snowfall in the himalayas: an uncertain future from a little-known past
TRANSCRIPT

TCD9 441ndash493 2015
Snowfall in theHimalayas an
uncertain future froma little-known past
E Viste and A Sorteberg
Title Page
Abstract Introduction
Conclusions References
Tables Figures
J I
J I
Back Close
Full Screen Esc
Printer-friendly Version
Interactive Discussion
Discussion
Paper
|D
iscussionP
aper|
Discussion
Paper
|D
iscussionP
aper|
The Cryosphere Discuss 9 441ndash493 2015wwwthe-cryosphere-discussnet94412015doi105194tcd-9-441-2015copy Author(s) 2015 CC Attribution 30 License
This discussion paper ishas been under review for the journal The Cryosphere (TC)Please refer to the corresponding final paper in TC if available
Snowfall in the Himalayas an uncertainfuture from a little-known pastE Viste and A Sorteberg
Geophysical Institute University of Bergen and Bjerknes Centre for Climate ResearchAlleacutegaten 70 5007 Bergen Norway
Received 4 December 2014 ndash Accepted 12 December 2014 ndash Published 16 January 2015
Correspondence to E Viste (ellenvistegfiuibno)
Published by Copernicus Publications on behalf of the European Geosciences Union
441
TCD9 441ndash493 2015
Snowfall in theHimalayas an
uncertain future froma little-known past
E Viste and A Sorteberg
Title Page
Abstract Introduction
Conclusions References
Tables Figures
J I
J I
Back Close
Full Screen Esc
Printer-friendly Version
Interactive Discussion
Discussion
Paper
|D
iscussionP
aper|
Discussion
Paper
|D
iscussionP
aper|
Abstract
Snow and ice provide large amounts of meltwater to the Indus Ganges and Brahma-putra rivers This study combines present-day observations and reanalysis data withclimate model projections to estimate the amount of snow falling over the basins todayand in the last decades of the 21st century Estimates of present-day snowfall based on5
a combination of temperature and precipitation from reanalysis data and observationsvary by factors of 2ndash4 The spread is large not just between the reanalysis and the ob-servations but also between the different observational data sets With the strongestanthropogenic forcing scenario (RCP 85) the climate models project reductions inannual snowfall by 30ndash50 in the Indus Basin 50ndash60 in the Ganges Basin and10
50ndash70 in the Brahmaputra Basin by 2071ndash2100 The reduction is due to increasingtemperatures as the mean of the models show constant or increasing precipitationthroughout the year in most of the region With the strongest anthropogenic forcingscenario the mean elevation where rain changes to snow ndash the rainsnow line ndash creepsupward by 400ndash900 m in most of the region by 700ndash900 m The largest relative change15
in snowfall is seen in the upper westernmost sub-basins of the Brahmaputra With thestrongest forcing scenario most of this region will have temperatures above freezingespecially in the summer The projected reduction in annual snowfall is 65ndash75 Inthe upper Indus the effect of a warmer climate on snowfall is less extreme as mostof the terrain is high enough to have temperatures sufficiently far below freezing today20
A 20ndash40 reduction in annual snowfall is projected
1 Introduction
In the dry spring months preceding the Indian summer monsoon much of the waterin the Himalayan rivers comes from melting snow and ice (Bookhagen and Burbank2010 Siderius et al 2013 Schaner et al 2012) Concern has been raised that global25
warming may reduce the glaciers and their capacity to store water as well as the
442
TCD9 441ndash493 2015
Snowfall in theHimalayas an
uncertain future froma little-known past
E Viste and A Sorteberg
Title Page
Abstract Introduction
Conclusions References
Tables Figures
J I
J I
Back Close
Full Screen Esc
Printer-friendly Version
Interactive Discussion
Discussion
Paper
|D
iscussionP
aper|
Discussion
Paper
|D
iscussionP
aper|
amount of seasonal snow available for melting Whether the meltwater comes fromsnow or glacier ice stable snowfall is required to maintain the flow in the long runObservations of present-day snowfall in the region are limited meaning that there isalso limited knowledge of the normal state and of historical trends In this study we usetemperature and precipitation data from a reanalysis and from observations to estimate5
snowfall in the Indus Ganges and Brahmaputra Basins today We then incorporatefuture changes in temperature and precipitation from a suite of climate models andfollow the same procedure to estimate snowfall in 2071ndash2100
The catchments of the Indus Ganges and Brahmaputra rivers as referred to in thisarticle are shown in Fig 1 The rivers run from the Hindu Kush - Karakoram - Himalaya10
(HKH) mountain range through the lowlands of Pakistan India and Bangladesh Bothrainwater and meltwater from snow and ice contribute to all three rivers with the highestmeltwater fraction in the Indus and the lowest in the Ganges (Immerzeel et al 2010Bookhagen and Burbank 2010 Singh et al 1997) Even in the Ganges meltwater isimportant in the otherwise dry spring (Siderius et al 2013)15
The Indian summer monsoon creates markedly different seasonal cycles in easternand western parts of the HKH both in precipitation and in the accumulation of snowand ice In the monsoon-dominated central Himalayas and on the Tibetan Plateaumore than 80 of the annual precipitation falls during summer Precipitation maximain the western regions occur in connection with westerly disturbances in winter In the20
Hindu Kush and Karakoram as well as in the easternmost Himalaya summer precipi-tation amounts to less than 50 of the annual precipitation (Bookhagen and Burbank2010) The seasonal cycle of snowfall varies accordingly In the western HKH snow ac-cumulates during winter while the summer is the main melting season Further eastthe summer is the main season not just for ablation but also for accumulation (Rees25
and Collins 2006)Precipitation also varies greatly between inner and outer parts of the Himalayas
(Singh et al 1997 Bookhagen and Burbank 2006 Winiger et al 2005) According toBookhagen and Burbank (2010) the eastndashwest gradient and the effect of the summer
443
TCD9 441ndash493 2015
Snowfall in theHimalayas an
uncertain future froma little-known past
E Viste and A Sorteberg
Title Page
Abstract Introduction
Conclusions References
Tables Figures
J I
J I
Back Close
Full Screen Esc
Printer-friendly Version
Interactive Discussion
Discussion
Paper
|D
iscussionP
aper|
Discussion
Paper
|D
iscussionP
aper|
monsoon is most pronounced in the lowlands below 500 masl while the differenceis less at higher elevations
11 Observed trends in snowfall temperature and precipitation
Using satellite data Rikiishi and Nakasato (2006) found that the mean annual snowcover area in Himalaya and on the Tibetan Plateau had been reduced by sim 1 yrminus1
5
during 1966ndash2001 Few studies include snowfall data from stations on the groundespecially for periods long enough to detect trends Studies of temperature and precip-itation provide some information though the picture is far from complete Temperatureshave increased in most of the region whereas precipitation studies show varying re-sults depending on the location and time period Whereas higher temperatures act10
to reduce the snow fraction increased precipitation may have compensated in someregions
Positive temperature trends have been observed throughout the HKH (Immerzeel2008 Immerzeel et al 2009 Xu et al 2008b Bhutiyani et al 2007 2010 Shresthaet al 1999 Shekhar et al 2010 Fowler and Archer 2006) The only exception to the15
regional warming is the Karakoram range where both maximum and minimum tem-peratures have decreased since the mid-1980s (Shekhar et al 2010) Both in Nepal(Shrestha et al 1999) and the Upper Indus (Immerzeel et al 2009) temperatureshave increased more at higher elevations than in the lower terrain implying that regionswith snow may have been more strongly affected than indicated by regional means20
Increasing temperatures (Xu et al 2008b) have most likely been the driver behindreductions in the snow cover on the Tibetan Plateau During 1966ndash2001 the length ofthe snow season was reduced by 23 days (Rikiishi and Nakasato 2006) The annualprecipitation on most of the Tibetan Plateau increased over the same period (Xu et al2008a b You et al 2008) only in the western part was there a decrease (Xu et al25
2008b)Few studies include data from the high-elevation parts of the Brahmaputra and
Ganges Basins Immerzeel (2008) found no clear precipitation trends for Brahmapu-444
TCD9 441ndash493 2015
Snowfall in theHimalayas an
uncertain future froma little-known past
E Viste and A Sorteberg
Title Page
Abstract Introduction
Conclusions References
Tables Figures
J I
J I
Back Close
Full Screen Esc
Printer-friendly Version
Interactive Discussion
Discussion
Paper
|D
iscussionP
aper|
Discussion
Paper
|D
iscussionP
aper|
tra as a whole for 1901ndash2002 For the same period Guhathakurta and Rajeevan (2008)found no significant precipitation trends relevant to snowfall in eastern parts of Indiaand neither did Shrestha et al (2000) for stations in Nepal in the shorter period 1959ndash1994
More studies of snow and ice have been performed for the Indus Basin than for the5
Ganges and Brahmaputra possibly because meltwater constitutes a larger fraction ofthe run-off in this basin (Bookhagen and Burbank 2010 Immerzeel et al 2010) Alsoas large parts of the Indus get little rain in late spring and summer the link betweenmelting snow and river discharge is perhaps more intuitive than in the regions furthereast where the top of the meltwater season coincides with the Indian summer mon-10
soon rain (Rees and Collins 2006) No consistent precipitation trends have been foundfor the mountain regions of the Indus Basin as a whole and epochs of more and lessprecipitation have alternated (Sontakke et al 2008 Bhutiyani et al 2010)
Some of the recent interest may also have been sparked by Karakoram glaciergrowth After decades of recession Karakoram glaciers were seen to expand in the15
late 1990s (Scherler et al 2011 Gardelle et al 2012 Hewitt 2005) An observedcombination of increased winter precipitation and decreased summer temperatureshave been suggested to be the cause (Archer and Fowler 2004 Fowler and Archer2006) and reduced summer discharge in rivers coming from the Karakoram is in accor-dance with the observed glacier growth (Fowler and Archer 2006 Sharif et al 2013)20
In contrast Hartmann and Andresky (2013) found only insignificant negative trends inKarakoram precipitation during 1986ndash2010 and Cook et al (2013) reported increaseddischarge in the Upper Indus after 1998 As pointed out by Hewitt (2005) and sup-ported by Kaumlaumlb et al (2012) the glacier growth applies only to higher elevations in thecentral Karakoram while glaciers in other parts and at intermediate elevations have25
continued to decline Increased transport of moisture to higher altitudes may be part ofthe explanation (Hewitt 2005)
Comparing the Karakoram with three other mountain ranges in the western Hi-malayas during 1984ndash2008 Shekhar et al (2010) found that snowfall had been re-
445
TCD9 441ndash493 2015
Snowfall in theHimalayas an
uncertain future froma little-known past
E Viste and A Sorteberg
Title Page
Abstract Introduction
Conclusions References
Tables Figures
J I
J I
Back Close
Full Screen Esc
Printer-friendly Version
Interactive Discussion
Discussion
Paper
|D
iscussionP
aper|
Discussion
Paper
|D
iscussionP
aper|
duced in all the ranges though less in the innermost Karakoram than in the outerranges As opposed to temperature increases in the other ranges the Karakoramrange experienced decreasing temperatures The reduction in snowfall on the outsideof the outermost range Pir Panjal during the last decades was supported by Bhutiyaniet al (2010) who found that the duration of the snowfall season had been reduced by5
about 5ndash6 days per decadeDocumented trends in other parts of the Indus basin vary and alternating epochs
indicate that the choice of time period may influence the results In Jammu and Kash-mir and Himachal Pradesh Bhutiyani et al (2010) found a significant decreasing trendin summer precipitation during the 20th century There was no trend in winter precip-10
itation at the three stations used but epochs of dry and wet winters had alternatedand winter precipitation was above average in 1991ndash2006 Previously a long-term in-crease in summer and annual precipitation in Jammu and Kashmir was documentedby Guhathakurta and Rajeevan (2008) and in Himachal Pradesh by Singh et al (2008)Sontakke et al (2008) on the other hand found no trends in this part of India since the15
19th century but noted a dry epoch since 1968 It should be pointed out that their dataset contained stations in the outer ranges only and not in eg the Karakoram
Further west in the Upper Indus Basin at stations mainly in Pakistan (Archer andFowler 2004) observed no trends in precipitation over the 20th century but a signifi-cant increase in winter summer and annual precipitation at several stations starting in20
1961 The increase was accompanied by increasing winter temperatures but decreas-ing summer temperatures (Fowler and Archer 2006) Hartmann and Andresky (2013)found significant positive trends in precipitation in the Hindu Kush and the Sulaimanmountains for 1986ndash2010
Satellite-based studies of trends in the present century (2000ndash20082001ndash2007)25
have documented a decrease in winter snow cover area in the Upper Indus (Immerzeelet al 2009) but an increase in the Indus water volume stored in snow and ice (Im-merzeel et al 2010)
446
TCD9 441ndash493 2015
Snowfall in theHimalayas an
uncertain future froma little-known past
E Viste and A Sorteberg
Title Page
Abstract Introduction
Conclusions References
Tables Figures
J I
J I
Back Close
Full Screen Esc
Printer-friendly Version
Interactive Discussion
Discussion
Paper
|D
iscussionP
aper|
Discussion
Paper
|D
iscussionP
aper|
12 Future projections of snowfall temperature and precipitation
In the last decades of the 21th century the temperature over India is projected to be onaverage 20ndash48 C higher than today depending on the anthropogenic forcing scenario(Chaturvedi et al 2012) In the Himalayas a temperature increase of more than 7 C isseen with the strongest forcing the Representative Concentration Pathway (RCP) 855
(Chaturvedi et al 2012 Collins et al 2013) Independently of precipitation changeshigher temperatures will decrease the fraction of precipitation falling as snow Whethersnowfall will increase or decrease thus depends on whether precipitation will increaseenough to compensate for the reduced snow fraction
Climate models from CMIP5 the most recent Coupled Model Inter-comparison10
Project (Taylor et al 2011) project a general increase in precipitation over India grow-ing with anthropogenic forcing and with time both annually (Chaturvedi et al 2012)and during the summer monsoon (Menon et al 2013) An increase was also seenin data from the previous model comparison project CMIP3 (Turner and Annamalai2012) Menon et al (2013) found that changes in the low-level winds suggest a north-15
ward shift in the monsoon by the end of the 21st century for the strongest forcingscenario although the total zonal strength of the monsoon remained fairly constant
It should be emphasized that there is a large inter-model spread in precipitation pro-jections and the IPCC AR5 concludes that there is medium confidence in the increasein summer monsoon precipitation over South Asia (Christensen et al 2013) But al-20
though precipitation projections are less reliable than temperature projections agree-ment between models increases with time and anthropogenic forcing (Chaturvedi et al2012) Also the CMIP5 multi-model mean has been considered to represent the mon-soon and the actual climate in India better than any individual model (Chaturvedi et al2012 Sperber et al 2013)25
The IPCC AR5 has high confidence that the snow cover area in the Northern Hemi-sphere will be substantially reduced with anthropogenic forcing as in the strongestscenarios (Collins et al 2013) For the range of RCPs 26ndash85 CMIP5 models sim-
447
TCD9 441ndash493 2015
Snowfall in theHimalayas an
uncertain future froma little-known past
E Viste and A Sorteberg
Title Page
Abstract Introduction
Conclusions References
Tables Figures
J I
J I
Back Close
Full Screen Esc
Printer-friendly Version
Interactive Discussion
Discussion
Paper
|D
iscussionP
aper|
Discussion
Paper
|D
iscussionP
aper|
ulate 7ndash25 reductions in the spring snow cover extent by 2080ndash2100 For snowfalland snow water equivalents (SWE) the projections show more variation While warm-ing decreases the amount of snow both through melting and through decreasing thesnow fraction more precipitation may increase snowfall in some of the coldest regions(Raumlisaumlnen 2008 Brutel-Vuilmet et al 2013) Though shown to apply mainly to the5
northern parts of Eurasia and North America there is a possibility that some of thehigher-lying terrain in the HKH may be similarly affected
13 Aims and scope
For the HKH uncertainty in projections of future precipitation and snowfall comes ontop of uncertainty in present time conditions Observations are limited especially in re-10
mote high-elevation regions (Anders et al 2006 Immerzeel 2008 Tahir et al 2011bWiniger et al 2005) Insufficient knowledge of the amount of snow falling over the re-gion today makes the contribution to both seasonal snowmelt and storage in glacierscorrespondingly uncertain
Recognizing this uncertainty this study provides an ensemble of monthly mean15
snowfall estimates for all sub-basins of the Indus Ganges and Brahmaputra todayand for 2071ndash2100 For the present time estimates we have combined MERRA re-analysis data (Rienecker et al 2011) with observationally based data sets of precip-itation and temperature CRU TS (Harris et al 2014) TRMM (Huffman et al 2007)and APHRODITE (Yatagai et al 2012 Yasutomi et al 2011) Whereas Meacuteneacutegoz20
et al (2013) and Wiltshire (2014) analyzed Himalayan snowfall by downscaling reanal-ysis data with regional climate models we have applied a simple terrain adjustment ofthe reanalysis temperature field
The ensemble of present-day estimates is presented in Sect 3 Future snowfall wasthen calculated based on the present-day snowfall and projected changes in temper-25
ature and precipitation in 14 and 15 CMIP5 models for the RCPs 26 and 85 re-spectively These results are presented in Sect 4 The data and methods for both thepresent time and the future case are described in Sect 2
448
TCD9 441ndash493 2015
Snowfall in theHimalayas an
uncertain future froma little-known past
E Viste and A Sorteberg
Title Page
Abstract Introduction
Conclusions References
Tables Figures
J I
J I
Back Close
Full Screen Esc
Printer-friendly Version
Interactive Discussion
Discussion
Paper
|D
iscussionP
aper|
Discussion
Paper
|D
iscussionP
aper|
Three main features may be involved in precipitation changes in the HKH changesin the summer monsoon changes in western disturbances during winter and the gen-eral changes that occur in the thermodynamic properties of the air as the temperatureincreases and the air contains more water vapor We have not considered the role ofthe different factors only looked at how changes in temperature and precipitation af-5
fect snowfall Unless otherwise specified any reference to snow refers to precipitationfalling as snow not to the snow cover on the ground
2 Data and methods
In addition to the original MERRA reanalysis snowfall we estimated snowfall usingdifferent combinations of temperature and precipitation data An overview of the com-10
binations is shown in Table 1 and the data sets used presented in Tables 2 and 3Present-day snowfall estimates were based on
1 MERRA 2 m temperature adjusted to a higher-resolution elevation grid andMERRA precipitation (Sect 21) This was used as a basis for the other estimatesand is referred to as MERRA reference snowfall The adjusted temperature is15
referred to as terrain-adjusted
2 MERRA 2 m temperature and precipitation
3 The MERRA data in (1) bias-corrected with observation-based data for tempera-ture and precipitation (Sect 22)
Estimates for the last decades of the 21th century were based on20
4 The MERRA data in (1) plus the changes in temperature and precipitation ina group of CMIP5 models over the coming century (Sect 23)
5 Bias-corrections with one of the data sets in (3) ndash APHRODITE ndash plus the meanchanges in temperature and precipitation in the CMIP5 models used in (4) Thiswas done to account for the spread in the present-day estimates25
449
TCD9 441ndash493 2015
Snowfall in theHimalayas an
uncertain future froma little-known past
E Viste and A Sorteberg
Title Page
Abstract Introduction
Conclusions References
Tables Figures
J I
J I
Back Close
Full Screen Esc
Printer-friendly Version
Interactive Discussion
Discussion
Paper
|D
iscussionP
aper|
Discussion
Paper
|D
iscussionP
aper|
With the exception of original MERRA snowfall data all snowfall estimates werebased on the relationship between temperature and snowfall derived by Dai (2008)Based on observations the conditional snow frequency over land was formulated as
F (Ts) = a[
tanh(b(Ts minusc)
)minusd]
(1)
where Ts is the surface air temperature [C] and a = minus482292b = 07205c = 116625
and d = 10223 This may be interpreted as the probability or fraction of precipitationfalling as snow at a given temperature We calculated hourly snowfall as the productof F and the amount of precipitation Cut-offs for no rain and no snow were set at minus10and 10 C respectively as this was the range of the data used by Dai (2008)
All snowfall estimates were made for the sub-basins defined in the HydroSHEDS10
data set (Lehner et al 2008) The results were then aggregated for the Indus Gangesand Brahmaputra Basins
Within each major basin we also grouped the sub-basins into regions with simi-lar characteristics of snow and precipitation This was done with k-means clustering(MacQueen 1967) using the square Euclidean distance as the distance measure15
The seasonal cycles of precipitation snow and snow fraction were first clustered sep-arately with the MERRA reference data and data bias-corrected with CRU TS data asinput We then adjusted the clusters manually prioritizing similarity of the relative sea-sonal cycles of snow and snow fraction and checking that both data sets gave similarresults Five groups were defined for the Indus and four for each of the other basins20
This included a no-snow group in each basin
21 Reference present-day snowfall
The horizontal resolution of the MERRA reanalysis data in the Himalayas is about55 km latitude and 70 km longitude To account for smaller-scale temperature variationsin the rugged terrain we used the vertical temperature gradient in MERRA to adjust25
the ground temperature to the GLOBE topography (Hastings and Dunbar 1998) The450
TCD9 441ndash493 2015
Snowfall in theHimalayas an
uncertain future froma little-known past
E Viste and A Sorteberg
Title Page
Abstract Introduction
Conclusions References
Tables Figures
J I
J I
Back Close
Full Screen Esc
Printer-friendly Version
Interactive Discussion
Discussion
Paper
|D
iscussionP
aper|
Discussion
Paper
|D
iscussionP
aper|
elevation-adjusted ground temperature was calculated as
Tadj = T0 minusT2 minus T1
z2 minus z1(zmerra 0 minus zglobe) (2)
where T0 is the MERRA 2 m temperature T1 is the temperature at the lowest pressurelevel above the ground T2 the temperature at the next level and z2 and z1 the height ofthese levels zmerra0 and zglobe is the elevation of the MERRA and GLOBE topography5
respectively To reduce calculation time compared to using the original 1 km GLOBEresolution both MERRA and GLOBE data were interpolated to a 4 km grid Snowfallwas calculated for each grid-point and then aggregated for each sub-basin for eachmonth
Snowfall based on elevation-adjusted MERRA temperature and MERRA precipita-10
tion is used as a reference throughout this article This is because the elevation-adjusted temperature and the 4 km grid was used as the starting-point in all subse-quent calculations It does not mean that we consider this snowfall to be closer to thetruth than any of the other estimates
22 Bias-corrected present-day snowfall15
A second group of present-day snowfall estimates was made from MERRA precipi-tation and elevation-adjusted temperature bias-corrected with observationally baseddata sets APHRODITE daily temperature and precipitation for 1979ndash2007 CRU TSmonthly temperature and precipitation for 1979ndash2011 and TRMM 3B42 3 hourly pre-cipitation for 1998ndash2012 Bias-corrections were performed on daily or monthly scales20
depending on the input data and the result distributed over the hourly time-steps ofthe MERRA temperature and precipitation As a result the diurnal cycle in MERRA ismaintained in all estimates Snowfall was then calculated following the same procedureas for the MERRA reference snowfall (Sect 21) When referring to APHRODITE snowor CRU snow anywhere in this article this is the snowfall calculated using MERRA25
precipitation and temperature both bias-corrected with these data sets451
TCD9 441ndash493 2015
Snowfall in theHimalayas an
uncertain future froma little-known past
E Viste and A Sorteberg
Title Page
Abstract Introduction
Conclusions References
Tables Figures
J I
J I
Back Close
Full Screen Esc
Printer-friendly Version
Interactive Discussion
Discussion
Paper
|D
iscussionP
aper|
Discussion
Paper
|D
iscussionP
aper|
Temperature data are generally assumed to be normally distributed and as de-scribed in Teutschbein and Seibert (2012) and references therein the data can bebias-corrected through a Gaussian distribution mapping We thus bias-corrected theelevation-adjusted MERRA temperature with the observationally based APHRODITEV1204 daily temperature by mapping the distribution of the MERRA data to the Gaus-5
sian distribution of the observationsAs the CRU TS 320 includes monthly mean daily minimum and maximum temper-
atures the method described by (Wang and Zeng 2013) was used Bias-correcteddaily maximum temperatures were defined as
Td max = Tmerra d max minus(Tmerra mn max minus Tcru mn max
) (3)10
d denotes daily and mn monthly Daily minimum temperatures were then corrected byadjusting the diurnal range
Td min = Td max minus∆Tmerra d middot∆Tcru mn
∆Tmerra mn (4)
where ∆T represents the diurnal and monthly temperature rangeThe distribution mapping procedure described by Ines and Hansen (2006) was used15
to bias-correct MERRA precipitation with APHRODITE V1101R2 daily precipitation anddaily accumulated TRMM 3B42 3 hourly precipitation This is a two-step procedureinvolving frequency and intensity adjustments We defined precipitation days as dayswith at least 01 mm in the observations The frequency was first adjusted by settingthe number of precipitation days in MERRA equal to that of the observations This was20
done by removing the lowest daily values The intensity was then adjusted by fitting theremaining days to the gamma distribution of the observations
Bias-corrections with CRU TS 320 monthly precipitation were done with a simplecorrection factor to adjust the monthly MERRA total to that of CRU (eg Ines andHansen 2006)25
452
TCD9 441ndash493 2015
Snowfall in theHimalayas an
uncertain future froma little-known past
E Viste and A Sorteberg
Title Page
Abstract Introduction
Conclusions References
Tables Figures
J I
J I
Back Close
Full Screen Esc
Printer-friendly Version
Interactive Discussion
Discussion
Paper
|D
iscussionP
aper|
Discussion
Paper
|D
iscussionP
aper|
23 Projected snowfall
The MERRA reanalysis was also the basis for estimates of future snowfall Thechanges in temperature and precipitation from 1971ndash2000 to 2071ndash2100 were addedto the reanalysis data and snowfall calculated following the same procedure as for thepresent time Climate change input came from models that were part of the Coupled5
Model Inter-comparison Project 5 (CMIP5 Taylor et al 2011) for the RepresentativeConcentration Pathways (RCP) 26 and 85 (Moss et al 2010 van Vuuren et al 2011)The models used are listed in Table 3
Due to the different spatial resolution of the models changes were defined asmonthly mean changes on the sub-basin level For temperature the absolute change10
was used and for precipitation the fractional change Future projected snowfall wascalculated with reference to elevation-adjusted MERRA snowfall for each model Dueto large deviations in estimates of present-day snowfall (Sect 3) we also calculatedsnowfall for the CMIP5 multi-model mean changes with reference to the lowest presenttime estimate APHRODITE snowfall15
24 The rain-snow line
Not all temperature changes affect snowfall We defined the rain-snow line as the el-evation where the temperature suggests a shift from rain to snow Technically thisis a conditional rain-snow line as no precipitation was required For every hour allgrid cells that had a snow fractionprobability between 025 and 075 corresponding20
to a temperature between 09 and 13 C were identified The monthly rain-snow linewas then set as the mean elevation of these grid cells and time steps For present-dayconditions this was done for elevation-adjusted MERRA temperature and temperaturebias-corrected with APHRODITE Projected temperature changes in the CMIP5 RCP85 were then added to these temperatures and the procedure repeated25
453
TCD9 441ndash493 2015
Snowfall in theHimalayas an
uncertain future froma little-known past
E Viste and A Sorteberg
Title Page
Abstract Introduction
Conclusions References
Tables Figures
J I
J I
Back Close
Full Screen Esc
Printer-friendly Version
Interactive Discussion
Discussion
Paper
|D
iscussionP
aper|
Discussion
Paper
|D
iscussionP
aper|
3 Present-day snowfall
31 Seasonal cycles of precipitation and snowfall
Figure 2 gives an overview of the seasonal cycle of rain and snow in different parts ofthe HKH based on MERRA precipitation and MERRA reference snowfall (Sect 21)The upper Indus basin gets more snow than rain in other sub-basins of the Indus5
Ganges and Brahmaputra rainfall dominates This difference is caused by different pre-cipitation cycles Whereas the summer monsoon dominates in the Central Himalayaswinter depressions bring most of the precipitation in the upper Indus ndash at a time whenlow temperatures mean that precipitation falls as snow in larger areas than it wouldin summer Although snow fractions are lower in the upper Brahmaputra monsoon10
precipitation produces a substantial amount of summer snow at high elevationsIn the northwesternmost cluster in the Indus I4 March is the wettest month and also
the month with the highest total amount of snowfall Precipitation has a second peakduring July and August but the temperature is then too high to allow much snowfallFurther east in cluster I5 more terrain at higher elevations cause higher snow fractions15
during summer but winter and spring is still the dominant snow season The summerpeak in precipitation in this cluster is caused by the two eastern sub-basins There islittle summer precipitation in the west
In Brahmaputrarsquos cluster B4 and Gangesrsquo G4 maximum snowfall occurs during thesummer monsoon Higher temperatures during summer means that the snow fraction20
is lower than in winter but as there is much more summer precipitation the amount ofsnow is also higher Rare occurrences of precipitation during the cold winter togetherwith the combination of snowfall and snowmelt during summer makes the seasonalcycle of snow depth in the Central Himalayas unpronounced (Meacuteneacutegoz et al 2013)In the upper-level basins in Brahmaputrarsquos B3 the summer is also the main precipi-25
tation season but the peak is less sharp than further west As a result snowfall is ata maximum in MarchndashApril
454
TCD9 441ndash493 2015
Snowfall in theHimalayas an
uncertain future froma little-known past
E Viste and A Sorteberg
Title Page
Abstract Introduction
Conclusions References
Tables Figures
J I
J I
Back Close
Full Screen Esc
Printer-friendly Version
Interactive Discussion
Discussion
Paper
|D
iscussionP
aper|
Discussion
Paper
|D
iscussionP
aper|
32 Comparison of snowfall estimates
The MERRA reference snowfall described in Sect 31 differs greatly from snowfallbased on bias-corrected temperature and precipitation Large differences betweentemperature and data sets for the HKH cause corresponding deviations in snowfall ndashnot only between MERRA-based estimates and bias-corrected data but between esti-5
mates based on bias-corrections with different data sets This can be seen from Table 4which displays annual snowfall estimates for combinations of the bias-corrections de-scribed in Sect 22 aggregated to the major basins Data for the individual sub-basinsare included as Supplement
With the exception of snowfall based on MERRA precipitation and MERRA temper-10
ature bias-corrected with CRU TS in the Ganges basin all estimates based on bias-corrected data are lower than the MERRA reference snowfall The lowest estimates arethose based on bias-corrections with APHRODITE precipitation and temperature Thiscombination produced only 33 of the reference snowfall in the Indus Basin 22 inthe Ganges Basins and 17 in the Brahmaputra Basin While the difference is large in15
all sub-basins that have snow today it is especially large in the upper parts of the Indusand Brahmaputra Basins (Fig 3) In comparison bias-corrections with CRU TS tem-perature and precipitation produce 54 of the reference snowfall in the Indus 75 inthe Ganges and 42 in the Brahmaputra ndash factors of 2ndash4 compared to APHRODITEIt should be noted that as the time periods covered by the data sets are not equal20
the results are not strictly comparable but tests using different MERRA periods (notshown) indicate that there would be no major difference in the monthly means
The large difference between MERRA reference snowfall and snowfall based onbias-corrected data results from differences in both temperature and precipitation butdifferences in the precipitation pattern have the greatest effect Estimates where only25
the precipitation has been bias-corrected are lower than those where only the tempera-ture has been bias-corrected (Table 4) This is not solely an effect of more precipitationin MERRA than in the observation-based data although MERRA is wetter than all the
455
TCD9 441ndash493 2015
Snowfall in theHimalayas an
uncertain future froma little-known past
E Viste and A Sorteberg
Title Page
Abstract Introduction
Conclusions References
Tables Figures
J I
J I
Back Close
Full Screen Esc
Printer-friendly Version
Interactive Discussion
Discussion
Paper
|D
iscussionP
aper|
Discussion
Paper
|D
iscussionP
aper|
data sets in the Indus and for APHRODITE also in the Ganges and the Brahmapu-tra An inland and upward shift in the MERRA precipitation adds to the differencesAs shown in Fig 4 all the observation-based precipitation data sets are wetter thanMERRA in most of the lowlands and in the foothills of the HKH but drier in the higher-elevation regions further inland In MERRA the precipitation belt is shifted higher up5
in the Himalayas where temperatures are lower and more of the precipitation falls assnow
In addition HKH temperatures are lower in MERRA than in APHRODITE and inthe upper Indus also than in CRU TS (Fig 5) The lower temperatures in MERRAcause higher snow fractions further increasing the difference between the MERRA ref-10
erence snowfall and APHRODITE snowfall Oppositely CRU TS is colder than MERRAthroughout the Ganges leading to higher snowfall estimates when bias-correctingMERRA temperatures with CRU TS (Table 4)
We do not see any reason to consider any of the observation-based data sets northe reanalysis the ground truth The reanalysis has the benefit of being physically15
consistent though precipitation is a pure model product In the other data sets thenumber of observations vary greatly within the region
The lack of observations in the HKH has been pointed out in many studies Mostmeteorological stations are located in the valleys and do not necessarily representweather conditions in higher terrain As demonstrated by Palazzi et al (2013) station-20
based data sets like APHRODITE and CRU TS are merely mathematical interpolationsin major parts of the HKH and on the Tibetan Plateau Immerzeel (2008) showed thatthe number of observations going into version 21 of the CRU data set in the Himalayanregion varies greatly A drop in the mid-1990s suggests that caution should be takenwhen interpreting data at later times Maps (not shown) of station coverage in version25
320 used in this study show that this problem persistsThe fact that more of the precipitation falls as snow at higher elevations may in it-
self lead to an under-estimation of precipitation in the mountains In addition to thelack of observations in high terrain gauges tend to capture snow less easily than rain
456
TCD9 441ndash493 2015
Snowfall in theHimalayas an
uncertain future froma little-known past
E Viste and A Sorteberg
Title Page
Abstract Introduction
Conclusions References
Tables Figures
J I
J I
Back Close
Full Screen Esc
Printer-friendly Version
Interactive Discussion
Discussion
Paper
|D
iscussionP
aper|
Discussion
Paper
|D
iscussionP
aper|
leading to a possible under-registration of precipitation at the few high-elevation sta-tions that exist Comparing stations along a vertical profile in the Karakoram Winigeret al (2005) found that precipitation multiplied by a factor of 5ndash10 from 2500 masl to5000ndash6000 masl This maximum is much higher than reported in most other studiesand they attributed this to the valley-dominance of stations normally used5
Indications of too little precipitation at higher elevations were also given by Tahiret al (2011b) as APHRODITE precipitation was too low to account for the observeddischarge in the Hunza river in the Karakoram Anders et al (2006) reported thatTRMM radar data underestimated precipitation at higher elevations in the Himalayasdue to the low ability of the radar to detect very low precipitation and lowndashmoderated10
snowfall rates On the other hand Krakauer et al (2013) found that both TRMM andAPHRODITE had too much precipitation compared to observations from the few exist-ing stations at elevations above 3000 masl in Nepal
Satellite data are a promising future alternative for measuring snowfall but presentlyof limited use MODIS and LANDSAT satellite data have been used in several studies15
of snow and ice in the Himalayas (Tahir et al 2011a b Bookhagen and Burbank2010 Hewitt 2005 Krishna 2005 Negi et al 2009 Jain et al 2009 Butt 2012 Gaoet al 2012 Kulkarni et al 2010 Immerzeel et al 2009) but these data contain onlysnow cover area with no measure of the snow thickness or snow water equivalentsThe NASA AMSR-E SWE data set distributed by the National Snow and Ice Data20
Center could have been used but correlations between AMSR-E SWE and groundobservations have been shown to be poor (Tedesco and Narvekar 2010 Byun andChoi 2014 Kumar et al 2006) As AMSR-E SWE has been found underestimatesnow depth we concluded that incorporating these data into our ensemble would notlikely constrain the results nor add new information25
Defining snowfall based on MERRA precipitation and elevation-adjusted tempera-ture as a reference was done mainly to have a single reference when comparing thedata sets against each other Also we believe the elevation-adjustment of temperaturerepresents an enhancement compared to the original MERRA reanalysis MERRA was
457
TCD9 441ndash493 2015
Snowfall in theHimalayas an
uncertain future froma little-known past
E Viste and A Sorteberg
Title Page
Abstract Introduction
Conclusions References
Tables Figures
J I
J I
Back Close
Full Screen Esc
Printer-friendly Version
Interactive Discussion
Discussion
Paper
|D
iscussionP
aper|
Discussion
Paper
|D
iscussionP
aper|
chosen mainly because it has an hourly resolution allowing diurnal temperature vari-ations to affect snowfall But even though this estimate is much higher than all thebias-corrected estimates it cannot be discarded It has been argued that reanalysisdata and regional climate models may in some cases be as good as or better thanobservations in the HKH (Wiltshire 2014 Meacuteneacutegoz et al 2013 Akhtar et al 2008)5
Akhtar et al (2008) got better results when modeling river discharge in three upperIndus catchments with an RCM-based hydrological model than with one based on thefew observations available within the region They concluded that it was preferable touse RCM data directly as input to hydrological models in this region
As shown in the small inset maps in Fig 4 MERRA precipitation is higher than ob-10
served precipitation throughout the HKH and the same has previously been shownfor ERA-Interim reanalysis precipitation (Palazzi et al 2013) In MERRA the precipi-tation belt is shifted upward in the terrain compared to in the observation-based datasets Whether this shift is realistic cannot be determined as long as observations fromupper-level terrain are either missing or likely too low15
4 Projected future snowfall
Whether higher temperatures lead to less snowfall depends on whether the tempera-ture changes from below to above freezing and whether this change occurs at a timewhen there is precipitation The maps in Fig 6 illustrate where a temperature increaseis most likely to affect snowfall and snowmelt In the red zones where the monthly20
temperature today is between ndash5 and 0 C the projected temperature increase of 2ndash7 C (Chaturvedi et al 2012 Collins et al 2013 Wiltshire 2014) may be consideredcritical Such a change would change snowfall to rain and also cause a change fromfreezing to melting of snow and ice The pink zones with monthly mean temperaturesof 0ndash5 C would similarly change from a climate where precipitation may often fall as25
snow to one that is snow-free
458
TCD9 441ndash493 2015
Snowfall in theHimalayas an
uncertain future froma little-known past
E Viste and A Sorteberg
Title Page
Abstract Introduction
Conclusions References
Tables Figures
J I
J I
Back Close
Full Screen Esc
Printer-friendly Version
Interactive Discussion
Discussion
Paper
|D
iscussionP
aper|
Discussion
Paper
|D
iscussionP
aper|
In January (Fig 6a) only the lower parts of the Himalayas is affected as most ofthe region would still have temperatures well below the freezing point The small insetmap shows precipitation in the red zone a narrow band along the range Oppositelyin July (Fig 6c) the temperature is already above 5 C in most of the region though athigher elevations along the Himalayan range and in the Karakoram the change can be5
critical The most widespread changes are seen in spring and fall In April and October(Fig 6b d) large areas in the HKH and on the Tibetan Plateau risk a change frombelow to above freezing
Incorporating CMIP5 precipitation changes we find that the projected temperatureincrease has a larger impact so that snowfall will be reduced in the Indus Ganges and10
Brahmaputra Basins by 2071ndash2100 compared to today Details for the major basinsare presented in Sect 41 How much increased temperatures reduce snowfall withina region depends on the location of the rainsnow line today compared to the terraindistribution Results for selected upper-level sub-basins in the Indus and Brahmaputrawill be discussed in that context in Sect 4215
The large deviations in the estimates of present-day snowfall (Sect 3) means thatthere will be correspondingly large deviations in projected values To account for thismost results are shown with reference to the highest and lowest present-day estimatesMERRA reference snowfall and to APHRODITE-based snowfall Future estimates rela-tive to CRU and TRMM are assumed to lie between those of MERRA and APHRODITE20
41 Basin-scale projections
In the Indus Ganges and Brahmaputra Basins the CMIP5 models project a meanincrease in both temperature (Fig 7) and precipitation (Fig 8) in the region by 2071ndash2100 for both RCPs 26 and 85 The RCP 85 multi-model mean change in temper-ature varies through the year with a 49ndash62 C increase in the Indus 36ndash52 C in25
the Ganges and 42ndash60 C in the Brahmaputra The increase is smallest during thesummer months The dip in the summer is also seen though less pronounced with
459
TCD9 441ndash493 2015
Snowfall in theHimalayas an
uncertain future froma little-known past
E Viste and A Sorteberg
Title Page
Abstract Introduction
Conclusions References
Tables Figures
J I
J I
Back Close
Full Screen Esc
Printer-friendly Version
Interactive Discussion
Discussion
Paper
|D
iscussionP
aper|
Discussion
Paper
|D
iscussionP
aper|
the RCP 26 The summer is also the season with the largest absolute increase inprecipitation
Compared to present-day estimates the CMIP5 models project less snowfall in theIndus Ganges and Brahmaputra Basins in the last decades of this century This canbe seen from Fig 9 The projected multi-model mean is lower than today in all calen-5
dar months for both RCPs 26 and 85 With the RCP 26 some models suggest anincrease in some months mainly in winter and spring This is also the case for one ortwo models with the RCP 85 whereas other models indicate that the snowfall in thesame months will be only half of todayrsquos values
In the Ganges Basin (Fig 9b) the seasonal distribution of snowfall today is mainly10
flat with equal amounts of snowfall from January through September Reductions insummer snowfall with the RCP 85 would change the seasonal cycle into a winter-dominated one To a lesser degree this is also the case for RCP 26 As summerprecipitation is projected to increase in all of the Ganges (not shown but consistentwith Menon et al 2013) this indicates that large areas are at elevations where a small15
increase in the summer temperature may cause a shift from snow to rain This is seenas the red band along the upper Ganges in Fig 6c Reductions in summer snowfall arealso large in the Brahmaputra (Fig 9b) whereas in the Indus the largest total changesoccur in MarchndashMay (Fig 9a)
As the MERRA reference snowfall for today is much larger than APHRODITE snow-20
fall (Sect 32) projected absolute changes for 2071ndash2100 are also much largerin MERRA The relative changes are more similar though larger with reference toAPHRODITE Annual snowfall changes for each major basin are presented in Table 5for changes in temperature precipitation or both and with reference to MERRA andAphrodite present-day snowfall Changes at the sub-basin level are shown in Fig 1025
In the Ganges Basin both MERRA- and APHRODITE-based multi-model mean snow-fall is reduced by about 20 with the RCP 26 and 50 with the RCP 85 In theIndus and Brahmaputra Basins the differences between MERRA- and APHRODITE-based changes are larger but not as large as for the absolute values With reference
460
TCD9 441ndash493 2015
Snowfall in theHimalayas an
uncertain future froma little-known past
E Viste and A Sorteberg
Title Page
Abstract Introduction
Conclusions References
Tables Figures
J I
J I
Back Close
Full Screen Esc
Printer-friendly Version
Interactive Discussion
Discussion
Paper
|D
iscussionP
aper|
Discussion
Paper
|D
iscussionP
aper|
to MERRA and APHRODITE respectively the reduction in snowfall in the Indus Basinis 30 and 50 with the RCP 85 The corresponding reductions in the BrahmaputraBasin are 50 and 70
The projected changes in temperature have greater effect on snowfall than thechanges in precipitation When taking into account only changes in precipitation all5
snowfall estimates are positive (∆P Table 5) This indicates that the mean annual to-tal reduction for each major basin is governed by the temperature change In someCMIP5 models (values in brackets in Table 5) the effect of precipitation changes (∆P )on snowfall are of the same magnitude as the effect of temperature changes (∆T ) butfor the CMIP5 multi-model mean temperature changes cause snowfall changes 4ndash1010
times as large as those due to changes in precipitation This is with reference to thepresent-day MERRA reference snowfall and for both RCPs 26 and 85 With referenceto APHRODITE snowfall the effect of temperature changes compared to precipitationchanges is even greater
42 Regional projections15
If temperatures are far below freezing everywhere warming may have little effect onsnowfall The same applies if only the highest peaks receive snow today The largestreduction in snowfall in a basin occurs if todayrsquos rainsnow line is at an elevation justbelow the dominant elevation of the basin Then large regions will see a shift fromsnow to rain20
In the Indus Basin the largest relative snowfall reduction by 2071ndash2100 is seen inthe southwestern sub-basins where snowfall is limited today (Fig 10) The largest totalreduction is seen in the snow-rich sub-basins of KabulSwatAlingar in the west and inthe east and a smaller reduction in the inner-most basins of GilgitHunza Indus 1 andNubraShyok Together with the upper regions of the Brahmaputra these sub-basins25
clusters I4 I5 B3 and B4 in Fig 2 were selected for a closer analysis In addition tohaving the most snow these clusters are the most homogeneous when considering
461
TCD9 441ndash493 2015
Snowfall in theHimalayas an
uncertain future froma little-known past
E Viste and A Sorteberg
Title Page
Abstract Introduction
Conclusions References
Tables Figures
J I
J I
Back Close
Full Screen Esc
Printer-friendly Version
Interactive Discussion
Discussion
Paper
|D
iscussionP
aper|
Discussion
Paper
|D
iscussionP
aper|
the seasonal cycle of snowfall and snow fraction The values presented in this sectionare all from the RCP 85 for changes from today to 2071ndash2100
421 Upper Indus western part
Cluster 4 consists of the sub-basins Astor KabulSwatAlingar and Krishen GangaAs seen from the elevation profile at the top of Fig 11a the elevation span is large5
and there is an almost equal proportion of the terrain at all levels from heights close tosea level to about 5000 masl The most important change for this cluster is a largereduction in the total amount of snowfall in winter and spring
With a few exceptions all CMIP5 models project less snowfall in all months of theyear (Fig 11a i ii) The largest total multi-model mean reduction in snowfall (ii) oc-10
curs in FebruaryndashApril without notable change in the multi-model mean precipitation(iii) Thus the reduction is caused by increasing temperatures represented by therainsnow line in Fig 11a iv As seen from the change in the rainsnow line elevationthe projected temperature increase in these months would imply that large areas thatreceive snow today would receive only rain About 40 of the ground in this cluster lies15
below 2000 masl and receives precipitation as rain throughout the year In summerprecipitation (iii) is at a minimum and the rainsnow line (iv) is already so high that onlya small fraction of the area receives snowfall today Thus although the relative changein snowfall (i) is largest in summer the change in the amount of snowfall (ii) is small Itshould also be noted that the change in the rainsnow line elevation (iv) in summer is20
much smaller 400ndash600 m compared to 600ndash900 m in DecemberndashApril
422 Upper Indus eastern part
Further east the largest changes are projected for the spring season Cluster 5 in theIndus Basin consists of the sub-basins GilgitHunza Indus 1 NubraShyok and Zan-skar As shown in Fig 11b this is high-elevation terrain with 80 of the ground lying25
above 4000 masl As a result almost all winter precipitation is snow (Fig 11b iii)
462
TCD9 441ndash493 2015
Snowfall in theHimalayas an
uncertain future froma little-known past
E Viste and A Sorteberg
Title Page
Abstract Introduction
Conclusions References
Tables Figures
J I
J I
Back Close
Full Screen Esc
Printer-friendly Version
Interactive Discussion
Discussion
Paper
|D
iscussionP
aper|
Discussion
Paper
|D
iscussionP
aper|
For the multi-model mean no big changes are projected in JanuaryndashFebruary This ispartly because of little change in precipitation (iii) and because the rainsnow line (iv)in these months is sufficiently low in the terrain today With the 500ndash600 m shift pro-jected with the RCP 85 80ndash90 of the area will still have temperatures low enoughfor snow The largest changes occur in MarchndashOctober when higher temperatures5
push the rainsnow line above large areas that receive snow today Increasing summerprecipitation (iii) causes the snowfall reduction in summer to be less than it would other-wise be The effect of higher temperatures is smaller on the APHRODITE snowfall thanon the MERRA reference snowfall (ii) as APHRODITE has very little summer snow-fall today The difference arises both from less precipitation (iii) in APHRODITE than10
MERRA today and from a higher rainsnow line (iv) in APHRODITE Note that as thechange in precipitation was defined as a fraction of the present-day value (Sect 23)the relative changes in APHRODITE and MERRA precipitation are equal
423 Upper Brahmaputra western part
In the westernmost part of the upper Brahmaputra Basin large snowfall changes are15
projected for the summer As cluster 5 in the Indus Basin Brahmaputrarsquos cluster 4 islimited to higher grounds Less than 6 lies outside of the 4000ndash6000 masl rangeThe cluster consists of Maquan He Yarlung Zangbo Dogxung ZangboMaiqu ZangboShang ChuYarlung ZangboNyang Lhasa HeRazheng Zangbo and Yamzho YumcoThe summer monsoon fully dominates the seasonal cycle of precipitation in this region20
(Fig 12a iii) resulting in a unimodal snow cycle with a maximum in JulyndashSeptember InAPHRODITE the seasonal cycle of snowfall is similar but less pronounced than in theMERRA reference The summer also sees the greatest reduction in CMIP5 projectedsnowfall both in absolute (ii) and relative (i) terms despite increasing summer precip-itation in all models (iii) The reason can be seen from the change in the rainsnow25
line elevation (iv) In the warmest months July and August elevation changes of 400ndash500 m would shift the rainsnow line from a level where at least 5ndash10 of the groundlies above the line to a level where only 1 of the area would receive precipitation as
463
TCD9 441ndash493 2015
Snowfall in theHimalayas an
uncertain future froma little-known past
E Viste and A Sorteberg
Title Page
Abstract Introduction
Conclusions References
Tables Figures
J I
J I
Back Close
Full Screen Esc
Printer-friendly Version
Interactive Discussion
Discussion
Paper
|D
iscussionP
aper|
Discussion
Paper
|D
iscussionP
aper|
snow In comparison with reference to MERRA the 300ndash400 m shift seen in JanuaryndashFebruary would cause only a small absolute change in snowfall (ii) because there islittle precipitation in these months (ii) and a small relative change (i) because therainsnow line would still be low in the terrain (iv) With reference to APHRODITE therelative snowfall change in winter would be larger than with reference to MERRA as5
temperatures today are higher resulting in a higher rainsnow line (iv)
424 Upper Brahmaputra eastern part
Like further west the Indian summer monsoon dominates the precipitation cycle in theeastern part of upper Brahmaputra (Fig 12b iii) but the seasonal cycle of snowfallpeaks in spring and fall (iii) This is also the time of the largest projected changes10
Cluster 3 in the Brahmaputra consists of the sub-basins Yarlung Zangbo2 NyangQu Yarlung Zangbo3 Yirsquoong ZangboParl Siyom Zaya QuLuhitDi About 70 of theground lies between 3000 and 6000 masl but there is also land almost at sea levelmainly in the Zaya QuLuhitDingba Qu sub-basin During summer most of the terrainlies below the rainsnow line (iv) In spring temperatures are lower than in summer15
and pre- monsoon precipitation is stronger in this part of the Himalayas than furtherwest in cluster 3 (Fig 12a iii vs Fig 12b iii) As a result MarchndashApril gets the mostsnow
Reductions in snowfall are projected for all months (ii) comparable in magnitude butlargest in the snow-rich spring and late summer The CMIP5 multi-model mean shows20
increasing or no change in precipitation in all months (Fig 12b iii) so the reductionin snowfall is due solely to higher temperatures The largest absolute reductions inApril and May occur with a 700ndash800 m shift in the rainsnow line elevation leaving30 more of the terrain in the rain The largest relative reduction in future snowfall areprojected for July and August (Fig 12b i) when the rainsnow line shifts so high that25
only the highest peaks can get precipitation as snow (iv) This would be despite thelowest changes in the rainsnow line only about 300 m in APHRODITE
464
TCD9 441ndash493 2015
Snowfall in theHimalayas an
uncertain future froma little-known past
E Viste and A Sorteberg
Title Page
Abstract Introduction
Conclusions References
Tables Figures
J I
J I
Back Close
Full Screen Esc
Printer-friendly Version
Interactive Discussion
Discussion
Paper
|D
iscussionP
aper|
Discussion
Paper
|D
iscussionP
aper|
43 Potential effects of reduced snowfall on water availability
With a few exceptions the CMIP5 multi-model mean precipitation change over the com-ing century is positive in all months in the upper Indus and Brahmaputra (Sect 42)Thus the projected reduction in snowfall is due solely to higher temperatures How-ever there is a large spread in precipitation projections among the models If tempera-5
tures increase as much as projected with the RCP 85 could any realistic precipitationchange in the HKH compensate and maintain present-day snowfall Results indicatethat this may happen in parts of the upper Indus but is out of the reach in the upperBrahmaputra As for water availability reduced snowfall may still cause more severeproblems in the Indus than in the Brahmaputra10
In cold regions where temperatures remain below freezing more winter precipita-tion may increase both the snow cover area the length of the snow season and theSWE (Collins et al 2013 Brutel-Vuilmet et al 2013 Raumlisaumlnen 2008 Gao et al 2012Wiltshire 2014) Raumlisaumlnen (2008) showed this to be the case in eastern Siberia andthe northernmost part of North America At the southern edge of the seasonal snow15
cover relevant for this study precipitation did not compensate and there was a reduc-tion in SWEWiltshire (2014) concluded that there would be small changes in snowfallin very cold and very warm regions of the HKH Snowfall in Nepal Bhutan and Hi-machal Pradesh where winters are warmer than in most parts of the range was mostvulnerable to higher temperatures The data presented in Sect 42 generally support20
the previous studiesOne of the reasons that precipitation does not compensate is that the highest pro-
jected precipitation increase in the HKH is seen in the summer when the temperaturetoday is so high that only the highest terrain is in the snow zone Shifting the rainsnowline upward even by only a few hundred meters reduces the area that receives snow25
greatly requiring very large increases in precipitation to compensate The summer isthe season with the largest relative reduction in snowfall in all the clusters described inSect 42 Except in the western upper Indus (cluster I4 Sect 421) which has very
465
TCD9 441ndash493 2015
Snowfall in theHimalayas an
uncertain future froma little-known past
E Viste and A Sorteberg
Title Page
Abstract Introduction
Conclusions References
Tables Figures
J I
J I
Back Close
Full Screen Esc
Printer-friendly Version
Interactive Discussion
Discussion
Paper
|D
iscussionP
aper|
Discussion
Paper
|D
iscussionP
aper|
little summer snowfall today the reduction in summer snowfall is notable in all clustersin the MERRA data in the Brahmaputra clusters also in APHRODITE
The largest change in snowfall is seen in the western part of the Brahmaputra (clus-ter B4 Sect 423) where a 400ndash500 m upward shift in the rainsnow line during sum-mer reduces the area with temperatures low enough for snowfall by a factor of 5ndash105
(Fig 12a iv values not shown) As a result the summer peak in the seasonal cycleof snowfall is replaced by a dip (Fig 12a ii) With an even distribution of precipitationwith elevation the area that still receives snow would have to receive 5ndash10 times asmuch precipitation to compensate for the lost snowfall Assuming more realisticallythat precipitation decreases above a certain height would require an even higher in-10
crease in precipitation In the model with the highest increase a doubling of the Julyprecipitation by the end of the century SWE is less than 25 of todayrsquos value in thatmonth (Fig 12a iii)
With a winter-dominated precipitation cycle the relative change in snowfall is smallerin the upper Indus than in the upper Brahmaputra Downscaling a high-emission sce-15
nario (A1B) in two CMIP3 models with a regional model Wiltshire (2014) found that bythe 2080s precipitation increased more than enough to compensate for higher temper-atures in the Karakoram Hindu Kush and Jammu and Kashmir in one of the modelsthe HadCM3 In the other model ECHAM5 precipitation increased less and snow-fall increased only in the higher parts of the Karakoram In our ensemble of CMIP520
models multi-model mean precipitation in the upper Indus clusters increases mainlyin the summer season when the inter-model spread is also the largest (Fig 11a iiiand 11b iii) Among the models 4ndash5 project increased winter precipitation in the upperIndus and in the uppermost cluster I5 this is associated with an increase in wintersnowfall (Fig 11b ii)25
Although it is the part of the HKH where snowfall is least reduced by increasingtemperatures (Fig 10b) the Karakoram and inner parts of the upper Indus may still bethe region where the changes have the largest impact on river run-off Compared tothe monsoon-dominated regions further east there is little summer precipitation and
466
TCD9 441ndash493 2015
Snowfall in theHimalayas an
uncertain future froma little-known past
E Viste and A Sorteberg
Title Page
Abstract Introduction
Conclusions References
Tables Figures
J I
J I
Back Close
Full Screen Esc
Printer-friendly Version
Interactive Discussion
Discussion
Paper
|D
iscussionP
aper|
Discussion
Paper
|D
iscussionP
aper|
much of the water in the rivers during summer is meltwater (Bookhagen and Burbank2010 Immerzeel et al 2010) As melting of snow and ice has not been analyzed inthis study we cannot quantify the effect of reduced snowmelt om river run-off but it isobvious that eventually reduced snowfall will lead to reduced melting In western partsof the HKH this may lead to changes in the seasonal cycle of the river flow5
As pointed out by Wiltshire (2014) increasing precipitation in the eastern HKH im-plies that water resources are likely to increase with climate change As snowfall andsnowmelt are both at maximum during summer (Rees and Collins 2006) meltwaterdoes not have the same importance for river flow in dry parts of the year as in the In-dus Reduced snowfall may reduce glaciers but ndash not considering potential changes in10
the amount of evaporation ndash there is no indication that there will be less water comingfrom the upper Brahmaputra
5 Concluding summary
In this study we have presented a suite of estimates of present-day snowfall in theIndus Ganges and Brahmaputra Basins and the changes in snowfall that would follow15
from CMIP5 projected changes in temperature and precipitation from 1971ndash2000 to2071ndash2100 The results show that if the temperature increases as much as in the RCP85 there will be much less snowfall despite increasing precipitation in most of theregion Limiting anthropogenic forcing to the RCP 26 level would still cause reductionsthough smaller20
Estimates of present-day snowfall based on a combination of temperature and pre-cipitation from reanalysis data and observations vary by factors of 2ndash4 The MERRAreanalysis gives higher estimates than TRMM 3B42 CRU TS and APHRODITE butthe spread is also large between the estimates based on the different observationallybased data sets This demonstrates the difficulties in assessing vulnerability to climate25
change in the region With limited knowledge of the current state future conditions arebound to be uncertain
467
TCD9 441ndash493 2015
Snowfall in theHimalayas an
uncertain future froma little-known past
E Viste and A Sorteberg
Title Page
Abstract Introduction
Conclusions References
Tables Figures
J I
J I
Back Close
Full Screen Esc
Printer-friendly Version
Interactive Discussion
Discussion
Paper
|D
iscussionP
aper|
Discussion
Paper
|D
iscussionP
aper|
Future changes in temperature and precipitation projected by climate models can stillprovide an indication of the relative change in snowfall With the RCP 85 the climatemodels project mean reductions in annual snowfall by 30ndash50 in the Indus Basin 50ndash60 in the Ganges Basin and 50ndash70 in the Brahmaputra Basin by 2071ndash2100 Withthe RCP 26 the corresponding reductions would be 10ndash20 in the Indus about 20 5
in the Ganges and 20ndash30 in the Brahmaputra The reductions are due to increasingtemperatures as the mean of the models show constant or increasing precipitationthroughout the year in most of the region
How much increasing temperatures reduce snowfall in a region depends on howmuch of the terrain that is below and above the freezing point today and on whether10
the terrain profile is such that the temperature increase transforms large areas fromsnow to rain zones With the RCP 85 the mean elevation where rain changes to snowndash the rainsnow line ndash creeps upward by 400ndash900 m in most of the region by 700ndash900 m
The largest relative change in snowfall is seen in the upper westernmost sub-basins15
of the Brahmaputra despite increasing precipitation and the lowest rainsnow line el-evation change (400ndash500 m) This is because a major part of this region is near thefreezing point today With the RCP 85 most of this region will have temperaturesabove freezing especially in the summer which is the wettest part of the year Theprojected reduction in annual snowfall is 65ndash75 20
In the upper Indus the effect of a warmer climate on snowfall is less extreme asmost of the terrain is high enough to have temperatures sufficiently far below freezingtoday Winter and spring brings most of the precipitation and the projected 600ndash800 mchange in the rainsnow line elevation during these seasons would leave most of theterrain below the freezing point Still a 20ndash40 reduction in annual snowfall is pro-25
jected with the RCP 85The range of our estimates of present-day snowfall illustrates how little that is known
about conditions that influence the availability of drinking water in some of the mostdensely populated parts of the world There is both a scientific and a societal need
468
TCD9 441ndash493 2015
Snowfall in theHimalayas an
uncertain future froma little-known past
E Viste and A Sorteberg
Title Page
Abstract Introduction
Conclusions References
Tables Figures
J I
J I
Back Close
Full Screen Esc
Printer-friendly Version
Interactive Discussion
Discussion
Paper
|D
iscussionP
aper|
Discussion
Paper
|D
iscussionP
aper|
for more information about precipitation in the HKH As a full-scale long-time observa-tional program covering all parts of the Himalayan range is not a likely possibility theonly hope for improved future knowledge of Himalayan snowfall lies in the improvementof satellite data and regional climate models
The Supplement related to this article is available online at5
doi105194tcd-9-441-2015-supplement
Acknowledgements This work has been carried out with support from the University of Bergenthe NORINDIA and SNOWHIM projects funded by The Research Council of Norway and theCentre for Climate Dynamics at the Bjerknes Centre for Climate Research We acknowledgethe World Climate Research Programmersquos Working Group on Coupled Modelling which is re-10
sponsible for CMIP and we thank the climate modeling groups listed in Table 3 of this paper forproducing and making available their model output For CMIP the US Department of EnergyrsquosProgram for Climate Model Diagnosis and Intercomparison provides coordinating support andled development of software infrastructure in partnership with the Global Organization for EarthSystem Science Portals15
References
Akhtar M Ahmad N and Booij M J The impact of climate change on the water resourcesof Hindukush-Karakorum-Himalaya region under different glacier coverage scenarios J Hy-drol 355 148ndash163 2008
Anders A M Roe G H Hallet B Montgomery D R Finnegan N J and Putkonen J20
Spatial patterns of precipitation and topography in the Himalaya in Tectonics Climate andLandscape Evolution Geological Society of America Special Paper edited by Willett S DHovius N Brandon M T and Fisher D Geological Society of America Boulder CO USA39ndash53 2006
469
TCD9 441ndash493 2015
Snowfall in theHimalayas an
uncertain future froma little-known past
E Viste and A Sorteberg
Title Page
Abstract Introduction
Conclusions References
Tables Figures
J I
J I
Back Close
Full Screen Esc
Printer-friendly Version
Interactive Discussion
Discussion
Paper
|D
iscussionP
aper|
Discussion
Paper
|D
iscussionP
aper|
Archer DR and Fowler HJ Spatial and temporal variations in precipitation in the UpperIndus Basin global teleconnections and hydrological implications Hydrol Earth Syst Sci8 47ndash61 doi105194hess-8-47-2004 2004
Bhutiyani M R Kale V S and Pawar N J Long-term trends in maximum minimum andmean annual air temperatures across the Northwestern Himalaya during the twentieth cen-5
tury Climatic Change 85 159ndash177 doi101007s10584-006-9196-1 2007Bhutiyani M R Kale V S and Pawar N J Climate change and the precipitation variations in
the northwestern Himalaya 1866ndash2006 Int J Climatol 30 535ndash548 doi101002joc19202010
Bookhagen B and Burbank D W Topography relief and TRMM-derived rainfall variations10
along the Himalaya Geophys Res Lett 33 L08405 doi1010292006GL026037 2006Bookhagen B and Burbank D W Toward a complete Himalayan hydrological budget spa-
tiotemporal distribution of snowmelt and rainfall and their impact on river discharge J Geo-phys Res 115 F03019 doi1010292009jf001426 2010
Franco B Fettweis X and Erpicum M Future projections of the Greenland ice sheet energy15
balance driving the surface melt The Cryosphere 7 1ndash18 doi105194tc-7-1-2013 2013Butt M J Characteristics of snow cover in the Hindukush Karakoram and Himalaya region
using Landsat satellite data Hydrol Process 10 3689ndash3698 doi101002hyp8375 2012Byun K and Choi M Uncertainty of snow water equivalent retrieved from AMSR-E brightness
temperature in northeast Asia Hydrol Process 28 12 doi101002hyp9846 201420
Chaturvedi R K Joshi J Jayaraman M Bala G and Ravindranath N H Multi-modelclimate change projections for India under representative concentration pathways Curr SciIndia 103 791ndash802 2012
Christensen J H Krishna Kumar K Aldrian E An S-I Cavalcanti I F A Castro Md Dong W Goswami P Hall A Kanyanga J K Kitoh A Kossin J Lau N-C Ren-25
wick J Stephenson D B Xie S-P and Zhou T Climate phenomena and their relevancefor future regional climate change in Climate Change 2013 The Physical Science BasisContribution of Working Group I to the Fifth Assessment Report of the Intergovernmen-tal Panel on Climate Change edited by Stocker T F Qin D Plattner G-K Tignor MAllen S K Boschung J Nauels A Xia Y Bex V and Midgley P M Cambridge Univer-30
sity Press Cambridge UK and New York NY USA 92 2013Collins M Knutti R Arblaster J Dufresne J-L Fichefet T Friedlingstein P Gao X
Gutowski W J Johns T Krinner G Shongwe M Tebaldi C Weaver A J and
470
TCD9 441ndash493 2015
Snowfall in theHimalayas an
uncertain future froma little-known past
E Viste and A Sorteberg
Title Page
Abstract Introduction
Conclusions References
Tables Figures
J I
J I
Back Close
Full Screen Esc
Printer-friendly Version
Interactive Discussion
Discussion
Paper
|D
iscussionP
aper|
Discussion
Paper
|D
iscussionP
aper|
Wehner M Long-term climate change projections commitments and irreversibility in Cli-mate Change 2013 The Physical Science Basis Contribution of Working Group I to theFifth Assessment Report of the Intergovernmental Panel on Climate Change edited byStocker T F Qin D Plattner G-K Tignor M Allen S K Boschung J Nauels AXia Y Bex V and Midgley P M Cambridge University Press Cambridge UK and New5
York NY USA 108 2013Cook E R Palmer J G Ahmed M Woodhouse C A Fenwick P Zafar M U Wahab M
and Khan N Five centuries of Upper Indus River flow from tree rings J Hydrol 486 365ndash375 doi101016jjhydrol201302004 2013
Dai A Temperature and pressure dependence of the rain-snow phase transition over land and10
ocean Geophys Res Lett 35 L12802 doi1010292008gl033295 2008Fowler H J and Archer D R Conflicting signals of climatic change in the Upper Indus Basin
J Climate 19 4276ndash4293 doi101175jcli38601 2006Gao J Williams M W Fu X Wang G and Gong T Spatiotemporal distribution of snow
in eastern Tibet and the response to climate change Remote Sens Environ 121 1ndash915
doi101016jrse201201006 2012Gardelle J Berthier E and Arnaud Y Slight mass gain of Karakoram glaciers in the
early twenty-first century ndash Supplement Nature Geosci 5 322ndash325 doi101038ngeo14502012
Guhathakurta P and Rajeevan M Trends in the rainfall pattern over India Int J Climatol20
28 1453ndash1469 doi101002joc1640 2008Harris I Jones P D Osborn T J and Lister D H Updated high-resolution grids of
monthly climatic observations ndash the CRU TS310 Dataset Int J Climatol 34 623ndash642doi101002joc3711 2014
Hartmann H and Andresky L Flooding in the Indus River basin ndash a spa-25
tiotemporal analysis of precipitation records Global Planet Change 107 25ndash35doi101016jgloplacha201304002 2013
Hastings D and Dunbar P Development amp Assessment of the Global Land One-km BaseElevation Digital Elevation Model (GLOBE) ISPRS Commission IV Symposium on GIS ndashBetween Visions and Applications Stuttgart Germany 7ndash10 September 199830
Hewitt K The Karakoram anomaly Glacier expansion and the ldquoelevation ef-fectrdquo Karakoram Himalaya Mt Res Dev 25 332ndash340 doi1016590276-4741(2005)025[0332TKAGEA]20CO2 2005
471
TCD9 441ndash493 2015
Snowfall in theHimalayas an
uncertain future froma little-known past
E Viste and A Sorteberg
Title Page
Abstract Introduction
Conclusions References
Tables Figures
J I
J I
Back Close
Full Screen Esc
Printer-friendly Version
Interactive Discussion
Discussion
Paper
|D
iscussionP
aper|
Discussion
Paper
|D
iscussionP
aper|
Huffman G J Adler R F Bolvin D T Gu G Nelkin E J Bowman K P Hong YStocker E F and Wolff D B The TRMM Multisatellite Precipitation Analysis (TMPA) quasi-global multiyear combined-sensor precipitation estimates at fine scales J Hydrometeorol8 38ndash55 2007
Immerzeel W Historical trends and future predictions of climate variability in the Brahmaputra5
basin Int J Climatol 28 243ndash254 doi101002joc1528 2008Immerzeel W W Droogers P de Jong S M and Bierkens M F P Large-scale monitoring
of snow cover and runoff simulation in Himalayan river basins using remote sensing RemoteSens Environ 113 40ndash49 doi101016jrse200808010 2009
Immerzeel W W van Beek L P H and Bierkens M F P Climate change will affect the10
asian water towers Science 328 1382ndash1385 doi101126science1183188 2010Ines A V M and Hansen J W Bias correction of daily GCM rainfall for crop simulation
studies Agr Forest Meteorol 138 44ndash53 doi101016jagrformet200603009 2006Jain S K Goswami A and Saraf A K Role of elevation and aspect in snow distribution
in western Himalaya Water Resour Manag 23 71ndash83 doi101007s11269-008-9265-515
2009Krakauer N Pradhanang S Lakhankar T and Jha A Evaluating satellite products for
precipitation estimation in mountain regions a case study for Nepal Remote Sensing 54107ndash4123 2013
Krishna A P Snow and glacier cover assessment in the high mountains of Sikkim Himalaya20
Hydrol Process 19 2375ndash2383 doi101002hyp5890 2005Kulkarni A V Rathore B P Singh S K and Ajai Distribution of seasonal snow cover in cen-
tral and western Himalaya Ann Glaciol 51 123ndash128 doi1031891727564107913864452010
Kumar V Rao Y S Venkataraman G Sarwade R N and Mani S Analysis of Aqua25
AMSR-E Derived Snow Water Equivalent over Himalayan Snow Covered Regions Geo-science and Remote Sensing Symposium Denver CO USA 31 Julyndash4 August 2006
Kaumlaumlb A Berthier E Nuth C Gardelle J and Arnaud Y Contrasting patterns of earlytwenty-first-century glacier mass change in the Himalayas Nature 488 495ndash498 availableat httpwwwnaturecomnaturejournalv488n7412absnature11324html ndash Supplement30
2012Lehner B Verdin K and Jarvis A New global hydrography derived from spaceborne eleva-
tion data Eos T Am Geophys Un 89 93ndash94 doi1010292008EO100001 2008
472
TCD9 441ndash493 2015
Snowfall in theHimalayas an
uncertain future froma little-known past
E Viste and A Sorteberg
Title Page
Abstract Introduction
Conclusions References
Tables Figures
J I
J I
Back Close
Full Screen Esc
Printer-friendly Version
Interactive Discussion
Discussion
Paper
|D
iscussionP
aper|
Discussion
Paper
|D
iscussionP
aper|
MacQueen J Some Methods for Classification and Analysis of Multivariate ObservationsFifth Berkeley Symposium on Mathematical Statistics and Probability Berkeley California21 Junendash18 July 1967
Meacuteneacutegoz M Galleacutee H and Jacobi H W Precipitation and snow cover in the Himalayafrom reanalysis to regional climate simulations Hydrol Earth Syst Sci 17 3921ndash39365
doi105194hess-17-3921-2013 2013Menon A Levermann A Schewe J Lehmann J and Frieler K Consistent increase in
Indian monsoon rainfall and its variability across CMIP-5 models Earth Syst Dynam 4287ndash300 doi105194esd-4-287-2013 2013
Moss R H Edmonds J A Hibbard K A Manning M R Rose S K van Vuuren D P10
Carter T R Emori S Kainuma M Kram T Meehl G A Mitchell J F B Naki-cenovic N Riahi K Smith S J Stouffer R J Thomson A M Weyant J P andWilbanks T J The next generation of scenarios for climate change research and assess-ment Nature 463 747ndash756 2010
Negi H S Kulkarni A V and Semwal B S Estimation of snow cover distribution in Beas15
basin Indian Himalaya using satellite data and ground measurements J Earth Syst Sci118 525ndash538 doi101007s12040-009-0039-0 2009
Palazzi E v Hardenberg J and Provenzale A Precipitation in the Hindu-Kush Karako-ram Himalaya observations and future scenarios J Geophys Res-Atmos 118 85ndash100doi1010292012JD018697 201320
Rees H G and Collins D N Regional differences in response of flow in glacier-fed Himalayanrivers to climatic warming Hydrol Process 20 2157ndash2169 doi101002hyp6209 2006
Rienecker M M Suarez M J Gelaro R Todling R Bacmeister J Liu EBosilovich M G Schubert S D Takacs L Kim G-K Bloom S Chen J Collins DConaty A da Silva A Gu W Joiner J Koster R D Lucchesi R Molod A Owens T25
Pawson S Pegion P Redder C R Reichle R Robertson F R Ruddick A GSienkiewicz M and Woollen J MERRA NASArsquos Modern-Era Retrospective Analysis forResearch and Applications J Climate 24 3624ndash3648 doi101175JCLI-D-11-0001512011
Rikiishi K and Nakasato H Height dependence of the tendency for reduction in seasonal30
snow cover in the Himalaya and the Tibetan Plateau region 1966ndash2001 Ann Glaciol 43369ndash377 doi103189172756406781811989 2006
473
TCD9 441ndash493 2015
Snowfall in theHimalayas an
uncertain future froma little-known past
E Viste and A Sorteberg
Title Page
Abstract Introduction
Conclusions References
Tables Figures
J I
J I
Back Close
Full Screen Esc
Printer-friendly Version
Interactive Discussion
Discussion
Paper
|D
iscussionP
aper|
Discussion
Paper
|D
iscussionP
aper|
Raumlisaumlnen J Warmer climate less or more snow Clim Dynam 30 307ndash319doi101007s00382-007-0289-y 2008
Schaner N Voisin N Nijssen B and Lettenmaier D P The contribution of glacier melt tostreamflow Environ Res Lett 7 034029 doi1010881748-932673034029 2012
Scherler D Bookhagen B and Strecker M R Spatially variable response of Himalayan5
glaciers to climate change affected by debris cover Nature Geosci 4 156ndash159 availableat httpwwwnaturecomngeojournalv4n3absngeo1068html ndash Supplement 2011
Sharif M Archer D R Fowler H J and Forsythe N Trends in timing and magnitude offlow in the Upper Indus Basin Hydrol Earth Syst Sci 17 1503ndash1516 doi105194hess-17-1503-2013 201310
Shekhar M S Chand H Kumar S Srinivasan K and Ganju A Climate-change studiesin the western Himalaya Ann Glaciol 51 105ndash112 doi1031891727564107913865082010
Shrestha A B Wake C P Mayewski P A and Dibb J E Maximum tempera-ture trends in the Himalaya and its vicinity an analysis based on temperature records15
from Nepal for the period 1971ndash94 J Climate 12 2775ndash2786 doi1011751520-0442(1999)012lt2775MTTITHgt20CO2 1999
Shrestha A B Wake C P Dibb J E and Mayewski P A Precipitation fluctuations in theNepal Himalaya and its vicinity and relationship with some large scale climatological parame-ters Int J Climatol 20 317ndash327 doi101002(SICI)1097-0088(20000315)203lt317AID-20
JOC476gt30CO2-G 2000Siderius C Biemans H Wiltshire A Rao S Franssen W H P Kumar P Gosain A K
van Vliet M T H and Collins D N Snowmelt contributions to discharge of the GangesSci Total Environ Supplement 468ndash469 9 doi101016jscitotenv201305084 2013
Singh P Jain S K and Kumar N Estimation of snow and glacier-melt contribution to the25
Chenab River Western Himalaya Mt Res Dev 17 49ndash56 doi1023073673913 1997Singh P Kumar V Thomas T and Arora M Changes in rainfall and relative hu-
midity in river basins in northwest and central India Hydrol Process 22 2982ndash2992doi101002hyp6871 2008
Sontakke N A Singh N and Singh H N Instrumental period rainfall series of the Indian30
region (AD 1813ndash2005) revised reconstruction update and analysis Holocene 18 1055ndash1066 doi1011770959683608095576 2008
474
TCD9 441ndash493 2015
Snowfall in theHimalayas an
uncertain future froma little-known past
E Viste and A Sorteberg
Title Page
Abstract Introduction
Conclusions References
Tables Figures
J I
J I
Back Close
Full Screen Esc
Printer-friendly Version
Interactive Discussion
Discussion
Paper
|D
iscussionP
aper|
Discussion
Paper
|D
iscussionP
aper|
Sperber K R Annamalai H Kang I S Kitoh A Moise A Turner A Wang B andZhou T The Asian summer monsoon an intercomparison of CMIP5 vs CMIP3 simulationsof the late 20th century Clim Dynam 41 2711ndash2744 doi101007s00382-012-1607-62013
Tahir A A Chevallier P Arnaud Y and Ahmad B Snow cover dynamics and hydrological5
regime of the Hunza River basin Karakoram Range Northern Pakistan Hydrol Earth SystSci 15 2275ndash2290 doi105194hess-15-2275-2011 2011a
Tahir A A Chevallier P Arnaud Y Neppel L and Ahmad B Modeling snowmelt-runoffunder climate scenarios in the Hunza River basin Karakoram Range Northern Pakistan JHydrol 409 104ndash117 doi101016jjhydrol201108035 2011b10
Taylor K E Stouffer R J and Meehl G A An overview of CMIP5 and the experimentdesign B Am Meteorol Soc 93 14 doi101175BAMS-D-11-000941 2011
Tedesco M and Narvekar P S Assessment of the NASA AMSR-E SWE product IEEE J SelTop Appl 3 141ndash159 doi101109JSTARS20102040462 2010
Teutschbein C and Seibert J Bias correction of regional climate model simulations for hydro-15
logical climate-change impact studies review and evaluation of different methods J Hydrol456ndash457 12ndash29 doi101016jjhydrol201205052 2012
Turner A G and Annamalai H Climate change and the South Asian summer monsoon NatClim Change 2 587ndash595 2012
van Vuuren D Edmonds J Kainuma M Riahi K Thomson A Hibbard K Hurtt G20
Kram T Krey V Lamarque J-F Masui T Meinshausen M Nakicenovic N Smith Sand Rose S The representative concentration pathways an overview Climatic Change109 26 doi101007s10584-011-0148-z 2011
Wang A and Zeng X Development of global hourly 05-degree land surface air temperaturedatasets J Climate 26 7676ndash7691 doi101175JCLI-D-12-006821 201325
Wiltshire A J Climate change implications for the glaciers of the Hindu Kush Karakoram andHimalayan region The Cryosphere 8 941ndash958 doi105194tc-8-941-2014 2014
Winiger M Gumpert M and Yamout H KarakorumndashHindukushndashwestern Himalaya assess-ing high-altitude water resources Hydrol Process 19 2329ndash2338 doi101002hyp5887200530
Xu X Lu C Shi X and Gao S World water tower An atmospheric perspective GeophysRes Lett 35 L20815 doi1010292008GL035867 2008a
475
TCD9 441ndash493 2015
Snowfall in theHimalayas an
uncertain future froma little-known past
E Viste and A Sorteberg
Title Page
Abstract Introduction
Conclusions References
Tables Figures
J I
J I
Back Close
Full Screen Esc
Printer-friendly Version
Interactive Discussion
Discussion
Paper
|D
iscussionP
aper|
Discussion
Paper
|D
iscussionP
aper|
Xu Z X Gong T L and Li J Y Decadal trend of climate in the Tibetan Plateaumdashregionaltemperature and precipitation Hydrol Process 22 3056ndash3065 doi101002hyp68922008b
Yasutomi N Hamada A and Akiyo Y Development of a Long-term Daily Gridded Temper-ature Dataset and its Application to RainSnow Discrimination of Daily Precipitation Global5
Environ Res15 165ndash172 2011Yatagai A Kamiguchi K Arakawa O Hamada A Yasutomi N and Kitoh A APHRODITE
Constructing a Long-Term Daily Gridded Precipitation Dataset for Asia Based on a DenseNetwork of Rain Gauges B Am Meteorol Soc 93 1401ndash1415 doi101175BAMS-D-11-001221 201210
You Q Kang S Aguilar E and Yan Y Changes in daily climate extremes in the east-ern and central Tibetan Plateau during 1961ndash2005 J Geophys Res-Atmos 113 D07101doi1010292007JD009389 2008
476
TCD9 441ndash493 2015
Snowfall in theHimalayas an
uncertain future froma little-known past
E Viste and A Sorteberg
Title Page
Abstract Introduction
Conclusions References
Tables Figures
J I
J I
Back Close
Full Screen Esc
Printer-friendly Version
Interactive Discussion
Discussion
Paper
|D
iscussionP
aper|
Discussion
Paper
|D
iscussionP
aper|
Table 1 Combinations of data types used in snowfall estimates T temperature P precipita-tion f (P T ) indicates that snowfall is calculated as a function of P and T
Precipitation Temperature Snowfall Time
MERRA MERRA PresentMERRA reference MERRA Terrain-adjusted MERRA f (P T ) PresentMERRA T2m MERRA MERRA T2m f (P T ) PresentBias-corrected with obs T MERRA Bias-corr terrain-adj MERRA f (P T ) PresentBias-corrected with obs P Bias-corr MERRA Terrain-adjusted MERRA f (P T ) PresentBias-corrected with obs T P Bias-corr MERRA Bias-corr terrain-adj MERRA f (P T ) PresentCMIP5 T MERRA Terrain-adj MERRA+∆T f (P T ) FutureCMIP5 P MERRAtimes∆P Terrain-adj MERRA f (P T ) FutureCMIP5 T P MERRAtimes∆P Terrain-adj MERRA+∆T f (P T ) FutureBias-corr CMIP5 T Bias-corr MERRA Bias-corr terrain-adj MERRA+∆T f (P T ) FutureBias-corr CMIP5 P Bias-corr MERRAtimes∆P Bias-corr terrain-adj MERRA f (P T ) FutureBias-corr CMIP5 T P Bias-corr MERRAtimes∆P Bias-corr terrain-adj MERRA+∆T f (P T ) Future
477
TCD9 441ndash493 2015
Snowfall in theHimalayas an
uncertain future froma little-known past
E Viste and A Sorteberg
Title Page
Abstract Introduction
Conclusions References
Tables Figures
J I
J I
Back Close
Full Screen Esc
Printer-friendly Version
Interactive Discussion
Discussion
Paper
|D
iscussionP
aper|
Discussion
Paper
|D
iscussionP
aper|
Table 2 Data sets used in calculations of present-day snowfall
Product Time Hor res Description
MERRA 1979ndash2012 05 lat 07 lon Hourly atmospheric reanalysis data(Rienecker et al 2011)
APHRODITEV1204V1101
1979ndash2007 025 Daily temperature andprecipitation basedon observations (Yatagai et al 2012Yasutomi et al 2011)
CRU TS 320 1979ndash2011 05 Monthly temperature and precipitationbased on observations(Harris et al 2014)
TRMM 3B42 V7 1998ndash2012 05 3 hourly satellite-based precipitation(Huffman et al 2007)
GLOBE 1 km Topography data set(Hastings and Dunbar 1998)
478
TCD9 441ndash493 2015
Snowfall in theHimalayas an
uncertain future froma little-known past
E Viste and A Sorteberg
Title Page
Abstract Introduction
Conclusions References
Tables Figures
J I
J I
Back Close
Full Screen Esc
Printer-friendly Version
Interactive Discussion
Discussion
Paper
|D
iscussionP
aper|
Discussion
Paper
|D
iscussionP
aper|
Table 3 CMIP5 models and RCPs used (x) in calculations of 2071ndash2100 snowfall
Model RCP 26 RCP 85
CanESM2 x xCCSM4 x xCESM1-CAM5 xCNRM-CM5 xGFDL-CM3 x xGFDL-ESM2G xGISS-E2-R x xHadGEM2-ES x xIPSL-CM5A-LR x xIPSL-CM5A-MR x xMIROC-ESM x xMIROC-ESM-CHEM x xMIROC5 x xMRI-CGCM3 x xNorESM1-M x xNorESM1-ME x x
479
TCD9 441ndash493 2015
Snowfall in theHimalayas an
uncertain future froma little-known past
E Viste and A Sorteberg
Title Page
Abstract Introduction
Conclusions References
Tables Figures
J I
J I
Back Close
Full Screen Esc
Printer-friendly Version
Interactive Discussion
Discussion
Paper
|D
iscussionP
aper|
Discussion
Paper
|D
iscussionP
aper|
Table 4 Annual snowfall estimates for the Indus Ganges and Brahmaputra Basins S snow[km3 SWE] P precipitation [km3] S and P percent of MERRA reference snowfall andMERRA precipitation First horizontal section no bias-corrections Second third and fourthsection bias-corrections with T P and both T and P
Indus Basin Ganges Basin Brahmaputra BasinInput S S P P S S P P S S P P
MERRA reference 148 100 422 100 54 100 1147 100 119 100 733 100MERRA 166 112 422 100 49 90 1147 100 129 109 733 100MERRA T2m 154 104 422 100 42 77 1147 100 109 92 733 100T APHRODITE 113 76 422 100 30 55 1147 100 74 62 733 100T CRU 126 85 422 100 81 151 1147 100 109 92 733 100P APHRODITE 66 44 315 75 22 42 1020 89 35 30 567 77P TRMM 72 49 404 96 31 57 1244 108 63 54 835 114P CRU 84 56 398 94 30 56 1100 96 53 45 716 98P T APHRODITE 49 33 315 75 12 22 1020 89 20 17 567 77P APHRODITE T CRU 62 42 315 75 34 63 1020 89 33 28 567 77P TRMM T APHRODITE 54 36 390 92 18 34 1195 104 39 33 815 111P TRMM T CRU 65 44 403 96 46 85 1254 109 58 49 813 111P CRU T APHRODITE 65 44 395 94 17 31 1106 96 31 26 718 98P T CRU 80 54 398 94 41 75 1100 96 49 42 716 98
480
TCD9 441ndash493 2015
Snowfall in theHimalayas an
uncertain future froma little-known past
E Viste and A Sorteberg
Title Page
Abstract Introduction
Conclusions References
Tables Figures
J I
J I
Back Close
Full Screen Esc
Printer-friendly Version
Interactive Discussion
Discussion
Paper
|D
iscussionP
aper|
Discussion
Paper
|D
iscussionP
aper|
Table 5 Projected change in annual snowfall from 1971ndash2000 to 2071ndash2100 with referenceto terrain-adjusted MERRA and APHRODITE ∆Sabs [km3] is the absolute change ∆Srel [] isthe relative change compared to the present-day MERRA reference snowfall Values are pre-sented with the CMIP5 multi-model mean as the main value and the span of individual modelsin brackets (MERRA only) ∆TP indicates that changes in both temperature and precipitationare included whereas ∆P and ∆T denotes changes only in precipitation or temperature re-spectively
Indus Ganges Brahmaputra∆Sabs [km3] ∆Srel [] ∆Sabs [km3] ∆Srel [] ∆Sabs [km3] ∆Srel []
RCP 85 MERRA ∆TP minus49 [minus83minus9] minus33 [minus56minus6] minus27 [minus36minus14] minus50 [minus66minus25] minus64 [minus93minus39] minus54 [minus79minus33]MERRA ∆T minus51 [minus67minus34] minus34 [minus45minus23] minus28 [minus34minus21] minus51 [minus64minus39] minus71 [minus87minus53] minus60 [minus73minus44]MERRA ∆P 5 [minus2544] 4 [minus1730] 7 [minus417] 12 [minus731] 20 [minus1750] 17 [minus1542]
APHRO ∆TP minus25 minus51 minus7 minus56 minus13 minus67APHRO ∆T minus25 minus52 minus7 minus57 minus14 minus71APHRO ∆P 1 1 1 6 3 16
RCP 26 MERRA ∆TP minus15 [minus406] minus10 [minus274] minus10 [minus19minus3] minus18 [minus36minus5] minus25 [minus42minus5] minus21 [minus35minus4]MERRA ∆T minus18 [minus27minus9] minus12 [minus18minus6] minus12 [minus21minus6] minus21 [minus39minus11] minus29 [minus47minus13] minus25 [minus40minus11]MERRA ∆P 3 [minus1825] 2 [minus1217] 3 [minus210] 5 [minus419] 7 [minus828] 6 [minus623]
APHRO ∆TP minus9 minus18 minus2 minus20 minus6 minus29APHRO ∆T minus10 minus19 minus3 minus23 minus6 minus32APHRO ∆P 1 1 0 4 1 6
481
TCD9 441ndash493 2015
Snowfall in theHimalayas an
uncertain future froma little-known past
E Viste and A Sorteberg
Title Page
Abstract Introduction
Conclusions References
Tables Figures
J I
J I
Back Close
Full Screen Esc
Printer-friendly Version
Interactive Discussion
Discussion
Paper
|D
iscussionP
aper|
Discussion
Paper
|D
iscussionP
aper|
Figure 1 Map of the region with the Indus Ganges and Brahmaputra basins outlined in whiteThinner outlines are national borders Background NASA Visible Earth
482
TCD9 441ndash493 2015
Snowfall in theHimalayas an
uncertain future froma little-known past
E Viste and A Sorteberg
Title Page
Abstract Introduction
Conclusions References
Tables Figures
J I
J I
Back Close
Full Screen Esc
Printer-friendly Version
Interactive Discussion
Discussion
Paper
|D
iscussionP
aper|
Discussion
Paper
|D
iscussionP
aper|
0
400 mm
Months 1ndash12
SP
I1
I2I3
I5I4
G1
G2G3
G4
B1
B2
B3B4
Viste amp SortebergFigure 2
Figure 2 Monthly mean MERRA precipitation and MERRA reference snowfall in sub-basinclusters of the Indus (I) Ganges (G) and Brahmaputra (B) Total bar height MERRA precip-itation (P) [mm] Colored bars snowfall (S) [mm SWE] based on MERRA precipitation andterrain-adjusted MERRA temperature in the region with the same color Cluster 1 in eachbasin is considered snow-free and the seasonal cycles are not shown
483
TCD9 441ndash493 2015
Snowfall in theHimalayas an
uncertain future froma little-known past
E Viste and A Sorteberg
Title Page
Abstract Introduction
Conclusions References
Tables Figures
J I
J I
Back Close
Full Screen Esc
Printer-friendly Version
Interactive Discussion
Discussion
Paper
|D
iscussionP
aper|
Discussion
Paper
|D
iscussionP
aper|
a) MERRA reference b) APHRODITE c) APHRODITE ndash MERRA ref
30 km3
20100-10-20-30
Viste amp SortebergFigure 3
Figure 3 The effect of bias-corrections with APHRODITE temperature and precipitation(a) MERRA reference snowfall (b) Snowfall based on bias-corrections with APHRODITE(c) APHRODITE (b) minus MERRA reference snowfall (a)
484
TCD9 441ndash493 2015
Snowfall in theHimalayas an
uncertain future froma little-known past
E Viste and A Sorteberg
Title Page
Abstract Introduction
Conclusions References
Tables Figures
J I
J I
Back Close
Full Screen Esc
Printer-friendly Version
Interactive Discussion
Discussion
Paper
|D
iscussionP
aper|
Discussion
Paper
|D
iscussionP
aper|
Figure 4 Difference between MERRA precipitation and observation-based data (a) Annualmean MERRA precipitation (b c and d) Annual mean MERRA precipitation bias-correctedwith observations APHRODITE CRU TS and TRMM 3B42 For each data set the small insetmaps show the observations minus MERRA
485
TCD9 441ndash493 2015
Snowfall in theHimalayas an
uncertain future froma little-known past
E Viste and A Sorteberg
Title Page
Abstract Introduction
Conclusions References
Tables Figures
J I
J I
Back Close
Full Screen Esc
Printer-friendly Version
Interactive Discussion
Discussion
Paper
|D
iscussionP
aper|
Discussion
Paper
|D
iscussionP
aper|
Biasminuscorrected minus original MERRA temperature [C]
minus15
minus10
minus5
0
5
10
Biasminuscorrected minus original MERRA temperature [C]
minus15
minus10
minus5
0
5
10
MERRA mean temperature [C] 1979minus2007
minus15
minus10
minus5
0
5
10
15
20
25
30a) MERRA b) APHRODITE ndash MERRA c) CRU ndash MERRA
-10
0
10
20
30degC
minus15
minus10
minus5
0
5
10
15degC
Viste amp SortebergFigure 5
Figure 5 Difference between MERRA temperature and observation-based data (a) Annualmean MERRA temperature (b and c) Annual mean MERRA temperature bias-corrected withobservations APHRODITE and CRU TS
486
TCD9 441ndash493 2015
Snowfall in theHimalayas an
uncertain future froma little-known past
E Viste and A Sorteberg
Title Page
Abstract Introduction
Conclusions References
Tables Figures
J I
J I
Back Close
Full Screen Esc
Printer-friendly Version
Interactive Discussion
Discussion
Paper
|D
iscussionP
aper|
Discussion
Paper
|D
iscussionP
aper|
Jan Apr
Jul Oct
a)
c)
b)
d)
15degC
10
5
0
ndash5
ndash10
ndash15
200 mm16012080400ndash40ndash80ndash120ndash160ndash200
Viste amp SortebergFigure 6
Figure 6 Regions where increasing temperatures are likely to cause a shift from snow to rainData monthly mean MERRA temperature terrain-adjusted to a 4 km GLOBE grid Red temper-ature between minus5 and 0 considered critical Small inset maps monthly MERRA precipitationin the critical zones
487
TCD9 441ndash493 2015
Snowfall in theHimalayas an
uncertain future froma little-known past
E Viste and A Sorteberg
Title Page
Abstract Introduction
Conclusions References
Tables Figures
J I
J I
Back Close
Full Screen Esc
Printer-friendly Version
Interactive Discussion
Discussion
Paper
|D
iscussionP
aper|
Discussion
Paper
|D
iscussionP
aper|
1 2 3 4 5 6 7 8 9 10 11 12Month
∆T [ordm
C]
a) Indus
0
1
2
3
4
5
6
7
8
9
10
b) Ganges∆T
[ordmC
]
1 2 3 4 5 6 7 8 9 10 11 12Month
1
2
3
4
5
6
7
8
0 0
c) Brahmaputra
∆T [ordm
C]
1 2 3 4 5 6 7 8 9 10 11 12Month
1
2
3
4
5
6
7
8
9
10 RCP 85RCP 85 meanRCP 26RCP 26 mean
Viste amp SortebergFigure 7
Figure 7 Projected future temperature change from 1971ndash2000 to 2071ndash2100 in the (a) In-dus (b) Ganges and (c) Brahmaputra Basins Thin lines show the individual CMIP5 modelsstronger lines the multi-model mean
488
TCD9 441ndash493 2015
Snowfall in theHimalayas an
uncertain future froma little-known past
E Viste and A Sorteberg
Title Page
Abstract Introduction
Conclusions References
Tables Figures
J I
J I
Back Close
Full Screen Esc
Printer-friendly Version
Interactive Discussion
Discussion
Paper
|D
iscussionP
aper|
Discussion
Paper
|D
iscussionP
aper|
1 2 3 4 5 6 7 8 9 10 11 12Month
[km
3 ]
a) Indus
0
20
40
60
80
100
120
140
b) Ganges[k
m3 ]
1 2 3 4 5 6 7 8 9 10 11 12Month
0
100
200
300
400
500
600
700
c) Brahmaputra
[km
3 ]
1 2 3 4 5 6 7 8 9 10 11 12Month
0
50
100
150
200
250
MERRA ref
2071ndash2100
1979ndash2008
RCP 85RCP 85 meanRCP 26RCP 26 mean
Viste amp SortebergFigure 8
Figure 8 Projected future precipitation in the (a) Indus (b) Ganges and (c) BrahmaputraBasins Gray bars MERRA 1979ndash2008 Thin lines and horizontal marks on the bars show theindividual CMIP5 models and the multi-model mean for 2071ndash2100
489
TCD9 441ndash493 2015
Snowfall in theHimalayas an
uncertain future froma little-known past
E Viste and A Sorteberg
Title Page
Abstract Introduction
Conclusions References
Tables Figures
J I
J I
Back Close
Full Screen Esc
Printer-friendly Version
Interactive Discussion
Discussion
Paper
|D
iscussionP
aper|
Discussion
Paper
|D
iscussionP
aper|
1 2 3 4 5 6 7 8 9 10 11 120
5
10
15
20
25
30
35
Month
SWE
[km
3 ]
a) Indus
0
1
2
3
4
5
6
7
8
b) Ganges
SWE
[km
3 ]
1 2 3 4 5 6 7 8 9 10 11 12Month
0
2
4
6
8
10
12
14
16
18
20
c) Brahmaputra
SWE
[km
3 ]
1 2 3 4 5 6 7 8 9 10 11 12Month
MERRA ref
2071ndash2100
1979ndash2008
RCP 85RCP 85 meanRCP 26RCP 26 mean
Viste amp SortebergFigure 9
Figure 9 Projected future snowfall in the (a) Indus (b) Ganges and (c) Brahmaputra Basinswith reference to MERRA reference snowfall Gray bars MERRA reference snowfall for 1979ndash2008 Thin lines and horizontal marks on the bars show the individual CMIP5 models andthe multi-model mean for 2071ndash2100 based on changes in temperature and precipitation asdescribed in Sect 23
490
TCD9 441ndash493 2015
Snowfall in theHimalayas an
uncertain future froma little-known past
E Viste and A Sorteberg
Title Page
Abstract Introduction
Conclusions References
Tables Figures
J I
J I
Back Close
Full Screen Esc
Printer-friendly Version
Interactive Discussion
Discussion
Paper
|D
iscussionP
aper|
Discussion
Paper
|D
iscussionP
aper|
Figure 10 Projected future changes in snowfall in sub-basins of the Indus Ganges andBrahmaputra Basins (a) Absolute change [km3] with reference to MERRA reference snow-fall (b) Absolute change [km3] with reference to APHRODITE snowfall (c d) Correspondingrelative changes [] with reference to MERRA and APHRODITE
491
TCD9 441ndash493 2015
Snowfall in theHimalayas an
uncertain future froma little-known past
E Viste and A Sorteberg
Title Page
Abstract Introduction
Conclusions References
Tables Figures
J I
J I
Back Close
Full Screen Esc
Printer-friendly Version
Interactive Discussion
Discussion
Paper
|D
iscussionP
aper|
Discussion
Paper
|D
iscussionP
aper|
J F M A M J J A S O N DMonth
0
5
10
15
20 km3Precip
0
2
4
6
8
10 km3SWE
2000
3000
4000
5000
6000 masl
1845
J F
M
A
M
JJ A
S
O
N
D
RSL
I4A = 146793 km2
1 km 3 = 68 mm
0
05
1
15 SWE rel
8000 m
0
J F M A M J J A S O N DMonth
0
2
4
6
8
10
12 km3 SWE
3000
4000
5000
6000 masl
78
2
14
J FM
A
MJ
J AS
O
ND
RSL
I5
Precip
0
5
10
15
20
25 km3
0
05
1
15 SWE rel
8000 m
0
A = 178669 km2
1 km 3 = 56 mm
CMIP52071ndash2100mean
Today
MERRA APHRODITE
Individual models
CMIP52071ndash2100mean
MERRA APHRODITE
Individual models
CMIP52071ndash2100Precip mean
MERRA APHRODITE
Individual models
SWE todayPrecip today
2000 mTerrain distribution of area between levels
CMIP52071ndash2100
TodayMERRA
APHRODITE
a)
i)
ii)
iii)
iv)
b)
Viste amp SortebergFigure 11
Figure 11 Monthly CMIP5 RCP 85 change in snowfall precipitation and rainsnow line eleva-tion in the upper Indus clusters (a) 4 and (b) 5 from 1971ndash2000 to 2071ndash2100 with referenceto the MERRA reference (red) and APHRODITE (blue) CMIP5 multi-model means are shownas horizontal marks individual models as dots Cluster location and terrain profile are shownabove the graphs (i) Fractional change in snowfall (ii) Future snowfall [km3] (dots) comparedto today (bars) (iii) Future precipitation [km3] (dots) compared to today (bars) Snowfall todayis shown as darker part of bars (iv) Rainsnow line elevation [m asl] Gray background el-evation histogram with the of total ground area lying in the marked 2000 m intervals Barschange from today (bottom) to CMIP5 multi-model mean (top)
492
TCD9 441ndash493 2015
Snowfall in theHimalayas an
uncertain future froma little-known past
E Viste and A Sorteberg
Title Page
Abstract Introduction
Conclusions References
Tables Figures
J I
J I
Back Close
Full Screen Esc
Printer-friendly Version
Interactive Discussion
Discussion
Paper
|D
iscussionP
aper|
Discussion
Paper
|D
iscussionP
aper|
3000
4000
5000
6000 masl
0
2
4
6
8
10 km3
0
10
20
30
40
50
60 km3
0
05
1
15
J F M A M J J A S O N DMonth
J FM
A
M
JJ A
S
O
ND
Precip
SWE
RSL
SWE rel
53
B3
8000 m
0
A = 139611 km2
1 km 3 = 72 mm
4500
5000
5500
6000
6500 masl
0
1
2
3
4 km3
0
10
20
30
40
50 km3
0
05
1
15 SWE rel
SWE
RSL
Precip
95
J F M A M J J A S O N DMonth
J FM
A
M
JJ A
S
ON
D
B4
8000 m
0
A = 159165 km2
1 km 3 = 63 mm
CMIP52071ndash2100mean
Today
MERRA APHRODITE
Individual models
CMIP52071ndash2100mean
MERRA APHRODITE
Individual models
CMIP52071ndash2100Precip mean
MERRA APHRODITE
Individual models
SWE todayPrecip today
2000 mTerrain distribution of area between levels
CMIP52071ndash2100
TodayMERRA
APHRODITE
a)
i)
ii)
iii)
iv)
b)
Viste amp SortebergFigure 12
Figure 12 Monthly CMIP5 RCP 85 change in snowfall precipitation and rainsnow line ele-vation in the upper Brahmaputra clusters (a) 4 and (b) 3 See Fig 11 for a description of thecontent
493
- Introduction
-
- Observed trends in snowfall temperature and precipitation
- Future projections of snowfall temperature and precipitation
- Aims and scope
-
- Data and methods
-
- Reference present-day snowfall
- Bias-corrected present-day snowfall
- Projected snowfall
- The rain-snow line
-
- Present-day snowfall
-
- Seasonal cycles of precipitation and snowfall
- Comparison of snowfall estimates
-
- Projected future snowfall
-
- Basin-scale projections
- Regional projections
-
- Upper Indus western part
- Upper Indus eastern part
- Upper Brahmaputra western part
- Upper Brahmaputra eastern part
-
- Potential effects of reduced snowfall on water availability
-
- Concluding summary
-

TCD9 441ndash493 2015
Snowfall in theHimalayas an
uncertain future froma little-known past
E Viste and A Sorteberg
Title Page
Abstract Introduction
Conclusions References
Tables Figures
J I
J I
Back Close
Full Screen Esc
Printer-friendly Version
Interactive Discussion
Discussion
Paper
|D
iscussionP
aper|
Discussion
Paper
|D
iscussionP
aper|
Abstract
Snow and ice provide large amounts of meltwater to the Indus Ganges and Brahma-putra rivers This study combines present-day observations and reanalysis data withclimate model projections to estimate the amount of snow falling over the basins todayand in the last decades of the 21st century Estimates of present-day snowfall based on5
a combination of temperature and precipitation from reanalysis data and observationsvary by factors of 2ndash4 The spread is large not just between the reanalysis and the ob-servations but also between the different observational data sets With the strongestanthropogenic forcing scenario (RCP 85) the climate models project reductions inannual snowfall by 30ndash50 in the Indus Basin 50ndash60 in the Ganges Basin and10
50ndash70 in the Brahmaputra Basin by 2071ndash2100 The reduction is due to increasingtemperatures as the mean of the models show constant or increasing precipitationthroughout the year in most of the region With the strongest anthropogenic forcingscenario the mean elevation where rain changes to snow ndash the rainsnow line ndash creepsupward by 400ndash900 m in most of the region by 700ndash900 m The largest relative change15
in snowfall is seen in the upper westernmost sub-basins of the Brahmaputra With thestrongest forcing scenario most of this region will have temperatures above freezingespecially in the summer The projected reduction in annual snowfall is 65ndash75 Inthe upper Indus the effect of a warmer climate on snowfall is less extreme as mostof the terrain is high enough to have temperatures sufficiently far below freezing today20
A 20ndash40 reduction in annual snowfall is projected
1 Introduction
In the dry spring months preceding the Indian summer monsoon much of the waterin the Himalayan rivers comes from melting snow and ice (Bookhagen and Burbank2010 Siderius et al 2013 Schaner et al 2012) Concern has been raised that global25
warming may reduce the glaciers and their capacity to store water as well as the
442
TCD9 441ndash493 2015
Snowfall in theHimalayas an
uncertain future froma little-known past
E Viste and A Sorteberg
Title Page
Abstract Introduction
Conclusions References
Tables Figures
J I
J I
Back Close
Full Screen Esc
Printer-friendly Version
Interactive Discussion
Discussion
Paper
|D
iscussionP
aper|
Discussion
Paper
|D
iscussionP
aper|
amount of seasonal snow available for melting Whether the meltwater comes fromsnow or glacier ice stable snowfall is required to maintain the flow in the long runObservations of present-day snowfall in the region are limited meaning that there isalso limited knowledge of the normal state and of historical trends In this study we usetemperature and precipitation data from a reanalysis and from observations to estimate5
snowfall in the Indus Ganges and Brahmaputra Basins today We then incorporatefuture changes in temperature and precipitation from a suite of climate models andfollow the same procedure to estimate snowfall in 2071ndash2100
The catchments of the Indus Ganges and Brahmaputra rivers as referred to in thisarticle are shown in Fig 1 The rivers run from the Hindu Kush - Karakoram - Himalaya10
(HKH) mountain range through the lowlands of Pakistan India and Bangladesh Bothrainwater and meltwater from snow and ice contribute to all three rivers with the highestmeltwater fraction in the Indus and the lowest in the Ganges (Immerzeel et al 2010Bookhagen and Burbank 2010 Singh et al 1997) Even in the Ganges meltwater isimportant in the otherwise dry spring (Siderius et al 2013)15
The Indian summer monsoon creates markedly different seasonal cycles in easternand western parts of the HKH both in precipitation and in the accumulation of snowand ice In the monsoon-dominated central Himalayas and on the Tibetan Plateaumore than 80 of the annual precipitation falls during summer Precipitation maximain the western regions occur in connection with westerly disturbances in winter In the20
Hindu Kush and Karakoram as well as in the easternmost Himalaya summer precipi-tation amounts to less than 50 of the annual precipitation (Bookhagen and Burbank2010) The seasonal cycle of snowfall varies accordingly In the western HKH snow ac-cumulates during winter while the summer is the main melting season Further eastthe summer is the main season not just for ablation but also for accumulation (Rees25
and Collins 2006)Precipitation also varies greatly between inner and outer parts of the Himalayas
(Singh et al 1997 Bookhagen and Burbank 2006 Winiger et al 2005) According toBookhagen and Burbank (2010) the eastndashwest gradient and the effect of the summer
443
TCD9 441ndash493 2015
Snowfall in theHimalayas an
uncertain future froma little-known past
E Viste and A Sorteberg
Title Page
Abstract Introduction
Conclusions References
Tables Figures
J I
J I
Back Close
Full Screen Esc
Printer-friendly Version
Interactive Discussion
Discussion
Paper
|D
iscussionP
aper|
Discussion
Paper
|D
iscussionP
aper|
monsoon is most pronounced in the lowlands below 500 masl while the differenceis less at higher elevations
11 Observed trends in snowfall temperature and precipitation
Using satellite data Rikiishi and Nakasato (2006) found that the mean annual snowcover area in Himalaya and on the Tibetan Plateau had been reduced by sim 1 yrminus1
5
during 1966ndash2001 Few studies include snowfall data from stations on the groundespecially for periods long enough to detect trends Studies of temperature and precip-itation provide some information though the picture is far from complete Temperatureshave increased in most of the region whereas precipitation studies show varying re-sults depending on the location and time period Whereas higher temperatures act10
to reduce the snow fraction increased precipitation may have compensated in someregions
Positive temperature trends have been observed throughout the HKH (Immerzeel2008 Immerzeel et al 2009 Xu et al 2008b Bhutiyani et al 2007 2010 Shresthaet al 1999 Shekhar et al 2010 Fowler and Archer 2006) The only exception to the15
regional warming is the Karakoram range where both maximum and minimum tem-peratures have decreased since the mid-1980s (Shekhar et al 2010) Both in Nepal(Shrestha et al 1999) and the Upper Indus (Immerzeel et al 2009) temperatureshave increased more at higher elevations than in the lower terrain implying that regionswith snow may have been more strongly affected than indicated by regional means20
Increasing temperatures (Xu et al 2008b) have most likely been the driver behindreductions in the snow cover on the Tibetan Plateau During 1966ndash2001 the length ofthe snow season was reduced by 23 days (Rikiishi and Nakasato 2006) The annualprecipitation on most of the Tibetan Plateau increased over the same period (Xu et al2008a b You et al 2008) only in the western part was there a decrease (Xu et al25
2008b)Few studies include data from the high-elevation parts of the Brahmaputra and
Ganges Basins Immerzeel (2008) found no clear precipitation trends for Brahmapu-444
TCD9 441ndash493 2015
Snowfall in theHimalayas an
uncertain future froma little-known past
E Viste and A Sorteberg
Title Page
Abstract Introduction
Conclusions References
Tables Figures
J I
J I
Back Close
Full Screen Esc
Printer-friendly Version
Interactive Discussion
Discussion
Paper
|D
iscussionP
aper|
Discussion
Paper
|D
iscussionP
aper|
tra as a whole for 1901ndash2002 For the same period Guhathakurta and Rajeevan (2008)found no significant precipitation trends relevant to snowfall in eastern parts of Indiaand neither did Shrestha et al (2000) for stations in Nepal in the shorter period 1959ndash1994
More studies of snow and ice have been performed for the Indus Basin than for the5
Ganges and Brahmaputra possibly because meltwater constitutes a larger fraction ofthe run-off in this basin (Bookhagen and Burbank 2010 Immerzeel et al 2010) Alsoas large parts of the Indus get little rain in late spring and summer the link betweenmelting snow and river discharge is perhaps more intuitive than in the regions furthereast where the top of the meltwater season coincides with the Indian summer mon-10
soon rain (Rees and Collins 2006) No consistent precipitation trends have been foundfor the mountain regions of the Indus Basin as a whole and epochs of more and lessprecipitation have alternated (Sontakke et al 2008 Bhutiyani et al 2010)
Some of the recent interest may also have been sparked by Karakoram glaciergrowth After decades of recession Karakoram glaciers were seen to expand in the15
late 1990s (Scherler et al 2011 Gardelle et al 2012 Hewitt 2005) An observedcombination of increased winter precipitation and decreased summer temperatureshave been suggested to be the cause (Archer and Fowler 2004 Fowler and Archer2006) and reduced summer discharge in rivers coming from the Karakoram is in accor-dance with the observed glacier growth (Fowler and Archer 2006 Sharif et al 2013)20
In contrast Hartmann and Andresky (2013) found only insignificant negative trends inKarakoram precipitation during 1986ndash2010 and Cook et al (2013) reported increaseddischarge in the Upper Indus after 1998 As pointed out by Hewitt (2005) and sup-ported by Kaumlaumlb et al (2012) the glacier growth applies only to higher elevations in thecentral Karakoram while glaciers in other parts and at intermediate elevations have25
continued to decline Increased transport of moisture to higher altitudes may be part ofthe explanation (Hewitt 2005)
Comparing the Karakoram with three other mountain ranges in the western Hi-malayas during 1984ndash2008 Shekhar et al (2010) found that snowfall had been re-
445
TCD9 441ndash493 2015
Snowfall in theHimalayas an
uncertain future froma little-known past
E Viste and A Sorteberg
Title Page
Abstract Introduction
Conclusions References
Tables Figures
J I
J I
Back Close
Full Screen Esc
Printer-friendly Version
Interactive Discussion
Discussion
Paper
|D
iscussionP
aper|
Discussion
Paper
|D
iscussionP
aper|
duced in all the ranges though less in the innermost Karakoram than in the outerranges As opposed to temperature increases in the other ranges the Karakoramrange experienced decreasing temperatures The reduction in snowfall on the outsideof the outermost range Pir Panjal during the last decades was supported by Bhutiyaniet al (2010) who found that the duration of the snowfall season had been reduced by5
about 5ndash6 days per decadeDocumented trends in other parts of the Indus basin vary and alternating epochs
indicate that the choice of time period may influence the results In Jammu and Kash-mir and Himachal Pradesh Bhutiyani et al (2010) found a significant decreasing trendin summer precipitation during the 20th century There was no trend in winter precip-10
itation at the three stations used but epochs of dry and wet winters had alternatedand winter precipitation was above average in 1991ndash2006 Previously a long-term in-crease in summer and annual precipitation in Jammu and Kashmir was documentedby Guhathakurta and Rajeevan (2008) and in Himachal Pradesh by Singh et al (2008)Sontakke et al (2008) on the other hand found no trends in this part of India since the15
19th century but noted a dry epoch since 1968 It should be pointed out that their dataset contained stations in the outer ranges only and not in eg the Karakoram
Further west in the Upper Indus Basin at stations mainly in Pakistan (Archer andFowler 2004) observed no trends in precipitation over the 20th century but a signifi-cant increase in winter summer and annual precipitation at several stations starting in20
1961 The increase was accompanied by increasing winter temperatures but decreas-ing summer temperatures (Fowler and Archer 2006) Hartmann and Andresky (2013)found significant positive trends in precipitation in the Hindu Kush and the Sulaimanmountains for 1986ndash2010
Satellite-based studies of trends in the present century (2000ndash20082001ndash2007)25
have documented a decrease in winter snow cover area in the Upper Indus (Immerzeelet al 2009) but an increase in the Indus water volume stored in snow and ice (Im-merzeel et al 2010)
446
TCD9 441ndash493 2015
Snowfall in theHimalayas an
uncertain future froma little-known past
E Viste and A Sorteberg
Title Page
Abstract Introduction
Conclusions References
Tables Figures
J I
J I
Back Close
Full Screen Esc
Printer-friendly Version
Interactive Discussion
Discussion
Paper
|D
iscussionP
aper|
Discussion
Paper
|D
iscussionP
aper|
12 Future projections of snowfall temperature and precipitation
In the last decades of the 21th century the temperature over India is projected to be onaverage 20ndash48 C higher than today depending on the anthropogenic forcing scenario(Chaturvedi et al 2012) In the Himalayas a temperature increase of more than 7 C isseen with the strongest forcing the Representative Concentration Pathway (RCP) 855
(Chaturvedi et al 2012 Collins et al 2013) Independently of precipitation changeshigher temperatures will decrease the fraction of precipitation falling as snow Whethersnowfall will increase or decrease thus depends on whether precipitation will increaseenough to compensate for the reduced snow fraction
Climate models from CMIP5 the most recent Coupled Model Inter-comparison10
Project (Taylor et al 2011) project a general increase in precipitation over India grow-ing with anthropogenic forcing and with time both annually (Chaturvedi et al 2012)and during the summer monsoon (Menon et al 2013) An increase was also seenin data from the previous model comparison project CMIP3 (Turner and Annamalai2012) Menon et al (2013) found that changes in the low-level winds suggest a north-15
ward shift in the monsoon by the end of the 21st century for the strongest forcingscenario although the total zonal strength of the monsoon remained fairly constant
It should be emphasized that there is a large inter-model spread in precipitation pro-jections and the IPCC AR5 concludes that there is medium confidence in the increasein summer monsoon precipitation over South Asia (Christensen et al 2013) But al-20
though precipitation projections are less reliable than temperature projections agree-ment between models increases with time and anthropogenic forcing (Chaturvedi et al2012) Also the CMIP5 multi-model mean has been considered to represent the mon-soon and the actual climate in India better than any individual model (Chaturvedi et al2012 Sperber et al 2013)25
The IPCC AR5 has high confidence that the snow cover area in the Northern Hemi-sphere will be substantially reduced with anthropogenic forcing as in the strongestscenarios (Collins et al 2013) For the range of RCPs 26ndash85 CMIP5 models sim-
447
TCD9 441ndash493 2015
Snowfall in theHimalayas an
uncertain future froma little-known past
E Viste and A Sorteberg
Title Page
Abstract Introduction
Conclusions References
Tables Figures
J I
J I
Back Close
Full Screen Esc
Printer-friendly Version
Interactive Discussion
Discussion
Paper
|D
iscussionP
aper|
Discussion
Paper
|D
iscussionP
aper|
ulate 7ndash25 reductions in the spring snow cover extent by 2080ndash2100 For snowfalland snow water equivalents (SWE) the projections show more variation While warm-ing decreases the amount of snow both through melting and through decreasing thesnow fraction more precipitation may increase snowfall in some of the coldest regions(Raumlisaumlnen 2008 Brutel-Vuilmet et al 2013) Though shown to apply mainly to the5
northern parts of Eurasia and North America there is a possibility that some of thehigher-lying terrain in the HKH may be similarly affected
13 Aims and scope
For the HKH uncertainty in projections of future precipitation and snowfall comes ontop of uncertainty in present time conditions Observations are limited especially in re-10
mote high-elevation regions (Anders et al 2006 Immerzeel 2008 Tahir et al 2011bWiniger et al 2005) Insufficient knowledge of the amount of snow falling over the re-gion today makes the contribution to both seasonal snowmelt and storage in glacierscorrespondingly uncertain
Recognizing this uncertainty this study provides an ensemble of monthly mean15
snowfall estimates for all sub-basins of the Indus Ganges and Brahmaputra todayand for 2071ndash2100 For the present time estimates we have combined MERRA re-analysis data (Rienecker et al 2011) with observationally based data sets of precip-itation and temperature CRU TS (Harris et al 2014) TRMM (Huffman et al 2007)and APHRODITE (Yatagai et al 2012 Yasutomi et al 2011) Whereas Meacuteneacutegoz20
et al (2013) and Wiltshire (2014) analyzed Himalayan snowfall by downscaling reanal-ysis data with regional climate models we have applied a simple terrain adjustment ofthe reanalysis temperature field
The ensemble of present-day estimates is presented in Sect 3 Future snowfall wasthen calculated based on the present-day snowfall and projected changes in temper-25
ature and precipitation in 14 and 15 CMIP5 models for the RCPs 26 and 85 re-spectively These results are presented in Sect 4 The data and methods for both thepresent time and the future case are described in Sect 2
448
TCD9 441ndash493 2015
Snowfall in theHimalayas an
uncertain future froma little-known past
E Viste and A Sorteberg
Title Page
Abstract Introduction
Conclusions References
Tables Figures
J I
J I
Back Close
Full Screen Esc
Printer-friendly Version
Interactive Discussion
Discussion
Paper
|D
iscussionP
aper|
Discussion
Paper
|D
iscussionP
aper|
Three main features may be involved in precipitation changes in the HKH changesin the summer monsoon changes in western disturbances during winter and the gen-eral changes that occur in the thermodynamic properties of the air as the temperatureincreases and the air contains more water vapor We have not considered the role ofthe different factors only looked at how changes in temperature and precipitation af-5
fect snowfall Unless otherwise specified any reference to snow refers to precipitationfalling as snow not to the snow cover on the ground
2 Data and methods
In addition to the original MERRA reanalysis snowfall we estimated snowfall usingdifferent combinations of temperature and precipitation data An overview of the com-10
binations is shown in Table 1 and the data sets used presented in Tables 2 and 3Present-day snowfall estimates were based on
1 MERRA 2 m temperature adjusted to a higher-resolution elevation grid andMERRA precipitation (Sect 21) This was used as a basis for the other estimatesand is referred to as MERRA reference snowfall The adjusted temperature is15
referred to as terrain-adjusted
2 MERRA 2 m temperature and precipitation
3 The MERRA data in (1) bias-corrected with observation-based data for tempera-ture and precipitation (Sect 22)
Estimates for the last decades of the 21th century were based on20
4 The MERRA data in (1) plus the changes in temperature and precipitation ina group of CMIP5 models over the coming century (Sect 23)
5 Bias-corrections with one of the data sets in (3) ndash APHRODITE ndash plus the meanchanges in temperature and precipitation in the CMIP5 models used in (4) Thiswas done to account for the spread in the present-day estimates25
449
TCD9 441ndash493 2015
Snowfall in theHimalayas an
uncertain future froma little-known past
E Viste and A Sorteberg
Title Page
Abstract Introduction
Conclusions References
Tables Figures
J I
J I
Back Close
Full Screen Esc
Printer-friendly Version
Interactive Discussion
Discussion
Paper
|D
iscussionP
aper|
Discussion
Paper
|D
iscussionP
aper|
With the exception of original MERRA snowfall data all snowfall estimates werebased on the relationship between temperature and snowfall derived by Dai (2008)Based on observations the conditional snow frequency over land was formulated as
F (Ts) = a[
tanh(b(Ts minusc)
)minusd]
(1)
where Ts is the surface air temperature [C] and a = minus482292b = 07205c = 116625
and d = 10223 This may be interpreted as the probability or fraction of precipitationfalling as snow at a given temperature We calculated hourly snowfall as the productof F and the amount of precipitation Cut-offs for no rain and no snow were set at minus10and 10 C respectively as this was the range of the data used by Dai (2008)
All snowfall estimates were made for the sub-basins defined in the HydroSHEDS10
data set (Lehner et al 2008) The results were then aggregated for the Indus Gangesand Brahmaputra Basins
Within each major basin we also grouped the sub-basins into regions with simi-lar characteristics of snow and precipitation This was done with k-means clustering(MacQueen 1967) using the square Euclidean distance as the distance measure15
The seasonal cycles of precipitation snow and snow fraction were first clustered sep-arately with the MERRA reference data and data bias-corrected with CRU TS data asinput We then adjusted the clusters manually prioritizing similarity of the relative sea-sonal cycles of snow and snow fraction and checking that both data sets gave similarresults Five groups were defined for the Indus and four for each of the other basins20
This included a no-snow group in each basin
21 Reference present-day snowfall
The horizontal resolution of the MERRA reanalysis data in the Himalayas is about55 km latitude and 70 km longitude To account for smaller-scale temperature variationsin the rugged terrain we used the vertical temperature gradient in MERRA to adjust25
the ground temperature to the GLOBE topography (Hastings and Dunbar 1998) The450
TCD9 441ndash493 2015
Snowfall in theHimalayas an
uncertain future froma little-known past
E Viste and A Sorteberg
Title Page
Abstract Introduction
Conclusions References
Tables Figures
J I
J I
Back Close
Full Screen Esc
Printer-friendly Version
Interactive Discussion
Discussion
Paper
|D
iscussionP
aper|
Discussion
Paper
|D
iscussionP
aper|
elevation-adjusted ground temperature was calculated as
Tadj = T0 minusT2 minus T1
z2 minus z1(zmerra 0 minus zglobe) (2)
where T0 is the MERRA 2 m temperature T1 is the temperature at the lowest pressurelevel above the ground T2 the temperature at the next level and z2 and z1 the height ofthese levels zmerra0 and zglobe is the elevation of the MERRA and GLOBE topography5
respectively To reduce calculation time compared to using the original 1 km GLOBEresolution both MERRA and GLOBE data were interpolated to a 4 km grid Snowfallwas calculated for each grid-point and then aggregated for each sub-basin for eachmonth
Snowfall based on elevation-adjusted MERRA temperature and MERRA precipita-10
tion is used as a reference throughout this article This is because the elevation-adjusted temperature and the 4 km grid was used as the starting-point in all subse-quent calculations It does not mean that we consider this snowfall to be closer to thetruth than any of the other estimates
22 Bias-corrected present-day snowfall15
A second group of present-day snowfall estimates was made from MERRA precipi-tation and elevation-adjusted temperature bias-corrected with observationally baseddata sets APHRODITE daily temperature and precipitation for 1979ndash2007 CRU TSmonthly temperature and precipitation for 1979ndash2011 and TRMM 3B42 3 hourly pre-cipitation for 1998ndash2012 Bias-corrections were performed on daily or monthly scales20
depending on the input data and the result distributed over the hourly time-steps ofthe MERRA temperature and precipitation As a result the diurnal cycle in MERRA ismaintained in all estimates Snowfall was then calculated following the same procedureas for the MERRA reference snowfall (Sect 21) When referring to APHRODITE snowor CRU snow anywhere in this article this is the snowfall calculated using MERRA25
precipitation and temperature both bias-corrected with these data sets451
TCD9 441ndash493 2015
Snowfall in theHimalayas an
uncertain future froma little-known past
E Viste and A Sorteberg
Title Page
Abstract Introduction
Conclusions References
Tables Figures
J I
J I
Back Close
Full Screen Esc
Printer-friendly Version
Interactive Discussion
Discussion
Paper
|D
iscussionP
aper|
Discussion
Paper
|D
iscussionP
aper|
Temperature data are generally assumed to be normally distributed and as de-scribed in Teutschbein and Seibert (2012) and references therein the data can bebias-corrected through a Gaussian distribution mapping We thus bias-corrected theelevation-adjusted MERRA temperature with the observationally based APHRODITEV1204 daily temperature by mapping the distribution of the MERRA data to the Gaus-5
sian distribution of the observationsAs the CRU TS 320 includes monthly mean daily minimum and maximum temper-
atures the method described by (Wang and Zeng 2013) was used Bias-correcteddaily maximum temperatures were defined as
Td max = Tmerra d max minus(Tmerra mn max minus Tcru mn max
) (3)10
d denotes daily and mn monthly Daily minimum temperatures were then corrected byadjusting the diurnal range
Td min = Td max minus∆Tmerra d middot∆Tcru mn
∆Tmerra mn (4)
where ∆T represents the diurnal and monthly temperature rangeThe distribution mapping procedure described by Ines and Hansen (2006) was used15
to bias-correct MERRA precipitation with APHRODITE V1101R2 daily precipitation anddaily accumulated TRMM 3B42 3 hourly precipitation This is a two-step procedureinvolving frequency and intensity adjustments We defined precipitation days as dayswith at least 01 mm in the observations The frequency was first adjusted by settingthe number of precipitation days in MERRA equal to that of the observations This was20
done by removing the lowest daily values The intensity was then adjusted by fitting theremaining days to the gamma distribution of the observations
Bias-corrections with CRU TS 320 monthly precipitation were done with a simplecorrection factor to adjust the monthly MERRA total to that of CRU (eg Ines andHansen 2006)25
452
TCD9 441ndash493 2015
Snowfall in theHimalayas an
uncertain future froma little-known past
E Viste and A Sorteberg
Title Page
Abstract Introduction
Conclusions References
Tables Figures
J I
J I
Back Close
Full Screen Esc
Printer-friendly Version
Interactive Discussion
Discussion
Paper
|D
iscussionP
aper|
Discussion
Paper
|D
iscussionP
aper|
23 Projected snowfall
The MERRA reanalysis was also the basis for estimates of future snowfall Thechanges in temperature and precipitation from 1971ndash2000 to 2071ndash2100 were addedto the reanalysis data and snowfall calculated following the same procedure as for thepresent time Climate change input came from models that were part of the Coupled5
Model Inter-comparison Project 5 (CMIP5 Taylor et al 2011) for the RepresentativeConcentration Pathways (RCP) 26 and 85 (Moss et al 2010 van Vuuren et al 2011)The models used are listed in Table 3
Due to the different spatial resolution of the models changes were defined asmonthly mean changes on the sub-basin level For temperature the absolute change10
was used and for precipitation the fractional change Future projected snowfall wascalculated with reference to elevation-adjusted MERRA snowfall for each model Dueto large deviations in estimates of present-day snowfall (Sect 3) we also calculatedsnowfall for the CMIP5 multi-model mean changes with reference to the lowest presenttime estimate APHRODITE snowfall15
24 The rain-snow line
Not all temperature changes affect snowfall We defined the rain-snow line as the el-evation where the temperature suggests a shift from rain to snow Technically thisis a conditional rain-snow line as no precipitation was required For every hour allgrid cells that had a snow fractionprobability between 025 and 075 corresponding20
to a temperature between 09 and 13 C were identified The monthly rain-snow linewas then set as the mean elevation of these grid cells and time steps For present-dayconditions this was done for elevation-adjusted MERRA temperature and temperaturebias-corrected with APHRODITE Projected temperature changes in the CMIP5 RCP85 were then added to these temperatures and the procedure repeated25
453
TCD9 441ndash493 2015
Snowfall in theHimalayas an
uncertain future froma little-known past
E Viste and A Sorteberg
Title Page
Abstract Introduction
Conclusions References
Tables Figures
J I
J I
Back Close
Full Screen Esc
Printer-friendly Version
Interactive Discussion
Discussion
Paper
|D
iscussionP
aper|
Discussion
Paper
|D
iscussionP
aper|
3 Present-day snowfall
31 Seasonal cycles of precipitation and snowfall
Figure 2 gives an overview of the seasonal cycle of rain and snow in different parts ofthe HKH based on MERRA precipitation and MERRA reference snowfall (Sect 21)The upper Indus basin gets more snow than rain in other sub-basins of the Indus5
Ganges and Brahmaputra rainfall dominates This difference is caused by different pre-cipitation cycles Whereas the summer monsoon dominates in the Central Himalayaswinter depressions bring most of the precipitation in the upper Indus ndash at a time whenlow temperatures mean that precipitation falls as snow in larger areas than it wouldin summer Although snow fractions are lower in the upper Brahmaputra monsoon10
precipitation produces a substantial amount of summer snow at high elevationsIn the northwesternmost cluster in the Indus I4 March is the wettest month and also
the month with the highest total amount of snowfall Precipitation has a second peakduring July and August but the temperature is then too high to allow much snowfallFurther east in cluster I5 more terrain at higher elevations cause higher snow fractions15
during summer but winter and spring is still the dominant snow season The summerpeak in precipitation in this cluster is caused by the two eastern sub-basins There islittle summer precipitation in the west
In Brahmaputrarsquos cluster B4 and Gangesrsquo G4 maximum snowfall occurs during thesummer monsoon Higher temperatures during summer means that the snow fraction20
is lower than in winter but as there is much more summer precipitation the amount ofsnow is also higher Rare occurrences of precipitation during the cold winter togetherwith the combination of snowfall and snowmelt during summer makes the seasonalcycle of snow depth in the Central Himalayas unpronounced (Meacuteneacutegoz et al 2013)In the upper-level basins in Brahmaputrarsquos B3 the summer is also the main precipi-25
tation season but the peak is less sharp than further west As a result snowfall is ata maximum in MarchndashApril
454
TCD9 441ndash493 2015
Snowfall in theHimalayas an
uncertain future froma little-known past
E Viste and A Sorteberg
Title Page
Abstract Introduction
Conclusions References
Tables Figures
J I
J I
Back Close
Full Screen Esc
Printer-friendly Version
Interactive Discussion
Discussion
Paper
|D
iscussionP
aper|
Discussion
Paper
|D
iscussionP
aper|
32 Comparison of snowfall estimates
The MERRA reference snowfall described in Sect 31 differs greatly from snowfallbased on bias-corrected temperature and precipitation Large differences betweentemperature and data sets for the HKH cause corresponding deviations in snowfall ndashnot only between MERRA-based estimates and bias-corrected data but between esti-5
mates based on bias-corrections with different data sets This can be seen from Table 4which displays annual snowfall estimates for combinations of the bias-corrections de-scribed in Sect 22 aggregated to the major basins Data for the individual sub-basinsare included as Supplement
With the exception of snowfall based on MERRA precipitation and MERRA temper-10
ature bias-corrected with CRU TS in the Ganges basin all estimates based on bias-corrected data are lower than the MERRA reference snowfall The lowest estimates arethose based on bias-corrections with APHRODITE precipitation and temperature Thiscombination produced only 33 of the reference snowfall in the Indus Basin 22 inthe Ganges Basins and 17 in the Brahmaputra Basin While the difference is large in15
all sub-basins that have snow today it is especially large in the upper parts of the Indusand Brahmaputra Basins (Fig 3) In comparison bias-corrections with CRU TS tem-perature and precipitation produce 54 of the reference snowfall in the Indus 75 inthe Ganges and 42 in the Brahmaputra ndash factors of 2ndash4 compared to APHRODITEIt should be noted that as the time periods covered by the data sets are not equal20
the results are not strictly comparable but tests using different MERRA periods (notshown) indicate that there would be no major difference in the monthly means
The large difference between MERRA reference snowfall and snowfall based onbias-corrected data results from differences in both temperature and precipitation butdifferences in the precipitation pattern have the greatest effect Estimates where only25
the precipitation has been bias-corrected are lower than those where only the tempera-ture has been bias-corrected (Table 4) This is not solely an effect of more precipitationin MERRA than in the observation-based data although MERRA is wetter than all the
455
TCD9 441ndash493 2015
Snowfall in theHimalayas an
uncertain future froma little-known past
E Viste and A Sorteberg
Title Page
Abstract Introduction
Conclusions References
Tables Figures
J I
J I
Back Close
Full Screen Esc
Printer-friendly Version
Interactive Discussion
Discussion
Paper
|D
iscussionP
aper|
Discussion
Paper
|D
iscussionP
aper|
data sets in the Indus and for APHRODITE also in the Ganges and the Brahmapu-tra An inland and upward shift in the MERRA precipitation adds to the differencesAs shown in Fig 4 all the observation-based precipitation data sets are wetter thanMERRA in most of the lowlands and in the foothills of the HKH but drier in the higher-elevation regions further inland In MERRA the precipitation belt is shifted higher up5
in the Himalayas where temperatures are lower and more of the precipitation falls assnow
In addition HKH temperatures are lower in MERRA than in APHRODITE and inthe upper Indus also than in CRU TS (Fig 5) The lower temperatures in MERRAcause higher snow fractions further increasing the difference between the MERRA ref-10
erence snowfall and APHRODITE snowfall Oppositely CRU TS is colder than MERRAthroughout the Ganges leading to higher snowfall estimates when bias-correctingMERRA temperatures with CRU TS (Table 4)
We do not see any reason to consider any of the observation-based data sets northe reanalysis the ground truth The reanalysis has the benefit of being physically15
consistent though precipitation is a pure model product In the other data sets thenumber of observations vary greatly within the region
The lack of observations in the HKH has been pointed out in many studies Mostmeteorological stations are located in the valleys and do not necessarily representweather conditions in higher terrain As demonstrated by Palazzi et al (2013) station-20
based data sets like APHRODITE and CRU TS are merely mathematical interpolationsin major parts of the HKH and on the Tibetan Plateau Immerzeel (2008) showed thatthe number of observations going into version 21 of the CRU data set in the Himalayanregion varies greatly A drop in the mid-1990s suggests that caution should be takenwhen interpreting data at later times Maps (not shown) of station coverage in version25
320 used in this study show that this problem persistsThe fact that more of the precipitation falls as snow at higher elevations may in it-
self lead to an under-estimation of precipitation in the mountains In addition to thelack of observations in high terrain gauges tend to capture snow less easily than rain
456
TCD9 441ndash493 2015
Snowfall in theHimalayas an
uncertain future froma little-known past
E Viste and A Sorteberg
Title Page
Abstract Introduction
Conclusions References
Tables Figures
J I
J I
Back Close
Full Screen Esc
Printer-friendly Version
Interactive Discussion
Discussion
Paper
|D
iscussionP
aper|
Discussion
Paper
|D
iscussionP
aper|
leading to a possible under-registration of precipitation at the few high-elevation sta-tions that exist Comparing stations along a vertical profile in the Karakoram Winigeret al (2005) found that precipitation multiplied by a factor of 5ndash10 from 2500 masl to5000ndash6000 masl This maximum is much higher than reported in most other studiesand they attributed this to the valley-dominance of stations normally used5
Indications of too little precipitation at higher elevations were also given by Tahiret al (2011b) as APHRODITE precipitation was too low to account for the observeddischarge in the Hunza river in the Karakoram Anders et al (2006) reported thatTRMM radar data underestimated precipitation at higher elevations in the Himalayasdue to the low ability of the radar to detect very low precipitation and lowndashmoderated10
snowfall rates On the other hand Krakauer et al (2013) found that both TRMM andAPHRODITE had too much precipitation compared to observations from the few exist-ing stations at elevations above 3000 masl in Nepal
Satellite data are a promising future alternative for measuring snowfall but presentlyof limited use MODIS and LANDSAT satellite data have been used in several studies15
of snow and ice in the Himalayas (Tahir et al 2011a b Bookhagen and Burbank2010 Hewitt 2005 Krishna 2005 Negi et al 2009 Jain et al 2009 Butt 2012 Gaoet al 2012 Kulkarni et al 2010 Immerzeel et al 2009) but these data contain onlysnow cover area with no measure of the snow thickness or snow water equivalentsThe NASA AMSR-E SWE data set distributed by the National Snow and Ice Data20
Center could have been used but correlations between AMSR-E SWE and groundobservations have been shown to be poor (Tedesco and Narvekar 2010 Byun andChoi 2014 Kumar et al 2006) As AMSR-E SWE has been found underestimatesnow depth we concluded that incorporating these data into our ensemble would notlikely constrain the results nor add new information25
Defining snowfall based on MERRA precipitation and elevation-adjusted tempera-ture as a reference was done mainly to have a single reference when comparing thedata sets against each other Also we believe the elevation-adjustment of temperaturerepresents an enhancement compared to the original MERRA reanalysis MERRA was
457
TCD9 441ndash493 2015
Snowfall in theHimalayas an
uncertain future froma little-known past
E Viste and A Sorteberg
Title Page
Abstract Introduction
Conclusions References
Tables Figures
J I
J I
Back Close
Full Screen Esc
Printer-friendly Version
Interactive Discussion
Discussion
Paper
|D
iscussionP
aper|
Discussion
Paper
|D
iscussionP
aper|
chosen mainly because it has an hourly resolution allowing diurnal temperature vari-ations to affect snowfall But even though this estimate is much higher than all thebias-corrected estimates it cannot be discarded It has been argued that reanalysisdata and regional climate models may in some cases be as good as or better thanobservations in the HKH (Wiltshire 2014 Meacuteneacutegoz et al 2013 Akhtar et al 2008)5
Akhtar et al (2008) got better results when modeling river discharge in three upperIndus catchments with an RCM-based hydrological model than with one based on thefew observations available within the region They concluded that it was preferable touse RCM data directly as input to hydrological models in this region
As shown in the small inset maps in Fig 4 MERRA precipitation is higher than ob-10
served precipitation throughout the HKH and the same has previously been shownfor ERA-Interim reanalysis precipitation (Palazzi et al 2013) In MERRA the precipi-tation belt is shifted upward in the terrain compared to in the observation-based datasets Whether this shift is realistic cannot be determined as long as observations fromupper-level terrain are either missing or likely too low15
4 Projected future snowfall
Whether higher temperatures lead to less snowfall depends on whether the tempera-ture changes from below to above freezing and whether this change occurs at a timewhen there is precipitation The maps in Fig 6 illustrate where a temperature increaseis most likely to affect snowfall and snowmelt In the red zones where the monthly20
temperature today is between ndash5 and 0 C the projected temperature increase of 2ndash7 C (Chaturvedi et al 2012 Collins et al 2013 Wiltshire 2014) may be consideredcritical Such a change would change snowfall to rain and also cause a change fromfreezing to melting of snow and ice The pink zones with monthly mean temperaturesof 0ndash5 C would similarly change from a climate where precipitation may often fall as25
snow to one that is snow-free
458
TCD9 441ndash493 2015
Snowfall in theHimalayas an
uncertain future froma little-known past
E Viste and A Sorteberg
Title Page
Abstract Introduction
Conclusions References
Tables Figures
J I
J I
Back Close
Full Screen Esc
Printer-friendly Version
Interactive Discussion
Discussion
Paper
|D
iscussionP
aper|
Discussion
Paper
|D
iscussionP
aper|
In January (Fig 6a) only the lower parts of the Himalayas is affected as most ofthe region would still have temperatures well below the freezing point The small insetmap shows precipitation in the red zone a narrow band along the range Oppositelyin July (Fig 6c) the temperature is already above 5 C in most of the region though athigher elevations along the Himalayan range and in the Karakoram the change can be5
critical The most widespread changes are seen in spring and fall In April and October(Fig 6b d) large areas in the HKH and on the Tibetan Plateau risk a change frombelow to above freezing
Incorporating CMIP5 precipitation changes we find that the projected temperatureincrease has a larger impact so that snowfall will be reduced in the Indus Ganges and10
Brahmaputra Basins by 2071ndash2100 compared to today Details for the major basinsare presented in Sect 41 How much increased temperatures reduce snowfall withina region depends on the location of the rainsnow line today compared to the terraindistribution Results for selected upper-level sub-basins in the Indus and Brahmaputrawill be discussed in that context in Sect 4215
The large deviations in the estimates of present-day snowfall (Sect 3) means thatthere will be correspondingly large deviations in projected values To account for thismost results are shown with reference to the highest and lowest present-day estimatesMERRA reference snowfall and to APHRODITE-based snowfall Future estimates rela-tive to CRU and TRMM are assumed to lie between those of MERRA and APHRODITE20
41 Basin-scale projections
In the Indus Ganges and Brahmaputra Basins the CMIP5 models project a meanincrease in both temperature (Fig 7) and precipitation (Fig 8) in the region by 2071ndash2100 for both RCPs 26 and 85 The RCP 85 multi-model mean change in temper-ature varies through the year with a 49ndash62 C increase in the Indus 36ndash52 C in25
the Ganges and 42ndash60 C in the Brahmaputra The increase is smallest during thesummer months The dip in the summer is also seen though less pronounced with
459
TCD9 441ndash493 2015
Snowfall in theHimalayas an
uncertain future froma little-known past
E Viste and A Sorteberg
Title Page
Abstract Introduction
Conclusions References
Tables Figures
J I
J I
Back Close
Full Screen Esc
Printer-friendly Version
Interactive Discussion
Discussion
Paper
|D
iscussionP
aper|
Discussion
Paper
|D
iscussionP
aper|
the RCP 26 The summer is also the season with the largest absolute increase inprecipitation
Compared to present-day estimates the CMIP5 models project less snowfall in theIndus Ganges and Brahmaputra Basins in the last decades of this century This canbe seen from Fig 9 The projected multi-model mean is lower than today in all calen-5
dar months for both RCPs 26 and 85 With the RCP 26 some models suggest anincrease in some months mainly in winter and spring This is also the case for one ortwo models with the RCP 85 whereas other models indicate that the snowfall in thesame months will be only half of todayrsquos values
In the Ganges Basin (Fig 9b) the seasonal distribution of snowfall today is mainly10
flat with equal amounts of snowfall from January through September Reductions insummer snowfall with the RCP 85 would change the seasonal cycle into a winter-dominated one To a lesser degree this is also the case for RCP 26 As summerprecipitation is projected to increase in all of the Ganges (not shown but consistentwith Menon et al 2013) this indicates that large areas are at elevations where a small15
increase in the summer temperature may cause a shift from snow to rain This is seenas the red band along the upper Ganges in Fig 6c Reductions in summer snowfall arealso large in the Brahmaputra (Fig 9b) whereas in the Indus the largest total changesoccur in MarchndashMay (Fig 9a)
As the MERRA reference snowfall for today is much larger than APHRODITE snow-20
fall (Sect 32) projected absolute changes for 2071ndash2100 are also much largerin MERRA The relative changes are more similar though larger with reference toAPHRODITE Annual snowfall changes for each major basin are presented in Table 5for changes in temperature precipitation or both and with reference to MERRA andAphrodite present-day snowfall Changes at the sub-basin level are shown in Fig 1025
In the Ganges Basin both MERRA- and APHRODITE-based multi-model mean snow-fall is reduced by about 20 with the RCP 26 and 50 with the RCP 85 In theIndus and Brahmaputra Basins the differences between MERRA- and APHRODITE-based changes are larger but not as large as for the absolute values With reference
460
TCD9 441ndash493 2015
Snowfall in theHimalayas an
uncertain future froma little-known past
E Viste and A Sorteberg
Title Page
Abstract Introduction
Conclusions References
Tables Figures
J I
J I
Back Close
Full Screen Esc
Printer-friendly Version
Interactive Discussion
Discussion
Paper
|D
iscussionP
aper|
Discussion
Paper
|D
iscussionP
aper|
to MERRA and APHRODITE respectively the reduction in snowfall in the Indus Basinis 30 and 50 with the RCP 85 The corresponding reductions in the BrahmaputraBasin are 50 and 70
The projected changes in temperature have greater effect on snowfall than thechanges in precipitation When taking into account only changes in precipitation all5
snowfall estimates are positive (∆P Table 5) This indicates that the mean annual to-tal reduction for each major basin is governed by the temperature change In someCMIP5 models (values in brackets in Table 5) the effect of precipitation changes (∆P )on snowfall are of the same magnitude as the effect of temperature changes (∆T ) butfor the CMIP5 multi-model mean temperature changes cause snowfall changes 4ndash1010
times as large as those due to changes in precipitation This is with reference to thepresent-day MERRA reference snowfall and for both RCPs 26 and 85 With referenceto APHRODITE snowfall the effect of temperature changes compared to precipitationchanges is even greater
42 Regional projections15
If temperatures are far below freezing everywhere warming may have little effect onsnowfall The same applies if only the highest peaks receive snow today The largestreduction in snowfall in a basin occurs if todayrsquos rainsnow line is at an elevation justbelow the dominant elevation of the basin Then large regions will see a shift fromsnow to rain20
In the Indus Basin the largest relative snowfall reduction by 2071ndash2100 is seen inthe southwestern sub-basins where snowfall is limited today (Fig 10) The largest totalreduction is seen in the snow-rich sub-basins of KabulSwatAlingar in the west and inthe east and a smaller reduction in the inner-most basins of GilgitHunza Indus 1 andNubraShyok Together with the upper regions of the Brahmaputra these sub-basins25
clusters I4 I5 B3 and B4 in Fig 2 were selected for a closer analysis In addition tohaving the most snow these clusters are the most homogeneous when considering
461
TCD9 441ndash493 2015
Snowfall in theHimalayas an
uncertain future froma little-known past
E Viste and A Sorteberg
Title Page
Abstract Introduction
Conclusions References
Tables Figures
J I
J I
Back Close
Full Screen Esc
Printer-friendly Version
Interactive Discussion
Discussion
Paper
|D
iscussionP
aper|
Discussion
Paper
|D
iscussionP
aper|
the seasonal cycle of snowfall and snow fraction The values presented in this sectionare all from the RCP 85 for changes from today to 2071ndash2100
421 Upper Indus western part
Cluster 4 consists of the sub-basins Astor KabulSwatAlingar and Krishen GangaAs seen from the elevation profile at the top of Fig 11a the elevation span is large5
and there is an almost equal proportion of the terrain at all levels from heights close tosea level to about 5000 masl The most important change for this cluster is a largereduction in the total amount of snowfall in winter and spring
With a few exceptions all CMIP5 models project less snowfall in all months of theyear (Fig 11a i ii) The largest total multi-model mean reduction in snowfall (ii) oc-10
curs in FebruaryndashApril without notable change in the multi-model mean precipitation(iii) Thus the reduction is caused by increasing temperatures represented by therainsnow line in Fig 11a iv As seen from the change in the rainsnow line elevationthe projected temperature increase in these months would imply that large areas thatreceive snow today would receive only rain About 40 of the ground in this cluster lies15
below 2000 masl and receives precipitation as rain throughout the year In summerprecipitation (iii) is at a minimum and the rainsnow line (iv) is already so high that onlya small fraction of the area receives snowfall today Thus although the relative changein snowfall (i) is largest in summer the change in the amount of snowfall (ii) is small Itshould also be noted that the change in the rainsnow line elevation (iv) in summer is20
much smaller 400ndash600 m compared to 600ndash900 m in DecemberndashApril
422 Upper Indus eastern part
Further east the largest changes are projected for the spring season Cluster 5 in theIndus Basin consists of the sub-basins GilgitHunza Indus 1 NubraShyok and Zan-skar As shown in Fig 11b this is high-elevation terrain with 80 of the ground lying25
above 4000 masl As a result almost all winter precipitation is snow (Fig 11b iii)
462
TCD9 441ndash493 2015
Snowfall in theHimalayas an
uncertain future froma little-known past
E Viste and A Sorteberg
Title Page
Abstract Introduction
Conclusions References
Tables Figures
J I
J I
Back Close
Full Screen Esc
Printer-friendly Version
Interactive Discussion
Discussion
Paper
|D
iscussionP
aper|
Discussion
Paper
|D
iscussionP
aper|
For the multi-model mean no big changes are projected in JanuaryndashFebruary This ispartly because of little change in precipitation (iii) and because the rainsnow line (iv)in these months is sufficiently low in the terrain today With the 500ndash600 m shift pro-jected with the RCP 85 80ndash90 of the area will still have temperatures low enoughfor snow The largest changes occur in MarchndashOctober when higher temperatures5
push the rainsnow line above large areas that receive snow today Increasing summerprecipitation (iii) causes the snowfall reduction in summer to be less than it would other-wise be The effect of higher temperatures is smaller on the APHRODITE snowfall thanon the MERRA reference snowfall (ii) as APHRODITE has very little summer snow-fall today The difference arises both from less precipitation (iii) in APHRODITE than10
MERRA today and from a higher rainsnow line (iv) in APHRODITE Note that as thechange in precipitation was defined as a fraction of the present-day value (Sect 23)the relative changes in APHRODITE and MERRA precipitation are equal
423 Upper Brahmaputra western part
In the westernmost part of the upper Brahmaputra Basin large snowfall changes are15
projected for the summer As cluster 5 in the Indus Basin Brahmaputrarsquos cluster 4 islimited to higher grounds Less than 6 lies outside of the 4000ndash6000 masl rangeThe cluster consists of Maquan He Yarlung Zangbo Dogxung ZangboMaiqu ZangboShang ChuYarlung ZangboNyang Lhasa HeRazheng Zangbo and Yamzho YumcoThe summer monsoon fully dominates the seasonal cycle of precipitation in this region20
(Fig 12a iii) resulting in a unimodal snow cycle with a maximum in JulyndashSeptember InAPHRODITE the seasonal cycle of snowfall is similar but less pronounced than in theMERRA reference The summer also sees the greatest reduction in CMIP5 projectedsnowfall both in absolute (ii) and relative (i) terms despite increasing summer precip-itation in all models (iii) The reason can be seen from the change in the rainsnow25
line elevation (iv) In the warmest months July and August elevation changes of 400ndash500 m would shift the rainsnow line from a level where at least 5ndash10 of the groundlies above the line to a level where only 1 of the area would receive precipitation as
463
TCD9 441ndash493 2015
Snowfall in theHimalayas an
uncertain future froma little-known past
E Viste and A Sorteberg
Title Page
Abstract Introduction
Conclusions References
Tables Figures
J I
J I
Back Close
Full Screen Esc
Printer-friendly Version
Interactive Discussion
Discussion
Paper
|D
iscussionP
aper|
Discussion
Paper
|D
iscussionP
aper|
snow In comparison with reference to MERRA the 300ndash400 m shift seen in JanuaryndashFebruary would cause only a small absolute change in snowfall (ii) because there islittle precipitation in these months (ii) and a small relative change (i) because therainsnow line would still be low in the terrain (iv) With reference to APHRODITE therelative snowfall change in winter would be larger than with reference to MERRA as5
temperatures today are higher resulting in a higher rainsnow line (iv)
424 Upper Brahmaputra eastern part
Like further west the Indian summer monsoon dominates the precipitation cycle in theeastern part of upper Brahmaputra (Fig 12b iii) but the seasonal cycle of snowfallpeaks in spring and fall (iii) This is also the time of the largest projected changes10
Cluster 3 in the Brahmaputra consists of the sub-basins Yarlung Zangbo2 NyangQu Yarlung Zangbo3 Yirsquoong ZangboParl Siyom Zaya QuLuhitDi About 70 of theground lies between 3000 and 6000 masl but there is also land almost at sea levelmainly in the Zaya QuLuhitDingba Qu sub-basin During summer most of the terrainlies below the rainsnow line (iv) In spring temperatures are lower than in summer15
and pre- monsoon precipitation is stronger in this part of the Himalayas than furtherwest in cluster 3 (Fig 12a iii vs Fig 12b iii) As a result MarchndashApril gets the mostsnow
Reductions in snowfall are projected for all months (ii) comparable in magnitude butlargest in the snow-rich spring and late summer The CMIP5 multi-model mean shows20
increasing or no change in precipitation in all months (Fig 12b iii) so the reductionin snowfall is due solely to higher temperatures The largest absolute reductions inApril and May occur with a 700ndash800 m shift in the rainsnow line elevation leaving30 more of the terrain in the rain The largest relative reduction in future snowfall areprojected for July and August (Fig 12b i) when the rainsnow line shifts so high that25
only the highest peaks can get precipitation as snow (iv) This would be despite thelowest changes in the rainsnow line only about 300 m in APHRODITE
464
TCD9 441ndash493 2015
Snowfall in theHimalayas an
uncertain future froma little-known past
E Viste and A Sorteberg
Title Page
Abstract Introduction
Conclusions References
Tables Figures
J I
J I
Back Close
Full Screen Esc
Printer-friendly Version
Interactive Discussion
Discussion
Paper
|D
iscussionP
aper|
Discussion
Paper
|D
iscussionP
aper|
43 Potential effects of reduced snowfall on water availability
With a few exceptions the CMIP5 multi-model mean precipitation change over the com-ing century is positive in all months in the upper Indus and Brahmaputra (Sect 42)Thus the projected reduction in snowfall is due solely to higher temperatures How-ever there is a large spread in precipitation projections among the models If tempera-5
tures increase as much as projected with the RCP 85 could any realistic precipitationchange in the HKH compensate and maintain present-day snowfall Results indicatethat this may happen in parts of the upper Indus but is out of the reach in the upperBrahmaputra As for water availability reduced snowfall may still cause more severeproblems in the Indus than in the Brahmaputra10
In cold regions where temperatures remain below freezing more winter precipita-tion may increase both the snow cover area the length of the snow season and theSWE (Collins et al 2013 Brutel-Vuilmet et al 2013 Raumlisaumlnen 2008 Gao et al 2012Wiltshire 2014) Raumlisaumlnen (2008) showed this to be the case in eastern Siberia andthe northernmost part of North America At the southern edge of the seasonal snow15
cover relevant for this study precipitation did not compensate and there was a reduc-tion in SWEWiltshire (2014) concluded that there would be small changes in snowfallin very cold and very warm regions of the HKH Snowfall in Nepal Bhutan and Hi-machal Pradesh where winters are warmer than in most parts of the range was mostvulnerable to higher temperatures The data presented in Sect 42 generally support20
the previous studiesOne of the reasons that precipitation does not compensate is that the highest pro-
jected precipitation increase in the HKH is seen in the summer when the temperaturetoday is so high that only the highest terrain is in the snow zone Shifting the rainsnowline upward even by only a few hundred meters reduces the area that receives snow25
greatly requiring very large increases in precipitation to compensate The summer isthe season with the largest relative reduction in snowfall in all the clusters described inSect 42 Except in the western upper Indus (cluster I4 Sect 421) which has very
465
TCD9 441ndash493 2015
Snowfall in theHimalayas an
uncertain future froma little-known past
E Viste and A Sorteberg
Title Page
Abstract Introduction
Conclusions References
Tables Figures
J I
J I
Back Close
Full Screen Esc
Printer-friendly Version
Interactive Discussion
Discussion
Paper
|D
iscussionP
aper|
Discussion
Paper
|D
iscussionP
aper|
little summer snowfall today the reduction in summer snowfall is notable in all clustersin the MERRA data in the Brahmaputra clusters also in APHRODITE
The largest change in snowfall is seen in the western part of the Brahmaputra (clus-ter B4 Sect 423) where a 400ndash500 m upward shift in the rainsnow line during sum-mer reduces the area with temperatures low enough for snowfall by a factor of 5ndash105
(Fig 12a iv values not shown) As a result the summer peak in the seasonal cycleof snowfall is replaced by a dip (Fig 12a ii) With an even distribution of precipitationwith elevation the area that still receives snow would have to receive 5ndash10 times asmuch precipitation to compensate for the lost snowfall Assuming more realisticallythat precipitation decreases above a certain height would require an even higher in-10
crease in precipitation In the model with the highest increase a doubling of the Julyprecipitation by the end of the century SWE is less than 25 of todayrsquos value in thatmonth (Fig 12a iii)
With a winter-dominated precipitation cycle the relative change in snowfall is smallerin the upper Indus than in the upper Brahmaputra Downscaling a high-emission sce-15
nario (A1B) in two CMIP3 models with a regional model Wiltshire (2014) found that bythe 2080s precipitation increased more than enough to compensate for higher temper-atures in the Karakoram Hindu Kush and Jammu and Kashmir in one of the modelsthe HadCM3 In the other model ECHAM5 precipitation increased less and snow-fall increased only in the higher parts of the Karakoram In our ensemble of CMIP520
models multi-model mean precipitation in the upper Indus clusters increases mainlyin the summer season when the inter-model spread is also the largest (Fig 11a iiiand 11b iii) Among the models 4ndash5 project increased winter precipitation in the upperIndus and in the uppermost cluster I5 this is associated with an increase in wintersnowfall (Fig 11b ii)25
Although it is the part of the HKH where snowfall is least reduced by increasingtemperatures (Fig 10b) the Karakoram and inner parts of the upper Indus may still bethe region where the changes have the largest impact on river run-off Compared tothe monsoon-dominated regions further east there is little summer precipitation and
466
TCD9 441ndash493 2015
Snowfall in theHimalayas an
uncertain future froma little-known past
E Viste and A Sorteberg
Title Page
Abstract Introduction
Conclusions References
Tables Figures
J I
J I
Back Close
Full Screen Esc
Printer-friendly Version
Interactive Discussion
Discussion
Paper
|D
iscussionP
aper|
Discussion
Paper
|D
iscussionP
aper|
much of the water in the rivers during summer is meltwater (Bookhagen and Burbank2010 Immerzeel et al 2010) As melting of snow and ice has not been analyzed inthis study we cannot quantify the effect of reduced snowmelt om river run-off but it isobvious that eventually reduced snowfall will lead to reduced melting In western partsof the HKH this may lead to changes in the seasonal cycle of the river flow5
As pointed out by Wiltshire (2014) increasing precipitation in the eastern HKH im-plies that water resources are likely to increase with climate change As snowfall andsnowmelt are both at maximum during summer (Rees and Collins 2006) meltwaterdoes not have the same importance for river flow in dry parts of the year as in the In-dus Reduced snowfall may reduce glaciers but ndash not considering potential changes in10
the amount of evaporation ndash there is no indication that there will be less water comingfrom the upper Brahmaputra
5 Concluding summary
In this study we have presented a suite of estimates of present-day snowfall in theIndus Ganges and Brahmaputra Basins and the changes in snowfall that would follow15
from CMIP5 projected changes in temperature and precipitation from 1971ndash2000 to2071ndash2100 The results show that if the temperature increases as much as in the RCP85 there will be much less snowfall despite increasing precipitation in most of theregion Limiting anthropogenic forcing to the RCP 26 level would still cause reductionsthough smaller20
Estimates of present-day snowfall based on a combination of temperature and pre-cipitation from reanalysis data and observations vary by factors of 2ndash4 The MERRAreanalysis gives higher estimates than TRMM 3B42 CRU TS and APHRODITE butthe spread is also large between the estimates based on the different observationallybased data sets This demonstrates the difficulties in assessing vulnerability to climate25
change in the region With limited knowledge of the current state future conditions arebound to be uncertain
467
TCD9 441ndash493 2015
Snowfall in theHimalayas an
uncertain future froma little-known past
E Viste and A Sorteberg
Title Page
Abstract Introduction
Conclusions References
Tables Figures
J I
J I
Back Close
Full Screen Esc
Printer-friendly Version
Interactive Discussion
Discussion
Paper
|D
iscussionP
aper|
Discussion
Paper
|D
iscussionP
aper|
Future changes in temperature and precipitation projected by climate models can stillprovide an indication of the relative change in snowfall With the RCP 85 the climatemodels project mean reductions in annual snowfall by 30ndash50 in the Indus Basin 50ndash60 in the Ganges Basin and 50ndash70 in the Brahmaputra Basin by 2071ndash2100 Withthe RCP 26 the corresponding reductions would be 10ndash20 in the Indus about 20 5
in the Ganges and 20ndash30 in the Brahmaputra The reductions are due to increasingtemperatures as the mean of the models show constant or increasing precipitationthroughout the year in most of the region
How much increasing temperatures reduce snowfall in a region depends on howmuch of the terrain that is below and above the freezing point today and on whether10
the terrain profile is such that the temperature increase transforms large areas fromsnow to rain zones With the RCP 85 the mean elevation where rain changes to snowndash the rainsnow line ndash creeps upward by 400ndash900 m in most of the region by 700ndash900 m
The largest relative change in snowfall is seen in the upper westernmost sub-basins15
of the Brahmaputra despite increasing precipitation and the lowest rainsnow line el-evation change (400ndash500 m) This is because a major part of this region is near thefreezing point today With the RCP 85 most of this region will have temperaturesabove freezing especially in the summer which is the wettest part of the year Theprojected reduction in annual snowfall is 65ndash75 20
In the upper Indus the effect of a warmer climate on snowfall is less extreme asmost of the terrain is high enough to have temperatures sufficiently far below freezingtoday Winter and spring brings most of the precipitation and the projected 600ndash800 mchange in the rainsnow line elevation during these seasons would leave most of theterrain below the freezing point Still a 20ndash40 reduction in annual snowfall is pro-25
jected with the RCP 85The range of our estimates of present-day snowfall illustrates how little that is known
about conditions that influence the availability of drinking water in some of the mostdensely populated parts of the world There is both a scientific and a societal need
468
TCD9 441ndash493 2015
Snowfall in theHimalayas an
uncertain future froma little-known past
E Viste and A Sorteberg
Title Page
Abstract Introduction
Conclusions References
Tables Figures
J I
J I
Back Close
Full Screen Esc
Printer-friendly Version
Interactive Discussion
Discussion
Paper
|D
iscussionP
aper|
Discussion
Paper
|D
iscussionP
aper|
for more information about precipitation in the HKH As a full-scale long-time observa-tional program covering all parts of the Himalayan range is not a likely possibility theonly hope for improved future knowledge of Himalayan snowfall lies in the improvementof satellite data and regional climate models
The Supplement related to this article is available online at5
doi105194tcd-9-441-2015-supplement
Acknowledgements This work has been carried out with support from the University of Bergenthe NORINDIA and SNOWHIM projects funded by The Research Council of Norway and theCentre for Climate Dynamics at the Bjerknes Centre for Climate Research We acknowledgethe World Climate Research Programmersquos Working Group on Coupled Modelling which is re-10
sponsible for CMIP and we thank the climate modeling groups listed in Table 3 of this paper forproducing and making available their model output For CMIP the US Department of EnergyrsquosProgram for Climate Model Diagnosis and Intercomparison provides coordinating support andled development of software infrastructure in partnership with the Global Organization for EarthSystem Science Portals15
References
Akhtar M Ahmad N and Booij M J The impact of climate change on the water resourcesof Hindukush-Karakorum-Himalaya region under different glacier coverage scenarios J Hy-drol 355 148ndash163 2008
Anders A M Roe G H Hallet B Montgomery D R Finnegan N J and Putkonen J20
Spatial patterns of precipitation and topography in the Himalaya in Tectonics Climate andLandscape Evolution Geological Society of America Special Paper edited by Willett S DHovius N Brandon M T and Fisher D Geological Society of America Boulder CO USA39ndash53 2006
469
TCD9 441ndash493 2015
Snowfall in theHimalayas an
uncertain future froma little-known past
E Viste and A Sorteberg
Title Page
Abstract Introduction
Conclusions References
Tables Figures
J I
J I
Back Close
Full Screen Esc
Printer-friendly Version
Interactive Discussion
Discussion
Paper
|D
iscussionP
aper|
Discussion
Paper
|D
iscussionP
aper|
Archer DR and Fowler HJ Spatial and temporal variations in precipitation in the UpperIndus Basin global teleconnections and hydrological implications Hydrol Earth Syst Sci8 47ndash61 doi105194hess-8-47-2004 2004
Bhutiyani M R Kale V S and Pawar N J Long-term trends in maximum minimum andmean annual air temperatures across the Northwestern Himalaya during the twentieth cen-5
tury Climatic Change 85 159ndash177 doi101007s10584-006-9196-1 2007Bhutiyani M R Kale V S and Pawar N J Climate change and the precipitation variations in
the northwestern Himalaya 1866ndash2006 Int J Climatol 30 535ndash548 doi101002joc19202010
Bookhagen B and Burbank D W Topography relief and TRMM-derived rainfall variations10
along the Himalaya Geophys Res Lett 33 L08405 doi1010292006GL026037 2006Bookhagen B and Burbank D W Toward a complete Himalayan hydrological budget spa-
tiotemporal distribution of snowmelt and rainfall and their impact on river discharge J Geo-phys Res 115 F03019 doi1010292009jf001426 2010
Franco B Fettweis X and Erpicum M Future projections of the Greenland ice sheet energy15
balance driving the surface melt The Cryosphere 7 1ndash18 doi105194tc-7-1-2013 2013Butt M J Characteristics of snow cover in the Hindukush Karakoram and Himalaya region
using Landsat satellite data Hydrol Process 10 3689ndash3698 doi101002hyp8375 2012Byun K and Choi M Uncertainty of snow water equivalent retrieved from AMSR-E brightness
temperature in northeast Asia Hydrol Process 28 12 doi101002hyp9846 201420
Chaturvedi R K Joshi J Jayaraman M Bala G and Ravindranath N H Multi-modelclimate change projections for India under representative concentration pathways Curr SciIndia 103 791ndash802 2012
Christensen J H Krishna Kumar K Aldrian E An S-I Cavalcanti I F A Castro Md Dong W Goswami P Hall A Kanyanga J K Kitoh A Kossin J Lau N-C Ren-25
wick J Stephenson D B Xie S-P and Zhou T Climate phenomena and their relevancefor future regional climate change in Climate Change 2013 The Physical Science BasisContribution of Working Group I to the Fifth Assessment Report of the Intergovernmen-tal Panel on Climate Change edited by Stocker T F Qin D Plattner G-K Tignor MAllen S K Boschung J Nauels A Xia Y Bex V and Midgley P M Cambridge Univer-30
sity Press Cambridge UK and New York NY USA 92 2013Collins M Knutti R Arblaster J Dufresne J-L Fichefet T Friedlingstein P Gao X
Gutowski W J Johns T Krinner G Shongwe M Tebaldi C Weaver A J and
470
TCD9 441ndash493 2015
Snowfall in theHimalayas an
uncertain future froma little-known past
E Viste and A Sorteberg
Title Page
Abstract Introduction
Conclusions References
Tables Figures
J I
J I
Back Close
Full Screen Esc
Printer-friendly Version
Interactive Discussion
Discussion
Paper
|D
iscussionP
aper|
Discussion
Paper
|D
iscussionP
aper|
Wehner M Long-term climate change projections commitments and irreversibility in Cli-mate Change 2013 The Physical Science Basis Contribution of Working Group I to theFifth Assessment Report of the Intergovernmental Panel on Climate Change edited byStocker T F Qin D Plattner G-K Tignor M Allen S K Boschung J Nauels AXia Y Bex V and Midgley P M Cambridge University Press Cambridge UK and New5
York NY USA 108 2013Cook E R Palmer J G Ahmed M Woodhouse C A Fenwick P Zafar M U Wahab M
and Khan N Five centuries of Upper Indus River flow from tree rings J Hydrol 486 365ndash375 doi101016jjhydrol201302004 2013
Dai A Temperature and pressure dependence of the rain-snow phase transition over land and10
ocean Geophys Res Lett 35 L12802 doi1010292008gl033295 2008Fowler H J and Archer D R Conflicting signals of climatic change in the Upper Indus Basin
J Climate 19 4276ndash4293 doi101175jcli38601 2006Gao J Williams M W Fu X Wang G and Gong T Spatiotemporal distribution of snow
in eastern Tibet and the response to climate change Remote Sens Environ 121 1ndash915
doi101016jrse201201006 2012Gardelle J Berthier E and Arnaud Y Slight mass gain of Karakoram glaciers in the
early twenty-first century ndash Supplement Nature Geosci 5 322ndash325 doi101038ngeo14502012
Guhathakurta P and Rajeevan M Trends in the rainfall pattern over India Int J Climatol20
28 1453ndash1469 doi101002joc1640 2008Harris I Jones P D Osborn T J and Lister D H Updated high-resolution grids of
monthly climatic observations ndash the CRU TS310 Dataset Int J Climatol 34 623ndash642doi101002joc3711 2014
Hartmann H and Andresky L Flooding in the Indus River basin ndash a spa-25
tiotemporal analysis of precipitation records Global Planet Change 107 25ndash35doi101016jgloplacha201304002 2013
Hastings D and Dunbar P Development amp Assessment of the Global Land One-km BaseElevation Digital Elevation Model (GLOBE) ISPRS Commission IV Symposium on GIS ndashBetween Visions and Applications Stuttgart Germany 7ndash10 September 199830
Hewitt K The Karakoram anomaly Glacier expansion and the ldquoelevation ef-fectrdquo Karakoram Himalaya Mt Res Dev 25 332ndash340 doi1016590276-4741(2005)025[0332TKAGEA]20CO2 2005
471
TCD9 441ndash493 2015
Snowfall in theHimalayas an
uncertain future froma little-known past
E Viste and A Sorteberg
Title Page
Abstract Introduction
Conclusions References
Tables Figures
J I
J I
Back Close
Full Screen Esc
Printer-friendly Version
Interactive Discussion
Discussion
Paper
|D
iscussionP
aper|
Discussion
Paper
|D
iscussionP
aper|
Huffman G J Adler R F Bolvin D T Gu G Nelkin E J Bowman K P Hong YStocker E F and Wolff D B The TRMM Multisatellite Precipitation Analysis (TMPA) quasi-global multiyear combined-sensor precipitation estimates at fine scales J Hydrometeorol8 38ndash55 2007
Immerzeel W Historical trends and future predictions of climate variability in the Brahmaputra5
basin Int J Climatol 28 243ndash254 doi101002joc1528 2008Immerzeel W W Droogers P de Jong S M and Bierkens M F P Large-scale monitoring
of snow cover and runoff simulation in Himalayan river basins using remote sensing RemoteSens Environ 113 40ndash49 doi101016jrse200808010 2009
Immerzeel W W van Beek L P H and Bierkens M F P Climate change will affect the10
asian water towers Science 328 1382ndash1385 doi101126science1183188 2010Ines A V M and Hansen J W Bias correction of daily GCM rainfall for crop simulation
studies Agr Forest Meteorol 138 44ndash53 doi101016jagrformet200603009 2006Jain S K Goswami A and Saraf A K Role of elevation and aspect in snow distribution
in western Himalaya Water Resour Manag 23 71ndash83 doi101007s11269-008-9265-515
2009Krakauer N Pradhanang S Lakhankar T and Jha A Evaluating satellite products for
precipitation estimation in mountain regions a case study for Nepal Remote Sensing 54107ndash4123 2013
Krishna A P Snow and glacier cover assessment in the high mountains of Sikkim Himalaya20
Hydrol Process 19 2375ndash2383 doi101002hyp5890 2005Kulkarni A V Rathore B P Singh S K and Ajai Distribution of seasonal snow cover in cen-
tral and western Himalaya Ann Glaciol 51 123ndash128 doi1031891727564107913864452010
Kumar V Rao Y S Venkataraman G Sarwade R N and Mani S Analysis of Aqua25
AMSR-E Derived Snow Water Equivalent over Himalayan Snow Covered Regions Geo-science and Remote Sensing Symposium Denver CO USA 31 Julyndash4 August 2006
Kaumlaumlb A Berthier E Nuth C Gardelle J and Arnaud Y Contrasting patterns of earlytwenty-first-century glacier mass change in the Himalayas Nature 488 495ndash498 availableat httpwwwnaturecomnaturejournalv488n7412absnature11324html ndash Supplement30
2012Lehner B Verdin K and Jarvis A New global hydrography derived from spaceborne eleva-
tion data Eos T Am Geophys Un 89 93ndash94 doi1010292008EO100001 2008
472
TCD9 441ndash493 2015
Snowfall in theHimalayas an
uncertain future froma little-known past
E Viste and A Sorteberg
Title Page
Abstract Introduction
Conclusions References
Tables Figures
J I
J I
Back Close
Full Screen Esc
Printer-friendly Version
Interactive Discussion
Discussion
Paper
|D
iscussionP
aper|
Discussion
Paper
|D
iscussionP
aper|
MacQueen J Some Methods for Classification and Analysis of Multivariate ObservationsFifth Berkeley Symposium on Mathematical Statistics and Probability Berkeley California21 Junendash18 July 1967
Meacuteneacutegoz M Galleacutee H and Jacobi H W Precipitation and snow cover in the Himalayafrom reanalysis to regional climate simulations Hydrol Earth Syst Sci 17 3921ndash39365
doi105194hess-17-3921-2013 2013Menon A Levermann A Schewe J Lehmann J and Frieler K Consistent increase in
Indian monsoon rainfall and its variability across CMIP-5 models Earth Syst Dynam 4287ndash300 doi105194esd-4-287-2013 2013
Moss R H Edmonds J A Hibbard K A Manning M R Rose S K van Vuuren D P10
Carter T R Emori S Kainuma M Kram T Meehl G A Mitchell J F B Naki-cenovic N Riahi K Smith S J Stouffer R J Thomson A M Weyant J P andWilbanks T J The next generation of scenarios for climate change research and assess-ment Nature 463 747ndash756 2010
Negi H S Kulkarni A V and Semwal B S Estimation of snow cover distribution in Beas15
basin Indian Himalaya using satellite data and ground measurements J Earth Syst Sci118 525ndash538 doi101007s12040-009-0039-0 2009
Palazzi E v Hardenberg J and Provenzale A Precipitation in the Hindu-Kush Karako-ram Himalaya observations and future scenarios J Geophys Res-Atmos 118 85ndash100doi1010292012JD018697 201320
Rees H G and Collins D N Regional differences in response of flow in glacier-fed Himalayanrivers to climatic warming Hydrol Process 20 2157ndash2169 doi101002hyp6209 2006
Rienecker M M Suarez M J Gelaro R Todling R Bacmeister J Liu EBosilovich M G Schubert S D Takacs L Kim G-K Bloom S Chen J Collins DConaty A da Silva A Gu W Joiner J Koster R D Lucchesi R Molod A Owens T25
Pawson S Pegion P Redder C R Reichle R Robertson F R Ruddick A GSienkiewicz M and Woollen J MERRA NASArsquos Modern-Era Retrospective Analysis forResearch and Applications J Climate 24 3624ndash3648 doi101175JCLI-D-11-0001512011
Rikiishi K and Nakasato H Height dependence of the tendency for reduction in seasonal30
snow cover in the Himalaya and the Tibetan Plateau region 1966ndash2001 Ann Glaciol 43369ndash377 doi103189172756406781811989 2006
473
TCD9 441ndash493 2015
Snowfall in theHimalayas an
uncertain future froma little-known past
E Viste and A Sorteberg
Title Page
Abstract Introduction
Conclusions References
Tables Figures
J I
J I
Back Close
Full Screen Esc
Printer-friendly Version
Interactive Discussion
Discussion
Paper
|D
iscussionP
aper|
Discussion
Paper
|D
iscussionP
aper|
Raumlisaumlnen J Warmer climate less or more snow Clim Dynam 30 307ndash319doi101007s00382-007-0289-y 2008
Schaner N Voisin N Nijssen B and Lettenmaier D P The contribution of glacier melt tostreamflow Environ Res Lett 7 034029 doi1010881748-932673034029 2012
Scherler D Bookhagen B and Strecker M R Spatially variable response of Himalayan5
glaciers to climate change affected by debris cover Nature Geosci 4 156ndash159 availableat httpwwwnaturecomngeojournalv4n3absngeo1068html ndash Supplement 2011
Sharif M Archer D R Fowler H J and Forsythe N Trends in timing and magnitude offlow in the Upper Indus Basin Hydrol Earth Syst Sci 17 1503ndash1516 doi105194hess-17-1503-2013 201310
Shekhar M S Chand H Kumar S Srinivasan K and Ganju A Climate-change studiesin the western Himalaya Ann Glaciol 51 105ndash112 doi1031891727564107913865082010
Shrestha A B Wake C P Mayewski P A and Dibb J E Maximum tempera-ture trends in the Himalaya and its vicinity an analysis based on temperature records15
from Nepal for the period 1971ndash94 J Climate 12 2775ndash2786 doi1011751520-0442(1999)012lt2775MTTITHgt20CO2 1999
Shrestha A B Wake C P Dibb J E and Mayewski P A Precipitation fluctuations in theNepal Himalaya and its vicinity and relationship with some large scale climatological parame-ters Int J Climatol 20 317ndash327 doi101002(SICI)1097-0088(20000315)203lt317AID-20
JOC476gt30CO2-G 2000Siderius C Biemans H Wiltshire A Rao S Franssen W H P Kumar P Gosain A K
van Vliet M T H and Collins D N Snowmelt contributions to discharge of the GangesSci Total Environ Supplement 468ndash469 9 doi101016jscitotenv201305084 2013
Singh P Jain S K and Kumar N Estimation of snow and glacier-melt contribution to the25
Chenab River Western Himalaya Mt Res Dev 17 49ndash56 doi1023073673913 1997Singh P Kumar V Thomas T and Arora M Changes in rainfall and relative hu-
midity in river basins in northwest and central India Hydrol Process 22 2982ndash2992doi101002hyp6871 2008
Sontakke N A Singh N and Singh H N Instrumental period rainfall series of the Indian30
region (AD 1813ndash2005) revised reconstruction update and analysis Holocene 18 1055ndash1066 doi1011770959683608095576 2008
474
TCD9 441ndash493 2015
Snowfall in theHimalayas an
uncertain future froma little-known past
E Viste and A Sorteberg
Title Page
Abstract Introduction
Conclusions References
Tables Figures
J I
J I
Back Close
Full Screen Esc
Printer-friendly Version
Interactive Discussion
Discussion
Paper
|D
iscussionP
aper|
Discussion
Paper
|D
iscussionP
aper|
Sperber K R Annamalai H Kang I S Kitoh A Moise A Turner A Wang B andZhou T The Asian summer monsoon an intercomparison of CMIP5 vs CMIP3 simulationsof the late 20th century Clim Dynam 41 2711ndash2744 doi101007s00382-012-1607-62013
Tahir A A Chevallier P Arnaud Y and Ahmad B Snow cover dynamics and hydrological5
regime of the Hunza River basin Karakoram Range Northern Pakistan Hydrol Earth SystSci 15 2275ndash2290 doi105194hess-15-2275-2011 2011a
Tahir A A Chevallier P Arnaud Y Neppel L and Ahmad B Modeling snowmelt-runoffunder climate scenarios in the Hunza River basin Karakoram Range Northern Pakistan JHydrol 409 104ndash117 doi101016jjhydrol201108035 2011b10
Taylor K E Stouffer R J and Meehl G A An overview of CMIP5 and the experimentdesign B Am Meteorol Soc 93 14 doi101175BAMS-D-11-000941 2011
Tedesco M and Narvekar P S Assessment of the NASA AMSR-E SWE product IEEE J SelTop Appl 3 141ndash159 doi101109JSTARS20102040462 2010
Teutschbein C and Seibert J Bias correction of regional climate model simulations for hydro-15
logical climate-change impact studies review and evaluation of different methods J Hydrol456ndash457 12ndash29 doi101016jjhydrol201205052 2012
Turner A G and Annamalai H Climate change and the South Asian summer monsoon NatClim Change 2 587ndash595 2012
van Vuuren D Edmonds J Kainuma M Riahi K Thomson A Hibbard K Hurtt G20
Kram T Krey V Lamarque J-F Masui T Meinshausen M Nakicenovic N Smith Sand Rose S The representative concentration pathways an overview Climatic Change109 26 doi101007s10584-011-0148-z 2011
Wang A and Zeng X Development of global hourly 05-degree land surface air temperaturedatasets J Climate 26 7676ndash7691 doi101175JCLI-D-12-006821 201325
Wiltshire A J Climate change implications for the glaciers of the Hindu Kush Karakoram andHimalayan region The Cryosphere 8 941ndash958 doi105194tc-8-941-2014 2014
Winiger M Gumpert M and Yamout H KarakorumndashHindukushndashwestern Himalaya assess-ing high-altitude water resources Hydrol Process 19 2329ndash2338 doi101002hyp5887200530
Xu X Lu C Shi X and Gao S World water tower An atmospheric perspective GeophysRes Lett 35 L20815 doi1010292008GL035867 2008a
475
TCD9 441ndash493 2015
Snowfall in theHimalayas an
uncertain future froma little-known past
E Viste and A Sorteberg
Title Page
Abstract Introduction
Conclusions References
Tables Figures
J I
J I
Back Close
Full Screen Esc
Printer-friendly Version
Interactive Discussion
Discussion
Paper
|D
iscussionP
aper|
Discussion
Paper
|D
iscussionP
aper|
Xu Z X Gong T L and Li J Y Decadal trend of climate in the Tibetan Plateaumdashregionaltemperature and precipitation Hydrol Process 22 3056ndash3065 doi101002hyp68922008b
Yasutomi N Hamada A and Akiyo Y Development of a Long-term Daily Gridded Temper-ature Dataset and its Application to RainSnow Discrimination of Daily Precipitation Global5
Environ Res15 165ndash172 2011Yatagai A Kamiguchi K Arakawa O Hamada A Yasutomi N and Kitoh A APHRODITE
Constructing a Long-Term Daily Gridded Precipitation Dataset for Asia Based on a DenseNetwork of Rain Gauges B Am Meteorol Soc 93 1401ndash1415 doi101175BAMS-D-11-001221 201210
You Q Kang S Aguilar E and Yan Y Changes in daily climate extremes in the east-ern and central Tibetan Plateau during 1961ndash2005 J Geophys Res-Atmos 113 D07101doi1010292007JD009389 2008
476
TCD9 441ndash493 2015
Snowfall in theHimalayas an
uncertain future froma little-known past
E Viste and A Sorteberg
Title Page
Abstract Introduction
Conclusions References
Tables Figures
J I
J I
Back Close
Full Screen Esc
Printer-friendly Version
Interactive Discussion
Discussion
Paper
|D
iscussionP
aper|
Discussion
Paper
|D
iscussionP
aper|
Table 1 Combinations of data types used in snowfall estimates T temperature P precipita-tion f (P T ) indicates that snowfall is calculated as a function of P and T
Precipitation Temperature Snowfall Time
MERRA MERRA PresentMERRA reference MERRA Terrain-adjusted MERRA f (P T ) PresentMERRA T2m MERRA MERRA T2m f (P T ) PresentBias-corrected with obs T MERRA Bias-corr terrain-adj MERRA f (P T ) PresentBias-corrected with obs P Bias-corr MERRA Terrain-adjusted MERRA f (P T ) PresentBias-corrected with obs T P Bias-corr MERRA Bias-corr terrain-adj MERRA f (P T ) PresentCMIP5 T MERRA Terrain-adj MERRA+∆T f (P T ) FutureCMIP5 P MERRAtimes∆P Terrain-adj MERRA f (P T ) FutureCMIP5 T P MERRAtimes∆P Terrain-adj MERRA+∆T f (P T ) FutureBias-corr CMIP5 T Bias-corr MERRA Bias-corr terrain-adj MERRA+∆T f (P T ) FutureBias-corr CMIP5 P Bias-corr MERRAtimes∆P Bias-corr terrain-adj MERRA f (P T ) FutureBias-corr CMIP5 T P Bias-corr MERRAtimes∆P Bias-corr terrain-adj MERRA+∆T f (P T ) Future
477
TCD9 441ndash493 2015
Snowfall in theHimalayas an
uncertain future froma little-known past
E Viste and A Sorteberg
Title Page
Abstract Introduction
Conclusions References
Tables Figures
J I
J I
Back Close
Full Screen Esc
Printer-friendly Version
Interactive Discussion
Discussion
Paper
|D
iscussionP
aper|
Discussion
Paper
|D
iscussionP
aper|
Table 2 Data sets used in calculations of present-day snowfall
Product Time Hor res Description
MERRA 1979ndash2012 05 lat 07 lon Hourly atmospheric reanalysis data(Rienecker et al 2011)
APHRODITEV1204V1101
1979ndash2007 025 Daily temperature andprecipitation basedon observations (Yatagai et al 2012Yasutomi et al 2011)
CRU TS 320 1979ndash2011 05 Monthly temperature and precipitationbased on observations(Harris et al 2014)
TRMM 3B42 V7 1998ndash2012 05 3 hourly satellite-based precipitation(Huffman et al 2007)
GLOBE 1 km Topography data set(Hastings and Dunbar 1998)
478
TCD9 441ndash493 2015
Snowfall in theHimalayas an
uncertain future froma little-known past
E Viste and A Sorteberg
Title Page
Abstract Introduction
Conclusions References
Tables Figures
J I
J I
Back Close
Full Screen Esc
Printer-friendly Version
Interactive Discussion
Discussion
Paper
|D
iscussionP
aper|
Discussion
Paper
|D
iscussionP
aper|
Table 3 CMIP5 models and RCPs used (x) in calculations of 2071ndash2100 snowfall
Model RCP 26 RCP 85
CanESM2 x xCCSM4 x xCESM1-CAM5 xCNRM-CM5 xGFDL-CM3 x xGFDL-ESM2G xGISS-E2-R x xHadGEM2-ES x xIPSL-CM5A-LR x xIPSL-CM5A-MR x xMIROC-ESM x xMIROC-ESM-CHEM x xMIROC5 x xMRI-CGCM3 x xNorESM1-M x xNorESM1-ME x x
479
TCD9 441ndash493 2015
Snowfall in theHimalayas an
uncertain future froma little-known past
E Viste and A Sorteberg
Title Page
Abstract Introduction
Conclusions References
Tables Figures
J I
J I
Back Close
Full Screen Esc
Printer-friendly Version
Interactive Discussion
Discussion
Paper
|D
iscussionP
aper|
Discussion
Paper
|D
iscussionP
aper|
Table 4 Annual snowfall estimates for the Indus Ganges and Brahmaputra Basins S snow[km3 SWE] P precipitation [km3] S and P percent of MERRA reference snowfall andMERRA precipitation First horizontal section no bias-corrections Second third and fourthsection bias-corrections with T P and both T and P
Indus Basin Ganges Basin Brahmaputra BasinInput S S P P S S P P S S P P
MERRA reference 148 100 422 100 54 100 1147 100 119 100 733 100MERRA 166 112 422 100 49 90 1147 100 129 109 733 100MERRA T2m 154 104 422 100 42 77 1147 100 109 92 733 100T APHRODITE 113 76 422 100 30 55 1147 100 74 62 733 100T CRU 126 85 422 100 81 151 1147 100 109 92 733 100P APHRODITE 66 44 315 75 22 42 1020 89 35 30 567 77P TRMM 72 49 404 96 31 57 1244 108 63 54 835 114P CRU 84 56 398 94 30 56 1100 96 53 45 716 98P T APHRODITE 49 33 315 75 12 22 1020 89 20 17 567 77P APHRODITE T CRU 62 42 315 75 34 63 1020 89 33 28 567 77P TRMM T APHRODITE 54 36 390 92 18 34 1195 104 39 33 815 111P TRMM T CRU 65 44 403 96 46 85 1254 109 58 49 813 111P CRU T APHRODITE 65 44 395 94 17 31 1106 96 31 26 718 98P T CRU 80 54 398 94 41 75 1100 96 49 42 716 98
480
TCD9 441ndash493 2015
Snowfall in theHimalayas an
uncertain future froma little-known past
E Viste and A Sorteberg
Title Page
Abstract Introduction
Conclusions References
Tables Figures
J I
J I
Back Close
Full Screen Esc
Printer-friendly Version
Interactive Discussion
Discussion
Paper
|D
iscussionP
aper|
Discussion
Paper
|D
iscussionP
aper|
Table 5 Projected change in annual snowfall from 1971ndash2000 to 2071ndash2100 with referenceto terrain-adjusted MERRA and APHRODITE ∆Sabs [km3] is the absolute change ∆Srel [] isthe relative change compared to the present-day MERRA reference snowfall Values are pre-sented with the CMIP5 multi-model mean as the main value and the span of individual modelsin brackets (MERRA only) ∆TP indicates that changes in both temperature and precipitationare included whereas ∆P and ∆T denotes changes only in precipitation or temperature re-spectively
Indus Ganges Brahmaputra∆Sabs [km3] ∆Srel [] ∆Sabs [km3] ∆Srel [] ∆Sabs [km3] ∆Srel []
RCP 85 MERRA ∆TP minus49 [minus83minus9] minus33 [minus56minus6] minus27 [minus36minus14] minus50 [minus66minus25] minus64 [minus93minus39] minus54 [minus79minus33]MERRA ∆T minus51 [minus67minus34] minus34 [minus45minus23] minus28 [minus34minus21] minus51 [minus64minus39] minus71 [minus87minus53] minus60 [minus73minus44]MERRA ∆P 5 [minus2544] 4 [minus1730] 7 [minus417] 12 [minus731] 20 [minus1750] 17 [minus1542]
APHRO ∆TP minus25 minus51 minus7 minus56 minus13 minus67APHRO ∆T minus25 minus52 minus7 minus57 minus14 minus71APHRO ∆P 1 1 1 6 3 16
RCP 26 MERRA ∆TP minus15 [minus406] minus10 [minus274] minus10 [minus19minus3] minus18 [minus36minus5] minus25 [minus42minus5] minus21 [minus35minus4]MERRA ∆T minus18 [minus27minus9] minus12 [minus18minus6] minus12 [minus21minus6] minus21 [minus39minus11] minus29 [minus47minus13] minus25 [minus40minus11]MERRA ∆P 3 [minus1825] 2 [minus1217] 3 [minus210] 5 [minus419] 7 [minus828] 6 [minus623]
APHRO ∆TP minus9 minus18 minus2 minus20 minus6 minus29APHRO ∆T minus10 minus19 minus3 minus23 minus6 minus32APHRO ∆P 1 1 0 4 1 6
481
TCD9 441ndash493 2015
Snowfall in theHimalayas an
uncertain future froma little-known past
E Viste and A Sorteberg
Title Page
Abstract Introduction
Conclusions References
Tables Figures
J I
J I
Back Close
Full Screen Esc
Printer-friendly Version
Interactive Discussion
Discussion
Paper
|D
iscussionP
aper|
Discussion
Paper
|D
iscussionP
aper|
Figure 1 Map of the region with the Indus Ganges and Brahmaputra basins outlined in whiteThinner outlines are national borders Background NASA Visible Earth
482
TCD9 441ndash493 2015
Snowfall in theHimalayas an
uncertain future froma little-known past
E Viste and A Sorteberg
Title Page
Abstract Introduction
Conclusions References
Tables Figures
J I
J I
Back Close
Full Screen Esc
Printer-friendly Version
Interactive Discussion
Discussion
Paper
|D
iscussionP
aper|
Discussion
Paper
|D
iscussionP
aper|
0
400 mm
Months 1ndash12
SP
I1
I2I3
I5I4
G1
G2G3
G4
B1
B2
B3B4
Viste amp SortebergFigure 2
Figure 2 Monthly mean MERRA precipitation and MERRA reference snowfall in sub-basinclusters of the Indus (I) Ganges (G) and Brahmaputra (B) Total bar height MERRA precip-itation (P) [mm] Colored bars snowfall (S) [mm SWE] based on MERRA precipitation andterrain-adjusted MERRA temperature in the region with the same color Cluster 1 in eachbasin is considered snow-free and the seasonal cycles are not shown
483
TCD9 441ndash493 2015
Snowfall in theHimalayas an
uncertain future froma little-known past
E Viste and A Sorteberg
Title Page
Abstract Introduction
Conclusions References
Tables Figures
J I
J I
Back Close
Full Screen Esc
Printer-friendly Version
Interactive Discussion
Discussion
Paper
|D
iscussionP
aper|
Discussion
Paper
|D
iscussionP
aper|
a) MERRA reference b) APHRODITE c) APHRODITE ndash MERRA ref
30 km3
20100-10-20-30
Viste amp SortebergFigure 3
Figure 3 The effect of bias-corrections with APHRODITE temperature and precipitation(a) MERRA reference snowfall (b) Snowfall based on bias-corrections with APHRODITE(c) APHRODITE (b) minus MERRA reference snowfall (a)
484
TCD9 441ndash493 2015
Snowfall in theHimalayas an
uncertain future froma little-known past
E Viste and A Sorteberg
Title Page
Abstract Introduction
Conclusions References
Tables Figures
J I
J I
Back Close
Full Screen Esc
Printer-friendly Version
Interactive Discussion
Discussion
Paper
|D
iscussionP
aper|
Discussion
Paper
|D
iscussionP
aper|
Figure 4 Difference between MERRA precipitation and observation-based data (a) Annualmean MERRA precipitation (b c and d) Annual mean MERRA precipitation bias-correctedwith observations APHRODITE CRU TS and TRMM 3B42 For each data set the small insetmaps show the observations minus MERRA
485
TCD9 441ndash493 2015
Snowfall in theHimalayas an
uncertain future froma little-known past
E Viste and A Sorteberg
Title Page
Abstract Introduction
Conclusions References
Tables Figures
J I
J I
Back Close
Full Screen Esc
Printer-friendly Version
Interactive Discussion
Discussion
Paper
|D
iscussionP
aper|
Discussion
Paper
|D
iscussionP
aper|
Biasminuscorrected minus original MERRA temperature [C]
minus15
minus10
minus5
0
5
10
Biasminuscorrected minus original MERRA temperature [C]
minus15
minus10
minus5
0
5
10
MERRA mean temperature [C] 1979minus2007
minus15
minus10
minus5
0
5
10
15
20
25
30a) MERRA b) APHRODITE ndash MERRA c) CRU ndash MERRA
-10
0
10
20
30degC
minus15
minus10
minus5
0
5
10
15degC
Viste amp SortebergFigure 5
Figure 5 Difference between MERRA temperature and observation-based data (a) Annualmean MERRA temperature (b and c) Annual mean MERRA temperature bias-corrected withobservations APHRODITE and CRU TS
486
TCD9 441ndash493 2015
Snowfall in theHimalayas an
uncertain future froma little-known past
E Viste and A Sorteberg
Title Page
Abstract Introduction
Conclusions References
Tables Figures
J I
J I
Back Close
Full Screen Esc
Printer-friendly Version
Interactive Discussion
Discussion
Paper
|D
iscussionP
aper|
Discussion
Paper
|D
iscussionP
aper|
Jan Apr
Jul Oct
a)
c)
b)
d)
15degC
10
5
0
ndash5
ndash10
ndash15
200 mm16012080400ndash40ndash80ndash120ndash160ndash200
Viste amp SortebergFigure 6
Figure 6 Regions where increasing temperatures are likely to cause a shift from snow to rainData monthly mean MERRA temperature terrain-adjusted to a 4 km GLOBE grid Red temper-ature between minus5 and 0 considered critical Small inset maps monthly MERRA precipitationin the critical zones
487
TCD9 441ndash493 2015
Snowfall in theHimalayas an
uncertain future froma little-known past
E Viste and A Sorteberg
Title Page
Abstract Introduction
Conclusions References
Tables Figures
J I
J I
Back Close
Full Screen Esc
Printer-friendly Version
Interactive Discussion
Discussion
Paper
|D
iscussionP
aper|
Discussion
Paper
|D
iscussionP
aper|
1 2 3 4 5 6 7 8 9 10 11 12Month
∆T [ordm
C]
a) Indus
0
1
2
3
4
5
6
7
8
9
10
b) Ganges∆T
[ordmC
]
1 2 3 4 5 6 7 8 9 10 11 12Month
1
2
3
4
5
6
7
8
0 0
c) Brahmaputra
∆T [ordm
C]
1 2 3 4 5 6 7 8 9 10 11 12Month
1
2
3
4
5
6
7
8
9
10 RCP 85RCP 85 meanRCP 26RCP 26 mean
Viste amp SortebergFigure 7
Figure 7 Projected future temperature change from 1971ndash2000 to 2071ndash2100 in the (a) In-dus (b) Ganges and (c) Brahmaputra Basins Thin lines show the individual CMIP5 modelsstronger lines the multi-model mean
488
TCD9 441ndash493 2015
Snowfall in theHimalayas an
uncertain future froma little-known past
E Viste and A Sorteberg
Title Page
Abstract Introduction
Conclusions References
Tables Figures
J I
J I
Back Close
Full Screen Esc
Printer-friendly Version
Interactive Discussion
Discussion
Paper
|D
iscussionP
aper|
Discussion
Paper
|D
iscussionP
aper|
1 2 3 4 5 6 7 8 9 10 11 12Month
[km
3 ]
a) Indus
0
20
40
60
80
100
120
140
b) Ganges[k
m3 ]
1 2 3 4 5 6 7 8 9 10 11 12Month
0
100
200
300
400
500
600
700
c) Brahmaputra
[km
3 ]
1 2 3 4 5 6 7 8 9 10 11 12Month
0
50
100
150
200
250
MERRA ref
2071ndash2100
1979ndash2008
RCP 85RCP 85 meanRCP 26RCP 26 mean
Viste amp SortebergFigure 8
Figure 8 Projected future precipitation in the (a) Indus (b) Ganges and (c) BrahmaputraBasins Gray bars MERRA 1979ndash2008 Thin lines and horizontal marks on the bars show theindividual CMIP5 models and the multi-model mean for 2071ndash2100
489
TCD9 441ndash493 2015
Snowfall in theHimalayas an
uncertain future froma little-known past
E Viste and A Sorteberg
Title Page
Abstract Introduction
Conclusions References
Tables Figures
J I
J I
Back Close
Full Screen Esc
Printer-friendly Version
Interactive Discussion
Discussion
Paper
|D
iscussionP
aper|
Discussion
Paper
|D
iscussionP
aper|
1 2 3 4 5 6 7 8 9 10 11 120
5
10
15
20
25
30
35
Month
SWE
[km
3 ]
a) Indus
0
1
2
3
4
5
6
7
8
b) Ganges
SWE
[km
3 ]
1 2 3 4 5 6 7 8 9 10 11 12Month
0
2
4
6
8
10
12
14
16
18
20
c) Brahmaputra
SWE
[km
3 ]
1 2 3 4 5 6 7 8 9 10 11 12Month
MERRA ref
2071ndash2100
1979ndash2008
RCP 85RCP 85 meanRCP 26RCP 26 mean
Viste amp SortebergFigure 9
Figure 9 Projected future snowfall in the (a) Indus (b) Ganges and (c) Brahmaputra Basinswith reference to MERRA reference snowfall Gray bars MERRA reference snowfall for 1979ndash2008 Thin lines and horizontal marks on the bars show the individual CMIP5 models andthe multi-model mean for 2071ndash2100 based on changes in temperature and precipitation asdescribed in Sect 23
490
TCD9 441ndash493 2015
Snowfall in theHimalayas an
uncertain future froma little-known past
E Viste and A Sorteberg
Title Page
Abstract Introduction
Conclusions References
Tables Figures
J I
J I
Back Close
Full Screen Esc
Printer-friendly Version
Interactive Discussion
Discussion
Paper
|D
iscussionP
aper|
Discussion
Paper
|D
iscussionP
aper|
Figure 10 Projected future changes in snowfall in sub-basins of the Indus Ganges andBrahmaputra Basins (a) Absolute change [km3] with reference to MERRA reference snow-fall (b) Absolute change [km3] with reference to APHRODITE snowfall (c d) Correspondingrelative changes [] with reference to MERRA and APHRODITE
491
TCD9 441ndash493 2015
Snowfall in theHimalayas an
uncertain future froma little-known past
E Viste and A Sorteberg
Title Page
Abstract Introduction
Conclusions References
Tables Figures
J I
J I
Back Close
Full Screen Esc
Printer-friendly Version
Interactive Discussion
Discussion
Paper
|D
iscussionP
aper|
Discussion
Paper
|D
iscussionP
aper|
J F M A M J J A S O N DMonth
0
5
10
15
20 km3Precip
0
2
4
6
8
10 km3SWE
2000
3000
4000
5000
6000 masl
1845
J F
M
A
M
JJ A
S
O
N
D
RSL
I4A = 146793 km2
1 km 3 = 68 mm
0
05
1
15 SWE rel
8000 m
0
J F M A M J J A S O N DMonth
0
2
4
6
8
10
12 km3 SWE
3000
4000
5000
6000 masl
78
2
14
J FM
A
MJ
J AS
O
ND
RSL
I5
Precip
0
5
10
15
20
25 km3
0
05
1
15 SWE rel
8000 m
0
A = 178669 km2
1 km 3 = 56 mm
CMIP52071ndash2100mean
Today
MERRA APHRODITE
Individual models
CMIP52071ndash2100mean
MERRA APHRODITE
Individual models
CMIP52071ndash2100Precip mean
MERRA APHRODITE
Individual models
SWE todayPrecip today
2000 mTerrain distribution of area between levels
CMIP52071ndash2100
TodayMERRA
APHRODITE
a)
i)
ii)
iii)
iv)
b)
Viste amp SortebergFigure 11
Figure 11 Monthly CMIP5 RCP 85 change in snowfall precipitation and rainsnow line eleva-tion in the upper Indus clusters (a) 4 and (b) 5 from 1971ndash2000 to 2071ndash2100 with referenceto the MERRA reference (red) and APHRODITE (blue) CMIP5 multi-model means are shownas horizontal marks individual models as dots Cluster location and terrain profile are shownabove the graphs (i) Fractional change in snowfall (ii) Future snowfall [km3] (dots) comparedto today (bars) (iii) Future precipitation [km3] (dots) compared to today (bars) Snowfall todayis shown as darker part of bars (iv) Rainsnow line elevation [m asl] Gray background el-evation histogram with the of total ground area lying in the marked 2000 m intervals Barschange from today (bottom) to CMIP5 multi-model mean (top)
492
TCD9 441ndash493 2015
Snowfall in theHimalayas an
uncertain future froma little-known past
E Viste and A Sorteberg
Title Page
Abstract Introduction
Conclusions References
Tables Figures
J I
J I
Back Close
Full Screen Esc
Printer-friendly Version
Interactive Discussion
Discussion
Paper
|D
iscussionP
aper|
Discussion
Paper
|D
iscussionP
aper|
3000
4000
5000
6000 masl
0
2
4
6
8
10 km3
0
10
20
30
40
50
60 km3
0
05
1
15
J F M A M J J A S O N DMonth
J FM
A
M
JJ A
S
O
ND
Precip
SWE
RSL
SWE rel
53
B3
8000 m
0
A = 139611 km2
1 km 3 = 72 mm
4500
5000
5500
6000
6500 masl
0
1
2
3
4 km3
0
10
20
30
40
50 km3
0
05
1
15 SWE rel
SWE
RSL
Precip
95
J F M A M J J A S O N DMonth
J FM
A
M
JJ A
S
ON
D
B4
8000 m
0
A = 159165 km2
1 km 3 = 63 mm
CMIP52071ndash2100mean
Today
MERRA APHRODITE
Individual models
CMIP52071ndash2100mean
MERRA APHRODITE
Individual models
CMIP52071ndash2100Precip mean
MERRA APHRODITE
Individual models
SWE todayPrecip today
2000 mTerrain distribution of area between levels
CMIP52071ndash2100
TodayMERRA
APHRODITE
a)
i)
ii)
iii)
iv)
b)
Viste amp SortebergFigure 12
Figure 12 Monthly CMIP5 RCP 85 change in snowfall precipitation and rainsnow line ele-vation in the upper Brahmaputra clusters (a) 4 and (b) 3 See Fig 11 for a description of thecontent
493
- Introduction
-
- Observed trends in snowfall temperature and precipitation
- Future projections of snowfall temperature and precipitation
- Aims and scope
-
- Data and methods
-
- Reference present-day snowfall
- Bias-corrected present-day snowfall
- Projected snowfall
- The rain-snow line
-
- Present-day snowfall
-
- Seasonal cycles of precipitation and snowfall
- Comparison of snowfall estimates
-
- Projected future snowfall
-
- Basin-scale projections
- Regional projections
-
- Upper Indus western part
- Upper Indus eastern part
- Upper Brahmaputra western part
- Upper Brahmaputra eastern part
-
- Potential effects of reduced snowfall on water availability
-
- Concluding summary
-
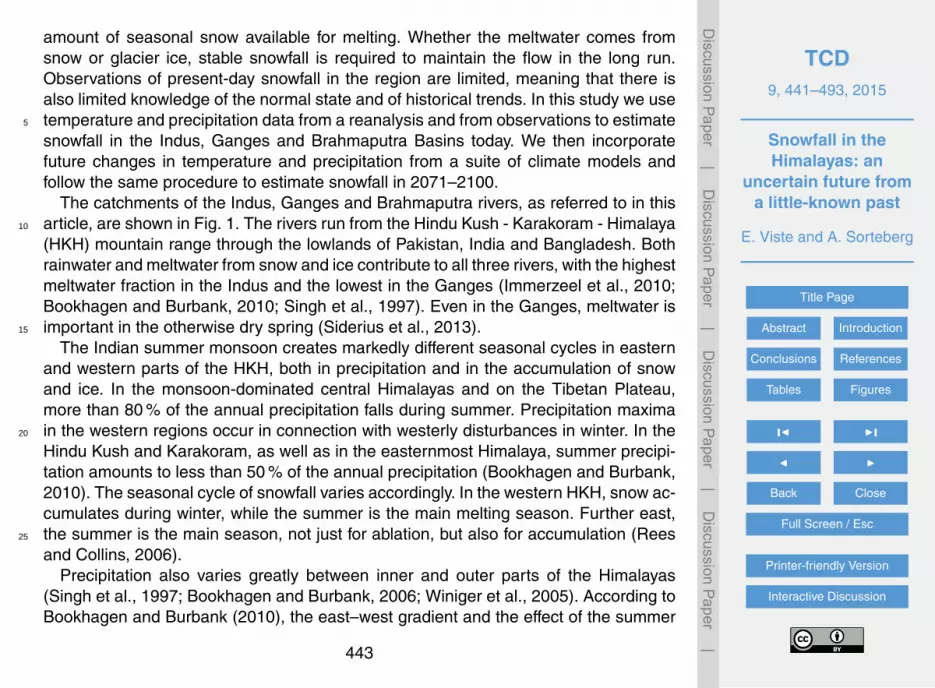
TCD9 441ndash493 2015
Snowfall in theHimalayas an
uncertain future froma little-known past
E Viste and A Sorteberg
Title Page
Abstract Introduction
Conclusions References
Tables Figures
J I
J I
Back Close
Full Screen Esc
Printer-friendly Version
Interactive Discussion
Discussion
Paper
|D
iscussionP
aper|
Discussion
Paper
|D
iscussionP
aper|
tra as a whole for 1901ndash2002 For the same period Guhathakurta and Rajeevan (2008)found no significant precipitation trends relevant to snowfall in eastern parts of Indiaand neither did Shrestha et al (2000) for stations in Nepal in the shorter period 1959ndash1994
More studies of snow and ice have been performed for the Indus Basin than for the5
Ganges and Brahmaputra possibly because meltwater constitutes a larger fraction ofthe run-off in this basin (Bookhagen and Burbank 2010 Immerzeel et al 2010) Alsoas large parts of the Indus get little rain in late spring and summer the link betweenmelting snow and river discharge is perhaps more intuitive than in the regions furthereast where the top of the meltwater season coincides with the Indian summer mon-10
soon rain (Rees and Collins 2006) No consistent precipitation trends have been foundfor the mountain regions of the Indus Basin as a whole and epochs of more and lessprecipitation have alternated (Sontakke et al 2008 Bhutiyani et al 2010)
Some of the recent interest may also have been sparked by Karakoram glaciergrowth After decades of recession Karakoram glaciers were seen to expand in the15
late 1990s (Scherler et al 2011 Gardelle et al 2012 Hewitt 2005) An observedcombination of increased winter precipitation and decreased summer temperatureshave been suggested to be the cause (Archer and Fowler 2004 Fowler and Archer2006) and reduced summer discharge in rivers coming from the Karakoram is in accor-dance with the observed glacier growth (Fowler and Archer 2006 Sharif et al 2013)20
In contrast Hartmann and Andresky (2013) found only insignificant negative trends inKarakoram precipitation during 1986ndash2010 and Cook et al (2013) reported increaseddischarge in the Upper Indus after 1998 As pointed out by Hewitt (2005) and sup-ported by Kaumlaumlb et al (2012) the glacier growth applies only to higher elevations in thecentral Karakoram while glaciers in other parts and at intermediate elevations have25
continued to decline Increased transport of moisture to higher altitudes may be part ofthe explanation (Hewitt 2005)
Comparing the Karakoram with three other mountain ranges in the western Hi-malayas during 1984ndash2008 Shekhar et al (2010) found that snowfall had been re-
445
TCD9 441ndash493 2015
Snowfall in theHimalayas an
uncertain future froma little-known past
E Viste and A Sorteberg
Title Page
Abstract Introduction
Conclusions References
Tables Figures
J I
J I
Back Close
Full Screen Esc
Printer-friendly Version
Interactive Discussion
Discussion
Paper
|D
iscussionP
aper|
Discussion
Paper
|D
iscussionP
aper|
duced in all the ranges though less in the innermost Karakoram than in the outerranges As opposed to temperature increases in the other ranges the Karakoramrange experienced decreasing temperatures The reduction in snowfall on the outsideof the outermost range Pir Panjal during the last decades was supported by Bhutiyaniet al (2010) who found that the duration of the snowfall season had been reduced by5
about 5ndash6 days per decadeDocumented trends in other parts of the Indus basin vary and alternating epochs
indicate that the choice of time period may influence the results In Jammu and Kash-mir and Himachal Pradesh Bhutiyani et al (2010) found a significant decreasing trendin summer precipitation during the 20th century There was no trend in winter precip-10
itation at the three stations used but epochs of dry and wet winters had alternatedand winter precipitation was above average in 1991ndash2006 Previously a long-term in-crease in summer and annual precipitation in Jammu and Kashmir was documentedby Guhathakurta and Rajeevan (2008) and in Himachal Pradesh by Singh et al (2008)Sontakke et al (2008) on the other hand found no trends in this part of India since the15
19th century but noted a dry epoch since 1968 It should be pointed out that their dataset contained stations in the outer ranges only and not in eg the Karakoram
Further west in the Upper Indus Basin at stations mainly in Pakistan (Archer andFowler 2004) observed no trends in precipitation over the 20th century but a signifi-cant increase in winter summer and annual precipitation at several stations starting in20
1961 The increase was accompanied by increasing winter temperatures but decreas-ing summer temperatures (Fowler and Archer 2006) Hartmann and Andresky (2013)found significant positive trends in precipitation in the Hindu Kush and the Sulaimanmountains for 1986ndash2010
Satellite-based studies of trends in the present century (2000ndash20082001ndash2007)25
have documented a decrease in winter snow cover area in the Upper Indus (Immerzeelet al 2009) but an increase in the Indus water volume stored in snow and ice (Im-merzeel et al 2010)
446
TCD9 441ndash493 2015
Snowfall in theHimalayas an
uncertain future froma little-known past
E Viste and A Sorteberg
Title Page
Abstract Introduction
Conclusions References
Tables Figures
J I
J I
Back Close
Full Screen Esc
Printer-friendly Version
Interactive Discussion
Discussion
Paper
|D
iscussionP
aper|
Discussion
Paper
|D
iscussionP
aper|
12 Future projections of snowfall temperature and precipitation
In the last decades of the 21th century the temperature over India is projected to be onaverage 20ndash48 C higher than today depending on the anthropogenic forcing scenario(Chaturvedi et al 2012) In the Himalayas a temperature increase of more than 7 C isseen with the strongest forcing the Representative Concentration Pathway (RCP) 855
(Chaturvedi et al 2012 Collins et al 2013) Independently of precipitation changeshigher temperatures will decrease the fraction of precipitation falling as snow Whethersnowfall will increase or decrease thus depends on whether precipitation will increaseenough to compensate for the reduced snow fraction
Climate models from CMIP5 the most recent Coupled Model Inter-comparison10
Project (Taylor et al 2011) project a general increase in precipitation over India grow-ing with anthropogenic forcing and with time both annually (Chaturvedi et al 2012)and during the summer monsoon (Menon et al 2013) An increase was also seenin data from the previous model comparison project CMIP3 (Turner and Annamalai2012) Menon et al (2013) found that changes in the low-level winds suggest a north-15
ward shift in the monsoon by the end of the 21st century for the strongest forcingscenario although the total zonal strength of the monsoon remained fairly constant
It should be emphasized that there is a large inter-model spread in precipitation pro-jections and the IPCC AR5 concludes that there is medium confidence in the increasein summer monsoon precipitation over South Asia (Christensen et al 2013) But al-20
though precipitation projections are less reliable than temperature projections agree-ment between models increases with time and anthropogenic forcing (Chaturvedi et al2012) Also the CMIP5 multi-model mean has been considered to represent the mon-soon and the actual climate in India better than any individual model (Chaturvedi et al2012 Sperber et al 2013)25
The IPCC AR5 has high confidence that the snow cover area in the Northern Hemi-sphere will be substantially reduced with anthropogenic forcing as in the strongestscenarios (Collins et al 2013) For the range of RCPs 26ndash85 CMIP5 models sim-
447
TCD9 441ndash493 2015
Snowfall in theHimalayas an
uncertain future froma little-known past
E Viste and A Sorteberg
Title Page
Abstract Introduction
Conclusions References
Tables Figures
J I
J I
Back Close
Full Screen Esc
Printer-friendly Version
Interactive Discussion
Discussion
Paper
|D
iscussionP
aper|
Discussion
Paper
|D
iscussionP
aper|
ulate 7ndash25 reductions in the spring snow cover extent by 2080ndash2100 For snowfalland snow water equivalents (SWE) the projections show more variation While warm-ing decreases the amount of snow both through melting and through decreasing thesnow fraction more precipitation may increase snowfall in some of the coldest regions(Raumlisaumlnen 2008 Brutel-Vuilmet et al 2013) Though shown to apply mainly to the5
northern parts of Eurasia and North America there is a possibility that some of thehigher-lying terrain in the HKH may be similarly affected
13 Aims and scope
For the HKH uncertainty in projections of future precipitation and snowfall comes ontop of uncertainty in present time conditions Observations are limited especially in re-10
mote high-elevation regions (Anders et al 2006 Immerzeel 2008 Tahir et al 2011bWiniger et al 2005) Insufficient knowledge of the amount of snow falling over the re-gion today makes the contribution to both seasonal snowmelt and storage in glacierscorrespondingly uncertain
Recognizing this uncertainty this study provides an ensemble of monthly mean15
snowfall estimates for all sub-basins of the Indus Ganges and Brahmaputra todayand for 2071ndash2100 For the present time estimates we have combined MERRA re-analysis data (Rienecker et al 2011) with observationally based data sets of precip-itation and temperature CRU TS (Harris et al 2014) TRMM (Huffman et al 2007)and APHRODITE (Yatagai et al 2012 Yasutomi et al 2011) Whereas Meacuteneacutegoz20
et al (2013) and Wiltshire (2014) analyzed Himalayan snowfall by downscaling reanal-ysis data with regional climate models we have applied a simple terrain adjustment ofthe reanalysis temperature field
The ensemble of present-day estimates is presented in Sect 3 Future snowfall wasthen calculated based on the present-day snowfall and projected changes in temper-25
ature and precipitation in 14 and 15 CMIP5 models for the RCPs 26 and 85 re-spectively These results are presented in Sect 4 The data and methods for both thepresent time and the future case are described in Sect 2
448
TCD9 441ndash493 2015
Snowfall in theHimalayas an
uncertain future froma little-known past
E Viste and A Sorteberg
Title Page
Abstract Introduction
Conclusions References
Tables Figures
J I
J I
Back Close
Full Screen Esc
Printer-friendly Version
Interactive Discussion
Discussion
Paper
|D
iscussionP
aper|
Discussion
Paper
|D
iscussionP
aper|
Three main features may be involved in precipitation changes in the HKH changesin the summer monsoon changes in western disturbances during winter and the gen-eral changes that occur in the thermodynamic properties of the air as the temperatureincreases and the air contains more water vapor We have not considered the role ofthe different factors only looked at how changes in temperature and precipitation af-5
fect snowfall Unless otherwise specified any reference to snow refers to precipitationfalling as snow not to the snow cover on the ground
2 Data and methods
In addition to the original MERRA reanalysis snowfall we estimated snowfall usingdifferent combinations of temperature and precipitation data An overview of the com-10
binations is shown in Table 1 and the data sets used presented in Tables 2 and 3Present-day snowfall estimates were based on
1 MERRA 2 m temperature adjusted to a higher-resolution elevation grid andMERRA precipitation (Sect 21) This was used as a basis for the other estimatesand is referred to as MERRA reference snowfall The adjusted temperature is15
referred to as terrain-adjusted
2 MERRA 2 m temperature and precipitation
3 The MERRA data in (1) bias-corrected with observation-based data for tempera-ture and precipitation (Sect 22)
Estimates for the last decades of the 21th century were based on20
4 The MERRA data in (1) plus the changes in temperature and precipitation ina group of CMIP5 models over the coming century (Sect 23)
5 Bias-corrections with one of the data sets in (3) ndash APHRODITE ndash plus the meanchanges in temperature and precipitation in the CMIP5 models used in (4) Thiswas done to account for the spread in the present-day estimates25
449
TCD9 441ndash493 2015
Snowfall in theHimalayas an
uncertain future froma little-known past
E Viste and A Sorteberg
Title Page
Abstract Introduction
Conclusions References
Tables Figures
J I
J I
Back Close
Full Screen Esc
Printer-friendly Version
Interactive Discussion
Discussion
Paper
|D
iscussionP
aper|
Discussion
Paper
|D
iscussionP
aper|
With the exception of original MERRA snowfall data all snowfall estimates werebased on the relationship between temperature and snowfall derived by Dai (2008)Based on observations the conditional snow frequency over land was formulated as
F (Ts) = a[
tanh(b(Ts minusc)
)minusd]
(1)
where Ts is the surface air temperature [C] and a = minus482292b = 07205c = 116625
and d = 10223 This may be interpreted as the probability or fraction of precipitationfalling as snow at a given temperature We calculated hourly snowfall as the productof F and the amount of precipitation Cut-offs for no rain and no snow were set at minus10and 10 C respectively as this was the range of the data used by Dai (2008)
All snowfall estimates were made for the sub-basins defined in the HydroSHEDS10
data set (Lehner et al 2008) The results were then aggregated for the Indus Gangesand Brahmaputra Basins
Within each major basin we also grouped the sub-basins into regions with simi-lar characteristics of snow and precipitation This was done with k-means clustering(MacQueen 1967) using the square Euclidean distance as the distance measure15
The seasonal cycles of precipitation snow and snow fraction were first clustered sep-arately with the MERRA reference data and data bias-corrected with CRU TS data asinput We then adjusted the clusters manually prioritizing similarity of the relative sea-sonal cycles of snow and snow fraction and checking that both data sets gave similarresults Five groups were defined for the Indus and four for each of the other basins20
This included a no-snow group in each basin
21 Reference present-day snowfall
The horizontal resolution of the MERRA reanalysis data in the Himalayas is about55 km latitude and 70 km longitude To account for smaller-scale temperature variationsin the rugged terrain we used the vertical temperature gradient in MERRA to adjust25
the ground temperature to the GLOBE topography (Hastings and Dunbar 1998) The450
TCD9 441ndash493 2015
Snowfall in theHimalayas an
uncertain future froma little-known past
E Viste and A Sorteberg
Title Page
Abstract Introduction
Conclusions References
Tables Figures
J I
J I
Back Close
Full Screen Esc
Printer-friendly Version
Interactive Discussion
Discussion
Paper
|D
iscussionP
aper|
Discussion
Paper
|D
iscussionP
aper|
elevation-adjusted ground temperature was calculated as
Tadj = T0 minusT2 minus T1
z2 minus z1(zmerra 0 minus zglobe) (2)
where T0 is the MERRA 2 m temperature T1 is the temperature at the lowest pressurelevel above the ground T2 the temperature at the next level and z2 and z1 the height ofthese levels zmerra0 and zglobe is the elevation of the MERRA and GLOBE topography5
respectively To reduce calculation time compared to using the original 1 km GLOBEresolution both MERRA and GLOBE data were interpolated to a 4 km grid Snowfallwas calculated for each grid-point and then aggregated for each sub-basin for eachmonth
Snowfall based on elevation-adjusted MERRA temperature and MERRA precipita-10
tion is used as a reference throughout this article This is because the elevation-adjusted temperature and the 4 km grid was used as the starting-point in all subse-quent calculations It does not mean that we consider this snowfall to be closer to thetruth than any of the other estimates
22 Bias-corrected present-day snowfall15
A second group of present-day snowfall estimates was made from MERRA precipi-tation and elevation-adjusted temperature bias-corrected with observationally baseddata sets APHRODITE daily temperature and precipitation for 1979ndash2007 CRU TSmonthly temperature and precipitation for 1979ndash2011 and TRMM 3B42 3 hourly pre-cipitation for 1998ndash2012 Bias-corrections were performed on daily or monthly scales20
depending on the input data and the result distributed over the hourly time-steps ofthe MERRA temperature and precipitation As a result the diurnal cycle in MERRA ismaintained in all estimates Snowfall was then calculated following the same procedureas for the MERRA reference snowfall (Sect 21) When referring to APHRODITE snowor CRU snow anywhere in this article this is the snowfall calculated using MERRA25
precipitation and temperature both bias-corrected with these data sets451
TCD9 441ndash493 2015
Snowfall in theHimalayas an
uncertain future froma little-known past
E Viste and A Sorteberg
Title Page
Abstract Introduction
Conclusions References
Tables Figures
J I
J I
Back Close
Full Screen Esc
Printer-friendly Version
Interactive Discussion
Discussion
Paper
|D
iscussionP
aper|
Discussion
Paper
|D
iscussionP
aper|
Temperature data are generally assumed to be normally distributed and as de-scribed in Teutschbein and Seibert (2012) and references therein the data can bebias-corrected through a Gaussian distribution mapping We thus bias-corrected theelevation-adjusted MERRA temperature with the observationally based APHRODITEV1204 daily temperature by mapping the distribution of the MERRA data to the Gaus-5
sian distribution of the observationsAs the CRU TS 320 includes monthly mean daily minimum and maximum temper-
atures the method described by (Wang and Zeng 2013) was used Bias-correcteddaily maximum temperatures were defined as
Td max = Tmerra d max minus(Tmerra mn max minus Tcru mn max
) (3)10
d denotes daily and mn monthly Daily minimum temperatures were then corrected byadjusting the diurnal range
Td min = Td max minus∆Tmerra d middot∆Tcru mn
∆Tmerra mn (4)
where ∆T represents the diurnal and monthly temperature rangeThe distribution mapping procedure described by Ines and Hansen (2006) was used15
to bias-correct MERRA precipitation with APHRODITE V1101R2 daily precipitation anddaily accumulated TRMM 3B42 3 hourly precipitation This is a two-step procedureinvolving frequency and intensity adjustments We defined precipitation days as dayswith at least 01 mm in the observations The frequency was first adjusted by settingthe number of precipitation days in MERRA equal to that of the observations This was20
done by removing the lowest daily values The intensity was then adjusted by fitting theremaining days to the gamma distribution of the observations
Bias-corrections with CRU TS 320 monthly precipitation were done with a simplecorrection factor to adjust the monthly MERRA total to that of CRU (eg Ines andHansen 2006)25
452
TCD9 441ndash493 2015
Snowfall in theHimalayas an
uncertain future froma little-known past
E Viste and A Sorteberg
Title Page
Abstract Introduction
Conclusions References
Tables Figures
J I
J I
Back Close
Full Screen Esc
Printer-friendly Version
Interactive Discussion
Discussion
Paper
|D
iscussionP
aper|
Discussion
Paper
|D
iscussionP
aper|
23 Projected snowfall
The MERRA reanalysis was also the basis for estimates of future snowfall Thechanges in temperature and precipitation from 1971ndash2000 to 2071ndash2100 were addedto the reanalysis data and snowfall calculated following the same procedure as for thepresent time Climate change input came from models that were part of the Coupled5
Model Inter-comparison Project 5 (CMIP5 Taylor et al 2011) for the RepresentativeConcentration Pathways (RCP) 26 and 85 (Moss et al 2010 van Vuuren et al 2011)The models used are listed in Table 3
Due to the different spatial resolution of the models changes were defined asmonthly mean changes on the sub-basin level For temperature the absolute change10
was used and for precipitation the fractional change Future projected snowfall wascalculated with reference to elevation-adjusted MERRA snowfall for each model Dueto large deviations in estimates of present-day snowfall (Sect 3) we also calculatedsnowfall for the CMIP5 multi-model mean changes with reference to the lowest presenttime estimate APHRODITE snowfall15
24 The rain-snow line
Not all temperature changes affect snowfall We defined the rain-snow line as the el-evation where the temperature suggests a shift from rain to snow Technically thisis a conditional rain-snow line as no precipitation was required For every hour allgrid cells that had a snow fractionprobability between 025 and 075 corresponding20
to a temperature between 09 and 13 C were identified The monthly rain-snow linewas then set as the mean elevation of these grid cells and time steps For present-dayconditions this was done for elevation-adjusted MERRA temperature and temperaturebias-corrected with APHRODITE Projected temperature changes in the CMIP5 RCP85 were then added to these temperatures and the procedure repeated25
453
TCD9 441ndash493 2015
Snowfall in theHimalayas an
uncertain future froma little-known past
E Viste and A Sorteberg
Title Page
Abstract Introduction
Conclusions References
Tables Figures
J I
J I
Back Close
Full Screen Esc
Printer-friendly Version
Interactive Discussion
Discussion
Paper
|D
iscussionP
aper|
Discussion
Paper
|D
iscussionP
aper|
3 Present-day snowfall
31 Seasonal cycles of precipitation and snowfall
Figure 2 gives an overview of the seasonal cycle of rain and snow in different parts ofthe HKH based on MERRA precipitation and MERRA reference snowfall (Sect 21)The upper Indus basin gets more snow than rain in other sub-basins of the Indus5
Ganges and Brahmaputra rainfall dominates This difference is caused by different pre-cipitation cycles Whereas the summer monsoon dominates in the Central Himalayaswinter depressions bring most of the precipitation in the upper Indus ndash at a time whenlow temperatures mean that precipitation falls as snow in larger areas than it wouldin summer Although snow fractions are lower in the upper Brahmaputra monsoon10
precipitation produces a substantial amount of summer snow at high elevationsIn the northwesternmost cluster in the Indus I4 March is the wettest month and also
the month with the highest total amount of snowfall Precipitation has a second peakduring July and August but the temperature is then too high to allow much snowfallFurther east in cluster I5 more terrain at higher elevations cause higher snow fractions15
during summer but winter and spring is still the dominant snow season The summerpeak in precipitation in this cluster is caused by the two eastern sub-basins There islittle summer precipitation in the west
In Brahmaputrarsquos cluster B4 and Gangesrsquo G4 maximum snowfall occurs during thesummer monsoon Higher temperatures during summer means that the snow fraction20
is lower than in winter but as there is much more summer precipitation the amount ofsnow is also higher Rare occurrences of precipitation during the cold winter togetherwith the combination of snowfall and snowmelt during summer makes the seasonalcycle of snow depth in the Central Himalayas unpronounced (Meacuteneacutegoz et al 2013)In the upper-level basins in Brahmaputrarsquos B3 the summer is also the main precipi-25
tation season but the peak is less sharp than further west As a result snowfall is ata maximum in MarchndashApril
454
TCD9 441ndash493 2015
Snowfall in theHimalayas an
uncertain future froma little-known past
E Viste and A Sorteberg
Title Page
Abstract Introduction
Conclusions References
Tables Figures
J I
J I
Back Close
Full Screen Esc
Printer-friendly Version
Interactive Discussion
Discussion
Paper
|D
iscussionP
aper|
Discussion
Paper
|D
iscussionP
aper|
32 Comparison of snowfall estimates
The MERRA reference snowfall described in Sect 31 differs greatly from snowfallbased on bias-corrected temperature and precipitation Large differences betweentemperature and data sets for the HKH cause corresponding deviations in snowfall ndashnot only between MERRA-based estimates and bias-corrected data but between esti-5
mates based on bias-corrections with different data sets This can be seen from Table 4which displays annual snowfall estimates for combinations of the bias-corrections de-scribed in Sect 22 aggregated to the major basins Data for the individual sub-basinsare included as Supplement
With the exception of snowfall based on MERRA precipitation and MERRA temper-10
ature bias-corrected with CRU TS in the Ganges basin all estimates based on bias-corrected data are lower than the MERRA reference snowfall The lowest estimates arethose based on bias-corrections with APHRODITE precipitation and temperature Thiscombination produced only 33 of the reference snowfall in the Indus Basin 22 inthe Ganges Basins and 17 in the Brahmaputra Basin While the difference is large in15
all sub-basins that have snow today it is especially large in the upper parts of the Indusand Brahmaputra Basins (Fig 3) In comparison bias-corrections with CRU TS tem-perature and precipitation produce 54 of the reference snowfall in the Indus 75 inthe Ganges and 42 in the Brahmaputra ndash factors of 2ndash4 compared to APHRODITEIt should be noted that as the time periods covered by the data sets are not equal20
the results are not strictly comparable but tests using different MERRA periods (notshown) indicate that there would be no major difference in the monthly means
The large difference between MERRA reference snowfall and snowfall based onbias-corrected data results from differences in both temperature and precipitation butdifferences in the precipitation pattern have the greatest effect Estimates where only25
the precipitation has been bias-corrected are lower than those where only the tempera-ture has been bias-corrected (Table 4) This is not solely an effect of more precipitationin MERRA than in the observation-based data although MERRA is wetter than all the
455
TCD9 441ndash493 2015
Snowfall in theHimalayas an
uncertain future froma little-known past
E Viste and A Sorteberg
Title Page
Abstract Introduction
Conclusions References
Tables Figures
J I
J I
Back Close
Full Screen Esc
Printer-friendly Version
Interactive Discussion
Discussion
Paper
|D
iscussionP
aper|
Discussion
Paper
|D
iscussionP
aper|
data sets in the Indus and for APHRODITE also in the Ganges and the Brahmapu-tra An inland and upward shift in the MERRA precipitation adds to the differencesAs shown in Fig 4 all the observation-based precipitation data sets are wetter thanMERRA in most of the lowlands and in the foothills of the HKH but drier in the higher-elevation regions further inland In MERRA the precipitation belt is shifted higher up5
in the Himalayas where temperatures are lower and more of the precipitation falls assnow
In addition HKH temperatures are lower in MERRA than in APHRODITE and inthe upper Indus also than in CRU TS (Fig 5) The lower temperatures in MERRAcause higher snow fractions further increasing the difference between the MERRA ref-10
erence snowfall and APHRODITE snowfall Oppositely CRU TS is colder than MERRAthroughout the Ganges leading to higher snowfall estimates when bias-correctingMERRA temperatures with CRU TS (Table 4)
We do not see any reason to consider any of the observation-based data sets northe reanalysis the ground truth The reanalysis has the benefit of being physically15
consistent though precipitation is a pure model product In the other data sets thenumber of observations vary greatly within the region
The lack of observations in the HKH has been pointed out in many studies Mostmeteorological stations are located in the valleys and do not necessarily representweather conditions in higher terrain As demonstrated by Palazzi et al (2013) station-20
based data sets like APHRODITE and CRU TS are merely mathematical interpolationsin major parts of the HKH and on the Tibetan Plateau Immerzeel (2008) showed thatthe number of observations going into version 21 of the CRU data set in the Himalayanregion varies greatly A drop in the mid-1990s suggests that caution should be takenwhen interpreting data at later times Maps (not shown) of station coverage in version25
320 used in this study show that this problem persistsThe fact that more of the precipitation falls as snow at higher elevations may in it-
self lead to an under-estimation of precipitation in the mountains In addition to thelack of observations in high terrain gauges tend to capture snow less easily than rain
456
TCD9 441ndash493 2015
Snowfall in theHimalayas an
uncertain future froma little-known past
E Viste and A Sorteberg
Title Page
Abstract Introduction
Conclusions References
Tables Figures
J I
J I
Back Close
Full Screen Esc
Printer-friendly Version
Interactive Discussion
Discussion
Paper
|D
iscussionP
aper|
Discussion
Paper
|D
iscussionP
aper|
leading to a possible under-registration of precipitation at the few high-elevation sta-tions that exist Comparing stations along a vertical profile in the Karakoram Winigeret al (2005) found that precipitation multiplied by a factor of 5ndash10 from 2500 masl to5000ndash6000 masl This maximum is much higher than reported in most other studiesand they attributed this to the valley-dominance of stations normally used5
Indications of too little precipitation at higher elevations were also given by Tahiret al (2011b) as APHRODITE precipitation was too low to account for the observeddischarge in the Hunza river in the Karakoram Anders et al (2006) reported thatTRMM radar data underestimated precipitation at higher elevations in the Himalayasdue to the low ability of the radar to detect very low precipitation and lowndashmoderated10
snowfall rates On the other hand Krakauer et al (2013) found that both TRMM andAPHRODITE had too much precipitation compared to observations from the few exist-ing stations at elevations above 3000 masl in Nepal
Satellite data are a promising future alternative for measuring snowfall but presentlyof limited use MODIS and LANDSAT satellite data have been used in several studies15
of snow and ice in the Himalayas (Tahir et al 2011a b Bookhagen and Burbank2010 Hewitt 2005 Krishna 2005 Negi et al 2009 Jain et al 2009 Butt 2012 Gaoet al 2012 Kulkarni et al 2010 Immerzeel et al 2009) but these data contain onlysnow cover area with no measure of the snow thickness or snow water equivalentsThe NASA AMSR-E SWE data set distributed by the National Snow and Ice Data20
Center could have been used but correlations between AMSR-E SWE and groundobservations have been shown to be poor (Tedesco and Narvekar 2010 Byun andChoi 2014 Kumar et al 2006) As AMSR-E SWE has been found underestimatesnow depth we concluded that incorporating these data into our ensemble would notlikely constrain the results nor add new information25
Defining snowfall based on MERRA precipitation and elevation-adjusted tempera-ture as a reference was done mainly to have a single reference when comparing thedata sets against each other Also we believe the elevation-adjustment of temperaturerepresents an enhancement compared to the original MERRA reanalysis MERRA was
457
TCD9 441ndash493 2015
Snowfall in theHimalayas an
uncertain future froma little-known past
E Viste and A Sorteberg
Title Page
Abstract Introduction
Conclusions References
Tables Figures
J I
J I
Back Close
Full Screen Esc
Printer-friendly Version
Interactive Discussion
Discussion
Paper
|D
iscussionP
aper|
Discussion
Paper
|D
iscussionP
aper|
chosen mainly because it has an hourly resolution allowing diurnal temperature vari-ations to affect snowfall But even though this estimate is much higher than all thebias-corrected estimates it cannot be discarded It has been argued that reanalysisdata and regional climate models may in some cases be as good as or better thanobservations in the HKH (Wiltshire 2014 Meacuteneacutegoz et al 2013 Akhtar et al 2008)5
Akhtar et al (2008) got better results when modeling river discharge in three upperIndus catchments with an RCM-based hydrological model than with one based on thefew observations available within the region They concluded that it was preferable touse RCM data directly as input to hydrological models in this region
As shown in the small inset maps in Fig 4 MERRA precipitation is higher than ob-10
served precipitation throughout the HKH and the same has previously been shownfor ERA-Interim reanalysis precipitation (Palazzi et al 2013) In MERRA the precipi-tation belt is shifted upward in the terrain compared to in the observation-based datasets Whether this shift is realistic cannot be determined as long as observations fromupper-level terrain are either missing or likely too low15
4 Projected future snowfall
Whether higher temperatures lead to less snowfall depends on whether the tempera-ture changes from below to above freezing and whether this change occurs at a timewhen there is precipitation The maps in Fig 6 illustrate where a temperature increaseis most likely to affect snowfall and snowmelt In the red zones where the monthly20
temperature today is between ndash5 and 0 C the projected temperature increase of 2ndash7 C (Chaturvedi et al 2012 Collins et al 2013 Wiltshire 2014) may be consideredcritical Such a change would change snowfall to rain and also cause a change fromfreezing to melting of snow and ice The pink zones with monthly mean temperaturesof 0ndash5 C would similarly change from a climate where precipitation may often fall as25
snow to one that is snow-free
458
TCD9 441ndash493 2015
Snowfall in theHimalayas an
uncertain future froma little-known past
E Viste and A Sorteberg
Title Page
Abstract Introduction
Conclusions References
Tables Figures
J I
J I
Back Close
Full Screen Esc
Printer-friendly Version
Interactive Discussion
Discussion
Paper
|D
iscussionP
aper|
Discussion
Paper
|D
iscussionP
aper|
In January (Fig 6a) only the lower parts of the Himalayas is affected as most ofthe region would still have temperatures well below the freezing point The small insetmap shows precipitation in the red zone a narrow band along the range Oppositelyin July (Fig 6c) the temperature is already above 5 C in most of the region though athigher elevations along the Himalayan range and in the Karakoram the change can be5
critical The most widespread changes are seen in spring and fall In April and October(Fig 6b d) large areas in the HKH and on the Tibetan Plateau risk a change frombelow to above freezing
Incorporating CMIP5 precipitation changes we find that the projected temperatureincrease has a larger impact so that snowfall will be reduced in the Indus Ganges and10
Brahmaputra Basins by 2071ndash2100 compared to today Details for the major basinsare presented in Sect 41 How much increased temperatures reduce snowfall withina region depends on the location of the rainsnow line today compared to the terraindistribution Results for selected upper-level sub-basins in the Indus and Brahmaputrawill be discussed in that context in Sect 4215
The large deviations in the estimates of present-day snowfall (Sect 3) means thatthere will be correspondingly large deviations in projected values To account for thismost results are shown with reference to the highest and lowest present-day estimatesMERRA reference snowfall and to APHRODITE-based snowfall Future estimates rela-tive to CRU and TRMM are assumed to lie between those of MERRA and APHRODITE20
41 Basin-scale projections
In the Indus Ganges and Brahmaputra Basins the CMIP5 models project a meanincrease in both temperature (Fig 7) and precipitation (Fig 8) in the region by 2071ndash2100 for both RCPs 26 and 85 The RCP 85 multi-model mean change in temper-ature varies through the year with a 49ndash62 C increase in the Indus 36ndash52 C in25
the Ganges and 42ndash60 C in the Brahmaputra The increase is smallest during thesummer months The dip in the summer is also seen though less pronounced with
459
TCD9 441ndash493 2015
Snowfall in theHimalayas an
uncertain future froma little-known past
E Viste and A Sorteberg
Title Page
Abstract Introduction
Conclusions References
Tables Figures
J I
J I
Back Close
Full Screen Esc
Printer-friendly Version
Interactive Discussion
Discussion
Paper
|D
iscussionP
aper|
Discussion
Paper
|D
iscussionP
aper|
the RCP 26 The summer is also the season with the largest absolute increase inprecipitation
Compared to present-day estimates the CMIP5 models project less snowfall in theIndus Ganges and Brahmaputra Basins in the last decades of this century This canbe seen from Fig 9 The projected multi-model mean is lower than today in all calen-5
dar months for both RCPs 26 and 85 With the RCP 26 some models suggest anincrease in some months mainly in winter and spring This is also the case for one ortwo models with the RCP 85 whereas other models indicate that the snowfall in thesame months will be only half of todayrsquos values
In the Ganges Basin (Fig 9b) the seasonal distribution of snowfall today is mainly10
flat with equal amounts of snowfall from January through September Reductions insummer snowfall with the RCP 85 would change the seasonal cycle into a winter-dominated one To a lesser degree this is also the case for RCP 26 As summerprecipitation is projected to increase in all of the Ganges (not shown but consistentwith Menon et al 2013) this indicates that large areas are at elevations where a small15
increase in the summer temperature may cause a shift from snow to rain This is seenas the red band along the upper Ganges in Fig 6c Reductions in summer snowfall arealso large in the Brahmaputra (Fig 9b) whereas in the Indus the largest total changesoccur in MarchndashMay (Fig 9a)
As the MERRA reference snowfall for today is much larger than APHRODITE snow-20
fall (Sect 32) projected absolute changes for 2071ndash2100 are also much largerin MERRA The relative changes are more similar though larger with reference toAPHRODITE Annual snowfall changes for each major basin are presented in Table 5for changes in temperature precipitation or both and with reference to MERRA andAphrodite present-day snowfall Changes at the sub-basin level are shown in Fig 1025
In the Ganges Basin both MERRA- and APHRODITE-based multi-model mean snow-fall is reduced by about 20 with the RCP 26 and 50 with the RCP 85 In theIndus and Brahmaputra Basins the differences between MERRA- and APHRODITE-based changes are larger but not as large as for the absolute values With reference
460
TCD9 441ndash493 2015
Snowfall in theHimalayas an
uncertain future froma little-known past
E Viste and A Sorteberg
Title Page
Abstract Introduction
Conclusions References
Tables Figures
J I
J I
Back Close
Full Screen Esc
Printer-friendly Version
Interactive Discussion
Discussion
Paper
|D
iscussionP
aper|
Discussion
Paper
|D
iscussionP
aper|
to MERRA and APHRODITE respectively the reduction in snowfall in the Indus Basinis 30 and 50 with the RCP 85 The corresponding reductions in the BrahmaputraBasin are 50 and 70
The projected changes in temperature have greater effect on snowfall than thechanges in precipitation When taking into account only changes in precipitation all5
snowfall estimates are positive (∆P Table 5) This indicates that the mean annual to-tal reduction for each major basin is governed by the temperature change In someCMIP5 models (values in brackets in Table 5) the effect of precipitation changes (∆P )on snowfall are of the same magnitude as the effect of temperature changes (∆T ) butfor the CMIP5 multi-model mean temperature changes cause snowfall changes 4ndash1010
times as large as those due to changes in precipitation This is with reference to thepresent-day MERRA reference snowfall and for both RCPs 26 and 85 With referenceto APHRODITE snowfall the effect of temperature changes compared to precipitationchanges is even greater
42 Regional projections15
If temperatures are far below freezing everywhere warming may have little effect onsnowfall The same applies if only the highest peaks receive snow today The largestreduction in snowfall in a basin occurs if todayrsquos rainsnow line is at an elevation justbelow the dominant elevation of the basin Then large regions will see a shift fromsnow to rain20
In the Indus Basin the largest relative snowfall reduction by 2071ndash2100 is seen inthe southwestern sub-basins where snowfall is limited today (Fig 10) The largest totalreduction is seen in the snow-rich sub-basins of KabulSwatAlingar in the west and inthe east and a smaller reduction in the inner-most basins of GilgitHunza Indus 1 andNubraShyok Together with the upper regions of the Brahmaputra these sub-basins25
clusters I4 I5 B3 and B4 in Fig 2 were selected for a closer analysis In addition tohaving the most snow these clusters are the most homogeneous when considering
461
TCD9 441ndash493 2015
Snowfall in theHimalayas an
uncertain future froma little-known past
E Viste and A Sorteberg
Title Page
Abstract Introduction
Conclusions References
Tables Figures
J I
J I
Back Close
Full Screen Esc
Printer-friendly Version
Interactive Discussion
Discussion
Paper
|D
iscussionP
aper|
Discussion
Paper
|D
iscussionP
aper|
the seasonal cycle of snowfall and snow fraction The values presented in this sectionare all from the RCP 85 for changes from today to 2071ndash2100
421 Upper Indus western part
Cluster 4 consists of the sub-basins Astor KabulSwatAlingar and Krishen GangaAs seen from the elevation profile at the top of Fig 11a the elevation span is large5
and there is an almost equal proportion of the terrain at all levels from heights close tosea level to about 5000 masl The most important change for this cluster is a largereduction in the total amount of snowfall in winter and spring
With a few exceptions all CMIP5 models project less snowfall in all months of theyear (Fig 11a i ii) The largest total multi-model mean reduction in snowfall (ii) oc-10
curs in FebruaryndashApril without notable change in the multi-model mean precipitation(iii) Thus the reduction is caused by increasing temperatures represented by therainsnow line in Fig 11a iv As seen from the change in the rainsnow line elevationthe projected temperature increase in these months would imply that large areas thatreceive snow today would receive only rain About 40 of the ground in this cluster lies15
below 2000 masl and receives precipitation as rain throughout the year In summerprecipitation (iii) is at a minimum and the rainsnow line (iv) is already so high that onlya small fraction of the area receives snowfall today Thus although the relative changein snowfall (i) is largest in summer the change in the amount of snowfall (ii) is small Itshould also be noted that the change in the rainsnow line elevation (iv) in summer is20
much smaller 400ndash600 m compared to 600ndash900 m in DecemberndashApril
422 Upper Indus eastern part
Further east the largest changes are projected for the spring season Cluster 5 in theIndus Basin consists of the sub-basins GilgitHunza Indus 1 NubraShyok and Zan-skar As shown in Fig 11b this is high-elevation terrain with 80 of the ground lying25
above 4000 masl As a result almost all winter precipitation is snow (Fig 11b iii)
462
TCD9 441ndash493 2015
Snowfall in theHimalayas an
uncertain future froma little-known past
E Viste and A Sorteberg
Title Page
Abstract Introduction
Conclusions References
Tables Figures
J I
J I
Back Close
Full Screen Esc
Printer-friendly Version
Interactive Discussion
Discussion
Paper
|D
iscussionP
aper|
Discussion
Paper
|D
iscussionP
aper|
For the multi-model mean no big changes are projected in JanuaryndashFebruary This ispartly because of little change in precipitation (iii) and because the rainsnow line (iv)in these months is sufficiently low in the terrain today With the 500ndash600 m shift pro-jected with the RCP 85 80ndash90 of the area will still have temperatures low enoughfor snow The largest changes occur in MarchndashOctober when higher temperatures5
push the rainsnow line above large areas that receive snow today Increasing summerprecipitation (iii) causes the snowfall reduction in summer to be less than it would other-wise be The effect of higher temperatures is smaller on the APHRODITE snowfall thanon the MERRA reference snowfall (ii) as APHRODITE has very little summer snow-fall today The difference arises both from less precipitation (iii) in APHRODITE than10
MERRA today and from a higher rainsnow line (iv) in APHRODITE Note that as thechange in precipitation was defined as a fraction of the present-day value (Sect 23)the relative changes in APHRODITE and MERRA precipitation are equal
423 Upper Brahmaputra western part
In the westernmost part of the upper Brahmaputra Basin large snowfall changes are15
projected for the summer As cluster 5 in the Indus Basin Brahmaputrarsquos cluster 4 islimited to higher grounds Less than 6 lies outside of the 4000ndash6000 masl rangeThe cluster consists of Maquan He Yarlung Zangbo Dogxung ZangboMaiqu ZangboShang ChuYarlung ZangboNyang Lhasa HeRazheng Zangbo and Yamzho YumcoThe summer monsoon fully dominates the seasonal cycle of precipitation in this region20
(Fig 12a iii) resulting in a unimodal snow cycle with a maximum in JulyndashSeptember InAPHRODITE the seasonal cycle of snowfall is similar but less pronounced than in theMERRA reference The summer also sees the greatest reduction in CMIP5 projectedsnowfall both in absolute (ii) and relative (i) terms despite increasing summer precip-itation in all models (iii) The reason can be seen from the change in the rainsnow25
line elevation (iv) In the warmest months July and August elevation changes of 400ndash500 m would shift the rainsnow line from a level where at least 5ndash10 of the groundlies above the line to a level where only 1 of the area would receive precipitation as
463
TCD9 441ndash493 2015
Snowfall in theHimalayas an
uncertain future froma little-known past
E Viste and A Sorteberg
Title Page
Abstract Introduction
Conclusions References
Tables Figures
J I
J I
Back Close
Full Screen Esc
Printer-friendly Version
Interactive Discussion
Discussion
Paper
|D
iscussionP
aper|
Discussion
Paper
|D
iscussionP
aper|
snow In comparison with reference to MERRA the 300ndash400 m shift seen in JanuaryndashFebruary would cause only a small absolute change in snowfall (ii) because there islittle precipitation in these months (ii) and a small relative change (i) because therainsnow line would still be low in the terrain (iv) With reference to APHRODITE therelative snowfall change in winter would be larger than with reference to MERRA as5
temperatures today are higher resulting in a higher rainsnow line (iv)
424 Upper Brahmaputra eastern part
Like further west the Indian summer monsoon dominates the precipitation cycle in theeastern part of upper Brahmaputra (Fig 12b iii) but the seasonal cycle of snowfallpeaks in spring and fall (iii) This is also the time of the largest projected changes10
Cluster 3 in the Brahmaputra consists of the sub-basins Yarlung Zangbo2 NyangQu Yarlung Zangbo3 Yirsquoong ZangboParl Siyom Zaya QuLuhitDi About 70 of theground lies between 3000 and 6000 masl but there is also land almost at sea levelmainly in the Zaya QuLuhitDingba Qu sub-basin During summer most of the terrainlies below the rainsnow line (iv) In spring temperatures are lower than in summer15
and pre- monsoon precipitation is stronger in this part of the Himalayas than furtherwest in cluster 3 (Fig 12a iii vs Fig 12b iii) As a result MarchndashApril gets the mostsnow
Reductions in snowfall are projected for all months (ii) comparable in magnitude butlargest in the snow-rich spring and late summer The CMIP5 multi-model mean shows20
increasing or no change in precipitation in all months (Fig 12b iii) so the reductionin snowfall is due solely to higher temperatures The largest absolute reductions inApril and May occur with a 700ndash800 m shift in the rainsnow line elevation leaving30 more of the terrain in the rain The largest relative reduction in future snowfall areprojected for July and August (Fig 12b i) when the rainsnow line shifts so high that25
only the highest peaks can get precipitation as snow (iv) This would be despite thelowest changes in the rainsnow line only about 300 m in APHRODITE
464
TCD9 441ndash493 2015
Snowfall in theHimalayas an
uncertain future froma little-known past
E Viste and A Sorteberg
Title Page
Abstract Introduction
Conclusions References
Tables Figures
J I
J I
Back Close
Full Screen Esc
Printer-friendly Version
Interactive Discussion
Discussion
Paper
|D
iscussionP
aper|
Discussion
Paper
|D
iscussionP
aper|
43 Potential effects of reduced snowfall on water availability
With a few exceptions the CMIP5 multi-model mean precipitation change over the com-ing century is positive in all months in the upper Indus and Brahmaputra (Sect 42)Thus the projected reduction in snowfall is due solely to higher temperatures How-ever there is a large spread in precipitation projections among the models If tempera-5
tures increase as much as projected with the RCP 85 could any realistic precipitationchange in the HKH compensate and maintain present-day snowfall Results indicatethat this may happen in parts of the upper Indus but is out of the reach in the upperBrahmaputra As for water availability reduced snowfall may still cause more severeproblems in the Indus than in the Brahmaputra10
In cold regions where temperatures remain below freezing more winter precipita-tion may increase both the snow cover area the length of the snow season and theSWE (Collins et al 2013 Brutel-Vuilmet et al 2013 Raumlisaumlnen 2008 Gao et al 2012Wiltshire 2014) Raumlisaumlnen (2008) showed this to be the case in eastern Siberia andthe northernmost part of North America At the southern edge of the seasonal snow15
cover relevant for this study precipitation did not compensate and there was a reduc-tion in SWEWiltshire (2014) concluded that there would be small changes in snowfallin very cold and very warm regions of the HKH Snowfall in Nepal Bhutan and Hi-machal Pradesh where winters are warmer than in most parts of the range was mostvulnerable to higher temperatures The data presented in Sect 42 generally support20
the previous studiesOne of the reasons that precipitation does not compensate is that the highest pro-
jected precipitation increase in the HKH is seen in the summer when the temperaturetoday is so high that only the highest terrain is in the snow zone Shifting the rainsnowline upward even by only a few hundred meters reduces the area that receives snow25
greatly requiring very large increases in precipitation to compensate The summer isthe season with the largest relative reduction in snowfall in all the clusters described inSect 42 Except in the western upper Indus (cluster I4 Sect 421) which has very
465
TCD9 441ndash493 2015
Snowfall in theHimalayas an
uncertain future froma little-known past
E Viste and A Sorteberg
Title Page
Abstract Introduction
Conclusions References
Tables Figures
J I
J I
Back Close
Full Screen Esc
Printer-friendly Version
Interactive Discussion
Discussion
Paper
|D
iscussionP
aper|
Discussion
Paper
|D
iscussionP
aper|
little summer snowfall today the reduction in summer snowfall is notable in all clustersin the MERRA data in the Brahmaputra clusters also in APHRODITE
The largest change in snowfall is seen in the western part of the Brahmaputra (clus-ter B4 Sect 423) where a 400ndash500 m upward shift in the rainsnow line during sum-mer reduces the area with temperatures low enough for snowfall by a factor of 5ndash105
(Fig 12a iv values not shown) As a result the summer peak in the seasonal cycleof snowfall is replaced by a dip (Fig 12a ii) With an even distribution of precipitationwith elevation the area that still receives snow would have to receive 5ndash10 times asmuch precipitation to compensate for the lost snowfall Assuming more realisticallythat precipitation decreases above a certain height would require an even higher in-10
crease in precipitation In the model with the highest increase a doubling of the Julyprecipitation by the end of the century SWE is less than 25 of todayrsquos value in thatmonth (Fig 12a iii)
With a winter-dominated precipitation cycle the relative change in snowfall is smallerin the upper Indus than in the upper Brahmaputra Downscaling a high-emission sce-15
nario (A1B) in two CMIP3 models with a regional model Wiltshire (2014) found that bythe 2080s precipitation increased more than enough to compensate for higher temper-atures in the Karakoram Hindu Kush and Jammu and Kashmir in one of the modelsthe HadCM3 In the other model ECHAM5 precipitation increased less and snow-fall increased only in the higher parts of the Karakoram In our ensemble of CMIP520
models multi-model mean precipitation in the upper Indus clusters increases mainlyin the summer season when the inter-model spread is also the largest (Fig 11a iiiand 11b iii) Among the models 4ndash5 project increased winter precipitation in the upperIndus and in the uppermost cluster I5 this is associated with an increase in wintersnowfall (Fig 11b ii)25
Although it is the part of the HKH where snowfall is least reduced by increasingtemperatures (Fig 10b) the Karakoram and inner parts of the upper Indus may still bethe region where the changes have the largest impact on river run-off Compared tothe monsoon-dominated regions further east there is little summer precipitation and
466
TCD9 441ndash493 2015
Snowfall in theHimalayas an
uncertain future froma little-known past
E Viste and A Sorteberg
Title Page
Abstract Introduction
Conclusions References
Tables Figures
J I
J I
Back Close
Full Screen Esc
Printer-friendly Version
Interactive Discussion
Discussion
Paper
|D
iscussionP
aper|
Discussion
Paper
|D
iscussionP
aper|
much of the water in the rivers during summer is meltwater (Bookhagen and Burbank2010 Immerzeel et al 2010) As melting of snow and ice has not been analyzed inthis study we cannot quantify the effect of reduced snowmelt om river run-off but it isobvious that eventually reduced snowfall will lead to reduced melting In western partsof the HKH this may lead to changes in the seasonal cycle of the river flow5
As pointed out by Wiltshire (2014) increasing precipitation in the eastern HKH im-plies that water resources are likely to increase with climate change As snowfall andsnowmelt are both at maximum during summer (Rees and Collins 2006) meltwaterdoes not have the same importance for river flow in dry parts of the year as in the In-dus Reduced snowfall may reduce glaciers but ndash not considering potential changes in10
the amount of evaporation ndash there is no indication that there will be less water comingfrom the upper Brahmaputra
5 Concluding summary
In this study we have presented a suite of estimates of present-day snowfall in theIndus Ganges and Brahmaputra Basins and the changes in snowfall that would follow15
from CMIP5 projected changes in temperature and precipitation from 1971ndash2000 to2071ndash2100 The results show that if the temperature increases as much as in the RCP85 there will be much less snowfall despite increasing precipitation in most of theregion Limiting anthropogenic forcing to the RCP 26 level would still cause reductionsthough smaller20
Estimates of present-day snowfall based on a combination of temperature and pre-cipitation from reanalysis data and observations vary by factors of 2ndash4 The MERRAreanalysis gives higher estimates than TRMM 3B42 CRU TS and APHRODITE butthe spread is also large between the estimates based on the different observationallybased data sets This demonstrates the difficulties in assessing vulnerability to climate25
change in the region With limited knowledge of the current state future conditions arebound to be uncertain
467
TCD9 441ndash493 2015
Snowfall in theHimalayas an
uncertain future froma little-known past
E Viste and A Sorteberg
Title Page
Abstract Introduction
Conclusions References
Tables Figures
J I
J I
Back Close
Full Screen Esc
Printer-friendly Version
Interactive Discussion
Discussion
Paper
|D
iscussionP
aper|
Discussion
Paper
|D
iscussionP
aper|
Future changes in temperature and precipitation projected by climate models can stillprovide an indication of the relative change in snowfall With the RCP 85 the climatemodels project mean reductions in annual snowfall by 30ndash50 in the Indus Basin 50ndash60 in the Ganges Basin and 50ndash70 in the Brahmaputra Basin by 2071ndash2100 Withthe RCP 26 the corresponding reductions would be 10ndash20 in the Indus about 20 5
in the Ganges and 20ndash30 in the Brahmaputra The reductions are due to increasingtemperatures as the mean of the models show constant or increasing precipitationthroughout the year in most of the region
How much increasing temperatures reduce snowfall in a region depends on howmuch of the terrain that is below and above the freezing point today and on whether10
the terrain profile is such that the temperature increase transforms large areas fromsnow to rain zones With the RCP 85 the mean elevation where rain changes to snowndash the rainsnow line ndash creeps upward by 400ndash900 m in most of the region by 700ndash900 m
The largest relative change in snowfall is seen in the upper westernmost sub-basins15
of the Brahmaputra despite increasing precipitation and the lowest rainsnow line el-evation change (400ndash500 m) This is because a major part of this region is near thefreezing point today With the RCP 85 most of this region will have temperaturesabove freezing especially in the summer which is the wettest part of the year Theprojected reduction in annual snowfall is 65ndash75 20
In the upper Indus the effect of a warmer climate on snowfall is less extreme asmost of the terrain is high enough to have temperatures sufficiently far below freezingtoday Winter and spring brings most of the precipitation and the projected 600ndash800 mchange in the rainsnow line elevation during these seasons would leave most of theterrain below the freezing point Still a 20ndash40 reduction in annual snowfall is pro-25
jected with the RCP 85The range of our estimates of present-day snowfall illustrates how little that is known
about conditions that influence the availability of drinking water in some of the mostdensely populated parts of the world There is both a scientific and a societal need
468
TCD9 441ndash493 2015
Snowfall in theHimalayas an
uncertain future froma little-known past
E Viste and A Sorteberg
Title Page
Abstract Introduction
Conclusions References
Tables Figures
J I
J I
Back Close
Full Screen Esc
Printer-friendly Version
Interactive Discussion
Discussion
Paper
|D
iscussionP
aper|
Discussion
Paper
|D
iscussionP
aper|
for more information about precipitation in the HKH As a full-scale long-time observa-tional program covering all parts of the Himalayan range is not a likely possibility theonly hope for improved future knowledge of Himalayan snowfall lies in the improvementof satellite data and regional climate models
The Supplement related to this article is available online at5
doi105194tcd-9-441-2015-supplement
Acknowledgements This work has been carried out with support from the University of Bergenthe NORINDIA and SNOWHIM projects funded by The Research Council of Norway and theCentre for Climate Dynamics at the Bjerknes Centre for Climate Research We acknowledgethe World Climate Research Programmersquos Working Group on Coupled Modelling which is re-10
sponsible for CMIP and we thank the climate modeling groups listed in Table 3 of this paper forproducing and making available their model output For CMIP the US Department of EnergyrsquosProgram for Climate Model Diagnosis and Intercomparison provides coordinating support andled development of software infrastructure in partnership with the Global Organization for EarthSystem Science Portals15
References
Akhtar M Ahmad N and Booij M J The impact of climate change on the water resourcesof Hindukush-Karakorum-Himalaya region under different glacier coverage scenarios J Hy-drol 355 148ndash163 2008
Anders A M Roe G H Hallet B Montgomery D R Finnegan N J and Putkonen J20
Spatial patterns of precipitation and topography in the Himalaya in Tectonics Climate andLandscape Evolution Geological Society of America Special Paper edited by Willett S DHovius N Brandon M T and Fisher D Geological Society of America Boulder CO USA39ndash53 2006
469
TCD9 441ndash493 2015
Snowfall in theHimalayas an
uncertain future froma little-known past
E Viste and A Sorteberg
Title Page
Abstract Introduction
Conclusions References
Tables Figures
J I
J I
Back Close
Full Screen Esc
Printer-friendly Version
Interactive Discussion
Discussion
Paper
|D
iscussionP
aper|
Discussion
Paper
|D
iscussionP
aper|
Archer DR and Fowler HJ Spatial and temporal variations in precipitation in the UpperIndus Basin global teleconnections and hydrological implications Hydrol Earth Syst Sci8 47ndash61 doi105194hess-8-47-2004 2004
Bhutiyani M R Kale V S and Pawar N J Long-term trends in maximum minimum andmean annual air temperatures across the Northwestern Himalaya during the twentieth cen-5
tury Climatic Change 85 159ndash177 doi101007s10584-006-9196-1 2007Bhutiyani M R Kale V S and Pawar N J Climate change and the precipitation variations in
the northwestern Himalaya 1866ndash2006 Int J Climatol 30 535ndash548 doi101002joc19202010
Bookhagen B and Burbank D W Topography relief and TRMM-derived rainfall variations10
along the Himalaya Geophys Res Lett 33 L08405 doi1010292006GL026037 2006Bookhagen B and Burbank D W Toward a complete Himalayan hydrological budget spa-
tiotemporal distribution of snowmelt and rainfall and their impact on river discharge J Geo-phys Res 115 F03019 doi1010292009jf001426 2010
Franco B Fettweis X and Erpicum M Future projections of the Greenland ice sheet energy15
balance driving the surface melt The Cryosphere 7 1ndash18 doi105194tc-7-1-2013 2013Butt M J Characteristics of snow cover in the Hindukush Karakoram and Himalaya region
using Landsat satellite data Hydrol Process 10 3689ndash3698 doi101002hyp8375 2012Byun K and Choi M Uncertainty of snow water equivalent retrieved from AMSR-E brightness
temperature in northeast Asia Hydrol Process 28 12 doi101002hyp9846 201420
Chaturvedi R K Joshi J Jayaraman M Bala G and Ravindranath N H Multi-modelclimate change projections for India under representative concentration pathways Curr SciIndia 103 791ndash802 2012
Christensen J H Krishna Kumar K Aldrian E An S-I Cavalcanti I F A Castro Md Dong W Goswami P Hall A Kanyanga J K Kitoh A Kossin J Lau N-C Ren-25
wick J Stephenson D B Xie S-P and Zhou T Climate phenomena and their relevancefor future regional climate change in Climate Change 2013 The Physical Science BasisContribution of Working Group I to the Fifth Assessment Report of the Intergovernmen-tal Panel on Climate Change edited by Stocker T F Qin D Plattner G-K Tignor MAllen S K Boschung J Nauels A Xia Y Bex V and Midgley P M Cambridge Univer-30
sity Press Cambridge UK and New York NY USA 92 2013Collins M Knutti R Arblaster J Dufresne J-L Fichefet T Friedlingstein P Gao X
Gutowski W J Johns T Krinner G Shongwe M Tebaldi C Weaver A J and
470
TCD9 441ndash493 2015
Snowfall in theHimalayas an
uncertain future froma little-known past
E Viste and A Sorteberg
Title Page
Abstract Introduction
Conclusions References
Tables Figures
J I
J I
Back Close
Full Screen Esc
Printer-friendly Version
Interactive Discussion
Discussion
Paper
|D
iscussionP
aper|
Discussion
Paper
|D
iscussionP
aper|
Wehner M Long-term climate change projections commitments and irreversibility in Cli-mate Change 2013 The Physical Science Basis Contribution of Working Group I to theFifth Assessment Report of the Intergovernmental Panel on Climate Change edited byStocker T F Qin D Plattner G-K Tignor M Allen S K Boschung J Nauels AXia Y Bex V and Midgley P M Cambridge University Press Cambridge UK and New5
York NY USA 108 2013Cook E R Palmer J G Ahmed M Woodhouse C A Fenwick P Zafar M U Wahab M
and Khan N Five centuries of Upper Indus River flow from tree rings J Hydrol 486 365ndash375 doi101016jjhydrol201302004 2013
Dai A Temperature and pressure dependence of the rain-snow phase transition over land and10
ocean Geophys Res Lett 35 L12802 doi1010292008gl033295 2008Fowler H J and Archer D R Conflicting signals of climatic change in the Upper Indus Basin
J Climate 19 4276ndash4293 doi101175jcli38601 2006Gao J Williams M W Fu X Wang G and Gong T Spatiotemporal distribution of snow
in eastern Tibet and the response to climate change Remote Sens Environ 121 1ndash915
doi101016jrse201201006 2012Gardelle J Berthier E and Arnaud Y Slight mass gain of Karakoram glaciers in the
early twenty-first century ndash Supplement Nature Geosci 5 322ndash325 doi101038ngeo14502012
Guhathakurta P and Rajeevan M Trends in the rainfall pattern over India Int J Climatol20
28 1453ndash1469 doi101002joc1640 2008Harris I Jones P D Osborn T J and Lister D H Updated high-resolution grids of
monthly climatic observations ndash the CRU TS310 Dataset Int J Climatol 34 623ndash642doi101002joc3711 2014
Hartmann H and Andresky L Flooding in the Indus River basin ndash a spa-25
tiotemporal analysis of precipitation records Global Planet Change 107 25ndash35doi101016jgloplacha201304002 2013
Hastings D and Dunbar P Development amp Assessment of the Global Land One-km BaseElevation Digital Elevation Model (GLOBE) ISPRS Commission IV Symposium on GIS ndashBetween Visions and Applications Stuttgart Germany 7ndash10 September 199830
Hewitt K The Karakoram anomaly Glacier expansion and the ldquoelevation ef-fectrdquo Karakoram Himalaya Mt Res Dev 25 332ndash340 doi1016590276-4741(2005)025[0332TKAGEA]20CO2 2005
471
TCD9 441ndash493 2015
Snowfall in theHimalayas an
uncertain future froma little-known past
E Viste and A Sorteberg
Title Page
Abstract Introduction
Conclusions References
Tables Figures
J I
J I
Back Close
Full Screen Esc
Printer-friendly Version
Interactive Discussion
Discussion
Paper
|D
iscussionP
aper|
Discussion
Paper
|D
iscussionP
aper|
Huffman G J Adler R F Bolvin D T Gu G Nelkin E J Bowman K P Hong YStocker E F and Wolff D B The TRMM Multisatellite Precipitation Analysis (TMPA) quasi-global multiyear combined-sensor precipitation estimates at fine scales J Hydrometeorol8 38ndash55 2007
Immerzeel W Historical trends and future predictions of climate variability in the Brahmaputra5
basin Int J Climatol 28 243ndash254 doi101002joc1528 2008Immerzeel W W Droogers P de Jong S M and Bierkens M F P Large-scale monitoring
of snow cover and runoff simulation in Himalayan river basins using remote sensing RemoteSens Environ 113 40ndash49 doi101016jrse200808010 2009
Immerzeel W W van Beek L P H and Bierkens M F P Climate change will affect the10
asian water towers Science 328 1382ndash1385 doi101126science1183188 2010Ines A V M and Hansen J W Bias correction of daily GCM rainfall for crop simulation
studies Agr Forest Meteorol 138 44ndash53 doi101016jagrformet200603009 2006Jain S K Goswami A and Saraf A K Role of elevation and aspect in snow distribution
in western Himalaya Water Resour Manag 23 71ndash83 doi101007s11269-008-9265-515
2009Krakauer N Pradhanang S Lakhankar T and Jha A Evaluating satellite products for
precipitation estimation in mountain regions a case study for Nepal Remote Sensing 54107ndash4123 2013
Krishna A P Snow and glacier cover assessment in the high mountains of Sikkim Himalaya20
Hydrol Process 19 2375ndash2383 doi101002hyp5890 2005Kulkarni A V Rathore B P Singh S K and Ajai Distribution of seasonal snow cover in cen-
tral and western Himalaya Ann Glaciol 51 123ndash128 doi1031891727564107913864452010
Kumar V Rao Y S Venkataraman G Sarwade R N and Mani S Analysis of Aqua25
AMSR-E Derived Snow Water Equivalent over Himalayan Snow Covered Regions Geo-science and Remote Sensing Symposium Denver CO USA 31 Julyndash4 August 2006
Kaumlaumlb A Berthier E Nuth C Gardelle J and Arnaud Y Contrasting patterns of earlytwenty-first-century glacier mass change in the Himalayas Nature 488 495ndash498 availableat httpwwwnaturecomnaturejournalv488n7412absnature11324html ndash Supplement30
2012Lehner B Verdin K and Jarvis A New global hydrography derived from spaceborne eleva-
tion data Eos T Am Geophys Un 89 93ndash94 doi1010292008EO100001 2008
472
TCD9 441ndash493 2015
Snowfall in theHimalayas an
uncertain future froma little-known past
E Viste and A Sorteberg
Title Page
Abstract Introduction
Conclusions References
Tables Figures
J I
J I
Back Close
Full Screen Esc
Printer-friendly Version
Interactive Discussion
Discussion
Paper
|D
iscussionP
aper|
Discussion
Paper
|D
iscussionP
aper|
MacQueen J Some Methods for Classification and Analysis of Multivariate ObservationsFifth Berkeley Symposium on Mathematical Statistics and Probability Berkeley California21 Junendash18 July 1967
Meacuteneacutegoz M Galleacutee H and Jacobi H W Precipitation and snow cover in the Himalayafrom reanalysis to regional climate simulations Hydrol Earth Syst Sci 17 3921ndash39365
doi105194hess-17-3921-2013 2013Menon A Levermann A Schewe J Lehmann J and Frieler K Consistent increase in
Indian monsoon rainfall and its variability across CMIP-5 models Earth Syst Dynam 4287ndash300 doi105194esd-4-287-2013 2013
Moss R H Edmonds J A Hibbard K A Manning M R Rose S K van Vuuren D P10
Carter T R Emori S Kainuma M Kram T Meehl G A Mitchell J F B Naki-cenovic N Riahi K Smith S J Stouffer R J Thomson A M Weyant J P andWilbanks T J The next generation of scenarios for climate change research and assess-ment Nature 463 747ndash756 2010
Negi H S Kulkarni A V and Semwal B S Estimation of snow cover distribution in Beas15
basin Indian Himalaya using satellite data and ground measurements J Earth Syst Sci118 525ndash538 doi101007s12040-009-0039-0 2009
Palazzi E v Hardenberg J and Provenzale A Precipitation in the Hindu-Kush Karako-ram Himalaya observations and future scenarios J Geophys Res-Atmos 118 85ndash100doi1010292012JD018697 201320
Rees H G and Collins D N Regional differences in response of flow in glacier-fed Himalayanrivers to climatic warming Hydrol Process 20 2157ndash2169 doi101002hyp6209 2006
Rienecker M M Suarez M J Gelaro R Todling R Bacmeister J Liu EBosilovich M G Schubert S D Takacs L Kim G-K Bloom S Chen J Collins DConaty A da Silva A Gu W Joiner J Koster R D Lucchesi R Molod A Owens T25
Pawson S Pegion P Redder C R Reichle R Robertson F R Ruddick A GSienkiewicz M and Woollen J MERRA NASArsquos Modern-Era Retrospective Analysis forResearch and Applications J Climate 24 3624ndash3648 doi101175JCLI-D-11-0001512011
Rikiishi K and Nakasato H Height dependence of the tendency for reduction in seasonal30
snow cover in the Himalaya and the Tibetan Plateau region 1966ndash2001 Ann Glaciol 43369ndash377 doi103189172756406781811989 2006
473
TCD9 441ndash493 2015
Snowfall in theHimalayas an
uncertain future froma little-known past
E Viste and A Sorteberg
Title Page
Abstract Introduction
Conclusions References
Tables Figures
J I
J I
Back Close
Full Screen Esc
Printer-friendly Version
Interactive Discussion
Discussion
Paper
|D
iscussionP
aper|
Discussion
Paper
|D
iscussionP
aper|
Raumlisaumlnen J Warmer climate less or more snow Clim Dynam 30 307ndash319doi101007s00382-007-0289-y 2008
Schaner N Voisin N Nijssen B and Lettenmaier D P The contribution of glacier melt tostreamflow Environ Res Lett 7 034029 doi1010881748-932673034029 2012
Scherler D Bookhagen B and Strecker M R Spatially variable response of Himalayan5
glaciers to climate change affected by debris cover Nature Geosci 4 156ndash159 availableat httpwwwnaturecomngeojournalv4n3absngeo1068html ndash Supplement 2011
Sharif M Archer D R Fowler H J and Forsythe N Trends in timing and magnitude offlow in the Upper Indus Basin Hydrol Earth Syst Sci 17 1503ndash1516 doi105194hess-17-1503-2013 201310
Shekhar M S Chand H Kumar S Srinivasan K and Ganju A Climate-change studiesin the western Himalaya Ann Glaciol 51 105ndash112 doi1031891727564107913865082010
Shrestha A B Wake C P Mayewski P A and Dibb J E Maximum tempera-ture trends in the Himalaya and its vicinity an analysis based on temperature records15
from Nepal for the period 1971ndash94 J Climate 12 2775ndash2786 doi1011751520-0442(1999)012lt2775MTTITHgt20CO2 1999
Shrestha A B Wake C P Dibb J E and Mayewski P A Precipitation fluctuations in theNepal Himalaya and its vicinity and relationship with some large scale climatological parame-ters Int J Climatol 20 317ndash327 doi101002(SICI)1097-0088(20000315)203lt317AID-20
JOC476gt30CO2-G 2000Siderius C Biemans H Wiltshire A Rao S Franssen W H P Kumar P Gosain A K
van Vliet M T H and Collins D N Snowmelt contributions to discharge of the GangesSci Total Environ Supplement 468ndash469 9 doi101016jscitotenv201305084 2013
Singh P Jain S K and Kumar N Estimation of snow and glacier-melt contribution to the25
Chenab River Western Himalaya Mt Res Dev 17 49ndash56 doi1023073673913 1997Singh P Kumar V Thomas T and Arora M Changes in rainfall and relative hu-
midity in river basins in northwest and central India Hydrol Process 22 2982ndash2992doi101002hyp6871 2008
Sontakke N A Singh N and Singh H N Instrumental period rainfall series of the Indian30
region (AD 1813ndash2005) revised reconstruction update and analysis Holocene 18 1055ndash1066 doi1011770959683608095576 2008
474
TCD9 441ndash493 2015
Snowfall in theHimalayas an
uncertain future froma little-known past
E Viste and A Sorteberg
Title Page
Abstract Introduction
Conclusions References
Tables Figures
J I
J I
Back Close
Full Screen Esc
Printer-friendly Version
Interactive Discussion
Discussion
Paper
|D
iscussionP
aper|
Discussion
Paper
|D
iscussionP
aper|
Sperber K R Annamalai H Kang I S Kitoh A Moise A Turner A Wang B andZhou T The Asian summer monsoon an intercomparison of CMIP5 vs CMIP3 simulationsof the late 20th century Clim Dynam 41 2711ndash2744 doi101007s00382-012-1607-62013
Tahir A A Chevallier P Arnaud Y and Ahmad B Snow cover dynamics and hydrological5
regime of the Hunza River basin Karakoram Range Northern Pakistan Hydrol Earth SystSci 15 2275ndash2290 doi105194hess-15-2275-2011 2011a
Tahir A A Chevallier P Arnaud Y Neppel L and Ahmad B Modeling snowmelt-runoffunder climate scenarios in the Hunza River basin Karakoram Range Northern Pakistan JHydrol 409 104ndash117 doi101016jjhydrol201108035 2011b10
Taylor K E Stouffer R J and Meehl G A An overview of CMIP5 and the experimentdesign B Am Meteorol Soc 93 14 doi101175BAMS-D-11-000941 2011
Tedesco M and Narvekar P S Assessment of the NASA AMSR-E SWE product IEEE J SelTop Appl 3 141ndash159 doi101109JSTARS20102040462 2010
Teutschbein C and Seibert J Bias correction of regional climate model simulations for hydro-15
logical climate-change impact studies review and evaluation of different methods J Hydrol456ndash457 12ndash29 doi101016jjhydrol201205052 2012
Turner A G and Annamalai H Climate change and the South Asian summer monsoon NatClim Change 2 587ndash595 2012
van Vuuren D Edmonds J Kainuma M Riahi K Thomson A Hibbard K Hurtt G20
Kram T Krey V Lamarque J-F Masui T Meinshausen M Nakicenovic N Smith Sand Rose S The representative concentration pathways an overview Climatic Change109 26 doi101007s10584-011-0148-z 2011
Wang A and Zeng X Development of global hourly 05-degree land surface air temperaturedatasets J Climate 26 7676ndash7691 doi101175JCLI-D-12-006821 201325
Wiltshire A J Climate change implications for the glaciers of the Hindu Kush Karakoram andHimalayan region The Cryosphere 8 941ndash958 doi105194tc-8-941-2014 2014
Winiger M Gumpert M and Yamout H KarakorumndashHindukushndashwestern Himalaya assess-ing high-altitude water resources Hydrol Process 19 2329ndash2338 doi101002hyp5887200530
Xu X Lu C Shi X and Gao S World water tower An atmospheric perspective GeophysRes Lett 35 L20815 doi1010292008GL035867 2008a
475
TCD9 441ndash493 2015
Snowfall in theHimalayas an
uncertain future froma little-known past
E Viste and A Sorteberg
Title Page
Abstract Introduction
Conclusions References
Tables Figures
J I
J I
Back Close
Full Screen Esc
Printer-friendly Version
Interactive Discussion
Discussion
Paper
|D
iscussionP
aper|
Discussion
Paper
|D
iscussionP
aper|
Xu Z X Gong T L and Li J Y Decadal trend of climate in the Tibetan Plateaumdashregionaltemperature and precipitation Hydrol Process 22 3056ndash3065 doi101002hyp68922008b
Yasutomi N Hamada A and Akiyo Y Development of a Long-term Daily Gridded Temper-ature Dataset and its Application to RainSnow Discrimination of Daily Precipitation Global5
Environ Res15 165ndash172 2011Yatagai A Kamiguchi K Arakawa O Hamada A Yasutomi N and Kitoh A APHRODITE
Constructing a Long-Term Daily Gridded Precipitation Dataset for Asia Based on a DenseNetwork of Rain Gauges B Am Meteorol Soc 93 1401ndash1415 doi101175BAMS-D-11-001221 201210
You Q Kang S Aguilar E and Yan Y Changes in daily climate extremes in the east-ern and central Tibetan Plateau during 1961ndash2005 J Geophys Res-Atmos 113 D07101doi1010292007JD009389 2008
476
TCD9 441ndash493 2015
Snowfall in theHimalayas an
uncertain future froma little-known past
E Viste and A Sorteberg
Title Page
Abstract Introduction
Conclusions References
Tables Figures
J I
J I
Back Close
Full Screen Esc
Printer-friendly Version
Interactive Discussion
Discussion
Paper
|D
iscussionP
aper|
Discussion
Paper
|D
iscussionP
aper|
Table 1 Combinations of data types used in snowfall estimates T temperature P precipita-tion f (P T ) indicates that snowfall is calculated as a function of P and T
Precipitation Temperature Snowfall Time
MERRA MERRA PresentMERRA reference MERRA Terrain-adjusted MERRA f (P T ) PresentMERRA T2m MERRA MERRA T2m f (P T ) PresentBias-corrected with obs T MERRA Bias-corr terrain-adj MERRA f (P T ) PresentBias-corrected with obs P Bias-corr MERRA Terrain-adjusted MERRA f (P T ) PresentBias-corrected with obs T P Bias-corr MERRA Bias-corr terrain-adj MERRA f (P T ) PresentCMIP5 T MERRA Terrain-adj MERRA+∆T f (P T ) FutureCMIP5 P MERRAtimes∆P Terrain-adj MERRA f (P T ) FutureCMIP5 T P MERRAtimes∆P Terrain-adj MERRA+∆T f (P T ) FutureBias-corr CMIP5 T Bias-corr MERRA Bias-corr terrain-adj MERRA+∆T f (P T ) FutureBias-corr CMIP5 P Bias-corr MERRAtimes∆P Bias-corr terrain-adj MERRA f (P T ) FutureBias-corr CMIP5 T P Bias-corr MERRAtimes∆P Bias-corr terrain-adj MERRA+∆T f (P T ) Future
477
TCD9 441ndash493 2015
Snowfall in theHimalayas an
uncertain future froma little-known past
E Viste and A Sorteberg
Title Page
Abstract Introduction
Conclusions References
Tables Figures
J I
J I
Back Close
Full Screen Esc
Printer-friendly Version
Interactive Discussion
Discussion
Paper
|D
iscussionP
aper|
Discussion
Paper
|D
iscussionP
aper|
Table 2 Data sets used in calculations of present-day snowfall
Product Time Hor res Description
MERRA 1979ndash2012 05 lat 07 lon Hourly atmospheric reanalysis data(Rienecker et al 2011)
APHRODITEV1204V1101
1979ndash2007 025 Daily temperature andprecipitation basedon observations (Yatagai et al 2012Yasutomi et al 2011)
CRU TS 320 1979ndash2011 05 Monthly temperature and precipitationbased on observations(Harris et al 2014)
TRMM 3B42 V7 1998ndash2012 05 3 hourly satellite-based precipitation(Huffman et al 2007)
GLOBE 1 km Topography data set(Hastings and Dunbar 1998)
478
TCD9 441ndash493 2015
Snowfall in theHimalayas an
uncertain future froma little-known past
E Viste and A Sorteberg
Title Page
Abstract Introduction
Conclusions References
Tables Figures
J I
J I
Back Close
Full Screen Esc
Printer-friendly Version
Interactive Discussion
Discussion
Paper
|D
iscussionP
aper|
Discussion
Paper
|D
iscussionP
aper|
Table 3 CMIP5 models and RCPs used (x) in calculations of 2071ndash2100 snowfall
Model RCP 26 RCP 85
CanESM2 x xCCSM4 x xCESM1-CAM5 xCNRM-CM5 xGFDL-CM3 x xGFDL-ESM2G xGISS-E2-R x xHadGEM2-ES x xIPSL-CM5A-LR x xIPSL-CM5A-MR x xMIROC-ESM x xMIROC-ESM-CHEM x xMIROC5 x xMRI-CGCM3 x xNorESM1-M x xNorESM1-ME x x
479
TCD9 441ndash493 2015
Snowfall in theHimalayas an
uncertain future froma little-known past
E Viste and A Sorteberg
Title Page
Abstract Introduction
Conclusions References
Tables Figures
J I
J I
Back Close
Full Screen Esc
Printer-friendly Version
Interactive Discussion
Discussion
Paper
|D
iscussionP
aper|
Discussion
Paper
|D
iscussionP
aper|
Table 4 Annual snowfall estimates for the Indus Ganges and Brahmaputra Basins S snow[km3 SWE] P precipitation [km3] S and P percent of MERRA reference snowfall andMERRA precipitation First horizontal section no bias-corrections Second third and fourthsection bias-corrections with T P and both T and P
Indus Basin Ganges Basin Brahmaputra BasinInput S S P P S S P P S S P P
MERRA reference 148 100 422 100 54 100 1147 100 119 100 733 100MERRA 166 112 422 100 49 90 1147 100 129 109 733 100MERRA T2m 154 104 422 100 42 77 1147 100 109 92 733 100T APHRODITE 113 76 422 100 30 55 1147 100 74 62 733 100T CRU 126 85 422 100 81 151 1147 100 109 92 733 100P APHRODITE 66 44 315 75 22 42 1020 89 35 30 567 77P TRMM 72 49 404 96 31 57 1244 108 63 54 835 114P CRU 84 56 398 94 30 56 1100 96 53 45 716 98P T APHRODITE 49 33 315 75 12 22 1020 89 20 17 567 77P APHRODITE T CRU 62 42 315 75 34 63 1020 89 33 28 567 77P TRMM T APHRODITE 54 36 390 92 18 34 1195 104 39 33 815 111P TRMM T CRU 65 44 403 96 46 85 1254 109 58 49 813 111P CRU T APHRODITE 65 44 395 94 17 31 1106 96 31 26 718 98P T CRU 80 54 398 94 41 75 1100 96 49 42 716 98
480
TCD9 441ndash493 2015
Snowfall in theHimalayas an
uncertain future froma little-known past
E Viste and A Sorteberg
Title Page
Abstract Introduction
Conclusions References
Tables Figures
J I
J I
Back Close
Full Screen Esc
Printer-friendly Version
Interactive Discussion
Discussion
Paper
|D
iscussionP
aper|
Discussion
Paper
|D
iscussionP
aper|
Table 5 Projected change in annual snowfall from 1971ndash2000 to 2071ndash2100 with referenceto terrain-adjusted MERRA and APHRODITE ∆Sabs [km3] is the absolute change ∆Srel [] isthe relative change compared to the present-day MERRA reference snowfall Values are pre-sented with the CMIP5 multi-model mean as the main value and the span of individual modelsin brackets (MERRA only) ∆TP indicates that changes in both temperature and precipitationare included whereas ∆P and ∆T denotes changes only in precipitation or temperature re-spectively
Indus Ganges Brahmaputra∆Sabs [km3] ∆Srel [] ∆Sabs [km3] ∆Srel [] ∆Sabs [km3] ∆Srel []
RCP 85 MERRA ∆TP minus49 [minus83minus9] minus33 [minus56minus6] minus27 [minus36minus14] minus50 [minus66minus25] minus64 [minus93minus39] minus54 [minus79minus33]MERRA ∆T minus51 [minus67minus34] minus34 [minus45minus23] minus28 [minus34minus21] minus51 [minus64minus39] minus71 [minus87minus53] minus60 [minus73minus44]MERRA ∆P 5 [minus2544] 4 [minus1730] 7 [minus417] 12 [minus731] 20 [minus1750] 17 [minus1542]
APHRO ∆TP minus25 minus51 minus7 minus56 minus13 minus67APHRO ∆T minus25 minus52 minus7 minus57 minus14 minus71APHRO ∆P 1 1 1 6 3 16
RCP 26 MERRA ∆TP minus15 [minus406] minus10 [minus274] minus10 [minus19minus3] minus18 [minus36minus5] minus25 [minus42minus5] minus21 [minus35minus4]MERRA ∆T minus18 [minus27minus9] minus12 [minus18minus6] minus12 [minus21minus6] minus21 [minus39minus11] minus29 [minus47minus13] minus25 [minus40minus11]MERRA ∆P 3 [minus1825] 2 [minus1217] 3 [minus210] 5 [minus419] 7 [minus828] 6 [minus623]
APHRO ∆TP minus9 minus18 minus2 minus20 minus6 minus29APHRO ∆T minus10 minus19 minus3 minus23 minus6 minus32APHRO ∆P 1 1 0 4 1 6
481
TCD9 441ndash493 2015
Snowfall in theHimalayas an
uncertain future froma little-known past
E Viste and A Sorteberg
Title Page
Abstract Introduction
Conclusions References
Tables Figures
J I
J I
Back Close
Full Screen Esc
Printer-friendly Version
Interactive Discussion
Discussion
Paper
|D
iscussionP
aper|
Discussion
Paper
|D
iscussionP
aper|
Figure 1 Map of the region with the Indus Ganges and Brahmaputra basins outlined in whiteThinner outlines are national borders Background NASA Visible Earth
482
TCD9 441ndash493 2015
Snowfall in theHimalayas an
uncertain future froma little-known past
E Viste and A Sorteberg
Title Page
Abstract Introduction
Conclusions References
Tables Figures
J I
J I
Back Close
Full Screen Esc
Printer-friendly Version
Interactive Discussion
Discussion
Paper
|D
iscussionP
aper|
Discussion
Paper
|D
iscussionP
aper|
0
400 mm
Months 1ndash12
SP
I1
I2I3
I5I4
G1
G2G3
G4
B1
B2
B3B4
Viste amp SortebergFigure 2
Figure 2 Monthly mean MERRA precipitation and MERRA reference snowfall in sub-basinclusters of the Indus (I) Ganges (G) and Brahmaputra (B) Total bar height MERRA precip-itation (P) [mm] Colored bars snowfall (S) [mm SWE] based on MERRA precipitation andterrain-adjusted MERRA temperature in the region with the same color Cluster 1 in eachbasin is considered snow-free and the seasonal cycles are not shown
483
TCD9 441ndash493 2015
Snowfall in theHimalayas an
uncertain future froma little-known past
E Viste and A Sorteberg
Title Page
Abstract Introduction
Conclusions References
Tables Figures
J I
J I
Back Close
Full Screen Esc
Printer-friendly Version
Interactive Discussion
Discussion
Paper
|D
iscussionP
aper|
Discussion
Paper
|D
iscussionP
aper|
a) MERRA reference b) APHRODITE c) APHRODITE ndash MERRA ref
30 km3
20100-10-20-30
Viste amp SortebergFigure 3
Figure 3 The effect of bias-corrections with APHRODITE temperature and precipitation(a) MERRA reference snowfall (b) Snowfall based on bias-corrections with APHRODITE(c) APHRODITE (b) minus MERRA reference snowfall (a)
484
TCD9 441ndash493 2015
Snowfall in theHimalayas an
uncertain future froma little-known past
E Viste and A Sorteberg
Title Page
Abstract Introduction
Conclusions References
Tables Figures
J I
J I
Back Close
Full Screen Esc
Printer-friendly Version
Interactive Discussion
Discussion
Paper
|D
iscussionP
aper|
Discussion
Paper
|D
iscussionP
aper|
Figure 4 Difference between MERRA precipitation and observation-based data (a) Annualmean MERRA precipitation (b c and d) Annual mean MERRA precipitation bias-correctedwith observations APHRODITE CRU TS and TRMM 3B42 For each data set the small insetmaps show the observations minus MERRA
485
TCD9 441ndash493 2015
Snowfall in theHimalayas an
uncertain future froma little-known past
E Viste and A Sorteberg
Title Page
Abstract Introduction
Conclusions References
Tables Figures
J I
J I
Back Close
Full Screen Esc
Printer-friendly Version
Interactive Discussion
Discussion
Paper
|D
iscussionP
aper|
Discussion
Paper
|D
iscussionP
aper|
Biasminuscorrected minus original MERRA temperature [C]
minus15
minus10
minus5
0
5
10
Biasminuscorrected minus original MERRA temperature [C]
minus15
minus10
minus5
0
5
10
MERRA mean temperature [C] 1979minus2007
minus15
minus10
minus5
0
5
10
15
20
25
30a) MERRA b) APHRODITE ndash MERRA c) CRU ndash MERRA
-10
0
10
20
30degC
minus15
minus10
minus5
0
5
10
15degC
Viste amp SortebergFigure 5
Figure 5 Difference between MERRA temperature and observation-based data (a) Annualmean MERRA temperature (b and c) Annual mean MERRA temperature bias-corrected withobservations APHRODITE and CRU TS
486
TCD9 441ndash493 2015
Snowfall in theHimalayas an
uncertain future froma little-known past
E Viste and A Sorteberg
Title Page
Abstract Introduction
Conclusions References
Tables Figures
J I
J I
Back Close
Full Screen Esc
Printer-friendly Version
Interactive Discussion
Discussion
Paper
|D
iscussionP
aper|
Discussion
Paper
|D
iscussionP
aper|
Jan Apr
Jul Oct
a)
c)
b)
d)
15degC
10
5
0
ndash5
ndash10
ndash15
200 mm16012080400ndash40ndash80ndash120ndash160ndash200
Viste amp SortebergFigure 6
Figure 6 Regions where increasing temperatures are likely to cause a shift from snow to rainData monthly mean MERRA temperature terrain-adjusted to a 4 km GLOBE grid Red temper-ature between minus5 and 0 considered critical Small inset maps monthly MERRA precipitationin the critical zones
487
TCD9 441ndash493 2015
Snowfall in theHimalayas an
uncertain future froma little-known past
E Viste and A Sorteberg
Title Page
Abstract Introduction
Conclusions References
Tables Figures
J I
J I
Back Close
Full Screen Esc
Printer-friendly Version
Interactive Discussion
Discussion
Paper
|D
iscussionP
aper|
Discussion
Paper
|D
iscussionP
aper|
1 2 3 4 5 6 7 8 9 10 11 12Month
∆T [ordm
C]
a) Indus
0
1
2
3
4
5
6
7
8
9
10
b) Ganges∆T
[ordmC
]
1 2 3 4 5 6 7 8 9 10 11 12Month
1
2
3
4
5
6
7
8
0 0
c) Brahmaputra
∆T [ordm
C]
1 2 3 4 5 6 7 8 9 10 11 12Month
1
2
3
4
5
6
7
8
9
10 RCP 85RCP 85 meanRCP 26RCP 26 mean
Viste amp SortebergFigure 7
Figure 7 Projected future temperature change from 1971ndash2000 to 2071ndash2100 in the (a) In-dus (b) Ganges and (c) Brahmaputra Basins Thin lines show the individual CMIP5 modelsstronger lines the multi-model mean
488
TCD9 441ndash493 2015
Snowfall in theHimalayas an
uncertain future froma little-known past
E Viste and A Sorteberg
Title Page
Abstract Introduction
Conclusions References
Tables Figures
J I
J I
Back Close
Full Screen Esc
Printer-friendly Version
Interactive Discussion
Discussion
Paper
|D
iscussionP
aper|
Discussion
Paper
|D
iscussionP
aper|
1 2 3 4 5 6 7 8 9 10 11 12Month
[km
3 ]
a) Indus
0
20
40
60
80
100
120
140
b) Ganges[k
m3 ]
1 2 3 4 5 6 7 8 9 10 11 12Month
0
100
200
300
400
500
600
700
c) Brahmaputra
[km
3 ]
1 2 3 4 5 6 7 8 9 10 11 12Month
0
50
100
150
200
250
MERRA ref
2071ndash2100
1979ndash2008
RCP 85RCP 85 meanRCP 26RCP 26 mean
Viste amp SortebergFigure 8
Figure 8 Projected future precipitation in the (a) Indus (b) Ganges and (c) BrahmaputraBasins Gray bars MERRA 1979ndash2008 Thin lines and horizontal marks on the bars show theindividual CMIP5 models and the multi-model mean for 2071ndash2100
489
TCD9 441ndash493 2015
Snowfall in theHimalayas an
uncertain future froma little-known past
E Viste and A Sorteberg
Title Page
Abstract Introduction
Conclusions References
Tables Figures
J I
J I
Back Close
Full Screen Esc
Printer-friendly Version
Interactive Discussion
Discussion
Paper
|D
iscussionP
aper|
Discussion
Paper
|D
iscussionP
aper|
1 2 3 4 5 6 7 8 9 10 11 120
5
10
15
20
25
30
35
Month
SWE
[km
3 ]
a) Indus
0
1
2
3
4
5
6
7
8
b) Ganges
SWE
[km
3 ]
1 2 3 4 5 6 7 8 9 10 11 12Month
0
2
4
6
8
10
12
14
16
18
20
c) Brahmaputra
SWE
[km
3 ]
1 2 3 4 5 6 7 8 9 10 11 12Month
MERRA ref
2071ndash2100
1979ndash2008
RCP 85RCP 85 meanRCP 26RCP 26 mean
Viste amp SortebergFigure 9
Figure 9 Projected future snowfall in the (a) Indus (b) Ganges and (c) Brahmaputra Basinswith reference to MERRA reference snowfall Gray bars MERRA reference snowfall for 1979ndash2008 Thin lines and horizontal marks on the bars show the individual CMIP5 models andthe multi-model mean for 2071ndash2100 based on changes in temperature and precipitation asdescribed in Sect 23
490
TCD9 441ndash493 2015
Snowfall in theHimalayas an
uncertain future froma little-known past
E Viste and A Sorteberg
Title Page
Abstract Introduction
Conclusions References
Tables Figures
J I
J I
Back Close
Full Screen Esc
Printer-friendly Version
Interactive Discussion
Discussion
Paper
|D
iscussionP
aper|
Discussion
Paper
|D
iscussionP
aper|
Figure 10 Projected future changes in snowfall in sub-basins of the Indus Ganges andBrahmaputra Basins (a) Absolute change [km3] with reference to MERRA reference snow-fall (b) Absolute change [km3] with reference to APHRODITE snowfall (c d) Correspondingrelative changes [] with reference to MERRA and APHRODITE
491
TCD9 441ndash493 2015
Snowfall in theHimalayas an
uncertain future froma little-known past
E Viste and A Sorteberg
Title Page
Abstract Introduction
Conclusions References
Tables Figures
J I
J I
Back Close
Full Screen Esc
Printer-friendly Version
Interactive Discussion
Discussion
Paper
|D
iscussionP
aper|
Discussion
Paper
|D
iscussionP
aper|
J F M A M J J A S O N DMonth
0
5
10
15
20 km3Precip
0
2
4
6
8
10 km3SWE
2000
3000
4000
5000
6000 masl
1845
J F
M
A
M
JJ A
S
O
N
D
RSL
I4A = 146793 km2
1 km 3 = 68 mm
0
05
1
15 SWE rel
8000 m
0
J F M A M J J A S O N DMonth
0
2
4
6
8
10
12 km3 SWE
3000
4000
5000
6000 masl
78
2
14
J FM
A
MJ
J AS
O
ND
RSL
I5
Precip
0
5
10
15
20
25 km3
0
05
1
15 SWE rel
8000 m
0
A = 178669 km2
1 km 3 = 56 mm
CMIP52071ndash2100mean
Today
MERRA APHRODITE
Individual models
CMIP52071ndash2100mean
MERRA APHRODITE
Individual models
CMIP52071ndash2100Precip mean
MERRA APHRODITE
Individual models
SWE todayPrecip today
2000 mTerrain distribution of area between levels
CMIP52071ndash2100
TodayMERRA
APHRODITE
a)
i)
ii)
iii)
iv)
b)
Viste amp SortebergFigure 11
Figure 11 Monthly CMIP5 RCP 85 change in snowfall precipitation and rainsnow line eleva-tion in the upper Indus clusters (a) 4 and (b) 5 from 1971ndash2000 to 2071ndash2100 with referenceto the MERRA reference (red) and APHRODITE (blue) CMIP5 multi-model means are shownas horizontal marks individual models as dots Cluster location and terrain profile are shownabove the graphs (i) Fractional change in snowfall (ii) Future snowfall [km3] (dots) comparedto today (bars) (iii) Future precipitation [km3] (dots) compared to today (bars) Snowfall todayis shown as darker part of bars (iv) Rainsnow line elevation [m asl] Gray background el-evation histogram with the of total ground area lying in the marked 2000 m intervals Barschange from today (bottom) to CMIP5 multi-model mean (top)
492
TCD9 441ndash493 2015
Snowfall in theHimalayas an
uncertain future froma little-known past
E Viste and A Sorteberg
Title Page
Abstract Introduction
Conclusions References
Tables Figures
J I
J I
Back Close
Full Screen Esc
Printer-friendly Version
Interactive Discussion
Discussion
Paper
|D
iscussionP
aper|
Discussion
Paper
|D
iscussionP
aper|
3000
4000
5000
6000 masl
0
2
4
6
8
10 km3
0
10
20
30
40
50
60 km3
0
05
1
15
J F M A M J J A S O N DMonth
J FM
A
M
JJ A
S
O
ND
Precip
SWE
RSL
SWE rel
53
B3
8000 m
0
A = 139611 km2
1 km 3 = 72 mm
4500
5000
5500
6000
6500 masl
0
1
2
3
4 km3
0
10
20
30
40
50 km3
0
05
1
15 SWE rel
SWE
RSL
Precip
95
J F M A M J J A S O N DMonth
J FM
A
M
JJ A
S
ON
D
B4
8000 m
0
A = 159165 km2
1 km 3 = 63 mm
CMIP52071ndash2100mean
Today
MERRA APHRODITE
Individual models
CMIP52071ndash2100mean
MERRA APHRODITE
Individual models
CMIP52071ndash2100Precip mean
MERRA APHRODITE
Individual models
SWE todayPrecip today
2000 mTerrain distribution of area between levels
CMIP52071ndash2100
TodayMERRA
APHRODITE
a)
i)
ii)
iii)
iv)
b)
Viste amp SortebergFigure 12
Figure 12 Monthly CMIP5 RCP 85 change in snowfall precipitation and rainsnow line ele-vation in the upper Brahmaputra clusters (a) 4 and (b) 3 See Fig 11 for a description of thecontent
493
- Introduction
-
- Observed trends in snowfall temperature and precipitation
- Future projections of snowfall temperature and precipitation
- Aims and scope
-
- Data and methods
-
- Reference present-day snowfall
- Bias-corrected present-day snowfall
- Projected snowfall
- The rain-snow line
-
- Present-day snowfall
-
- Seasonal cycles of precipitation and snowfall
- Comparison of snowfall estimates
-
- Projected future snowfall
-
- Basin-scale projections
- Regional projections
-
- Upper Indus western part
- Upper Indus eastern part
- Upper Brahmaputra western part
- Upper Brahmaputra eastern part
-
- Potential effects of reduced snowfall on water availability
-
- Concluding summary
-
TCD9 441ndash493 2015
Snowfall in theHimalayas an
uncertain future froma little-known past
E Viste and A Sorteberg
Title Page
Abstract Introduction
Conclusions References
Tables Figures
J I
J I
Back Close
Full Screen Esc
Printer-friendly Version
Interactive Discussion
Discussion
Paper
|D
iscussionP
aper|
Discussion
Paper
|D
iscussionP
aper|
duced in all the ranges though less in the innermost Karakoram than in the outerranges As opposed to temperature increases in the other ranges the Karakoramrange experienced decreasing temperatures The reduction in snowfall on the outsideof the outermost range Pir Panjal during the last decades was supported by Bhutiyaniet al (2010) who found that the duration of the snowfall season had been reduced by5
about 5ndash6 days per decadeDocumented trends in other parts of the Indus basin vary and alternating epochs
indicate that the choice of time period may influence the results In Jammu and Kash-mir and Himachal Pradesh Bhutiyani et al (2010) found a significant decreasing trendin summer precipitation during the 20th century There was no trend in winter precip-10
itation at the three stations used but epochs of dry and wet winters had alternatedand winter precipitation was above average in 1991ndash2006 Previously a long-term in-crease in summer and annual precipitation in Jammu and Kashmir was documentedby Guhathakurta and Rajeevan (2008) and in Himachal Pradesh by Singh et al (2008)Sontakke et al (2008) on the other hand found no trends in this part of India since the15
19th century but noted a dry epoch since 1968 It should be pointed out that their dataset contained stations in the outer ranges only and not in eg the Karakoram
Further west in the Upper Indus Basin at stations mainly in Pakistan (Archer andFowler 2004) observed no trends in precipitation over the 20th century but a signifi-cant increase in winter summer and annual precipitation at several stations starting in20
1961 The increase was accompanied by increasing winter temperatures but decreas-ing summer temperatures (Fowler and Archer 2006) Hartmann and Andresky (2013)found significant positive trends in precipitation in the Hindu Kush and the Sulaimanmountains for 1986ndash2010
Satellite-based studies of trends in the present century (2000ndash20082001ndash2007)25
have documented a decrease in winter snow cover area in the Upper Indus (Immerzeelet al 2009) but an increase in the Indus water volume stored in snow and ice (Im-merzeel et al 2010)
446
TCD9 441ndash493 2015
Snowfall in theHimalayas an
uncertain future froma little-known past
E Viste and A Sorteberg
Title Page
Abstract Introduction
Conclusions References
Tables Figures
J I
J I
Back Close
Full Screen Esc
Printer-friendly Version
Interactive Discussion
Discussion
Paper
|D
iscussionP
aper|
Discussion
Paper
|D
iscussionP
aper|
12 Future projections of snowfall temperature and precipitation
In the last decades of the 21th century the temperature over India is projected to be onaverage 20ndash48 C higher than today depending on the anthropogenic forcing scenario(Chaturvedi et al 2012) In the Himalayas a temperature increase of more than 7 C isseen with the strongest forcing the Representative Concentration Pathway (RCP) 855
(Chaturvedi et al 2012 Collins et al 2013) Independently of precipitation changeshigher temperatures will decrease the fraction of precipitation falling as snow Whethersnowfall will increase or decrease thus depends on whether precipitation will increaseenough to compensate for the reduced snow fraction
Climate models from CMIP5 the most recent Coupled Model Inter-comparison10
Project (Taylor et al 2011) project a general increase in precipitation over India grow-ing with anthropogenic forcing and with time both annually (Chaturvedi et al 2012)and during the summer monsoon (Menon et al 2013) An increase was also seenin data from the previous model comparison project CMIP3 (Turner and Annamalai2012) Menon et al (2013) found that changes in the low-level winds suggest a north-15
ward shift in the monsoon by the end of the 21st century for the strongest forcingscenario although the total zonal strength of the monsoon remained fairly constant
It should be emphasized that there is a large inter-model spread in precipitation pro-jections and the IPCC AR5 concludes that there is medium confidence in the increasein summer monsoon precipitation over South Asia (Christensen et al 2013) But al-20
though precipitation projections are less reliable than temperature projections agree-ment between models increases with time and anthropogenic forcing (Chaturvedi et al2012) Also the CMIP5 multi-model mean has been considered to represent the mon-soon and the actual climate in India better than any individual model (Chaturvedi et al2012 Sperber et al 2013)25
The IPCC AR5 has high confidence that the snow cover area in the Northern Hemi-sphere will be substantially reduced with anthropogenic forcing as in the strongestscenarios (Collins et al 2013) For the range of RCPs 26ndash85 CMIP5 models sim-
447
TCD9 441ndash493 2015
Snowfall in theHimalayas an
uncertain future froma little-known past
E Viste and A Sorteberg
Title Page
Abstract Introduction
Conclusions References
Tables Figures
J I
J I
Back Close
Full Screen Esc
Printer-friendly Version
Interactive Discussion
Discussion
Paper
|D
iscussionP
aper|
Discussion
Paper
|D
iscussionP
aper|
ulate 7ndash25 reductions in the spring snow cover extent by 2080ndash2100 For snowfalland snow water equivalents (SWE) the projections show more variation While warm-ing decreases the amount of snow both through melting and through decreasing thesnow fraction more precipitation may increase snowfall in some of the coldest regions(Raumlisaumlnen 2008 Brutel-Vuilmet et al 2013) Though shown to apply mainly to the5
northern parts of Eurasia and North America there is a possibility that some of thehigher-lying terrain in the HKH may be similarly affected
13 Aims and scope
For the HKH uncertainty in projections of future precipitation and snowfall comes ontop of uncertainty in present time conditions Observations are limited especially in re-10
mote high-elevation regions (Anders et al 2006 Immerzeel 2008 Tahir et al 2011bWiniger et al 2005) Insufficient knowledge of the amount of snow falling over the re-gion today makes the contribution to both seasonal snowmelt and storage in glacierscorrespondingly uncertain
Recognizing this uncertainty this study provides an ensemble of monthly mean15
snowfall estimates for all sub-basins of the Indus Ganges and Brahmaputra todayand for 2071ndash2100 For the present time estimates we have combined MERRA re-analysis data (Rienecker et al 2011) with observationally based data sets of precip-itation and temperature CRU TS (Harris et al 2014) TRMM (Huffman et al 2007)and APHRODITE (Yatagai et al 2012 Yasutomi et al 2011) Whereas Meacuteneacutegoz20
et al (2013) and Wiltshire (2014) analyzed Himalayan snowfall by downscaling reanal-ysis data with regional climate models we have applied a simple terrain adjustment ofthe reanalysis temperature field
The ensemble of present-day estimates is presented in Sect 3 Future snowfall wasthen calculated based on the present-day snowfall and projected changes in temper-25
ature and precipitation in 14 and 15 CMIP5 models for the RCPs 26 and 85 re-spectively These results are presented in Sect 4 The data and methods for both thepresent time and the future case are described in Sect 2
448
TCD9 441ndash493 2015
Snowfall in theHimalayas an
uncertain future froma little-known past
E Viste and A Sorteberg
Title Page
Abstract Introduction
Conclusions References
Tables Figures
J I
J I
Back Close
Full Screen Esc
Printer-friendly Version
Interactive Discussion
Discussion
Paper
|D
iscussionP
aper|
Discussion
Paper
|D
iscussionP
aper|
Three main features may be involved in precipitation changes in the HKH changesin the summer monsoon changes in western disturbances during winter and the gen-eral changes that occur in the thermodynamic properties of the air as the temperatureincreases and the air contains more water vapor We have not considered the role ofthe different factors only looked at how changes in temperature and precipitation af-5
fect snowfall Unless otherwise specified any reference to snow refers to precipitationfalling as snow not to the snow cover on the ground
2 Data and methods
In addition to the original MERRA reanalysis snowfall we estimated snowfall usingdifferent combinations of temperature and precipitation data An overview of the com-10
binations is shown in Table 1 and the data sets used presented in Tables 2 and 3Present-day snowfall estimates were based on
1 MERRA 2 m temperature adjusted to a higher-resolution elevation grid andMERRA precipitation (Sect 21) This was used as a basis for the other estimatesand is referred to as MERRA reference snowfall The adjusted temperature is15
referred to as terrain-adjusted
2 MERRA 2 m temperature and precipitation
3 The MERRA data in (1) bias-corrected with observation-based data for tempera-ture and precipitation (Sect 22)
Estimates for the last decades of the 21th century were based on20
4 The MERRA data in (1) plus the changes in temperature and precipitation ina group of CMIP5 models over the coming century (Sect 23)
5 Bias-corrections with one of the data sets in (3) ndash APHRODITE ndash plus the meanchanges in temperature and precipitation in the CMIP5 models used in (4) Thiswas done to account for the spread in the present-day estimates25
449
TCD9 441ndash493 2015
Snowfall in theHimalayas an
uncertain future froma little-known past
E Viste and A Sorteberg
Title Page
Abstract Introduction
Conclusions References
Tables Figures
J I
J I
Back Close
Full Screen Esc
Printer-friendly Version
Interactive Discussion
Discussion
Paper
|D
iscussionP
aper|
Discussion
Paper
|D
iscussionP
aper|
With the exception of original MERRA snowfall data all snowfall estimates werebased on the relationship between temperature and snowfall derived by Dai (2008)Based on observations the conditional snow frequency over land was formulated as
F (Ts) = a[
tanh(b(Ts minusc)
)minusd]
(1)
where Ts is the surface air temperature [C] and a = minus482292b = 07205c = 116625
and d = 10223 This may be interpreted as the probability or fraction of precipitationfalling as snow at a given temperature We calculated hourly snowfall as the productof F and the amount of precipitation Cut-offs for no rain and no snow were set at minus10and 10 C respectively as this was the range of the data used by Dai (2008)
All snowfall estimates were made for the sub-basins defined in the HydroSHEDS10
data set (Lehner et al 2008) The results were then aggregated for the Indus Gangesand Brahmaputra Basins
Within each major basin we also grouped the sub-basins into regions with simi-lar characteristics of snow and precipitation This was done with k-means clustering(MacQueen 1967) using the square Euclidean distance as the distance measure15
The seasonal cycles of precipitation snow and snow fraction were first clustered sep-arately with the MERRA reference data and data bias-corrected with CRU TS data asinput We then adjusted the clusters manually prioritizing similarity of the relative sea-sonal cycles of snow and snow fraction and checking that both data sets gave similarresults Five groups were defined for the Indus and four for each of the other basins20
This included a no-snow group in each basin
21 Reference present-day snowfall
The horizontal resolution of the MERRA reanalysis data in the Himalayas is about55 km latitude and 70 km longitude To account for smaller-scale temperature variationsin the rugged terrain we used the vertical temperature gradient in MERRA to adjust25
the ground temperature to the GLOBE topography (Hastings and Dunbar 1998) The450
TCD9 441ndash493 2015
Snowfall in theHimalayas an
uncertain future froma little-known past
E Viste and A Sorteberg
Title Page
Abstract Introduction
Conclusions References
Tables Figures
J I
J I
Back Close
Full Screen Esc
Printer-friendly Version
Interactive Discussion
Discussion
Paper
|D
iscussionP
aper|
Discussion
Paper
|D
iscussionP
aper|
elevation-adjusted ground temperature was calculated as
Tadj = T0 minusT2 minus T1
z2 minus z1(zmerra 0 minus zglobe) (2)
where T0 is the MERRA 2 m temperature T1 is the temperature at the lowest pressurelevel above the ground T2 the temperature at the next level and z2 and z1 the height ofthese levels zmerra0 and zglobe is the elevation of the MERRA and GLOBE topography5
respectively To reduce calculation time compared to using the original 1 km GLOBEresolution both MERRA and GLOBE data were interpolated to a 4 km grid Snowfallwas calculated for each grid-point and then aggregated for each sub-basin for eachmonth
Snowfall based on elevation-adjusted MERRA temperature and MERRA precipita-10
tion is used as a reference throughout this article This is because the elevation-adjusted temperature and the 4 km grid was used as the starting-point in all subse-quent calculations It does not mean that we consider this snowfall to be closer to thetruth than any of the other estimates
22 Bias-corrected present-day snowfall15
A second group of present-day snowfall estimates was made from MERRA precipi-tation and elevation-adjusted temperature bias-corrected with observationally baseddata sets APHRODITE daily temperature and precipitation for 1979ndash2007 CRU TSmonthly temperature and precipitation for 1979ndash2011 and TRMM 3B42 3 hourly pre-cipitation for 1998ndash2012 Bias-corrections were performed on daily or monthly scales20
depending on the input data and the result distributed over the hourly time-steps ofthe MERRA temperature and precipitation As a result the diurnal cycle in MERRA ismaintained in all estimates Snowfall was then calculated following the same procedureas for the MERRA reference snowfall (Sect 21) When referring to APHRODITE snowor CRU snow anywhere in this article this is the snowfall calculated using MERRA25
precipitation and temperature both bias-corrected with these data sets451
TCD9 441ndash493 2015
Snowfall in theHimalayas an
uncertain future froma little-known past
E Viste and A Sorteberg
Title Page
Abstract Introduction
Conclusions References
Tables Figures
J I
J I
Back Close
Full Screen Esc
Printer-friendly Version
Interactive Discussion
Discussion
Paper
|D
iscussionP
aper|
Discussion
Paper
|D
iscussionP
aper|
Temperature data are generally assumed to be normally distributed and as de-scribed in Teutschbein and Seibert (2012) and references therein the data can bebias-corrected through a Gaussian distribution mapping We thus bias-corrected theelevation-adjusted MERRA temperature with the observationally based APHRODITEV1204 daily temperature by mapping the distribution of the MERRA data to the Gaus-5
sian distribution of the observationsAs the CRU TS 320 includes monthly mean daily minimum and maximum temper-
atures the method described by (Wang and Zeng 2013) was used Bias-correcteddaily maximum temperatures were defined as
Td max = Tmerra d max minus(Tmerra mn max minus Tcru mn max
) (3)10
d denotes daily and mn monthly Daily minimum temperatures were then corrected byadjusting the diurnal range
Td min = Td max minus∆Tmerra d middot∆Tcru mn
∆Tmerra mn (4)
where ∆T represents the diurnal and monthly temperature rangeThe distribution mapping procedure described by Ines and Hansen (2006) was used15
to bias-correct MERRA precipitation with APHRODITE V1101R2 daily precipitation anddaily accumulated TRMM 3B42 3 hourly precipitation This is a two-step procedureinvolving frequency and intensity adjustments We defined precipitation days as dayswith at least 01 mm in the observations The frequency was first adjusted by settingthe number of precipitation days in MERRA equal to that of the observations This was20
done by removing the lowest daily values The intensity was then adjusted by fitting theremaining days to the gamma distribution of the observations
Bias-corrections with CRU TS 320 monthly precipitation were done with a simplecorrection factor to adjust the monthly MERRA total to that of CRU (eg Ines andHansen 2006)25
452
TCD9 441ndash493 2015
Snowfall in theHimalayas an
uncertain future froma little-known past
E Viste and A Sorteberg
Title Page
Abstract Introduction
Conclusions References
Tables Figures
J I
J I
Back Close
Full Screen Esc
Printer-friendly Version
Interactive Discussion
Discussion
Paper
|D
iscussionP
aper|
Discussion
Paper
|D
iscussionP
aper|
23 Projected snowfall
The MERRA reanalysis was also the basis for estimates of future snowfall Thechanges in temperature and precipitation from 1971ndash2000 to 2071ndash2100 were addedto the reanalysis data and snowfall calculated following the same procedure as for thepresent time Climate change input came from models that were part of the Coupled5
Model Inter-comparison Project 5 (CMIP5 Taylor et al 2011) for the RepresentativeConcentration Pathways (RCP) 26 and 85 (Moss et al 2010 van Vuuren et al 2011)The models used are listed in Table 3
Due to the different spatial resolution of the models changes were defined asmonthly mean changes on the sub-basin level For temperature the absolute change10
was used and for precipitation the fractional change Future projected snowfall wascalculated with reference to elevation-adjusted MERRA snowfall for each model Dueto large deviations in estimates of present-day snowfall (Sect 3) we also calculatedsnowfall for the CMIP5 multi-model mean changes with reference to the lowest presenttime estimate APHRODITE snowfall15
24 The rain-snow line
Not all temperature changes affect snowfall We defined the rain-snow line as the el-evation where the temperature suggests a shift from rain to snow Technically thisis a conditional rain-snow line as no precipitation was required For every hour allgrid cells that had a snow fractionprobability between 025 and 075 corresponding20
to a temperature between 09 and 13 C were identified The monthly rain-snow linewas then set as the mean elevation of these grid cells and time steps For present-dayconditions this was done for elevation-adjusted MERRA temperature and temperaturebias-corrected with APHRODITE Projected temperature changes in the CMIP5 RCP85 were then added to these temperatures and the procedure repeated25
453
TCD9 441ndash493 2015
Snowfall in theHimalayas an
uncertain future froma little-known past
E Viste and A Sorteberg
Title Page
Abstract Introduction
Conclusions References
Tables Figures
J I
J I
Back Close
Full Screen Esc
Printer-friendly Version
Interactive Discussion
Discussion
Paper
|D
iscussionP
aper|
Discussion
Paper
|D
iscussionP
aper|
3 Present-day snowfall
31 Seasonal cycles of precipitation and snowfall
Figure 2 gives an overview of the seasonal cycle of rain and snow in different parts ofthe HKH based on MERRA precipitation and MERRA reference snowfall (Sect 21)The upper Indus basin gets more snow than rain in other sub-basins of the Indus5
Ganges and Brahmaputra rainfall dominates This difference is caused by different pre-cipitation cycles Whereas the summer monsoon dominates in the Central Himalayaswinter depressions bring most of the precipitation in the upper Indus ndash at a time whenlow temperatures mean that precipitation falls as snow in larger areas than it wouldin summer Although snow fractions are lower in the upper Brahmaputra monsoon10
precipitation produces a substantial amount of summer snow at high elevationsIn the northwesternmost cluster in the Indus I4 March is the wettest month and also
the month with the highest total amount of snowfall Precipitation has a second peakduring July and August but the temperature is then too high to allow much snowfallFurther east in cluster I5 more terrain at higher elevations cause higher snow fractions15
during summer but winter and spring is still the dominant snow season The summerpeak in precipitation in this cluster is caused by the two eastern sub-basins There islittle summer precipitation in the west
In Brahmaputrarsquos cluster B4 and Gangesrsquo G4 maximum snowfall occurs during thesummer monsoon Higher temperatures during summer means that the snow fraction20
is lower than in winter but as there is much more summer precipitation the amount ofsnow is also higher Rare occurrences of precipitation during the cold winter togetherwith the combination of snowfall and snowmelt during summer makes the seasonalcycle of snow depth in the Central Himalayas unpronounced (Meacuteneacutegoz et al 2013)In the upper-level basins in Brahmaputrarsquos B3 the summer is also the main precipi-25
tation season but the peak is less sharp than further west As a result snowfall is ata maximum in MarchndashApril
454
TCD9 441ndash493 2015
Snowfall in theHimalayas an
uncertain future froma little-known past
E Viste and A Sorteberg
Title Page
Abstract Introduction
Conclusions References
Tables Figures
J I
J I
Back Close
Full Screen Esc
Printer-friendly Version
Interactive Discussion
Discussion
Paper
|D
iscussionP
aper|
Discussion
Paper
|D
iscussionP
aper|
32 Comparison of snowfall estimates
The MERRA reference snowfall described in Sect 31 differs greatly from snowfallbased on bias-corrected temperature and precipitation Large differences betweentemperature and data sets for the HKH cause corresponding deviations in snowfall ndashnot only between MERRA-based estimates and bias-corrected data but between esti-5
mates based on bias-corrections with different data sets This can be seen from Table 4which displays annual snowfall estimates for combinations of the bias-corrections de-scribed in Sect 22 aggregated to the major basins Data for the individual sub-basinsare included as Supplement
With the exception of snowfall based on MERRA precipitation and MERRA temper-10
ature bias-corrected with CRU TS in the Ganges basin all estimates based on bias-corrected data are lower than the MERRA reference snowfall The lowest estimates arethose based on bias-corrections with APHRODITE precipitation and temperature Thiscombination produced only 33 of the reference snowfall in the Indus Basin 22 inthe Ganges Basins and 17 in the Brahmaputra Basin While the difference is large in15
all sub-basins that have snow today it is especially large in the upper parts of the Indusand Brahmaputra Basins (Fig 3) In comparison bias-corrections with CRU TS tem-perature and precipitation produce 54 of the reference snowfall in the Indus 75 inthe Ganges and 42 in the Brahmaputra ndash factors of 2ndash4 compared to APHRODITEIt should be noted that as the time periods covered by the data sets are not equal20
the results are not strictly comparable but tests using different MERRA periods (notshown) indicate that there would be no major difference in the monthly means
The large difference between MERRA reference snowfall and snowfall based onbias-corrected data results from differences in both temperature and precipitation butdifferences in the precipitation pattern have the greatest effect Estimates where only25
the precipitation has been bias-corrected are lower than those where only the tempera-ture has been bias-corrected (Table 4) This is not solely an effect of more precipitationin MERRA than in the observation-based data although MERRA is wetter than all the
455
TCD9 441ndash493 2015
Snowfall in theHimalayas an
uncertain future froma little-known past
E Viste and A Sorteberg
Title Page
Abstract Introduction
Conclusions References
Tables Figures
J I
J I
Back Close
Full Screen Esc
Printer-friendly Version
Interactive Discussion
Discussion
Paper
|D
iscussionP
aper|
Discussion
Paper
|D
iscussionP
aper|
data sets in the Indus and for APHRODITE also in the Ganges and the Brahmapu-tra An inland and upward shift in the MERRA precipitation adds to the differencesAs shown in Fig 4 all the observation-based precipitation data sets are wetter thanMERRA in most of the lowlands and in the foothills of the HKH but drier in the higher-elevation regions further inland In MERRA the precipitation belt is shifted higher up5
in the Himalayas where temperatures are lower and more of the precipitation falls assnow
In addition HKH temperatures are lower in MERRA than in APHRODITE and inthe upper Indus also than in CRU TS (Fig 5) The lower temperatures in MERRAcause higher snow fractions further increasing the difference between the MERRA ref-10
erence snowfall and APHRODITE snowfall Oppositely CRU TS is colder than MERRAthroughout the Ganges leading to higher snowfall estimates when bias-correctingMERRA temperatures with CRU TS (Table 4)
We do not see any reason to consider any of the observation-based data sets northe reanalysis the ground truth The reanalysis has the benefit of being physically15
consistent though precipitation is a pure model product In the other data sets thenumber of observations vary greatly within the region
The lack of observations in the HKH has been pointed out in many studies Mostmeteorological stations are located in the valleys and do not necessarily representweather conditions in higher terrain As demonstrated by Palazzi et al (2013) station-20
based data sets like APHRODITE and CRU TS are merely mathematical interpolationsin major parts of the HKH and on the Tibetan Plateau Immerzeel (2008) showed thatthe number of observations going into version 21 of the CRU data set in the Himalayanregion varies greatly A drop in the mid-1990s suggests that caution should be takenwhen interpreting data at later times Maps (not shown) of station coverage in version25
320 used in this study show that this problem persistsThe fact that more of the precipitation falls as snow at higher elevations may in it-
self lead to an under-estimation of precipitation in the mountains In addition to thelack of observations in high terrain gauges tend to capture snow less easily than rain
456
TCD9 441ndash493 2015
Snowfall in theHimalayas an
uncertain future froma little-known past
E Viste and A Sorteberg
Title Page
Abstract Introduction
Conclusions References
Tables Figures
J I
J I
Back Close
Full Screen Esc
Printer-friendly Version
Interactive Discussion
Discussion
Paper
|D
iscussionP
aper|
Discussion
Paper
|D
iscussionP
aper|
leading to a possible under-registration of precipitation at the few high-elevation sta-tions that exist Comparing stations along a vertical profile in the Karakoram Winigeret al (2005) found that precipitation multiplied by a factor of 5ndash10 from 2500 masl to5000ndash6000 masl This maximum is much higher than reported in most other studiesand they attributed this to the valley-dominance of stations normally used5
Indications of too little precipitation at higher elevations were also given by Tahiret al (2011b) as APHRODITE precipitation was too low to account for the observeddischarge in the Hunza river in the Karakoram Anders et al (2006) reported thatTRMM radar data underestimated precipitation at higher elevations in the Himalayasdue to the low ability of the radar to detect very low precipitation and lowndashmoderated10
snowfall rates On the other hand Krakauer et al (2013) found that both TRMM andAPHRODITE had too much precipitation compared to observations from the few exist-ing stations at elevations above 3000 masl in Nepal
Satellite data are a promising future alternative for measuring snowfall but presentlyof limited use MODIS and LANDSAT satellite data have been used in several studies15
of snow and ice in the Himalayas (Tahir et al 2011a b Bookhagen and Burbank2010 Hewitt 2005 Krishna 2005 Negi et al 2009 Jain et al 2009 Butt 2012 Gaoet al 2012 Kulkarni et al 2010 Immerzeel et al 2009) but these data contain onlysnow cover area with no measure of the snow thickness or snow water equivalentsThe NASA AMSR-E SWE data set distributed by the National Snow and Ice Data20
Center could have been used but correlations between AMSR-E SWE and groundobservations have been shown to be poor (Tedesco and Narvekar 2010 Byun andChoi 2014 Kumar et al 2006) As AMSR-E SWE has been found underestimatesnow depth we concluded that incorporating these data into our ensemble would notlikely constrain the results nor add new information25
Defining snowfall based on MERRA precipitation and elevation-adjusted tempera-ture as a reference was done mainly to have a single reference when comparing thedata sets against each other Also we believe the elevation-adjustment of temperaturerepresents an enhancement compared to the original MERRA reanalysis MERRA was
457
TCD9 441ndash493 2015
Snowfall in theHimalayas an
uncertain future froma little-known past
E Viste and A Sorteberg
Title Page
Abstract Introduction
Conclusions References
Tables Figures
J I
J I
Back Close
Full Screen Esc
Printer-friendly Version
Interactive Discussion
Discussion
Paper
|D
iscussionP
aper|
Discussion
Paper
|D
iscussionP
aper|
chosen mainly because it has an hourly resolution allowing diurnal temperature vari-ations to affect snowfall But even though this estimate is much higher than all thebias-corrected estimates it cannot be discarded It has been argued that reanalysisdata and regional climate models may in some cases be as good as or better thanobservations in the HKH (Wiltshire 2014 Meacuteneacutegoz et al 2013 Akhtar et al 2008)5
Akhtar et al (2008) got better results when modeling river discharge in three upperIndus catchments with an RCM-based hydrological model than with one based on thefew observations available within the region They concluded that it was preferable touse RCM data directly as input to hydrological models in this region
As shown in the small inset maps in Fig 4 MERRA precipitation is higher than ob-10
served precipitation throughout the HKH and the same has previously been shownfor ERA-Interim reanalysis precipitation (Palazzi et al 2013) In MERRA the precipi-tation belt is shifted upward in the terrain compared to in the observation-based datasets Whether this shift is realistic cannot be determined as long as observations fromupper-level terrain are either missing or likely too low15
4 Projected future snowfall
Whether higher temperatures lead to less snowfall depends on whether the tempera-ture changes from below to above freezing and whether this change occurs at a timewhen there is precipitation The maps in Fig 6 illustrate where a temperature increaseis most likely to affect snowfall and snowmelt In the red zones where the monthly20
temperature today is between ndash5 and 0 C the projected temperature increase of 2ndash7 C (Chaturvedi et al 2012 Collins et al 2013 Wiltshire 2014) may be consideredcritical Such a change would change snowfall to rain and also cause a change fromfreezing to melting of snow and ice The pink zones with monthly mean temperaturesof 0ndash5 C would similarly change from a climate where precipitation may often fall as25
snow to one that is snow-free
458
TCD9 441ndash493 2015
Snowfall in theHimalayas an
uncertain future froma little-known past
E Viste and A Sorteberg
Title Page
Abstract Introduction
Conclusions References
Tables Figures
J I
J I
Back Close
Full Screen Esc
Printer-friendly Version
Interactive Discussion
Discussion
Paper
|D
iscussionP
aper|
Discussion
Paper
|D
iscussionP
aper|
In January (Fig 6a) only the lower parts of the Himalayas is affected as most ofthe region would still have temperatures well below the freezing point The small insetmap shows precipitation in the red zone a narrow band along the range Oppositelyin July (Fig 6c) the temperature is already above 5 C in most of the region though athigher elevations along the Himalayan range and in the Karakoram the change can be5
critical The most widespread changes are seen in spring and fall In April and October(Fig 6b d) large areas in the HKH and on the Tibetan Plateau risk a change frombelow to above freezing
Incorporating CMIP5 precipitation changes we find that the projected temperatureincrease has a larger impact so that snowfall will be reduced in the Indus Ganges and10
Brahmaputra Basins by 2071ndash2100 compared to today Details for the major basinsare presented in Sect 41 How much increased temperatures reduce snowfall withina region depends on the location of the rainsnow line today compared to the terraindistribution Results for selected upper-level sub-basins in the Indus and Brahmaputrawill be discussed in that context in Sect 4215
The large deviations in the estimates of present-day snowfall (Sect 3) means thatthere will be correspondingly large deviations in projected values To account for thismost results are shown with reference to the highest and lowest present-day estimatesMERRA reference snowfall and to APHRODITE-based snowfall Future estimates rela-tive to CRU and TRMM are assumed to lie between those of MERRA and APHRODITE20
41 Basin-scale projections
In the Indus Ganges and Brahmaputra Basins the CMIP5 models project a meanincrease in both temperature (Fig 7) and precipitation (Fig 8) in the region by 2071ndash2100 for both RCPs 26 and 85 The RCP 85 multi-model mean change in temper-ature varies through the year with a 49ndash62 C increase in the Indus 36ndash52 C in25
the Ganges and 42ndash60 C in the Brahmaputra The increase is smallest during thesummer months The dip in the summer is also seen though less pronounced with
459
TCD9 441ndash493 2015
Snowfall in theHimalayas an
uncertain future froma little-known past
E Viste and A Sorteberg
Title Page
Abstract Introduction
Conclusions References
Tables Figures
J I
J I
Back Close
Full Screen Esc
Printer-friendly Version
Interactive Discussion
Discussion
Paper
|D
iscussionP
aper|
Discussion
Paper
|D
iscussionP
aper|
the RCP 26 The summer is also the season with the largest absolute increase inprecipitation
Compared to present-day estimates the CMIP5 models project less snowfall in theIndus Ganges and Brahmaputra Basins in the last decades of this century This canbe seen from Fig 9 The projected multi-model mean is lower than today in all calen-5
dar months for both RCPs 26 and 85 With the RCP 26 some models suggest anincrease in some months mainly in winter and spring This is also the case for one ortwo models with the RCP 85 whereas other models indicate that the snowfall in thesame months will be only half of todayrsquos values
In the Ganges Basin (Fig 9b) the seasonal distribution of snowfall today is mainly10
flat with equal amounts of snowfall from January through September Reductions insummer snowfall with the RCP 85 would change the seasonal cycle into a winter-dominated one To a lesser degree this is also the case for RCP 26 As summerprecipitation is projected to increase in all of the Ganges (not shown but consistentwith Menon et al 2013) this indicates that large areas are at elevations where a small15
increase in the summer temperature may cause a shift from snow to rain This is seenas the red band along the upper Ganges in Fig 6c Reductions in summer snowfall arealso large in the Brahmaputra (Fig 9b) whereas in the Indus the largest total changesoccur in MarchndashMay (Fig 9a)
As the MERRA reference snowfall for today is much larger than APHRODITE snow-20
fall (Sect 32) projected absolute changes for 2071ndash2100 are also much largerin MERRA The relative changes are more similar though larger with reference toAPHRODITE Annual snowfall changes for each major basin are presented in Table 5for changes in temperature precipitation or both and with reference to MERRA andAphrodite present-day snowfall Changes at the sub-basin level are shown in Fig 1025
In the Ganges Basin both MERRA- and APHRODITE-based multi-model mean snow-fall is reduced by about 20 with the RCP 26 and 50 with the RCP 85 In theIndus and Brahmaputra Basins the differences between MERRA- and APHRODITE-based changes are larger but not as large as for the absolute values With reference
460
TCD9 441ndash493 2015
Snowfall in theHimalayas an
uncertain future froma little-known past
E Viste and A Sorteberg
Title Page
Abstract Introduction
Conclusions References
Tables Figures
J I
J I
Back Close
Full Screen Esc
Printer-friendly Version
Interactive Discussion
Discussion
Paper
|D
iscussionP
aper|
Discussion
Paper
|D
iscussionP
aper|
to MERRA and APHRODITE respectively the reduction in snowfall in the Indus Basinis 30 and 50 with the RCP 85 The corresponding reductions in the BrahmaputraBasin are 50 and 70
The projected changes in temperature have greater effect on snowfall than thechanges in precipitation When taking into account only changes in precipitation all5
snowfall estimates are positive (∆P Table 5) This indicates that the mean annual to-tal reduction for each major basin is governed by the temperature change In someCMIP5 models (values in brackets in Table 5) the effect of precipitation changes (∆P )on snowfall are of the same magnitude as the effect of temperature changes (∆T ) butfor the CMIP5 multi-model mean temperature changes cause snowfall changes 4ndash1010
times as large as those due to changes in precipitation This is with reference to thepresent-day MERRA reference snowfall and for both RCPs 26 and 85 With referenceto APHRODITE snowfall the effect of temperature changes compared to precipitationchanges is even greater
42 Regional projections15
If temperatures are far below freezing everywhere warming may have little effect onsnowfall The same applies if only the highest peaks receive snow today The largestreduction in snowfall in a basin occurs if todayrsquos rainsnow line is at an elevation justbelow the dominant elevation of the basin Then large regions will see a shift fromsnow to rain20
In the Indus Basin the largest relative snowfall reduction by 2071ndash2100 is seen inthe southwestern sub-basins where snowfall is limited today (Fig 10) The largest totalreduction is seen in the snow-rich sub-basins of KabulSwatAlingar in the west and inthe east and a smaller reduction in the inner-most basins of GilgitHunza Indus 1 andNubraShyok Together with the upper regions of the Brahmaputra these sub-basins25
clusters I4 I5 B3 and B4 in Fig 2 were selected for a closer analysis In addition tohaving the most snow these clusters are the most homogeneous when considering
461
TCD9 441ndash493 2015
Snowfall in theHimalayas an
uncertain future froma little-known past
E Viste and A Sorteberg
Title Page
Abstract Introduction
Conclusions References
Tables Figures
J I
J I
Back Close
Full Screen Esc
Printer-friendly Version
Interactive Discussion
Discussion
Paper
|D
iscussionP
aper|
Discussion
Paper
|D
iscussionP
aper|
the seasonal cycle of snowfall and snow fraction The values presented in this sectionare all from the RCP 85 for changes from today to 2071ndash2100
421 Upper Indus western part
Cluster 4 consists of the sub-basins Astor KabulSwatAlingar and Krishen GangaAs seen from the elevation profile at the top of Fig 11a the elevation span is large5
and there is an almost equal proportion of the terrain at all levels from heights close tosea level to about 5000 masl The most important change for this cluster is a largereduction in the total amount of snowfall in winter and spring
With a few exceptions all CMIP5 models project less snowfall in all months of theyear (Fig 11a i ii) The largest total multi-model mean reduction in snowfall (ii) oc-10
curs in FebruaryndashApril without notable change in the multi-model mean precipitation(iii) Thus the reduction is caused by increasing temperatures represented by therainsnow line in Fig 11a iv As seen from the change in the rainsnow line elevationthe projected temperature increase in these months would imply that large areas thatreceive snow today would receive only rain About 40 of the ground in this cluster lies15
below 2000 masl and receives precipitation as rain throughout the year In summerprecipitation (iii) is at a minimum and the rainsnow line (iv) is already so high that onlya small fraction of the area receives snowfall today Thus although the relative changein snowfall (i) is largest in summer the change in the amount of snowfall (ii) is small Itshould also be noted that the change in the rainsnow line elevation (iv) in summer is20
much smaller 400ndash600 m compared to 600ndash900 m in DecemberndashApril
422 Upper Indus eastern part
Further east the largest changes are projected for the spring season Cluster 5 in theIndus Basin consists of the sub-basins GilgitHunza Indus 1 NubraShyok and Zan-skar As shown in Fig 11b this is high-elevation terrain with 80 of the ground lying25
above 4000 masl As a result almost all winter precipitation is snow (Fig 11b iii)
462
TCD9 441ndash493 2015
Snowfall in theHimalayas an
uncertain future froma little-known past
E Viste and A Sorteberg
Title Page
Abstract Introduction
Conclusions References
Tables Figures
J I
J I
Back Close
Full Screen Esc
Printer-friendly Version
Interactive Discussion
Discussion
Paper
|D
iscussionP
aper|
Discussion
Paper
|D
iscussionP
aper|
For the multi-model mean no big changes are projected in JanuaryndashFebruary This ispartly because of little change in precipitation (iii) and because the rainsnow line (iv)in these months is sufficiently low in the terrain today With the 500ndash600 m shift pro-jected with the RCP 85 80ndash90 of the area will still have temperatures low enoughfor snow The largest changes occur in MarchndashOctober when higher temperatures5
push the rainsnow line above large areas that receive snow today Increasing summerprecipitation (iii) causes the snowfall reduction in summer to be less than it would other-wise be The effect of higher temperatures is smaller on the APHRODITE snowfall thanon the MERRA reference snowfall (ii) as APHRODITE has very little summer snow-fall today The difference arises both from less precipitation (iii) in APHRODITE than10
MERRA today and from a higher rainsnow line (iv) in APHRODITE Note that as thechange in precipitation was defined as a fraction of the present-day value (Sect 23)the relative changes in APHRODITE and MERRA precipitation are equal
423 Upper Brahmaputra western part
In the westernmost part of the upper Brahmaputra Basin large snowfall changes are15
projected for the summer As cluster 5 in the Indus Basin Brahmaputrarsquos cluster 4 islimited to higher grounds Less than 6 lies outside of the 4000ndash6000 masl rangeThe cluster consists of Maquan He Yarlung Zangbo Dogxung ZangboMaiqu ZangboShang ChuYarlung ZangboNyang Lhasa HeRazheng Zangbo and Yamzho YumcoThe summer monsoon fully dominates the seasonal cycle of precipitation in this region20
(Fig 12a iii) resulting in a unimodal snow cycle with a maximum in JulyndashSeptember InAPHRODITE the seasonal cycle of snowfall is similar but less pronounced than in theMERRA reference The summer also sees the greatest reduction in CMIP5 projectedsnowfall both in absolute (ii) and relative (i) terms despite increasing summer precip-itation in all models (iii) The reason can be seen from the change in the rainsnow25
line elevation (iv) In the warmest months July and August elevation changes of 400ndash500 m would shift the rainsnow line from a level where at least 5ndash10 of the groundlies above the line to a level where only 1 of the area would receive precipitation as
463
TCD9 441ndash493 2015
Snowfall in theHimalayas an
uncertain future froma little-known past
E Viste and A Sorteberg
Title Page
Abstract Introduction
Conclusions References
Tables Figures
J I
J I
Back Close
Full Screen Esc
Printer-friendly Version
Interactive Discussion
Discussion
Paper
|D
iscussionP
aper|
Discussion
Paper
|D
iscussionP
aper|
snow In comparison with reference to MERRA the 300ndash400 m shift seen in JanuaryndashFebruary would cause only a small absolute change in snowfall (ii) because there islittle precipitation in these months (ii) and a small relative change (i) because therainsnow line would still be low in the terrain (iv) With reference to APHRODITE therelative snowfall change in winter would be larger than with reference to MERRA as5
temperatures today are higher resulting in a higher rainsnow line (iv)
424 Upper Brahmaputra eastern part
Like further west the Indian summer monsoon dominates the precipitation cycle in theeastern part of upper Brahmaputra (Fig 12b iii) but the seasonal cycle of snowfallpeaks in spring and fall (iii) This is also the time of the largest projected changes10
Cluster 3 in the Brahmaputra consists of the sub-basins Yarlung Zangbo2 NyangQu Yarlung Zangbo3 Yirsquoong ZangboParl Siyom Zaya QuLuhitDi About 70 of theground lies between 3000 and 6000 masl but there is also land almost at sea levelmainly in the Zaya QuLuhitDingba Qu sub-basin During summer most of the terrainlies below the rainsnow line (iv) In spring temperatures are lower than in summer15
and pre- monsoon precipitation is stronger in this part of the Himalayas than furtherwest in cluster 3 (Fig 12a iii vs Fig 12b iii) As a result MarchndashApril gets the mostsnow
Reductions in snowfall are projected for all months (ii) comparable in magnitude butlargest in the snow-rich spring and late summer The CMIP5 multi-model mean shows20
increasing or no change in precipitation in all months (Fig 12b iii) so the reductionin snowfall is due solely to higher temperatures The largest absolute reductions inApril and May occur with a 700ndash800 m shift in the rainsnow line elevation leaving30 more of the terrain in the rain The largest relative reduction in future snowfall areprojected for July and August (Fig 12b i) when the rainsnow line shifts so high that25
only the highest peaks can get precipitation as snow (iv) This would be despite thelowest changes in the rainsnow line only about 300 m in APHRODITE
464
TCD9 441ndash493 2015
Snowfall in theHimalayas an
uncertain future froma little-known past
E Viste and A Sorteberg
Title Page
Abstract Introduction
Conclusions References
Tables Figures
J I
J I
Back Close
Full Screen Esc
Printer-friendly Version
Interactive Discussion
Discussion
Paper
|D
iscussionP
aper|
Discussion
Paper
|D
iscussionP
aper|
43 Potential effects of reduced snowfall on water availability
With a few exceptions the CMIP5 multi-model mean precipitation change over the com-ing century is positive in all months in the upper Indus and Brahmaputra (Sect 42)Thus the projected reduction in snowfall is due solely to higher temperatures How-ever there is a large spread in precipitation projections among the models If tempera-5
tures increase as much as projected with the RCP 85 could any realistic precipitationchange in the HKH compensate and maintain present-day snowfall Results indicatethat this may happen in parts of the upper Indus but is out of the reach in the upperBrahmaputra As for water availability reduced snowfall may still cause more severeproblems in the Indus than in the Brahmaputra10
In cold regions where temperatures remain below freezing more winter precipita-tion may increase both the snow cover area the length of the snow season and theSWE (Collins et al 2013 Brutel-Vuilmet et al 2013 Raumlisaumlnen 2008 Gao et al 2012Wiltshire 2014) Raumlisaumlnen (2008) showed this to be the case in eastern Siberia andthe northernmost part of North America At the southern edge of the seasonal snow15
cover relevant for this study precipitation did not compensate and there was a reduc-tion in SWEWiltshire (2014) concluded that there would be small changes in snowfallin very cold and very warm regions of the HKH Snowfall in Nepal Bhutan and Hi-machal Pradesh where winters are warmer than in most parts of the range was mostvulnerable to higher temperatures The data presented in Sect 42 generally support20
the previous studiesOne of the reasons that precipitation does not compensate is that the highest pro-
jected precipitation increase in the HKH is seen in the summer when the temperaturetoday is so high that only the highest terrain is in the snow zone Shifting the rainsnowline upward even by only a few hundred meters reduces the area that receives snow25
greatly requiring very large increases in precipitation to compensate The summer isthe season with the largest relative reduction in snowfall in all the clusters described inSect 42 Except in the western upper Indus (cluster I4 Sect 421) which has very
465
TCD9 441ndash493 2015
Snowfall in theHimalayas an
uncertain future froma little-known past
E Viste and A Sorteberg
Title Page
Abstract Introduction
Conclusions References
Tables Figures
J I
J I
Back Close
Full Screen Esc
Printer-friendly Version
Interactive Discussion
Discussion
Paper
|D
iscussionP
aper|
Discussion
Paper
|D
iscussionP
aper|
little summer snowfall today the reduction in summer snowfall is notable in all clustersin the MERRA data in the Brahmaputra clusters also in APHRODITE
The largest change in snowfall is seen in the western part of the Brahmaputra (clus-ter B4 Sect 423) where a 400ndash500 m upward shift in the rainsnow line during sum-mer reduces the area with temperatures low enough for snowfall by a factor of 5ndash105
(Fig 12a iv values not shown) As a result the summer peak in the seasonal cycleof snowfall is replaced by a dip (Fig 12a ii) With an even distribution of precipitationwith elevation the area that still receives snow would have to receive 5ndash10 times asmuch precipitation to compensate for the lost snowfall Assuming more realisticallythat precipitation decreases above a certain height would require an even higher in-10
crease in precipitation In the model with the highest increase a doubling of the Julyprecipitation by the end of the century SWE is less than 25 of todayrsquos value in thatmonth (Fig 12a iii)
With a winter-dominated precipitation cycle the relative change in snowfall is smallerin the upper Indus than in the upper Brahmaputra Downscaling a high-emission sce-15
nario (A1B) in two CMIP3 models with a regional model Wiltshire (2014) found that bythe 2080s precipitation increased more than enough to compensate for higher temper-atures in the Karakoram Hindu Kush and Jammu and Kashmir in one of the modelsthe HadCM3 In the other model ECHAM5 precipitation increased less and snow-fall increased only in the higher parts of the Karakoram In our ensemble of CMIP520
models multi-model mean precipitation in the upper Indus clusters increases mainlyin the summer season when the inter-model spread is also the largest (Fig 11a iiiand 11b iii) Among the models 4ndash5 project increased winter precipitation in the upperIndus and in the uppermost cluster I5 this is associated with an increase in wintersnowfall (Fig 11b ii)25
Although it is the part of the HKH where snowfall is least reduced by increasingtemperatures (Fig 10b) the Karakoram and inner parts of the upper Indus may still bethe region where the changes have the largest impact on river run-off Compared tothe monsoon-dominated regions further east there is little summer precipitation and
466
TCD9 441ndash493 2015
Snowfall in theHimalayas an
uncertain future froma little-known past
E Viste and A Sorteberg
Title Page
Abstract Introduction
Conclusions References
Tables Figures
J I
J I
Back Close
Full Screen Esc
Printer-friendly Version
Interactive Discussion
Discussion
Paper
|D
iscussionP
aper|
Discussion
Paper
|D
iscussionP
aper|
much of the water in the rivers during summer is meltwater (Bookhagen and Burbank2010 Immerzeel et al 2010) As melting of snow and ice has not been analyzed inthis study we cannot quantify the effect of reduced snowmelt om river run-off but it isobvious that eventually reduced snowfall will lead to reduced melting In western partsof the HKH this may lead to changes in the seasonal cycle of the river flow5
As pointed out by Wiltshire (2014) increasing precipitation in the eastern HKH im-plies that water resources are likely to increase with climate change As snowfall andsnowmelt are both at maximum during summer (Rees and Collins 2006) meltwaterdoes not have the same importance for river flow in dry parts of the year as in the In-dus Reduced snowfall may reduce glaciers but ndash not considering potential changes in10
the amount of evaporation ndash there is no indication that there will be less water comingfrom the upper Brahmaputra
5 Concluding summary
In this study we have presented a suite of estimates of present-day snowfall in theIndus Ganges and Brahmaputra Basins and the changes in snowfall that would follow15
from CMIP5 projected changes in temperature and precipitation from 1971ndash2000 to2071ndash2100 The results show that if the temperature increases as much as in the RCP85 there will be much less snowfall despite increasing precipitation in most of theregion Limiting anthropogenic forcing to the RCP 26 level would still cause reductionsthough smaller20
Estimates of present-day snowfall based on a combination of temperature and pre-cipitation from reanalysis data and observations vary by factors of 2ndash4 The MERRAreanalysis gives higher estimates than TRMM 3B42 CRU TS and APHRODITE butthe spread is also large between the estimates based on the different observationallybased data sets This demonstrates the difficulties in assessing vulnerability to climate25
change in the region With limited knowledge of the current state future conditions arebound to be uncertain
467
TCD9 441ndash493 2015
Snowfall in theHimalayas an
uncertain future froma little-known past
E Viste and A Sorteberg
Title Page
Abstract Introduction
Conclusions References
Tables Figures
J I
J I
Back Close
Full Screen Esc
Printer-friendly Version
Interactive Discussion
Discussion
Paper
|D
iscussionP
aper|
Discussion
Paper
|D
iscussionP
aper|
Future changes in temperature and precipitation projected by climate models can stillprovide an indication of the relative change in snowfall With the RCP 85 the climatemodels project mean reductions in annual snowfall by 30ndash50 in the Indus Basin 50ndash60 in the Ganges Basin and 50ndash70 in the Brahmaputra Basin by 2071ndash2100 Withthe RCP 26 the corresponding reductions would be 10ndash20 in the Indus about 20 5
in the Ganges and 20ndash30 in the Brahmaputra The reductions are due to increasingtemperatures as the mean of the models show constant or increasing precipitationthroughout the year in most of the region
How much increasing temperatures reduce snowfall in a region depends on howmuch of the terrain that is below and above the freezing point today and on whether10
the terrain profile is such that the temperature increase transforms large areas fromsnow to rain zones With the RCP 85 the mean elevation where rain changes to snowndash the rainsnow line ndash creeps upward by 400ndash900 m in most of the region by 700ndash900 m
The largest relative change in snowfall is seen in the upper westernmost sub-basins15
of the Brahmaputra despite increasing precipitation and the lowest rainsnow line el-evation change (400ndash500 m) This is because a major part of this region is near thefreezing point today With the RCP 85 most of this region will have temperaturesabove freezing especially in the summer which is the wettest part of the year Theprojected reduction in annual snowfall is 65ndash75 20
In the upper Indus the effect of a warmer climate on snowfall is less extreme asmost of the terrain is high enough to have temperatures sufficiently far below freezingtoday Winter and spring brings most of the precipitation and the projected 600ndash800 mchange in the rainsnow line elevation during these seasons would leave most of theterrain below the freezing point Still a 20ndash40 reduction in annual snowfall is pro-25
jected with the RCP 85The range of our estimates of present-day snowfall illustrates how little that is known
about conditions that influence the availability of drinking water in some of the mostdensely populated parts of the world There is both a scientific and a societal need
468
TCD9 441ndash493 2015
Snowfall in theHimalayas an
uncertain future froma little-known past
E Viste and A Sorteberg
Title Page
Abstract Introduction
Conclusions References
Tables Figures
J I
J I
Back Close
Full Screen Esc
Printer-friendly Version
Interactive Discussion
Discussion
Paper
|D
iscussionP
aper|
Discussion
Paper
|D
iscussionP
aper|
for more information about precipitation in the HKH As a full-scale long-time observa-tional program covering all parts of the Himalayan range is not a likely possibility theonly hope for improved future knowledge of Himalayan snowfall lies in the improvementof satellite data and regional climate models
The Supplement related to this article is available online at5
doi105194tcd-9-441-2015-supplement
Acknowledgements This work has been carried out with support from the University of Bergenthe NORINDIA and SNOWHIM projects funded by The Research Council of Norway and theCentre for Climate Dynamics at the Bjerknes Centre for Climate Research We acknowledgethe World Climate Research Programmersquos Working Group on Coupled Modelling which is re-10
sponsible for CMIP and we thank the climate modeling groups listed in Table 3 of this paper forproducing and making available their model output For CMIP the US Department of EnergyrsquosProgram for Climate Model Diagnosis and Intercomparison provides coordinating support andled development of software infrastructure in partnership with the Global Organization for EarthSystem Science Portals15
References
Akhtar M Ahmad N and Booij M J The impact of climate change on the water resourcesof Hindukush-Karakorum-Himalaya region under different glacier coverage scenarios J Hy-drol 355 148ndash163 2008
Anders A M Roe G H Hallet B Montgomery D R Finnegan N J and Putkonen J20
Spatial patterns of precipitation and topography in the Himalaya in Tectonics Climate andLandscape Evolution Geological Society of America Special Paper edited by Willett S DHovius N Brandon M T and Fisher D Geological Society of America Boulder CO USA39ndash53 2006
469
TCD9 441ndash493 2015
Snowfall in theHimalayas an
uncertain future froma little-known past
E Viste and A Sorteberg
Title Page
Abstract Introduction
Conclusions References
Tables Figures
J I
J I
Back Close
Full Screen Esc
Printer-friendly Version
Interactive Discussion
Discussion
Paper
|D
iscussionP
aper|
Discussion
Paper
|D
iscussionP
aper|
Archer DR and Fowler HJ Spatial and temporal variations in precipitation in the UpperIndus Basin global teleconnections and hydrological implications Hydrol Earth Syst Sci8 47ndash61 doi105194hess-8-47-2004 2004
Bhutiyani M R Kale V S and Pawar N J Long-term trends in maximum minimum andmean annual air temperatures across the Northwestern Himalaya during the twentieth cen-5
tury Climatic Change 85 159ndash177 doi101007s10584-006-9196-1 2007Bhutiyani M R Kale V S and Pawar N J Climate change and the precipitation variations in
the northwestern Himalaya 1866ndash2006 Int J Climatol 30 535ndash548 doi101002joc19202010
Bookhagen B and Burbank D W Topography relief and TRMM-derived rainfall variations10
along the Himalaya Geophys Res Lett 33 L08405 doi1010292006GL026037 2006Bookhagen B and Burbank D W Toward a complete Himalayan hydrological budget spa-
tiotemporal distribution of snowmelt and rainfall and their impact on river discharge J Geo-phys Res 115 F03019 doi1010292009jf001426 2010
Franco B Fettweis X and Erpicum M Future projections of the Greenland ice sheet energy15
balance driving the surface melt The Cryosphere 7 1ndash18 doi105194tc-7-1-2013 2013Butt M J Characteristics of snow cover in the Hindukush Karakoram and Himalaya region
using Landsat satellite data Hydrol Process 10 3689ndash3698 doi101002hyp8375 2012Byun K and Choi M Uncertainty of snow water equivalent retrieved from AMSR-E brightness
temperature in northeast Asia Hydrol Process 28 12 doi101002hyp9846 201420
Chaturvedi R K Joshi J Jayaraman M Bala G and Ravindranath N H Multi-modelclimate change projections for India under representative concentration pathways Curr SciIndia 103 791ndash802 2012
Christensen J H Krishna Kumar K Aldrian E An S-I Cavalcanti I F A Castro Md Dong W Goswami P Hall A Kanyanga J K Kitoh A Kossin J Lau N-C Ren-25
wick J Stephenson D B Xie S-P and Zhou T Climate phenomena and their relevancefor future regional climate change in Climate Change 2013 The Physical Science BasisContribution of Working Group I to the Fifth Assessment Report of the Intergovernmen-tal Panel on Climate Change edited by Stocker T F Qin D Plattner G-K Tignor MAllen S K Boschung J Nauels A Xia Y Bex V and Midgley P M Cambridge Univer-30
sity Press Cambridge UK and New York NY USA 92 2013Collins M Knutti R Arblaster J Dufresne J-L Fichefet T Friedlingstein P Gao X
Gutowski W J Johns T Krinner G Shongwe M Tebaldi C Weaver A J and
470
TCD9 441ndash493 2015
Snowfall in theHimalayas an
uncertain future froma little-known past
E Viste and A Sorteberg
Title Page
Abstract Introduction
Conclusions References
Tables Figures
J I
J I
Back Close
Full Screen Esc
Printer-friendly Version
Interactive Discussion
Discussion
Paper
|D
iscussionP
aper|
Discussion
Paper
|D
iscussionP
aper|
Wehner M Long-term climate change projections commitments and irreversibility in Cli-mate Change 2013 The Physical Science Basis Contribution of Working Group I to theFifth Assessment Report of the Intergovernmental Panel on Climate Change edited byStocker T F Qin D Plattner G-K Tignor M Allen S K Boschung J Nauels AXia Y Bex V and Midgley P M Cambridge University Press Cambridge UK and New5
York NY USA 108 2013Cook E R Palmer J G Ahmed M Woodhouse C A Fenwick P Zafar M U Wahab M
and Khan N Five centuries of Upper Indus River flow from tree rings J Hydrol 486 365ndash375 doi101016jjhydrol201302004 2013
Dai A Temperature and pressure dependence of the rain-snow phase transition over land and10
ocean Geophys Res Lett 35 L12802 doi1010292008gl033295 2008Fowler H J and Archer D R Conflicting signals of climatic change in the Upper Indus Basin
J Climate 19 4276ndash4293 doi101175jcli38601 2006Gao J Williams M W Fu X Wang G and Gong T Spatiotemporal distribution of snow
in eastern Tibet and the response to climate change Remote Sens Environ 121 1ndash915
doi101016jrse201201006 2012Gardelle J Berthier E and Arnaud Y Slight mass gain of Karakoram glaciers in the
early twenty-first century ndash Supplement Nature Geosci 5 322ndash325 doi101038ngeo14502012
Guhathakurta P and Rajeevan M Trends in the rainfall pattern over India Int J Climatol20
28 1453ndash1469 doi101002joc1640 2008Harris I Jones P D Osborn T J and Lister D H Updated high-resolution grids of
monthly climatic observations ndash the CRU TS310 Dataset Int J Climatol 34 623ndash642doi101002joc3711 2014
Hartmann H and Andresky L Flooding in the Indus River basin ndash a spa-25
tiotemporal analysis of precipitation records Global Planet Change 107 25ndash35doi101016jgloplacha201304002 2013
Hastings D and Dunbar P Development amp Assessment of the Global Land One-km BaseElevation Digital Elevation Model (GLOBE) ISPRS Commission IV Symposium on GIS ndashBetween Visions and Applications Stuttgart Germany 7ndash10 September 199830
Hewitt K The Karakoram anomaly Glacier expansion and the ldquoelevation ef-fectrdquo Karakoram Himalaya Mt Res Dev 25 332ndash340 doi1016590276-4741(2005)025[0332TKAGEA]20CO2 2005
471
TCD9 441ndash493 2015
Snowfall in theHimalayas an
uncertain future froma little-known past
E Viste and A Sorteberg
Title Page
Abstract Introduction
Conclusions References
Tables Figures
J I
J I
Back Close
Full Screen Esc
Printer-friendly Version
Interactive Discussion
Discussion
Paper
|D
iscussionP
aper|
Discussion
Paper
|D
iscussionP
aper|
Huffman G J Adler R F Bolvin D T Gu G Nelkin E J Bowman K P Hong YStocker E F and Wolff D B The TRMM Multisatellite Precipitation Analysis (TMPA) quasi-global multiyear combined-sensor precipitation estimates at fine scales J Hydrometeorol8 38ndash55 2007
Immerzeel W Historical trends and future predictions of climate variability in the Brahmaputra5
basin Int J Climatol 28 243ndash254 doi101002joc1528 2008Immerzeel W W Droogers P de Jong S M and Bierkens M F P Large-scale monitoring
of snow cover and runoff simulation in Himalayan river basins using remote sensing RemoteSens Environ 113 40ndash49 doi101016jrse200808010 2009
Immerzeel W W van Beek L P H and Bierkens M F P Climate change will affect the10
asian water towers Science 328 1382ndash1385 doi101126science1183188 2010Ines A V M and Hansen J W Bias correction of daily GCM rainfall for crop simulation
studies Agr Forest Meteorol 138 44ndash53 doi101016jagrformet200603009 2006Jain S K Goswami A and Saraf A K Role of elevation and aspect in snow distribution
in western Himalaya Water Resour Manag 23 71ndash83 doi101007s11269-008-9265-515
2009Krakauer N Pradhanang S Lakhankar T and Jha A Evaluating satellite products for
precipitation estimation in mountain regions a case study for Nepal Remote Sensing 54107ndash4123 2013
Krishna A P Snow and glacier cover assessment in the high mountains of Sikkim Himalaya20
Hydrol Process 19 2375ndash2383 doi101002hyp5890 2005Kulkarni A V Rathore B P Singh S K and Ajai Distribution of seasonal snow cover in cen-
tral and western Himalaya Ann Glaciol 51 123ndash128 doi1031891727564107913864452010
Kumar V Rao Y S Venkataraman G Sarwade R N and Mani S Analysis of Aqua25
AMSR-E Derived Snow Water Equivalent over Himalayan Snow Covered Regions Geo-science and Remote Sensing Symposium Denver CO USA 31 Julyndash4 August 2006
Kaumlaumlb A Berthier E Nuth C Gardelle J and Arnaud Y Contrasting patterns of earlytwenty-first-century glacier mass change in the Himalayas Nature 488 495ndash498 availableat httpwwwnaturecomnaturejournalv488n7412absnature11324html ndash Supplement30
2012Lehner B Verdin K and Jarvis A New global hydrography derived from spaceborne eleva-
tion data Eos T Am Geophys Un 89 93ndash94 doi1010292008EO100001 2008
472
TCD9 441ndash493 2015
Snowfall in theHimalayas an
uncertain future froma little-known past
E Viste and A Sorteberg
Title Page
Abstract Introduction
Conclusions References
Tables Figures
J I
J I
Back Close
Full Screen Esc
Printer-friendly Version
Interactive Discussion
Discussion
Paper
|D
iscussionP
aper|
Discussion
Paper
|D
iscussionP
aper|
MacQueen J Some Methods for Classification and Analysis of Multivariate ObservationsFifth Berkeley Symposium on Mathematical Statistics and Probability Berkeley California21 Junendash18 July 1967
Meacuteneacutegoz M Galleacutee H and Jacobi H W Precipitation and snow cover in the Himalayafrom reanalysis to regional climate simulations Hydrol Earth Syst Sci 17 3921ndash39365
doi105194hess-17-3921-2013 2013Menon A Levermann A Schewe J Lehmann J and Frieler K Consistent increase in
Indian monsoon rainfall and its variability across CMIP-5 models Earth Syst Dynam 4287ndash300 doi105194esd-4-287-2013 2013
Moss R H Edmonds J A Hibbard K A Manning M R Rose S K van Vuuren D P10
Carter T R Emori S Kainuma M Kram T Meehl G A Mitchell J F B Naki-cenovic N Riahi K Smith S J Stouffer R J Thomson A M Weyant J P andWilbanks T J The next generation of scenarios for climate change research and assess-ment Nature 463 747ndash756 2010
Negi H S Kulkarni A V and Semwal B S Estimation of snow cover distribution in Beas15
basin Indian Himalaya using satellite data and ground measurements J Earth Syst Sci118 525ndash538 doi101007s12040-009-0039-0 2009
Palazzi E v Hardenberg J and Provenzale A Precipitation in the Hindu-Kush Karako-ram Himalaya observations and future scenarios J Geophys Res-Atmos 118 85ndash100doi1010292012JD018697 201320
Rees H G and Collins D N Regional differences in response of flow in glacier-fed Himalayanrivers to climatic warming Hydrol Process 20 2157ndash2169 doi101002hyp6209 2006
Rienecker M M Suarez M J Gelaro R Todling R Bacmeister J Liu EBosilovich M G Schubert S D Takacs L Kim G-K Bloom S Chen J Collins DConaty A da Silva A Gu W Joiner J Koster R D Lucchesi R Molod A Owens T25
Pawson S Pegion P Redder C R Reichle R Robertson F R Ruddick A GSienkiewicz M and Woollen J MERRA NASArsquos Modern-Era Retrospective Analysis forResearch and Applications J Climate 24 3624ndash3648 doi101175JCLI-D-11-0001512011
Rikiishi K and Nakasato H Height dependence of the tendency for reduction in seasonal30
snow cover in the Himalaya and the Tibetan Plateau region 1966ndash2001 Ann Glaciol 43369ndash377 doi103189172756406781811989 2006
473
TCD9 441ndash493 2015
Snowfall in theHimalayas an
uncertain future froma little-known past
E Viste and A Sorteberg
Title Page
Abstract Introduction
Conclusions References
Tables Figures
J I
J I
Back Close
Full Screen Esc
Printer-friendly Version
Interactive Discussion
Discussion
Paper
|D
iscussionP
aper|
Discussion
Paper
|D
iscussionP
aper|
Raumlisaumlnen J Warmer climate less or more snow Clim Dynam 30 307ndash319doi101007s00382-007-0289-y 2008
Schaner N Voisin N Nijssen B and Lettenmaier D P The contribution of glacier melt tostreamflow Environ Res Lett 7 034029 doi1010881748-932673034029 2012
Scherler D Bookhagen B and Strecker M R Spatially variable response of Himalayan5
glaciers to climate change affected by debris cover Nature Geosci 4 156ndash159 availableat httpwwwnaturecomngeojournalv4n3absngeo1068html ndash Supplement 2011
Sharif M Archer D R Fowler H J and Forsythe N Trends in timing and magnitude offlow in the Upper Indus Basin Hydrol Earth Syst Sci 17 1503ndash1516 doi105194hess-17-1503-2013 201310
Shekhar M S Chand H Kumar S Srinivasan K and Ganju A Climate-change studiesin the western Himalaya Ann Glaciol 51 105ndash112 doi1031891727564107913865082010
Shrestha A B Wake C P Mayewski P A and Dibb J E Maximum tempera-ture trends in the Himalaya and its vicinity an analysis based on temperature records15
from Nepal for the period 1971ndash94 J Climate 12 2775ndash2786 doi1011751520-0442(1999)012lt2775MTTITHgt20CO2 1999
Shrestha A B Wake C P Dibb J E and Mayewski P A Precipitation fluctuations in theNepal Himalaya and its vicinity and relationship with some large scale climatological parame-ters Int J Climatol 20 317ndash327 doi101002(SICI)1097-0088(20000315)203lt317AID-20
JOC476gt30CO2-G 2000Siderius C Biemans H Wiltshire A Rao S Franssen W H P Kumar P Gosain A K
van Vliet M T H and Collins D N Snowmelt contributions to discharge of the GangesSci Total Environ Supplement 468ndash469 9 doi101016jscitotenv201305084 2013
Singh P Jain S K and Kumar N Estimation of snow and glacier-melt contribution to the25
Chenab River Western Himalaya Mt Res Dev 17 49ndash56 doi1023073673913 1997Singh P Kumar V Thomas T and Arora M Changes in rainfall and relative hu-
midity in river basins in northwest and central India Hydrol Process 22 2982ndash2992doi101002hyp6871 2008
Sontakke N A Singh N and Singh H N Instrumental period rainfall series of the Indian30
region (AD 1813ndash2005) revised reconstruction update and analysis Holocene 18 1055ndash1066 doi1011770959683608095576 2008
474
TCD9 441ndash493 2015
Snowfall in theHimalayas an
uncertain future froma little-known past
E Viste and A Sorteberg
Title Page
Abstract Introduction
Conclusions References
Tables Figures
J I
J I
Back Close
Full Screen Esc
Printer-friendly Version
Interactive Discussion
Discussion
Paper
|D
iscussionP
aper|
Discussion
Paper
|D
iscussionP
aper|
Sperber K R Annamalai H Kang I S Kitoh A Moise A Turner A Wang B andZhou T The Asian summer monsoon an intercomparison of CMIP5 vs CMIP3 simulationsof the late 20th century Clim Dynam 41 2711ndash2744 doi101007s00382-012-1607-62013
Tahir A A Chevallier P Arnaud Y and Ahmad B Snow cover dynamics and hydrological5
regime of the Hunza River basin Karakoram Range Northern Pakistan Hydrol Earth SystSci 15 2275ndash2290 doi105194hess-15-2275-2011 2011a
Tahir A A Chevallier P Arnaud Y Neppel L and Ahmad B Modeling snowmelt-runoffunder climate scenarios in the Hunza River basin Karakoram Range Northern Pakistan JHydrol 409 104ndash117 doi101016jjhydrol201108035 2011b10
Taylor K E Stouffer R J and Meehl G A An overview of CMIP5 and the experimentdesign B Am Meteorol Soc 93 14 doi101175BAMS-D-11-000941 2011
Tedesco M and Narvekar P S Assessment of the NASA AMSR-E SWE product IEEE J SelTop Appl 3 141ndash159 doi101109JSTARS20102040462 2010
Teutschbein C and Seibert J Bias correction of regional climate model simulations for hydro-15
logical climate-change impact studies review and evaluation of different methods J Hydrol456ndash457 12ndash29 doi101016jjhydrol201205052 2012
Turner A G and Annamalai H Climate change and the South Asian summer monsoon NatClim Change 2 587ndash595 2012
van Vuuren D Edmonds J Kainuma M Riahi K Thomson A Hibbard K Hurtt G20
Kram T Krey V Lamarque J-F Masui T Meinshausen M Nakicenovic N Smith Sand Rose S The representative concentration pathways an overview Climatic Change109 26 doi101007s10584-011-0148-z 2011
Wang A and Zeng X Development of global hourly 05-degree land surface air temperaturedatasets J Climate 26 7676ndash7691 doi101175JCLI-D-12-006821 201325
Wiltshire A J Climate change implications for the glaciers of the Hindu Kush Karakoram andHimalayan region The Cryosphere 8 941ndash958 doi105194tc-8-941-2014 2014
Winiger M Gumpert M and Yamout H KarakorumndashHindukushndashwestern Himalaya assess-ing high-altitude water resources Hydrol Process 19 2329ndash2338 doi101002hyp5887200530
Xu X Lu C Shi X and Gao S World water tower An atmospheric perspective GeophysRes Lett 35 L20815 doi1010292008GL035867 2008a
475
TCD9 441ndash493 2015
Snowfall in theHimalayas an
uncertain future froma little-known past
E Viste and A Sorteberg
Title Page
Abstract Introduction
Conclusions References
Tables Figures
J I
J I
Back Close
Full Screen Esc
Printer-friendly Version
Interactive Discussion
Discussion
Paper
|D
iscussionP
aper|
Discussion
Paper
|D
iscussionP
aper|
Xu Z X Gong T L and Li J Y Decadal trend of climate in the Tibetan Plateaumdashregionaltemperature and precipitation Hydrol Process 22 3056ndash3065 doi101002hyp68922008b
Yasutomi N Hamada A and Akiyo Y Development of a Long-term Daily Gridded Temper-ature Dataset and its Application to RainSnow Discrimination of Daily Precipitation Global5
Environ Res15 165ndash172 2011Yatagai A Kamiguchi K Arakawa O Hamada A Yasutomi N and Kitoh A APHRODITE
Constructing a Long-Term Daily Gridded Precipitation Dataset for Asia Based on a DenseNetwork of Rain Gauges B Am Meteorol Soc 93 1401ndash1415 doi101175BAMS-D-11-001221 201210
You Q Kang S Aguilar E and Yan Y Changes in daily climate extremes in the east-ern and central Tibetan Plateau during 1961ndash2005 J Geophys Res-Atmos 113 D07101doi1010292007JD009389 2008
476
TCD9 441ndash493 2015
Snowfall in theHimalayas an
uncertain future froma little-known past
E Viste and A Sorteberg
Title Page
Abstract Introduction
Conclusions References
Tables Figures
J I
J I
Back Close
Full Screen Esc
Printer-friendly Version
Interactive Discussion
Discussion
Paper
|D
iscussionP
aper|
Discussion
Paper
|D
iscussionP
aper|
Table 1 Combinations of data types used in snowfall estimates T temperature P precipita-tion f (P T ) indicates that snowfall is calculated as a function of P and T
Precipitation Temperature Snowfall Time
MERRA MERRA PresentMERRA reference MERRA Terrain-adjusted MERRA f (P T ) PresentMERRA T2m MERRA MERRA T2m f (P T ) PresentBias-corrected with obs T MERRA Bias-corr terrain-adj MERRA f (P T ) PresentBias-corrected with obs P Bias-corr MERRA Terrain-adjusted MERRA f (P T ) PresentBias-corrected with obs T P Bias-corr MERRA Bias-corr terrain-adj MERRA f (P T ) PresentCMIP5 T MERRA Terrain-adj MERRA+∆T f (P T ) FutureCMIP5 P MERRAtimes∆P Terrain-adj MERRA f (P T ) FutureCMIP5 T P MERRAtimes∆P Terrain-adj MERRA+∆T f (P T ) FutureBias-corr CMIP5 T Bias-corr MERRA Bias-corr terrain-adj MERRA+∆T f (P T ) FutureBias-corr CMIP5 P Bias-corr MERRAtimes∆P Bias-corr terrain-adj MERRA f (P T ) FutureBias-corr CMIP5 T P Bias-corr MERRAtimes∆P Bias-corr terrain-adj MERRA+∆T f (P T ) Future
477
TCD9 441ndash493 2015
Snowfall in theHimalayas an
uncertain future froma little-known past
E Viste and A Sorteberg
Title Page
Abstract Introduction
Conclusions References
Tables Figures
J I
J I
Back Close
Full Screen Esc
Printer-friendly Version
Interactive Discussion
Discussion
Paper
|D
iscussionP
aper|
Discussion
Paper
|D
iscussionP
aper|
Table 2 Data sets used in calculations of present-day snowfall
Product Time Hor res Description
MERRA 1979ndash2012 05 lat 07 lon Hourly atmospheric reanalysis data(Rienecker et al 2011)
APHRODITEV1204V1101
1979ndash2007 025 Daily temperature andprecipitation basedon observations (Yatagai et al 2012Yasutomi et al 2011)
CRU TS 320 1979ndash2011 05 Monthly temperature and precipitationbased on observations(Harris et al 2014)
TRMM 3B42 V7 1998ndash2012 05 3 hourly satellite-based precipitation(Huffman et al 2007)
GLOBE 1 km Topography data set(Hastings and Dunbar 1998)
478
TCD9 441ndash493 2015
Snowfall in theHimalayas an
uncertain future froma little-known past
E Viste and A Sorteberg
Title Page
Abstract Introduction
Conclusions References
Tables Figures
J I
J I
Back Close
Full Screen Esc
Printer-friendly Version
Interactive Discussion
Discussion
Paper
|D
iscussionP
aper|
Discussion
Paper
|D
iscussionP
aper|
Table 3 CMIP5 models and RCPs used (x) in calculations of 2071ndash2100 snowfall
Model RCP 26 RCP 85
CanESM2 x xCCSM4 x xCESM1-CAM5 xCNRM-CM5 xGFDL-CM3 x xGFDL-ESM2G xGISS-E2-R x xHadGEM2-ES x xIPSL-CM5A-LR x xIPSL-CM5A-MR x xMIROC-ESM x xMIROC-ESM-CHEM x xMIROC5 x xMRI-CGCM3 x xNorESM1-M x xNorESM1-ME x x
479
TCD9 441ndash493 2015
Snowfall in theHimalayas an
uncertain future froma little-known past
E Viste and A Sorteberg
Title Page
Abstract Introduction
Conclusions References
Tables Figures
J I
J I
Back Close
Full Screen Esc
Printer-friendly Version
Interactive Discussion
Discussion
Paper
|D
iscussionP
aper|
Discussion
Paper
|D
iscussionP
aper|
Table 4 Annual snowfall estimates for the Indus Ganges and Brahmaputra Basins S snow[km3 SWE] P precipitation [km3] S and P percent of MERRA reference snowfall andMERRA precipitation First horizontal section no bias-corrections Second third and fourthsection bias-corrections with T P and both T and P
Indus Basin Ganges Basin Brahmaputra BasinInput S S P P S S P P S S P P
MERRA reference 148 100 422 100 54 100 1147 100 119 100 733 100MERRA 166 112 422 100 49 90 1147 100 129 109 733 100MERRA T2m 154 104 422 100 42 77 1147 100 109 92 733 100T APHRODITE 113 76 422 100 30 55 1147 100 74 62 733 100T CRU 126 85 422 100 81 151 1147 100 109 92 733 100P APHRODITE 66 44 315 75 22 42 1020 89 35 30 567 77P TRMM 72 49 404 96 31 57 1244 108 63 54 835 114P CRU 84 56 398 94 30 56 1100 96 53 45 716 98P T APHRODITE 49 33 315 75 12 22 1020 89 20 17 567 77P APHRODITE T CRU 62 42 315 75 34 63 1020 89 33 28 567 77P TRMM T APHRODITE 54 36 390 92 18 34 1195 104 39 33 815 111P TRMM T CRU 65 44 403 96 46 85 1254 109 58 49 813 111P CRU T APHRODITE 65 44 395 94 17 31 1106 96 31 26 718 98P T CRU 80 54 398 94 41 75 1100 96 49 42 716 98
480
TCD9 441ndash493 2015
Snowfall in theHimalayas an
uncertain future froma little-known past
E Viste and A Sorteberg
Title Page
Abstract Introduction
Conclusions References
Tables Figures
J I
J I
Back Close
Full Screen Esc
Printer-friendly Version
Interactive Discussion
Discussion
Paper
|D
iscussionP
aper|
Discussion
Paper
|D
iscussionP
aper|
Table 5 Projected change in annual snowfall from 1971ndash2000 to 2071ndash2100 with referenceto terrain-adjusted MERRA and APHRODITE ∆Sabs [km3] is the absolute change ∆Srel [] isthe relative change compared to the present-day MERRA reference snowfall Values are pre-sented with the CMIP5 multi-model mean as the main value and the span of individual modelsin brackets (MERRA only) ∆TP indicates that changes in both temperature and precipitationare included whereas ∆P and ∆T denotes changes only in precipitation or temperature re-spectively
Indus Ganges Brahmaputra∆Sabs [km3] ∆Srel [] ∆Sabs [km3] ∆Srel [] ∆Sabs [km3] ∆Srel []
RCP 85 MERRA ∆TP minus49 [minus83minus9] minus33 [minus56minus6] minus27 [minus36minus14] minus50 [minus66minus25] minus64 [minus93minus39] minus54 [minus79minus33]MERRA ∆T minus51 [minus67minus34] minus34 [minus45minus23] minus28 [minus34minus21] minus51 [minus64minus39] minus71 [minus87minus53] minus60 [minus73minus44]MERRA ∆P 5 [minus2544] 4 [minus1730] 7 [minus417] 12 [minus731] 20 [minus1750] 17 [minus1542]
APHRO ∆TP minus25 minus51 minus7 minus56 minus13 minus67APHRO ∆T minus25 minus52 minus7 minus57 minus14 minus71APHRO ∆P 1 1 1 6 3 16
RCP 26 MERRA ∆TP minus15 [minus406] minus10 [minus274] minus10 [minus19minus3] minus18 [minus36minus5] minus25 [minus42minus5] minus21 [minus35minus4]MERRA ∆T minus18 [minus27minus9] minus12 [minus18minus6] minus12 [minus21minus6] minus21 [minus39minus11] minus29 [minus47minus13] minus25 [minus40minus11]MERRA ∆P 3 [minus1825] 2 [minus1217] 3 [minus210] 5 [minus419] 7 [minus828] 6 [minus623]
APHRO ∆TP minus9 minus18 minus2 minus20 minus6 minus29APHRO ∆T minus10 minus19 minus3 minus23 minus6 minus32APHRO ∆P 1 1 0 4 1 6
481
TCD9 441ndash493 2015
Snowfall in theHimalayas an
uncertain future froma little-known past
E Viste and A Sorteberg
Title Page
Abstract Introduction
Conclusions References
Tables Figures
J I
J I
Back Close
Full Screen Esc
Printer-friendly Version
Interactive Discussion
Discussion
Paper
|D
iscussionP
aper|
Discussion
Paper
|D
iscussionP
aper|
Figure 1 Map of the region with the Indus Ganges and Brahmaputra basins outlined in whiteThinner outlines are national borders Background NASA Visible Earth
482
TCD9 441ndash493 2015
Snowfall in theHimalayas an
uncertain future froma little-known past
E Viste and A Sorteberg
Title Page
Abstract Introduction
Conclusions References
Tables Figures
J I
J I
Back Close
Full Screen Esc
Printer-friendly Version
Interactive Discussion
Discussion
Paper
|D
iscussionP
aper|
Discussion
Paper
|D
iscussionP
aper|
0
400 mm
Months 1ndash12
SP
I1
I2I3
I5I4
G1
G2G3
G4
B1
B2
B3B4
Viste amp SortebergFigure 2
Figure 2 Monthly mean MERRA precipitation and MERRA reference snowfall in sub-basinclusters of the Indus (I) Ganges (G) and Brahmaputra (B) Total bar height MERRA precip-itation (P) [mm] Colored bars snowfall (S) [mm SWE] based on MERRA precipitation andterrain-adjusted MERRA temperature in the region with the same color Cluster 1 in eachbasin is considered snow-free and the seasonal cycles are not shown
483
TCD9 441ndash493 2015
Snowfall in theHimalayas an
uncertain future froma little-known past
E Viste and A Sorteberg
Title Page
Abstract Introduction
Conclusions References
Tables Figures
J I
J I
Back Close
Full Screen Esc
Printer-friendly Version
Interactive Discussion
Discussion
Paper
|D
iscussionP
aper|
Discussion
Paper
|D
iscussionP
aper|
a) MERRA reference b) APHRODITE c) APHRODITE ndash MERRA ref
30 km3
20100-10-20-30
Viste amp SortebergFigure 3
Figure 3 The effect of bias-corrections with APHRODITE temperature and precipitation(a) MERRA reference snowfall (b) Snowfall based on bias-corrections with APHRODITE(c) APHRODITE (b) minus MERRA reference snowfall (a)
484
TCD9 441ndash493 2015
Snowfall in theHimalayas an
uncertain future froma little-known past
E Viste and A Sorteberg
Title Page
Abstract Introduction
Conclusions References
Tables Figures
J I
J I
Back Close
Full Screen Esc
Printer-friendly Version
Interactive Discussion
Discussion
Paper
|D
iscussionP
aper|
Discussion
Paper
|D
iscussionP
aper|
Figure 4 Difference between MERRA precipitation and observation-based data (a) Annualmean MERRA precipitation (b c and d) Annual mean MERRA precipitation bias-correctedwith observations APHRODITE CRU TS and TRMM 3B42 For each data set the small insetmaps show the observations minus MERRA
485
TCD9 441ndash493 2015
Snowfall in theHimalayas an
uncertain future froma little-known past
E Viste and A Sorteberg
Title Page
Abstract Introduction
Conclusions References
Tables Figures
J I
J I
Back Close
Full Screen Esc
Printer-friendly Version
Interactive Discussion
Discussion
Paper
|D
iscussionP
aper|
Discussion
Paper
|D
iscussionP
aper|
Biasminuscorrected minus original MERRA temperature [C]
minus15
minus10
minus5
0
5
10
Biasminuscorrected minus original MERRA temperature [C]
minus15
minus10
minus5
0
5
10
MERRA mean temperature [C] 1979minus2007
minus15
minus10
minus5
0
5
10
15
20
25
30a) MERRA b) APHRODITE ndash MERRA c) CRU ndash MERRA
-10
0
10
20
30degC
minus15
minus10
minus5
0
5
10
15degC
Viste amp SortebergFigure 5
Figure 5 Difference between MERRA temperature and observation-based data (a) Annualmean MERRA temperature (b and c) Annual mean MERRA temperature bias-corrected withobservations APHRODITE and CRU TS
486
TCD9 441ndash493 2015
Snowfall in theHimalayas an
uncertain future froma little-known past
E Viste and A Sorteberg
Title Page
Abstract Introduction
Conclusions References
Tables Figures
J I
J I
Back Close
Full Screen Esc
Printer-friendly Version
Interactive Discussion
Discussion
Paper
|D
iscussionP
aper|
Discussion
Paper
|D
iscussionP
aper|
Jan Apr
Jul Oct
a)
c)
b)
d)
15degC
10
5
0
ndash5
ndash10
ndash15
200 mm16012080400ndash40ndash80ndash120ndash160ndash200
Viste amp SortebergFigure 6
Figure 6 Regions where increasing temperatures are likely to cause a shift from snow to rainData monthly mean MERRA temperature terrain-adjusted to a 4 km GLOBE grid Red temper-ature between minus5 and 0 considered critical Small inset maps monthly MERRA precipitationin the critical zones
487
TCD9 441ndash493 2015
Snowfall in theHimalayas an
uncertain future froma little-known past
E Viste and A Sorteberg
Title Page
Abstract Introduction
Conclusions References
Tables Figures
J I
J I
Back Close
Full Screen Esc
Printer-friendly Version
Interactive Discussion
Discussion
Paper
|D
iscussionP
aper|
Discussion
Paper
|D
iscussionP
aper|
1 2 3 4 5 6 7 8 9 10 11 12Month
∆T [ordm
C]
a) Indus
0
1
2
3
4
5
6
7
8
9
10
b) Ganges∆T
[ordmC
]
1 2 3 4 5 6 7 8 9 10 11 12Month
1
2
3
4
5
6
7
8
0 0
c) Brahmaputra
∆T [ordm
C]
1 2 3 4 5 6 7 8 9 10 11 12Month
1
2
3
4
5
6
7
8
9
10 RCP 85RCP 85 meanRCP 26RCP 26 mean
Viste amp SortebergFigure 7
Figure 7 Projected future temperature change from 1971ndash2000 to 2071ndash2100 in the (a) In-dus (b) Ganges and (c) Brahmaputra Basins Thin lines show the individual CMIP5 modelsstronger lines the multi-model mean
488
TCD9 441ndash493 2015
Snowfall in theHimalayas an
uncertain future froma little-known past
E Viste and A Sorteberg
Title Page
Abstract Introduction
Conclusions References
Tables Figures
J I
J I
Back Close
Full Screen Esc
Printer-friendly Version
Interactive Discussion
Discussion
Paper
|D
iscussionP
aper|
Discussion
Paper
|D
iscussionP
aper|
1 2 3 4 5 6 7 8 9 10 11 12Month
[km
3 ]
a) Indus
0
20
40
60
80
100
120
140
b) Ganges[k
m3 ]
1 2 3 4 5 6 7 8 9 10 11 12Month
0
100
200
300
400
500
600
700
c) Brahmaputra
[km
3 ]
1 2 3 4 5 6 7 8 9 10 11 12Month
0
50
100
150
200
250
MERRA ref
2071ndash2100
1979ndash2008
RCP 85RCP 85 meanRCP 26RCP 26 mean
Viste amp SortebergFigure 8
Figure 8 Projected future precipitation in the (a) Indus (b) Ganges and (c) BrahmaputraBasins Gray bars MERRA 1979ndash2008 Thin lines and horizontal marks on the bars show theindividual CMIP5 models and the multi-model mean for 2071ndash2100
489
TCD9 441ndash493 2015
Snowfall in theHimalayas an
uncertain future froma little-known past
E Viste and A Sorteberg
Title Page
Abstract Introduction
Conclusions References
Tables Figures
J I
J I
Back Close
Full Screen Esc
Printer-friendly Version
Interactive Discussion
Discussion
Paper
|D
iscussionP
aper|
Discussion
Paper
|D
iscussionP
aper|
1 2 3 4 5 6 7 8 9 10 11 120
5
10
15
20
25
30
35
Month
SWE
[km
3 ]
a) Indus
0
1
2
3
4
5
6
7
8
b) Ganges
SWE
[km
3 ]
1 2 3 4 5 6 7 8 9 10 11 12Month
0
2
4
6
8
10
12
14
16
18
20
c) Brahmaputra
SWE
[km
3 ]
1 2 3 4 5 6 7 8 9 10 11 12Month
MERRA ref
2071ndash2100
1979ndash2008
RCP 85RCP 85 meanRCP 26RCP 26 mean
Viste amp SortebergFigure 9
Figure 9 Projected future snowfall in the (a) Indus (b) Ganges and (c) Brahmaputra Basinswith reference to MERRA reference snowfall Gray bars MERRA reference snowfall for 1979ndash2008 Thin lines and horizontal marks on the bars show the individual CMIP5 models andthe multi-model mean for 2071ndash2100 based on changes in temperature and precipitation asdescribed in Sect 23
490
TCD9 441ndash493 2015
Snowfall in theHimalayas an
uncertain future froma little-known past
E Viste and A Sorteberg
Title Page
Abstract Introduction
Conclusions References
Tables Figures
J I
J I
Back Close
Full Screen Esc
Printer-friendly Version
Interactive Discussion
Discussion
Paper
|D
iscussionP
aper|
Discussion
Paper
|D
iscussionP
aper|
Figure 10 Projected future changes in snowfall in sub-basins of the Indus Ganges andBrahmaputra Basins (a) Absolute change [km3] with reference to MERRA reference snow-fall (b) Absolute change [km3] with reference to APHRODITE snowfall (c d) Correspondingrelative changes [] with reference to MERRA and APHRODITE
491
TCD9 441ndash493 2015
Snowfall in theHimalayas an
uncertain future froma little-known past
E Viste and A Sorteberg
Title Page
Abstract Introduction
Conclusions References
Tables Figures
J I
J I
Back Close
Full Screen Esc
Printer-friendly Version
Interactive Discussion
Discussion
Paper
|D
iscussionP
aper|
Discussion
Paper
|D
iscussionP
aper|
J F M A M J J A S O N DMonth
0
5
10
15
20 km3Precip
0
2
4
6
8
10 km3SWE
2000
3000
4000
5000
6000 masl
1845
J F
M
A
M
JJ A
S
O
N
D
RSL
I4A = 146793 km2
1 km 3 = 68 mm
0
05
1
15 SWE rel
8000 m
0
J F M A M J J A S O N DMonth
0
2
4
6
8
10
12 km3 SWE
3000
4000
5000
6000 masl
78
2
14
J FM
A
MJ
J AS
O
ND
RSL
I5
Precip
0
5
10
15
20
25 km3
0
05
1
15 SWE rel
8000 m
0
A = 178669 km2
1 km 3 = 56 mm
CMIP52071ndash2100mean
Today
MERRA APHRODITE
Individual models
CMIP52071ndash2100mean
MERRA APHRODITE
Individual models
CMIP52071ndash2100Precip mean
MERRA APHRODITE
Individual models
SWE todayPrecip today
2000 mTerrain distribution of area between levels
CMIP52071ndash2100
TodayMERRA
APHRODITE
a)
i)
ii)
iii)
iv)
b)
Viste amp SortebergFigure 11
Figure 11 Monthly CMIP5 RCP 85 change in snowfall precipitation and rainsnow line eleva-tion in the upper Indus clusters (a) 4 and (b) 5 from 1971ndash2000 to 2071ndash2100 with referenceto the MERRA reference (red) and APHRODITE (blue) CMIP5 multi-model means are shownas horizontal marks individual models as dots Cluster location and terrain profile are shownabove the graphs (i) Fractional change in snowfall (ii) Future snowfall [km3] (dots) comparedto today (bars) (iii) Future precipitation [km3] (dots) compared to today (bars) Snowfall todayis shown as darker part of bars (iv) Rainsnow line elevation [m asl] Gray background el-evation histogram with the of total ground area lying in the marked 2000 m intervals Barschange from today (bottom) to CMIP5 multi-model mean (top)
492
TCD9 441ndash493 2015
Snowfall in theHimalayas an
uncertain future froma little-known past
E Viste and A Sorteberg
Title Page
Abstract Introduction
Conclusions References
Tables Figures
J I
J I
Back Close
Full Screen Esc
Printer-friendly Version
Interactive Discussion
Discussion
Paper
|D
iscussionP
aper|
Discussion
Paper
|D
iscussionP
aper|
3000
4000
5000
6000 masl
0
2
4
6
8
10 km3
0
10
20
30
40
50
60 km3
0
05
1
15
J F M A M J J A S O N DMonth
J FM
A
M
JJ A
S
O
ND
Precip
SWE
RSL
SWE rel
53
B3
8000 m
0
A = 139611 km2
1 km 3 = 72 mm
4500
5000
5500
6000
6500 masl
0
1
2
3
4 km3
0
10
20
30
40
50 km3
0
05
1
15 SWE rel
SWE
RSL
Precip
95
J F M A M J J A S O N DMonth
J FM
A
M
JJ A
S
ON
D
B4
8000 m
0
A = 159165 km2
1 km 3 = 63 mm
CMIP52071ndash2100mean
Today
MERRA APHRODITE
Individual models
CMIP52071ndash2100mean
MERRA APHRODITE
Individual models
CMIP52071ndash2100Precip mean
MERRA APHRODITE
Individual models
SWE todayPrecip today
2000 mTerrain distribution of area between levels
CMIP52071ndash2100
TodayMERRA
APHRODITE
a)
i)
ii)
iii)
iv)
b)
Viste amp SortebergFigure 12
Figure 12 Monthly CMIP5 RCP 85 change in snowfall precipitation and rainsnow line ele-vation in the upper Brahmaputra clusters (a) 4 and (b) 3 See Fig 11 for a description of thecontent
493
- Introduction
-
- Observed trends in snowfall temperature and precipitation
- Future projections of snowfall temperature and precipitation
- Aims and scope
-
- Data and methods
-
- Reference present-day snowfall
- Bias-corrected present-day snowfall
- Projected snowfall
- The rain-snow line
-
- Present-day snowfall
-
- Seasonal cycles of precipitation and snowfall
- Comparison of snowfall estimates
-
- Projected future snowfall
-
- Basin-scale projections
- Regional projections
-
- Upper Indus western part
- Upper Indus eastern part
- Upper Brahmaputra western part
- Upper Brahmaputra eastern part
-
- Potential effects of reduced snowfall on water availability
-
- Concluding summary
-

TCD9 441ndash493 2015
Snowfall in theHimalayas an
uncertain future froma little-known past
E Viste and A Sorteberg
Title Page
Abstract Introduction
Conclusions References
Tables Figures
J I
J I
Back Close
Full Screen Esc
Printer-friendly Version
Interactive Discussion
Discussion
Paper
|D
iscussionP
aper|
Discussion
Paper
|D
iscussionP
aper|
12 Future projections of snowfall temperature and precipitation
In the last decades of the 21th century the temperature over India is projected to be onaverage 20ndash48 C higher than today depending on the anthropogenic forcing scenario(Chaturvedi et al 2012) In the Himalayas a temperature increase of more than 7 C isseen with the strongest forcing the Representative Concentration Pathway (RCP) 855
(Chaturvedi et al 2012 Collins et al 2013) Independently of precipitation changeshigher temperatures will decrease the fraction of precipitation falling as snow Whethersnowfall will increase or decrease thus depends on whether precipitation will increaseenough to compensate for the reduced snow fraction
Climate models from CMIP5 the most recent Coupled Model Inter-comparison10
Project (Taylor et al 2011) project a general increase in precipitation over India grow-ing with anthropogenic forcing and with time both annually (Chaturvedi et al 2012)and during the summer monsoon (Menon et al 2013) An increase was also seenin data from the previous model comparison project CMIP3 (Turner and Annamalai2012) Menon et al (2013) found that changes in the low-level winds suggest a north-15
ward shift in the monsoon by the end of the 21st century for the strongest forcingscenario although the total zonal strength of the monsoon remained fairly constant
It should be emphasized that there is a large inter-model spread in precipitation pro-jections and the IPCC AR5 concludes that there is medium confidence in the increasein summer monsoon precipitation over South Asia (Christensen et al 2013) But al-20
though precipitation projections are less reliable than temperature projections agree-ment between models increases with time and anthropogenic forcing (Chaturvedi et al2012) Also the CMIP5 multi-model mean has been considered to represent the mon-soon and the actual climate in India better than any individual model (Chaturvedi et al2012 Sperber et al 2013)25
The IPCC AR5 has high confidence that the snow cover area in the Northern Hemi-sphere will be substantially reduced with anthropogenic forcing as in the strongestscenarios (Collins et al 2013) For the range of RCPs 26ndash85 CMIP5 models sim-
447
TCD9 441ndash493 2015
Snowfall in theHimalayas an
uncertain future froma little-known past
E Viste and A Sorteberg
Title Page
Abstract Introduction
Conclusions References
Tables Figures
J I
J I
Back Close
Full Screen Esc
Printer-friendly Version
Interactive Discussion
Discussion
Paper
|D
iscussionP
aper|
Discussion
Paper
|D
iscussionP
aper|
ulate 7ndash25 reductions in the spring snow cover extent by 2080ndash2100 For snowfalland snow water equivalents (SWE) the projections show more variation While warm-ing decreases the amount of snow both through melting and through decreasing thesnow fraction more precipitation may increase snowfall in some of the coldest regions(Raumlisaumlnen 2008 Brutel-Vuilmet et al 2013) Though shown to apply mainly to the5
northern parts of Eurasia and North America there is a possibility that some of thehigher-lying terrain in the HKH may be similarly affected
13 Aims and scope
For the HKH uncertainty in projections of future precipitation and snowfall comes ontop of uncertainty in present time conditions Observations are limited especially in re-10
mote high-elevation regions (Anders et al 2006 Immerzeel 2008 Tahir et al 2011bWiniger et al 2005) Insufficient knowledge of the amount of snow falling over the re-gion today makes the contribution to both seasonal snowmelt and storage in glacierscorrespondingly uncertain
Recognizing this uncertainty this study provides an ensemble of monthly mean15
snowfall estimates for all sub-basins of the Indus Ganges and Brahmaputra todayand for 2071ndash2100 For the present time estimates we have combined MERRA re-analysis data (Rienecker et al 2011) with observationally based data sets of precip-itation and temperature CRU TS (Harris et al 2014) TRMM (Huffman et al 2007)and APHRODITE (Yatagai et al 2012 Yasutomi et al 2011) Whereas Meacuteneacutegoz20
et al (2013) and Wiltshire (2014) analyzed Himalayan snowfall by downscaling reanal-ysis data with regional climate models we have applied a simple terrain adjustment ofthe reanalysis temperature field
The ensemble of present-day estimates is presented in Sect 3 Future snowfall wasthen calculated based on the present-day snowfall and projected changes in temper-25
ature and precipitation in 14 and 15 CMIP5 models for the RCPs 26 and 85 re-spectively These results are presented in Sect 4 The data and methods for both thepresent time and the future case are described in Sect 2
448
TCD9 441ndash493 2015
Snowfall in theHimalayas an
uncertain future froma little-known past
E Viste and A Sorteberg
Title Page
Abstract Introduction
Conclusions References
Tables Figures
J I
J I
Back Close
Full Screen Esc
Printer-friendly Version
Interactive Discussion
Discussion
Paper
|D
iscussionP
aper|
Discussion
Paper
|D
iscussionP
aper|
Three main features may be involved in precipitation changes in the HKH changesin the summer monsoon changes in western disturbances during winter and the gen-eral changes that occur in the thermodynamic properties of the air as the temperatureincreases and the air contains more water vapor We have not considered the role ofthe different factors only looked at how changes in temperature and precipitation af-5
fect snowfall Unless otherwise specified any reference to snow refers to precipitationfalling as snow not to the snow cover on the ground
2 Data and methods
In addition to the original MERRA reanalysis snowfall we estimated snowfall usingdifferent combinations of temperature and precipitation data An overview of the com-10
binations is shown in Table 1 and the data sets used presented in Tables 2 and 3Present-day snowfall estimates were based on
1 MERRA 2 m temperature adjusted to a higher-resolution elevation grid andMERRA precipitation (Sect 21) This was used as a basis for the other estimatesand is referred to as MERRA reference snowfall The adjusted temperature is15
referred to as terrain-adjusted
2 MERRA 2 m temperature and precipitation
3 The MERRA data in (1) bias-corrected with observation-based data for tempera-ture and precipitation (Sect 22)
Estimates for the last decades of the 21th century were based on20
4 The MERRA data in (1) plus the changes in temperature and precipitation ina group of CMIP5 models over the coming century (Sect 23)
5 Bias-corrections with one of the data sets in (3) ndash APHRODITE ndash plus the meanchanges in temperature and precipitation in the CMIP5 models used in (4) Thiswas done to account for the spread in the present-day estimates25
449
TCD9 441ndash493 2015
Snowfall in theHimalayas an
uncertain future froma little-known past
E Viste and A Sorteberg
Title Page
Abstract Introduction
Conclusions References
Tables Figures
J I
J I
Back Close
Full Screen Esc
Printer-friendly Version
Interactive Discussion
Discussion
Paper
|D
iscussionP
aper|
Discussion
Paper
|D
iscussionP
aper|
With the exception of original MERRA snowfall data all snowfall estimates werebased on the relationship between temperature and snowfall derived by Dai (2008)Based on observations the conditional snow frequency over land was formulated as
F (Ts) = a[
tanh(b(Ts minusc)
)minusd]
(1)
where Ts is the surface air temperature [C] and a = minus482292b = 07205c = 116625
and d = 10223 This may be interpreted as the probability or fraction of precipitationfalling as snow at a given temperature We calculated hourly snowfall as the productof F and the amount of precipitation Cut-offs for no rain and no snow were set at minus10and 10 C respectively as this was the range of the data used by Dai (2008)
All snowfall estimates were made for the sub-basins defined in the HydroSHEDS10
data set (Lehner et al 2008) The results were then aggregated for the Indus Gangesand Brahmaputra Basins
Within each major basin we also grouped the sub-basins into regions with simi-lar characteristics of snow and precipitation This was done with k-means clustering(MacQueen 1967) using the square Euclidean distance as the distance measure15
The seasonal cycles of precipitation snow and snow fraction were first clustered sep-arately with the MERRA reference data and data bias-corrected with CRU TS data asinput We then adjusted the clusters manually prioritizing similarity of the relative sea-sonal cycles of snow and snow fraction and checking that both data sets gave similarresults Five groups were defined for the Indus and four for each of the other basins20
This included a no-snow group in each basin
21 Reference present-day snowfall
The horizontal resolution of the MERRA reanalysis data in the Himalayas is about55 km latitude and 70 km longitude To account for smaller-scale temperature variationsin the rugged terrain we used the vertical temperature gradient in MERRA to adjust25
the ground temperature to the GLOBE topography (Hastings and Dunbar 1998) The450
TCD9 441ndash493 2015
Snowfall in theHimalayas an
uncertain future froma little-known past
E Viste and A Sorteberg
Title Page
Abstract Introduction
Conclusions References
Tables Figures
J I
J I
Back Close
Full Screen Esc
Printer-friendly Version
Interactive Discussion
Discussion
Paper
|D
iscussionP
aper|
Discussion
Paper
|D
iscussionP
aper|
elevation-adjusted ground temperature was calculated as
Tadj = T0 minusT2 minus T1
z2 minus z1(zmerra 0 minus zglobe) (2)
where T0 is the MERRA 2 m temperature T1 is the temperature at the lowest pressurelevel above the ground T2 the temperature at the next level and z2 and z1 the height ofthese levels zmerra0 and zglobe is the elevation of the MERRA and GLOBE topography5
respectively To reduce calculation time compared to using the original 1 km GLOBEresolution both MERRA and GLOBE data were interpolated to a 4 km grid Snowfallwas calculated for each grid-point and then aggregated for each sub-basin for eachmonth
Snowfall based on elevation-adjusted MERRA temperature and MERRA precipita-10
tion is used as a reference throughout this article This is because the elevation-adjusted temperature and the 4 km grid was used as the starting-point in all subse-quent calculations It does not mean that we consider this snowfall to be closer to thetruth than any of the other estimates
22 Bias-corrected present-day snowfall15
A second group of present-day snowfall estimates was made from MERRA precipi-tation and elevation-adjusted temperature bias-corrected with observationally baseddata sets APHRODITE daily temperature and precipitation for 1979ndash2007 CRU TSmonthly temperature and precipitation for 1979ndash2011 and TRMM 3B42 3 hourly pre-cipitation for 1998ndash2012 Bias-corrections were performed on daily or monthly scales20
depending on the input data and the result distributed over the hourly time-steps ofthe MERRA temperature and precipitation As a result the diurnal cycle in MERRA ismaintained in all estimates Snowfall was then calculated following the same procedureas for the MERRA reference snowfall (Sect 21) When referring to APHRODITE snowor CRU snow anywhere in this article this is the snowfall calculated using MERRA25
precipitation and temperature both bias-corrected with these data sets451
TCD9 441ndash493 2015
Snowfall in theHimalayas an
uncertain future froma little-known past
E Viste and A Sorteberg
Title Page
Abstract Introduction
Conclusions References
Tables Figures
J I
J I
Back Close
Full Screen Esc
Printer-friendly Version
Interactive Discussion
Discussion
Paper
|D
iscussionP
aper|
Discussion
Paper
|D
iscussionP
aper|
Temperature data are generally assumed to be normally distributed and as de-scribed in Teutschbein and Seibert (2012) and references therein the data can bebias-corrected through a Gaussian distribution mapping We thus bias-corrected theelevation-adjusted MERRA temperature with the observationally based APHRODITEV1204 daily temperature by mapping the distribution of the MERRA data to the Gaus-5
sian distribution of the observationsAs the CRU TS 320 includes monthly mean daily minimum and maximum temper-
atures the method described by (Wang and Zeng 2013) was used Bias-correcteddaily maximum temperatures were defined as
Td max = Tmerra d max minus(Tmerra mn max minus Tcru mn max
) (3)10
d denotes daily and mn monthly Daily minimum temperatures were then corrected byadjusting the diurnal range
Td min = Td max minus∆Tmerra d middot∆Tcru mn
∆Tmerra mn (4)
where ∆T represents the diurnal and monthly temperature rangeThe distribution mapping procedure described by Ines and Hansen (2006) was used15
to bias-correct MERRA precipitation with APHRODITE V1101R2 daily precipitation anddaily accumulated TRMM 3B42 3 hourly precipitation This is a two-step procedureinvolving frequency and intensity adjustments We defined precipitation days as dayswith at least 01 mm in the observations The frequency was first adjusted by settingthe number of precipitation days in MERRA equal to that of the observations This was20
done by removing the lowest daily values The intensity was then adjusted by fitting theremaining days to the gamma distribution of the observations
Bias-corrections with CRU TS 320 monthly precipitation were done with a simplecorrection factor to adjust the monthly MERRA total to that of CRU (eg Ines andHansen 2006)25
452
TCD9 441ndash493 2015
Snowfall in theHimalayas an
uncertain future froma little-known past
E Viste and A Sorteberg
Title Page
Abstract Introduction
Conclusions References
Tables Figures
J I
J I
Back Close
Full Screen Esc
Printer-friendly Version
Interactive Discussion
Discussion
Paper
|D
iscussionP
aper|
Discussion
Paper
|D
iscussionP
aper|
23 Projected snowfall
The MERRA reanalysis was also the basis for estimates of future snowfall Thechanges in temperature and precipitation from 1971ndash2000 to 2071ndash2100 were addedto the reanalysis data and snowfall calculated following the same procedure as for thepresent time Climate change input came from models that were part of the Coupled5
Model Inter-comparison Project 5 (CMIP5 Taylor et al 2011) for the RepresentativeConcentration Pathways (RCP) 26 and 85 (Moss et al 2010 van Vuuren et al 2011)The models used are listed in Table 3
Due to the different spatial resolution of the models changes were defined asmonthly mean changes on the sub-basin level For temperature the absolute change10
was used and for precipitation the fractional change Future projected snowfall wascalculated with reference to elevation-adjusted MERRA snowfall for each model Dueto large deviations in estimates of present-day snowfall (Sect 3) we also calculatedsnowfall for the CMIP5 multi-model mean changes with reference to the lowest presenttime estimate APHRODITE snowfall15
24 The rain-snow line
Not all temperature changes affect snowfall We defined the rain-snow line as the el-evation where the temperature suggests a shift from rain to snow Technically thisis a conditional rain-snow line as no precipitation was required For every hour allgrid cells that had a snow fractionprobability between 025 and 075 corresponding20
to a temperature between 09 and 13 C were identified The monthly rain-snow linewas then set as the mean elevation of these grid cells and time steps For present-dayconditions this was done for elevation-adjusted MERRA temperature and temperaturebias-corrected with APHRODITE Projected temperature changes in the CMIP5 RCP85 were then added to these temperatures and the procedure repeated25
453
TCD9 441ndash493 2015
Snowfall in theHimalayas an
uncertain future froma little-known past
E Viste and A Sorteberg
Title Page
Abstract Introduction
Conclusions References
Tables Figures
J I
J I
Back Close
Full Screen Esc
Printer-friendly Version
Interactive Discussion
Discussion
Paper
|D
iscussionP
aper|
Discussion
Paper
|D
iscussionP
aper|
3 Present-day snowfall
31 Seasonal cycles of precipitation and snowfall
Figure 2 gives an overview of the seasonal cycle of rain and snow in different parts ofthe HKH based on MERRA precipitation and MERRA reference snowfall (Sect 21)The upper Indus basin gets more snow than rain in other sub-basins of the Indus5
Ganges and Brahmaputra rainfall dominates This difference is caused by different pre-cipitation cycles Whereas the summer monsoon dominates in the Central Himalayaswinter depressions bring most of the precipitation in the upper Indus ndash at a time whenlow temperatures mean that precipitation falls as snow in larger areas than it wouldin summer Although snow fractions are lower in the upper Brahmaputra monsoon10
precipitation produces a substantial amount of summer snow at high elevationsIn the northwesternmost cluster in the Indus I4 March is the wettest month and also
the month with the highest total amount of snowfall Precipitation has a second peakduring July and August but the temperature is then too high to allow much snowfallFurther east in cluster I5 more terrain at higher elevations cause higher snow fractions15
during summer but winter and spring is still the dominant snow season The summerpeak in precipitation in this cluster is caused by the two eastern sub-basins There islittle summer precipitation in the west
In Brahmaputrarsquos cluster B4 and Gangesrsquo G4 maximum snowfall occurs during thesummer monsoon Higher temperatures during summer means that the snow fraction20
is lower than in winter but as there is much more summer precipitation the amount ofsnow is also higher Rare occurrences of precipitation during the cold winter togetherwith the combination of snowfall and snowmelt during summer makes the seasonalcycle of snow depth in the Central Himalayas unpronounced (Meacuteneacutegoz et al 2013)In the upper-level basins in Brahmaputrarsquos B3 the summer is also the main precipi-25
tation season but the peak is less sharp than further west As a result snowfall is ata maximum in MarchndashApril
454
TCD9 441ndash493 2015
Snowfall in theHimalayas an
uncertain future froma little-known past
E Viste and A Sorteberg
Title Page
Abstract Introduction
Conclusions References
Tables Figures
J I
J I
Back Close
Full Screen Esc
Printer-friendly Version
Interactive Discussion
Discussion
Paper
|D
iscussionP
aper|
Discussion
Paper
|D
iscussionP
aper|
32 Comparison of snowfall estimates
The MERRA reference snowfall described in Sect 31 differs greatly from snowfallbased on bias-corrected temperature and precipitation Large differences betweentemperature and data sets for the HKH cause corresponding deviations in snowfall ndashnot only between MERRA-based estimates and bias-corrected data but between esti-5
mates based on bias-corrections with different data sets This can be seen from Table 4which displays annual snowfall estimates for combinations of the bias-corrections de-scribed in Sect 22 aggregated to the major basins Data for the individual sub-basinsare included as Supplement
With the exception of snowfall based on MERRA precipitation and MERRA temper-10
ature bias-corrected with CRU TS in the Ganges basin all estimates based on bias-corrected data are lower than the MERRA reference snowfall The lowest estimates arethose based on bias-corrections with APHRODITE precipitation and temperature Thiscombination produced only 33 of the reference snowfall in the Indus Basin 22 inthe Ganges Basins and 17 in the Brahmaputra Basin While the difference is large in15
all sub-basins that have snow today it is especially large in the upper parts of the Indusand Brahmaputra Basins (Fig 3) In comparison bias-corrections with CRU TS tem-perature and precipitation produce 54 of the reference snowfall in the Indus 75 inthe Ganges and 42 in the Brahmaputra ndash factors of 2ndash4 compared to APHRODITEIt should be noted that as the time periods covered by the data sets are not equal20
the results are not strictly comparable but tests using different MERRA periods (notshown) indicate that there would be no major difference in the monthly means
The large difference between MERRA reference snowfall and snowfall based onbias-corrected data results from differences in both temperature and precipitation butdifferences in the precipitation pattern have the greatest effect Estimates where only25
the precipitation has been bias-corrected are lower than those where only the tempera-ture has been bias-corrected (Table 4) This is not solely an effect of more precipitationin MERRA than in the observation-based data although MERRA is wetter than all the
455
TCD9 441ndash493 2015
Snowfall in theHimalayas an
uncertain future froma little-known past
E Viste and A Sorteberg
Title Page
Abstract Introduction
Conclusions References
Tables Figures
J I
J I
Back Close
Full Screen Esc
Printer-friendly Version
Interactive Discussion
Discussion
Paper
|D
iscussionP
aper|
Discussion
Paper
|D
iscussionP
aper|
data sets in the Indus and for APHRODITE also in the Ganges and the Brahmapu-tra An inland and upward shift in the MERRA precipitation adds to the differencesAs shown in Fig 4 all the observation-based precipitation data sets are wetter thanMERRA in most of the lowlands and in the foothills of the HKH but drier in the higher-elevation regions further inland In MERRA the precipitation belt is shifted higher up5
in the Himalayas where temperatures are lower and more of the precipitation falls assnow
In addition HKH temperatures are lower in MERRA than in APHRODITE and inthe upper Indus also than in CRU TS (Fig 5) The lower temperatures in MERRAcause higher snow fractions further increasing the difference between the MERRA ref-10
erence snowfall and APHRODITE snowfall Oppositely CRU TS is colder than MERRAthroughout the Ganges leading to higher snowfall estimates when bias-correctingMERRA temperatures with CRU TS (Table 4)
We do not see any reason to consider any of the observation-based data sets northe reanalysis the ground truth The reanalysis has the benefit of being physically15
consistent though precipitation is a pure model product In the other data sets thenumber of observations vary greatly within the region
The lack of observations in the HKH has been pointed out in many studies Mostmeteorological stations are located in the valleys and do not necessarily representweather conditions in higher terrain As demonstrated by Palazzi et al (2013) station-20
based data sets like APHRODITE and CRU TS are merely mathematical interpolationsin major parts of the HKH and on the Tibetan Plateau Immerzeel (2008) showed thatthe number of observations going into version 21 of the CRU data set in the Himalayanregion varies greatly A drop in the mid-1990s suggests that caution should be takenwhen interpreting data at later times Maps (not shown) of station coverage in version25
320 used in this study show that this problem persistsThe fact that more of the precipitation falls as snow at higher elevations may in it-
self lead to an under-estimation of precipitation in the mountains In addition to thelack of observations in high terrain gauges tend to capture snow less easily than rain
456
TCD9 441ndash493 2015
Snowfall in theHimalayas an
uncertain future froma little-known past
E Viste and A Sorteberg
Title Page
Abstract Introduction
Conclusions References
Tables Figures
J I
J I
Back Close
Full Screen Esc
Printer-friendly Version
Interactive Discussion
Discussion
Paper
|D
iscussionP
aper|
Discussion
Paper
|D
iscussionP
aper|
leading to a possible under-registration of precipitation at the few high-elevation sta-tions that exist Comparing stations along a vertical profile in the Karakoram Winigeret al (2005) found that precipitation multiplied by a factor of 5ndash10 from 2500 masl to5000ndash6000 masl This maximum is much higher than reported in most other studiesand they attributed this to the valley-dominance of stations normally used5
Indications of too little precipitation at higher elevations were also given by Tahiret al (2011b) as APHRODITE precipitation was too low to account for the observeddischarge in the Hunza river in the Karakoram Anders et al (2006) reported thatTRMM radar data underestimated precipitation at higher elevations in the Himalayasdue to the low ability of the radar to detect very low precipitation and lowndashmoderated10
snowfall rates On the other hand Krakauer et al (2013) found that both TRMM andAPHRODITE had too much precipitation compared to observations from the few exist-ing stations at elevations above 3000 masl in Nepal
Satellite data are a promising future alternative for measuring snowfall but presentlyof limited use MODIS and LANDSAT satellite data have been used in several studies15
of snow and ice in the Himalayas (Tahir et al 2011a b Bookhagen and Burbank2010 Hewitt 2005 Krishna 2005 Negi et al 2009 Jain et al 2009 Butt 2012 Gaoet al 2012 Kulkarni et al 2010 Immerzeel et al 2009) but these data contain onlysnow cover area with no measure of the snow thickness or snow water equivalentsThe NASA AMSR-E SWE data set distributed by the National Snow and Ice Data20
Center could have been used but correlations between AMSR-E SWE and groundobservations have been shown to be poor (Tedesco and Narvekar 2010 Byun andChoi 2014 Kumar et al 2006) As AMSR-E SWE has been found underestimatesnow depth we concluded that incorporating these data into our ensemble would notlikely constrain the results nor add new information25
Defining snowfall based on MERRA precipitation and elevation-adjusted tempera-ture as a reference was done mainly to have a single reference when comparing thedata sets against each other Also we believe the elevation-adjustment of temperaturerepresents an enhancement compared to the original MERRA reanalysis MERRA was
457
TCD9 441ndash493 2015
Snowfall in theHimalayas an
uncertain future froma little-known past
E Viste and A Sorteberg
Title Page
Abstract Introduction
Conclusions References
Tables Figures
J I
J I
Back Close
Full Screen Esc
Printer-friendly Version
Interactive Discussion
Discussion
Paper
|D
iscussionP
aper|
Discussion
Paper
|D
iscussionP
aper|
chosen mainly because it has an hourly resolution allowing diurnal temperature vari-ations to affect snowfall But even though this estimate is much higher than all thebias-corrected estimates it cannot be discarded It has been argued that reanalysisdata and regional climate models may in some cases be as good as or better thanobservations in the HKH (Wiltshire 2014 Meacuteneacutegoz et al 2013 Akhtar et al 2008)5
Akhtar et al (2008) got better results when modeling river discharge in three upperIndus catchments with an RCM-based hydrological model than with one based on thefew observations available within the region They concluded that it was preferable touse RCM data directly as input to hydrological models in this region
As shown in the small inset maps in Fig 4 MERRA precipitation is higher than ob-10
served precipitation throughout the HKH and the same has previously been shownfor ERA-Interim reanalysis precipitation (Palazzi et al 2013) In MERRA the precipi-tation belt is shifted upward in the terrain compared to in the observation-based datasets Whether this shift is realistic cannot be determined as long as observations fromupper-level terrain are either missing or likely too low15
4 Projected future snowfall
Whether higher temperatures lead to less snowfall depends on whether the tempera-ture changes from below to above freezing and whether this change occurs at a timewhen there is precipitation The maps in Fig 6 illustrate where a temperature increaseis most likely to affect snowfall and snowmelt In the red zones where the monthly20
temperature today is between ndash5 and 0 C the projected temperature increase of 2ndash7 C (Chaturvedi et al 2012 Collins et al 2013 Wiltshire 2014) may be consideredcritical Such a change would change snowfall to rain and also cause a change fromfreezing to melting of snow and ice The pink zones with monthly mean temperaturesof 0ndash5 C would similarly change from a climate where precipitation may often fall as25
snow to one that is snow-free
458
TCD9 441ndash493 2015
Snowfall in theHimalayas an
uncertain future froma little-known past
E Viste and A Sorteberg
Title Page
Abstract Introduction
Conclusions References
Tables Figures
J I
J I
Back Close
Full Screen Esc
Printer-friendly Version
Interactive Discussion
Discussion
Paper
|D
iscussionP
aper|
Discussion
Paper
|D
iscussionP
aper|
In January (Fig 6a) only the lower parts of the Himalayas is affected as most ofthe region would still have temperatures well below the freezing point The small insetmap shows precipitation in the red zone a narrow band along the range Oppositelyin July (Fig 6c) the temperature is already above 5 C in most of the region though athigher elevations along the Himalayan range and in the Karakoram the change can be5
critical The most widespread changes are seen in spring and fall In April and October(Fig 6b d) large areas in the HKH and on the Tibetan Plateau risk a change frombelow to above freezing
Incorporating CMIP5 precipitation changes we find that the projected temperatureincrease has a larger impact so that snowfall will be reduced in the Indus Ganges and10
Brahmaputra Basins by 2071ndash2100 compared to today Details for the major basinsare presented in Sect 41 How much increased temperatures reduce snowfall withina region depends on the location of the rainsnow line today compared to the terraindistribution Results for selected upper-level sub-basins in the Indus and Brahmaputrawill be discussed in that context in Sect 4215
The large deviations in the estimates of present-day snowfall (Sect 3) means thatthere will be correspondingly large deviations in projected values To account for thismost results are shown with reference to the highest and lowest present-day estimatesMERRA reference snowfall and to APHRODITE-based snowfall Future estimates rela-tive to CRU and TRMM are assumed to lie between those of MERRA and APHRODITE20
41 Basin-scale projections
In the Indus Ganges and Brahmaputra Basins the CMIP5 models project a meanincrease in both temperature (Fig 7) and precipitation (Fig 8) in the region by 2071ndash2100 for both RCPs 26 and 85 The RCP 85 multi-model mean change in temper-ature varies through the year with a 49ndash62 C increase in the Indus 36ndash52 C in25
the Ganges and 42ndash60 C in the Brahmaputra The increase is smallest during thesummer months The dip in the summer is also seen though less pronounced with
459
TCD9 441ndash493 2015
Snowfall in theHimalayas an
uncertain future froma little-known past
E Viste and A Sorteberg
Title Page
Abstract Introduction
Conclusions References
Tables Figures
J I
J I
Back Close
Full Screen Esc
Printer-friendly Version
Interactive Discussion
Discussion
Paper
|D
iscussionP
aper|
Discussion
Paper
|D
iscussionP
aper|
the RCP 26 The summer is also the season with the largest absolute increase inprecipitation
Compared to present-day estimates the CMIP5 models project less snowfall in theIndus Ganges and Brahmaputra Basins in the last decades of this century This canbe seen from Fig 9 The projected multi-model mean is lower than today in all calen-5
dar months for both RCPs 26 and 85 With the RCP 26 some models suggest anincrease in some months mainly in winter and spring This is also the case for one ortwo models with the RCP 85 whereas other models indicate that the snowfall in thesame months will be only half of todayrsquos values
In the Ganges Basin (Fig 9b) the seasonal distribution of snowfall today is mainly10
flat with equal amounts of snowfall from January through September Reductions insummer snowfall with the RCP 85 would change the seasonal cycle into a winter-dominated one To a lesser degree this is also the case for RCP 26 As summerprecipitation is projected to increase in all of the Ganges (not shown but consistentwith Menon et al 2013) this indicates that large areas are at elevations where a small15
increase in the summer temperature may cause a shift from snow to rain This is seenas the red band along the upper Ganges in Fig 6c Reductions in summer snowfall arealso large in the Brahmaputra (Fig 9b) whereas in the Indus the largest total changesoccur in MarchndashMay (Fig 9a)
As the MERRA reference snowfall for today is much larger than APHRODITE snow-20
fall (Sect 32) projected absolute changes for 2071ndash2100 are also much largerin MERRA The relative changes are more similar though larger with reference toAPHRODITE Annual snowfall changes for each major basin are presented in Table 5for changes in temperature precipitation or both and with reference to MERRA andAphrodite present-day snowfall Changes at the sub-basin level are shown in Fig 1025
In the Ganges Basin both MERRA- and APHRODITE-based multi-model mean snow-fall is reduced by about 20 with the RCP 26 and 50 with the RCP 85 In theIndus and Brahmaputra Basins the differences between MERRA- and APHRODITE-based changes are larger but not as large as for the absolute values With reference
460
TCD9 441ndash493 2015
Snowfall in theHimalayas an
uncertain future froma little-known past
E Viste and A Sorteberg
Title Page
Abstract Introduction
Conclusions References
Tables Figures
J I
J I
Back Close
Full Screen Esc
Printer-friendly Version
Interactive Discussion
Discussion
Paper
|D
iscussionP
aper|
Discussion
Paper
|D
iscussionP
aper|
to MERRA and APHRODITE respectively the reduction in snowfall in the Indus Basinis 30 and 50 with the RCP 85 The corresponding reductions in the BrahmaputraBasin are 50 and 70
The projected changes in temperature have greater effect on snowfall than thechanges in precipitation When taking into account only changes in precipitation all5
snowfall estimates are positive (∆P Table 5) This indicates that the mean annual to-tal reduction for each major basin is governed by the temperature change In someCMIP5 models (values in brackets in Table 5) the effect of precipitation changes (∆P )on snowfall are of the same magnitude as the effect of temperature changes (∆T ) butfor the CMIP5 multi-model mean temperature changes cause snowfall changes 4ndash1010
times as large as those due to changes in precipitation This is with reference to thepresent-day MERRA reference snowfall and for both RCPs 26 and 85 With referenceto APHRODITE snowfall the effect of temperature changes compared to precipitationchanges is even greater
42 Regional projections15
If temperatures are far below freezing everywhere warming may have little effect onsnowfall The same applies if only the highest peaks receive snow today The largestreduction in snowfall in a basin occurs if todayrsquos rainsnow line is at an elevation justbelow the dominant elevation of the basin Then large regions will see a shift fromsnow to rain20
In the Indus Basin the largest relative snowfall reduction by 2071ndash2100 is seen inthe southwestern sub-basins where snowfall is limited today (Fig 10) The largest totalreduction is seen in the snow-rich sub-basins of KabulSwatAlingar in the west and inthe east and a smaller reduction in the inner-most basins of GilgitHunza Indus 1 andNubraShyok Together with the upper regions of the Brahmaputra these sub-basins25
clusters I4 I5 B3 and B4 in Fig 2 were selected for a closer analysis In addition tohaving the most snow these clusters are the most homogeneous when considering
461
TCD9 441ndash493 2015
Snowfall in theHimalayas an
uncertain future froma little-known past
E Viste and A Sorteberg
Title Page
Abstract Introduction
Conclusions References
Tables Figures
J I
J I
Back Close
Full Screen Esc
Printer-friendly Version
Interactive Discussion
Discussion
Paper
|D
iscussionP
aper|
Discussion
Paper
|D
iscussionP
aper|
the seasonal cycle of snowfall and snow fraction The values presented in this sectionare all from the RCP 85 for changes from today to 2071ndash2100
421 Upper Indus western part
Cluster 4 consists of the sub-basins Astor KabulSwatAlingar and Krishen GangaAs seen from the elevation profile at the top of Fig 11a the elevation span is large5
and there is an almost equal proportion of the terrain at all levels from heights close tosea level to about 5000 masl The most important change for this cluster is a largereduction in the total amount of snowfall in winter and spring
With a few exceptions all CMIP5 models project less snowfall in all months of theyear (Fig 11a i ii) The largest total multi-model mean reduction in snowfall (ii) oc-10
curs in FebruaryndashApril without notable change in the multi-model mean precipitation(iii) Thus the reduction is caused by increasing temperatures represented by therainsnow line in Fig 11a iv As seen from the change in the rainsnow line elevationthe projected temperature increase in these months would imply that large areas thatreceive snow today would receive only rain About 40 of the ground in this cluster lies15
below 2000 masl and receives precipitation as rain throughout the year In summerprecipitation (iii) is at a minimum and the rainsnow line (iv) is already so high that onlya small fraction of the area receives snowfall today Thus although the relative changein snowfall (i) is largest in summer the change in the amount of snowfall (ii) is small Itshould also be noted that the change in the rainsnow line elevation (iv) in summer is20
much smaller 400ndash600 m compared to 600ndash900 m in DecemberndashApril
422 Upper Indus eastern part
Further east the largest changes are projected for the spring season Cluster 5 in theIndus Basin consists of the sub-basins GilgitHunza Indus 1 NubraShyok and Zan-skar As shown in Fig 11b this is high-elevation terrain with 80 of the ground lying25
above 4000 masl As a result almost all winter precipitation is snow (Fig 11b iii)
462
TCD9 441ndash493 2015
Snowfall in theHimalayas an
uncertain future froma little-known past
E Viste and A Sorteberg
Title Page
Abstract Introduction
Conclusions References
Tables Figures
J I
J I
Back Close
Full Screen Esc
Printer-friendly Version
Interactive Discussion
Discussion
Paper
|D
iscussionP
aper|
Discussion
Paper
|D
iscussionP
aper|
For the multi-model mean no big changes are projected in JanuaryndashFebruary This ispartly because of little change in precipitation (iii) and because the rainsnow line (iv)in these months is sufficiently low in the terrain today With the 500ndash600 m shift pro-jected with the RCP 85 80ndash90 of the area will still have temperatures low enoughfor snow The largest changes occur in MarchndashOctober when higher temperatures5
push the rainsnow line above large areas that receive snow today Increasing summerprecipitation (iii) causes the snowfall reduction in summer to be less than it would other-wise be The effect of higher temperatures is smaller on the APHRODITE snowfall thanon the MERRA reference snowfall (ii) as APHRODITE has very little summer snow-fall today The difference arises both from less precipitation (iii) in APHRODITE than10
MERRA today and from a higher rainsnow line (iv) in APHRODITE Note that as thechange in precipitation was defined as a fraction of the present-day value (Sect 23)the relative changes in APHRODITE and MERRA precipitation are equal
423 Upper Brahmaputra western part
In the westernmost part of the upper Brahmaputra Basin large snowfall changes are15
projected for the summer As cluster 5 in the Indus Basin Brahmaputrarsquos cluster 4 islimited to higher grounds Less than 6 lies outside of the 4000ndash6000 masl rangeThe cluster consists of Maquan He Yarlung Zangbo Dogxung ZangboMaiqu ZangboShang ChuYarlung ZangboNyang Lhasa HeRazheng Zangbo and Yamzho YumcoThe summer monsoon fully dominates the seasonal cycle of precipitation in this region20
(Fig 12a iii) resulting in a unimodal snow cycle with a maximum in JulyndashSeptember InAPHRODITE the seasonal cycle of snowfall is similar but less pronounced than in theMERRA reference The summer also sees the greatest reduction in CMIP5 projectedsnowfall both in absolute (ii) and relative (i) terms despite increasing summer precip-itation in all models (iii) The reason can be seen from the change in the rainsnow25
line elevation (iv) In the warmest months July and August elevation changes of 400ndash500 m would shift the rainsnow line from a level where at least 5ndash10 of the groundlies above the line to a level where only 1 of the area would receive precipitation as
463
TCD9 441ndash493 2015
Snowfall in theHimalayas an
uncertain future froma little-known past
E Viste and A Sorteberg
Title Page
Abstract Introduction
Conclusions References
Tables Figures
J I
J I
Back Close
Full Screen Esc
Printer-friendly Version
Interactive Discussion
Discussion
Paper
|D
iscussionP
aper|
Discussion
Paper
|D
iscussionP
aper|
snow In comparison with reference to MERRA the 300ndash400 m shift seen in JanuaryndashFebruary would cause only a small absolute change in snowfall (ii) because there islittle precipitation in these months (ii) and a small relative change (i) because therainsnow line would still be low in the terrain (iv) With reference to APHRODITE therelative snowfall change in winter would be larger than with reference to MERRA as5
temperatures today are higher resulting in a higher rainsnow line (iv)
424 Upper Brahmaputra eastern part
Like further west the Indian summer monsoon dominates the precipitation cycle in theeastern part of upper Brahmaputra (Fig 12b iii) but the seasonal cycle of snowfallpeaks in spring and fall (iii) This is also the time of the largest projected changes10
Cluster 3 in the Brahmaputra consists of the sub-basins Yarlung Zangbo2 NyangQu Yarlung Zangbo3 Yirsquoong ZangboParl Siyom Zaya QuLuhitDi About 70 of theground lies between 3000 and 6000 masl but there is also land almost at sea levelmainly in the Zaya QuLuhitDingba Qu sub-basin During summer most of the terrainlies below the rainsnow line (iv) In spring temperatures are lower than in summer15
and pre- monsoon precipitation is stronger in this part of the Himalayas than furtherwest in cluster 3 (Fig 12a iii vs Fig 12b iii) As a result MarchndashApril gets the mostsnow
Reductions in snowfall are projected for all months (ii) comparable in magnitude butlargest in the snow-rich spring and late summer The CMIP5 multi-model mean shows20
increasing or no change in precipitation in all months (Fig 12b iii) so the reductionin snowfall is due solely to higher temperatures The largest absolute reductions inApril and May occur with a 700ndash800 m shift in the rainsnow line elevation leaving30 more of the terrain in the rain The largest relative reduction in future snowfall areprojected for July and August (Fig 12b i) when the rainsnow line shifts so high that25
only the highest peaks can get precipitation as snow (iv) This would be despite thelowest changes in the rainsnow line only about 300 m in APHRODITE
464
TCD9 441ndash493 2015
Snowfall in theHimalayas an
uncertain future froma little-known past
E Viste and A Sorteberg
Title Page
Abstract Introduction
Conclusions References
Tables Figures
J I
J I
Back Close
Full Screen Esc
Printer-friendly Version
Interactive Discussion
Discussion
Paper
|D
iscussionP
aper|
Discussion
Paper
|D
iscussionP
aper|
43 Potential effects of reduced snowfall on water availability
With a few exceptions the CMIP5 multi-model mean precipitation change over the com-ing century is positive in all months in the upper Indus and Brahmaputra (Sect 42)Thus the projected reduction in snowfall is due solely to higher temperatures How-ever there is a large spread in precipitation projections among the models If tempera-5
tures increase as much as projected with the RCP 85 could any realistic precipitationchange in the HKH compensate and maintain present-day snowfall Results indicatethat this may happen in parts of the upper Indus but is out of the reach in the upperBrahmaputra As for water availability reduced snowfall may still cause more severeproblems in the Indus than in the Brahmaputra10
In cold regions where temperatures remain below freezing more winter precipita-tion may increase both the snow cover area the length of the snow season and theSWE (Collins et al 2013 Brutel-Vuilmet et al 2013 Raumlisaumlnen 2008 Gao et al 2012Wiltshire 2014) Raumlisaumlnen (2008) showed this to be the case in eastern Siberia andthe northernmost part of North America At the southern edge of the seasonal snow15
cover relevant for this study precipitation did not compensate and there was a reduc-tion in SWEWiltshire (2014) concluded that there would be small changes in snowfallin very cold and very warm regions of the HKH Snowfall in Nepal Bhutan and Hi-machal Pradesh where winters are warmer than in most parts of the range was mostvulnerable to higher temperatures The data presented in Sect 42 generally support20
the previous studiesOne of the reasons that precipitation does not compensate is that the highest pro-
jected precipitation increase in the HKH is seen in the summer when the temperaturetoday is so high that only the highest terrain is in the snow zone Shifting the rainsnowline upward even by only a few hundred meters reduces the area that receives snow25
greatly requiring very large increases in precipitation to compensate The summer isthe season with the largest relative reduction in snowfall in all the clusters described inSect 42 Except in the western upper Indus (cluster I4 Sect 421) which has very
465
TCD9 441ndash493 2015
Snowfall in theHimalayas an
uncertain future froma little-known past
E Viste and A Sorteberg
Title Page
Abstract Introduction
Conclusions References
Tables Figures
J I
J I
Back Close
Full Screen Esc
Printer-friendly Version
Interactive Discussion
Discussion
Paper
|D
iscussionP
aper|
Discussion
Paper
|D
iscussionP
aper|
little summer snowfall today the reduction in summer snowfall is notable in all clustersin the MERRA data in the Brahmaputra clusters also in APHRODITE
The largest change in snowfall is seen in the western part of the Brahmaputra (clus-ter B4 Sect 423) where a 400ndash500 m upward shift in the rainsnow line during sum-mer reduces the area with temperatures low enough for snowfall by a factor of 5ndash105
(Fig 12a iv values not shown) As a result the summer peak in the seasonal cycleof snowfall is replaced by a dip (Fig 12a ii) With an even distribution of precipitationwith elevation the area that still receives snow would have to receive 5ndash10 times asmuch precipitation to compensate for the lost snowfall Assuming more realisticallythat precipitation decreases above a certain height would require an even higher in-10
crease in precipitation In the model with the highest increase a doubling of the Julyprecipitation by the end of the century SWE is less than 25 of todayrsquos value in thatmonth (Fig 12a iii)
With a winter-dominated precipitation cycle the relative change in snowfall is smallerin the upper Indus than in the upper Brahmaputra Downscaling a high-emission sce-15
nario (A1B) in two CMIP3 models with a regional model Wiltshire (2014) found that bythe 2080s precipitation increased more than enough to compensate for higher temper-atures in the Karakoram Hindu Kush and Jammu and Kashmir in one of the modelsthe HadCM3 In the other model ECHAM5 precipitation increased less and snow-fall increased only in the higher parts of the Karakoram In our ensemble of CMIP520
models multi-model mean precipitation in the upper Indus clusters increases mainlyin the summer season when the inter-model spread is also the largest (Fig 11a iiiand 11b iii) Among the models 4ndash5 project increased winter precipitation in the upperIndus and in the uppermost cluster I5 this is associated with an increase in wintersnowfall (Fig 11b ii)25
Although it is the part of the HKH where snowfall is least reduced by increasingtemperatures (Fig 10b) the Karakoram and inner parts of the upper Indus may still bethe region where the changes have the largest impact on river run-off Compared tothe monsoon-dominated regions further east there is little summer precipitation and
466
TCD9 441ndash493 2015
Snowfall in theHimalayas an
uncertain future froma little-known past
E Viste and A Sorteberg
Title Page
Abstract Introduction
Conclusions References
Tables Figures
J I
J I
Back Close
Full Screen Esc
Printer-friendly Version
Interactive Discussion
Discussion
Paper
|D
iscussionP
aper|
Discussion
Paper
|D
iscussionP
aper|
much of the water in the rivers during summer is meltwater (Bookhagen and Burbank2010 Immerzeel et al 2010) As melting of snow and ice has not been analyzed inthis study we cannot quantify the effect of reduced snowmelt om river run-off but it isobvious that eventually reduced snowfall will lead to reduced melting In western partsof the HKH this may lead to changes in the seasonal cycle of the river flow5
As pointed out by Wiltshire (2014) increasing precipitation in the eastern HKH im-plies that water resources are likely to increase with climate change As snowfall andsnowmelt are both at maximum during summer (Rees and Collins 2006) meltwaterdoes not have the same importance for river flow in dry parts of the year as in the In-dus Reduced snowfall may reduce glaciers but ndash not considering potential changes in10
the amount of evaporation ndash there is no indication that there will be less water comingfrom the upper Brahmaputra
5 Concluding summary
In this study we have presented a suite of estimates of present-day snowfall in theIndus Ganges and Brahmaputra Basins and the changes in snowfall that would follow15
from CMIP5 projected changes in temperature and precipitation from 1971ndash2000 to2071ndash2100 The results show that if the temperature increases as much as in the RCP85 there will be much less snowfall despite increasing precipitation in most of theregion Limiting anthropogenic forcing to the RCP 26 level would still cause reductionsthough smaller20
Estimates of present-day snowfall based on a combination of temperature and pre-cipitation from reanalysis data and observations vary by factors of 2ndash4 The MERRAreanalysis gives higher estimates than TRMM 3B42 CRU TS and APHRODITE butthe spread is also large between the estimates based on the different observationallybased data sets This demonstrates the difficulties in assessing vulnerability to climate25
change in the region With limited knowledge of the current state future conditions arebound to be uncertain
467
TCD9 441ndash493 2015
Snowfall in theHimalayas an
uncertain future froma little-known past
E Viste and A Sorteberg
Title Page
Abstract Introduction
Conclusions References
Tables Figures
J I
J I
Back Close
Full Screen Esc
Printer-friendly Version
Interactive Discussion
Discussion
Paper
|D
iscussionP
aper|
Discussion
Paper
|D
iscussionP
aper|
Future changes in temperature and precipitation projected by climate models can stillprovide an indication of the relative change in snowfall With the RCP 85 the climatemodels project mean reductions in annual snowfall by 30ndash50 in the Indus Basin 50ndash60 in the Ganges Basin and 50ndash70 in the Brahmaputra Basin by 2071ndash2100 Withthe RCP 26 the corresponding reductions would be 10ndash20 in the Indus about 20 5
in the Ganges and 20ndash30 in the Brahmaputra The reductions are due to increasingtemperatures as the mean of the models show constant or increasing precipitationthroughout the year in most of the region
How much increasing temperatures reduce snowfall in a region depends on howmuch of the terrain that is below and above the freezing point today and on whether10
the terrain profile is such that the temperature increase transforms large areas fromsnow to rain zones With the RCP 85 the mean elevation where rain changes to snowndash the rainsnow line ndash creeps upward by 400ndash900 m in most of the region by 700ndash900 m
The largest relative change in snowfall is seen in the upper westernmost sub-basins15
of the Brahmaputra despite increasing precipitation and the lowest rainsnow line el-evation change (400ndash500 m) This is because a major part of this region is near thefreezing point today With the RCP 85 most of this region will have temperaturesabove freezing especially in the summer which is the wettest part of the year Theprojected reduction in annual snowfall is 65ndash75 20
In the upper Indus the effect of a warmer climate on snowfall is less extreme asmost of the terrain is high enough to have temperatures sufficiently far below freezingtoday Winter and spring brings most of the precipitation and the projected 600ndash800 mchange in the rainsnow line elevation during these seasons would leave most of theterrain below the freezing point Still a 20ndash40 reduction in annual snowfall is pro-25
jected with the RCP 85The range of our estimates of present-day snowfall illustrates how little that is known
about conditions that influence the availability of drinking water in some of the mostdensely populated parts of the world There is both a scientific and a societal need
468
TCD9 441ndash493 2015
Snowfall in theHimalayas an
uncertain future froma little-known past
E Viste and A Sorteberg
Title Page
Abstract Introduction
Conclusions References
Tables Figures
J I
J I
Back Close
Full Screen Esc
Printer-friendly Version
Interactive Discussion
Discussion
Paper
|D
iscussionP
aper|
Discussion
Paper
|D
iscussionP
aper|
for more information about precipitation in the HKH As a full-scale long-time observa-tional program covering all parts of the Himalayan range is not a likely possibility theonly hope for improved future knowledge of Himalayan snowfall lies in the improvementof satellite data and regional climate models
The Supplement related to this article is available online at5
doi105194tcd-9-441-2015-supplement
Acknowledgements This work has been carried out with support from the University of Bergenthe NORINDIA and SNOWHIM projects funded by The Research Council of Norway and theCentre for Climate Dynamics at the Bjerknes Centre for Climate Research We acknowledgethe World Climate Research Programmersquos Working Group on Coupled Modelling which is re-10
sponsible for CMIP and we thank the climate modeling groups listed in Table 3 of this paper forproducing and making available their model output For CMIP the US Department of EnergyrsquosProgram for Climate Model Diagnosis and Intercomparison provides coordinating support andled development of software infrastructure in partnership with the Global Organization for EarthSystem Science Portals15
References
Akhtar M Ahmad N and Booij M J The impact of climate change on the water resourcesof Hindukush-Karakorum-Himalaya region under different glacier coverage scenarios J Hy-drol 355 148ndash163 2008
Anders A M Roe G H Hallet B Montgomery D R Finnegan N J and Putkonen J20
Spatial patterns of precipitation and topography in the Himalaya in Tectonics Climate andLandscape Evolution Geological Society of America Special Paper edited by Willett S DHovius N Brandon M T and Fisher D Geological Society of America Boulder CO USA39ndash53 2006
469
TCD9 441ndash493 2015
Snowfall in theHimalayas an
uncertain future froma little-known past
E Viste and A Sorteberg
Title Page
Abstract Introduction
Conclusions References
Tables Figures
J I
J I
Back Close
Full Screen Esc
Printer-friendly Version
Interactive Discussion
Discussion
Paper
|D
iscussionP
aper|
Discussion
Paper
|D
iscussionP
aper|
Archer DR and Fowler HJ Spatial and temporal variations in precipitation in the UpperIndus Basin global teleconnections and hydrological implications Hydrol Earth Syst Sci8 47ndash61 doi105194hess-8-47-2004 2004
Bhutiyani M R Kale V S and Pawar N J Long-term trends in maximum minimum andmean annual air temperatures across the Northwestern Himalaya during the twentieth cen-5
tury Climatic Change 85 159ndash177 doi101007s10584-006-9196-1 2007Bhutiyani M R Kale V S and Pawar N J Climate change and the precipitation variations in
the northwestern Himalaya 1866ndash2006 Int J Climatol 30 535ndash548 doi101002joc19202010
Bookhagen B and Burbank D W Topography relief and TRMM-derived rainfall variations10
along the Himalaya Geophys Res Lett 33 L08405 doi1010292006GL026037 2006Bookhagen B and Burbank D W Toward a complete Himalayan hydrological budget spa-
tiotemporal distribution of snowmelt and rainfall and their impact on river discharge J Geo-phys Res 115 F03019 doi1010292009jf001426 2010
Franco B Fettweis X and Erpicum M Future projections of the Greenland ice sheet energy15
balance driving the surface melt The Cryosphere 7 1ndash18 doi105194tc-7-1-2013 2013Butt M J Characteristics of snow cover in the Hindukush Karakoram and Himalaya region
using Landsat satellite data Hydrol Process 10 3689ndash3698 doi101002hyp8375 2012Byun K and Choi M Uncertainty of snow water equivalent retrieved from AMSR-E brightness
temperature in northeast Asia Hydrol Process 28 12 doi101002hyp9846 201420
Chaturvedi R K Joshi J Jayaraman M Bala G and Ravindranath N H Multi-modelclimate change projections for India under representative concentration pathways Curr SciIndia 103 791ndash802 2012
Christensen J H Krishna Kumar K Aldrian E An S-I Cavalcanti I F A Castro Md Dong W Goswami P Hall A Kanyanga J K Kitoh A Kossin J Lau N-C Ren-25
wick J Stephenson D B Xie S-P and Zhou T Climate phenomena and their relevancefor future regional climate change in Climate Change 2013 The Physical Science BasisContribution of Working Group I to the Fifth Assessment Report of the Intergovernmen-tal Panel on Climate Change edited by Stocker T F Qin D Plattner G-K Tignor MAllen S K Boschung J Nauels A Xia Y Bex V and Midgley P M Cambridge Univer-30
sity Press Cambridge UK and New York NY USA 92 2013Collins M Knutti R Arblaster J Dufresne J-L Fichefet T Friedlingstein P Gao X
Gutowski W J Johns T Krinner G Shongwe M Tebaldi C Weaver A J and
470
TCD9 441ndash493 2015
Snowfall in theHimalayas an
uncertain future froma little-known past
E Viste and A Sorteberg
Title Page
Abstract Introduction
Conclusions References
Tables Figures
J I
J I
Back Close
Full Screen Esc
Printer-friendly Version
Interactive Discussion
Discussion
Paper
|D
iscussionP
aper|
Discussion
Paper
|D
iscussionP
aper|
Wehner M Long-term climate change projections commitments and irreversibility in Cli-mate Change 2013 The Physical Science Basis Contribution of Working Group I to theFifth Assessment Report of the Intergovernmental Panel on Climate Change edited byStocker T F Qin D Plattner G-K Tignor M Allen S K Boschung J Nauels AXia Y Bex V and Midgley P M Cambridge University Press Cambridge UK and New5
York NY USA 108 2013Cook E R Palmer J G Ahmed M Woodhouse C A Fenwick P Zafar M U Wahab M
and Khan N Five centuries of Upper Indus River flow from tree rings J Hydrol 486 365ndash375 doi101016jjhydrol201302004 2013
Dai A Temperature and pressure dependence of the rain-snow phase transition over land and10
ocean Geophys Res Lett 35 L12802 doi1010292008gl033295 2008Fowler H J and Archer D R Conflicting signals of climatic change in the Upper Indus Basin
J Climate 19 4276ndash4293 doi101175jcli38601 2006Gao J Williams M W Fu X Wang G and Gong T Spatiotemporal distribution of snow
in eastern Tibet and the response to climate change Remote Sens Environ 121 1ndash915
doi101016jrse201201006 2012Gardelle J Berthier E and Arnaud Y Slight mass gain of Karakoram glaciers in the
early twenty-first century ndash Supplement Nature Geosci 5 322ndash325 doi101038ngeo14502012
Guhathakurta P and Rajeevan M Trends in the rainfall pattern over India Int J Climatol20
28 1453ndash1469 doi101002joc1640 2008Harris I Jones P D Osborn T J and Lister D H Updated high-resolution grids of
monthly climatic observations ndash the CRU TS310 Dataset Int J Climatol 34 623ndash642doi101002joc3711 2014
Hartmann H and Andresky L Flooding in the Indus River basin ndash a spa-25
tiotemporal analysis of precipitation records Global Planet Change 107 25ndash35doi101016jgloplacha201304002 2013
Hastings D and Dunbar P Development amp Assessment of the Global Land One-km BaseElevation Digital Elevation Model (GLOBE) ISPRS Commission IV Symposium on GIS ndashBetween Visions and Applications Stuttgart Germany 7ndash10 September 199830
Hewitt K The Karakoram anomaly Glacier expansion and the ldquoelevation ef-fectrdquo Karakoram Himalaya Mt Res Dev 25 332ndash340 doi1016590276-4741(2005)025[0332TKAGEA]20CO2 2005
471
TCD9 441ndash493 2015
Snowfall in theHimalayas an
uncertain future froma little-known past
E Viste and A Sorteberg
Title Page
Abstract Introduction
Conclusions References
Tables Figures
J I
J I
Back Close
Full Screen Esc
Printer-friendly Version
Interactive Discussion
Discussion
Paper
|D
iscussionP
aper|
Discussion
Paper
|D
iscussionP
aper|
Huffman G J Adler R F Bolvin D T Gu G Nelkin E J Bowman K P Hong YStocker E F and Wolff D B The TRMM Multisatellite Precipitation Analysis (TMPA) quasi-global multiyear combined-sensor precipitation estimates at fine scales J Hydrometeorol8 38ndash55 2007
Immerzeel W Historical trends and future predictions of climate variability in the Brahmaputra5
basin Int J Climatol 28 243ndash254 doi101002joc1528 2008Immerzeel W W Droogers P de Jong S M and Bierkens M F P Large-scale monitoring
of snow cover and runoff simulation in Himalayan river basins using remote sensing RemoteSens Environ 113 40ndash49 doi101016jrse200808010 2009
Immerzeel W W van Beek L P H and Bierkens M F P Climate change will affect the10
asian water towers Science 328 1382ndash1385 doi101126science1183188 2010Ines A V M and Hansen J W Bias correction of daily GCM rainfall for crop simulation
studies Agr Forest Meteorol 138 44ndash53 doi101016jagrformet200603009 2006Jain S K Goswami A and Saraf A K Role of elevation and aspect in snow distribution
in western Himalaya Water Resour Manag 23 71ndash83 doi101007s11269-008-9265-515
2009Krakauer N Pradhanang S Lakhankar T and Jha A Evaluating satellite products for
precipitation estimation in mountain regions a case study for Nepal Remote Sensing 54107ndash4123 2013
Krishna A P Snow and glacier cover assessment in the high mountains of Sikkim Himalaya20
Hydrol Process 19 2375ndash2383 doi101002hyp5890 2005Kulkarni A V Rathore B P Singh S K and Ajai Distribution of seasonal snow cover in cen-
tral and western Himalaya Ann Glaciol 51 123ndash128 doi1031891727564107913864452010
Kumar V Rao Y S Venkataraman G Sarwade R N and Mani S Analysis of Aqua25
AMSR-E Derived Snow Water Equivalent over Himalayan Snow Covered Regions Geo-science and Remote Sensing Symposium Denver CO USA 31 Julyndash4 August 2006
Kaumlaumlb A Berthier E Nuth C Gardelle J and Arnaud Y Contrasting patterns of earlytwenty-first-century glacier mass change in the Himalayas Nature 488 495ndash498 availableat httpwwwnaturecomnaturejournalv488n7412absnature11324html ndash Supplement30
2012Lehner B Verdin K and Jarvis A New global hydrography derived from spaceborne eleva-
tion data Eos T Am Geophys Un 89 93ndash94 doi1010292008EO100001 2008
472
TCD9 441ndash493 2015
Snowfall in theHimalayas an
uncertain future froma little-known past
E Viste and A Sorteberg
Title Page
Abstract Introduction
Conclusions References
Tables Figures
J I
J I
Back Close
Full Screen Esc
Printer-friendly Version
Interactive Discussion
Discussion
Paper
|D
iscussionP
aper|
Discussion
Paper
|D
iscussionP
aper|
MacQueen J Some Methods for Classification and Analysis of Multivariate ObservationsFifth Berkeley Symposium on Mathematical Statistics and Probability Berkeley California21 Junendash18 July 1967
Meacuteneacutegoz M Galleacutee H and Jacobi H W Precipitation and snow cover in the Himalayafrom reanalysis to regional climate simulations Hydrol Earth Syst Sci 17 3921ndash39365
doi105194hess-17-3921-2013 2013Menon A Levermann A Schewe J Lehmann J and Frieler K Consistent increase in
Indian monsoon rainfall and its variability across CMIP-5 models Earth Syst Dynam 4287ndash300 doi105194esd-4-287-2013 2013
Moss R H Edmonds J A Hibbard K A Manning M R Rose S K van Vuuren D P10
Carter T R Emori S Kainuma M Kram T Meehl G A Mitchell J F B Naki-cenovic N Riahi K Smith S J Stouffer R J Thomson A M Weyant J P andWilbanks T J The next generation of scenarios for climate change research and assess-ment Nature 463 747ndash756 2010
Negi H S Kulkarni A V and Semwal B S Estimation of snow cover distribution in Beas15
basin Indian Himalaya using satellite data and ground measurements J Earth Syst Sci118 525ndash538 doi101007s12040-009-0039-0 2009
Palazzi E v Hardenberg J and Provenzale A Precipitation in the Hindu-Kush Karako-ram Himalaya observations and future scenarios J Geophys Res-Atmos 118 85ndash100doi1010292012JD018697 201320
Rees H G and Collins D N Regional differences in response of flow in glacier-fed Himalayanrivers to climatic warming Hydrol Process 20 2157ndash2169 doi101002hyp6209 2006
Rienecker M M Suarez M J Gelaro R Todling R Bacmeister J Liu EBosilovich M G Schubert S D Takacs L Kim G-K Bloom S Chen J Collins DConaty A da Silva A Gu W Joiner J Koster R D Lucchesi R Molod A Owens T25
Pawson S Pegion P Redder C R Reichle R Robertson F R Ruddick A GSienkiewicz M and Woollen J MERRA NASArsquos Modern-Era Retrospective Analysis forResearch and Applications J Climate 24 3624ndash3648 doi101175JCLI-D-11-0001512011
Rikiishi K and Nakasato H Height dependence of the tendency for reduction in seasonal30
snow cover in the Himalaya and the Tibetan Plateau region 1966ndash2001 Ann Glaciol 43369ndash377 doi103189172756406781811989 2006
473
TCD9 441ndash493 2015
Snowfall in theHimalayas an
uncertain future froma little-known past
E Viste and A Sorteberg
Title Page
Abstract Introduction
Conclusions References
Tables Figures
J I
J I
Back Close
Full Screen Esc
Printer-friendly Version
Interactive Discussion
Discussion
Paper
|D
iscussionP
aper|
Discussion
Paper
|D
iscussionP
aper|
Raumlisaumlnen J Warmer climate less or more snow Clim Dynam 30 307ndash319doi101007s00382-007-0289-y 2008
Schaner N Voisin N Nijssen B and Lettenmaier D P The contribution of glacier melt tostreamflow Environ Res Lett 7 034029 doi1010881748-932673034029 2012
Scherler D Bookhagen B and Strecker M R Spatially variable response of Himalayan5
glaciers to climate change affected by debris cover Nature Geosci 4 156ndash159 availableat httpwwwnaturecomngeojournalv4n3absngeo1068html ndash Supplement 2011
Sharif M Archer D R Fowler H J and Forsythe N Trends in timing and magnitude offlow in the Upper Indus Basin Hydrol Earth Syst Sci 17 1503ndash1516 doi105194hess-17-1503-2013 201310
Shekhar M S Chand H Kumar S Srinivasan K and Ganju A Climate-change studiesin the western Himalaya Ann Glaciol 51 105ndash112 doi1031891727564107913865082010
Shrestha A B Wake C P Mayewski P A and Dibb J E Maximum tempera-ture trends in the Himalaya and its vicinity an analysis based on temperature records15
from Nepal for the period 1971ndash94 J Climate 12 2775ndash2786 doi1011751520-0442(1999)012lt2775MTTITHgt20CO2 1999
Shrestha A B Wake C P Dibb J E and Mayewski P A Precipitation fluctuations in theNepal Himalaya and its vicinity and relationship with some large scale climatological parame-ters Int J Climatol 20 317ndash327 doi101002(SICI)1097-0088(20000315)203lt317AID-20
JOC476gt30CO2-G 2000Siderius C Biemans H Wiltshire A Rao S Franssen W H P Kumar P Gosain A K
van Vliet M T H and Collins D N Snowmelt contributions to discharge of the GangesSci Total Environ Supplement 468ndash469 9 doi101016jscitotenv201305084 2013
Singh P Jain S K and Kumar N Estimation of snow and glacier-melt contribution to the25
Chenab River Western Himalaya Mt Res Dev 17 49ndash56 doi1023073673913 1997Singh P Kumar V Thomas T and Arora M Changes in rainfall and relative hu-
midity in river basins in northwest and central India Hydrol Process 22 2982ndash2992doi101002hyp6871 2008
Sontakke N A Singh N and Singh H N Instrumental period rainfall series of the Indian30
region (AD 1813ndash2005) revised reconstruction update and analysis Holocene 18 1055ndash1066 doi1011770959683608095576 2008
474
TCD9 441ndash493 2015
Snowfall in theHimalayas an
uncertain future froma little-known past
E Viste and A Sorteberg
Title Page
Abstract Introduction
Conclusions References
Tables Figures
J I
J I
Back Close
Full Screen Esc
Printer-friendly Version
Interactive Discussion
Discussion
Paper
|D
iscussionP
aper|
Discussion
Paper
|D
iscussionP
aper|
Sperber K R Annamalai H Kang I S Kitoh A Moise A Turner A Wang B andZhou T The Asian summer monsoon an intercomparison of CMIP5 vs CMIP3 simulationsof the late 20th century Clim Dynam 41 2711ndash2744 doi101007s00382-012-1607-62013
Tahir A A Chevallier P Arnaud Y and Ahmad B Snow cover dynamics and hydrological5
regime of the Hunza River basin Karakoram Range Northern Pakistan Hydrol Earth SystSci 15 2275ndash2290 doi105194hess-15-2275-2011 2011a
Tahir A A Chevallier P Arnaud Y Neppel L and Ahmad B Modeling snowmelt-runoffunder climate scenarios in the Hunza River basin Karakoram Range Northern Pakistan JHydrol 409 104ndash117 doi101016jjhydrol201108035 2011b10
Taylor K E Stouffer R J and Meehl G A An overview of CMIP5 and the experimentdesign B Am Meteorol Soc 93 14 doi101175BAMS-D-11-000941 2011
Tedesco M and Narvekar P S Assessment of the NASA AMSR-E SWE product IEEE J SelTop Appl 3 141ndash159 doi101109JSTARS20102040462 2010
Teutschbein C and Seibert J Bias correction of regional climate model simulations for hydro-15
logical climate-change impact studies review and evaluation of different methods J Hydrol456ndash457 12ndash29 doi101016jjhydrol201205052 2012
Turner A G and Annamalai H Climate change and the South Asian summer monsoon NatClim Change 2 587ndash595 2012
van Vuuren D Edmonds J Kainuma M Riahi K Thomson A Hibbard K Hurtt G20
Kram T Krey V Lamarque J-F Masui T Meinshausen M Nakicenovic N Smith Sand Rose S The representative concentration pathways an overview Climatic Change109 26 doi101007s10584-011-0148-z 2011
Wang A and Zeng X Development of global hourly 05-degree land surface air temperaturedatasets J Climate 26 7676ndash7691 doi101175JCLI-D-12-006821 201325
Wiltshire A J Climate change implications for the glaciers of the Hindu Kush Karakoram andHimalayan region The Cryosphere 8 941ndash958 doi105194tc-8-941-2014 2014
Winiger M Gumpert M and Yamout H KarakorumndashHindukushndashwestern Himalaya assess-ing high-altitude water resources Hydrol Process 19 2329ndash2338 doi101002hyp5887200530
Xu X Lu C Shi X and Gao S World water tower An atmospheric perspective GeophysRes Lett 35 L20815 doi1010292008GL035867 2008a
475
TCD9 441ndash493 2015
Snowfall in theHimalayas an
uncertain future froma little-known past
E Viste and A Sorteberg
Title Page
Abstract Introduction
Conclusions References
Tables Figures
J I
J I
Back Close
Full Screen Esc
Printer-friendly Version
Interactive Discussion
Discussion
Paper
|D
iscussionP
aper|
Discussion
Paper
|D
iscussionP
aper|
Xu Z X Gong T L and Li J Y Decadal trend of climate in the Tibetan Plateaumdashregionaltemperature and precipitation Hydrol Process 22 3056ndash3065 doi101002hyp68922008b
Yasutomi N Hamada A and Akiyo Y Development of a Long-term Daily Gridded Temper-ature Dataset and its Application to RainSnow Discrimination of Daily Precipitation Global5
Environ Res15 165ndash172 2011Yatagai A Kamiguchi K Arakawa O Hamada A Yasutomi N and Kitoh A APHRODITE
Constructing a Long-Term Daily Gridded Precipitation Dataset for Asia Based on a DenseNetwork of Rain Gauges B Am Meteorol Soc 93 1401ndash1415 doi101175BAMS-D-11-001221 201210
You Q Kang S Aguilar E and Yan Y Changes in daily climate extremes in the east-ern and central Tibetan Plateau during 1961ndash2005 J Geophys Res-Atmos 113 D07101doi1010292007JD009389 2008
476
TCD9 441ndash493 2015
Snowfall in theHimalayas an
uncertain future froma little-known past
E Viste and A Sorteberg
Title Page
Abstract Introduction
Conclusions References
Tables Figures
J I
J I
Back Close
Full Screen Esc
Printer-friendly Version
Interactive Discussion
Discussion
Paper
|D
iscussionP
aper|
Discussion
Paper
|D
iscussionP
aper|
Table 1 Combinations of data types used in snowfall estimates T temperature P precipita-tion f (P T ) indicates that snowfall is calculated as a function of P and T
Precipitation Temperature Snowfall Time
MERRA MERRA PresentMERRA reference MERRA Terrain-adjusted MERRA f (P T ) PresentMERRA T2m MERRA MERRA T2m f (P T ) PresentBias-corrected with obs T MERRA Bias-corr terrain-adj MERRA f (P T ) PresentBias-corrected with obs P Bias-corr MERRA Terrain-adjusted MERRA f (P T ) PresentBias-corrected with obs T P Bias-corr MERRA Bias-corr terrain-adj MERRA f (P T ) PresentCMIP5 T MERRA Terrain-adj MERRA+∆T f (P T ) FutureCMIP5 P MERRAtimes∆P Terrain-adj MERRA f (P T ) FutureCMIP5 T P MERRAtimes∆P Terrain-adj MERRA+∆T f (P T ) FutureBias-corr CMIP5 T Bias-corr MERRA Bias-corr terrain-adj MERRA+∆T f (P T ) FutureBias-corr CMIP5 P Bias-corr MERRAtimes∆P Bias-corr terrain-adj MERRA f (P T ) FutureBias-corr CMIP5 T P Bias-corr MERRAtimes∆P Bias-corr terrain-adj MERRA+∆T f (P T ) Future
477
TCD9 441ndash493 2015
Snowfall in theHimalayas an
uncertain future froma little-known past
E Viste and A Sorteberg
Title Page
Abstract Introduction
Conclusions References
Tables Figures
J I
J I
Back Close
Full Screen Esc
Printer-friendly Version
Interactive Discussion
Discussion
Paper
|D
iscussionP
aper|
Discussion
Paper
|D
iscussionP
aper|
Table 2 Data sets used in calculations of present-day snowfall
Product Time Hor res Description
MERRA 1979ndash2012 05 lat 07 lon Hourly atmospheric reanalysis data(Rienecker et al 2011)
APHRODITEV1204V1101
1979ndash2007 025 Daily temperature andprecipitation basedon observations (Yatagai et al 2012Yasutomi et al 2011)
CRU TS 320 1979ndash2011 05 Monthly temperature and precipitationbased on observations(Harris et al 2014)
TRMM 3B42 V7 1998ndash2012 05 3 hourly satellite-based precipitation(Huffman et al 2007)
GLOBE 1 km Topography data set(Hastings and Dunbar 1998)
478
TCD9 441ndash493 2015
Snowfall in theHimalayas an
uncertain future froma little-known past
E Viste and A Sorteberg
Title Page
Abstract Introduction
Conclusions References
Tables Figures
J I
J I
Back Close
Full Screen Esc
Printer-friendly Version
Interactive Discussion
Discussion
Paper
|D
iscussionP
aper|
Discussion
Paper
|D
iscussionP
aper|
Table 3 CMIP5 models and RCPs used (x) in calculations of 2071ndash2100 snowfall
Model RCP 26 RCP 85
CanESM2 x xCCSM4 x xCESM1-CAM5 xCNRM-CM5 xGFDL-CM3 x xGFDL-ESM2G xGISS-E2-R x xHadGEM2-ES x xIPSL-CM5A-LR x xIPSL-CM5A-MR x xMIROC-ESM x xMIROC-ESM-CHEM x xMIROC5 x xMRI-CGCM3 x xNorESM1-M x xNorESM1-ME x x
479
TCD9 441ndash493 2015
Snowfall in theHimalayas an
uncertain future froma little-known past
E Viste and A Sorteberg
Title Page
Abstract Introduction
Conclusions References
Tables Figures
J I
J I
Back Close
Full Screen Esc
Printer-friendly Version
Interactive Discussion
Discussion
Paper
|D
iscussionP
aper|
Discussion
Paper
|D
iscussionP
aper|
Table 4 Annual snowfall estimates for the Indus Ganges and Brahmaputra Basins S snow[km3 SWE] P precipitation [km3] S and P percent of MERRA reference snowfall andMERRA precipitation First horizontal section no bias-corrections Second third and fourthsection bias-corrections with T P and both T and P
Indus Basin Ganges Basin Brahmaputra BasinInput S S P P S S P P S S P P
MERRA reference 148 100 422 100 54 100 1147 100 119 100 733 100MERRA 166 112 422 100 49 90 1147 100 129 109 733 100MERRA T2m 154 104 422 100 42 77 1147 100 109 92 733 100T APHRODITE 113 76 422 100 30 55 1147 100 74 62 733 100T CRU 126 85 422 100 81 151 1147 100 109 92 733 100P APHRODITE 66 44 315 75 22 42 1020 89 35 30 567 77P TRMM 72 49 404 96 31 57 1244 108 63 54 835 114P CRU 84 56 398 94 30 56 1100 96 53 45 716 98P T APHRODITE 49 33 315 75 12 22 1020 89 20 17 567 77P APHRODITE T CRU 62 42 315 75 34 63 1020 89 33 28 567 77P TRMM T APHRODITE 54 36 390 92 18 34 1195 104 39 33 815 111P TRMM T CRU 65 44 403 96 46 85 1254 109 58 49 813 111P CRU T APHRODITE 65 44 395 94 17 31 1106 96 31 26 718 98P T CRU 80 54 398 94 41 75 1100 96 49 42 716 98
480
TCD9 441ndash493 2015
Snowfall in theHimalayas an
uncertain future froma little-known past
E Viste and A Sorteberg
Title Page
Abstract Introduction
Conclusions References
Tables Figures
J I
J I
Back Close
Full Screen Esc
Printer-friendly Version
Interactive Discussion
Discussion
Paper
|D
iscussionP
aper|
Discussion
Paper
|D
iscussionP
aper|
Table 5 Projected change in annual snowfall from 1971ndash2000 to 2071ndash2100 with referenceto terrain-adjusted MERRA and APHRODITE ∆Sabs [km3] is the absolute change ∆Srel [] isthe relative change compared to the present-day MERRA reference snowfall Values are pre-sented with the CMIP5 multi-model mean as the main value and the span of individual modelsin brackets (MERRA only) ∆TP indicates that changes in both temperature and precipitationare included whereas ∆P and ∆T denotes changes only in precipitation or temperature re-spectively
Indus Ganges Brahmaputra∆Sabs [km3] ∆Srel [] ∆Sabs [km3] ∆Srel [] ∆Sabs [km3] ∆Srel []
RCP 85 MERRA ∆TP minus49 [minus83minus9] minus33 [minus56minus6] minus27 [minus36minus14] minus50 [minus66minus25] minus64 [minus93minus39] minus54 [minus79minus33]MERRA ∆T minus51 [minus67minus34] minus34 [minus45minus23] minus28 [minus34minus21] minus51 [minus64minus39] minus71 [minus87minus53] minus60 [minus73minus44]MERRA ∆P 5 [minus2544] 4 [minus1730] 7 [minus417] 12 [minus731] 20 [minus1750] 17 [minus1542]
APHRO ∆TP minus25 minus51 minus7 minus56 minus13 minus67APHRO ∆T minus25 minus52 minus7 minus57 minus14 minus71APHRO ∆P 1 1 1 6 3 16
RCP 26 MERRA ∆TP minus15 [minus406] minus10 [minus274] minus10 [minus19minus3] minus18 [minus36minus5] minus25 [minus42minus5] minus21 [minus35minus4]MERRA ∆T minus18 [minus27minus9] minus12 [minus18minus6] minus12 [minus21minus6] minus21 [minus39minus11] minus29 [minus47minus13] minus25 [minus40minus11]MERRA ∆P 3 [minus1825] 2 [minus1217] 3 [minus210] 5 [minus419] 7 [minus828] 6 [minus623]
APHRO ∆TP minus9 minus18 minus2 minus20 minus6 minus29APHRO ∆T minus10 minus19 minus3 minus23 minus6 minus32APHRO ∆P 1 1 0 4 1 6
481
TCD9 441ndash493 2015
Snowfall in theHimalayas an
uncertain future froma little-known past
E Viste and A Sorteberg
Title Page
Abstract Introduction
Conclusions References
Tables Figures
J I
J I
Back Close
Full Screen Esc
Printer-friendly Version
Interactive Discussion
Discussion
Paper
|D
iscussionP
aper|
Discussion
Paper
|D
iscussionP
aper|
Figure 1 Map of the region with the Indus Ganges and Brahmaputra basins outlined in whiteThinner outlines are national borders Background NASA Visible Earth
482
TCD9 441ndash493 2015
Snowfall in theHimalayas an
uncertain future froma little-known past
E Viste and A Sorteberg
Title Page
Abstract Introduction
Conclusions References
Tables Figures
J I
J I
Back Close
Full Screen Esc
Printer-friendly Version
Interactive Discussion
Discussion
Paper
|D
iscussionP
aper|
Discussion
Paper
|D
iscussionP
aper|
0
400 mm
Months 1ndash12
SP
I1
I2I3
I5I4
G1
G2G3
G4
B1
B2
B3B4
Viste amp SortebergFigure 2
Figure 2 Monthly mean MERRA precipitation and MERRA reference snowfall in sub-basinclusters of the Indus (I) Ganges (G) and Brahmaputra (B) Total bar height MERRA precip-itation (P) [mm] Colored bars snowfall (S) [mm SWE] based on MERRA precipitation andterrain-adjusted MERRA temperature in the region with the same color Cluster 1 in eachbasin is considered snow-free and the seasonal cycles are not shown
483
TCD9 441ndash493 2015
Snowfall in theHimalayas an
uncertain future froma little-known past
E Viste and A Sorteberg
Title Page
Abstract Introduction
Conclusions References
Tables Figures
J I
J I
Back Close
Full Screen Esc
Printer-friendly Version
Interactive Discussion
Discussion
Paper
|D
iscussionP
aper|
Discussion
Paper
|D
iscussionP
aper|
a) MERRA reference b) APHRODITE c) APHRODITE ndash MERRA ref
30 km3
20100-10-20-30
Viste amp SortebergFigure 3
Figure 3 The effect of bias-corrections with APHRODITE temperature and precipitation(a) MERRA reference snowfall (b) Snowfall based on bias-corrections with APHRODITE(c) APHRODITE (b) minus MERRA reference snowfall (a)
484
TCD9 441ndash493 2015
Snowfall in theHimalayas an
uncertain future froma little-known past
E Viste and A Sorteberg
Title Page
Abstract Introduction
Conclusions References
Tables Figures
J I
J I
Back Close
Full Screen Esc
Printer-friendly Version
Interactive Discussion
Discussion
Paper
|D
iscussionP
aper|
Discussion
Paper
|D
iscussionP
aper|
Figure 4 Difference between MERRA precipitation and observation-based data (a) Annualmean MERRA precipitation (b c and d) Annual mean MERRA precipitation bias-correctedwith observations APHRODITE CRU TS and TRMM 3B42 For each data set the small insetmaps show the observations minus MERRA
485
TCD9 441ndash493 2015
Snowfall in theHimalayas an
uncertain future froma little-known past
E Viste and A Sorteberg
Title Page
Abstract Introduction
Conclusions References
Tables Figures
J I
J I
Back Close
Full Screen Esc
Printer-friendly Version
Interactive Discussion
Discussion
Paper
|D
iscussionP
aper|
Discussion
Paper
|D
iscussionP
aper|
Biasminuscorrected minus original MERRA temperature [C]
minus15
minus10
minus5
0
5
10
Biasminuscorrected minus original MERRA temperature [C]
minus15
minus10
minus5
0
5
10
MERRA mean temperature [C] 1979minus2007
minus15
minus10
minus5
0
5
10
15
20
25
30a) MERRA b) APHRODITE ndash MERRA c) CRU ndash MERRA
-10
0
10
20
30degC
minus15
minus10
minus5
0
5
10
15degC
Viste amp SortebergFigure 5
Figure 5 Difference between MERRA temperature and observation-based data (a) Annualmean MERRA temperature (b and c) Annual mean MERRA temperature bias-corrected withobservations APHRODITE and CRU TS
486
TCD9 441ndash493 2015
Snowfall in theHimalayas an
uncertain future froma little-known past
E Viste and A Sorteberg
Title Page
Abstract Introduction
Conclusions References
Tables Figures
J I
J I
Back Close
Full Screen Esc
Printer-friendly Version
Interactive Discussion
Discussion
Paper
|D
iscussionP
aper|
Discussion
Paper
|D
iscussionP
aper|
Jan Apr
Jul Oct
a)
c)
b)
d)
15degC
10
5
0
ndash5
ndash10
ndash15
200 mm16012080400ndash40ndash80ndash120ndash160ndash200
Viste amp SortebergFigure 6
Figure 6 Regions where increasing temperatures are likely to cause a shift from snow to rainData monthly mean MERRA temperature terrain-adjusted to a 4 km GLOBE grid Red temper-ature between minus5 and 0 considered critical Small inset maps monthly MERRA precipitationin the critical zones
487
TCD9 441ndash493 2015
Snowfall in theHimalayas an
uncertain future froma little-known past
E Viste and A Sorteberg
Title Page
Abstract Introduction
Conclusions References
Tables Figures
J I
J I
Back Close
Full Screen Esc
Printer-friendly Version
Interactive Discussion
Discussion
Paper
|D
iscussionP
aper|
Discussion
Paper
|D
iscussionP
aper|
1 2 3 4 5 6 7 8 9 10 11 12Month
∆T [ordm
C]
a) Indus
0
1
2
3
4
5
6
7
8
9
10
b) Ganges∆T
[ordmC
]
1 2 3 4 5 6 7 8 9 10 11 12Month
1
2
3
4
5
6
7
8
0 0
c) Brahmaputra
∆T [ordm
C]
1 2 3 4 5 6 7 8 9 10 11 12Month
1
2
3
4
5
6
7
8
9
10 RCP 85RCP 85 meanRCP 26RCP 26 mean
Viste amp SortebergFigure 7
Figure 7 Projected future temperature change from 1971ndash2000 to 2071ndash2100 in the (a) In-dus (b) Ganges and (c) Brahmaputra Basins Thin lines show the individual CMIP5 modelsstronger lines the multi-model mean
488
TCD9 441ndash493 2015
Snowfall in theHimalayas an
uncertain future froma little-known past
E Viste and A Sorteberg
Title Page
Abstract Introduction
Conclusions References
Tables Figures
J I
J I
Back Close
Full Screen Esc
Printer-friendly Version
Interactive Discussion
Discussion
Paper
|D
iscussionP
aper|
Discussion
Paper
|D
iscussionP
aper|
1 2 3 4 5 6 7 8 9 10 11 12Month
[km
3 ]
a) Indus
0
20
40
60
80
100
120
140
b) Ganges[k
m3 ]
1 2 3 4 5 6 7 8 9 10 11 12Month
0
100
200
300
400
500
600
700
c) Brahmaputra
[km
3 ]
1 2 3 4 5 6 7 8 9 10 11 12Month
0
50
100
150
200
250
MERRA ref
2071ndash2100
1979ndash2008
RCP 85RCP 85 meanRCP 26RCP 26 mean
Viste amp SortebergFigure 8
Figure 8 Projected future precipitation in the (a) Indus (b) Ganges and (c) BrahmaputraBasins Gray bars MERRA 1979ndash2008 Thin lines and horizontal marks on the bars show theindividual CMIP5 models and the multi-model mean for 2071ndash2100
489
TCD9 441ndash493 2015
Snowfall in theHimalayas an
uncertain future froma little-known past
E Viste and A Sorteberg
Title Page
Abstract Introduction
Conclusions References
Tables Figures
J I
J I
Back Close
Full Screen Esc
Printer-friendly Version
Interactive Discussion
Discussion
Paper
|D
iscussionP
aper|
Discussion
Paper
|D
iscussionP
aper|
1 2 3 4 5 6 7 8 9 10 11 120
5
10
15
20
25
30
35
Month
SWE
[km
3 ]
a) Indus
0
1
2
3
4
5
6
7
8
b) Ganges
SWE
[km
3 ]
1 2 3 4 5 6 7 8 9 10 11 12Month
0
2
4
6
8
10
12
14
16
18
20
c) Brahmaputra
SWE
[km
3 ]
1 2 3 4 5 6 7 8 9 10 11 12Month
MERRA ref
2071ndash2100
1979ndash2008
RCP 85RCP 85 meanRCP 26RCP 26 mean
Viste amp SortebergFigure 9
Figure 9 Projected future snowfall in the (a) Indus (b) Ganges and (c) Brahmaputra Basinswith reference to MERRA reference snowfall Gray bars MERRA reference snowfall for 1979ndash2008 Thin lines and horizontal marks on the bars show the individual CMIP5 models andthe multi-model mean for 2071ndash2100 based on changes in temperature and precipitation asdescribed in Sect 23
490
TCD9 441ndash493 2015
Snowfall in theHimalayas an
uncertain future froma little-known past
E Viste and A Sorteberg
Title Page
Abstract Introduction
Conclusions References
Tables Figures
J I
J I
Back Close
Full Screen Esc
Printer-friendly Version
Interactive Discussion
Discussion
Paper
|D
iscussionP
aper|
Discussion
Paper
|D
iscussionP
aper|
Figure 10 Projected future changes in snowfall in sub-basins of the Indus Ganges andBrahmaputra Basins (a) Absolute change [km3] with reference to MERRA reference snow-fall (b) Absolute change [km3] with reference to APHRODITE snowfall (c d) Correspondingrelative changes [] with reference to MERRA and APHRODITE
491
TCD9 441ndash493 2015
Snowfall in theHimalayas an
uncertain future froma little-known past
E Viste and A Sorteberg
Title Page
Abstract Introduction
Conclusions References
Tables Figures
J I
J I
Back Close
Full Screen Esc
Printer-friendly Version
Interactive Discussion
Discussion
Paper
|D
iscussionP
aper|
Discussion
Paper
|D
iscussionP
aper|
J F M A M J J A S O N DMonth
0
5
10
15
20 km3Precip
0
2
4
6
8
10 km3SWE
2000
3000
4000
5000
6000 masl
1845
J F
M
A
M
JJ A
S
O
N
D
RSL
I4A = 146793 km2
1 km 3 = 68 mm
0
05
1
15 SWE rel
8000 m
0
J F M A M J J A S O N DMonth
0
2
4
6
8
10
12 km3 SWE
3000
4000
5000
6000 masl
78
2
14
J FM
A
MJ
J AS
O
ND
RSL
I5
Precip
0
5
10
15
20
25 km3
0
05
1
15 SWE rel
8000 m
0
A = 178669 km2
1 km 3 = 56 mm
CMIP52071ndash2100mean
Today
MERRA APHRODITE
Individual models
CMIP52071ndash2100mean
MERRA APHRODITE
Individual models
CMIP52071ndash2100Precip mean
MERRA APHRODITE
Individual models
SWE todayPrecip today
2000 mTerrain distribution of area between levels
CMIP52071ndash2100
TodayMERRA
APHRODITE
a)
i)
ii)
iii)
iv)
b)
Viste amp SortebergFigure 11
Figure 11 Monthly CMIP5 RCP 85 change in snowfall precipitation and rainsnow line eleva-tion in the upper Indus clusters (a) 4 and (b) 5 from 1971ndash2000 to 2071ndash2100 with referenceto the MERRA reference (red) and APHRODITE (blue) CMIP5 multi-model means are shownas horizontal marks individual models as dots Cluster location and terrain profile are shownabove the graphs (i) Fractional change in snowfall (ii) Future snowfall [km3] (dots) comparedto today (bars) (iii) Future precipitation [km3] (dots) compared to today (bars) Snowfall todayis shown as darker part of bars (iv) Rainsnow line elevation [m asl] Gray background el-evation histogram with the of total ground area lying in the marked 2000 m intervals Barschange from today (bottom) to CMIP5 multi-model mean (top)
492
TCD9 441ndash493 2015
Snowfall in theHimalayas an
uncertain future froma little-known past
E Viste and A Sorteberg
Title Page
Abstract Introduction
Conclusions References
Tables Figures
J I
J I
Back Close
Full Screen Esc
Printer-friendly Version
Interactive Discussion
Discussion
Paper
|D
iscussionP
aper|
Discussion
Paper
|D
iscussionP
aper|
3000
4000
5000
6000 masl
0
2
4
6
8
10 km3
0
10
20
30
40
50
60 km3
0
05
1
15
J F M A M J J A S O N DMonth
J FM
A
M
JJ A
S
O
ND
Precip
SWE
RSL
SWE rel
53
B3
8000 m
0
A = 139611 km2
1 km 3 = 72 mm
4500
5000
5500
6000
6500 masl
0
1
2
3
4 km3
0
10
20
30
40
50 km3
0
05
1
15 SWE rel
SWE
RSL
Precip
95
J F M A M J J A S O N DMonth
J FM
A
M
JJ A
S
ON
D
B4
8000 m
0
A = 159165 km2
1 km 3 = 63 mm
CMIP52071ndash2100mean
Today
MERRA APHRODITE
Individual models
CMIP52071ndash2100mean
MERRA APHRODITE
Individual models
CMIP52071ndash2100Precip mean
MERRA APHRODITE
Individual models
SWE todayPrecip today
2000 mTerrain distribution of area between levels
CMIP52071ndash2100
TodayMERRA
APHRODITE
a)
i)
ii)
iii)
iv)
b)
Viste amp SortebergFigure 12
Figure 12 Monthly CMIP5 RCP 85 change in snowfall precipitation and rainsnow line ele-vation in the upper Brahmaputra clusters (a) 4 and (b) 3 See Fig 11 for a description of thecontent
493
- Introduction
-
- Observed trends in snowfall temperature and precipitation
- Future projections of snowfall temperature and precipitation
- Aims and scope
-
- Data and methods
-
- Reference present-day snowfall
- Bias-corrected present-day snowfall
- Projected snowfall
- The rain-snow line
-
- Present-day snowfall
-
- Seasonal cycles of precipitation and snowfall
- Comparison of snowfall estimates
-
- Projected future snowfall
-
- Basin-scale projections
- Regional projections
-
- Upper Indus western part
- Upper Indus eastern part
- Upper Brahmaputra western part
- Upper Brahmaputra eastern part
-
- Potential effects of reduced snowfall on water availability
-
- Concluding summary
-
TCD9 441ndash493 2015
Snowfall in theHimalayas an
uncertain future froma little-known past
E Viste and A Sorteberg
Title Page
Abstract Introduction
Conclusions References
Tables Figures
J I
J I
Back Close
Full Screen Esc
Printer-friendly Version
Interactive Discussion
Discussion
Paper
|D
iscussionP
aper|
Discussion
Paper
|D
iscussionP
aper|
ulate 7ndash25 reductions in the spring snow cover extent by 2080ndash2100 For snowfalland snow water equivalents (SWE) the projections show more variation While warm-ing decreases the amount of snow both through melting and through decreasing thesnow fraction more precipitation may increase snowfall in some of the coldest regions(Raumlisaumlnen 2008 Brutel-Vuilmet et al 2013) Though shown to apply mainly to the5
northern parts of Eurasia and North America there is a possibility that some of thehigher-lying terrain in the HKH may be similarly affected
13 Aims and scope
For the HKH uncertainty in projections of future precipitation and snowfall comes ontop of uncertainty in present time conditions Observations are limited especially in re-10
mote high-elevation regions (Anders et al 2006 Immerzeel 2008 Tahir et al 2011bWiniger et al 2005) Insufficient knowledge of the amount of snow falling over the re-gion today makes the contribution to both seasonal snowmelt and storage in glacierscorrespondingly uncertain
Recognizing this uncertainty this study provides an ensemble of monthly mean15
snowfall estimates for all sub-basins of the Indus Ganges and Brahmaputra todayand for 2071ndash2100 For the present time estimates we have combined MERRA re-analysis data (Rienecker et al 2011) with observationally based data sets of precip-itation and temperature CRU TS (Harris et al 2014) TRMM (Huffman et al 2007)and APHRODITE (Yatagai et al 2012 Yasutomi et al 2011) Whereas Meacuteneacutegoz20
et al (2013) and Wiltshire (2014) analyzed Himalayan snowfall by downscaling reanal-ysis data with regional climate models we have applied a simple terrain adjustment ofthe reanalysis temperature field
The ensemble of present-day estimates is presented in Sect 3 Future snowfall wasthen calculated based on the present-day snowfall and projected changes in temper-25
ature and precipitation in 14 and 15 CMIP5 models for the RCPs 26 and 85 re-spectively These results are presented in Sect 4 The data and methods for both thepresent time and the future case are described in Sect 2
448
TCD9 441ndash493 2015
Snowfall in theHimalayas an
uncertain future froma little-known past
E Viste and A Sorteberg
Title Page
Abstract Introduction
Conclusions References
Tables Figures
J I
J I
Back Close
Full Screen Esc
Printer-friendly Version
Interactive Discussion
Discussion
Paper
|D
iscussionP
aper|
Discussion
Paper
|D
iscussionP
aper|
Three main features may be involved in precipitation changes in the HKH changesin the summer monsoon changes in western disturbances during winter and the gen-eral changes that occur in the thermodynamic properties of the air as the temperatureincreases and the air contains more water vapor We have not considered the role ofthe different factors only looked at how changes in temperature and precipitation af-5
fect snowfall Unless otherwise specified any reference to snow refers to precipitationfalling as snow not to the snow cover on the ground
2 Data and methods
In addition to the original MERRA reanalysis snowfall we estimated snowfall usingdifferent combinations of temperature and precipitation data An overview of the com-10
binations is shown in Table 1 and the data sets used presented in Tables 2 and 3Present-day snowfall estimates were based on
1 MERRA 2 m temperature adjusted to a higher-resolution elevation grid andMERRA precipitation (Sect 21) This was used as a basis for the other estimatesand is referred to as MERRA reference snowfall The adjusted temperature is15
referred to as terrain-adjusted
2 MERRA 2 m temperature and precipitation
3 The MERRA data in (1) bias-corrected with observation-based data for tempera-ture and precipitation (Sect 22)
Estimates for the last decades of the 21th century were based on20
4 The MERRA data in (1) plus the changes in temperature and precipitation ina group of CMIP5 models over the coming century (Sect 23)
5 Bias-corrections with one of the data sets in (3) ndash APHRODITE ndash plus the meanchanges in temperature and precipitation in the CMIP5 models used in (4) Thiswas done to account for the spread in the present-day estimates25
449
TCD9 441ndash493 2015
Snowfall in theHimalayas an
uncertain future froma little-known past
E Viste and A Sorteberg
Title Page
Abstract Introduction
Conclusions References
Tables Figures
J I
J I
Back Close
Full Screen Esc
Printer-friendly Version
Interactive Discussion
Discussion
Paper
|D
iscussionP
aper|
Discussion
Paper
|D
iscussionP
aper|
With the exception of original MERRA snowfall data all snowfall estimates werebased on the relationship between temperature and snowfall derived by Dai (2008)Based on observations the conditional snow frequency over land was formulated as
F (Ts) = a[
tanh(b(Ts minusc)
)minusd]
(1)
where Ts is the surface air temperature [C] and a = minus482292b = 07205c = 116625
and d = 10223 This may be interpreted as the probability or fraction of precipitationfalling as snow at a given temperature We calculated hourly snowfall as the productof F and the amount of precipitation Cut-offs for no rain and no snow were set at minus10and 10 C respectively as this was the range of the data used by Dai (2008)
All snowfall estimates were made for the sub-basins defined in the HydroSHEDS10
data set (Lehner et al 2008) The results were then aggregated for the Indus Gangesand Brahmaputra Basins
Within each major basin we also grouped the sub-basins into regions with simi-lar characteristics of snow and precipitation This was done with k-means clustering(MacQueen 1967) using the square Euclidean distance as the distance measure15
The seasonal cycles of precipitation snow and snow fraction were first clustered sep-arately with the MERRA reference data and data bias-corrected with CRU TS data asinput We then adjusted the clusters manually prioritizing similarity of the relative sea-sonal cycles of snow and snow fraction and checking that both data sets gave similarresults Five groups were defined for the Indus and four for each of the other basins20
This included a no-snow group in each basin
21 Reference present-day snowfall
The horizontal resolution of the MERRA reanalysis data in the Himalayas is about55 km latitude and 70 km longitude To account for smaller-scale temperature variationsin the rugged terrain we used the vertical temperature gradient in MERRA to adjust25
the ground temperature to the GLOBE topography (Hastings and Dunbar 1998) The450
TCD9 441ndash493 2015
Snowfall in theHimalayas an
uncertain future froma little-known past
E Viste and A Sorteberg
Title Page
Abstract Introduction
Conclusions References
Tables Figures
J I
J I
Back Close
Full Screen Esc
Printer-friendly Version
Interactive Discussion
Discussion
Paper
|D
iscussionP
aper|
Discussion
Paper
|D
iscussionP
aper|
elevation-adjusted ground temperature was calculated as
Tadj = T0 minusT2 minus T1
z2 minus z1(zmerra 0 minus zglobe) (2)
where T0 is the MERRA 2 m temperature T1 is the temperature at the lowest pressurelevel above the ground T2 the temperature at the next level and z2 and z1 the height ofthese levels zmerra0 and zglobe is the elevation of the MERRA and GLOBE topography5
respectively To reduce calculation time compared to using the original 1 km GLOBEresolution both MERRA and GLOBE data were interpolated to a 4 km grid Snowfallwas calculated for each grid-point and then aggregated for each sub-basin for eachmonth
Snowfall based on elevation-adjusted MERRA temperature and MERRA precipita-10
tion is used as a reference throughout this article This is because the elevation-adjusted temperature and the 4 km grid was used as the starting-point in all subse-quent calculations It does not mean that we consider this snowfall to be closer to thetruth than any of the other estimates
22 Bias-corrected present-day snowfall15
A second group of present-day snowfall estimates was made from MERRA precipi-tation and elevation-adjusted temperature bias-corrected with observationally baseddata sets APHRODITE daily temperature and precipitation for 1979ndash2007 CRU TSmonthly temperature and precipitation for 1979ndash2011 and TRMM 3B42 3 hourly pre-cipitation for 1998ndash2012 Bias-corrections were performed on daily or monthly scales20
depending on the input data and the result distributed over the hourly time-steps ofthe MERRA temperature and precipitation As a result the diurnal cycle in MERRA ismaintained in all estimates Snowfall was then calculated following the same procedureas for the MERRA reference snowfall (Sect 21) When referring to APHRODITE snowor CRU snow anywhere in this article this is the snowfall calculated using MERRA25
precipitation and temperature both bias-corrected with these data sets451
TCD9 441ndash493 2015
Snowfall in theHimalayas an
uncertain future froma little-known past
E Viste and A Sorteberg
Title Page
Abstract Introduction
Conclusions References
Tables Figures
J I
J I
Back Close
Full Screen Esc
Printer-friendly Version
Interactive Discussion
Discussion
Paper
|D
iscussionP
aper|
Discussion
Paper
|D
iscussionP
aper|
Temperature data are generally assumed to be normally distributed and as de-scribed in Teutschbein and Seibert (2012) and references therein the data can bebias-corrected through a Gaussian distribution mapping We thus bias-corrected theelevation-adjusted MERRA temperature with the observationally based APHRODITEV1204 daily temperature by mapping the distribution of the MERRA data to the Gaus-5
sian distribution of the observationsAs the CRU TS 320 includes monthly mean daily minimum and maximum temper-
atures the method described by (Wang and Zeng 2013) was used Bias-correcteddaily maximum temperatures were defined as
Td max = Tmerra d max minus(Tmerra mn max minus Tcru mn max
) (3)10
d denotes daily and mn monthly Daily minimum temperatures were then corrected byadjusting the diurnal range
Td min = Td max minus∆Tmerra d middot∆Tcru mn
∆Tmerra mn (4)
where ∆T represents the diurnal and monthly temperature rangeThe distribution mapping procedure described by Ines and Hansen (2006) was used15
to bias-correct MERRA precipitation with APHRODITE V1101R2 daily precipitation anddaily accumulated TRMM 3B42 3 hourly precipitation This is a two-step procedureinvolving frequency and intensity adjustments We defined precipitation days as dayswith at least 01 mm in the observations The frequency was first adjusted by settingthe number of precipitation days in MERRA equal to that of the observations This was20
done by removing the lowest daily values The intensity was then adjusted by fitting theremaining days to the gamma distribution of the observations
Bias-corrections with CRU TS 320 monthly precipitation were done with a simplecorrection factor to adjust the monthly MERRA total to that of CRU (eg Ines andHansen 2006)25
452
TCD9 441ndash493 2015
Snowfall in theHimalayas an
uncertain future froma little-known past
E Viste and A Sorteberg
Title Page
Abstract Introduction
Conclusions References
Tables Figures
J I
J I
Back Close
Full Screen Esc
Printer-friendly Version
Interactive Discussion
Discussion
Paper
|D
iscussionP
aper|
Discussion
Paper
|D
iscussionP
aper|
23 Projected snowfall
The MERRA reanalysis was also the basis for estimates of future snowfall Thechanges in temperature and precipitation from 1971ndash2000 to 2071ndash2100 were addedto the reanalysis data and snowfall calculated following the same procedure as for thepresent time Climate change input came from models that were part of the Coupled5
Model Inter-comparison Project 5 (CMIP5 Taylor et al 2011) for the RepresentativeConcentration Pathways (RCP) 26 and 85 (Moss et al 2010 van Vuuren et al 2011)The models used are listed in Table 3
Due to the different spatial resolution of the models changes were defined asmonthly mean changes on the sub-basin level For temperature the absolute change10
was used and for precipitation the fractional change Future projected snowfall wascalculated with reference to elevation-adjusted MERRA snowfall for each model Dueto large deviations in estimates of present-day snowfall (Sect 3) we also calculatedsnowfall for the CMIP5 multi-model mean changes with reference to the lowest presenttime estimate APHRODITE snowfall15
24 The rain-snow line
Not all temperature changes affect snowfall We defined the rain-snow line as the el-evation where the temperature suggests a shift from rain to snow Technically thisis a conditional rain-snow line as no precipitation was required For every hour allgrid cells that had a snow fractionprobability between 025 and 075 corresponding20
to a temperature between 09 and 13 C were identified The monthly rain-snow linewas then set as the mean elevation of these grid cells and time steps For present-dayconditions this was done for elevation-adjusted MERRA temperature and temperaturebias-corrected with APHRODITE Projected temperature changes in the CMIP5 RCP85 were then added to these temperatures and the procedure repeated25
453
TCD9 441ndash493 2015
Snowfall in theHimalayas an
uncertain future froma little-known past
E Viste and A Sorteberg
Title Page
Abstract Introduction
Conclusions References
Tables Figures
J I
J I
Back Close
Full Screen Esc
Printer-friendly Version
Interactive Discussion
Discussion
Paper
|D
iscussionP
aper|
Discussion
Paper
|D
iscussionP
aper|
3 Present-day snowfall
31 Seasonal cycles of precipitation and snowfall
Figure 2 gives an overview of the seasonal cycle of rain and snow in different parts ofthe HKH based on MERRA precipitation and MERRA reference snowfall (Sect 21)The upper Indus basin gets more snow than rain in other sub-basins of the Indus5
Ganges and Brahmaputra rainfall dominates This difference is caused by different pre-cipitation cycles Whereas the summer monsoon dominates in the Central Himalayaswinter depressions bring most of the precipitation in the upper Indus ndash at a time whenlow temperatures mean that precipitation falls as snow in larger areas than it wouldin summer Although snow fractions are lower in the upper Brahmaputra monsoon10
precipitation produces a substantial amount of summer snow at high elevationsIn the northwesternmost cluster in the Indus I4 March is the wettest month and also
the month with the highest total amount of snowfall Precipitation has a second peakduring July and August but the temperature is then too high to allow much snowfallFurther east in cluster I5 more terrain at higher elevations cause higher snow fractions15
during summer but winter and spring is still the dominant snow season The summerpeak in precipitation in this cluster is caused by the two eastern sub-basins There islittle summer precipitation in the west
In Brahmaputrarsquos cluster B4 and Gangesrsquo G4 maximum snowfall occurs during thesummer monsoon Higher temperatures during summer means that the snow fraction20
is lower than in winter but as there is much more summer precipitation the amount ofsnow is also higher Rare occurrences of precipitation during the cold winter togetherwith the combination of snowfall and snowmelt during summer makes the seasonalcycle of snow depth in the Central Himalayas unpronounced (Meacuteneacutegoz et al 2013)In the upper-level basins in Brahmaputrarsquos B3 the summer is also the main precipi-25
tation season but the peak is less sharp than further west As a result snowfall is ata maximum in MarchndashApril
454
TCD9 441ndash493 2015
Snowfall in theHimalayas an
uncertain future froma little-known past
E Viste and A Sorteberg
Title Page
Abstract Introduction
Conclusions References
Tables Figures
J I
J I
Back Close
Full Screen Esc
Printer-friendly Version
Interactive Discussion
Discussion
Paper
|D
iscussionP
aper|
Discussion
Paper
|D
iscussionP
aper|
32 Comparison of snowfall estimates
The MERRA reference snowfall described in Sect 31 differs greatly from snowfallbased on bias-corrected temperature and precipitation Large differences betweentemperature and data sets for the HKH cause corresponding deviations in snowfall ndashnot only between MERRA-based estimates and bias-corrected data but between esti-5
mates based on bias-corrections with different data sets This can be seen from Table 4which displays annual snowfall estimates for combinations of the bias-corrections de-scribed in Sect 22 aggregated to the major basins Data for the individual sub-basinsare included as Supplement
With the exception of snowfall based on MERRA precipitation and MERRA temper-10
ature bias-corrected with CRU TS in the Ganges basin all estimates based on bias-corrected data are lower than the MERRA reference snowfall The lowest estimates arethose based on bias-corrections with APHRODITE precipitation and temperature Thiscombination produced only 33 of the reference snowfall in the Indus Basin 22 inthe Ganges Basins and 17 in the Brahmaputra Basin While the difference is large in15
all sub-basins that have snow today it is especially large in the upper parts of the Indusand Brahmaputra Basins (Fig 3) In comparison bias-corrections with CRU TS tem-perature and precipitation produce 54 of the reference snowfall in the Indus 75 inthe Ganges and 42 in the Brahmaputra ndash factors of 2ndash4 compared to APHRODITEIt should be noted that as the time periods covered by the data sets are not equal20
the results are not strictly comparable but tests using different MERRA periods (notshown) indicate that there would be no major difference in the monthly means
The large difference between MERRA reference snowfall and snowfall based onbias-corrected data results from differences in both temperature and precipitation butdifferences in the precipitation pattern have the greatest effect Estimates where only25
the precipitation has been bias-corrected are lower than those where only the tempera-ture has been bias-corrected (Table 4) This is not solely an effect of more precipitationin MERRA than in the observation-based data although MERRA is wetter than all the
455
TCD9 441ndash493 2015
Snowfall in theHimalayas an
uncertain future froma little-known past
E Viste and A Sorteberg
Title Page
Abstract Introduction
Conclusions References
Tables Figures
J I
J I
Back Close
Full Screen Esc
Printer-friendly Version
Interactive Discussion
Discussion
Paper
|D
iscussionP
aper|
Discussion
Paper
|D
iscussionP
aper|
data sets in the Indus and for APHRODITE also in the Ganges and the Brahmapu-tra An inland and upward shift in the MERRA precipitation adds to the differencesAs shown in Fig 4 all the observation-based precipitation data sets are wetter thanMERRA in most of the lowlands and in the foothills of the HKH but drier in the higher-elevation regions further inland In MERRA the precipitation belt is shifted higher up5
in the Himalayas where temperatures are lower and more of the precipitation falls assnow
In addition HKH temperatures are lower in MERRA than in APHRODITE and inthe upper Indus also than in CRU TS (Fig 5) The lower temperatures in MERRAcause higher snow fractions further increasing the difference between the MERRA ref-10
erence snowfall and APHRODITE snowfall Oppositely CRU TS is colder than MERRAthroughout the Ganges leading to higher snowfall estimates when bias-correctingMERRA temperatures with CRU TS (Table 4)
We do not see any reason to consider any of the observation-based data sets northe reanalysis the ground truth The reanalysis has the benefit of being physically15
consistent though precipitation is a pure model product In the other data sets thenumber of observations vary greatly within the region
The lack of observations in the HKH has been pointed out in many studies Mostmeteorological stations are located in the valleys and do not necessarily representweather conditions in higher terrain As demonstrated by Palazzi et al (2013) station-20
based data sets like APHRODITE and CRU TS are merely mathematical interpolationsin major parts of the HKH and on the Tibetan Plateau Immerzeel (2008) showed thatthe number of observations going into version 21 of the CRU data set in the Himalayanregion varies greatly A drop in the mid-1990s suggests that caution should be takenwhen interpreting data at later times Maps (not shown) of station coverage in version25
320 used in this study show that this problem persistsThe fact that more of the precipitation falls as snow at higher elevations may in it-
self lead to an under-estimation of precipitation in the mountains In addition to thelack of observations in high terrain gauges tend to capture snow less easily than rain
456
TCD9 441ndash493 2015
Snowfall in theHimalayas an
uncertain future froma little-known past
E Viste and A Sorteberg
Title Page
Abstract Introduction
Conclusions References
Tables Figures
J I
J I
Back Close
Full Screen Esc
Printer-friendly Version
Interactive Discussion
Discussion
Paper
|D
iscussionP
aper|
Discussion
Paper
|D
iscussionP
aper|
leading to a possible under-registration of precipitation at the few high-elevation sta-tions that exist Comparing stations along a vertical profile in the Karakoram Winigeret al (2005) found that precipitation multiplied by a factor of 5ndash10 from 2500 masl to5000ndash6000 masl This maximum is much higher than reported in most other studiesand they attributed this to the valley-dominance of stations normally used5
Indications of too little precipitation at higher elevations were also given by Tahiret al (2011b) as APHRODITE precipitation was too low to account for the observeddischarge in the Hunza river in the Karakoram Anders et al (2006) reported thatTRMM radar data underestimated precipitation at higher elevations in the Himalayasdue to the low ability of the radar to detect very low precipitation and lowndashmoderated10
snowfall rates On the other hand Krakauer et al (2013) found that both TRMM andAPHRODITE had too much precipitation compared to observations from the few exist-ing stations at elevations above 3000 masl in Nepal
Satellite data are a promising future alternative for measuring snowfall but presentlyof limited use MODIS and LANDSAT satellite data have been used in several studies15
of snow and ice in the Himalayas (Tahir et al 2011a b Bookhagen and Burbank2010 Hewitt 2005 Krishna 2005 Negi et al 2009 Jain et al 2009 Butt 2012 Gaoet al 2012 Kulkarni et al 2010 Immerzeel et al 2009) but these data contain onlysnow cover area with no measure of the snow thickness or snow water equivalentsThe NASA AMSR-E SWE data set distributed by the National Snow and Ice Data20
Center could have been used but correlations between AMSR-E SWE and groundobservations have been shown to be poor (Tedesco and Narvekar 2010 Byun andChoi 2014 Kumar et al 2006) As AMSR-E SWE has been found underestimatesnow depth we concluded that incorporating these data into our ensemble would notlikely constrain the results nor add new information25
Defining snowfall based on MERRA precipitation and elevation-adjusted tempera-ture as a reference was done mainly to have a single reference when comparing thedata sets against each other Also we believe the elevation-adjustment of temperaturerepresents an enhancement compared to the original MERRA reanalysis MERRA was
457
TCD9 441ndash493 2015
Snowfall in theHimalayas an
uncertain future froma little-known past
E Viste and A Sorteberg
Title Page
Abstract Introduction
Conclusions References
Tables Figures
J I
J I
Back Close
Full Screen Esc
Printer-friendly Version
Interactive Discussion
Discussion
Paper
|D
iscussionP
aper|
Discussion
Paper
|D
iscussionP
aper|
chosen mainly because it has an hourly resolution allowing diurnal temperature vari-ations to affect snowfall But even though this estimate is much higher than all thebias-corrected estimates it cannot be discarded It has been argued that reanalysisdata and regional climate models may in some cases be as good as or better thanobservations in the HKH (Wiltshire 2014 Meacuteneacutegoz et al 2013 Akhtar et al 2008)5
Akhtar et al (2008) got better results when modeling river discharge in three upperIndus catchments with an RCM-based hydrological model than with one based on thefew observations available within the region They concluded that it was preferable touse RCM data directly as input to hydrological models in this region
As shown in the small inset maps in Fig 4 MERRA precipitation is higher than ob-10
served precipitation throughout the HKH and the same has previously been shownfor ERA-Interim reanalysis precipitation (Palazzi et al 2013) In MERRA the precipi-tation belt is shifted upward in the terrain compared to in the observation-based datasets Whether this shift is realistic cannot be determined as long as observations fromupper-level terrain are either missing or likely too low15
4 Projected future snowfall
Whether higher temperatures lead to less snowfall depends on whether the tempera-ture changes from below to above freezing and whether this change occurs at a timewhen there is precipitation The maps in Fig 6 illustrate where a temperature increaseis most likely to affect snowfall and snowmelt In the red zones where the monthly20
temperature today is between ndash5 and 0 C the projected temperature increase of 2ndash7 C (Chaturvedi et al 2012 Collins et al 2013 Wiltshire 2014) may be consideredcritical Such a change would change snowfall to rain and also cause a change fromfreezing to melting of snow and ice The pink zones with monthly mean temperaturesof 0ndash5 C would similarly change from a climate where precipitation may often fall as25
snow to one that is snow-free
458
TCD9 441ndash493 2015
Snowfall in theHimalayas an
uncertain future froma little-known past
E Viste and A Sorteberg
Title Page
Abstract Introduction
Conclusions References
Tables Figures
J I
J I
Back Close
Full Screen Esc
Printer-friendly Version
Interactive Discussion
Discussion
Paper
|D
iscussionP
aper|
Discussion
Paper
|D
iscussionP
aper|
In January (Fig 6a) only the lower parts of the Himalayas is affected as most ofthe region would still have temperatures well below the freezing point The small insetmap shows precipitation in the red zone a narrow band along the range Oppositelyin July (Fig 6c) the temperature is already above 5 C in most of the region though athigher elevations along the Himalayan range and in the Karakoram the change can be5
critical The most widespread changes are seen in spring and fall In April and October(Fig 6b d) large areas in the HKH and on the Tibetan Plateau risk a change frombelow to above freezing
Incorporating CMIP5 precipitation changes we find that the projected temperatureincrease has a larger impact so that snowfall will be reduced in the Indus Ganges and10
Brahmaputra Basins by 2071ndash2100 compared to today Details for the major basinsare presented in Sect 41 How much increased temperatures reduce snowfall withina region depends on the location of the rainsnow line today compared to the terraindistribution Results for selected upper-level sub-basins in the Indus and Brahmaputrawill be discussed in that context in Sect 4215
The large deviations in the estimates of present-day snowfall (Sect 3) means thatthere will be correspondingly large deviations in projected values To account for thismost results are shown with reference to the highest and lowest present-day estimatesMERRA reference snowfall and to APHRODITE-based snowfall Future estimates rela-tive to CRU and TRMM are assumed to lie between those of MERRA and APHRODITE20
41 Basin-scale projections
In the Indus Ganges and Brahmaputra Basins the CMIP5 models project a meanincrease in both temperature (Fig 7) and precipitation (Fig 8) in the region by 2071ndash2100 for both RCPs 26 and 85 The RCP 85 multi-model mean change in temper-ature varies through the year with a 49ndash62 C increase in the Indus 36ndash52 C in25
the Ganges and 42ndash60 C in the Brahmaputra The increase is smallest during thesummer months The dip in the summer is also seen though less pronounced with
459
TCD9 441ndash493 2015
Snowfall in theHimalayas an
uncertain future froma little-known past
E Viste and A Sorteberg
Title Page
Abstract Introduction
Conclusions References
Tables Figures
J I
J I
Back Close
Full Screen Esc
Printer-friendly Version
Interactive Discussion
Discussion
Paper
|D
iscussionP
aper|
Discussion
Paper
|D
iscussionP
aper|
the RCP 26 The summer is also the season with the largest absolute increase inprecipitation
Compared to present-day estimates the CMIP5 models project less snowfall in theIndus Ganges and Brahmaputra Basins in the last decades of this century This canbe seen from Fig 9 The projected multi-model mean is lower than today in all calen-5
dar months for both RCPs 26 and 85 With the RCP 26 some models suggest anincrease in some months mainly in winter and spring This is also the case for one ortwo models with the RCP 85 whereas other models indicate that the snowfall in thesame months will be only half of todayrsquos values
In the Ganges Basin (Fig 9b) the seasonal distribution of snowfall today is mainly10
flat with equal amounts of snowfall from January through September Reductions insummer snowfall with the RCP 85 would change the seasonal cycle into a winter-dominated one To a lesser degree this is also the case for RCP 26 As summerprecipitation is projected to increase in all of the Ganges (not shown but consistentwith Menon et al 2013) this indicates that large areas are at elevations where a small15
increase in the summer temperature may cause a shift from snow to rain This is seenas the red band along the upper Ganges in Fig 6c Reductions in summer snowfall arealso large in the Brahmaputra (Fig 9b) whereas in the Indus the largest total changesoccur in MarchndashMay (Fig 9a)
As the MERRA reference snowfall for today is much larger than APHRODITE snow-20
fall (Sect 32) projected absolute changes for 2071ndash2100 are also much largerin MERRA The relative changes are more similar though larger with reference toAPHRODITE Annual snowfall changes for each major basin are presented in Table 5for changes in temperature precipitation or both and with reference to MERRA andAphrodite present-day snowfall Changes at the sub-basin level are shown in Fig 1025
In the Ganges Basin both MERRA- and APHRODITE-based multi-model mean snow-fall is reduced by about 20 with the RCP 26 and 50 with the RCP 85 In theIndus and Brahmaputra Basins the differences between MERRA- and APHRODITE-based changes are larger but not as large as for the absolute values With reference
460
TCD9 441ndash493 2015
Snowfall in theHimalayas an
uncertain future froma little-known past
E Viste and A Sorteberg
Title Page
Abstract Introduction
Conclusions References
Tables Figures
J I
J I
Back Close
Full Screen Esc
Printer-friendly Version
Interactive Discussion
Discussion
Paper
|D
iscussionP
aper|
Discussion
Paper
|D
iscussionP
aper|
to MERRA and APHRODITE respectively the reduction in snowfall in the Indus Basinis 30 and 50 with the RCP 85 The corresponding reductions in the BrahmaputraBasin are 50 and 70
The projected changes in temperature have greater effect on snowfall than thechanges in precipitation When taking into account only changes in precipitation all5
snowfall estimates are positive (∆P Table 5) This indicates that the mean annual to-tal reduction for each major basin is governed by the temperature change In someCMIP5 models (values in brackets in Table 5) the effect of precipitation changes (∆P )on snowfall are of the same magnitude as the effect of temperature changes (∆T ) butfor the CMIP5 multi-model mean temperature changes cause snowfall changes 4ndash1010
times as large as those due to changes in precipitation This is with reference to thepresent-day MERRA reference snowfall and for both RCPs 26 and 85 With referenceto APHRODITE snowfall the effect of temperature changes compared to precipitationchanges is even greater
42 Regional projections15
If temperatures are far below freezing everywhere warming may have little effect onsnowfall The same applies if only the highest peaks receive snow today The largestreduction in snowfall in a basin occurs if todayrsquos rainsnow line is at an elevation justbelow the dominant elevation of the basin Then large regions will see a shift fromsnow to rain20
In the Indus Basin the largest relative snowfall reduction by 2071ndash2100 is seen inthe southwestern sub-basins where snowfall is limited today (Fig 10) The largest totalreduction is seen in the snow-rich sub-basins of KabulSwatAlingar in the west and inthe east and a smaller reduction in the inner-most basins of GilgitHunza Indus 1 andNubraShyok Together with the upper regions of the Brahmaputra these sub-basins25
clusters I4 I5 B3 and B4 in Fig 2 were selected for a closer analysis In addition tohaving the most snow these clusters are the most homogeneous when considering
461
TCD9 441ndash493 2015
Snowfall in theHimalayas an
uncertain future froma little-known past
E Viste and A Sorteberg
Title Page
Abstract Introduction
Conclusions References
Tables Figures
J I
J I
Back Close
Full Screen Esc
Printer-friendly Version
Interactive Discussion
Discussion
Paper
|D
iscussionP
aper|
Discussion
Paper
|D
iscussionP
aper|
the seasonal cycle of snowfall and snow fraction The values presented in this sectionare all from the RCP 85 for changes from today to 2071ndash2100
421 Upper Indus western part
Cluster 4 consists of the sub-basins Astor KabulSwatAlingar and Krishen GangaAs seen from the elevation profile at the top of Fig 11a the elevation span is large5
and there is an almost equal proportion of the terrain at all levels from heights close tosea level to about 5000 masl The most important change for this cluster is a largereduction in the total amount of snowfall in winter and spring
With a few exceptions all CMIP5 models project less snowfall in all months of theyear (Fig 11a i ii) The largest total multi-model mean reduction in snowfall (ii) oc-10
curs in FebruaryndashApril without notable change in the multi-model mean precipitation(iii) Thus the reduction is caused by increasing temperatures represented by therainsnow line in Fig 11a iv As seen from the change in the rainsnow line elevationthe projected temperature increase in these months would imply that large areas thatreceive snow today would receive only rain About 40 of the ground in this cluster lies15
below 2000 masl and receives precipitation as rain throughout the year In summerprecipitation (iii) is at a minimum and the rainsnow line (iv) is already so high that onlya small fraction of the area receives snowfall today Thus although the relative changein snowfall (i) is largest in summer the change in the amount of snowfall (ii) is small Itshould also be noted that the change in the rainsnow line elevation (iv) in summer is20
much smaller 400ndash600 m compared to 600ndash900 m in DecemberndashApril
422 Upper Indus eastern part
Further east the largest changes are projected for the spring season Cluster 5 in theIndus Basin consists of the sub-basins GilgitHunza Indus 1 NubraShyok and Zan-skar As shown in Fig 11b this is high-elevation terrain with 80 of the ground lying25
above 4000 masl As a result almost all winter precipitation is snow (Fig 11b iii)
462
TCD9 441ndash493 2015
Snowfall in theHimalayas an
uncertain future froma little-known past
E Viste and A Sorteberg
Title Page
Abstract Introduction
Conclusions References
Tables Figures
J I
J I
Back Close
Full Screen Esc
Printer-friendly Version
Interactive Discussion
Discussion
Paper
|D
iscussionP
aper|
Discussion
Paper
|D
iscussionP
aper|
For the multi-model mean no big changes are projected in JanuaryndashFebruary This ispartly because of little change in precipitation (iii) and because the rainsnow line (iv)in these months is sufficiently low in the terrain today With the 500ndash600 m shift pro-jected with the RCP 85 80ndash90 of the area will still have temperatures low enoughfor snow The largest changes occur in MarchndashOctober when higher temperatures5
push the rainsnow line above large areas that receive snow today Increasing summerprecipitation (iii) causes the snowfall reduction in summer to be less than it would other-wise be The effect of higher temperatures is smaller on the APHRODITE snowfall thanon the MERRA reference snowfall (ii) as APHRODITE has very little summer snow-fall today The difference arises both from less precipitation (iii) in APHRODITE than10
MERRA today and from a higher rainsnow line (iv) in APHRODITE Note that as thechange in precipitation was defined as a fraction of the present-day value (Sect 23)the relative changes in APHRODITE and MERRA precipitation are equal
423 Upper Brahmaputra western part
In the westernmost part of the upper Brahmaputra Basin large snowfall changes are15
projected for the summer As cluster 5 in the Indus Basin Brahmaputrarsquos cluster 4 islimited to higher grounds Less than 6 lies outside of the 4000ndash6000 masl rangeThe cluster consists of Maquan He Yarlung Zangbo Dogxung ZangboMaiqu ZangboShang ChuYarlung ZangboNyang Lhasa HeRazheng Zangbo and Yamzho YumcoThe summer monsoon fully dominates the seasonal cycle of precipitation in this region20
(Fig 12a iii) resulting in a unimodal snow cycle with a maximum in JulyndashSeptember InAPHRODITE the seasonal cycle of snowfall is similar but less pronounced than in theMERRA reference The summer also sees the greatest reduction in CMIP5 projectedsnowfall both in absolute (ii) and relative (i) terms despite increasing summer precip-itation in all models (iii) The reason can be seen from the change in the rainsnow25
line elevation (iv) In the warmest months July and August elevation changes of 400ndash500 m would shift the rainsnow line from a level where at least 5ndash10 of the groundlies above the line to a level where only 1 of the area would receive precipitation as
463
TCD9 441ndash493 2015
Snowfall in theHimalayas an
uncertain future froma little-known past
E Viste and A Sorteberg
Title Page
Abstract Introduction
Conclusions References
Tables Figures
J I
J I
Back Close
Full Screen Esc
Printer-friendly Version
Interactive Discussion
Discussion
Paper
|D
iscussionP
aper|
Discussion
Paper
|D
iscussionP
aper|
snow In comparison with reference to MERRA the 300ndash400 m shift seen in JanuaryndashFebruary would cause only a small absolute change in snowfall (ii) because there islittle precipitation in these months (ii) and a small relative change (i) because therainsnow line would still be low in the terrain (iv) With reference to APHRODITE therelative snowfall change in winter would be larger than with reference to MERRA as5
temperatures today are higher resulting in a higher rainsnow line (iv)
424 Upper Brahmaputra eastern part
Like further west the Indian summer monsoon dominates the precipitation cycle in theeastern part of upper Brahmaputra (Fig 12b iii) but the seasonal cycle of snowfallpeaks in spring and fall (iii) This is also the time of the largest projected changes10
Cluster 3 in the Brahmaputra consists of the sub-basins Yarlung Zangbo2 NyangQu Yarlung Zangbo3 Yirsquoong ZangboParl Siyom Zaya QuLuhitDi About 70 of theground lies between 3000 and 6000 masl but there is also land almost at sea levelmainly in the Zaya QuLuhitDingba Qu sub-basin During summer most of the terrainlies below the rainsnow line (iv) In spring temperatures are lower than in summer15
and pre- monsoon precipitation is stronger in this part of the Himalayas than furtherwest in cluster 3 (Fig 12a iii vs Fig 12b iii) As a result MarchndashApril gets the mostsnow
Reductions in snowfall are projected for all months (ii) comparable in magnitude butlargest in the snow-rich spring and late summer The CMIP5 multi-model mean shows20
increasing or no change in precipitation in all months (Fig 12b iii) so the reductionin snowfall is due solely to higher temperatures The largest absolute reductions inApril and May occur with a 700ndash800 m shift in the rainsnow line elevation leaving30 more of the terrain in the rain The largest relative reduction in future snowfall areprojected for July and August (Fig 12b i) when the rainsnow line shifts so high that25
only the highest peaks can get precipitation as snow (iv) This would be despite thelowest changes in the rainsnow line only about 300 m in APHRODITE
464
TCD9 441ndash493 2015
Snowfall in theHimalayas an
uncertain future froma little-known past
E Viste and A Sorteberg
Title Page
Abstract Introduction
Conclusions References
Tables Figures
J I
J I
Back Close
Full Screen Esc
Printer-friendly Version
Interactive Discussion
Discussion
Paper
|D
iscussionP
aper|
Discussion
Paper
|D
iscussionP
aper|
43 Potential effects of reduced snowfall on water availability
With a few exceptions the CMIP5 multi-model mean precipitation change over the com-ing century is positive in all months in the upper Indus and Brahmaputra (Sect 42)Thus the projected reduction in snowfall is due solely to higher temperatures How-ever there is a large spread in precipitation projections among the models If tempera-5
tures increase as much as projected with the RCP 85 could any realistic precipitationchange in the HKH compensate and maintain present-day snowfall Results indicatethat this may happen in parts of the upper Indus but is out of the reach in the upperBrahmaputra As for water availability reduced snowfall may still cause more severeproblems in the Indus than in the Brahmaputra10
In cold regions where temperatures remain below freezing more winter precipita-tion may increase both the snow cover area the length of the snow season and theSWE (Collins et al 2013 Brutel-Vuilmet et al 2013 Raumlisaumlnen 2008 Gao et al 2012Wiltshire 2014) Raumlisaumlnen (2008) showed this to be the case in eastern Siberia andthe northernmost part of North America At the southern edge of the seasonal snow15
cover relevant for this study precipitation did not compensate and there was a reduc-tion in SWEWiltshire (2014) concluded that there would be small changes in snowfallin very cold and very warm regions of the HKH Snowfall in Nepal Bhutan and Hi-machal Pradesh where winters are warmer than in most parts of the range was mostvulnerable to higher temperatures The data presented in Sect 42 generally support20
the previous studiesOne of the reasons that precipitation does not compensate is that the highest pro-
jected precipitation increase in the HKH is seen in the summer when the temperaturetoday is so high that only the highest terrain is in the snow zone Shifting the rainsnowline upward even by only a few hundred meters reduces the area that receives snow25
greatly requiring very large increases in precipitation to compensate The summer isthe season with the largest relative reduction in snowfall in all the clusters described inSect 42 Except in the western upper Indus (cluster I4 Sect 421) which has very
465
TCD9 441ndash493 2015
Snowfall in theHimalayas an
uncertain future froma little-known past
E Viste and A Sorteberg
Title Page
Abstract Introduction
Conclusions References
Tables Figures
J I
J I
Back Close
Full Screen Esc
Printer-friendly Version
Interactive Discussion
Discussion
Paper
|D
iscussionP
aper|
Discussion
Paper
|D
iscussionP
aper|
little summer snowfall today the reduction in summer snowfall is notable in all clustersin the MERRA data in the Brahmaputra clusters also in APHRODITE
The largest change in snowfall is seen in the western part of the Brahmaputra (clus-ter B4 Sect 423) where a 400ndash500 m upward shift in the rainsnow line during sum-mer reduces the area with temperatures low enough for snowfall by a factor of 5ndash105
(Fig 12a iv values not shown) As a result the summer peak in the seasonal cycleof snowfall is replaced by a dip (Fig 12a ii) With an even distribution of precipitationwith elevation the area that still receives snow would have to receive 5ndash10 times asmuch precipitation to compensate for the lost snowfall Assuming more realisticallythat precipitation decreases above a certain height would require an even higher in-10
crease in precipitation In the model with the highest increase a doubling of the Julyprecipitation by the end of the century SWE is less than 25 of todayrsquos value in thatmonth (Fig 12a iii)
With a winter-dominated precipitation cycle the relative change in snowfall is smallerin the upper Indus than in the upper Brahmaputra Downscaling a high-emission sce-15
nario (A1B) in two CMIP3 models with a regional model Wiltshire (2014) found that bythe 2080s precipitation increased more than enough to compensate for higher temper-atures in the Karakoram Hindu Kush and Jammu and Kashmir in one of the modelsthe HadCM3 In the other model ECHAM5 precipitation increased less and snow-fall increased only in the higher parts of the Karakoram In our ensemble of CMIP520
models multi-model mean precipitation in the upper Indus clusters increases mainlyin the summer season when the inter-model spread is also the largest (Fig 11a iiiand 11b iii) Among the models 4ndash5 project increased winter precipitation in the upperIndus and in the uppermost cluster I5 this is associated with an increase in wintersnowfall (Fig 11b ii)25
Although it is the part of the HKH where snowfall is least reduced by increasingtemperatures (Fig 10b) the Karakoram and inner parts of the upper Indus may still bethe region where the changes have the largest impact on river run-off Compared tothe monsoon-dominated regions further east there is little summer precipitation and
466
TCD9 441ndash493 2015
Snowfall in theHimalayas an
uncertain future froma little-known past
E Viste and A Sorteberg
Title Page
Abstract Introduction
Conclusions References
Tables Figures
J I
J I
Back Close
Full Screen Esc
Printer-friendly Version
Interactive Discussion
Discussion
Paper
|D
iscussionP
aper|
Discussion
Paper
|D
iscussionP
aper|
much of the water in the rivers during summer is meltwater (Bookhagen and Burbank2010 Immerzeel et al 2010) As melting of snow and ice has not been analyzed inthis study we cannot quantify the effect of reduced snowmelt om river run-off but it isobvious that eventually reduced snowfall will lead to reduced melting In western partsof the HKH this may lead to changes in the seasonal cycle of the river flow5
As pointed out by Wiltshire (2014) increasing precipitation in the eastern HKH im-plies that water resources are likely to increase with climate change As snowfall andsnowmelt are both at maximum during summer (Rees and Collins 2006) meltwaterdoes not have the same importance for river flow in dry parts of the year as in the In-dus Reduced snowfall may reduce glaciers but ndash not considering potential changes in10
the amount of evaporation ndash there is no indication that there will be less water comingfrom the upper Brahmaputra
5 Concluding summary
In this study we have presented a suite of estimates of present-day snowfall in theIndus Ganges and Brahmaputra Basins and the changes in snowfall that would follow15
from CMIP5 projected changes in temperature and precipitation from 1971ndash2000 to2071ndash2100 The results show that if the temperature increases as much as in the RCP85 there will be much less snowfall despite increasing precipitation in most of theregion Limiting anthropogenic forcing to the RCP 26 level would still cause reductionsthough smaller20
Estimates of present-day snowfall based on a combination of temperature and pre-cipitation from reanalysis data and observations vary by factors of 2ndash4 The MERRAreanalysis gives higher estimates than TRMM 3B42 CRU TS and APHRODITE butthe spread is also large between the estimates based on the different observationallybased data sets This demonstrates the difficulties in assessing vulnerability to climate25
change in the region With limited knowledge of the current state future conditions arebound to be uncertain
467
TCD9 441ndash493 2015
Snowfall in theHimalayas an
uncertain future froma little-known past
E Viste and A Sorteberg
Title Page
Abstract Introduction
Conclusions References
Tables Figures
J I
J I
Back Close
Full Screen Esc
Printer-friendly Version
Interactive Discussion
Discussion
Paper
|D
iscussionP
aper|
Discussion
Paper
|D
iscussionP
aper|
Future changes in temperature and precipitation projected by climate models can stillprovide an indication of the relative change in snowfall With the RCP 85 the climatemodels project mean reductions in annual snowfall by 30ndash50 in the Indus Basin 50ndash60 in the Ganges Basin and 50ndash70 in the Brahmaputra Basin by 2071ndash2100 Withthe RCP 26 the corresponding reductions would be 10ndash20 in the Indus about 20 5
in the Ganges and 20ndash30 in the Brahmaputra The reductions are due to increasingtemperatures as the mean of the models show constant or increasing precipitationthroughout the year in most of the region
How much increasing temperatures reduce snowfall in a region depends on howmuch of the terrain that is below and above the freezing point today and on whether10
the terrain profile is such that the temperature increase transforms large areas fromsnow to rain zones With the RCP 85 the mean elevation where rain changes to snowndash the rainsnow line ndash creeps upward by 400ndash900 m in most of the region by 700ndash900 m
The largest relative change in snowfall is seen in the upper westernmost sub-basins15
of the Brahmaputra despite increasing precipitation and the lowest rainsnow line el-evation change (400ndash500 m) This is because a major part of this region is near thefreezing point today With the RCP 85 most of this region will have temperaturesabove freezing especially in the summer which is the wettest part of the year Theprojected reduction in annual snowfall is 65ndash75 20
In the upper Indus the effect of a warmer climate on snowfall is less extreme asmost of the terrain is high enough to have temperatures sufficiently far below freezingtoday Winter and spring brings most of the precipitation and the projected 600ndash800 mchange in the rainsnow line elevation during these seasons would leave most of theterrain below the freezing point Still a 20ndash40 reduction in annual snowfall is pro-25
jected with the RCP 85The range of our estimates of present-day snowfall illustrates how little that is known
about conditions that influence the availability of drinking water in some of the mostdensely populated parts of the world There is both a scientific and a societal need
468
TCD9 441ndash493 2015
Snowfall in theHimalayas an
uncertain future froma little-known past
E Viste and A Sorteberg
Title Page
Abstract Introduction
Conclusions References
Tables Figures
J I
J I
Back Close
Full Screen Esc
Printer-friendly Version
Interactive Discussion
Discussion
Paper
|D
iscussionP
aper|
Discussion
Paper
|D
iscussionP
aper|
for more information about precipitation in the HKH As a full-scale long-time observa-tional program covering all parts of the Himalayan range is not a likely possibility theonly hope for improved future knowledge of Himalayan snowfall lies in the improvementof satellite data and regional climate models
The Supplement related to this article is available online at5
doi105194tcd-9-441-2015-supplement
Acknowledgements This work has been carried out with support from the University of Bergenthe NORINDIA and SNOWHIM projects funded by The Research Council of Norway and theCentre for Climate Dynamics at the Bjerknes Centre for Climate Research We acknowledgethe World Climate Research Programmersquos Working Group on Coupled Modelling which is re-10
sponsible for CMIP and we thank the climate modeling groups listed in Table 3 of this paper forproducing and making available their model output For CMIP the US Department of EnergyrsquosProgram for Climate Model Diagnosis and Intercomparison provides coordinating support andled development of software infrastructure in partnership with the Global Organization for EarthSystem Science Portals15
References
Akhtar M Ahmad N and Booij M J The impact of climate change on the water resourcesof Hindukush-Karakorum-Himalaya region under different glacier coverage scenarios J Hy-drol 355 148ndash163 2008
Anders A M Roe G H Hallet B Montgomery D R Finnegan N J and Putkonen J20
Spatial patterns of precipitation and topography in the Himalaya in Tectonics Climate andLandscape Evolution Geological Society of America Special Paper edited by Willett S DHovius N Brandon M T and Fisher D Geological Society of America Boulder CO USA39ndash53 2006
469
TCD9 441ndash493 2015
Snowfall in theHimalayas an
uncertain future froma little-known past
E Viste and A Sorteberg
Title Page
Abstract Introduction
Conclusions References
Tables Figures
J I
J I
Back Close
Full Screen Esc
Printer-friendly Version
Interactive Discussion
Discussion
Paper
|D
iscussionP
aper|
Discussion
Paper
|D
iscussionP
aper|
Archer DR and Fowler HJ Spatial and temporal variations in precipitation in the UpperIndus Basin global teleconnections and hydrological implications Hydrol Earth Syst Sci8 47ndash61 doi105194hess-8-47-2004 2004
Bhutiyani M R Kale V S and Pawar N J Long-term trends in maximum minimum andmean annual air temperatures across the Northwestern Himalaya during the twentieth cen-5
tury Climatic Change 85 159ndash177 doi101007s10584-006-9196-1 2007Bhutiyani M R Kale V S and Pawar N J Climate change and the precipitation variations in
the northwestern Himalaya 1866ndash2006 Int J Climatol 30 535ndash548 doi101002joc19202010
Bookhagen B and Burbank D W Topography relief and TRMM-derived rainfall variations10
along the Himalaya Geophys Res Lett 33 L08405 doi1010292006GL026037 2006Bookhagen B and Burbank D W Toward a complete Himalayan hydrological budget spa-
tiotemporal distribution of snowmelt and rainfall and their impact on river discharge J Geo-phys Res 115 F03019 doi1010292009jf001426 2010
Franco B Fettweis X and Erpicum M Future projections of the Greenland ice sheet energy15
balance driving the surface melt The Cryosphere 7 1ndash18 doi105194tc-7-1-2013 2013Butt M J Characteristics of snow cover in the Hindukush Karakoram and Himalaya region
using Landsat satellite data Hydrol Process 10 3689ndash3698 doi101002hyp8375 2012Byun K and Choi M Uncertainty of snow water equivalent retrieved from AMSR-E brightness
temperature in northeast Asia Hydrol Process 28 12 doi101002hyp9846 201420
Chaturvedi R K Joshi J Jayaraman M Bala G and Ravindranath N H Multi-modelclimate change projections for India under representative concentration pathways Curr SciIndia 103 791ndash802 2012
Christensen J H Krishna Kumar K Aldrian E An S-I Cavalcanti I F A Castro Md Dong W Goswami P Hall A Kanyanga J K Kitoh A Kossin J Lau N-C Ren-25
wick J Stephenson D B Xie S-P and Zhou T Climate phenomena and their relevancefor future regional climate change in Climate Change 2013 The Physical Science BasisContribution of Working Group I to the Fifth Assessment Report of the Intergovernmen-tal Panel on Climate Change edited by Stocker T F Qin D Plattner G-K Tignor MAllen S K Boschung J Nauels A Xia Y Bex V and Midgley P M Cambridge Univer-30
sity Press Cambridge UK and New York NY USA 92 2013Collins M Knutti R Arblaster J Dufresne J-L Fichefet T Friedlingstein P Gao X
Gutowski W J Johns T Krinner G Shongwe M Tebaldi C Weaver A J and
470
TCD9 441ndash493 2015
Snowfall in theHimalayas an
uncertain future froma little-known past
E Viste and A Sorteberg
Title Page
Abstract Introduction
Conclusions References
Tables Figures
J I
J I
Back Close
Full Screen Esc
Printer-friendly Version
Interactive Discussion
Discussion
Paper
|D
iscussionP
aper|
Discussion
Paper
|D
iscussionP
aper|
Wehner M Long-term climate change projections commitments and irreversibility in Cli-mate Change 2013 The Physical Science Basis Contribution of Working Group I to theFifth Assessment Report of the Intergovernmental Panel on Climate Change edited byStocker T F Qin D Plattner G-K Tignor M Allen S K Boschung J Nauels AXia Y Bex V and Midgley P M Cambridge University Press Cambridge UK and New5
York NY USA 108 2013Cook E R Palmer J G Ahmed M Woodhouse C A Fenwick P Zafar M U Wahab M
and Khan N Five centuries of Upper Indus River flow from tree rings J Hydrol 486 365ndash375 doi101016jjhydrol201302004 2013
Dai A Temperature and pressure dependence of the rain-snow phase transition over land and10
ocean Geophys Res Lett 35 L12802 doi1010292008gl033295 2008Fowler H J and Archer D R Conflicting signals of climatic change in the Upper Indus Basin
J Climate 19 4276ndash4293 doi101175jcli38601 2006Gao J Williams M W Fu X Wang G and Gong T Spatiotemporal distribution of snow
in eastern Tibet and the response to climate change Remote Sens Environ 121 1ndash915
doi101016jrse201201006 2012Gardelle J Berthier E and Arnaud Y Slight mass gain of Karakoram glaciers in the
early twenty-first century ndash Supplement Nature Geosci 5 322ndash325 doi101038ngeo14502012
Guhathakurta P and Rajeevan M Trends in the rainfall pattern over India Int J Climatol20
28 1453ndash1469 doi101002joc1640 2008Harris I Jones P D Osborn T J and Lister D H Updated high-resolution grids of
monthly climatic observations ndash the CRU TS310 Dataset Int J Climatol 34 623ndash642doi101002joc3711 2014
Hartmann H and Andresky L Flooding in the Indus River basin ndash a spa-25
tiotemporal analysis of precipitation records Global Planet Change 107 25ndash35doi101016jgloplacha201304002 2013
Hastings D and Dunbar P Development amp Assessment of the Global Land One-km BaseElevation Digital Elevation Model (GLOBE) ISPRS Commission IV Symposium on GIS ndashBetween Visions and Applications Stuttgart Germany 7ndash10 September 199830
Hewitt K The Karakoram anomaly Glacier expansion and the ldquoelevation ef-fectrdquo Karakoram Himalaya Mt Res Dev 25 332ndash340 doi1016590276-4741(2005)025[0332TKAGEA]20CO2 2005
471
TCD9 441ndash493 2015
Snowfall in theHimalayas an
uncertain future froma little-known past
E Viste and A Sorteberg
Title Page
Abstract Introduction
Conclusions References
Tables Figures
J I
J I
Back Close
Full Screen Esc
Printer-friendly Version
Interactive Discussion
Discussion
Paper
|D
iscussionP
aper|
Discussion
Paper
|D
iscussionP
aper|
Huffman G J Adler R F Bolvin D T Gu G Nelkin E J Bowman K P Hong YStocker E F and Wolff D B The TRMM Multisatellite Precipitation Analysis (TMPA) quasi-global multiyear combined-sensor precipitation estimates at fine scales J Hydrometeorol8 38ndash55 2007
Immerzeel W Historical trends and future predictions of climate variability in the Brahmaputra5
basin Int J Climatol 28 243ndash254 doi101002joc1528 2008Immerzeel W W Droogers P de Jong S M and Bierkens M F P Large-scale monitoring
of snow cover and runoff simulation in Himalayan river basins using remote sensing RemoteSens Environ 113 40ndash49 doi101016jrse200808010 2009
Immerzeel W W van Beek L P H and Bierkens M F P Climate change will affect the10
asian water towers Science 328 1382ndash1385 doi101126science1183188 2010Ines A V M and Hansen J W Bias correction of daily GCM rainfall for crop simulation
studies Agr Forest Meteorol 138 44ndash53 doi101016jagrformet200603009 2006Jain S K Goswami A and Saraf A K Role of elevation and aspect in snow distribution
in western Himalaya Water Resour Manag 23 71ndash83 doi101007s11269-008-9265-515
2009Krakauer N Pradhanang S Lakhankar T and Jha A Evaluating satellite products for
precipitation estimation in mountain regions a case study for Nepal Remote Sensing 54107ndash4123 2013
Krishna A P Snow and glacier cover assessment in the high mountains of Sikkim Himalaya20
Hydrol Process 19 2375ndash2383 doi101002hyp5890 2005Kulkarni A V Rathore B P Singh S K and Ajai Distribution of seasonal snow cover in cen-
tral and western Himalaya Ann Glaciol 51 123ndash128 doi1031891727564107913864452010
Kumar V Rao Y S Venkataraman G Sarwade R N and Mani S Analysis of Aqua25
AMSR-E Derived Snow Water Equivalent over Himalayan Snow Covered Regions Geo-science and Remote Sensing Symposium Denver CO USA 31 Julyndash4 August 2006
Kaumlaumlb A Berthier E Nuth C Gardelle J and Arnaud Y Contrasting patterns of earlytwenty-first-century glacier mass change in the Himalayas Nature 488 495ndash498 availableat httpwwwnaturecomnaturejournalv488n7412absnature11324html ndash Supplement30
2012Lehner B Verdin K and Jarvis A New global hydrography derived from spaceborne eleva-
tion data Eos T Am Geophys Un 89 93ndash94 doi1010292008EO100001 2008
472
TCD9 441ndash493 2015
Snowfall in theHimalayas an
uncertain future froma little-known past
E Viste and A Sorteberg
Title Page
Abstract Introduction
Conclusions References
Tables Figures
J I
J I
Back Close
Full Screen Esc
Printer-friendly Version
Interactive Discussion
Discussion
Paper
|D
iscussionP
aper|
Discussion
Paper
|D
iscussionP
aper|
MacQueen J Some Methods for Classification and Analysis of Multivariate ObservationsFifth Berkeley Symposium on Mathematical Statistics and Probability Berkeley California21 Junendash18 July 1967
Meacuteneacutegoz M Galleacutee H and Jacobi H W Precipitation and snow cover in the Himalayafrom reanalysis to regional climate simulations Hydrol Earth Syst Sci 17 3921ndash39365
doi105194hess-17-3921-2013 2013Menon A Levermann A Schewe J Lehmann J and Frieler K Consistent increase in
Indian monsoon rainfall and its variability across CMIP-5 models Earth Syst Dynam 4287ndash300 doi105194esd-4-287-2013 2013
Moss R H Edmonds J A Hibbard K A Manning M R Rose S K van Vuuren D P10
Carter T R Emori S Kainuma M Kram T Meehl G A Mitchell J F B Naki-cenovic N Riahi K Smith S J Stouffer R J Thomson A M Weyant J P andWilbanks T J The next generation of scenarios for climate change research and assess-ment Nature 463 747ndash756 2010
Negi H S Kulkarni A V and Semwal B S Estimation of snow cover distribution in Beas15
basin Indian Himalaya using satellite data and ground measurements J Earth Syst Sci118 525ndash538 doi101007s12040-009-0039-0 2009
Palazzi E v Hardenberg J and Provenzale A Precipitation in the Hindu-Kush Karako-ram Himalaya observations and future scenarios J Geophys Res-Atmos 118 85ndash100doi1010292012JD018697 201320
Rees H G and Collins D N Regional differences in response of flow in glacier-fed Himalayanrivers to climatic warming Hydrol Process 20 2157ndash2169 doi101002hyp6209 2006
Rienecker M M Suarez M J Gelaro R Todling R Bacmeister J Liu EBosilovich M G Schubert S D Takacs L Kim G-K Bloom S Chen J Collins DConaty A da Silva A Gu W Joiner J Koster R D Lucchesi R Molod A Owens T25
Pawson S Pegion P Redder C R Reichle R Robertson F R Ruddick A GSienkiewicz M and Woollen J MERRA NASArsquos Modern-Era Retrospective Analysis forResearch and Applications J Climate 24 3624ndash3648 doi101175JCLI-D-11-0001512011
Rikiishi K and Nakasato H Height dependence of the tendency for reduction in seasonal30
snow cover in the Himalaya and the Tibetan Plateau region 1966ndash2001 Ann Glaciol 43369ndash377 doi103189172756406781811989 2006
473
TCD9 441ndash493 2015
Snowfall in theHimalayas an
uncertain future froma little-known past
E Viste and A Sorteberg
Title Page
Abstract Introduction
Conclusions References
Tables Figures
J I
J I
Back Close
Full Screen Esc
Printer-friendly Version
Interactive Discussion
Discussion
Paper
|D
iscussionP
aper|
Discussion
Paper
|D
iscussionP
aper|
Raumlisaumlnen J Warmer climate less or more snow Clim Dynam 30 307ndash319doi101007s00382-007-0289-y 2008
Schaner N Voisin N Nijssen B and Lettenmaier D P The contribution of glacier melt tostreamflow Environ Res Lett 7 034029 doi1010881748-932673034029 2012
Scherler D Bookhagen B and Strecker M R Spatially variable response of Himalayan5
glaciers to climate change affected by debris cover Nature Geosci 4 156ndash159 availableat httpwwwnaturecomngeojournalv4n3absngeo1068html ndash Supplement 2011
Sharif M Archer D R Fowler H J and Forsythe N Trends in timing and magnitude offlow in the Upper Indus Basin Hydrol Earth Syst Sci 17 1503ndash1516 doi105194hess-17-1503-2013 201310
Shekhar M S Chand H Kumar S Srinivasan K and Ganju A Climate-change studiesin the western Himalaya Ann Glaciol 51 105ndash112 doi1031891727564107913865082010
Shrestha A B Wake C P Mayewski P A and Dibb J E Maximum tempera-ture trends in the Himalaya and its vicinity an analysis based on temperature records15
from Nepal for the period 1971ndash94 J Climate 12 2775ndash2786 doi1011751520-0442(1999)012lt2775MTTITHgt20CO2 1999
Shrestha A B Wake C P Dibb J E and Mayewski P A Precipitation fluctuations in theNepal Himalaya and its vicinity and relationship with some large scale climatological parame-ters Int J Climatol 20 317ndash327 doi101002(SICI)1097-0088(20000315)203lt317AID-20
JOC476gt30CO2-G 2000Siderius C Biemans H Wiltshire A Rao S Franssen W H P Kumar P Gosain A K
van Vliet M T H and Collins D N Snowmelt contributions to discharge of the GangesSci Total Environ Supplement 468ndash469 9 doi101016jscitotenv201305084 2013
Singh P Jain S K and Kumar N Estimation of snow and glacier-melt contribution to the25
Chenab River Western Himalaya Mt Res Dev 17 49ndash56 doi1023073673913 1997Singh P Kumar V Thomas T and Arora M Changes in rainfall and relative hu-
midity in river basins in northwest and central India Hydrol Process 22 2982ndash2992doi101002hyp6871 2008
Sontakke N A Singh N and Singh H N Instrumental period rainfall series of the Indian30
region (AD 1813ndash2005) revised reconstruction update and analysis Holocene 18 1055ndash1066 doi1011770959683608095576 2008
474
TCD9 441ndash493 2015
Snowfall in theHimalayas an
uncertain future froma little-known past
E Viste and A Sorteberg
Title Page
Abstract Introduction
Conclusions References
Tables Figures
J I
J I
Back Close
Full Screen Esc
Printer-friendly Version
Interactive Discussion
Discussion
Paper
|D
iscussionP
aper|
Discussion
Paper
|D
iscussionP
aper|
Sperber K R Annamalai H Kang I S Kitoh A Moise A Turner A Wang B andZhou T The Asian summer monsoon an intercomparison of CMIP5 vs CMIP3 simulationsof the late 20th century Clim Dynam 41 2711ndash2744 doi101007s00382-012-1607-62013
Tahir A A Chevallier P Arnaud Y and Ahmad B Snow cover dynamics and hydrological5
regime of the Hunza River basin Karakoram Range Northern Pakistan Hydrol Earth SystSci 15 2275ndash2290 doi105194hess-15-2275-2011 2011a
Tahir A A Chevallier P Arnaud Y Neppel L and Ahmad B Modeling snowmelt-runoffunder climate scenarios in the Hunza River basin Karakoram Range Northern Pakistan JHydrol 409 104ndash117 doi101016jjhydrol201108035 2011b10
Taylor K E Stouffer R J and Meehl G A An overview of CMIP5 and the experimentdesign B Am Meteorol Soc 93 14 doi101175BAMS-D-11-000941 2011
Tedesco M and Narvekar P S Assessment of the NASA AMSR-E SWE product IEEE J SelTop Appl 3 141ndash159 doi101109JSTARS20102040462 2010
Teutschbein C and Seibert J Bias correction of regional climate model simulations for hydro-15
logical climate-change impact studies review and evaluation of different methods J Hydrol456ndash457 12ndash29 doi101016jjhydrol201205052 2012
Turner A G and Annamalai H Climate change and the South Asian summer monsoon NatClim Change 2 587ndash595 2012
van Vuuren D Edmonds J Kainuma M Riahi K Thomson A Hibbard K Hurtt G20
Kram T Krey V Lamarque J-F Masui T Meinshausen M Nakicenovic N Smith Sand Rose S The representative concentration pathways an overview Climatic Change109 26 doi101007s10584-011-0148-z 2011
Wang A and Zeng X Development of global hourly 05-degree land surface air temperaturedatasets J Climate 26 7676ndash7691 doi101175JCLI-D-12-006821 201325
Wiltshire A J Climate change implications for the glaciers of the Hindu Kush Karakoram andHimalayan region The Cryosphere 8 941ndash958 doi105194tc-8-941-2014 2014
Winiger M Gumpert M and Yamout H KarakorumndashHindukushndashwestern Himalaya assess-ing high-altitude water resources Hydrol Process 19 2329ndash2338 doi101002hyp5887200530
Xu X Lu C Shi X and Gao S World water tower An atmospheric perspective GeophysRes Lett 35 L20815 doi1010292008GL035867 2008a
475
TCD9 441ndash493 2015
Snowfall in theHimalayas an
uncertain future froma little-known past
E Viste and A Sorteberg
Title Page
Abstract Introduction
Conclusions References
Tables Figures
J I
J I
Back Close
Full Screen Esc
Printer-friendly Version
Interactive Discussion
Discussion
Paper
|D
iscussionP
aper|
Discussion
Paper
|D
iscussionP
aper|
Xu Z X Gong T L and Li J Y Decadal trend of climate in the Tibetan Plateaumdashregionaltemperature and precipitation Hydrol Process 22 3056ndash3065 doi101002hyp68922008b
Yasutomi N Hamada A and Akiyo Y Development of a Long-term Daily Gridded Temper-ature Dataset and its Application to RainSnow Discrimination of Daily Precipitation Global5
Environ Res15 165ndash172 2011Yatagai A Kamiguchi K Arakawa O Hamada A Yasutomi N and Kitoh A APHRODITE
Constructing a Long-Term Daily Gridded Precipitation Dataset for Asia Based on a DenseNetwork of Rain Gauges B Am Meteorol Soc 93 1401ndash1415 doi101175BAMS-D-11-001221 201210
You Q Kang S Aguilar E and Yan Y Changes in daily climate extremes in the east-ern and central Tibetan Plateau during 1961ndash2005 J Geophys Res-Atmos 113 D07101doi1010292007JD009389 2008
476
TCD9 441ndash493 2015
Snowfall in theHimalayas an
uncertain future froma little-known past
E Viste and A Sorteberg
Title Page
Abstract Introduction
Conclusions References
Tables Figures
J I
J I
Back Close
Full Screen Esc
Printer-friendly Version
Interactive Discussion
Discussion
Paper
|D
iscussionP
aper|
Discussion
Paper
|D
iscussionP
aper|
Table 1 Combinations of data types used in snowfall estimates T temperature P precipita-tion f (P T ) indicates that snowfall is calculated as a function of P and T
Precipitation Temperature Snowfall Time
MERRA MERRA PresentMERRA reference MERRA Terrain-adjusted MERRA f (P T ) PresentMERRA T2m MERRA MERRA T2m f (P T ) PresentBias-corrected with obs T MERRA Bias-corr terrain-adj MERRA f (P T ) PresentBias-corrected with obs P Bias-corr MERRA Terrain-adjusted MERRA f (P T ) PresentBias-corrected with obs T P Bias-corr MERRA Bias-corr terrain-adj MERRA f (P T ) PresentCMIP5 T MERRA Terrain-adj MERRA+∆T f (P T ) FutureCMIP5 P MERRAtimes∆P Terrain-adj MERRA f (P T ) FutureCMIP5 T P MERRAtimes∆P Terrain-adj MERRA+∆T f (P T ) FutureBias-corr CMIP5 T Bias-corr MERRA Bias-corr terrain-adj MERRA+∆T f (P T ) FutureBias-corr CMIP5 P Bias-corr MERRAtimes∆P Bias-corr terrain-adj MERRA f (P T ) FutureBias-corr CMIP5 T P Bias-corr MERRAtimes∆P Bias-corr terrain-adj MERRA+∆T f (P T ) Future
477
TCD9 441ndash493 2015
Snowfall in theHimalayas an
uncertain future froma little-known past
E Viste and A Sorteberg
Title Page
Abstract Introduction
Conclusions References
Tables Figures
J I
J I
Back Close
Full Screen Esc
Printer-friendly Version
Interactive Discussion
Discussion
Paper
|D
iscussionP
aper|
Discussion
Paper
|D
iscussionP
aper|
Table 2 Data sets used in calculations of present-day snowfall
Product Time Hor res Description
MERRA 1979ndash2012 05 lat 07 lon Hourly atmospheric reanalysis data(Rienecker et al 2011)
APHRODITEV1204V1101
1979ndash2007 025 Daily temperature andprecipitation basedon observations (Yatagai et al 2012Yasutomi et al 2011)
CRU TS 320 1979ndash2011 05 Monthly temperature and precipitationbased on observations(Harris et al 2014)
TRMM 3B42 V7 1998ndash2012 05 3 hourly satellite-based precipitation(Huffman et al 2007)
GLOBE 1 km Topography data set(Hastings and Dunbar 1998)
478
TCD9 441ndash493 2015
Snowfall in theHimalayas an
uncertain future froma little-known past
E Viste and A Sorteberg
Title Page
Abstract Introduction
Conclusions References
Tables Figures
J I
J I
Back Close
Full Screen Esc
Printer-friendly Version
Interactive Discussion
Discussion
Paper
|D
iscussionP
aper|
Discussion
Paper
|D
iscussionP
aper|
Table 3 CMIP5 models and RCPs used (x) in calculations of 2071ndash2100 snowfall
Model RCP 26 RCP 85
CanESM2 x xCCSM4 x xCESM1-CAM5 xCNRM-CM5 xGFDL-CM3 x xGFDL-ESM2G xGISS-E2-R x xHadGEM2-ES x xIPSL-CM5A-LR x xIPSL-CM5A-MR x xMIROC-ESM x xMIROC-ESM-CHEM x xMIROC5 x xMRI-CGCM3 x xNorESM1-M x xNorESM1-ME x x
479
TCD9 441ndash493 2015
Snowfall in theHimalayas an
uncertain future froma little-known past
E Viste and A Sorteberg
Title Page
Abstract Introduction
Conclusions References
Tables Figures
J I
J I
Back Close
Full Screen Esc
Printer-friendly Version
Interactive Discussion
Discussion
Paper
|D
iscussionP
aper|
Discussion
Paper
|D
iscussionP
aper|
Table 4 Annual snowfall estimates for the Indus Ganges and Brahmaputra Basins S snow[km3 SWE] P precipitation [km3] S and P percent of MERRA reference snowfall andMERRA precipitation First horizontal section no bias-corrections Second third and fourthsection bias-corrections with T P and both T and P
Indus Basin Ganges Basin Brahmaputra BasinInput S S P P S S P P S S P P
MERRA reference 148 100 422 100 54 100 1147 100 119 100 733 100MERRA 166 112 422 100 49 90 1147 100 129 109 733 100MERRA T2m 154 104 422 100 42 77 1147 100 109 92 733 100T APHRODITE 113 76 422 100 30 55 1147 100 74 62 733 100T CRU 126 85 422 100 81 151 1147 100 109 92 733 100P APHRODITE 66 44 315 75 22 42 1020 89 35 30 567 77P TRMM 72 49 404 96 31 57 1244 108 63 54 835 114P CRU 84 56 398 94 30 56 1100 96 53 45 716 98P T APHRODITE 49 33 315 75 12 22 1020 89 20 17 567 77P APHRODITE T CRU 62 42 315 75 34 63 1020 89 33 28 567 77P TRMM T APHRODITE 54 36 390 92 18 34 1195 104 39 33 815 111P TRMM T CRU 65 44 403 96 46 85 1254 109 58 49 813 111P CRU T APHRODITE 65 44 395 94 17 31 1106 96 31 26 718 98P T CRU 80 54 398 94 41 75 1100 96 49 42 716 98
480
TCD9 441ndash493 2015
Snowfall in theHimalayas an
uncertain future froma little-known past
E Viste and A Sorteberg
Title Page
Abstract Introduction
Conclusions References
Tables Figures
J I
J I
Back Close
Full Screen Esc
Printer-friendly Version
Interactive Discussion
Discussion
Paper
|D
iscussionP
aper|
Discussion
Paper
|D
iscussionP
aper|
Table 5 Projected change in annual snowfall from 1971ndash2000 to 2071ndash2100 with referenceto terrain-adjusted MERRA and APHRODITE ∆Sabs [km3] is the absolute change ∆Srel [] isthe relative change compared to the present-day MERRA reference snowfall Values are pre-sented with the CMIP5 multi-model mean as the main value and the span of individual modelsin brackets (MERRA only) ∆TP indicates that changes in both temperature and precipitationare included whereas ∆P and ∆T denotes changes only in precipitation or temperature re-spectively
Indus Ganges Brahmaputra∆Sabs [km3] ∆Srel [] ∆Sabs [km3] ∆Srel [] ∆Sabs [km3] ∆Srel []
RCP 85 MERRA ∆TP minus49 [minus83minus9] minus33 [minus56minus6] minus27 [minus36minus14] minus50 [minus66minus25] minus64 [minus93minus39] minus54 [minus79minus33]MERRA ∆T minus51 [minus67minus34] minus34 [minus45minus23] minus28 [minus34minus21] minus51 [minus64minus39] minus71 [minus87minus53] minus60 [minus73minus44]MERRA ∆P 5 [minus2544] 4 [minus1730] 7 [minus417] 12 [minus731] 20 [minus1750] 17 [minus1542]
APHRO ∆TP minus25 minus51 minus7 minus56 minus13 minus67APHRO ∆T minus25 minus52 minus7 minus57 minus14 minus71APHRO ∆P 1 1 1 6 3 16
RCP 26 MERRA ∆TP minus15 [minus406] minus10 [minus274] minus10 [minus19minus3] minus18 [minus36minus5] minus25 [minus42minus5] minus21 [minus35minus4]MERRA ∆T minus18 [minus27minus9] minus12 [minus18minus6] minus12 [minus21minus6] minus21 [minus39minus11] minus29 [minus47minus13] minus25 [minus40minus11]MERRA ∆P 3 [minus1825] 2 [minus1217] 3 [minus210] 5 [minus419] 7 [minus828] 6 [minus623]
APHRO ∆TP minus9 minus18 minus2 minus20 minus6 minus29APHRO ∆T minus10 minus19 minus3 minus23 minus6 minus32APHRO ∆P 1 1 0 4 1 6
481
TCD9 441ndash493 2015
Snowfall in theHimalayas an
uncertain future froma little-known past
E Viste and A Sorteberg
Title Page
Abstract Introduction
Conclusions References
Tables Figures
J I
J I
Back Close
Full Screen Esc
Printer-friendly Version
Interactive Discussion
Discussion
Paper
|D
iscussionP
aper|
Discussion
Paper
|D
iscussionP
aper|
Figure 1 Map of the region with the Indus Ganges and Brahmaputra basins outlined in whiteThinner outlines are national borders Background NASA Visible Earth
482
TCD9 441ndash493 2015
Snowfall in theHimalayas an
uncertain future froma little-known past
E Viste and A Sorteberg
Title Page
Abstract Introduction
Conclusions References
Tables Figures
J I
J I
Back Close
Full Screen Esc
Printer-friendly Version
Interactive Discussion
Discussion
Paper
|D
iscussionP
aper|
Discussion
Paper
|D
iscussionP
aper|
0
400 mm
Months 1ndash12
SP
I1
I2I3
I5I4
G1
G2G3
G4
B1
B2
B3B4
Viste amp SortebergFigure 2
Figure 2 Monthly mean MERRA precipitation and MERRA reference snowfall in sub-basinclusters of the Indus (I) Ganges (G) and Brahmaputra (B) Total bar height MERRA precip-itation (P) [mm] Colored bars snowfall (S) [mm SWE] based on MERRA precipitation andterrain-adjusted MERRA temperature in the region with the same color Cluster 1 in eachbasin is considered snow-free and the seasonal cycles are not shown
483
TCD9 441ndash493 2015
Snowfall in theHimalayas an
uncertain future froma little-known past
E Viste and A Sorteberg
Title Page
Abstract Introduction
Conclusions References
Tables Figures
J I
J I
Back Close
Full Screen Esc
Printer-friendly Version
Interactive Discussion
Discussion
Paper
|D
iscussionP
aper|
Discussion
Paper
|D
iscussionP
aper|
a) MERRA reference b) APHRODITE c) APHRODITE ndash MERRA ref
30 km3
20100-10-20-30
Viste amp SortebergFigure 3
Figure 3 The effect of bias-corrections with APHRODITE temperature and precipitation(a) MERRA reference snowfall (b) Snowfall based on bias-corrections with APHRODITE(c) APHRODITE (b) minus MERRA reference snowfall (a)
484
TCD9 441ndash493 2015
Snowfall in theHimalayas an
uncertain future froma little-known past
E Viste and A Sorteberg
Title Page
Abstract Introduction
Conclusions References
Tables Figures
J I
J I
Back Close
Full Screen Esc
Printer-friendly Version
Interactive Discussion
Discussion
Paper
|D
iscussionP
aper|
Discussion
Paper
|D
iscussionP
aper|
Figure 4 Difference between MERRA precipitation and observation-based data (a) Annualmean MERRA precipitation (b c and d) Annual mean MERRA precipitation bias-correctedwith observations APHRODITE CRU TS and TRMM 3B42 For each data set the small insetmaps show the observations minus MERRA
485
TCD9 441ndash493 2015
Snowfall in theHimalayas an
uncertain future froma little-known past
E Viste and A Sorteberg
Title Page
Abstract Introduction
Conclusions References
Tables Figures
J I
J I
Back Close
Full Screen Esc
Printer-friendly Version
Interactive Discussion
Discussion
Paper
|D
iscussionP
aper|
Discussion
Paper
|D
iscussionP
aper|
Biasminuscorrected minus original MERRA temperature [C]
minus15
minus10
minus5
0
5
10
Biasminuscorrected minus original MERRA temperature [C]
minus15
minus10
minus5
0
5
10
MERRA mean temperature [C] 1979minus2007
minus15
minus10
minus5
0
5
10
15
20
25
30a) MERRA b) APHRODITE ndash MERRA c) CRU ndash MERRA
-10
0
10
20
30degC
minus15
minus10
minus5
0
5
10
15degC
Viste amp SortebergFigure 5
Figure 5 Difference between MERRA temperature and observation-based data (a) Annualmean MERRA temperature (b and c) Annual mean MERRA temperature bias-corrected withobservations APHRODITE and CRU TS
486
TCD9 441ndash493 2015
Snowfall in theHimalayas an
uncertain future froma little-known past
E Viste and A Sorteberg
Title Page
Abstract Introduction
Conclusions References
Tables Figures
J I
J I
Back Close
Full Screen Esc
Printer-friendly Version
Interactive Discussion
Discussion
Paper
|D
iscussionP
aper|
Discussion
Paper
|D
iscussionP
aper|
Jan Apr
Jul Oct
a)
c)
b)
d)
15degC
10
5
0
ndash5
ndash10
ndash15
200 mm16012080400ndash40ndash80ndash120ndash160ndash200
Viste amp SortebergFigure 6
Figure 6 Regions where increasing temperatures are likely to cause a shift from snow to rainData monthly mean MERRA temperature terrain-adjusted to a 4 km GLOBE grid Red temper-ature between minus5 and 0 considered critical Small inset maps monthly MERRA precipitationin the critical zones
487
TCD9 441ndash493 2015
Snowfall in theHimalayas an
uncertain future froma little-known past
E Viste and A Sorteberg
Title Page
Abstract Introduction
Conclusions References
Tables Figures
J I
J I
Back Close
Full Screen Esc
Printer-friendly Version
Interactive Discussion
Discussion
Paper
|D
iscussionP
aper|
Discussion
Paper
|D
iscussionP
aper|
1 2 3 4 5 6 7 8 9 10 11 12Month
∆T [ordm
C]
a) Indus
0
1
2
3
4
5
6
7
8
9
10
b) Ganges∆T
[ordmC
]
1 2 3 4 5 6 7 8 9 10 11 12Month
1
2
3
4
5
6
7
8
0 0
c) Brahmaputra
∆T [ordm
C]
1 2 3 4 5 6 7 8 9 10 11 12Month
1
2
3
4
5
6
7
8
9
10 RCP 85RCP 85 meanRCP 26RCP 26 mean
Viste amp SortebergFigure 7
Figure 7 Projected future temperature change from 1971ndash2000 to 2071ndash2100 in the (a) In-dus (b) Ganges and (c) Brahmaputra Basins Thin lines show the individual CMIP5 modelsstronger lines the multi-model mean
488
TCD9 441ndash493 2015
Snowfall in theHimalayas an
uncertain future froma little-known past
E Viste and A Sorteberg
Title Page
Abstract Introduction
Conclusions References
Tables Figures
J I
J I
Back Close
Full Screen Esc
Printer-friendly Version
Interactive Discussion
Discussion
Paper
|D
iscussionP
aper|
Discussion
Paper
|D
iscussionP
aper|
1 2 3 4 5 6 7 8 9 10 11 12Month
[km
3 ]
a) Indus
0
20
40
60
80
100
120
140
b) Ganges[k
m3 ]
1 2 3 4 5 6 7 8 9 10 11 12Month
0
100
200
300
400
500
600
700
c) Brahmaputra
[km
3 ]
1 2 3 4 5 6 7 8 9 10 11 12Month
0
50
100
150
200
250
MERRA ref
2071ndash2100
1979ndash2008
RCP 85RCP 85 meanRCP 26RCP 26 mean
Viste amp SortebergFigure 8
Figure 8 Projected future precipitation in the (a) Indus (b) Ganges and (c) BrahmaputraBasins Gray bars MERRA 1979ndash2008 Thin lines and horizontal marks on the bars show theindividual CMIP5 models and the multi-model mean for 2071ndash2100
489
TCD9 441ndash493 2015
Snowfall in theHimalayas an
uncertain future froma little-known past
E Viste and A Sorteberg
Title Page
Abstract Introduction
Conclusions References
Tables Figures
J I
J I
Back Close
Full Screen Esc
Printer-friendly Version
Interactive Discussion
Discussion
Paper
|D
iscussionP
aper|
Discussion
Paper
|D
iscussionP
aper|
1 2 3 4 5 6 7 8 9 10 11 120
5
10
15
20
25
30
35
Month
SWE
[km
3 ]
a) Indus
0
1
2
3
4
5
6
7
8
b) Ganges
SWE
[km
3 ]
1 2 3 4 5 6 7 8 9 10 11 12Month
0
2
4
6
8
10
12
14
16
18
20
c) Brahmaputra
SWE
[km
3 ]
1 2 3 4 5 6 7 8 9 10 11 12Month
MERRA ref
2071ndash2100
1979ndash2008
RCP 85RCP 85 meanRCP 26RCP 26 mean
Viste amp SortebergFigure 9
Figure 9 Projected future snowfall in the (a) Indus (b) Ganges and (c) Brahmaputra Basinswith reference to MERRA reference snowfall Gray bars MERRA reference snowfall for 1979ndash2008 Thin lines and horizontal marks on the bars show the individual CMIP5 models andthe multi-model mean for 2071ndash2100 based on changes in temperature and precipitation asdescribed in Sect 23
490
TCD9 441ndash493 2015
Snowfall in theHimalayas an
uncertain future froma little-known past
E Viste and A Sorteberg
Title Page
Abstract Introduction
Conclusions References
Tables Figures
J I
J I
Back Close
Full Screen Esc
Printer-friendly Version
Interactive Discussion
Discussion
Paper
|D
iscussionP
aper|
Discussion
Paper
|D
iscussionP
aper|
Figure 10 Projected future changes in snowfall in sub-basins of the Indus Ganges andBrahmaputra Basins (a) Absolute change [km3] with reference to MERRA reference snow-fall (b) Absolute change [km3] with reference to APHRODITE snowfall (c d) Correspondingrelative changes [] with reference to MERRA and APHRODITE
491
TCD9 441ndash493 2015
Snowfall in theHimalayas an
uncertain future froma little-known past
E Viste and A Sorteberg
Title Page
Abstract Introduction
Conclusions References
Tables Figures
J I
J I
Back Close
Full Screen Esc
Printer-friendly Version
Interactive Discussion
Discussion
Paper
|D
iscussionP
aper|
Discussion
Paper
|D
iscussionP
aper|
J F M A M J J A S O N DMonth
0
5
10
15
20 km3Precip
0
2
4
6
8
10 km3SWE
2000
3000
4000
5000
6000 masl
1845
J F
M
A
M
JJ A
S
O
N
D
RSL
I4A = 146793 km2
1 km 3 = 68 mm
0
05
1
15 SWE rel
8000 m
0
J F M A M J J A S O N DMonth
0
2
4
6
8
10
12 km3 SWE
3000
4000
5000
6000 masl
78
2
14
J FM
A
MJ
J AS
O
ND
RSL
I5
Precip
0
5
10
15
20
25 km3
0
05
1
15 SWE rel
8000 m
0
A = 178669 km2
1 km 3 = 56 mm
CMIP52071ndash2100mean
Today
MERRA APHRODITE
Individual models
CMIP52071ndash2100mean
MERRA APHRODITE
Individual models
CMIP52071ndash2100Precip mean
MERRA APHRODITE
Individual models
SWE todayPrecip today
2000 mTerrain distribution of area between levels
CMIP52071ndash2100
TodayMERRA
APHRODITE
a)
i)
ii)
iii)
iv)
b)
Viste amp SortebergFigure 11
Figure 11 Monthly CMIP5 RCP 85 change in snowfall precipitation and rainsnow line eleva-tion in the upper Indus clusters (a) 4 and (b) 5 from 1971ndash2000 to 2071ndash2100 with referenceto the MERRA reference (red) and APHRODITE (blue) CMIP5 multi-model means are shownas horizontal marks individual models as dots Cluster location and terrain profile are shownabove the graphs (i) Fractional change in snowfall (ii) Future snowfall [km3] (dots) comparedto today (bars) (iii) Future precipitation [km3] (dots) compared to today (bars) Snowfall todayis shown as darker part of bars (iv) Rainsnow line elevation [m asl] Gray background el-evation histogram with the of total ground area lying in the marked 2000 m intervals Barschange from today (bottom) to CMIP5 multi-model mean (top)
492
TCD9 441ndash493 2015
Snowfall in theHimalayas an
uncertain future froma little-known past
E Viste and A Sorteberg
Title Page
Abstract Introduction
Conclusions References
Tables Figures
J I
J I
Back Close
Full Screen Esc
Printer-friendly Version
Interactive Discussion
Discussion
Paper
|D
iscussionP
aper|
Discussion
Paper
|D
iscussionP
aper|
3000
4000
5000
6000 masl
0
2
4
6
8
10 km3
0
10
20
30
40
50
60 km3
0
05
1
15
J F M A M J J A S O N DMonth
J FM
A
M
JJ A
S
O
ND
Precip
SWE
RSL
SWE rel
53
B3
8000 m
0
A = 139611 km2
1 km 3 = 72 mm
4500
5000
5500
6000
6500 masl
0
1
2
3
4 km3
0
10
20
30
40
50 km3
0
05
1
15 SWE rel
SWE
RSL
Precip
95
J F M A M J J A S O N DMonth
J FM
A
M
JJ A
S
ON
D
B4
8000 m
0
A = 159165 km2
1 km 3 = 63 mm
CMIP52071ndash2100mean
Today
MERRA APHRODITE
Individual models
CMIP52071ndash2100mean
MERRA APHRODITE
Individual models
CMIP52071ndash2100Precip mean
MERRA APHRODITE
Individual models
SWE todayPrecip today
2000 mTerrain distribution of area between levels
CMIP52071ndash2100
TodayMERRA
APHRODITE
a)
i)
ii)
iii)
iv)
b)
Viste amp SortebergFigure 12
Figure 12 Monthly CMIP5 RCP 85 change in snowfall precipitation and rainsnow line ele-vation in the upper Brahmaputra clusters (a) 4 and (b) 3 See Fig 11 for a description of thecontent
493
- Introduction
-
- Observed trends in snowfall temperature and precipitation
- Future projections of snowfall temperature and precipitation
- Aims and scope
-
- Data and methods
-
- Reference present-day snowfall
- Bias-corrected present-day snowfall
- Projected snowfall
- The rain-snow line
-
- Present-day snowfall
-
- Seasonal cycles of precipitation and snowfall
- Comparison of snowfall estimates
-
- Projected future snowfall
-
- Basin-scale projections
- Regional projections
-
- Upper Indus western part
- Upper Indus eastern part
- Upper Brahmaputra western part
- Upper Brahmaputra eastern part
-
- Potential effects of reduced snowfall on water availability
-
- Concluding summary
-

TCD9 441ndash493 2015
Snowfall in theHimalayas an
uncertain future froma little-known past
E Viste and A Sorteberg
Title Page
Abstract Introduction
Conclusions References
Tables Figures
J I
J I
Back Close
Full Screen Esc
Printer-friendly Version
Interactive Discussion
Discussion
Paper
|D
iscussionP
aper|
Discussion
Paper
|D
iscussionP
aper|
32 Comparison of snowfall estimates
The MERRA reference snowfall described in Sect 31 differs greatly from snowfallbased on bias-corrected temperature and precipitation Large differences betweentemperature and data sets for the HKH cause corresponding deviations in snowfall ndashnot only between MERRA-based estimates and bias-corrected data but between esti-5
mates based on bias-corrections with different data sets This can be seen from Table 4which displays annual snowfall estimates for combinations of the bias-corrections de-scribed in Sect 22 aggregated to the major basins Data for the individual sub-basinsare included as Supplement
With the exception of snowfall based on MERRA precipitation and MERRA temper-10
ature bias-corrected with CRU TS in the Ganges basin all estimates based on bias-corrected data are lower than the MERRA reference snowfall The lowest estimates arethose based on bias-corrections with APHRODITE precipitation and temperature Thiscombination produced only 33 of the reference snowfall in the Indus Basin 22 inthe Ganges Basins and 17 in the Brahmaputra Basin While the difference is large in15
all sub-basins that have snow today it is especially large in the upper parts of the Indusand Brahmaputra Basins (Fig 3) In comparison bias-corrections with CRU TS tem-perature and precipitation produce 54 of the reference snowfall in the Indus 75 inthe Ganges and 42 in the Brahmaputra ndash factors of 2ndash4 compared to APHRODITEIt should be noted that as the time periods covered by the data sets are not equal20
the results are not strictly comparable but tests using different MERRA periods (notshown) indicate that there would be no major difference in the monthly means
The large difference between MERRA reference snowfall and snowfall based onbias-corrected data results from differences in both temperature and precipitation butdifferences in the precipitation pattern have the greatest effect Estimates where only25
the precipitation has been bias-corrected are lower than those where only the tempera-ture has been bias-corrected (Table 4) This is not solely an effect of more precipitationin MERRA than in the observation-based data although MERRA is wetter than all the
455
TCD9 441ndash493 2015
Snowfall in theHimalayas an
uncertain future froma little-known past
E Viste and A Sorteberg
Title Page
Abstract Introduction
Conclusions References
Tables Figures
J I
J I
Back Close
Full Screen Esc
Printer-friendly Version
Interactive Discussion
Discussion
Paper
|D
iscussionP
aper|
Discussion
Paper
|D
iscussionP
aper|
data sets in the Indus and for APHRODITE also in the Ganges and the Brahmapu-tra An inland and upward shift in the MERRA precipitation adds to the differencesAs shown in Fig 4 all the observation-based precipitation data sets are wetter thanMERRA in most of the lowlands and in the foothills of the HKH but drier in the higher-elevation regions further inland In MERRA the precipitation belt is shifted higher up5
in the Himalayas where temperatures are lower and more of the precipitation falls assnow
In addition HKH temperatures are lower in MERRA than in APHRODITE and inthe upper Indus also than in CRU TS (Fig 5) The lower temperatures in MERRAcause higher snow fractions further increasing the difference between the MERRA ref-10
erence snowfall and APHRODITE snowfall Oppositely CRU TS is colder than MERRAthroughout the Ganges leading to higher snowfall estimates when bias-correctingMERRA temperatures with CRU TS (Table 4)
We do not see any reason to consider any of the observation-based data sets northe reanalysis the ground truth The reanalysis has the benefit of being physically15
consistent though precipitation is a pure model product In the other data sets thenumber of observations vary greatly within the region
The lack of observations in the HKH has been pointed out in many studies Mostmeteorological stations are located in the valleys and do not necessarily representweather conditions in higher terrain As demonstrated by Palazzi et al (2013) station-20
based data sets like APHRODITE and CRU TS are merely mathematical interpolationsin major parts of the HKH and on the Tibetan Plateau Immerzeel (2008) showed thatthe number of observations going into version 21 of the CRU data set in the Himalayanregion varies greatly A drop in the mid-1990s suggests that caution should be takenwhen interpreting data at later times Maps (not shown) of station coverage in version25
320 used in this study show that this problem persistsThe fact that more of the precipitation falls as snow at higher elevations may in it-
self lead to an under-estimation of precipitation in the mountains In addition to thelack of observations in high terrain gauges tend to capture snow less easily than rain
456
TCD9 441ndash493 2015
Snowfall in theHimalayas an
uncertain future froma little-known past
E Viste and A Sorteberg
Title Page
Abstract Introduction
Conclusions References
Tables Figures
J I
J I
Back Close
Full Screen Esc
Printer-friendly Version
Interactive Discussion
Discussion
Paper
|D
iscussionP
aper|
Discussion
Paper
|D
iscussionP
aper|
leading to a possible under-registration of precipitation at the few high-elevation sta-tions that exist Comparing stations along a vertical profile in the Karakoram Winigeret al (2005) found that precipitation multiplied by a factor of 5ndash10 from 2500 masl to5000ndash6000 masl This maximum is much higher than reported in most other studiesand they attributed this to the valley-dominance of stations normally used5
Indications of too little precipitation at higher elevations were also given by Tahiret al (2011b) as APHRODITE precipitation was too low to account for the observeddischarge in the Hunza river in the Karakoram Anders et al (2006) reported thatTRMM radar data underestimated precipitation at higher elevations in the Himalayasdue to the low ability of the radar to detect very low precipitation and lowndashmoderated10
snowfall rates On the other hand Krakauer et al (2013) found that both TRMM andAPHRODITE had too much precipitation compared to observations from the few exist-ing stations at elevations above 3000 masl in Nepal
Satellite data are a promising future alternative for measuring snowfall but presentlyof limited use MODIS and LANDSAT satellite data have been used in several studies15
of snow and ice in the Himalayas (Tahir et al 2011a b Bookhagen and Burbank2010 Hewitt 2005 Krishna 2005 Negi et al 2009 Jain et al 2009 Butt 2012 Gaoet al 2012 Kulkarni et al 2010 Immerzeel et al 2009) but these data contain onlysnow cover area with no measure of the snow thickness or snow water equivalentsThe NASA AMSR-E SWE data set distributed by the National Snow and Ice Data20
Center could have been used but correlations between AMSR-E SWE and groundobservations have been shown to be poor (Tedesco and Narvekar 2010 Byun andChoi 2014 Kumar et al 2006) As AMSR-E SWE has been found underestimatesnow depth we concluded that incorporating these data into our ensemble would notlikely constrain the results nor add new information25
Defining snowfall based on MERRA precipitation and elevation-adjusted tempera-ture as a reference was done mainly to have a single reference when comparing thedata sets against each other Also we believe the elevation-adjustment of temperaturerepresents an enhancement compared to the original MERRA reanalysis MERRA was
457
TCD9 441ndash493 2015
Snowfall in theHimalayas an
uncertain future froma little-known past
E Viste and A Sorteberg
Title Page
Abstract Introduction
Conclusions References
Tables Figures
J I
J I
Back Close
Full Screen Esc
Printer-friendly Version
Interactive Discussion
Discussion
Paper
|D
iscussionP
aper|
Discussion
Paper
|D
iscussionP
aper|
chosen mainly because it has an hourly resolution allowing diurnal temperature vari-ations to affect snowfall But even though this estimate is much higher than all thebias-corrected estimates it cannot be discarded It has been argued that reanalysisdata and regional climate models may in some cases be as good as or better thanobservations in the HKH (Wiltshire 2014 Meacuteneacutegoz et al 2013 Akhtar et al 2008)5
Akhtar et al (2008) got better results when modeling river discharge in three upperIndus catchments with an RCM-based hydrological model than with one based on thefew observations available within the region They concluded that it was preferable touse RCM data directly as input to hydrological models in this region
As shown in the small inset maps in Fig 4 MERRA precipitation is higher than ob-10
served precipitation throughout the HKH and the same has previously been shownfor ERA-Interim reanalysis precipitation (Palazzi et al 2013) In MERRA the precipi-tation belt is shifted upward in the terrain compared to in the observation-based datasets Whether this shift is realistic cannot be determined as long as observations fromupper-level terrain are either missing or likely too low15
4 Projected future snowfall
Whether higher temperatures lead to less snowfall depends on whether the tempera-ture changes from below to above freezing and whether this change occurs at a timewhen there is precipitation The maps in Fig 6 illustrate where a temperature increaseis most likely to affect snowfall and snowmelt In the red zones where the monthly20
temperature today is between ndash5 and 0 C the projected temperature increase of 2ndash7 C (Chaturvedi et al 2012 Collins et al 2013 Wiltshire 2014) may be consideredcritical Such a change would change snowfall to rain and also cause a change fromfreezing to melting of snow and ice The pink zones with monthly mean temperaturesof 0ndash5 C would similarly change from a climate where precipitation may often fall as25
snow to one that is snow-free
458
TCD9 441ndash493 2015
Snowfall in theHimalayas an
uncertain future froma little-known past
E Viste and A Sorteberg
Title Page
Abstract Introduction
Conclusions References
Tables Figures
J I
J I
Back Close
Full Screen Esc
Printer-friendly Version
Interactive Discussion
Discussion
Paper
|D
iscussionP
aper|
Discussion
Paper
|D
iscussionP
aper|
In January (Fig 6a) only the lower parts of the Himalayas is affected as most ofthe region would still have temperatures well below the freezing point The small insetmap shows precipitation in the red zone a narrow band along the range Oppositelyin July (Fig 6c) the temperature is already above 5 C in most of the region though athigher elevations along the Himalayan range and in the Karakoram the change can be5
critical The most widespread changes are seen in spring and fall In April and October(Fig 6b d) large areas in the HKH and on the Tibetan Plateau risk a change frombelow to above freezing
Incorporating CMIP5 precipitation changes we find that the projected temperatureincrease has a larger impact so that snowfall will be reduced in the Indus Ganges and10
Brahmaputra Basins by 2071ndash2100 compared to today Details for the major basinsare presented in Sect 41 How much increased temperatures reduce snowfall withina region depends on the location of the rainsnow line today compared to the terraindistribution Results for selected upper-level sub-basins in the Indus and Brahmaputrawill be discussed in that context in Sect 4215
The large deviations in the estimates of present-day snowfall (Sect 3) means thatthere will be correspondingly large deviations in projected values To account for thismost results are shown with reference to the highest and lowest present-day estimatesMERRA reference snowfall and to APHRODITE-based snowfall Future estimates rela-tive to CRU and TRMM are assumed to lie between those of MERRA and APHRODITE20
41 Basin-scale projections
In the Indus Ganges and Brahmaputra Basins the CMIP5 models project a meanincrease in both temperature (Fig 7) and precipitation (Fig 8) in the region by 2071ndash2100 for both RCPs 26 and 85 The RCP 85 multi-model mean change in temper-ature varies through the year with a 49ndash62 C increase in the Indus 36ndash52 C in25
the Ganges and 42ndash60 C in the Brahmaputra The increase is smallest during thesummer months The dip in the summer is also seen though less pronounced with
459
TCD9 441ndash493 2015
Snowfall in theHimalayas an
uncertain future froma little-known past
E Viste and A Sorteberg
Title Page
Abstract Introduction
Conclusions References
Tables Figures
J I
J I
Back Close
Full Screen Esc
Printer-friendly Version
Interactive Discussion
Discussion
Paper
|D
iscussionP
aper|
Discussion
Paper
|D
iscussionP
aper|
the RCP 26 The summer is also the season with the largest absolute increase inprecipitation
Compared to present-day estimates the CMIP5 models project less snowfall in theIndus Ganges and Brahmaputra Basins in the last decades of this century This canbe seen from Fig 9 The projected multi-model mean is lower than today in all calen-5
dar months for both RCPs 26 and 85 With the RCP 26 some models suggest anincrease in some months mainly in winter and spring This is also the case for one ortwo models with the RCP 85 whereas other models indicate that the snowfall in thesame months will be only half of todayrsquos values
In the Ganges Basin (Fig 9b) the seasonal distribution of snowfall today is mainly10
flat with equal amounts of snowfall from January through September Reductions insummer snowfall with the RCP 85 would change the seasonal cycle into a winter-dominated one To a lesser degree this is also the case for RCP 26 As summerprecipitation is projected to increase in all of the Ganges (not shown but consistentwith Menon et al 2013) this indicates that large areas are at elevations where a small15
increase in the summer temperature may cause a shift from snow to rain This is seenas the red band along the upper Ganges in Fig 6c Reductions in summer snowfall arealso large in the Brahmaputra (Fig 9b) whereas in the Indus the largest total changesoccur in MarchndashMay (Fig 9a)
As the MERRA reference snowfall for today is much larger than APHRODITE snow-20
fall (Sect 32) projected absolute changes for 2071ndash2100 are also much largerin MERRA The relative changes are more similar though larger with reference toAPHRODITE Annual snowfall changes for each major basin are presented in Table 5for changes in temperature precipitation or both and with reference to MERRA andAphrodite present-day snowfall Changes at the sub-basin level are shown in Fig 1025
In the Ganges Basin both MERRA- and APHRODITE-based multi-model mean snow-fall is reduced by about 20 with the RCP 26 and 50 with the RCP 85 In theIndus and Brahmaputra Basins the differences between MERRA- and APHRODITE-based changes are larger but not as large as for the absolute values With reference
460
TCD9 441ndash493 2015
Snowfall in theHimalayas an
uncertain future froma little-known past
E Viste and A Sorteberg
Title Page
Abstract Introduction
Conclusions References
Tables Figures
J I
J I
Back Close
Full Screen Esc
Printer-friendly Version
Interactive Discussion
Discussion
Paper
|D
iscussionP
aper|
Discussion
Paper
|D
iscussionP
aper|
to MERRA and APHRODITE respectively the reduction in snowfall in the Indus Basinis 30 and 50 with the RCP 85 The corresponding reductions in the BrahmaputraBasin are 50 and 70
The projected changes in temperature have greater effect on snowfall than thechanges in precipitation When taking into account only changes in precipitation all5
snowfall estimates are positive (∆P Table 5) This indicates that the mean annual to-tal reduction for each major basin is governed by the temperature change In someCMIP5 models (values in brackets in Table 5) the effect of precipitation changes (∆P )on snowfall are of the same magnitude as the effect of temperature changes (∆T ) butfor the CMIP5 multi-model mean temperature changes cause snowfall changes 4ndash1010
times as large as those due to changes in precipitation This is with reference to thepresent-day MERRA reference snowfall and for both RCPs 26 and 85 With referenceto APHRODITE snowfall the effect of temperature changes compared to precipitationchanges is even greater
42 Regional projections15
If temperatures are far below freezing everywhere warming may have little effect onsnowfall The same applies if only the highest peaks receive snow today The largestreduction in snowfall in a basin occurs if todayrsquos rainsnow line is at an elevation justbelow the dominant elevation of the basin Then large regions will see a shift fromsnow to rain20
In the Indus Basin the largest relative snowfall reduction by 2071ndash2100 is seen inthe southwestern sub-basins where snowfall is limited today (Fig 10) The largest totalreduction is seen in the snow-rich sub-basins of KabulSwatAlingar in the west and inthe east and a smaller reduction in the inner-most basins of GilgitHunza Indus 1 andNubraShyok Together with the upper regions of the Brahmaputra these sub-basins25
clusters I4 I5 B3 and B4 in Fig 2 were selected for a closer analysis In addition tohaving the most snow these clusters are the most homogeneous when considering
461
TCD9 441ndash493 2015
Snowfall in theHimalayas an
uncertain future froma little-known past
E Viste and A Sorteberg
Title Page
Abstract Introduction
Conclusions References
Tables Figures
J I
J I
Back Close
Full Screen Esc
Printer-friendly Version
Interactive Discussion
Discussion
Paper
|D
iscussionP
aper|
Discussion
Paper
|D
iscussionP
aper|
the seasonal cycle of snowfall and snow fraction The values presented in this sectionare all from the RCP 85 for changes from today to 2071ndash2100
421 Upper Indus western part
Cluster 4 consists of the sub-basins Astor KabulSwatAlingar and Krishen GangaAs seen from the elevation profile at the top of Fig 11a the elevation span is large5
and there is an almost equal proportion of the terrain at all levels from heights close tosea level to about 5000 masl The most important change for this cluster is a largereduction in the total amount of snowfall in winter and spring
With a few exceptions all CMIP5 models project less snowfall in all months of theyear (Fig 11a i ii) The largest total multi-model mean reduction in snowfall (ii) oc-10
curs in FebruaryndashApril without notable change in the multi-model mean precipitation(iii) Thus the reduction is caused by increasing temperatures represented by therainsnow line in Fig 11a iv As seen from the change in the rainsnow line elevationthe projected temperature increase in these months would imply that large areas thatreceive snow today would receive only rain About 40 of the ground in this cluster lies15
below 2000 masl and receives precipitation as rain throughout the year In summerprecipitation (iii) is at a minimum and the rainsnow line (iv) is already so high that onlya small fraction of the area receives snowfall today Thus although the relative changein snowfall (i) is largest in summer the change in the amount of snowfall (ii) is small Itshould also be noted that the change in the rainsnow line elevation (iv) in summer is20
much smaller 400ndash600 m compared to 600ndash900 m in DecemberndashApril
422 Upper Indus eastern part
Further east the largest changes are projected for the spring season Cluster 5 in theIndus Basin consists of the sub-basins GilgitHunza Indus 1 NubraShyok and Zan-skar As shown in Fig 11b this is high-elevation terrain with 80 of the ground lying25
above 4000 masl As a result almost all winter precipitation is snow (Fig 11b iii)
462
TCD9 441ndash493 2015
Snowfall in theHimalayas an
uncertain future froma little-known past
E Viste and A Sorteberg
Title Page
Abstract Introduction
Conclusions References
Tables Figures
J I
J I
Back Close
Full Screen Esc
Printer-friendly Version
Interactive Discussion
Discussion
Paper
|D
iscussionP
aper|
Discussion
Paper
|D
iscussionP
aper|
For the multi-model mean no big changes are projected in JanuaryndashFebruary This ispartly because of little change in precipitation (iii) and because the rainsnow line (iv)in these months is sufficiently low in the terrain today With the 500ndash600 m shift pro-jected with the RCP 85 80ndash90 of the area will still have temperatures low enoughfor snow The largest changes occur in MarchndashOctober when higher temperatures5
push the rainsnow line above large areas that receive snow today Increasing summerprecipitation (iii) causes the snowfall reduction in summer to be less than it would other-wise be The effect of higher temperatures is smaller on the APHRODITE snowfall thanon the MERRA reference snowfall (ii) as APHRODITE has very little summer snow-fall today The difference arises both from less precipitation (iii) in APHRODITE than10
MERRA today and from a higher rainsnow line (iv) in APHRODITE Note that as thechange in precipitation was defined as a fraction of the present-day value (Sect 23)the relative changes in APHRODITE and MERRA precipitation are equal
423 Upper Brahmaputra western part
In the westernmost part of the upper Brahmaputra Basin large snowfall changes are15
projected for the summer As cluster 5 in the Indus Basin Brahmaputrarsquos cluster 4 islimited to higher grounds Less than 6 lies outside of the 4000ndash6000 masl rangeThe cluster consists of Maquan He Yarlung Zangbo Dogxung ZangboMaiqu ZangboShang ChuYarlung ZangboNyang Lhasa HeRazheng Zangbo and Yamzho YumcoThe summer monsoon fully dominates the seasonal cycle of precipitation in this region20
(Fig 12a iii) resulting in a unimodal snow cycle with a maximum in JulyndashSeptember InAPHRODITE the seasonal cycle of snowfall is similar but less pronounced than in theMERRA reference The summer also sees the greatest reduction in CMIP5 projectedsnowfall both in absolute (ii) and relative (i) terms despite increasing summer precip-itation in all models (iii) The reason can be seen from the change in the rainsnow25
line elevation (iv) In the warmest months July and August elevation changes of 400ndash500 m would shift the rainsnow line from a level where at least 5ndash10 of the groundlies above the line to a level where only 1 of the area would receive precipitation as
463
TCD9 441ndash493 2015
Snowfall in theHimalayas an
uncertain future froma little-known past
E Viste and A Sorteberg
Title Page
Abstract Introduction
Conclusions References
Tables Figures
J I
J I
Back Close
Full Screen Esc
Printer-friendly Version
Interactive Discussion
Discussion
Paper
|D
iscussionP
aper|
Discussion
Paper
|D
iscussionP
aper|
snow In comparison with reference to MERRA the 300ndash400 m shift seen in JanuaryndashFebruary would cause only a small absolute change in snowfall (ii) because there islittle precipitation in these months (ii) and a small relative change (i) because therainsnow line would still be low in the terrain (iv) With reference to APHRODITE therelative snowfall change in winter would be larger than with reference to MERRA as5
temperatures today are higher resulting in a higher rainsnow line (iv)
424 Upper Brahmaputra eastern part
Like further west the Indian summer monsoon dominates the precipitation cycle in theeastern part of upper Brahmaputra (Fig 12b iii) but the seasonal cycle of snowfallpeaks in spring and fall (iii) This is also the time of the largest projected changes10
Cluster 3 in the Brahmaputra consists of the sub-basins Yarlung Zangbo2 NyangQu Yarlung Zangbo3 Yirsquoong ZangboParl Siyom Zaya QuLuhitDi About 70 of theground lies between 3000 and 6000 masl but there is also land almost at sea levelmainly in the Zaya QuLuhitDingba Qu sub-basin During summer most of the terrainlies below the rainsnow line (iv) In spring temperatures are lower than in summer15
and pre- monsoon precipitation is stronger in this part of the Himalayas than furtherwest in cluster 3 (Fig 12a iii vs Fig 12b iii) As a result MarchndashApril gets the mostsnow
Reductions in snowfall are projected for all months (ii) comparable in magnitude butlargest in the snow-rich spring and late summer The CMIP5 multi-model mean shows20
increasing or no change in precipitation in all months (Fig 12b iii) so the reductionin snowfall is due solely to higher temperatures The largest absolute reductions inApril and May occur with a 700ndash800 m shift in the rainsnow line elevation leaving30 more of the terrain in the rain The largest relative reduction in future snowfall areprojected for July and August (Fig 12b i) when the rainsnow line shifts so high that25
only the highest peaks can get precipitation as snow (iv) This would be despite thelowest changes in the rainsnow line only about 300 m in APHRODITE
464
TCD9 441ndash493 2015
Snowfall in theHimalayas an
uncertain future froma little-known past
E Viste and A Sorteberg
Title Page
Abstract Introduction
Conclusions References
Tables Figures
J I
J I
Back Close
Full Screen Esc
Printer-friendly Version
Interactive Discussion
Discussion
Paper
|D
iscussionP
aper|
Discussion
Paper
|D
iscussionP
aper|
43 Potential effects of reduced snowfall on water availability
With a few exceptions the CMIP5 multi-model mean precipitation change over the com-ing century is positive in all months in the upper Indus and Brahmaputra (Sect 42)Thus the projected reduction in snowfall is due solely to higher temperatures How-ever there is a large spread in precipitation projections among the models If tempera-5
tures increase as much as projected with the RCP 85 could any realistic precipitationchange in the HKH compensate and maintain present-day snowfall Results indicatethat this may happen in parts of the upper Indus but is out of the reach in the upperBrahmaputra As for water availability reduced snowfall may still cause more severeproblems in the Indus than in the Brahmaputra10
In cold regions where temperatures remain below freezing more winter precipita-tion may increase both the snow cover area the length of the snow season and theSWE (Collins et al 2013 Brutel-Vuilmet et al 2013 Raumlisaumlnen 2008 Gao et al 2012Wiltshire 2014) Raumlisaumlnen (2008) showed this to be the case in eastern Siberia andthe northernmost part of North America At the southern edge of the seasonal snow15
cover relevant for this study precipitation did not compensate and there was a reduc-tion in SWEWiltshire (2014) concluded that there would be small changes in snowfallin very cold and very warm regions of the HKH Snowfall in Nepal Bhutan and Hi-machal Pradesh where winters are warmer than in most parts of the range was mostvulnerable to higher temperatures The data presented in Sect 42 generally support20
the previous studiesOne of the reasons that precipitation does not compensate is that the highest pro-
jected precipitation increase in the HKH is seen in the summer when the temperaturetoday is so high that only the highest terrain is in the snow zone Shifting the rainsnowline upward even by only a few hundred meters reduces the area that receives snow25
greatly requiring very large increases in precipitation to compensate The summer isthe season with the largest relative reduction in snowfall in all the clusters described inSect 42 Except in the western upper Indus (cluster I4 Sect 421) which has very
465
TCD9 441ndash493 2015
Snowfall in theHimalayas an
uncertain future froma little-known past
E Viste and A Sorteberg
Title Page
Abstract Introduction
Conclusions References
Tables Figures
J I
J I
Back Close
Full Screen Esc
Printer-friendly Version
Interactive Discussion
Discussion
Paper
|D
iscussionP
aper|
Discussion
Paper
|D
iscussionP
aper|
little summer snowfall today the reduction in summer snowfall is notable in all clustersin the MERRA data in the Brahmaputra clusters also in APHRODITE
The largest change in snowfall is seen in the western part of the Brahmaputra (clus-ter B4 Sect 423) where a 400ndash500 m upward shift in the rainsnow line during sum-mer reduces the area with temperatures low enough for snowfall by a factor of 5ndash105
(Fig 12a iv values not shown) As a result the summer peak in the seasonal cycleof snowfall is replaced by a dip (Fig 12a ii) With an even distribution of precipitationwith elevation the area that still receives snow would have to receive 5ndash10 times asmuch precipitation to compensate for the lost snowfall Assuming more realisticallythat precipitation decreases above a certain height would require an even higher in-10
crease in precipitation In the model with the highest increase a doubling of the Julyprecipitation by the end of the century SWE is less than 25 of todayrsquos value in thatmonth (Fig 12a iii)
With a winter-dominated precipitation cycle the relative change in snowfall is smallerin the upper Indus than in the upper Brahmaputra Downscaling a high-emission sce-15
nario (A1B) in two CMIP3 models with a regional model Wiltshire (2014) found that bythe 2080s precipitation increased more than enough to compensate for higher temper-atures in the Karakoram Hindu Kush and Jammu and Kashmir in one of the modelsthe HadCM3 In the other model ECHAM5 precipitation increased less and snow-fall increased only in the higher parts of the Karakoram In our ensemble of CMIP520
models multi-model mean precipitation in the upper Indus clusters increases mainlyin the summer season when the inter-model spread is also the largest (Fig 11a iiiand 11b iii) Among the models 4ndash5 project increased winter precipitation in the upperIndus and in the uppermost cluster I5 this is associated with an increase in wintersnowfall (Fig 11b ii)25
Although it is the part of the HKH where snowfall is least reduced by increasingtemperatures (Fig 10b) the Karakoram and inner parts of the upper Indus may still bethe region where the changes have the largest impact on river run-off Compared tothe monsoon-dominated regions further east there is little summer precipitation and
466
TCD9 441ndash493 2015
Snowfall in theHimalayas an
uncertain future froma little-known past
E Viste and A Sorteberg
Title Page
Abstract Introduction
Conclusions References
Tables Figures
J I
J I
Back Close
Full Screen Esc
Printer-friendly Version
Interactive Discussion
Discussion
Paper
|D
iscussionP
aper|
Discussion
Paper
|D
iscussionP
aper|
much of the water in the rivers during summer is meltwater (Bookhagen and Burbank2010 Immerzeel et al 2010) As melting of snow and ice has not been analyzed inthis study we cannot quantify the effect of reduced snowmelt om river run-off but it isobvious that eventually reduced snowfall will lead to reduced melting In western partsof the HKH this may lead to changes in the seasonal cycle of the river flow5
As pointed out by Wiltshire (2014) increasing precipitation in the eastern HKH im-plies that water resources are likely to increase with climate change As snowfall andsnowmelt are both at maximum during summer (Rees and Collins 2006) meltwaterdoes not have the same importance for river flow in dry parts of the year as in the In-dus Reduced snowfall may reduce glaciers but ndash not considering potential changes in10
the amount of evaporation ndash there is no indication that there will be less water comingfrom the upper Brahmaputra
5 Concluding summary
In this study we have presented a suite of estimates of present-day snowfall in theIndus Ganges and Brahmaputra Basins and the changes in snowfall that would follow15
from CMIP5 projected changes in temperature and precipitation from 1971ndash2000 to2071ndash2100 The results show that if the temperature increases as much as in the RCP85 there will be much less snowfall despite increasing precipitation in most of theregion Limiting anthropogenic forcing to the RCP 26 level would still cause reductionsthough smaller20
Estimates of present-day snowfall based on a combination of temperature and pre-cipitation from reanalysis data and observations vary by factors of 2ndash4 The MERRAreanalysis gives higher estimates than TRMM 3B42 CRU TS and APHRODITE butthe spread is also large between the estimates based on the different observationallybased data sets This demonstrates the difficulties in assessing vulnerability to climate25
change in the region With limited knowledge of the current state future conditions arebound to be uncertain
467
TCD9 441ndash493 2015
Snowfall in theHimalayas an
uncertain future froma little-known past
E Viste and A Sorteberg
Title Page
Abstract Introduction
Conclusions References
Tables Figures
J I
J I
Back Close
Full Screen Esc
Printer-friendly Version
Interactive Discussion
Discussion
Paper
|D
iscussionP
aper|
Discussion
Paper
|D
iscussionP
aper|
Future changes in temperature and precipitation projected by climate models can stillprovide an indication of the relative change in snowfall With the RCP 85 the climatemodels project mean reductions in annual snowfall by 30ndash50 in the Indus Basin 50ndash60 in the Ganges Basin and 50ndash70 in the Brahmaputra Basin by 2071ndash2100 Withthe RCP 26 the corresponding reductions would be 10ndash20 in the Indus about 20 5
in the Ganges and 20ndash30 in the Brahmaputra The reductions are due to increasingtemperatures as the mean of the models show constant or increasing precipitationthroughout the year in most of the region
How much increasing temperatures reduce snowfall in a region depends on howmuch of the terrain that is below and above the freezing point today and on whether10
the terrain profile is such that the temperature increase transforms large areas fromsnow to rain zones With the RCP 85 the mean elevation where rain changes to snowndash the rainsnow line ndash creeps upward by 400ndash900 m in most of the region by 700ndash900 m
The largest relative change in snowfall is seen in the upper westernmost sub-basins15
of the Brahmaputra despite increasing precipitation and the lowest rainsnow line el-evation change (400ndash500 m) This is because a major part of this region is near thefreezing point today With the RCP 85 most of this region will have temperaturesabove freezing especially in the summer which is the wettest part of the year Theprojected reduction in annual snowfall is 65ndash75 20
In the upper Indus the effect of a warmer climate on snowfall is less extreme asmost of the terrain is high enough to have temperatures sufficiently far below freezingtoday Winter and spring brings most of the precipitation and the projected 600ndash800 mchange in the rainsnow line elevation during these seasons would leave most of theterrain below the freezing point Still a 20ndash40 reduction in annual snowfall is pro-25
jected with the RCP 85The range of our estimates of present-day snowfall illustrates how little that is known
about conditions that influence the availability of drinking water in some of the mostdensely populated parts of the world There is both a scientific and a societal need
468
TCD9 441ndash493 2015
Snowfall in theHimalayas an
uncertain future froma little-known past
E Viste and A Sorteberg
Title Page
Abstract Introduction
Conclusions References
Tables Figures
J I
J I
Back Close
Full Screen Esc
Printer-friendly Version
Interactive Discussion
Discussion
Paper
|D
iscussionP
aper|
Discussion
Paper
|D
iscussionP
aper|
for more information about precipitation in the HKH As a full-scale long-time observa-tional program covering all parts of the Himalayan range is not a likely possibility theonly hope for improved future knowledge of Himalayan snowfall lies in the improvementof satellite data and regional climate models
The Supplement related to this article is available online at5
doi105194tcd-9-441-2015-supplement
Acknowledgements This work has been carried out with support from the University of Bergenthe NORINDIA and SNOWHIM projects funded by The Research Council of Norway and theCentre for Climate Dynamics at the Bjerknes Centre for Climate Research We acknowledgethe World Climate Research Programmersquos Working Group on Coupled Modelling which is re-10
sponsible for CMIP and we thank the climate modeling groups listed in Table 3 of this paper forproducing and making available their model output For CMIP the US Department of EnergyrsquosProgram for Climate Model Diagnosis and Intercomparison provides coordinating support andled development of software infrastructure in partnership with the Global Organization for EarthSystem Science Portals15
References
Akhtar M Ahmad N and Booij M J The impact of climate change on the water resourcesof Hindukush-Karakorum-Himalaya region under different glacier coverage scenarios J Hy-drol 355 148ndash163 2008
Anders A M Roe G H Hallet B Montgomery D R Finnegan N J and Putkonen J20
Spatial patterns of precipitation and topography in the Himalaya in Tectonics Climate andLandscape Evolution Geological Society of America Special Paper edited by Willett S DHovius N Brandon M T and Fisher D Geological Society of America Boulder CO USA39ndash53 2006
469
TCD9 441ndash493 2015
Snowfall in theHimalayas an
uncertain future froma little-known past
E Viste and A Sorteberg
Title Page
Abstract Introduction
Conclusions References
Tables Figures
J I
J I
Back Close
Full Screen Esc
Printer-friendly Version
Interactive Discussion
Discussion
Paper
|D
iscussionP
aper|
Discussion
Paper
|D
iscussionP
aper|
Archer DR and Fowler HJ Spatial and temporal variations in precipitation in the UpperIndus Basin global teleconnections and hydrological implications Hydrol Earth Syst Sci8 47ndash61 doi105194hess-8-47-2004 2004
Bhutiyani M R Kale V S and Pawar N J Long-term trends in maximum minimum andmean annual air temperatures across the Northwestern Himalaya during the twentieth cen-5
tury Climatic Change 85 159ndash177 doi101007s10584-006-9196-1 2007Bhutiyani M R Kale V S and Pawar N J Climate change and the precipitation variations in
the northwestern Himalaya 1866ndash2006 Int J Climatol 30 535ndash548 doi101002joc19202010
Bookhagen B and Burbank D W Topography relief and TRMM-derived rainfall variations10
along the Himalaya Geophys Res Lett 33 L08405 doi1010292006GL026037 2006Bookhagen B and Burbank D W Toward a complete Himalayan hydrological budget spa-
tiotemporal distribution of snowmelt and rainfall and their impact on river discharge J Geo-phys Res 115 F03019 doi1010292009jf001426 2010
Franco B Fettweis X and Erpicum M Future projections of the Greenland ice sheet energy15
balance driving the surface melt The Cryosphere 7 1ndash18 doi105194tc-7-1-2013 2013Butt M J Characteristics of snow cover in the Hindukush Karakoram and Himalaya region
using Landsat satellite data Hydrol Process 10 3689ndash3698 doi101002hyp8375 2012Byun K and Choi M Uncertainty of snow water equivalent retrieved from AMSR-E brightness
temperature in northeast Asia Hydrol Process 28 12 doi101002hyp9846 201420
Chaturvedi R K Joshi J Jayaraman M Bala G and Ravindranath N H Multi-modelclimate change projections for India under representative concentration pathways Curr SciIndia 103 791ndash802 2012
Christensen J H Krishna Kumar K Aldrian E An S-I Cavalcanti I F A Castro Md Dong W Goswami P Hall A Kanyanga J K Kitoh A Kossin J Lau N-C Ren-25
wick J Stephenson D B Xie S-P and Zhou T Climate phenomena and their relevancefor future regional climate change in Climate Change 2013 The Physical Science BasisContribution of Working Group I to the Fifth Assessment Report of the Intergovernmen-tal Panel on Climate Change edited by Stocker T F Qin D Plattner G-K Tignor MAllen S K Boschung J Nauels A Xia Y Bex V and Midgley P M Cambridge Univer-30
sity Press Cambridge UK and New York NY USA 92 2013Collins M Knutti R Arblaster J Dufresne J-L Fichefet T Friedlingstein P Gao X
Gutowski W J Johns T Krinner G Shongwe M Tebaldi C Weaver A J and
470
TCD9 441ndash493 2015
Snowfall in theHimalayas an
uncertain future froma little-known past
E Viste and A Sorteberg
Title Page
Abstract Introduction
Conclusions References
Tables Figures
J I
J I
Back Close
Full Screen Esc
Printer-friendly Version
Interactive Discussion
Discussion
Paper
|D
iscussionP
aper|
Discussion
Paper
|D
iscussionP
aper|
Wehner M Long-term climate change projections commitments and irreversibility in Cli-mate Change 2013 The Physical Science Basis Contribution of Working Group I to theFifth Assessment Report of the Intergovernmental Panel on Climate Change edited byStocker T F Qin D Plattner G-K Tignor M Allen S K Boschung J Nauels AXia Y Bex V and Midgley P M Cambridge University Press Cambridge UK and New5
York NY USA 108 2013Cook E R Palmer J G Ahmed M Woodhouse C A Fenwick P Zafar M U Wahab M
and Khan N Five centuries of Upper Indus River flow from tree rings J Hydrol 486 365ndash375 doi101016jjhydrol201302004 2013
Dai A Temperature and pressure dependence of the rain-snow phase transition over land and10
ocean Geophys Res Lett 35 L12802 doi1010292008gl033295 2008Fowler H J and Archer D R Conflicting signals of climatic change in the Upper Indus Basin
J Climate 19 4276ndash4293 doi101175jcli38601 2006Gao J Williams M W Fu X Wang G and Gong T Spatiotemporal distribution of snow
in eastern Tibet and the response to climate change Remote Sens Environ 121 1ndash915
doi101016jrse201201006 2012Gardelle J Berthier E and Arnaud Y Slight mass gain of Karakoram glaciers in the
early twenty-first century ndash Supplement Nature Geosci 5 322ndash325 doi101038ngeo14502012
Guhathakurta P and Rajeevan M Trends in the rainfall pattern over India Int J Climatol20
28 1453ndash1469 doi101002joc1640 2008Harris I Jones P D Osborn T J and Lister D H Updated high-resolution grids of
monthly climatic observations ndash the CRU TS310 Dataset Int J Climatol 34 623ndash642doi101002joc3711 2014
Hartmann H and Andresky L Flooding in the Indus River basin ndash a spa-25
tiotemporal analysis of precipitation records Global Planet Change 107 25ndash35doi101016jgloplacha201304002 2013
Hastings D and Dunbar P Development amp Assessment of the Global Land One-km BaseElevation Digital Elevation Model (GLOBE) ISPRS Commission IV Symposium on GIS ndashBetween Visions and Applications Stuttgart Germany 7ndash10 September 199830
Hewitt K The Karakoram anomaly Glacier expansion and the ldquoelevation ef-fectrdquo Karakoram Himalaya Mt Res Dev 25 332ndash340 doi1016590276-4741(2005)025[0332TKAGEA]20CO2 2005
471
TCD9 441ndash493 2015
Snowfall in theHimalayas an
uncertain future froma little-known past
E Viste and A Sorteberg
Title Page
Abstract Introduction
Conclusions References
Tables Figures
J I
J I
Back Close
Full Screen Esc
Printer-friendly Version
Interactive Discussion
Discussion
Paper
|D
iscussionP
aper|
Discussion
Paper
|D
iscussionP
aper|
Huffman G J Adler R F Bolvin D T Gu G Nelkin E J Bowman K P Hong YStocker E F and Wolff D B The TRMM Multisatellite Precipitation Analysis (TMPA) quasi-global multiyear combined-sensor precipitation estimates at fine scales J Hydrometeorol8 38ndash55 2007
Immerzeel W Historical trends and future predictions of climate variability in the Brahmaputra5
basin Int J Climatol 28 243ndash254 doi101002joc1528 2008Immerzeel W W Droogers P de Jong S M and Bierkens M F P Large-scale monitoring
of snow cover and runoff simulation in Himalayan river basins using remote sensing RemoteSens Environ 113 40ndash49 doi101016jrse200808010 2009
Immerzeel W W van Beek L P H and Bierkens M F P Climate change will affect the10
asian water towers Science 328 1382ndash1385 doi101126science1183188 2010Ines A V M and Hansen J W Bias correction of daily GCM rainfall for crop simulation
studies Agr Forest Meteorol 138 44ndash53 doi101016jagrformet200603009 2006Jain S K Goswami A and Saraf A K Role of elevation and aspect in snow distribution
in western Himalaya Water Resour Manag 23 71ndash83 doi101007s11269-008-9265-515
2009Krakauer N Pradhanang S Lakhankar T and Jha A Evaluating satellite products for
precipitation estimation in mountain regions a case study for Nepal Remote Sensing 54107ndash4123 2013
Krishna A P Snow and glacier cover assessment in the high mountains of Sikkim Himalaya20
Hydrol Process 19 2375ndash2383 doi101002hyp5890 2005Kulkarni A V Rathore B P Singh S K and Ajai Distribution of seasonal snow cover in cen-
tral and western Himalaya Ann Glaciol 51 123ndash128 doi1031891727564107913864452010
Kumar V Rao Y S Venkataraman G Sarwade R N and Mani S Analysis of Aqua25
AMSR-E Derived Snow Water Equivalent over Himalayan Snow Covered Regions Geo-science and Remote Sensing Symposium Denver CO USA 31 Julyndash4 August 2006
Kaumlaumlb A Berthier E Nuth C Gardelle J and Arnaud Y Contrasting patterns of earlytwenty-first-century glacier mass change in the Himalayas Nature 488 495ndash498 availableat httpwwwnaturecomnaturejournalv488n7412absnature11324html ndash Supplement30
2012Lehner B Verdin K and Jarvis A New global hydrography derived from spaceborne eleva-
tion data Eos T Am Geophys Un 89 93ndash94 doi1010292008EO100001 2008
472
TCD9 441ndash493 2015
Snowfall in theHimalayas an
uncertain future froma little-known past
E Viste and A Sorteberg
Title Page
Abstract Introduction
Conclusions References
Tables Figures
J I
J I
Back Close
Full Screen Esc
Printer-friendly Version
Interactive Discussion
Discussion
Paper
|D
iscussionP
aper|
Discussion
Paper
|D
iscussionP
aper|
MacQueen J Some Methods for Classification and Analysis of Multivariate ObservationsFifth Berkeley Symposium on Mathematical Statistics and Probability Berkeley California21 Junendash18 July 1967
Meacuteneacutegoz M Galleacutee H and Jacobi H W Precipitation and snow cover in the Himalayafrom reanalysis to regional climate simulations Hydrol Earth Syst Sci 17 3921ndash39365
doi105194hess-17-3921-2013 2013Menon A Levermann A Schewe J Lehmann J and Frieler K Consistent increase in
Indian monsoon rainfall and its variability across CMIP-5 models Earth Syst Dynam 4287ndash300 doi105194esd-4-287-2013 2013
Moss R H Edmonds J A Hibbard K A Manning M R Rose S K van Vuuren D P10
Carter T R Emori S Kainuma M Kram T Meehl G A Mitchell J F B Naki-cenovic N Riahi K Smith S J Stouffer R J Thomson A M Weyant J P andWilbanks T J The next generation of scenarios for climate change research and assess-ment Nature 463 747ndash756 2010
Negi H S Kulkarni A V and Semwal B S Estimation of snow cover distribution in Beas15
basin Indian Himalaya using satellite data and ground measurements J Earth Syst Sci118 525ndash538 doi101007s12040-009-0039-0 2009
Palazzi E v Hardenberg J and Provenzale A Precipitation in the Hindu-Kush Karako-ram Himalaya observations and future scenarios J Geophys Res-Atmos 118 85ndash100doi1010292012JD018697 201320
Rees H G and Collins D N Regional differences in response of flow in glacier-fed Himalayanrivers to climatic warming Hydrol Process 20 2157ndash2169 doi101002hyp6209 2006
Rienecker M M Suarez M J Gelaro R Todling R Bacmeister J Liu EBosilovich M G Schubert S D Takacs L Kim G-K Bloom S Chen J Collins DConaty A da Silva A Gu W Joiner J Koster R D Lucchesi R Molod A Owens T25
Pawson S Pegion P Redder C R Reichle R Robertson F R Ruddick A GSienkiewicz M and Woollen J MERRA NASArsquos Modern-Era Retrospective Analysis forResearch and Applications J Climate 24 3624ndash3648 doi101175JCLI-D-11-0001512011
Rikiishi K and Nakasato H Height dependence of the tendency for reduction in seasonal30
snow cover in the Himalaya and the Tibetan Plateau region 1966ndash2001 Ann Glaciol 43369ndash377 doi103189172756406781811989 2006
473
TCD9 441ndash493 2015
Snowfall in theHimalayas an
uncertain future froma little-known past
E Viste and A Sorteberg
Title Page
Abstract Introduction
Conclusions References
Tables Figures
J I
J I
Back Close
Full Screen Esc
Printer-friendly Version
Interactive Discussion
Discussion
Paper
|D
iscussionP
aper|
Discussion
Paper
|D
iscussionP
aper|
Raumlisaumlnen J Warmer climate less or more snow Clim Dynam 30 307ndash319doi101007s00382-007-0289-y 2008
Schaner N Voisin N Nijssen B and Lettenmaier D P The contribution of glacier melt tostreamflow Environ Res Lett 7 034029 doi1010881748-932673034029 2012
Scherler D Bookhagen B and Strecker M R Spatially variable response of Himalayan5
glaciers to climate change affected by debris cover Nature Geosci 4 156ndash159 availableat httpwwwnaturecomngeojournalv4n3absngeo1068html ndash Supplement 2011
Sharif M Archer D R Fowler H J and Forsythe N Trends in timing and magnitude offlow in the Upper Indus Basin Hydrol Earth Syst Sci 17 1503ndash1516 doi105194hess-17-1503-2013 201310
Shekhar M S Chand H Kumar S Srinivasan K and Ganju A Climate-change studiesin the western Himalaya Ann Glaciol 51 105ndash112 doi1031891727564107913865082010
Shrestha A B Wake C P Mayewski P A and Dibb J E Maximum tempera-ture trends in the Himalaya and its vicinity an analysis based on temperature records15
from Nepal for the period 1971ndash94 J Climate 12 2775ndash2786 doi1011751520-0442(1999)012lt2775MTTITHgt20CO2 1999
Shrestha A B Wake C P Dibb J E and Mayewski P A Precipitation fluctuations in theNepal Himalaya and its vicinity and relationship with some large scale climatological parame-ters Int J Climatol 20 317ndash327 doi101002(SICI)1097-0088(20000315)203lt317AID-20
JOC476gt30CO2-G 2000Siderius C Biemans H Wiltshire A Rao S Franssen W H P Kumar P Gosain A K
van Vliet M T H and Collins D N Snowmelt contributions to discharge of the GangesSci Total Environ Supplement 468ndash469 9 doi101016jscitotenv201305084 2013
Singh P Jain S K and Kumar N Estimation of snow and glacier-melt contribution to the25
Chenab River Western Himalaya Mt Res Dev 17 49ndash56 doi1023073673913 1997Singh P Kumar V Thomas T and Arora M Changes in rainfall and relative hu-
midity in river basins in northwest and central India Hydrol Process 22 2982ndash2992doi101002hyp6871 2008
Sontakke N A Singh N and Singh H N Instrumental period rainfall series of the Indian30
region (AD 1813ndash2005) revised reconstruction update and analysis Holocene 18 1055ndash1066 doi1011770959683608095576 2008
474
TCD9 441ndash493 2015
Snowfall in theHimalayas an
uncertain future froma little-known past
E Viste and A Sorteberg
Title Page
Abstract Introduction
Conclusions References
Tables Figures
J I
J I
Back Close
Full Screen Esc
Printer-friendly Version
Interactive Discussion
Discussion
Paper
|D
iscussionP
aper|
Discussion
Paper
|D
iscussionP
aper|
Sperber K R Annamalai H Kang I S Kitoh A Moise A Turner A Wang B andZhou T The Asian summer monsoon an intercomparison of CMIP5 vs CMIP3 simulationsof the late 20th century Clim Dynam 41 2711ndash2744 doi101007s00382-012-1607-62013
Tahir A A Chevallier P Arnaud Y and Ahmad B Snow cover dynamics and hydrological5
regime of the Hunza River basin Karakoram Range Northern Pakistan Hydrol Earth SystSci 15 2275ndash2290 doi105194hess-15-2275-2011 2011a
Tahir A A Chevallier P Arnaud Y Neppel L and Ahmad B Modeling snowmelt-runoffunder climate scenarios in the Hunza River basin Karakoram Range Northern Pakistan JHydrol 409 104ndash117 doi101016jjhydrol201108035 2011b10
Taylor K E Stouffer R J and Meehl G A An overview of CMIP5 and the experimentdesign B Am Meteorol Soc 93 14 doi101175BAMS-D-11-000941 2011
Tedesco M and Narvekar P S Assessment of the NASA AMSR-E SWE product IEEE J SelTop Appl 3 141ndash159 doi101109JSTARS20102040462 2010
Teutschbein C and Seibert J Bias correction of regional climate model simulations for hydro-15
logical climate-change impact studies review and evaluation of different methods J Hydrol456ndash457 12ndash29 doi101016jjhydrol201205052 2012
Turner A G and Annamalai H Climate change and the South Asian summer monsoon NatClim Change 2 587ndash595 2012
van Vuuren D Edmonds J Kainuma M Riahi K Thomson A Hibbard K Hurtt G20
Kram T Krey V Lamarque J-F Masui T Meinshausen M Nakicenovic N Smith Sand Rose S The representative concentration pathways an overview Climatic Change109 26 doi101007s10584-011-0148-z 2011
Wang A and Zeng X Development of global hourly 05-degree land surface air temperaturedatasets J Climate 26 7676ndash7691 doi101175JCLI-D-12-006821 201325
Wiltshire A J Climate change implications for the glaciers of the Hindu Kush Karakoram andHimalayan region The Cryosphere 8 941ndash958 doi105194tc-8-941-2014 2014
Winiger M Gumpert M and Yamout H KarakorumndashHindukushndashwestern Himalaya assess-ing high-altitude water resources Hydrol Process 19 2329ndash2338 doi101002hyp5887200530
Xu X Lu C Shi X and Gao S World water tower An atmospheric perspective GeophysRes Lett 35 L20815 doi1010292008GL035867 2008a
475
TCD9 441ndash493 2015
Snowfall in theHimalayas an
uncertain future froma little-known past
E Viste and A Sorteberg
Title Page
Abstract Introduction
Conclusions References
Tables Figures
J I
J I
Back Close
Full Screen Esc
Printer-friendly Version
Interactive Discussion
Discussion
Paper
|D
iscussionP
aper|
Discussion
Paper
|D
iscussionP
aper|
Xu Z X Gong T L and Li J Y Decadal trend of climate in the Tibetan Plateaumdashregionaltemperature and precipitation Hydrol Process 22 3056ndash3065 doi101002hyp68922008b
Yasutomi N Hamada A and Akiyo Y Development of a Long-term Daily Gridded Temper-ature Dataset and its Application to RainSnow Discrimination of Daily Precipitation Global5
Environ Res15 165ndash172 2011Yatagai A Kamiguchi K Arakawa O Hamada A Yasutomi N and Kitoh A APHRODITE
Constructing a Long-Term Daily Gridded Precipitation Dataset for Asia Based on a DenseNetwork of Rain Gauges B Am Meteorol Soc 93 1401ndash1415 doi101175BAMS-D-11-001221 201210
You Q Kang S Aguilar E and Yan Y Changes in daily climate extremes in the east-ern and central Tibetan Plateau during 1961ndash2005 J Geophys Res-Atmos 113 D07101doi1010292007JD009389 2008
476
TCD9 441ndash493 2015
Snowfall in theHimalayas an
uncertain future froma little-known past
E Viste and A Sorteberg
Title Page
Abstract Introduction
Conclusions References
Tables Figures
J I
J I
Back Close
Full Screen Esc
Printer-friendly Version
Interactive Discussion
Discussion
Paper
|D
iscussionP
aper|
Discussion
Paper
|D
iscussionP
aper|
Table 1 Combinations of data types used in snowfall estimates T temperature P precipita-tion f (P T ) indicates that snowfall is calculated as a function of P and T
Precipitation Temperature Snowfall Time
MERRA MERRA PresentMERRA reference MERRA Terrain-adjusted MERRA f (P T ) PresentMERRA T2m MERRA MERRA T2m f (P T ) PresentBias-corrected with obs T MERRA Bias-corr terrain-adj MERRA f (P T ) PresentBias-corrected with obs P Bias-corr MERRA Terrain-adjusted MERRA f (P T ) PresentBias-corrected with obs T P Bias-corr MERRA Bias-corr terrain-adj MERRA f (P T ) PresentCMIP5 T MERRA Terrain-adj MERRA+∆T f (P T ) FutureCMIP5 P MERRAtimes∆P Terrain-adj MERRA f (P T ) FutureCMIP5 T P MERRAtimes∆P Terrain-adj MERRA+∆T f (P T ) FutureBias-corr CMIP5 T Bias-corr MERRA Bias-corr terrain-adj MERRA+∆T f (P T ) FutureBias-corr CMIP5 P Bias-corr MERRAtimes∆P Bias-corr terrain-adj MERRA f (P T ) FutureBias-corr CMIP5 T P Bias-corr MERRAtimes∆P Bias-corr terrain-adj MERRA+∆T f (P T ) Future
477
TCD9 441ndash493 2015
Snowfall in theHimalayas an
uncertain future froma little-known past
E Viste and A Sorteberg
Title Page
Abstract Introduction
Conclusions References
Tables Figures
J I
J I
Back Close
Full Screen Esc
Printer-friendly Version
Interactive Discussion
Discussion
Paper
|D
iscussionP
aper|
Discussion
Paper
|D
iscussionP
aper|
Table 2 Data sets used in calculations of present-day snowfall
Product Time Hor res Description
MERRA 1979ndash2012 05 lat 07 lon Hourly atmospheric reanalysis data(Rienecker et al 2011)
APHRODITEV1204V1101
1979ndash2007 025 Daily temperature andprecipitation basedon observations (Yatagai et al 2012Yasutomi et al 2011)
CRU TS 320 1979ndash2011 05 Monthly temperature and precipitationbased on observations(Harris et al 2014)
TRMM 3B42 V7 1998ndash2012 05 3 hourly satellite-based precipitation(Huffman et al 2007)
GLOBE 1 km Topography data set(Hastings and Dunbar 1998)
478
TCD9 441ndash493 2015
Snowfall in theHimalayas an
uncertain future froma little-known past
E Viste and A Sorteberg
Title Page
Abstract Introduction
Conclusions References
Tables Figures
J I
J I
Back Close
Full Screen Esc
Printer-friendly Version
Interactive Discussion
Discussion
Paper
|D
iscussionP
aper|
Discussion
Paper
|D
iscussionP
aper|
Table 3 CMIP5 models and RCPs used (x) in calculations of 2071ndash2100 snowfall
Model RCP 26 RCP 85
CanESM2 x xCCSM4 x xCESM1-CAM5 xCNRM-CM5 xGFDL-CM3 x xGFDL-ESM2G xGISS-E2-R x xHadGEM2-ES x xIPSL-CM5A-LR x xIPSL-CM5A-MR x xMIROC-ESM x xMIROC-ESM-CHEM x xMIROC5 x xMRI-CGCM3 x xNorESM1-M x xNorESM1-ME x x
479
TCD9 441ndash493 2015
Snowfall in theHimalayas an
uncertain future froma little-known past
E Viste and A Sorteberg
Title Page
Abstract Introduction
Conclusions References
Tables Figures
J I
J I
Back Close
Full Screen Esc
Printer-friendly Version
Interactive Discussion
Discussion
Paper
|D
iscussionP
aper|
Discussion
Paper
|D
iscussionP
aper|
Table 4 Annual snowfall estimates for the Indus Ganges and Brahmaputra Basins S snow[km3 SWE] P precipitation [km3] S and P percent of MERRA reference snowfall andMERRA precipitation First horizontal section no bias-corrections Second third and fourthsection bias-corrections with T P and both T and P
Indus Basin Ganges Basin Brahmaputra BasinInput S S P P S S P P S S P P
MERRA reference 148 100 422 100 54 100 1147 100 119 100 733 100MERRA 166 112 422 100 49 90 1147 100 129 109 733 100MERRA T2m 154 104 422 100 42 77 1147 100 109 92 733 100T APHRODITE 113 76 422 100 30 55 1147 100 74 62 733 100T CRU 126 85 422 100 81 151 1147 100 109 92 733 100P APHRODITE 66 44 315 75 22 42 1020 89 35 30 567 77P TRMM 72 49 404 96 31 57 1244 108 63 54 835 114P CRU 84 56 398 94 30 56 1100 96 53 45 716 98P T APHRODITE 49 33 315 75 12 22 1020 89 20 17 567 77P APHRODITE T CRU 62 42 315 75 34 63 1020 89 33 28 567 77P TRMM T APHRODITE 54 36 390 92 18 34 1195 104 39 33 815 111P TRMM T CRU 65 44 403 96 46 85 1254 109 58 49 813 111P CRU T APHRODITE 65 44 395 94 17 31 1106 96 31 26 718 98P T CRU 80 54 398 94 41 75 1100 96 49 42 716 98
480
TCD9 441ndash493 2015
Snowfall in theHimalayas an
uncertain future froma little-known past
E Viste and A Sorteberg
Title Page
Abstract Introduction
Conclusions References
Tables Figures
J I
J I
Back Close
Full Screen Esc
Printer-friendly Version
Interactive Discussion
Discussion
Paper
|D
iscussionP
aper|
Discussion
Paper
|D
iscussionP
aper|
Table 5 Projected change in annual snowfall from 1971ndash2000 to 2071ndash2100 with referenceto terrain-adjusted MERRA and APHRODITE ∆Sabs [km3] is the absolute change ∆Srel [] isthe relative change compared to the present-day MERRA reference snowfall Values are pre-sented with the CMIP5 multi-model mean as the main value and the span of individual modelsin brackets (MERRA only) ∆TP indicates that changes in both temperature and precipitationare included whereas ∆P and ∆T denotes changes only in precipitation or temperature re-spectively
Indus Ganges Brahmaputra∆Sabs [km3] ∆Srel [] ∆Sabs [km3] ∆Srel [] ∆Sabs [km3] ∆Srel []
RCP 85 MERRA ∆TP minus49 [minus83minus9] minus33 [minus56minus6] minus27 [minus36minus14] minus50 [minus66minus25] minus64 [minus93minus39] minus54 [minus79minus33]MERRA ∆T minus51 [minus67minus34] minus34 [minus45minus23] minus28 [minus34minus21] minus51 [minus64minus39] minus71 [minus87minus53] minus60 [minus73minus44]MERRA ∆P 5 [minus2544] 4 [minus1730] 7 [minus417] 12 [minus731] 20 [minus1750] 17 [minus1542]
APHRO ∆TP minus25 minus51 minus7 minus56 minus13 minus67APHRO ∆T minus25 minus52 minus7 minus57 minus14 minus71APHRO ∆P 1 1 1 6 3 16
RCP 26 MERRA ∆TP minus15 [minus406] minus10 [minus274] minus10 [minus19minus3] minus18 [minus36minus5] minus25 [minus42minus5] minus21 [minus35minus4]MERRA ∆T minus18 [minus27minus9] minus12 [minus18minus6] minus12 [minus21minus6] minus21 [minus39minus11] minus29 [minus47minus13] minus25 [minus40minus11]MERRA ∆P 3 [minus1825] 2 [minus1217] 3 [minus210] 5 [minus419] 7 [minus828] 6 [minus623]
APHRO ∆TP minus9 minus18 minus2 minus20 minus6 minus29APHRO ∆T minus10 minus19 minus3 minus23 minus6 minus32APHRO ∆P 1 1 0 4 1 6
481
TCD9 441ndash493 2015
Snowfall in theHimalayas an
uncertain future froma little-known past
E Viste and A Sorteberg
Title Page
Abstract Introduction
Conclusions References
Tables Figures
J I
J I
Back Close
Full Screen Esc
Printer-friendly Version
Interactive Discussion
Discussion
Paper
|D
iscussionP
aper|
Discussion
Paper
|D
iscussionP
aper|
Figure 1 Map of the region with the Indus Ganges and Brahmaputra basins outlined in whiteThinner outlines are national borders Background NASA Visible Earth
482
TCD9 441ndash493 2015
Snowfall in theHimalayas an
uncertain future froma little-known past
E Viste and A Sorteberg
Title Page
Abstract Introduction
Conclusions References
Tables Figures
J I
J I
Back Close
Full Screen Esc
Printer-friendly Version
Interactive Discussion
Discussion
Paper
|D
iscussionP
aper|
Discussion
Paper
|D
iscussionP
aper|
0
400 mm
Months 1ndash12
SP
I1
I2I3
I5I4
G1
G2G3
G4
B1
B2
B3B4
Viste amp SortebergFigure 2
Figure 2 Monthly mean MERRA precipitation and MERRA reference snowfall in sub-basinclusters of the Indus (I) Ganges (G) and Brahmaputra (B) Total bar height MERRA precip-itation (P) [mm] Colored bars snowfall (S) [mm SWE] based on MERRA precipitation andterrain-adjusted MERRA temperature in the region with the same color Cluster 1 in eachbasin is considered snow-free and the seasonal cycles are not shown
483
TCD9 441ndash493 2015
Snowfall in theHimalayas an
uncertain future froma little-known past
E Viste and A Sorteberg
Title Page
Abstract Introduction
Conclusions References
Tables Figures
J I
J I
Back Close
Full Screen Esc
Printer-friendly Version
Interactive Discussion
Discussion
Paper
|D
iscussionP
aper|
Discussion
Paper
|D
iscussionP
aper|
a) MERRA reference b) APHRODITE c) APHRODITE ndash MERRA ref
30 km3
20100-10-20-30
Viste amp SortebergFigure 3
Figure 3 The effect of bias-corrections with APHRODITE temperature and precipitation(a) MERRA reference snowfall (b) Snowfall based on bias-corrections with APHRODITE(c) APHRODITE (b) minus MERRA reference snowfall (a)
484
TCD9 441ndash493 2015
Snowfall in theHimalayas an
uncertain future froma little-known past
E Viste and A Sorteberg
Title Page
Abstract Introduction
Conclusions References
Tables Figures
J I
J I
Back Close
Full Screen Esc
Printer-friendly Version
Interactive Discussion
Discussion
Paper
|D
iscussionP
aper|
Discussion
Paper
|D
iscussionP
aper|
Figure 4 Difference between MERRA precipitation and observation-based data (a) Annualmean MERRA precipitation (b c and d) Annual mean MERRA precipitation bias-correctedwith observations APHRODITE CRU TS and TRMM 3B42 For each data set the small insetmaps show the observations minus MERRA
485
TCD9 441ndash493 2015
Snowfall in theHimalayas an
uncertain future froma little-known past
E Viste and A Sorteberg
Title Page
Abstract Introduction
Conclusions References
Tables Figures
J I
J I
Back Close
Full Screen Esc
Printer-friendly Version
Interactive Discussion
Discussion
Paper
|D
iscussionP
aper|
Discussion
Paper
|D
iscussionP
aper|
Biasminuscorrected minus original MERRA temperature [C]
minus15
minus10
minus5
0
5
10
Biasminuscorrected minus original MERRA temperature [C]
minus15
minus10
minus5
0
5
10
MERRA mean temperature [C] 1979minus2007
minus15
minus10
minus5
0
5
10
15
20
25
30a) MERRA b) APHRODITE ndash MERRA c) CRU ndash MERRA
-10
0
10
20
30degC
minus15
minus10
minus5
0
5
10
15degC
Viste amp SortebergFigure 5
Figure 5 Difference between MERRA temperature and observation-based data (a) Annualmean MERRA temperature (b and c) Annual mean MERRA temperature bias-corrected withobservations APHRODITE and CRU TS
486
TCD9 441ndash493 2015
Snowfall in theHimalayas an
uncertain future froma little-known past
E Viste and A Sorteberg
Title Page
Abstract Introduction
Conclusions References
Tables Figures
J I
J I
Back Close
Full Screen Esc
Printer-friendly Version
Interactive Discussion
Discussion
Paper
|D
iscussionP
aper|
Discussion
Paper
|D
iscussionP
aper|
Jan Apr
Jul Oct
a)
c)
b)
d)
15degC
10
5
0
ndash5
ndash10
ndash15
200 mm16012080400ndash40ndash80ndash120ndash160ndash200
Viste amp SortebergFigure 6
Figure 6 Regions where increasing temperatures are likely to cause a shift from snow to rainData monthly mean MERRA temperature terrain-adjusted to a 4 km GLOBE grid Red temper-ature between minus5 and 0 considered critical Small inset maps monthly MERRA precipitationin the critical zones
487
TCD9 441ndash493 2015
Snowfall in theHimalayas an
uncertain future froma little-known past
E Viste and A Sorteberg
Title Page
Abstract Introduction
Conclusions References
Tables Figures
J I
J I
Back Close
Full Screen Esc
Printer-friendly Version
Interactive Discussion
Discussion
Paper
|D
iscussionP
aper|
Discussion
Paper
|D
iscussionP
aper|
1 2 3 4 5 6 7 8 9 10 11 12Month
∆T [ordm
C]
a) Indus
0
1
2
3
4
5
6
7
8
9
10
b) Ganges∆T
[ordmC
]
1 2 3 4 5 6 7 8 9 10 11 12Month
1
2
3
4
5
6
7
8
0 0
c) Brahmaputra
∆T [ordm
C]
1 2 3 4 5 6 7 8 9 10 11 12Month
1
2
3
4
5
6
7
8
9
10 RCP 85RCP 85 meanRCP 26RCP 26 mean
Viste amp SortebergFigure 7
Figure 7 Projected future temperature change from 1971ndash2000 to 2071ndash2100 in the (a) In-dus (b) Ganges and (c) Brahmaputra Basins Thin lines show the individual CMIP5 modelsstronger lines the multi-model mean
488
TCD9 441ndash493 2015
Snowfall in theHimalayas an
uncertain future froma little-known past
E Viste and A Sorteberg
Title Page
Abstract Introduction
Conclusions References
Tables Figures
J I
J I
Back Close
Full Screen Esc
Printer-friendly Version
Interactive Discussion
Discussion
Paper
|D
iscussionP
aper|
Discussion
Paper
|D
iscussionP
aper|
1 2 3 4 5 6 7 8 9 10 11 12Month
[km
3 ]
a) Indus
0
20
40
60
80
100
120
140
b) Ganges[k
m3 ]
1 2 3 4 5 6 7 8 9 10 11 12Month
0
100
200
300
400
500
600
700
c) Brahmaputra
[km
3 ]
1 2 3 4 5 6 7 8 9 10 11 12Month
0
50
100
150
200
250
MERRA ref
2071ndash2100
1979ndash2008
RCP 85RCP 85 meanRCP 26RCP 26 mean
Viste amp SortebergFigure 8
Figure 8 Projected future precipitation in the (a) Indus (b) Ganges and (c) BrahmaputraBasins Gray bars MERRA 1979ndash2008 Thin lines and horizontal marks on the bars show theindividual CMIP5 models and the multi-model mean for 2071ndash2100
489
TCD9 441ndash493 2015
Snowfall in theHimalayas an
uncertain future froma little-known past
E Viste and A Sorteberg
Title Page
Abstract Introduction
Conclusions References
Tables Figures
J I
J I
Back Close
Full Screen Esc
Printer-friendly Version
Interactive Discussion
Discussion
Paper
|D
iscussionP
aper|
Discussion
Paper
|D
iscussionP
aper|
1 2 3 4 5 6 7 8 9 10 11 120
5
10
15
20
25
30
35
Month
SWE
[km
3 ]
a) Indus
0
1
2
3
4
5
6
7
8
b) Ganges
SWE
[km
3 ]
1 2 3 4 5 6 7 8 9 10 11 12Month
0
2
4
6
8
10
12
14
16
18
20
c) Brahmaputra
SWE
[km
3 ]
1 2 3 4 5 6 7 8 9 10 11 12Month
MERRA ref
2071ndash2100
1979ndash2008
RCP 85RCP 85 meanRCP 26RCP 26 mean
Viste amp SortebergFigure 9
Figure 9 Projected future snowfall in the (a) Indus (b) Ganges and (c) Brahmaputra Basinswith reference to MERRA reference snowfall Gray bars MERRA reference snowfall for 1979ndash2008 Thin lines and horizontal marks on the bars show the individual CMIP5 models andthe multi-model mean for 2071ndash2100 based on changes in temperature and precipitation asdescribed in Sect 23
490
TCD9 441ndash493 2015
Snowfall in theHimalayas an
uncertain future froma little-known past
E Viste and A Sorteberg
Title Page
Abstract Introduction
Conclusions References
Tables Figures
J I
J I
Back Close
Full Screen Esc
Printer-friendly Version
Interactive Discussion
Discussion
Paper
|D
iscussionP
aper|
Discussion
Paper
|D
iscussionP
aper|
Figure 10 Projected future changes in snowfall in sub-basins of the Indus Ganges andBrahmaputra Basins (a) Absolute change [km3] with reference to MERRA reference snow-fall (b) Absolute change [km3] with reference to APHRODITE snowfall (c d) Correspondingrelative changes [] with reference to MERRA and APHRODITE
491
TCD9 441ndash493 2015
Snowfall in theHimalayas an
uncertain future froma little-known past
E Viste and A Sorteberg
Title Page
Abstract Introduction
Conclusions References
Tables Figures
J I
J I
Back Close
Full Screen Esc
Printer-friendly Version
Interactive Discussion
Discussion
Paper
|D
iscussionP
aper|
Discussion
Paper
|D
iscussionP
aper|
J F M A M J J A S O N DMonth
0
5
10
15
20 km3Precip
0
2
4
6
8
10 km3SWE
2000
3000
4000
5000
6000 masl
1845
J F
M
A
M
JJ A
S
O
N
D
RSL
I4A = 146793 km2
1 km 3 = 68 mm
0
05
1
15 SWE rel
8000 m
0
J F M A M J J A S O N DMonth
0
2
4
6
8
10
12 km3 SWE
3000
4000
5000
6000 masl
78
2
14
J FM
A
MJ
J AS
O
ND
RSL
I5
Precip
0
5
10
15
20
25 km3
0
05
1
15 SWE rel
8000 m
0
A = 178669 km2
1 km 3 = 56 mm
CMIP52071ndash2100mean
Today
MERRA APHRODITE
Individual models
CMIP52071ndash2100mean
MERRA APHRODITE
Individual models
CMIP52071ndash2100Precip mean
MERRA APHRODITE
Individual models
SWE todayPrecip today
2000 mTerrain distribution of area between levels
CMIP52071ndash2100
TodayMERRA
APHRODITE
a)
i)
ii)
iii)
iv)
b)
Viste amp SortebergFigure 11
Figure 11 Monthly CMIP5 RCP 85 change in snowfall precipitation and rainsnow line eleva-tion in the upper Indus clusters (a) 4 and (b) 5 from 1971ndash2000 to 2071ndash2100 with referenceto the MERRA reference (red) and APHRODITE (blue) CMIP5 multi-model means are shownas horizontal marks individual models as dots Cluster location and terrain profile are shownabove the graphs (i) Fractional change in snowfall (ii) Future snowfall [km3] (dots) comparedto today (bars) (iii) Future precipitation [km3] (dots) compared to today (bars) Snowfall todayis shown as darker part of bars (iv) Rainsnow line elevation [m asl] Gray background el-evation histogram with the of total ground area lying in the marked 2000 m intervals Barschange from today (bottom) to CMIP5 multi-model mean (top)
492
TCD9 441ndash493 2015
Snowfall in theHimalayas an
uncertain future froma little-known past
E Viste and A Sorteberg
Title Page
Abstract Introduction
Conclusions References
Tables Figures
J I
J I
Back Close
Full Screen Esc
Printer-friendly Version
Interactive Discussion
Discussion
Paper
|D
iscussionP
aper|
Discussion
Paper
|D
iscussionP
aper|
3000
4000
5000
6000 masl
0
2
4
6
8
10 km3
0
10
20
30
40
50
60 km3
0
05
1
15
J F M A M J J A S O N DMonth
J FM
A
M
JJ A
S
O
ND
Precip
SWE
RSL
SWE rel
53
B3
8000 m
0
A = 139611 km2
1 km 3 = 72 mm
4500
5000
5500
6000
6500 masl
0
1
2
3
4 km3
0
10
20
30
40
50 km3
0
05
1
15 SWE rel
SWE
RSL
Precip
95
J F M A M J J A S O N DMonth
J FM
A
M
JJ A
S
ON
D
B4
8000 m
0
A = 159165 km2
1 km 3 = 63 mm
CMIP52071ndash2100mean
Today
MERRA APHRODITE
Individual models
CMIP52071ndash2100mean
MERRA APHRODITE
Individual models
CMIP52071ndash2100Precip mean
MERRA APHRODITE
Individual models
SWE todayPrecip today
2000 mTerrain distribution of area between levels
CMIP52071ndash2100
TodayMERRA
APHRODITE
a)
i)
ii)
iii)
iv)
b)
Viste amp SortebergFigure 12
Figure 12 Monthly CMIP5 RCP 85 change in snowfall precipitation and rainsnow line ele-vation in the upper Brahmaputra clusters (a) 4 and (b) 3 See Fig 11 for a description of thecontent
493
- Introduction
-
- Observed trends in snowfall temperature and precipitation
- Future projections of snowfall temperature and precipitation
- Aims and scope
-
- Data and methods
-
- Reference present-day snowfall
- Bias-corrected present-day snowfall
- Projected snowfall
- The rain-snow line
-
- Present-day snowfall
-
- Seasonal cycles of precipitation and snowfall
- Comparison of snowfall estimates
-
- Projected future snowfall
-
- Basin-scale projections
- Regional projections
-
- Upper Indus western part
- Upper Indus eastern part
- Upper Brahmaputra western part
- Upper Brahmaputra eastern part
-
- Potential effects of reduced snowfall on water availability
-
- Concluding summary
-
TCD9 441ndash493 2015
Snowfall in theHimalayas an
uncertain future froma little-known past
E Viste and A Sorteberg
Title Page
Abstract Introduction
Conclusions References
Tables Figures
J I
J I
Back Close
Full Screen Esc
Printer-friendly Version
Interactive Discussion
Discussion
Paper
|D
iscussionP
aper|
Discussion
Paper
|D
iscussionP
aper|
data sets in the Indus and for APHRODITE also in the Ganges and the Brahmapu-tra An inland and upward shift in the MERRA precipitation adds to the differencesAs shown in Fig 4 all the observation-based precipitation data sets are wetter thanMERRA in most of the lowlands and in the foothills of the HKH but drier in the higher-elevation regions further inland In MERRA the precipitation belt is shifted higher up5
in the Himalayas where temperatures are lower and more of the precipitation falls assnow
In addition HKH temperatures are lower in MERRA than in APHRODITE and inthe upper Indus also than in CRU TS (Fig 5) The lower temperatures in MERRAcause higher snow fractions further increasing the difference between the MERRA ref-10
erence snowfall and APHRODITE snowfall Oppositely CRU TS is colder than MERRAthroughout the Ganges leading to higher snowfall estimates when bias-correctingMERRA temperatures with CRU TS (Table 4)
We do not see any reason to consider any of the observation-based data sets northe reanalysis the ground truth The reanalysis has the benefit of being physically15
consistent though precipitation is a pure model product In the other data sets thenumber of observations vary greatly within the region
The lack of observations in the HKH has been pointed out in many studies Mostmeteorological stations are located in the valleys and do not necessarily representweather conditions in higher terrain As demonstrated by Palazzi et al (2013) station-20
based data sets like APHRODITE and CRU TS are merely mathematical interpolationsin major parts of the HKH and on the Tibetan Plateau Immerzeel (2008) showed thatthe number of observations going into version 21 of the CRU data set in the Himalayanregion varies greatly A drop in the mid-1990s suggests that caution should be takenwhen interpreting data at later times Maps (not shown) of station coverage in version25
320 used in this study show that this problem persistsThe fact that more of the precipitation falls as snow at higher elevations may in it-
self lead to an under-estimation of precipitation in the mountains In addition to thelack of observations in high terrain gauges tend to capture snow less easily than rain
456
TCD9 441ndash493 2015
Snowfall in theHimalayas an
uncertain future froma little-known past
E Viste and A Sorteberg
Title Page
Abstract Introduction
Conclusions References
Tables Figures
J I
J I
Back Close
Full Screen Esc
Printer-friendly Version
Interactive Discussion
Discussion
Paper
|D
iscussionP
aper|
Discussion
Paper
|D
iscussionP
aper|
leading to a possible under-registration of precipitation at the few high-elevation sta-tions that exist Comparing stations along a vertical profile in the Karakoram Winigeret al (2005) found that precipitation multiplied by a factor of 5ndash10 from 2500 masl to5000ndash6000 masl This maximum is much higher than reported in most other studiesand they attributed this to the valley-dominance of stations normally used5
Indications of too little precipitation at higher elevations were also given by Tahiret al (2011b) as APHRODITE precipitation was too low to account for the observeddischarge in the Hunza river in the Karakoram Anders et al (2006) reported thatTRMM radar data underestimated precipitation at higher elevations in the Himalayasdue to the low ability of the radar to detect very low precipitation and lowndashmoderated10
snowfall rates On the other hand Krakauer et al (2013) found that both TRMM andAPHRODITE had too much precipitation compared to observations from the few exist-ing stations at elevations above 3000 masl in Nepal
Satellite data are a promising future alternative for measuring snowfall but presentlyof limited use MODIS and LANDSAT satellite data have been used in several studies15
of snow and ice in the Himalayas (Tahir et al 2011a b Bookhagen and Burbank2010 Hewitt 2005 Krishna 2005 Negi et al 2009 Jain et al 2009 Butt 2012 Gaoet al 2012 Kulkarni et al 2010 Immerzeel et al 2009) but these data contain onlysnow cover area with no measure of the snow thickness or snow water equivalentsThe NASA AMSR-E SWE data set distributed by the National Snow and Ice Data20
Center could have been used but correlations between AMSR-E SWE and groundobservations have been shown to be poor (Tedesco and Narvekar 2010 Byun andChoi 2014 Kumar et al 2006) As AMSR-E SWE has been found underestimatesnow depth we concluded that incorporating these data into our ensemble would notlikely constrain the results nor add new information25
Defining snowfall based on MERRA precipitation and elevation-adjusted tempera-ture as a reference was done mainly to have a single reference when comparing thedata sets against each other Also we believe the elevation-adjustment of temperaturerepresents an enhancement compared to the original MERRA reanalysis MERRA was
457
TCD9 441ndash493 2015
Snowfall in theHimalayas an
uncertain future froma little-known past
E Viste and A Sorteberg
Title Page
Abstract Introduction
Conclusions References
Tables Figures
J I
J I
Back Close
Full Screen Esc
Printer-friendly Version
Interactive Discussion
Discussion
Paper
|D
iscussionP
aper|
Discussion
Paper
|D
iscussionP
aper|
chosen mainly because it has an hourly resolution allowing diurnal temperature vari-ations to affect snowfall But even though this estimate is much higher than all thebias-corrected estimates it cannot be discarded It has been argued that reanalysisdata and regional climate models may in some cases be as good as or better thanobservations in the HKH (Wiltshire 2014 Meacuteneacutegoz et al 2013 Akhtar et al 2008)5
Akhtar et al (2008) got better results when modeling river discharge in three upperIndus catchments with an RCM-based hydrological model than with one based on thefew observations available within the region They concluded that it was preferable touse RCM data directly as input to hydrological models in this region
As shown in the small inset maps in Fig 4 MERRA precipitation is higher than ob-10
served precipitation throughout the HKH and the same has previously been shownfor ERA-Interim reanalysis precipitation (Palazzi et al 2013) In MERRA the precipi-tation belt is shifted upward in the terrain compared to in the observation-based datasets Whether this shift is realistic cannot be determined as long as observations fromupper-level terrain are either missing or likely too low15
4 Projected future snowfall
Whether higher temperatures lead to less snowfall depends on whether the tempera-ture changes from below to above freezing and whether this change occurs at a timewhen there is precipitation The maps in Fig 6 illustrate where a temperature increaseis most likely to affect snowfall and snowmelt In the red zones where the monthly20
temperature today is between ndash5 and 0 C the projected temperature increase of 2ndash7 C (Chaturvedi et al 2012 Collins et al 2013 Wiltshire 2014) may be consideredcritical Such a change would change snowfall to rain and also cause a change fromfreezing to melting of snow and ice The pink zones with monthly mean temperaturesof 0ndash5 C would similarly change from a climate where precipitation may often fall as25
snow to one that is snow-free
458
TCD9 441ndash493 2015
Snowfall in theHimalayas an
uncertain future froma little-known past
E Viste and A Sorteberg
Title Page
Abstract Introduction
Conclusions References
Tables Figures
J I
J I
Back Close
Full Screen Esc
Printer-friendly Version
Interactive Discussion
Discussion
Paper
|D
iscussionP
aper|
Discussion
Paper
|D
iscussionP
aper|
In January (Fig 6a) only the lower parts of the Himalayas is affected as most ofthe region would still have temperatures well below the freezing point The small insetmap shows precipitation in the red zone a narrow band along the range Oppositelyin July (Fig 6c) the temperature is already above 5 C in most of the region though athigher elevations along the Himalayan range and in the Karakoram the change can be5
critical The most widespread changes are seen in spring and fall In April and October(Fig 6b d) large areas in the HKH and on the Tibetan Plateau risk a change frombelow to above freezing
Incorporating CMIP5 precipitation changes we find that the projected temperatureincrease has a larger impact so that snowfall will be reduced in the Indus Ganges and10
Brahmaputra Basins by 2071ndash2100 compared to today Details for the major basinsare presented in Sect 41 How much increased temperatures reduce snowfall withina region depends on the location of the rainsnow line today compared to the terraindistribution Results for selected upper-level sub-basins in the Indus and Brahmaputrawill be discussed in that context in Sect 4215
The large deviations in the estimates of present-day snowfall (Sect 3) means thatthere will be correspondingly large deviations in projected values To account for thismost results are shown with reference to the highest and lowest present-day estimatesMERRA reference snowfall and to APHRODITE-based snowfall Future estimates rela-tive to CRU and TRMM are assumed to lie between those of MERRA and APHRODITE20
41 Basin-scale projections
In the Indus Ganges and Brahmaputra Basins the CMIP5 models project a meanincrease in both temperature (Fig 7) and precipitation (Fig 8) in the region by 2071ndash2100 for both RCPs 26 and 85 The RCP 85 multi-model mean change in temper-ature varies through the year with a 49ndash62 C increase in the Indus 36ndash52 C in25
the Ganges and 42ndash60 C in the Brahmaputra The increase is smallest during thesummer months The dip in the summer is also seen though less pronounced with
459
TCD9 441ndash493 2015
Snowfall in theHimalayas an
uncertain future froma little-known past
E Viste and A Sorteberg
Title Page
Abstract Introduction
Conclusions References
Tables Figures
J I
J I
Back Close
Full Screen Esc
Printer-friendly Version
Interactive Discussion
Discussion
Paper
|D
iscussionP
aper|
Discussion
Paper
|D
iscussionP
aper|
the RCP 26 The summer is also the season with the largest absolute increase inprecipitation
Compared to present-day estimates the CMIP5 models project less snowfall in theIndus Ganges and Brahmaputra Basins in the last decades of this century This canbe seen from Fig 9 The projected multi-model mean is lower than today in all calen-5
dar months for both RCPs 26 and 85 With the RCP 26 some models suggest anincrease in some months mainly in winter and spring This is also the case for one ortwo models with the RCP 85 whereas other models indicate that the snowfall in thesame months will be only half of todayrsquos values
In the Ganges Basin (Fig 9b) the seasonal distribution of snowfall today is mainly10
flat with equal amounts of snowfall from January through September Reductions insummer snowfall with the RCP 85 would change the seasonal cycle into a winter-dominated one To a lesser degree this is also the case for RCP 26 As summerprecipitation is projected to increase in all of the Ganges (not shown but consistentwith Menon et al 2013) this indicates that large areas are at elevations where a small15
increase in the summer temperature may cause a shift from snow to rain This is seenas the red band along the upper Ganges in Fig 6c Reductions in summer snowfall arealso large in the Brahmaputra (Fig 9b) whereas in the Indus the largest total changesoccur in MarchndashMay (Fig 9a)
As the MERRA reference snowfall for today is much larger than APHRODITE snow-20
fall (Sect 32) projected absolute changes for 2071ndash2100 are also much largerin MERRA The relative changes are more similar though larger with reference toAPHRODITE Annual snowfall changes for each major basin are presented in Table 5for changes in temperature precipitation or both and with reference to MERRA andAphrodite present-day snowfall Changes at the sub-basin level are shown in Fig 1025
In the Ganges Basin both MERRA- and APHRODITE-based multi-model mean snow-fall is reduced by about 20 with the RCP 26 and 50 with the RCP 85 In theIndus and Brahmaputra Basins the differences between MERRA- and APHRODITE-based changes are larger but not as large as for the absolute values With reference
460
TCD9 441ndash493 2015
Snowfall in theHimalayas an
uncertain future froma little-known past
E Viste and A Sorteberg
Title Page
Abstract Introduction
Conclusions References
Tables Figures
J I
J I
Back Close
Full Screen Esc
Printer-friendly Version
Interactive Discussion
Discussion
Paper
|D
iscussionP
aper|
Discussion
Paper
|D
iscussionP
aper|
to MERRA and APHRODITE respectively the reduction in snowfall in the Indus Basinis 30 and 50 with the RCP 85 The corresponding reductions in the BrahmaputraBasin are 50 and 70
The projected changes in temperature have greater effect on snowfall than thechanges in precipitation When taking into account only changes in precipitation all5
snowfall estimates are positive (∆P Table 5) This indicates that the mean annual to-tal reduction for each major basin is governed by the temperature change In someCMIP5 models (values in brackets in Table 5) the effect of precipitation changes (∆P )on snowfall are of the same magnitude as the effect of temperature changes (∆T ) butfor the CMIP5 multi-model mean temperature changes cause snowfall changes 4ndash1010
times as large as those due to changes in precipitation This is with reference to thepresent-day MERRA reference snowfall and for both RCPs 26 and 85 With referenceto APHRODITE snowfall the effect of temperature changes compared to precipitationchanges is even greater
42 Regional projections15
If temperatures are far below freezing everywhere warming may have little effect onsnowfall The same applies if only the highest peaks receive snow today The largestreduction in snowfall in a basin occurs if todayrsquos rainsnow line is at an elevation justbelow the dominant elevation of the basin Then large regions will see a shift fromsnow to rain20
In the Indus Basin the largest relative snowfall reduction by 2071ndash2100 is seen inthe southwestern sub-basins where snowfall is limited today (Fig 10) The largest totalreduction is seen in the snow-rich sub-basins of KabulSwatAlingar in the west and inthe east and a smaller reduction in the inner-most basins of GilgitHunza Indus 1 andNubraShyok Together with the upper regions of the Brahmaputra these sub-basins25
clusters I4 I5 B3 and B4 in Fig 2 were selected for a closer analysis In addition tohaving the most snow these clusters are the most homogeneous when considering
461
TCD9 441ndash493 2015
Snowfall in theHimalayas an
uncertain future froma little-known past
E Viste and A Sorteberg
Title Page
Abstract Introduction
Conclusions References
Tables Figures
J I
J I
Back Close
Full Screen Esc
Printer-friendly Version
Interactive Discussion
Discussion
Paper
|D
iscussionP
aper|
Discussion
Paper
|D
iscussionP
aper|
the seasonal cycle of snowfall and snow fraction The values presented in this sectionare all from the RCP 85 for changes from today to 2071ndash2100
421 Upper Indus western part
Cluster 4 consists of the sub-basins Astor KabulSwatAlingar and Krishen GangaAs seen from the elevation profile at the top of Fig 11a the elevation span is large5
and there is an almost equal proportion of the terrain at all levels from heights close tosea level to about 5000 masl The most important change for this cluster is a largereduction in the total amount of snowfall in winter and spring
With a few exceptions all CMIP5 models project less snowfall in all months of theyear (Fig 11a i ii) The largest total multi-model mean reduction in snowfall (ii) oc-10
curs in FebruaryndashApril without notable change in the multi-model mean precipitation(iii) Thus the reduction is caused by increasing temperatures represented by therainsnow line in Fig 11a iv As seen from the change in the rainsnow line elevationthe projected temperature increase in these months would imply that large areas thatreceive snow today would receive only rain About 40 of the ground in this cluster lies15
below 2000 masl and receives precipitation as rain throughout the year In summerprecipitation (iii) is at a minimum and the rainsnow line (iv) is already so high that onlya small fraction of the area receives snowfall today Thus although the relative changein snowfall (i) is largest in summer the change in the amount of snowfall (ii) is small Itshould also be noted that the change in the rainsnow line elevation (iv) in summer is20
much smaller 400ndash600 m compared to 600ndash900 m in DecemberndashApril
422 Upper Indus eastern part
Further east the largest changes are projected for the spring season Cluster 5 in theIndus Basin consists of the sub-basins GilgitHunza Indus 1 NubraShyok and Zan-skar As shown in Fig 11b this is high-elevation terrain with 80 of the ground lying25
above 4000 masl As a result almost all winter precipitation is snow (Fig 11b iii)
462
TCD9 441ndash493 2015
Snowfall in theHimalayas an
uncertain future froma little-known past
E Viste and A Sorteberg
Title Page
Abstract Introduction
Conclusions References
Tables Figures
J I
J I
Back Close
Full Screen Esc
Printer-friendly Version
Interactive Discussion
Discussion
Paper
|D
iscussionP
aper|
Discussion
Paper
|D
iscussionP
aper|
For the multi-model mean no big changes are projected in JanuaryndashFebruary This ispartly because of little change in precipitation (iii) and because the rainsnow line (iv)in these months is sufficiently low in the terrain today With the 500ndash600 m shift pro-jected with the RCP 85 80ndash90 of the area will still have temperatures low enoughfor snow The largest changes occur in MarchndashOctober when higher temperatures5
push the rainsnow line above large areas that receive snow today Increasing summerprecipitation (iii) causes the snowfall reduction in summer to be less than it would other-wise be The effect of higher temperatures is smaller on the APHRODITE snowfall thanon the MERRA reference snowfall (ii) as APHRODITE has very little summer snow-fall today The difference arises both from less precipitation (iii) in APHRODITE than10
MERRA today and from a higher rainsnow line (iv) in APHRODITE Note that as thechange in precipitation was defined as a fraction of the present-day value (Sect 23)the relative changes in APHRODITE and MERRA precipitation are equal
423 Upper Brahmaputra western part
In the westernmost part of the upper Brahmaputra Basin large snowfall changes are15
projected for the summer As cluster 5 in the Indus Basin Brahmaputrarsquos cluster 4 islimited to higher grounds Less than 6 lies outside of the 4000ndash6000 masl rangeThe cluster consists of Maquan He Yarlung Zangbo Dogxung ZangboMaiqu ZangboShang ChuYarlung ZangboNyang Lhasa HeRazheng Zangbo and Yamzho YumcoThe summer monsoon fully dominates the seasonal cycle of precipitation in this region20
(Fig 12a iii) resulting in a unimodal snow cycle with a maximum in JulyndashSeptember InAPHRODITE the seasonal cycle of snowfall is similar but less pronounced than in theMERRA reference The summer also sees the greatest reduction in CMIP5 projectedsnowfall both in absolute (ii) and relative (i) terms despite increasing summer precip-itation in all models (iii) The reason can be seen from the change in the rainsnow25
line elevation (iv) In the warmest months July and August elevation changes of 400ndash500 m would shift the rainsnow line from a level where at least 5ndash10 of the groundlies above the line to a level where only 1 of the area would receive precipitation as
463
TCD9 441ndash493 2015
Snowfall in theHimalayas an
uncertain future froma little-known past
E Viste and A Sorteberg
Title Page
Abstract Introduction
Conclusions References
Tables Figures
J I
J I
Back Close
Full Screen Esc
Printer-friendly Version
Interactive Discussion
Discussion
Paper
|D
iscussionP
aper|
Discussion
Paper
|D
iscussionP
aper|
snow In comparison with reference to MERRA the 300ndash400 m shift seen in JanuaryndashFebruary would cause only a small absolute change in snowfall (ii) because there islittle precipitation in these months (ii) and a small relative change (i) because therainsnow line would still be low in the terrain (iv) With reference to APHRODITE therelative snowfall change in winter would be larger than with reference to MERRA as5
temperatures today are higher resulting in a higher rainsnow line (iv)
424 Upper Brahmaputra eastern part
Like further west the Indian summer monsoon dominates the precipitation cycle in theeastern part of upper Brahmaputra (Fig 12b iii) but the seasonal cycle of snowfallpeaks in spring and fall (iii) This is also the time of the largest projected changes10
Cluster 3 in the Brahmaputra consists of the sub-basins Yarlung Zangbo2 NyangQu Yarlung Zangbo3 Yirsquoong ZangboParl Siyom Zaya QuLuhitDi About 70 of theground lies between 3000 and 6000 masl but there is also land almost at sea levelmainly in the Zaya QuLuhitDingba Qu sub-basin During summer most of the terrainlies below the rainsnow line (iv) In spring temperatures are lower than in summer15
and pre- monsoon precipitation is stronger in this part of the Himalayas than furtherwest in cluster 3 (Fig 12a iii vs Fig 12b iii) As a result MarchndashApril gets the mostsnow
Reductions in snowfall are projected for all months (ii) comparable in magnitude butlargest in the snow-rich spring and late summer The CMIP5 multi-model mean shows20
increasing or no change in precipitation in all months (Fig 12b iii) so the reductionin snowfall is due solely to higher temperatures The largest absolute reductions inApril and May occur with a 700ndash800 m shift in the rainsnow line elevation leaving30 more of the terrain in the rain The largest relative reduction in future snowfall areprojected for July and August (Fig 12b i) when the rainsnow line shifts so high that25
only the highest peaks can get precipitation as snow (iv) This would be despite thelowest changes in the rainsnow line only about 300 m in APHRODITE
464
TCD9 441ndash493 2015
Snowfall in theHimalayas an
uncertain future froma little-known past
E Viste and A Sorteberg
Title Page
Abstract Introduction
Conclusions References
Tables Figures
J I
J I
Back Close
Full Screen Esc
Printer-friendly Version
Interactive Discussion
Discussion
Paper
|D
iscussionP
aper|
Discussion
Paper
|D
iscussionP
aper|
43 Potential effects of reduced snowfall on water availability
With a few exceptions the CMIP5 multi-model mean precipitation change over the com-ing century is positive in all months in the upper Indus and Brahmaputra (Sect 42)Thus the projected reduction in snowfall is due solely to higher temperatures How-ever there is a large spread in precipitation projections among the models If tempera-5
tures increase as much as projected with the RCP 85 could any realistic precipitationchange in the HKH compensate and maintain present-day snowfall Results indicatethat this may happen in parts of the upper Indus but is out of the reach in the upperBrahmaputra As for water availability reduced snowfall may still cause more severeproblems in the Indus than in the Brahmaputra10
In cold regions where temperatures remain below freezing more winter precipita-tion may increase both the snow cover area the length of the snow season and theSWE (Collins et al 2013 Brutel-Vuilmet et al 2013 Raumlisaumlnen 2008 Gao et al 2012Wiltshire 2014) Raumlisaumlnen (2008) showed this to be the case in eastern Siberia andthe northernmost part of North America At the southern edge of the seasonal snow15
cover relevant for this study precipitation did not compensate and there was a reduc-tion in SWEWiltshire (2014) concluded that there would be small changes in snowfallin very cold and very warm regions of the HKH Snowfall in Nepal Bhutan and Hi-machal Pradesh where winters are warmer than in most parts of the range was mostvulnerable to higher temperatures The data presented in Sect 42 generally support20
the previous studiesOne of the reasons that precipitation does not compensate is that the highest pro-
jected precipitation increase in the HKH is seen in the summer when the temperaturetoday is so high that only the highest terrain is in the snow zone Shifting the rainsnowline upward even by only a few hundred meters reduces the area that receives snow25
greatly requiring very large increases in precipitation to compensate The summer isthe season with the largest relative reduction in snowfall in all the clusters described inSect 42 Except in the western upper Indus (cluster I4 Sect 421) which has very
465
TCD9 441ndash493 2015
Snowfall in theHimalayas an
uncertain future froma little-known past
E Viste and A Sorteberg
Title Page
Abstract Introduction
Conclusions References
Tables Figures
J I
J I
Back Close
Full Screen Esc
Printer-friendly Version
Interactive Discussion
Discussion
Paper
|D
iscussionP
aper|
Discussion
Paper
|D
iscussionP
aper|
little summer snowfall today the reduction in summer snowfall is notable in all clustersin the MERRA data in the Brahmaputra clusters also in APHRODITE
The largest change in snowfall is seen in the western part of the Brahmaputra (clus-ter B4 Sect 423) where a 400ndash500 m upward shift in the rainsnow line during sum-mer reduces the area with temperatures low enough for snowfall by a factor of 5ndash105
(Fig 12a iv values not shown) As a result the summer peak in the seasonal cycleof snowfall is replaced by a dip (Fig 12a ii) With an even distribution of precipitationwith elevation the area that still receives snow would have to receive 5ndash10 times asmuch precipitation to compensate for the lost snowfall Assuming more realisticallythat precipitation decreases above a certain height would require an even higher in-10
crease in precipitation In the model with the highest increase a doubling of the Julyprecipitation by the end of the century SWE is less than 25 of todayrsquos value in thatmonth (Fig 12a iii)
With a winter-dominated precipitation cycle the relative change in snowfall is smallerin the upper Indus than in the upper Brahmaputra Downscaling a high-emission sce-15
nario (A1B) in two CMIP3 models with a regional model Wiltshire (2014) found that bythe 2080s precipitation increased more than enough to compensate for higher temper-atures in the Karakoram Hindu Kush and Jammu and Kashmir in one of the modelsthe HadCM3 In the other model ECHAM5 precipitation increased less and snow-fall increased only in the higher parts of the Karakoram In our ensemble of CMIP520
models multi-model mean precipitation in the upper Indus clusters increases mainlyin the summer season when the inter-model spread is also the largest (Fig 11a iiiand 11b iii) Among the models 4ndash5 project increased winter precipitation in the upperIndus and in the uppermost cluster I5 this is associated with an increase in wintersnowfall (Fig 11b ii)25
Although it is the part of the HKH where snowfall is least reduced by increasingtemperatures (Fig 10b) the Karakoram and inner parts of the upper Indus may still bethe region where the changes have the largest impact on river run-off Compared tothe monsoon-dominated regions further east there is little summer precipitation and
466
TCD9 441ndash493 2015
Snowfall in theHimalayas an
uncertain future froma little-known past
E Viste and A Sorteberg
Title Page
Abstract Introduction
Conclusions References
Tables Figures
J I
J I
Back Close
Full Screen Esc
Printer-friendly Version
Interactive Discussion
Discussion
Paper
|D
iscussionP
aper|
Discussion
Paper
|D
iscussionP
aper|
much of the water in the rivers during summer is meltwater (Bookhagen and Burbank2010 Immerzeel et al 2010) As melting of snow and ice has not been analyzed inthis study we cannot quantify the effect of reduced snowmelt om river run-off but it isobvious that eventually reduced snowfall will lead to reduced melting In western partsof the HKH this may lead to changes in the seasonal cycle of the river flow5
As pointed out by Wiltshire (2014) increasing precipitation in the eastern HKH im-plies that water resources are likely to increase with climate change As snowfall andsnowmelt are both at maximum during summer (Rees and Collins 2006) meltwaterdoes not have the same importance for river flow in dry parts of the year as in the In-dus Reduced snowfall may reduce glaciers but ndash not considering potential changes in10
the amount of evaporation ndash there is no indication that there will be less water comingfrom the upper Brahmaputra
5 Concluding summary
In this study we have presented a suite of estimates of present-day snowfall in theIndus Ganges and Brahmaputra Basins and the changes in snowfall that would follow15
from CMIP5 projected changes in temperature and precipitation from 1971ndash2000 to2071ndash2100 The results show that if the temperature increases as much as in the RCP85 there will be much less snowfall despite increasing precipitation in most of theregion Limiting anthropogenic forcing to the RCP 26 level would still cause reductionsthough smaller20
Estimates of present-day snowfall based on a combination of temperature and pre-cipitation from reanalysis data and observations vary by factors of 2ndash4 The MERRAreanalysis gives higher estimates than TRMM 3B42 CRU TS and APHRODITE butthe spread is also large between the estimates based on the different observationallybased data sets This demonstrates the difficulties in assessing vulnerability to climate25
change in the region With limited knowledge of the current state future conditions arebound to be uncertain
467
TCD9 441ndash493 2015
Snowfall in theHimalayas an
uncertain future froma little-known past
E Viste and A Sorteberg
Title Page
Abstract Introduction
Conclusions References
Tables Figures
J I
J I
Back Close
Full Screen Esc
Printer-friendly Version
Interactive Discussion
Discussion
Paper
|D
iscussionP
aper|
Discussion
Paper
|D
iscussionP
aper|
Future changes in temperature and precipitation projected by climate models can stillprovide an indication of the relative change in snowfall With the RCP 85 the climatemodels project mean reductions in annual snowfall by 30ndash50 in the Indus Basin 50ndash60 in the Ganges Basin and 50ndash70 in the Brahmaputra Basin by 2071ndash2100 Withthe RCP 26 the corresponding reductions would be 10ndash20 in the Indus about 20 5
in the Ganges and 20ndash30 in the Brahmaputra The reductions are due to increasingtemperatures as the mean of the models show constant or increasing precipitationthroughout the year in most of the region
How much increasing temperatures reduce snowfall in a region depends on howmuch of the terrain that is below and above the freezing point today and on whether10
the terrain profile is such that the temperature increase transforms large areas fromsnow to rain zones With the RCP 85 the mean elevation where rain changes to snowndash the rainsnow line ndash creeps upward by 400ndash900 m in most of the region by 700ndash900 m
The largest relative change in snowfall is seen in the upper westernmost sub-basins15
of the Brahmaputra despite increasing precipitation and the lowest rainsnow line el-evation change (400ndash500 m) This is because a major part of this region is near thefreezing point today With the RCP 85 most of this region will have temperaturesabove freezing especially in the summer which is the wettest part of the year Theprojected reduction in annual snowfall is 65ndash75 20
In the upper Indus the effect of a warmer climate on snowfall is less extreme asmost of the terrain is high enough to have temperatures sufficiently far below freezingtoday Winter and spring brings most of the precipitation and the projected 600ndash800 mchange in the rainsnow line elevation during these seasons would leave most of theterrain below the freezing point Still a 20ndash40 reduction in annual snowfall is pro-25
jected with the RCP 85The range of our estimates of present-day snowfall illustrates how little that is known
about conditions that influence the availability of drinking water in some of the mostdensely populated parts of the world There is both a scientific and a societal need
468
TCD9 441ndash493 2015
Snowfall in theHimalayas an
uncertain future froma little-known past
E Viste and A Sorteberg
Title Page
Abstract Introduction
Conclusions References
Tables Figures
J I
J I
Back Close
Full Screen Esc
Printer-friendly Version
Interactive Discussion
Discussion
Paper
|D
iscussionP
aper|
Discussion
Paper
|D
iscussionP
aper|
for more information about precipitation in the HKH As a full-scale long-time observa-tional program covering all parts of the Himalayan range is not a likely possibility theonly hope for improved future knowledge of Himalayan snowfall lies in the improvementof satellite data and regional climate models
The Supplement related to this article is available online at5
doi105194tcd-9-441-2015-supplement
Acknowledgements This work has been carried out with support from the University of Bergenthe NORINDIA and SNOWHIM projects funded by The Research Council of Norway and theCentre for Climate Dynamics at the Bjerknes Centre for Climate Research We acknowledgethe World Climate Research Programmersquos Working Group on Coupled Modelling which is re-10
sponsible for CMIP and we thank the climate modeling groups listed in Table 3 of this paper forproducing and making available their model output For CMIP the US Department of EnergyrsquosProgram for Climate Model Diagnosis and Intercomparison provides coordinating support andled development of software infrastructure in partnership with the Global Organization for EarthSystem Science Portals15
References
Akhtar M Ahmad N and Booij M J The impact of climate change on the water resourcesof Hindukush-Karakorum-Himalaya region under different glacier coverage scenarios J Hy-drol 355 148ndash163 2008
Anders A M Roe G H Hallet B Montgomery D R Finnegan N J and Putkonen J20
Spatial patterns of precipitation and topography in the Himalaya in Tectonics Climate andLandscape Evolution Geological Society of America Special Paper edited by Willett S DHovius N Brandon M T and Fisher D Geological Society of America Boulder CO USA39ndash53 2006
469
TCD9 441ndash493 2015
Snowfall in theHimalayas an
uncertain future froma little-known past
E Viste and A Sorteberg
Title Page
Abstract Introduction
Conclusions References
Tables Figures
J I
J I
Back Close
Full Screen Esc
Printer-friendly Version
Interactive Discussion
Discussion
Paper
|D
iscussionP
aper|
Discussion
Paper
|D
iscussionP
aper|
Archer DR and Fowler HJ Spatial and temporal variations in precipitation in the UpperIndus Basin global teleconnections and hydrological implications Hydrol Earth Syst Sci8 47ndash61 doi105194hess-8-47-2004 2004
Bhutiyani M R Kale V S and Pawar N J Long-term trends in maximum minimum andmean annual air temperatures across the Northwestern Himalaya during the twentieth cen-5
tury Climatic Change 85 159ndash177 doi101007s10584-006-9196-1 2007Bhutiyani M R Kale V S and Pawar N J Climate change and the precipitation variations in
the northwestern Himalaya 1866ndash2006 Int J Climatol 30 535ndash548 doi101002joc19202010
Bookhagen B and Burbank D W Topography relief and TRMM-derived rainfall variations10
along the Himalaya Geophys Res Lett 33 L08405 doi1010292006GL026037 2006Bookhagen B and Burbank D W Toward a complete Himalayan hydrological budget spa-
tiotemporal distribution of snowmelt and rainfall and their impact on river discharge J Geo-phys Res 115 F03019 doi1010292009jf001426 2010
Franco B Fettweis X and Erpicum M Future projections of the Greenland ice sheet energy15
balance driving the surface melt The Cryosphere 7 1ndash18 doi105194tc-7-1-2013 2013Butt M J Characteristics of snow cover in the Hindukush Karakoram and Himalaya region
using Landsat satellite data Hydrol Process 10 3689ndash3698 doi101002hyp8375 2012Byun K and Choi M Uncertainty of snow water equivalent retrieved from AMSR-E brightness
temperature in northeast Asia Hydrol Process 28 12 doi101002hyp9846 201420
Chaturvedi R K Joshi J Jayaraman M Bala G and Ravindranath N H Multi-modelclimate change projections for India under representative concentration pathways Curr SciIndia 103 791ndash802 2012
Christensen J H Krishna Kumar K Aldrian E An S-I Cavalcanti I F A Castro Md Dong W Goswami P Hall A Kanyanga J K Kitoh A Kossin J Lau N-C Ren-25
wick J Stephenson D B Xie S-P and Zhou T Climate phenomena and their relevancefor future regional climate change in Climate Change 2013 The Physical Science BasisContribution of Working Group I to the Fifth Assessment Report of the Intergovernmen-tal Panel on Climate Change edited by Stocker T F Qin D Plattner G-K Tignor MAllen S K Boschung J Nauels A Xia Y Bex V and Midgley P M Cambridge Univer-30
sity Press Cambridge UK and New York NY USA 92 2013Collins M Knutti R Arblaster J Dufresne J-L Fichefet T Friedlingstein P Gao X
Gutowski W J Johns T Krinner G Shongwe M Tebaldi C Weaver A J and
470
TCD9 441ndash493 2015
Snowfall in theHimalayas an
uncertain future froma little-known past
E Viste and A Sorteberg
Title Page
Abstract Introduction
Conclusions References
Tables Figures
J I
J I
Back Close
Full Screen Esc
Printer-friendly Version
Interactive Discussion
Discussion
Paper
|D
iscussionP
aper|
Discussion
Paper
|D
iscussionP
aper|
Wehner M Long-term climate change projections commitments and irreversibility in Cli-mate Change 2013 The Physical Science Basis Contribution of Working Group I to theFifth Assessment Report of the Intergovernmental Panel on Climate Change edited byStocker T F Qin D Plattner G-K Tignor M Allen S K Boschung J Nauels AXia Y Bex V and Midgley P M Cambridge University Press Cambridge UK and New5
York NY USA 108 2013Cook E R Palmer J G Ahmed M Woodhouse C A Fenwick P Zafar M U Wahab M
and Khan N Five centuries of Upper Indus River flow from tree rings J Hydrol 486 365ndash375 doi101016jjhydrol201302004 2013
Dai A Temperature and pressure dependence of the rain-snow phase transition over land and10
ocean Geophys Res Lett 35 L12802 doi1010292008gl033295 2008Fowler H J and Archer D R Conflicting signals of climatic change in the Upper Indus Basin
J Climate 19 4276ndash4293 doi101175jcli38601 2006Gao J Williams M W Fu X Wang G and Gong T Spatiotemporal distribution of snow
in eastern Tibet and the response to climate change Remote Sens Environ 121 1ndash915
doi101016jrse201201006 2012Gardelle J Berthier E and Arnaud Y Slight mass gain of Karakoram glaciers in the
early twenty-first century ndash Supplement Nature Geosci 5 322ndash325 doi101038ngeo14502012
Guhathakurta P and Rajeevan M Trends in the rainfall pattern over India Int J Climatol20
28 1453ndash1469 doi101002joc1640 2008Harris I Jones P D Osborn T J and Lister D H Updated high-resolution grids of
monthly climatic observations ndash the CRU TS310 Dataset Int J Climatol 34 623ndash642doi101002joc3711 2014
Hartmann H and Andresky L Flooding in the Indus River basin ndash a spa-25
tiotemporal analysis of precipitation records Global Planet Change 107 25ndash35doi101016jgloplacha201304002 2013
Hastings D and Dunbar P Development amp Assessment of the Global Land One-km BaseElevation Digital Elevation Model (GLOBE) ISPRS Commission IV Symposium on GIS ndashBetween Visions and Applications Stuttgart Germany 7ndash10 September 199830
Hewitt K The Karakoram anomaly Glacier expansion and the ldquoelevation ef-fectrdquo Karakoram Himalaya Mt Res Dev 25 332ndash340 doi1016590276-4741(2005)025[0332TKAGEA]20CO2 2005
471
TCD9 441ndash493 2015
Snowfall in theHimalayas an
uncertain future froma little-known past
E Viste and A Sorteberg
Title Page
Abstract Introduction
Conclusions References
Tables Figures
J I
J I
Back Close
Full Screen Esc
Printer-friendly Version
Interactive Discussion
Discussion
Paper
|D
iscussionP
aper|
Discussion
Paper
|D
iscussionP
aper|
Huffman G J Adler R F Bolvin D T Gu G Nelkin E J Bowman K P Hong YStocker E F and Wolff D B The TRMM Multisatellite Precipitation Analysis (TMPA) quasi-global multiyear combined-sensor precipitation estimates at fine scales J Hydrometeorol8 38ndash55 2007
Immerzeel W Historical trends and future predictions of climate variability in the Brahmaputra5
basin Int J Climatol 28 243ndash254 doi101002joc1528 2008Immerzeel W W Droogers P de Jong S M and Bierkens M F P Large-scale monitoring
of snow cover and runoff simulation in Himalayan river basins using remote sensing RemoteSens Environ 113 40ndash49 doi101016jrse200808010 2009
Immerzeel W W van Beek L P H and Bierkens M F P Climate change will affect the10
asian water towers Science 328 1382ndash1385 doi101126science1183188 2010Ines A V M and Hansen J W Bias correction of daily GCM rainfall for crop simulation
studies Agr Forest Meteorol 138 44ndash53 doi101016jagrformet200603009 2006Jain S K Goswami A and Saraf A K Role of elevation and aspect in snow distribution
in western Himalaya Water Resour Manag 23 71ndash83 doi101007s11269-008-9265-515
2009Krakauer N Pradhanang S Lakhankar T and Jha A Evaluating satellite products for
precipitation estimation in mountain regions a case study for Nepal Remote Sensing 54107ndash4123 2013
Krishna A P Snow and glacier cover assessment in the high mountains of Sikkim Himalaya20
Hydrol Process 19 2375ndash2383 doi101002hyp5890 2005Kulkarni A V Rathore B P Singh S K and Ajai Distribution of seasonal snow cover in cen-
tral and western Himalaya Ann Glaciol 51 123ndash128 doi1031891727564107913864452010
Kumar V Rao Y S Venkataraman G Sarwade R N and Mani S Analysis of Aqua25
AMSR-E Derived Snow Water Equivalent over Himalayan Snow Covered Regions Geo-science and Remote Sensing Symposium Denver CO USA 31 Julyndash4 August 2006
Kaumlaumlb A Berthier E Nuth C Gardelle J and Arnaud Y Contrasting patterns of earlytwenty-first-century glacier mass change in the Himalayas Nature 488 495ndash498 availableat httpwwwnaturecomnaturejournalv488n7412absnature11324html ndash Supplement30
2012Lehner B Verdin K and Jarvis A New global hydrography derived from spaceborne eleva-
tion data Eos T Am Geophys Un 89 93ndash94 doi1010292008EO100001 2008
472
TCD9 441ndash493 2015
Snowfall in theHimalayas an
uncertain future froma little-known past
E Viste and A Sorteberg
Title Page
Abstract Introduction
Conclusions References
Tables Figures
J I
J I
Back Close
Full Screen Esc
Printer-friendly Version
Interactive Discussion
Discussion
Paper
|D
iscussionP
aper|
Discussion
Paper
|D
iscussionP
aper|
MacQueen J Some Methods for Classification and Analysis of Multivariate ObservationsFifth Berkeley Symposium on Mathematical Statistics and Probability Berkeley California21 Junendash18 July 1967
Meacuteneacutegoz M Galleacutee H and Jacobi H W Precipitation and snow cover in the Himalayafrom reanalysis to regional climate simulations Hydrol Earth Syst Sci 17 3921ndash39365
doi105194hess-17-3921-2013 2013Menon A Levermann A Schewe J Lehmann J and Frieler K Consistent increase in
Indian monsoon rainfall and its variability across CMIP-5 models Earth Syst Dynam 4287ndash300 doi105194esd-4-287-2013 2013
Moss R H Edmonds J A Hibbard K A Manning M R Rose S K van Vuuren D P10
Carter T R Emori S Kainuma M Kram T Meehl G A Mitchell J F B Naki-cenovic N Riahi K Smith S J Stouffer R J Thomson A M Weyant J P andWilbanks T J The next generation of scenarios for climate change research and assess-ment Nature 463 747ndash756 2010
Negi H S Kulkarni A V and Semwal B S Estimation of snow cover distribution in Beas15
basin Indian Himalaya using satellite data and ground measurements J Earth Syst Sci118 525ndash538 doi101007s12040-009-0039-0 2009
Palazzi E v Hardenberg J and Provenzale A Precipitation in the Hindu-Kush Karako-ram Himalaya observations and future scenarios J Geophys Res-Atmos 118 85ndash100doi1010292012JD018697 201320
Rees H G and Collins D N Regional differences in response of flow in glacier-fed Himalayanrivers to climatic warming Hydrol Process 20 2157ndash2169 doi101002hyp6209 2006
Rienecker M M Suarez M J Gelaro R Todling R Bacmeister J Liu EBosilovich M G Schubert S D Takacs L Kim G-K Bloom S Chen J Collins DConaty A da Silva A Gu W Joiner J Koster R D Lucchesi R Molod A Owens T25
Pawson S Pegion P Redder C R Reichle R Robertson F R Ruddick A GSienkiewicz M and Woollen J MERRA NASArsquos Modern-Era Retrospective Analysis forResearch and Applications J Climate 24 3624ndash3648 doi101175JCLI-D-11-0001512011
Rikiishi K and Nakasato H Height dependence of the tendency for reduction in seasonal30
snow cover in the Himalaya and the Tibetan Plateau region 1966ndash2001 Ann Glaciol 43369ndash377 doi103189172756406781811989 2006
473
TCD9 441ndash493 2015
Snowfall in theHimalayas an
uncertain future froma little-known past
E Viste and A Sorteberg
Title Page
Abstract Introduction
Conclusions References
Tables Figures
J I
J I
Back Close
Full Screen Esc
Printer-friendly Version
Interactive Discussion
Discussion
Paper
|D
iscussionP
aper|
Discussion
Paper
|D
iscussionP
aper|
Raumlisaumlnen J Warmer climate less or more snow Clim Dynam 30 307ndash319doi101007s00382-007-0289-y 2008
Schaner N Voisin N Nijssen B and Lettenmaier D P The contribution of glacier melt tostreamflow Environ Res Lett 7 034029 doi1010881748-932673034029 2012
Scherler D Bookhagen B and Strecker M R Spatially variable response of Himalayan5
glaciers to climate change affected by debris cover Nature Geosci 4 156ndash159 availableat httpwwwnaturecomngeojournalv4n3absngeo1068html ndash Supplement 2011
Sharif M Archer D R Fowler H J and Forsythe N Trends in timing and magnitude offlow in the Upper Indus Basin Hydrol Earth Syst Sci 17 1503ndash1516 doi105194hess-17-1503-2013 201310
Shekhar M S Chand H Kumar S Srinivasan K and Ganju A Climate-change studiesin the western Himalaya Ann Glaciol 51 105ndash112 doi1031891727564107913865082010
Shrestha A B Wake C P Mayewski P A and Dibb J E Maximum tempera-ture trends in the Himalaya and its vicinity an analysis based on temperature records15
from Nepal for the period 1971ndash94 J Climate 12 2775ndash2786 doi1011751520-0442(1999)012lt2775MTTITHgt20CO2 1999
Shrestha A B Wake C P Dibb J E and Mayewski P A Precipitation fluctuations in theNepal Himalaya and its vicinity and relationship with some large scale climatological parame-ters Int J Climatol 20 317ndash327 doi101002(SICI)1097-0088(20000315)203lt317AID-20
JOC476gt30CO2-G 2000Siderius C Biemans H Wiltshire A Rao S Franssen W H P Kumar P Gosain A K
van Vliet M T H and Collins D N Snowmelt contributions to discharge of the GangesSci Total Environ Supplement 468ndash469 9 doi101016jscitotenv201305084 2013
Singh P Jain S K and Kumar N Estimation of snow and glacier-melt contribution to the25
Chenab River Western Himalaya Mt Res Dev 17 49ndash56 doi1023073673913 1997Singh P Kumar V Thomas T and Arora M Changes in rainfall and relative hu-
midity in river basins in northwest and central India Hydrol Process 22 2982ndash2992doi101002hyp6871 2008
Sontakke N A Singh N and Singh H N Instrumental period rainfall series of the Indian30
region (AD 1813ndash2005) revised reconstruction update and analysis Holocene 18 1055ndash1066 doi1011770959683608095576 2008
474
TCD9 441ndash493 2015
Snowfall in theHimalayas an
uncertain future froma little-known past
E Viste and A Sorteberg
Title Page
Abstract Introduction
Conclusions References
Tables Figures
J I
J I
Back Close
Full Screen Esc
Printer-friendly Version
Interactive Discussion
Discussion
Paper
|D
iscussionP
aper|
Discussion
Paper
|D
iscussionP
aper|
Sperber K R Annamalai H Kang I S Kitoh A Moise A Turner A Wang B andZhou T The Asian summer monsoon an intercomparison of CMIP5 vs CMIP3 simulationsof the late 20th century Clim Dynam 41 2711ndash2744 doi101007s00382-012-1607-62013
Tahir A A Chevallier P Arnaud Y and Ahmad B Snow cover dynamics and hydrological5
regime of the Hunza River basin Karakoram Range Northern Pakistan Hydrol Earth SystSci 15 2275ndash2290 doi105194hess-15-2275-2011 2011a
Tahir A A Chevallier P Arnaud Y Neppel L and Ahmad B Modeling snowmelt-runoffunder climate scenarios in the Hunza River basin Karakoram Range Northern Pakistan JHydrol 409 104ndash117 doi101016jjhydrol201108035 2011b10
Taylor K E Stouffer R J and Meehl G A An overview of CMIP5 and the experimentdesign B Am Meteorol Soc 93 14 doi101175BAMS-D-11-000941 2011
Tedesco M and Narvekar P S Assessment of the NASA AMSR-E SWE product IEEE J SelTop Appl 3 141ndash159 doi101109JSTARS20102040462 2010
Teutschbein C and Seibert J Bias correction of regional climate model simulations for hydro-15
logical climate-change impact studies review and evaluation of different methods J Hydrol456ndash457 12ndash29 doi101016jjhydrol201205052 2012
Turner A G and Annamalai H Climate change and the South Asian summer monsoon NatClim Change 2 587ndash595 2012
van Vuuren D Edmonds J Kainuma M Riahi K Thomson A Hibbard K Hurtt G20
Kram T Krey V Lamarque J-F Masui T Meinshausen M Nakicenovic N Smith Sand Rose S The representative concentration pathways an overview Climatic Change109 26 doi101007s10584-011-0148-z 2011
Wang A and Zeng X Development of global hourly 05-degree land surface air temperaturedatasets J Climate 26 7676ndash7691 doi101175JCLI-D-12-006821 201325
Wiltshire A J Climate change implications for the glaciers of the Hindu Kush Karakoram andHimalayan region The Cryosphere 8 941ndash958 doi105194tc-8-941-2014 2014
Winiger M Gumpert M and Yamout H KarakorumndashHindukushndashwestern Himalaya assess-ing high-altitude water resources Hydrol Process 19 2329ndash2338 doi101002hyp5887200530
Xu X Lu C Shi X and Gao S World water tower An atmospheric perspective GeophysRes Lett 35 L20815 doi1010292008GL035867 2008a
475
TCD9 441ndash493 2015
Snowfall in theHimalayas an
uncertain future froma little-known past
E Viste and A Sorteberg
Title Page
Abstract Introduction
Conclusions References
Tables Figures
J I
J I
Back Close
Full Screen Esc
Printer-friendly Version
Interactive Discussion
Discussion
Paper
|D
iscussionP
aper|
Discussion
Paper
|D
iscussionP
aper|
Xu Z X Gong T L and Li J Y Decadal trend of climate in the Tibetan Plateaumdashregionaltemperature and precipitation Hydrol Process 22 3056ndash3065 doi101002hyp68922008b
Yasutomi N Hamada A and Akiyo Y Development of a Long-term Daily Gridded Temper-ature Dataset and its Application to RainSnow Discrimination of Daily Precipitation Global5
Environ Res15 165ndash172 2011Yatagai A Kamiguchi K Arakawa O Hamada A Yasutomi N and Kitoh A APHRODITE
Constructing a Long-Term Daily Gridded Precipitation Dataset for Asia Based on a DenseNetwork of Rain Gauges B Am Meteorol Soc 93 1401ndash1415 doi101175BAMS-D-11-001221 201210
You Q Kang S Aguilar E and Yan Y Changes in daily climate extremes in the east-ern and central Tibetan Plateau during 1961ndash2005 J Geophys Res-Atmos 113 D07101doi1010292007JD009389 2008
476
TCD9 441ndash493 2015
Snowfall in theHimalayas an
uncertain future froma little-known past
E Viste and A Sorteberg
Title Page
Abstract Introduction
Conclusions References
Tables Figures
J I
J I
Back Close
Full Screen Esc
Printer-friendly Version
Interactive Discussion
Discussion
Paper
|D
iscussionP
aper|
Discussion
Paper
|D
iscussionP
aper|
Table 1 Combinations of data types used in snowfall estimates T temperature P precipita-tion f (P T ) indicates that snowfall is calculated as a function of P and T
Precipitation Temperature Snowfall Time
MERRA MERRA PresentMERRA reference MERRA Terrain-adjusted MERRA f (P T ) PresentMERRA T2m MERRA MERRA T2m f (P T ) PresentBias-corrected with obs T MERRA Bias-corr terrain-adj MERRA f (P T ) PresentBias-corrected with obs P Bias-corr MERRA Terrain-adjusted MERRA f (P T ) PresentBias-corrected with obs T P Bias-corr MERRA Bias-corr terrain-adj MERRA f (P T ) PresentCMIP5 T MERRA Terrain-adj MERRA+∆T f (P T ) FutureCMIP5 P MERRAtimes∆P Terrain-adj MERRA f (P T ) FutureCMIP5 T P MERRAtimes∆P Terrain-adj MERRA+∆T f (P T ) FutureBias-corr CMIP5 T Bias-corr MERRA Bias-corr terrain-adj MERRA+∆T f (P T ) FutureBias-corr CMIP5 P Bias-corr MERRAtimes∆P Bias-corr terrain-adj MERRA f (P T ) FutureBias-corr CMIP5 T P Bias-corr MERRAtimes∆P Bias-corr terrain-adj MERRA+∆T f (P T ) Future
477
TCD9 441ndash493 2015
Snowfall in theHimalayas an
uncertain future froma little-known past
E Viste and A Sorteberg
Title Page
Abstract Introduction
Conclusions References
Tables Figures
J I
J I
Back Close
Full Screen Esc
Printer-friendly Version
Interactive Discussion
Discussion
Paper
|D
iscussionP
aper|
Discussion
Paper
|D
iscussionP
aper|
Table 2 Data sets used in calculations of present-day snowfall
Product Time Hor res Description
MERRA 1979ndash2012 05 lat 07 lon Hourly atmospheric reanalysis data(Rienecker et al 2011)
APHRODITEV1204V1101
1979ndash2007 025 Daily temperature andprecipitation basedon observations (Yatagai et al 2012Yasutomi et al 2011)
CRU TS 320 1979ndash2011 05 Monthly temperature and precipitationbased on observations(Harris et al 2014)
TRMM 3B42 V7 1998ndash2012 05 3 hourly satellite-based precipitation(Huffman et al 2007)
GLOBE 1 km Topography data set(Hastings and Dunbar 1998)
478
TCD9 441ndash493 2015
Snowfall in theHimalayas an
uncertain future froma little-known past
E Viste and A Sorteberg
Title Page
Abstract Introduction
Conclusions References
Tables Figures
J I
J I
Back Close
Full Screen Esc
Printer-friendly Version
Interactive Discussion
Discussion
Paper
|D
iscussionP
aper|
Discussion
Paper
|D
iscussionP
aper|
Table 3 CMIP5 models and RCPs used (x) in calculations of 2071ndash2100 snowfall
Model RCP 26 RCP 85
CanESM2 x xCCSM4 x xCESM1-CAM5 xCNRM-CM5 xGFDL-CM3 x xGFDL-ESM2G xGISS-E2-R x xHadGEM2-ES x xIPSL-CM5A-LR x xIPSL-CM5A-MR x xMIROC-ESM x xMIROC-ESM-CHEM x xMIROC5 x xMRI-CGCM3 x xNorESM1-M x xNorESM1-ME x x
479
TCD9 441ndash493 2015
Snowfall in theHimalayas an
uncertain future froma little-known past
E Viste and A Sorteberg
Title Page
Abstract Introduction
Conclusions References
Tables Figures
J I
J I
Back Close
Full Screen Esc
Printer-friendly Version
Interactive Discussion
Discussion
Paper
|D
iscussionP
aper|
Discussion
Paper
|D
iscussionP
aper|
Table 4 Annual snowfall estimates for the Indus Ganges and Brahmaputra Basins S snow[km3 SWE] P precipitation [km3] S and P percent of MERRA reference snowfall andMERRA precipitation First horizontal section no bias-corrections Second third and fourthsection bias-corrections with T P and both T and P
Indus Basin Ganges Basin Brahmaputra BasinInput S S P P S S P P S S P P
MERRA reference 148 100 422 100 54 100 1147 100 119 100 733 100MERRA 166 112 422 100 49 90 1147 100 129 109 733 100MERRA T2m 154 104 422 100 42 77 1147 100 109 92 733 100T APHRODITE 113 76 422 100 30 55 1147 100 74 62 733 100T CRU 126 85 422 100 81 151 1147 100 109 92 733 100P APHRODITE 66 44 315 75 22 42 1020 89 35 30 567 77P TRMM 72 49 404 96 31 57 1244 108 63 54 835 114P CRU 84 56 398 94 30 56 1100 96 53 45 716 98P T APHRODITE 49 33 315 75 12 22 1020 89 20 17 567 77P APHRODITE T CRU 62 42 315 75 34 63 1020 89 33 28 567 77P TRMM T APHRODITE 54 36 390 92 18 34 1195 104 39 33 815 111P TRMM T CRU 65 44 403 96 46 85 1254 109 58 49 813 111P CRU T APHRODITE 65 44 395 94 17 31 1106 96 31 26 718 98P T CRU 80 54 398 94 41 75 1100 96 49 42 716 98
480
TCD9 441ndash493 2015
Snowfall in theHimalayas an
uncertain future froma little-known past
E Viste and A Sorteberg
Title Page
Abstract Introduction
Conclusions References
Tables Figures
J I
J I
Back Close
Full Screen Esc
Printer-friendly Version
Interactive Discussion
Discussion
Paper
|D
iscussionP
aper|
Discussion
Paper
|D
iscussionP
aper|
Table 5 Projected change in annual snowfall from 1971ndash2000 to 2071ndash2100 with referenceto terrain-adjusted MERRA and APHRODITE ∆Sabs [km3] is the absolute change ∆Srel [] isthe relative change compared to the present-day MERRA reference snowfall Values are pre-sented with the CMIP5 multi-model mean as the main value and the span of individual modelsin brackets (MERRA only) ∆TP indicates that changes in both temperature and precipitationare included whereas ∆P and ∆T denotes changes only in precipitation or temperature re-spectively
Indus Ganges Brahmaputra∆Sabs [km3] ∆Srel [] ∆Sabs [km3] ∆Srel [] ∆Sabs [km3] ∆Srel []
RCP 85 MERRA ∆TP minus49 [minus83minus9] minus33 [minus56minus6] minus27 [minus36minus14] minus50 [minus66minus25] minus64 [minus93minus39] minus54 [minus79minus33]MERRA ∆T minus51 [minus67minus34] minus34 [minus45minus23] minus28 [minus34minus21] minus51 [minus64minus39] minus71 [minus87minus53] minus60 [minus73minus44]MERRA ∆P 5 [minus2544] 4 [minus1730] 7 [minus417] 12 [minus731] 20 [minus1750] 17 [minus1542]
APHRO ∆TP minus25 minus51 minus7 minus56 minus13 minus67APHRO ∆T minus25 minus52 minus7 minus57 minus14 minus71APHRO ∆P 1 1 1 6 3 16
RCP 26 MERRA ∆TP minus15 [minus406] minus10 [minus274] minus10 [minus19minus3] minus18 [minus36minus5] minus25 [minus42minus5] minus21 [minus35minus4]MERRA ∆T minus18 [minus27minus9] minus12 [minus18minus6] minus12 [minus21minus6] minus21 [minus39minus11] minus29 [minus47minus13] minus25 [minus40minus11]MERRA ∆P 3 [minus1825] 2 [minus1217] 3 [minus210] 5 [minus419] 7 [minus828] 6 [minus623]
APHRO ∆TP minus9 minus18 minus2 minus20 minus6 minus29APHRO ∆T minus10 minus19 minus3 minus23 minus6 minus32APHRO ∆P 1 1 0 4 1 6
481
TCD9 441ndash493 2015
Snowfall in theHimalayas an
uncertain future froma little-known past
E Viste and A Sorteberg
Title Page
Abstract Introduction
Conclusions References
Tables Figures
J I
J I
Back Close
Full Screen Esc
Printer-friendly Version
Interactive Discussion
Discussion
Paper
|D
iscussionP
aper|
Discussion
Paper
|D
iscussionP
aper|
Figure 1 Map of the region with the Indus Ganges and Brahmaputra basins outlined in whiteThinner outlines are national borders Background NASA Visible Earth
482
TCD9 441ndash493 2015
Snowfall in theHimalayas an
uncertain future froma little-known past
E Viste and A Sorteberg
Title Page
Abstract Introduction
Conclusions References
Tables Figures
J I
J I
Back Close
Full Screen Esc
Printer-friendly Version
Interactive Discussion
Discussion
Paper
|D
iscussionP
aper|
Discussion
Paper
|D
iscussionP
aper|
0
400 mm
Months 1ndash12
SP
I1
I2I3
I5I4
G1
G2G3
G4
B1
B2
B3B4
Viste amp SortebergFigure 2
Figure 2 Monthly mean MERRA precipitation and MERRA reference snowfall in sub-basinclusters of the Indus (I) Ganges (G) and Brahmaputra (B) Total bar height MERRA precip-itation (P) [mm] Colored bars snowfall (S) [mm SWE] based on MERRA precipitation andterrain-adjusted MERRA temperature in the region with the same color Cluster 1 in eachbasin is considered snow-free and the seasonal cycles are not shown
483
TCD9 441ndash493 2015
Snowfall in theHimalayas an
uncertain future froma little-known past
E Viste and A Sorteberg
Title Page
Abstract Introduction
Conclusions References
Tables Figures
J I
J I
Back Close
Full Screen Esc
Printer-friendly Version
Interactive Discussion
Discussion
Paper
|D
iscussionP
aper|
Discussion
Paper
|D
iscussionP
aper|
a) MERRA reference b) APHRODITE c) APHRODITE ndash MERRA ref
30 km3
20100-10-20-30
Viste amp SortebergFigure 3
Figure 3 The effect of bias-corrections with APHRODITE temperature and precipitation(a) MERRA reference snowfall (b) Snowfall based on bias-corrections with APHRODITE(c) APHRODITE (b) minus MERRA reference snowfall (a)
484
TCD9 441ndash493 2015
Snowfall in theHimalayas an
uncertain future froma little-known past
E Viste and A Sorteberg
Title Page
Abstract Introduction
Conclusions References
Tables Figures
J I
J I
Back Close
Full Screen Esc
Printer-friendly Version
Interactive Discussion
Discussion
Paper
|D
iscussionP
aper|
Discussion
Paper
|D
iscussionP
aper|
Figure 4 Difference between MERRA precipitation and observation-based data (a) Annualmean MERRA precipitation (b c and d) Annual mean MERRA precipitation bias-correctedwith observations APHRODITE CRU TS and TRMM 3B42 For each data set the small insetmaps show the observations minus MERRA
485
TCD9 441ndash493 2015
Snowfall in theHimalayas an
uncertain future froma little-known past
E Viste and A Sorteberg
Title Page
Abstract Introduction
Conclusions References
Tables Figures
J I
J I
Back Close
Full Screen Esc
Printer-friendly Version
Interactive Discussion
Discussion
Paper
|D
iscussionP
aper|
Discussion
Paper
|D
iscussionP
aper|
Biasminuscorrected minus original MERRA temperature [C]
minus15
minus10
minus5
0
5
10
Biasminuscorrected minus original MERRA temperature [C]
minus15
minus10
minus5
0
5
10
MERRA mean temperature [C] 1979minus2007
minus15
minus10
minus5
0
5
10
15
20
25
30a) MERRA b) APHRODITE ndash MERRA c) CRU ndash MERRA
-10
0
10
20
30degC
minus15
minus10
minus5
0
5
10
15degC
Viste amp SortebergFigure 5
Figure 5 Difference between MERRA temperature and observation-based data (a) Annualmean MERRA temperature (b and c) Annual mean MERRA temperature bias-corrected withobservations APHRODITE and CRU TS
486
TCD9 441ndash493 2015
Snowfall in theHimalayas an
uncertain future froma little-known past
E Viste and A Sorteberg
Title Page
Abstract Introduction
Conclusions References
Tables Figures
J I
J I
Back Close
Full Screen Esc
Printer-friendly Version
Interactive Discussion
Discussion
Paper
|D
iscussionP
aper|
Discussion
Paper
|D
iscussionP
aper|
Jan Apr
Jul Oct
a)
c)
b)
d)
15degC
10
5
0
ndash5
ndash10
ndash15
200 mm16012080400ndash40ndash80ndash120ndash160ndash200
Viste amp SortebergFigure 6
Figure 6 Regions where increasing temperatures are likely to cause a shift from snow to rainData monthly mean MERRA temperature terrain-adjusted to a 4 km GLOBE grid Red temper-ature between minus5 and 0 considered critical Small inset maps monthly MERRA precipitationin the critical zones
487
TCD9 441ndash493 2015
Snowfall in theHimalayas an
uncertain future froma little-known past
E Viste and A Sorteberg
Title Page
Abstract Introduction
Conclusions References
Tables Figures
J I
J I
Back Close
Full Screen Esc
Printer-friendly Version
Interactive Discussion
Discussion
Paper
|D
iscussionP
aper|
Discussion
Paper
|D
iscussionP
aper|
1 2 3 4 5 6 7 8 9 10 11 12Month
∆T [ordm
C]
a) Indus
0
1
2
3
4
5
6
7
8
9
10
b) Ganges∆T
[ordmC
]
1 2 3 4 5 6 7 8 9 10 11 12Month
1
2
3
4
5
6
7
8
0 0
c) Brahmaputra
∆T [ordm
C]
1 2 3 4 5 6 7 8 9 10 11 12Month
1
2
3
4
5
6
7
8
9
10 RCP 85RCP 85 meanRCP 26RCP 26 mean
Viste amp SortebergFigure 7
Figure 7 Projected future temperature change from 1971ndash2000 to 2071ndash2100 in the (a) In-dus (b) Ganges and (c) Brahmaputra Basins Thin lines show the individual CMIP5 modelsstronger lines the multi-model mean
488
TCD9 441ndash493 2015
Snowfall in theHimalayas an
uncertain future froma little-known past
E Viste and A Sorteberg
Title Page
Abstract Introduction
Conclusions References
Tables Figures
J I
J I
Back Close
Full Screen Esc
Printer-friendly Version
Interactive Discussion
Discussion
Paper
|D
iscussionP
aper|
Discussion
Paper
|D
iscussionP
aper|
1 2 3 4 5 6 7 8 9 10 11 12Month
[km
3 ]
a) Indus
0
20
40
60
80
100
120
140
b) Ganges[k
m3 ]
1 2 3 4 5 6 7 8 9 10 11 12Month
0
100
200
300
400
500
600
700
c) Brahmaputra
[km
3 ]
1 2 3 4 5 6 7 8 9 10 11 12Month
0
50
100
150
200
250
MERRA ref
2071ndash2100
1979ndash2008
RCP 85RCP 85 meanRCP 26RCP 26 mean
Viste amp SortebergFigure 8
Figure 8 Projected future precipitation in the (a) Indus (b) Ganges and (c) BrahmaputraBasins Gray bars MERRA 1979ndash2008 Thin lines and horizontal marks on the bars show theindividual CMIP5 models and the multi-model mean for 2071ndash2100
489
TCD9 441ndash493 2015
Snowfall in theHimalayas an
uncertain future froma little-known past
E Viste and A Sorteberg
Title Page
Abstract Introduction
Conclusions References
Tables Figures
J I
J I
Back Close
Full Screen Esc
Printer-friendly Version
Interactive Discussion
Discussion
Paper
|D
iscussionP
aper|
Discussion
Paper
|D
iscussionP
aper|
1 2 3 4 5 6 7 8 9 10 11 120
5
10
15
20
25
30
35
Month
SWE
[km
3 ]
a) Indus
0
1
2
3
4
5
6
7
8
b) Ganges
SWE
[km
3 ]
1 2 3 4 5 6 7 8 9 10 11 12Month
0
2
4
6
8
10
12
14
16
18
20
c) Brahmaputra
SWE
[km
3 ]
1 2 3 4 5 6 7 8 9 10 11 12Month
MERRA ref
2071ndash2100
1979ndash2008
RCP 85RCP 85 meanRCP 26RCP 26 mean
Viste amp SortebergFigure 9
Figure 9 Projected future snowfall in the (a) Indus (b) Ganges and (c) Brahmaputra Basinswith reference to MERRA reference snowfall Gray bars MERRA reference snowfall for 1979ndash2008 Thin lines and horizontal marks on the bars show the individual CMIP5 models andthe multi-model mean for 2071ndash2100 based on changes in temperature and precipitation asdescribed in Sect 23
490
TCD9 441ndash493 2015
Snowfall in theHimalayas an
uncertain future froma little-known past
E Viste and A Sorteberg
Title Page
Abstract Introduction
Conclusions References
Tables Figures
J I
J I
Back Close
Full Screen Esc
Printer-friendly Version
Interactive Discussion
Discussion
Paper
|D
iscussionP
aper|
Discussion
Paper
|D
iscussionP
aper|
Figure 10 Projected future changes in snowfall in sub-basins of the Indus Ganges andBrahmaputra Basins (a) Absolute change [km3] with reference to MERRA reference snow-fall (b) Absolute change [km3] with reference to APHRODITE snowfall (c d) Correspondingrelative changes [] with reference to MERRA and APHRODITE
491
TCD9 441ndash493 2015
Snowfall in theHimalayas an
uncertain future froma little-known past
E Viste and A Sorteberg
Title Page
Abstract Introduction
Conclusions References
Tables Figures
J I
J I
Back Close
Full Screen Esc
Printer-friendly Version
Interactive Discussion
Discussion
Paper
|D
iscussionP
aper|
Discussion
Paper
|D
iscussionP
aper|
J F M A M J J A S O N DMonth
0
5
10
15
20 km3Precip
0
2
4
6
8
10 km3SWE
2000
3000
4000
5000
6000 masl
1845
J F
M
A
M
JJ A
S
O
N
D
RSL
I4A = 146793 km2
1 km 3 = 68 mm
0
05
1
15 SWE rel
8000 m
0
J F M A M J J A S O N DMonth
0
2
4
6
8
10
12 km3 SWE
3000
4000
5000
6000 masl
78
2
14
J FM
A
MJ
J AS
O
ND
RSL
I5
Precip
0
5
10
15
20
25 km3
0
05
1
15 SWE rel
8000 m
0
A = 178669 km2
1 km 3 = 56 mm
CMIP52071ndash2100mean
Today
MERRA APHRODITE
Individual models
CMIP52071ndash2100mean
MERRA APHRODITE
Individual models
CMIP52071ndash2100Precip mean
MERRA APHRODITE
Individual models
SWE todayPrecip today
2000 mTerrain distribution of area between levels
CMIP52071ndash2100
TodayMERRA
APHRODITE
a)
i)
ii)
iii)
iv)
b)
Viste amp SortebergFigure 11
Figure 11 Monthly CMIP5 RCP 85 change in snowfall precipitation and rainsnow line eleva-tion in the upper Indus clusters (a) 4 and (b) 5 from 1971ndash2000 to 2071ndash2100 with referenceto the MERRA reference (red) and APHRODITE (blue) CMIP5 multi-model means are shownas horizontal marks individual models as dots Cluster location and terrain profile are shownabove the graphs (i) Fractional change in snowfall (ii) Future snowfall [km3] (dots) comparedto today (bars) (iii) Future precipitation [km3] (dots) compared to today (bars) Snowfall todayis shown as darker part of bars (iv) Rainsnow line elevation [m asl] Gray background el-evation histogram with the of total ground area lying in the marked 2000 m intervals Barschange from today (bottom) to CMIP5 multi-model mean (top)
492
TCD9 441ndash493 2015
Snowfall in theHimalayas an
uncertain future froma little-known past
E Viste and A Sorteberg
Title Page
Abstract Introduction
Conclusions References
Tables Figures
J I
J I
Back Close
Full Screen Esc
Printer-friendly Version
Interactive Discussion
Discussion
Paper
|D
iscussionP
aper|
Discussion
Paper
|D
iscussionP
aper|
3000
4000
5000
6000 masl
0
2
4
6
8
10 km3
0
10
20
30
40
50
60 km3
0
05
1
15
J F M A M J J A S O N DMonth
J FM
A
M
JJ A
S
O
ND
Precip
SWE
RSL
SWE rel
53
B3
8000 m
0
A = 139611 km2
1 km 3 = 72 mm
4500
5000
5500
6000
6500 masl
0
1
2
3
4 km3
0
10
20
30
40
50 km3
0
05
1
15 SWE rel
SWE
RSL
Precip
95
J F M A M J J A S O N DMonth
J FM
A
M
JJ A
S
ON
D
B4
8000 m
0
A = 159165 km2
1 km 3 = 63 mm
CMIP52071ndash2100mean
Today
MERRA APHRODITE
Individual models
CMIP52071ndash2100mean
MERRA APHRODITE
Individual models
CMIP52071ndash2100Precip mean
MERRA APHRODITE
Individual models
SWE todayPrecip today
2000 mTerrain distribution of area between levels
CMIP52071ndash2100
TodayMERRA
APHRODITE
a)
i)
ii)
iii)
iv)
b)
Viste amp SortebergFigure 12
Figure 12 Monthly CMIP5 RCP 85 change in snowfall precipitation and rainsnow line ele-vation in the upper Brahmaputra clusters (a) 4 and (b) 3 See Fig 11 for a description of thecontent
493
- Introduction
-
- Observed trends in snowfall temperature and precipitation
- Future projections of snowfall temperature and precipitation
- Aims and scope
-
- Data and methods
-
- Reference present-day snowfall
- Bias-corrected present-day snowfall
- Projected snowfall
- The rain-snow line
-
- Present-day snowfall
-
- Seasonal cycles of precipitation and snowfall
- Comparison of snowfall estimates
-
- Projected future snowfall
-
- Basin-scale projections
- Regional projections
-
- Upper Indus western part
- Upper Indus eastern part
- Upper Brahmaputra western part
- Upper Brahmaputra eastern part
-
- Potential effects of reduced snowfall on water availability
-
- Concluding summary
-

TCD9 441ndash493 2015
Snowfall in theHimalayas an
uncertain future froma little-known past
E Viste and A Sorteberg
Title Page
Abstract Introduction
Conclusions References
Tables Figures
J I
J I
Back Close
Full Screen Esc
Printer-friendly Version
Interactive Discussion
Discussion
Paper
|D
iscussionP
aper|
Discussion
Paper
|D
iscussionP
aper|
leading to a possible under-registration of precipitation at the few high-elevation sta-tions that exist Comparing stations along a vertical profile in the Karakoram Winigeret al (2005) found that precipitation multiplied by a factor of 5ndash10 from 2500 masl to5000ndash6000 masl This maximum is much higher than reported in most other studiesand they attributed this to the valley-dominance of stations normally used5
Indications of too little precipitation at higher elevations were also given by Tahiret al (2011b) as APHRODITE precipitation was too low to account for the observeddischarge in the Hunza river in the Karakoram Anders et al (2006) reported thatTRMM radar data underestimated precipitation at higher elevations in the Himalayasdue to the low ability of the radar to detect very low precipitation and lowndashmoderated10
snowfall rates On the other hand Krakauer et al (2013) found that both TRMM andAPHRODITE had too much precipitation compared to observations from the few exist-ing stations at elevations above 3000 masl in Nepal
Satellite data are a promising future alternative for measuring snowfall but presentlyof limited use MODIS and LANDSAT satellite data have been used in several studies15
of snow and ice in the Himalayas (Tahir et al 2011a b Bookhagen and Burbank2010 Hewitt 2005 Krishna 2005 Negi et al 2009 Jain et al 2009 Butt 2012 Gaoet al 2012 Kulkarni et al 2010 Immerzeel et al 2009) but these data contain onlysnow cover area with no measure of the snow thickness or snow water equivalentsThe NASA AMSR-E SWE data set distributed by the National Snow and Ice Data20
Center could have been used but correlations between AMSR-E SWE and groundobservations have been shown to be poor (Tedesco and Narvekar 2010 Byun andChoi 2014 Kumar et al 2006) As AMSR-E SWE has been found underestimatesnow depth we concluded that incorporating these data into our ensemble would notlikely constrain the results nor add new information25
Defining snowfall based on MERRA precipitation and elevation-adjusted tempera-ture as a reference was done mainly to have a single reference when comparing thedata sets against each other Also we believe the elevation-adjustment of temperaturerepresents an enhancement compared to the original MERRA reanalysis MERRA was
457
TCD9 441ndash493 2015
Snowfall in theHimalayas an
uncertain future froma little-known past
E Viste and A Sorteberg
Title Page
Abstract Introduction
Conclusions References
Tables Figures
J I
J I
Back Close
Full Screen Esc
Printer-friendly Version
Interactive Discussion
Discussion
Paper
|D
iscussionP
aper|
Discussion
Paper
|D
iscussionP
aper|
chosen mainly because it has an hourly resolution allowing diurnal temperature vari-ations to affect snowfall But even though this estimate is much higher than all thebias-corrected estimates it cannot be discarded It has been argued that reanalysisdata and regional climate models may in some cases be as good as or better thanobservations in the HKH (Wiltshire 2014 Meacuteneacutegoz et al 2013 Akhtar et al 2008)5
Akhtar et al (2008) got better results when modeling river discharge in three upperIndus catchments with an RCM-based hydrological model than with one based on thefew observations available within the region They concluded that it was preferable touse RCM data directly as input to hydrological models in this region
As shown in the small inset maps in Fig 4 MERRA precipitation is higher than ob-10
served precipitation throughout the HKH and the same has previously been shownfor ERA-Interim reanalysis precipitation (Palazzi et al 2013) In MERRA the precipi-tation belt is shifted upward in the terrain compared to in the observation-based datasets Whether this shift is realistic cannot be determined as long as observations fromupper-level terrain are either missing or likely too low15
4 Projected future snowfall
Whether higher temperatures lead to less snowfall depends on whether the tempera-ture changes from below to above freezing and whether this change occurs at a timewhen there is precipitation The maps in Fig 6 illustrate where a temperature increaseis most likely to affect snowfall and snowmelt In the red zones where the monthly20
temperature today is between ndash5 and 0 C the projected temperature increase of 2ndash7 C (Chaturvedi et al 2012 Collins et al 2013 Wiltshire 2014) may be consideredcritical Such a change would change snowfall to rain and also cause a change fromfreezing to melting of snow and ice The pink zones with monthly mean temperaturesof 0ndash5 C would similarly change from a climate where precipitation may often fall as25
snow to one that is snow-free
458
TCD9 441ndash493 2015
Snowfall in theHimalayas an
uncertain future froma little-known past
E Viste and A Sorteberg
Title Page
Abstract Introduction
Conclusions References
Tables Figures
J I
J I
Back Close
Full Screen Esc
Printer-friendly Version
Interactive Discussion
Discussion
Paper
|D
iscussionP
aper|
Discussion
Paper
|D
iscussionP
aper|
In January (Fig 6a) only the lower parts of the Himalayas is affected as most ofthe region would still have temperatures well below the freezing point The small insetmap shows precipitation in the red zone a narrow band along the range Oppositelyin July (Fig 6c) the temperature is already above 5 C in most of the region though athigher elevations along the Himalayan range and in the Karakoram the change can be5
critical The most widespread changes are seen in spring and fall In April and October(Fig 6b d) large areas in the HKH and on the Tibetan Plateau risk a change frombelow to above freezing
Incorporating CMIP5 precipitation changes we find that the projected temperatureincrease has a larger impact so that snowfall will be reduced in the Indus Ganges and10
Brahmaputra Basins by 2071ndash2100 compared to today Details for the major basinsare presented in Sect 41 How much increased temperatures reduce snowfall withina region depends on the location of the rainsnow line today compared to the terraindistribution Results for selected upper-level sub-basins in the Indus and Brahmaputrawill be discussed in that context in Sect 4215
The large deviations in the estimates of present-day snowfall (Sect 3) means thatthere will be correspondingly large deviations in projected values To account for thismost results are shown with reference to the highest and lowest present-day estimatesMERRA reference snowfall and to APHRODITE-based snowfall Future estimates rela-tive to CRU and TRMM are assumed to lie between those of MERRA and APHRODITE20
41 Basin-scale projections
In the Indus Ganges and Brahmaputra Basins the CMIP5 models project a meanincrease in both temperature (Fig 7) and precipitation (Fig 8) in the region by 2071ndash2100 for both RCPs 26 and 85 The RCP 85 multi-model mean change in temper-ature varies through the year with a 49ndash62 C increase in the Indus 36ndash52 C in25
the Ganges and 42ndash60 C in the Brahmaputra The increase is smallest during thesummer months The dip in the summer is also seen though less pronounced with
459
TCD9 441ndash493 2015
Snowfall in theHimalayas an
uncertain future froma little-known past
E Viste and A Sorteberg
Title Page
Abstract Introduction
Conclusions References
Tables Figures
J I
J I
Back Close
Full Screen Esc
Printer-friendly Version
Interactive Discussion
Discussion
Paper
|D
iscussionP
aper|
Discussion
Paper
|D
iscussionP
aper|
the RCP 26 The summer is also the season with the largest absolute increase inprecipitation
Compared to present-day estimates the CMIP5 models project less snowfall in theIndus Ganges and Brahmaputra Basins in the last decades of this century This canbe seen from Fig 9 The projected multi-model mean is lower than today in all calen-5
dar months for both RCPs 26 and 85 With the RCP 26 some models suggest anincrease in some months mainly in winter and spring This is also the case for one ortwo models with the RCP 85 whereas other models indicate that the snowfall in thesame months will be only half of todayrsquos values
In the Ganges Basin (Fig 9b) the seasonal distribution of snowfall today is mainly10
flat with equal amounts of snowfall from January through September Reductions insummer snowfall with the RCP 85 would change the seasonal cycle into a winter-dominated one To a lesser degree this is also the case for RCP 26 As summerprecipitation is projected to increase in all of the Ganges (not shown but consistentwith Menon et al 2013) this indicates that large areas are at elevations where a small15
increase in the summer temperature may cause a shift from snow to rain This is seenas the red band along the upper Ganges in Fig 6c Reductions in summer snowfall arealso large in the Brahmaputra (Fig 9b) whereas in the Indus the largest total changesoccur in MarchndashMay (Fig 9a)
As the MERRA reference snowfall for today is much larger than APHRODITE snow-20
fall (Sect 32) projected absolute changes for 2071ndash2100 are also much largerin MERRA The relative changes are more similar though larger with reference toAPHRODITE Annual snowfall changes for each major basin are presented in Table 5for changes in temperature precipitation or both and with reference to MERRA andAphrodite present-day snowfall Changes at the sub-basin level are shown in Fig 1025
In the Ganges Basin both MERRA- and APHRODITE-based multi-model mean snow-fall is reduced by about 20 with the RCP 26 and 50 with the RCP 85 In theIndus and Brahmaputra Basins the differences between MERRA- and APHRODITE-based changes are larger but not as large as for the absolute values With reference
460
TCD9 441ndash493 2015
Snowfall in theHimalayas an
uncertain future froma little-known past
E Viste and A Sorteberg
Title Page
Abstract Introduction
Conclusions References
Tables Figures
J I
J I
Back Close
Full Screen Esc
Printer-friendly Version
Interactive Discussion
Discussion
Paper
|D
iscussionP
aper|
Discussion
Paper
|D
iscussionP
aper|
to MERRA and APHRODITE respectively the reduction in snowfall in the Indus Basinis 30 and 50 with the RCP 85 The corresponding reductions in the BrahmaputraBasin are 50 and 70
The projected changes in temperature have greater effect on snowfall than thechanges in precipitation When taking into account only changes in precipitation all5
snowfall estimates are positive (∆P Table 5) This indicates that the mean annual to-tal reduction for each major basin is governed by the temperature change In someCMIP5 models (values in brackets in Table 5) the effect of precipitation changes (∆P )on snowfall are of the same magnitude as the effect of temperature changes (∆T ) butfor the CMIP5 multi-model mean temperature changes cause snowfall changes 4ndash1010
times as large as those due to changes in precipitation This is with reference to thepresent-day MERRA reference snowfall and for both RCPs 26 and 85 With referenceto APHRODITE snowfall the effect of temperature changes compared to precipitationchanges is even greater
42 Regional projections15
If temperatures are far below freezing everywhere warming may have little effect onsnowfall The same applies if only the highest peaks receive snow today The largestreduction in snowfall in a basin occurs if todayrsquos rainsnow line is at an elevation justbelow the dominant elevation of the basin Then large regions will see a shift fromsnow to rain20
In the Indus Basin the largest relative snowfall reduction by 2071ndash2100 is seen inthe southwestern sub-basins where snowfall is limited today (Fig 10) The largest totalreduction is seen in the snow-rich sub-basins of KabulSwatAlingar in the west and inthe east and a smaller reduction in the inner-most basins of GilgitHunza Indus 1 andNubraShyok Together with the upper regions of the Brahmaputra these sub-basins25
clusters I4 I5 B3 and B4 in Fig 2 were selected for a closer analysis In addition tohaving the most snow these clusters are the most homogeneous when considering
461
TCD9 441ndash493 2015
Snowfall in theHimalayas an
uncertain future froma little-known past
E Viste and A Sorteberg
Title Page
Abstract Introduction
Conclusions References
Tables Figures
J I
J I
Back Close
Full Screen Esc
Printer-friendly Version
Interactive Discussion
Discussion
Paper
|D
iscussionP
aper|
Discussion
Paper
|D
iscussionP
aper|
the seasonal cycle of snowfall and snow fraction The values presented in this sectionare all from the RCP 85 for changes from today to 2071ndash2100
421 Upper Indus western part
Cluster 4 consists of the sub-basins Astor KabulSwatAlingar and Krishen GangaAs seen from the elevation profile at the top of Fig 11a the elevation span is large5
and there is an almost equal proportion of the terrain at all levels from heights close tosea level to about 5000 masl The most important change for this cluster is a largereduction in the total amount of snowfall in winter and spring
With a few exceptions all CMIP5 models project less snowfall in all months of theyear (Fig 11a i ii) The largest total multi-model mean reduction in snowfall (ii) oc-10
curs in FebruaryndashApril without notable change in the multi-model mean precipitation(iii) Thus the reduction is caused by increasing temperatures represented by therainsnow line in Fig 11a iv As seen from the change in the rainsnow line elevationthe projected temperature increase in these months would imply that large areas thatreceive snow today would receive only rain About 40 of the ground in this cluster lies15
below 2000 masl and receives precipitation as rain throughout the year In summerprecipitation (iii) is at a minimum and the rainsnow line (iv) is already so high that onlya small fraction of the area receives snowfall today Thus although the relative changein snowfall (i) is largest in summer the change in the amount of snowfall (ii) is small Itshould also be noted that the change in the rainsnow line elevation (iv) in summer is20
much smaller 400ndash600 m compared to 600ndash900 m in DecemberndashApril
422 Upper Indus eastern part
Further east the largest changes are projected for the spring season Cluster 5 in theIndus Basin consists of the sub-basins GilgitHunza Indus 1 NubraShyok and Zan-skar As shown in Fig 11b this is high-elevation terrain with 80 of the ground lying25
above 4000 masl As a result almost all winter precipitation is snow (Fig 11b iii)
462
TCD9 441ndash493 2015
Snowfall in theHimalayas an
uncertain future froma little-known past
E Viste and A Sorteberg
Title Page
Abstract Introduction
Conclusions References
Tables Figures
J I
J I
Back Close
Full Screen Esc
Printer-friendly Version
Interactive Discussion
Discussion
Paper
|D
iscussionP
aper|
Discussion
Paper
|D
iscussionP
aper|
For the multi-model mean no big changes are projected in JanuaryndashFebruary This ispartly because of little change in precipitation (iii) and because the rainsnow line (iv)in these months is sufficiently low in the terrain today With the 500ndash600 m shift pro-jected with the RCP 85 80ndash90 of the area will still have temperatures low enoughfor snow The largest changes occur in MarchndashOctober when higher temperatures5
push the rainsnow line above large areas that receive snow today Increasing summerprecipitation (iii) causes the snowfall reduction in summer to be less than it would other-wise be The effect of higher temperatures is smaller on the APHRODITE snowfall thanon the MERRA reference snowfall (ii) as APHRODITE has very little summer snow-fall today The difference arises both from less precipitation (iii) in APHRODITE than10
MERRA today and from a higher rainsnow line (iv) in APHRODITE Note that as thechange in precipitation was defined as a fraction of the present-day value (Sect 23)the relative changes in APHRODITE and MERRA precipitation are equal
423 Upper Brahmaputra western part
In the westernmost part of the upper Brahmaputra Basin large snowfall changes are15
projected for the summer As cluster 5 in the Indus Basin Brahmaputrarsquos cluster 4 islimited to higher grounds Less than 6 lies outside of the 4000ndash6000 masl rangeThe cluster consists of Maquan He Yarlung Zangbo Dogxung ZangboMaiqu ZangboShang ChuYarlung ZangboNyang Lhasa HeRazheng Zangbo and Yamzho YumcoThe summer monsoon fully dominates the seasonal cycle of precipitation in this region20
(Fig 12a iii) resulting in a unimodal snow cycle with a maximum in JulyndashSeptember InAPHRODITE the seasonal cycle of snowfall is similar but less pronounced than in theMERRA reference The summer also sees the greatest reduction in CMIP5 projectedsnowfall both in absolute (ii) and relative (i) terms despite increasing summer precip-itation in all models (iii) The reason can be seen from the change in the rainsnow25
line elevation (iv) In the warmest months July and August elevation changes of 400ndash500 m would shift the rainsnow line from a level where at least 5ndash10 of the groundlies above the line to a level where only 1 of the area would receive precipitation as
463
TCD9 441ndash493 2015
Snowfall in theHimalayas an
uncertain future froma little-known past
E Viste and A Sorteberg
Title Page
Abstract Introduction
Conclusions References
Tables Figures
J I
J I
Back Close
Full Screen Esc
Printer-friendly Version
Interactive Discussion
Discussion
Paper
|D
iscussionP
aper|
Discussion
Paper
|D
iscussionP
aper|
snow In comparison with reference to MERRA the 300ndash400 m shift seen in JanuaryndashFebruary would cause only a small absolute change in snowfall (ii) because there islittle precipitation in these months (ii) and a small relative change (i) because therainsnow line would still be low in the terrain (iv) With reference to APHRODITE therelative snowfall change in winter would be larger than with reference to MERRA as5
temperatures today are higher resulting in a higher rainsnow line (iv)
424 Upper Brahmaputra eastern part
Like further west the Indian summer monsoon dominates the precipitation cycle in theeastern part of upper Brahmaputra (Fig 12b iii) but the seasonal cycle of snowfallpeaks in spring and fall (iii) This is also the time of the largest projected changes10
Cluster 3 in the Brahmaputra consists of the sub-basins Yarlung Zangbo2 NyangQu Yarlung Zangbo3 Yirsquoong ZangboParl Siyom Zaya QuLuhitDi About 70 of theground lies between 3000 and 6000 masl but there is also land almost at sea levelmainly in the Zaya QuLuhitDingba Qu sub-basin During summer most of the terrainlies below the rainsnow line (iv) In spring temperatures are lower than in summer15
and pre- monsoon precipitation is stronger in this part of the Himalayas than furtherwest in cluster 3 (Fig 12a iii vs Fig 12b iii) As a result MarchndashApril gets the mostsnow
Reductions in snowfall are projected for all months (ii) comparable in magnitude butlargest in the snow-rich spring and late summer The CMIP5 multi-model mean shows20
increasing or no change in precipitation in all months (Fig 12b iii) so the reductionin snowfall is due solely to higher temperatures The largest absolute reductions inApril and May occur with a 700ndash800 m shift in the rainsnow line elevation leaving30 more of the terrain in the rain The largest relative reduction in future snowfall areprojected for July and August (Fig 12b i) when the rainsnow line shifts so high that25
only the highest peaks can get precipitation as snow (iv) This would be despite thelowest changes in the rainsnow line only about 300 m in APHRODITE
464
TCD9 441ndash493 2015
Snowfall in theHimalayas an
uncertain future froma little-known past
E Viste and A Sorteberg
Title Page
Abstract Introduction
Conclusions References
Tables Figures
J I
J I
Back Close
Full Screen Esc
Printer-friendly Version
Interactive Discussion
Discussion
Paper
|D
iscussionP
aper|
Discussion
Paper
|D
iscussionP
aper|
43 Potential effects of reduced snowfall on water availability
With a few exceptions the CMIP5 multi-model mean precipitation change over the com-ing century is positive in all months in the upper Indus and Brahmaputra (Sect 42)Thus the projected reduction in snowfall is due solely to higher temperatures How-ever there is a large spread in precipitation projections among the models If tempera-5
tures increase as much as projected with the RCP 85 could any realistic precipitationchange in the HKH compensate and maintain present-day snowfall Results indicatethat this may happen in parts of the upper Indus but is out of the reach in the upperBrahmaputra As for water availability reduced snowfall may still cause more severeproblems in the Indus than in the Brahmaputra10
In cold regions where temperatures remain below freezing more winter precipita-tion may increase both the snow cover area the length of the snow season and theSWE (Collins et al 2013 Brutel-Vuilmet et al 2013 Raumlisaumlnen 2008 Gao et al 2012Wiltshire 2014) Raumlisaumlnen (2008) showed this to be the case in eastern Siberia andthe northernmost part of North America At the southern edge of the seasonal snow15
cover relevant for this study precipitation did not compensate and there was a reduc-tion in SWEWiltshire (2014) concluded that there would be small changes in snowfallin very cold and very warm regions of the HKH Snowfall in Nepal Bhutan and Hi-machal Pradesh where winters are warmer than in most parts of the range was mostvulnerable to higher temperatures The data presented in Sect 42 generally support20
the previous studiesOne of the reasons that precipitation does not compensate is that the highest pro-
jected precipitation increase in the HKH is seen in the summer when the temperaturetoday is so high that only the highest terrain is in the snow zone Shifting the rainsnowline upward even by only a few hundred meters reduces the area that receives snow25
greatly requiring very large increases in precipitation to compensate The summer isthe season with the largest relative reduction in snowfall in all the clusters described inSect 42 Except in the western upper Indus (cluster I4 Sect 421) which has very
465
TCD9 441ndash493 2015
Snowfall in theHimalayas an
uncertain future froma little-known past
E Viste and A Sorteberg
Title Page
Abstract Introduction
Conclusions References
Tables Figures
J I
J I
Back Close
Full Screen Esc
Printer-friendly Version
Interactive Discussion
Discussion
Paper
|D
iscussionP
aper|
Discussion
Paper
|D
iscussionP
aper|
little summer snowfall today the reduction in summer snowfall is notable in all clustersin the MERRA data in the Brahmaputra clusters also in APHRODITE
The largest change in snowfall is seen in the western part of the Brahmaputra (clus-ter B4 Sect 423) where a 400ndash500 m upward shift in the rainsnow line during sum-mer reduces the area with temperatures low enough for snowfall by a factor of 5ndash105
(Fig 12a iv values not shown) As a result the summer peak in the seasonal cycleof snowfall is replaced by a dip (Fig 12a ii) With an even distribution of precipitationwith elevation the area that still receives snow would have to receive 5ndash10 times asmuch precipitation to compensate for the lost snowfall Assuming more realisticallythat precipitation decreases above a certain height would require an even higher in-10
crease in precipitation In the model with the highest increase a doubling of the Julyprecipitation by the end of the century SWE is less than 25 of todayrsquos value in thatmonth (Fig 12a iii)
With a winter-dominated precipitation cycle the relative change in snowfall is smallerin the upper Indus than in the upper Brahmaputra Downscaling a high-emission sce-15
nario (A1B) in two CMIP3 models with a regional model Wiltshire (2014) found that bythe 2080s precipitation increased more than enough to compensate for higher temper-atures in the Karakoram Hindu Kush and Jammu and Kashmir in one of the modelsthe HadCM3 In the other model ECHAM5 precipitation increased less and snow-fall increased only in the higher parts of the Karakoram In our ensemble of CMIP520
models multi-model mean precipitation in the upper Indus clusters increases mainlyin the summer season when the inter-model spread is also the largest (Fig 11a iiiand 11b iii) Among the models 4ndash5 project increased winter precipitation in the upperIndus and in the uppermost cluster I5 this is associated with an increase in wintersnowfall (Fig 11b ii)25
Although it is the part of the HKH where snowfall is least reduced by increasingtemperatures (Fig 10b) the Karakoram and inner parts of the upper Indus may still bethe region where the changes have the largest impact on river run-off Compared tothe monsoon-dominated regions further east there is little summer precipitation and
466
TCD9 441ndash493 2015
Snowfall in theHimalayas an
uncertain future froma little-known past
E Viste and A Sorteberg
Title Page
Abstract Introduction
Conclusions References
Tables Figures
J I
J I
Back Close
Full Screen Esc
Printer-friendly Version
Interactive Discussion
Discussion
Paper
|D
iscussionP
aper|
Discussion
Paper
|D
iscussionP
aper|
much of the water in the rivers during summer is meltwater (Bookhagen and Burbank2010 Immerzeel et al 2010) As melting of snow and ice has not been analyzed inthis study we cannot quantify the effect of reduced snowmelt om river run-off but it isobvious that eventually reduced snowfall will lead to reduced melting In western partsof the HKH this may lead to changes in the seasonal cycle of the river flow5
As pointed out by Wiltshire (2014) increasing precipitation in the eastern HKH im-plies that water resources are likely to increase with climate change As snowfall andsnowmelt are both at maximum during summer (Rees and Collins 2006) meltwaterdoes not have the same importance for river flow in dry parts of the year as in the In-dus Reduced snowfall may reduce glaciers but ndash not considering potential changes in10
the amount of evaporation ndash there is no indication that there will be less water comingfrom the upper Brahmaputra
5 Concluding summary
In this study we have presented a suite of estimates of present-day snowfall in theIndus Ganges and Brahmaputra Basins and the changes in snowfall that would follow15
from CMIP5 projected changes in temperature and precipitation from 1971ndash2000 to2071ndash2100 The results show that if the temperature increases as much as in the RCP85 there will be much less snowfall despite increasing precipitation in most of theregion Limiting anthropogenic forcing to the RCP 26 level would still cause reductionsthough smaller20
Estimates of present-day snowfall based on a combination of temperature and pre-cipitation from reanalysis data and observations vary by factors of 2ndash4 The MERRAreanalysis gives higher estimates than TRMM 3B42 CRU TS and APHRODITE butthe spread is also large between the estimates based on the different observationallybased data sets This demonstrates the difficulties in assessing vulnerability to climate25
change in the region With limited knowledge of the current state future conditions arebound to be uncertain
467
TCD9 441ndash493 2015
Snowfall in theHimalayas an
uncertain future froma little-known past
E Viste and A Sorteberg
Title Page
Abstract Introduction
Conclusions References
Tables Figures
J I
J I
Back Close
Full Screen Esc
Printer-friendly Version
Interactive Discussion
Discussion
Paper
|D
iscussionP
aper|
Discussion
Paper
|D
iscussionP
aper|
Future changes in temperature and precipitation projected by climate models can stillprovide an indication of the relative change in snowfall With the RCP 85 the climatemodels project mean reductions in annual snowfall by 30ndash50 in the Indus Basin 50ndash60 in the Ganges Basin and 50ndash70 in the Brahmaputra Basin by 2071ndash2100 Withthe RCP 26 the corresponding reductions would be 10ndash20 in the Indus about 20 5
in the Ganges and 20ndash30 in the Brahmaputra The reductions are due to increasingtemperatures as the mean of the models show constant or increasing precipitationthroughout the year in most of the region
How much increasing temperatures reduce snowfall in a region depends on howmuch of the terrain that is below and above the freezing point today and on whether10
the terrain profile is such that the temperature increase transforms large areas fromsnow to rain zones With the RCP 85 the mean elevation where rain changes to snowndash the rainsnow line ndash creeps upward by 400ndash900 m in most of the region by 700ndash900 m
The largest relative change in snowfall is seen in the upper westernmost sub-basins15
of the Brahmaputra despite increasing precipitation and the lowest rainsnow line el-evation change (400ndash500 m) This is because a major part of this region is near thefreezing point today With the RCP 85 most of this region will have temperaturesabove freezing especially in the summer which is the wettest part of the year Theprojected reduction in annual snowfall is 65ndash75 20
In the upper Indus the effect of a warmer climate on snowfall is less extreme asmost of the terrain is high enough to have temperatures sufficiently far below freezingtoday Winter and spring brings most of the precipitation and the projected 600ndash800 mchange in the rainsnow line elevation during these seasons would leave most of theterrain below the freezing point Still a 20ndash40 reduction in annual snowfall is pro-25
jected with the RCP 85The range of our estimates of present-day snowfall illustrates how little that is known
about conditions that influence the availability of drinking water in some of the mostdensely populated parts of the world There is both a scientific and a societal need
468
TCD9 441ndash493 2015
Snowfall in theHimalayas an
uncertain future froma little-known past
E Viste and A Sorteberg
Title Page
Abstract Introduction
Conclusions References
Tables Figures
J I
J I
Back Close
Full Screen Esc
Printer-friendly Version
Interactive Discussion
Discussion
Paper
|D
iscussionP
aper|
Discussion
Paper
|D
iscussionP
aper|
for more information about precipitation in the HKH As a full-scale long-time observa-tional program covering all parts of the Himalayan range is not a likely possibility theonly hope for improved future knowledge of Himalayan snowfall lies in the improvementof satellite data and regional climate models
The Supplement related to this article is available online at5
doi105194tcd-9-441-2015-supplement
Acknowledgements This work has been carried out with support from the University of Bergenthe NORINDIA and SNOWHIM projects funded by The Research Council of Norway and theCentre for Climate Dynamics at the Bjerknes Centre for Climate Research We acknowledgethe World Climate Research Programmersquos Working Group on Coupled Modelling which is re-10
sponsible for CMIP and we thank the climate modeling groups listed in Table 3 of this paper forproducing and making available their model output For CMIP the US Department of EnergyrsquosProgram for Climate Model Diagnosis and Intercomparison provides coordinating support andled development of software infrastructure in partnership with the Global Organization for EarthSystem Science Portals15
References
Akhtar M Ahmad N and Booij M J The impact of climate change on the water resourcesof Hindukush-Karakorum-Himalaya region under different glacier coverage scenarios J Hy-drol 355 148ndash163 2008
Anders A M Roe G H Hallet B Montgomery D R Finnegan N J and Putkonen J20
Spatial patterns of precipitation and topography in the Himalaya in Tectonics Climate andLandscape Evolution Geological Society of America Special Paper edited by Willett S DHovius N Brandon M T and Fisher D Geological Society of America Boulder CO USA39ndash53 2006
469
TCD9 441ndash493 2015
Snowfall in theHimalayas an
uncertain future froma little-known past
E Viste and A Sorteberg
Title Page
Abstract Introduction
Conclusions References
Tables Figures
J I
J I
Back Close
Full Screen Esc
Printer-friendly Version
Interactive Discussion
Discussion
Paper
|D
iscussionP
aper|
Discussion
Paper
|D
iscussionP
aper|
Archer DR and Fowler HJ Spatial and temporal variations in precipitation in the UpperIndus Basin global teleconnections and hydrological implications Hydrol Earth Syst Sci8 47ndash61 doi105194hess-8-47-2004 2004
Bhutiyani M R Kale V S and Pawar N J Long-term trends in maximum minimum andmean annual air temperatures across the Northwestern Himalaya during the twentieth cen-5
tury Climatic Change 85 159ndash177 doi101007s10584-006-9196-1 2007Bhutiyani M R Kale V S and Pawar N J Climate change and the precipitation variations in
the northwestern Himalaya 1866ndash2006 Int J Climatol 30 535ndash548 doi101002joc19202010
Bookhagen B and Burbank D W Topography relief and TRMM-derived rainfall variations10
along the Himalaya Geophys Res Lett 33 L08405 doi1010292006GL026037 2006Bookhagen B and Burbank D W Toward a complete Himalayan hydrological budget spa-
tiotemporal distribution of snowmelt and rainfall and their impact on river discharge J Geo-phys Res 115 F03019 doi1010292009jf001426 2010
Franco B Fettweis X and Erpicum M Future projections of the Greenland ice sheet energy15
balance driving the surface melt The Cryosphere 7 1ndash18 doi105194tc-7-1-2013 2013Butt M J Characteristics of snow cover in the Hindukush Karakoram and Himalaya region
using Landsat satellite data Hydrol Process 10 3689ndash3698 doi101002hyp8375 2012Byun K and Choi M Uncertainty of snow water equivalent retrieved from AMSR-E brightness
temperature in northeast Asia Hydrol Process 28 12 doi101002hyp9846 201420
Chaturvedi R K Joshi J Jayaraman M Bala G and Ravindranath N H Multi-modelclimate change projections for India under representative concentration pathways Curr SciIndia 103 791ndash802 2012
Christensen J H Krishna Kumar K Aldrian E An S-I Cavalcanti I F A Castro Md Dong W Goswami P Hall A Kanyanga J K Kitoh A Kossin J Lau N-C Ren-25
wick J Stephenson D B Xie S-P and Zhou T Climate phenomena and their relevancefor future regional climate change in Climate Change 2013 The Physical Science BasisContribution of Working Group I to the Fifth Assessment Report of the Intergovernmen-tal Panel on Climate Change edited by Stocker T F Qin D Plattner G-K Tignor MAllen S K Boschung J Nauels A Xia Y Bex V and Midgley P M Cambridge Univer-30
sity Press Cambridge UK and New York NY USA 92 2013Collins M Knutti R Arblaster J Dufresne J-L Fichefet T Friedlingstein P Gao X
Gutowski W J Johns T Krinner G Shongwe M Tebaldi C Weaver A J and
470
TCD9 441ndash493 2015
Snowfall in theHimalayas an
uncertain future froma little-known past
E Viste and A Sorteberg
Title Page
Abstract Introduction
Conclusions References
Tables Figures
J I
J I
Back Close
Full Screen Esc
Printer-friendly Version
Interactive Discussion
Discussion
Paper
|D
iscussionP
aper|
Discussion
Paper
|D
iscussionP
aper|
Wehner M Long-term climate change projections commitments and irreversibility in Cli-mate Change 2013 The Physical Science Basis Contribution of Working Group I to theFifth Assessment Report of the Intergovernmental Panel on Climate Change edited byStocker T F Qin D Plattner G-K Tignor M Allen S K Boschung J Nauels AXia Y Bex V and Midgley P M Cambridge University Press Cambridge UK and New5
York NY USA 108 2013Cook E R Palmer J G Ahmed M Woodhouse C A Fenwick P Zafar M U Wahab M
and Khan N Five centuries of Upper Indus River flow from tree rings J Hydrol 486 365ndash375 doi101016jjhydrol201302004 2013
Dai A Temperature and pressure dependence of the rain-snow phase transition over land and10
ocean Geophys Res Lett 35 L12802 doi1010292008gl033295 2008Fowler H J and Archer D R Conflicting signals of climatic change in the Upper Indus Basin
J Climate 19 4276ndash4293 doi101175jcli38601 2006Gao J Williams M W Fu X Wang G and Gong T Spatiotemporal distribution of snow
in eastern Tibet and the response to climate change Remote Sens Environ 121 1ndash915
doi101016jrse201201006 2012Gardelle J Berthier E and Arnaud Y Slight mass gain of Karakoram glaciers in the
early twenty-first century ndash Supplement Nature Geosci 5 322ndash325 doi101038ngeo14502012
Guhathakurta P and Rajeevan M Trends in the rainfall pattern over India Int J Climatol20
28 1453ndash1469 doi101002joc1640 2008Harris I Jones P D Osborn T J and Lister D H Updated high-resolution grids of
monthly climatic observations ndash the CRU TS310 Dataset Int J Climatol 34 623ndash642doi101002joc3711 2014
Hartmann H and Andresky L Flooding in the Indus River basin ndash a spa-25
tiotemporal analysis of precipitation records Global Planet Change 107 25ndash35doi101016jgloplacha201304002 2013
Hastings D and Dunbar P Development amp Assessment of the Global Land One-km BaseElevation Digital Elevation Model (GLOBE) ISPRS Commission IV Symposium on GIS ndashBetween Visions and Applications Stuttgart Germany 7ndash10 September 199830
Hewitt K The Karakoram anomaly Glacier expansion and the ldquoelevation ef-fectrdquo Karakoram Himalaya Mt Res Dev 25 332ndash340 doi1016590276-4741(2005)025[0332TKAGEA]20CO2 2005
471
TCD9 441ndash493 2015
Snowfall in theHimalayas an
uncertain future froma little-known past
E Viste and A Sorteberg
Title Page
Abstract Introduction
Conclusions References
Tables Figures
J I
J I
Back Close
Full Screen Esc
Printer-friendly Version
Interactive Discussion
Discussion
Paper
|D
iscussionP
aper|
Discussion
Paper
|D
iscussionP
aper|
Huffman G J Adler R F Bolvin D T Gu G Nelkin E J Bowman K P Hong YStocker E F and Wolff D B The TRMM Multisatellite Precipitation Analysis (TMPA) quasi-global multiyear combined-sensor precipitation estimates at fine scales J Hydrometeorol8 38ndash55 2007
Immerzeel W Historical trends and future predictions of climate variability in the Brahmaputra5
basin Int J Climatol 28 243ndash254 doi101002joc1528 2008Immerzeel W W Droogers P de Jong S M and Bierkens M F P Large-scale monitoring
of snow cover and runoff simulation in Himalayan river basins using remote sensing RemoteSens Environ 113 40ndash49 doi101016jrse200808010 2009
Immerzeel W W van Beek L P H and Bierkens M F P Climate change will affect the10
asian water towers Science 328 1382ndash1385 doi101126science1183188 2010Ines A V M and Hansen J W Bias correction of daily GCM rainfall for crop simulation
studies Agr Forest Meteorol 138 44ndash53 doi101016jagrformet200603009 2006Jain S K Goswami A and Saraf A K Role of elevation and aspect in snow distribution
in western Himalaya Water Resour Manag 23 71ndash83 doi101007s11269-008-9265-515
2009Krakauer N Pradhanang S Lakhankar T and Jha A Evaluating satellite products for
precipitation estimation in mountain regions a case study for Nepal Remote Sensing 54107ndash4123 2013
Krishna A P Snow and glacier cover assessment in the high mountains of Sikkim Himalaya20
Hydrol Process 19 2375ndash2383 doi101002hyp5890 2005Kulkarni A V Rathore B P Singh S K and Ajai Distribution of seasonal snow cover in cen-
tral and western Himalaya Ann Glaciol 51 123ndash128 doi1031891727564107913864452010
Kumar V Rao Y S Venkataraman G Sarwade R N and Mani S Analysis of Aqua25
AMSR-E Derived Snow Water Equivalent over Himalayan Snow Covered Regions Geo-science and Remote Sensing Symposium Denver CO USA 31 Julyndash4 August 2006
Kaumlaumlb A Berthier E Nuth C Gardelle J and Arnaud Y Contrasting patterns of earlytwenty-first-century glacier mass change in the Himalayas Nature 488 495ndash498 availableat httpwwwnaturecomnaturejournalv488n7412absnature11324html ndash Supplement30
2012Lehner B Verdin K and Jarvis A New global hydrography derived from spaceborne eleva-
tion data Eos T Am Geophys Un 89 93ndash94 doi1010292008EO100001 2008
472
TCD9 441ndash493 2015
Snowfall in theHimalayas an
uncertain future froma little-known past
E Viste and A Sorteberg
Title Page
Abstract Introduction
Conclusions References
Tables Figures
J I
J I
Back Close
Full Screen Esc
Printer-friendly Version
Interactive Discussion
Discussion
Paper
|D
iscussionP
aper|
Discussion
Paper
|D
iscussionP
aper|
MacQueen J Some Methods for Classification and Analysis of Multivariate ObservationsFifth Berkeley Symposium on Mathematical Statistics and Probability Berkeley California21 Junendash18 July 1967
Meacuteneacutegoz M Galleacutee H and Jacobi H W Precipitation and snow cover in the Himalayafrom reanalysis to regional climate simulations Hydrol Earth Syst Sci 17 3921ndash39365
doi105194hess-17-3921-2013 2013Menon A Levermann A Schewe J Lehmann J and Frieler K Consistent increase in
Indian monsoon rainfall and its variability across CMIP-5 models Earth Syst Dynam 4287ndash300 doi105194esd-4-287-2013 2013
Moss R H Edmonds J A Hibbard K A Manning M R Rose S K van Vuuren D P10
Carter T R Emori S Kainuma M Kram T Meehl G A Mitchell J F B Naki-cenovic N Riahi K Smith S J Stouffer R J Thomson A M Weyant J P andWilbanks T J The next generation of scenarios for climate change research and assess-ment Nature 463 747ndash756 2010
Negi H S Kulkarni A V and Semwal B S Estimation of snow cover distribution in Beas15
basin Indian Himalaya using satellite data and ground measurements J Earth Syst Sci118 525ndash538 doi101007s12040-009-0039-0 2009
Palazzi E v Hardenberg J and Provenzale A Precipitation in the Hindu-Kush Karako-ram Himalaya observations and future scenarios J Geophys Res-Atmos 118 85ndash100doi1010292012JD018697 201320
Rees H G and Collins D N Regional differences in response of flow in glacier-fed Himalayanrivers to climatic warming Hydrol Process 20 2157ndash2169 doi101002hyp6209 2006
Rienecker M M Suarez M J Gelaro R Todling R Bacmeister J Liu EBosilovich M G Schubert S D Takacs L Kim G-K Bloom S Chen J Collins DConaty A da Silva A Gu W Joiner J Koster R D Lucchesi R Molod A Owens T25
Pawson S Pegion P Redder C R Reichle R Robertson F R Ruddick A GSienkiewicz M and Woollen J MERRA NASArsquos Modern-Era Retrospective Analysis forResearch and Applications J Climate 24 3624ndash3648 doi101175JCLI-D-11-0001512011
Rikiishi K and Nakasato H Height dependence of the tendency for reduction in seasonal30
snow cover in the Himalaya and the Tibetan Plateau region 1966ndash2001 Ann Glaciol 43369ndash377 doi103189172756406781811989 2006
473
TCD9 441ndash493 2015
Snowfall in theHimalayas an
uncertain future froma little-known past
E Viste and A Sorteberg
Title Page
Abstract Introduction
Conclusions References
Tables Figures
J I
J I
Back Close
Full Screen Esc
Printer-friendly Version
Interactive Discussion
Discussion
Paper
|D
iscussionP
aper|
Discussion
Paper
|D
iscussionP
aper|
Raumlisaumlnen J Warmer climate less or more snow Clim Dynam 30 307ndash319doi101007s00382-007-0289-y 2008
Schaner N Voisin N Nijssen B and Lettenmaier D P The contribution of glacier melt tostreamflow Environ Res Lett 7 034029 doi1010881748-932673034029 2012
Scherler D Bookhagen B and Strecker M R Spatially variable response of Himalayan5
glaciers to climate change affected by debris cover Nature Geosci 4 156ndash159 availableat httpwwwnaturecomngeojournalv4n3absngeo1068html ndash Supplement 2011
Sharif M Archer D R Fowler H J and Forsythe N Trends in timing and magnitude offlow in the Upper Indus Basin Hydrol Earth Syst Sci 17 1503ndash1516 doi105194hess-17-1503-2013 201310
Shekhar M S Chand H Kumar S Srinivasan K and Ganju A Climate-change studiesin the western Himalaya Ann Glaciol 51 105ndash112 doi1031891727564107913865082010
Shrestha A B Wake C P Mayewski P A and Dibb J E Maximum tempera-ture trends in the Himalaya and its vicinity an analysis based on temperature records15
from Nepal for the period 1971ndash94 J Climate 12 2775ndash2786 doi1011751520-0442(1999)012lt2775MTTITHgt20CO2 1999
Shrestha A B Wake C P Dibb J E and Mayewski P A Precipitation fluctuations in theNepal Himalaya and its vicinity and relationship with some large scale climatological parame-ters Int J Climatol 20 317ndash327 doi101002(SICI)1097-0088(20000315)203lt317AID-20
JOC476gt30CO2-G 2000Siderius C Biemans H Wiltshire A Rao S Franssen W H P Kumar P Gosain A K
van Vliet M T H and Collins D N Snowmelt contributions to discharge of the GangesSci Total Environ Supplement 468ndash469 9 doi101016jscitotenv201305084 2013
Singh P Jain S K and Kumar N Estimation of snow and glacier-melt contribution to the25
Chenab River Western Himalaya Mt Res Dev 17 49ndash56 doi1023073673913 1997Singh P Kumar V Thomas T and Arora M Changes in rainfall and relative hu-
midity in river basins in northwest and central India Hydrol Process 22 2982ndash2992doi101002hyp6871 2008
Sontakke N A Singh N and Singh H N Instrumental period rainfall series of the Indian30
region (AD 1813ndash2005) revised reconstruction update and analysis Holocene 18 1055ndash1066 doi1011770959683608095576 2008
474
TCD9 441ndash493 2015
Snowfall in theHimalayas an
uncertain future froma little-known past
E Viste and A Sorteberg
Title Page
Abstract Introduction
Conclusions References
Tables Figures
J I
J I
Back Close
Full Screen Esc
Printer-friendly Version
Interactive Discussion
Discussion
Paper
|D
iscussionP
aper|
Discussion
Paper
|D
iscussionP
aper|
Sperber K R Annamalai H Kang I S Kitoh A Moise A Turner A Wang B andZhou T The Asian summer monsoon an intercomparison of CMIP5 vs CMIP3 simulationsof the late 20th century Clim Dynam 41 2711ndash2744 doi101007s00382-012-1607-62013
Tahir A A Chevallier P Arnaud Y and Ahmad B Snow cover dynamics and hydrological5
regime of the Hunza River basin Karakoram Range Northern Pakistan Hydrol Earth SystSci 15 2275ndash2290 doi105194hess-15-2275-2011 2011a
Tahir A A Chevallier P Arnaud Y Neppel L and Ahmad B Modeling snowmelt-runoffunder climate scenarios in the Hunza River basin Karakoram Range Northern Pakistan JHydrol 409 104ndash117 doi101016jjhydrol201108035 2011b10
Taylor K E Stouffer R J and Meehl G A An overview of CMIP5 and the experimentdesign B Am Meteorol Soc 93 14 doi101175BAMS-D-11-000941 2011
Tedesco M and Narvekar P S Assessment of the NASA AMSR-E SWE product IEEE J SelTop Appl 3 141ndash159 doi101109JSTARS20102040462 2010
Teutschbein C and Seibert J Bias correction of regional climate model simulations for hydro-15
logical climate-change impact studies review and evaluation of different methods J Hydrol456ndash457 12ndash29 doi101016jjhydrol201205052 2012
Turner A G and Annamalai H Climate change and the South Asian summer monsoon NatClim Change 2 587ndash595 2012
van Vuuren D Edmonds J Kainuma M Riahi K Thomson A Hibbard K Hurtt G20
Kram T Krey V Lamarque J-F Masui T Meinshausen M Nakicenovic N Smith Sand Rose S The representative concentration pathways an overview Climatic Change109 26 doi101007s10584-011-0148-z 2011
Wang A and Zeng X Development of global hourly 05-degree land surface air temperaturedatasets J Climate 26 7676ndash7691 doi101175JCLI-D-12-006821 201325
Wiltshire A J Climate change implications for the glaciers of the Hindu Kush Karakoram andHimalayan region The Cryosphere 8 941ndash958 doi105194tc-8-941-2014 2014
Winiger M Gumpert M and Yamout H KarakorumndashHindukushndashwestern Himalaya assess-ing high-altitude water resources Hydrol Process 19 2329ndash2338 doi101002hyp5887200530
Xu X Lu C Shi X and Gao S World water tower An atmospheric perspective GeophysRes Lett 35 L20815 doi1010292008GL035867 2008a
475
TCD9 441ndash493 2015
Snowfall in theHimalayas an
uncertain future froma little-known past
E Viste and A Sorteberg
Title Page
Abstract Introduction
Conclusions References
Tables Figures
J I
J I
Back Close
Full Screen Esc
Printer-friendly Version
Interactive Discussion
Discussion
Paper
|D
iscussionP
aper|
Discussion
Paper
|D
iscussionP
aper|
Xu Z X Gong T L and Li J Y Decadal trend of climate in the Tibetan Plateaumdashregionaltemperature and precipitation Hydrol Process 22 3056ndash3065 doi101002hyp68922008b
Yasutomi N Hamada A and Akiyo Y Development of a Long-term Daily Gridded Temper-ature Dataset and its Application to RainSnow Discrimination of Daily Precipitation Global5
Environ Res15 165ndash172 2011Yatagai A Kamiguchi K Arakawa O Hamada A Yasutomi N and Kitoh A APHRODITE
Constructing a Long-Term Daily Gridded Precipitation Dataset for Asia Based on a DenseNetwork of Rain Gauges B Am Meteorol Soc 93 1401ndash1415 doi101175BAMS-D-11-001221 201210
You Q Kang S Aguilar E and Yan Y Changes in daily climate extremes in the east-ern and central Tibetan Plateau during 1961ndash2005 J Geophys Res-Atmos 113 D07101doi1010292007JD009389 2008
476
TCD9 441ndash493 2015
Snowfall in theHimalayas an
uncertain future froma little-known past
E Viste and A Sorteberg
Title Page
Abstract Introduction
Conclusions References
Tables Figures
J I
J I
Back Close
Full Screen Esc
Printer-friendly Version
Interactive Discussion
Discussion
Paper
|D
iscussionP
aper|
Discussion
Paper
|D
iscussionP
aper|
Table 1 Combinations of data types used in snowfall estimates T temperature P precipita-tion f (P T ) indicates that snowfall is calculated as a function of P and T
Precipitation Temperature Snowfall Time
MERRA MERRA PresentMERRA reference MERRA Terrain-adjusted MERRA f (P T ) PresentMERRA T2m MERRA MERRA T2m f (P T ) PresentBias-corrected with obs T MERRA Bias-corr terrain-adj MERRA f (P T ) PresentBias-corrected with obs P Bias-corr MERRA Terrain-adjusted MERRA f (P T ) PresentBias-corrected with obs T P Bias-corr MERRA Bias-corr terrain-adj MERRA f (P T ) PresentCMIP5 T MERRA Terrain-adj MERRA+∆T f (P T ) FutureCMIP5 P MERRAtimes∆P Terrain-adj MERRA f (P T ) FutureCMIP5 T P MERRAtimes∆P Terrain-adj MERRA+∆T f (P T ) FutureBias-corr CMIP5 T Bias-corr MERRA Bias-corr terrain-adj MERRA+∆T f (P T ) FutureBias-corr CMIP5 P Bias-corr MERRAtimes∆P Bias-corr terrain-adj MERRA f (P T ) FutureBias-corr CMIP5 T P Bias-corr MERRAtimes∆P Bias-corr terrain-adj MERRA+∆T f (P T ) Future
477
TCD9 441ndash493 2015
Snowfall in theHimalayas an
uncertain future froma little-known past
E Viste and A Sorteberg
Title Page
Abstract Introduction
Conclusions References
Tables Figures
J I
J I
Back Close
Full Screen Esc
Printer-friendly Version
Interactive Discussion
Discussion
Paper
|D
iscussionP
aper|
Discussion
Paper
|D
iscussionP
aper|
Table 2 Data sets used in calculations of present-day snowfall
Product Time Hor res Description
MERRA 1979ndash2012 05 lat 07 lon Hourly atmospheric reanalysis data(Rienecker et al 2011)
APHRODITEV1204V1101
1979ndash2007 025 Daily temperature andprecipitation basedon observations (Yatagai et al 2012Yasutomi et al 2011)
CRU TS 320 1979ndash2011 05 Monthly temperature and precipitationbased on observations(Harris et al 2014)
TRMM 3B42 V7 1998ndash2012 05 3 hourly satellite-based precipitation(Huffman et al 2007)
GLOBE 1 km Topography data set(Hastings and Dunbar 1998)
478
TCD9 441ndash493 2015
Snowfall in theHimalayas an
uncertain future froma little-known past
E Viste and A Sorteberg
Title Page
Abstract Introduction
Conclusions References
Tables Figures
J I
J I
Back Close
Full Screen Esc
Printer-friendly Version
Interactive Discussion
Discussion
Paper
|D
iscussionP
aper|
Discussion
Paper
|D
iscussionP
aper|
Table 3 CMIP5 models and RCPs used (x) in calculations of 2071ndash2100 snowfall
Model RCP 26 RCP 85
CanESM2 x xCCSM4 x xCESM1-CAM5 xCNRM-CM5 xGFDL-CM3 x xGFDL-ESM2G xGISS-E2-R x xHadGEM2-ES x xIPSL-CM5A-LR x xIPSL-CM5A-MR x xMIROC-ESM x xMIROC-ESM-CHEM x xMIROC5 x xMRI-CGCM3 x xNorESM1-M x xNorESM1-ME x x
479
TCD9 441ndash493 2015
Snowfall in theHimalayas an
uncertain future froma little-known past
E Viste and A Sorteberg
Title Page
Abstract Introduction
Conclusions References
Tables Figures
J I
J I
Back Close
Full Screen Esc
Printer-friendly Version
Interactive Discussion
Discussion
Paper
|D
iscussionP
aper|
Discussion
Paper
|D
iscussionP
aper|
Table 4 Annual snowfall estimates for the Indus Ganges and Brahmaputra Basins S snow[km3 SWE] P precipitation [km3] S and P percent of MERRA reference snowfall andMERRA precipitation First horizontal section no bias-corrections Second third and fourthsection bias-corrections with T P and both T and P
Indus Basin Ganges Basin Brahmaputra BasinInput S S P P S S P P S S P P
MERRA reference 148 100 422 100 54 100 1147 100 119 100 733 100MERRA 166 112 422 100 49 90 1147 100 129 109 733 100MERRA T2m 154 104 422 100 42 77 1147 100 109 92 733 100T APHRODITE 113 76 422 100 30 55 1147 100 74 62 733 100T CRU 126 85 422 100 81 151 1147 100 109 92 733 100P APHRODITE 66 44 315 75 22 42 1020 89 35 30 567 77P TRMM 72 49 404 96 31 57 1244 108 63 54 835 114P CRU 84 56 398 94 30 56 1100 96 53 45 716 98P T APHRODITE 49 33 315 75 12 22 1020 89 20 17 567 77P APHRODITE T CRU 62 42 315 75 34 63 1020 89 33 28 567 77P TRMM T APHRODITE 54 36 390 92 18 34 1195 104 39 33 815 111P TRMM T CRU 65 44 403 96 46 85 1254 109 58 49 813 111P CRU T APHRODITE 65 44 395 94 17 31 1106 96 31 26 718 98P T CRU 80 54 398 94 41 75 1100 96 49 42 716 98
480
TCD9 441ndash493 2015
Snowfall in theHimalayas an
uncertain future froma little-known past
E Viste and A Sorteberg
Title Page
Abstract Introduction
Conclusions References
Tables Figures
J I
J I
Back Close
Full Screen Esc
Printer-friendly Version
Interactive Discussion
Discussion
Paper
|D
iscussionP
aper|
Discussion
Paper
|D
iscussionP
aper|
Table 5 Projected change in annual snowfall from 1971ndash2000 to 2071ndash2100 with referenceto terrain-adjusted MERRA and APHRODITE ∆Sabs [km3] is the absolute change ∆Srel [] isthe relative change compared to the present-day MERRA reference snowfall Values are pre-sented with the CMIP5 multi-model mean as the main value and the span of individual modelsin brackets (MERRA only) ∆TP indicates that changes in both temperature and precipitationare included whereas ∆P and ∆T denotes changes only in precipitation or temperature re-spectively
Indus Ganges Brahmaputra∆Sabs [km3] ∆Srel [] ∆Sabs [km3] ∆Srel [] ∆Sabs [km3] ∆Srel []
RCP 85 MERRA ∆TP minus49 [minus83minus9] minus33 [minus56minus6] minus27 [minus36minus14] minus50 [minus66minus25] minus64 [minus93minus39] minus54 [minus79minus33]MERRA ∆T minus51 [minus67minus34] minus34 [minus45minus23] minus28 [minus34minus21] minus51 [minus64minus39] minus71 [minus87minus53] minus60 [minus73minus44]MERRA ∆P 5 [minus2544] 4 [minus1730] 7 [minus417] 12 [minus731] 20 [minus1750] 17 [minus1542]
APHRO ∆TP minus25 minus51 minus7 minus56 minus13 minus67APHRO ∆T minus25 minus52 minus7 minus57 minus14 minus71APHRO ∆P 1 1 1 6 3 16
RCP 26 MERRA ∆TP minus15 [minus406] minus10 [minus274] minus10 [minus19minus3] minus18 [minus36minus5] minus25 [minus42minus5] minus21 [minus35minus4]MERRA ∆T minus18 [minus27minus9] minus12 [minus18minus6] minus12 [minus21minus6] minus21 [minus39minus11] minus29 [minus47minus13] minus25 [minus40minus11]MERRA ∆P 3 [minus1825] 2 [minus1217] 3 [minus210] 5 [minus419] 7 [minus828] 6 [minus623]
APHRO ∆TP minus9 minus18 minus2 minus20 minus6 minus29APHRO ∆T minus10 minus19 minus3 minus23 minus6 minus32APHRO ∆P 1 1 0 4 1 6
481
TCD9 441ndash493 2015
Snowfall in theHimalayas an
uncertain future froma little-known past
E Viste and A Sorteberg
Title Page
Abstract Introduction
Conclusions References
Tables Figures
J I
J I
Back Close
Full Screen Esc
Printer-friendly Version
Interactive Discussion
Discussion
Paper
|D
iscussionP
aper|
Discussion
Paper
|D
iscussionP
aper|
Figure 1 Map of the region with the Indus Ganges and Brahmaputra basins outlined in whiteThinner outlines are national borders Background NASA Visible Earth
482
TCD9 441ndash493 2015
Snowfall in theHimalayas an
uncertain future froma little-known past
E Viste and A Sorteberg
Title Page
Abstract Introduction
Conclusions References
Tables Figures
J I
J I
Back Close
Full Screen Esc
Printer-friendly Version
Interactive Discussion
Discussion
Paper
|D
iscussionP
aper|
Discussion
Paper
|D
iscussionP
aper|
0
400 mm
Months 1ndash12
SP
I1
I2I3
I5I4
G1
G2G3
G4
B1
B2
B3B4
Viste amp SortebergFigure 2
Figure 2 Monthly mean MERRA precipitation and MERRA reference snowfall in sub-basinclusters of the Indus (I) Ganges (G) and Brahmaputra (B) Total bar height MERRA precip-itation (P) [mm] Colored bars snowfall (S) [mm SWE] based on MERRA precipitation andterrain-adjusted MERRA temperature in the region with the same color Cluster 1 in eachbasin is considered snow-free and the seasonal cycles are not shown
483
TCD9 441ndash493 2015
Snowfall in theHimalayas an
uncertain future froma little-known past
E Viste and A Sorteberg
Title Page
Abstract Introduction
Conclusions References
Tables Figures
J I
J I
Back Close
Full Screen Esc
Printer-friendly Version
Interactive Discussion
Discussion
Paper
|D
iscussionP
aper|
Discussion
Paper
|D
iscussionP
aper|
a) MERRA reference b) APHRODITE c) APHRODITE ndash MERRA ref
30 km3
20100-10-20-30
Viste amp SortebergFigure 3
Figure 3 The effect of bias-corrections with APHRODITE temperature and precipitation(a) MERRA reference snowfall (b) Snowfall based on bias-corrections with APHRODITE(c) APHRODITE (b) minus MERRA reference snowfall (a)
484
TCD9 441ndash493 2015
Snowfall in theHimalayas an
uncertain future froma little-known past
E Viste and A Sorteberg
Title Page
Abstract Introduction
Conclusions References
Tables Figures
J I
J I
Back Close
Full Screen Esc
Printer-friendly Version
Interactive Discussion
Discussion
Paper
|D
iscussionP
aper|
Discussion
Paper
|D
iscussionP
aper|
Figure 4 Difference between MERRA precipitation and observation-based data (a) Annualmean MERRA precipitation (b c and d) Annual mean MERRA precipitation bias-correctedwith observations APHRODITE CRU TS and TRMM 3B42 For each data set the small insetmaps show the observations minus MERRA
485
TCD9 441ndash493 2015
Snowfall in theHimalayas an
uncertain future froma little-known past
E Viste and A Sorteberg
Title Page
Abstract Introduction
Conclusions References
Tables Figures
J I
J I
Back Close
Full Screen Esc
Printer-friendly Version
Interactive Discussion
Discussion
Paper
|D
iscussionP
aper|
Discussion
Paper
|D
iscussionP
aper|
Biasminuscorrected minus original MERRA temperature [C]
minus15
minus10
minus5
0
5
10
Biasminuscorrected minus original MERRA temperature [C]
minus15
minus10
minus5
0
5
10
MERRA mean temperature [C] 1979minus2007
minus15
minus10
minus5
0
5
10
15
20
25
30a) MERRA b) APHRODITE ndash MERRA c) CRU ndash MERRA
-10
0
10
20
30degC
minus15
minus10
minus5
0
5
10
15degC
Viste amp SortebergFigure 5
Figure 5 Difference between MERRA temperature and observation-based data (a) Annualmean MERRA temperature (b and c) Annual mean MERRA temperature bias-corrected withobservations APHRODITE and CRU TS
486
TCD9 441ndash493 2015
Snowfall in theHimalayas an
uncertain future froma little-known past
E Viste and A Sorteberg
Title Page
Abstract Introduction
Conclusions References
Tables Figures
J I
J I
Back Close
Full Screen Esc
Printer-friendly Version
Interactive Discussion
Discussion
Paper
|D
iscussionP
aper|
Discussion
Paper
|D
iscussionP
aper|
Jan Apr
Jul Oct
a)
c)
b)
d)
15degC
10
5
0
ndash5
ndash10
ndash15
200 mm16012080400ndash40ndash80ndash120ndash160ndash200
Viste amp SortebergFigure 6
Figure 6 Regions where increasing temperatures are likely to cause a shift from snow to rainData monthly mean MERRA temperature terrain-adjusted to a 4 km GLOBE grid Red temper-ature between minus5 and 0 considered critical Small inset maps monthly MERRA precipitationin the critical zones
487
TCD9 441ndash493 2015
Snowfall in theHimalayas an
uncertain future froma little-known past
E Viste and A Sorteberg
Title Page
Abstract Introduction
Conclusions References
Tables Figures
J I
J I
Back Close
Full Screen Esc
Printer-friendly Version
Interactive Discussion
Discussion
Paper
|D
iscussionP
aper|
Discussion
Paper
|D
iscussionP
aper|
1 2 3 4 5 6 7 8 9 10 11 12Month
∆T [ordm
C]
a) Indus
0
1
2
3
4
5
6
7
8
9
10
b) Ganges∆T
[ordmC
]
1 2 3 4 5 6 7 8 9 10 11 12Month
1
2
3
4
5
6
7
8
0 0
c) Brahmaputra
∆T [ordm
C]
1 2 3 4 5 6 7 8 9 10 11 12Month
1
2
3
4
5
6
7
8
9
10 RCP 85RCP 85 meanRCP 26RCP 26 mean
Viste amp SortebergFigure 7
Figure 7 Projected future temperature change from 1971ndash2000 to 2071ndash2100 in the (a) In-dus (b) Ganges and (c) Brahmaputra Basins Thin lines show the individual CMIP5 modelsstronger lines the multi-model mean
488
TCD9 441ndash493 2015
Snowfall in theHimalayas an
uncertain future froma little-known past
E Viste and A Sorteberg
Title Page
Abstract Introduction
Conclusions References
Tables Figures
J I
J I
Back Close
Full Screen Esc
Printer-friendly Version
Interactive Discussion
Discussion
Paper
|D
iscussionP
aper|
Discussion
Paper
|D
iscussionP
aper|
1 2 3 4 5 6 7 8 9 10 11 12Month
[km
3 ]
a) Indus
0
20
40
60
80
100
120
140
b) Ganges[k
m3 ]
1 2 3 4 5 6 7 8 9 10 11 12Month
0
100
200
300
400
500
600
700
c) Brahmaputra
[km
3 ]
1 2 3 4 5 6 7 8 9 10 11 12Month
0
50
100
150
200
250
MERRA ref
2071ndash2100
1979ndash2008
RCP 85RCP 85 meanRCP 26RCP 26 mean
Viste amp SortebergFigure 8
Figure 8 Projected future precipitation in the (a) Indus (b) Ganges and (c) BrahmaputraBasins Gray bars MERRA 1979ndash2008 Thin lines and horizontal marks on the bars show theindividual CMIP5 models and the multi-model mean for 2071ndash2100
489
TCD9 441ndash493 2015
Snowfall in theHimalayas an
uncertain future froma little-known past
E Viste and A Sorteberg
Title Page
Abstract Introduction
Conclusions References
Tables Figures
J I
J I
Back Close
Full Screen Esc
Printer-friendly Version
Interactive Discussion
Discussion
Paper
|D
iscussionP
aper|
Discussion
Paper
|D
iscussionP
aper|
1 2 3 4 5 6 7 8 9 10 11 120
5
10
15
20
25
30
35
Month
SWE
[km
3 ]
a) Indus
0
1
2
3
4
5
6
7
8
b) Ganges
SWE
[km
3 ]
1 2 3 4 5 6 7 8 9 10 11 12Month
0
2
4
6
8
10
12
14
16
18
20
c) Brahmaputra
SWE
[km
3 ]
1 2 3 4 5 6 7 8 9 10 11 12Month
MERRA ref
2071ndash2100
1979ndash2008
RCP 85RCP 85 meanRCP 26RCP 26 mean
Viste amp SortebergFigure 9
Figure 9 Projected future snowfall in the (a) Indus (b) Ganges and (c) Brahmaputra Basinswith reference to MERRA reference snowfall Gray bars MERRA reference snowfall for 1979ndash2008 Thin lines and horizontal marks on the bars show the individual CMIP5 models andthe multi-model mean for 2071ndash2100 based on changes in temperature and precipitation asdescribed in Sect 23
490
TCD9 441ndash493 2015
Snowfall in theHimalayas an
uncertain future froma little-known past
E Viste and A Sorteberg
Title Page
Abstract Introduction
Conclusions References
Tables Figures
J I
J I
Back Close
Full Screen Esc
Printer-friendly Version
Interactive Discussion
Discussion
Paper
|D
iscussionP
aper|
Discussion
Paper
|D
iscussionP
aper|
Figure 10 Projected future changes in snowfall in sub-basins of the Indus Ganges andBrahmaputra Basins (a) Absolute change [km3] with reference to MERRA reference snow-fall (b) Absolute change [km3] with reference to APHRODITE snowfall (c d) Correspondingrelative changes [] with reference to MERRA and APHRODITE
491
TCD9 441ndash493 2015
Snowfall in theHimalayas an
uncertain future froma little-known past
E Viste and A Sorteberg
Title Page
Abstract Introduction
Conclusions References
Tables Figures
J I
J I
Back Close
Full Screen Esc
Printer-friendly Version
Interactive Discussion
Discussion
Paper
|D
iscussionP
aper|
Discussion
Paper
|D
iscussionP
aper|
J F M A M J J A S O N DMonth
0
5
10
15
20 km3Precip
0
2
4
6
8
10 km3SWE
2000
3000
4000
5000
6000 masl
1845
J F
M
A
M
JJ A
S
O
N
D
RSL
I4A = 146793 km2
1 km 3 = 68 mm
0
05
1
15 SWE rel
8000 m
0
J F M A M J J A S O N DMonth
0
2
4
6
8
10
12 km3 SWE
3000
4000
5000
6000 masl
78
2
14
J FM
A
MJ
J AS
O
ND
RSL
I5
Precip
0
5
10
15
20
25 km3
0
05
1
15 SWE rel
8000 m
0
A = 178669 km2
1 km 3 = 56 mm
CMIP52071ndash2100mean
Today
MERRA APHRODITE
Individual models
CMIP52071ndash2100mean
MERRA APHRODITE
Individual models
CMIP52071ndash2100Precip mean
MERRA APHRODITE
Individual models
SWE todayPrecip today
2000 mTerrain distribution of area between levels
CMIP52071ndash2100
TodayMERRA
APHRODITE
a)
i)
ii)
iii)
iv)
b)
Viste amp SortebergFigure 11
Figure 11 Monthly CMIP5 RCP 85 change in snowfall precipitation and rainsnow line eleva-tion in the upper Indus clusters (a) 4 and (b) 5 from 1971ndash2000 to 2071ndash2100 with referenceto the MERRA reference (red) and APHRODITE (blue) CMIP5 multi-model means are shownas horizontal marks individual models as dots Cluster location and terrain profile are shownabove the graphs (i) Fractional change in snowfall (ii) Future snowfall [km3] (dots) comparedto today (bars) (iii) Future precipitation [km3] (dots) compared to today (bars) Snowfall todayis shown as darker part of bars (iv) Rainsnow line elevation [m asl] Gray background el-evation histogram with the of total ground area lying in the marked 2000 m intervals Barschange from today (bottom) to CMIP5 multi-model mean (top)
492
TCD9 441ndash493 2015
Snowfall in theHimalayas an
uncertain future froma little-known past
E Viste and A Sorteberg
Title Page
Abstract Introduction
Conclusions References
Tables Figures
J I
J I
Back Close
Full Screen Esc
Printer-friendly Version
Interactive Discussion
Discussion
Paper
|D
iscussionP
aper|
Discussion
Paper
|D
iscussionP
aper|
3000
4000
5000
6000 masl
0
2
4
6
8
10 km3
0
10
20
30
40
50
60 km3
0
05
1
15
J F M A M J J A S O N DMonth
J FM
A
M
JJ A
S
O
ND
Precip
SWE
RSL
SWE rel
53
B3
8000 m
0
A = 139611 km2
1 km 3 = 72 mm
4500
5000
5500
6000
6500 masl
0
1
2
3
4 km3
0
10
20
30
40
50 km3
0
05
1
15 SWE rel
SWE
RSL
Precip
95
J F M A M J J A S O N DMonth
J FM
A
M
JJ A
S
ON
D
B4
8000 m
0
A = 159165 km2
1 km 3 = 63 mm
CMIP52071ndash2100mean
Today
MERRA APHRODITE
Individual models
CMIP52071ndash2100mean
MERRA APHRODITE
Individual models
CMIP52071ndash2100Precip mean
MERRA APHRODITE
Individual models
SWE todayPrecip today
2000 mTerrain distribution of area between levels
CMIP52071ndash2100
TodayMERRA
APHRODITE
a)
i)
ii)
iii)
iv)
b)
Viste amp SortebergFigure 12
Figure 12 Monthly CMIP5 RCP 85 change in snowfall precipitation and rainsnow line ele-vation in the upper Brahmaputra clusters (a) 4 and (b) 3 See Fig 11 for a description of thecontent
493
- Introduction
-
- Observed trends in snowfall temperature and precipitation
- Future projections of snowfall temperature and precipitation
- Aims and scope
-
- Data and methods
-
- Reference present-day snowfall
- Bias-corrected present-day snowfall
- Projected snowfall
- The rain-snow line
-
- Present-day snowfall
-
- Seasonal cycles of precipitation and snowfall
- Comparison of snowfall estimates
-
- Projected future snowfall
-
- Basin-scale projections
- Regional projections
-
- Upper Indus western part
- Upper Indus eastern part
- Upper Brahmaputra western part
- Upper Brahmaputra eastern part
-
- Potential effects of reduced snowfall on water availability
-
- Concluding summary
-
TCD9 441ndash493 2015
Snowfall in theHimalayas an
uncertain future froma little-known past
E Viste and A Sorteberg
Title Page
Abstract Introduction
Conclusions References
Tables Figures
J I
J I
Back Close
Full Screen Esc
Printer-friendly Version
Interactive Discussion
Discussion
Paper
|D
iscussionP
aper|
Discussion
Paper
|D
iscussionP
aper|
In January (Fig 6a) only the lower parts of the Himalayas is affected as most ofthe region would still have temperatures well below the freezing point The small insetmap shows precipitation in the red zone a narrow band along the range Oppositelyin July (Fig 6c) the temperature is already above 5 C in most of the region though athigher elevations along the Himalayan range and in the Karakoram the change can be5
critical The most widespread changes are seen in spring and fall In April and October(Fig 6b d) large areas in the HKH and on the Tibetan Plateau risk a change frombelow to above freezing
Incorporating CMIP5 precipitation changes we find that the projected temperatureincrease has a larger impact so that snowfall will be reduced in the Indus Ganges and10
Brahmaputra Basins by 2071ndash2100 compared to today Details for the major basinsare presented in Sect 41 How much increased temperatures reduce snowfall withina region depends on the location of the rainsnow line today compared to the terraindistribution Results for selected upper-level sub-basins in the Indus and Brahmaputrawill be discussed in that context in Sect 4215
The large deviations in the estimates of present-day snowfall (Sect 3) means thatthere will be correspondingly large deviations in projected values To account for thismost results are shown with reference to the highest and lowest present-day estimatesMERRA reference snowfall and to APHRODITE-based snowfall Future estimates rela-tive to CRU and TRMM are assumed to lie between those of MERRA and APHRODITE20
41 Basin-scale projections
In the Indus Ganges and Brahmaputra Basins the CMIP5 models project a meanincrease in both temperature (Fig 7) and precipitation (Fig 8) in the region by 2071ndash2100 for both RCPs 26 and 85 The RCP 85 multi-model mean change in temper-ature varies through the year with a 49ndash62 C increase in the Indus 36ndash52 C in25
the Ganges and 42ndash60 C in the Brahmaputra The increase is smallest during thesummer months The dip in the summer is also seen though less pronounced with
459
TCD9 441ndash493 2015
Snowfall in theHimalayas an
uncertain future froma little-known past
E Viste and A Sorteberg
Title Page
Abstract Introduction
Conclusions References
Tables Figures
J I
J I
Back Close
Full Screen Esc
Printer-friendly Version
Interactive Discussion
Discussion
Paper
|D
iscussionP
aper|
Discussion
Paper
|D
iscussionP
aper|
the RCP 26 The summer is also the season with the largest absolute increase inprecipitation
Compared to present-day estimates the CMIP5 models project less snowfall in theIndus Ganges and Brahmaputra Basins in the last decades of this century This canbe seen from Fig 9 The projected multi-model mean is lower than today in all calen-5
dar months for both RCPs 26 and 85 With the RCP 26 some models suggest anincrease in some months mainly in winter and spring This is also the case for one ortwo models with the RCP 85 whereas other models indicate that the snowfall in thesame months will be only half of todayrsquos values
In the Ganges Basin (Fig 9b) the seasonal distribution of snowfall today is mainly10
flat with equal amounts of snowfall from January through September Reductions insummer snowfall with the RCP 85 would change the seasonal cycle into a winter-dominated one To a lesser degree this is also the case for RCP 26 As summerprecipitation is projected to increase in all of the Ganges (not shown but consistentwith Menon et al 2013) this indicates that large areas are at elevations where a small15
increase in the summer temperature may cause a shift from snow to rain This is seenas the red band along the upper Ganges in Fig 6c Reductions in summer snowfall arealso large in the Brahmaputra (Fig 9b) whereas in the Indus the largest total changesoccur in MarchndashMay (Fig 9a)
As the MERRA reference snowfall for today is much larger than APHRODITE snow-20
fall (Sect 32) projected absolute changes for 2071ndash2100 are also much largerin MERRA The relative changes are more similar though larger with reference toAPHRODITE Annual snowfall changes for each major basin are presented in Table 5for changes in temperature precipitation or both and with reference to MERRA andAphrodite present-day snowfall Changes at the sub-basin level are shown in Fig 1025
In the Ganges Basin both MERRA- and APHRODITE-based multi-model mean snow-fall is reduced by about 20 with the RCP 26 and 50 with the RCP 85 In theIndus and Brahmaputra Basins the differences between MERRA- and APHRODITE-based changes are larger but not as large as for the absolute values With reference
460
TCD9 441ndash493 2015
Snowfall in theHimalayas an
uncertain future froma little-known past
E Viste and A Sorteberg
Title Page
Abstract Introduction
Conclusions References
Tables Figures
J I
J I
Back Close
Full Screen Esc
Printer-friendly Version
Interactive Discussion
Discussion
Paper
|D
iscussionP
aper|
Discussion
Paper
|D
iscussionP
aper|
to MERRA and APHRODITE respectively the reduction in snowfall in the Indus Basinis 30 and 50 with the RCP 85 The corresponding reductions in the BrahmaputraBasin are 50 and 70
The projected changes in temperature have greater effect on snowfall than thechanges in precipitation When taking into account only changes in precipitation all5
snowfall estimates are positive (∆P Table 5) This indicates that the mean annual to-tal reduction for each major basin is governed by the temperature change In someCMIP5 models (values in brackets in Table 5) the effect of precipitation changes (∆P )on snowfall are of the same magnitude as the effect of temperature changes (∆T ) butfor the CMIP5 multi-model mean temperature changes cause snowfall changes 4ndash1010
times as large as those due to changes in precipitation This is with reference to thepresent-day MERRA reference snowfall and for both RCPs 26 and 85 With referenceto APHRODITE snowfall the effect of temperature changes compared to precipitationchanges is even greater
42 Regional projections15
If temperatures are far below freezing everywhere warming may have little effect onsnowfall The same applies if only the highest peaks receive snow today The largestreduction in snowfall in a basin occurs if todayrsquos rainsnow line is at an elevation justbelow the dominant elevation of the basin Then large regions will see a shift fromsnow to rain20
In the Indus Basin the largest relative snowfall reduction by 2071ndash2100 is seen inthe southwestern sub-basins where snowfall is limited today (Fig 10) The largest totalreduction is seen in the snow-rich sub-basins of KabulSwatAlingar in the west and inthe east and a smaller reduction in the inner-most basins of GilgitHunza Indus 1 andNubraShyok Together with the upper regions of the Brahmaputra these sub-basins25
clusters I4 I5 B3 and B4 in Fig 2 were selected for a closer analysis In addition tohaving the most snow these clusters are the most homogeneous when considering
461
TCD9 441ndash493 2015
Snowfall in theHimalayas an
uncertain future froma little-known past
E Viste and A Sorteberg
Title Page
Abstract Introduction
Conclusions References
Tables Figures
J I
J I
Back Close
Full Screen Esc
Printer-friendly Version
Interactive Discussion
Discussion
Paper
|D
iscussionP
aper|
Discussion
Paper
|D
iscussionP
aper|
the seasonal cycle of snowfall and snow fraction The values presented in this sectionare all from the RCP 85 for changes from today to 2071ndash2100
421 Upper Indus western part
Cluster 4 consists of the sub-basins Astor KabulSwatAlingar and Krishen GangaAs seen from the elevation profile at the top of Fig 11a the elevation span is large5
and there is an almost equal proportion of the terrain at all levels from heights close tosea level to about 5000 masl The most important change for this cluster is a largereduction in the total amount of snowfall in winter and spring
With a few exceptions all CMIP5 models project less snowfall in all months of theyear (Fig 11a i ii) The largest total multi-model mean reduction in snowfall (ii) oc-10
curs in FebruaryndashApril without notable change in the multi-model mean precipitation(iii) Thus the reduction is caused by increasing temperatures represented by therainsnow line in Fig 11a iv As seen from the change in the rainsnow line elevationthe projected temperature increase in these months would imply that large areas thatreceive snow today would receive only rain About 40 of the ground in this cluster lies15
below 2000 masl and receives precipitation as rain throughout the year In summerprecipitation (iii) is at a minimum and the rainsnow line (iv) is already so high that onlya small fraction of the area receives snowfall today Thus although the relative changein snowfall (i) is largest in summer the change in the amount of snowfall (ii) is small Itshould also be noted that the change in the rainsnow line elevation (iv) in summer is20
much smaller 400ndash600 m compared to 600ndash900 m in DecemberndashApril
422 Upper Indus eastern part
Further east the largest changes are projected for the spring season Cluster 5 in theIndus Basin consists of the sub-basins GilgitHunza Indus 1 NubraShyok and Zan-skar As shown in Fig 11b this is high-elevation terrain with 80 of the ground lying25
above 4000 masl As a result almost all winter precipitation is snow (Fig 11b iii)
462
TCD9 441ndash493 2015
Snowfall in theHimalayas an
uncertain future froma little-known past
E Viste and A Sorteberg
Title Page
Abstract Introduction
Conclusions References
Tables Figures
J I
J I
Back Close
Full Screen Esc
Printer-friendly Version
Interactive Discussion
Discussion
Paper
|D
iscussionP
aper|
Discussion
Paper
|D
iscussionP
aper|
For the multi-model mean no big changes are projected in JanuaryndashFebruary This ispartly because of little change in precipitation (iii) and because the rainsnow line (iv)in these months is sufficiently low in the terrain today With the 500ndash600 m shift pro-jected with the RCP 85 80ndash90 of the area will still have temperatures low enoughfor snow The largest changes occur in MarchndashOctober when higher temperatures5
push the rainsnow line above large areas that receive snow today Increasing summerprecipitation (iii) causes the snowfall reduction in summer to be less than it would other-wise be The effect of higher temperatures is smaller on the APHRODITE snowfall thanon the MERRA reference snowfall (ii) as APHRODITE has very little summer snow-fall today The difference arises both from less precipitation (iii) in APHRODITE than10
MERRA today and from a higher rainsnow line (iv) in APHRODITE Note that as thechange in precipitation was defined as a fraction of the present-day value (Sect 23)the relative changes in APHRODITE and MERRA precipitation are equal
423 Upper Brahmaputra western part
In the westernmost part of the upper Brahmaputra Basin large snowfall changes are15
projected for the summer As cluster 5 in the Indus Basin Brahmaputrarsquos cluster 4 islimited to higher grounds Less than 6 lies outside of the 4000ndash6000 masl rangeThe cluster consists of Maquan He Yarlung Zangbo Dogxung ZangboMaiqu ZangboShang ChuYarlung ZangboNyang Lhasa HeRazheng Zangbo and Yamzho YumcoThe summer monsoon fully dominates the seasonal cycle of precipitation in this region20
(Fig 12a iii) resulting in a unimodal snow cycle with a maximum in JulyndashSeptember InAPHRODITE the seasonal cycle of snowfall is similar but less pronounced than in theMERRA reference The summer also sees the greatest reduction in CMIP5 projectedsnowfall both in absolute (ii) and relative (i) terms despite increasing summer precip-itation in all models (iii) The reason can be seen from the change in the rainsnow25
line elevation (iv) In the warmest months July and August elevation changes of 400ndash500 m would shift the rainsnow line from a level where at least 5ndash10 of the groundlies above the line to a level where only 1 of the area would receive precipitation as
463
TCD9 441ndash493 2015
Snowfall in theHimalayas an
uncertain future froma little-known past
E Viste and A Sorteberg
Title Page
Abstract Introduction
Conclusions References
Tables Figures
J I
J I
Back Close
Full Screen Esc
Printer-friendly Version
Interactive Discussion
Discussion
Paper
|D
iscussionP
aper|
Discussion
Paper
|D
iscussionP
aper|
snow In comparison with reference to MERRA the 300ndash400 m shift seen in JanuaryndashFebruary would cause only a small absolute change in snowfall (ii) because there islittle precipitation in these months (ii) and a small relative change (i) because therainsnow line would still be low in the terrain (iv) With reference to APHRODITE therelative snowfall change in winter would be larger than with reference to MERRA as5
temperatures today are higher resulting in a higher rainsnow line (iv)
424 Upper Brahmaputra eastern part
Like further west the Indian summer monsoon dominates the precipitation cycle in theeastern part of upper Brahmaputra (Fig 12b iii) but the seasonal cycle of snowfallpeaks in spring and fall (iii) This is also the time of the largest projected changes10
Cluster 3 in the Brahmaputra consists of the sub-basins Yarlung Zangbo2 NyangQu Yarlung Zangbo3 Yirsquoong ZangboParl Siyom Zaya QuLuhitDi About 70 of theground lies between 3000 and 6000 masl but there is also land almost at sea levelmainly in the Zaya QuLuhitDingba Qu sub-basin During summer most of the terrainlies below the rainsnow line (iv) In spring temperatures are lower than in summer15
and pre- monsoon precipitation is stronger in this part of the Himalayas than furtherwest in cluster 3 (Fig 12a iii vs Fig 12b iii) As a result MarchndashApril gets the mostsnow
Reductions in snowfall are projected for all months (ii) comparable in magnitude butlargest in the snow-rich spring and late summer The CMIP5 multi-model mean shows20
increasing or no change in precipitation in all months (Fig 12b iii) so the reductionin snowfall is due solely to higher temperatures The largest absolute reductions inApril and May occur with a 700ndash800 m shift in the rainsnow line elevation leaving30 more of the terrain in the rain The largest relative reduction in future snowfall areprojected for July and August (Fig 12b i) when the rainsnow line shifts so high that25
only the highest peaks can get precipitation as snow (iv) This would be despite thelowest changes in the rainsnow line only about 300 m in APHRODITE
464
TCD9 441ndash493 2015
Snowfall in theHimalayas an
uncertain future froma little-known past
E Viste and A Sorteberg
Title Page
Abstract Introduction
Conclusions References
Tables Figures
J I
J I
Back Close
Full Screen Esc
Printer-friendly Version
Interactive Discussion
Discussion
Paper
|D
iscussionP
aper|
Discussion
Paper
|D
iscussionP
aper|
43 Potential effects of reduced snowfall on water availability
With a few exceptions the CMIP5 multi-model mean precipitation change over the com-ing century is positive in all months in the upper Indus and Brahmaputra (Sect 42)Thus the projected reduction in snowfall is due solely to higher temperatures How-ever there is a large spread in precipitation projections among the models If tempera-5
tures increase as much as projected with the RCP 85 could any realistic precipitationchange in the HKH compensate and maintain present-day snowfall Results indicatethat this may happen in parts of the upper Indus but is out of the reach in the upperBrahmaputra As for water availability reduced snowfall may still cause more severeproblems in the Indus than in the Brahmaputra10
In cold regions where temperatures remain below freezing more winter precipita-tion may increase both the snow cover area the length of the snow season and theSWE (Collins et al 2013 Brutel-Vuilmet et al 2013 Raumlisaumlnen 2008 Gao et al 2012Wiltshire 2014) Raumlisaumlnen (2008) showed this to be the case in eastern Siberia andthe northernmost part of North America At the southern edge of the seasonal snow15
cover relevant for this study precipitation did not compensate and there was a reduc-tion in SWEWiltshire (2014) concluded that there would be small changes in snowfallin very cold and very warm regions of the HKH Snowfall in Nepal Bhutan and Hi-machal Pradesh where winters are warmer than in most parts of the range was mostvulnerable to higher temperatures The data presented in Sect 42 generally support20
the previous studiesOne of the reasons that precipitation does not compensate is that the highest pro-
jected precipitation increase in the HKH is seen in the summer when the temperaturetoday is so high that only the highest terrain is in the snow zone Shifting the rainsnowline upward even by only a few hundred meters reduces the area that receives snow25
greatly requiring very large increases in precipitation to compensate The summer isthe season with the largest relative reduction in snowfall in all the clusters described inSect 42 Except in the western upper Indus (cluster I4 Sect 421) which has very
465
TCD9 441ndash493 2015
Snowfall in theHimalayas an
uncertain future froma little-known past
E Viste and A Sorteberg
Title Page
Abstract Introduction
Conclusions References
Tables Figures
J I
J I
Back Close
Full Screen Esc
Printer-friendly Version
Interactive Discussion
Discussion
Paper
|D
iscussionP
aper|
Discussion
Paper
|D
iscussionP
aper|
little summer snowfall today the reduction in summer snowfall is notable in all clustersin the MERRA data in the Brahmaputra clusters also in APHRODITE
The largest change in snowfall is seen in the western part of the Brahmaputra (clus-ter B4 Sect 423) where a 400ndash500 m upward shift in the rainsnow line during sum-mer reduces the area with temperatures low enough for snowfall by a factor of 5ndash105
(Fig 12a iv values not shown) As a result the summer peak in the seasonal cycleof snowfall is replaced by a dip (Fig 12a ii) With an even distribution of precipitationwith elevation the area that still receives snow would have to receive 5ndash10 times asmuch precipitation to compensate for the lost snowfall Assuming more realisticallythat precipitation decreases above a certain height would require an even higher in-10
crease in precipitation In the model with the highest increase a doubling of the Julyprecipitation by the end of the century SWE is less than 25 of todayrsquos value in thatmonth (Fig 12a iii)
With a winter-dominated precipitation cycle the relative change in snowfall is smallerin the upper Indus than in the upper Brahmaputra Downscaling a high-emission sce-15
nario (A1B) in two CMIP3 models with a regional model Wiltshire (2014) found that bythe 2080s precipitation increased more than enough to compensate for higher temper-atures in the Karakoram Hindu Kush and Jammu and Kashmir in one of the modelsthe HadCM3 In the other model ECHAM5 precipitation increased less and snow-fall increased only in the higher parts of the Karakoram In our ensemble of CMIP520
models multi-model mean precipitation in the upper Indus clusters increases mainlyin the summer season when the inter-model spread is also the largest (Fig 11a iiiand 11b iii) Among the models 4ndash5 project increased winter precipitation in the upperIndus and in the uppermost cluster I5 this is associated with an increase in wintersnowfall (Fig 11b ii)25
Although it is the part of the HKH where snowfall is least reduced by increasingtemperatures (Fig 10b) the Karakoram and inner parts of the upper Indus may still bethe region where the changes have the largest impact on river run-off Compared tothe monsoon-dominated regions further east there is little summer precipitation and
466
TCD9 441ndash493 2015
Snowfall in theHimalayas an
uncertain future froma little-known past
E Viste and A Sorteberg
Title Page
Abstract Introduction
Conclusions References
Tables Figures
J I
J I
Back Close
Full Screen Esc
Printer-friendly Version
Interactive Discussion
Discussion
Paper
|D
iscussionP
aper|
Discussion
Paper
|D
iscussionP
aper|
much of the water in the rivers during summer is meltwater (Bookhagen and Burbank2010 Immerzeel et al 2010) As melting of snow and ice has not been analyzed inthis study we cannot quantify the effect of reduced snowmelt om river run-off but it isobvious that eventually reduced snowfall will lead to reduced melting In western partsof the HKH this may lead to changes in the seasonal cycle of the river flow5
As pointed out by Wiltshire (2014) increasing precipitation in the eastern HKH im-plies that water resources are likely to increase with climate change As snowfall andsnowmelt are both at maximum during summer (Rees and Collins 2006) meltwaterdoes not have the same importance for river flow in dry parts of the year as in the In-dus Reduced snowfall may reduce glaciers but ndash not considering potential changes in10
the amount of evaporation ndash there is no indication that there will be less water comingfrom the upper Brahmaputra
5 Concluding summary
In this study we have presented a suite of estimates of present-day snowfall in theIndus Ganges and Brahmaputra Basins and the changes in snowfall that would follow15
from CMIP5 projected changes in temperature and precipitation from 1971ndash2000 to2071ndash2100 The results show that if the temperature increases as much as in the RCP85 there will be much less snowfall despite increasing precipitation in most of theregion Limiting anthropogenic forcing to the RCP 26 level would still cause reductionsthough smaller20
Estimates of present-day snowfall based on a combination of temperature and pre-cipitation from reanalysis data and observations vary by factors of 2ndash4 The MERRAreanalysis gives higher estimates than TRMM 3B42 CRU TS and APHRODITE butthe spread is also large between the estimates based on the different observationallybased data sets This demonstrates the difficulties in assessing vulnerability to climate25
change in the region With limited knowledge of the current state future conditions arebound to be uncertain
467
TCD9 441ndash493 2015
Snowfall in theHimalayas an
uncertain future froma little-known past
E Viste and A Sorteberg
Title Page
Abstract Introduction
Conclusions References
Tables Figures
J I
J I
Back Close
Full Screen Esc
Printer-friendly Version
Interactive Discussion
Discussion
Paper
|D
iscussionP
aper|
Discussion
Paper
|D
iscussionP
aper|
Future changes in temperature and precipitation projected by climate models can stillprovide an indication of the relative change in snowfall With the RCP 85 the climatemodels project mean reductions in annual snowfall by 30ndash50 in the Indus Basin 50ndash60 in the Ganges Basin and 50ndash70 in the Brahmaputra Basin by 2071ndash2100 Withthe RCP 26 the corresponding reductions would be 10ndash20 in the Indus about 20 5
in the Ganges and 20ndash30 in the Brahmaputra The reductions are due to increasingtemperatures as the mean of the models show constant or increasing precipitationthroughout the year in most of the region
How much increasing temperatures reduce snowfall in a region depends on howmuch of the terrain that is below and above the freezing point today and on whether10
the terrain profile is such that the temperature increase transforms large areas fromsnow to rain zones With the RCP 85 the mean elevation where rain changes to snowndash the rainsnow line ndash creeps upward by 400ndash900 m in most of the region by 700ndash900 m
The largest relative change in snowfall is seen in the upper westernmost sub-basins15
of the Brahmaputra despite increasing precipitation and the lowest rainsnow line el-evation change (400ndash500 m) This is because a major part of this region is near thefreezing point today With the RCP 85 most of this region will have temperaturesabove freezing especially in the summer which is the wettest part of the year Theprojected reduction in annual snowfall is 65ndash75 20
In the upper Indus the effect of a warmer climate on snowfall is less extreme asmost of the terrain is high enough to have temperatures sufficiently far below freezingtoday Winter and spring brings most of the precipitation and the projected 600ndash800 mchange in the rainsnow line elevation during these seasons would leave most of theterrain below the freezing point Still a 20ndash40 reduction in annual snowfall is pro-25
jected with the RCP 85The range of our estimates of present-day snowfall illustrates how little that is known
about conditions that influence the availability of drinking water in some of the mostdensely populated parts of the world There is both a scientific and a societal need
468
TCD9 441ndash493 2015
Snowfall in theHimalayas an
uncertain future froma little-known past
E Viste and A Sorteberg
Title Page
Abstract Introduction
Conclusions References
Tables Figures
J I
J I
Back Close
Full Screen Esc
Printer-friendly Version
Interactive Discussion
Discussion
Paper
|D
iscussionP
aper|
Discussion
Paper
|D
iscussionP
aper|
for more information about precipitation in the HKH As a full-scale long-time observa-tional program covering all parts of the Himalayan range is not a likely possibility theonly hope for improved future knowledge of Himalayan snowfall lies in the improvementof satellite data and regional climate models
The Supplement related to this article is available online at5
doi105194tcd-9-441-2015-supplement
Acknowledgements This work has been carried out with support from the University of Bergenthe NORINDIA and SNOWHIM projects funded by The Research Council of Norway and theCentre for Climate Dynamics at the Bjerknes Centre for Climate Research We acknowledgethe World Climate Research Programmersquos Working Group on Coupled Modelling which is re-10
sponsible for CMIP and we thank the climate modeling groups listed in Table 3 of this paper forproducing and making available their model output For CMIP the US Department of EnergyrsquosProgram for Climate Model Diagnosis and Intercomparison provides coordinating support andled development of software infrastructure in partnership with the Global Organization for EarthSystem Science Portals15
References
Akhtar M Ahmad N and Booij M J The impact of climate change on the water resourcesof Hindukush-Karakorum-Himalaya region under different glacier coverage scenarios J Hy-drol 355 148ndash163 2008
Anders A M Roe G H Hallet B Montgomery D R Finnegan N J and Putkonen J20
Spatial patterns of precipitation and topography in the Himalaya in Tectonics Climate andLandscape Evolution Geological Society of America Special Paper edited by Willett S DHovius N Brandon M T and Fisher D Geological Society of America Boulder CO USA39ndash53 2006
469
TCD9 441ndash493 2015
Snowfall in theHimalayas an
uncertain future froma little-known past
E Viste and A Sorteberg
Title Page
Abstract Introduction
Conclusions References
Tables Figures
J I
J I
Back Close
Full Screen Esc
Printer-friendly Version
Interactive Discussion
Discussion
Paper
|D
iscussionP
aper|
Discussion
Paper
|D
iscussionP
aper|
Archer DR and Fowler HJ Spatial and temporal variations in precipitation in the UpperIndus Basin global teleconnections and hydrological implications Hydrol Earth Syst Sci8 47ndash61 doi105194hess-8-47-2004 2004
Bhutiyani M R Kale V S and Pawar N J Long-term trends in maximum minimum andmean annual air temperatures across the Northwestern Himalaya during the twentieth cen-5
tury Climatic Change 85 159ndash177 doi101007s10584-006-9196-1 2007Bhutiyani M R Kale V S and Pawar N J Climate change and the precipitation variations in
the northwestern Himalaya 1866ndash2006 Int J Climatol 30 535ndash548 doi101002joc19202010
Bookhagen B and Burbank D W Topography relief and TRMM-derived rainfall variations10
along the Himalaya Geophys Res Lett 33 L08405 doi1010292006GL026037 2006Bookhagen B and Burbank D W Toward a complete Himalayan hydrological budget spa-
tiotemporal distribution of snowmelt and rainfall and their impact on river discharge J Geo-phys Res 115 F03019 doi1010292009jf001426 2010
Franco B Fettweis X and Erpicum M Future projections of the Greenland ice sheet energy15
balance driving the surface melt The Cryosphere 7 1ndash18 doi105194tc-7-1-2013 2013Butt M J Characteristics of snow cover in the Hindukush Karakoram and Himalaya region
using Landsat satellite data Hydrol Process 10 3689ndash3698 doi101002hyp8375 2012Byun K and Choi M Uncertainty of snow water equivalent retrieved from AMSR-E brightness
temperature in northeast Asia Hydrol Process 28 12 doi101002hyp9846 201420
Chaturvedi R K Joshi J Jayaraman M Bala G and Ravindranath N H Multi-modelclimate change projections for India under representative concentration pathways Curr SciIndia 103 791ndash802 2012
Christensen J H Krishna Kumar K Aldrian E An S-I Cavalcanti I F A Castro Md Dong W Goswami P Hall A Kanyanga J K Kitoh A Kossin J Lau N-C Ren-25
wick J Stephenson D B Xie S-P and Zhou T Climate phenomena and their relevancefor future regional climate change in Climate Change 2013 The Physical Science BasisContribution of Working Group I to the Fifth Assessment Report of the Intergovernmen-tal Panel on Climate Change edited by Stocker T F Qin D Plattner G-K Tignor MAllen S K Boschung J Nauels A Xia Y Bex V and Midgley P M Cambridge Univer-30
sity Press Cambridge UK and New York NY USA 92 2013Collins M Knutti R Arblaster J Dufresne J-L Fichefet T Friedlingstein P Gao X
Gutowski W J Johns T Krinner G Shongwe M Tebaldi C Weaver A J and
470
TCD9 441ndash493 2015
Snowfall in theHimalayas an
uncertain future froma little-known past
E Viste and A Sorteberg
Title Page
Abstract Introduction
Conclusions References
Tables Figures
J I
J I
Back Close
Full Screen Esc
Printer-friendly Version
Interactive Discussion
Discussion
Paper
|D
iscussionP
aper|
Discussion
Paper
|D
iscussionP
aper|
Wehner M Long-term climate change projections commitments and irreversibility in Cli-mate Change 2013 The Physical Science Basis Contribution of Working Group I to theFifth Assessment Report of the Intergovernmental Panel on Climate Change edited byStocker T F Qin D Plattner G-K Tignor M Allen S K Boschung J Nauels AXia Y Bex V and Midgley P M Cambridge University Press Cambridge UK and New5
York NY USA 108 2013Cook E R Palmer J G Ahmed M Woodhouse C A Fenwick P Zafar M U Wahab M
and Khan N Five centuries of Upper Indus River flow from tree rings J Hydrol 486 365ndash375 doi101016jjhydrol201302004 2013
Dai A Temperature and pressure dependence of the rain-snow phase transition over land and10
ocean Geophys Res Lett 35 L12802 doi1010292008gl033295 2008Fowler H J and Archer D R Conflicting signals of climatic change in the Upper Indus Basin
J Climate 19 4276ndash4293 doi101175jcli38601 2006Gao J Williams M W Fu X Wang G and Gong T Spatiotemporal distribution of snow
in eastern Tibet and the response to climate change Remote Sens Environ 121 1ndash915
doi101016jrse201201006 2012Gardelle J Berthier E and Arnaud Y Slight mass gain of Karakoram glaciers in the
early twenty-first century ndash Supplement Nature Geosci 5 322ndash325 doi101038ngeo14502012
Guhathakurta P and Rajeevan M Trends in the rainfall pattern over India Int J Climatol20
28 1453ndash1469 doi101002joc1640 2008Harris I Jones P D Osborn T J and Lister D H Updated high-resolution grids of
monthly climatic observations ndash the CRU TS310 Dataset Int J Climatol 34 623ndash642doi101002joc3711 2014
Hartmann H and Andresky L Flooding in the Indus River basin ndash a spa-25
tiotemporal analysis of precipitation records Global Planet Change 107 25ndash35doi101016jgloplacha201304002 2013
Hastings D and Dunbar P Development amp Assessment of the Global Land One-km BaseElevation Digital Elevation Model (GLOBE) ISPRS Commission IV Symposium on GIS ndashBetween Visions and Applications Stuttgart Germany 7ndash10 September 199830
Hewitt K The Karakoram anomaly Glacier expansion and the ldquoelevation ef-fectrdquo Karakoram Himalaya Mt Res Dev 25 332ndash340 doi1016590276-4741(2005)025[0332TKAGEA]20CO2 2005
471
TCD9 441ndash493 2015
Snowfall in theHimalayas an
uncertain future froma little-known past
E Viste and A Sorteberg
Title Page
Abstract Introduction
Conclusions References
Tables Figures
J I
J I
Back Close
Full Screen Esc
Printer-friendly Version
Interactive Discussion
Discussion
Paper
|D
iscussionP
aper|
Discussion
Paper
|D
iscussionP
aper|
Huffman G J Adler R F Bolvin D T Gu G Nelkin E J Bowman K P Hong YStocker E F and Wolff D B The TRMM Multisatellite Precipitation Analysis (TMPA) quasi-global multiyear combined-sensor precipitation estimates at fine scales J Hydrometeorol8 38ndash55 2007
Immerzeel W Historical trends and future predictions of climate variability in the Brahmaputra5
basin Int J Climatol 28 243ndash254 doi101002joc1528 2008Immerzeel W W Droogers P de Jong S M and Bierkens M F P Large-scale monitoring
of snow cover and runoff simulation in Himalayan river basins using remote sensing RemoteSens Environ 113 40ndash49 doi101016jrse200808010 2009
Immerzeel W W van Beek L P H and Bierkens M F P Climate change will affect the10
asian water towers Science 328 1382ndash1385 doi101126science1183188 2010Ines A V M and Hansen J W Bias correction of daily GCM rainfall for crop simulation
studies Agr Forest Meteorol 138 44ndash53 doi101016jagrformet200603009 2006Jain S K Goswami A and Saraf A K Role of elevation and aspect in snow distribution
in western Himalaya Water Resour Manag 23 71ndash83 doi101007s11269-008-9265-515
2009Krakauer N Pradhanang S Lakhankar T and Jha A Evaluating satellite products for
precipitation estimation in mountain regions a case study for Nepal Remote Sensing 54107ndash4123 2013
Krishna A P Snow and glacier cover assessment in the high mountains of Sikkim Himalaya20
Hydrol Process 19 2375ndash2383 doi101002hyp5890 2005Kulkarni A V Rathore B P Singh S K and Ajai Distribution of seasonal snow cover in cen-
tral and western Himalaya Ann Glaciol 51 123ndash128 doi1031891727564107913864452010
Kumar V Rao Y S Venkataraman G Sarwade R N and Mani S Analysis of Aqua25
AMSR-E Derived Snow Water Equivalent over Himalayan Snow Covered Regions Geo-science and Remote Sensing Symposium Denver CO USA 31 Julyndash4 August 2006
Kaumlaumlb A Berthier E Nuth C Gardelle J and Arnaud Y Contrasting patterns of earlytwenty-first-century glacier mass change in the Himalayas Nature 488 495ndash498 availableat httpwwwnaturecomnaturejournalv488n7412absnature11324html ndash Supplement30
2012Lehner B Verdin K and Jarvis A New global hydrography derived from spaceborne eleva-
tion data Eos T Am Geophys Un 89 93ndash94 doi1010292008EO100001 2008
472
TCD9 441ndash493 2015
Snowfall in theHimalayas an
uncertain future froma little-known past
E Viste and A Sorteberg
Title Page
Abstract Introduction
Conclusions References
Tables Figures
J I
J I
Back Close
Full Screen Esc
Printer-friendly Version
Interactive Discussion
Discussion
Paper
|D
iscussionP
aper|
Discussion
Paper
|D
iscussionP
aper|
MacQueen J Some Methods for Classification and Analysis of Multivariate ObservationsFifth Berkeley Symposium on Mathematical Statistics and Probability Berkeley California21 Junendash18 July 1967
Meacuteneacutegoz M Galleacutee H and Jacobi H W Precipitation and snow cover in the Himalayafrom reanalysis to regional climate simulations Hydrol Earth Syst Sci 17 3921ndash39365
doi105194hess-17-3921-2013 2013Menon A Levermann A Schewe J Lehmann J and Frieler K Consistent increase in
Indian monsoon rainfall and its variability across CMIP-5 models Earth Syst Dynam 4287ndash300 doi105194esd-4-287-2013 2013
Moss R H Edmonds J A Hibbard K A Manning M R Rose S K van Vuuren D P10
Carter T R Emori S Kainuma M Kram T Meehl G A Mitchell J F B Naki-cenovic N Riahi K Smith S J Stouffer R J Thomson A M Weyant J P andWilbanks T J The next generation of scenarios for climate change research and assess-ment Nature 463 747ndash756 2010
Negi H S Kulkarni A V and Semwal B S Estimation of snow cover distribution in Beas15
basin Indian Himalaya using satellite data and ground measurements J Earth Syst Sci118 525ndash538 doi101007s12040-009-0039-0 2009
Palazzi E v Hardenberg J and Provenzale A Precipitation in the Hindu-Kush Karako-ram Himalaya observations and future scenarios J Geophys Res-Atmos 118 85ndash100doi1010292012JD018697 201320
Rees H G and Collins D N Regional differences in response of flow in glacier-fed Himalayanrivers to climatic warming Hydrol Process 20 2157ndash2169 doi101002hyp6209 2006
Rienecker M M Suarez M J Gelaro R Todling R Bacmeister J Liu EBosilovich M G Schubert S D Takacs L Kim G-K Bloom S Chen J Collins DConaty A da Silva A Gu W Joiner J Koster R D Lucchesi R Molod A Owens T25
Pawson S Pegion P Redder C R Reichle R Robertson F R Ruddick A GSienkiewicz M and Woollen J MERRA NASArsquos Modern-Era Retrospective Analysis forResearch and Applications J Climate 24 3624ndash3648 doi101175JCLI-D-11-0001512011
Rikiishi K and Nakasato H Height dependence of the tendency for reduction in seasonal30
snow cover in the Himalaya and the Tibetan Plateau region 1966ndash2001 Ann Glaciol 43369ndash377 doi103189172756406781811989 2006
473
TCD9 441ndash493 2015
Snowfall in theHimalayas an
uncertain future froma little-known past
E Viste and A Sorteberg
Title Page
Abstract Introduction
Conclusions References
Tables Figures
J I
J I
Back Close
Full Screen Esc
Printer-friendly Version
Interactive Discussion
Discussion
Paper
|D
iscussionP
aper|
Discussion
Paper
|D
iscussionP
aper|
Raumlisaumlnen J Warmer climate less or more snow Clim Dynam 30 307ndash319doi101007s00382-007-0289-y 2008
Schaner N Voisin N Nijssen B and Lettenmaier D P The contribution of glacier melt tostreamflow Environ Res Lett 7 034029 doi1010881748-932673034029 2012
Scherler D Bookhagen B and Strecker M R Spatially variable response of Himalayan5
glaciers to climate change affected by debris cover Nature Geosci 4 156ndash159 availableat httpwwwnaturecomngeojournalv4n3absngeo1068html ndash Supplement 2011
Sharif M Archer D R Fowler H J and Forsythe N Trends in timing and magnitude offlow in the Upper Indus Basin Hydrol Earth Syst Sci 17 1503ndash1516 doi105194hess-17-1503-2013 201310
Shekhar M S Chand H Kumar S Srinivasan K and Ganju A Climate-change studiesin the western Himalaya Ann Glaciol 51 105ndash112 doi1031891727564107913865082010
Shrestha A B Wake C P Mayewski P A and Dibb J E Maximum tempera-ture trends in the Himalaya and its vicinity an analysis based on temperature records15
from Nepal for the period 1971ndash94 J Climate 12 2775ndash2786 doi1011751520-0442(1999)012lt2775MTTITHgt20CO2 1999
Shrestha A B Wake C P Dibb J E and Mayewski P A Precipitation fluctuations in theNepal Himalaya and its vicinity and relationship with some large scale climatological parame-ters Int J Climatol 20 317ndash327 doi101002(SICI)1097-0088(20000315)203lt317AID-20
JOC476gt30CO2-G 2000Siderius C Biemans H Wiltshire A Rao S Franssen W H P Kumar P Gosain A K
van Vliet M T H and Collins D N Snowmelt contributions to discharge of the GangesSci Total Environ Supplement 468ndash469 9 doi101016jscitotenv201305084 2013
Singh P Jain S K and Kumar N Estimation of snow and glacier-melt contribution to the25
Chenab River Western Himalaya Mt Res Dev 17 49ndash56 doi1023073673913 1997Singh P Kumar V Thomas T and Arora M Changes in rainfall and relative hu-
midity in river basins in northwest and central India Hydrol Process 22 2982ndash2992doi101002hyp6871 2008
Sontakke N A Singh N and Singh H N Instrumental period rainfall series of the Indian30
region (AD 1813ndash2005) revised reconstruction update and analysis Holocene 18 1055ndash1066 doi1011770959683608095576 2008
474
TCD9 441ndash493 2015
Snowfall in theHimalayas an
uncertain future froma little-known past
E Viste and A Sorteberg
Title Page
Abstract Introduction
Conclusions References
Tables Figures
J I
J I
Back Close
Full Screen Esc
Printer-friendly Version
Interactive Discussion
Discussion
Paper
|D
iscussionP
aper|
Discussion
Paper
|D
iscussionP
aper|
Sperber K R Annamalai H Kang I S Kitoh A Moise A Turner A Wang B andZhou T The Asian summer monsoon an intercomparison of CMIP5 vs CMIP3 simulationsof the late 20th century Clim Dynam 41 2711ndash2744 doi101007s00382-012-1607-62013
Tahir A A Chevallier P Arnaud Y and Ahmad B Snow cover dynamics and hydrological5
regime of the Hunza River basin Karakoram Range Northern Pakistan Hydrol Earth SystSci 15 2275ndash2290 doi105194hess-15-2275-2011 2011a
Tahir A A Chevallier P Arnaud Y Neppel L and Ahmad B Modeling snowmelt-runoffunder climate scenarios in the Hunza River basin Karakoram Range Northern Pakistan JHydrol 409 104ndash117 doi101016jjhydrol201108035 2011b10
Taylor K E Stouffer R J and Meehl G A An overview of CMIP5 and the experimentdesign B Am Meteorol Soc 93 14 doi101175BAMS-D-11-000941 2011
Tedesco M and Narvekar P S Assessment of the NASA AMSR-E SWE product IEEE J SelTop Appl 3 141ndash159 doi101109JSTARS20102040462 2010
Teutschbein C and Seibert J Bias correction of regional climate model simulations for hydro-15
logical climate-change impact studies review and evaluation of different methods J Hydrol456ndash457 12ndash29 doi101016jjhydrol201205052 2012
Turner A G and Annamalai H Climate change and the South Asian summer monsoon NatClim Change 2 587ndash595 2012
van Vuuren D Edmonds J Kainuma M Riahi K Thomson A Hibbard K Hurtt G20
Kram T Krey V Lamarque J-F Masui T Meinshausen M Nakicenovic N Smith Sand Rose S The representative concentration pathways an overview Climatic Change109 26 doi101007s10584-011-0148-z 2011
Wang A and Zeng X Development of global hourly 05-degree land surface air temperaturedatasets J Climate 26 7676ndash7691 doi101175JCLI-D-12-006821 201325
Wiltshire A J Climate change implications for the glaciers of the Hindu Kush Karakoram andHimalayan region The Cryosphere 8 941ndash958 doi105194tc-8-941-2014 2014
Winiger M Gumpert M and Yamout H KarakorumndashHindukushndashwestern Himalaya assess-ing high-altitude water resources Hydrol Process 19 2329ndash2338 doi101002hyp5887200530
Xu X Lu C Shi X and Gao S World water tower An atmospheric perspective GeophysRes Lett 35 L20815 doi1010292008GL035867 2008a
475
TCD9 441ndash493 2015
Snowfall in theHimalayas an
uncertain future froma little-known past
E Viste and A Sorteberg
Title Page
Abstract Introduction
Conclusions References
Tables Figures
J I
J I
Back Close
Full Screen Esc
Printer-friendly Version
Interactive Discussion
Discussion
Paper
|D
iscussionP
aper|
Discussion
Paper
|D
iscussionP
aper|
Xu Z X Gong T L and Li J Y Decadal trend of climate in the Tibetan Plateaumdashregionaltemperature and precipitation Hydrol Process 22 3056ndash3065 doi101002hyp68922008b
Yasutomi N Hamada A and Akiyo Y Development of a Long-term Daily Gridded Temper-ature Dataset and its Application to RainSnow Discrimination of Daily Precipitation Global5
Environ Res15 165ndash172 2011Yatagai A Kamiguchi K Arakawa O Hamada A Yasutomi N and Kitoh A APHRODITE
Constructing a Long-Term Daily Gridded Precipitation Dataset for Asia Based on a DenseNetwork of Rain Gauges B Am Meteorol Soc 93 1401ndash1415 doi101175BAMS-D-11-001221 201210
You Q Kang S Aguilar E and Yan Y Changes in daily climate extremes in the east-ern and central Tibetan Plateau during 1961ndash2005 J Geophys Res-Atmos 113 D07101doi1010292007JD009389 2008
476
TCD9 441ndash493 2015
Snowfall in theHimalayas an
uncertain future froma little-known past
E Viste and A Sorteberg
Title Page
Abstract Introduction
Conclusions References
Tables Figures
J I
J I
Back Close
Full Screen Esc
Printer-friendly Version
Interactive Discussion
Discussion
Paper
|D
iscussionP
aper|
Discussion
Paper
|D
iscussionP
aper|
Table 1 Combinations of data types used in snowfall estimates T temperature P precipita-tion f (P T ) indicates that snowfall is calculated as a function of P and T
Precipitation Temperature Snowfall Time
MERRA MERRA PresentMERRA reference MERRA Terrain-adjusted MERRA f (P T ) PresentMERRA T2m MERRA MERRA T2m f (P T ) PresentBias-corrected with obs T MERRA Bias-corr terrain-adj MERRA f (P T ) PresentBias-corrected with obs P Bias-corr MERRA Terrain-adjusted MERRA f (P T ) PresentBias-corrected with obs T P Bias-corr MERRA Bias-corr terrain-adj MERRA f (P T ) PresentCMIP5 T MERRA Terrain-adj MERRA+∆T f (P T ) FutureCMIP5 P MERRAtimes∆P Terrain-adj MERRA f (P T ) FutureCMIP5 T P MERRAtimes∆P Terrain-adj MERRA+∆T f (P T ) FutureBias-corr CMIP5 T Bias-corr MERRA Bias-corr terrain-adj MERRA+∆T f (P T ) FutureBias-corr CMIP5 P Bias-corr MERRAtimes∆P Bias-corr terrain-adj MERRA f (P T ) FutureBias-corr CMIP5 T P Bias-corr MERRAtimes∆P Bias-corr terrain-adj MERRA+∆T f (P T ) Future
477
TCD9 441ndash493 2015
Snowfall in theHimalayas an
uncertain future froma little-known past
E Viste and A Sorteberg
Title Page
Abstract Introduction
Conclusions References
Tables Figures
J I
J I
Back Close
Full Screen Esc
Printer-friendly Version
Interactive Discussion
Discussion
Paper
|D
iscussionP
aper|
Discussion
Paper
|D
iscussionP
aper|
Table 2 Data sets used in calculations of present-day snowfall
Product Time Hor res Description
MERRA 1979ndash2012 05 lat 07 lon Hourly atmospheric reanalysis data(Rienecker et al 2011)
APHRODITEV1204V1101
1979ndash2007 025 Daily temperature andprecipitation basedon observations (Yatagai et al 2012Yasutomi et al 2011)
CRU TS 320 1979ndash2011 05 Monthly temperature and precipitationbased on observations(Harris et al 2014)
TRMM 3B42 V7 1998ndash2012 05 3 hourly satellite-based precipitation(Huffman et al 2007)
GLOBE 1 km Topography data set(Hastings and Dunbar 1998)
478
TCD9 441ndash493 2015
Snowfall in theHimalayas an
uncertain future froma little-known past
E Viste and A Sorteberg
Title Page
Abstract Introduction
Conclusions References
Tables Figures
J I
J I
Back Close
Full Screen Esc
Printer-friendly Version
Interactive Discussion
Discussion
Paper
|D
iscussionP
aper|
Discussion
Paper
|D
iscussionP
aper|
Table 3 CMIP5 models and RCPs used (x) in calculations of 2071ndash2100 snowfall
Model RCP 26 RCP 85
CanESM2 x xCCSM4 x xCESM1-CAM5 xCNRM-CM5 xGFDL-CM3 x xGFDL-ESM2G xGISS-E2-R x xHadGEM2-ES x xIPSL-CM5A-LR x xIPSL-CM5A-MR x xMIROC-ESM x xMIROC-ESM-CHEM x xMIROC5 x xMRI-CGCM3 x xNorESM1-M x xNorESM1-ME x x
479
TCD9 441ndash493 2015
Snowfall in theHimalayas an
uncertain future froma little-known past
E Viste and A Sorteberg
Title Page
Abstract Introduction
Conclusions References
Tables Figures
J I
J I
Back Close
Full Screen Esc
Printer-friendly Version
Interactive Discussion
Discussion
Paper
|D
iscussionP
aper|
Discussion
Paper
|D
iscussionP
aper|
Table 4 Annual snowfall estimates for the Indus Ganges and Brahmaputra Basins S snow[km3 SWE] P precipitation [km3] S and P percent of MERRA reference snowfall andMERRA precipitation First horizontal section no bias-corrections Second third and fourthsection bias-corrections with T P and both T and P
Indus Basin Ganges Basin Brahmaputra BasinInput S S P P S S P P S S P P
MERRA reference 148 100 422 100 54 100 1147 100 119 100 733 100MERRA 166 112 422 100 49 90 1147 100 129 109 733 100MERRA T2m 154 104 422 100 42 77 1147 100 109 92 733 100T APHRODITE 113 76 422 100 30 55 1147 100 74 62 733 100T CRU 126 85 422 100 81 151 1147 100 109 92 733 100P APHRODITE 66 44 315 75 22 42 1020 89 35 30 567 77P TRMM 72 49 404 96 31 57 1244 108 63 54 835 114P CRU 84 56 398 94 30 56 1100 96 53 45 716 98P T APHRODITE 49 33 315 75 12 22 1020 89 20 17 567 77P APHRODITE T CRU 62 42 315 75 34 63 1020 89 33 28 567 77P TRMM T APHRODITE 54 36 390 92 18 34 1195 104 39 33 815 111P TRMM T CRU 65 44 403 96 46 85 1254 109 58 49 813 111P CRU T APHRODITE 65 44 395 94 17 31 1106 96 31 26 718 98P T CRU 80 54 398 94 41 75 1100 96 49 42 716 98
480
TCD9 441ndash493 2015
Snowfall in theHimalayas an
uncertain future froma little-known past
E Viste and A Sorteberg
Title Page
Abstract Introduction
Conclusions References
Tables Figures
J I
J I
Back Close
Full Screen Esc
Printer-friendly Version
Interactive Discussion
Discussion
Paper
|D
iscussionP
aper|
Discussion
Paper
|D
iscussionP
aper|
Table 5 Projected change in annual snowfall from 1971ndash2000 to 2071ndash2100 with referenceto terrain-adjusted MERRA and APHRODITE ∆Sabs [km3] is the absolute change ∆Srel [] isthe relative change compared to the present-day MERRA reference snowfall Values are pre-sented with the CMIP5 multi-model mean as the main value and the span of individual modelsin brackets (MERRA only) ∆TP indicates that changes in both temperature and precipitationare included whereas ∆P and ∆T denotes changes only in precipitation or temperature re-spectively
Indus Ganges Brahmaputra∆Sabs [km3] ∆Srel [] ∆Sabs [km3] ∆Srel [] ∆Sabs [km3] ∆Srel []
RCP 85 MERRA ∆TP minus49 [minus83minus9] minus33 [minus56minus6] minus27 [minus36minus14] minus50 [minus66minus25] minus64 [minus93minus39] minus54 [minus79minus33]MERRA ∆T minus51 [minus67minus34] minus34 [minus45minus23] minus28 [minus34minus21] minus51 [minus64minus39] minus71 [minus87minus53] minus60 [minus73minus44]MERRA ∆P 5 [minus2544] 4 [minus1730] 7 [minus417] 12 [minus731] 20 [minus1750] 17 [minus1542]
APHRO ∆TP minus25 minus51 minus7 minus56 minus13 minus67APHRO ∆T minus25 minus52 minus7 minus57 minus14 minus71APHRO ∆P 1 1 1 6 3 16
RCP 26 MERRA ∆TP minus15 [minus406] minus10 [minus274] minus10 [minus19minus3] minus18 [minus36minus5] minus25 [minus42minus5] minus21 [minus35minus4]MERRA ∆T minus18 [minus27minus9] minus12 [minus18minus6] minus12 [minus21minus6] minus21 [minus39minus11] minus29 [minus47minus13] minus25 [minus40minus11]MERRA ∆P 3 [minus1825] 2 [minus1217] 3 [minus210] 5 [minus419] 7 [minus828] 6 [minus623]
APHRO ∆TP minus9 minus18 minus2 minus20 minus6 minus29APHRO ∆T minus10 minus19 minus3 minus23 minus6 minus32APHRO ∆P 1 1 0 4 1 6
481
TCD9 441ndash493 2015
Snowfall in theHimalayas an
uncertain future froma little-known past
E Viste and A Sorteberg
Title Page
Abstract Introduction
Conclusions References
Tables Figures
J I
J I
Back Close
Full Screen Esc
Printer-friendly Version
Interactive Discussion
Discussion
Paper
|D
iscussionP
aper|
Discussion
Paper
|D
iscussionP
aper|
Figure 1 Map of the region with the Indus Ganges and Brahmaputra basins outlined in whiteThinner outlines are national borders Background NASA Visible Earth
482
TCD9 441ndash493 2015
Snowfall in theHimalayas an
uncertain future froma little-known past
E Viste and A Sorteberg
Title Page
Abstract Introduction
Conclusions References
Tables Figures
J I
J I
Back Close
Full Screen Esc
Printer-friendly Version
Interactive Discussion
Discussion
Paper
|D
iscussionP
aper|
Discussion
Paper
|D
iscussionP
aper|
0
400 mm
Months 1ndash12
SP
I1
I2I3
I5I4
G1
G2G3
G4
B1
B2
B3B4
Viste amp SortebergFigure 2
Figure 2 Monthly mean MERRA precipitation and MERRA reference snowfall in sub-basinclusters of the Indus (I) Ganges (G) and Brahmaputra (B) Total bar height MERRA precip-itation (P) [mm] Colored bars snowfall (S) [mm SWE] based on MERRA precipitation andterrain-adjusted MERRA temperature in the region with the same color Cluster 1 in eachbasin is considered snow-free and the seasonal cycles are not shown
483
TCD9 441ndash493 2015
Snowfall in theHimalayas an
uncertain future froma little-known past
E Viste and A Sorteberg
Title Page
Abstract Introduction
Conclusions References
Tables Figures
J I
J I
Back Close
Full Screen Esc
Printer-friendly Version
Interactive Discussion
Discussion
Paper
|D
iscussionP
aper|
Discussion
Paper
|D
iscussionP
aper|
a) MERRA reference b) APHRODITE c) APHRODITE ndash MERRA ref
30 km3
20100-10-20-30
Viste amp SortebergFigure 3
Figure 3 The effect of bias-corrections with APHRODITE temperature and precipitation(a) MERRA reference snowfall (b) Snowfall based on bias-corrections with APHRODITE(c) APHRODITE (b) minus MERRA reference snowfall (a)
484
TCD9 441ndash493 2015
Snowfall in theHimalayas an
uncertain future froma little-known past
E Viste and A Sorteberg
Title Page
Abstract Introduction
Conclusions References
Tables Figures
J I
J I
Back Close
Full Screen Esc
Printer-friendly Version
Interactive Discussion
Discussion
Paper
|D
iscussionP
aper|
Discussion
Paper
|D
iscussionP
aper|
Figure 4 Difference between MERRA precipitation and observation-based data (a) Annualmean MERRA precipitation (b c and d) Annual mean MERRA precipitation bias-correctedwith observations APHRODITE CRU TS and TRMM 3B42 For each data set the small insetmaps show the observations minus MERRA
485
TCD9 441ndash493 2015
Snowfall in theHimalayas an
uncertain future froma little-known past
E Viste and A Sorteberg
Title Page
Abstract Introduction
Conclusions References
Tables Figures
J I
J I
Back Close
Full Screen Esc
Printer-friendly Version
Interactive Discussion
Discussion
Paper
|D
iscussionP
aper|
Discussion
Paper
|D
iscussionP
aper|
Biasminuscorrected minus original MERRA temperature [C]
minus15
minus10
minus5
0
5
10
Biasminuscorrected minus original MERRA temperature [C]
minus15
minus10
minus5
0
5
10
MERRA mean temperature [C] 1979minus2007
minus15
minus10
minus5
0
5
10
15
20
25
30a) MERRA b) APHRODITE ndash MERRA c) CRU ndash MERRA
-10
0
10
20
30degC
minus15
minus10
minus5
0
5
10
15degC
Viste amp SortebergFigure 5
Figure 5 Difference between MERRA temperature and observation-based data (a) Annualmean MERRA temperature (b and c) Annual mean MERRA temperature bias-corrected withobservations APHRODITE and CRU TS
486
TCD9 441ndash493 2015
Snowfall in theHimalayas an
uncertain future froma little-known past
E Viste and A Sorteberg
Title Page
Abstract Introduction
Conclusions References
Tables Figures
J I
J I
Back Close
Full Screen Esc
Printer-friendly Version
Interactive Discussion
Discussion
Paper
|D
iscussionP
aper|
Discussion
Paper
|D
iscussionP
aper|
Jan Apr
Jul Oct
a)
c)
b)
d)
15degC
10
5
0
ndash5
ndash10
ndash15
200 mm16012080400ndash40ndash80ndash120ndash160ndash200
Viste amp SortebergFigure 6
Figure 6 Regions where increasing temperatures are likely to cause a shift from snow to rainData monthly mean MERRA temperature terrain-adjusted to a 4 km GLOBE grid Red temper-ature between minus5 and 0 considered critical Small inset maps monthly MERRA precipitationin the critical zones
487
TCD9 441ndash493 2015
Snowfall in theHimalayas an
uncertain future froma little-known past
E Viste and A Sorteberg
Title Page
Abstract Introduction
Conclusions References
Tables Figures
J I
J I
Back Close
Full Screen Esc
Printer-friendly Version
Interactive Discussion
Discussion
Paper
|D
iscussionP
aper|
Discussion
Paper
|D
iscussionP
aper|
1 2 3 4 5 6 7 8 9 10 11 12Month
∆T [ordm
C]
a) Indus
0
1
2
3
4
5
6
7
8
9
10
b) Ganges∆T
[ordmC
]
1 2 3 4 5 6 7 8 9 10 11 12Month
1
2
3
4
5
6
7
8
0 0
c) Brahmaputra
∆T [ordm
C]
1 2 3 4 5 6 7 8 9 10 11 12Month
1
2
3
4
5
6
7
8
9
10 RCP 85RCP 85 meanRCP 26RCP 26 mean
Viste amp SortebergFigure 7
Figure 7 Projected future temperature change from 1971ndash2000 to 2071ndash2100 in the (a) In-dus (b) Ganges and (c) Brahmaputra Basins Thin lines show the individual CMIP5 modelsstronger lines the multi-model mean
488
TCD9 441ndash493 2015
Snowfall in theHimalayas an
uncertain future froma little-known past
E Viste and A Sorteberg
Title Page
Abstract Introduction
Conclusions References
Tables Figures
J I
J I
Back Close
Full Screen Esc
Printer-friendly Version
Interactive Discussion
Discussion
Paper
|D
iscussionP
aper|
Discussion
Paper
|D
iscussionP
aper|
1 2 3 4 5 6 7 8 9 10 11 12Month
[km
3 ]
a) Indus
0
20
40
60
80
100
120
140
b) Ganges[k
m3 ]
1 2 3 4 5 6 7 8 9 10 11 12Month
0
100
200
300
400
500
600
700
c) Brahmaputra
[km
3 ]
1 2 3 4 5 6 7 8 9 10 11 12Month
0
50
100
150
200
250
MERRA ref
2071ndash2100
1979ndash2008
RCP 85RCP 85 meanRCP 26RCP 26 mean
Viste amp SortebergFigure 8
Figure 8 Projected future precipitation in the (a) Indus (b) Ganges and (c) BrahmaputraBasins Gray bars MERRA 1979ndash2008 Thin lines and horizontal marks on the bars show theindividual CMIP5 models and the multi-model mean for 2071ndash2100
489
TCD9 441ndash493 2015
Snowfall in theHimalayas an
uncertain future froma little-known past
E Viste and A Sorteberg
Title Page
Abstract Introduction
Conclusions References
Tables Figures
J I
J I
Back Close
Full Screen Esc
Printer-friendly Version
Interactive Discussion
Discussion
Paper
|D
iscussionP
aper|
Discussion
Paper
|D
iscussionP
aper|
1 2 3 4 5 6 7 8 9 10 11 120
5
10
15
20
25
30
35
Month
SWE
[km
3 ]
a) Indus
0
1
2
3
4
5
6
7
8
b) Ganges
SWE
[km
3 ]
1 2 3 4 5 6 7 8 9 10 11 12Month
0
2
4
6
8
10
12
14
16
18
20
c) Brahmaputra
SWE
[km
3 ]
1 2 3 4 5 6 7 8 9 10 11 12Month
MERRA ref
2071ndash2100
1979ndash2008
RCP 85RCP 85 meanRCP 26RCP 26 mean
Viste amp SortebergFigure 9
Figure 9 Projected future snowfall in the (a) Indus (b) Ganges and (c) Brahmaputra Basinswith reference to MERRA reference snowfall Gray bars MERRA reference snowfall for 1979ndash2008 Thin lines and horizontal marks on the bars show the individual CMIP5 models andthe multi-model mean for 2071ndash2100 based on changes in temperature and precipitation asdescribed in Sect 23
490
TCD9 441ndash493 2015
Snowfall in theHimalayas an
uncertain future froma little-known past
E Viste and A Sorteberg
Title Page
Abstract Introduction
Conclusions References
Tables Figures
J I
J I
Back Close
Full Screen Esc
Printer-friendly Version
Interactive Discussion
Discussion
Paper
|D
iscussionP
aper|
Discussion
Paper
|D
iscussionP
aper|
Figure 10 Projected future changes in snowfall in sub-basins of the Indus Ganges andBrahmaputra Basins (a) Absolute change [km3] with reference to MERRA reference snow-fall (b) Absolute change [km3] with reference to APHRODITE snowfall (c d) Correspondingrelative changes [] with reference to MERRA and APHRODITE
491
TCD9 441ndash493 2015
Snowfall in theHimalayas an
uncertain future froma little-known past
E Viste and A Sorteberg
Title Page
Abstract Introduction
Conclusions References
Tables Figures
J I
J I
Back Close
Full Screen Esc
Printer-friendly Version
Interactive Discussion
Discussion
Paper
|D
iscussionP
aper|
Discussion
Paper
|D
iscussionP
aper|
J F M A M J J A S O N DMonth
0
5
10
15
20 km3Precip
0
2
4
6
8
10 km3SWE
2000
3000
4000
5000
6000 masl
1845
J F
M
A
M
JJ A
S
O
N
D
RSL
I4A = 146793 km2
1 km 3 = 68 mm
0
05
1
15 SWE rel
8000 m
0
J F M A M J J A S O N DMonth
0
2
4
6
8
10
12 km3 SWE
3000
4000
5000
6000 masl
78
2
14
J FM
A
MJ
J AS
O
ND
RSL
I5
Precip
0
5
10
15
20
25 km3
0
05
1
15 SWE rel
8000 m
0
A = 178669 km2
1 km 3 = 56 mm
CMIP52071ndash2100mean
Today
MERRA APHRODITE
Individual models
CMIP52071ndash2100mean
MERRA APHRODITE
Individual models
CMIP52071ndash2100Precip mean
MERRA APHRODITE
Individual models
SWE todayPrecip today
2000 mTerrain distribution of area between levels
CMIP52071ndash2100
TodayMERRA
APHRODITE
a)
i)
ii)
iii)
iv)
b)
Viste amp SortebergFigure 11
Figure 11 Monthly CMIP5 RCP 85 change in snowfall precipitation and rainsnow line eleva-tion in the upper Indus clusters (a) 4 and (b) 5 from 1971ndash2000 to 2071ndash2100 with referenceto the MERRA reference (red) and APHRODITE (blue) CMIP5 multi-model means are shownas horizontal marks individual models as dots Cluster location and terrain profile are shownabove the graphs (i) Fractional change in snowfall (ii) Future snowfall [km3] (dots) comparedto today (bars) (iii) Future precipitation [km3] (dots) compared to today (bars) Snowfall todayis shown as darker part of bars (iv) Rainsnow line elevation [m asl] Gray background el-evation histogram with the of total ground area lying in the marked 2000 m intervals Barschange from today (bottom) to CMIP5 multi-model mean (top)
492
TCD9 441ndash493 2015
Snowfall in theHimalayas an
uncertain future froma little-known past
E Viste and A Sorteberg
Title Page
Abstract Introduction
Conclusions References
Tables Figures
J I
J I
Back Close
Full Screen Esc
Printer-friendly Version
Interactive Discussion
Discussion
Paper
|D
iscussionP
aper|
Discussion
Paper
|D
iscussionP
aper|
3000
4000
5000
6000 masl
0
2
4
6
8
10 km3
0
10
20
30
40
50
60 km3
0
05
1
15
J F M A M J J A S O N DMonth
J FM
A
M
JJ A
S
O
ND
Precip
SWE
RSL
SWE rel
53
B3
8000 m
0
A = 139611 km2
1 km 3 = 72 mm
4500
5000
5500
6000
6500 masl
0
1
2
3
4 km3
0
10
20
30
40
50 km3
0
05
1
15 SWE rel
SWE
RSL
Precip
95
J F M A M J J A S O N DMonth
J FM
A
M
JJ A
S
ON
D
B4
8000 m
0
A = 159165 km2
1 km 3 = 63 mm
CMIP52071ndash2100mean
Today
MERRA APHRODITE
Individual models
CMIP52071ndash2100mean
MERRA APHRODITE
Individual models
CMIP52071ndash2100Precip mean
MERRA APHRODITE
Individual models
SWE todayPrecip today
2000 mTerrain distribution of area between levels
CMIP52071ndash2100
TodayMERRA
APHRODITE
a)
i)
ii)
iii)
iv)
b)
Viste amp SortebergFigure 12
Figure 12 Monthly CMIP5 RCP 85 change in snowfall precipitation and rainsnow line ele-vation in the upper Brahmaputra clusters (a) 4 and (b) 3 See Fig 11 for a description of thecontent
493
- Introduction
-
- Observed trends in snowfall temperature and precipitation
- Future projections of snowfall temperature and precipitation
- Aims and scope
-
- Data and methods
-
- Reference present-day snowfall
- Bias-corrected present-day snowfall
- Projected snowfall
- The rain-snow line
-
- Present-day snowfall
-
- Seasonal cycles of precipitation and snowfall
- Comparison of snowfall estimates
-
- Projected future snowfall
-
- Basin-scale projections
- Regional projections
-
- Upper Indus western part
- Upper Indus eastern part
- Upper Brahmaputra western part
- Upper Brahmaputra eastern part
-
- Potential effects of reduced snowfall on water availability
-
- Concluding summary
-

TCD9 441ndash493 2015
Snowfall in theHimalayas an
uncertain future froma little-known past
E Viste and A Sorteberg
Title Page
Abstract Introduction
Conclusions References
Tables Figures
J I
J I
Back Close
Full Screen Esc
Printer-friendly Version
Interactive Discussion
Discussion
Paper
|D
iscussionP
aper|
Discussion
Paper
|D
iscussionP
aper|
the RCP 26 The summer is also the season with the largest absolute increase inprecipitation
Compared to present-day estimates the CMIP5 models project less snowfall in theIndus Ganges and Brahmaputra Basins in the last decades of this century This canbe seen from Fig 9 The projected multi-model mean is lower than today in all calen-5
dar months for both RCPs 26 and 85 With the RCP 26 some models suggest anincrease in some months mainly in winter and spring This is also the case for one ortwo models with the RCP 85 whereas other models indicate that the snowfall in thesame months will be only half of todayrsquos values
In the Ganges Basin (Fig 9b) the seasonal distribution of snowfall today is mainly10
flat with equal amounts of snowfall from January through September Reductions insummer snowfall with the RCP 85 would change the seasonal cycle into a winter-dominated one To a lesser degree this is also the case for RCP 26 As summerprecipitation is projected to increase in all of the Ganges (not shown but consistentwith Menon et al 2013) this indicates that large areas are at elevations where a small15
increase in the summer temperature may cause a shift from snow to rain This is seenas the red band along the upper Ganges in Fig 6c Reductions in summer snowfall arealso large in the Brahmaputra (Fig 9b) whereas in the Indus the largest total changesoccur in MarchndashMay (Fig 9a)
As the MERRA reference snowfall for today is much larger than APHRODITE snow-20
fall (Sect 32) projected absolute changes for 2071ndash2100 are also much largerin MERRA The relative changes are more similar though larger with reference toAPHRODITE Annual snowfall changes for each major basin are presented in Table 5for changes in temperature precipitation or both and with reference to MERRA andAphrodite present-day snowfall Changes at the sub-basin level are shown in Fig 1025
In the Ganges Basin both MERRA- and APHRODITE-based multi-model mean snow-fall is reduced by about 20 with the RCP 26 and 50 with the RCP 85 In theIndus and Brahmaputra Basins the differences between MERRA- and APHRODITE-based changes are larger but not as large as for the absolute values With reference
460
TCD9 441ndash493 2015
Snowfall in theHimalayas an
uncertain future froma little-known past
E Viste and A Sorteberg
Title Page
Abstract Introduction
Conclusions References
Tables Figures
J I
J I
Back Close
Full Screen Esc
Printer-friendly Version
Interactive Discussion
Discussion
Paper
|D
iscussionP
aper|
Discussion
Paper
|D
iscussionP
aper|
to MERRA and APHRODITE respectively the reduction in snowfall in the Indus Basinis 30 and 50 with the RCP 85 The corresponding reductions in the BrahmaputraBasin are 50 and 70
The projected changes in temperature have greater effect on snowfall than thechanges in precipitation When taking into account only changes in precipitation all5
snowfall estimates are positive (∆P Table 5) This indicates that the mean annual to-tal reduction for each major basin is governed by the temperature change In someCMIP5 models (values in brackets in Table 5) the effect of precipitation changes (∆P )on snowfall are of the same magnitude as the effect of temperature changes (∆T ) butfor the CMIP5 multi-model mean temperature changes cause snowfall changes 4ndash1010
times as large as those due to changes in precipitation This is with reference to thepresent-day MERRA reference snowfall and for both RCPs 26 and 85 With referenceto APHRODITE snowfall the effect of temperature changes compared to precipitationchanges is even greater
42 Regional projections15
If temperatures are far below freezing everywhere warming may have little effect onsnowfall The same applies if only the highest peaks receive snow today The largestreduction in snowfall in a basin occurs if todayrsquos rainsnow line is at an elevation justbelow the dominant elevation of the basin Then large regions will see a shift fromsnow to rain20
In the Indus Basin the largest relative snowfall reduction by 2071ndash2100 is seen inthe southwestern sub-basins where snowfall is limited today (Fig 10) The largest totalreduction is seen in the snow-rich sub-basins of KabulSwatAlingar in the west and inthe east and a smaller reduction in the inner-most basins of GilgitHunza Indus 1 andNubraShyok Together with the upper regions of the Brahmaputra these sub-basins25
clusters I4 I5 B3 and B4 in Fig 2 were selected for a closer analysis In addition tohaving the most snow these clusters are the most homogeneous when considering
461
TCD9 441ndash493 2015
Snowfall in theHimalayas an
uncertain future froma little-known past
E Viste and A Sorteberg
Title Page
Abstract Introduction
Conclusions References
Tables Figures
J I
J I
Back Close
Full Screen Esc
Printer-friendly Version
Interactive Discussion
Discussion
Paper
|D
iscussionP
aper|
Discussion
Paper
|D
iscussionP
aper|
the seasonal cycle of snowfall and snow fraction The values presented in this sectionare all from the RCP 85 for changes from today to 2071ndash2100
421 Upper Indus western part
Cluster 4 consists of the sub-basins Astor KabulSwatAlingar and Krishen GangaAs seen from the elevation profile at the top of Fig 11a the elevation span is large5
and there is an almost equal proportion of the terrain at all levels from heights close tosea level to about 5000 masl The most important change for this cluster is a largereduction in the total amount of snowfall in winter and spring
With a few exceptions all CMIP5 models project less snowfall in all months of theyear (Fig 11a i ii) The largest total multi-model mean reduction in snowfall (ii) oc-10
curs in FebruaryndashApril without notable change in the multi-model mean precipitation(iii) Thus the reduction is caused by increasing temperatures represented by therainsnow line in Fig 11a iv As seen from the change in the rainsnow line elevationthe projected temperature increase in these months would imply that large areas thatreceive snow today would receive only rain About 40 of the ground in this cluster lies15
below 2000 masl and receives precipitation as rain throughout the year In summerprecipitation (iii) is at a minimum and the rainsnow line (iv) is already so high that onlya small fraction of the area receives snowfall today Thus although the relative changein snowfall (i) is largest in summer the change in the amount of snowfall (ii) is small Itshould also be noted that the change in the rainsnow line elevation (iv) in summer is20
much smaller 400ndash600 m compared to 600ndash900 m in DecemberndashApril
422 Upper Indus eastern part
Further east the largest changes are projected for the spring season Cluster 5 in theIndus Basin consists of the sub-basins GilgitHunza Indus 1 NubraShyok and Zan-skar As shown in Fig 11b this is high-elevation terrain with 80 of the ground lying25
above 4000 masl As a result almost all winter precipitation is snow (Fig 11b iii)
462
TCD9 441ndash493 2015
Snowfall in theHimalayas an
uncertain future froma little-known past
E Viste and A Sorteberg
Title Page
Abstract Introduction
Conclusions References
Tables Figures
J I
J I
Back Close
Full Screen Esc
Printer-friendly Version
Interactive Discussion
Discussion
Paper
|D
iscussionP
aper|
Discussion
Paper
|D
iscussionP
aper|
For the multi-model mean no big changes are projected in JanuaryndashFebruary This ispartly because of little change in precipitation (iii) and because the rainsnow line (iv)in these months is sufficiently low in the terrain today With the 500ndash600 m shift pro-jected with the RCP 85 80ndash90 of the area will still have temperatures low enoughfor snow The largest changes occur in MarchndashOctober when higher temperatures5
push the rainsnow line above large areas that receive snow today Increasing summerprecipitation (iii) causes the snowfall reduction in summer to be less than it would other-wise be The effect of higher temperatures is smaller on the APHRODITE snowfall thanon the MERRA reference snowfall (ii) as APHRODITE has very little summer snow-fall today The difference arises both from less precipitation (iii) in APHRODITE than10
MERRA today and from a higher rainsnow line (iv) in APHRODITE Note that as thechange in precipitation was defined as a fraction of the present-day value (Sect 23)the relative changes in APHRODITE and MERRA precipitation are equal
423 Upper Brahmaputra western part
In the westernmost part of the upper Brahmaputra Basin large snowfall changes are15
projected for the summer As cluster 5 in the Indus Basin Brahmaputrarsquos cluster 4 islimited to higher grounds Less than 6 lies outside of the 4000ndash6000 masl rangeThe cluster consists of Maquan He Yarlung Zangbo Dogxung ZangboMaiqu ZangboShang ChuYarlung ZangboNyang Lhasa HeRazheng Zangbo and Yamzho YumcoThe summer monsoon fully dominates the seasonal cycle of precipitation in this region20
(Fig 12a iii) resulting in a unimodal snow cycle with a maximum in JulyndashSeptember InAPHRODITE the seasonal cycle of snowfall is similar but less pronounced than in theMERRA reference The summer also sees the greatest reduction in CMIP5 projectedsnowfall both in absolute (ii) and relative (i) terms despite increasing summer precip-itation in all models (iii) The reason can be seen from the change in the rainsnow25
line elevation (iv) In the warmest months July and August elevation changes of 400ndash500 m would shift the rainsnow line from a level where at least 5ndash10 of the groundlies above the line to a level where only 1 of the area would receive precipitation as
463
TCD9 441ndash493 2015
Snowfall in theHimalayas an
uncertain future froma little-known past
E Viste and A Sorteberg
Title Page
Abstract Introduction
Conclusions References
Tables Figures
J I
J I
Back Close
Full Screen Esc
Printer-friendly Version
Interactive Discussion
Discussion
Paper
|D
iscussionP
aper|
Discussion
Paper
|D
iscussionP
aper|
snow In comparison with reference to MERRA the 300ndash400 m shift seen in JanuaryndashFebruary would cause only a small absolute change in snowfall (ii) because there islittle precipitation in these months (ii) and a small relative change (i) because therainsnow line would still be low in the terrain (iv) With reference to APHRODITE therelative snowfall change in winter would be larger than with reference to MERRA as5
temperatures today are higher resulting in a higher rainsnow line (iv)
424 Upper Brahmaputra eastern part
Like further west the Indian summer monsoon dominates the precipitation cycle in theeastern part of upper Brahmaputra (Fig 12b iii) but the seasonal cycle of snowfallpeaks in spring and fall (iii) This is also the time of the largest projected changes10
Cluster 3 in the Brahmaputra consists of the sub-basins Yarlung Zangbo2 NyangQu Yarlung Zangbo3 Yirsquoong ZangboParl Siyom Zaya QuLuhitDi About 70 of theground lies between 3000 and 6000 masl but there is also land almost at sea levelmainly in the Zaya QuLuhitDingba Qu sub-basin During summer most of the terrainlies below the rainsnow line (iv) In spring temperatures are lower than in summer15
and pre- monsoon precipitation is stronger in this part of the Himalayas than furtherwest in cluster 3 (Fig 12a iii vs Fig 12b iii) As a result MarchndashApril gets the mostsnow
Reductions in snowfall are projected for all months (ii) comparable in magnitude butlargest in the snow-rich spring and late summer The CMIP5 multi-model mean shows20
increasing or no change in precipitation in all months (Fig 12b iii) so the reductionin snowfall is due solely to higher temperatures The largest absolute reductions inApril and May occur with a 700ndash800 m shift in the rainsnow line elevation leaving30 more of the terrain in the rain The largest relative reduction in future snowfall areprojected for July and August (Fig 12b i) when the rainsnow line shifts so high that25
only the highest peaks can get precipitation as snow (iv) This would be despite thelowest changes in the rainsnow line only about 300 m in APHRODITE
464
TCD9 441ndash493 2015
Snowfall in theHimalayas an
uncertain future froma little-known past
E Viste and A Sorteberg
Title Page
Abstract Introduction
Conclusions References
Tables Figures
J I
J I
Back Close
Full Screen Esc
Printer-friendly Version
Interactive Discussion
Discussion
Paper
|D
iscussionP
aper|
Discussion
Paper
|D
iscussionP
aper|
43 Potential effects of reduced snowfall on water availability
With a few exceptions the CMIP5 multi-model mean precipitation change over the com-ing century is positive in all months in the upper Indus and Brahmaputra (Sect 42)Thus the projected reduction in snowfall is due solely to higher temperatures How-ever there is a large spread in precipitation projections among the models If tempera-5
tures increase as much as projected with the RCP 85 could any realistic precipitationchange in the HKH compensate and maintain present-day snowfall Results indicatethat this may happen in parts of the upper Indus but is out of the reach in the upperBrahmaputra As for water availability reduced snowfall may still cause more severeproblems in the Indus than in the Brahmaputra10
In cold regions where temperatures remain below freezing more winter precipita-tion may increase both the snow cover area the length of the snow season and theSWE (Collins et al 2013 Brutel-Vuilmet et al 2013 Raumlisaumlnen 2008 Gao et al 2012Wiltshire 2014) Raumlisaumlnen (2008) showed this to be the case in eastern Siberia andthe northernmost part of North America At the southern edge of the seasonal snow15
cover relevant for this study precipitation did not compensate and there was a reduc-tion in SWEWiltshire (2014) concluded that there would be small changes in snowfallin very cold and very warm regions of the HKH Snowfall in Nepal Bhutan and Hi-machal Pradesh where winters are warmer than in most parts of the range was mostvulnerable to higher temperatures The data presented in Sect 42 generally support20
the previous studiesOne of the reasons that precipitation does not compensate is that the highest pro-
jected precipitation increase in the HKH is seen in the summer when the temperaturetoday is so high that only the highest terrain is in the snow zone Shifting the rainsnowline upward even by only a few hundred meters reduces the area that receives snow25
greatly requiring very large increases in precipitation to compensate The summer isthe season with the largest relative reduction in snowfall in all the clusters described inSect 42 Except in the western upper Indus (cluster I4 Sect 421) which has very
465
TCD9 441ndash493 2015
Snowfall in theHimalayas an
uncertain future froma little-known past
E Viste and A Sorteberg
Title Page
Abstract Introduction
Conclusions References
Tables Figures
J I
J I
Back Close
Full Screen Esc
Printer-friendly Version
Interactive Discussion
Discussion
Paper
|D
iscussionP
aper|
Discussion
Paper
|D
iscussionP
aper|
little summer snowfall today the reduction in summer snowfall is notable in all clustersin the MERRA data in the Brahmaputra clusters also in APHRODITE
The largest change in snowfall is seen in the western part of the Brahmaputra (clus-ter B4 Sect 423) where a 400ndash500 m upward shift in the rainsnow line during sum-mer reduces the area with temperatures low enough for snowfall by a factor of 5ndash105
(Fig 12a iv values not shown) As a result the summer peak in the seasonal cycleof snowfall is replaced by a dip (Fig 12a ii) With an even distribution of precipitationwith elevation the area that still receives snow would have to receive 5ndash10 times asmuch precipitation to compensate for the lost snowfall Assuming more realisticallythat precipitation decreases above a certain height would require an even higher in-10
crease in precipitation In the model with the highest increase a doubling of the Julyprecipitation by the end of the century SWE is less than 25 of todayrsquos value in thatmonth (Fig 12a iii)
With a winter-dominated precipitation cycle the relative change in snowfall is smallerin the upper Indus than in the upper Brahmaputra Downscaling a high-emission sce-15
nario (A1B) in two CMIP3 models with a regional model Wiltshire (2014) found that bythe 2080s precipitation increased more than enough to compensate for higher temper-atures in the Karakoram Hindu Kush and Jammu and Kashmir in one of the modelsthe HadCM3 In the other model ECHAM5 precipitation increased less and snow-fall increased only in the higher parts of the Karakoram In our ensemble of CMIP520
models multi-model mean precipitation in the upper Indus clusters increases mainlyin the summer season when the inter-model spread is also the largest (Fig 11a iiiand 11b iii) Among the models 4ndash5 project increased winter precipitation in the upperIndus and in the uppermost cluster I5 this is associated with an increase in wintersnowfall (Fig 11b ii)25
Although it is the part of the HKH where snowfall is least reduced by increasingtemperatures (Fig 10b) the Karakoram and inner parts of the upper Indus may still bethe region where the changes have the largest impact on river run-off Compared tothe monsoon-dominated regions further east there is little summer precipitation and
466
TCD9 441ndash493 2015
Snowfall in theHimalayas an
uncertain future froma little-known past
E Viste and A Sorteberg
Title Page
Abstract Introduction
Conclusions References
Tables Figures
J I
J I
Back Close
Full Screen Esc
Printer-friendly Version
Interactive Discussion
Discussion
Paper
|D
iscussionP
aper|
Discussion
Paper
|D
iscussionP
aper|
much of the water in the rivers during summer is meltwater (Bookhagen and Burbank2010 Immerzeel et al 2010) As melting of snow and ice has not been analyzed inthis study we cannot quantify the effect of reduced snowmelt om river run-off but it isobvious that eventually reduced snowfall will lead to reduced melting In western partsof the HKH this may lead to changes in the seasonal cycle of the river flow5
As pointed out by Wiltshire (2014) increasing precipitation in the eastern HKH im-plies that water resources are likely to increase with climate change As snowfall andsnowmelt are both at maximum during summer (Rees and Collins 2006) meltwaterdoes not have the same importance for river flow in dry parts of the year as in the In-dus Reduced snowfall may reduce glaciers but ndash not considering potential changes in10
the amount of evaporation ndash there is no indication that there will be less water comingfrom the upper Brahmaputra
5 Concluding summary
In this study we have presented a suite of estimates of present-day snowfall in theIndus Ganges and Brahmaputra Basins and the changes in snowfall that would follow15
from CMIP5 projected changes in temperature and precipitation from 1971ndash2000 to2071ndash2100 The results show that if the temperature increases as much as in the RCP85 there will be much less snowfall despite increasing precipitation in most of theregion Limiting anthropogenic forcing to the RCP 26 level would still cause reductionsthough smaller20
Estimates of present-day snowfall based on a combination of temperature and pre-cipitation from reanalysis data and observations vary by factors of 2ndash4 The MERRAreanalysis gives higher estimates than TRMM 3B42 CRU TS and APHRODITE butthe spread is also large between the estimates based on the different observationallybased data sets This demonstrates the difficulties in assessing vulnerability to climate25
change in the region With limited knowledge of the current state future conditions arebound to be uncertain
467
TCD9 441ndash493 2015
Snowfall in theHimalayas an
uncertain future froma little-known past
E Viste and A Sorteberg
Title Page
Abstract Introduction
Conclusions References
Tables Figures
J I
J I
Back Close
Full Screen Esc
Printer-friendly Version
Interactive Discussion
Discussion
Paper
|D
iscussionP
aper|
Discussion
Paper
|D
iscussionP
aper|
Future changes in temperature and precipitation projected by climate models can stillprovide an indication of the relative change in snowfall With the RCP 85 the climatemodels project mean reductions in annual snowfall by 30ndash50 in the Indus Basin 50ndash60 in the Ganges Basin and 50ndash70 in the Brahmaputra Basin by 2071ndash2100 Withthe RCP 26 the corresponding reductions would be 10ndash20 in the Indus about 20 5
in the Ganges and 20ndash30 in the Brahmaputra The reductions are due to increasingtemperatures as the mean of the models show constant or increasing precipitationthroughout the year in most of the region
How much increasing temperatures reduce snowfall in a region depends on howmuch of the terrain that is below and above the freezing point today and on whether10
the terrain profile is such that the temperature increase transforms large areas fromsnow to rain zones With the RCP 85 the mean elevation where rain changes to snowndash the rainsnow line ndash creeps upward by 400ndash900 m in most of the region by 700ndash900 m
The largest relative change in snowfall is seen in the upper westernmost sub-basins15
of the Brahmaputra despite increasing precipitation and the lowest rainsnow line el-evation change (400ndash500 m) This is because a major part of this region is near thefreezing point today With the RCP 85 most of this region will have temperaturesabove freezing especially in the summer which is the wettest part of the year Theprojected reduction in annual snowfall is 65ndash75 20
In the upper Indus the effect of a warmer climate on snowfall is less extreme asmost of the terrain is high enough to have temperatures sufficiently far below freezingtoday Winter and spring brings most of the precipitation and the projected 600ndash800 mchange in the rainsnow line elevation during these seasons would leave most of theterrain below the freezing point Still a 20ndash40 reduction in annual snowfall is pro-25
jected with the RCP 85The range of our estimates of present-day snowfall illustrates how little that is known
about conditions that influence the availability of drinking water in some of the mostdensely populated parts of the world There is both a scientific and a societal need
468
TCD9 441ndash493 2015
Snowfall in theHimalayas an
uncertain future froma little-known past
E Viste and A Sorteberg
Title Page
Abstract Introduction
Conclusions References
Tables Figures
J I
J I
Back Close
Full Screen Esc
Printer-friendly Version
Interactive Discussion
Discussion
Paper
|D
iscussionP
aper|
Discussion
Paper
|D
iscussionP
aper|
for more information about precipitation in the HKH As a full-scale long-time observa-tional program covering all parts of the Himalayan range is not a likely possibility theonly hope for improved future knowledge of Himalayan snowfall lies in the improvementof satellite data and regional climate models
The Supplement related to this article is available online at5
doi105194tcd-9-441-2015-supplement
Acknowledgements This work has been carried out with support from the University of Bergenthe NORINDIA and SNOWHIM projects funded by The Research Council of Norway and theCentre for Climate Dynamics at the Bjerknes Centre for Climate Research We acknowledgethe World Climate Research Programmersquos Working Group on Coupled Modelling which is re-10
sponsible for CMIP and we thank the climate modeling groups listed in Table 3 of this paper forproducing and making available their model output For CMIP the US Department of EnergyrsquosProgram for Climate Model Diagnosis and Intercomparison provides coordinating support andled development of software infrastructure in partnership with the Global Organization for EarthSystem Science Portals15
References
Akhtar M Ahmad N and Booij M J The impact of climate change on the water resourcesof Hindukush-Karakorum-Himalaya region under different glacier coverage scenarios J Hy-drol 355 148ndash163 2008
Anders A M Roe G H Hallet B Montgomery D R Finnegan N J and Putkonen J20
Spatial patterns of precipitation and topography in the Himalaya in Tectonics Climate andLandscape Evolution Geological Society of America Special Paper edited by Willett S DHovius N Brandon M T and Fisher D Geological Society of America Boulder CO USA39ndash53 2006
469
TCD9 441ndash493 2015
Snowfall in theHimalayas an
uncertain future froma little-known past
E Viste and A Sorteberg
Title Page
Abstract Introduction
Conclusions References
Tables Figures
J I
J I
Back Close
Full Screen Esc
Printer-friendly Version
Interactive Discussion
Discussion
Paper
|D
iscussionP
aper|
Discussion
Paper
|D
iscussionP
aper|
Archer DR and Fowler HJ Spatial and temporal variations in precipitation in the UpperIndus Basin global teleconnections and hydrological implications Hydrol Earth Syst Sci8 47ndash61 doi105194hess-8-47-2004 2004
Bhutiyani M R Kale V S and Pawar N J Long-term trends in maximum minimum andmean annual air temperatures across the Northwestern Himalaya during the twentieth cen-5
tury Climatic Change 85 159ndash177 doi101007s10584-006-9196-1 2007Bhutiyani M R Kale V S and Pawar N J Climate change and the precipitation variations in
the northwestern Himalaya 1866ndash2006 Int J Climatol 30 535ndash548 doi101002joc19202010
Bookhagen B and Burbank D W Topography relief and TRMM-derived rainfall variations10
along the Himalaya Geophys Res Lett 33 L08405 doi1010292006GL026037 2006Bookhagen B and Burbank D W Toward a complete Himalayan hydrological budget spa-
tiotemporal distribution of snowmelt and rainfall and their impact on river discharge J Geo-phys Res 115 F03019 doi1010292009jf001426 2010
Franco B Fettweis X and Erpicum M Future projections of the Greenland ice sheet energy15
balance driving the surface melt The Cryosphere 7 1ndash18 doi105194tc-7-1-2013 2013Butt M J Characteristics of snow cover in the Hindukush Karakoram and Himalaya region
using Landsat satellite data Hydrol Process 10 3689ndash3698 doi101002hyp8375 2012Byun K and Choi M Uncertainty of snow water equivalent retrieved from AMSR-E brightness
temperature in northeast Asia Hydrol Process 28 12 doi101002hyp9846 201420
Chaturvedi R K Joshi J Jayaraman M Bala G and Ravindranath N H Multi-modelclimate change projections for India under representative concentration pathways Curr SciIndia 103 791ndash802 2012
Christensen J H Krishna Kumar K Aldrian E An S-I Cavalcanti I F A Castro Md Dong W Goswami P Hall A Kanyanga J K Kitoh A Kossin J Lau N-C Ren-25
wick J Stephenson D B Xie S-P and Zhou T Climate phenomena and their relevancefor future regional climate change in Climate Change 2013 The Physical Science BasisContribution of Working Group I to the Fifth Assessment Report of the Intergovernmen-tal Panel on Climate Change edited by Stocker T F Qin D Plattner G-K Tignor MAllen S K Boschung J Nauels A Xia Y Bex V and Midgley P M Cambridge Univer-30
sity Press Cambridge UK and New York NY USA 92 2013Collins M Knutti R Arblaster J Dufresne J-L Fichefet T Friedlingstein P Gao X
Gutowski W J Johns T Krinner G Shongwe M Tebaldi C Weaver A J and
470
TCD9 441ndash493 2015
Snowfall in theHimalayas an
uncertain future froma little-known past
E Viste and A Sorteberg
Title Page
Abstract Introduction
Conclusions References
Tables Figures
J I
J I
Back Close
Full Screen Esc
Printer-friendly Version
Interactive Discussion
Discussion
Paper
|D
iscussionP
aper|
Discussion
Paper
|D
iscussionP
aper|
Wehner M Long-term climate change projections commitments and irreversibility in Cli-mate Change 2013 The Physical Science Basis Contribution of Working Group I to theFifth Assessment Report of the Intergovernmental Panel on Climate Change edited byStocker T F Qin D Plattner G-K Tignor M Allen S K Boschung J Nauels AXia Y Bex V and Midgley P M Cambridge University Press Cambridge UK and New5
York NY USA 108 2013Cook E R Palmer J G Ahmed M Woodhouse C A Fenwick P Zafar M U Wahab M
and Khan N Five centuries of Upper Indus River flow from tree rings J Hydrol 486 365ndash375 doi101016jjhydrol201302004 2013
Dai A Temperature and pressure dependence of the rain-snow phase transition over land and10
ocean Geophys Res Lett 35 L12802 doi1010292008gl033295 2008Fowler H J and Archer D R Conflicting signals of climatic change in the Upper Indus Basin
J Climate 19 4276ndash4293 doi101175jcli38601 2006Gao J Williams M W Fu X Wang G and Gong T Spatiotemporal distribution of snow
in eastern Tibet and the response to climate change Remote Sens Environ 121 1ndash915
doi101016jrse201201006 2012Gardelle J Berthier E and Arnaud Y Slight mass gain of Karakoram glaciers in the
early twenty-first century ndash Supplement Nature Geosci 5 322ndash325 doi101038ngeo14502012
Guhathakurta P and Rajeevan M Trends in the rainfall pattern over India Int J Climatol20
28 1453ndash1469 doi101002joc1640 2008Harris I Jones P D Osborn T J and Lister D H Updated high-resolution grids of
monthly climatic observations ndash the CRU TS310 Dataset Int J Climatol 34 623ndash642doi101002joc3711 2014
Hartmann H and Andresky L Flooding in the Indus River basin ndash a spa-25
tiotemporal analysis of precipitation records Global Planet Change 107 25ndash35doi101016jgloplacha201304002 2013
Hastings D and Dunbar P Development amp Assessment of the Global Land One-km BaseElevation Digital Elevation Model (GLOBE) ISPRS Commission IV Symposium on GIS ndashBetween Visions and Applications Stuttgart Germany 7ndash10 September 199830
Hewitt K The Karakoram anomaly Glacier expansion and the ldquoelevation ef-fectrdquo Karakoram Himalaya Mt Res Dev 25 332ndash340 doi1016590276-4741(2005)025[0332TKAGEA]20CO2 2005
471
TCD9 441ndash493 2015
Snowfall in theHimalayas an
uncertain future froma little-known past
E Viste and A Sorteberg
Title Page
Abstract Introduction
Conclusions References
Tables Figures
J I
J I
Back Close
Full Screen Esc
Printer-friendly Version
Interactive Discussion
Discussion
Paper
|D
iscussionP
aper|
Discussion
Paper
|D
iscussionP
aper|
Huffman G J Adler R F Bolvin D T Gu G Nelkin E J Bowman K P Hong YStocker E F and Wolff D B The TRMM Multisatellite Precipitation Analysis (TMPA) quasi-global multiyear combined-sensor precipitation estimates at fine scales J Hydrometeorol8 38ndash55 2007
Immerzeel W Historical trends and future predictions of climate variability in the Brahmaputra5
basin Int J Climatol 28 243ndash254 doi101002joc1528 2008Immerzeel W W Droogers P de Jong S M and Bierkens M F P Large-scale monitoring
of snow cover and runoff simulation in Himalayan river basins using remote sensing RemoteSens Environ 113 40ndash49 doi101016jrse200808010 2009
Immerzeel W W van Beek L P H and Bierkens M F P Climate change will affect the10
asian water towers Science 328 1382ndash1385 doi101126science1183188 2010Ines A V M and Hansen J W Bias correction of daily GCM rainfall for crop simulation
studies Agr Forest Meteorol 138 44ndash53 doi101016jagrformet200603009 2006Jain S K Goswami A and Saraf A K Role of elevation and aspect in snow distribution
in western Himalaya Water Resour Manag 23 71ndash83 doi101007s11269-008-9265-515
2009Krakauer N Pradhanang S Lakhankar T and Jha A Evaluating satellite products for
precipitation estimation in mountain regions a case study for Nepal Remote Sensing 54107ndash4123 2013
Krishna A P Snow and glacier cover assessment in the high mountains of Sikkim Himalaya20
Hydrol Process 19 2375ndash2383 doi101002hyp5890 2005Kulkarni A V Rathore B P Singh S K and Ajai Distribution of seasonal snow cover in cen-
tral and western Himalaya Ann Glaciol 51 123ndash128 doi1031891727564107913864452010
Kumar V Rao Y S Venkataraman G Sarwade R N and Mani S Analysis of Aqua25
AMSR-E Derived Snow Water Equivalent over Himalayan Snow Covered Regions Geo-science and Remote Sensing Symposium Denver CO USA 31 Julyndash4 August 2006
Kaumlaumlb A Berthier E Nuth C Gardelle J and Arnaud Y Contrasting patterns of earlytwenty-first-century glacier mass change in the Himalayas Nature 488 495ndash498 availableat httpwwwnaturecomnaturejournalv488n7412absnature11324html ndash Supplement30
2012Lehner B Verdin K and Jarvis A New global hydrography derived from spaceborne eleva-
tion data Eos T Am Geophys Un 89 93ndash94 doi1010292008EO100001 2008
472
TCD9 441ndash493 2015
Snowfall in theHimalayas an
uncertain future froma little-known past
E Viste and A Sorteberg
Title Page
Abstract Introduction
Conclusions References
Tables Figures
J I
J I
Back Close
Full Screen Esc
Printer-friendly Version
Interactive Discussion
Discussion
Paper
|D
iscussionP
aper|
Discussion
Paper
|D
iscussionP
aper|
MacQueen J Some Methods for Classification and Analysis of Multivariate ObservationsFifth Berkeley Symposium on Mathematical Statistics and Probability Berkeley California21 Junendash18 July 1967
Meacuteneacutegoz M Galleacutee H and Jacobi H W Precipitation and snow cover in the Himalayafrom reanalysis to regional climate simulations Hydrol Earth Syst Sci 17 3921ndash39365
doi105194hess-17-3921-2013 2013Menon A Levermann A Schewe J Lehmann J and Frieler K Consistent increase in
Indian monsoon rainfall and its variability across CMIP-5 models Earth Syst Dynam 4287ndash300 doi105194esd-4-287-2013 2013
Moss R H Edmonds J A Hibbard K A Manning M R Rose S K van Vuuren D P10
Carter T R Emori S Kainuma M Kram T Meehl G A Mitchell J F B Naki-cenovic N Riahi K Smith S J Stouffer R J Thomson A M Weyant J P andWilbanks T J The next generation of scenarios for climate change research and assess-ment Nature 463 747ndash756 2010
Negi H S Kulkarni A V and Semwal B S Estimation of snow cover distribution in Beas15
basin Indian Himalaya using satellite data and ground measurements J Earth Syst Sci118 525ndash538 doi101007s12040-009-0039-0 2009
Palazzi E v Hardenberg J and Provenzale A Precipitation in the Hindu-Kush Karako-ram Himalaya observations and future scenarios J Geophys Res-Atmos 118 85ndash100doi1010292012JD018697 201320
Rees H G and Collins D N Regional differences in response of flow in glacier-fed Himalayanrivers to climatic warming Hydrol Process 20 2157ndash2169 doi101002hyp6209 2006
Rienecker M M Suarez M J Gelaro R Todling R Bacmeister J Liu EBosilovich M G Schubert S D Takacs L Kim G-K Bloom S Chen J Collins DConaty A da Silva A Gu W Joiner J Koster R D Lucchesi R Molod A Owens T25
Pawson S Pegion P Redder C R Reichle R Robertson F R Ruddick A GSienkiewicz M and Woollen J MERRA NASArsquos Modern-Era Retrospective Analysis forResearch and Applications J Climate 24 3624ndash3648 doi101175JCLI-D-11-0001512011
Rikiishi K and Nakasato H Height dependence of the tendency for reduction in seasonal30
snow cover in the Himalaya and the Tibetan Plateau region 1966ndash2001 Ann Glaciol 43369ndash377 doi103189172756406781811989 2006
473
TCD9 441ndash493 2015
Snowfall in theHimalayas an
uncertain future froma little-known past
E Viste and A Sorteberg
Title Page
Abstract Introduction
Conclusions References
Tables Figures
J I
J I
Back Close
Full Screen Esc
Printer-friendly Version
Interactive Discussion
Discussion
Paper
|D
iscussionP
aper|
Discussion
Paper
|D
iscussionP
aper|
Raumlisaumlnen J Warmer climate less or more snow Clim Dynam 30 307ndash319doi101007s00382-007-0289-y 2008
Schaner N Voisin N Nijssen B and Lettenmaier D P The contribution of glacier melt tostreamflow Environ Res Lett 7 034029 doi1010881748-932673034029 2012
Scherler D Bookhagen B and Strecker M R Spatially variable response of Himalayan5
glaciers to climate change affected by debris cover Nature Geosci 4 156ndash159 availableat httpwwwnaturecomngeojournalv4n3absngeo1068html ndash Supplement 2011
Sharif M Archer D R Fowler H J and Forsythe N Trends in timing and magnitude offlow in the Upper Indus Basin Hydrol Earth Syst Sci 17 1503ndash1516 doi105194hess-17-1503-2013 201310
Shekhar M S Chand H Kumar S Srinivasan K and Ganju A Climate-change studiesin the western Himalaya Ann Glaciol 51 105ndash112 doi1031891727564107913865082010
Shrestha A B Wake C P Mayewski P A and Dibb J E Maximum tempera-ture trends in the Himalaya and its vicinity an analysis based on temperature records15
from Nepal for the period 1971ndash94 J Climate 12 2775ndash2786 doi1011751520-0442(1999)012lt2775MTTITHgt20CO2 1999
Shrestha A B Wake C P Dibb J E and Mayewski P A Precipitation fluctuations in theNepal Himalaya and its vicinity and relationship with some large scale climatological parame-ters Int J Climatol 20 317ndash327 doi101002(SICI)1097-0088(20000315)203lt317AID-20
JOC476gt30CO2-G 2000Siderius C Biemans H Wiltshire A Rao S Franssen W H P Kumar P Gosain A K
van Vliet M T H and Collins D N Snowmelt contributions to discharge of the GangesSci Total Environ Supplement 468ndash469 9 doi101016jscitotenv201305084 2013
Singh P Jain S K and Kumar N Estimation of snow and glacier-melt contribution to the25
Chenab River Western Himalaya Mt Res Dev 17 49ndash56 doi1023073673913 1997Singh P Kumar V Thomas T and Arora M Changes in rainfall and relative hu-
midity in river basins in northwest and central India Hydrol Process 22 2982ndash2992doi101002hyp6871 2008
Sontakke N A Singh N and Singh H N Instrumental period rainfall series of the Indian30
region (AD 1813ndash2005) revised reconstruction update and analysis Holocene 18 1055ndash1066 doi1011770959683608095576 2008
474
TCD9 441ndash493 2015
Snowfall in theHimalayas an
uncertain future froma little-known past
E Viste and A Sorteberg
Title Page
Abstract Introduction
Conclusions References
Tables Figures
J I
J I
Back Close
Full Screen Esc
Printer-friendly Version
Interactive Discussion
Discussion
Paper
|D
iscussionP
aper|
Discussion
Paper
|D
iscussionP
aper|
Sperber K R Annamalai H Kang I S Kitoh A Moise A Turner A Wang B andZhou T The Asian summer monsoon an intercomparison of CMIP5 vs CMIP3 simulationsof the late 20th century Clim Dynam 41 2711ndash2744 doi101007s00382-012-1607-62013
Tahir A A Chevallier P Arnaud Y and Ahmad B Snow cover dynamics and hydrological5
regime of the Hunza River basin Karakoram Range Northern Pakistan Hydrol Earth SystSci 15 2275ndash2290 doi105194hess-15-2275-2011 2011a
Tahir A A Chevallier P Arnaud Y Neppel L and Ahmad B Modeling snowmelt-runoffunder climate scenarios in the Hunza River basin Karakoram Range Northern Pakistan JHydrol 409 104ndash117 doi101016jjhydrol201108035 2011b10
Taylor K E Stouffer R J and Meehl G A An overview of CMIP5 and the experimentdesign B Am Meteorol Soc 93 14 doi101175BAMS-D-11-000941 2011
Tedesco M and Narvekar P S Assessment of the NASA AMSR-E SWE product IEEE J SelTop Appl 3 141ndash159 doi101109JSTARS20102040462 2010
Teutschbein C and Seibert J Bias correction of regional climate model simulations for hydro-15
logical climate-change impact studies review and evaluation of different methods J Hydrol456ndash457 12ndash29 doi101016jjhydrol201205052 2012
Turner A G and Annamalai H Climate change and the South Asian summer monsoon NatClim Change 2 587ndash595 2012
van Vuuren D Edmonds J Kainuma M Riahi K Thomson A Hibbard K Hurtt G20
Kram T Krey V Lamarque J-F Masui T Meinshausen M Nakicenovic N Smith Sand Rose S The representative concentration pathways an overview Climatic Change109 26 doi101007s10584-011-0148-z 2011
Wang A and Zeng X Development of global hourly 05-degree land surface air temperaturedatasets J Climate 26 7676ndash7691 doi101175JCLI-D-12-006821 201325
Wiltshire A J Climate change implications for the glaciers of the Hindu Kush Karakoram andHimalayan region The Cryosphere 8 941ndash958 doi105194tc-8-941-2014 2014
Winiger M Gumpert M and Yamout H KarakorumndashHindukushndashwestern Himalaya assess-ing high-altitude water resources Hydrol Process 19 2329ndash2338 doi101002hyp5887200530
Xu X Lu C Shi X and Gao S World water tower An atmospheric perspective GeophysRes Lett 35 L20815 doi1010292008GL035867 2008a
475
TCD9 441ndash493 2015
Snowfall in theHimalayas an
uncertain future froma little-known past
E Viste and A Sorteberg
Title Page
Abstract Introduction
Conclusions References
Tables Figures
J I
J I
Back Close
Full Screen Esc
Printer-friendly Version
Interactive Discussion
Discussion
Paper
|D
iscussionP
aper|
Discussion
Paper
|D
iscussionP
aper|
Xu Z X Gong T L and Li J Y Decadal trend of climate in the Tibetan Plateaumdashregionaltemperature and precipitation Hydrol Process 22 3056ndash3065 doi101002hyp68922008b
Yasutomi N Hamada A and Akiyo Y Development of a Long-term Daily Gridded Temper-ature Dataset and its Application to RainSnow Discrimination of Daily Precipitation Global5
Environ Res15 165ndash172 2011Yatagai A Kamiguchi K Arakawa O Hamada A Yasutomi N and Kitoh A APHRODITE
Constructing a Long-Term Daily Gridded Precipitation Dataset for Asia Based on a DenseNetwork of Rain Gauges B Am Meteorol Soc 93 1401ndash1415 doi101175BAMS-D-11-001221 201210
You Q Kang S Aguilar E and Yan Y Changes in daily climate extremes in the east-ern and central Tibetan Plateau during 1961ndash2005 J Geophys Res-Atmos 113 D07101doi1010292007JD009389 2008
476
TCD9 441ndash493 2015
Snowfall in theHimalayas an
uncertain future froma little-known past
E Viste and A Sorteberg
Title Page
Abstract Introduction
Conclusions References
Tables Figures
J I
J I
Back Close
Full Screen Esc
Printer-friendly Version
Interactive Discussion
Discussion
Paper
|D
iscussionP
aper|
Discussion
Paper
|D
iscussionP
aper|
Table 1 Combinations of data types used in snowfall estimates T temperature P precipita-tion f (P T ) indicates that snowfall is calculated as a function of P and T
Precipitation Temperature Snowfall Time
MERRA MERRA PresentMERRA reference MERRA Terrain-adjusted MERRA f (P T ) PresentMERRA T2m MERRA MERRA T2m f (P T ) PresentBias-corrected with obs T MERRA Bias-corr terrain-adj MERRA f (P T ) PresentBias-corrected with obs P Bias-corr MERRA Terrain-adjusted MERRA f (P T ) PresentBias-corrected with obs T P Bias-corr MERRA Bias-corr terrain-adj MERRA f (P T ) PresentCMIP5 T MERRA Terrain-adj MERRA+∆T f (P T ) FutureCMIP5 P MERRAtimes∆P Terrain-adj MERRA f (P T ) FutureCMIP5 T P MERRAtimes∆P Terrain-adj MERRA+∆T f (P T ) FutureBias-corr CMIP5 T Bias-corr MERRA Bias-corr terrain-adj MERRA+∆T f (P T ) FutureBias-corr CMIP5 P Bias-corr MERRAtimes∆P Bias-corr terrain-adj MERRA f (P T ) FutureBias-corr CMIP5 T P Bias-corr MERRAtimes∆P Bias-corr terrain-adj MERRA+∆T f (P T ) Future
477
TCD9 441ndash493 2015
Snowfall in theHimalayas an
uncertain future froma little-known past
E Viste and A Sorteberg
Title Page
Abstract Introduction
Conclusions References
Tables Figures
J I
J I
Back Close
Full Screen Esc
Printer-friendly Version
Interactive Discussion
Discussion
Paper
|D
iscussionP
aper|
Discussion
Paper
|D
iscussionP
aper|
Table 2 Data sets used in calculations of present-day snowfall
Product Time Hor res Description
MERRA 1979ndash2012 05 lat 07 lon Hourly atmospheric reanalysis data(Rienecker et al 2011)
APHRODITEV1204V1101
1979ndash2007 025 Daily temperature andprecipitation basedon observations (Yatagai et al 2012Yasutomi et al 2011)
CRU TS 320 1979ndash2011 05 Monthly temperature and precipitationbased on observations(Harris et al 2014)
TRMM 3B42 V7 1998ndash2012 05 3 hourly satellite-based precipitation(Huffman et al 2007)
GLOBE 1 km Topography data set(Hastings and Dunbar 1998)
478
TCD9 441ndash493 2015
Snowfall in theHimalayas an
uncertain future froma little-known past
E Viste and A Sorteberg
Title Page
Abstract Introduction
Conclusions References
Tables Figures
J I
J I
Back Close
Full Screen Esc
Printer-friendly Version
Interactive Discussion
Discussion
Paper
|D
iscussionP
aper|
Discussion
Paper
|D
iscussionP
aper|
Table 3 CMIP5 models and RCPs used (x) in calculations of 2071ndash2100 snowfall
Model RCP 26 RCP 85
CanESM2 x xCCSM4 x xCESM1-CAM5 xCNRM-CM5 xGFDL-CM3 x xGFDL-ESM2G xGISS-E2-R x xHadGEM2-ES x xIPSL-CM5A-LR x xIPSL-CM5A-MR x xMIROC-ESM x xMIROC-ESM-CHEM x xMIROC5 x xMRI-CGCM3 x xNorESM1-M x xNorESM1-ME x x
479
TCD9 441ndash493 2015
Snowfall in theHimalayas an
uncertain future froma little-known past
E Viste and A Sorteberg
Title Page
Abstract Introduction
Conclusions References
Tables Figures
J I
J I
Back Close
Full Screen Esc
Printer-friendly Version
Interactive Discussion
Discussion
Paper
|D
iscussionP
aper|
Discussion
Paper
|D
iscussionP
aper|
Table 4 Annual snowfall estimates for the Indus Ganges and Brahmaputra Basins S snow[km3 SWE] P precipitation [km3] S and P percent of MERRA reference snowfall andMERRA precipitation First horizontal section no bias-corrections Second third and fourthsection bias-corrections with T P and both T and P
Indus Basin Ganges Basin Brahmaputra BasinInput S S P P S S P P S S P P
MERRA reference 148 100 422 100 54 100 1147 100 119 100 733 100MERRA 166 112 422 100 49 90 1147 100 129 109 733 100MERRA T2m 154 104 422 100 42 77 1147 100 109 92 733 100T APHRODITE 113 76 422 100 30 55 1147 100 74 62 733 100T CRU 126 85 422 100 81 151 1147 100 109 92 733 100P APHRODITE 66 44 315 75 22 42 1020 89 35 30 567 77P TRMM 72 49 404 96 31 57 1244 108 63 54 835 114P CRU 84 56 398 94 30 56 1100 96 53 45 716 98P T APHRODITE 49 33 315 75 12 22 1020 89 20 17 567 77P APHRODITE T CRU 62 42 315 75 34 63 1020 89 33 28 567 77P TRMM T APHRODITE 54 36 390 92 18 34 1195 104 39 33 815 111P TRMM T CRU 65 44 403 96 46 85 1254 109 58 49 813 111P CRU T APHRODITE 65 44 395 94 17 31 1106 96 31 26 718 98P T CRU 80 54 398 94 41 75 1100 96 49 42 716 98
480
TCD9 441ndash493 2015
Snowfall in theHimalayas an
uncertain future froma little-known past
E Viste and A Sorteberg
Title Page
Abstract Introduction
Conclusions References
Tables Figures
J I
J I
Back Close
Full Screen Esc
Printer-friendly Version
Interactive Discussion
Discussion
Paper
|D
iscussionP
aper|
Discussion
Paper
|D
iscussionP
aper|
Table 5 Projected change in annual snowfall from 1971ndash2000 to 2071ndash2100 with referenceto terrain-adjusted MERRA and APHRODITE ∆Sabs [km3] is the absolute change ∆Srel [] isthe relative change compared to the present-day MERRA reference snowfall Values are pre-sented with the CMIP5 multi-model mean as the main value and the span of individual modelsin brackets (MERRA only) ∆TP indicates that changes in both temperature and precipitationare included whereas ∆P and ∆T denotes changes only in precipitation or temperature re-spectively
Indus Ganges Brahmaputra∆Sabs [km3] ∆Srel [] ∆Sabs [km3] ∆Srel [] ∆Sabs [km3] ∆Srel []
RCP 85 MERRA ∆TP minus49 [minus83minus9] minus33 [minus56minus6] minus27 [minus36minus14] minus50 [minus66minus25] minus64 [minus93minus39] minus54 [minus79minus33]MERRA ∆T minus51 [minus67minus34] minus34 [minus45minus23] minus28 [minus34minus21] minus51 [minus64minus39] minus71 [minus87minus53] minus60 [minus73minus44]MERRA ∆P 5 [minus2544] 4 [minus1730] 7 [minus417] 12 [minus731] 20 [minus1750] 17 [minus1542]
APHRO ∆TP minus25 minus51 minus7 minus56 minus13 minus67APHRO ∆T minus25 minus52 minus7 minus57 minus14 minus71APHRO ∆P 1 1 1 6 3 16
RCP 26 MERRA ∆TP minus15 [minus406] minus10 [minus274] minus10 [minus19minus3] minus18 [minus36minus5] minus25 [minus42minus5] minus21 [minus35minus4]MERRA ∆T minus18 [minus27minus9] minus12 [minus18minus6] minus12 [minus21minus6] minus21 [minus39minus11] minus29 [minus47minus13] minus25 [minus40minus11]MERRA ∆P 3 [minus1825] 2 [minus1217] 3 [minus210] 5 [minus419] 7 [minus828] 6 [minus623]
APHRO ∆TP minus9 minus18 minus2 minus20 minus6 minus29APHRO ∆T minus10 minus19 minus3 minus23 minus6 minus32APHRO ∆P 1 1 0 4 1 6
481
TCD9 441ndash493 2015
Snowfall in theHimalayas an
uncertain future froma little-known past
E Viste and A Sorteberg
Title Page
Abstract Introduction
Conclusions References
Tables Figures
J I
J I
Back Close
Full Screen Esc
Printer-friendly Version
Interactive Discussion
Discussion
Paper
|D
iscussionP
aper|
Discussion
Paper
|D
iscussionP
aper|
Figure 1 Map of the region with the Indus Ganges and Brahmaputra basins outlined in whiteThinner outlines are national borders Background NASA Visible Earth
482
TCD9 441ndash493 2015
Snowfall in theHimalayas an
uncertain future froma little-known past
E Viste and A Sorteberg
Title Page
Abstract Introduction
Conclusions References
Tables Figures
J I
J I
Back Close
Full Screen Esc
Printer-friendly Version
Interactive Discussion
Discussion
Paper
|D
iscussionP
aper|
Discussion
Paper
|D
iscussionP
aper|
0
400 mm
Months 1ndash12
SP
I1
I2I3
I5I4
G1
G2G3
G4
B1
B2
B3B4
Viste amp SortebergFigure 2
Figure 2 Monthly mean MERRA precipitation and MERRA reference snowfall in sub-basinclusters of the Indus (I) Ganges (G) and Brahmaputra (B) Total bar height MERRA precip-itation (P) [mm] Colored bars snowfall (S) [mm SWE] based on MERRA precipitation andterrain-adjusted MERRA temperature in the region with the same color Cluster 1 in eachbasin is considered snow-free and the seasonal cycles are not shown
483
TCD9 441ndash493 2015
Snowfall in theHimalayas an
uncertain future froma little-known past
E Viste and A Sorteberg
Title Page
Abstract Introduction
Conclusions References
Tables Figures
J I
J I
Back Close
Full Screen Esc
Printer-friendly Version
Interactive Discussion
Discussion
Paper
|D
iscussionP
aper|
Discussion
Paper
|D
iscussionP
aper|
a) MERRA reference b) APHRODITE c) APHRODITE ndash MERRA ref
30 km3
20100-10-20-30
Viste amp SortebergFigure 3
Figure 3 The effect of bias-corrections with APHRODITE temperature and precipitation(a) MERRA reference snowfall (b) Snowfall based on bias-corrections with APHRODITE(c) APHRODITE (b) minus MERRA reference snowfall (a)
484
TCD9 441ndash493 2015
Snowfall in theHimalayas an
uncertain future froma little-known past
E Viste and A Sorteberg
Title Page
Abstract Introduction
Conclusions References
Tables Figures
J I
J I
Back Close
Full Screen Esc
Printer-friendly Version
Interactive Discussion
Discussion
Paper
|D
iscussionP
aper|
Discussion
Paper
|D
iscussionP
aper|
Figure 4 Difference between MERRA precipitation and observation-based data (a) Annualmean MERRA precipitation (b c and d) Annual mean MERRA precipitation bias-correctedwith observations APHRODITE CRU TS and TRMM 3B42 For each data set the small insetmaps show the observations minus MERRA
485
TCD9 441ndash493 2015
Snowfall in theHimalayas an
uncertain future froma little-known past
E Viste and A Sorteberg
Title Page
Abstract Introduction
Conclusions References
Tables Figures
J I
J I
Back Close
Full Screen Esc
Printer-friendly Version
Interactive Discussion
Discussion
Paper
|D
iscussionP
aper|
Discussion
Paper
|D
iscussionP
aper|
Biasminuscorrected minus original MERRA temperature [C]
minus15
minus10
minus5
0
5
10
Biasminuscorrected minus original MERRA temperature [C]
minus15
minus10
minus5
0
5
10
MERRA mean temperature [C] 1979minus2007
minus15
minus10
minus5
0
5
10
15
20
25
30a) MERRA b) APHRODITE ndash MERRA c) CRU ndash MERRA
-10
0
10
20
30degC
minus15
minus10
minus5
0
5
10
15degC
Viste amp SortebergFigure 5
Figure 5 Difference between MERRA temperature and observation-based data (a) Annualmean MERRA temperature (b and c) Annual mean MERRA temperature bias-corrected withobservations APHRODITE and CRU TS
486
TCD9 441ndash493 2015
Snowfall in theHimalayas an
uncertain future froma little-known past
E Viste and A Sorteberg
Title Page
Abstract Introduction
Conclusions References
Tables Figures
J I
J I
Back Close
Full Screen Esc
Printer-friendly Version
Interactive Discussion
Discussion
Paper
|D
iscussionP
aper|
Discussion
Paper
|D
iscussionP
aper|
Jan Apr
Jul Oct
a)
c)
b)
d)
15degC
10
5
0
ndash5
ndash10
ndash15
200 mm16012080400ndash40ndash80ndash120ndash160ndash200
Viste amp SortebergFigure 6
Figure 6 Regions where increasing temperatures are likely to cause a shift from snow to rainData monthly mean MERRA temperature terrain-adjusted to a 4 km GLOBE grid Red temper-ature between minus5 and 0 considered critical Small inset maps monthly MERRA precipitationin the critical zones
487
TCD9 441ndash493 2015
Snowfall in theHimalayas an
uncertain future froma little-known past
E Viste and A Sorteberg
Title Page
Abstract Introduction
Conclusions References
Tables Figures
J I
J I
Back Close
Full Screen Esc
Printer-friendly Version
Interactive Discussion
Discussion
Paper
|D
iscussionP
aper|
Discussion
Paper
|D
iscussionP
aper|
1 2 3 4 5 6 7 8 9 10 11 12Month
∆T [ordm
C]
a) Indus
0
1
2
3
4
5
6
7
8
9
10
b) Ganges∆T
[ordmC
]
1 2 3 4 5 6 7 8 9 10 11 12Month
1
2
3
4
5
6
7
8
0 0
c) Brahmaputra
∆T [ordm
C]
1 2 3 4 5 6 7 8 9 10 11 12Month
1
2
3
4
5
6
7
8
9
10 RCP 85RCP 85 meanRCP 26RCP 26 mean
Viste amp SortebergFigure 7
Figure 7 Projected future temperature change from 1971ndash2000 to 2071ndash2100 in the (a) In-dus (b) Ganges and (c) Brahmaputra Basins Thin lines show the individual CMIP5 modelsstronger lines the multi-model mean
488
TCD9 441ndash493 2015
Snowfall in theHimalayas an
uncertain future froma little-known past
E Viste and A Sorteberg
Title Page
Abstract Introduction
Conclusions References
Tables Figures
J I
J I
Back Close
Full Screen Esc
Printer-friendly Version
Interactive Discussion
Discussion
Paper
|D
iscussionP
aper|
Discussion
Paper
|D
iscussionP
aper|
1 2 3 4 5 6 7 8 9 10 11 12Month
[km
3 ]
a) Indus
0
20
40
60
80
100
120
140
b) Ganges[k
m3 ]
1 2 3 4 5 6 7 8 9 10 11 12Month
0
100
200
300
400
500
600
700
c) Brahmaputra
[km
3 ]
1 2 3 4 5 6 7 8 9 10 11 12Month
0
50
100
150
200
250
MERRA ref
2071ndash2100
1979ndash2008
RCP 85RCP 85 meanRCP 26RCP 26 mean
Viste amp SortebergFigure 8
Figure 8 Projected future precipitation in the (a) Indus (b) Ganges and (c) BrahmaputraBasins Gray bars MERRA 1979ndash2008 Thin lines and horizontal marks on the bars show theindividual CMIP5 models and the multi-model mean for 2071ndash2100
489
TCD9 441ndash493 2015
Snowfall in theHimalayas an
uncertain future froma little-known past
E Viste and A Sorteberg
Title Page
Abstract Introduction
Conclusions References
Tables Figures
J I
J I
Back Close
Full Screen Esc
Printer-friendly Version
Interactive Discussion
Discussion
Paper
|D
iscussionP
aper|
Discussion
Paper
|D
iscussionP
aper|
1 2 3 4 5 6 7 8 9 10 11 120
5
10
15
20
25
30
35
Month
SWE
[km
3 ]
a) Indus
0
1
2
3
4
5
6
7
8
b) Ganges
SWE
[km
3 ]
1 2 3 4 5 6 7 8 9 10 11 12Month
0
2
4
6
8
10
12
14
16
18
20
c) Brahmaputra
SWE
[km
3 ]
1 2 3 4 5 6 7 8 9 10 11 12Month
MERRA ref
2071ndash2100
1979ndash2008
RCP 85RCP 85 meanRCP 26RCP 26 mean
Viste amp SortebergFigure 9
Figure 9 Projected future snowfall in the (a) Indus (b) Ganges and (c) Brahmaputra Basinswith reference to MERRA reference snowfall Gray bars MERRA reference snowfall for 1979ndash2008 Thin lines and horizontal marks on the bars show the individual CMIP5 models andthe multi-model mean for 2071ndash2100 based on changes in temperature and precipitation asdescribed in Sect 23
490
TCD9 441ndash493 2015
Snowfall in theHimalayas an
uncertain future froma little-known past
E Viste and A Sorteberg
Title Page
Abstract Introduction
Conclusions References
Tables Figures
J I
J I
Back Close
Full Screen Esc
Printer-friendly Version
Interactive Discussion
Discussion
Paper
|D
iscussionP
aper|
Discussion
Paper
|D
iscussionP
aper|
Figure 10 Projected future changes in snowfall in sub-basins of the Indus Ganges andBrahmaputra Basins (a) Absolute change [km3] with reference to MERRA reference snow-fall (b) Absolute change [km3] with reference to APHRODITE snowfall (c d) Correspondingrelative changes [] with reference to MERRA and APHRODITE
491
TCD9 441ndash493 2015
Snowfall in theHimalayas an
uncertain future froma little-known past
E Viste and A Sorteberg
Title Page
Abstract Introduction
Conclusions References
Tables Figures
J I
J I
Back Close
Full Screen Esc
Printer-friendly Version
Interactive Discussion
Discussion
Paper
|D
iscussionP
aper|
Discussion
Paper
|D
iscussionP
aper|
J F M A M J J A S O N DMonth
0
5
10
15
20 km3Precip
0
2
4
6
8
10 km3SWE
2000
3000
4000
5000
6000 masl
1845
J F
M
A
M
JJ A
S
O
N
D
RSL
I4A = 146793 km2
1 km 3 = 68 mm
0
05
1
15 SWE rel
8000 m
0
J F M A M J J A S O N DMonth
0
2
4
6
8
10
12 km3 SWE
3000
4000
5000
6000 masl
78
2
14
J FM
A
MJ
J AS
O
ND
RSL
I5
Precip
0
5
10
15
20
25 km3
0
05
1
15 SWE rel
8000 m
0
A = 178669 km2
1 km 3 = 56 mm
CMIP52071ndash2100mean
Today
MERRA APHRODITE
Individual models
CMIP52071ndash2100mean
MERRA APHRODITE
Individual models
CMIP52071ndash2100Precip mean
MERRA APHRODITE
Individual models
SWE todayPrecip today
2000 mTerrain distribution of area between levels
CMIP52071ndash2100
TodayMERRA
APHRODITE
a)
i)
ii)
iii)
iv)
b)
Viste amp SortebergFigure 11
Figure 11 Monthly CMIP5 RCP 85 change in snowfall precipitation and rainsnow line eleva-tion in the upper Indus clusters (a) 4 and (b) 5 from 1971ndash2000 to 2071ndash2100 with referenceto the MERRA reference (red) and APHRODITE (blue) CMIP5 multi-model means are shownas horizontal marks individual models as dots Cluster location and terrain profile are shownabove the graphs (i) Fractional change in snowfall (ii) Future snowfall [km3] (dots) comparedto today (bars) (iii) Future precipitation [km3] (dots) compared to today (bars) Snowfall todayis shown as darker part of bars (iv) Rainsnow line elevation [m asl] Gray background el-evation histogram with the of total ground area lying in the marked 2000 m intervals Barschange from today (bottom) to CMIP5 multi-model mean (top)
492
TCD9 441ndash493 2015
Snowfall in theHimalayas an
uncertain future froma little-known past
E Viste and A Sorteberg
Title Page
Abstract Introduction
Conclusions References
Tables Figures
J I
J I
Back Close
Full Screen Esc
Printer-friendly Version
Interactive Discussion
Discussion
Paper
|D
iscussionP
aper|
Discussion
Paper
|D
iscussionP
aper|
3000
4000
5000
6000 masl
0
2
4
6
8
10 km3
0
10
20
30
40
50
60 km3
0
05
1
15
J F M A M J J A S O N DMonth
J FM
A
M
JJ A
S
O
ND
Precip
SWE
RSL
SWE rel
53
B3
8000 m
0
A = 139611 km2
1 km 3 = 72 mm
4500
5000
5500
6000
6500 masl
0
1
2
3
4 km3
0
10
20
30
40
50 km3
0
05
1
15 SWE rel
SWE
RSL
Precip
95
J F M A M J J A S O N DMonth
J FM
A
M
JJ A
S
ON
D
B4
8000 m
0
A = 159165 km2
1 km 3 = 63 mm
CMIP52071ndash2100mean
Today
MERRA APHRODITE
Individual models
CMIP52071ndash2100mean
MERRA APHRODITE
Individual models
CMIP52071ndash2100Precip mean
MERRA APHRODITE
Individual models
SWE todayPrecip today
2000 mTerrain distribution of area between levels
CMIP52071ndash2100
TodayMERRA
APHRODITE
a)
i)
ii)
iii)
iv)
b)
Viste amp SortebergFigure 12
Figure 12 Monthly CMIP5 RCP 85 change in snowfall precipitation and rainsnow line ele-vation in the upper Brahmaputra clusters (a) 4 and (b) 3 See Fig 11 for a description of thecontent
493
- Introduction
-
- Observed trends in snowfall temperature and precipitation
- Future projections of snowfall temperature and precipitation
- Aims and scope
-
- Data and methods
-
- Reference present-day snowfall
- Bias-corrected present-day snowfall
- Projected snowfall
- The rain-snow line
-
- Present-day snowfall
-
- Seasonal cycles of precipitation and snowfall
- Comparison of snowfall estimates
-
- Projected future snowfall
-
- Basin-scale projections
- Regional projections
-
- Upper Indus western part
- Upper Indus eastern part
- Upper Brahmaputra western part
- Upper Brahmaputra eastern part
-
- Potential effects of reduced snowfall on water availability
-
- Concluding summary
-
TCD9 441ndash493 2015
Snowfall in theHimalayas an
uncertain future froma little-known past
E Viste and A Sorteberg
Title Page
Abstract Introduction
Conclusions References
Tables Figures
J I
J I
Back Close
Full Screen Esc
Printer-friendly Version
Interactive Discussion
Discussion
Paper
|D
iscussionP
aper|
Discussion
Paper
|D
iscussionP
aper|
to MERRA and APHRODITE respectively the reduction in snowfall in the Indus Basinis 30 and 50 with the RCP 85 The corresponding reductions in the BrahmaputraBasin are 50 and 70
The projected changes in temperature have greater effect on snowfall than thechanges in precipitation When taking into account only changes in precipitation all5
snowfall estimates are positive (∆P Table 5) This indicates that the mean annual to-tal reduction for each major basin is governed by the temperature change In someCMIP5 models (values in brackets in Table 5) the effect of precipitation changes (∆P )on snowfall are of the same magnitude as the effect of temperature changes (∆T ) butfor the CMIP5 multi-model mean temperature changes cause snowfall changes 4ndash1010
times as large as those due to changes in precipitation This is with reference to thepresent-day MERRA reference snowfall and for both RCPs 26 and 85 With referenceto APHRODITE snowfall the effect of temperature changes compared to precipitationchanges is even greater
42 Regional projections15
If temperatures are far below freezing everywhere warming may have little effect onsnowfall The same applies if only the highest peaks receive snow today The largestreduction in snowfall in a basin occurs if todayrsquos rainsnow line is at an elevation justbelow the dominant elevation of the basin Then large regions will see a shift fromsnow to rain20
In the Indus Basin the largest relative snowfall reduction by 2071ndash2100 is seen inthe southwestern sub-basins where snowfall is limited today (Fig 10) The largest totalreduction is seen in the snow-rich sub-basins of KabulSwatAlingar in the west and inthe east and a smaller reduction in the inner-most basins of GilgitHunza Indus 1 andNubraShyok Together with the upper regions of the Brahmaputra these sub-basins25
clusters I4 I5 B3 and B4 in Fig 2 were selected for a closer analysis In addition tohaving the most snow these clusters are the most homogeneous when considering
461
TCD9 441ndash493 2015
Snowfall in theHimalayas an
uncertain future froma little-known past
E Viste and A Sorteberg
Title Page
Abstract Introduction
Conclusions References
Tables Figures
J I
J I
Back Close
Full Screen Esc
Printer-friendly Version
Interactive Discussion
Discussion
Paper
|D
iscussionP
aper|
Discussion
Paper
|D
iscussionP
aper|
the seasonal cycle of snowfall and snow fraction The values presented in this sectionare all from the RCP 85 for changes from today to 2071ndash2100
421 Upper Indus western part
Cluster 4 consists of the sub-basins Astor KabulSwatAlingar and Krishen GangaAs seen from the elevation profile at the top of Fig 11a the elevation span is large5
and there is an almost equal proportion of the terrain at all levels from heights close tosea level to about 5000 masl The most important change for this cluster is a largereduction in the total amount of snowfall in winter and spring
With a few exceptions all CMIP5 models project less snowfall in all months of theyear (Fig 11a i ii) The largest total multi-model mean reduction in snowfall (ii) oc-10
curs in FebruaryndashApril without notable change in the multi-model mean precipitation(iii) Thus the reduction is caused by increasing temperatures represented by therainsnow line in Fig 11a iv As seen from the change in the rainsnow line elevationthe projected temperature increase in these months would imply that large areas thatreceive snow today would receive only rain About 40 of the ground in this cluster lies15
below 2000 masl and receives precipitation as rain throughout the year In summerprecipitation (iii) is at a minimum and the rainsnow line (iv) is already so high that onlya small fraction of the area receives snowfall today Thus although the relative changein snowfall (i) is largest in summer the change in the amount of snowfall (ii) is small Itshould also be noted that the change in the rainsnow line elevation (iv) in summer is20
much smaller 400ndash600 m compared to 600ndash900 m in DecemberndashApril
422 Upper Indus eastern part
Further east the largest changes are projected for the spring season Cluster 5 in theIndus Basin consists of the sub-basins GilgitHunza Indus 1 NubraShyok and Zan-skar As shown in Fig 11b this is high-elevation terrain with 80 of the ground lying25
above 4000 masl As a result almost all winter precipitation is snow (Fig 11b iii)
462
TCD9 441ndash493 2015
Snowfall in theHimalayas an
uncertain future froma little-known past
E Viste and A Sorteberg
Title Page
Abstract Introduction
Conclusions References
Tables Figures
J I
J I
Back Close
Full Screen Esc
Printer-friendly Version
Interactive Discussion
Discussion
Paper
|D
iscussionP
aper|
Discussion
Paper
|D
iscussionP
aper|
For the multi-model mean no big changes are projected in JanuaryndashFebruary This ispartly because of little change in precipitation (iii) and because the rainsnow line (iv)in these months is sufficiently low in the terrain today With the 500ndash600 m shift pro-jected with the RCP 85 80ndash90 of the area will still have temperatures low enoughfor snow The largest changes occur in MarchndashOctober when higher temperatures5
push the rainsnow line above large areas that receive snow today Increasing summerprecipitation (iii) causes the snowfall reduction in summer to be less than it would other-wise be The effect of higher temperatures is smaller on the APHRODITE snowfall thanon the MERRA reference snowfall (ii) as APHRODITE has very little summer snow-fall today The difference arises both from less precipitation (iii) in APHRODITE than10
MERRA today and from a higher rainsnow line (iv) in APHRODITE Note that as thechange in precipitation was defined as a fraction of the present-day value (Sect 23)the relative changes in APHRODITE and MERRA precipitation are equal
423 Upper Brahmaputra western part
In the westernmost part of the upper Brahmaputra Basin large snowfall changes are15
projected for the summer As cluster 5 in the Indus Basin Brahmaputrarsquos cluster 4 islimited to higher grounds Less than 6 lies outside of the 4000ndash6000 masl rangeThe cluster consists of Maquan He Yarlung Zangbo Dogxung ZangboMaiqu ZangboShang ChuYarlung ZangboNyang Lhasa HeRazheng Zangbo and Yamzho YumcoThe summer monsoon fully dominates the seasonal cycle of precipitation in this region20
(Fig 12a iii) resulting in a unimodal snow cycle with a maximum in JulyndashSeptember InAPHRODITE the seasonal cycle of snowfall is similar but less pronounced than in theMERRA reference The summer also sees the greatest reduction in CMIP5 projectedsnowfall both in absolute (ii) and relative (i) terms despite increasing summer precip-itation in all models (iii) The reason can be seen from the change in the rainsnow25
line elevation (iv) In the warmest months July and August elevation changes of 400ndash500 m would shift the rainsnow line from a level where at least 5ndash10 of the groundlies above the line to a level where only 1 of the area would receive precipitation as
463
TCD9 441ndash493 2015
Snowfall in theHimalayas an
uncertain future froma little-known past
E Viste and A Sorteberg
Title Page
Abstract Introduction
Conclusions References
Tables Figures
J I
J I
Back Close
Full Screen Esc
Printer-friendly Version
Interactive Discussion
Discussion
Paper
|D
iscussionP
aper|
Discussion
Paper
|D
iscussionP
aper|
snow In comparison with reference to MERRA the 300ndash400 m shift seen in JanuaryndashFebruary would cause only a small absolute change in snowfall (ii) because there islittle precipitation in these months (ii) and a small relative change (i) because therainsnow line would still be low in the terrain (iv) With reference to APHRODITE therelative snowfall change in winter would be larger than with reference to MERRA as5
temperatures today are higher resulting in a higher rainsnow line (iv)
424 Upper Brahmaputra eastern part
Like further west the Indian summer monsoon dominates the precipitation cycle in theeastern part of upper Brahmaputra (Fig 12b iii) but the seasonal cycle of snowfallpeaks in spring and fall (iii) This is also the time of the largest projected changes10
Cluster 3 in the Brahmaputra consists of the sub-basins Yarlung Zangbo2 NyangQu Yarlung Zangbo3 Yirsquoong ZangboParl Siyom Zaya QuLuhitDi About 70 of theground lies between 3000 and 6000 masl but there is also land almost at sea levelmainly in the Zaya QuLuhitDingba Qu sub-basin During summer most of the terrainlies below the rainsnow line (iv) In spring temperatures are lower than in summer15
and pre- monsoon precipitation is stronger in this part of the Himalayas than furtherwest in cluster 3 (Fig 12a iii vs Fig 12b iii) As a result MarchndashApril gets the mostsnow
Reductions in snowfall are projected for all months (ii) comparable in magnitude butlargest in the snow-rich spring and late summer The CMIP5 multi-model mean shows20
increasing or no change in precipitation in all months (Fig 12b iii) so the reductionin snowfall is due solely to higher temperatures The largest absolute reductions inApril and May occur with a 700ndash800 m shift in the rainsnow line elevation leaving30 more of the terrain in the rain The largest relative reduction in future snowfall areprojected for July and August (Fig 12b i) when the rainsnow line shifts so high that25
only the highest peaks can get precipitation as snow (iv) This would be despite thelowest changes in the rainsnow line only about 300 m in APHRODITE
464
TCD9 441ndash493 2015
Snowfall in theHimalayas an
uncertain future froma little-known past
E Viste and A Sorteberg
Title Page
Abstract Introduction
Conclusions References
Tables Figures
J I
J I
Back Close
Full Screen Esc
Printer-friendly Version
Interactive Discussion
Discussion
Paper
|D
iscussionP
aper|
Discussion
Paper
|D
iscussionP
aper|
43 Potential effects of reduced snowfall on water availability
With a few exceptions the CMIP5 multi-model mean precipitation change over the com-ing century is positive in all months in the upper Indus and Brahmaputra (Sect 42)Thus the projected reduction in snowfall is due solely to higher temperatures How-ever there is a large spread in precipitation projections among the models If tempera-5
tures increase as much as projected with the RCP 85 could any realistic precipitationchange in the HKH compensate and maintain present-day snowfall Results indicatethat this may happen in parts of the upper Indus but is out of the reach in the upperBrahmaputra As for water availability reduced snowfall may still cause more severeproblems in the Indus than in the Brahmaputra10
In cold regions where temperatures remain below freezing more winter precipita-tion may increase both the snow cover area the length of the snow season and theSWE (Collins et al 2013 Brutel-Vuilmet et al 2013 Raumlisaumlnen 2008 Gao et al 2012Wiltshire 2014) Raumlisaumlnen (2008) showed this to be the case in eastern Siberia andthe northernmost part of North America At the southern edge of the seasonal snow15
cover relevant for this study precipitation did not compensate and there was a reduc-tion in SWEWiltshire (2014) concluded that there would be small changes in snowfallin very cold and very warm regions of the HKH Snowfall in Nepal Bhutan and Hi-machal Pradesh where winters are warmer than in most parts of the range was mostvulnerable to higher temperatures The data presented in Sect 42 generally support20
the previous studiesOne of the reasons that precipitation does not compensate is that the highest pro-
jected precipitation increase in the HKH is seen in the summer when the temperaturetoday is so high that only the highest terrain is in the snow zone Shifting the rainsnowline upward even by only a few hundred meters reduces the area that receives snow25
greatly requiring very large increases in precipitation to compensate The summer isthe season with the largest relative reduction in snowfall in all the clusters described inSect 42 Except in the western upper Indus (cluster I4 Sect 421) which has very
465
TCD9 441ndash493 2015
Snowfall in theHimalayas an
uncertain future froma little-known past
E Viste and A Sorteberg
Title Page
Abstract Introduction
Conclusions References
Tables Figures
J I
J I
Back Close
Full Screen Esc
Printer-friendly Version
Interactive Discussion
Discussion
Paper
|D
iscussionP
aper|
Discussion
Paper
|D
iscussionP
aper|
little summer snowfall today the reduction in summer snowfall is notable in all clustersin the MERRA data in the Brahmaputra clusters also in APHRODITE
The largest change in snowfall is seen in the western part of the Brahmaputra (clus-ter B4 Sect 423) where a 400ndash500 m upward shift in the rainsnow line during sum-mer reduces the area with temperatures low enough for snowfall by a factor of 5ndash105
(Fig 12a iv values not shown) As a result the summer peak in the seasonal cycleof snowfall is replaced by a dip (Fig 12a ii) With an even distribution of precipitationwith elevation the area that still receives snow would have to receive 5ndash10 times asmuch precipitation to compensate for the lost snowfall Assuming more realisticallythat precipitation decreases above a certain height would require an even higher in-10
crease in precipitation In the model with the highest increase a doubling of the Julyprecipitation by the end of the century SWE is less than 25 of todayrsquos value in thatmonth (Fig 12a iii)
With a winter-dominated precipitation cycle the relative change in snowfall is smallerin the upper Indus than in the upper Brahmaputra Downscaling a high-emission sce-15
nario (A1B) in two CMIP3 models with a regional model Wiltshire (2014) found that bythe 2080s precipitation increased more than enough to compensate for higher temper-atures in the Karakoram Hindu Kush and Jammu and Kashmir in one of the modelsthe HadCM3 In the other model ECHAM5 precipitation increased less and snow-fall increased only in the higher parts of the Karakoram In our ensemble of CMIP520
models multi-model mean precipitation in the upper Indus clusters increases mainlyin the summer season when the inter-model spread is also the largest (Fig 11a iiiand 11b iii) Among the models 4ndash5 project increased winter precipitation in the upperIndus and in the uppermost cluster I5 this is associated with an increase in wintersnowfall (Fig 11b ii)25
Although it is the part of the HKH where snowfall is least reduced by increasingtemperatures (Fig 10b) the Karakoram and inner parts of the upper Indus may still bethe region where the changes have the largest impact on river run-off Compared tothe monsoon-dominated regions further east there is little summer precipitation and
466
TCD9 441ndash493 2015
Snowfall in theHimalayas an
uncertain future froma little-known past
E Viste and A Sorteberg
Title Page
Abstract Introduction
Conclusions References
Tables Figures
J I
J I
Back Close
Full Screen Esc
Printer-friendly Version
Interactive Discussion
Discussion
Paper
|D
iscussionP
aper|
Discussion
Paper
|D
iscussionP
aper|
much of the water in the rivers during summer is meltwater (Bookhagen and Burbank2010 Immerzeel et al 2010) As melting of snow and ice has not been analyzed inthis study we cannot quantify the effect of reduced snowmelt om river run-off but it isobvious that eventually reduced snowfall will lead to reduced melting In western partsof the HKH this may lead to changes in the seasonal cycle of the river flow5
As pointed out by Wiltshire (2014) increasing precipitation in the eastern HKH im-plies that water resources are likely to increase with climate change As snowfall andsnowmelt are both at maximum during summer (Rees and Collins 2006) meltwaterdoes not have the same importance for river flow in dry parts of the year as in the In-dus Reduced snowfall may reduce glaciers but ndash not considering potential changes in10
the amount of evaporation ndash there is no indication that there will be less water comingfrom the upper Brahmaputra
5 Concluding summary
In this study we have presented a suite of estimates of present-day snowfall in theIndus Ganges and Brahmaputra Basins and the changes in snowfall that would follow15
from CMIP5 projected changes in temperature and precipitation from 1971ndash2000 to2071ndash2100 The results show that if the temperature increases as much as in the RCP85 there will be much less snowfall despite increasing precipitation in most of theregion Limiting anthropogenic forcing to the RCP 26 level would still cause reductionsthough smaller20
Estimates of present-day snowfall based on a combination of temperature and pre-cipitation from reanalysis data and observations vary by factors of 2ndash4 The MERRAreanalysis gives higher estimates than TRMM 3B42 CRU TS and APHRODITE butthe spread is also large between the estimates based on the different observationallybased data sets This demonstrates the difficulties in assessing vulnerability to climate25
change in the region With limited knowledge of the current state future conditions arebound to be uncertain
467
TCD9 441ndash493 2015
Snowfall in theHimalayas an
uncertain future froma little-known past
E Viste and A Sorteberg
Title Page
Abstract Introduction
Conclusions References
Tables Figures
J I
J I
Back Close
Full Screen Esc
Printer-friendly Version
Interactive Discussion
Discussion
Paper
|D
iscussionP
aper|
Discussion
Paper
|D
iscussionP
aper|
Future changes in temperature and precipitation projected by climate models can stillprovide an indication of the relative change in snowfall With the RCP 85 the climatemodels project mean reductions in annual snowfall by 30ndash50 in the Indus Basin 50ndash60 in the Ganges Basin and 50ndash70 in the Brahmaputra Basin by 2071ndash2100 Withthe RCP 26 the corresponding reductions would be 10ndash20 in the Indus about 20 5
in the Ganges and 20ndash30 in the Brahmaputra The reductions are due to increasingtemperatures as the mean of the models show constant or increasing precipitationthroughout the year in most of the region
How much increasing temperatures reduce snowfall in a region depends on howmuch of the terrain that is below and above the freezing point today and on whether10
the terrain profile is such that the temperature increase transforms large areas fromsnow to rain zones With the RCP 85 the mean elevation where rain changes to snowndash the rainsnow line ndash creeps upward by 400ndash900 m in most of the region by 700ndash900 m
The largest relative change in snowfall is seen in the upper westernmost sub-basins15
of the Brahmaputra despite increasing precipitation and the lowest rainsnow line el-evation change (400ndash500 m) This is because a major part of this region is near thefreezing point today With the RCP 85 most of this region will have temperaturesabove freezing especially in the summer which is the wettest part of the year Theprojected reduction in annual snowfall is 65ndash75 20
In the upper Indus the effect of a warmer climate on snowfall is less extreme asmost of the terrain is high enough to have temperatures sufficiently far below freezingtoday Winter and spring brings most of the precipitation and the projected 600ndash800 mchange in the rainsnow line elevation during these seasons would leave most of theterrain below the freezing point Still a 20ndash40 reduction in annual snowfall is pro-25
jected with the RCP 85The range of our estimates of present-day snowfall illustrates how little that is known
about conditions that influence the availability of drinking water in some of the mostdensely populated parts of the world There is both a scientific and a societal need
468
TCD9 441ndash493 2015
Snowfall in theHimalayas an
uncertain future froma little-known past
E Viste and A Sorteberg
Title Page
Abstract Introduction
Conclusions References
Tables Figures
J I
J I
Back Close
Full Screen Esc
Printer-friendly Version
Interactive Discussion
Discussion
Paper
|D
iscussionP
aper|
Discussion
Paper
|D
iscussionP
aper|
for more information about precipitation in the HKH As a full-scale long-time observa-tional program covering all parts of the Himalayan range is not a likely possibility theonly hope for improved future knowledge of Himalayan snowfall lies in the improvementof satellite data and regional climate models
The Supplement related to this article is available online at5
doi105194tcd-9-441-2015-supplement
Acknowledgements This work has been carried out with support from the University of Bergenthe NORINDIA and SNOWHIM projects funded by The Research Council of Norway and theCentre for Climate Dynamics at the Bjerknes Centre for Climate Research We acknowledgethe World Climate Research Programmersquos Working Group on Coupled Modelling which is re-10
sponsible for CMIP and we thank the climate modeling groups listed in Table 3 of this paper forproducing and making available their model output For CMIP the US Department of EnergyrsquosProgram for Climate Model Diagnosis and Intercomparison provides coordinating support andled development of software infrastructure in partnership with the Global Organization for EarthSystem Science Portals15
References
Akhtar M Ahmad N and Booij M J The impact of climate change on the water resourcesof Hindukush-Karakorum-Himalaya region under different glacier coverage scenarios J Hy-drol 355 148ndash163 2008
Anders A M Roe G H Hallet B Montgomery D R Finnegan N J and Putkonen J20
Spatial patterns of precipitation and topography in the Himalaya in Tectonics Climate andLandscape Evolution Geological Society of America Special Paper edited by Willett S DHovius N Brandon M T and Fisher D Geological Society of America Boulder CO USA39ndash53 2006
469
TCD9 441ndash493 2015
Snowfall in theHimalayas an
uncertain future froma little-known past
E Viste and A Sorteberg
Title Page
Abstract Introduction
Conclusions References
Tables Figures
J I
J I
Back Close
Full Screen Esc
Printer-friendly Version
Interactive Discussion
Discussion
Paper
|D
iscussionP
aper|
Discussion
Paper
|D
iscussionP
aper|
Archer DR and Fowler HJ Spatial and temporal variations in precipitation in the UpperIndus Basin global teleconnections and hydrological implications Hydrol Earth Syst Sci8 47ndash61 doi105194hess-8-47-2004 2004
Bhutiyani M R Kale V S and Pawar N J Long-term trends in maximum minimum andmean annual air temperatures across the Northwestern Himalaya during the twentieth cen-5
tury Climatic Change 85 159ndash177 doi101007s10584-006-9196-1 2007Bhutiyani M R Kale V S and Pawar N J Climate change and the precipitation variations in
the northwestern Himalaya 1866ndash2006 Int J Climatol 30 535ndash548 doi101002joc19202010
Bookhagen B and Burbank D W Topography relief and TRMM-derived rainfall variations10
along the Himalaya Geophys Res Lett 33 L08405 doi1010292006GL026037 2006Bookhagen B and Burbank D W Toward a complete Himalayan hydrological budget spa-
tiotemporal distribution of snowmelt and rainfall and their impact on river discharge J Geo-phys Res 115 F03019 doi1010292009jf001426 2010
Franco B Fettweis X and Erpicum M Future projections of the Greenland ice sheet energy15
balance driving the surface melt The Cryosphere 7 1ndash18 doi105194tc-7-1-2013 2013Butt M J Characteristics of snow cover in the Hindukush Karakoram and Himalaya region
using Landsat satellite data Hydrol Process 10 3689ndash3698 doi101002hyp8375 2012Byun K and Choi M Uncertainty of snow water equivalent retrieved from AMSR-E brightness
temperature in northeast Asia Hydrol Process 28 12 doi101002hyp9846 201420
Chaturvedi R K Joshi J Jayaraman M Bala G and Ravindranath N H Multi-modelclimate change projections for India under representative concentration pathways Curr SciIndia 103 791ndash802 2012
Christensen J H Krishna Kumar K Aldrian E An S-I Cavalcanti I F A Castro Md Dong W Goswami P Hall A Kanyanga J K Kitoh A Kossin J Lau N-C Ren-25
wick J Stephenson D B Xie S-P and Zhou T Climate phenomena and their relevancefor future regional climate change in Climate Change 2013 The Physical Science BasisContribution of Working Group I to the Fifth Assessment Report of the Intergovernmen-tal Panel on Climate Change edited by Stocker T F Qin D Plattner G-K Tignor MAllen S K Boschung J Nauels A Xia Y Bex V and Midgley P M Cambridge Univer-30
sity Press Cambridge UK and New York NY USA 92 2013Collins M Knutti R Arblaster J Dufresne J-L Fichefet T Friedlingstein P Gao X
Gutowski W J Johns T Krinner G Shongwe M Tebaldi C Weaver A J and
470
TCD9 441ndash493 2015
Snowfall in theHimalayas an
uncertain future froma little-known past
E Viste and A Sorteberg
Title Page
Abstract Introduction
Conclusions References
Tables Figures
J I
J I
Back Close
Full Screen Esc
Printer-friendly Version
Interactive Discussion
Discussion
Paper
|D
iscussionP
aper|
Discussion
Paper
|D
iscussionP
aper|
Wehner M Long-term climate change projections commitments and irreversibility in Cli-mate Change 2013 The Physical Science Basis Contribution of Working Group I to theFifth Assessment Report of the Intergovernmental Panel on Climate Change edited byStocker T F Qin D Plattner G-K Tignor M Allen S K Boschung J Nauels AXia Y Bex V and Midgley P M Cambridge University Press Cambridge UK and New5
York NY USA 108 2013Cook E R Palmer J G Ahmed M Woodhouse C A Fenwick P Zafar M U Wahab M
and Khan N Five centuries of Upper Indus River flow from tree rings J Hydrol 486 365ndash375 doi101016jjhydrol201302004 2013
Dai A Temperature and pressure dependence of the rain-snow phase transition over land and10
ocean Geophys Res Lett 35 L12802 doi1010292008gl033295 2008Fowler H J and Archer D R Conflicting signals of climatic change in the Upper Indus Basin
J Climate 19 4276ndash4293 doi101175jcli38601 2006Gao J Williams M W Fu X Wang G and Gong T Spatiotemporal distribution of snow
in eastern Tibet and the response to climate change Remote Sens Environ 121 1ndash915
doi101016jrse201201006 2012Gardelle J Berthier E and Arnaud Y Slight mass gain of Karakoram glaciers in the
early twenty-first century ndash Supplement Nature Geosci 5 322ndash325 doi101038ngeo14502012
Guhathakurta P and Rajeevan M Trends in the rainfall pattern over India Int J Climatol20
28 1453ndash1469 doi101002joc1640 2008Harris I Jones P D Osborn T J and Lister D H Updated high-resolution grids of
monthly climatic observations ndash the CRU TS310 Dataset Int J Climatol 34 623ndash642doi101002joc3711 2014
Hartmann H and Andresky L Flooding in the Indus River basin ndash a spa-25
tiotemporal analysis of precipitation records Global Planet Change 107 25ndash35doi101016jgloplacha201304002 2013
Hastings D and Dunbar P Development amp Assessment of the Global Land One-km BaseElevation Digital Elevation Model (GLOBE) ISPRS Commission IV Symposium on GIS ndashBetween Visions and Applications Stuttgart Germany 7ndash10 September 199830
Hewitt K The Karakoram anomaly Glacier expansion and the ldquoelevation ef-fectrdquo Karakoram Himalaya Mt Res Dev 25 332ndash340 doi1016590276-4741(2005)025[0332TKAGEA]20CO2 2005
471
TCD9 441ndash493 2015
Snowfall in theHimalayas an
uncertain future froma little-known past
E Viste and A Sorteberg
Title Page
Abstract Introduction
Conclusions References
Tables Figures
J I
J I
Back Close
Full Screen Esc
Printer-friendly Version
Interactive Discussion
Discussion
Paper
|D
iscussionP
aper|
Discussion
Paper
|D
iscussionP
aper|
Huffman G J Adler R F Bolvin D T Gu G Nelkin E J Bowman K P Hong YStocker E F and Wolff D B The TRMM Multisatellite Precipitation Analysis (TMPA) quasi-global multiyear combined-sensor precipitation estimates at fine scales J Hydrometeorol8 38ndash55 2007
Immerzeel W Historical trends and future predictions of climate variability in the Brahmaputra5
basin Int J Climatol 28 243ndash254 doi101002joc1528 2008Immerzeel W W Droogers P de Jong S M and Bierkens M F P Large-scale monitoring
of snow cover and runoff simulation in Himalayan river basins using remote sensing RemoteSens Environ 113 40ndash49 doi101016jrse200808010 2009
Immerzeel W W van Beek L P H and Bierkens M F P Climate change will affect the10
asian water towers Science 328 1382ndash1385 doi101126science1183188 2010Ines A V M and Hansen J W Bias correction of daily GCM rainfall for crop simulation
studies Agr Forest Meteorol 138 44ndash53 doi101016jagrformet200603009 2006Jain S K Goswami A and Saraf A K Role of elevation and aspect in snow distribution
in western Himalaya Water Resour Manag 23 71ndash83 doi101007s11269-008-9265-515
2009Krakauer N Pradhanang S Lakhankar T and Jha A Evaluating satellite products for
precipitation estimation in mountain regions a case study for Nepal Remote Sensing 54107ndash4123 2013
Krishna A P Snow and glacier cover assessment in the high mountains of Sikkim Himalaya20
Hydrol Process 19 2375ndash2383 doi101002hyp5890 2005Kulkarni A V Rathore B P Singh S K and Ajai Distribution of seasonal snow cover in cen-
tral and western Himalaya Ann Glaciol 51 123ndash128 doi1031891727564107913864452010
Kumar V Rao Y S Venkataraman G Sarwade R N and Mani S Analysis of Aqua25
AMSR-E Derived Snow Water Equivalent over Himalayan Snow Covered Regions Geo-science and Remote Sensing Symposium Denver CO USA 31 Julyndash4 August 2006
Kaumlaumlb A Berthier E Nuth C Gardelle J and Arnaud Y Contrasting patterns of earlytwenty-first-century glacier mass change in the Himalayas Nature 488 495ndash498 availableat httpwwwnaturecomnaturejournalv488n7412absnature11324html ndash Supplement30
2012Lehner B Verdin K and Jarvis A New global hydrography derived from spaceborne eleva-
tion data Eos T Am Geophys Un 89 93ndash94 doi1010292008EO100001 2008
472
TCD9 441ndash493 2015
Snowfall in theHimalayas an
uncertain future froma little-known past
E Viste and A Sorteberg
Title Page
Abstract Introduction
Conclusions References
Tables Figures
J I
J I
Back Close
Full Screen Esc
Printer-friendly Version
Interactive Discussion
Discussion
Paper
|D
iscussionP
aper|
Discussion
Paper
|D
iscussionP
aper|
MacQueen J Some Methods for Classification and Analysis of Multivariate ObservationsFifth Berkeley Symposium on Mathematical Statistics and Probability Berkeley California21 Junendash18 July 1967
Meacuteneacutegoz M Galleacutee H and Jacobi H W Precipitation and snow cover in the Himalayafrom reanalysis to regional climate simulations Hydrol Earth Syst Sci 17 3921ndash39365
doi105194hess-17-3921-2013 2013Menon A Levermann A Schewe J Lehmann J and Frieler K Consistent increase in
Indian monsoon rainfall and its variability across CMIP-5 models Earth Syst Dynam 4287ndash300 doi105194esd-4-287-2013 2013
Moss R H Edmonds J A Hibbard K A Manning M R Rose S K van Vuuren D P10
Carter T R Emori S Kainuma M Kram T Meehl G A Mitchell J F B Naki-cenovic N Riahi K Smith S J Stouffer R J Thomson A M Weyant J P andWilbanks T J The next generation of scenarios for climate change research and assess-ment Nature 463 747ndash756 2010
Negi H S Kulkarni A V and Semwal B S Estimation of snow cover distribution in Beas15
basin Indian Himalaya using satellite data and ground measurements J Earth Syst Sci118 525ndash538 doi101007s12040-009-0039-0 2009
Palazzi E v Hardenberg J and Provenzale A Precipitation in the Hindu-Kush Karako-ram Himalaya observations and future scenarios J Geophys Res-Atmos 118 85ndash100doi1010292012JD018697 201320
Rees H G and Collins D N Regional differences in response of flow in glacier-fed Himalayanrivers to climatic warming Hydrol Process 20 2157ndash2169 doi101002hyp6209 2006
Rienecker M M Suarez M J Gelaro R Todling R Bacmeister J Liu EBosilovich M G Schubert S D Takacs L Kim G-K Bloom S Chen J Collins DConaty A da Silva A Gu W Joiner J Koster R D Lucchesi R Molod A Owens T25
Pawson S Pegion P Redder C R Reichle R Robertson F R Ruddick A GSienkiewicz M and Woollen J MERRA NASArsquos Modern-Era Retrospective Analysis forResearch and Applications J Climate 24 3624ndash3648 doi101175JCLI-D-11-0001512011
Rikiishi K and Nakasato H Height dependence of the tendency for reduction in seasonal30
snow cover in the Himalaya and the Tibetan Plateau region 1966ndash2001 Ann Glaciol 43369ndash377 doi103189172756406781811989 2006
473
TCD9 441ndash493 2015
Snowfall in theHimalayas an
uncertain future froma little-known past
E Viste and A Sorteberg
Title Page
Abstract Introduction
Conclusions References
Tables Figures
J I
J I
Back Close
Full Screen Esc
Printer-friendly Version
Interactive Discussion
Discussion
Paper
|D
iscussionP
aper|
Discussion
Paper
|D
iscussionP
aper|
Raumlisaumlnen J Warmer climate less or more snow Clim Dynam 30 307ndash319doi101007s00382-007-0289-y 2008
Schaner N Voisin N Nijssen B and Lettenmaier D P The contribution of glacier melt tostreamflow Environ Res Lett 7 034029 doi1010881748-932673034029 2012
Scherler D Bookhagen B and Strecker M R Spatially variable response of Himalayan5
glaciers to climate change affected by debris cover Nature Geosci 4 156ndash159 availableat httpwwwnaturecomngeojournalv4n3absngeo1068html ndash Supplement 2011
Sharif M Archer D R Fowler H J and Forsythe N Trends in timing and magnitude offlow in the Upper Indus Basin Hydrol Earth Syst Sci 17 1503ndash1516 doi105194hess-17-1503-2013 201310
Shekhar M S Chand H Kumar S Srinivasan K and Ganju A Climate-change studiesin the western Himalaya Ann Glaciol 51 105ndash112 doi1031891727564107913865082010
Shrestha A B Wake C P Mayewski P A and Dibb J E Maximum tempera-ture trends in the Himalaya and its vicinity an analysis based on temperature records15
from Nepal for the period 1971ndash94 J Climate 12 2775ndash2786 doi1011751520-0442(1999)012lt2775MTTITHgt20CO2 1999
Shrestha A B Wake C P Dibb J E and Mayewski P A Precipitation fluctuations in theNepal Himalaya and its vicinity and relationship with some large scale climatological parame-ters Int J Climatol 20 317ndash327 doi101002(SICI)1097-0088(20000315)203lt317AID-20
JOC476gt30CO2-G 2000Siderius C Biemans H Wiltshire A Rao S Franssen W H P Kumar P Gosain A K
van Vliet M T H and Collins D N Snowmelt contributions to discharge of the GangesSci Total Environ Supplement 468ndash469 9 doi101016jscitotenv201305084 2013
Singh P Jain S K and Kumar N Estimation of snow and glacier-melt contribution to the25
Chenab River Western Himalaya Mt Res Dev 17 49ndash56 doi1023073673913 1997Singh P Kumar V Thomas T and Arora M Changes in rainfall and relative hu-
midity in river basins in northwest and central India Hydrol Process 22 2982ndash2992doi101002hyp6871 2008
Sontakke N A Singh N and Singh H N Instrumental period rainfall series of the Indian30
region (AD 1813ndash2005) revised reconstruction update and analysis Holocene 18 1055ndash1066 doi1011770959683608095576 2008
474
TCD9 441ndash493 2015
Snowfall in theHimalayas an
uncertain future froma little-known past
E Viste and A Sorteberg
Title Page
Abstract Introduction
Conclusions References
Tables Figures
J I
J I
Back Close
Full Screen Esc
Printer-friendly Version
Interactive Discussion
Discussion
Paper
|D
iscussionP
aper|
Discussion
Paper
|D
iscussionP
aper|
Sperber K R Annamalai H Kang I S Kitoh A Moise A Turner A Wang B andZhou T The Asian summer monsoon an intercomparison of CMIP5 vs CMIP3 simulationsof the late 20th century Clim Dynam 41 2711ndash2744 doi101007s00382-012-1607-62013
Tahir A A Chevallier P Arnaud Y and Ahmad B Snow cover dynamics and hydrological5
regime of the Hunza River basin Karakoram Range Northern Pakistan Hydrol Earth SystSci 15 2275ndash2290 doi105194hess-15-2275-2011 2011a
Tahir A A Chevallier P Arnaud Y Neppel L and Ahmad B Modeling snowmelt-runoffunder climate scenarios in the Hunza River basin Karakoram Range Northern Pakistan JHydrol 409 104ndash117 doi101016jjhydrol201108035 2011b10
Taylor K E Stouffer R J and Meehl G A An overview of CMIP5 and the experimentdesign B Am Meteorol Soc 93 14 doi101175BAMS-D-11-000941 2011
Tedesco M and Narvekar P S Assessment of the NASA AMSR-E SWE product IEEE J SelTop Appl 3 141ndash159 doi101109JSTARS20102040462 2010
Teutschbein C and Seibert J Bias correction of regional climate model simulations for hydro-15
logical climate-change impact studies review and evaluation of different methods J Hydrol456ndash457 12ndash29 doi101016jjhydrol201205052 2012
Turner A G and Annamalai H Climate change and the South Asian summer monsoon NatClim Change 2 587ndash595 2012
van Vuuren D Edmonds J Kainuma M Riahi K Thomson A Hibbard K Hurtt G20
Kram T Krey V Lamarque J-F Masui T Meinshausen M Nakicenovic N Smith Sand Rose S The representative concentration pathways an overview Climatic Change109 26 doi101007s10584-011-0148-z 2011
Wang A and Zeng X Development of global hourly 05-degree land surface air temperaturedatasets J Climate 26 7676ndash7691 doi101175JCLI-D-12-006821 201325
Wiltshire A J Climate change implications for the glaciers of the Hindu Kush Karakoram andHimalayan region The Cryosphere 8 941ndash958 doi105194tc-8-941-2014 2014
Winiger M Gumpert M and Yamout H KarakorumndashHindukushndashwestern Himalaya assess-ing high-altitude water resources Hydrol Process 19 2329ndash2338 doi101002hyp5887200530
Xu X Lu C Shi X and Gao S World water tower An atmospheric perspective GeophysRes Lett 35 L20815 doi1010292008GL035867 2008a
475
TCD9 441ndash493 2015
Snowfall in theHimalayas an
uncertain future froma little-known past
E Viste and A Sorteberg
Title Page
Abstract Introduction
Conclusions References
Tables Figures
J I
J I
Back Close
Full Screen Esc
Printer-friendly Version
Interactive Discussion
Discussion
Paper
|D
iscussionP
aper|
Discussion
Paper
|D
iscussionP
aper|
Xu Z X Gong T L and Li J Y Decadal trend of climate in the Tibetan Plateaumdashregionaltemperature and precipitation Hydrol Process 22 3056ndash3065 doi101002hyp68922008b
Yasutomi N Hamada A and Akiyo Y Development of a Long-term Daily Gridded Temper-ature Dataset and its Application to RainSnow Discrimination of Daily Precipitation Global5
Environ Res15 165ndash172 2011Yatagai A Kamiguchi K Arakawa O Hamada A Yasutomi N and Kitoh A APHRODITE
Constructing a Long-Term Daily Gridded Precipitation Dataset for Asia Based on a DenseNetwork of Rain Gauges B Am Meteorol Soc 93 1401ndash1415 doi101175BAMS-D-11-001221 201210
You Q Kang S Aguilar E and Yan Y Changes in daily climate extremes in the east-ern and central Tibetan Plateau during 1961ndash2005 J Geophys Res-Atmos 113 D07101doi1010292007JD009389 2008
476
TCD9 441ndash493 2015
Snowfall in theHimalayas an
uncertain future froma little-known past
E Viste and A Sorteberg
Title Page
Abstract Introduction
Conclusions References
Tables Figures
J I
J I
Back Close
Full Screen Esc
Printer-friendly Version
Interactive Discussion
Discussion
Paper
|D
iscussionP
aper|
Discussion
Paper
|D
iscussionP
aper|
Table 1 Combinations of data types used in snowfall estimates T temperature P precipita-tion f (P T ) indicates that snowfall is calculated as a function of P and T
Precipitation Temperature Snowfall Time
MERRA MERRA PresentMERRA reference MERRA Terrain-adjusted MERRA f (P T ) PresentMERRA T2m MERRA MERRA T2m f (P T ) PresentBias-corrected with obs T MERRA Bias-corr terrain-adj MERRA f (P T ) PresentBias-corrected with obs P Bias-corr MERRA Terrain-adjusted MERRA f (P T ) PresentBias-corrected with obs T P Bias-corr MERRA Bias-corr terrain-adj MERRA f (P T ) PresentCMIP5 T MERRA Terrain-adj MERRA+∆T f (P T ) FutureCMIP5 P MERRAtimes∆P Terrain-adj MERRA f (P T ) FutureCMIP5 T P MERRAtimes∆P Terrain-adj MERRA+∆T f (P T ) FutureBias-corr CMIP5 T Bias-corr MERRA Bias-corr terrain-adj MERRA+∆T f (P T ) FutureBias-corr CMIP5 P Bias-corr MERRAtimes∆P Bias-corr terrain-adj MERRA f (P T ) FutureBias-corr CMIP5 T P Bias-corr MERRAtimes∆P Bias-corr terrain-adj MERRA+∆T f (P T ) Future
477
TCD9 441ndash493 2015
Snowfall in theHimalayas an
uncertain future froma little-known past
E Viste and A Sorteberg
Title Page
Abstract Introduction
Conclusions References
Tables Figures
J I
J I
Back Close
Full Screen Esc
Printer-friendly Version
Interactive Discussion
Discussion
Paper
|D
iscussionP
aper|
Discussion
Paper
|D
iscussionP
aper|
Table 2 Data sets used in calculations of present-day snowfall
Product Time Hor res Description
MERRA 1979ndash2012 05 lat 07 lon Hourly atmospheric reanalysis data(Rienecker et al 2011)
APHRODITEV1204V1101
1979ndash2007 025 Daily temperature andprecipitation basedon observations (Yatagai et al 2012Yasutomi et al 2011)
CRU TS 320 1979ndash2011 05 Monthly temperature and precipitationbased on observations(Harris et al 2014)
TRMM 3B42 V7 1998ndash2012 05 3 hourly satellite-based precipitation(Huffman et al 2007)
GLOBE 1 km Topography data set(Hastings and Dunbar 1998)
478
TCD9 441ndash493 2015
Snowfall in theHimalayas an
uncertain future froma little-known past
E Viste and A Sorteberg
Title Page
Abstract Introduction
Conclusions References
Tables Figures
J I
J I
Back Close
Full Screen Esc
Printer-friendly Version
Interactive Discussion
Discussion
Paper
|D
iscussionP
aper|
Discussion
Paper
|D
iscussionP
aper|
Table 3 CMIP5 models and RCPs used (x) in calculations of 2071ndash2100 snowfall
Model RCP 26 RCP 85
CanESM2 x xCCSM4 x xCESM1-CAM5 xCNRM-CM5 xGFDL-CM3 x xGFDL-ESM2G xGISS-E2-R x xHadGEM2-ES x xIPSL-CM5A-LR x xIPSL-CM5A-MR x xMIROC-ESM x xMIROC-ESM-CHEM x xMIROC5 x xMRI-CGCM3 x xNorESM1-M x xNorESM1-ME x x
479
TCD9 441ndash493 2015
Snowfall in theHimalayas an
uncertain future froma little-known past
E Viste and A Sorteberg
Title Page
Abstract Introduction
Conclusions References
Tables Figures
J I
J I
Back Close
Full Screen Esc
Printer-friendly Version
Interactive Discussion
Discussion
Paper
|D
iscussionP
aper|
Discussion
Paper
|D
iscussionP
aper|
Table 4 Annual snowfall estimates for the Indus Ganges and Brahmaputra Basins S snow[km3 SWE] P precipitation [km3] S and P percent of MERRA reference snowfall andMERRA precipitation First horizontal section no bias-corrections Second third and fourthsection bias-corrections with T P and both T and P
Indus Basin Ganges Basin Brahmaputra BasinInput S S P P S S P P S S P P
MERRA reference 148 100 422 100 54 100 1147 100 119 100 733 100MERRA 166 112 422 100 49 90 1147 100 129 109 733 100MERRA T2m 154 104 422 100 42 77 1147 100 109 92 733 100T APHRODITE 113 76 422 100 30 55 1147 100 74 62 733 100T CRU 126 85 422 100 81 151 1147 100 109 92 733 100P APHRODITE 66 44 315 75 22 42 1020 89 35 30 567 77P TRMM 72 49 404 96 31 57 1244 108 63 54 835 114P CRU 84 56 398 94 30 56 1100 96 53 45 716 98P T APHRODITE 49 33 315 75 12 22 1020 89 20 17 567 77P APHRODITE T CRU 62 42 315 75 34 63 1020 89 33 28 567 77P TRMM T APHRODITE 54 36 390 92 18 34 1195 104 39 33 815 111P TRMM T CRU 65 44 403 96 46 85 1254 109 58 49 813 111P CRU T APHRODITE 65 44 395 94 17 31 1106 96 31 26 718 98P T CRU 80 54 398 94 41 75 1100 96 49 42 716 98
480
TCD9 441ndash493 2015
Snowfall in theHimalayas an
uncertain future froma little-known past
E Viste and A Sorteberg
Title Page
Abstract Introduction
Conclusions References
Tables Figures
J I
J I
Back Close
Full Screen Esc
Printer-friendly Version
Interactive Discussion
Discussion
Paper
|D
iscussionP
aper|
Discussion
Paper
|D
iscussionP
aper|
Table 5 Projected change in annual snowfall from 1971ndash2000 to 2071ndash2100 with referenceto terrain-adjusted MERRA and APHRODITE ∆Sabs [km3] is the absolute change ∆Srel [] isthe relative change compared to the present-day MERRA reference snowfall Values are pre-sented with the CMIP5 multi-model mean as the main value and the span of individual modelsin brackets (MERRA only) ∆TP indicates that changes in both temperature and precipitationare included whereas ∆P and ∆T denotes changes only in precipitation or temperature re-spectively
Indus Ganges Brahmaputra∆Sabs [km3] ∆Srel [] ∆Sabs [km3] ∆Srel [] ∆Sabs [km3] ∆Srel []
RCP 85 MERRA ∆TP minus49 [minus83minus9] minus33 [minus56minus6] minus27 [minus36minus14] minus50 [minus66minus25] minus64 [minus93minus39] minus54 [minus79minus33]MERRA ∆T minus51 [minus67minus34] minus34 [minus45minus23] minus28 [minus34minus21] minus51 [minus64minus39] minus71 [minus87minus53] minus60 [minus73minus44]MERRA ∆P 5 [minus2544] 4 [minus1730] 7 [minus417] 12 [minus731] 20 [minus1750] 17 [minus1542]
APHRO ∆TP minus25 minus51 minus7 minus56 minus13 minus67APHRO ∆T minus25 minus52 minus7 minus57 minus14 minus71APHRO ∆P 1 1 1 6 3 16
RCP 26 MERRA ∆TP minus15 [minus406] minus10 [minus274] minus10 [minus19minus3] minus18 [minus36minus5] minus25 [minus42minus5] minus21 [minus35minus4]MERRA ∆T minus18 [minus27minus9] minus12 [minus18minus6] minus12 [minus21minus6] minus21 [minus39minus11] minus29 [minus47minus13] minus25 [minus40minus11]MERRA ∆P 3 [minus1825] 2 [minus1217] 3 [minus210] 5 [minus419] 7 [minus828] 6 [minus623]
APHRO ∆TP minus9 minus18 minus2 minus20 minus6 minus29APHRO ∆T minus10 minus19 minus3 minus23 minus6 minus32APHRO ∆P 1 1 0 4 1 6
481
TCD9 441ndash493 2015
Snowfall in theHimalayas an
uncertain future froma little-known past
E Viste and A Sorteberg
Title Page
Abstract Introduction
Conclusions References
Tables Figures
J I
J I
Back Close
Full Screen Esc
Printer-friendly Version
Interactive Discussion
Discussion
Paper
|D
iscussionP
aper|
Discussion
Paper
|D
iscussionP
aper|
Figure 1 Map of the region with the Indus Ganges and Brahmaputra basins outlined in whiteThinner outlines are national borders Background NASA Visible Earth
482
TCD9 441ndash493 2015
Snowfall in theHimalayas an
uncertain future froma little-known past
E Viste and A Sorteberg
Title Page
Abstract Introduction
Conclusions References
Tables Figures
J I
J I
Back Close
Full Screen Esc
Printer-friendly Version
Interactive Discussion
Discussion
Paper
|D
iscussionP
aper|
Discussion
Paper
|D
iscussionP
aper|
0
400 mm
Months 1ndash12
SP
I1
I2I3
I5I4
G1
G2G3
G4
B1
B2
B3B4
Viste amp SortebergFigure 2
Figure 2 Monthly mean MERRA precipitation and MERRA reference snowfall in sub-basinclusters of the Indus (I) Ganges (G) and Brahmaputra (B) Total bar height MERRA precip-itation (P) [mm] Colored bars snowfall (S) [mm SWE] based on MERRA precipitation andterrain-adjusted MERRA temperature in the region with the same color Cluster 1 in eachbasin is considered snow-free and the seasonal cycles are not shown
483
TCD9 441ndash493 2015
Snowfall in theHimalayas an
uncertain future froma little-known past
E Viste and A Sorteberg
Title Page
Abstract Introduction
Conclusions References
Tables Figures
J I
J I
Back Close
Full Screen Esc
Printer-friendly Version
Interactive Discussion
Discussion
Paper
|D
iscussionP
aper|
Discussion
Paper
|D
iscussionP
aper|
a) MERRA reference b) APHRODITE c) APHRODITE ndash MERRA ref
30 km3
20100-10-20-30
Viste amp SortebergFigure 3
Figure 3 The effect of bias-corrections with APHRODITE temperature and precipitation(a) MERRA reference snowfall (b) Snowfall based on bias-corrections with APHRODITE(c) APHRODITE (b) minus MERRA reference snowfall (a)
484
TCD9 441ndash493 2015
Snowfall in theHimalayas an
uncertain future froma little-known past
E Viste and A Sorteberg
Title Page
Abstract Introduction
Conclusions References
Tables Figures
J I
J I
Back Close
Full Screen Esc
Printer-friendly Version
Interactive Discussion
Discussion
Paper
|D
iscussionP
aper|
Discussion
Paper
|D
iscussionP
aper|
Figure 4 Difference between MERRA precipitation and observation-based data (a) Annualmean MERRA precipitation (b c and d) Annual mean MERRA precipitation bias-correctedwith observations APHRODITE CRU TS and TRMM 3B42 For each data set the small insetmaps show the observations minus MERRA
485
TCD9 441ndash493 2015
Snowfall in theHimalayas an
uncertain future froma little-known past
E Viste and A Sorteberg
Title Page
Abstract Introduction
Conclusions References
Tables Figures
J I
J I
Back Close
Full Screen Esc
Printer-friendly Version
Interactive Discussion
Discussion
Paper
|D
iscussionP
aper|
Discussion
Paper
|D
iscussionP
aper|
Biasminuscorrected minus original MERRA temperature [C]
minus15
minus10
minus5
0
5
10
Biasminuscorrected minus original MERRA temperature [C]
minus15
minus10
minus5
0
5
10
MERRA mean temperature [C] 1979minus2007
minus15
minus10
minus5
0
5
10
15
20
25
30a) MERRA b) APHRODITE ndash MERRA c) CRU ndash MERRA
-10
0
10
20
30degC
minus15
minus10
minus5
0
5
10
15degC
Viste amp SortebergFigure 5
Figure 5 Difference between MERRA temperature and observation-based data (a) Annualmean MERRA temperature (b and c) Annual mean MERRA temperature bias-corrected withobservations APHRODITE and CRU TS
486
TCD9 441ndash493 2015
Snowfall in theHimalayas an
uncertain future froma little-known past
E Viste and A Sorteberg
Title Page
Abstract Introduction
Conclusions References
Tables Figures
J I
J I
Back Close
Full Screen Esc
Printer-friendly Version
Interactive Discussion
Discussion
Paper
|D
iscussionP
aper|
Discussion
Paper
|D
iscussionP
aper|
Jan Apr
Jul Oct
a)
c)
b)
d)
15degC
10
5
0
ndash5
ndash10
ndash15
200 mm16012080400ndash40ndash80ndash120ndash160ndash200
Viste amp SortebergFigure 6
Figure 6 Regions where increasing temperatures are likely to cause a shift from snow to rainData monthly mean MERRA temperature terrain-adjusted to a 4 km GLOBE grid Red temper-ature between minus5 and 0 considered critical Small inset maps monthly MERRA precipitationin the critical zones
487
TCD9 441ndash493 2015
Snowfall in theHimalayas an
uncertain future froma little-known past
E Viste and A Sorteberg
Title Page
Abstract Introduction
Conclusions References
Tables Figures
J I
J I
Back Close
Full Screen Esc
Printer-friendly Version
Interactive Discussion
Discussion
Paper
|D
iscussionP
aper|
Discussion
Paper
|D
iscussionP
aper|
1 2 3 4 5 6 7 8 9 10 11 12Month
∆T [ordm
C]
a) Indus
0
1
2
3
4
5
6
7
8
9
10
b) Ganges∆T
[ordmC
]
1 2 3 4 5 6 7 8 9 10 11 12Month
1
2
3
4
5
6
7
8
0 0
c) Brahmaputra
∆T [ordm
C]
1 2 3 4 5 6 7 8 9 10 11 12Month
1
2
3
4
5
6
7
8
9
10 RCP 85RCP 85 meanRCP 26RCP 26 mean
Viste amp SortebergFigure 7
Figure 7 Projected future temperature change from 1971ndash2000 to 2071ndash2100 in the (a) In-dus (b) Ganges and (c) Brahmaputra Basins Thin lines show the individual CMIP5 modelsstronger lines the multi-model mean
488
TCD9 441ndash493 2015
Snowfall in theHimalayas an
uncertain future froma little-known past
E Viste and A Sorteberg
Title Page
Abstract Introduction
Conclusions References
Tables Figures
J I
J I
Back Close
Full Screen Esc
Printer-friendly Version
Interactive Discussion
Discussion
Paper
|D
iscussionP
aper|
Discussion
Paper
|D
iscussionP
aper|
1 2 3 4 5 6 7 8 9 10 11 12Month
[km
3 ]
a) Indus
0
20
40
60
80
100
120
140
b) Ganges[k
m3 ]
1 2 3 4 5 6 7 8 9 10 11 12Month
0
100
200
300
400
500
600
700
c) Brahmaputra
[km
3 ]
1 2 3 4 5 6 7 8 9 10 11 12Month
0
50
100
150
200
250
MERRA ref
2071ndash2100
1979ndash2008
RCP 85RCP 85 meanRCP 26RCP 26 mean
Viste amp SortebergFigure 8
Figure 8 Projected future precipitation in the (a) Indus (b) Ganges and (c) BrahmaputraBasins Gray bars MERRA 1979ndash2008 Thin lines and horizontal marks on the bars show theindividual CMIP5 models and the multi-model mean for 2071ndash2100
489
TCD9 441ndash493 2015
Snowfall in theHimalayas an
uncertain future froma little-known past
E Viste and A Sorteberg
Title Page
Abstract Introduction
Conclusions References
Tables Figures
J I
J I
Back Close
Full Screen Esc
Printer-friendly Version
Interactive Discussion
Discussion
Paper
|D
iscussionP
aper|
Discussion
Paper
|D
iscussionP
aper|
1 2 3 4 5 6 7 8 9 10 11 120
5
10
15
20
25
30
35
Month
SWE
[km
3 ]
a) Indus
0
1
2
3
4
5
6
7
8
b) Ganges
SWE
[km
3 ]
1 2 3 4 5 6 7 8 9 10 11 12Month
0
2
4
6
8
10
12
14
16
18
20
c) Brahmaputra
SWE
[km
3 ]
1 2 3 4 5 6 7 8 9 10 11 12Month
MERRA ref
2071ndash2100
1979ndash2008
RCP 85RCP 85 meanRCP 26RCP 26 mean
Viste amp SortebergFigure 9
Figure 9 Projected future snowfall in the (a) Indus (b) Ganges and (c) Brahmaputra Basinswith reference to MERRA reference snowfall Gray bars MERRA reference snowfall for 1979ndash2008 Thin lines and horizontal marks on the bars show the individual CMIP5 models andthe multi-model mean for 2071ndash2100 based on changes in temperature and precipitation asdescribed in Sect 23
490
TCD9 441ndash493 2015
Snowfall in theHimalayas an
uncertain future froma little-known past
E Viste and A Sorteberg
Title Page
Abstract Introduction
Conclusions References
Tables Figures
J I
J I
Back Close
Full Screen Esc
Printer-friendly Version
Interactive Discussion
Discussion
Paper
|D
iscussionP
aper|
Discussion
Paper
|D
iscussionP
aper|
Figure 10 Projected future changes in snowfall in sub-basins of the Indus Ganges andBrahmaputra Basins (a) Absolute change [km3] with reference to MERRA reference snow-fall (b) Absolute change [km3] with reference to APHRODITE snowfall (c d) Correspondingrelative changes [] with reference to MERRA and APHRODITE
491
TCD9 441ndash493 2015
Snowfall in theHimalayas an
uncertain future froma little-known past
E Viste and A Sorteberg
Title Page
Abstract Introduction
Conclusions References
Tables Figures
J I
J I
Back Close
Full Screen Esc
Printer-friendly Version
Interactive Discussion
Discussion
Paper
|D
iscussionP
aper|
Discussion
Paper
|D
iscussionP
aper|
J F M A M J J A S O N DMonth
0
5
10
15
20 km3Precip
0
2
4
6
8
10 km3SWE
2000
3000
4000
5000
6000 masl
1845
J F
M
A
M
JJ A
S
O
N
D
RSL
I4A = 146793 km2
1 km 3 = 68 mm
0
05
1
15 SWE rel
8000 m
0
J F M A M J J A S O N DMonth
0
2
4
6
8
10
12 km3 SWE
3000
4000
5000
6000 masl
78
2
14
J FM
A
MJ
J AS
O
ND
RSL
I5
Precip
0
5
10
15
20
25 km3
0
05
1
15 SWE rel
8000 m
0
A = 178669 km2
1 km 3 = 56 mm
CMIP52071ndash2100mean
Today
MERRA APHRODITE
Individual models
CMIP52071ndash2100mean
MERRA APHRODITE
Individual models
CMIP52071ndash2100Precip mean
MERRA APHRODITE
Individual models
SWE todayPrecip today
2000 mTerrain distribution of area between levels
CMIP52071ndash2100
TodayMERRA
APHRODITE
a)
i)
ii)
iii)
iv)
b)
Viste amp SortebergFigure 11
Figure 11 Monthly CMIP5 RCP 85 change in snowfall precipitation and rainsnow line eleva-tion in the upper Indus clusters (a) 4 and (b) 5 from 1971ndash2000 to 2071ndash2100 with referenceto the MERRA reference (red) and APHRODITE (blue) CMIP5 multi-model means are shownas horizontal marks individual models as dots Cluster location and terrain profile are shownabove the graphs (i) Fractional change in snowfall (ii) Future snowfall [km3] (dots) comparedto today (bars) (iii) Future precipitation [km3] (dots) compared to today (bars) Snowfall todayis shown as darker part of bars (iv) Rainsnow line elevation [m asl] Gray background el-evation histogram with the of total ground area lying in the marked 2000 m intervals Barschange from today (bottom) to CMIP5 multi-model mean (top)
492
TCD9 441ndash493 2015
Snowfall in theHimalayas an
uncertain future froma little-known past
E Viste and A Sorteberg
Title Page
Abstract Introduction
Conclusions References
Tables Figures
J I
J I
Back Close
Full Screen Esc
Printer-friendly Version
Interactive Discussion
Discussion
Paper
|D
iscussionP
aper|
Discussion
Paper
|D
iscussionP
aper|
3000
4000
5000
6000 masl
0
2
4
6
8
10 km3
0
10
20
30
40
50
60 km3
0
05
1
15
J F M A M J J A S O N DMonth
J FM
A
M
JJ A
S
O
ND
Precip
SWE
RSL
SWE rel
53
B3
8000 m
0
A = 139611 km2
1 km 3 = 72 mm
4500
5000
5500
6000
6500 masl
0
1
2
3
4 km3
0
10
20
30
40
50 km3
0
05
1
15 SWE rel
SWE
RSL
Precip
95
J F M A M J J A S O N DMonth
J FM
A
M
JJ A
S
ON
D
B4
8000 m
0
A = 159165 km2
1 km 3 = 63 mm
CMIP52071ndash2100mean
Today
MERRA APHRODITE
Individual models
CMIP52071ndash2100mean
MERRA APHRODITE
Individual models
CMIP52071ndash2100Precip mean
MERRA APHRODITE
Individual models
SWE todayPrecip today
2000 mTerrain distribution of area between levels
CMIP52071ndash2100
TodayMERRA
APHRODITE
a)
i)
ii)
iii)
iv)
b)
Viste amp SortebergFigure 12
Figure 12 Monthly CMIP5 RCP 85 change in snowfall precipitation and rainsnow line ele-vation in the upper Brahmaputra clusters (a) 4 and (b) 3 See Fig 11 for a description of thecontent
493
- Introduction
-
- Observed trends in snowfall temperature and precipitation
- Future projections of snowfall temperature and precipitation
- Aims and scope
-
- Data and methods
-
- Reference present-day snowfall
- Bias-corrected present-day snowfall
- Projected snowfall
- The rain-snow line
-
- Present-day snowfall
-
- Seasonal cycles of precipitation and snowfall
- Comparison of snowfall estimates
-
- Projected future snowfall
-
- Basin-scale projections
- Regional projections
-
- Upper Indus western part
- Upper Indus eastern part
- Upper Brahmaputra western part
- Upper Brahmaputra eastern part
-
- Potential effects of reduced snowfall on water availability
-
- Concluding summary
-

TCD9 441ndash493 2015
Snowfall in theHimalayas an
uncertain future froma little-known past
E Viste and A Sorteberg
Title Page
Abstract Introduction
Conclusions References
Tables Figures
J I
J I
Back Close
Full Screen Esc
Printer-friendly Version
Interactive Discussion
Discussion
Paper
|D
iscussionP
aper|
Discussion
Paper
|D
iscussionP
aper|
little summer snowfall today the reduction in summer snowfall is notable in all clustersin the MERRA data in the Brahmaputra clusters also in APHRODITE
The largest change in snowfall is seen in the western part of the Brahmaputra (clus-ter B4 Sect 423) where a 400ndash500 m upward shift in the rainsnow line during sum-mer reduces the area with temperatures low enough for snowfall by a factor of 5ndash105
(Fig 12a iv values not shown) As a result the summer peak in the seasonal cycleof snowfall is replaced by a dip (Fig 12a ii) With an even distribution of precipitationwith elevation the area that still receives snow would have to receive 5ndash10 times asmuch precipitation to compensate for the lost snowfall Assuming more realisticallythat precipitation decreases above a certain height would require an even higher in-10
crease in precipitation In the model with the highest increase a doubling of the Julyprecipitation by the end of the century SWE is less than 25 of todayrsquos value in thatmonth (Fig 12a iii)
With a winter-dominated precipitation cycle the relative change in snowfall is smallerin the upper Indus than in the upper Brahmaputra Downscaling a high-emission sce-15
nario (A1B) in two CMIP3 models with a regional model Wiltshire (2014) found that bythe 2080s precipitation increased more than enough to compensate for higher temper-atures in the Karakoram Hindu Kush and Jammu and Kashmir in one of the modelsthe HadCM3 In the other model ECHAM5 precipitation increased less and snow-fall increased only in the higher parts of the Karakoram In our ensemble of CMIP520
models multi-model mean precipitation in the upper Indus clusters increases mainlyin the summer season when the inter-model spread is also the largest (Fig 11a iiiand 11b iii) Among the models 4ndash5 project increased winter precipitation in the upperIndus and in the uppermost cluster I5 this is associated with an increase in wintersnowfall (Fig 11b ii)25
Although it is the part of the HKH where snowfall is least reduced by increasingtemperatures (Fig 10b) the Karakoram and inner parts of the upper Indus may still bethe region where the changes have the largest impact on river run-off Compared tothe monsoon-dominated regions further east there is little summer precipitation and
466
TCD9 441ndash493 2015
Snowfall in theHimalayas an
uncertain future froma little-known past
E Viste and A Sorteberg
Title Page
Abstract Introduction
Conclusions References
Tables Figures
J I
J I
Back Close
Full Screen Esc
Printer-friendly Version
Interactive Discussion
Discussion
Paper
|D
iscussionP
aper|
Discussion
Paper
|D
iscussionP
aper|
much of the water in the rivers during summer is meltwater (Bookhagen and Burbank2010 Immerzeel et al 2010) As melting of snow and ice has not been analyzed inthis study we cannot quantify the effect of reduced snowmelt om river run-off but it isobvious that eventually reduced snowfall will lead to reduced melting In western partsof the HKH this may lead to changes in the seasonal cycle of the river flow5
As pointed out by Wiltshire (2014) increasing precipitation in the eastern HKH im-plies that water resources are likely to increase with climate change As snowfall andsnowmelt are both at maximum during summer (Rees and Collins 2006) meltwaterdoes not have the same importance for river flow in dry parts of the year as in the In-dus Reduced snowfall may reduce glaciers but ndash not considering potential changes in10
the amount of evaporation ndash there is no indication that there will be less water comingfrom the upper Brahmaputra
5 Concluding summary
In this study we have presented a suite of estimates of present-day snowfall in theIndus Ganges and Brahmaputra Basins and the changes in snowfall that would follow15
from CMIP5 projected changes in temperature and precipitation from 1971ndash2000 to2071ndash2100 The results show that if the temperature increases as much as in the RCP85 there will be much less snowfall despite increasing precipitation in most of theregion Limiting anthropogenic forcing to the RCP 26 level would still cause reductionsthough smaller20
Estimates of present-day snowfall based on a combination of temperature and pre-cipitation from reanalysis data and observations vary by factors of 2ndash4 The MERRAreanalysis gives higher estimates than TRMM 3B42 CRU TS and APHRODITE butthe spread is also large between the estimates based on the different observationallybased data sets This demonstrates the difficulties in assessing vulnerability to climate25
change in the region With limited knowledge of the current state future conditions arebound to be uncertain
467
TCD9 441ndash493 2015
Snowfall in theHimalayas an
uncertain future froma little-known past
E Viste and A Sorteberg
Title Page
Abstract Introduction
Conclusions References
Tables Figures
J I
J I
Back Close
Full Screen Esc
Printer-friendly Version
Interactive Discussion
Discussion
Paper
|D
iscussionP
aper|
Discussion
Paper
|D
iscussionP
aper|
Future changes in temperature and precipitation projected by climate models can stillprovide an indication of the relative change in snowfall With the RCP 85 the climatemodels project mean reductions in annual snowfall by 30ndash50 in the Indus Basin 50ndash60 in the Ganges Basin and 50ndash70 in the Brahmaputra Basin by 2071ndash2100 Withthe RCP 26 the corresponding reductions would be 10ndash20 in the Indus about 20 5
in the Ganges and 20ndash30 in the Brahmaputra The reductions are due to increasingtemperatures as the mean of the models show constant or increasing precipitationthroughout the year in most of the region
How much increasing temperatures reduce snowfall in a region depends on howmuch of the terrain that is below and above the freezing point today and on whether10
the terrain profile is such that the temperature increase transforms large areas fromsnow to rain zones With the RCP 85 the mean elevation where rain changes to snowndash the rainsnow line ndash creeps upward by 400ndash900 m in most of the region by 700ndash900 m
The largest relative change in snowfall is seen in the upper westernmost sub-basins15
of the Brahmaputra despite increasing precipitation and the lowest rainsnow line el-evation change (400ndash500 m) This is because a major part of this region is near thefreezing point today With the RCP 85 most of this region will have temperaturesabove freezing especially in the summer which is the wettest part of the year Theprojected reduction in annual snowfall is 65ndash75 20
In the upper Indus the effect of a warmer climate on snowfall is less extreme asmost of the terrain is high enough to have temperatures sufficiently far below freezingtoday Winter and spring brings most of the precipitation and the projected 600ndash800 mchange in the rainsnow line elevation during these seasons would leave most of theterrain below the freezing point Still a 20ndash40 reduction in annual snowfall is pro-25
jected with the RCP 85The range of our estimates of present-day snowfall illustrates how little that is known
about conditions that influence the availability of drinking water in some of the mostdensely populated parts of the world There is both a scientific and a societal need
468
TCD9 441ndash493 2015
Snowfall in theHimalayas an
uncertain future froma little-known past
E Viste and A Sorteberg
Title Page
Abstract Introduction
Conclusions References
Tables Figures
J I
J I
Back Close
Full Screen Esc
Printer-friendly Version
Interactive Discussion
Discussion
Paper
|D
iscussionP
aper|
Discussion
Paper
|D
iscussionP
aper|
for more information about precipitation in the HKH As a full-scale long-time observa-tional program covering all parts of the Himalayan range is not a likely possibility theonly hope for improved future knowledge of Himalayan snowfall lies in the improvementof satellite data and regional climate models
The Supplement related to this article is available online at5
doi105194tcd-9-441-2015-supplement
Acknowledgements This work has been carried out with support from the University of Bergenthe NORINDIA and SNOWHIM projects funded by The Research Council of Norway and theCentre for Climate Dynamics at the Bjerknes Centre for Climate Research We acknowledgethe World Climate Research Programmersquos Working Group on Coupled Modelling which is re-10
sponsible for CMIP and we thank the climate modeling groups listed in Table 3 of this paper forproducing and making available their model output For CMIP the US Department of EnergyrsquosProgram for Climate Model Diagnosis and Intercomparison provides coordinating support andled development of software infrastructure in partnership with the Global Organization for EarthSystem Science Portals15
References
Akhtar M Ahmad N and Booij M J The impact of climate change on the water resourcesof Hindukush-Karakorum-Himalaya region under different glacier coverage scenarios J Hy-drol 355 148ndash163 2008
Anders A M Roe G H Hallet B Montgomery D R Finnegan N J and Putkonen J20
Spatial patterns of precipitation and topography in the Himalaya in Tectonics Climate andLandscape Evolution Geological Society of America Special Paper edited by Willett S DHovius N Brandon M T and Fisher D Geological Society of America Boulder CO USA39ndash53 2006
469
TCD9 441ndash493 2015
Snowfall in theHimalayas an
uncertain future froma little-known past
E Viste and A Sorteberg
Title Page
Abstract Introduction
Conclusions References
Tables Figures
J I
J I
Back Close
Full Screen Esc
Printer-friendly Version
Interactive Discussion
Discussion
Paper
|D
iscussionP
aper|
Discussion
Paper
|D
iscussionP
aper|
Archer DR and Fowler HJ Spatial and temporal variations in precipitation in the UpperIndus Basin global teleconnections and hydrological implications Hydrol Earth Syst Sci8 47ndash61 doi105194hess-8-47-2004 2004
Bhutiyani M R Kale V S and Pawar N J Long-term trends in maximum minimum andmean annual air temperatures across the Northwestern Himalaya during the twentieth cen-5
tury Climatic Change 85 159ndash177 doi101007s10584-006-9196-1 2007Bhutiyani M R Kale V S and Pawar N J Climate change and the precipitation variations in
the northwestern Himalaya 1866ndash2006 Int J Climatol 30 535ndash548 doi101002joc19202010
Bookhagen B and Burbank D W Topography relief and TRMM-derived rainfall variations10
along the Himalaya Geophys Res Lett 33 L08405 doi1010292006GL026037 2006Bookhagen B and Burbank D W Toward a complete Himalayan hydrological budget spa-
tiotemporal distribution of snowmelt and rainfall and their impact on river discharge J Geo-phys Res 115 F03019 doi1010292009jf001426 2010
Franco B Fettweis X and Erpicum M Future projections of the Greenland ice sheet energy15
balance driving the surface melt The Cryosphere 7 1ndash18 doi105194tc-7-1-2013 2013Butt M J Characteristics of snow cover in the Hindukush Karakoram and Himalaya region
using Landsat satellite data Hydrol Process 10 3689ndash3698 doi101002hyp8375 2012Byun K and Choi M Uncertainty of snow water equivalent retrieved from AMSR-E brightness
temperature in northeast Asia Hydrol Process 28 12 doi101002hyp9846 201420
Chaturvedi R K Joshi J Jayaraman M Bala G and Ravindranath N H Multi-modelclimate change projections for India under representative concentration pathways Curr SciIndia 103 791ndash802 2012
Christensen J H Krishna Kumar K Aldrian E An S-I Cavalcanti I F A Castro Md Dong W Goswami P Hall A Kanyanga J K Kitoh A Kossin J Lau N-C Ren-25
wick J Stephenson D B Xie S-P and Zhou T Climate phenomena and their relevancefor future regional climate change in Climate Change 2013 The Physical Science BasisContribution of Working Group I to the Fifth Assessment Report of the Intergovernmen-tal Panel on Climate Change edited by Stocker T F Qin D Plattner G-K Tignor MAllen S K Boschung J Nauels A Xia Y Bex V and Midgley P M Cambridge Univer-30
sity Press Cambridge UK and New York NY USA 92 2013Collins M Knutti R Arblaster J Dufresne J-L Fichefet T Friedlingstein P Gao X
Gutowski W J Johns T Krinner G Shongwe M Tebaldi C Weaver A J and
470
TCD9 441ndash493 2015
Snowfall in theHimalayas an
uncertain future froma little-known past
E Viste and A Sorteberg
Title Page
Abstract Introduction
Conclusions References
Tables Figures
J I
J I
Back Close
Full Screen Esc
Printer-friendly Version
Interactive Discussion
Discussion
Paper
|D
iscussionP
aper|
Discussion
Paper
|D
iscussionP
aper|
Wehner M Long-term climate change projections commitments and irreversibility in Cli-mate Change 2013 The Physical Science Basis Contribution of Working Group I to theFifth Assessment Report of the Intergovernmental Panel on Climate Change edited byStocker T F Qin D Plattner G-K Tignor M Allen S K Boschung J Nauels AXia Y Bex V and Midgley P M Cambridge University Press Cambridge UK and New5
York NY USA 108 2013Cook E R Palmer J G Ahmed M Woodhouse C A Fenwick P Zafar M U Wahab M
and Khan N Five centuries of Upper Indus River flow from tree rings J Hydrol 486 365ndash375 doi101016jjhydrol201302004 2013
Dai A Temperature and pressure dependence of the rain-snow phase transition over land and10
ocean Geophys Res Lett 35 L12802 doi1010292008gl033295 2008Fowler H J and Archer D R Conflicting signals of climatic change in the Upper Indus Basin
J Climate 19 4276ndash4293 doi101175jcli38601 2006Gao J Williams M W Fu X Wang G and Gong T Spatiotemporal distribution of snow
in eastern Tibet and the response to climate change Remote Sens Environ 121 1ndash915
doi101016jrse201201006 2012Gardelle J Berthier E and Arnaud Y Slight mass gain of Karakoram glaciers in the
early twenty-first century ndash Supplement Nature Geosci 5 322ndash325 doi101038ngeo14502012
Guhathakurta P and Rajeevan M Trends in the rainfall pattern over India Int J Climatol20
28 1453ndash1469 doi101002joc1640 2008Harris I Jones P D Osborn T J and Lister D H Updated high-resolution grids of
monthly climatic observations ndash the CRU TS310 Dataset Int J Climatol 34 623ndash642doi101002joc3711 2014
Hartmann H and Andresky L Flooding in the Indus River basin ndash a spa-25
tiotemporal analysis of precipitation records Global Planet Change 107 25ndash35doi101016jgloplacha201304002 2013
Hastings D and Dunbar P Development amp Assessment of the Global Land One-km BaseElevation Digital Elevation Model (GLOBE) ISPRS Commission IV Symposium on GIS ndashBetween Visions and Applications Stuttgart Germany 7ndash10 September 199830
Hewitt K The Karakoram anomaly Glacier expansion and the ldquoelevation ef-fectrdquo Karakoram Himalaya Mt Res Dev 25 332ndash340 doi1016590276-4741(2005)025[0332TKAGEA]20CO2 2005
471
TCD9 441ndash493 2015
Snowfall in theHimalayas an
uncertain future froma little-known past
E Viste and A Sorteberg
Title Page
Abstract Introduction
Conclusions References
Tables Figures
J I
J I
Back Close
Full Screen Esc
Printer-friendly Version
Interactive Discussion
Discussion
Paper
|D
iscussionP
aper|
Discussion
Paper
|D
iscussionP
aper|
Huffman G J Adler R F Bolvin D T Gu G Nelkin E J Bowman K P Hong YStocker E F and Wolff D B The TRMM Multisatellite Precipitation Analysis (TMPA) quasi-global multiyear combined-sensor precipitation estimates at fine scales J Hydrometeorol8 38ndash55 2007
Immerzeel W Historical trends and future predictions of climate variability in the Brahmaputra5
basin Int J Climatol 28 243ndash254 doi101002joc1528 2008Immerzeel W W Droogers P de Jong S M and Bierkens M F P Large-scale monitoring
of snow cover and runoff simulation in Himalayan river basins using remote sensing RemoteSens Environ 113 40ndash49 doi101016jrse200808010 2009
Immerzeel W W van Beek L P H and Bierkens M F P Climate change will affect the10
asian water towers Science 328 1382ndash1385 doi101126science1183188 2010Ines A V M and Hansen J W Bias correction of daily GCM rainfall for crop simulation
studies Agr Forest Meteorol 138 44ndash53 doi101016jagrformet200603009 2006Jain S K Goswami A and Saraf A K Role of elevation and aspect in snow distribution
in western Himalaya Water Resour Manag 23 71ndash83 doi101007s11269-008-9265-515
2009Krakauer N Pradhanang S Lakhankar T and Jha A Evaluating satellite products for
precipitation estimation in mountain regions a case study for Nepal Remote Sensing 54107ndash4123 2013
Krishna A P Snow and glacier cover assessment in the high mountains of Sikkim Himalaya20
Hydrol Process 19 2375ndash2383 doi101002hyp5890 2005Kulkarni A V Rathore B P Singh S K and Ajai Distribution of seasonal snow cover in cen-
tral and western Himalaya Ann Glaciol 51 123ndash128 doi1031891727564107913864452010
Kumar V Rao Y S Venkataraman G Sarwade R N and Mani S Analysis of Aqua25
AMSR-E Derived Snow Water Equivalent over Himalayan Snow Covered Regions Geo-science and Remote Sensing Symposium Denver CO USA 31 Julyndash4 August 2006
Kaumlaumlb A Berthier E Nuth C Gardelle J and Arnaud Y Contrasting patterns of earlytwenty-first-century glacier mass change in the Himalayas Nature 488 495ndash498 availableat httpwwwnaturecomnaturejournalv488n7412absnature11324html ndash Supplement30
2012Lehner B Verdin K and Jarvis A New global hydrography derived from spaceborne eleva-
tion data Eos T Am Geophys Un 89 93ndash94 doi1010292008EO100001 2008
472
TCD9 441ndash493 2015
Snowfall in theHimalayas an
uncertain future froma little-known past
E Viste and A Sorteberg
Title Page
Abstract Introduction
Conclusions References
Tables Figures
J I
J I
Back Close
Full Screen Esc
Printer-friendly Version
Interactive Discussion
Discussion
Paper
|D
iscussionP
aper|
Discussion
Paper
|D
iscussionP
aper|
MacQueen J Some Methods for Classification and Analysis of Multivariate ObservationsFifth Berkeley Symposium on Mathematical Statistics and Probability Berkeley California21 Junendash18 July 1967
Meacuteneacutegoz M Galleacutee H and Jacobi H W Precipitation and snow cover in the Himalayafrom reanalysis to regional climate simulations Hydrol Earth Syst Sci 17 3921ndash39365
doi105194hess-17-3921-2013 2013Menon A Levermann A Schewe J Lehmann J and Frieler K Consistent increase in
Indian monsoon rainfall and its variability across CMIP-5 models Earth Syst Dynam 4287ndash300 doi105194esd-4-287-2013 2013
Moss R H Edmonds J A Hibbard K A Manning M R Rose S K van Vuuren D P10
Carter T R Emori S Kainuma M Kram T Meehl G A Mitchell J F B Naki-cenovic N Riahi K Smith S J Stouffer R J Thomson A M Weyant J P andWilbanks T J The next generation of scenarios for climate change research and assess-ment Nature 463 747ndash756 2010
Negi H S Kulkarni A V and Semwal B S Estimation of snow cover distribution in Beas15
basin Indian Himalaya using satellite data and ground measurements J Earth Syst Sci118 525ndash538 doi101007s12040-009-0039-0 2009
Palazzi E v Hardenberg J and Provenzale A Precipitation in the Hindu-Kush Karako-ram Himalaya observations and future scenarios J Geophys Res-Atmos 118 85ndash100doi1010292012JD018697 201320
Rees H G and Collins D N Regional differences in response of flow in glacier-fed Himalayanrivers to climatic warming Hydrol Process 20 2157ndash2169 doi101002hyp6209 2006
Rienecker M M Suarez M J Gelaro R Todling R Bacmeister J Liu EBosilovich M G Schubert S D Takacs L Kim G-K Bloom S Chen J Collins DConaty A da Silva A Gu W Joiner J Koster R D Lucchesi R Molod A Owens T25
Pawson S Pegion P Redder C R Reichle R Robertson F R Ruddick A GSienkiewicz M and Woollen J MERRA NASArsquos Modern-Era Retrospective Analysis forResearch and Applications J Climate 24 3624ndash3648 doi101175JCLI-D-11-0001512011
Rikiishi K and Nakasato H Height dependence of the tendency for reduction in seasonal30
snow cover in the Himalaya and the Tibetan Plateau region 1966ndash2001 Ann Glaciol 43369ndash377 doi103189172756406781811989 2006
473
TCD9 441ndash493 2015
Snowfall in theHimalayas an
uncertain future froma little-known past
E Viste and A Sorteberg
Title Page
Abstract Introduction
Conclusions References
Tables Figures
J I
J I
Back Close
Full Screen Esc
Printer-friendly Version
Interactive Discussion
Discussion
Paper
|D
iscussionP
aper|
Discussion
Paper
|D
iscussionP
aper|
Raumlisaumlnen J Warmer climate less or more snow Clim Dynam 30 307ndash319doi101007s00382-007-0289-y 2008
Schaner N Voisin N Nijssen B and Lettenmaier D P The contribution of glacier melt tostreamflow Environ Res Lett 7 034029 doi1010881748-932673034029 2012
Scherler D Bookhagen B and Strecker M R Spatially variable response of Himalayan5
glaciers to climate change affected by debris cover Nature Geosci 4 156ndash159 availableat httpwwwnaturecomngeojournalv4n3absngeo1068html ndash Supplement 2011
Sharif M Archer D R Fowler H J and Forsythe N Trends in timing and magnitude offlow in the Upper Indus Basin Hydrol Earth Syst Sci 17 1503ndash1516 doi105194hess-17-1503-2013 201310
Shekhar M S Chand H Kumar S Srinivasan K and Ganju A Climate-change studiesin the western Himalaya Ann Glaciol 51 105ndash112 doi1031891727564107913865082010
Shrestha A B Wake C P Mayewski P A and Dibb J E Maximum tempera-ture trends in the Himalaya and its vicinity an analysis based on temperature records15
from Nepal for the period 1971ndash94 J Climate 12 2775ndash2786 doi1011751520-0442(1999)012lt2775MTTITHgt20CO2 1999
Shrestha A B Wake C P Dibb J E and Mayewski P A Precipitation fluctuations in theNepal Himalaya and its vicinity and relationship with some large scale climatological parame-ters Int J Climatol 20 317ndash327 doi101002(SICI)1097-0088(20000315)203lt317AID-20
JOC476gt30CO2-G 2000Siderius C Biemans H Wiltshire A Rao S Franssen W H P Kumar P Gosain A K
van Vliet M T H and Collins D N Snowmelt contributions to discharge of the GangesSci Total Environ Supplement 468ndash469 9 doi101016jscitotenv201305084 2013
Singh P Jain S K and Kumar N Estimation of snow and glacier-melt contribution to the25
Chenab River Western Himalaya Mt Res Dev 17 49ndash56 doi1023073673913 1997Singh P Kumar V Thomas T and Arora M Changes in rainfall and relative hu-
midity in river basins in northwest and central India Hydrol Process 22 2982ndash2992doi101002hyp6871 2008
Sontakke N A Singh N and Singh H N Instrumental period rainfall series of the Indian30
region (AD 1813ndash2005) revised reconstruction update and analysis Holocene 18 1055ndash1066 doi1011770959683608095576 2008
474
TCD9 441ndash493 2015
Snowfall in theHimalayas an
uncertain future froma little-known past
E Viste and A Sorteberg
Title Page
Abstract Introduction
Conclusions References
Tables Figures
J I
J I
Back Close
Full Screen Esc
Printer-friendly Version
Interactive Discussion
Discussion
Paper
|D
iscussionP
aper|
Discussion
Paper
|D
iscussionP
aper|
Sperber K R Annamalai H Kang I S Kitoh A Moise A Turner A Wang B andZhou T The Asian summer monsoon an intercomparison of CMIP5 vs CMIP3 simulationsof the late 20th century Clim Dynam 41 2711ndash2744 doi101007s00382-012-1607-62013
Tahir A A Chevallier P Arnaud Y and Ahmad B Snow cover dynamics and hydrological5
regime of the Hunza River basin Karakoram Range Northern Pakistan Hydrol Earth SystSci 15 2275ndash2290 doi105194hess-15-2275-2011 2011a
Tahir A A Chevallier P Arnaud Y Neppel L and Ahmad B Modeling snowmelt-runoffunder climate scenarios in the Hunza River basin Karakoram Range Northern Pakistan JHydrol 409 104ndash117 doi101016jjhydrol201108035 2011b10
Taylor K E Stouffer R J and Meehl G A An overview of CMIP5 and the experimentdesign B Am Meteorol Soc 93 14 doi101175BAMS-D-11-000941 2011
Tedesco M and Narvekar P S Assessment of the NASA AMSR-E SWE product IEEE J SelTop Appl 3 141ndash159 doi101109JSTARS20102040462 2010
Teutschbein C and Seibert J Bias correction of regional climate model simulations for hydro-15
logical climate-change impact studies review and evaluation of different methods J Hydrol456ndash457 12ndash29 doi101016jjhydrol201205052 2012
Turner A G and Annamalai H Climate change and the South Asian summer monsoon NatClim Change 2 587ndash595 2012
van Vuuren D Edmonds J Kainuma M Riahi K Thomson A Hibbard K Hurtt G20
Kram T Krey V Lamarque J-F Masui T Meinshausen M Nakicenovic N Smith Sand Rose S The representative concentration pathways an overview Climatic Change109 26 doi101007s10584-011-0148-z 2011
Wang A and Zeng X Development of global hourly 05-degree land surface air temperaturedatasets J Climate 26 7676ndash7691 doi101175JCLI-D-12-006821 201325
Wiltshire A J Climate change implications for the glaciers of the Hindu Kush Karakoram andHimalayan region The Cryosphere 8 941ndash958 doi105194tc-8-941-2014 2014
Winiger M Gumpert M and Yamout H KarakorumndashHindukushndashwestern Himalaya assess-ing high-altitude water resources Hydrol Process 19 2329ndash2338 doi101002hyp5887200530
Xu X Lu C Shi X and Gao S World water tower An atmospheric perspective GeophysRes Lett 35 L20815 doi1010292008GL035867 2008a
475
TCD9 441ndash493 2015
Snowfall in theHimalayas an
uncertain future froma little-known past
E Viste and A Sorteberg
Title Page
Abstract Introduction
Conclusions References
Tables Figures
J I
J I
Back Close
Full Screen Esc
Printer-friendly Version
Interactive Discussion
Discussion
Paper
|D
iscussionP
aper|
Discussion
Paper
|D
iscussionP
aper|
Xu Z X Gong T L and Li J Y Decadal trend of climate in the Tibetan Plateaumdashregionaltemperature and precipitation Hydrol Process 22 3056ndash3065 doi101002hyp68922008b
Yasutomi N Hamada A and Akiyo Y Development of a Long-term Daily Gridded Temper-ature Dataset and its Application to RainSnow Discrimination of Daily Precipitation Global5
Environ Res15 165ndash172 2011Yatagai A Kamiguchi K Arakawa O Hamada A Yasutomi N and Kitoh A APHRODITE
Constructing a Long-Term Daily Gridded Precipitation Dataset for Asia Based on a DenseNetwork of Rain Gauges B Am Meteorol Soc 93 1401ndash1415 doi101175BAMS-D-11-001221 201210
You Q Kang S Aguilar E and Yan Y Changes in daily climate extremes in the east-ern and central Tibetan Plateau during 1961ndash2005 J Geophys Res-Atmos 113 D07101doi1010292007JD009389 2008
476
TCD9 441ndash493 2015
Snowfall in theHimalayas an
uncertain future froma little-known past
E Viste and A Sorteberg
Title Page
Abstract Introduction
Conclusions References
Tables Figures
J I
J I
Back Close
Full Screen Esc
Printer-friendly Version
Interactive Discussion
Discussion
Paper
|D
iscussionP
aper|
Discussion
Paper
|D
iscussionP
aper|
Table 1 Combinations of data types used in snowfall estimates T temperature P precipita-tion f (P T ) indicates that snowfall is calculated as a function of P and T
Precipitation Temperature Snowfall Time
MERRA MERRA PresentMERRA reference MERRA Terrain-adjusted MERRA f (P T ) PresentMERRA T2m MERRA MERRA T2m f (P T ) PresentBias-corrected with obs T MERRA Bias-corr terrain-adj MERRA f (P T ) PresentBias-corrected with obs P Bias-corr MERRA Terrain-adjusted MERRA f (P T ) PresentBias-corrected with obs T P Bias-corr MERRA Bias-corr terrain-adj MERRA f (P T ) PresentCMIP5 T MERRA Terrain-adj MERRA+∆T f (P T ) FutureCMIP5 P MERRAtimes∆P Terrain-adj MERRA f (P T ) FutureCMIP5 T P MERRAtimes∆P Terrain-adj MERRA+∆T f (P T ) FutureBias-corr CMIP5 T Bias-corr MERRA Bias-corr terrain-adj MERRA+∆T f (P T ) FutureBias-corr CMIP5 P Bias-corr MERRAtimes∆P Bias-corr terrain-adj MERRA f (P T ) FutureBias-corr CMIP5 T P Bias-corr MERRAtimes∆P Bias-corr terrain-adj MERRA+∆T f (P T ) Future
477
TCD9 441ndash493 2015
Snowfall in theHimalayas an
uncertain future froma little-known past
E Viste and A Sorteberg
Title Page
Abstract Introduction
Conclusions References
Tables Figures
J I
J I
Back Close
Full Screen Esc
Printer-friendly Version
Interactive Discussion
Discussion
Paper
|D
iscussionP
aper|
Discussion
Paper
|D
iscussionP
aper|
Table 2 Data sets used in calculations of present-day snowfall
Product Time Hor res Description
MERRA 1979ndash2012 05 lat 07 lon Hourly atmospheric reanalysis data(Rienecker et al 2011)
APHRODITEV1204V1101
1979ndash2007 025 Daily temperature andprecipitation basedon observations (Yatagai et al 2012Yasutomi et al 2011)
CRU TS 320 1979ndash2011 05 Monthly temperature and precipitationbased on observations(Harris et al 2014)
TRMM 3B42 V7 1998ndash2012 05 3 hourly satellite-based precipitation(Huffman et al 2007)
GLOBE 1 km Topography data set(Hastings and Dunbar 1998)
478
TCD9 441ndash493 2015
Snowfall in theHimalayas an
uncertain future froma little-known past
E Viste and A Sorteberg
Title Page
Abstract Introduction
Conclusions References
Tables Figures
J I
J I
Back Close
Full Screen Esc
Printer-friendly Version
Interactive Discussion
Discussion
Paper
|D
iscussionP
aper|
Discussion
Paper
|D
iscussionP
aper|
Table 3 CMIP5 models and RCPs used (x) in calculations of 2071ndash2100 snowfall
Model RCP 26 RCP 85
CanESM2 x xCCSM4 x xCESM1-CAM5 xCNRM-CM5 xGFDL-CM3 x xGFDL-ESM2G xGISS-E2-R x xHadGEM2-ES x xIPSL-CM5A-LR x xIPSL-CM5A-MR x xMIROC-ESM x xMIROC-ESM-CHEM x xMIROC5 x xMRI-CGCM3 x xNorESM1-M x xNorESM1-ME x x
479
TCD9 441ndash493 2015
Snowfall in theHimalayas an
uncertain future froma little-known past
E Viste and A Sorteberg
Title Page
Abstract Introduction
Conclusions References
Tables Figures
J I
J I
Back Close
Full Screen Esc
Printer-friendly Version
Interactive Discussion
Discussion
Paper
|D
iscussionP
aper|
Discussion
Paper
|D
iscussionP
aper|
Table 4 Annual snowfall estimates for the Indus Ganges and Brahmaputra Basins S snow[km3 SWE] P precipitation [km3] S and P percent of MERRA reference snowfall andMERRA precipitation First horizontal section no bias-corrections Second third and fourthsection bias-corrections with T P and both T and P
Indus Basin Ganges Basin Brahmaputra BasinInput S S P P S S P P S S P P
MERRA reference 148 100 422 100 54 100 1147 100 119 100 733 100MERRA 166 112 422 100 49 90 1147 100 129 109 733 100MERRA T2m 154 104 422 100 42 77 1147 100 109 92 733 100T APHRODITE 113 76 422 100 30 55 1147 100 74 62 733 100T CRU 126 85 422 100 81 151 1147 100 109 92 733 100P APHRODITE 66 44 315 75 22 42 1020 89 35 30 567 77P TRMM 72 49 404 96 31 57 1244 108 63 54 835 114P CRU 84 56 398 94 30 56 1100 96 53 45 716 98P T APHRODITE 49 33 315 75 12 22 1020 89 20 17 567 77P APHRODITE T CRU 62 42 315 75 34 63 1020 89 33 28 567 77P TRMM T APHRODITE 54 36 390 92 18 34 1195 104 39 33 815 111P TRMM T CRU 65 44 403 96 46 85 1254 109 58 49 813 111P CRU T APHRODITE 65 44 395 94 17 31 1106 96 31 26 718 98P T CRU 80 54 398 94 41 75 1100 96 49 42 716 98
480
TCD9 441ndash493 2015
Snowfall in theHimalayas an
uncertain future froma little-known past
E Viste and A Sorteberg
Title Page
Abstract Introduction
Conclusions References
Tables Figures
J I
J I
Back Close
Full Screen Esc
Printer-friendly Version
Interactive Discussion
Discussion
Paper
|D
iscussionP
aper|
Discussion
Paper
|D
iscussionP
aper|
Table 5 Projected change in annual snowfall from 1971ndash2000 to 2071ndash2100 with referenceto terrain-adjusted MERRA and APHRODITE ∆Sabs [km3] is the absolute change ∆Srel [] isthe relative change compared to the present-day MERRA reference snowfall Values are pre-sented with the CMIP5 multi-model mean as the main value and the span of individual modelsin brackets (MERRA only) ∆TP indicates that changes in both temperature and precipitationare included whereas ∆P and ∆T denotes changes only in precipitation or temperature re-spectively
Indus Ganges Brahmaputra∆Sabs [km3] ∆Srel [] ∆Sabs [km3] ∆Srel [] ∆Sabs [km3] ∆Srel []
RCP 85 MERRA ∆TP minus49 [minus83minus9] minus33 [minus56minus6] minus27 [minus36minus14] minus50 [minus66minus25] minus64 [minus93minus39] minus54 [minus79minus33]MERRA ∆T minus51 [minus67minus34] minus34 [minus45minus23] minus28 [minus34minus21] minus51 [minus64minus39] minus71 [minus87minus53] minus60 [minus73minus44]MERRA ∆P 5 [minus2544] 4 [minus1730] 7 [minus417] 12 [minus731] 20 [minus1750] 17 [minus1542]
APHRO ∆TP minus25 minus51 minus7 minus56 minus13 minus67APHRO ∆T minus25 minus52 minus7 minus57 minus14 minus71APHRO ∆P 1 1 1 6 3 16
RCP 26 MERRA ∆TP minus15 [minus406] minus10 [minus274] minus10 [minus19minus3] minus18 [minus36minus5] minus25 [minus42minus5] minus21 [minus35minus4]MERRA ∆T minus18 [minus27minus9] minus12 [minus18minus6] minus12 [minus21minus6] minus21 [minus39minus11] minus29 [minus47minus13] minus25 [minus40minus11]MERRA ∆P 3 [minus1825] 2 [minus1217] 3 [minus210] 5 [minus419] 7 [minus828] 6 [minus623]
APHRO ∆TP minus9 minus18 minus2 minus20 minus6 minus29APHRO ∆T minus10 minus19 minus3 minus23 minus6 minus32APHRO ∆P 1 1 0 4 1 6
481
TCD9 441ndash493 2015
Snowfall in theHimalayas an
uncertain future froma little-known past
E Viste and A Sorteberg
Title Page
Abstract Introduction
Conclusions References
Tables Figures
J I
J I
Back Close
Full Screen Esc
Printer-friendly Version
Interactive Discussion
Discussion
Paper
|D
iscussionP
aper|
Discussion
Paper
|D
iscussionP
aper|
Figure 1 Map of the region with the Indus Ganges and Brahmaputra basins outlined in whiteThinner outlines are national borders Background NASA Visible Earth
482
TCD9 441ndash493 2015
Snowfall in theHimalayas an
uncertain future froma little-known past
E Viste and A Sorteberg
Title Page
Abstract Introduction
Conclusions References
Tables Figures
J I
J I
Back Close
Full Screen Esc
Printer-friendly Version
Interactive Discussion
Discussion
Paper
|D
iscussionP
aper|
Discussion
Paper
|D
iscussionP
aper|
0
400 mm
Months 1ndash12
SP
I1
I2I3
I5I4
G1
G2G3
G4
B1
B2
B3B4
Viste amp SortebergFigure 2
Figure 2 Monthly mean MERRA precipitation and MERRA reference snowfall in sub-basinclusters of the Indus (I) Ganges (G) and Brahmaputra (B) Total bar height MERRA precip-itation (P) [mm] Colored bars snowfall (S) [mm SWE] based on MERRA precipitation andterrain-adjusted MERRA temperature in the region with the same color Cluster 1 in eachbasin is considered snow-free and the seasonal cycles are not shown
483
TCD9 441ndash493 2015
Snowfall in theHimalayas an
uncertain future froma little-known past
E Viste and A Sorteberg
Title Page
Abstract Introduction
Conclusions References
Tables Figures
J I
J I
Back Close
Full Screen Esc
Printer-friendly Version
Interactive Discussion
Discussion
Paper
|D
iscussionP
aper|
Discussion
Paper
|D
iscussionP
aper|
a) MERRA reference b) APHRODITE c) APHRODITE ndash MERRA ref
30 km3
20100-10-20-30
Viste amp SortebergFigure 3
Figure 3 The effect of bias-corrections with APHRODITE temperature and precipitation(a) MERRA reference snowfall (b) Snowfall based on bias-corrections with APHRODITE(c) APHRODITE (b) minus MERRA reference snowfall (a)
484
TCD9 441ndash493 2015
Snowfall in theHimalayas an
uncertain future froma little-known past
E Viste and A Sorteberg
Title Page
Abstract Introduction
Conclusions References
Tables Figures
J I
J I
Back Close
Full Screen Esc
Printer-friendly Version
Interactive Discussion
Discussion
Paper
|D
iscussionP
aper|
Discussion
Paper
|D
iscussionP
aper|
Figure 4 Difference between MERRA precipitation and observation-based data (a) Annualmean MERRA precipitation (b c and d) Annual mean MERRA precipitation bias-correctedwith observations APHRODITE CRU TS and TRMM 3B42 For each data set the small insetmaps show the observations minus MERRA
485
TCD9 441ndash493 2015
Snowfall in theHimalayas an
uncertain future froma little-known past
E Viste and A Sorteberg
Title Page
Abstract Introduction
Conclusions References
Tables Figures
J I
J I
Back Close
Full Screen Esc
Printer-friendly Version
Interactive Discussion
Discussion
Paper
|D
iscussionP
aper|
Discussion
Paper
|D
iscussionP
aper|
Biasminuscorrected minus original MERRA temperature [C]
minus15
minus10
minus5
0
5
10
Biasminuscorrected minus original MERRA temperature [C]
minus15
minus10
minus5
0
5
10
MERRA mean temperature [C] 1979minus2007
minus15
minus10
minus5
0
5
10
15
20
25
30a) MERRA b) APHRODITE ndash MERRA c) CRU ndash MERRA
-10
0
10
20
30degC
minus15
minus10
minus5
0
5
10
15degC
Viste amp SortebergFigure 5
Figure 5 Difference between MERRA temperature and observation-based data (a) Annualmean MERRA temperature (b and c) Annual mean MERRA temperature bias-corrected withobservations APHRODITE and CRU TS
486
TCD9 441ndash493 2015
Snowfall in theHimalayas an
uncertain future froma little-known past
E Viste and A Sorteberg
Title Page
Abstract Introduction
Conclusions References
Tables Figures
J I
J I
Back Close
Full Screen Esc
Printer-friendly Version
Interactive Discussion
Discussion
Paper
|D
iscussionP
aper|
Discussion
Paper
|D
iscussionP
aper|
Jan Apr
Jul Oct
a)
c)
b)
d)
15degC
10
5
0
ndash5
ndash10
ndash15
200 mm16012080400ndash40ndash80ndash120ndash160ndash200
Viste amp SortebergFigure 6
Figure 6 Regions where increasing temperatures are likely to cause a shift from snow to rainData monthly mean MERRA temperature terrain-adjusted to a 4 km GLOBE grid Red temper-ature between minus5 and 0 considered critical Small inset maps monthly MERRA precipitationin the critical zones
487
TCD9 441ndash493 2015
Snowfall in theHimalayas an
uncertain future froma little-known past
E Viste and A Sorteberg
Title Page
Abstract Introduction
Conclusions References
Tables Figures
J I
J I
Back Close
Full Screen Esc
Printer-friendly Version
Interactive Discussion
Discussion
Paper
|D
iscussionP
aper|
Discussion
Paper
|D
iscussionP
aper|
1 2 3 4 5 6 7 8 9 10 11 12Month
∆T [ordm
C]
a) Indus
0
1
2
3
4
5
6
7
8
9
10
b) Ganges∆T
[ordmC
]
1 2 3 4 5 6 7 8 9 10 11 12Month
1
2
3
4
5
6
7
8
0 0
c) Brahmaputra
∆T [ordm
C]
1 2 3 4 5 6 7 8 9 10 11 12Month
1
2
3
4
5
6
7
8
9
10 RCP 85RCP 85 meanRCP 26RCP 26 mean
Viste amp SortebergFigure 7
Figure 7 Projected future temperature change from 1971ndash2000 to 2071ndash2100 in the (a) In-dus (b) Ganges and (c) Brahmaputra Basins Thin lines show the individual CMIP5 modelsstronger lines the multi-model mean
488
TCD9 441ndash493 2015
Snowfall in theHimalayas an
uncertain future froma little-known past
E Viste and A Sorteberg
Title Page
Abstract Introduction
Conclusions References
Tables Figures
J I
J I
Back Close
Full Screen Esc
Printer-friendly Version
Interactive Discussion
Discussion
Paper
|D
iscussionP
aper|
Discussion
Paper
|D
iscussionP
aper|
1 2 3 4 5 6 7 8 9 10 11 12Month
[km
3 ]
a) Indus
0
20
40
60
80
100
120
140
b) Ganges[k
m3 ]
1 2 3 4 5 6 7 8 9 10 11 12Month
0
100
200
300
400
500
600
700
c) Brahmaputra
[km
3 ]
1 2 3 4 5 6 7 8 9 10 11 12Month
0
50
100
150
200
250
MERRA ref
2071ndash2100
1979ndash2008
RCP 85RCP 85 meanRCP 26RCP 26 mean
Viste amp SortebergFigure 8
Figure 8 Projected future precipitation in the (a) Indus (b) Ganges and (c) BrahmaputraBasins Gray bars MERRA 1979ndash2008 Thin lines and horizontal marks on the bars show theindividual CMIP5 models and the multi-model mean for 2071ndash2100
489
TCD9 441ndash493 2015
Snowfall in theHimalayas an
uncertain future froma little-known past
E Viste and A Sorteberg
Title Page
Abstract Introduction
Conclusions References
Tables Figures
J I
J I
Back Close
Full Screen Esc
Printer-friendly Version
Interactive Discussion
Discussion
Paper
|D
iscussionP
aper|
Discussion
Paper
|D
iscussionP
aper|
1 2 3 4 5 6 7 8 9 10 11 120
5
10
15
20
25
30
35
Month
SWE
[km
3 ]
a) Indus
0
1
2
3
4
5
6
7
8
b) Ganges
SWE
[km
3 ]
1 2 3 4 5 6 7 8 9 10 11 12Month
0
2
4
6
8
10
12
14
16
18
20
c) Brahmaputra
SWE
[km
3 ]
1 2 3 4 5 6 7 8 9 10 11 12Month
MERRA ref
2071ndash2100
1979ndash2008
RCP 85RCP 85 meanRCP 26RCP 26 mean
Viste amp SortebergFigure 9
Figure 9 Projected future snowfall in the (a) Indus (b) Ganges and (c) Brahmaputra Basinswith reference to MERRA reference snowfall Gray bars MERRA reference snowfall for 1979ndash2008 Thin lines and horizontal marks on the bars show the individual CMIP5 models andthe multi-model mean for 2071ndash2100 based on changes in temperature and precipitation asdescribed in Sect 23
490
TCD9 441ndash493 2015
Snowfall in theHimalayas an
uncertain future froma little-known past
E Viste and A Sorteberg
Title Page
Abstract Introduction
Conclusions References
Tables Figures
J I
J I
Back Close
Full Screen Esc
Printer-friendly Version
Interactive Discussion
Discussion
Paper
|D
iscussionP
aper|
Discussion
Paper
|D
iscussionP
aper|
Figure 10 Projected future changes in snowfall in sub-basins of the Indus Ganges andBrahmaputra Basins (a) Absolute change [km3] with reference to MERRA reference snow-fall (b) Absolute change [km3] with reference to APHRODITE snowfall (c d) Correspondingrelative changes [] with reference to MERRA and APHRODITE
491
TCD9 441ndash493 2015
Snowfall in theHimalayas an
uncertain future froma little-known past
E Viste and A Sorteberg
Title Page
Abstract Introduction
Conclusions References
Tables Figures
J I
J I
Back Close
Full Screen Esc
Printer-friendly Version
Interactive Discussion
Discussion
Paper
|D
iscussionP
aper|
Discussion
Paper
|D
iscussionP
aper|
J F M A M J J A S O N DMonth
0
5
10
15
20 km3Precip
0
2
4
6
8
10 km3SWE
2000
3000
4000
5000
6000 masl
1845
J F
M
A
M
JJ A
S
O
N
D
RSL
I4A = 146793 km2
1 km 3 = 68 mm
0
05
1
15 SWE rel
8000 m
0
J F M A M J J A S O N DMonth
0
2
4
6
8
10
12 km3 SWE
3000
4000
5000
6000 masl
78
2
14
J FM
A
MJ
J AS
O
ND
RSL
I5
Precip
0
5
10
15
20
25 km3
0
05
1
15 SWE rel
8000 m
0
A = 178669 km2
1 km 3 = 56 mm
CMIP52071ndash2100mean
Today
MERRA APHRODITE
Individual models
CMIP52071ndash2100mean
MERRA APHRODITE
Individual models
CMIP52071ndash2100Precip mean
MERRA APHRODITE
Individual models
SWE todayPrecip today
2000 mTerrain distribution of area between levels
CMIP52071ndash2100
TodayMERRA
APHRODITE
a)
i)
ii)
iii)
iv)
b)
Viste amp SortebergFigure 11
Figure 11 Monthly CMIP5 RCP 85 change in snowfall precipitation and rainsnow line eleva-tion in the upper Indus clusters (a) 4 and (b) 5 from 1971ndash2000 to 2071ndash2100 with referenceto the MERRA reference (red) and APHRODITE (blue) CMIP5 multi-model means are shownas horizontal marks individual models as dots Cluster location and terrain profile are shownabove the graphs (i) Fractional change in snowfall (ii) Future snowfall [km3] (dots) comparedto today (bars) (iii) Future precipitation [km3] (dots) compared to today (bars) Snowfall todayis shown as darker part of bars (iv) Rainsnow line elevation [m asl] Gray background el-evation histogram with the of total ground area lying in the marked 2000 m intervals Barschange from today (bottom) to CMIP5 multi-model mean (top)
492
TCD9 441ndash493 2015
Snowfall in theHimalayas an
uncertain future froma little-known past
E Viste and A Sorteberg
Title Page
Abstract Introduction
Conclusions References
Tables Figures
J I
J I
Back Close
Full Screen Esc
Printer-friendly Version
Interactive Discussion
Discussion
Paper
|D
iscussionP
aper|
Discussion
Paper
|D
iscussionP
aper|
3000
4000
5000
6000 masl
0
2
4
6
8
10 km3
0
10
20
30
40
50
60 km3
0
05
1
15
J F M A M J J A S O N DMonth
J FM
A
M
JJ A
S
O
ND
Precip
SWE
RSL
SWE rel
53
B3
8000 m
0
A = 139611 km2
1 km 3 = 72 mm
4500
5000
5500
6000
6500 masl
0
1
2
3
4 km3
0
10
20
30
40
50 km3
0
05
1
15 SWE rel
SWE
RSL
Precip
95
J F M A M J J A S O N DMonth
J FM
A
M
JJ A
S
ON
D
B4
8000 m
0
A = 159165 km2
1 km 3 = 63 mm
CMIP52071ndash2100mean
Today
MERRA APHRODITE
Individual models
CMIP52071ndash2100mean
MERRA APHRODITE
Individual models
CMIP52071ndash2100Precip mean
MERRA APHRODITE
Individual models
SWE todayPrecip today
2000 mTerrain distribution of area between levels
CMIP52071ndash2100
TodayMERRA
APHRODITE
a)
i)
ii)
iii)
iv)
b)
Viste amp SortebergFigure 12
Figure 12 Monthly CMIP5 RCP 85 change in snowfall precipitation and rainsnow line ele-vation in the upper Brahmaputra clusters (a) 4 and (b) 3 See Fig 11 for a description of thecontent
493
- Introduction
-
- Observed trends in snowfall temperature and precipitation
- Future projections of snowfall temperature and precipitation
- Aims and scope
-
- Data and methods
-
- Reference present-day snowfall
- Bias-corrected present-day snowfall
- Projected snowfall
- The rain-snow line
-
- Present-day snowfall
-
- Seasonal cycles of precipitation and snowfall
- Comparison of snowfall estimates
-
- Projected future snowfall
-
- Basin-scale projections
- Regional projections
-
- Upper Indus western part
- Upper Indus eastern part
- Upper Brahmaputra western part
- Upper Brahmaputra eastern part
-
- Potential effects of reduced snowfall on water availability
-
- Concluding summary
-
TCD9 441ndash493 2015
Snowfall in theHimalayas an
uncertain future froma little-known past
E Viste and A Sorteberg
Title Page
Abstract Introduction
Conclusions References
Tables Figures
J I
J I
Back Close
Full Screen Esc
Printer-friendly Version
Interactive Discussion
Discussion
Paper
|D
iscussionP
aper|
Discussion
Paper
|D
iscussionP
aper|
much of the water in the rivers during summer is meltwater (Bookhagen and Burbank2010 Immerzeel et al 2010) As melting of snow and ice has not been analyzed inthis study we cannot quantify the effect of reduced snowmelt om river run-off but it isobvious that eventually reduced snowfall will lead to reduced melting In western partsof the HKH this may lead to changes in the seasonal cycle of the river flow5
As pointed out by Wiltshire (2014) increasing precipitation in the eastern HKH im-plies that water resources are likely to increase with climate change As snowfall andsnowmelt are both at maximum during summer (Rees and Collins 2006) meltwaterdoes not have the same importance for river flow in dry parts of the year as in the In-dus Reduced snowfall may reduce glaciers but ndash not considering potential changes in10
the amount of evaporation ndash there is no indication that there will be less water comingfrom the upper Brahmaputra
5 Concluding summary
In this study we have presented a suite of estimates of present-day snowfall in theIndus Ganges and Brahmaputra Basins and the changes in snowfall that would follow15
from CMIP5 projected changes in temperature and precipitation from 1971ndash2000 to2071ndash2100 The results show that if the temperature increases as much as in the RCP85 there will be much less snowfall despite increasing precipitation in most of theregion Limiting anthropogenic forcing to the RCP 26 level would still cause reductionsthough smaller20
Estimates of present-day snowfall based on a combination of temperature and pre-cipitation from reanalysis data and observations vary by factors of 2ndash4 The MERRAreanalysis gives higher estimates than TRMM 3B42 CRU TS and APHRODITE butthe spread is also large between the estimates based on the different observationallybased data sets This demonstrates the difficulties in assessing vulnerability to climate25
change in the region With limited knowledge of the current state future conditions arebound to be uncertain
467
TCD9 441ndash493 2015
Snowfall in theHimalayas an
uncertain future froma little-known past
E Viste and A Sorteberg
Title Page
Abstract Introduction
Conclusions References
Tables Figures
J I
J I
Back Close
Full Screen Esc
Printer-friendly Version
Interactive Discussion
Discussion
Paper
|D
iscussionP
aper|
Discussion
Paper
|D
iscussionP
aper|
Future changes in temperature and precipitation projected by climate models can stillprovide an indication of the relative change in snowfall With the RCP 85 the climatemodels project mean reductions in annual snowfall by 30ndash50 in the Indus Basin 50ndash60 in the Ganges Basin and 50ndash70 in the Brahmaputra Basin by 2071ndash2100 Withthe RCP 26 the corresponding reductions would be 10ndash20 in the Indus about 20 5
in the Ganges and 20ndash30 in the Brahmaputra The reductions are due to increasingtemperatures as the mean of the models show constant or increasing precipitationthroughout the year in most of the region
How much increasing temperatures reduce snowfall in a region depends on howmuch of the terrain that is below and above the freezing point today and on whether10
the terrain profile is such that the temperature increase transforms large areas fromsnow to rain zones With the RCP 85 the mean elevation where rain changes to snowndash the rainsnow line ndash creeps upward by 400ndash900 m in most of the region by 700ndash900 m
The largest relative change in snowfall is seen in the upper westernmost sub-basins15
of the Brahmaputra despite increasing precipitation and the lowest rainsnow line el-evation change (400ndash500 m) This is because a major part of this region is near thefreezing point today With the RCP 85 most of this region will have temperaturesabove freezing especially in the summer which is the wettest part of the year Theprojected reduction in annual snowfall is 65ndash75 20
In the upper Indus the effect of a warmer climate on snowfall is less extreme asmost of the terrain is high enough to have temperatures sufficiently far below freezingtoday Winter and spring brings most of the precipitation and the projected 600ndash800 mchange in the rainsnow line elevation during these seasons would leave most of theterrain below the freezing point Still a 20ndash40 reduction in annual snowfall is pro-25
jected with the RCP 85The range of our estimates of present-day snowfall illustrates how little that is known
about conditions that influence the availability of drinking water in some of the mostdensely populated parts of the world There is both a scientific and a societal need
468
TCD9 441ndash493 2015
Snowfall in theHimalayas an
uncertain future froma little-known past
E Viste and A Sorteberg
Title Page
Abstract Introduction
Conclusions References
Tables Figures
J I
J I
Back Close
Full Screen Esc
Printer-friendly Version
Interactive Discussion
Discussion
Paper
|D
iscussionP
aper|
Discussion
Paper
|D
iscussionP
aper|
for more information about precipitation in the HKH As a full-scale long-time observa-tional program covering all parts of the Himalayan range is not a likely possibility theonly hope for improved future knowledge of Himalayan snowfall lies in the improvementof satellite data and regional climate models
The Supplement related to this article is available online at5
doi105194tcd-9-441-2015-supplement
Acknowledgements This work has been carried out with support from the University of Bergenthe NORINDIA and SNOWHIM projects funded by The Research Council of Norway and theCentre for Climate Dynamics at the Bjerknes Centre for Climate Research We acknowledgethe World Climate Research Programmersquos Working Group on Coupled Modelling which is re-10
sponsible for CMIP and we thank the climate modeling groups listed in Table 3 of this paper forproducing and making available their model output For CMIP the US Department of EnergyrsquosProgram for Climate Model Diagnosis and Intercomparison provides coordinating support andled development of software infrastructure in partnership with the Global Organization for EarthSystem Science Portals15
References
Akhtar M Ahmad N and Booij M J The impact of climate change on the water resourcesof Hindukush-Karakorum-Himalaya region under different glacier coverage scenarios J Hy-drol 355 148ndash163 2008
Anders A M Roe G H Hallet B Montgomery D R Finnegan N J and Putkonen J20
Spatial patterns of precipitation and topography in the Himalaya in Tectonics Climate andLandscape Evolution Geological Society of America Special Paper edited by Willett S DHovius N Brandon M T and Fisher D Geological Society of America Boulder CO USA39ndash53 2006
469
TCD9 441ndash493 2015
Snowfall in theHimalayas an
uncertain future froma little-known past
E Viste and A Sorteberg
Title Page
Abstract Introduction
Conclusions References
Tables Figures
J I
J I
Back Close
Full Screen Esc
Printer-friendly Version
Interactive Discussion
Discussion
Paper
|D
iscussionP
aper|
Discussion
Paper
|D
iscussionP
aper|
Archer DR and Fowler HJ Spatial and temporal variations in precipitation in the UpperIndus Basin global teleconnections and hydrological implications Hydrol Earth Syst Sci8 47ndash61 doi105194hess-8-47-2004 2004
Bhutiyani M R Kale V S and Pawar N J Long-term trends in maximum minimum andmean annual air temperatures across the Northwestern Himalaya during the twentieth cen-5
tury Climatic Change 85 159ndash177 doi101007s10584-006-9196-1 2007Bhutiyani M R Kale V S and Pawar N J Climate change and the precipitation variations in
the northwestern Himalaya 1866ndash2006 Int J Climatol 30 535ndash548 doi101002joc19202010
Bookhagen B and Burbank D W Topography relief and TRMM-derived rainfall variations10
along the Himalaya Geophys Res Lett 33 L08405 doi1010292006GL026037 2006Bookhagen B and Burbank D W Toward a complete Himalayan hydrological budget spa-
tiotemporal distribution of snowmelt and rainfall and their impact on river discharge J Geo-phys Res 115 F03019 doi1010292009jf001426 2010
Franco B Fettweis X and Erpicum M Future projections of the Greenland ice sheet energy15
balance driving the surface melt The Cryosphere 7 1ndash18 doi105194tc-7-1-2013 2013Butt M J Characteristics of snow cover in the Hindukush Karakoram and Himalaya region
using Landsat satellite data Hydrol Process 10 3689ndash3698 doi101002hyp8375 2012Byun K and Choi M Uncertainty of snow water equivalent retrieved from AMSR-E brightness
temperature in northeast Asia Hydrol Process 28 12 doi101002hyp9846 201420
Chaturvedi R K Joshi J Jayaraman M Bala G and Ravindranath N H Multi-modelclimate change projections for India under representative concentration pathways Curr SciIndia 103 791ndash802 2012
Christensen J H Krishna Kumar K Aldrian E An S-I Cavalcanti I F A Castro Md Dong W Goswami P Hall A Kanyanga J K Kitoh A Kossin J Lau N-C Ren-25
wick J Stephenson D B Xie S-P and Zhou T Climate phenomena and their relevancefor future regional climate change in Climate Change 2013 The Physical Science BasisContribution of Working Group I to the Fifth Assessment Report of the Intergovernmen-tal Panel on Climate Change edited by Stocker T F Qin D Plattner G-K Tignor MAllen S K Boschung J Nauels A Xia Y Bex V and Midgley P M Cambridge Univer-30
sity Press Cambridge UK and New York NY USA 92 2013Collins M Knutti R Arblaster J Dufresne J-L Fichefet T Friedlingstein P Gao X
Gutowski W J Johns T Krinner G Shongwe M Tebaldi C Weaver A J and
470
TCD9 441ndash493 2015
Snowfall in theHimalayas an
uncertain future froma little-known past
E Viste and A Sorteberg
Title Page
Abstract Introduction
Conclusions References
Tables Figures
J I
J I
Back Close
Full Screen Esc
Printer-friendly Version
Interactive Discussion
Discussion
Paper
|D
iscussionP
aper|
Discussion
Paper
|D
iscussionP
aper|
Wehner M Long-term climate change projections commitments and irreversibility in Cli-mate Change 2013 The Physical Science Basis Contribution of Working Group I to theFifth Assessment Report of the Intergovernmental Panel on Climate Change edited byStocker T F Qin D Plattner G-K Tignor M Allen S K Boschung J Nauels AXia Y Bex V and Midgley P M Cambridge University Press Cambridge UK and New5
York NY USA 108 2013Cook E R Palmer J G Ahmed M Woodhouse C A Fenwick P Zafar M U Wahab M
and Khan N Five centuries of Upper Indus River flow from tree rings J Hydrol 486 365ndash375 doi101016jjhydrol201302004 2013
Dai A Temperature and pressure dependence of the rain-snow phase transition over land and10
ocean Geophys Res Lett 35 L12802 doi1010292008gl033295 2008Fowler H J and Archer D R Conflicting signals of climatic change in the Upper Indus Basin
J Climate 19 4276ndash4293 doi101175jcli38601 2006Gao J Williams M W Fu X Wang G and Gong T Spatiotemporal distribution of snow
in eastern Tibet and the response to climate change Remote Sens Environ 121 1ndash915
doi101016jrse201201006 2012Gardelle J Berthier E and Arnaud Y Slight mass gain of Karakoram glaciers in the
early twenty-first century ndash Supplement Nature Geosci 5 322ndash325 doi101038ngeo14502012
Guhathakurta P and Rajeevan M Trends in the rainfall pattern over India Int J Climatol20
28 1453ndash1469 doi101002joc1640 2008Harris I Jones P D Osborn T J and Lister D H Updated high-resolution grids of
monthly climatic observations ndash the CRU TS310 Dataset Int J Climatol 34 623ndash642doi101002joc3711 2014
Hartmann H and Andresky L Flooding in the Indus River basin ndash a spa-25
tiotemporal analysis of precipitation records Global Planet Change 107 25ndash35doi101016jgloplacha201304002 2013
Hastings D and Dunbar P Development amp Assessment of the Global Land One-km BaseElevation Digital Elevation Model (GLOBE) ISPRS Commission IV Symposium on GIS ndashBetween Visions and Applications Stuttgart Germany 7ndash10 September 199830
Hewitt K The Karakoram anomaly Glacier expansion and the ldquoelevation ef-fectrdquo Karakoram Himalaya Mt Res Dev 25 332ndash340 doi1016590276-4741(2005)025[0332TKAGEA]20CO2 2005
471
TCD9 441ndash493 2015
Snowfall in theHimalayas an
uncertain future froma little-known past
E Viste and A Sorteberg
Title Page
Abstract Introduction
Conclusions References
Tables Figures
J I
J I
Back Close
Full Screen Esc
Printer-friendly Version
Interactive Discussion
Discussion
Paper
|D
iscussionP
aper|
Discussion
Paper
|D
iscussionP
aper|
Huffman G J Adler R F Bolvin D T Gu G Nelkin E J Bowman K P Hong YStocker E F and Wolff D B The TRMM Multisatellite Precipitation Analysis (TMPA) quasi-global multiyear combined-sensor precipitation estimates at fine scales J Hydrometeorol8 38ndash55 2007
Immerzeel W Historical trends and future predictions of climate variability in the Brahmaputra5
basin Int J Climatol 28 243ndash254 doi101002joc1528 2008Immerzeel W W Droogers P de Jong S M and Bierkens M F P Large-scale monitoring
of snow cover and runoff simulation in Himalayan river basins using remote sensing RemoteSens Environ 113 40ndash49 doi101016jrse200808010 2009
Immerzeel W W van Beek L P H and Bierkens M F P Climate change will affect the10
asian water towers Science 328 1382ndash1385 doi101126science1183188 2010Ines A V M and Hansen J W Bias correction of daily GCM rainfall for crop simulation
studies Agr Forest Meteorol 138 44ndash53 doi101016jagrformet200603009 2006Jain S K Goswami A and Saraf A K Role of elevation and aspect in snow distribution
in western Himalaya Water Resour Manag 23 71ndash83 doi101007s11269-008-9265-515
2009Krakauer N Pradhanang S Lakhankar T and Jha A Evaluating satellite products for
precipitation estimation in mountain regions a case study for Nepal Remote Sensing 54107ndash4123 2013
Krishna A P Snow and glacier cover assessment in the high mountains of Sikkim Himalaya20
Hydrol Process 19 2375ndash2383 doi101002hyp5890 2005Kulkarni A V Rathore B P Singh S K and Ajai Distribution of seasonal snow cover in cen-
tral and western Himalaya Ann Glaciol 51 123ndash128 doi1031891727564107913864452010
Kumar V Rao Y S Venkataraman G Sarwade R N and Mani S Analysis of Aqua25
AMSR-E Derived Snow Water Equivalent over Himalayan Snow Covered Regions Geo-science and Remote Sensing Symposium Denver CO USA 31 Julyndash4 August 2006
Kaumlaumlb A Berthier E Nuth C Gardelle J and Arnaud Y Contrasting patterns of earlytwenty-first-century glacier mass change in the Himalayas Nature 488 495ndash498 availableat httpwwwnaturecomnaturejournalv488n7412absnature11324html ndash Supplement30
2012Lehner B Verdin K and Jarvis A New global hydrography derived from spaceborne eleva-
tion data Eos T Am Geophys Un 89 93ndash94 doi1010292008EO100001 2008
472
TCD9 441ndash493 2015
Snowfall in theHimalayas an
uncertain future froma little-known past
E Viste and A Sorteberg
Title Page
Abstract Introduction
Conclusions References
Tables Figures
J I
J I
Back Close
Full Screen Esc
Printer-friendly Version
Interactive Discussion
Discussion
Paper
|D
iscussionP
aper|
Discussion
Paper
|D
iscussionP
aper|
MacQueen J Some Methods for Classification and Analysis of Multivariate ObservationsFifth Berkeley Symposium on Mathematical Statistics and Probability Berkeley California21 Junendash18 July 1967
Meacuteneacutegoz M Galleacutee H and Jacobi H W Precipitation and snow cover in the Himalayafrom reanalysis to regional climate simulations Hydrol Earth Syst Sci 17 3921ndash39365
doi105194hess-17-3921-2013 2013Menon A Levermann A Schewe J Lehmann J and Frieler K Consistent increase in
Indian monsoon rainfall and its variability across CMIP-5 models Earth Syst Dynam 4287ndash300 doi105194esd-4-287-2013 2013
Moss R H Edmonds J A Hibbard K A Manning M R Rose S K van Vuuren D P10
Carter T R Emori S Kainuma M Kram T Meehl G A Mitchell J F B Naki-cenovic N Riahi K Smith S J Stouffer R J Thomson A M Weyant J P andWilbanks T J The next generation of scenarios for climate change research and assess-ment Nature 463 747ndash756 2010
Negi H S Kulkarni A V and Semwal B S Estimation of snow cover distribution in Beas15
basin Indian Himalaya using satellite data and ground measurements J Earth Syst Sci118 525ndash538 doi101007s12040-009-0039-0 2009
Palazzi E v Hardenberg J and Provenzale A Precipitation in the Hindu-Kush Karako-ram Himalaya observations and future scenarios J Geophys Res-Atmos 118 85ndash100doi1010292012JD018697 201320
Rees H G and Collins D N Regional differences in response of flow in glacier-fed Himalayanrivers to climatic warming Hydrol Process 20 2157ndash2169 doi101002hyp6209 2006
Rienecker M M Suarez M J Gelaro R Todling R Bacmeister J Liu EBosilovich M G Schubert S D Takacs L Kim G-K Bloom S Chen J Collins DConaty A da Silva A Gu W Joiner J Koster R D Lucchesi R Molod A Owens T25
Pawson S Pegion P Redder C R Reichle R Robertson F R Ruddick A GSienkiewicz M and Woollen J MERRA NASArsquos Modern-Era Retrospective Analysis forResearch and Applications J Climate 24 3624ndash3648 doi101175JCLI-D-11-0001512011
Rikiishi K and Nakasato H Height dependence of the tendency for reduction in seasonal30
snow cover in the Himalaya and the Tibetan Plateau region 1966ndash2001 Ann Glaciol 43369ndash377 doi103189172756406781811989 2006
473
TCD9 441ndash493 2015
Snowfall in theHimalayas an
uncertain future froma little-known past
E Viste and A Sorteberg
Title Page
Abstract Introduction
Conclusions References
Tables Figures
J I
J I
Back Close
Full Screen Esc
Printer-friendly Version
Interactive Discussion
Discussion
Paper
|D
iscussionP
aper|
Discussion
Paper
|D
iscussionP
aper|
Raumlisaumlnen J Warmer climate less or more snow Clim Dynam 30 307ndash319doi101007s00382-007-0289-y 2008
Schaner N Voisin N Nijssen B and Lettenmaier D P The contribution of glacier melt tostreamflow Environ Res Lett 7 034029 doi1010881748-932673034029 2012
Scherler D Bookhagen B and Strecker M R Spatially variable response of Himalayan5
glaciers to climate change affected by debris cover Nature Geosci 4 156ndash159 availableat httpwwwnaturecomngeojournalv4n3absngeo1068html ndash Supplement 2011
Sharif M Archer D R Fowler H J and Forsythe N Trends in timing and magnitude offlow in the Upper Indus Basin Hydrol Earth Syst Sci 17 1503ndash1516 doi105194hess-17-1503-2013 201310
Shekhar M S Chand H Kumar S Srinivasan K and Ganju A Climate-change studiesin the western Himalaya Ann Glaciol 51 105ndash112 doi1031891727564107913865082010
Shrestha A B Wake C P Mayewski P A and Dibb J E Maximum tempera-ture trends in the Himalaya and its vicinity an analysis based on temperature records15
from Nepal for the period 1971ndash94 J Climate 12 2775ndash2786 doi1011751520-0442(1999)012lt2775MTTITHgt20CO2 1999
Shrestha A B Wake C P Dibb J E and Mayewski P A Precipitation fluctuations in theNepal Himalaya and its vicinity and relationship with some large scale climatological parame-ters Int J Climatol 20 317ndash327 doi101002(SICI)1097-0088(20000315)203lt317AID-20
JOC476gt30CO2-G 2000Siderius C Biemans H Wiltshire A Rao S Franssen W H P Kumar P Gosain A K
van Vliet M T H and Collins D N Snowmelt contributions to discharge of the GangesSci Total Environ Supplement 468ndash469 9 doi101016jscitotenv201305084 2013
Singh P Jain S K and Kumar N Estimation of snow and glacier-melt contribution to the25
Chenab River Western Himalaya Mt Res Dev 17 49ndash56 doi1023073673913 1997Singh P Kumar V Thomas T and Arora M Changes in rainfall and relative hu-
midity in river basins in northwest and central India Hydrol Process 22 2982ndash2992doi101002hyp6871 2008
Sontakke N A Singh N and Singh H N Instrumental period rainfall series of the Indian30
region (AD 1813ndash2005) revised reconstruction update and analysis Holocene 18 1055ndash1066 doi1011770959683608095576 2008
474
TCD9 441ndash493 2015
Snowfall in theHimalayas an
uncertain future froma little-known past
E Viste and A Sorteberg
Title Page
Abstract Introduction
Conclusions References
Tables Figures
J I
J I
Back Close
Full Screen Esc
Printer-friendly Version
Interactive Discussion
Discussion
Paper
|D
iscussionP
aper|
Discussion
Paper
|D
iscussionP
aper|
Sperber K R Annamalai H Kang I S Kitoh A Moise A Turner A Wang B andZhou T The Asian summer monsoon an intercomparison of CMIP5 vs CMIP3 simulationsof the late 20th century Clim Dynam 41 2711ndash2744 doi101007s00382-012-1607-62013
Tahir A A Chevallier P Arnaud Y and Ahmad B Snow cover dynamics and hydrological5
regime of the Hunza River basin Karakoram Range Northern Pakistan Hydrol Earth SystSci 15 2275ndash2290 doi105194hess-15-2275-2011 2011a
Tahir A A Chevallier P Arnaud Y Neppel L and Ahmad B Modeling snowmelt-runoffunder climate scenarios in the Hunza River basin Karakoram Range Northern Pakistan JHydrol 409 104ndash117 doi101016jjhydrol201108035 2011b10
Taylor K E Stouffer R J and Meehl G A An overview of CMIP5 and the experimentdesign B Am Meteorol Soc 93 14 doi101175BAMS-D-11-000941 2011
Tedesco M and Narvekar P S Assessment of the NASA AMSR-E SWE product IEEE J SelTop Appl 3 141ndash159 doi101109JSTARS20102040462 2010
Teutschbein C and Seibert J Bias correction of regional climate model simulations for hydro-15
logical climate-change impact studies review and evaluation of different methods J Hydrol456ndash457 12ndash29 doi101016jjhydrol201205052 2012
Turner A G and Annamalai H Climate change and the South Asian summer monsoon NatClim Change 2 587ndash595 2012
van Vuuren D Edmonds J Kainuma M Riahi K Thomson A Hibbard K Hurtt G20
Kram T Krey V Lamarque J-F Masui T Meinshausen M Nakicenovic N Smith Sand Rose S The representative concentration pathways an overview Climatic Change109 26 doi101007s10584-011-0148-z 2011
Wang A and Zeng X Development of global hourly 05-degree land surface air temperaturedatasets J Climate 26 7676ndash7691 doi101175JCLI-D-12-006821 201325
Wiltshire A J Climate change implications for the glaciers of the Hindu Kush Karakoram andHimalayan region The Cryosphere 8 941ndash958 doi105194tc-8-941-2014 2014
Winiger M Gumpert M and Yamout H KarakorumndashHindukushndashwestern Himalaya assess-ing high-altitude water resources Hydrol Process 19 2329ndash2338 doi101002hyp5887200530
Xu X Lu C Shi X and Gao S World water tower An atmospheric perspective GeophysRes Lett 35 L20815 doi1010292008GL035867 2008a
475
TCD9 441ndash493 2015
Snowfall in theHimalayas an
uncertain future froma little-known past
E Viste and A Sorteberg
Title Page
Abstract Introduction
Conclusions References
Tables Figures
J I
J I
Back Close
Full Screen Esc
Printer-friendly Version
Interactive Discussion
Discussion
Paper
|D
iscussionP
aper|
Discussion
Paper
|D
iscussionP
aper|
Xu Z X Gong T L and Li J Y Decadal trend of climate in the Tibetan Plateaumdashregionaltemperature and precipitation Hydrol Process 22 3056ndash3065 doi101002hyp68922008b
Yasutomi N Hamada A and Akiyo Y Development of a Long-term Daily Gridded Temper-ature Dataset and its Application to RainSnow Discrimination of Daily Precipitation Global5
Environ Res15 165ndash172 2011Yatagai A Kamiguchi K Arakawa O Hamada A Yasutomi N and Kitoh A APHRODITE
Constructing a Long-Term Daily Gridded Precipitation Dataset for Asia Based on a DenseNetwork of Rain Gauges B Am Meteorol Soc 93 1401ndash1415 doi101175BAMS-D-11-001221 201210
You Q Kang S Aguilar E and Yan Y Changes in daily climate extremes in the east-ern and central Tibetan Plateau during 1961ndash2005 J Geophys Res-Atmos 113 D07101doi1010292007JD009389 2008
476
TCD9 441ndash493 2015
Snowfall in theHimalayas an
uncertain future froma little-known past
E Viste and A Sorteberg
Title Page
Abstract Introduction
Conclusions References
Tables Figures
J I
J I
Back Close
Full Screen Esc
Printer-friendly Version
Interactive Discussion
Discussion
Paper
|D
iscussionP
aper|
Discussion
Paper
|D
iscussionP
aper|
Table 1 Combinations of data types used in snowfall estimates T temperature P precipita-tion f (P T ) indicates that snowfall is calculated as a function of P and T
Precipitation Temperature Snowfall Time
MERRA MERRA PresentMERRA reference MERRA Terrain-adjusted MERRA f (P T ) PresentMERRA T2m MERRA MERRA T2m f (P T ) PresentBias-corrected with obs T MERRA Bias-corr terrain-adj MERRA f (P T ) PresentBias-corrected with obs P Bias-corr MERRA Terrain-adjusted MERRA f (P T ) PresentBias-corrected with obs T P Bias-corr MERRA Bias-corr terrain-adj MERRA f (P T ) PresentCMIP5 T MERRA Terrain-adj MERRA+∆T f (P T ) FutureCMIP5 P MERRAtimes∆P Terrain-adj MERRA f (P T ) FutureCMIP5 T P MERRAtimes∆P Terrain-adj MERRA+∆T f (P T ) FutureBias-corr CMIP5 T Bias-corr MERRA Bias-corr terrain-adj MERRA+∆T f (P T ) FutureBias-corr CMIP5 P Bias-corr MERRAtimes∆P Bias-corr terrain-adj MERRA f (P T ) FutureBias-corr CMIP5 T P Bias-corr MERRAtimes∆P Bias-corr terrain-adj MERRA+∆T f (P T ) Future
477
TCD9 441ndash493 2015
Snowfall in theHimalayas an
uncertain future froma little-known past
E Viste and A Sorteberg
Title Page
Abstract Introduction
Conclusions References
Tables Figures
J I
J I
Back Close
Full Screen Esc
Printer-friendly Version
Interactive Discussion
Discussion
Paper
|D
iscussionP
aper|
Discussion
Paper
|D
iscussionP
aper|
Table 2 Data sets used in calculations of present-day snowfall
Product Time Hor res Description
MERRA 1979ndash2012 05 lat 07 lon Hourly atmospheric reanalysis data(Rienecker et al 2011)
APHRODITEV1204V1101
1979ndash2007 025 Daily temperature andprecipitation basedon observations (Yatagai et al 2012Yasutomi et al 2011)
CRU TS 320 1979ndash2011 05 Monthly temperature and precipitationbased on observations(Harris et al 2014)
TRMM 3B42 V7 1998ndash2012 05 3 hourly satellite-based precipitation(Huffman et al 2007)
GLOBE 1 km Topography data set(Hastings and Dunbar 1998)
478
TCD9 441ndash493 2015
Snowfall in theHimalayas an
uncertain future froma little-known past
E Viste and A Sorteberg
Title Page
Abstract Introduction
Conclusions References
Tables Figures
J I
J I
Back Close
Full Screen Esc
Printer-friendly Version
Interactive Discussion
Discussion
Paper
|D
iscussionP
aper|
Discussion
Paper
|D
iscussionP
aper|
Table 3 CMIP5 models and RCPs used (x) in calculations of 2071ndash2100 snowfall
Model RCP 26 RCP 85
CanESM2 x xCCSM4 x xCESM1-CAM5 xCNRM-CM5 xGFDL-CM3 x xGFDL-ESM2G xGISS-E2-R x xHadGEM2-ES x xIPSL-CM5A-LR x xIPSL-CM5A-MR x xMIROC-ESM x xMIROC-ESM-CHEM x xMIROC5 x xMRI-CGCM3 x xNorESM1-M x xNorESM1-ME x x
479
TCD9 441ndash493 2015
Snowfall in theHimalayas an
uncertain future froma little-known past
E Viste and A Sorteberg
Title Page
Abstract Introduction
Conclusions References
Tables Figures
J I
J I
Back Close
Full Screen Esc
Printer-friendly Version
Interactive Discussion
Discussion
Paper
|D
iscussionP
aper|
Discussion
Paper
|D
iscussionP
aper|
Table 4 Annual snowfall estimates for the Indus Ganges and Brahmaputra Basins S snow[km3 SWE] P precipitation [km3] S and P percent of MERRA reference snowfall andMERRA precipitation First horizontal section no bias-corrections Second third and fourthsection bias-corrections with T P and both T and P
Indus Basin Ganges Basin Brahmaputra BasinInput S S P P S S P P S S P P
MERRA reference 148 100 422 100 54 100 1147 100 119 100 733 100MERRA 166 112 422 100 49 90 1147 100 129 109 733 100MERRA T2m 154 104 422 100 42 77 1147 100 109 92 733 100T APHRODITE 113 76 422 100 30 55 1147 100 74 62 733 100T CRU 126 85 422 100 81 151 1147 100 109 92 733 100P APHRODITE 66 44 315 75 22 42 1020 89 35 30 567 77P TRMM 72 49 404 96 31 57 1244 108 63 54 835 114P CRU 84 56 398 94 30 56 1100 96 53 45 716 98P T APHRODITE 49 33 315 75 12 22 1020 89 20 17 567 77P APHRODITE T CRU 62 42 315 75 34 63 1020 89 33 28 567 77P TRMM T APHRODITE 54 36 390 92 18 34 1195 104 39 33 815 111P TRMM T CRU 65 44 403 96 46 85 1254 109 58 49 813 111P CRU T APHRODITE 65 44 395 94 17 31 1106 96 31 26 718 98P T CRU 80 54 398 94 41 75 1100 96 49 42 716 98
480
TCD9 441ndash493 2015
Snowfall in theHimalayas an
uncertain future froma little-known past
E Viste and A Sorteberg
Title Page
Abstract Introduction
Conclusions References
Tables Figures
J I
J I
Back Close
Full Screen Esc
Printer-friendly Version
Interactive Discussion
Discussion
Paper
|D
iscussionP
aper|
Discussion
Paper
|D
iscussionP
aper|
Table 5 Projected change in annual snowfall from 1971ndash2000 to 2071ndash2100 with referenceto terrain-adjusted MERRA and APHRODITE ∆Sabs [km3] is the absolute change ∆Srel [] isthe relative change compared to the present-day MERRA reference snowfall Values are pre-sented with the CMIP5 multi-model mean as the main value and the span of individual modelsin brackets (MERRA only) ∆TP indicates that changes in both temperature and precipitationare included whereas ∆P and ∆T denotes changes only in precipitation or temperature re-spectively
Indus Ganges Brahmaputra∆Sabs [km3] ∆Srel [] ∆Sabs [km3] ∆Srel [] ∆Sabs [km3] ∆Srel []
RCP 85 MERRA ∆TP minus49 [minus83minus9] minus33 [minus56minus6] minus27 [minus36minus14] minus50 [minus66minus25] minus64 [minus93minus39] minus54 [minus79minus33]MERRA ∆T minus51 [minus67minus34] minus34 [minus45minus23] minus28 [minus34minus21] minus51 [minus64minus39] minus71 [minus87minus53] minus60 [minus73minus44]MERRA ∆P 5 [minus2544] 4 [minus1730] 7 [minus417] 12 [minus731] 20 [minus1750] 17 [minus1542]
APHRO ∆TP minus25 minus51 minus7 minus56 minus13 minus67APHRO ∆T minus25 minus52 minus7 minus57 minus14 minus71APHRO ∆P 1 1 1 6 3 16
RCP 26 MERRA ∆TP minus15 [minus406] minus10 [minus274] minus10 [minus19minus3] minus18 [minus36minus5] minus25 [minus42minus5] minus21 [minus35minus4]MERRA ∆T minus18 [minus27minus9] minus12 [minus18minus6] minus12 [minus21minus6] minus21 [minus39minus11] minus29 [minus47minus13] minus25 [minus40minus11]MERRA ∆P 3 [minus1825] 2 [minus1217] 3 [minus210] 5 [minus419] 7 [minus828] 6 [minus623]
APHRO ∆TP minus9 minus18 minus2 minus20 minus6 minus29APHRO ∆T minus10 minus19 minus3 minus23 minus6 minus32APHRO ∆P 1 1 0 4 1 6
481
TCD9 441ndash493 2015
Snowfall in theHimalayas an
uncertain future froma little-known past
E Viste and A Sorteberg
Title Page
Abstract Introduction
Conclusions References
Tables Figures
J I
J I
Back Close
Full Screen Esc
Printer-friendly Version
Interactive Discussion
Discussion
Paper
|D
iscussionP
aper|
Discussion
Paper
|D
iscussionP
aper|
Figure 1 Map of the region with the Indus Ganges and Brahmaputra basins outlined in whiteThinner outlines are national borders Background NASA Visible Earth
482
TCD9 441ndash493 2015
Snowfall in theHimalayas an
uncertain future froma little-known past
E Viste and A Sorteberg
Title Page
Abstract Introduction
Conclusions References
Tables Figures
J I
J I
Back Close
Full Screen Esc
Printer-friendly Version
Interactive Discussion
Discussion
Paper
|D
iscussionP
aper|
Discussion
Paper
|D
iscussionP
aper|
0
400 mm
Months 1ndash12
SP
I1
I2I3
I5I4
G1
G2G3
G4
B1
B2
B3B4
Viste amp SortebergFigure 2
Figure 2 Monthly mean MERRA precipitation and MERRA reference snowfall in sub-basinclusters of the Indus (I) Ganges (G) and Brahmaputra (B) Total bar height MERRA precip-itation (P) [mm] Colored bars snowfall (S) [mm SWE] based on MERRA precipitation andterrain-adjusted MERRA temperature in the region with the same color Cluster 1 in eachbasin is considered snow-free and the seasonal cycles are not shown
483
TCD9 441ndash493 2015
Snowfall in theHimalayas an
uncertain future froma little-known past
E Viste and A Sorteberg
Title Page
Abstract Introduction
Conclusions References
Tables Figures
J I
J I
Back Close
Full Screen Esc
Printer-friendly Version
Interactive Discussion
Discussion
Paper
|D
iscussionP
aper|
Discussion
Paper
|D
iscussionP
aper|
a) MERRA reference b) APHRODITE c) APHRODITE ndash MERRA ref
30 km3
20100-10-20-30
Viste amp SortebergFigure 3
Figure 3 The effect of bias-corrections with APHRODITE temperature and precipitation(a) MERRA reference snowfall (b) Snowfall based on bias-corrections with APHRODITE(c) APHRODITE (b) minus MERRA reference snowfall (a)
484
TCD9 441ndash493 2015
Snowfall in theHimalayas an
uncertain future froma little-known past
E Viste and A Sorteberg
Title Page
Abstract Introduction
Conclusions References
Tables Figures
J I
J I
Back Close
Full Screen Esc
Printer-friendly Version
Interactive Discussion
Discussion
Paper
|D
iscussionP
aper|
Discussion
Paper
|D
iscussionP
aper|
Figure 4 Difference between MERRA precipitation and observation-based data (a) Annualmean MERRA precipitation (b c and d) Annual mean MERRA precipitation bias-correctedwith observations APHRODITE CRU TS and TRMM 3B42 For each data set the small insetmaps show the observations minus MERRA
485
TCD9 441ndash493 2015
Snowfall in theHimalayas an
uncertain future froma little-known past
E Viste and A Sorteberg
Title Page
Abstract Introduction
Conclusions References
Tables Figures
J I
J I
Back Close
Full Screen Esc
Printer-friendly Version
Interactive Discussion
Discussion
Paper
|D
iscussionP
aper|
Discussion
Paper
|D
iscussionP
aper|
Biasminuscorrected minus original MERRA temperature [C]
minus15
minus10
minus5
0
5
10
Biasminuscorrected minus original MERRA temperature [C]
minus15
minus10
minus5
0
5
10
MERRA mean temperature [C] 1979minus2007
minus15
minus10
minus5
0
5
10
15
20
25
30a) MERRA b) APHRODITE ndash MERRA c) CRU ndash MERRA
-10
0
10
20
30degC
minus15
minus10
minus5
0
5
10
15degC
Viste amp SortebergFigure 5
Figure 5 Difference between MERRA temperature and observation-based data (a) Annualmean MERRA temperature (b and c) Annual mean MERRA temperature bias-corrected withobservations APHRODITE and CRU TS
486
TCD9 441ndash493 2015
Snowfall in theHimalayas an
uncertain future froma little-known past
E Viste and A Sorteberg
Title Page
Abstract Introduction
Conclusions References
Tables Figures
J I
J I
Back Close
Full Screen Esc
Printer-friendly Version
Interactive Discussion
Discussion
Paper
|D
iscussionP
aper|
Discussion
Paper
|D
iscussionP
aper|
Jan Apr
Jul Oct
a)
c)
b)
d)
15degC
10
5
0
ndash5
ndash10
ndash15
200 mm16012080400ndash40ndash80ndash120ndash160ndash200
Viste amp SortebergFigure 6
Figure 6 Regions where increasing temperatures are likely to cause a shift from snow to rainData monthly mean MERRA temperature terrain-adjusted to a 4 km GLOBE grid Red temper-ature between minus5 and 0 considered critical Small inset maps monthly MERRA precipitationin the critical zones
487
TCD9 441ndash493 2015
Snowfall in theHimalayas an
uncertain future froma little-known past
E Viste and A Sorteberg
Title Page
Abstract Introduction
Conclusions References
Tables Figures
J I
J I
Back Close
Full Screen Esc
Printer-friendly Version
Interactive Discussion
Discussion
Paper
|D
iscussionP
aper|
Discussion
Paper
|D
iscussionP
aper|
1 2 3 4 5 6 7 8 9 10 11 12Month
∆T [ordm
C]
a) Indus
0
1
2
3
4
5
6
7
8
9
10
b) Ganges∆T
[ordmC
]
1 2 3 4 5 6 7 8 9 10 11 12Month
1
2
3
4
5
6
7
8
0 0
c) Brahmaputra
∆T [ordm
C]
1 2 3 4 5 6 7 8 9 10 11 12Month
1
2
3
4
5
6
7
8
9
10 RCP 85RCP 85 meanRCP 26RCP 26 mean
Viste amp SortebergFigure 7
Figure 7 Projected future temperature change from 1971ndash2000 to 2071ndash2100 in the (a) In-dus (b) Ganges and (c) Brahmaputra Basins Thin lines show the individual CMIP5 modelsstronger lines the multi-model mean
488
TCD9 441ndash493 2015
Snowfall in theHimalayas an
uncertain future froma little-known past
E Viste and A Sorteberg
Title Page
Abstract Introduction
Conclusions References
Tables Figures
J I
J I
Back Close
Full Screen Esc
Printer-friendly Version
Interactive Discussion
Discussion
Paper
|D
iscussionP
aper|
Discussion
Paper
|D
iscussionP
aper|
1 2 3 4 5 6 7 8 9 10 11 12Month
[km
3 ]
a) Indus
0
20
40
60
80
100
120
140
b) Ganges[k
m3 ]
1 2 3 4 5 6 7 8 9 10 11 12Month
0
100
200
300
400
500
600
700
c) Brahmaputra
[km
3 ]
1 2 3 4 5 6 7 8 9 10 11 12Month
0
50
100
150
200
250
MERRA ref
2071ndash2100
1979ndash2008
RCP 85RCP 85 meanRCP 26RCP 26 mean
Viste amp SortebergFigure 8
Figure 8 Projected future precipitation in the (a) Indus (b) Ganges and (c) BrahmaputraBasins Gray bars MERRA 1979ndash2008 Thin lines and horizontal marks on the bars show theindividual CMIP5 models and the multi-model mean for 2071ndash2100
489
TCD9 441ndash493 2015
Snowfall in theHimalayas an
uncertain future froma little-known past
E Viste and A Sorteberg
Title Page
Abstract Introduction
Conclusions References
Tables Figures
J I
J I
Back Close
Full Screen Esc
Printer-friendly Version
Interactive Discussion
Discussion
Paper
|D
iscussionP
aper|
Discussion
Paper
|D
iscussionP
aper|
1 2 3 4 5 6 7 8 9 10 11 120
5
10
15
20
25
30
35
Month
SWE
[km
3 ]
a) Indus
0
1
2
3
4
5
6
7
8
b) Ganges
SWE
[km
3 ]
1 2 3 4 5 6 7 8 9 10 11 12Month
0
2
4
6
8
10
12
14
16
18
20
c) Brahmaputra
SWE
[km
3 ]
1 2 3 4 5 6 7 8 9 10 11 12Month
MERRA ref
2071ndash2100
1979ndash2008
RCP 85RCP 85 meanRCP 26RCP 26 mean
Viste amp SortebergFigure 9
Figure 9 Projected future snowfall in the (a) Indus (b) Ganges and (c) Brahmaputra Basinswith reference to MERRA reference snowfall Gray bars MERRA reference snowfall for 1979ndash2008 Thin lines and horizontal marks on the bars show the individual CMIP5 models andthe multi-model mean for 2071ndash2100 based on changes in temperature and precipitation asdescribed in Sect 23
490
TCD9 441ndash493 2015
Snowfall in theHimalayas an
uncertain future froma little-known past
E Viste and A Sorteberg
Title Page
Abstract Introduction
Conclusions References
Tables Figures
J I
J I
Back Close
Full Screen Esc
Printer-friendly Version
Interactive Discussion
Discussion
Paper
|D
iscussionP
aper|
Discussion
Paper
|D
iscussionP
aper|
Figure 10 Projected future changes in snowfall in sub-basins of the Indus Ganges andBrahmaputra Basins (a) Absolute change [km3] with reference to MERRA reference snow-fall (b) Absolute change [km3] with reference to APHRODITE snowfall (c d) Correspondingrelative changes [] with reference to MERRA and APHRODITE
491
TCD9 441ndash493 2015
Snowfall in theHimalayas an
uncertain future froma little-known past
E Viste and A Sorteberg
Title Page
Abstract Introduction
Conclusions References
Tables Figures
J I
J I
Back Close
Full Screen Esc
Printer-friendly Version
Interactive Discussion
Discussion
Paper
|D
iscussionP
aper|
Discussion
Paper
|D
iscussionP
aper|
J F M A M J J A S O N DMonth
0
5
10
15
20 km3Precip
0
2
4
6
8
10 km3SWE
2000
3000
4000
5000
6000 masl
1845
J F
M
A
M
JJ A
S
O
N
D
RSL
I4A = 146793 km2
1 km 3 = 68 mm
0
05
1
15 SWE rel
8000 m
0
J F M A M J J A S O N DMonth
0
2
4
6
8
10
12 km3 SWE
3000
4000
5000
6000 masl
78
2
14
J FM
A
MJ
J AS
O
ND
RSL
I5
Precip
0
5
10
15
20
25 km3
0
05
1
15 SWE rel
8000 m
0
A = 178669 km2
1 km 3 = 56 mm
CMIP52071ndash2100mean
Today
MERRA APHRODITE
Individual models
CMIP52071ndash2100mean
MERRA APHRODITE
Individual models
CMIP52071ndash2100Precip mean
MERRA APHRODITE
Individual models
SWE todayPrecip today
2000 mTerrain distribution of area between levels
CMIP52071ndash2100
TodayMERRA
APHRODITE
a)
i)
ii)
iii)
iv)
b)
Viste amp SortebergFigure 11
Figure 11 Monthly CMIP5 RCP 85 change in snowfall precipitation and rainsnow line eleva-tion in the upper Indus clusters (a) 4 and (b) 5 from 1971ndash2000 to 2071ndash2100 with referenceto the MERRA reference (red) and APHRODITE (blue) CMIP5 multi-model means are shownas horizontal marks individual models as dots Cluster location and terrain profile are shownabove the graphs (i) Fractional change in snowfall (ii) Future snowfall [km3] (dots) comparedto today (bars) (iii) Future precipitation [km3] (dots) compared to today (bars) Snowfall todayis shown as darker part of bars (iv) Rainsnow line elevation [m asl] Gray background el-evation histogram with the of total ground area lying in the marked 2000 m intervals Barschange from today (bottom) to CMIP5 multi-model mean (top)
492
TCD9 441ndash493 2015
Snowfall in theHimalayas an
uncertain future froma little-known past
E Viste and A Sorteberg
Title Page
Abstract Introduction
Conclusions References
Tables Figures
J I
J I
Back Close
Full Screen Esc
Printer-friendly Version
Interactive Discussion
Discussion
Paper
|D
iscussionP
aper|
Discussion
Paper
|D
iscussionP
aper|
3000
4000
5000
6000 masl
0
2
4
6
8
10 km3
0
10
20
30
40
50
60 km3
0
05
1
15
J F M A M J J A S O N DMonth
J FM
A
M
JJ A
S
O
ND
Precip
SWE
RSL
SWE rel
53
B3
8000 m
0
A = 139611 km2
1 km 3 = 72 mm
4500
5000
5500
6000
6500 masl
0
1
2
3
4 km3
0
10
20
30
40
50 km3
0
05
1
15 SWE rel
SWE
RSL
Precip
95
J F M A M J J A S O N DMonth
J FM
A
M
JJ A
S
ON
D
B4
8000 m
0
A = 159165 km2
1 km 3 = 63 mm
CMIP52071ndash2100mean
Today
MERRA APHRODITE
Individual models
CMIP52071ndash2100mean
MERRA APHRODITE
Individual models
CMIP52071ndash2100Precip mean
MERRA APHRODITE
Individual models
SWE todayPrecip today
2000 mTerrain distribution of area between levels
CMIP52071ndash2100
TodayMERRA
APHRODITE
a)
i)
ii)
iii)
iv)
b)
Viste amp SortebergFigure 12
Figure 12 Monthly CMIP5 RCP 85 change in snowfall precipitation and rainsnow line ele-vation in the upper Brahmaputra clusters (a) 4 and (b) 3 See Fig 11 for a description of thecontent
493
- Introduction
-
- Observed trends in snowfall temperature and precipitation
- Future projections of snowfall temperature and precipitation
- Aims and scope
-
- Data and methods
-
- Reference present-day snowfall
- Bias-corrected present-day snowfall
- Projected snowfall
- The rain-snow line
-
- Present-day snowfall
-
- Seasonal cycles of precipitation and snowfall
- Comparison of snowfall estimates
-
- Projected future snowfall
-
- Basin-scale projections
- Regional projections
-
- Upper Indus western part
- Upper Indus eastern part
- Upper Brahmaputra western part
- Upper Brahmaputra eastern part
-
- Potential effects of reduced snowfall on water availability
-
- Concluding summary
-
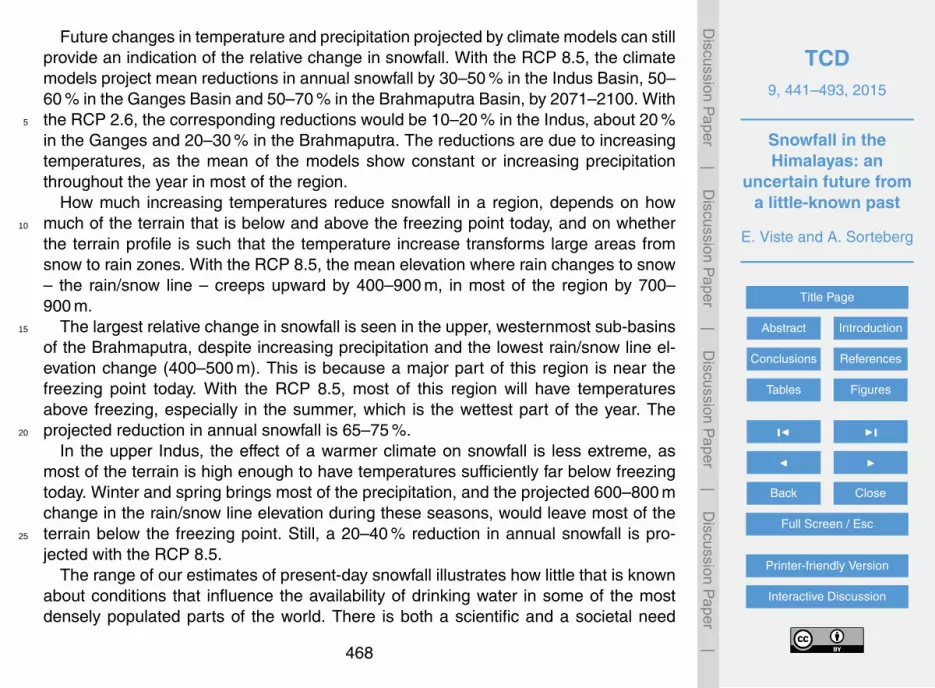
TCD9 441ndash493 2015
Snowfall in theHimalayas an
uncertain future froma little-known past
E Viste and A Sorteberg
Title Page
Abstract Introduction
Conclusions References
Tables Figures
J I
J I
Back Close
Full Screen Esc
Printer-friendly Version
Interactive Discussion
Discussion
Paper
|D
iscussionP
aper|
Discussion
Paper
|D
iscussionP
aper|
Table 3 CMIP5 models and RCPs used (x) in calculations of 2071ndash2100 snowfall
Model RCP 26 RCP 85
CanESM2 x xCCSM4 x xCESM1-CAM5 xCNRM-CM5 xGFDL-CM3 x xGFDL-ESM2G xGISS-E2-R x xHadGEM2-ES x xIPSL-CM5A-LR x xIPSL-CM5A-MR x xMIROC-ESM x xMIROC-ESM-CHEM x xMIROC5 x xMRI-CGCM3 x xNorESM1-M x xNorESM1-ME x x
479
TCD9 441ndash493 2015
Snowfall in theHimalayas an
uncertain future froma little-known past
E Viste and A Sorteberg
Title Page
Abstract Introduction
Conclusions References
Tables Figures
J I
J I
Back Close
Full Screen Esc
Printer-friendly Version
Interactive Discussion
Discussion
Paper
|D
iscussionP
aper|
Discussion
Paper
|D
iscussionP
aper|
Table 4 Annual snowfall estimates for the Indus Ganges and Brahmaputra Basins S snow[km3 SWE] P precipitation [km3] S and P percent of MERRA reference snowfall andMERRA precipitation First horizontal section no bias-corrections Second third and fourthsection bias-corrections with T P and both T and P
Indus Basin Ganges Basin Brahmaputra BasinInput S S P P S S P P S S P P
MERRA reference 148 100 422 100 54 100 1147 100 119 100 733 100MERRA 166 112 422 100 49 90 1147 100 129 109 733 100MERRA T2m 154 104 422 100 42 77 1147 100 109 92 733 100T APHRODITE 113 76 422 100 30 55 1147 100 74 62 733 100T CRU 126 85 422 100 81 151 1147 100 109 92 733 100P APHRODITE 66 44 315 75 22 42 1020 89 35 30 567 77P TRMM 72 49 404 96 31 57 1244 108 63 54 835 114P CRU 84 56 398 94 30 56 1100 96 53 45 716 98P T APHRODITE 49 33 315 75 12 22 1020 89 20 17 567 77P APHRODITE T CRU 62 42 315 75 34 63 1020 89 33 28 567 77P TRMM T APHRODITE 54 36 390 92 18 34 1195 104 39 33 815 111P TRMM T CRU 65 44 403 96 46 85 1254 109 58 49 813 111P CRU T APHRODITE 65 44 395 94 17 31 1106 96 31 26 718 98P T CRU 80 54 398 94 41 75 1100 96 49 42 716 98
480
TCD9 441ndash493 2015
Snowfall in theHimalayas an
uncertain future froma little-known past
E Viste and A Sorteberg
Title Page
Abstract Introduction
Conclusions References
Tables Figures
J I
J I
Back Close
Full Screen Esc
Printer-friendly Version
Interactive Discussion
Discussion
Paper
|D
iscussionP
aper|
Discussion
Paper
|D
iscussionP
aper|
Table 5 Projected change in annual snowfall from 1971ndash2000 to 2071ndash2100 with referenceto terrain-adjusted MERRA and APHRODITE ∆Sabs [km3] is the absolute change ∆Srel [] isthe relative change compared to the present-day MERRA reference snowfall Values are pre-sented with the CMIP5 multi-model mean as the main value and the span of individual modelsin brackets (MERRA only) ∆TP indicates that changes in both temperature and precipitationare included whereas ∆P and ∆T denotes changes only in precipitation or temperature re-spectively
Indus Ganges Brahmaputra∆Sabs [km3] ∆Srel [] ∆Sabs [km3] ∆Srel [] ∆Sabs [km3] ∆Srel []
RCP 85 MERRA ∆TP minus49 [minus83minus9] minus33 [minus56minus6] minus27 [minus36minus14] minus50 [minus66minus25] minus64 [minus93minus39] minus54 [minus79minus33]MERRA ∆T minus51 [minus67minus34] minus34 [minus45minus23] minus28 [minus34minus21] minus51 [minus64minus39] minus71 [minus87minus53] minus60 [minus73minus44]MERRA ∆P 5 [minus2544] 4 [minus1730] 7 [minus417] 12 [minus731] 20 [minus1750] 17 [minus1542]
APHRO ∆TP minus25 minus51 minus7 minus56 minus13 minus67APHRO ∆T minus25 minus52 minus7 minus57 minus14 minus71APHRO ∆P 1 1 1 6 3 16
RCP 26 MERRA ∆TP minus15 [minus406] minus10 [minus274] minus10 [minus19minus3] minus18 [minus36minus5] minus25 [minus42minus5] minus21 [minus35minus4]MERRA ∆T minus18 [minus27minus9] minus12 [minus18minus6] minus12 [minus21minus6] minus21 [minus39minus11] minus29 [minus47minus13] minus25 [minus40minus11]MERRA ∆P 3 [minus1825] 2 [minus1217] 3 [minus210] 5 [minus419] 7 [minus828] 6 [minus623]
APHRO ∆TP minus9 minus18 minus2 minus20 minus6 minus29APHRO ∆T minus10 minus19 minus3 minus23 minus6 minus32APHRO ∆P 1 1 0 4 1 6
481
TCD9 441ndash493 2015
Snowfall in theHimalayas an
uncertain future froma little-known past
E Viste and A Sorteberg
Title Page
Abstract Introduction
Conclusions References
Tables Figures
J I
J I
Back Close
Full Screen Esc
Printer-friendly Version
Interactive Discussion
Discussion
Paper
|D
iscussionP
aper|
Discussion
Paper
|D
iscussionP
aper|
Figure 1 Map of the region with the Indus Ganges and Brahmaputra basins outlined in whiteThinner outlines are national borders Background NASA Visible Earth
482
TCD9 441ndash493 2015
Snowfall in theHimalayas an
uncertain future froma little-known past
E Viste and A Sorteberg
Title Page
Abstract Introduction
Conclusions References
Tables Figures
J I
J I
Back Close
Full Screen Esc
Printer-friendly Version
Interactive Discussion
Discussion
Paper
|D
iscussionP
aper|
Discussion
Paper
|D
iscussionP
aper|
0
400 mm
Months 1ndash12
SP
I1
I2I3
I5I4
G1
G2G3
G4
B1
B2
B3B4
Viste amp SortebergFigure 2
Figure 2 Monthly mean MERRA precipitation and MERRA reference snowfall in sub-basinclusters of the Indus (I) Ganges (G) and Brahmaputra (B) Total bar height MERRA precip-itation (P) [mm] Colored bars snowfall (S) [mm SWE] based on MERRA precipitation andterrain-adjusted MERRA temperature in the region with the same color Cluster 1 in eachbasin is considered snow-free and the seasonal cycles are not shown
483
TCD9 441ndash493 2015
Snowfall in theHimalayas an
uncertain future froma little-known past
E Viste and A Sorteberg
Title Page
Abstract Introduction
Conclusions References
Tables Figures
J I
J I
Back Close
Full Screen Esc
Printer-friendly Version
Interactive Discussion
Discussion
Paper
|D
iscussionP
aper|
Discussion
Paper
|D
iscussionP
aper|
a) MERRA reference b) APHRODITE c) APHRODITE ndash MERRA ref
30 km3
20100-10-20-30
Viste amp SortebergFigure 3
Figure 3 The effect of bias-corrections with APHRODITE temperature and precipitation(a) MERRA reference snowfall (b) Snowfall based on bias-corrections with APHRODITE(c) APHRODITE (b) minus MERRA reference snowfall (a)
484
TCD9 441ndash493 2015
Snowfall in theHimalayas an
uncertain future froma little-known past
E Viste and A Sorteberg
Title Page
Abstract Introduction
Conclusions References
Tables Figures
J I
J I
Back Close
Full Screen Esc
Printer-friendly Version
Interactive Discussion
Discussion
Paper
|D
iscussionP
aper|
Discussion
Paper
|D
iscussionP
aper|
Figure 4 Difference between MERRA precipitation and observation-based data (a) Annualmean MERRA precipitation (b c and d) Annual mean MERRA precipitation bias-correctedwith observations APHRODITE CRU TS and TRMM 3B42 For each data set the small insetmaps show the observations minus MERRA
485
TCD9 441ndash493 2015
Snowfall in theHimalayas an
uncertain future froma little-known past
E Viste and A Sorteberg
Title Page
Abstract Introduction
Conclusions References
Tables Figures
J I
J I
Back Close
Full Screen Esc
Printer-friendly Version
Interactive Discussion
Discussion
Paper
|D
iscussionP
aper|
Discussion
Paper
|D
iscussionP
aper|
Biasminuscorrected minus original MERRA temperature [C]
minus15
minus10
minus5
0
5
10
Biasminuscorrected minus original MERRA temperature [C]
minus15
minus10
minus5
0
5
10
MERRA mean temperature [C] 1979minus2007
minus15
minus10
minus5
0
5
10
15
20
25
30a) MERRA b) APHRODITE ndash MERRA c) CRU ndash MERRA
-10
0
10
20
30degC
minus15
minus10
minus5
0
5
10
15degC
Viste amp SortebergFigure 5
Figure 5 Difference between MERRA temperature and observation-based data (a) Annualmean MERRA temperature (b and c) Annual mean MERRA temperature bias-corrected withobservations APHRODITE and CRU TS
486
TCD9 441ndash493 2015
Snowfall in theHimalayas an
uncertain future froma little-known past
E Viste and A Sorteberg
Title Page
Abstract Introduction
Conclusions References
Tables Figures
J I
J I
Back Close
Full Screen Esc
Printer-friendly Version
Interactive Discussion
Discussion
Paper
|D
iscussionP
aper|
Discussion
Paper
|D
iscussionP
aper|
Jan Apr
Jul Oct
a)
c)
b)
d)
15degC
10
5
0
ndash5
ndash10
ndash15
200 mm16012080400ndash40ndash80ndash120ndash160ndash200
Viste amp SortebergFigure 6
Figure 6 Regions where increasing temperatures are likely to cause a shift from snow to rainData monthly mean MERRA temperature terrain-adjusted to a 4 km GLOBE grid Red temper-ature between minus5 and 0 considered critical Small inset maps monthly MERRA precipitationin the critical zones
487
TCD9 441ndash493 2015
Snowfall in theHimalayas an
uncertain future froma little-known past
E Viste and A Sorteberg
Title Page
Abstract Introduction
Conclusions References
Tables Figures
J I
J I
Back Close
Full Screen Esc
Printer-friendly Version
Interactive Discussion
Discussion
Paper
|D
iscussionP
aper|
Discussion
Paper
|D
iscussionP
aper|
1 2 3 4 5 6 7 8 9 10 11 12Month
∆T [ordm
C]
a) Indus
0
1
2
3
4
5
6
7
8
9
10
b) Ganges∆T
[ordmC
]
1 2 3 4 5 6 7 8 9 10 11 12Month
1
2
3
4
5
6
7
8
0 0
c) Brahmaputra
∆T [ordm
C]
1 2 3 4 5 6 7 8 9 10 11 12Month
1
2
3
4
5
6
7
8
9
10 RCP 85RCP 85 meanRCP 26RCP 26 mean
Viste amp SortebergFigure 7
Figure 7 Projected future temperature change from 1971ndash2000 to 2071ndash2100 in the (a) In-dus (b) Ganges and (c) Brahmaputra Basins Thin lines show the individual CMIP5 modelsstronger lines the multi-model mean
488
TCD9 441ndash493 2015
Snowfall in theHimalayas an
uncertain future froma little-known past
E Viste and A Sorteberg
Title Page
Abstract Introduction
Conclusions References
Tables Figures
J I
J I
Back Close
Full Screen Esc
Printer-friendly Version
Interactive Discussion
Discussion
Paper
|D
iscussionP
aper|
Discussion
Paper
|D
iscussionP
aper|
1 2 3 4 5 6 7 8 9 10 11 12Month
[km
3 ]
a) Indus
0
20
40
60
80
100
120
140
b) Ganges[k
m3 ]
1 2 3 4 5 6 7 8 9 10 11 12Month
0
100
200
300
400
500
600
700
c) Brahmaputra
[km
3 ]
1 2 3 4 5 6 7 8 9 10 11 12Month
0
50
100
150
200
250
MERRA ref
2071ndash2100
1979ndash2008
RCP 85RCP 85 meanRCP 26RCP 26 mean
Viste amp SortebergFigure 8
Figure 8 Projected future precipitation in the (a) Indus (b) Ganges and (c) BrahmaputraBasins Gray bars MERRA 1979ndash2008 Thin lines and horizontal marks on the bars show theindividual CMIP5 models and the multi-model mean for 2071ndash2100
489
TCD9 441ndash493 2015
Snowfall in theHimalayas an
uncertain future froma little-known past
E Viste and A Sorteberg
Title Page
Abstract Introduction
Conclusions References
Tables Figures
J I
J I
Back Close
Full Screen Esc
Printer-friendly Version
Interactive Discussion
Discussion
Paper
|D
iscussionP
aper|
Discussion
Paper
|D
iscussionP
aper|
1 2 3 4 5 6 7 8 9 10 11 120
5
10
15
20
25
30
35
Month
SWE
[km
3 ]
a) Indus
0
1
2
3
4
5
6
7
8
b) Ganges
SWE
[km
3 ]
1 2 3 4 5 6 7 8 9 10 11 12Month
0
2
4
6
8
10
12
14
16
18
20
c) Brahmaputra
SWE
[km
3 ]
1 2 3 4 5 6 7 8 9 10 11 12Month
MERRA ref
2071ndash2100
1979ndash2008
RCP 85RCP 85 meanRCP 26RCP 26 mean
Viste amp SortebergFigure 9
Figure 9 Projected future snowfall in the (a) Indus (b) Ganges and (c) Brahmaputra Basinswith reference to MERRA reference snowfall Gray bars MERRA reference snowfall for 1979ndash2008 Thin lines and horizontal marks on the bars show the individual CMIP5 models andthe multi-model mean for 2071ndash2100 based on changes in temperature and precipitation asdescribed in Sect 23
490
TCD9 441ndash493 2015
Snowfall in theHimalayas an
uncertain future froma little-known past
E Viste and A Sorteberg
Title Page
Abstract Introduction
Conclusions References
Tables Figures
J I
J I
Back Close
Full Screen Esc
Printer-friendly Version
Interactive Discussion
Discussion
Paper
|D
iscussionP
aper|
Discussion
Paper
|D
iscussionP
aper|
Figure 10 Projected future changes in snowfall in sub-basins of the Indus Ganges andBrahmaputra Basins (a) Absolute change [km3] with reference to MERRA reference snow-fall (b) Absolute change [km3] with reference to APHRODITE snowfall (c d) Correspondingrelative changes [] with reference to MERRA and APHRODITE
491
TCD9 441ndash493 2015
Snowfall in theHimalayas an
uncertain future froma little-known past
E Viste and A Sorteberg
Title Page
Abstract Introduction
Conclusions References
Tables Figures
J I
J I
Back Close
Full Screen Esc
Printer-friendly Version
Interactive Discussion
Discussion
Paper
|D
iscussionP
aper|
Discussion
Paper
|D
iscussionP
aper|
J F M A M J J A S O N DMonth
0
5
10
15
20 km3Precip
0
2
4
6
8
10 km3SWE
2000
3000
4000
5000
6000 masl
1845
J F
M
A
M
JJ A
S
O
N
D
RSL
I4A = 146793 km2
1 km 3 = 68 mm
0
05
1
15 SWE rel
8000 m
0
J F M A M J J A S O N DMonth
0
2
4
6
8
10
12 km3 SWE
3000
4000
5000
6000 masl
78
2
14
J FM
A
MJ
J AS
O
ND
RSL
I5
Precip
0
5
10
15
20
25 km3
0
05
1
15 SWE rel
8000 m
0
A = 178669 km2
1 km 3 = 56 mm
CMIP52071ndash2100mean
Today
MERRA APHRODITE
Individual models
CMIP52071ndash2100mean
MERRA APHRODITE
Individual models
CMIP52071ndash2100Precip mean
MERRA APHRODITE
Individual models
SWE todayPrecip today
2000 mTerrain distribution of area between levels
CMIP52071ndash2100
TodayMERRA
APHRODITE
a)
i)
ii)
iii)
iv)
b)
Viste amp SortebergFigure 11
Figure 11 Monthly CMIP5 RCP 85 change in snowfall precipitation and rainsnow line eleva-tion in the upper Indus clusters (a) 4 and (b) 5 from 1971ndash2000 to 2071ndash2100 with referenceto the MERRA reference (red) and APHRODITE (blue) CMIP5 multi-model means are shownas horizontal marks individual models as dots Cluster location and terrain profile are shownabove the graphs (i) Fractional change in snowfall (ii) Future snowfall [km3] (dots) comparedto today (bars) (iii) Future precipitation [km3] (dots) compared to today (bars) Snowfall todayis shown as darker part of bars (iv) Rainsnow line elevation [m asl] Gray background el-evation histogram with the of total ground area lying in the marked 2000 m intervals Barschange from today (bottom) to CMIP5 multi-model mean (top)
492
TCD9 441ndash493 2015
Snowfall in theHimalayas an
uncertain future froma little-known past
E Viste and A Sorteberg
Title Page
Abstract Introduction
Conclusions References
Tables Figures
J I
J I
Back Close
Full Screen Esc
Printer-friendly Version
Interactive Discussion
Discussion
Paper
|D
iscussionP
aper|
Discussion
Paper
|D
iscussionP
aper|
3000
4000
5000
6000 masl
0
2
4
6
8
10 km3
0
10
20
30
40
50
60 km3
0
05
1
15
J F M A M J J A S O N DMonth
J FM
A
M
JJ A
S
O
ND
Precip
SWE
RSL
SWE rel
53
B3
8000 m
0
A = 139611 km2
1 km 3 = 72 mm
4500
5000
5500
6000
6500 masl
0
1
2
3
4 km3
0
10
20
30
40
50 km3
0
05
1
15 SWE rel
SWE
RSL
Precip
95
J F M A M J J A S O N DMonth
J FM
A
M
JJ A
S
ON
D
B4
8000 m
0
A = 159165 km2
1 km 3 = 63 mm
CMIP52071ndash2100mean
Today
MERRA APHRODITE
Individual models
CMIP52071ndash2100mean
MERRA APHRODITE
Individual models
CMIP52071ndash2100Precip mean
MERRA APHRODITE
Individual models
SWE todayPrecip today
2000 mTerrain distribution of area between levels
CMIP52071ndash2100
TodayMERRA
APHRODITE
a)
i)
ii)
iii)
iv)
b)
Viste amp SortebergFigure 12
Figure 12 Monthly CMIP5 RCP 85 change in snowfall precipitation and rainsnow line ele-vation in the upper Brahmaputra clusters (a) 4 and (b) 3 See Fig 11 for a description of thecontent
493
- Introduction
-
- Observed trends in snowfall temperature and precipitation
- Future projections of snowfall temperature and precipitation
- Aims and scope
-
- Data and methods
-
- Reference present-day snowfall
- Bias-corrected present-day snowfall
- Projected snowfall
- The rain-snow line
-
- Present-day snowfall
-
- Seasonal cycles of precipitation and snowfall
- Comparison of snowfall estimates
-
- Projected future snowfall
-
- Basin-scale projections
- Regional projections
-
- Upper Indus western part
- Upper Indus eastern part
- Upper Brahmaputra western part
- Upper Brahmaputra eastern part
-
- Potential effects of reduced snowfall on water availability
-
- Concluding summary
-
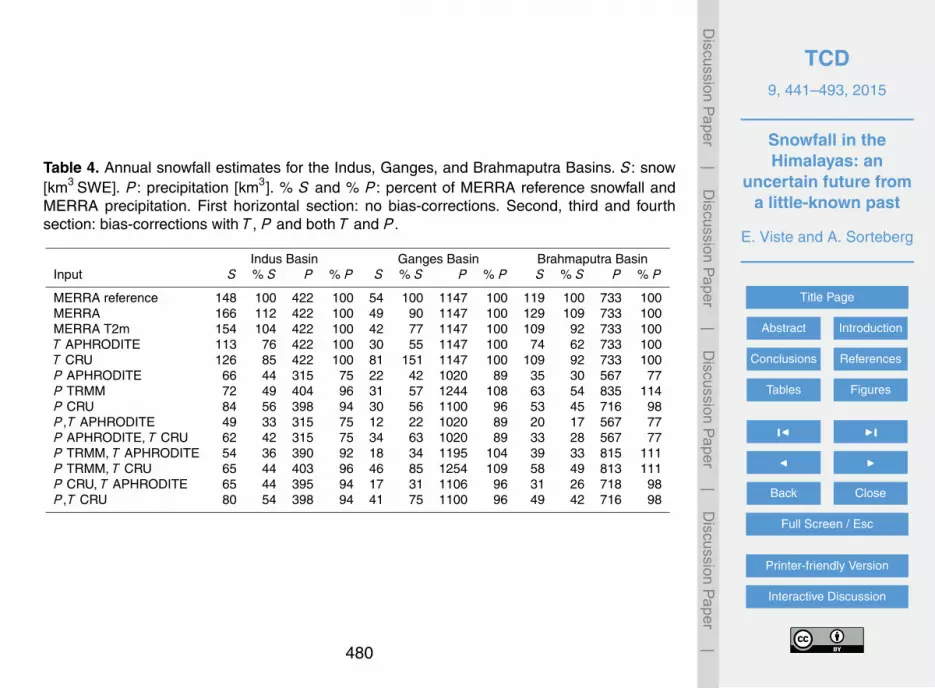
TCD9 441ndash493 2015
Snowfall in theHimalayas an
uncertain future froma little-known past
E Viste and A Sorteberg
Title Page
Abstract Introduction
Conclusions References
Tables Figures
J I
J I
Back Close
Full Screen Esc
Printer-friendly Version
Interactive Discussion
Discussion
Paper
|D
iscussionP
aper|
Discussion
Paper
|D
iscussionP
aper|
0
400 mm
Months 1ndash12
SP
I1
I2I3
I5I4
G1
G2G3
G4
B1
B2
B3B4
Viste amp SortebergFigure 2
Figure 2 Monthly mean MERRA precipitation and MERRA reference snowfall in sub-basinclusters of the Indus (I) Ganges (G) and Brahmaputra (B) Total bar height MERRA precip-itation (P) [mm] Colored bars snowfall (S) [mm SWE] based on MERRA precipitation andterrain-adjusted MERRA temperature in the region with the same color Cluster 1 in eachbasin is considered snow-free and the seasonal cycles are not shown
483
TCD9 441ndash493 2015
Snowfall in theHimalayas an
uncertain future froma little-known past
E Viste and A Sorteberg
Title Page
Abstract Introduction
Conclusions References
Tables Figures
J I
J I
Back Close
Full Screen Esc
Printer-friendly Version
Interactive Discussion
Discussion
Paper
|D
iscussionP
aper|
Discussion
Paper
|D
iscussionP
aper|
a) MERRA reference b) APHRODITE c) APHRODITE ndash MERRA ref
30 km3
20100-10-20-30
Viste amp SortebergFigure 3
Figure 3 The effect of bias-corrections with APHRODITE temperature and precipitation(a) MERRA reference snowfall (b) Snowfall based on bias-corrections with APHRODITE(c) APHRODITE (b) minus MERRA reference snowfall (a)
484
TCD9 441ndash493 2015
Snowfall in theHimalayas an
uncertain future froma little-known past
E Viste and A Sorteberg
Title Page
Abstract Introduction
Conclusions References
Tables Figures
J I
J I
Back Close
Full Screen Esc
Printer-friendly Version
Interactive Discussion
Discussion
Paper
|D
iscussionP
aper|
Discussion
Paper
|D
iscussionP
aper|
Figure 4 Difference between MERRA precipitation and observation-based data (a) Annualmean MERRA precipitation (b c and d) Annual mean MERRA precipitation bias-correctedwith observations APHRODITE CRU TS and TRMM 3B42 For each data set the small insetmaps show the observations minus MERRA
485
TCD9 441ndash493 2015
Snowfall in theHimalayas an
uncertain future froma little-known past
E Viste and A Sorteberg
Title Page
Abstract Introduction
Conclusions References
Tables Figures
J I
J I
Back Close
Full Screen Esc
Printer-friendly Version
Interactive Discussion
Discussion
Paper
|D
iscussionP
aper|
Discussion
Paper
|D
iscussionP
aper|
Biasminuscorrected minus original MERRA temperature [C]
minus15
minus10
minus5
0
5
10
Biasminuscorrected minus original MERRA temperature [C]
minus15
minus10
minus5
0
5
10
MERRA mean temperature [C] 1979minus2007
minus15
minus10
minus5
0
5
10
15
20
25
30a) MERRA b) APHRODITE ndash MERRA c) CRU ndash MERRA
-10
0
10
20
30degC
minus15
minus10
minus5
0
5
10
15degC
Viste amp SortebergFigure 5
Figure 5 Difference between MERRA temperature and observation-based data (a) Annualmean MERRA temperature (b and c) Annual mean MERRA temperature bias-corrected withobservations APHRODITE and CRU TS
486
TCD9 441ndash493 2015
Snowfall in theHimalayas an
uncertain future froma little-known past
E Viste and A Sorteberg
Title Page
Abstract Introduction
Conclusions References
Tables Figures
J I
J I
Back Close
Full Screen Esc
Printer-friendly Version
Interactive Discussion
Discussion
Paper
|D
iscussionP
aper|
Discussion
Paper
|D
iscussionP
aper|
Jan Apr
Jul Oct
a)
c)
b)
d)
15degC
10
5
0
ndash5
ndash10
ndash15
200 mm16012080400ndash40ndash80ndash120ndash160ndash200
Viste amp SortebergFigure 6
Figure 6 Regions where increasing temperatures are likely to cause a shift from snow to rainData monthly mean MERRA temperature terrain-adjusted to a 4 km GLOBE grid Red temper-ature between minus5 and 0 considered critical Small inset maps monthly MERRA precipitationin the critical zones
487
TCD9 441ndash493 2015
Snowfall in theHimalayas an
uncertain future froma little-known past
E Viste and A Sorteberg
Title Page
Abstract Introduction
Conclusions References
Tables Figures
J I
J I
Back Close
Full Screen Esc
Printer-friendly Version
Interactive Discussion
Discussion
Paper
|D
iscussionP
aper|
Discussion
Paper
|D
iscussionP
aper|
1 2 3 4 5 6 7 8 9 10 11 12Month
∆T [ordm
C]
a) Indus
0
1
2
3
4
5
6
7
8
9
10
b) Ganges∆T
[ordmC
]
1 2 3 4 5 6 7 8 9 10 11 12Month
1
2
3
4
5
6
7
8
0 0
c) Brahmaputra
∆T [ordm
C]
1 2 3 4 5 6 7 8 9 10 11 12Month
1
2
3
4
5
6
7
8
9
10 RCP 85RCP 85 meanRCP 26RCP 26 mean
Viste amp SortebergFigure 7
Figure 7 Projected future temperature change from 1971ndash2000 to 2071ndash2100 in the (a) In-dus (b) Ganges and (c) Brahmaputra Basins Thin lines show the individual CMIP5 modelsstronger lines the multi-model mean
488
TCD9 441ndash493 2015
Snowfall in theHimalayas an
uncertain future froma little-known past
E Viste and A Sorteberg
Title Page
Abstract Introduction
Conclusions References
Tables Figures
J I
J I
Back Close
Full Screen Esc
Printer-friendly Version
Interactive Discussion
Discussion
Paper
|D
iscussionP
aper|
Discussion
Paper
|D
iscussionP
aper|
1 2 3 4 5 6 7 8 9 10 11 12Month
[km
3 ]
a) Indus
0
20
40
60
80
100
120
140
b) Ganges[k
m3 ]
1 2 3 4 5 6 7 8 9 10 11 12Month
0
100
200
300
400
500
600
700
c) Brahmaputra
[km
3 ]
1 2 3 4 5 6 7 8 9 10 11 12Month
0
50
100
150
200
250
MERRA ref
2071ndash2100
1979ndash2008
RCP 85RCP 85 meanRCP 26RCP 26 mean
Viste amp SortebergFigure 8
Figure 8 Projected future precipitation in the (a) Indus (b) Ganges and (c) BrahmaputraBasins Gray bars MERRA 1979ndash2008 Thin lines and horizontal marks on the bars show theindividual CMIP5 models and the multi-model mean for 2071ndash2100
489
TCD9 441ndash493 2015
Snowfall in theHimalayas an
uncertain future froma little-known past
E Viste and A Sorteberg
Title Page
Abstract Introduction
Conclusions References
Tables Figures
J I
J I
Back Close
Full Screen Esc
Printer-friendly Version
Interactive Discussion
Discussion
Paper
|D
iscussionP
aper|
Discussion
Paper
|D
iscussionP
aper|
1 2 3 4 5 6 7 8 9 10 11 120
5
10
15
20
25
30
35
Month
SWE
[km
3 ]
a) Indus
0
1
2
3
4
5
6
7
8
b) Ganges
SWE
[km
3 ]
1 2 3 4 5 6 7 8 9 10 11 12Month
0
2
4
6
8
10
12
14
16
18
20
c) Brahmaputra
SWE
[km
3 ]
1 2 3 4 5 6 7 8 9 10 11 12Month
MERRA ref
2071ndash2100
1979ndash2008
RCP 85RCP 85 meanRCP 26RCP 26 mean
Viste amp SortebergFigure 9
Figure 9 Projected future snowfall in the (a) Indus (b) Ganges and (c) Brahmaputra Basinswith reference to MERRA reference snowfall Gray bars MERRA reference snowfall for 1979ndash2008 Thin lines and horizontal marks on the bars show the individual CMIP5 models andthe multi-model mean for 2071ndash2100 based on changes in temperature and precipitation asdescribed in Sect 23
490
TCD9 441ndash493 2015
Snowfall in theHimalayas an
uncertain future froma little-known past
E Viste and A Sorteberg
Title Page
Abstract Introduction
Conclusions References
Tables Figures
J I
J I
Back Close
Full Screen Esc
Printer-friendly Version
Interactive Discussion
Discussion
Paper
|D
iscussionP
aper|
Discussion
Paper
|D
iscussionP
aper|
Figure 10 Projected future changes in snowfall in sub-basins of the Indus Ganges andBrahmaputra Basins (a) Absolute change [km3] with reference to MERRA reference snow-fall (b) Absolute change [km3] with reference to APHRODITE snowfall (c d) Correspondingrelative changes [] with reference to MERRA and APHRODITE
491
TCD9 441ndash493 2015
Snowfall in theHimalayas an
uncertain future froma little-known past
E Viste and A Sorteberg
Title Page
Abstract Introduction
Conclusions References
Tables Figures
J I
J I
Back Close
Full Screen Esc
Printer-friendly Version
Interactive Discussion
Discussion
Paper
|D
iscussionP
aper|
Discussion
Paper
|D
iscussionP
aper|
J F M A M J J A S O N DMonth
0
5
10
15
20 km3Precip
0
2
4
6
8
10 km3SWE
2000
3000
4000
5000
6000 masl
1845
J F
M
A
M
JJ A
S
O
N
D
RSL
I4A = 146793 km2
1 km 3 = 68 mm
0
05
1
15 SWE rel
8000 m
0
J F M A M J J A S O N DMonth
0
2
4
6
8
10
12 km3 SWE
3000
4000
5000
6000 masl
78
2
14
J FM
A
MJ
J AS
O
ND
RSL
I5
Precip
0
5
10
15
20
25 km3
0
05
1
15 SWE rel
8000 m
0
A = 178669 km2
1 km 3 = 56 mm
CMIP52071ndash2100mean
Today
MERRA APHRODITE
Individual models
CMIP52071ndash2100mean
MERRA APHRODITE
Individual models
CMIP52071ndash2100Precip mean
MERRA APHRODITE
Individual models
SWE todayPrecip today
2000 mTerrain distribution of area between levels
CMIP52071ndash2100
TodayMERRA
APHRODITE
a)
i)
ii)
iii)
iv)
b)
Viste amp SortebergFigure 11
Figure 11 Monthly CMIP5 RCP 85 change in snowfall precipitation and rainsnow line eleva-tion in the upper Indus clusters (a) 4 and (b) 5 from 1971ndash2000 to 2071ndash2100 with referenceto the MERRA reference (red) and APHRODITE (blue) CMIP5 multi-model means are shownas horizontal marks individual models as dots Cluster location and terrain profile are shownabove the graphs (i) Fractional change in snowfall (ii) Future snowfall [km3] (dots) comparedto today (bars) (iii) Future precipitation [km3] (dots) compared to today (bars) Snowfall todayis shown as darker part of bars (iv) Rainsnow line elevation [m asl] Gray background el-evation histogram with the of total ground area lying in the marked 2000 m intervals Barschange from today (bottom) to CMIP5 multi-model mean (top)
492
TCD9 441ndash493 2015
Snowfall in theHimalayas an
uncertain future froma little-known past
E Viste and A Sorteberg
Title Page
Abstract Introduction
Conclusions References
Tables Figures
J I
J I
Back Close
Full Screen Esc
Printer-friendly Version
Interactive Discussion
Discussion
Paper
|D
iscussionP
aper|
Discussion
Paper
|D
iscussionP
aper|
3000
4000
5000
6000 masl
0
2
4
6
8
10 km3
0
10
20
30
40
50
60 km3
0
05
1
15
J F M A M J J A S O N DMonth
J FM
A
M
JJ A
S
O
ND
Precip
SWE
RSL
SWE rel
53
B3
8000 m
0
A = 139611 km2
1 km 3 = 72 mm
4500
5000
5500
6000
6500 masl
0
1
2
3
4 km3
0
10
20
30
40
50 km3
0
05
1
15 SWE rel
SWE
RSL
Precip
95
J F M A M J J A S O N DMonth
J FM
A
M
JJ A
S
ON
D
B4
8000 m
0
A = 159165 km2
1 km 3 = 63 mm
CMIP52071ndash2100mean
Today
MERRA APHRODITE
Individual models
CMIP52071ndash2100mean
MERRA APHRODITE
Individual models
CMIP52071ndash2100Precip mean
MERRA APHRODITE
Individual models
SWE todayPrecip today
2000 mTerrain distribution of area between levels
CMIP52071ndash2100
TodayMERRA
APHRODITE
a)
i)
ii)
iii)
iv)
b)
Viste amp SortebergFigure 12
Figure 12 Monthly CMIP5 RCP 85 change in snowfall precipitation and rainsnow line ele-vation in the upper Brahmaputra clusters (a) 4 and (b) 3 See Fig 11 for a description of thecontent
493
- Introduction
-
- Observed trends in snowfall temperature and precipitation
- Future projections of snowfall temperature and precipitation
- Aims and scope
-
- Data and methods
-
- Reference present-day snowfall
- Bias-corrected present-day snowfall
- Projected snowfall
- The rain-snow line
-
- Present-day snowfall
-
- Seasonal cycles of precipitation and snowfall
- Comparison of snowfall estimates
-
- Projected future snowfall
-
- Basin-scale projections
- Regional projections
-
- Upper Indus western part
- Upper Indus eastern part
- Upper Brahmaputra western part
- Upper Brahmaputra eastern part
-
- Potential effects of reduced snowfall on water availability
-
- Concluding summary
-

TCD9 441ndash493 2015
Snowfall in theHimalayas an
uncertain future froma little-known past
E Viste and A Sorteberg
Title Page
Abstract Introduction
Conclusions References
Tables Figures
J I
J I
Back Close
Full Screen Esc
Printer-friendly Version
Interactive Discussion
Discussion
Paper
|D
iscussionP
aper|
Discussion
Paper
|D
iscussionP
aper|
Biasminuscorrected minus original MERRA temperature [C]
minus15
minus10
minus5
0
5
10
Biasminuscorrected minus original MERRA temperature [C]
minus15
minus10
minus5
0
5
10
MERRA mean temperature [C] 1979minus2007
minus15
minus10
minus5
0
5
10
15
20
25
30a) MERRA b) APHRODITE ndash MERRA c) CRU ndash MERRA
-10
0
10
20
30degC
minus15
minus10
minus5
0
5
10
15degC
Viste amp SortebergFigure 5
Figure 5 Difference between MERRA temperature and observation-based data (a) Annualmean MERRA temperature (b and c) Annual mean MERRA temperature bias-corrected withobservations APHRODITE and CRU TS
486
TCD9 441ndash493 2015
Snowfall in theHimalayas an
uncertain future froma little-known past
E Viste and A Sorteberg
Title Page
Abstract Introduction
Conclusions References
Tables Figures
J I
J I
Back Close
Full Screen Esc
Printer-friendly Version
Interactive Discussion
Discussion
Paper
|D
iscussionP
aper|
Discussion
Paper
|D
iscussionP
aper|
Jan Apr
Jul Oct
a)
c)
b)
d)
15degC
10
5
0
ndash5
ndash10
ndash15
200 mm16012080400ndash40ndash80ndash120ndash160ndash200
Viste amp SortebergFigure 6
Figure 6 Regions where increasing temperatures are likely to cause a shift from snow to rainData monthly mean MERRA temperature terrain-adjusted to a 4 km GLOBE grid Red temper-ature between minus5 and 0 considered critical Small inset maps monthly MERRA precipitationin the critical zones
487
TCD9 441ndash493 2015
Snowfall in theHimalayas an
uncertain future froma little-known past
E Viste and A Sorteberg
Title Page
Abstract Introduction
Conclusions References
Tables Figures
J I
J I
Back Close
Full Screen Esc
Printer-friendly Version
Interactive Discussion
Discussion
Paper
|D
iscussionP
aper|
Discussion
Paper
|D
iscussionP
aper|
1 2 3 4 5 6 7 8 9 10 11 12Month
∆T [ordm
C]
a) Indus
0
1
2
3
4
5
6
7
8
9
10
b) Ganges∆T
[ordmC
]
1 2 3 4 5 6 7 8 9 10 11 12Month
1
2
3
4
5
6
7
8
0 0
c) Brahmaputra
∆T [ordm
C]
1 2 3 4 5 6 7 8 9 10 11 12Month
1
2
3
4
5
6
7
8
9
10 RCP 85RCP 85 meanRCP 26RCP 26 mean
Viste amp SortebergFigure 7
Figure 7 Projected future temperature change from 1971ndash2000 to 2071ndash2100 in the (a) In-dus (b) Ganges and (c) Brahmaputra Basins Thin lines show the individual CMIP5 modelsstronger lines the multi-model mean
488
TCD9 441ndash493 2015
Snowfall in theHimalayas an
uncertain future froma little-known past
E Viste and A Sorteberg
Title Page
Abstract Introduction
Conclusions References
Tables Figures
J I
J I
Back Close
Full Screen Esc
Printer-friendly Version
Interactive Discussion
Discussion
Paper
|D
iscussionP
aper|
Discussion
Paper
|D
iscussionP
aper|
1 2 3 4 5 6 7 8 9 10 11 12Month
[km
3 ]
a) Indus
0
20
40
60
80
100
120
140
b) Ganges[k
m3 ]
1 2 3 4 5 6 7 8 9 10 11 12Month
0
100
200
300
400
500
600
700
c) Brahmaputra
[km
3 ]
1 2 3 4 5 6 7 8 9 10 11 12Month
0
50
100
150
200
250
MERRA ref
2071ndash2100
1979ndash2008
RCP 85RCP 85 meanRCP 26RCP 26 mean
Viste amp SortebergFigure 8
Figure 8 Projected future precipitation in the (a) Indus (b) Ganges and (c) BrahmaputraBasins Gray bars MERRA 1979ndash2008 Thin lines and horizontal marks on the bars show theindividual CMIP5 models and the multi-model mean for 2071ndash2100
489
TCD9 441ndash493 2015
Snowfall in theHimalayas an
uncertain future froma little-known past
E Viste and A Sorteberg
Title Page
Abstract Introduction
Conclusions References
Tables Figures
J I
J I
Back Close
Full Screen Esc
Printer-friendly Version
Interactive Discussion
Discussion
Paper
|D
iscussionP
aper|
Discussion
Paper
|D
iscussionP
aper|
1 2 3 4 5 6 7 8 9 10 11 120
5
10
15
20
25
30
35
Month
SWE
[km
3 ]
a) Indus
0
1
2
3
4
5
6
7
8
b) Ganges
SWE
[km
3 ]
1 2 3 4 5 6 7 8 9 10 11 12Month
0
2
4
6
8
10
12
14
16
18
20
c) Brahmaputra
SWE
[km
3 ]
1 2 3 4 5 6 7 8 9 10 11 12Month
MERRA ref
2071ndash2100
1979ndash2008
RCP 85RCP 85 meanRCP 26RCP 26 mean
Viste amp SortebergFigure 9
Figure 9 Projected future snowfall in the (a) Indus (b) Ganges and (c) Brahmaputra Basinswith reference to MERRA reference snowfall Gray bars MERRA reference snowfall for 1979ndash2008 Thin lines and horizontal marks on the bars show the individual CMIP5 models andthe multi-model mean for 2071ndash2100 based on changes in temperature and precipitation asdescribed in Sect 23
490
TCD9 441ndash493 2015
Snowfall in theHimalayas an
uncertain future froma little-known past
E Viste and A Sorteberg
Title Page
Abstract Introduction
Conclusions References
Tables Figures
J I
J I
Back Close
Full Screen Esc
Printer-friendly Version
Interactive Discussion
Discussion
Paper
|D
iscussionP
aper|
Discussion
Paper
|D
iscussionP
aper|
Figure 10 Projected future changes in snowfall in sub-basins of the Indus Ganges andBrahmaputra Basins (a) Absolute change [km3] with reference to MERRA reference snow-fall (b) Absolute change [km3] with reference to APHRODITE snowfall (c d) Correspondingrelative changes [] with reference to MERRA and APHRODITE
491
TCD9 441ndash493 2015
Snowfall in theHimalayas an
uncertain future froma little-known past
E Viste and A Sorteberg
Title Page
Abstract Introduction
Conclusions References
Tables Figures
J I
J I
Back Close
Full Screen Esc
Printer-friendly Version
Interactive Discussion
Discussion
Paper
|D
iscussionP
aper|
Discussion
Paper
|D
iscussionP
aper|
J F M A M J J A S O N DMonth
0
5
10
15
20 km3Precip
0
2
4
6
8
10 km3SWE
2000
3000
4000
5000
6000 masl
1845
J F
M
A
M
JJ A
S
O
N
D
RSL
I4A = 146793 km2
1 km 3 = 68 mm
0
05
1
15 SWE rel
8000 m
0
J F M A M J J A S O N DMonth
0
2
4
6
8
10
12 km3 SWE
3000
4000
5000
6000 masl
78
2
14
J FM
A
MJ
J AS
O
ND
RSL
I5
Precip
0
5
10
15
20
25 km3
0
05
1
15 SWE rel
8000 m
0
A = 178669 km2
1 km 3 = 56 mm
CMIP52071ndash2100mean
Today
MERRA APHRODITE
Individual models
CMIP52071ndash2100mean
MERRA APHRODITE
Individual models
CMIP52071ndash2100Precip mean
MERRA APHRODITE
Individual models
SWE todayPrecip today
2000 mTerrain distribution of area between levels
CMIP52071ndash2100
TodayMERRA
APHRODITE
a)
i)
ii)
iii)
iv)
b)
Viste amp SortebergFigure 11
Figure 11 Monthly CMIP5 RCP 85 change in snowfall precipitation and rainsnow line eleva-tion in the upper Indus clusters (a) 4 and (b) 5 from 1971ndash2000 to 2071ndash2100 with referenceto the MERRA reference (red) and APHRODITE (blue) CMIP5 multi-model means are shownas horizontal marks individual models as dots Cluster location and terrain profile are shownabove the graphs (i) Fractional change in snowfall (ii) Future snowfall [km3] (dots) comparedto today (bars) (iii) Future precipitation [km3] (dots) compared to today (bars) Snowfall todayis shown as darker part of bars (iv) Rainsnow line elevation [m asl] Gray background el-evation histogram with the of total ground area lying in the marked 2000 m intervals Barschange from today (bottom) to CMIP5 multi-model mean (top)
492
TCD9 441ndash493 2015
Snowfall in theHimalayas an
uncertain future froma little-known past
E Viste and A Sorteberg
Title Page
Abstract Introduction
Conclusions References
Tables Figures
J I
J I
Back Close
Full Screen Esc
Printer-friendly Version
Interactive Discussion
Discussion
Paper
|D
iscussionP
aper|
Discussion
Paper
|D
iscussionP
aper|
3000
4000
5000
6000 masl
0
2
4
6
8
10 km3
0
10
20
30
40
50
60 km3
0
05
1
15
J F M A M J J A S O N DMonth
J FM
A
M
JJ A
S
O
ND
Precip
SWE
RSL
SWE rel
53
B3
8000 m
0
A = 139611 km2
1 km 3 = 72 mm
4500
5000
5500
6000
6500 masl
0
1
2
3
4 km3
0
10
20
30
40
50 km3
0
05
1
15 SWE rel
SWE
RSL
Precip
95
J F M A M J J A S O N DMonth
J FM
A
M
JJ A
S
ON
D
B4
8000 m
0
A = 159165 km2
1 km 3 = 63 mm
CMIP52071ndash2100mean
Today
MERRA APHRODITE
Individual models
CMIP52071ndash2100mean
MERRA APHRODITE
Individual models
CMIP52071ndash2100Precip mean
MERRA APHRODITE
Individual models
SWE todayPrecip today
2000 mTerrain distribution of area between levels
CMIP52071ndash2100
TodayMERRA
APHRODITE
a)
i)
ii)
iii)
iv)
b)
Viste amp SortebergFigure 12
Figure 12 Monthly CMIP5 RCP 85 change in snowfall precipitation and rainsnow line ele-vation in the upper Brahmaputra clusters (a) 4 and (b) 3 See Fig 11 for a description of thecontent
493
- Introduction
-
- Observed trends in snowfall temperature and precipitation
- Future projections of snowfall temperature and precipitation
- Aims and scope
-
- Data and methods
-
- Reference present-day snowfall
- Bias-corrected present-day snowfall
- Projected snowfall
- The rain-snow line
-
- Present-day snowfall
-
- Seasonal cycles of precipitation and snowfall
- Comparison of snowfall estimates
-
- Projected future snowfall
-
- Basin-scale projections
- Regional projections
-
- Upper Indus western part
- Upper Indus eastern part
- Upper Brahmaputra western part
- Upper Brahmaputra eastern part
-
- Potential effects of reduced snowfall on water availability
-
- Concluding summary
-
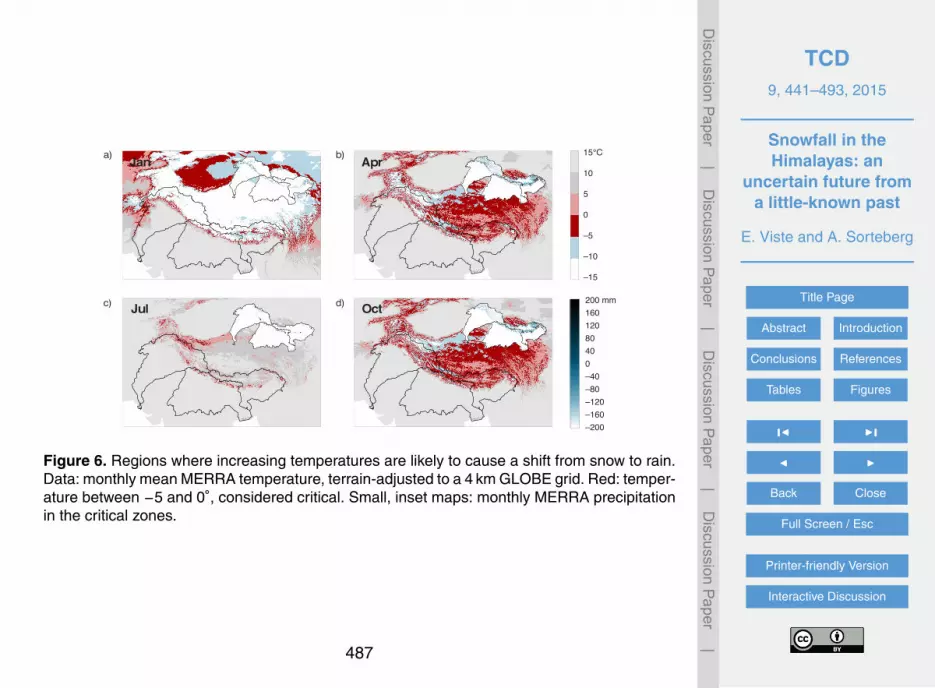
TCD9 441ndash493 2015
Snowfall in theHimalayas an
uncertain future froma little-known past
E Viste and A Sorteberg
Title Page
Abstract Introduction
Conclusions References
Tables Figures
J I
J I
Back Close
Full Screen Esc
Printer-friendly Version
Interactive Discussion
Discussion
Paper
|D
iscussionP
aper|
Discussion
Paper
|D
iscussionP
aper|
1 2 3 4 5 6 7 8 9 10 11 12Month
∆T [ordm
C]
a) Indus
0
1
2
3
4
5
6
7
8
9
10
b) Ganges∆T
[ordmC
]
1 2 3 4 5 6 7 8 9 10 11 12Month
1
2
3
4
5
6
7
8
0 0
c) Brahmaputra
∆T [ordm
C]
1 2 3 4 5 6 7 8 9 10 11 12Month
1
2
3
4
5
6
7
8
9
10 RCP 85RCP 85 meanRCP 26RCP 26 mean
Viste amp SortebergFigure 7
Figure 7 Projected future temperature change from 1971ndash2000 to 2071ndash2100 in the (a) In-dus (b) Ganges and (c) Brahmaputra Basins Thin lines show the individual CMIP5 modelsstronger lines the multi-model mean
488
TCD9 441ndash493 2015
Snowfall in theHimalayas an
uncertain future froma little-known past
E Viste and A Sorteberg
Title Page
Abstract Introduction
Conclusions References
Tables Figures
J I
J I
Back Close
Full Screen Esc
Printer-friendly Version
Interactive Discussion
Discussion
Paper
|D
iscussionP
aper|
Discussion
Paper
|D
iscussionP
aper|
1 2 3 4 5 6 7 8 9 10 11 12Month
[km
3 ]
a) Indus
0
20
40
60
80
100
120
140
b) Ganges[k
m3 ]
1 2 3 4 5 6 7 8 9 10 11 12Month
0
100
200
300
400
500
600
700
c) Brahmaputra
[km
3 ]
1 2 3 4 5 6 7 8 9 10 11 12Month
0
50
100
150
200
250
MERRA ref
2071ndash2100
1979ndash2008
RCP 85RCP 85 meanRCP 26RCP 26 mean
Viste amp SortebergFigure 8
Figure 8 Projected future precipitation in the (a) Indus (b) Ganges and (c) BrahmaputraBasins Gray bars MERRA 1979ndash2008 Thin lines and horizontal marks on the bars show theindividual CMIP5 models and the multi-model mean for 2071ndash2100
489
TCD9 441ndash493 2015
Snowfall in theHimalayas an
uncertain future froma little-known past
E Viste and A Sorteberg
Title Page
Abstract Introduction
Conclusions References
Tables Figures
J I
J I
Back Close
Full Screen Esc
Printer-friendly Version
Interactive Discussion
Discussion
Paper
|D
iscussionP
aper|
Discussion
Paper
|D
iscussionP
aper|
1 2 3 4 5 6 7 8 9 10 11 120
5
10
15
20
25
30
35
Month
SWE
[km
3 ]
a) Indus
0
1
2
3
4
5
6
7
8
b) Ganges
SWE
[km
3 ]
1 2 3 4 5 6 7 8 9 10 11 12Month
0
2
4
6
8
10
12
14
16
18
20
c) Brahmaputra
SWE
[km
3 ]
1 2 3 4 5 6 7 8 9 10 11 12Month
MERRA ref
2071ndash2100
1979ndash2008
RCP 85RCP 85 meanRCP 26RCP 26 mean
Viste amp SortebergFigure 9
Figure 9 Projected future snowfall in the (a) Indus (b) Ganges and (c) Brahmaputra Basinswith reference to MERRA reference snowfall Gray bars MERRA reference snowfall for 1979ndash2008 Thin lines and horizontal marks on the bars show the individual CMIP5 models andthe multi-model mean for 2071ndash2100 based on changes in temperature and precipitation asdescribed in Sect 23
490
TCD9 441ndash493 2015
Snowfall in theHimalayas an
uncertain future froma little-known past
E Viste and A Sorteberg
Title Page
Abstract Introduction
Conclusions References
Tables Figures
J I
J I
Back Close
Full Screen Esc
Printer-friendly Version
Interactive Discussion
Discussion
Paper
|D
iscussionP
aper|
Discussion
Paper
|D
iscussionP
aper|
Figure 10 Projected future changes in snowfall in sub-basins of the Indus Ganges andBrahmaputra Basins (a) Absolute change [km3] with reference to MERRA reference snow-fall (b) Absolute change [km3] with reference to APHRODITE snowfall (c d) Correspondingrelative changes [] with reference to MERRA and APHRODITE
491
TCD9 441ndash493 2015
Snowfall in theHimalayas an
uncertain future froma little-known past
E Viste and A Sorteberg
Title Page
Abstract Introduction
Conclusions References
Tables Figures
J I
J I
Back Close
Full Screen Esc
Printer-friendly Version
Interactive Discussion
Discussion
Paper
|D
iscussionP
aper|
Discussion
Paper
|D
iscussionP
aper|
J F M A M J J A S O N DMonth
0
5
10
15
20 km3Precip
0
2
4
6
8
10 km3SWE
2000
3000
4000
5000
6000 masl
1845
J F
M
A
M
JJ A
S
O
N
D
RSL
I4A = 146793 km2
1 km 3 = 68 mm
0
05
1
15 SWE rel
8000 m
0
J F M A M J J A S O N DMonth
0
2
4
6
8
10
12 km3 SWE
3000
4000
5000
6000 masl
78
2
14
J FM
A
MJ
J AS
O
ND
RSL
I5
Precip
0
5
10
15
20
25 km3
0
05
1
15 SWE rel
8000 m
0
A = 178669 km2
1 km 3 = 56 mm
CMIP52071ndash2100mean
Today
MERRA APHRODITE
Individual models
CMIP52071ndash2100mean
MERRA APHRODITE
Individual models
CMIP52071ndash2100Precip mean
MERRA APHRODITE
Individual models
SWE todayPrecip today
2000 mTerrain distribution of area between levels
CMIP52071ndash2100
TodayMERRA
APHRODITE
a)
i)
ii)
iii)
iv)
b)
Viste amp SortebergFigure 11
Figure 11 Monthly CMIP5 RCP 85 change in snowfall precipitation and rainsnow line eleva-tion in the upper Indus clusters (a) 4 and (b) 5 from 1971ndash2000 to 2071ndash2100 with referenceto the MERRA reference (red) and APHRODITE (blue) CMIP5 multi-model means are shownas horizontal marks individual models as dots Cluster location and terrain profile are shownabove the graphs (i) Fractional change in snowfall (ii) Future snowfall [km3] (dots) comparedto today (bars) (iii) Future precipitation [km3] (dots) compared to today (bars) Snowfall todayis shown as darker part of bars (iv) Rainsnow line elevation [m asl] Gray background el-evation histogram with the of total ground area lying in the marked 2000 m intervals Barschange from today (bottom) to CMIP5 multi-model mean (top)
492
TCD9 441ndash493 2015
Snowfall in theHimalayas an
uncertain future froma little-known past
E Viste and A Sorteberg
Title Page
Abstract Introduction
Conclusions References
Tables Figures
J I
J I
Back Close
Full Screen Esc
Printer-friendly Version
Interactive Discussion
Discussion
Paper
|D
iscussionP
aper|
Discussion
Paper
|D
iscussionP
aper|
3000
4000
5000
6000 masl
0
2
4
6
8
10 km3
0
10
20
30
40
50
60 km3
0
05
1
15
J F M A M J J A S O N DMonth
J FM
A
M
JJ A
S
O
ND
Precip
SWE
RSL
SWE rel
53
B3
8000 m
0
A = 139611 km2
1 km 3 = 72 mm
4500
5000
5500
6000
6500 masl
0
1
2
3
4 km3
0
10
20
30
40
50 km3
0
05
1
15 SWE rel
SWE
RSL
Precip
95
J F M A M J J A S O N DMonth
J FM
A
M
JJ A
S
ON
D
B4
8000 m
0
A = 159165 km2
1 km 3 = 63 mm
CMIP52071ndash2100mean
Today
MERRA APHRODITE
Individual models
CMIP52071ndash2100mean
MERRA APHRODITE
Individual models
CMIP52071ndash2100Precip mean
MERRA APHRODITE
Individual models
SWE todayPrecip today
2000 mTerrain distribution of area between levels
CMIP52071ndash2100
TodayMERRA
APHRODITE
a)
i)
ii)
iii)
iv)
b)
Viste amp SortebergFigure 12
Figure 12 Monthly CMIP5 RCP 85 change in snowfall precipitation and rainsnow line ele-vation in the upper Brahmaputra clusters (a) 4 and (b) 3 See Fig 11 for a description of thecontent
493
- Introduction
-
- Observed trends in snowfall temperature and precipitation
- Future projections of snowfall temperature and precipitation
- Aims and scope
-
- Data and methods
-
- Reference present-day snowfall
- Bias-corrected present-day snowfall
- Projected snowfall
- The rain-snow line
-
- Present-day snowfall
-
- Seasonal cycles of precipitation and snowfall
- Comparison of snowfall estimates
-
- Projected future snowfall
-
- Basin-scale projections
- Regional projections
-
- Upper Indus western part
- Upper Indus eastern part
- Upper Brahmaputra western part
- Upper Brahmaputra eastern part
-
- Potential effects of reduced snowfall on water availability
-
- Concluding summary
-

TCD9 441ndash493 2015
Snowfall in theHimalayas an
uncertain future froma little-known past
E Viste and A Sorteberg
Title Page
Abstract Introduction
Conclusions References
Tables Figures
J I
J I
Back Close
Full Screen Esc
Printer-friendly Version
Interactive Discussion
Discussion
Paper
|D
iscussionP
aper|
Discussion
Paper
|D
iscussionP
aper|
1 2 3 4 5 6 7 8 9 10 11 12Month
[km
3 ]
a) Indus
0
20
40
60
80
100
120
140
b) Ganges[k
m3 ]
1 2 3 4 5 6 7 8 9 10 11 12Month
0
100
200
300
400
500
600
700
c) Brahmaputra
[km
3 ]
1 2 3 4 5 6 7 8 9 10 11 12Month
0
50
100
150
200
250
MERRA ref
2071ndash2100
1979ndash2008
RCP 85RCP 85 meanRCP 26RCP 26 mean
Viste amp SortebergFigure 8
Figure 8 Projected future precipitation in the (a) Indus (b) Ganges and (c) BrahmaputraBasins Gray bars MERRA 1979ndash2008 Thin lines and horizontal marks on the bars show theindividual CMIP5 models and the multi-model mean for 2071ndash2100
489
TCD9 441ndash493 2015
Snowfall in theHimalayas an
uncertain future froma little-known past
E Viste and A Sorteberg
Title Page
Abstract Introduction
Conclusions References
Tables Figures
J I
J I
Back Close
Full Screen Esc
Printer-friendly Version
Interactive Discussion
Discussion
Paper
|D
iscussionP
aper|
Discussion
Paper
|D
iscussionP
aper|
1 2 3 4 5 6 7 8 9 10 11 120
5
10
15
20
25
30
35
Month
SWE
[km
3 ]
a) Indus
0
1
2
3
4
5
6
7
8
b) Ganges
SWE
[km
3 ]
1 2 3 4 5 6 7 8 9 10 11 12Month
0
2
4
6
8
10
12
14
16
18
20
c) Brahmaputra
SWE
[km
3 ]
1 2 3 4 5 6 7 8 9 10 11 12Month
MERRA ref
2071ndash2100
1979ndash2008
RCP 85RCP 85 meanRCP 26RCP 26 mean
Viste amp SortebergFigure 9
Figure 9 Projected future snowfall in the (a) Indus (b) Ganges and (c) Brahmaputra Basinswith reference to MERRA reference snowfall Gray bars MERRA reference snowfall for 1979ndash2008 Thin lines and horizontal marks on the bars show the individual CMIP5 models andthe multi-model mean for 2071ndash2100 based on changes in temperature and precipitation asdescribed in Sect 23
490
TCD9 441ndash493 2015
Snowfall in theHimalayas an
uncertain future froma little-known past
E Viste and A Sorteberg
Title Page
Abstract Introduction
Conclusions References
Tables Figures
J I
J I
Back Close
Full Screen Esc
Printer-friendly Version
Interactive Discussion
Discussion
Paper
|D
iscussionP
aper|
Discussion
Paper
|D
iscussionP
aper|
Figure 10 Projected future changes in snowfall in sub-basins of the Indus Ganges andBrahmaputra Basins (a) Absolute change [km3] with reference to MERRA reference snow-fall (b) Absolute change [km3] with reference to APHRODITE snowfall (c d) Correspondingrelative changes [] with reference to MERRA and APHRODITE
491
TCD9 441ndash493 2015
Snowfall in theHimalayas an
uncertain future froma little-known past
E Viste and A Sorteberg
Title Page
Abstract Introduction
Conclusions References
Tables Figures
J I
J I
Back Close
Full Screen Esc
Printer-friendly Version
Interactive Discussion
Discussion
Paper
|D
iscussionP
aper|
Discussion
Paper
|D
iscussionP
aper|
J F M A M J J A S O N DMonth
0
5
10
15
20 km3Precip
0
2
4
6
8
10 km3SWE
2000
3000
4000
5000
6000 masl
1845
J F
M
A
M
JJ A
S
O
N
D
RSL
I4A = 146793 km2
1 km 3 = 68 mm
0
05
1
15 SWE rel
8000 m
0
J F M A M J J A S O N DMonth
0
2
4
6
8
10
12 km3 SWE
3000
4000
5000
6000 masl
78
2
14
J FM
A
MJ
J AS
O
ND
RSL
I5
Precip
0
5
10
15
20
25 km3
0
05
1
15 SWE rel
8000 m
0
A = 178669 km2
1 km 3 = 56 mm
CMIP52071ndash2100mean
Today
MERRA APHRODITE
Individual models
CMIP52071ndash2100mean
MERRA APHRODITE
Individual models
CMIP52071ndash2100Precip mean
MERRA APHRODITE
Individual models
SWE todayPrecip today
2000 mTerrain distribution of area between levels
CMIP52071ndash2100
TodayMERRA
APHRODITE
a)
i)
ii)
iii)
iv)
b)
Viste amp SortebergFigure 11
Figure 11 Monthly CMIP5 RCP 85 change in snowfall precipitation and rainsnow line eleva-tion in the upper Indus clusters (a) 4 and (b) 5 from 1971ndash2000 to 2071ndash2100 with referenceto the MERRA reference (red) and APHRODITE (blue) CMIP5 multi-model means are shownas horizontal marks individual models as dots Cluster location and terrain profile are shownabove the graphs (i) Fractional change in snowfall (ii) Future snowfall [km3] (dots) comparedto today (bars) (iii) Future precipitation [km3] (dots) compared to today (bars) Snowfall todayis shown as darker part of bars (iv) Rainsnow line elevation [m asl] Gray background el-evation histogram with the of total ground area lying in the marked 2000 m intervals Barschange from today (bottom) to CMIP5 multi-model mean (top)
492
TCD9 441ndash493 2015
Snowfall in theHimalayas an
uncertain future froma little-known past
E Viste and A Sorteberg
Title Page
Abstract Introduction
Conclusions References
Tables Figures
J I
J I
Back Close
Full Screen Esc
Printer-friendly Version
Interactive Discussion
Discussion
Paper
|D
iscussionP
aper|
Discussion
Paper
|D
iscussionP
aper|
3000
4000
5000
6000 masl
0
2
4
6
8
10 km3
0
10
20
30
40
50
60 km3
0
05
1
15
J F M A M J J A S O N DMonth
J FM
A
M
JJ A
S
O
ND
Precip
SWE
RSL
SWE rel
53
B3
8000 m
0
A = 139611 km2
1 km 3 = 72 mm
4500
5000
5500
6000
6500 masl
0
1
2
3
4 km3
0
10
20
30
40
50 km3
0
05
1
15 SWE rel
SWE
RSL
Precip
95
J F M A M J J A S O N DMonth
J FM
A
M
JJ A
S
ON
D
B4
8000 m
0
A = 159165 km2
1 km 3 = 63 mm
CMIP52071ndash2100mean
Today
MERRA APHRODITE
Individual models
CMIP52071ndash2100mean
MERRA APHRODITE
Individual models
CMIP52071ndash2100Precip mean
MERRA APHRODITE
Individual models
SWE todayPrecip today
2000 mTerrain distribution of area between levels
CMIP52071ndash2100
TodayMERRA
APHRODITE
a)
i)
ii)
iii)
iv)
b)
Viste amp SortebergFigure 12
Figure 12 Monthly CMIP5 RCP 85 change in snowfall precipitation and rainsnow line ele-vation in the upper Brahmaputra clusters (a) 4 and (b) 3 See Fig 11 for a description of thecontent
493
- Introduction
-
- Observed trends in snowfall temperature and precipitation
- Future projections of snowfall temperature and precipitation
- Aims and scope
-
- Data and methods
-
- Reference present-day snowfall
- Bias-corrected present-day snowfall
- Projected snowfall
- The rain-snow line
-
- Present-day snowfall
-
- Seasonal cycles of precipitation and snowfall
- Comparison of snowfall estimates
-
- Projected future snowfall
-
- Basin-scale projections
- Regional projections
-
- Upper Indus western part
- Upper Indus eastern part
- Upper Brahmaputra western part
- Upper Brahmaputra eastern part
-
- Potential effects of reduced snowfall on water availability
-
- Concluding summary
-
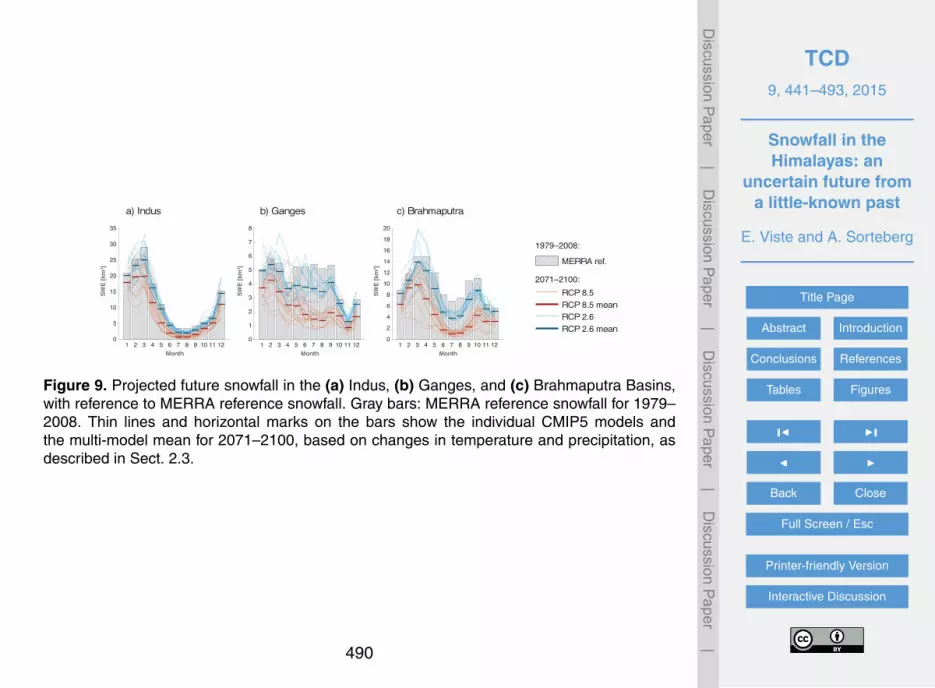
TCD9 441ndash493 2015
Snowfall in theHimalayas an
uncertain future froma little-known past
E Viste and A Sorteberg
Title Page
Abstract Introduction
Conclusions References
Tables Figures
J I
J I
Back Close
Full Screen Esc
Printer-friendly Version
Interactive Discussion
Discussion
Paper
|D
iscussionP
aper|
Discussion
Paper
|D
iscussionP
aper|
J F M A M J J A S O N DMonth
0
5
10
15
20 km3Precip
0
2
4
6
8
10 km3SWE
2000
3000
4000
5000
6000 masl
1845
J F
M
A
M
JJ A
S
O
N
D
RSL
I4A = 146793 km2
1 km 3 = 68 mm
0
05
1
15 SWE rel
8000 m
0
J F M A M J J A S O N DMonth
0
2
4
6
8
10
12 km3 SWE
3000
4000
5000
6000 masl
78
2
14
J FM
A
MJ
J AS
O
ND
RSL
I5
Precip
0
5
10
15
20
25 km3
0
05
1
15 SWE rel
8000 m
0
A = 178669 km2
1 km 3 = 56 mm
CMIP52071ndash2100mean
Today
MERRA APHRODITE
Individual models
CMIP52071ndash2100mean
MERRA APHRODITE
Individual models
CMIP52071ndash2100Precip mean
MERRA APHRODITE
Individual models
SWE todayPrecip today
2000 mTerrain distribution of area between levels
CMIP52071ndash2100
TodayMERRA
APHRODITE
a)
i)
ii)
iii)
iv)
b)
Viste amp SortebergFigure 11
Figure 11 Monthly CMIP5 RCP 85 change in snowfall precipitation and rainsnow line eleva-tion in the upper Indus clusters (a) 4 and (b) 5 from 1971ndash2000 to 2071ndash2100 with referenceto the MERRA reference (red) and APHRODITE (blue) CMIP5 multi-model means are shownas horizontal marks individual models as dots Cluster location and terrain profile are shownabove the graphs (i) Fractional change in snowfall (ii) Future snowfall [km3] (dots) comparedto today (bars) (iii) Future precipitation [km3] (dots) compared to today (bars) Snowfall todayis shown as darker part of bars (iv) Rainsnow line elevation [m asl] Gray background el-evation histogram with the of total ground area lying in the marked 2000 m intervals Barschange from today (bottom) to CMIP5 multi-model mean (top)
492
TCD9 441ndash493 2015
Snowfall in theHimalayas an
uncertain future froma little-known past
E Viste and A Sorteberg
Title Page
Abstract Introduction
Conclusions References
Tables Figures
J I
J I
Back Close
Full Screen Esc
Printer-friendly Version
Interactive Discussion
Discussion
Paper
|D
iscussionP
aper|
Discussion
Paper
|D
iscussionP
aper|
3000
4000
5000
6000 masl
0
2
4
6
8
10 km3
0
10
20
30
40
50
60 km3
0
05
1
15
J F M A M J J A S O N DMonth
J FM
A
M
JJ A
S
O
ND
Precip
SWE
RSL
SWE rel
53
B3
8000 m
0
A = 139611 km2
1 km 3 = 72 mm
4500
5000
5500
6000
6500 masl
0
1
2
3
4 km3
0
10
20
30
40
50 km3
0
05
1
15 SWE rel
SWE
RSL
Precip
95
J F M A M J J A S O N DMonth
J FM
A
M
JJ A
S
ON
D
B4
8000 m
0
A = 159165 km2
1 km 3 = 63 mm
CMIP52071ndash2100mean
Today
MERRA APHRODITE
Individual models
CMIP52071ndash2100mean
MERRA APHRODITE
Individual models
CMIP52071ndash2100Precip mean
MERRA APHRODITE
Individual models
SWE todayPrecip today
2000 mTerrain distribution of area between levels
CMIP52071ndash2100
TodayMERRA
APHRODITE
a)
i)
ii)
iii)
iv)
b)
Viste amp SortebergFigure 12
Figure 12 Monthly CMIP5 RCP 85 change in snowfall precipitation and rainsnow line ele-vation in the upper Brahmaputra clusters (a) 4 and (b) 3 See Fig 11 for a description of thecontent
493
- Introduction
-
- Observed trends in snowfall temperature and precipitation
- Future projections of snowfall temperature and precipitation
- Aims and scope
-
- Data and methods
-
- Reference present-day snowfall
- Bias-corrected present-day snowfall
- Projected snowfall
- The rain-snow line
-
- Present-day snowfall
-
- Seasonal cycles of precipitation and snowfall
- Comparison of snowfall estimates
-
- Projected future snowfall
-
- Basin-scale projections
- Regional projections
-
- Upper Indus western part
- Upper Indus eastern part
- Upper Brahmaputra western part
- Upper Brahmaputra eastern part
-
- Potential effects of reduced snowfall on water availability
-
- Concluding summary
-

TCD9 441ndash493 2015
Snowfall in theHimalayas an
uncertain future froma little-known past
E Viste and A Sorteberg
Title Page
Abstract Introduction
Conclusions References
Tables Figures
J I
J I
Back Close
Full Screen Esc
Printer-friendly Version
Interactive Discussion
Discussion
Paper
|D
iscussionP
aper|
Discussion
Paper
|D
iscussionP
aper|
3000
4000
5000
6000 masl
0
2
4
6
8
10 km3
0
10
20
30
40
50
60 km3
0
05
1
15
J F M A M J J A S O N DMonth
J FM
A
M
JJ A
S
O
ND
Precip
SWE
RSL
SWE rel
53
B3
8000 m
0
A = 139611 km2
1 km 3 = 72 mm
4500
5000
5500
6000
6500 masl
0
1
2
3
4 km3
0
10
20
30
40
50 km3
0
05
1
15 SWE rel
SWE
RSL
Precip
95
J F M A M J J A S O N DMonth
J FM
A
M
JJ A
S
ON
D
B4
8000 m
0
A = 159165 km2
1 km 3 = 63 mm
CMIP52071ndash2100mean
Today
MERRA APHRODITE
Individual models
CMIP52071ndash2100mean
MERRA APHRODITE
Individual models
CMIP52071ndash2100Precip mean
MERRA APHRODITE
Individual models
SWE todayPrecip today
2000 mTerrain distribution of area between levels
CMIP52071ndash2100
TodayMERRA
APHRODITE
a)
i)
ii)
iii)
iv)
b)
Viste amp SortebergFigure 12
Figure 12 Monthly CMIP5 RCP 85 change in snowfall precipitation and rainsnow line ele-vation in the upper Brahmaputra clusters (a) 4 and (b) 3 See Fig 11 for a description of thecontent
493
- Introduction
-
- Observed trends in snowfall temperature and precipitation
- Future projections of snowfall temperature and precipitation
- Aims and scope
-
- Data and methods
-
- Reference present-day snowfall
- Bias-corrected present-day snowfall
- Projected snowfall
- The rain-snow line
-
- Present-day snowfall
-
- Seasonal cycles of precipitation and snowfall
- Comparison of snowfall estimates
-
- Projected future snowfall
-
- Basin-scale projections
- Regional projections
-
- Upper Indus western part
- Upper Indus eastern part
- Upper Brahmaputra western part
- Upper Brahmaputra eastern part
-
- Potential effects of reduced snowfall on water availability
-
- Concluding summary
-