piccolo® biochemistry panel plus - abaxis
TRANSCRIPT
January 2021 Page 1 of 20 PN: 400-7182-1 Rev: F
Piccolo® BioChemistry Panel Plus For In Vitro Diagnostic Use and Professional Use Only Customer and Technical Service: 1-800-822-2947 Customers outside the US: +49 6155 780 210
Abaxis, Inc. ABAXIS Europe GmbH 3240 Whipple Rd. Bunsenstr. 9-11 Union City, CA 94587 64347 Griesheim USA Germany
1. Intended Use The Piccolo® BioChemistry Panel Plus, used with the Piccolo Xpress® chemistry analyzer, is intended to be used for the in vitro quantitative determination of alanine aminotransferase (ALT), albumin, alkaline phosphatase (ALP), amylase, aspartate aminotransferase (AST), c-reactive protein (CRP), calcium, creatinine, gamma glutamyltransferase (GGT), glucose, total protein, blood urea nitrogen (BUN), and uric acid in lithium heparinized whole blood, lithium heparinized plasma, or serum in a clinical laboratory setting or point-of-care location. The Abaxis CRP method is not intended for high sensitivity CRP measurement. 2. Summary and Explanation of Tests The Piccolo BioChemistry Panel Plus and the Piccolo Xpress chemistry analyzer comprise an in vitro diagnostic system that aids the physician in diagnosing the following disorders.
Alanine aminotransferase (ALT): Liver diseases, including viral hepatitis and cirrhosis. Albumin: Liver and kidney diseases. Alkaline phosphatase (ALP): Liver, bone, parathyroid, and intestinal diseases. Amylase: Pancreatitis. Aspartate aminotransferase (AST): Liver disease including hepatitis and viral jaundice, shock. C-Reactive Protein (CRP): Infection, tissue injury, and inflammatory disorders. Calcium: Parathyroid, bone and chronic renal diseases; tetany. Creatinine: Renal disease and monitoring of renal dialysis. Gamma glutamyltransferase (GGT): Liver diseases, including alcoholic cirrhosis and primary and
secondary liver tumors. Glucose: Carbohydrate metabolism disorders, including adult and juvenile
diabetes mellitus and hypoglycemia. Total protein: Liver, kidney, bone marrow diseases; metabolic and nutritional
disorders. Blood Urea Nitrogen (BUN): Renal and metabolic diseases. Uric Acid: Renal and metabolic disorders, including renal failure and gout.
As with any diagnostic test procedure, all other test procedures including the clinical status of the patient should be considered prior to final diagnosis. 3. Principle of Procedure Alanine Aminotransferase (ALT) Alanine aminotransferase (ALT) has been measured by three methods. Two of these methods—the colorimetric dinitrophenylhydrazine coupling technique 1,2 and the fluorescent enzymatic assay—are rarely used.3 An enzymatic method based on the work of Wróblewski and LaDue4 is the most common technique for determining ALT concentrations in serum. A modified Wróblewski and LaDue procedure has been proposed as the recommended procedure of the International Federation of Clinical Chemistry (IFCC).5 The method developed for use on the Piccolo Analyzers is a modification of the IFCC-recommended procedure. In this reaction, ALT catalyzes the transfer of an amino group from L-alanine to α-ketoglutarate to form L-glutamate and pyruvate.
Page 2 of 20
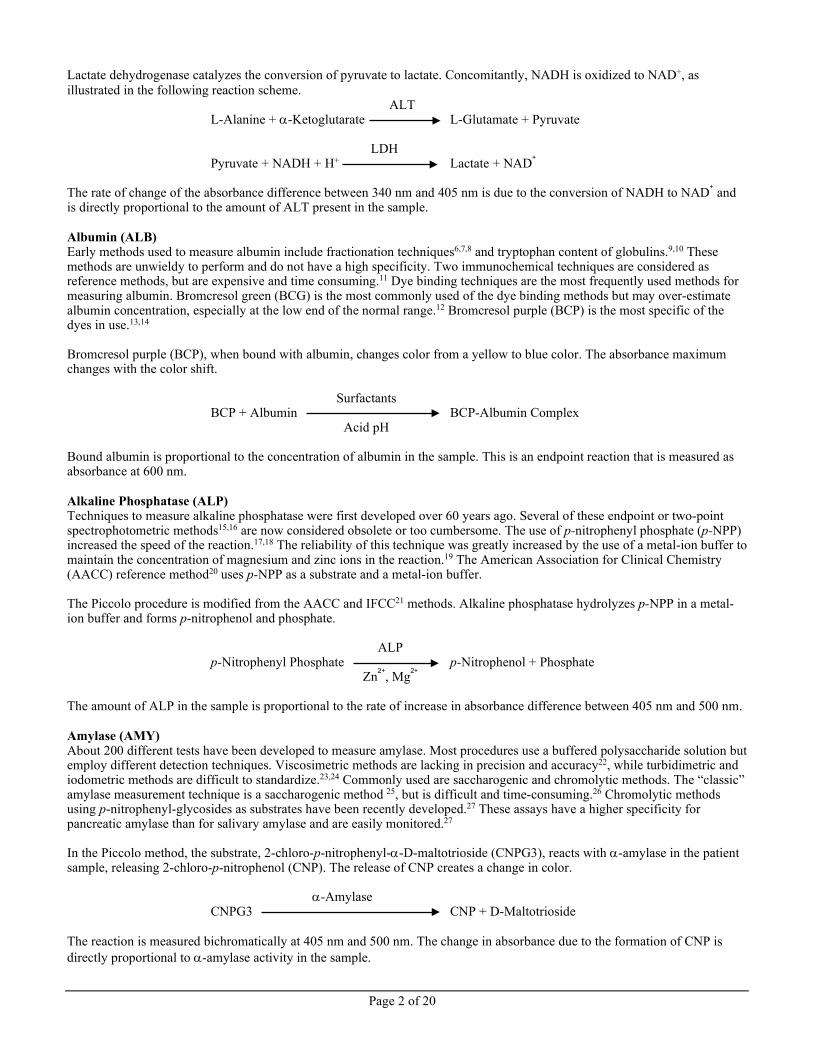
Lactate dehydrogenase catalyzes the conversion of pyruvate to lactate. Concomitantly, NADH is oxidized to NAD+, as illustrated in the following reaction scheme. ALT
L-Alanine + α-Ketoglutarate L-Glutamate + Pyruvate LDH
Pyruvate + NADH + H+ Lactate + NAD+ The rate of change of the absorbance difference between 340 nm and 405 nm is due to the conversion of NADH to NAD+ and is directly proportional to the amount of ALT present in the sample. Albumin (ALB) Early methods used to measure albumin include fractionation techniques6,7,8 and tryptophan content of globulins.9,10 These methods are unwieldy to perform and do not have a high specificity. Two immunochemical techniques are considered as reference methods, but are expensive and time consuming.11 Dye binding techniques are the most frequently used methods for measuring albumin. Bromcresol green (BCG) is the most commonly used of the dye binding methods but may over-estimate albumin concentration, especially at the low end of the normal range.12 Bromcresol purple (BCP) is the most specific of the dyes in use.13,14 Bromcresol purple (BCP), when bound with albumin, changes color from a yellow to blue color. The absorbance maximum changes with the color shift. Surfactants
BCP + Albumin BCP-Albumin Complex Acid pH Bound albumin is proportional to the concentration of albumin in the sample. This is an endpoint reaction that is measured as absorbance at 600 nm. Alkaline Phosphatase (ALP) Techniques to measure alkaline phosphatase were first developed over 60 years ago. Several of these endpoint or two-point spectrophotometric methods15,16 are now considered obsolete or too cumbersome. The use of p-nitrophenyl phosphate (p-NPP) increased the speed of the reaction.17,18 The reliability of this technique was greatly increased by the use of a metal-ion buffer to maintain the concentration of magnesium and zinc ions in the reaction.19 The American Association for Clinical Chemistry (AACC) reference method20 uses p-NPP as a substrate and a metal-ion buffer. The Piccolo procedure is modified from the AACC and IFCC21 methods. Alkaline phosphatase hydrolyzes p-NPP in a metal-ion buffer and forms p-nitrophenol and phosphate. ALP
p-Nitrophenyl Phosphate p-Nitrophenol + Phosphate Zn2+, Mg2+ The amount of ALP in the sample is proportional to the rate of increase in absorbance difference between 405 nm and 500 nm. Amylase (AMY) About 200 different tests have been developed to measure amylase. Most procedures use a buffered polysaccharide solution but employ different detection techniques. Viscosimetric methods are lacking in precision and accuracy22, while turbidimetric and iodometric methods are difficult to standardize.23,24 Commonly used are saccharogenic and chromolytic methods. The “classic” amylase measurement technique is a saccharogenic method 25, but is difficult and time-consuming.26 Chromolytic methods using p-nitrophenyl-glycosides as substrates have been recently developed.27 These assays have a higher specificity for pancreatic amylase than for salivary amylase and are easily monitored.27 In the Piccolo method, the substrate, 2-chloro-p-nitrophenyl-α-D-maltotrioside (CNPG3), reacts with α-amylase in the patient sample, releasing 2-chloro-p-nitrophenol (CNP). The release of CNP creates a change in color. α-Amylase
CNPG3 CNP + D-Maltotrioside
The reaction is measured bichromatically at 405 nm and 500 nm. The change in absorbance due to the formation of CNP is directly proportional to α-amylase activity in the sample.
Page 3 of 20
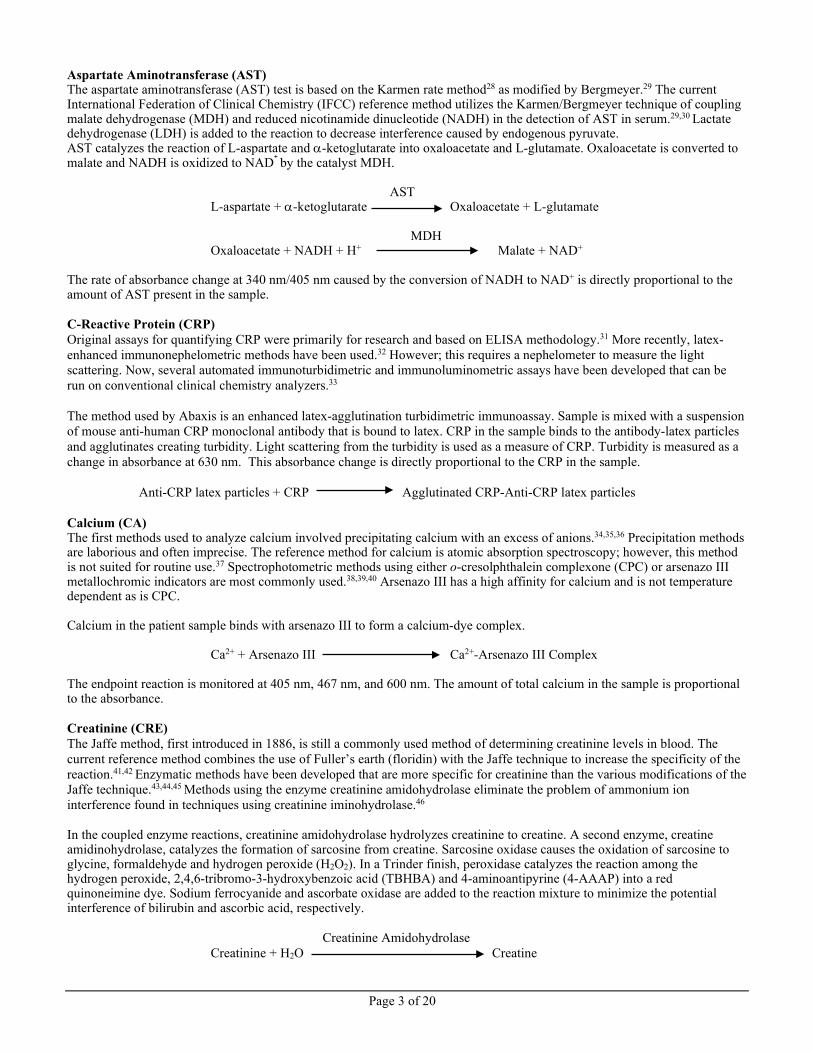
Aspartate Aminotransferase (AST) The aspartate aminotransferase (AST) test is based on the Karmen rate method28 as modified by Bergmeyer.29 The current International Federation of Clinical Chemistry (IFCC) reference method utilizes the Karmen/Bergmeyer technique of coupling malate dehydrogenase (MDH) and reduced nicotinamide dinucleotide (NADH) in the detection of AST in serum.29,30 Lactate dehydrogenase (LDH) is added to the reaction to decrease interference caused by endogenous pyruvate. AST catalyzes the reaction of L-aspartate and α-ketoglutarate into oxaloacetate and L-glutamate. Oxaloacetate is converted to malate and NADH is oxidized to NAD+ by the catalyst MDH. AST
L-aspartate + α-ketoglutarate Oxaloacetate + L-glutamate MDH
Oxaloacetate + NADH + H+ Malate + NAD+ The rate of absorbance change at 340 nm/405 nm caused by the conversion of NADH to NAD+ is directly proportional to the amount of AST present in the sample. C-Reactive Protein (CRP) Original assays for quantifying CRP were primarily for research and based on ELISA methodology.31 More recently, latex-enhanced immunonephelometric methods have been used.32 However; this requires a nephelometer to measure the light scattering. Now, several automated immunoturbidimetric and immunoluminometric assays have been developed that can be run on conventional clinical chemistry analyzers.33 The method used by Abaxis is an enhanced latex-agglutination turbidimetric immunoassay. Sample is mixed with a suspension of mouse anti-human CRP monoclonal antibody that is bound to latex. CRP in the sample binds to the antibody-latex particles and agglutinates creating turbidity. Light scattering from the turbidity is used as a measure of CRP. Turbidity is measured as a change in absorbance at 630 nm. This absorbance change is directly proportional to the CRP in the sample. Anti-CRP latex particles + CRP Agglutinated CRP-Anti-CRP latex particles Calcium (CA) The first methods used to analyze calcium involved precipitating calcium with an excess of anions.34,35,36 Precipitation methods are laborious and often imprecise. The reference method for calcium is atomic absorption spectroscopy; however, this method is not suited for routine use.37 Spectrophotometric methods using either o-cresolphthalein complexone (CPC) or arsenazo III metallochromic indicators are most commonly used.38,39,40 Arsenazo III has a high affinity for calcium and is not temperature dependent as is CPC. Calcium in the patient sample binds with arsenazo III to form a calcium-dye complex.
Ca2+ + Arsenazo III Ca2+-Arsenazo III Complex The endpoint reaction is monitored at 405 nm, 467 nm, and 600 nm. The amount of total calcium in the sample is proportional to the absorbance. Creatinine (CRE) The Jaffe method, first introduced in 1886, is still a commonly used method of determining creatinine levels in blood. The current reference method combines the use of Fuller’s earth (floridin) with the Jaffe technique to increase the specificity of the reaction.41,42 Enzymatic methods have been developed that are more specific for creatinine than the various modifications of the Jaffe technique.43,44,45 Methods using the enzyme creatinine amidohydrolase eliminate the problem of ammonium ion interference found in techniques using creatinine iminohydrolase.46
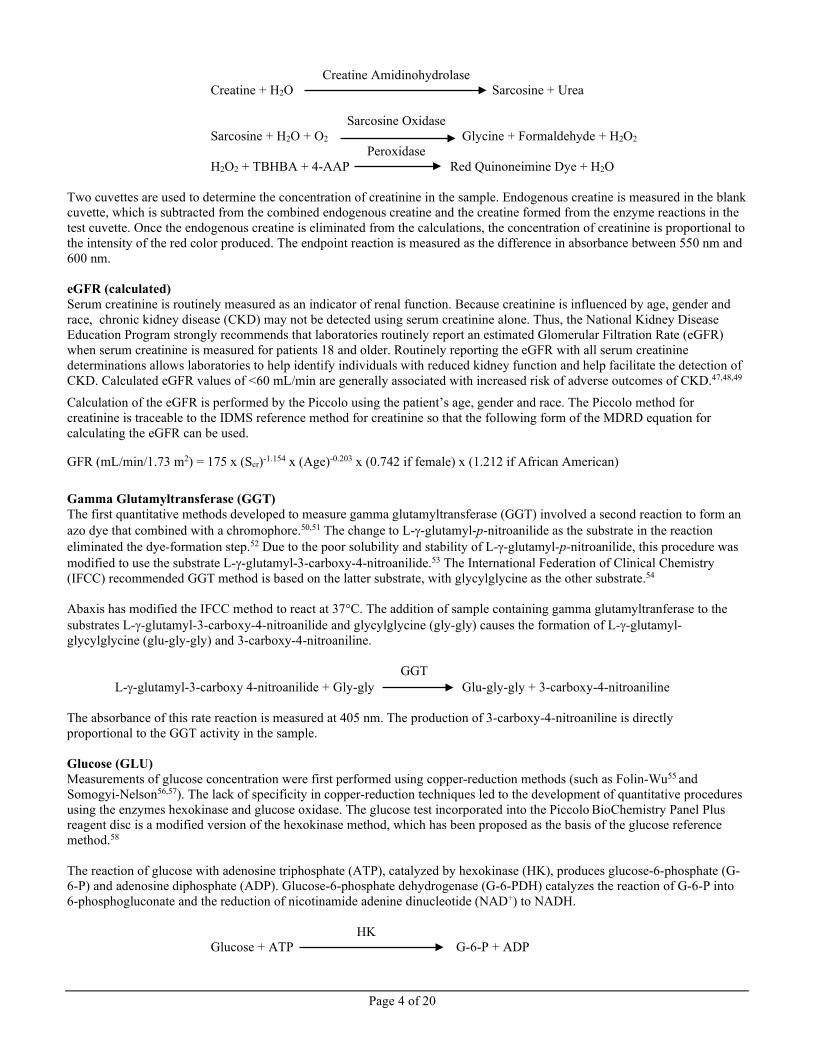
In the coupled enzyme reactions, creatinine amidohydrolase hydrolyzes creatinine to creatine. A second enzyme, creatine amidinohydrolase, catalyzes the formation of sarcosine from creatine. Sarcosine oxidase causes the oxidation of sarcosine to glycine, formaldehyde and hydrogen peroxide (H2O2). In a Trinder finish, peroxidase catalyzes the reaction among the hydrogen peroxide, 2,4,6-tribromo-3-hydroxybenzoic acid (TBHBA) and 4-aminoantipyrine (4-AAAP) into a red quinoneimine dye. Sodium ferrocyanide and ascorbate oxidase are added to the reaction mixture to minimize the potential interference of bilirubin and ascorbic acid, respectively. Creatinine Amidohydrolase
Creatinine + H2O Creatine
Page 4 of 20
Creatine Amidinohydrolase Creatine + H2O Sarcosine + Urea
Sarcosine Oxidase Sarcosine + H2O + O2 Glycine + Formaldehyde + H2O2
Peroxidase H2O2 + TBHBA + 4-AAP Red Quinoneimine Dye + H2O
Two cuvettes are used to determine the concentration of creatinine in the sample. Endogenous creatine is measured in the blank cuvette, which is subtracted from the combined endogenous creatine and the creatine formed from the enzyme reactions in the test cuvette. Once the endogenous creatine is eliminated from the calculations, the concentration of creatinine is proportional to the intensity of the red color produced. The endpoint reaction is measured as the difference in absorbance between 550 nm and 600 nm. eGFR (calculated) Serum creatinine is routinely measured as an indicator of renal function. Because creatinine is influenced by age, gender and race, chronic kidney disease (CKD) may not be detected using serum creatinine alone. Thus, the National Kidney Disease Education Program strongly recommends that laboratories routinely report an estimated Glomerular Filtration Rate (eGFR) when serum creatinine is measured for patients 18 and older. Routinely reporting the eGFR with all serum creatinine determinations allows laboratories to help identify individuals with reduced kidney function and help facilitate the detection of CKD. Calculated eGFR values of <60 mL/min are generally associated with increased risk of adverse outcomes of CKD.47,48,49 Calculation of the eGFR is performed by the Piccolo using the patient’s age, gender and race. The Piccolo method for creatinine is traceable to the IDMS reference method for creatinine so that the following form of the MDRD equation for calculating the eGFR can be used.
GFR (mL/min/1.73 m2) = 175 x (Scr)-1.154 x (Age)-0.203 x (0.742 if female) x (1.212 if African American) Gamma Glutamyltransferase (GGT) The first quantitative methods developed to measure gamma glutamyltransferase (GGT) involved a second reaction to form an azo dye that combined with a chromophore.50,51 The change to L-γ-glutamyl-p-nitroanilide as the substrate in the reaction eliminated the dye-formation step.52 Due to the poor solubility and stability of L-γ-glutamyl-p-nitroanilide, this procedure was modified to use the substrate L-γ-glutamyl-3-carboxy-4-nitroanilide.53 The International Federation of Clinical Chemistry (IFCC) recommended GGT method is based on the latter substrate, with glycylglycine as the other substrate.54 Abaxis has modified the IFCC method to react at 37°C. The addition of sample containing gamma glutamyltranferase to the substrates L-γ-glutamyl-3-carboxy-4-nitroanilide and glycylglycine (gly-gly) causes the formation of L-γ-glutamyl-glycylglycine (glu-gly-gly) and 3-carboxy-4-nitroaniline. GGT
L-γ-glutamyl-3-carboxy 4-nitroanilide + Gly-gly Glu-gly-gly + 3-carboxy-4-nitroaniline The absorbance of this rate reaction is measured at 405 nm. The production of 3-carboxy-4-nitroaniline is directly proportional to the GGT activity in the sample. Glucose (GLU) Measurements of glucose concentration were first performed using copper-reduction methods (such as Folin-Wu55 and Somogyi-Nelson56,57). The lack of specificity in copper-reduction techniques led to the development of quantitative procedures using the enzymes hexokinase and glucose oxidase. The glucose test incorporated into the Piccolo BioChemistry Panel Plus reagent disc is a modified version of the hexokinase method, which has been proposed as the basis of the glucose reference method.58
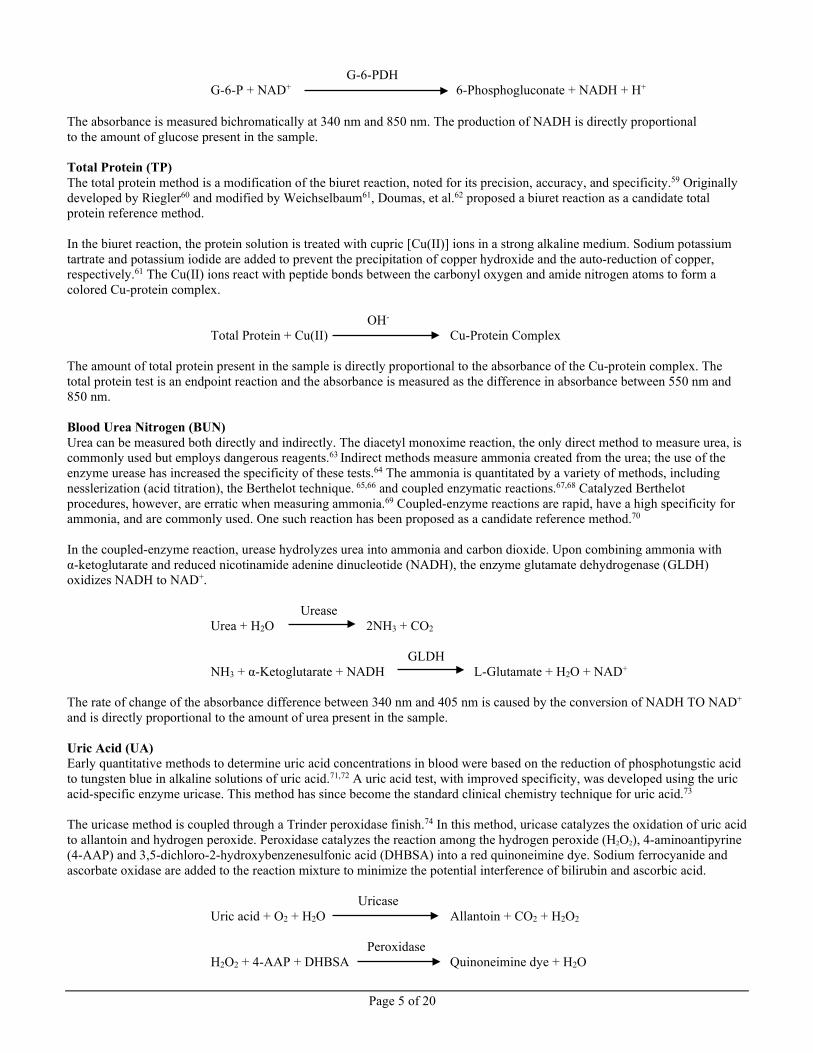
The reaction of glucose with adenosine triphosphate (ATP), catalyzed by hexokinase (HK), produces glucose-6-phosphate (G-6-P) and adenosine diphosphate (ADP). Glucose-6-phosphate dehydrogenase (G-6-PDH) catalyzes the reaction of G-6-P into 6-phosphogluconate and the reduction of nicotinamide adenine dinucleotide (NAD+) to NADH. HK
Glucose + ATP G-6-P + ADP
Page 5 of 20
G-6-PDH G-6-P + NAD+ 6-Phosphogluconate + NADH + H+
The absorbance is measured bichromatically at 340 nm and 850 nm. The production of NADH is directly proportional to the amount of glucose present in the sample. Total Protein (TP) The total protein method is a modification of the biuret reaction, noted for its precision, accuracy, and specificity.59 Originally developed by Riegler60 and modified by Weichselbaum61, Doumas, et al.62 proposed a biuret reaction as a candidate total protein reference method. In the biuret reaction, the protein solution is treated with cupric [Cu(II)] ions in a strong alkaline medium. Sodium potassium tartrate and potassium iodide are added to prevent the precipitation of copper hydroxide and the auto-reduction of copper, respectively.61 The Cu(II) ions react with peptide bonds between the carbonyl oxygen and amide nitrogen atoms to form a colored Cu-protein complex. OH-
Total Protein + Cu(II) Cu-Protein Complex The amount of total protein present in the sample is directly proportional to the absorbance of the Cu-protein complex. The total protein test is an endpoint reaction and the absorbance is measured as the difference in absorbance between 550 nm and 850 nm. Blood Urea Nitrogen (BUN) Urea can be measured both directly and indirectly. The diacetyl monoxime reaction, the only direct method to measure urea, is commonly used but employs dangerous reagents.63 Indirect methods measure ammonia created from the urea; the use of the enzyme urease has increased the specificity of these tests.64 The ammonia is quantitated by a variety of methods, including nesslerization (acid titration), the Berthelot technique. 65,66 and coupled enzymatic reactions.67,68 Catalyzed Berthelot procedures, however, are erratic when measuring ammonia.69 Coupled-enzyme reactions are rapid, have a high specificity for ammonia, and are commonly used. One such reaction has been proposed as a candidate reference method.70 In the coupled-enzyme reaction, urease hydrolyzes urea into ammonia and carbon dioxide. Upon combining ammonia with α-ketoglutarate and reduced nicotinamide adenine dinucleotide (NADH), the enzyme glutamate dehydrogenase (GLDH) oxidizes NADH to NAD+.
Urease Urea + H2O 2NH3 + CO2
GLDH
NH3 + α-Ketoglutarate + NADH L-Glutamate + H2O + NAD+ The rate of change of the absorbance difference between 340 nm and 405 nm is caused by the conversion of NADH TO NAD+ and is directly proportional to the amount of urea present in the sample. Uric Acid (UA) Early quantitative methods to determine uric acid concentrations in blood were based on the reduction of phosphotungstic acid to tungsten blue in alkaline solutions of uric acid.71,72 A uric acid test, with improved specificity, was developed using the uric acid-specific enzyme uricase. This method has since become the standard clinical chemistry technique for uric acid.73 The uricase method is coupled through a Trinder peroxidase finish.74 In this method, uricase catalyzes the oxidation of uric acid to allantoin and hydrogen peroxide. Peroxidase catalyzes the reaction among the hydrogen peroxide (H2O2), 4-aminoantipyrine (4-AAP) and 3,5-dichloro-2-hydroxybenzenesulfonic acid (DHBSA) into a red quinoneimine dye. Sodium ferrocyanide and ascorbate oxidase are added to the reaction mixture to minimize the potential interference of bilirubin and ascorbic acid. Uricase
Uric acid + O2 + H2O Allantoin + CO2 + H2O2 Peroxidase
H2O2 + 4-AAP + DHBSA Quinoneimine dye + H2O
Page 6 of 20
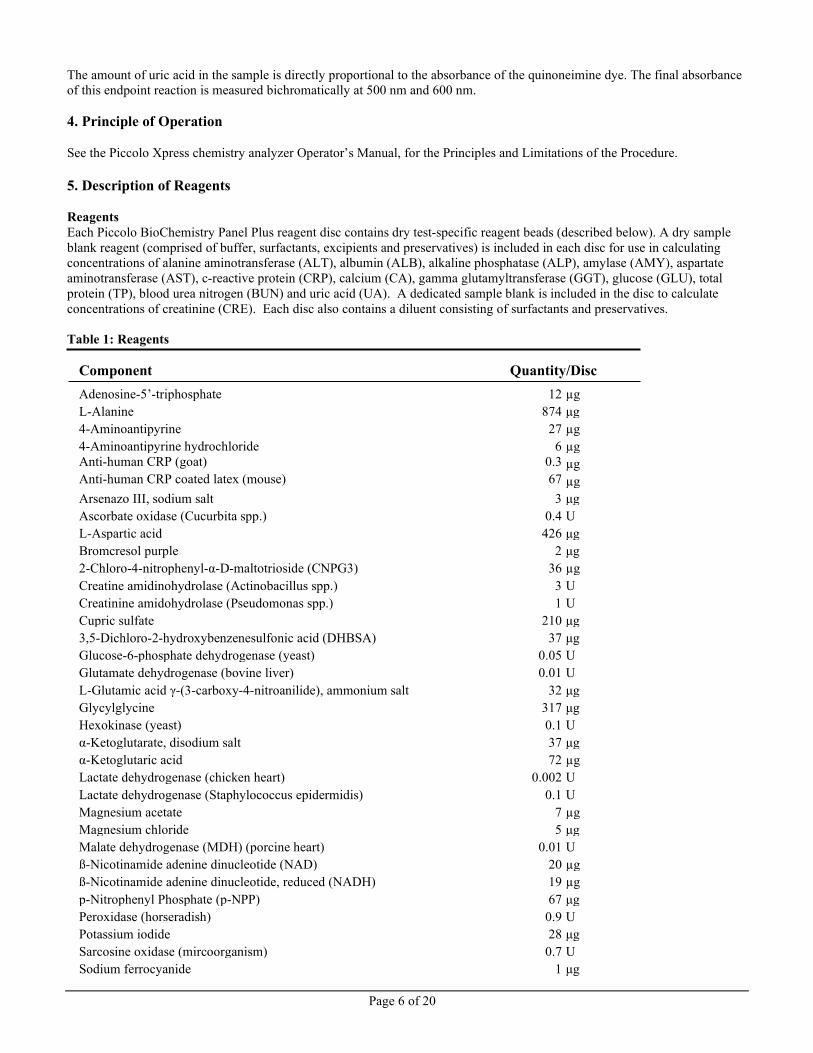
The amount of uric acid in the sample is directly proportional to the absorbance of the quinoneimine dye. The final absorbance of this endpoint reaction is measured bichromatically at 500 nm and 600 nm. 4. Principle of Operation See the Piccolo Xpress chemistry analyzer Operator’s Manual, for the Principles and Limitations of the Procedure. 5. Description of Reagents Reagents Each Piccolo BioChemistry Panel Plus reagent disc contains dry test-specific reagent beads (described below). A dry sample blank reagent (comprised of buffer, surfactants, excipients and preservatives) is included in each disc for use in calculating concentrations of alanine aminotransferase (ALT), albumin (ALB), alkaline phosphatase (ALP), amylase (AMY), aspartate aminotransferase (AST), c-reactive protein (CRP), calcium (CA), gamma glutamyltransferase (GGT), glucose (GLU), total protein (TP), blood urea nitrogen (BUN) and uric acid (UA). A dedicated sample blank is included in the disc to calculate concentrations of creatinine (CRE). Each disc also contains a diluent consisting of surfactants and preservatives. Table 1: Reagents
Component Quantity/Disc Adenosine-5’-triphosphate 12 µg L-Alanine 874 μg 4-Aminoantipyrine 27 µg 4-Aminoantipyrine hydrochloride 6 µg Anti-human CRP (goat) 0.3 µg Anti-human CRP coated latex (mouse) 67 µg Arsenazo III, sodium salt 3 μg Ascorbate oxidase (Cucurbita spp.) 0.4 U L-Aspartic acid 426 μg Bromcresol purple 2 μg 2-Chloro-4-nitrophenyl-α-D-maltotrioside (CNPG3) 36 µg Creatine amidinohydrolase (Actinobacillus spp.) 3 U Creatinine amidohydrolase (Pseudomonas spp.) 1 U Cupric sulfate 210 μg 3,5-Dichloro-2-hydroxybenzenesulfonic acid (DHBSA) 37 μg Glucose-6-phosphate dehydrogenase (yeast) 0.05 U Glutamate dehydrogenase (bovine liver) 0.01 U L-Glutamic acid γ-(3-carboxy-4-nitroanilide), ammonium salt 32 μg Glycylglycine 317 μg Hexokinase (yeast) 0.1 U α-Ketoglutarate, disodium salt 37 μg α-Ketoglutaric acid 72 µg Lactate dehydrogenase (chicken heart) 0.002 U Lactate dehydrogenase (Staphylococcus epidermidis) 0.1 U Magnesium acetate 7 µg Magnesium chloride 5 μg Malate dehydrogenase (MDH) (porcine heart) 0.01 U ß-Nicotinamide adenine dinucleotide (NAD) 20 µg ß-Nicotinamide adenine dinucleotide, reduced (NADH) 19 µg p-Nitrophenyl Phosphate (p-NPP) 67 μg Peroxidase (horseradish) 0.9 U Potassium iodide 28 μg Sarcosine oxidase (mircoorganism) 0.7 U Sodium ferrocyanide 1 μg
Page 7 of 20
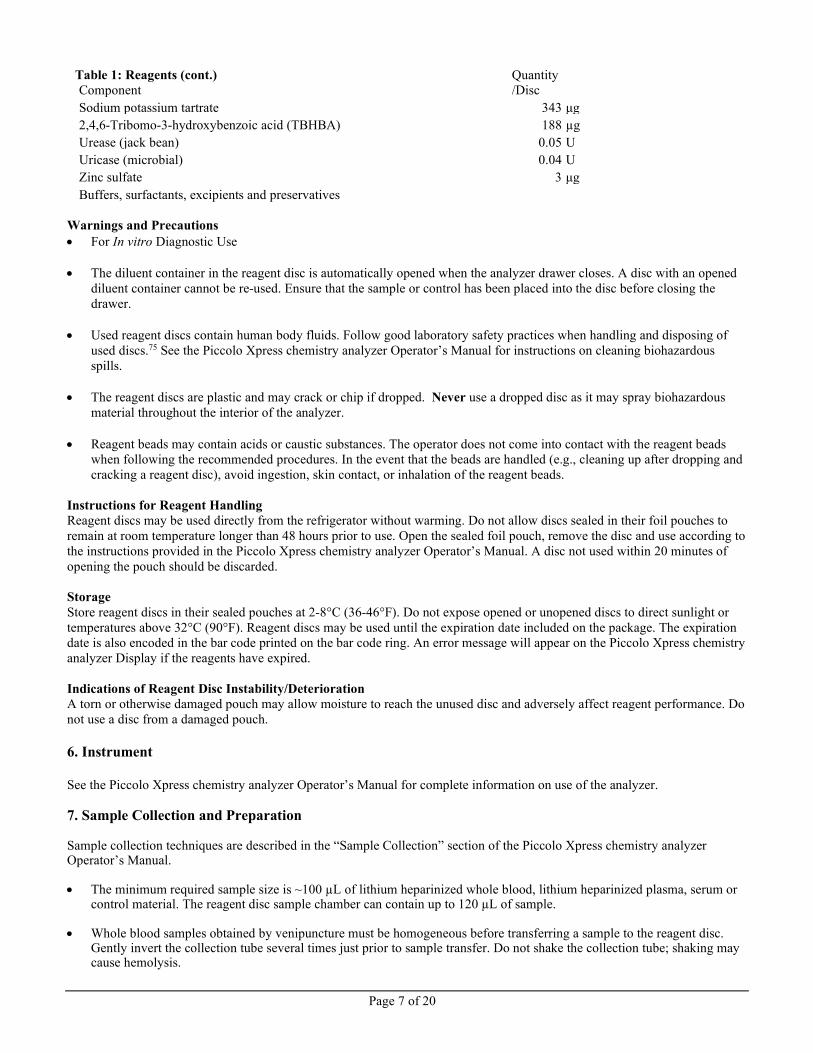
Table 1: Reagents (cont.) Component
Quantity/Disc
Sodium potassium tartrate 343 μg 2,4,6-Tribomo-3-hydroxybenzoic acid (TBHBA) 188 µg Urease (jack bean) 0.05 U Uricase (microbial) 0.04 U Zinc sulfate 3 μg Buffers, surfactants, excipients and preservatives
Warnings and Precautions • For In vitro Diagnostic Use • The diluent container in the reagent disc is automatically opened when the analyzer drawer closes. A disc with an opened
diluent container cannot be re-used. Ensure that the sample or control has been placed into the disc before closing the drawer.
• Used reagent discs contain human body fluids. Follow good laboratory safety practices when handling and disposing of
used discs.75 See the Piccolo Xpress chemistry analyzer Operator’s Manual for instructions on cleaning biohazardous spills.
• The reagent discs are plastic and may crack or chip if dropped. Never use a dropped disc as it may spray biohazardous
material throughout the interior of the analyzer. • Reagent beads may contain acids or caustic substances. The operator does not come into contact with the reagent beads
when following the recommended procedures. In the event that the beads are handled (e.g., cleaning up after dropping and cracking a reagent disc), avoid ingestion, skin contact, or inhalation of the reagent beads.
Instructions for Reagent Handling Reagent discs may be used directly from the refrigerator without warming. Do not allow discs sealed in their foil pouches to remain at room temperature longer than 48 hours prior to use. Open the sealed foil pouch, remove the disc and use according to the instructions provided in the Piccolo Xpress chemistry analyzer Operator’s Manual. A disc not used within 20 minutes of opening the pouch should be discarded. Storage Store reagent discs in their sealed pouches at 2-8°C (36-46°F). Do not expose opened or unopened discs to direct sunlight or temperatures above 32°C (90°F). Reagent discs may be used until the expiration date included on the package. The expiration date is also encoded in the bar code printed on the bar code ring. An error message will appear on the Piccolo Xpress chemistry analyzer Display if the reagents have expired. Indications of Reagent Disc Instability/Deterioration A torn or otherwise damaged pouch may allow moisture to reach the unused disc and adversely affect reagent performance. Do not use a disc from a damaged pouch. 6. Instrument See the Piccolo Xpress chemistry analyzer Operator’s Manual for complete information on use of the analyzer. 7. Sample Collection and Preparation Sample collection techniques are described in the “Sample Collection” section of the Piccolo Xpress chemistry analyzer Operator’s Manual. • The minimum required sample size is ~100 µL of lithium heparinized whole blood, lithium heparinized plasma, serum or
control material. The reagent disc sample chamber can contain up to 120 µL of sample. • Whole blood samples obtained by venipuncture must be homogeneous before transferring a sample to the reagent disc.
Gently invert the collection tube several times just prior to sample transfer. Do not shake the collection tube; shaking may cause hemolysis.
Page 8 of 20
• Whole blood samples should only be obtained via venipuncture, not from capillary blood. • Whole blood venipuncture samples should be run within 60 minutes of collection.76 Glucose concentrations are affected
by the length of time since the patient has eaten and by the type of sample collected from the patient. To accurately determine glucose results, samples should be obtained from a patient who has been fasting for at least 12 hours. The glucose concentration decreases approximately 5-12 mg/dL in 1 hour in uncentrifuged samples stored at room temperature.77
• Use only lithium heparin (green stopper) evacuated specimen collection tubes for whole blood or plasma samples. Use no-additive (red stopper) evacuated specimen collection tubes or serum separator tubes (red/black stopper) for serum samples.
• Refrigerating whole blood samples can cause significant changes in concentration of aspartate aminotransferase, creatinine and glucose.78 The sample may be separated into plasma or serum and stored in capped sample tubes at 2-8°C (36-46°F) if the sample cannot be run within 60 minutes.
• Start the test within 10 minutes of transferring the sample into the reagent disc. 8. Procedure Materials Provided • One Piccolo BioChemistry Panel Plus PN: 400-1035 (a box of discs PN 400-0035) Materials Required but not Provided • Piccolo Xpress chemistry analyzer • Sample transfer pipettes (fixed volume approximately 100 µL) and tips are provided with each Piccolo Xpress chemistry
analyzer and may be reordered from Abaxis. • Commercially available control reagents recommended by Abaxis (contact Abaxis Technical Support for approved control
materials and expected values). • Timer Test Parameters The Piccolo Xpress chemistry analyzer operates at ambient temperatures between 15°C and 32°C (59-90°F). The analysis time for each Piccolo BioChemistry Panel Plus reagent disc is less than 14 minutes. The analyzer maintains the reagent disc at a temperature of 37°C (98.6°F) over the measurement interval. Test Procedure The complete sample collection and step-by-step operating procedures are detailed in the Piccolo Xpress chemistry analyzer Operator’s Manual. Calibration The Piccolo Xpress chemistry analyzer is calibrated by the manufacturer before shipment. The bar code printed on the bar code ring provides the analyzer with disc-specific calibration data. See the Piccolo Xpress chemistry analyzer Operator’s Manual. Quality Control See the Piccolo Xpress chemistry analyzer Operator’s Manual, for a detailed discussion on running, recording, interpreting, and plotting control results. 9. Results The Piccolo Xpress chemistry analyzer automatically calculates and prints the analyte concentrations in the sample. Details of the endpoint and rate reaction calculations are found in the Piccolo Xpress chemistry analyzer Operator’s Manual. Interpretation of results is detailed in the Operator’s Manual. Results are printed onto paper rolls supplied by Abaxis. The paper roll has an adhesive backing for easy placement in the patient’s files. 10. Limitations of Procedure General procedural limitations are discussed in the Piccolo Xpress chemistry analyzer Operator’s Manual. • The only anticoagulant recommended for use with the Piccolo Xpress chemistry analyzer system is lithium heparin. Do
not use sodium heparin. Abaxis has performed studies demonstrating that EDTA, fluoride, oxalate and any anticoagulant containing ammonium ions will interfere with at least one chemistry contained in the PiccoloBioChemistry Panel Plus reagent disc.
Page 9 of 20
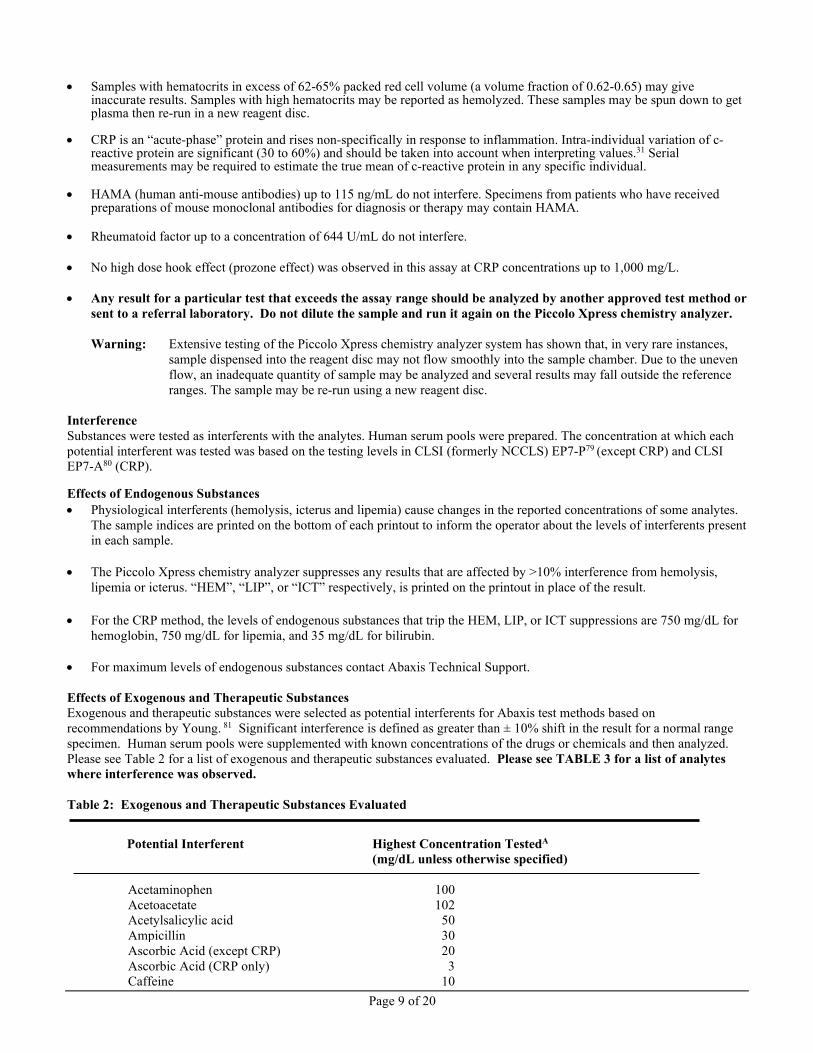
• Samples with hematocrits in excess of 62-65% packed red cell volume (a volume fraction of 0.62-0.65) may give
inaccurate results. Samples with high hematocrits may be reported as hemolyzed. These samples may be spun down to get plasma then re-run in a new reagent disc.
• CRP is an “acute-phase” protein and rises non-specifically in response to inflammation. Intra-individual variation of c-
reactive protein are significant (30 to 60%) and should be taken into account when interpreting values.31 Serial measurements may be required to estimate the true mean of c-reactive protein in any specific individual.
• HAMA (human anti-mouse antibodies) up to 115 ng/mL do not interfere. Specimens from patients who have received
preparations of mouse monoclonal antibodies for diagnosis or therapy may contain HAMA. • Rheumatoid factor up to a concentration of 644 U/mL do not interfere. • No high dose hook effect (prozone effect) was observed in this assay at CRP concentrations up to 1,000 mg/L. • Any result for a particular test that exceeds the assay range should be analyzed by another approved test method or
sent to a referral laboratory. Do not dilute the sample and run it again on the Piccolo Xpress chemistry analyzer. Warning: Extensive testing of the Piccolo Xpress chemistry analyzer system has shown that, in very rare instances,
sample dispensed into the reagent disc may not flow smoothly into the sample chamber. Due to the uneven flow, an inadequate quantity of sample may be analyzed and several results may fall outside the reference ranges. The sample may be re-run using a new reagent disc.
Interference Substances were tested as interferents with the analytes. Human serum pools were prepared. The concentration at which each potential interferent was tested was based on the testing levels in CLSI (formerly NCCLS) EP7-P79 (except CRP) and CLSI EP7-A80 (CRP). Effects of Endogenous Substances • Physiological interferents (hemolysis, icterus and lipemia) cause changes in the reported concentrations of some analytes.
The sample indices are printed on the bottom of each printout to inform the operator about the levels of interferents present in each sample.
• The Piccolo Xpress chemistry analyzer suppresses any results that are affected by >10% interference from hemolysis,
lipemia or icterus. “HEM”, “LIP”, or “ICT” respectively, is printed on the printout in place of the result. • For the CRP method, the levels of endogenous substances that trip the HEM, LIP, or ICT suppressions are 750 mg/dL for
hemoglobin, 750 mg/dL for lipemia, and 35 mg/dL for bilirubin. • For maximum levels of endogenous substances contact Abaxis Technical Support. Effects of Exogenous and Therapeutic Substances Exogenous and therapeutic substances were selected as potential interferents for Abaxis test methods based on recommendations by Young. 81 Significant interference is defined as greater than ± 10% shift in the result for a normal range specimen. Human serum pools were supplemented with known concentrations of the drugs or chemicals and then analyzed. Please see Table 2 for a list of exogenous and therapeutic substances evaluated. Please see TABLE 3 for a list of analytes where interference was observed. Table 2: Exogenous and Therapeutic Substances Evaluated
Potential Interferent Highest Concentration TestedA (mg/dL unless otherwise specified)
Acetaminophen 100 Acetoacetate 102 Acetylsalicylic acid 50 Ampicillin 30 Ascorbic Acid (except CRP) 20 Ascorbic Acid (CRP only) 3 Caffeine 10
Page 10 of 20
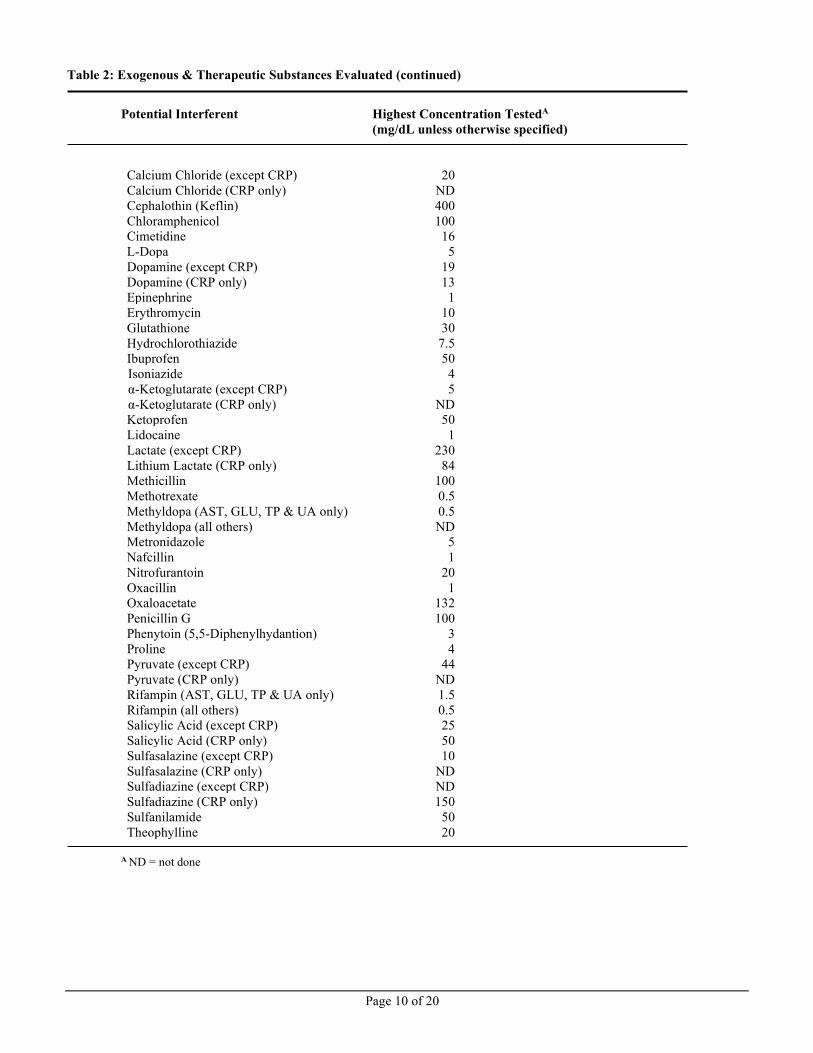
Table 2: Exogenous & Therapeutic Substances Evaluated (continued)
Potential Interferent Highest Concentration TestedA (mg/dL unless otherwise specified)
Calcium Chloride (except CRP) 20 Calcium Chloride (CRP only) ND Cephalothin (Keflin) 400 Chloramphenicol 100 Cimetidine 16 L-Dopa 5 Dopamine (except CRP) 19 Dopamine (CRP only) 13 Epinephrine 1 Erythromycin 10 Glutathione 30 Hydrochlorothiazide 7.5 Ibuprofen 50 Isoniazide 4 α-Ketoglutarate (except CRP) 5 α-Ketoglutarate (CRP only) ND Ketoprofen 50 Lidocaine 1 Lactate (except CRP) 230 Lithium Lactate (CRP only) 84 Methicillin 100 Methotrexate 0.5 Methyldopa (AST, GLU, TP & UA only) 0.5 Methyldopa (all others) ND Metronidazole 5 Nafcillin 1 Nitrofurantoin 20 Oxacillin 1 Oxaloacetate 132 Penicillin G 100 Phenytoin (5,5-Diphenylhydantion) 3 Proline 4 Pyruvate (except CRP) 44 Pyruvate (CRP only) ND Rifampin (AST, GLU, TP & UA only) 1.5 Rifampin (all others) 0.5 Salicylic Acid (except CRP) 25 Salicylic Acid (CRP only) 50 Sulfasalazine (except CRP) 10 Sulfasalazine (CRP only) ND Sulfadiazine (except CRP) ND Sulfadiazine (CRP only) 150 Sulfanilamide 50 Theophylline 20
A ND = not done
Page 11 of 20
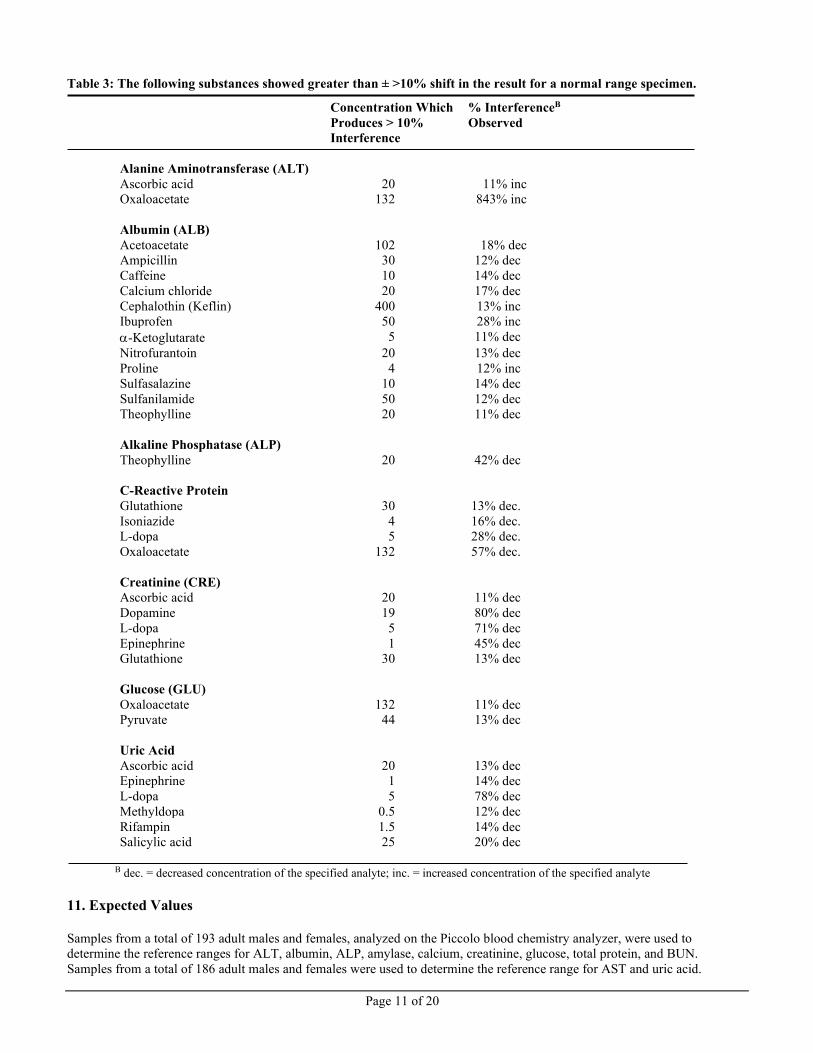
Table 3: The following substances showed greater than ± >10% shift in the result for a normal range specimen.
Concentration Which % InterferenceB Produces > 10% Observed Interference
Alanine Aminotransferase (ALT) Ascorbic acid 20 11% inc Oxaloacetate 132 843% inc Albumin (ALB) Acetoacetate 102 18% dec Ampicillin 30 12% dec Caffeine 10 14% dec Calcium chloride 20 17% dec Cephalothin (Keflin) 400 13% inc Ibuprofen 50 28% inc α-Ketoglutarate 5 11% dec Nitrofurantoin 20 13% dec Proline 4 12% inc Sulfasalazine 10 14% dec Sulfanilamide 50 12% dec Theophylline 20 11% dec Alkaline Phosphatase (ALP) Theophylline 20 42% dec C-Reactive Protein Glutathione 30 13% dec. Isoniazide 4 16% dec. L-dopa 5 28% dec. Oxaloacetate 132 57% dec. Creatinine (CRE) Ascorbic acid 20 11% dec Dopamine 19 80% dec L-dopa 5 71% dec Epinephrine 1 45% dec Glutathione 30 13% dec Glucose (GLU) Oxaloacetate 132 11% dec Pyruvate 44 13% dec Uric Acid Ascorbic acid 20 13% dec Epinephrine 1 14% dec L-dopa 5 78% dec Methyldopa 0.5 12% dec Rifampin 1.5 14% dec Salicylic acid 25 20% dec
B dec. = decreased concentration of the specified analyte; inc. = increased concentration of the specified analyte
11. Expected Values Samples from a total of 193 adult males and females, analyzed on the Piccolo blood chemistry analyzer, were used to determine the reference ranges for ALT, albumin, ALP, amylase, calcium, creatinine, glucose, total protein, and BUN. Samples from a total of 186 adult males and females were used to determine the reference range for AST and uric acid.
Page 12 of 20
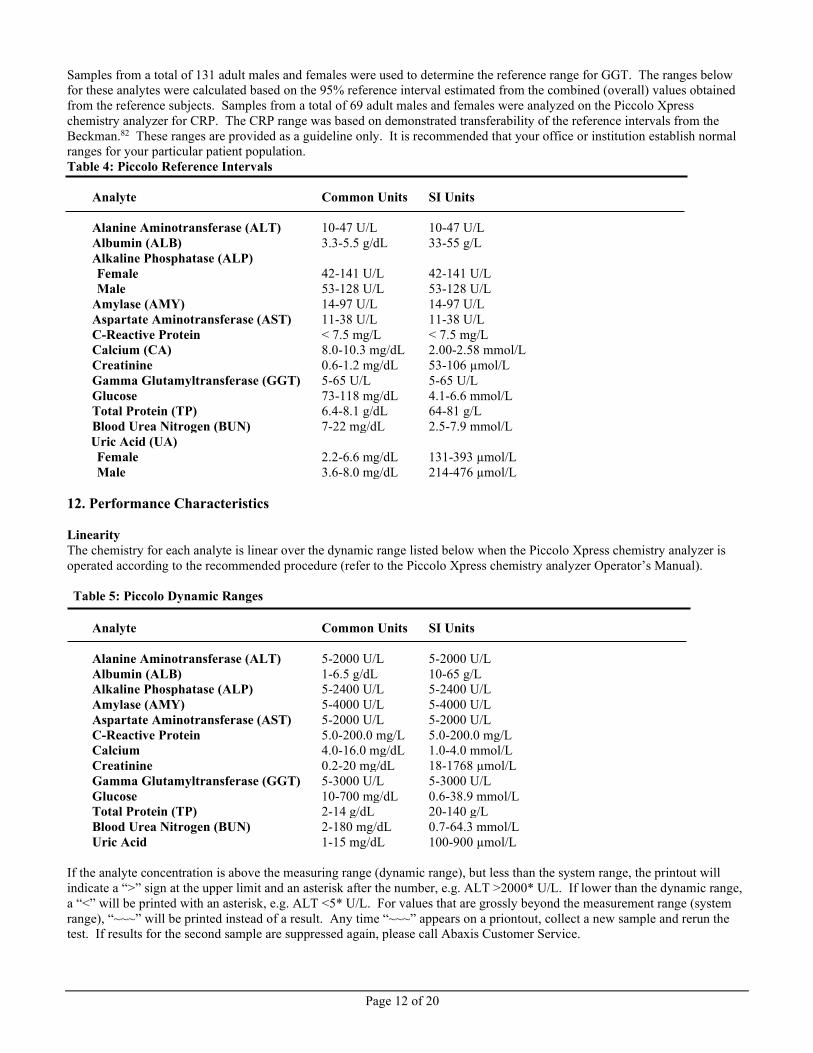
Samples from a total of 131 adult males and females were used to determine the reference range for GGT. The ranges below for these analytes were calculated based on the 95% reference interval estimated from the combined (overall) values obtained from the reference subjects. Samples from a total of 69 adult males and females were analyzed on the Piccolo Xpress chemistry analyzer for CRP. The CRP range was based on demonstrated transferability of the reference intervals from the Beckman.82 These ranges are provided as a guideline only. It is recommended that your office or institution establish normal ranges for your particular patient population. Table 4: Piccolo Reference Intervals
Analyte Common Units SI Units Alanine Aminotransferase (ALT) 10-47 U/L 10-47 U/L Albumin (ALB) 3.3-5.5 g/dL 33-55 g/L Alkaline Phosphatase (ALP) Female Male
42-141 U/L 53-128 U/L
42-141 U/L 53-128 U/L
Amylase (AMY) 14-97 U/L 14-97 U/L Aspartate Aminotransferase (AST) 11-38 U/L 11-38 U/L C-Reactive Protein < 7.5 mg/L < 7.5 mg/L Calcium (CA) 8.0-10.3 mg/dL 2.00-2.58 mmol/L Creatinine 0.6-1.2 mg/dL 53-106 µmol/L Gamma Glutamyltransferase (GGT) 5-65 U/L 5-65 U/L Glucose 73-118 mg/dL 4.1-6.6 mmol/L Total Protein (TP) 6.4-8.1 g/dL 64-81 g/L Blood Urea Nitrogen (BUN) 7-22 mg/dL 2.5-7.9 mmol/L Uric Acid (UA) Female Male
2.2-6.6 mg/dL 3.6-8.0 mg/dL
131-393 µmol/L 214-476 µmol/L
12. Performance Characteristics Linearity The chemistry for each analyte is linear over the dynamic range listed below when the Piccolo Xpress chemistry analyzer is operated according to the recommended procedure (refer to the Piccolo Xpress chemistry analyzer Operator’s Manual). Table 5: Piccolo Dynamic Ranges
Analyte Common Units SI Units Alanine Aminotransferase (ALT) 5-2000 U/L 5-2000 U/L Albumin (ALB) 1-6.5 g/dL 10-65 g/L Alkaline Phosphatase (ALP) 5-2400 U/L 5-2400 U/L Amylase (AMY) 5-4000 U/L 5-4000 U/L Aspartate Aminotransferase (AST) 5-2000 U/L 5-2000 U/L C-Reactive Protein 5.0-200.0 mg/L 5.0-200.0 mg/L Calcium 4.0-16.0 mg/dL 1.0-4.0 mmol/L Creatinine 0.2-20 mg/dL 18-1768 µmol/L Gamma Glutamyltransferase (GGT) 5-3000 U/L 5-3000 U/L Glucose 10-700 mg/dL 0.6-38.9 mmol/L Total Protein (TP) 2-14 g/dL 20-140 g/L Blood Urea Nitrogen (BUN) 2-180 mg/dL 0.7-64.3 mmol/L Uric Acid 1-15 mg/dL 100-900 µmol/L
If the analyte concentration is above the measuring range (dynamic range), but less than the system range, the printout will indicate a “>” sign at the upper limit and an asterisk after the number, e.g. ALT >2000* U/L. If lower than the dynamic range, a “<” will be printed with an asterisk, e.g. ALT <5* U/L. For values that are grossly beyond the measurement range (system range), “~~~” will be printed instead of a result. Any time “~~~” appears on a priontout, collect a new sample and rerun the test. If results for the second sample are suppressed again, please call Abaxis Customer Service.
Page 13 of 20
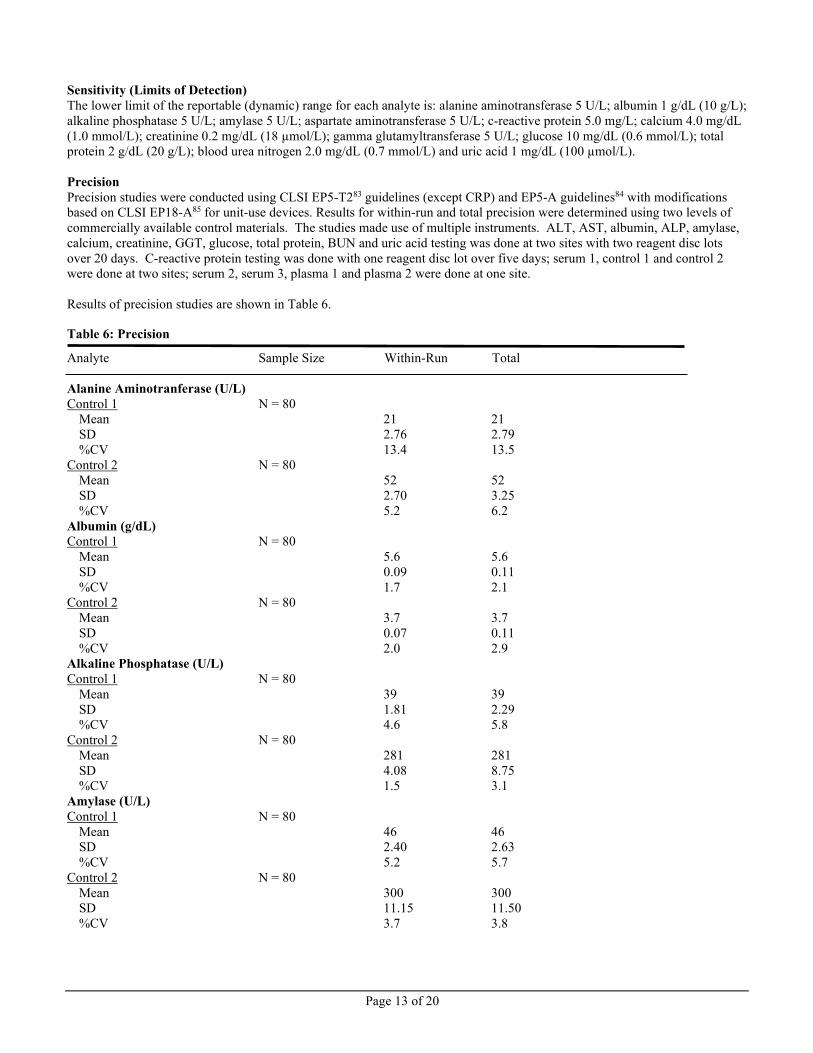
Sensitivity (Limits of Detection) The lower limit of the reportable (dynamic) range for each analyte is: alanine aminotransferase 5 U/L; albumin 1 g/dL (10 g/L); alkaline phosphatase 5 U/L; amylase 5 U/L; aspartate aminotransferase 5 U/L; c-reactive protein 5.0 mg/L; calcium 4.0 mg/dL (1.0 mmol/L); creatinine 0.2 mg/dL (18 µmol/L); gamma glutamyltransferase 5 U/L; glucose 10 mg/dL (0.6 mmol/L); total protein 2 g/dL (20 g/L); blood urea nitrogen 2.0 mg/dL (0.7 mmol/L) and uric acid 1 mg/dL (100 µmol/L). Precision Precision studies were conducted using CLSI EP5-T283 guidelines (except CRP) and EP5-A guidelines84 with modifications based on CLSI EP18-A85 for unit-use devices. Results for within-run and total precision were determined using two levels of commercially available control materials. The studies made use of multiple instruments. ALT, AST, albumin, ALP, amylase, calcium, creatinine, GGT, glucose, total protein, BUN and uric acid testing was done at two sites with two reagent disc lots over 20 days. C-reactive protein testing was done with one reagent disc lot over five days; serum 1, control 1 and control 2 were done at two sites; serum 2, serum 3, plasma 1 and plasma 2 were done at one site. Results of precision studies are shown in Table 6. Table 6: Precision
Analyte Sample Size Within-Run Total Alanine Aminotranferase (U/L) Control 1 N = 80
Mean 21 21 SD 2.76 2.79 %CV 13.4 13.5
Control 2 N = 80 Mean 52 52 SD 2.70 3.25 %CV 5.2 6.2
Albumin (g/dL) Control 1 N = 80
Mean 5.6 5.6 SD 0.09 0.11 %CV 1.7 2.1
Control 2 N = 80 Mean 3.7 3.7 SD 0.07 0.11 %CV 2.0 2.9
Alkaline Phosphatase (U/L) Control 1 N = 80
Mean 39 39 SD 1.81 2.29 %CV 4.6 5.8
Control 2 N = 80 Mean 281 281 SD 4.08 8.75 %CV 1.5 3.1
Amylase (U/L) Control 1 N = 80
Mean 46 46 SD 2.40 2.63 %CV 5.2 5.7
Control 2 N = 80 Mean 300 300 SD 11.15 11.50 %CV 3.7 3.8
Page 14 of 20
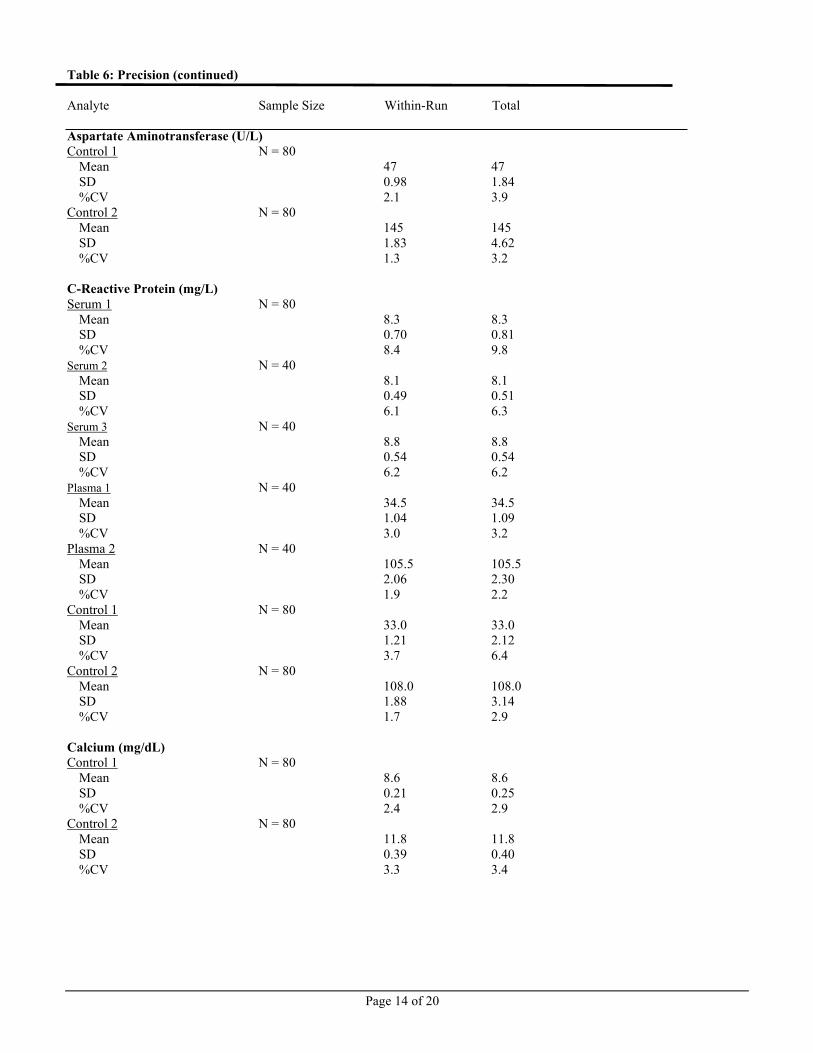
Table 6: Precision (continued) Analyte Sample Size Within-Run Total Aspartate Aminotransferase (U/L) Control 1 N = 80
Mean 47 47 SD 0.98 1.84 %CV 2.1 3.9
Control 2 N = 80 Mean 145 145 SD 1.83 4.62 %CV 1.3 3.2
C-Reactive Protein (mg/L) Serum 1 N = 80
Mean 8.3 8.3 SD 0.70 0.81 %CV 8.4 9.8
Serum 2 N = 40 Mean 8.1 8.1 SD 0.49 0.51 %CV 6.1 6.3
Serum 3 N = 40 Mean 8.8 8.8 SD 0.54 0.54 %CV 6.2 6.2
Plasma 1 N = 40 Mean 34.5 34.5 SD 1.04 1.09 %CV 3.0 3.2
Plasma 2 N = 40 Mean 105.5 105.5 SD 2.06 2.30
%CV 1.9 2.2 Control 1 N = 80
Mean 33.0 33.0 SD 1.21 2.12 %CV 3.7 6.4
Control 2 N = 80 Mean 108.0 108.0 SD 1.88 3.14 %CV 1.7 2.9
Calcium (mg/dL) Control 1 N = 80
Mean 8.6 8.6 SD 0.21 0.25 %CV 2.4 2.9
Control 2 N = 80 Mean 11.8 11.8 SD 0.39 0.40 %CV 3.3 3.4
Page 15 of 20
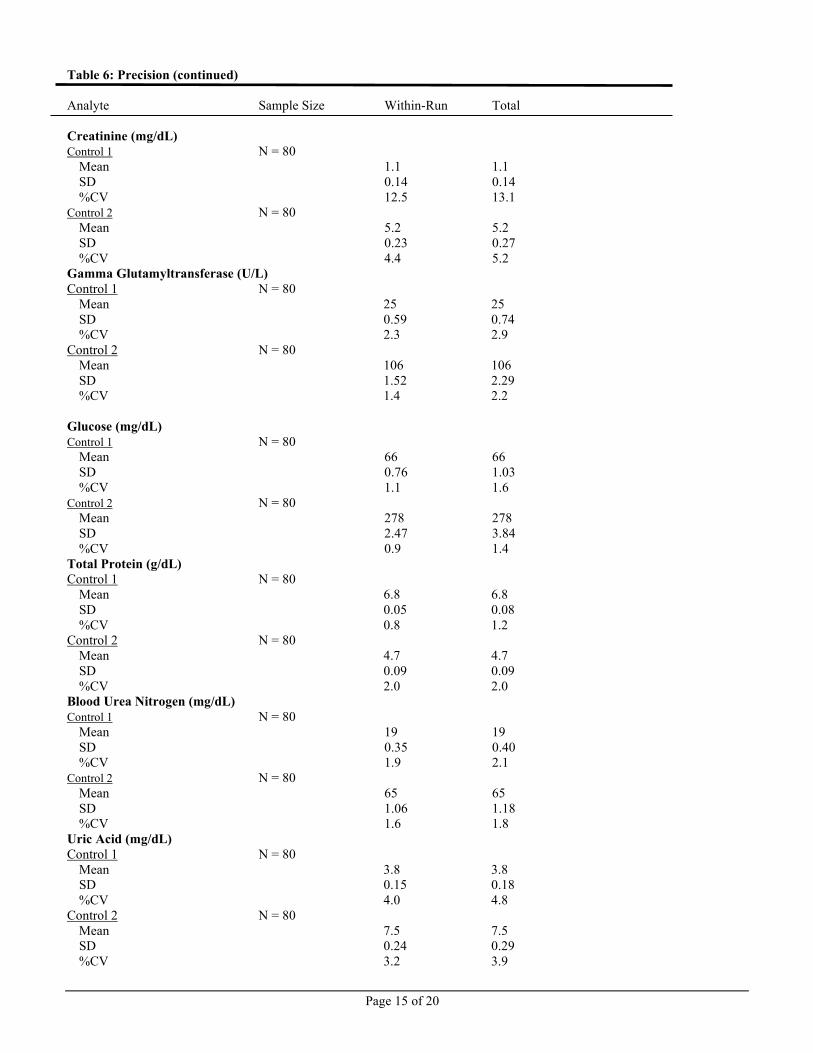
Table 6: Precision (continued) Analyte Sample Size Within-Run Total Creatinine (mg/dL) Control 1 N = 80
Mean 1.1 1.1 SD 0.14 0.14 %CV 12.5 13.1
Control 2 N = 80 Mean 5.2 5.2 SD 0.23 0.27 %CV 4.4 5.2
Gamma Glutamyltransferase (U/L) Control 1 N = 80
Mean 25 25 SD 0.59 0.74 %CV 2.3 2.9
Control 2 N = 80 Mean 106 106 SD 1.52 2.29 %CV 1.4 2.2
Glucose (mg/dL) Control 1 N = 80
Mean 66 66 SD 0.76 1.03 %CV 1.1 1.6
Control 2 N = 80 Mean 278 278 SD 2.47 3.84 %CV 0.9 1.4
Total Protein (g/dL) Control 1 N = 80
Mean 6.8 6.8 SD 0.05 0.08 %CV 0.8 1.2
Control 2 N = 80 Mean 4.7 4.7 SD 0.09 0.09 %CV 2.0 2.0
Blood Urea Nitrogen (mg/dL) Control 1 N = 80
Mean 19 19 SD 0.35 0.40 %CV 1.9 2.1
Control 2 N = 80 Mean 65 65 SD 1.06 1.18 %CV 1.6 1.8
Uric Acid (mg/dL) Control 1 N = 80
Mean 3.8 3.8 SD 0.15 0.18 %CV 4.0 4.8
Control 2 N = 80 Mean 7.5 7.5 SD 0.24 0.29 %CV 3.2 3.9
Page 16 of 20
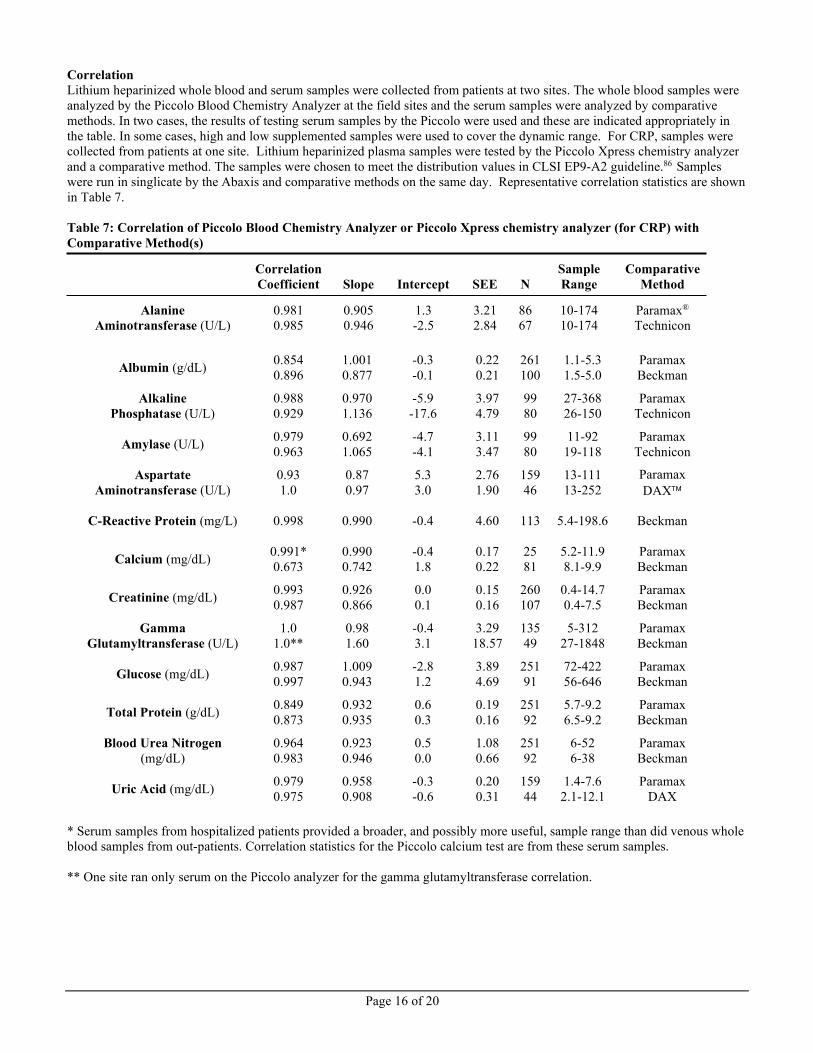
Correlation Lithium heparinized whole blood and serum samples were collected from patients at two sites. The whole blood samples were analyzed by the Piccolo Blood Chemistry Analyzer at the field sites and the serum samples were analyzed by comparative methods. In two cases, the results of testing serum samples by the Piccolo were used and these are indicated appropriately in the table. In some cases, high and low supplemented samples were used to cover the dynamic range. For CRP, samples were collected from patients at one site. Lithium heparinized plasma samples were tested by the Piccolo Xpress chemistry analyzer and a comparative method. The samples were chosen to meet the distribution values in CLSI EP9-A2 guideline.86 Samples were run in singlicate by the Abaxis and comparative methods on the same day. Representative correlation statistics are shown in Table 7. Table 7: Correlation of Piccolo Blood Chemistry Analyzer or Piccolo Xpress chemistry analyzer (for CRP) with Comparative Method(s)
Correlation Coefficient
Slope
Intercept
SEE
N
Sample Range
Comparative Method
Alanine Aminotransferase (U/L)
0.981 0.985
0.905 0.946
1.3 -2.5
3.21 2.84
86 67
10-174 10-174
Paramax®
Technicon
Albumin (g/dL) 0.854 0.896
1.001 0.877
-0.3 -0.1
0.22 0.21
261 100
1.1-5.3 1.5-5.0
Paramax Beckman
Alkaline Phosphatase (U/L)
0.988 0.929
0.970 1.136
-5.9 -17.6
3.97 4.79
99 80
27-368 26-150
Paramax Technicon
Amylase (U/L) 0.979 0.963
0.692 1.065
-4.7 -4.1
3.11 3.47
99 80
11-92 19-118
Paramax Technicon
Aspartate Aminotransferase (U/L)
0.93 1.0
0.87 0.97
5.3 3.0
2.76 1.90
159 46
13-111 13-252
Paramax DAX
C-Reactive Protein (mg/L) 0.998 0.990 -0.4 4.60 113 5.4-198.6 Beckman
Calcium (mg/dL) 0.991* 0.673
0.990 0.742
-0.4 1.8
0.17 0.22
25 81
5.2-11.9 8.1-9.9
Paramax Beckman
Creatinine (mg/dL) 0.993 0.987
0.926 0.866
0.0 0.1
0.15 0.16
260 107
0.4-14.7 0.4-7.5
Paramax
Beckman
Gamma Glutamyltransferase (U/L)
1.0 1.0**
0.98 1.60
-0.4 3.1
3.29 18.57
135 49
5-312 27-1848
Paramax Beckman
Glucose (mg/dL) 0.987 0.997
1.009 0.943
-2.8 1.2
3.89 4.69
251 91
72-422 56-646
Paramax
Beckman
Total Protein (g/dL) 0.849 0.873
0.932 0.935
0.6 0.3
0.19 0.16
251 92
5.7-9.2 6.5-9.2
Paramax Beckman
Blood Urea Nitrogen (mg/dL)
0.964 0.983
0.923 0.946
0.5 0.0
1.08 0.66
251 92
6-52 6-38
Paramax
Beckman
Uric Acid (mg/dL) 0.979 0.975
0.958 0.908
-0.3 -0.6
0.20 0.31
159 44
1.4-7.6 2.1-12.1
Paramax DAX
* Serum samples from hospitalized patients provided a broader, and possibly more useful, sample range than did venous whole blood samples from out-patients. Correlation statistics for the Piccolo calcium test are from these serum samples. ** One site ran only serum on the Piccolo analyzer for the gamma glutamyltransferase correlation.
Page 17 of 20
Table 8: Sample-type Correlation for CRP For the CRP test method the Deming regression analysis for sample-type gave the following results for n = 21.
Y Axis
X Axis
R2
Slope
Intercept
Lithium Heparinized Plasma Lithium Heparinized Whole Blood 1.000 0.995 0.2
Serum Lithium Heparinized Whole Blood 0.999 1.005 0.5
Serum Lithium Heparinized Plasma 0.999 1.010 0.3
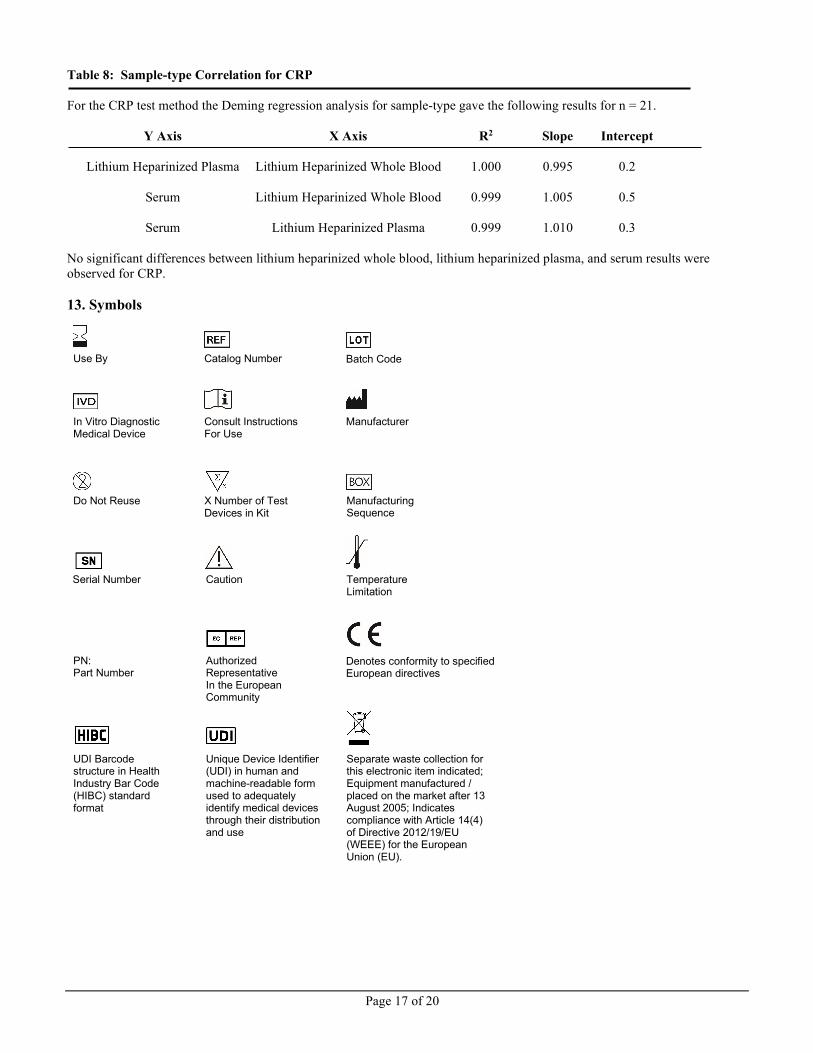
No significant differences between lithium heparinized whole blood, lithium heparinized plasma, and serum results were observed for CRP. 13. Symbols
Temperature Limitation
Use By Catalog Number Batch Code
Unique Device Identifier (UDI) in human and machine-readable form used to adequately identify medical devices through their distribution and use
UDI Barcode structure in Health Industry Bar Code (HIBC) standard format
In Vitro Diagnostic Medical Device
Consult Instructions For Use
Manufacturer
Do Not Reuse
X Number of Test Devices in Kit
Manufacturing Sequence
Serial Number
Authorized Representative In the European Community
PN: Part Number
Caution
Denotes conformity to specified European directives
Separate waste collection for this electronic item indicated; Equipment manufactured / placed on the market after 13 August 2005; Indicates compliance with Article 14(4) of Directive 2012/19/EU (WEEE) for the European Union (EU).
Page 18 of 20
14. Bibliography 1. Tonhazy NE, White NG, Umbreit WW. A rapid method for the estimation of the glutamic-aspartic transaminase in tissues
and its application to radiation sickness. Arch Biochem 1950; 28: 36-42. 2. Reitman S, Frankel S. A colorimetric method for the determination of serum glutamic oxalacetic and glutamic pyruvic
transaminases. Am J Clin Pathol 1957; 28: 56-63. 3. Murray RL. Alanine aminotransferase. In: Clinical Chemistry: Theory, Analysis, and Correlation, 2nd ed. Kaplan LA,
Pesce AJ, eds. St. Louis: The C.V. Mosby Company 1989: 895-898. 4. Wróblewski F, LaDue JS. Serum glutamic-pyruvic transminase in cardiac and hepatic disease. Proc Soc Exp Biol Med
1956; 91: 569-571. 5. Bergmeyer HU, Horder M. IFCC methods for the measurement of catalytic concentration of enzymes. Part 3. IFCC
method for alanine aminotransferase. J Clin Chem Clin Biochem 1980; 18: 521-534. 6. Howe PE. The use of sodium sulfate as the globulin precipitant in the determination of proteins in blood. J Biol Chem
1921; 49: 93-107. 7. Howe PE. The determination of proteins in blood — a micro method. J Biol Chem 1921; 49: 109-113. 8. Wolfson WQ, et al. A rapid procedure for the estimation of total protein, true albumin, total globulin, alpha globulin, beta
globulin and gamma globulin in 10 ml of serum. Am J Clin Pathol 1948; 18: 723-730. 9. Saifer A, Gerstenfeld S, Vacsler F. Photometric microdetermination of total serum globulins by means of a tryptophan
reaction. Clin Chem 1961; 7: 626-636. 10. Saifer A, Marven T. The photometric microdetermination of serum total globulins with a tryptophan reaction: a modified
procedure. Clin Chem 1966; 12: 414-417. 11. Gendler SM, Albumin. In: Clinical Chemistry: Theory, Analysis, and Correlation, 2nd ed. Kaplan LA, Pesce AJ, eds. St.
Louis: The C.V. Mosby Company. 1989: 1029-1033. 12. Webster D, Bignell AHC, Attwood EC. An assessment of the suitability of bromocresol green for the determination of
serum albumin. Clin Chim Acta 1974; 53: 101-108. 13. Louderback A, Mealey EH, Taylor NA. A new dye-binding technic using bromcresol purple for determination of albumin
in serum. Clin Chem 1968; 14: 793-794. (Abstract) 14. Pinnell AE, Northam BE. New automated dye-binding method for serum albumin determination with bromcresol purple.
Clin Chem 1978; 24: 80-86. 15. King EJ, Armstrong AR. A convenient method for determining serum and bile phosphatase activity. Can Med Assoc J
1934; 31: 376-381. 16. Kind PRN, King EJ. Estimation of plasma phosphatase by determination of hydrolysed phenol with amino-antipyrine. J
Clin Pathol 1954; 7: 322-326. 17. Ohmori Y. Uber die Phosphomonoesterase. Enzymologia 1937; 4: 217-231. 18. Fujita H. Uber die Mikrobestimmung der Blutphosphatase. J Biochem, Japan 1939; 30: 69-87. 19. Petitclerc C, et al. Mechanism of action of Mg2+ and Zn2+ on rat placental alkaline phosphatase. I. Studies on the soluble
Zn2+ and Mg2+ alkaline phosphatase. Can J Biochem 1975; 53: 1089-1100. 20. Tietz NW, et al. A reference method for measurement of alkaline phosphatase activity in human serum. Clin Chem 1983;
29: 751-761. 21. Bowers GN Jr, et al. IFCC methods for the measurement of catalytic concentration of enzymes. Part I. General
considerations concerning the determination of the catalytic concentration of an enzyme in the blood serum or plasma of man. Clin Chim Acta 1979; 98: 163F-174F.
22. McNeely MDD. Amylase. In: Clinical Chemistry: Theory, Analysis, and Correlation, 2nd ed. Kaplan LA, Pesce AJ, eds. St. Louis: The C.V. Mosby Company. 1989: 906-909.
23. Zinterhofer L, et al. Nephelometric determination of pancreatic enzymes. I. Amylase. Clin Chim Acta. 1973; 43: 5-12. 24. Centers for Disease Control (CDC). Alpha-amylase methodology survey I. Atlanta: US Public Health Service; Nov, 1975. 25. Somogyi M. Modifications of two methods for the assay of amylase. Clin Chem 1960; 6: 23-35. 26. Gillard BK, Markman HC, Feig SA. Direct spectro-photometric determination of α-amylase activity in saliva, with p-
nitrophenyl α-maltoside as substrate. Clin Chem 1977; 23: 2279-2282. 27. Wallenfels K, et al. The enzymic synthesis, by transglucosylation of a homologous series of glycosidically substituted
malto-oligosaccharides, and their use as amylase substrates. Carbohydrate Res 1978; 61: 359-368. 28. Karmen A. A note on the spectrophotometric assay of glutamic-oxalacetic transaminase in human blood serum. J Clin
Invest 1955; 34: 131-133. 29. Bergmeyer HU, et al. Provisional recommendations on IFCC methods for the measurement of catalytic concentrations of
enzymes. Part 2. IFCC method for aspartate aminotransferase. Clin Chem 1977; 23: 887-899. 30. Bergmeyer HU, et al.. Provisional recommendations on IFCC methods for the measurement of catalytic concentrations of
enzymes. Part 2. Revised IFCC method for aspartate aminotransferase. Clin Chem 1978; 24: 720-721. 31. Macy E, Hayes T, Tracy R. Variability in the measurement of c-reactive protein in healthy subjects: implications for
reference interval and epidemiological applications. Clin Chem 1997; 43: 52-58.
Page 19 of 20
32. Rifai N, Tracy RP, Ridker PM. Clinical efficacy of an automated high-sensitivity C-reactive protein assay. Clin Chem 1999; 45: 2136-2141.
33. Roberts WL, Moulton L, Law TC, Farrow G, Cooper-Anderson M, Savory J, Rifai N. Evaluation of nine automated high-sensitivity C-reactive protein methods: implications for clinical and epidemiological applications. Part 2. Clin Chem 2001; 47: 418–425.
34. Kramer B, et al. A simple technique for the determination of calcium and magnesium in small amounts of serum. J Biol Chem 1921; 47: 475-481.
35. Clark EP, et al. A study of the Tisdall method for the determination of blood serum calcium with suggested modification. J Biol Chem 1925; 63: 461-464.
36. Katzman E, et al. The determination of serum calcium by titration with ceric sulfate. J Biol Chem. 1937; 118: 539-544. 37. Cali JP, et al. A reference method for the determination of total calcium in serum. In: Selected Methods of Clinical
Chemistry, Vol 8. Cooper GR, ed. Washington, DC: American Association for Clinical Chemistry. 1997: 3-8. 38. Kessler G, M Wolfman. An automated procedure for the simultaneous determination of calcium and phosphorus. Clin
Chem 1964; 10: 686-703. 39. Michaylova V, et al. Photometric determination of micro amounts of calcium with arsenazo III. Anal Chim Acta 1971; 53:
194-198. 40. Scarpa A, et al. Metallochromic indicators of ionized calcium. Ann NY Acad Sci 1978; 307: 86-112. 41. Knoll VE, et al. Spezifische kreatininbetimmung im serum. Z Klin Chem Klin Biochem 1970; 8: 582-587. 42. Haeckel R, et al. Simplified determinations of the “true” creatinine concentration in serum and urine. J Clin Chem Clin
Biochem 1980; 18: 385-394. 43. Moss GA, et al. Kinetic enzymatic method for determining serum creatinine. Clin Chem 1975; 21: 1422-1426. 44. Jaynes PK, et al. An enzymatic, reaction-rate assay for serum creatinine with a centrifugal analyzer. Clin Chem 1982; 28:
114-117. 45. Fossati P, et al. Enzymatic creatinine assay: a new colorimetric method based on hydrogen peroxide measurement. Clin
Chem 1983; 29: 1494-1496. 46. Whelton A, et al. Nitrogen metabolites and renal function. In: Tietz Textbook of Clinical Chemistry, 2nd Ed. Burtis CA,
Ashwood ER, eds. Philadelphia: W.B. Saunders Company. 1994; 1513-1575. 47. National Kidney Disease Education Program (NKDEP). Creatinine Standardization.
http://www.nkdep.nih.gov/labprofessionals/creatinine_standardization.htm (Accessed September 2010). 48. National Kidney Disease Education Program (NKDEP) Creatinine Standardization Recommendations. IVD
Manufacturers. http://www.nkdep.nih.gov/labprofessionals/IVD_Manufacturers.htm (Accessed September 2010). 49. National Kidney Foundation. GFR Calculator. http://www.kidney.org/professionals/kls/gfr_calculator.cfm (Accessed
September 2010). 50. Ball, EG, Revel JP, Cooper O. The quantitative measurement of γ-glutamyl transpeptidase activity. J Biol Chem 1956;
221: 895-908. 51. Goldbarg JA, et al. The colorimetric determination of γ-glutamyl transpeptidase with a synthetic substrate. Arch Biochem
Biophys 1960; 91: 61-70. 52. Orlowski M, Meister A. γ-Glutamyl-p-nitroanilide: a new convenient substrate for determination and study of L- and D-γ-
glutamyltranspeptidase activities. Biochim Biophys Acta 1963; 73: 679-681 53. Persijn JP, van der Slik W. A new method for the determination of γ-glutamyltransferase in serum. J Clin Chem Clin
Biochem 1976; 14: 421-427. 54. Shaw LM, et al. IFCC methods for the measurement of catalytic concentration of enzymes. Part 4. IFCC method for γ-
glutamyltransferase. J Clin Chem Clin Biochem 1983; 21: 633-646. 55. Folin O, et al. A system of blood analysis. J Biol Chem 1919; 38: 81-110. 56. Somogyi M. A reagent for the copper-iodometric determination of very small amounts of sugar. J Biol Chem 1937; 117:
771-776. 57. Nelson N, et al. A photometric adaption of the Somogyi method for the determination of glucose. J Biol 1944; 153: 375-
380. 58. Kaplan LA. Glucose. In: Clinical Chemistry: Theory, Analysis, and Correlation, 2nd ed. Kaplan LA, Pesce AJ, eds. St.
Louis: The C.V. Mosby Company. 1989; 850-856. 59. Koller A, Kaplan LA. Total serum protein. In: Clinical Chemistry: Theory, Analysis, and Correlation, 2nd ed. Kaplan LA,
Pesce AJ, eds. St. Louis: The C.V. Mosby Company. 1989: 1057-1060. 60. Reigler E. Eine kolorimetrische Bestimmungsmethode des Eiweisses. Z Anal Chem 1914; 53: 242-245. 61. Weichselbaum TE. An accurate and rapid method for the determination of proteins in small amounts of blood serum and
plasma. Am J Clin Path 1946; 16: 40-49. 62. Doumas BT, et al. A candidate reference method for determination of total protein in serum. I. Development and
validation. Clin Chem 1981; 27: 1642-1650. 63. Fales FW. Urea in serum, direct diacetyl monoxime method. In: Selected Methods of Clinical Chemistry, vol 9. Faulkner
WR, Meites S, eds. Washington, DC: American Association for Clinical Chemistry. 1982; 365-373.
Page 20 of 20
64. Van Slyke, et al. A permanent preparation of urease, and its use in the determination of urea. J Biol Chem 1914; 19: 211-228.
65. Fawcett JK, et al. A rapid and Precise method for the determination of urea. J Clin Pathol 1960; 13: 156-159. 66. Chaney, et al. Urea and ammonia determinations. Clin Chem 1962; 8: 130-132. 67. Talke H, et al. Enzymatische harnstoffbestimmung in blut and serum im optischen test nach Warburg. Klin Wochensch
1965; 43: 174-175. 68. Hallett, et al. Reduced nicotinamide adenine dinucleotide-coupled reaction for emergency blood urea estimation. Clin
Chim Acta 1971; 35: 33-37. 69. Patton, et al. Spectrophotometric and kinetics investigation of the Berthelot reaction for the determination of ammonia.
Anal Chem 1977; 49: 464-469. 70. Sampson EJ, et al. A coupled-enzyme equilibrium method for the measuring urea in serum: optimization and evaluation
of the AACC study group on Urea Candidate reference method. Clin Chem 1980; 26: 816-826. 71. Folin O, Denis W. A new (colorimetric) method for the determination of uric acid in blood. J Biol Chem 1912-1913; 13:
469-475. 72. Brown H. The determination of uric acid in human blood. J Biol Chem 1945; 158: 601-608. 73. Feichtmeir TV, Wrenn HT. Direct determination of uric acid using uricase. Am J Clin Pathol 1955; 25: 833-839. 74. Fossati P, Prencipe L, Berti G. Use of 3,5-dichloro-2-hydroxy-benzenesulfonic acid/4-aminophenazone chromogenic
system in direct enzymic assay of uric acid in serum and urine. Clin Chem 1980; 26: 227-231. 75. Clinical and Laboratory Standards Institute. Physician’s office laboratory guidelines, tentative guideline, 2nd ed. CLSI
Document POL1-T2. Wayne, PA: CLSI, 1992. 76. Clinical and Laboratory Standards Institute. Procedures for the handling and processing of blood specimens; tentative
standard. CLSI Document H18-A2. Wayne, PA: CLSI, 1999. 77. Overfield CV, et al. Glycolysis: a re-evaluation of the effect on blood glucose. Clin Chim Acta 1972; 39: 35-40. 78. Rehak NN, Chiang BT. Storage of whole blood: effect of temperature on the measured concentration of analytes in serum.
Clin Chem 1988; 34-2111-4. 79. Clinical and Laboratory Standards Institute. Interference testing in clinical chemistry; proposed guideline. CLSI Document
EP7-A. Wayne, PA: CLSI, 2002. 80. Clinical and Laboratory Standards Institute. Interference testing in clinical chemistry; proposed guideline. CLSI
Publication EP7-P. Wayne, PA: CLSI, 1986. 81. Young DS. Effects of drugs on clinical laboratory tests, 3rd ed. Washington, DC: AACC Press, 1990. 82. Clinical and Laboratory Standards Institute. How to define and determine reference intervals in the clinical laboratory,
approved guidelines, 2nd ed. CLSI Document C28-A3. Wayne, PA: CLSI, 2008. 83. Clinical and Laboratory Standards Institute. Evaluation of precision performance of clinical chemistry devices; tentative
guideline – second edition. CLSI Document EP5-T2. Wayne, PA: CLSI, 1992. 84. Clinical and Laboratory Standards Institute. Evaluation of precision performance of clinical chemistry devices; approved
guideline. CLSI Document EP5-A. Wayne, PA: CLSI, 1999. 85. Clinical and Laboratory Standards Institute. Quality management for unit-use testing; proposed guideline. CLSI Document
EP18-A. Wayne, PA: CLSI, 2002. 86. Clinical and Laboratory Standards Institute. Method comparison and bias estimation using patient samples; approved
guideline. CLSI Document EP9-A2. Wayne, PA: CLSI, 2002. © 2010-2021 Abaxis, Inc. All rights reserved. Piccolo and Piccolo Xpress are registered trademarks of Abaxis, Inc. All other trademarks and service marks are the property of their respective owners.