phytoplankton-bacterioplankton interactions and carbon fluxes through microbial communities in a...
TRANSCRIPT

8
7
R E S E A R C H A R T I C L E
Phytoplankton^bacterioplankton interactions and carbon£uxesthroughmicrobial communities inamicrotidal lagoon (LagoonofVenice,Northern Italy)Q1
Alessandra Pugnetti1, Paola Del Negro2, Michele Giani3, Francesco Acri1, Fabrizio Bernardi Aubry1,Franco Bianchi1, Daniela Berto3 & Annalisa Valeri2
1Istituto di Scienze Marine (ISMAR), Consiglio Nazionale delle Ricerche, Castello, Venezia, Italy; 2Dipartimento di Oceanografia Biologica (BiO), Istituto
Nazionale di Oceanografia e di Geofisica Sperimentale (OGS), Trieste, Italy; and 3Istituto Superiore per la Protezione e la Ricerca Ambientale (ISPRA),
Chioggia, Italy
Correspondence: Alessandra Pugnetti,
Istituto di Scienze Marine (ISMAR), Consiglio
Nazionale delle Ricerche, Castello 1364/A,
I-30122 Venezia, Italy. Tel.: 139 041 240 4711;
fax: 139 041 520 4126; e-mail:
Present address: Michele Giani,
Dipartimento di Oceanografia Biologica (BiO),
Istituto Nazionale di Oceanografia e di
Geofisica Sperimentale (OGS), Via A. Piccard
54, I-34051 Trieste, Italy.
Received 16 March 2009; revised 11 December
2009; accepted 28 December 2009.
DOI:10.1111/j.1574-6941.2010.00839.x
Editor: Riks Laanbroek
Keywords
phytoplankton productivity; bacterial
production; organic carbon; exoenzimatic
activity; Venice lagoon; carbon fluxes.
Abstract
The strength of the bacteria–phytoplankton coupling and the importance of the
microbially mediated carbon fluxes have been investigated in a microtidal lagoon
(Lagoon of Venice), with emphasis on the trophic variations, in a within-system
perspective. The large trophic heterogeneity of the three stations considered
corresponded to an elevated variability of phytoplankton biomass and production
(from 0.1 up to 300 mg C L�1 h�1), while bacteria standing stock and production
(from 2 to 8 mg C L�1 h�1) appeared, in comparison, to be much more constant.
The relationships between bacteria and the phytoplankton community could not
be related to the trophic state in a straightforward way; rather, some patterns
common to the three stations could be evidenced. In particular, the two
communities appeared to be clearly uncoupled, bacterial carbon demand (BCD)
always exceeding dissolved primary production (DPP) and, mostly, also total
primary production, independent of the station and the season considered. The
occurrence of situations in which bacterial production was larger than primary
production and the continuous prevalence of BCD over DPP implied that, quite
independent of the trophic variability, sources of organic carbon other than
phytoplankton production were necessary and available to sustain the bacterial
metabolism in the Lagoon of Venice.
Introduction
Across-ecosystem analyses of the relationships between
bacterial carbon production (BCP) or bacterial carbon de-
mand (BCD) and primary production (PP) have supported
the general conceptual model that the bacterioplankton–phy-
toplankton coupling varies as a function of ecosystem char-
acteristics. In particular, a trophic dependence of bacteria on
algae, through the photosynthetic production of dissolved
organic carbon [dissolved primary production (DPP)], would
be characteristics of aquatic ecosystems where bacteria are
carbon limited. There is a general trend towards a tight linkage
in open oceans and clear water lakes and of loose coupling in
coastal or eutrophic sites. In open seas and clear water lakes,
the general picture is one of a nutrient-controlled energy flow,
where phytoplankton particulate organic matter is the main
energy source for grazers and dissolved organic carbon (DOC)
derived from phytoplankton (e.g. direct exudation through
DPP, lyses) represents the main energy source for bacteria,
supporting all the BCD, so that the bacteria–phytoplankton
coupling is tight. In contrast, in estuaries and coastal lagoons,
the plankton system might show a net heterotrophic metabo-
lism (respiration4 gross primary production) or a seasonal
shift from net autotrophy to net heterotrophy that may be due
to turbidity and nutrient variations and due to inputs of
organic matter allochthonous to the planktonic system
1
2
3
4
5
6
7
8
9
10
11
12
13
14
15
16
17
18
19
20
21
22
23
24
25
26
27
28
29
30
31
32
33
34
35
36
37
38
39
40
41
42
43
44
45
46
47
48
49
50
51
52
53
FEMS Microbiol Ecol ]] (2010) 1–12 c� 2010 Federation of European Microbiological SocietiesPublished by Blackwell Publishing Ltd. All rights reserved
F E M S E C 8 3 9 B Dispatch: 2.2.10 Journal: FEMSEC CE: Mahendra
Journal Name Manuscript No. Author Received: No. of pages: 12 TE: Deepa/MiniFEMSEC 839
(BW
UK
FE
MSE
C 8
39 W
ebpd
f:=
02/0
2/20
10 0
9:53
:21
4512
72 B
ytes
12
PAG
ES
n op
erat
or=
M.C
hack
alay
il) 2
/2/2
010
9:53
:29
PM

8
7
8
7
(Revilla et al., 2002; Hopkinson & Smith, 2005). As a
consequence, in transitional ecosystems, BCD may be met
not only by DPP but also by nonphytoplanktonic (leachates
from plants and exudates from macrophytes, pore water from
sediments) or by allochthonous sources (runoff, riverine
inputs) of organic carbon, leading to a loose coupling between
bacteria and phytoplankton. High bacteria biomass and BCP
may therefore occur in transitional ecosystems, where bacteria
and phytoplankton communities are often uncoupled, plank-
ton community respiration (CR) may exceed phytoplankton
photosynthesis and secondary production may be based, at
least during some seasons, on bacterial mobilization of
preformed organic matter, rather than on contemporaneous
phytoplankton photosynthesis (Gaedke & Kamjunke, 2006;
Berglund et al., 2007).
The pattern of strength variation of the bacterioplank-
ton–phytoplankton coupling appears evident from across-
ecosystem studies, but it does not necessarily hold for
smaller spatial and temporal scales. In some coastal ecosys-
tems, indeed, the reverse pattern has been observed, and a
tight coupling between DPP and BCD is recorded at the
most eutrophic sites and a loose linkage at the most
oligotrophic ones (Gonzalez-Benitez & Gattuso, 2003;
Rochelle-Newall et al., 2008).
The Lagoon of Venice (northern Adriatic Sea) is the
largest Italian lagoon and one of the largest in the Mediter-
ranean. The lagoon is intrinsically characterized by a high
heterogeneity in morphological structures and in the spatial
distribution of physical, biogeochemical and biological
parameters (Bianchi et al., 2000; Ravera, 2000; Acri et al.,
2004; Solidoro et al., 2004). The plankton communities in
this environment undergo complex spatial and temporal
dynamics. Exchanges with the sea, benthic–pelagic coupling
and river inflows appear to be important in defining the
spatial distribution of the plankton communities, even
though seasonality is the main factor leading successionQ2
(Bernardi Aubry & Acri, 2004; Bandelj et al., 2008). Phyto-
plankton community production has been traditionally
considered the main process sustaining the whole plank-
tonic food web in the lagoon (Bianchi et al., 2000; Acri et al.,
2004), while bacterial production and biomass have been
largely neglected, being studied only sporadically (Sorokin
et al., 1996, 2002). No information on the bacteria–phyto-
plankton coupling and on the carbon fluxes through the
microbial communities in Lagoon of Venice is available,
whereas long-term studies on the biomass and taxonomic
composition of phytoplankton and macrophytes are well
documented for the last 30 years (Acri et al., 2004; Sfriso
et al., 2005). The net ecosystem metabolic balance for the
whole lagoon has been calculated on the basis of the nutrient
budget, in the framework of the Land-Ocean Interactions in
the Coastal Zone activities (Giordani et al., 2005), and it
showed a state of near-balance between autotrophic and
heterotrophic processes, on a yearly base, with net auto-
trophy prevailing only in summer. A prevalent hetero-
trophic metabolism of the lagoon has been evidenced
through dissolved oxygen mass-balance models applied to
time series of high-frequency oxygen data collected in situ
(Ciavatta et al., 2008).
In this work, we aim at evaluating the strength of the
bacteria–phytoplankton coupling and at quantifying the
importance and the significance of the microbially mediated
carbon fluxes in the Lagoon of Venice and their seasonal and
spatial variations, with an emphasis on trophic state varia-
bility. Our work focuses on the water column, which, in this
shallow environment, is the result of the continuous water–
sediment interactions. We considered PP (total, particulate
and dissolved), BCP and CR as the main indicators of the
plankton system functioning, responding to environmental
variables such as light, nutrients and organic matter avail-
ability that are commonly influenced by the catchment’s
features and disturbance due both to anthropic and to
natural changes. We wish to make a contribution to the
debate about the environmental factors that influence the
bacteria–phytoplankton linkage and the microbially
mediated C fluxes from a within-system viewpoint. In
particular, we aimed at assessing, in an area characterized
by different trophic conditions: (1) the strength of the
coupling between phytoplankton and bacterial communities
(relationships between DPP and BCD), (2) the prevalent
base of the planktonic food web (relationships between BCP
and PP) and (3) the net autotrophy vs. the net heterotrophy
nature of the planktonic system (relationships between CR
and PP).
Materials and methods
Study area
The Lagoon of Venice (Fig. 1) is a large Mediterranean
lagoon of �550 km2, located in the northern Adriatic Sea. It
is surrounded by densely inhabited shores and industrial
plants and it hosts ports, shipyards, marinas, fisheries,
aquaculture and recreational activities. The lagoon has an
average depth of �1 m and it is morphologically character-
ized by the presence of large shallow areas and by a network
of deeper (5–10 m) channels. It is connected to the Adriatic
Sea by three inlets, through which tidal currents drive water
exchanges. The tidal amplitude is�100 cm, with maxima up
to 150 cm. The lagoon can be classified as polyhaline. Twelve
main tributaries annually carry about 35 m�3 s�1 of fresh-
water in the lagoon (Zuliani et al., 2005); nitrogen and
phosphorus load are in the order of Q34000 t N year�1 and
230 t P year�1 (Collavini et al., 2005).
The Lagoon of Venice presents a high variability in most
environmental parameters and a high habitat heterogeneity.
1
2
3
4
5
6
7
8
9
10
11
12
13
14
15
16
17
18
19
20
21
22
23
24
25
26
27
28
29
30
31
32
33
34
35
36
37
38
39
40
41
42
43
44
45
46
47
48
49
50
51
52
53
FEMS Microbiol Ecol ]] (2010) 1–12c� 2010 Federation of European Microbiological SocietiesPublished by Blackwell Publishing Ltd. All rights reserved
2 A. Pugnetti et al.
FEMSEC 839
(BW
UK
FE
MSE
C 8
39 W
ebpd
f:=
02/0
2/20
10 0
9:53
:21
4512
72 B
ytes
12
PAG
ES
n op
erat
or=
M.C
hack
alay
il) 2
/2/2
010
9:53
:29
PM

Within this ecosystem, we studied three shallow water
(2–3 m deep) sites (Fig. 1) located in plankton-dominated
areas of the lagoon. In these areas, the presence of macro-
phytes is negligible and most of the pp is by the phytoplank-
ton (Acri et al., 2004; Sfriso et al., 2005).
The three stations represent different environments typi-
cal of the central and northern lagoon. St. 1 is influenced by
urban wastewaters from the town of Mestre; st. 2 is a marshy
area and it represents a typical lagoon environment; st. 3 is
close to the inlet of Lido that allows the communication of
the lagoon with the Adriatic Sea, but it is also influenced by
the inputs of freshwater channels.
Sampling
Transparency (Secchi disk), photosynthetically active radia-
tion (PAR; LiCor Li-192), temperature, salinity, dissolved
oxygen and pH (Idronaut Ocean Seven 316 multiprobe)
were measured throughout the water column. Samples for
dissolved inorganic macronutrients (Grasshoff et al., 1999),
phytoplankton and bacterial communities, respiration, par-
ticulate organic carbon (POC) and DOC were collected at
the surface water layer, representative of the whole water
column. The water column was assumed to be well mixed
because the differences in surface and bottom salinity and
temperature were minimal. Hydrological parameters, nutri-
ents and chlorophyll a (chl) were determined monthly, and
the microbial carbon parameters and fluxes seasonally
(January, April, July and October 2005). Samplings were
always performed at neap tide, in order to minimize the
effects of tidal currents.
Phytoplankton production and CR
Phytoplankton chl was determined spectrofluorometrically
according to Holm-Hansen et al. (1965). Samples for total
primary production (TPP) (14C method) were incubated
under simulated in situ conditions (natural sunlight and
maintaining in situ temperature) for 2 h around noon. Two
hundred and fifty milliliters of subsamples and a dark bottle
were inoculated with 148 kBq of NaH14CO3. TPP was
determined on duplicate subsamples (5 mL) that were
acidified and stirred for one hour, before being radioassayed.
Particulate primary production (PPP) and DPP was deter-
mined after filtrations of 10 mL of samples on 0.2 mm
polycarbonate filters at a low (o 10 mmHg) vacuum pres-
sure. The DPP was always significantly different from the
corresponding dark bottle values. In order to also take into
account the potential rapid bacterial uptake of labelled
dissolved organic carbon (DO14C) during incubations, we
1
2
3
4
5
6
7
8
9
10
11
12
13
14
15
16
17
18
19
20
21
22
23
24
25
26
27
28
29
30
31
32
33
34
35
36
37
38
39
40
41
42
43
44
45
46
47
48
49
50
51
52
53
Fig. 1. Location of the sampling stations in the
Venice Lagoon.
Q13
FEMS Microbiol Ecol ]] (2010) 1–12 c� 2010 Federation of European Microbiological SocietiesPublished by Blackwell Publishing Ltd. All rights reserved
3Phytoplankton and bacterioplankton in the Lagoon of Venice
FEMSEC 839
(BW
UK
FE
MSE
C 8
39 W
ebpd
f:=
02/0
2/20
10 0
9:53
:21
4512
72 B
ytes
12
PAG
ES
n op
erat
or=
M.C
hack
alay
il) 2
/2/2
010
9:53
:29
PM

measured the 14C-labelled 0.2–2-mm size fraction as well, by
an additional filtration on 2-mm pore-size polycarbonate
filters. Because the 0.2–2-mm size fraction (PPpico, as the
difference between the 0.2 and the 2 mm filters) also includes
the 14C incorporated by autotrophic picoplankton, the sum
of DPP and PPpico could be taken to represent the maximum
potential carbon exudation rates.
The daily TPP was estimated considering the ratio
between the duration of the incubation (around 2 h) and
the total day length that ranged between 9 h (in winter)
and 15 h (in summer). Considering the inherent daily
variability of the phytoplankton community, related to the
tidal hydrodynamics – not assessed in the present work – the
daily TPP extrapolated from the hourly data must be
considered as a potential value.
CR was estimated as the difference in dissolved oxygen at
the beginning and after a 24-h incubation of triplicate 250-
mL water samples in the dark and at in situ temperature.
Dissolved oxygen was assayed by potentiometric Winkler
titrations (794 Basic Titrino, Metrohm). The oxygen uptake
rates were transformed into inorganic carbon production
assuming, in the absence of detailed information about
the composition of the substrate used, a respiratory quotient
of 1.
Bacterial abundance and ectoenzymaticactivities
Heterotrophic bacterial abundances were estimated on
samples fixed with 2% final concentration borate-buffered
prefiltered formalin, following a modification of the method
of Porter & Feig (1980). Subsamples (10 mL) were stained
with 40,6-diamidino-2-phenylindole (Sigma; 1 mg mL�1 final
concentration) and enumerated by an Olympus BX 60 F5
epifluorescence microscope at 1000 using a UV filter set (BP
330–385 nm). Bacterial abundance was converted into car-
bon equivalents (heterotrophic bacterial biomass, HBB)
using the conversion factor of 20 fg C per cell (Lee & Fuhr-
man, 1987).
BCP was estimated by the incorporation of 3H-leucine
(Leu-BCP) (Kirchman et al., 1985; Smith & Azam, 1992).
Triplicate 1.7-mL aliquots and two killed controls [90mL,
100% trichloracetic acid (TCA)] were amended with 20 nM
radiotracer and incubated at in situ (� 2 1C) temperature in
the dark. Incubations were stopped with 100% TCA after
1 h. The samples were processed following the microcentri-
fugation method (Smith & Azam, 1992). Radioactivity in
the samples was determined by a liquid scintillation counter
(Packard Tri-Carb 300) after the addition of 1 mL of
scintillation cocktail (Ultima Gold MV; Packard). Incor-
poration of 3H-leucine was converted into carbon produced
via bacterial protein production according to Simon &
Azam (1989), assuming a twofold isotope dilution for Leu.
BCD is the sum of BCP and bacterial respiration (BR),
assuming insignificant release of organic matter. Because of
methodological difficulties in correctly measuring BR, BCD
was estimated as Leu-BCP/BGE, with BGE values calculated
from the del Giorgio & Cole (1998) empirical model. The
daily rates of bacteria activity were estimated assuming the
activity rates to be constant throughout the day. Hydrolytic
ectoenzyme activities were measured using fluorogenic
substrates (Hoppe, 1993) derived from 7-amino-methyl-
coumarin (AMC) and 4-methyl-umbelliferone (MUF).
Aminopeptidase activity was assayed as the hydrolysis rate
of L-leucine-AMC. b-D-Glucosidase, a-D-glucosidase, b-D-
galactosidase, a-D-galactosidase, lipase, N-acetyl glucosami-
nidase and alkaline phosphatase were assayed using MUF
derivatives. Enzyme activities were expressed in terms of the
rate of MUF or AMC production. After evaluation of the
saturating concentration, hydrolysis was measured by in-
cubating 2.5-mL subsamples with 50 mM MUF phosphate
and 200mM leucine-AMC and other MUF substrates for 1 h
at in situ temperature in the dark. All samples were run in
triplicate with 0.2 mm filtered and boiled seawater as con-
trols. The fluorescence released by enzymatic cleavage of the
artificial substrates was measured fluorometrically at 380/
365 nm excitation and 440/455 nm emission for AMC/MUF
substrates using a Shimadzu RF 1501 fluorometer. Standard
solutions of MUF and AMC were used to perform
calibration curves. The velocity of hydrolysis (mM h�1) of b-D-
glucosidase, a-D-glucosidase, b-D-galactosidase, a-D-galactosi-
dase, lipase, N-acetyl glucosaminidase and L-leucine-amino-
peptidase was converted into the C content of the organic
component hydrolyzed from the model substrate using the
conversion factor of 72 in cases where the organic component
is glucose or a 6-C monosaccharide or a 6-C amino acid
(Hoppe, 1993) and of 216 where the organic component is
oleic acid. The sum of the enzymatic activities, expressed as
mg C L�1 h�1, represents the rate of C potentially mobilized
from the macromolecules by hydrolytic enzymes.
Organic carbon
Water samples for DOC, chromophoric dissolved organic
material (CDOM) and POC were analyzed after filtration
through precombusted (4 h, 450 1C) Whatman GF/F filters.
DOC concentrations were measured using a Shimadzu TOC
5000 Analyzer with a 1.2% Pt on silica as a catalyst at 680 1C
(Cauwet, 1994). Samples were acidified (pH = 2) with HCl
and purged with pure air for 10 min immediately before
analysis. DOC concentrations were calculated by subtracting
the system blanks (8.7� 0.9mmol L�1) and dividing by the
slope of the calibration curve (Thomas et al., 1995).
Potassium hydrogen phthalate was used as the standard.
One hundred microliters of samples were injected for each
analysis and the concentration was calculated as the average
1
2
3
4
5
6
7
8
9
10
11
12
13
14
15
16
17
18
19
20
21
22
23
24
25
26
27
28
29
30
31
32
33
34
35
36
37
38
39
40
41
42
43
44
45
46
47
48
49
50
51
52
53
FEMS Microbiol Ecol ]] (2010) 1–12c� 2010 Federation of European Microbiological SocietiesPublished by Blackwell Publishing Ltd. All rights reserved
4 A. Pugnetti et al.
FEMSEC 839
(BW
UK
FE
MSE
C 8
39 W
ebpd
f:=
02/0
2/20
10 0
9:53
:21
4512
72 B
ytes
12
PAG
ES
n op
erat
or=
M.C
hack
alay
il) 2
/2/2
010
9:53
:29
PM
8
7
of three to five replicates. The reproducibility was o 3%.
POC concentrations were determined using a CHN Ele-
mental AnalyzerFisons EA1108, after acidification with HClQ4
(Nieuwenhuize et al., 1994) to remove the inorganic carbo-
nate, with high reproducibility (o 2%). Acetanilide was
used as the standard.
The UV-Vis spectra of the filtered lagoon water were
performed by a UV2 spectrophotometer ATI Unicam from
270 to 800 nm with a 5-cm quartz optical cell using Milli-Q
water as the blank, as reported by Vodacek et al. (1997). To
quantify the CDOM in each sample, we used the absorption
coefficient (aCDOM, in m�1) at 355 nm as a proxy, calcu-
lated from the sample absorbance (A) in nm�1 and path
length (L) in meters as follows:
aCDOMð355Þ ¼ 2:303ACDOMð355Þ=L
Results
Trophic characteristics and climatology
At the three selected stations, pluriannual studies for hydrol-
ogy, nutrients and plankton have been carried out (Bianchi
et al., 2003; Acri et al., 2004). These stations are reference
ones for long-term ecological research studies (LTER) in the
Lagoon of Venice, one of the LTER national and interna-
tional sites. The monthly variations of the main hydrological
and trophic parameters, averaged for the last three years
(2006–2008) and compared (median comparison, Man-
n–Whitney test) with those observed in 2005, did not show
statistically significant differences: the year 2005 therefore
represents fairly well the most recent conditions of the
Lagoon of Venice.
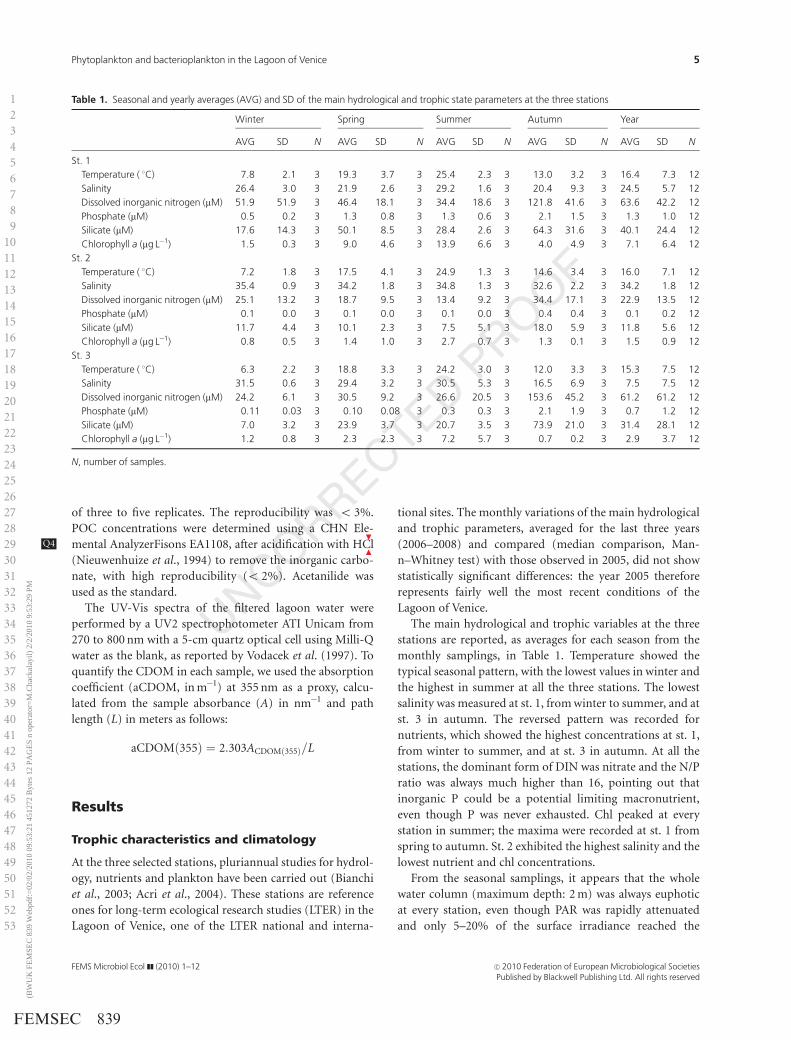
The main hydrological and trophic variables at the three
stations are reported, as averages for each season from the
monthly samplings, in Table 1. Temperature showed the
typical seasonal pattern, with the lowest values in winter and
the highest in summer at all the three stations. The lowest
salinity was measured at st. 1, from winter to summer, and at
st. 3 in autumn. The reversed pattern was recorded for
nutrients, which showed the highest concentrations at st. 1,
from winter to summer, and at st. 3 in autumn. At all the
stations, the dominant form of DIN was nitrate and the N/P
ratio was always much higher than 16, pointing out that
inorganic P could be a potential limiting macronutrient,
even though P was never exhausted. Chl peaked at every
station in summer; the maxima were recorded at st. 1 from
spring to autumn. St. 2 exhibited the highest salinity and the
lowest nutrient and chl concentrations.
From the seasonal samplings, it appears that the whole
water column (maximum depth: 2 m) was always euphotic
at every station, even though PAR was rapidly attenuated
and only 5–20% of the surface irradiance reached the
1
2
3
4
5
6
7
8
9
10
11
12
13
14
15
16
17
18
19
20
21
22
23
24
25
26
27
28
29
30
31
32
33
34
35
36
37
38
39
40
41
42
43
44
45
46
47
48
49
50
51
52
53
Table 1. Seasonal and yearly averages (AVG) and SD of the main hydrological and trophic state parameters at the three stations
Winter Spring Summer Autumn Year
AVG SD N AVG SD N AVG SD N AVG SD N AVG SD N
St. 1
Temperature ( 1C) 7.8 2.1 3 19.3 3.7 3 25.4 2.3 3 13.0 3.2 3 16.4 7.3 12
Salinity 26.4 3.0 3 21.9 2.6 3 29.2 1.6 3 20.4 9.3 3 24.5 5.7 12
Dissolved inorganic nitrogen (mM) 51.9 51.9 3 46.4 18.1 3 34.4 18.6 3 121.8 41.6 3 63.6 42.2 12
Phosphate (mM) 0.5 0.2 3 1.3 0.8 3 1.3 0.6 3 2.1 1.5 3 1.3 1.0 12
Silicate (mM) 17.6 14.3 3 50.1 8.5 3 28.4 2.6 3 64.3 31.6 3 40.1 24.4 12
Chlorophyll a (mg L�1) 1.5 0.3 3 9.0 4.6 3 13.9 6.6 3 4.0 4.9 3 7.1 6.4 12
St. 2
Temperature ( 1C) 7.2 1.8 3 17.5 4.1 3 24.9 1.3 3 14.6 3.4 3 16.0 7.1 12
Salinity 35.4 0.9 3 34.2 1.8 3 34.8 1.3 3 32.6 2.2 3 34.2 1.8 12
Dissolved inorganic nitrogen (mM) 25.1 13.2 3 18.7 9.5 3 13.4 9.2 3 34.4 17.1 3 22.9 13.5 12
Phosphate (mM) 0.1 0.0 3 0.1 0.0 3 0.1 0.0 3 0.4 0.4 3 0.1 0.2 12
Silicate (mM) 11.7 4.4 3 10.1 2.3 3 7.5 5.1 3 18.0 5.9 3 11.8 5.6 12
Chlorophyll a (mg L�1) 0.8 0.5 3 1.4 1.0 3 2.7 0.7 3 1.3 0.1 3 1.5 0.9 12
St. 3
Temperature ( 1C) 6.3 2.2 3 18.8 3.3 3 24.2 3.0 3 12.0 3.3 3 15.3 7.5 12
Salinity 31.5 0.6 3 29.4 3.2 3 30.5 5.3 3 16.5 6.9 3 7.5 7.5 12
Dissolved inorganic nitrogen (mM) 24.2 6.1 3 30.5 9.2 3 26.6 20.5 3 153.6 45.2 3 61.2 61.2 12
Phosphate (mM) 0.11 0.03 3 0.10 0.08 3 0.3 0.3 3 2.1 1.9 3 0.7 1.2 12
Silicate (mM) 7.0 3.2 3 23.9 3.7 3 20.7 3.5 3 73.9 21.0 3 31.4 28.1 12
Chlorophyll a (mg L�1) 1.2 0.8 3 2.3 2.3 3 7.2 5.7 3 0.7 0.2 3 2.9 3.7 12
N, number of samples.
FEMS Microbiol Ecol ]] (2010) 1–12 c� 2010 Federation of European Microbiological SocietiesPublished by Blackwell Publishing Ltd. All rights reserved
5Phytoplankton and bacterioplankton in the Lagoon of Venice
FEMSEC 839
(BW
UK
FE
MSE
C 8
39 W
ebpd
f:=
02/0
2/20
10 0
9:53
:21
4512
72 B
ytes
12
PAG
ES
n op
erat
or=
M.C
hack
alay
il) 2
/2/2
010
9:53
:29
PM

8
7
bottom. According to the Kd (Table 2), PAR attenuation in the
water column was the highest at st. 1 and the lowest at st. 3.
Phytoplankton production, bacterial productionand CR
The remarkable degree of trophic variability among the
three stations was also reflected in the wide seasonal and
spatial range of chl and TPP (Table 2).
TPP increased markedly at all stations from winter to
summer, when the maxima were attained, then decreasing
in autumn, in accordance with temperature and phyto-
plankton biomass variations. Indeed, considering the whole
data set, TPP was strongly correlated with both temperature
(r = 0.82, Po 0.05, n = 12) and chl (r = 0.86, Po 0.05,
n = 12). The highest TPP was measured at st. 1 from spring
to autumn.
HBB and Leu-BCP showed a seasonal variation qualita-
tively similar to that of phytoplankton biomass, increasing
at all the stations from winter to summer and then decreas-
ing in autumn (Table 2). The highest HBB and BCP were
prevalently recorded at st. 1 (Table 2). The heterotrophic
metabolism appeared to be much less variable with respect
to the widely ranging phytoplankton production, in parti-
cular at st. 1. Leu-BCP was correlated, although weakly, with
TPP (r = 0.58, Po 0.05, n = 12).
Hourly phytoplankton production efficiency (Pb) fol-
lowed the pattern of TPP and chl at st. 1 and st. 2, while at
st. 3, it increased also from summer to autumn, when the
maximum value was attained (Table 2). The hourly BCP
efficiency (ratio between BCP and HBB, Table 2) varied
much more irregularly than Pb, without showing a clearly
identifiable pattern among stations and through seasons.
The daily values of BCP and TPP are given in Table 3. On
a daily basis, Leu-BCPd prevailed over TPPd only in winter
and summer at st. 3, in winter and spring at st. 1 and in
winter, spring and autumn at st. 2 Q5. The daily respiration
rates (CRd, Table 3) showed the same seasonal pattern as
TPP at every station, with the maximum attained at st. 1 in
summer. CRd was indeed correlated both with temperature
(r = 0.67, Po 0.05, n = 12) and with TPP (r = 0.91, Po 0.05,
n = 12), while the correlation with HBB was not significant.
Daily CR prevailed over TPPd always at st. 3, in winter and
spring at st. 2 and only in winter at st. 1.
1
2
3
4
5
6
7
8
9
10
11
12
13
14
15
16
17
18
19
20
21
22
23
24
25
26
27
28
29
30
31
32
33
34
35
36
37
38
39
40
41
42
43
44
45
46
47
48
49
50
51
52
53
Table 2. Selected hydrological and biological parameters and activities at the three stations, in the four sampling periods
Winter Spring Summer Autumn
St. 1 St. 2 St. 3 St. 1 St. 2 St. 3 St. 1 St. 2 St. 3 St. 1 St. 2 St. 3
Kd (m�1) 3.8 1.5 0.1 1.7 1.2 0.8 2.5 1.6 0.6 3.5 1.3 1.4
Chlorophyll a (mg L�1) 1.3 2.1 0.3 3.8 1.2 1.6 19.9 4.9 1.8 9.7 1.0 0.9
HBB (mg C L�1) 66.5 23.0 21.8 68.5 63.2 31.9 212.3 109.3 119.1 40.8 53.4 31.5
POC (mM) 63.0 62.0 41.0 149.9 27.9 47.6 149.9 67.8 71.8 86.9 27.2 30.4
DOC (mM) 173.0 160.0 181.0 271.1 186.2 182.3 250.0 266.0 180.0 271.5 158.5 202.8
DOC/TOC (%) 73 72 82 64 87 79 63 80 71 76 85 87
aCDOM355 (nm�1) 0.3 0.8 0.6 3.9 1.0 – 3.1 1.1 0.4 3.7 1.7 0.5
TPP (mg C L�1 h�1) 0.02 1.4 0.9 15.3 5.0 11.5 300.4 71.9 16.1 92.8 5.4 12.1
DPP (mg C L�1 h�1) 0.0 0.2 0.1 1.1 1.5 0.2 3.1 0.6 0.2 4.2 0.0 0.6
PPP (mg C L�1 h�1) 0.1 1.2 0.9 14.3 3.5 11.3 297.3 71.3 15.9 88.6 5.4 11.5
PER (%) 1.0 14.3 5.6 6.9 30.0 1.7 1.0 0.8 1.1 4.5 0.2 5.0
Pb (mg C mg Chl L�1 h�1) 0.1 0.7 2.9 4.0 4.2 7.2 15.1 14.6 8.8 9.6 5.6 14.2
Leu-BCP (mg C L�1 h�1) 2.3 3.3 2.9 9.7 4.7 3.0 11.5 6.6 5.6 5.0 2.7 0.6
Leu-BCP/TPP 116.45 2.38 3.18 0.63 0.94 0.26 0.04 0.09 0.35 0.05 0.50 0.05
BCD (mg C L�1 h�1) 6.2 7.8 7.0 17.6 9.9 7.2 20.4 12.8 11.3 10.3 6.7 3.3
BCD/DPP 4 100 38.8 4 100 16.8 6.6 36.2 6.6 21.4 66.3 2.5 4 100 5.5
BCD/TPP 4 100 5.5 7.8 1.1 2.0 0.6 0.1 0.2 0.7 0.1 1.2 0.3
Leu-BCP/HBB (h�1) 0.04 0.15 0.13 0.14 0.07 0.09 0.05 0.06 0.05 0.12 0.05 0.02
CR (mg C L�1 h�1) 0.1 1.1 2.1 4.2 3.2 3.6 24.2 7.3 7.3 7.2 0.9 4.5
AMA (nM h�1) 549.7 407.1 255.0 1351.7 556.3 490.0 3155.0 796.0 475.0 753.2 181.0 231.6
APA (nM h�1) 11.3 19.6 4.0 24.6 20.0 31.8 39.7 90.9 161.6 81.8 19.2 51.4
LA (nM h�1) 1.7 90.8 25.8 24.0 15.4 24.8 12.4 8.0 2.7 840.2 878.7 55.5
a-glu (nM h�1) 2.0 7.5 3.3 4.7 4.5 6.8 9.5 7.2 5.7 15.1 2.7 2.8
b-glu (nM h�1) 3.5 1.8 0.5 5.1 3.0 6.0 11.8 15.0 18.5 22.6 4.7 3.7
a-gal (nM h�1) 1.1 2.3 1.6 3.6 3.3 7.8 7.7 6.0 0.0 116.2 6.4 7.6
b-gal (nM h�1) 1.5 3.6 0.9 1.6 1.4 2.0 7.2 2.3 1.2 19.6 2.9 5.6
NAG (nM h�1) 2.2 5.0 1.0 4.3 5.8 5.5 13.7 16.6 12.2 61.0 5.6 7.7
APA/AMA 0.021 0.048 0.016 0.018 0.036 0.065 0.013 0.114 0.340 0.109 0.106 0.222
See text for abbreviations.
FEMS Microbiol Ecol ]] (2010) 1–12c� 2010 Federation of European Microbiological SocietiesPublished by Blackwell Publishing Ltd. All rights reserved
6 A. Pugnetti et al.
FEMSEC 839
(BW
UK
FE
MSE
C 8
39 W
ebpd
f:=
02/0
2/20
10 0
9:53
:21
4512
72 B
ytes
12
PAG
ES
n op
erat
or=
M.C
hack
alay
il) 2
/2/2
010
9:53
:29
PM

8
7
Phytoplankton exudate release and BCD
Both DPP and the percentage carbon extracellular release
(PER = DPP%TPP) exhibited a very irregular pattern,
throughout seasons and stations (Table 2). The highest
DPP were attained at st. 1 in summer and autumn. On the
contrary, the PER was the lowest at this station, while it
attained the highest values at st. 2 in spring. Considering the
whole data set, DPP was correlated with both TPP (r = 0.76,
Po 0.05, n = 12) and PPP (r = 0.74, Po 0.05, n = 12; Fig. 2).
No significant relationships were found between PER and
PPP (Fig. 2) or TPP.
BCD (Tables 2 and 3) increased at every station from
winter to summer, then decreasing in autumn. The highest
values, from spring to autumn, were recorded at st. 1. On a
daily basis, DPPQ6 (Table 3) represented only a small fraction
(o 5%) of BCD and it was therefore never sufficient to
completely sustain the BCD. Also, the maximum potential
daily DPP (DPP1PPpico) was never sufficient to meet BCD
on a daily basis. Taking into account the TPP, as a non-
contemporaneous DOC pool potentially available for bac-
teria, BCD was met by TPP only in summer and autumn at
st. 1. No significant correlations were found between BCD
and DPP or TPP (Fig. 3) and between BCP and DPP (Fig. 3).
Enzymatic activities and potential organiccarbon mobilization
Among the assayed extracellular enzymatic activities (Table
2), aminopeptidase activity (AMA) showed the highest
values. The maxima were always recorded at st. 1 and in
summer at every station. The alkaline phosphatase activity
(APA) was quite low and it showed the same similar pattern
as for AMA only at st. 2 and 3, while it attained the
maximum in autumn at st. 1, appearing decoupled from
the seasonal pattern of phytoplankton and bacteria biomass
here (Table 2). The APA/AMA ratio, proposed as a proxy of
phosphorus deficiency in microbial assemblages (Sala et al.,
2001), was always o 1, indicating good phosphorus avail-
ability in the lagoon waters. The specific activity of APA and
AMA (APA and AMA/HBB and APA/chl, Table 2) showed a
very irregular pattern among both seasons and stations.
The lipase- and the enzymatic-degrading polysaccharides
activities varied irregularly, without showing a clearly
identifiable pattern among stations and through seasons
(Table 2).
1
2
3
4
5
6
7
8
9
10
11
12
13
14
15
16
17
18
19
20
21
22
23
24
25
26
27
28
29
30
31
32
33
34
35
36
37
38
39
40
41
42
43
44
45
46
47
48
49
50
51
52
53
Table 3. Daily metabolic rates at the three stations, in the four seasons
Winter Spring Summer Autumn
St. 1 St. 2 St. 3 St. 1 St. 2 St. 3 St. 1 St. 2 St. 3 St. 1 St. 2 St. 3
TPP (mg C L�1 day�1) 0.1 6.6 4.3 107.5 35.4 80.4 2295 552.4 123.5 539.2 31.2 71
DPP (mg C L�1 day�1) 0 0.9 0.2 7.4 10.6 1.4 23.7 4.6 1.3 24.4 0.1 3.5
Leu-BCP (mg C L�1 day�1) 55.9 79.9 68.7 232.8 112.8 72.0 276.0 158.4 134.4 119.2 64.3 13.2
BCD (mg C L�1 day�1) 148.8 186.2 168.8 422.1 237.1 173.9 488.7 307.5 270.5 247.1 161.9 78.7
Cmob (mg C L�1 day�1) 976.6 1209.1 587.0 2493.0 1072.3 1023.9 5602.4 1498.3 899.9 6062.3 4906.7 735.4
CR (mg C L�1 day�1) 2.4 26.9 50.8 100.3 75.6 87.3 581.7 175.2 175.9 173.1 22.2 108.0
BCP/TPP 4100 12.1 16.0 2.2 3.2 0.9 0.1 0.3 1.1 0.2 2.1 0.2
BCD/TPP 4100 28.2 39.3 3.9 6.7 2.2 0.2 0.6 2.2 0.5 5.2 1.1
BCD/DPP 4100 4100 4 100 57.2 22.3 4 100 20.6 66.7 4 100 10.1 4 100 22.3
CR/TPP 24.0 4.1 11.8 0.9 2.1 1.1 0.3 0.3 1.4 0.3 0.7 1.5
DOC/Cmob (days) 2.1 1.6 3.7 1.3 2.1 2.1 0.5 2.1 2.4 0.5 0.4 3.3
0.0
0.5
1.0
1.5
2.0
2.5
3.0
Log particulated primary production(µg C L–1 h–1)
Log
diss
olve
d pr
imar
ypr
oduc
tion
(µg
C L
–1 h
–1)
St. 1 St. 2 St. 3
0
5
10
15
20
25
30
35
0.0 0.5 1.0 1.5 2.0 2.5 3.0
0 50 100 150 200 250 300 350Particulated primary production
(µg C L–1 h–1)
Per
cent
age
extr
acel
lula
rre
leas
e (%
)
St. 1 St. 2 St. 3
(a)
(b)
Fig. 2. (a) Log–log plot between hourly dissolved primary production
and particulated primary production. (b) Plot of photosynthetic extra-
cellular release vs. particulate primary production.
FEMS Microbiol Ecol ]] (2010) 1–12 c� 2010 Federation of European Microbiological SocietiesPublished by Blackwell Publishing Ltd. All rights reserved
7Phytoplankton and bacterioplankton in the Lagoon of Venice
FEMSEC 839
(BW
UK
FE
MSE
C 8
39 W
ebpd
f:=
02/0
2/20
10 0
9:53
:21
4512
72 B
ytes
12
PAG
ES
n op
erat
or=
M.C
hack
alay
il) 2
/2/2
010
9:53
:29
PM

The potential bacterial carbon mobilization (Cmob, Table
3), calculated from bacterial enzymatic activity, increased
from winter to summer at every station. The highest values
were measured at st. 1. Daily BCD always appeared to be
satisfied by Cmob daily rates, at every station and season
(Table 3).
Plotting all the data together, Cmob was correlated with
Leu-BCP (r = 0.64, Po 0.05, n = 12), TPP (r = 0.76, n = 12,
Po 0.005) and DPP (r = 0.88, Po 0.001, n = 12). The
correlation of Cmob with Leu-BCP and with BCD suggests
that the carbon potentially mobilized by enzymatic activity
could be used for the bacterial carbon requirements. On the
other hand, the relationships between Cmob and DPP con-
firm the trophic link between heterotrophic bacteria and
algae mediated through DPP, usually composed of easy-
to-degrade molecules (Amon et al., 2001). Cmob was also
positively correlated with TPP even if TPP needs a variable
lag phase before it is available for bacterial uptake.
Dissolved and POC
The main part of the total organic carbon in the lagoon
waters was in the dissolved form (64–87%) at each station
(Table 1). The highest POC concentrations were measured
at st. 1, where the relative incidence on TOC was lower
(64–76%). POC concentrations were generally the highest in
spring–summer, while DOC did not show a clearly identifi-
able pattern among stations and through seasons.
The magnitude of chromophoric dissolved organic car-
bon (aCDOM355) varied on average from 0.3 to 3.9 nm�1,
with minimum values in winter (mean: 0.6� 0.3 nm�1).
The highest values were generally recorded at st. 1 and the
minima at st. 3. aCDOM355 was inversely correlated
with salinity (r = 0.73, n = 11, Po 0.05) and directly with
chl (r = 0.65, n = 11, Po 0.05,) and DPP (r = 0.74, n = 11,
Po 0.01), indicating that possibly both riverine inputs of
organic matter and phytoplankton exudation could contri-
bute to the formation of CDOM. The amount of nonab-
sorbing DOC concentration was extrapolated from the
positive correlation (r = 0.74, n = 11, Po 0.01, DOC-
25.1� aCDOM3551170) between aCDOM and DOC. The
CDOM, on average, contributed to 19% of the mean DOC
concentration.
The significant (r = 0.86, n = 11, Po 0.001) linear rela-
tionship between aCDOM355 and Cmob and of aCDOM355
and DPP (r = 0.74, n = 11, Po 0.01) suggests an important
role of the bacteria in the transformation and elaboration of
CDOM.
1
2
3
4
5
6
7
8
9
10
11
12
13
14
15
16
17
18
19
20
21
22
23
24
25
26
27
28
29
30
31
32
33
34
35
36
37
38
39
40
41
42
43
44
45
46
47
48
49
50
51
52
53
0.0
0.5
1.0
1.5
2.0
2.5
3.0(a) (b)
Log total primary production(µg C L–1 h–1)
Log
bact
eria
l car
bon
prod
uctio
n (µ
g C
L–1
h–1
)
0.0
0.5
1.0
1.5
2.0
2.5
3.0
Log dissolved primary production(µg C L–1 h–1)
Log
bact
eria
l car
bon
prod
uctio
n (µ
g C
L–1
h–1
)0.0
0.5
1.0
1.5
2.0
2.5
3.0(c)
Log total primary production(µg C L–1 h–1)
Log
bact
eria
l car
bon
dem
and
(µg
C L
–1 h
–1)
St. 1 St. 2 St. 3 St. 1 St. 2 St. 3
0.0
0.5
1.0
1.5
2.0
2.5
3.0(d)
0.0 0.5 1.0 1.5 2.0 2.5 3.0 0.0 0.5 1.0 1.5 2.0 2.5 3.0
0.0 0.5 1.0 1.5 2.0 2.5 3.0 0.0 0.5 1.0 1.5 2.0 2.5 3.0Log dissolved primary production
(µg C L–1 h–1)
Log
bact
eria
l car
bon
dem
and
(µg
C L
–1 h
–1)
St. 1 St. 2 St. 3St. 1 St. 2 St. 3
Fig. 3. Log–log plots between: (a) bacterial carbon production and total primary production, (b) bacterial carbon production and dissolved primary
production, (c) bacterial carbon demand and total primary production, (d) bacterial carbon demand and dissolved primary production.
FEMS Microbiol Ecol ]] (2010) 1–12c� 2010 Federation of European Microbiological SocietiesPublished by Blackwell Publishing Ltd. All rights reserved
8 A. Pugnetti et al.
FEMSEC 839
(BW
UK
FE
MSE
C 8
39 W
ebpd
f:=
02/0
2/20
10 0
9:53
:21
4512
72 B
ytes
12
PAG
ES
n op
erat
or=
M.C
hack
alay
il) 2
/2/2
010
9:53
:29
PM

8
7
Considering the potential turnover rate of DOC mobiliz-
able by enzyme activities (DOC/Cmob, Table 2), they ranged
from 0.4 to 3.7 days, in autumn and winter, respectively,
with minima at st. 2 and maxima at st. 3.
Discussion
This investigation was carried out at three stations in the
Lagoon of Venice, characterized by a large heterogeneity in
salinity and nutrient concentration. The different trophic
state was revealed by substantial differences with regard to
algal biomass and production. The photosynthetic activity
of the phytoplankton, in particular, was characterized by a
very wide seasonal range (up to four orders of magnitude at
st. 1 and to one at st. 2 and 3), comparable in any case with
the few pp data available in the literature for the lagoon,
gathered during the 1980s and the 1990s (Degobbis et al.,
1986; Bianchi et al., 2000). The seasonal phytoplankton
production and biomass appear to be mainly related to that
of temperature and solar irradiance. Specific production
(Pb) was comparable with that of other transitional ecosys-
tems, characterized by an elevated nutrient availability
(Macedo et al., 2001; Montes-Hugo & Alvarez-Borrego,
2003; Azevedo et al., 2006). The bacterial community, on
the contrary, showed a quite constant metabolism (BCP
from 1.5- to 4-fold throughout the seasons) when compared
with the widely ranging pp and, apparently, bacterial
biomass and production do not respond with the same
intensity to the trophic variations.
The ratio between PP and BCP indicates whether second-
ary pelagic production is based on bacterial mobilization of
chemically bound energy or on phytoplankton photosynth-
esis, with consequences on the structure of the trophic web
(Berglund et al., 2007). In our study, the base of the
planktonic trophic appears to be largely independent from
the different trophic state, while a rather common seasonal
pattern could be recognized. A definite shift of the plankton
food web toward autotrophy (TPP/BCP � 1) occurs in
correspondence to a production efficiency (Pb) higher than
9 mg Cmg chl L�1 h�1.
BCP and TPP were significantly, although weakly, corre-
lated. The correlation between BCP and PP is often accepted
as a sufficient evidence of phytoplankton–bacterioplankton
coupling. However, the contemporaneous dependence of
bacteria on algae can only be mediated through DPP, while
TPP needs a time lag before becoming available to bacteria.
The strength of coupling between bacteria and phytoplank-
ton is therefore considered here, as proposed by Moran et al.
(2002), as the extent to which DPP meets BCD. The organic
carbon released during photosynthesis by phytoplankton is
considered one of the most important sources of labile
organic molecules for bacteria growth (e.g. Cole et al.,
1988; Baines & Pace, 1991; Norrman et al., 1995). If BCD
exceeds DPP, then bacteria must have other sources of
organic carbon for their growth. Phytoplankton exudation
produces mainly low-molecular-weight material that is
readily assimilable by bacteria and may be turned over in
o 1 day (Leboulanger et al., 1997; Amon et al., 2001). The
nonreadily assimilable OM, mostly composed by high-
molecular-weight (HMW) molecules, must be hydrolyzed
by bacteria ectoenzymes before the assimilation, giving rise
to a decoupling between bacterial and phytoplankton pro-
duction. The DPP at the three stations examined represents,
generally, a very small fraction of TPP (prevalently o 7%,
with just two peaks exceeding this value), mostly within the
lowest range reported in the literature (Baines & Pace, 1991).
The PER does not show a decreasing trend at increasing PPP,
as it is, in contrast to what is reported in other ecosystems
(Moran et al., 2002; Teira et al., 2003): indeed, it spanned
from 0% to 30%, independent of the wide range of PPP
(from 0.1 to 90 mg C L�1 h�1) and of trophic conditions.
BCD, on both an hourly and a daily basis, was, at every
station and season, always extremely greater than the actual
supply of DPP from algae, leading to the conclusion that
bacteria and phytoplankton were uncoupled. In this investi-
gation, the possibility to underestimate DPP with short-
term, end-point incubation, due to bacterial recycling of
recently produced DOC (Moran & Estrada, 2002), has been
taken into account by calculating the potential DPP, which
also includes the organic 14C in the 0.2–2 mm fraction. This
fraction will include both the 14C recycled by bacteria and
the autotrophic picoplankton production that, in this
environment, might be consistent, the APP Q7biomass repre-
senting, on average, 4 5% of the total phytoplankton
biomass in the lagoon with peaks up to 20% (Coppola
et al., 2006, 2007). Anyway, BCD was always too high
to be supported by DPP, even when considering this DPP
potential rate (DPP1PPpico).
Both the occurrence of conditions in which BCP is larger
than TPP and the continuous prevalence of BCD over DPP
imply that further sources of organic C, more than phyto-
plankton production alone, are necessary to sustain the
bacterial metabolism.
The carbon that is made available by the ectoenzymatic
mobilization always satisfies the BCD and the correlation of
Cmob with Leu-BCP suggests that bacterial metabolism was
mainly used for enzyme synthesis. On the other hand, the
relationship between Cmob and DPP and TPP confirms the
trophic link of heterotrophic bacteria on algae even if the
phytoplankton alone are unable to support BCD.
The major autochthonous, nonphytoplanktonic sources
of DOM in wetlands are leachates from plants, exudates
from benthic microalgae, or macrophytes, and pore water
from sediments and soils (Ziegler & Benner, 1999; Bertilsson
& Jones, 2003; Maie et al., 2006). Macrophytes generate
DOM either through extracellular release of photosynthate
1
2
3
4
5
6
7
8
9
10
11
12
13
14
15
16
17
18
19
20
21
22
23
24
25
26
27
28
29
30
31
32
33
34
35
36
37
38
39
40
41
42
43
44
45
46
47
48
49
50
51
52
53
FEMS Microbiol Ecol ]] (2010) 1–12 c� 2010 Federation of European Microbiological SocietiesPublished by Blackwell Publishing Ltd. All rights reserved
9Phytoplankton and bacterioplankton in the Lagoon of Venice
FEMSEC 839
(BW
UK
FE
MSE
C 8
39 W
ebpd
f:=
02/0
2/20
10 0
9:53
:21
4512
72 B
ytes
12
PAG
ES
n op
erat
or=
M.C
hack
alay
il) 2
/2/2
010
9:53
:29
PM

8
7
or upon senescence (Bertilsson & Jones, 2003; Maie et al.,
2006; Wang et al., 2007 and references therein). In the three
shallow areas considered in this study, organic matter from
the sediments may also make an important contribution to
the organic matter in the waters (Sfriso et al., 2005), as a
consequence of both natural (e.g. wind, storm, tidal flush-
ing) and anthropogenic (clam harvesting, maritime traffic,
capital and maintenance dredging) sediment resuspension.
The resuspension was confirmed by the significant relation-
ship found from DOC concentrations in water and those at
the water–sediment interface (M. Giani, unpublished data).
The contribution of the CDOM, on average 19% of
the mean DOC concentration, probably derives from the
bacterial transformation of phytoplankton-derived DOM
and from riverine discharges into the lagoon. The highest
aCDOM values are usually observed in freshwaters and
estuaries and they decrease in coastal and offshore waters
(Blough et al., 1993). Bacterial processing of nonchromo-
phoric, algal organic matter, either particulate or dissolved,
could be responsible for the CDOM production. The
positive relationships found among aCDOM, DPP and
Cmob suggest that the bacteria could play an important role
in the formation of CDOM in the lagoon waters through the
reprocessing of phytoplankton exudates, supporting the
Rochelle-Newall & Fisher (2002) findings towards
the hypothesis that the noncolored DOM released by
phytoplankton could be transformed by bacteria in CDOM.
The relation between bacteria respiration and photo-
synthesis is expected to be different in relation to the
strength of the coupling between the two communities: the
availability of the HMW organic matter pool will allow
the bacteria to extend their activity and respiration beyond
the decline of photosynthesis. In this study, the relations
between CR, TPP and BCP are quite contradictory in this
respect. CR fell within the values generally reported for
estuarine and coastal waters (e.g. Jensen et al., 1990; Smith &
Kemp, 1995; Iriarte et al., 1996). A close coupling between
CR and TPP, but not between CR and BCP, was observed,
suggesting that phytoplankton may be responsible for a
significant fraction of CR. On the other hand, the rates of
oxygen consumption were much less variable than those of
PP: this may indicate that CR and PP do not respond with
the same intensity to the environmental variations and that
the CR is fuelled by sources other than phytoplankton
production and are also supplied more constantly through
time. In particular, in the periods in which CR exceeded PP,
stored or imported organic matter should prevalently sup-
port the planktonic system. However, in the present study,
the periods in which the system was heterotrophic
(CR4PP) were not related either to a concomitant increase
of BCP or of DOC concentrations or to BCP � PP.
In conclusion, this study evidenced that the large within-
system trophic heterogeneity corresponded to elevated phy-
toplankton biomass and production variability, while bac-
teria standing stock and production appeared to be much
more constant. The relationships between bacteria and
phytoplankton community could not be associated with
the trophic state in a straightforward way. Rather, a common
seasonal variability could be evidenced, occurring quite
independent of the trophic state, confirming the hypothesis
of a general loose bacterioplankton–phytoplankton cou-
pling in coastal and transitional areas. The two communities
appeared, indeed, uncoupled, with BCD largely exceeding
DPP: this characteristic, which is common to other coastal
systems, in this investigation appeared to be constant and
independent of the station and the season considered. The
variations of the microbial metabolism and the shift from
autotrophy to heterotrophy seem to be mainly related to
variations in phytoplankton activity, rather than Q8on bacteria
one. However, the interplay of trophic conditions, organic
carbon availability and seasonality makes it arduous to find
a within-system clear pattern of variability related to the
spatial and trophic differences.
Acknowledgements
This research was partially supported by the CORILA
(Consortium for Coordination of Research Activities Con-
cerning the Venice Lagoon System) II Research Programme
(2004–2006). We deeply acknowledge Prof. Farooq Azam
for his valuable discussion and suggestions. We thank Loris
Dametto, Mauro Penzo and Franco Antonini for their
assistance in the field, and Elisa Ravagnan, Erica Crevatin,
Chiara Larato and Fabio Savelli for their help in the
laboratory activities.
References
Acri F, Bernardi Aubry F, Berton A, Bianchi F, Boldrin A, Camatti
E, Comaschi A, Rabitti S & Socal G (2004) Plankton
communities and nutrients in the Venice Lagoon. Comparison
between current and old data. J Marine Syst 51: 321–329.
Amon RMW, Fitznar H-P & Benner R (2001) Linkages among
the bioreactivity, chemical composition and diagenetic state of
marine dissolved organic matter. Limnol Oceanogr 46:
287–297.
Azevedo IC, Duarte PM & Bordalo AA (2006) Pelagic metabolism
of the Douro estuary (Portugal) – factors controlling primary
production. Estuar Coast Shelf S 69: 133–146.
Baines SP & Pace ML (1991) The production of dissolved organic
matter by phytoplankton and its importance to bacteria:
patterns across marine and freshwater systems. Limnol
Oceanogr 36: 1078–1090.
Bandelj V, Socal G, Park Y-S, Coppola J, Camatti E, Capuzzo E,
Milan L & Solidoro C (2008) Analysis of multitrophic
plankton assemblages in the Lagoon of Venice. Mar Ecol-Prog
Ser 368: 23–40.
1
2
3
4
5
6
7
8
9
10
11
12
13
14
15
16
17
18
19
20
21
22
23
24
25
26
27
28
29
30
31
32
33
34
35
36
37
38
39
40
41
42
43
44
45
46
47
48
49
50
51
52
53
FEMS Microbiol Ecol ]] (2010) 1–12c� 2010 Federation of European Microbiological SocietiesPublished by Blackwell Publishing Ltd. All rights reserved
10 A. Pugnetti et al.
FEMSEC 839
(BW
UK
FE
MSE
C 8
39 W
ebpd
f:=
02/0
2/20
10 0
9:53
:21
4512
72 B
ytes
12
PAG
ES
n op
erat
or=
M.C
hack
alay
il) 2
/2/2
010
9:53
:29
PM

8
7
8
7
8
7
8
7
Berglund J, Muren U, Bamstedt U & Andersson A (2007)
Efficiency of a phytoplankton-based and a bacteria-based food
web in a pelagic marine system. Limnol Oceanogr 52: 121–131.
Bernardi Aubry F & Acri F (2004) Phytoplankton distribution at
the three mouths of the Lagoon of Venice (June 2001–July
2002). J Marine Syst 51: 65–76.
Bertilsson S & Jones JB (2003) Supply of dissolved organic matter
to aquatic ecosystems: autochthonous sources. Aquatic
Ecosystems. Interactivity of Dissolved Organic Matter (Findlay
SEG & Sinsabaugh RL, eds), pp. 3–24. Elsevier Science,
Amsterdam.
Bianchi F, Acri F, Alberighi L et al. (2000) Biological variability in
the Venice lagoonQ9 . The Venice Lagoon Ecosystem. Inputs and
Interactions Between Land and Sea. Man and the Biosphere
Series, Vol. 25 (Lasserre P & Marzollo A, eds), pp. 97–125.
UNESCO and Parthenon Publishing Group.
Bianchi F, Acri F, Bernardi Aubry F, Berton A, Boldrin A, Camatti
E, Cassin D & Comaschi A (2003) Can plankton communities
be considered as bio-indicators of water quality in the Lagoon
of Venice? Mar Pollut Bull 46: 964–971.
Blough NV, Zafirou OC & Bonilla J (1993) Optical absorption
spectra of waters from the Orinoco river outflow: terrestrial
input of colored organic matter to the Caribbean. J Geophys
Res 98: 2271–2278.
Cauwet G (1994) HTCO method for dissolved organic carbon
analysis in sea water: influence of catalyst on blank estimation.
Mar Chem 47: 55–64.
Ciavatta S, Pastres R, Badetti C, Ferrari G & Beck MB (2008)
Estimation of phytoplankton production and system
respiration form data collected by a real-time monitoring
network in the Lagoon of Venice. Ecol Model 212: 28–36.
Cole J, Findlay S & Pace ML (1988) Bacterial production in fresh
and saltwater ecosystems: a cross-system overview. Mar Ecol-
Prog Ser 43: 1–10.
Collavini F, Bettiol C, Zaggia L & Zonta R (2005) Pollutants load
from the drainage basin to the Venice Lagoon (Italy). Environ
Int 31: 939–947.
Coppola J, Bernardi Aubry F, Acri A, Del Negro P & Pugnetti A
(2006) Picophytoplankton contribution to phytoplankton
community in the Venice LagoonQ10 . Scientific Research and
safeguarding of Venice, 2006. CORILA Research Programme
2004–2006. Vol. V, pp. 245–254.
Coppola J, Bernardi Aubry F, Acri F, Bianchi F & Pugnetti A
(2007) Dimensional structure of phytoplancton community in
the Venice LagoonQ11 . Scientific Research and safeguarding of
Venice, 2007. CORILA Research Programm 2004–2006. Vol. VI,
pp. 312–322.
Degobbis D, Gilmartin M & Orio AA (1986) The relation of
nutrient regeneration in the sediments of the Northern
Adriatic to eutrophication, with special reference to the
Lagoon of Venice. Sci Total Environ 56: 201–210.
del Giorgio PA & Cole JJ (1998) Bacterial growth efficiency in
natural aquatic systems. Annu Rev Ecol Syst 29: 503–541.
Gaedke U & Kamjunke N (2006) Structural and functional
properties of low- and high-diversity planktonic food webs. J
Plankton Res 28: 707–718.
Giordani G, Viaroli P, Swaney DP, Murray CN, Zaldivar JM &
Marshall Crossland JI (2005) Nutrient fluxes in the
transitional zones of the Italian coasts. LOICZ Reports and
studies No. 28, LOCZ, Texel, the Netherlands, 157pp.
Gonzalez-Benitez N & Gattuso J-P (2003) Are phytoplankton and
bacteria coupled within an aquatic oligotrophic system? Q12.
Geoph Res Abstr 5: 06854.
Grasshoff K, Cremling K & Erhardt M (1999) Methods of
Seawater Analysis. Verlag Chemie, Weinheim, Germany,
600pp.
Holm-Hansen O, Lorenzen CJ, Holmes RW & Strickland JDH
(1965) Fluorometric determination of chlorophyll. J Cons
Perm Int Explor Mer 30: 3–15.
Hopkinson CSJ & Smith EM (2005) Estuarine respiration: an
overview of benthic, pelagic and whole system respiration.
Respiration in Aquatic Ecosystems (del Giorgio PA & Williams
LPJ, eds), pp. 123–147. Oxford University Press, Oxford, UK.
Hoppe HG (1993) Use of fluorogenic model substrates for
extracellular enzyme activity (EEA) measurement of bacteria.
Current Methods in Aquatic Microbial Ecology (Kemp PF, Sherr
BF, Sherr EB & Cole JJ, eds), pp. 423–431. CRC Press, Boca
Raton.
Iriarte A, de Madariaga I, Diez-Garagarza F, Revilla M & Orive E
(1996) Primary production, respiration and nitrification in a
shallow temperate estuary during summer. J Exp Mar Biol Ecol
208: 127–151.
Jensen LM, San-Jensen K, Marcher S & Hansen M (1990)
Plankton community respiration along a nutrient gradient in a
shallow Danish estuary. Mar Ecol-Prog Ser 61: 75–85.
Kirchman D, K’nees E & Hodson R (1985) Leucine incorporation
and its potential as a measure of protein synthesis by bacteria
in natural waters. Appl Environ Microb 49: 599–607.
Leboulanger C, Oriol L, Jupin H & Descolas-Gros C (1997) Diel
variability of glycolate in the eastern tropical Atlantic Ocean.
Deep-Sea Res 44: 2131–2139.
Lee S & Fuhrman JA (1987) Relationship between biovolume and
biomass of naturally delivered marine bacterioplankton. Appl
Environ Microb 53: 1298–1303.
Macedo MF, Duarte O, Mendes P & Ferreira JG (2001) Annual
variation of environmental variables, phytoplankton species
composition and photosynthetic parameters in a coastal
lagoon. J Plankton Res 23: 719–732.
Maie N, Jaffe R, Miyoshi T & Childers DL (2006) Quantitative
and qualitative aspects of dissolved organic carbon leached
from senescent plants in an oligotrophic wetland.
Biogeochemistry 78: 285–314.
Montes-Hugo MA & Alvarez-Borrego S (2003) Spatial and
temporal variation of photosynthetic parameters of
phytoplankton in a subtropical coastal lagoon. Estuar Coast
Shelf S 56: 517–525.
Moran XAG & Estrada M (2002) Phytoplankton DOC and POC
production in the Bransfield and Gerlache Straits as derived
1
2
3
4
5
6
7
8
9
10
11
12
13
14
15
16
17
18
19
20
21
22
23
24
25
26
27
28
29
30
31
32
33
34
35
36
37
38
39
40
41
42
43
44
45
46
47
48
49
50
51
52
53
FEMS Microbiol Ecol ]] (2010) 1–12 c� 2010 Federation of European Microbiological SocietiesPublished by Blackwell Publishing Ltd. All rights reserved
11Phytoplankton and bacterioplankton in the Lagoon of Venice
FEMSEC 839
(BW
UK
FE
MSE
C 8
39 W
ebpd
f:=
02/0
2/20
10 0
9:53
:21
4512
72 B
ytes
12
PAG
ES
n op
erat
or=
M.C
hack
alay
il) 2
/2/2
010
9:53
:29
PM

form kinetic experiments of 14C incorporation. Deep-Sea Res
Pt II 49: 769–786.
Moran XAG, Estrada M, Gasol JM & Pedros-Alio C (2002)
Dissolved primary production and the strength of
phytoplankton–bacterioplankton coupling in contrasting
marine regions. Microb Ecol 44: 217–223.
Nieuwenhuize J, Maas EM & Middelburg JJ (1994) Rapid analysis
of organic carbon and nitrogen in particulate materials. Mar
Chem 45: 217–224.
Norrman B, Zweifel UL, Opkinson CS Jr & Fry B (1995)
Production and utilization of dissolved organic carbon during
an experimental diatom bloom. Limnol Oceanogr 40: 898–907.
Porter KG & Feig YS (1980) The use of DAPI for identifying and
counting aquatic microflora. Limnol Oceanogr 25: 943–948.
Ravera O (2000) The Lagoon of Venice: the result of both natural
factors and human influente. J Limnol 59: 19–30.
Revilla M, Aristeguı A, Iriarte A, Madariaga I, Orive E, Sarobe A
& Trigueros JM (2002) Microplankton metabolism along a
trophic gradient in a shallow-temperate estuary. Estuaries 25:
6–18.
Rochelle-Newall EJ & Fisher TR (2002) Production of
chromophoric dissolved organic matter fluorescence in
marine and estuarine environments: an investigation into the
role of phytoplankton. Mar Chem 77: 7–21.
Rochelle-Newall EJ, Torreton J-P, Mari X & Pringault O (2008)
Phytoplankton–bacterioplankton coupling in a subtropical
South Pacific coral reef lagoon. Aquat Microb Ecol 50: 221–229.
Sala MM, Karner M, Arin L & Marrase C (2001) Measurement of
ectoenzyme activities as an indication of inorganic nutrient
imbalance in microbial communities. Aquat Microb Ecol 23:
301–311.
Sfriso A, Facca C, Ceoldo S & Marcomini A (2005) Recording the
occurrence of trophic level changes in the lagoon of Venice
over the ‘90s. Environ Int 31: 993–1001.
Simon M & Azam F (1989) Protein content and protein synthesis
rates of planktonic marine bacteria. Mar Ecol-Prog Ser 51: 201–213.
Smith DC & Azam F (1992) A simple, economical method for
measuring bacterial protein synthesis rates in sea water using
H3leucine. Mar Microb Food Webs 6: 107–114.
Smith EM & Kemp WM (1995) Seasonal and regional variations
in plankton community production and respiration for
Chesapeake Bay. Mar Ecol-Prog Ser 116: 217–231.
Solidoro C, Pastres R, Cossarini G & Ciavatta S (2004) Seasonal
and spatial variability of water quality parameters in the
Lagoon of Venice. J Marine Syst 51: 7–18.
Sorokin PYu, Sorokin YuI, Zakuskina OYu & Ravagnan GP
(2002) On the changing ecology of Venice lagoon.
Hydrobiologia 487: 1–18.
Sorokin YuI, Sorokin PYu, Giovanardi O & Dalla Venezia L
(1996) Study of the ecosystem of the lagoon of Venice with
emphasis on anthropogenic impact. Mar Ecol-Prog Ser 141:
247–261.
Teira E, Pazo MJ, Quevedo M, Fuentes MV, Niell FX & Fernandez
E (2003) Rates of dissolved organic carbon production and
bacterial activity in the eastern North Atlantic subtropical
Gyre during summer. Mar Ecol-Prog Ser 249: 53–67.
Thomas C, Cauwet G & Minster JF (1995) Dissolved organic
carbon in the Equatorial Atlantic Ocean. Mar Chem 49:
155–169.
Vodacek A, Blough NV, DeGrandpre MD, Peltzer ET & Nelson
RK (1997) Seasonal variation of CDOM and DOC in the
Middle Atlantic Bight: terrestrial inputs and photooxidation.
Limnol Oceanogr 42: 674–686.
Wang SR, Jin XC, Zhao HZ, Zhou XN & Wu FC (2007) Effect of
organic matter on sorption of dissolved organic and inorganic
phosphorus in lake sediment. Colloid Surface A 297: 154–162.
Ziegler S & Benner R (1999) Dissolved organic carbon cycling in a
subtropical seagrass-dominated lagoon. Mar Ecol-Prog Ser
180: 149–160.
Zuliani A, Zaggia L, Collavini F & Zonta R (2005) Freshwater
discharge from the drainage basin to the Venice Lagoon (Italy).
Environ Int 31: 929–938.
1
2
3
4
5
6
7
8
9
10
11
12
13
14
15
16
17
18
19
20
21
22
23
24
25
26
27
28
29
30
31
32
33
34
35
36
37
38
39
40
41
42
43
44
45
46
47
48
49
50
51
52
53
FEMS Microbiol Ecol ]] (2010) 1–12c� 2010 Federation of European Microbiological SocietiesPublished by Blackwell Publishing Ltd. All rights reserved
12 A. Pugnetti et al.
FEMSEC 839
(BW
UK
FE
MSE
C 8
39 W
ebpd
f:=
02/0
2/20
10 0
9:53
:21
4512
72 B
ytes
12
PAG
ES
n op
erat
or=
M.C
hack
alay
il) 2
/2/2
010
9:53
:29
PM