bacterial community structure of sediments of the bizerte lagoon (tunisia), a southern mediterranean...
TRANSCRIPT

BACTERIAL COMMUNITY STRUCTURE OF SUPERFICIAL SEDIMENTS OF THE 1
BIZERTE LAGOON (TUNISIA), A SOUTHERN MEDITERRANEAN COASTAL 2
ANTHROPIZED LAGOON. 3
4
Olfa BEN SAID1, 2, 3
, Marisol GOÑI URRIZA1, Monia EL BOUR
2, Patricia AISSA3 5
& Robert DURAN1*
6
7
1Equipe Environnement et Microbiologie – UMR IPREM 5254 - IBEAS – Université de Pau et 8
des Pays de l'Adour - France. 9
2 Laboratoire de Bactériologie – Pathologie, Institut National des Sciences et Technologies de 10
la Mer INSTM– Salammbô - Tunisie. 11
3 Laboratoire de Biosurveillance de l’Environnement, Faculté des Sciences de Bizerte - 12
Tunisie. 13
14
Keywords: Hydrocarbon pollution, Heavy-metal pollution, T-RFLP, 16S rRNA gene library, 15
bacterial diversity 16
17
Running title: Bacterial communities in Bizerte lagoon polluted sediments 18
19
∗To whom all correspondence should be addressed: 20
Robert Duran 21
Equipe Environnement et Microbiologie – IPREM UMR 5254 - IBEAS - Université de Pau et 22
des Pays de l'Adour, Avenue de l'Université, BP 1155 F-64013 - Pau cedex France. 23
Tel : (33) 5 59407468 ; Fax : (33) 5 59407494 ; e-mail : [email protected] 24

ABSTRACT 25
In order to estimate how pollution affects the bacterial community structure and composition of 26
sediments, chemical and molecular approaches were combined to investigate 8 stations around 27
the Bizerte lagoon. Terminal-Restriction Fragment Length Polymorphism (T-RFLP) analysis of 28
PCR-amplified 16S rRNA genes revealed that each station was characterized by a specific 29
bacterial community structure. The combination of this data with those of chemical analysis 30
showed a correlation between the bacterial fingerprint and the pollutant content, principally 31
with hydrocarbon pollution. The composition of the bacterial community of two contrasted 32
stations related to the pollution, revealed sequences affiliated to α, β, γ, δ, ε, subclass of the 33
Proteobacteria, Actinobacteria and Acidobacteria in both stations although in different extent. 34
Gamma and delta subclass of the Proteobacteria were dominant representing 75% of clones in 35
the heavy-metal-contaminated station while they were found to represent 55% in the 36
polyaromatic hydrocarbon (PAH)-contaminated station. Although sediments of Bizerte lagoon 37
contain bacterial communities well adapted to the presence of pollutants, especially 38
hydrocarbon compounds, most of the sequences were unaffiliated to cultured bacteria. Their 39
characterization will provide the basis for understanding the capacity of bacteria to cope with 40
pollutants.41
42
INTRODUCTION 43
Organic and inorganic pollution of coastal zones is a major ubiquitous environmental problem. 44
Once in the marine environment, contaminants accumulate in sediments (Ford & Ryan, 1995). 45
The fates of these contaminants are mainly drive by bacteria, since they are the most abundant 46
organisms in sediments (Ford & Ryan, 1995). Sediment microbial communities are exposed to 47
multiple stresses, as a result their structure and composition is most likely affected by many 48
different abiotic and biotic parameters (Yan et al., 2003). Recent studies have demonstrated 49
that natural attenuation and bioremediation of organic contaminants and heavy metals cannot 50
be effectively applied at many sites until we have a better understanding of the physiology, 51
ecology, and phylogeny of microbial communities at contaminated sites (Vrionis et al., 2005). 52
In the light of these data, we need to increase our understanding of how microbial communities 53
are affected by and interact with these compounds in contaminated sites. Recently, studies of 54
bacterial diversity in marine sediments by molecular approaches have given a fundamental 55
view of the capacities of these communities to cope with pollutants (Bordenave et al., 2004; 56
Inagaki et al., 2003; Jiang et al., 2006; Bordenave et al., 2007), but relatively little is known 57
about bacterial communities in contaminated sediments (Abulencia et al., 2006; Córdova-58
Kreylos et al., 2006; Edlund & Jansson, 2006; Hernández-Raquet et al., 2006). Moreover, 59
the combined effect of different pollutants such as polyaromatic hydrocarbons (PAH) and 60
heavy metals on microbial activities and community composition is still unclear since few 61
studies have addressed this point (Cao et al., 2006). 62
Costal urbanized and industrialized zones have often been shown to be characterized by the 63
concomitant presence of organic and inorganic pollutants (Córdova-Kreylos et al., 2006). 64
They provide a good study site for the investigation of microbial communities inhabiting mixed 65
contaminated sediments. The Bizerte lagoon (Tunisia) is an example of such ecosystem; it is 66

located in an urbanized and industrialized area subjected to the input of various pollutants. The 67
discharges of untreated domestic effluents and wastewater input from industrial companies 68
generate heavily polluted sediments characterized by the concomitant presence of PAHs, heavy 69
metals and drugs such as antibiotics. We previously characterized the aerobic PAH-degrading 70
bacteria isolated from sediments of different stations located around the Bizerte lagoon (Ben 71
Said et al., 2007). The present work combines chemical and microbial molecular approaches in 72
order to investigate the influence of PAHs and heavy metals concentrations on microbial 73
community structure and composition. First, bacterial T-RFLP fingerprints were correlated 74
with pollutant concentrations and, second, the bacterial composition of both the most PAH-75
polluted and the most heavy metal-polluted stations were determined by 16S rRNA gene 76
libraries analyses. 77
78
79
80
81

MATERIALS AND METHODS 82
Site description 83
Bizerte lagoon (Southern Mediterranean), a canalized lagoon system located in the Northern of 84
Tunisia (Fig. 1), has been exploited in fishing activities since several centuries and in mussel 85
farming since 1964. This area extending to approximately 150 km2 represent a receptor of 86
several industrial sewages, aquaculture wastes, fertilizers and pesticides through run-off and 87
soil erosion, wastewaters from towns implanted around. At least, five different contamination 88
sources can be identified in the Bizerte lagoon: Menzel Bourguiba-Tinja and Menzel 89
Bourguiba landfill, Bizerte, Menzel Abderahmen, Menzel Jmil industrial zone, and 90
Southeastern agricultural zone (Yoshida et al., 2002). Furthermore, this lagoon connected to 91
Mediterranean Sea by way of a straight channel is submitted to intensive maritime traffic and 92
indirectly to several pollutants coming from oil and steel factories. 93
94
Sediment collection and field measurements 95
Surface sediments (0-3cm depth) were collected with a Van Veen Grab at 15 stations located 96
around the Bizerte lagoon and the bay (Fig. 1) as previously described (Ben Said et al., 2007). 97
Water column temperature, pH and salinity were determined in the field with a handheld multi-98
parameter system. The water temperature and level of dissolved oxygen were determined with 99
a multiparameter probe (YSI GRANT 3800). Chemical analyses, namely, ammonium (NH4), 100
nitrates (NO3), nitrites (NO2), orthophosphate (PO4), and total phosphorus (Pt), were performed 101
using standard methods (Murphy & Riley, 1962). Chlorophyll a concentrations were obtained 102
by spectrophotometry (Richards & Thompson, 1952). 103
104
105
106

Chemical analyses 107
Metal analyses (cadmium, cobalt, copper, iron, lead, manganese, nickel, zinc, chromium) were 108
performed by atomic emission spectrometry with inductively coupled plasma according to NF 109
EN ISO 11885 (March-1998) standard. 110
Polycyclic Aromatic Hydrocarbon composition of sediments was conducted by an automated 111
extraction with ASE 200 (Accelerated Solvent Extractor- Dionex), extract purification and gaz 112
chromatography-mass spectrometry (GC/MS) analysis. More details are available in 113
Bordenave et al. (2004). 114
115
T-RFLP Analysis 116
Mixed community DNA was extracted directly from sediments samples using an UltraClean 117
soil DNA isolation Kit (MoBio Laboratoires, California) by following the manufacturer’s 118
protocol with minor modifications as previously described (Precigou et al., 2001). Genes 119
encoding 16S rRNA were PCR amplified from extracted samples using fluorescently labelled 120
bacterial primers 8F HEX (5-Hexa-chloro-fluorescein; 5’-AGAGTTTGATCCTGGCTCAG-3’) 121
and 1489R TET (5-Tetrachloro-fluorescein; 5’-TACCTTGTTACGACTTCA-3’) as previously 122
described (Bordenave et al., 2007). The PCR amplification mixture contained 12.5 µl Hot 123
Start Taq polymerase master mix (Qiagen), 0.5 µl of each primer (20 µM) and 10 ng of DNA 124
template. A final volume of 50 µl was adjusted with distilled water. 16S rRNA gene 125
amplification reactions were cycled in a PTC200 thermocycler (MJ Research) with a hot start 126
step at 94°C for 15 min, followed by 35 cycles of 94°C for 1 min, 52°C for 1.5 min, and 72°C 127
for 1 min, with a final extension step at 72°C for 10 min. 128
PCR products were purified with the GFX PCR DNA purification kit (Amersham-Pharmacia). 129
Purified PCR products (600 to 700 ng) were digested with 3 units of enzyme HaeIII (New 130
England Biolabs). The length of terminal fluorescently labelled fragments (TRFs) from the 131

digested PCR products was determined by capillary electrophoresis on ABI prism 310, 132
(Applied Biosystems) as previously described (Fourçans et al., 2006). Briefly, about 50 ng of 133
the digested DNA from each sample was mixed with 18.5 µl of deionized formamide and 0.5 134
µl of TAMRA size standard (Applied Biosystems) and then denatured at 94°C for 2 min and 135
immediately chilled on ice prior to electrophoresis. After an injection step of 10 s, 136
electrophoresis was carried out for up to 30 min applying a voltage of 15 KV. 137
The T-RFLP profiles (T-RFs) were analyzed using Gene Scan Software version 3.1 (Applied 138
Biosystem). Dominant T-RFs were selected by comparison of numerical values and 139
electropherograms. For analysis, only T-RF representing more than 1% of the total 140
fluorescence were considered (Hewson Fuhrman 2004). 141
T-RFLP profiles were compared by Canonical Correspondence Analysis (CCA) according to 142
Fromin et al. (2002). This test is based on the linear correlation between community data 143
(abundance of each T-RF) and environmental parameters in the sediments. The CCA were 144
performed with MVSP v3. 13d software. 145
146
16S rRNA gene libraries analyses, 16S rRNA gene sequencing and sequences analysis 147
Bacterial composition of the stations 1’ and 2 was further analyzed by cloning PCR amplified 148
16S rRNA genes in E. coli. PCR amplifications from these samples were carried out with 149
unlabelled 8F and 1489R primers as described before (Bordenave et al., 2007). PCR products 150
were purified with the GFX PCR DNA purification kit (Amersham-Pharmacia) then cloned in 151
E. coli TOP10 using the Topo-TA cloning kit (Invitrogen). Almost 100 clones from each 152
library were selected randomly and insert were amplified using the primers M13F (5’-153
CTGGCCGTCGTTTTAC-3’) and M13R (5’-GGTCATAAGCTGTTTCCTG-3’). 154
Partial sequences of the 16S rRNA gene were determined by the dideoxy nucleotide chain-155
termination method using the BigDye cycle sequencing kit (Applied Biosystems) on an ABI 156

PRISM 310 205 Genetic analyzer (Applied Biosystems) at the Génotypage - Séquençage de 157
Bordeaux (France) using the primers M13F and M13R. 158
DNA sequences were compared to those present in the databank via the NCBI server 159
(http://www.ncbi.nlm.nih.gov) using the Basic Local Alignment Search Tool (BLAST) 160
(Altschul et al., 1997). Sequence data were checked using the CHECK CHIMERA program 161
(http://rdp8.cme.msu.edu/html/) to determine the presence of hybrid sequences (Maidak et al., 162
2001). Nucleotide sequences were initially aligned with the Ribosomal Database Project (RDP) 163
database (Maidak et al., 2001) by means of the automatic alignment function of the RDP 164
phylogeny inference package (PHYLIP) interface, after sequences were manually aligned using 165
ClustalW (Thompson et al., 1997). The phylogenetic tree was constructed with the MEGA 166
software version 3.0 (Kumar et al., 2004) using Neighbour-Joining method (Saitou & Nei, 167
1987); the distance was calculated on the basis of Kimura’s 2-parameter algorithm (Kimura, 168
1980); 100 bootstrap resamplings were performed to estimate the reproductibility of the tree. 169
PAST (PAleontological Statistics v1.60) software from http://folk.uio.no/ohammer/past/ 170
website was used to perform rarefaction analysis and calculate diversity indices for each clone 171
library with clone phenotype similarity defined at 97% (Hammer et al., 2001). In order to 172
determine the significance of differences between the clone libraries, LIBSHUFF method was 173
applied (Singleton et al., 2001). 174
Nucleotide sequence accession numbers 175
The sequences determined in this study have been submitted to the GenBank database and 176
assigned Accession Nos. AM889144 to AM889146, AM889150, AM889157 to AM889198, 177
AM889201 to AM889204, FM211753 to FM211808 and FM211815 to FM211816. 178
179
180
181

RESULTS 182
Physico-chemical parameters, Metals and PAH concentrations in Bizerte lagoon’s 183
sediments 184
The physical and chemical parameters observed in the sampling stations are summarized in 185
Table 1. The channel stations (1, 1’ and 2) and, in less extent station 6, are submitted to the 186
marine influence with lower temperature and higher salinities. Channel station showed lower 187
O2 concentrations. 188
Total metal contents varied from 1864.44 (station 1') to 180274.93 µg.g-1 of dry wt sediment 189
(station 10) (Table 1). Station 2, located in the channel showed the second high score for metals 190
contents (41020.76 µg.g-1 of dry wt sediment). Iron is by far the most abundant metal in the 191
superficial sediments of all stations surveyed. Station 2 showed maximum concentrations of 192
cobalt, copper, nickel and chrome (respectively, 13.68, 34.9, 47.7, 162.6 µg.g-1 of dry wt 193
sediment) and station 10 of lead, manganese and zinc (respectively, 97.4, 993.2, 512.5 µg.g-1 of 194
dry wt sediment,) 195
Total PAH concentrations in the coastal sediments ranged from 23.9 (station 8, Southeast zone) 196
to 876.6 (station 1’, channel) ng.g-1 dry wt sediment (Fig. 2A and Table 1). Two different PAH 197
concentration profiles were distinguished: stations 1’, 2 and 6 were more contaminated by high 198
molecular weight PAHs (mainly fluoranthene, pyrene and benzo(a)pyrene for stations 1' and 2 199
and indeno(1,2,3-cd)pyrene for station 6) whereas in station 10, 8, 9 and 1 the main 200
hydrocarbon was naphthalene (data not shown). The unexpected high [Low PAH]/[High PAH] 201
ratio found in station 8 is due to a hardly absence of PAHs of high molecular weight. 202
203
Bacterial community structures 204
The T-RFLP profiles contained 25 ± 7.5 T-RFs defined as operational taxonomic units (OTUs). 205
The lowest OTU number (14) was observed in station 1 which is located in the connexion of 206

the channel with the Mediterranean Sea subjected to both marine and lagunar influences. In 207
contrast the highest OTU number (37) was recorded in station 12 which contained low level of 208
PAHs. Except for station 1, the general trend is that the diversity of the bacterial community 209
decreased when the concentration of PAHs in the superficial sediments increased (Fig. 2A). 210
The T-RFs of 73, 192, 204, 206 bp were detected in all the stations (Fig. 2B). Whereas most of 211
these T-RFs showed a low relative abundance, the T-RF 204 bp is the more abundant T-RF in 212
all the stations except for station 1'. It represents up to 60% of total fluorescence in station 9. In 213
contrast, some T-RFs were station-specific such as T-RFs of 36-37 bp (station 1’), 49 bp 214
(station 2), 56 bp (station 1), 114-120-127-186-209 bp (station 8), 110-111-215-259-388-399 215
bp (station 12), 227-290-291 bp (station 10). Except for T-RF 36 bp in station 1' which is 216
dominant, all these T-RFs are low abundant. Some OTUs (such as T-RF 204, 256 and others) 217
could be related to sequences of previously isolated strains and affiliated to the Pseudomonas 218
or Acinetobacter genera (Ben Said et al, 2007). 219
The T-RFLP fingerprints correlated by Canonical Correspondence Analysis (CCA) with the 220
PAH contents (Fig. 3) showed that the sediment bacterial community of station 1’ was clearly 221
influenced by all the PAHs analysed (Fig. 3A, insert). To observe the influence of the PAH 222
content on the bacterial community structure of the other stations, data concerning the station 223
1’ was excluded. In this condition, the first two axes of the CCA described 48.2% of the 224
variation (Fig. 3; axis 1, 25.5% and axis 2, 22.7%). The bacterial community structures of 225
stations 6 and 9 were mostly influenced by fluorene, dibenzoanthracene and benzoperylene 226
while those of stations 1, 2 and 10 by fluoranthene and pyrene (Fig. 3A). In contrast, bacterial 227
community structures of stations 8 and 12 were not influenced by PAH contents (Fig. 3A). As 228
presented in figure 3B some OTUs were correlated with the presence of some PAHs, such as 229
the OTU of 56 bp which is found only in station 1 mostly influenced by fluoranthene and 230

pyrene. Also, the OTU of 256 bp, detected in stations 6 and 9, was mostly influenced by 231
fluorene, dibenzoanthracene and benzoperylene. 232
The impact of metals in the bacterial community structure could be observed in station 12 that 233
was mainly influenciated by Cr, and in stations 8 and 10, influenciated by Mn and Fe (data not 234
shown). Despite the high concentrations of metals in station 2, no clear influence of a specific 235
metal on the community structure of this station could be characterized. 236
237
Bacterial community composition of sediments from stations 1’ and 2 238
The bacterial community composition of the channel stations 1’ and 2 were determined in order 239
to evaluate the impact of pollutants on the bacterial diversity. These stations were chosen 240
because i) they are both channel stations and their sediments have almost similar physico-241
chemical parameters (Table1); ii) they are under the influence of PAH contents at different 242
levels, station 1' beeing much more contaminated (Fig. 2A) and iii) the station 2 is the more 243
metal contaminated channel station (41020.8 and 1864.4 µg.g-1 of dry wt sediment in station 2 244
and 1’, respectively, Table 1). 16S rRNA gene library analysis of the stations 1’ and 2 was 245
performed in order to determine the composition of the bacterial communities. From the 98 and 246
97 clone sequences analysed, 78 (64 singletons) and 82 (73 singletons) phylotypes were found 247
in library of station 1’ and station 2 respectively. Although the rarefaction curves did not attain 248
the saturation (data not shown), the coverage values (0.95) indicated that a number sufficient of 249
clones was analysed for each station. Shannon index was almost similar for both libraries (4.22 250
and 4.28 for library 1’ and 2 respectively) and equitability was identical (0.97) indicating a 251
high bacterial diversity in both stations. No monophyletic groups (cut off level of < 97% 252
similarity) were found to be dominant as indicated by low Dominance indexes (1.73% for 253
library 1’ and 1.68% for library 2). A comparison of the libraries by the LIBSHUFF method 254
revealed that they were composed by significantly different phylotypes (XY p-value=0.001; 255

YX p-value=0.004, with a confidence of 99% (p = 0.01)). These observations are consistent 256
with the T-RFLP analyses that showed major differences in the bacterial populations between 257
the two stations with high diversity in bacterial community inhabiting superficial sediment of 258
station 2. 259
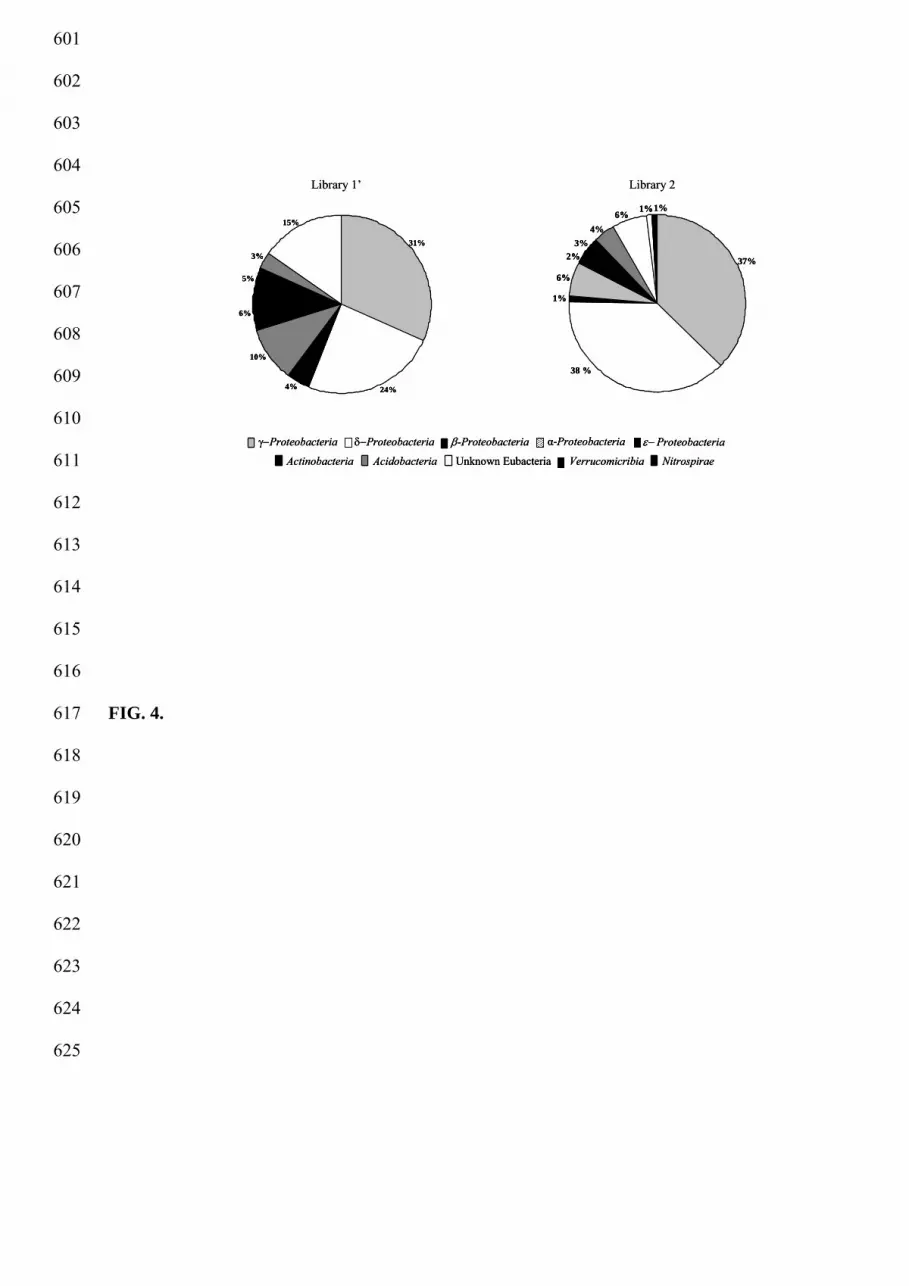
The phylogenetic analysis of the clone sequences revealed their distribution within six major 260
taxonomic groups of prokaryotic organisms (Fig. 4). Sequences affiliated to α, β, γ, δ, ε, 261
subclass of the Proteobacteria, to the phylum of Actinobacteria and Acidobacteria were 262
detected in both libraries, though in different extent. Sequences affiliated to the phyla of 263
Nitrospirae and Verrucomicrobia were detected only in library 2. Nevertheless, about 80% 264
(library 1’) and 90% (library 2), of the total sequences could not be closely related to cultured 265
organisms suggesting that they may constitute new taxa (Fig. 5). Surprisingly, about 15% of 266
the total sequences in library 1’and 6% of the total sequences in library 2 were closely related 267
to 16S rRNA sequences of unknown bacteria. The library 1’ was dominated by sequences 268
related to γ-Proteobacteria (31% of the sequences) and 3% of these sequences were related to 269
16S rRNA sequences of identified species such as Pseudomonas sp., Pseudomonas lanceolata, 270
Legionella pneumophila, Acinetobacter sp. (Fig. 5). Library 2 was characterized by the co-271
dominance of δ- and γ-Proteobacteria (38 and 37%, respectively) (Fig. 4). Numerous 272
sequences in the libraries were related to sequences previously found in organic and inorganic 273
contaminated sediment. Indeed, main phylotype, representing 6.1% and 12.4% of library 1' and 274
2 respectively, is affiliated within the γ-Proteobacteria and related to uncultured clones 275
obtained from polluted environments, heavy metal-rich and/or organic-rich, originated from 276
harbor sediments, marine sediments or fish farm sediments (Bissett et al., 2006; Gillan & 277
Pernet 2007; Zhang et al., 2008). 278
Several 16S rRNA gene sequences could be related to T-RFLP’s OTUs by predictive 279
digestions (data not shown). Both molecular methods revealed the same dominant populations, 280

i.e. clones sequences with an in silico digestion size of 204 bp, which is the domonant T-RF in 281
T-RFLP analysis. 282
283
DISCUSSION 284
The impact of environmental and pollutant variables on sediment microbial communities was 285
studied at 8 different stations located in a Southern Mediterranean lagoon. Considering 286
hydrological and trophic conditions, this ecosystem was divided into two zones: (i) the channel 287
(stations 1, 1’and 2) and (ii) the lagoon itself (stations 6, 8, 9, 10, and 12). This is the 288
consequence of the contribution of inflow streams into the Bizerte lagoon as previously 289
described (Yoshida et al., 2003), the Tinja wadi (Fig. 1) being the main contributor. The same 290
division could also be observed considering the PAH contents in sediments (from 23.9 ng.g-291
1dry wt to 876.6 ng.g-1 dry wt), the channel stations being the most contaminated. T-RFLP 292
analysis revealed differences between the microbial community structures. The lowest bacterial 293
diversity was observed in the closer Mediterranean Sea station (14 OTUs, station 1) subjected 294
to both marine and lagoonar influences and showing highest salinity. In contrast the highest 295
bacterial diversity was recorded in station 12 (37 OTUs) that shows lowest salinity, low PAH-296
levels and that receives Tinja wadi effluant in wet season, when the samples were taken. 297
Variations of the microbial diversity have been shown along environmental gradients such as 298
salinity (Goñi Urriza et al., 2007), pollution (Hunter et al., 2006) and other parameters 299
(Fourçans et al., 2004; Córdova-Kreylos et al,. 2006). The bacterial community structure was 300
correlated with the PAH content allowing the identification of specific OTUs. For example 301
OTU of 256 bp was found specifically in fluorene, dibenzoanthracene and benzoperylene 302
contaminated station. Interestingly, this OTU could correspond to Acinetobacter sp. and strains 303
belonging to this genus (and having a predictive restriction size of 256 bp) have been 304

previously isolated from Bizerte lagoon sediment for their capacity to degrade PAHs (Ben Said 305
et al., 2007). 306
The stations 1’ and 2 showed similar physico-chemical parameters and different PAH and 307
metal contamination levels. The comparison of their composition would reveal the effect of 308
contaminants on the bacterial community structure. Comparison of 16S rRNA gene library 309
analysis of these stations revealed clear differences between the bacterial community 310
compositions. Considerable number of singletons in the composition of the two rRNA gene 311
libraries was observed and the majority of phylotypes detected were not closely related to any 312
cultivated representatives. These results are in accordance with previous observations reported 313
in marine environmental sequence analysis (Hunter et al., 2006). We observed mainly 314
phylotypes affiliated with α, β, γ, δ, ε- Proteobacteria. In addition phylotypes related to the 315
phyla of Actinobacteria and Acidobacteria were also detected. Members of these phyla are 316
commonly found in less permeable sediments of Seas and estuaries (Lopez-Garcia et al., 317
2003). Numerous sequences in the libraries are related to sequences of bacteria that were 318
previously found in heavy metal and hydrocarbon contaminated sediments (Bowman & 319
McCuaig, 2003; Heijs et al., 2005; Bissett et al., 2006; Hunter et al., 2006). The libraries 320
were dominated by sequences related to γ- and δ-Proteobacteria, α-Proteobacteria related 321
sequences being less abundant. This is typically observed in marine microbial communities 322
(Brown & Bowman, 2001). Although γ-Proteobacteria related sequences were detected in 323
sediments of both PAH and metal contaminated stations, they dominated the community of the 324
most PAH-contaminated sediments (station 1’). Previous research showed that the microbial 325
community structure in a long-term mixed waste contaminated site might reflect both metal 326
and aromatic hydrocarbon concentrations (Nakatsu et al., 2005). The dominance of γ-327
Proteobacteria related bacteria in PAH-contaminated sediments is not unexpected since rapid 328
and strong selection for γ-Proteobacteria have been reported in oil-treated microcosms 329

(Bordenave et al., 2007), in oil-contaminated marine sediments (Hernandez-Raquet et al., 330
2006; Paisse et al., 2008) and after oil spill accident (Kasai et al., 2001). Moreover, 75% of 331
PAHs degrading strains isolated from the Bizerte lagoon in a previous study were γ-332
Proteobacteria (Ben Said et al., 2007). By cloning and sequencing, we detected clones 333
affiliated to Acinetobacter sp.. Interestingly, we have isolated strains affiliated to the same 334
genus capable of fluoranthene and pyrene mineralization (Ben Said et al., 2007). Their relative 335
abundance associated with their metabolic capacities indicates the possible role of strains of 336
this genus in in situ biodegradation of these pollutants. In the previous study we also isolated 337
other hydrocarbonoclastic strains, mainly affiliated to the Pseudomonas genus (Ben Said et al., 338
2007) that we could not detected in this study by library analysis but related T-RFs were detect 339
by T-RFLP analysis. 340
Sediments of the most metal contaminated station (station 2) were dominated by δ-341
Proteobacteria affiliated sequences followed by γ-Proteobacteria. Numerous δ-Proteobacteria 342
phylotypes were related to both aerobic sulfur oxidizers and anaerobic sulfate reducers 343
suggesting an active sulfur cycle in the sediments as usually found in sea sediments (Hunter et 344
al., 2006; Paisse et al., 2008). Interestingly, δ-Proteobacteria related sequences have been 345
observed as predominant in sediments contaminated with multiple pollutants (Hg, PAHs and 346
PCBs, Edund & Jansson, 2006). Nevertheless, Cordova-Kreylos et al. (20006) found that 347
metals had a greater effect on microbial community composition than organic pollutants. 348
Sequences affiliated to β-Proteobacteria were detected in both stations in low abundance (4 349
and 1 %) as reported in other studies of marine sediments (Bowman et al., 2003; Mills et al., 350
2003; Asami et al., 2005). Since β-Proteobacteria-related phylotypes are known to play a 351
critical role in ecosystem function, Hunter et al. (2006) hypothesised that the lack of β-352
Proteobacteria-related phylotypes is believed to be the result of the lowest detection limits of 353
these taxa rather than their absences. 354

355
In conclusion, our results revealed bacterial community structure differences along Bizerte 356
lagoonar sediments. We showed the influence of pollutants in bacterial community structure 357
that is clearly observed by the quantity and the type of PAHs and to a lesser extent by some 358
metals. Strong relationships were observed between individual-PAH concentrations and some 359
OTUs. Clone libraries analysis for two most contaminated PAHs and metals sediment stations 360
have demonstrated significant differences in bacterial community compositions, gamma 361
proteobacterial phylotypes dominated the most PAH-polluted station whereas delta and gamma 362
proteobacterial phylotypes dominated the most metal-polluted station. However, both libraries 363
were dominated by sequences affiliated with uncultured bacteria. Future research might focus 364
on in situ activity level of the γ-Proteobacteria, δ-Proteobacteria in order to determine if these 365
groups play a role in the biotransformation of the pollutants. 366
367
ACKNOWLEDGMENTS 368
This research was supported by the Tunisian “Ministère de la Recherche Scientifique, de la 369
Technologie et du Developpement des Competences” (MRSTDC). We acknowledge the 370
financial support by the Conseil Régional d’Aquitaine and the Conseil Général des Pyrénées 371
Atlantiques. Sequencing experiments presented in the present publication were performed at 372
the Genotyping and Sequencing facility of Bordeaux (grants from the Aquitaine Regional 373
Government Council n° 20030304002FA and 20040305003FA and from the European Union, 374
FEDER n° 2003227). 375

REFERENCES 376
Abulencia CB, Wyborski DL, Garcia JA, Podar M, Chen W, Chang SH, Chang HW, Watson 377
D, Brodie EL, Hazen TC & Keller M (2006) Environmental whole-genome amplification to 378
access microbial populations in contaminated sediments. Appl Enviro. Microbio 72: 3291–379
3301. 380
Altschul SF, Madden TL, Schäffer AA, Zhang J, Zhang Z, Miller W & Lipman DJ (1997) 381
Gapped BLAST and PSI-BLAST: a new generation of protein database search programs. 382
Nucleic Acids Res 25: 3389–3402. 383
Asami H, Aida M & Watanabe K (2005) Accelerated sulfur cycle in coastal marine sediment 384
beneath areas of intensive shellfish aquaculture. Appl Environ Microbiol 71: 2925–2933. 385
Ben Said O, Goñi-Urriza MS, El Bour M, Dellali M, Aissa P & Duran, R (2008) 386
Characterization of aerobic polyaromatic hydrocarbon-degrading bacteria from Bizerte lagoon 387
sediments, Tunisia. J Appl Microbiol 104: 987–997. 388
Bissett A, Bowman J & Burke C (2006) Bacterial diversity in organically-enriched fish farm 389
sediments. FEMS Microbiol Ecol. 55: 48-56. 390
Bordenave S, Fourçans A, Blanchard S, Goñi-Urriza M, Caumette P & Duran R (2004) 391
Structure and fonctional analyses of bacterial communities changes in microbial mats 392
following petroleum exposure. Ophelia 58: 195-203. 393
Bordenave S, Goñi-Urriza MS, Caumette P & Duran R (2007) Effects of heavy fuel oil on the 394
bacterial community structure of a pristine microbial mat. Appl Environ Microbiol 73 :6089-395
6097. 396
Bowman JP & Mccuaig RD (2003) Biodiversity, Community Structural Shifts, and 397
Biogeography of prokaryotes within antarctic continental shelf sediment. Appl Environ 398
Microbiol 69: 2463–2483. 399

Brown MV & Bowman JP (2001) A molecular phylogenetic survey of sea-ice microbial 400
communities (SIMCO). FEMS Microbiol Ecol 35: 267–275. 401
Cao Y Cherr GN, Córdova-Kreylos AL, Fan TWM, Green PG, Higashi RM, LaMontagne MG, 402
Scow KM, Vines CA, Yuan J & Holden PA (2006) Relationships between Sediment Microbial 403
Communities and Pollutants in Two California Salt Marshes Microbiol Ecol 52: 619-633 404
Córdova-Kreylos AL, Cao Y, Green PG, Hwang HM, Kuivila KM, LaMontagne MG, Van De 405
Werfhorst LC, Holden PA & Scow KM (2006) Diversity, composition, and geographical 406
distribution of microbial communities in California Salt Marsh Sediments. Appl Environ 407
Microbiol 72: 3357-3366. 408
Edlund A & Jansson JK (2006) Changes in active bacterial communities before and after 409
dredging of highly polluted baltic sea sediments. Appl Environ Microbiol 72: 6800–6807. 410
Ford T & Ryan D (1995) Toxic metals in aquatic ecosystems: a microbiological perspective. 411
Environ Health Perspect 103 (Suppl. 1): 25–28. 412
Fourçans A, Solé A, Diestra E, Ranchou-Peyruse A, Esteve I, Caumette P & Duran R (2006) 413
Vertical migrations of phototrophic bacterial populations in a hypersaline microbial mat from 414
Salins-de-Giraud (Camargue, France). FEMS Microbiol Ecol 57: 367-377. 415
Fromin N, Hamelin J, Tarnawski S, Roesti D, Jourdain-Miserez K, Forestier N, Teyssier 416
Cuvelle S, Gillet F, Aragno M & Rossi P (2002) Statistical analysis of denaturing gel 417
electrophoresis (DGE) fingerprinting patterns. Environ Microbiol 4: 634-643. 418
Gillan DC & Pernet P (2007) Adherent bacteria in heavy metal contaminated marine 419
sediments. Biofouling 23: 1-13. 420
Goñi-Urriza MS, Point D, Amouroux D, Guyoneaud R, Donard OFX, Caumette P & Duran R 421
(2007) Bacterial community structure along the Adour estuary (French Atlantic coast): 422
influence of salinity gradient versus metal contamination. Aquatic Microb Ecol. 49: 47–56. 423
Heijs SK, Damsté JS & Forney LJ (2005) Characterization of a deep-sea microbial mat from an 424
active cold seep at the Milano mud volcano in the Eastern Mediterranean Sea. FEMS Microbiol 425
Ecol 54: 47-56. 426
Hernández-Raquet G, Budzinski H, Caumette P, Dabert P, Le Ménach K, Muyzer G & Duran 427
R (2006) Molecular diversity studies of bacterial communities of oil polluted microbial mats 428
from the Etang de Berre (France). FEMS Microbiol Ecol 58: 550-562. 429
Hewson I & Fuhrman JA (2004) Richness and diveristy of bacterioplankton along an estuarine 430
gradient in Moreton Bay, Australia. Appl Environ Microbiol 70: 3425-3433. 431
Hunter EM, Mills HJ & Kostka JE (2006) Microbial community diversity associated with 432
carbon and nitrogen cycling in permeable shelf sediments. Appl Environ Microbiol 72: 5689-433
701. 434
Inagaki F, Suzuki M, Takai K, Oida, Sakamoto T, Aoki K, Nealson KH & Horikoshi K (2003) 435
Microbial communities associated with geological horizons in coastal subseafloor sediments 436
from the sea of Okhotsk. Appl Environ Microbiol 69:7224–7235. 437
Jiang SC & Paul JH (1996) Occurrence of lysogenic bacteria in marine microbial communities 438
as determined by prophage induction. Mar Ecol Prog Ser 142: 27–38. 439
Kasai Y, Kishira H, Syutsubo K & Harayama S (2001) Molecular detection of marine bacterial 440
populations on beaches contaminated by the Nakhodka tanker oil-spill accident. Environ 441
Microbiol 3: 246–255. 442
Kimura M (1980) A simple method for estimating evolutionary rates of base substitutions 443
through comparative studies of nucleotide sequences. J Mol Evol 16:111–120. 444
Kumar S, Tamura K & Nei M (2004) MEGA3: Integrated Software for Molecular Evolutionary 445
Gnenetics Analysis and sequence alignement. Breief Bioinform 5: 1907-1919. 446

Lopez-Garcia P, Duperron S, Philippot P, Foriel J, Susini J & Moreira D (2003) Bacterial 447
diversity in hydrothermal sediment and epsilonproteobacterial dominance in experimental 448
microcolonizers at the Mid-Atlantic Ridge. Environ Microbiol 5: 961–976. 449
Maidak BL, Cole JR, Lilburn TG, Parker CT Jr., Saxman PR, Farris RJ, Garrity GM, Olsen GJ, 450
Schmidt TM & Tiedje JM (2001) The RDP-II (Ribosomal Database Project). Nucleic Acids 451
Research 29: 173-174. 452
Mills HJ, Hodges CK, Wilson MacDonald IR & Sobecky PA (2003) Microbial diversity in 453
sediments associated with surface-breaching gas hydrate mounds in the Gulf of Mexico. FEMS 454
Microbiol Ecol 46: 39–52. 455
Murphy J & Riley JP (1962) A modified single solution method for the determination of 456
phosphate in naturel waters. Ana Chem Acta 27: 31-36. 457
Nakatsu CH, Carmosini N, Baldwin B, Beasley F, Kourtev P & Konopka A (2005) Soil 458
Microbial Community Responses to Additions of Organic Carbon Substrates and Heavy Metals 459
(Pb and Cr). Appl Environ Microbiol 71: 7679–7689. 460
Païssé S, Coulon F, Goñi-Urriza M, Peperzak L, J. McGenity T & Duran R (2008) Structure of 461
bacterial communities alonga hydrocarbon contamination gradient ina coastal sediment. FEMS 462
Microbiol Ecol (in press) 463
Pearson WR (1990) Rapid and sensitive sequence comparison with FASTP and FASTA. 464
Methods Enzymol 183: 63–98. 465
Precigou S, Goulas P & Duran R (2001) Rapid and specific identification of nitrile hydratase 466
(NHase)-encoding genes in soil samples by polymerase chain reaction. FEMS Microbiol Lett 467
204: 155-161. 468
Richards FA & Thompson TG (1952) The estimation and characterization of plankton 469
populations by analysis. 2- A spectrophotometric method for the estimation of plankton 470
pigment. J Mar Res 11: 156-172. 471

Röling WFM, Milner MG, Jones DM, Lee K, Daniel F, Swannell RJP & Head IM (2002) 472
Robust hydrocarbon degradation and dynamics of bacterial communities during nutrient-473
enhanced oil spill bioremediation. Appl Environ Microbiol 68: 5537–5548. 474
Saitou N & Nei M (1987) The neighbour-joining method: a new method for reconstructing 475
phylogenetics trees. Mol Biol Evol 4: 406-425. 476
Singleton DR, Furlong MA, Rathbun SL & Whitman WB (2001) Quantitative comparisons of 477
16S rDNA sequence libraries from environmental samples. Appl Environ Microbiol 67: 4373–478
4376. 479
Thompson JD, Gibson TJ, Plewniak F, Jeanmougin F & Higgins DG (1997) The ClustalX-480
Windows interface: flexible strategies for multiple sequence alignment aided by quality 481
analysis tools. Nucleic Acids Res 25: 4876–4882. 482
Vrionis HA, Anderson RT, Ortiz-Bernad I, O’Neill KR, Resch CT, Peacock AD, Dayvault R, 483
White DC, Long PE & Lovley DR (2005) Microbiological and geochemical heterogeneity in 484
an in situ uranium bioremediation field site. Appl Environ Microbiol 71: 6308–6318. 485
Yan T, Fields MW, Wu L, Zu Y, Tiedje JM & Zhou J (2003) Molecular diversity and 486
characterization of nitrite reductase gene fragments (nirK and nirS) from nitrate- and uranium-487
contaminated groundwater. Environ Microbiol 5: 13–24. 488
Yoshida M, Hamdi H, Abdulnasser I & Jedidi N (2002) Contamination of potentially toxic 489
elements (PTEs) in Bizerte lagoon bottom sediments, surface sediment and sediment 490
repository. In: Ghrabi A., Yoshida M. (eds) Study on Environmental Pollution of Bizerte 491
lagoon. INRST-JICA Publishers. 139 p. 492
Zhang W, Ki JS & Qian PY (2008) Microbial diversity in polluted harbor sediments I: 493
Bacterial community assessment based on four clone libraries of 16S rDNA. Estuar Coast 494
Shelf Sci 76: 668-681. 495
496

Table 1. Physico-chemical parameters of the stations located around the Bizerte lagoon. Temperature (T), salinity (S), suspended matter (SM), dissolved
oxygen (O2), nitrites (NO2), nitrates (NO3), ammonium (NH4), total nitrogen (Nt), orthophosphate (PO4), total phosphorus (Pt), chlorophyll (Chla), total
PAH (PAHt) and total metals (Metalst) were determined in 8 sites of Bizerte lagoon (May 2004).
Station Location Depth (m)
T (°C)
S (psu)
MS (g.m-3)
O2 (g.m-3)
NO2 (mg.m-3)
NO3 (mg.m-3)
NH4 (mg.m-3)
Nt (mg.m-3)
PO4 (mg.m-3)
Pt (mg.m-3)
Chla (mg.m-3)
PAHt (ng.g-1)
Metalst (µg.g-1)
1 3715452 N 951821 E
11 21.6 36 20 5.5 11.69 30 8 180 2 35 4.4 30 17698.65
1’ 3714600 N 950420 E
11 21.8 36.3 18 5.5 13.13 26.96 11.94 208.36 11.19 47.21 4.12 876.6 1864.44
2 3714000 N 949400 E
11 21.9 36 11.89 5.5 3.43 45.34 14.01 219.73 18.84 41.57 5.00 340.2 41020.76
6 3712460 N 955790 E
7.5 22.3 35.7 20 8.3 5.81 37.33 6.77 178.01 1.05 35.83 4.56 90.9 16941.01
8 3711040 N 955790 E
1.5 23.3 34.2 80 9.1 7.35 13.67 9.42 227.31 12 41.85 4.95 23.9 17103.40
9 3709770 N 954893 E
3.9 23 34.5 80 7 13.5 35 9 135 12 30 5.1 37.7 6927.65
10 3708480 N 949400 E
3 23.1 34.6 65 6.5 10 40 18 135 12 37 5.4 110 80274.93
12 3711042 N 947313 E
3 22.2 33.7 18 7.1 6.21 4.49 8.31 200.77 12.4 41.57 5.23 53.7 19974.23

500
Figure captions 501 502
Figure 1. Map of the Bizerte lagoon indicating the location of the sampling stations (•). Areas 503
of populated zones (dashed circles) and industrial zones (solid circles) are indicated. The 504
arrows indicate streams. 505
506
Figure 2. Bacterial community structure analysis of Bizerte lagoon sediments. A: number of 507
operational taxonomic units (OTUs) in each station, total PAH contents (ng.g-1 dry wt) and low 508
molecular weight PAHs/high molecular weight PAHs ratio (LPAHs/HPAHs) are also 509
indicated. B: relative abundance of T-RFs for each station from T-RFLP patterns obtained by 510
HaeIII digestion of 16S rRNA amplified fragment 511
512
Figure 3. Canonical Correspondance Analysis (CCA) between sediment bacterial communities 513
characterized by T-RFLP fingerprints and individual PAH concentrations. A: CCA of the 514
stations except station 1’, insert shows the CCA graph with all stations. B: CCA presented in A 515
showing the corresponding variables (i.e. T-RFs), the length of T-RF are indicated in base pair. 516
517
Figure 4. Repartition of representative phylogenetic groups detected in 16S rRNA gene 518
libraries of station 2 and 1’ of Bizerte lagoon sediment. 519
520
Figure 5. 16S rRNA-based phylogenetic reconstruction showing the affiliation of Bizerte 521
lagoon sequences (in bold) with selected reference sequences. The scale bar represents 5% 522
estimated sequence divergence. 523
524
525
526
527

528
529
530
531
532
533
534
535
536
537
538
539
540
541
542
543
544
545
546
547
FIG. 1. 548
Menzel Abderahmen
Menzel Jmil
Jarzouna
Bizerte
Bizerte LagoonTinja
MenzelBourguiba
MediterraneanSea
01
2
34
6
7
8
9
10
11
12
13
14
5
1’
Menzel Abderahmen
Menzel Jmil
Jarzouna
Bizerte
Bizerte Lagoon
Menzel Abderahmen
Menzel Jmil
Jarzouna
Bizerte
Bizerte LagoonTinja
MenzelBourguiba
MediterraneanSea
01
2
34
6
7
8
9
10
11
12
13
1414
5
1’
Menzel Abderahmen
Menzel Jmil
Jarzouna
Bizerte
Bizerte Lagoon
Menzel Abderahmen
Menzel Jmil
Jarzouna
Bizerte
Bizerte LagoonTinja
MenzelBourguiba
MediterraneanSea
01
2
34
6
7
8
9
10
11
12
13
1414
5
1’
Menzel Abderahmen
Menzel Jmil
Jarzouna
Bizerte
Bizerte Lagoon
Bizerte
Bizerte LagoonTinja
MenzelBourguiba
MediterraneanSea
01
2
3 46
7
8
9
10
11
12
13
1414
5
1’
Menzel Abderahmen
Menzel Jmil
Jarzouna
Bizerte
Bizerte Lagoon
Menzel Abderahmen
Menzel Jmil
Jarzouna
Bizerte
Bizerte LagoonTinja
MenzelBourguiba
MediterraneanSea
01
2
34
6
7
8
9
10
11
12
13
1414
5
1’
Menzel Abderahmen
Menzel Jmil
Jarzouna
Bizerte
Bizerte Lagoon
Menzel Abderahmen
Menzel Jmil
Jarzouna
Bizerte
Bizerte LagoonTinja
MenzelBourguiba
MediterraneanSea
01
2
34
6
7
8
9
10
11
12
13
1414
5
1’
Menzel Abderahmen
Menzel Jmil
Jarzouna
Bizerte
Bizerte Lagoon
Menzel Abderahmen
Menzel Jmil
Jarzouna
Bizerte
Bizerte LagoonTinja
MenzelBourguiba
MediterraneanSea
01
2
34
6
7
8
9
10
11
12
13
1414
5
1’
Menzel Abderahmen
Menzel Jmil
Jarzouna
Bizerte
Bizerte Lagoon
Bizerte
Bizerte LagoonTinja
MenzelBourguiba
MediterraneanSea
01
2
3 46
7
8
9
10
11
12
13
1414
5
1’

549
550
551
552
553
554
555
556
557
558
559
560
561
562
563
564
565
566
567
568
569
570
571
572
573
FIG. 2. 574
Stat
ions
Cha
nnel
Lago
on
1
1’
2
6
8
9
12
10
T-RF (bp)
Outdistance Mediterranean Sea
36 37 56 63 64 65 66 71 72 73 74 113
192
200
201
202
204
231
215
207
206
216
399
340
339
323
322
321
291
271
270
269
259
258
256
255
254
236
228
234
235
422
421
420
406
405
404
403
112
20 - 30 %
10 - 20 %
2 - 5 %
5 - 10 %
>60%
40 - 50 %
30 - 40 %Stat
ions
Cha
nnel
Lago
on
1
1’
2
6
8
9
12
10
T-RF (bp)
Outdistance Mediterranean Sea
36 37 56 63 64 65 66 71 72 73 74 113
192
200
201
202
204
231
215
207
206
216
399
340
339
323
322
321
291
271
270
269
259
258
256
255
254
236
228
234
235
422
421
420
406
405
404
403
112
20 - 30 %
10 - 20 %
2 - 5 %
5 - 10 %
>60%
40 - 50 %
30 - 40 %
20 - 30 %
10 - 20 %
2 - 5 %
5 - 10 %
>60%
40 - 50 %
30 - 40 %
0
200
400
600
800
1000
10 9 12 8 6 2 1' 1
Tota
l PA
Hs(
ng.g
-1dr
y w
eigh
t)
L PA
Hs/
HPA
Hs
05
10152025303540
OTU
snumber
Outdistance Mediterranean SeaChannelLagoon
L.PAHs/H.PAHs Total PAHs OTU numbers
89
00,5
11,5
22,5
3
0
200
400
600
800
1000
10 9 12 8 6 2 1' 1
Tota
l PA
Hs(
ng.g
-1dr
y w
eigh
t)
L PA
Hs/
HPA
Hs
05
10152025303540
OTU
snumber
Outdistance Mediterranean SeaChannelLagoon
L.PAHs/H.PAHs Total PAHs OTU numbersL.PAHs/H.PAHs Total PAHs OTU numbers
8989
00,5
11,5
22,5
3
00,5
11,5
22,5
3
A
B

575
576
577
578
579
580
581
582
583
584
585
586
587
588
589
590
591
592
593
594
595
596
597
598
FIG. 3. 599
600
A
B
12 8
6 9
1
-1.1
1.9
N
ANY
ANA
F
P
A
FLPY
CBA
BBF+BkF BAPIN
DBA
BPE
25.5 %
22.7 %
-1.1 1.9
2
10
12 8
6 9
1
-1.1
1.9
N
ANY
ANA
F
P
A
FLPY
CBA
BBF+BkF BAPIN
DBA
BPE
25.5 %
22.7 %
-1.1 1.9
2
10
22.7%
25.5 %
49
6365
71
72
7374
77
110
111112
113114
115
117
120
122
127186
190
192200
202
204206 207
209
215
216
227
228
229
231234
235
236
254
255
256
258259 269
270
273
290291
321
322
323
338
339
340
388
399402
404405
406
419
420421
422
-0.80
-2.41
0.80
4.02
-2.41
N
ANY
F
P
A
FL
PY
CBA
BBF + BkF BAP
IN
DBA
BPE
4.02
56
ANA
2
12
81’
6
10
9
1
-1.06
5.31
-1.06 5.31
N
ANYF
PAFLPYC
BABBF+BkFBAP
INDBABPE
34.7 %
17.7 %
ANA
2
12
81’
6
10
9
1
-1.06
5.31
-1.06 5.31
N
ANYF
PAFLPYC
BABBF+BkFBAP
INDBABPE
34.7 %
17.7 %
ANA
601
602
603
604
605
606
607
608
609
610
611
612
613
614
615
616
FIG. 4. 617
618
619
620
621
622
623
624
625
31%
24%4%
10%
3%
15%
5%
6%
37%
1%
38 %
6%
2%3%
4%6%
1%1%
Unknown Eubacteria
γ−Proteobacteria δ−Proteobacteria β-Proteobacteria ε− Proteobacteria
Actinobacteria Acidobacteria Nitrospirae Verrucomicribia
α-Proteobacteria
Library 1’ Library 2
31%
24%4%
10%
3%
15%
5%
6%
31%
24%4%
10%
3%
15%
5%
6%
37%
1%
38 %
6%
2%3%
4%6%
1%1%
37%
1%
38 %
6%
2%3%
4%6%
1%1%
Unknown Eubacteria
γ−Proteobacteria δ−Proteobacteria β-Proteobacteria ε− Proteobacteria
Actinobacteria Acidobacteria Nitrospirae Verrucomicribia
α-Proteobacteria
Unknown Eubacteria
γ−Proteobacteria δ−Proteobacteria β-Proteobacteria ε− Proteobacteria
Actinobacteria Acidobacteria Nitrospirae Verrucomicribia
α-Proteobacteria
Library 1’ Library 2

626
627
628
629
630
631
632
633
634
635
636
637
638
639
640
641
642
643
644
645
646
647
648
649
650
651
Fig 5 652
Sulfurimonas denitrificans (L40808)100100
100
87
100
100
100
92
100
51
100
61
90
99
100
100
67
89
83
99
58
76
89
53
77
77
66
100
100
96
70
98
100
52
53
58
57
99
89
82
100
99
85
90
73
86
83
53
50
59
51
0.02
1’ (1%); 2 (1%)Comamonas testosteroni (M11224)
Iodobacter fluviatilis (M22511)Achromobacter group
1’(1%)Burkholderia group
Nitrosomonas oligotropha (AF272422)Gallionella ferruginea (L07897)
Stenotrophomonas acidaminiphila (AF273080)1‘ (2%); 2 (3.1%)
2 (1%)Beggiatoa alba (AF110274)
1‘ (6.1%); 2 (12.4%) 1’ (1%)
Pseudomonas groupEnterobacter group
Alteromonadales groupsMarinobacter group
Marinomonas mediterranea (AF063027)1’ (1%)
Acinetobacter group2 (2.1%)
Oceanospirillum beijerinckii (AB006760)1’ (1%); 2 (1%)
Halomonas nitritophilus (AJ309564)Alcanivorax borkumensis (Y12579)
1‘ (1%); 2 (1%)Methylomicrobium pelagicum (X72775)
1‘ (1%); 2 (4.1%)
Thiothrix nivea (L40993)1‘ (2%)
1’ (1%)Legionella pneumophila (M59157)
1‘ (1%); 2 (2.1%)1’ (1%)
Rhodospirillum rubrum (D30778)Magnetite containing magnetic vibrio (L06455)
Rickettsia prowazekii (M21789)Sphingomonas group
1‘ (2%)Bradyrhizobium elkanii (U35000)
1‘ (1%); 2 (2.1%)1‘ (1%); 2 (2.1%)Agrobacterium tumefaciens (DQ468100)
1‘ (2%)2 (1%)Rhizobiales groups
1‘ (2%); 2 (1%)
1‘ (2%); 2 (3.1%)Desulfonatronum lacustre (AF418171)
Desulfovibrio halophilus (U48243)1‘ (1%); 2 (2.1%)
Geobacter metallireducens (L07834)2 (1%)Pelobacter carbinolicus (X79413)
1‘ (3.1%); 2 (1%)Desulfosarcina variabilis (M26632)
1‘ (2%)2 (1%)
Desulfococcus multivorans (AF418173)2 (1%)
Desulfobacterium anilini (AJ237601)2 (2.1%)
Desulfonema ishimotoei (U45992)Desulfobacca acetoxidans (AF002671)
1‘ (5.1%); 2 (4.1%)Syntrophobacter sp. (X94911)
2 (2.1%)Desulfobulbus elongatus (X95180)
Desulfotalea arctica (AF099061)Desulfocapsa thiozymogenes (X95181)
Desulforhopalus vacuolatus (L42613)1‘ (3.1%); 2 (8.2%)
1‘ (4.1%); 2 (2.1%)Helicobacter baculiformis (EF070342)
Helicobacter nemestrinae (AF348617)(1‘ (2%)
Campylobacter fetus subsp. fetus (DQ174128)2 (1%)
Candidatus Arcobacter sulfidicus (AY035822)Arcobacter cryaerophilus (L14624)
1’ (1%)
Psychrobacter marincola (AY292940)
δ-Proteobacteria
ε-Proteobacteria
α-Proteobacteria
γ-Proteobacteria
β-Proteobacteria
Desulfobacter group