photoablation of polyurethane films using uv laser pulses
TRANSCRIPT
Optical and Quantum Electronics 27 (1995) 1359-1376
Photoablation of polyurethane films using UV laser pulses
V. Z A F I R O P U L O S , J. PETRAKIS , C. FOTAKIS Institute of Electronic Structure and Laser - FORTH and Association for Research, Technology and Training (ART7"), PO Box 1527, 71110 Heraklion, Crete, Greece
Received 22 November 1994
Pulsed ultraviolet laser ablation of two polyurethane films has been studied in terms of ablation rate behaviour and time-of-flight mass spectroscopy of the positively charged photofragments. Three excimer laser wavelengths (193, 248 and 308nm; 17-30ns pulse duration) and short-pulse laser system (pulse duration 500fs or 5 ps, at 248 nm) were employed. The results of the influence of energy fluence on the ablation rate are tested against other photoablation models and a table of fitted physical constants is presented. The upper limit of the mean activation energy for desorption is found to be considerably lower than the energy required to break single covalent bonds. The mass analysis of the positively charged species produced during the photoablation process provides valuable insight into the photofragmentation mechanism.
1. Introduction The ablation of polymers using short or ultra-short UV laser pulses has attracted great interest over the past decade, mainly because of its relevance to a plethora of technological applications [1, 2]. During this time a considerable effort has been devoted to understanding the science as well as developing the technology of UV laser ablation of polymers. Comprehensive reviews of the subject are to be found in the recent literature [1-5].
The primary photoablation products of short-pulse UV laser ablation of organic polymers consist basically of atoms and small molecules and, to a lesser extent, of medium-sized molecu- lar fragments such as monomers and parts of monomers [6]. These fragments are created by the breaking of covalent bonds within the polymer chain. This bond incision could be due either to direct photodissociation by the absorption of one or more photons or to the thermal motion of the atoms within the surface molecules. The former process is usually called photochemical ablation, while the latter is the well-known photothermal ablation. The applicability of one mechanism versus the other and their relative contributions to the general ablative photodecom- position (APD) process remain a puzzle. Recently, B/iuerle and his co-workers developed a new model for the description of UV laser ablation in polymers [7-9]. The main idea of the new approach, called photophysical ablation, is that the removal of electronically excited species from the surface of the polymer requires a lower activation energy than the removal of the same species in their electronic ground state.
In the present work the pulsed UV laser ablation of two different polyurethane (PU) films
0306-8919 �9 1995 Chapman & Hall 1359

V. Zafiropulos et aL
was studied as part of ongoing research on paint stripping in the aircraft industry. The two PU films studied here were provided by Dassault Aviation and they are used as top coat (TC/PU) and anticorrosive primer (PAC/PU) respectively. Both films had a thickness of ,~40 #m and they were composed of different resins.
The ablation rate as a function of energy fluence, repetition rate and number of pulses was measured using three excimer laser wavelengths (193, 248 and 308 nm; 17-30 ns pulse duration) and a short-pulse laser system (pulse duration 500 fs or 5 ps, at 248 nm). As a first step in elucidating the nature of the UV laser ablation of these types of polymers (this work is still in progress), the results are compared with the predictions of the photophysical/ photothermal and photochemical models and valuable insight into the operative APD mechan- isms is gained. A time-of-flight (TOF) mass analysis of the positively charged photofragments (using an XeCI excimer laser) is also presented. The results of this analysis provide additional information on the fragmentation process.
2. Experimental 2.1. Ablation rate study In the ablation rate studies the excimer lasers employed were Lambda Physik LPX ArE (193nm, 17ns), KrF (248nm, 30ns) and XeCI (30ns) lasers, and a Lambda Physik EMG 150 MSC femtosecond Excimer-dye laser system capable of delivering laser pulses of duration 5 ps or 500 fs at 248 nm and a repetition rate of 5 Hz. For each laser system, the rectangular laser beam, after reflection by the appropriate mirrors, was passed through a variable attenuator and a pair of rectangular cylindrical lenses of focal lengths f = 300 and f = 100 mm, with their axes oriented at 90 ~ . The focused laser beam was directed on to the sample, which was placed normal to the beam and 10-20 mm before the focal point. A square mask was placed in front of the samples and at the centre of the laser beam profile in order to shape the ablation etching spot. A typical spot size was 2 x 2 mm 2. Special attention was given to the homogeneity of the beam profile by keeping the resonator at a stable mode of operation and using high-quality mirrors (A/10) and lenses (Melles Griot, high-grade quartz). During the irradiation of the sam- pies, which was performed in air, the computer-controlled lasers operated in constant-energy mode, while the incident pulse energy could be adjusted to any desired value by rotating the variable attenuator. Calibration of the output pulse energy and the real pulse energy incident on the sample was performed using a pyroelectric detector. The uncertainty for the energy measurements was estimated to be <10%.
A profile meter was employed to record each spot profile in both longitudinal and transverse directions. From these profiles the area of the etching spot was determined and the exact energy fluence was calculated. The area of each cross-section was measured from each profile diagram using an area meter and then divided by the width of the transverse profile to determine the mean ablation depth. Throughout this study the ablation rate is found by dividing the mean ablation depth by the number of pulses. Thus, by using the same method of measuring the energy fluence and the ablation rate, it is possible to derive the exact ablated volume per inci- dent photon (see Section 3.1). The uncertainty in the ablation rate values is <15%. This max- imum of 15% uncertainty is due to the small ablation depth (film thickness of ~40/zm) and the semiperiodic roughness of the substrate (epoxy aramid composite material) on which the PU films were deposited. In all cases the maximum depth of the etched spot was at most 80% of the total film thickness.
The two PU films had been deposited on an epoxy aramid composite material and were provided by Dassault Aviation. Both films had a density of 1.6 + 0 .1gem -3 and different
1360

Photoablation of polyurethane films using UV laser pulses
absorptivities, which were not provided by the manufacturer. TC/PU is a polyurethane com- posed by two polyester resins of average molecular weights 30 000 and 15 000, respectively, and a diisocyanate (the essential ingredient of polyurethanes) of molecular weight 500. PAC/PU, on the other hand, consists of an epoxy resin of average molecular weight 50 000 and the same diisocyanate (for more details see Section 4).
Three kinds of irradiation were performed on the samples. First the influence of the repetition rate on the ablation rate was checked by varying the repetition rate from 5 to 80 Hz while keep- ing the fluence and total number of pulses constant. Then the linearity of ablation depth versus number of pulses was checked for possible incubation phenomena. These experiments were performed under constant fluence and a repetition rate of 5 Hz. Finally, the main measurements of the ablation rate versus fluence were performed under constant repetition rate (5 Hz) and total number of pulses.
2.2. Mass spectroscopic study TOF mass spectroscopy was applied as a diagnostic technique to detect and identify the positively charged fragments produced during the ablation process. The samples were inserted in a separately pumped fast sample-exchange chamber attached to the main instrument. During the whole process the system was maintained under a vacuum of about 2 x 10 -6 torr. The main sample chamber had several window ports to allow the laser beam access to the samples in various directions according to their geometry, and for controlling the process.
The beam of the XeC1 excimer laser was focused with an f -- 150 mm focal length lens through the quartz window of the chamber on to the sample. The positively charged particles created were subjected to initial acceleration in an electric field between two metal grids in the interaction area of the main chamber to which a potential difference of 1000 V was applied. The particles then had to travel across the L -- 140 cm field-free area of the spectrometer to be detected by the MCP system. A fast photodiode that monitored the interaction of the beam with the sample, through another window of the main chamber, triggered a high-speed storage oscilloscope for recording the mass spectra. Calibration was performed between different measurements by rotating the sample holder, which held both the sample and a piece of lead.
3. Results 3.1. Ablation rate study Plots of the ablation rate of TC/PU and PAC/PU films versus incident fluence for the three excimer wavelengths are presented in Figs la and 2a, while Figs 3a and 4a display the analo- gous results for the three laser pulse durations employed in this study. Parts (b) of the above figures present the ablation efficiency in units of A 3 of ablated material per incident photon as a function of energy fluence. The ablation efficiency can be obtained in units of mean ablated monomer units per incident photonobY dividing the ordinate of these figures by 700 (average volume of one monomer unit in A3). This may be helpful in comparing the present results of ablation efficiency with the corresponding results for polyimide [10] or poly(methyl methacrylate) [11].
The ablation rate for PAC/PU was found not to depend on the repetition rate at 193, 248 and 308 nm, while for TC/PU the ablation rate increased slightly with increasing repetition rate at 248 and 308 nm. Figure 5 displays the measurements taken at 308 nm.
Finally, at least under the medium and high fluences employed, the ablation depth was found to be linear with the delivered number of pulses and the line of such a plot passes through zero.
1361
V. Zafiropulos et al.
3
--i
2 E v
t~
O
.Q <
0 o.1
(a)
120
too t
~176 001 :_~ ~. 8o
~ 60 o ~ "~ c~ 40 < . <
2
0.1
9 o o I
qn
= 5 P
am m �9
l i m i t i l t t t ! �9 �9 �9 0
~ 0 0 0 000 O0 O0
. . . . . . i ' .o . . . . . . . ; o . o
�9 i n
0 O �9 �9
o o o * % o ~ nu~ o o �9
o
o ~ o o 000
. . . . . . . i ' .o . . . . . . . 1'o.o (b) Fluence (J cm -2)
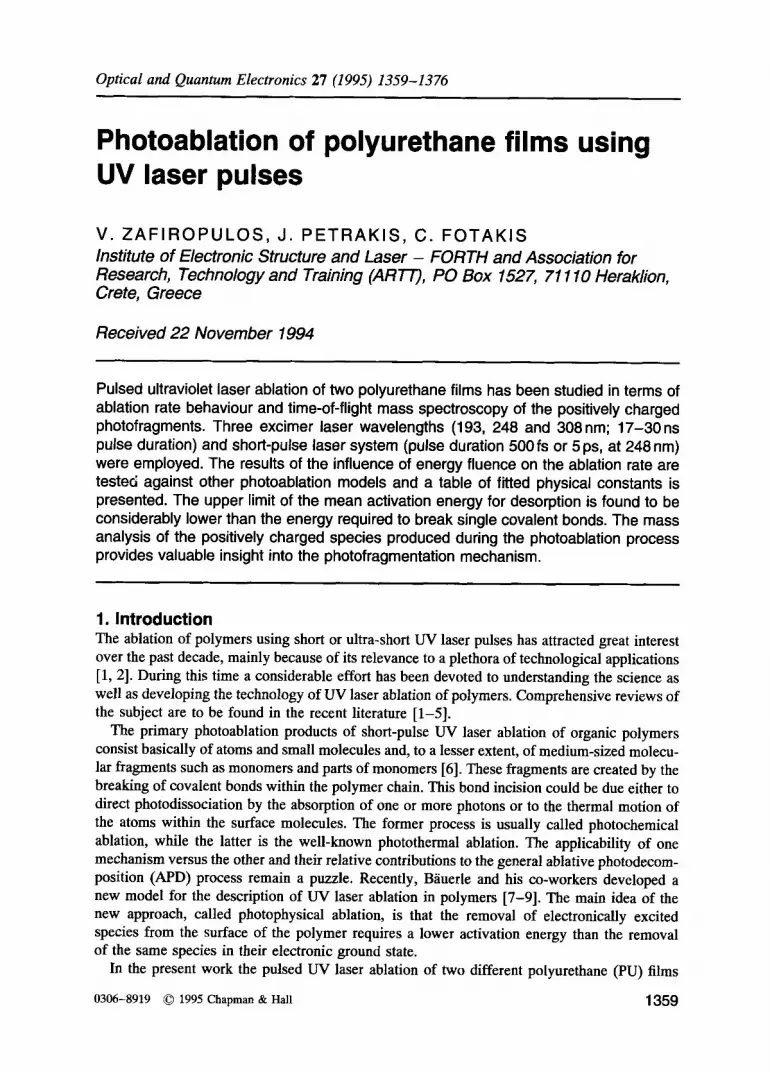
Figure 1 Plots of (a) the ablation rate and (b) the ablation efficiency of TC/PU versus the incident energy fluence for three excimer laser wavelengths (m, 308nm; �9 248 rim; O, 193nm). The uncertainties for the energy measurements, the ablation rate and the ablation efficiency were esti- mated to be <10%, <15% and <25%, respectively.
Owing to the relative roughness of the samples (as explained in Section 2.1), a detailed study of the incubation phenomenon at low fluence was difficult. Generally, the number of incubation pulses was found to be small (typically less than 4) at the lowest fluences used, while this number was zero at medium and high fluences.
3.2. Mass spectroscopic study Two typical TOF mass spectra of the positively charged fragments produced by 308 nm exci- mer laser APD of TC/PU and PAC/PU are shown in Figs 6a and 6b, respectively. Both spectra are recorded under the same conditions of TOF operation, energy fluence (1 J cm-2), focusing ( f = 150 mm) and signal averaging (average of 4 pulses). The low mass resolution in Fig. 6 was due to the pulse-to-pulse instability of the plume, the particular morphology of the samples, and the broad distribution of fragment velocities (single- and multiphoton absorption), thus reducing the resolution of the average spectrum compared to the higher resolution (but lower signal-to-noise ratio) of a single pulse spectrum.
As seen in Fig. 6, the main difference between the two spectra is near absence of positive monomers in (b) compared to their abundant presence in (a). On the other hand, spectrum (b) is richer than (a) in medium-size positive fragments, 24 < m < 160, especially at masses 26, 28, 68 and 73. In both spectra there is no appearance of C + or C,H + clusters except for n = 1-4. The common masses appearing in both mass spectra are 12, 13, 14, 15, 18, 24, 25, 26, 28, 36, 37, 52, 58 and 59. The mass spectrum of TC/PU additionally shows the masses
1362
Photoablation of polyurethane films using UV laser pulses
0.7
~" 0.6 r
0.5 E ,~ 0.4
0.3 t -
O -~ 0.2 "R < 0.1
0 0.1
(a) 40
m o 30"
I1) e'-
g~ . ~ ' ~
r 20- . i O ' ~ < %
Q
, 'o o �9 O O O .,,o j
o
o ~ mmmml m �9
m �9 �9
...... ito , . , , , , , ,
10.0
t~~ "% NIP %
o
o
�9 =lWI i l J l l I l l l
m �9
10 . . . . . . . . . . . . . . . . , 0.1 1.0 10.0
(b) Fluence (J cm -2)
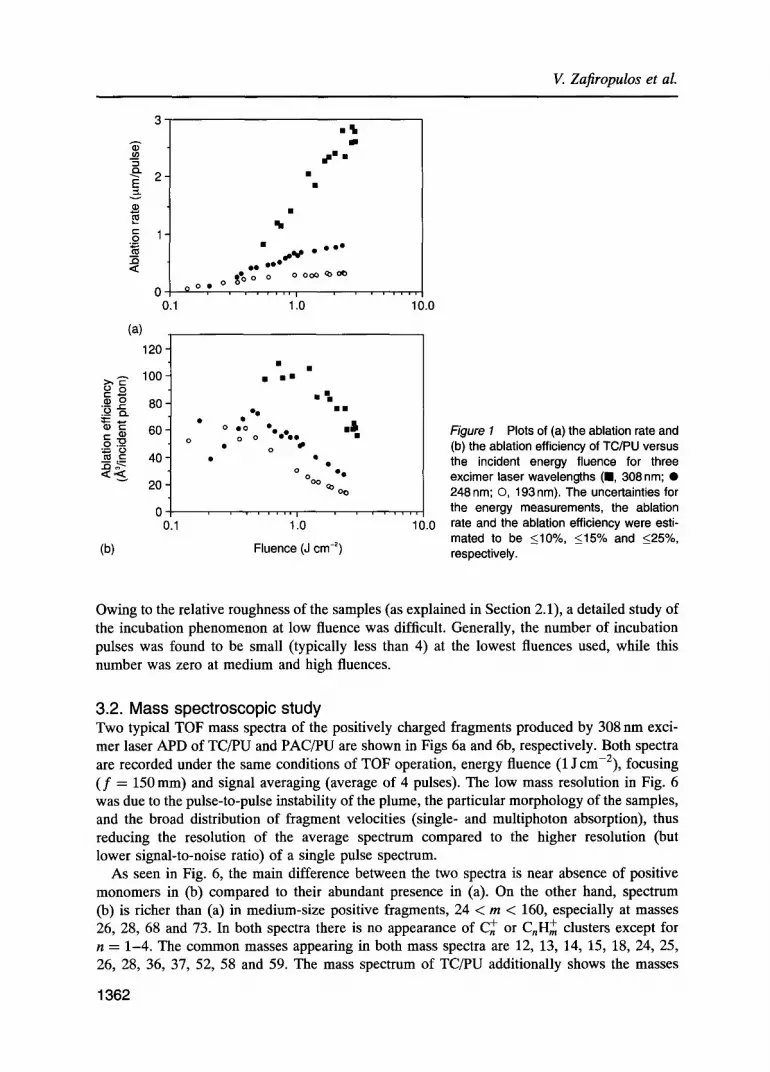
Figure 2 Plots of (a) the ablation rate and (b) the ablation efficiency of PAC/PU versus the incident energy fluence for three excimer laser wavelengths (O, 308nm; O, 248nm; m, 193 nm). The uncertainties for the energy measurements, the ablation rate and the abla- tion efficiency were estimated to be <10%, <15% and <25%, respectively.
21, 42, 44 and 650 (broad distribution), while in the spectrum of PAC/PU some masses between 68 and 160 appear.
4. Discussion 4.1. Genera l Current attempts to understand the nature of UV laser APD have provided considerable input to our present knowledge [6-26]. However, it should be noted that the existing models have mostly been applied to the two popular polymers polyimide (PI) and poly(methyl methacrylate) (PMMA). The main aims of this work are, first, to present results on the photoablation of another type of polymer and, second, to attempt a preliminary evaluation and understanding of these results by applying the simple forms of the existing models. Additional interest arises from the fact that PU has intermediate values of absorption coefficients compared to the two extreme cases of PI and PMMA.
In this section, the experimental curves of ablation rate versus fluence are fitted to the simple interpolation formulae of the photochemical and photophysical/photothermal models. This pro- cedure supplies information on the upper limits of the mean activation energies and the possible APD processes operating. A more comprehensive analysis (e.g. calculation of temperature and velocity profiles, influence of bleaching, sublimation, multiphoton phenomena, etc.) would require knowledge of physical parameters such as relaxation times, energies of electronic states, cross-sections, chromophore concentration, thermal conductivity, specific heat, etc.
1363
V. Zafiropulos et aL
"5
t -
O
(a)
�9 0
.,C} " "
(b)
0.8
0.6-
0.4-
0.2,
0 0.01
80
70
60
50
40
30
20
10 0.01
o @
o
oo
oo ~ cP
o ..: o �9
o o ~ 1 7 6
, ~ ~ �9 0 0
. . . . . . . . I . . . . . . . . !
0.10 1.00 10.00
% o
�9 o �9 �9 o
�9 o o �9 0 0 0
o
o o
.,..P. . . . . . . i . . . . . .
0.10 ' ' 1.00
Fluence (J cm -2)
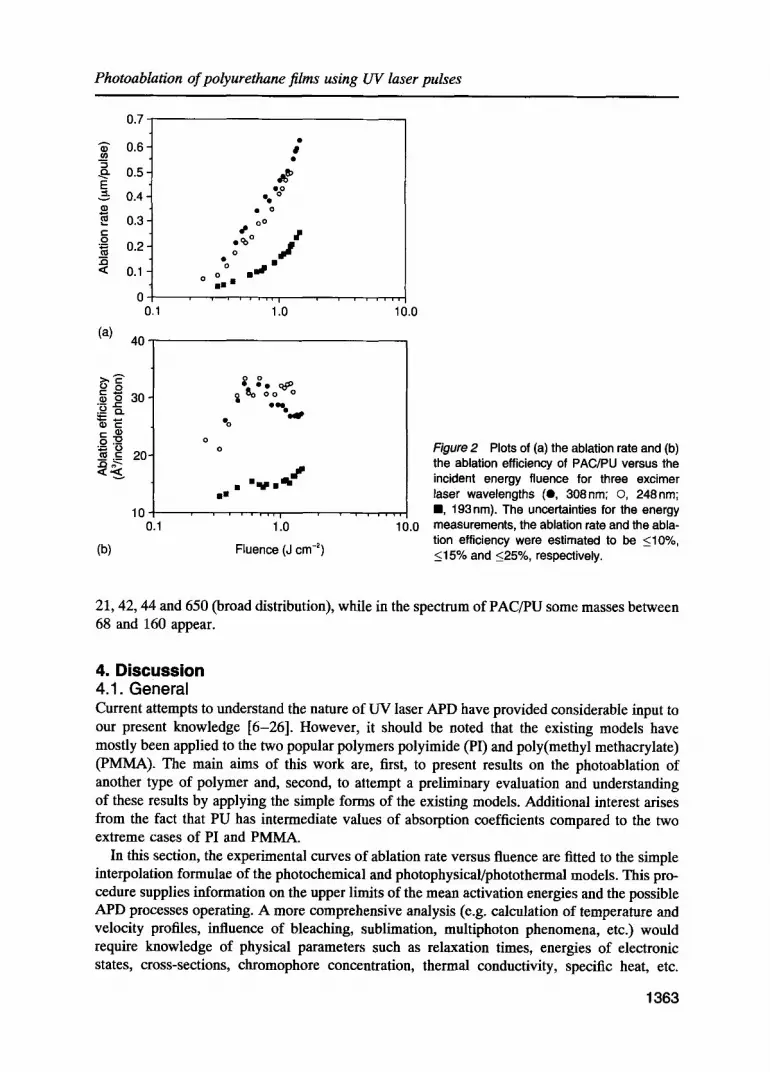
o Figure 3 Plots of (a) the ablation rate and (b) % the ablation efficiency of TC/PU versus the
incident energy fluence for three laser pulse duration values (0, 500fs; II, 5ps; O, 30ns). The uncertainties for the energy measure- , , , , , , . ,
10.00 ments, the ablation rate and the ablation effi- ciency were estimated to be _<10%, _<15% and <_25%, respectively.
Thus, without ignoring the importance of these processes, especially multiphoton absorption [6, 11, 19-22, 27, 28] (incoherent or coherent), we shall proceed in the rest of this section by dividing it into three parts. In the next two subsections the experimental results are viewed in terms of the photochemical and photophysical/photothermal mechanisms, respectively, without entering into an elaborate presentation of these processes. The reader may find details in the given references. Finally, Section 4.4 presents a general discussion of the mass analysis of PU films.
4.2. Photochemical ablation Photochemical ablation is due to direct incision of the covalent bonds within the polymer chain by the absorption of one or more UV photons. In the case of one-photon absorption, Beer's law yields the simple kinetic law
Ah = c ~ 1 ln(~/~Th) (1)
where Ah is the ablation rate (etch depth per pulse), �9 is the energy fluence of the laser pulse (energy per unit area), ~ is the threshold fluence for ablation and aeff is the effective absorption coefficient [13, 16], which has a different value from the absorption coefficient a derived from UV absorption spectrometry. Equation 1 generally holds within a narrow range of low fluences. The Ah-ln ~ linearity of the present results at low fluences can be seen clearly owing to the abscissa's logarithmic scale in Figs la-4a. Least-squares fits of these data to
1364

Photoablation of polyurethane films using UV laser pulses
0.5
--~ 0.4
E :t,. 0.3
= 0.2 0
�9 .~ 0.1 ,<
0 0.1
(a)
40-
e o 30- . ~ t - . _ Q .
, ~ 2 o -
~ . 10-
n I
~n= o~ o~ �9 � 9
0 � 9 1 7 6 �9
o ,.o.~.
. . . . . . . . 1.'0 10.0
�9 o , ~ . ' , , ~ , ~
,- o~~ �9 �9 � 9
0 , , , . . . . . . . . . . . . .
0.1 1'.0 10.0
(b) Fluence (J cm -2)
Figure 4 Plots of (a) the ablation rate and (b) the ablation efficiency of PAC/PU versus the incident energy fluence for three laser pulse duration values (e, 500fs; o, 5ps; B, 30ns). The uncertainties for the energy measure- ments, the ablation rate and the ablation effi- ciency were estimated to be <10%, <15% and <_25%, respectively.
Equation 1 produce values for aef ~ and ~xh tabulated in Table I. Note that the ~bxh values follow the common inequality ~ ( A = 193 nm) < ~Xh()~ = 248 nm) < ~ ( A = 308 nm). Also notice that for ultrashort laser pulses the values of aeff are three to four times the corresponding c~ef f values for nanosecond pulses. This is inevitably due to (i) the increasing
3
v
= 2
t - O
J ~ < 1
2'0 4'0 6'0 8'0 Repetition rate (Hz)
Figure 5 Plot of the ablation rates of TC/PU (e, 1.6J cm -2; o, 1.2 J cm -2) and PAC/PU (In, 3.4Jcm-2; l-I, 1.2Jcm -2) versus the repetition rate of the XeCI excimer laser.
1365

V. Zafiropulos et aL
(a)
(b)
Figure 6 Mass spectra of the positively charged species produced during the APD of (a) TC/PU and (b) PAC/ PU using an XeCI (308nm) excimer laser, �9 = 1 Jcm -2. The mass of 15amu is marked for comparison.
contribution of multiphoton processes to APD on going from 30 ns to 500 fs for laser pulse duration [11, 20] and (ii) the degree of incubation in the irradiated polymer, which affects the final ae~ [11].
For a wide range of fluences, it has been shown [18] that a time-dependent treatment that relates the dynamics of APD to the various experimental parameters is necessary to account for the numerous observations such as wavelength-dependent ablation rates, influence of pulse duration, incubation phenomena, etc. At this point such an elaborate analysis is outside the scope of this presentation, mainly because of our limited knowledge of the physical parameters of the polymers studied here.
Another approach is based on the effects of chromophore saturation and multiphoton absorption. This theoretical treatment [21, 22] accurately describes the observed z2xh-ln (b trends in cases where the above effects predominate over all the other effects occurring in APD. For a single-photon absorption, chromophores in the ground state are promoted to the excited state with an absorption cross-section ~r, and then return to the ground state through either stimulated emission or nonradiative decay. Finally, a simple expression for Ah is obtained [21]:
1 / 1 - exp(-2~rS) "~ ~U~ -- 2cr(S - ST.) + s l n L 1 - e x p ( - 2 ~ S ~ ) ) (2)
where S is the photon fluence (in photons c m 2) and ST. is the threshold photon fluence. Figure 7 presents fits of the Ah-ln S experimental data for PAC/PU for the three excimer wavelengths
1366

o3 ",,4
Ta
b le
I
Fit
para
met
ers
of E
quat
ions
1, 2
and
7
Fitt
ing
equa
tion
Pa
ram
eter
T
C/P
U
PA
C~
U
193
nm
248
nm
308
nm
193
nm
248
nm
308
nm
Fit
base
d on
pho
toph
ysic
al a
blat
ion
(7)
Fit
base
d on
chr
omop
hore
sat
urat
ion
(2)
Fit t'
bas
ed o
n lo
gari
thm
ic l
aw (
1)
B
(mJ
cm -2
) 20
0 ::k
10
423
• 16
81
5 -1
. 60
�9 1
056
-1.1
08
A (
/zm
/pul
se)
0.35
3 5:
0.00
5 0,
968
• 0.
019
3.61
-1. 0
.13
,(I,0
.94
-1. 0
.18
ct0
(#m
-1)
0
0 0
O3.
0-t-
0.9
#91.
n (l
ltl e
ra-2
) _a
_
_ 15
4-1.
7 a
(/zm
I)
-
- 49
.6 •
15.4
a
(era
~)
- -
- (4
.5 :t
: 1.5
) x
10 1
8 a~
n (~
m -Z
) 7.
5-1.
0.5
2.4-
1.0.
2 0.
75:0
.1
12.3
-1.0
.3
10,7
-1. 0
.6 c
11.5
4- 0
.9 d
ff~
(mJc
ra -;
~)
79•
171-
1.9
319-
1.35
20
2:t:
5 81
• 8
~
38=t
=6 a
852
-1. 5
1 1.
83 -1
. 0.1
9 1.
4-1.
0.2
170:
t:21
9.
6 •
2.3
(1,5
•
0.5)
x 1
0 -18
4.
3-1.
0.3
13.7
5:1
.9 c
16.9
-1. 4
.7 d
211-
1.12
64
• ~
57 -1
. 28 a
877
-1. 6
3 3.
40 4
- 0.5
1 1.
84-0
.3
185
• 24
5.
1,1,
-1.0
(4
.2+
1.7
) x
10 -1
9 3.
45:0
.1
222-
1.8
�9 T
hese
val
ues
shou
ld n
ot b
e tr
uste
d si
nce
the
fit
is n
ot s
ucce
ssfu
l (s
ee F
ig.
9a).
The
y ar
e pr
esen
ted
just
for
com
pari
son.
aThi
s ty
pe o
f fi
t is
not
pos
sibl
e.
CT
hese
val
ues
refe
r to
las
er p
ulse
dur
atio
n of
5ps
.
bFor
thi
s ty
pe o
f fi
t on
ly t
he l
ow-f
luen
ce
data
wer
e us
ed.
dThe
se
valu
es r
efer
to
lase
r pu
lse
dura
tion
of
500
fs.
r~
O~ g:
V. Zafiropulos et al.
3 o~
E 2 -
,'- 1 0
..Q < 0
1017 (a)
E t~
v
t - O
. O .<
5
4 ~
3: aS 1 -
0 1017
(b)
7 '
-" 6
0
< x
% 1017
0 j . . . . . . . . I
10 ~8 . . . . . . . 1'01~
. . . . . . . . I . . . . . . . . . . I
10 TM 101~
. . . . . . . I . . . . . . . .
/ . . . . . . . i
10 ~8 10 TM Figure 7
(c) Fluence (photons crn -2)
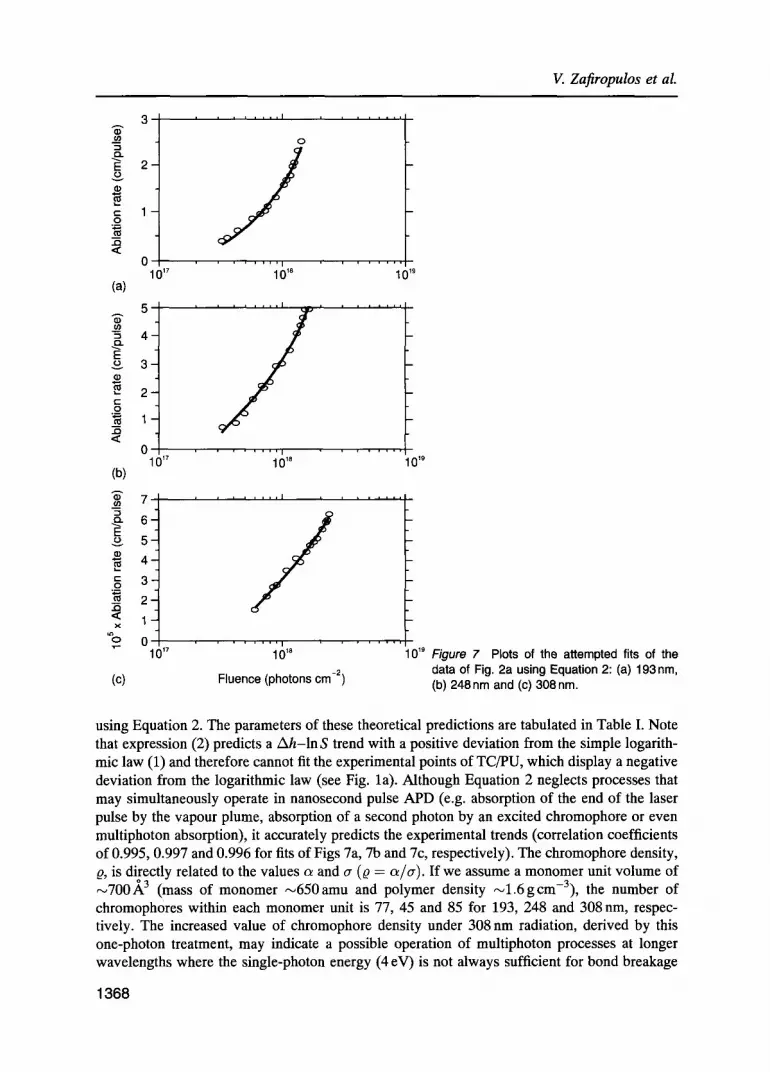
Plots of the attempted fits of the data of Fig. 2a using Equation 2: (a) 193nm, (b) 248 nm and (c) 308 nm.
using Equation 2. The parameters of these theoretical predictions are tabulated in Table I. Note that expression (2) predicts a Ah-ln S trend with a positive deviation from the simple logarith- mic law (1) and therefore cannot fit the experimental points of TC/PU, which display a negative deviation from the logarithmic law (see Fig. la). Although Equation 2 neglects processes that may simultaneously operate in nanosecond pulse APD (e.g. absorption of the end of the laser pulse by the vapour plume, absorption of a second photon by an excited chromophore or even multiphoton absorption), it accurately predicts the experimental trends (correlation coefficients of 0.995, 0.997 and 0.996 for fits of Figs 7a, 7b and 7c, respectively). The chromophore density, Q, is directly related to the values c~ and cr (Q -- c~/cr). If we assume a monomer unit volume of ~700.~ 3 (mass of monomer ,--650amu and polymer density ~ l .6gcm-3) , the number of chromophores within each monomer unit is 77, 45 and 85 for 193, 248 and 308 nm, respec- tively. The increased value of chromophore density under 308 nm radiation, derived by this one-photon treatment, may indicate a possible operation of multiphoton processes at longer wavelengths where the single-photon energy (4 eV) is not always sufficient for bond breakage
1368

Photoablation of polyurethane films using UV laser pulses
[19, 21]. The above numbers of chromophores per monomer seem to be comparable to the number of chromophores found in one monomer of PI (36 chromophores per monomer at 308 nm [21], mass of one PI monomer is 382 ainu).
4.3. Photothermal and photophysical ablation Consider first the photothermal [10, 23, 24] APD mechanism, assumed to be a zero-order kinetic process, where the chemical bonds are broken owing to the thermal motion of the atoms within the molecular chain. The rate of increase of the ablation depth is given by
dh - - = a e x p ( - A E / k T ) (3) dt
where A is the pre-exponential factor, AE is the activation (bond breaking) energy, k is the Boltzmann constant and T is the laser-induced surface temperature. Integration of Equation 3 yields [9] the etch depth per pulse:
Ah ,~ A exp ( - AE / kTmax ) (4)
where Tmax is the maximum laser-induced surface temperature reached and Ah is assumed to be very small (Ah << a-I ) . There is much documentation [4, 7, 9] showing the inadequacy of theoretical APD treatments based on a pure photothermal mechanism.
Recently, the photophysical ablation model was developed [7, 8], based on the assumption that the removal of electronically excited species from the surface of the polymer requires a lower activation energy than the removal of the same species in their electronic ground state. This model has been used to describe the accurate measurements of the ablation rates of P! [10]. It assumes for the desorption of the excited species activation energies AE* about 2-10 times less than AE and rather long thermal relaxation times (radiationless relaxation of triplet states) of ~1 ns. It was shown [9] that with a good approximation Ah can be estimated by
Ah ~ A exp(-AE*/kTmax) (5)
Here, A is a slowly varying function of �9 and can therefore be considered as constant for a small range of fluences.
It is worth commenting on the similarity of Equations 4 and 5. The only difference between these two relations is the activation energy for desorption, AE referring to species in the elec- tronic ground state and AE* to electronically excited species. A serious defect of Equations 4 and 5 when applied to experimental results arises from the fact that AE* (or AE) represents a mean activation energy due to the different types of covalent bonds broken (C-C, C-N, C-O, C-H, etc.). With the approximation Tma x cx ~ (valid for low fluences) Equations 4 and 5 can be written in the form
Ah = A exp( -B/~) (6)
The constant B contains information on the activation energy AE* (or AE) and the relation between �9 and Tmax. For fluences well above ~ , the bleaching effect and natural sublimation lead to a sublinear dependence of Tmax on 4, thus reducing the slope of Equation 6. However, calculations considering these effects [9] produce a change of slope which is not enough to explain the experimental results, at least in the case of PI photoablation [10]. It is expected to hold also for PU since its ce~ff is considerably smaller than the c~eff of PI. Another effect
1369
V. Zafiropulos et aL
0.4
"5 0 . 3 -
~-~ 0.2
g ~ o.1
o o.1
(a)
1
"~ 0 . 8 -
,~ 0 .6-
0.4 t -
O
0.2 J~ <
0 0.1
(b)
3
".'-1
0
< 0
0.1
(c)
i . . . . . . . I i i i i , , , , I
. . . . . . . . I . . . . . . . .
1,0 10.0
i i i . . . . . I i i i i , , , , I
f . . . . . . . . I
1.0 10.0
i i . . . . . . I i i i , , , , , I
i0 . . . . . . . i . . . . . . . lO0
Fluence (J cm -2)
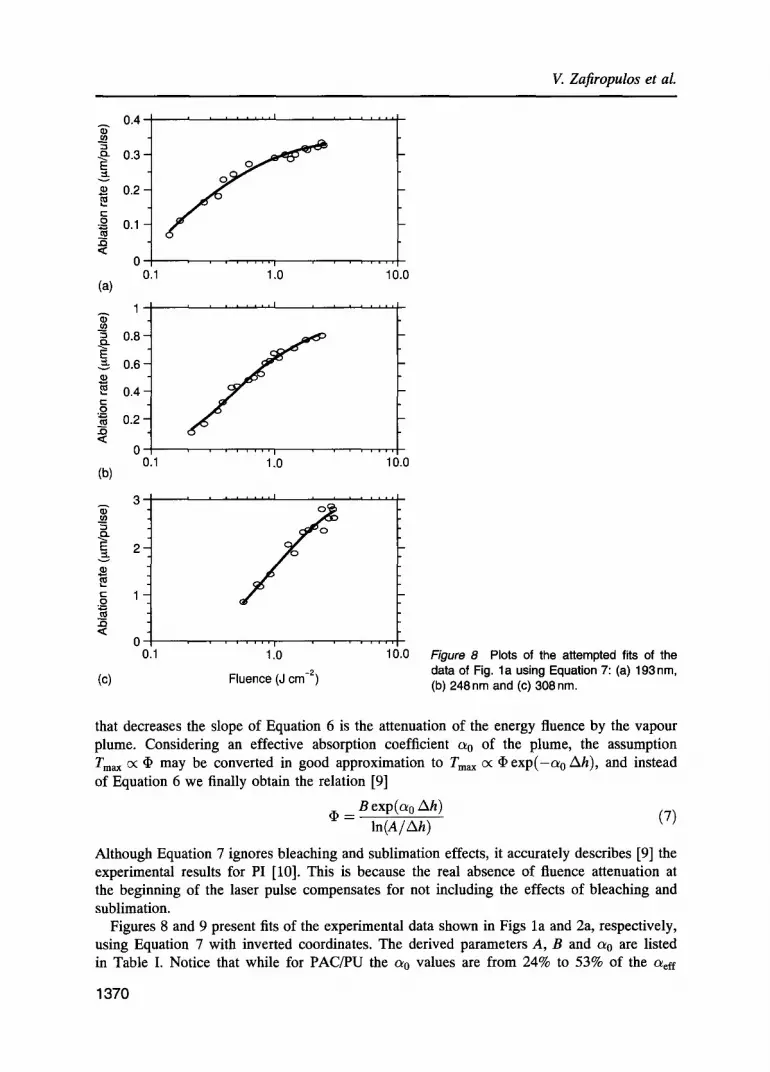
Figure 8 Plots of the attempted fits of the data of Fig. l a using Equation 7: (a) 193nm, (b) 248 nm and (c) 308 nm.
that decreases the slope of Equation 6 is the attenuation of the energy fluence by the vapour plume. Considering an effective absorption coefficient c~ 0 of the plume, the assumption Tma x cx #P may be converted in good approximation to Tmax o< #2 exp(-c~ o Ah), and instead of Equation 6 we finally obtain the relation [9]
#2 - B exp(a0 Ah) (7) ln(A / Ah )
Although Equation 7 ignores bleaching and sublimation effects, it accurately describes [9] the experimental results for PI [10]. This is because the real absence of fluence attenuation at the beginning of the laser pulse compensates for not including the effects of bleaching and sublimation.
Figures 8 and 9 present fits of the experimental data shown in Figs la and 2a, respectively, using Equation 7 with inverted coordinates. The derived parameters A, B and ao are listed in Table I. Notice that while for PAC/PU the a0 values are from 24% to 53% of the a~ff
1370

Photoablation of polyurethane films using UV laser pulses
r
E = L
v
t -
O
(a)
u~ .-i
E =L
v
t - O
,.O
(b)
~n . - i
E
m
r
0
<
(c)
0.3
0.2-
0.1
0 0.1
0.6
0.5- 0.4-
0.3-
0.2
0.1
0 0.1
0.7
0.6-
0.5-
0 .4 -
0 .3 -
0.2 -"
0.1
0 0.1
. . . . . . . . I
f t i , , , , , , I
. . . . . . . i'o . . . . . .
1 I i | . . . . i i i , , , , , , I
0 ~
. . . . . . . . I . . . . . . . .
1.0 10.1
/ . . . . , , = l l
L
. . . . . . . i iO . . . . . . . 1'0.0
Fluence (J cm -2)
Figure 9 Plots of the attempted fits of the data of Fig. 2a using Equation 7: (a) 193nm, (b) 248 nrn and (c) 308 nm.
values, for TC/PU they are found to be very close to zero (<0.05) at all three radiation wavelengths, resulting in an almost transparent vapour plume. Figure 8 demonstrates the quite accurate prediction by Equation 7 of the experimental Ah-ln ~ trends for TC/PU. On the other hand, comparing Figs 7 and 9 it is obvious that for PAC/PU a better prediction is made by Equation 2 (Fig. 7), especially at 193 nm, than by Equation 7. Nevertheless, Equation 7 still predicts the experimental results at 248 and 308 nm quite accurately (Figs 9b and 9c).
An important aspect of these theoretical predictions is the realization that if Equation 6 is used rather than Equation 7 to fit the data of PAC/PU (Fig. 9), the parameter B decreases in all three cases, by 3.7% at 193 nm to a maximum decrease of 19.6% at 308 nm, while the para- meter A increases by a factor of 2 to 4 depending on the wavelength. For TC/PU the value of B does not depend on the expression used (Equation 6 or 7) since (7) reduces to (6) when c~ 0 = 0. Therefore it is safe to estimate the upper limits of the activation energy based on the values of B given in Table I (except for the values marked with the symbol . ) .
1371

V. Zafiropulos et al.
>
0
.>_
e -
ID
E
E
Q .
2'
0 100 260
Wavelength (rim)
Figure 10 Plots of the upper limits of the acti- vation energy versus irradiation wavelength for TC/PU and PAC/PU and of PI for compar- ison. The data for PI are taken from [10]. A value of 1.55J K -1 cm -3 for Cp is used [23]. Case (a): I-I, TC/PU; O, PAC/PU, /k PI. Case (b): O, TC/PU; A, PAC/PU. Case (c): O, PI. cases (a), (b) and (c) are explained in the text.
Consider the final (after the end of the pulse) temperature increase AT of the receding surface in the case where thermal diffusion is slow compared to the etching mechanism. For an energy distribution based on Beer's law absorption and a complete conversion of photon energy into heat, we obtain [23]:
a ~ AT = ~ p exp(-crx) (8)
where Cp is the heat capacity in J K -1 cm -3 and ablation proceeds along the x-axis. For x = 0 and c~ = aeff, Equation 8 yields the upper limit of Tmax, the maximum temperature that the sur- face could reach under ideal photon to thermal conversion and in the absence of thermal diffu- sion and other energy-loss mechanisms (e.g. absorption of photons by the vapour plume):
Cteff ATma x -- (9)
Cp
Note that Tmax = T + ATmax, where T is the ambient temperature. From Equation 9, the upper limit of Tm~x that corresponds to the value of B obtained can be calculated and from it the upper limit of the activation energy is derived and plotted as a function of the radiation wavelength in Fig. 10 (case (a)).
Recently, Kiiper et al. [10] have found that the Tmax that corresponds to each 'I)Th is about the same for all four laser wavelengths used for the ablation of PI films. Assuming a similar beha- viour in PU films, another upper limit of the activation energy can be derived (Fig. 10, case (b)). In this case it is also assumed that (i) for each type of film ATm~x is taken to be the out- come of Equation 9 using C~eff = c~eff (~ = 308 nm) and �9 = ~Th ()~ = 308 nm), that is 1440 K for TC/PU and 4870 K for PAC/PU, and (ii) ATm~x is linear with fluence not only between /b = 0 and �9 = ~Th but also between ,I) = ~Th and 'I~ = B. Since both assumptions overesti- mate ATmax, the resulting values of the activation energies (Fig. 10, case (b)) still remain upper limits, although they are lower than the values of case (a). It is surprising, however, that for each type of PU film the activation energy of case (b) does not depend on the irradiation
1372
Photoablation of polyurethane films using UV laser pulses
wavelength. The upper limits of activation energy for PI are also presented in Fig. 10 (case (a)) for comparison (data taken from [10]). Here instead of case (b) the activation energies are cal- culated based on the actual values of ATmax, B and ~a'h [10] and assumption (ii) and shown in Fig. 10 (case (c)).
Summarizing the above, it becomes clear that the mean activation energy for desorption is considerably lower than the energy required to break single covalent bonds. Particularly in the case of TC/PU at 308 nm, the activation energy is even less than leV. Such a low activation energy (AE* = 0.3 eV) was assumed in the initial photophysical ablation model [7]. This is an indication of the operation of an APD process similar to the photophysical ablation mechanism [7-9]. On the other hand, the upper limits of the activation energy for the ablation of PAC/PU are found to be considerably larger than those of TC/PU (about 1 of the real energy of a cova- lent bond). This is probably due to the overestimation of Tmax by Equation 9 because of the simultaneous operation of photochemical ablative processes. At the same time, the Ah-ln trends of PAC/PU agree with the prediction of Equation 2 better than that of Equation 7, while its mass spectrum is richer in small photofragments than that of TC/PU (see Fig. 6). Finally, note that the Ah-ln gp trends of PAC/PU for different values of pulse duration show similar behaviour (see Fig. 4a). All these indications for PAC/PU may account for a different type of photophysical process closer to the photochemical ablation mechanism, particularly at A = 193 nm (note in Fig. 2b the different ablation efficiency behaviour at this wavelength). Nevertheless, it is evident that not only the irradiation wavelength but also the exact chemical composition governs the nature of the pulsed UV laser ablation processes.
4.4. Mass analysis There have been extensive studies on the composition of photoablation products from a number of polymers [6, 27-35]. One of the most important findings was an intense carbon duster source originated by excimer laser ablation of PI [29-31]. In these studies it was found that the neutral and positive ion spectra are fairly similar [29, 30], with most of the differences being due to photofragmentation of species by the second ionizing laser. There is evidence [6, 29, 32] that the small photofragrnents and ions produced during APD are formed directly at the polymer surface by the laser pulse. It should be noted, however, that the ion production is quantitatively a minor process (<0.01% of the total ablation products [34]). Nevertheless, the spectrum of the ions reflects quite well the composition of the products. An analysis of the neutral fragments of PU photoablation is under way using postionization techniques.
Polyurethane (PU) is a widely used polymer considered to be either block polymer or co- polymer. The essential ingredients of PU are a diisocyanate and a diol or polyol. The diisocyan- ate most commonly used is 2,4-diisocyano-l-methylbenzene of molecular weight (MW) 174. The films studied here consist of a longer diisocyanate (MW = 500), while the polyol is either an epoxy resin (MW 50 000) having one hydroxyl per monomer unit (except for the two end monomers) or two mixed polyester resins (MW = 30 000 and 15 000) that are formed by partial esterification of the secondary hydroxyls. The former and latter cases correspond to PAC/PU and TC/PU, respectively. The isocyano groups react with the hydroxyl end groups to form initi- ally an addition polymer which has polycarbamate (polyurethane) links:
(polymer)-OH + O = C = N - R - N = C = O ~ ( p o l y m e r ) - O - C O - N H - R - N = C = O
--~ (polymer) -O- [ - C O - N H - R - N H - C O - O - (polymer) -O-] - , (10)
A foam is formed by addition of a small amount of water. The water reacts with the isocyanate
1373
V. Zafiropulos et aL
groups left intact, to form carbamic acids which decarboxylate to give amine groups [36]:
R - N - - C = O + H20 ~ R - N H - C O - O H
R - N H 2 + CO2(foaming agent) (11)
The amino groups further react with the residual isocyano end groups to form urea linkages:
R - N = C - - O + R'-NH2 --, R - N H - C O - N H - R ' (12)
Bearing in mind the above composition and processes, the common masses appearing in Figs 6a and 6b are attributable to C +, CH +, CH +, CH~-, NH +, H2 O+, C +, C2 H+, C2 H+, CN +, CO +, C~-, C3 H+, C4H4 +, NHCONH +, COOCH + and HNCOO +. Fragments such as C~-, C3 H+ and C4 H+ come from the breakage of the aromatic rings which are included in the symbol R in the chemical equations above. The additional peaks of Fig. 6a at masses 44, 42 and 21 must be due to CO +, O= C = N + and O = C = N 2+. The first appears only in the mass spectrum of TC/PU because of the plethora of COO groups in polyesters, while this group is absent in epoxy resins (PAC/PU). The isocyano groups (singly and doubly positively charged) appearing only in Fig. 6a are due to the partial esterification (up to the point where the polyester is not so cross-linked as to be insoluble) of the secondary hydroxyl groups during the production of polyester. This results in a partial termination of reaction (10) since the - O H groups are lim- ited. Therefore it is expected that in TC/PU a substantial number of isocyano groups would finally survive in contrast to PAC/PU, where there are practically no isocyano groups left.
The main difference between the TC/PU and the PAC/PU mass spectrum is the near absence of monomer units in the latter. In such a complex polymer as TC/PU, composed of two differ- ent polyester resins with an unknown degree of esterification and cross-linked in different ways by diisocyanate molecules, it is difficult to define a monomer unit. However, it is expected that one type of monomer would consist of a diisocyanate molecule attached (through a urethane link) to a part of the polyester molecular chain. Since the mass spectrum of TC/PU (Fig. 6a) shows a distribution of masses centred at 650 amu, it is presumed that this is the distribution around the main monomer unit. Similar distributions have been observed for the neutral photo- fragments of KrF excimer laser ablation from the polymers PMMA and polystyrene [35].
There are a few possible explanations for the absence of monomer units from the mass spec- trum of PAC/PU. One of them may be the rigid cross-linked structure of PAC/PU, as described above, which does not allow the clear appearance of any distinct monomer entity (notice the lower masses between 68 and 160, instead). This is probably the main reason for the different behaviour of this film in terms of ablation rate versus fluence. Another explanation may be the possible fragmentation of the existing monomers (in the vapour plume) by the end of the laser pulse. The nonzero values of a 0 (see Table I) tend to support this interpretation. Finally, the mono- mers appearing in Fig. 6a may come from the sublimation of positive monomers from the surface of TC/PU, possibly due to a higher temperature developed compared to PAC/PU. The increase of Ah at high repetition rates for TC/PU (see Fig. 5) supports this supposition.
At this point any further correlation between mass spectra (in vacuum) and ablation rate results (in air) may prove to be irrelevant since the ambient gas effects [33] should also be con- sidered. Additional investigations on this subject are planned.
5. Conclusion The pulsed ultraviolet laser ablation of two polyurethane films has been studied in terms of ablation rate behaviour and time-of-flight mass spectroscopy of the positively charged
1374

Photoablation of polyurethane films using UV laser pulses
photofragments. Three excimer laser wavelengths (193, 248 and 308 nm, 17-30 ns pulse dura- tion) and a short-pulse laser system (pulse duration of 500 fs or 5 ps, at 248 nm) have been employed in this study. The results of the influence of energy fluence on the ablation rate were tested against different existing photoablation models and a table of physical constants used was presented. The upper limit of the mean activation energy for desorption has been found to be considerably lower (~3 to 15 times) than the average energy required to break sin- gle covalent bonds, indicating the importance of photophysical types of processes [7-9]. In at least one case (PAC/PU at 193 nm) it was found that photochemical processes predominate in the operative APD mechanism. Coherent and incoherent multiphoton absorption must contribute significantly to the ablation in the case of femtosecond and picosecond UV laser pulses. A more extensive analysis of the ultrashort laser pulse results is currently under way.
The mass analysis of the positively charged species produced during the photoablation process has provided valuable insight into the photofragmentation mechanism, although high-resolution mass analysis of the neutral fragments at different irradiation wavelengths, pulse durations and energy fluences is necessary to pinpoint the underlying details of the APD process. Such a study is in progress.
Acknowledgements We acknowledge support through the BRITE/EURAM program (BRE2-0151, BE-5107). We thank the Ultraviolet Laser Facility at FORTH for its generous technical support. We also thank Gilles Navarre from Dassault Aviation for his valuable information on PU films, Aleka Manoussaki for technical support, and R. Eason for fruitful discussions.
References 1. J. C. MILLER (ed.), Laser Ablation - Principles and Applications, Springer Series in Materials Science 28
(Springer-Vedag, Berlin, 1994). 2. E. FOGARASSY and S. LAZARE (eds.), Laser Ablation of Electronic Materials - Basic Mechanisms and
Applications, Proc. European Materials Research Society Monographs 4 (North-Holland Elsevier, Amsterdam, 1992).
3. P. E. DYER, Photochemical Processing of Electronic Materials (Academic Press, London, 1992). 4. R. SRINIVASAN and B. BRAREN, Chem. Rev. 89 (1989) 1303. 5. J. T. C. YEH, J. Vac. Sci. Technol. A 4 (1986) 653. 6. R. SRINIVASAN, Appl. Phys. A 56 (1993) 417. 7. B. LUK'YANCHUK, N. BITYURIN, S. ANISIMOV and D. B,~UERLE, Appl. Phys. A 57 (1993) 367. 8. B. LUK'YANCHUK, N. BITYURIN, S. ANISIMOV and D. B.~UERLE, Appl. Phys. A 57 (1993) 449. 9. B. LUK'YANCHUK, N. BITYURIN, S. ANISIMOV and D. B.~UERLE, Excimer LAsers, edited by L. D. Laude, NATO
ASI Series E: Applied Sciences 265 (Kluwer Academic Publishers, Dordrecht, 1994) p. 59. 10. S. KOPER, J. BRANNON and K. BRANNON, Appl. Phys. A 56 (1993) 43. 11. S. KOPER and M. STUKE, Appl. Phys. B 44 (1987) 199. 12. B. J. GARRISON and R. SRINIVASAN, Appl. Phys. Left 44 (1984) 849. 13. H. H. JELLINEK and R. SRINIVASAN, J. Phys. Chem. 88 (1984) 3048. 14. G. GORODETSKY, T. G. KAZYAKA, R. L MELCHER and R. SRINIVASAN, Appl. Phys. Lett. 46 (1985) 828. 15. V. SRINIVASAN, M. A. SMRTIC and S. V. BABU, J. Appl. Phys. 59 (1986) 3861. 16. R. SRINIVASAN, B. BRAREN, R. W. DREYFUS, L. HADEL and D. E. SEEGER, J. Opt. Soc. Am. B 3 (1986) 785. 17. H. S. COLE, Y. S. LIU and H. R. PHILIPP, Appl. Phys. Lett. 48 (1986) 76. 18. E. SUTCLIFFE and R. SRINlVASAN, Jr. Appl. Phys. 60 (1986) 3315. 19. R. SRINIVASAN, B. BRAREN and R. W. DREYFUS, J. Appl. Phys. 61 (1987) 372. 20. S. KUPER and M. STUKE, Appl. Phys. Lett. 54 (1989) 4. 21. G. n. PETI1T and R. SAUERBREY, Appl. Phys. A 56 (1993) 51. 22. G. H. PETI'IT, M. N. EDIGER, D. W. HAHN, B. E. BRINSON and R. SAUERBREY, Appl. Phys. A 58 (1994) 573.
1375

V. Zafiropulos et aL
23. S. R. CAIN, F. C. BURNS and C. E. OTIS, J. Appl. Phys. 71 (1992) 4107. 24. S. R. CAIN, F. C. BURNS, C. E. OTIS and B. BRAREN, J. Appl. Phys. 72 (1992) 5172. 25. P. E. DYER and R. SRINIVASAN, Appl. Phys. Lett. 48 (1986) 445. 26. T. KEYES, R. H. CLARKE and J. M. ISNER, J. Phys. Chem. 89 (1985) 4194. 27. R. SRINIVASAN, J. Appl. Phys. 73 (1993) 2743. 28. R. SRINIVASAN, B. BRAREN, D. E. SEEGER and R. W. DREYFUS, Macromolecules 19 (1986) 916. 29. G. ULMER, B. HASSELBERGER, H.-G. BUSMANN and E. E. B. CAMPBELL, Appl. Surf. Sci. 46 (1990) 272. 30. E. E. B. CAMPBELL, G. ULMER, B. HASSELBERGER, H.-G. BUSMANN and I. V. HERTEL, J. Chem. Phys. 93 (1990)
6900.
31. J. T. BRENNA, W. R. CRESY and W. VOLKSEN, Chem. Phys. Lett. 163 (1989) 499. 32. P. L. G. VENTZEK, R. M. GILGENBACH, C. H. CHING and R. A. LINDLEY, J. Appl. Phys. 72 (1992) 1696. 33. T. SUMIYOSHI, Y. NINOMIYA, H. OGASAWARA, M. OBARA and H. TANAKA, Appl. Phys. A 58 (1994) 475. 34. E. E. B. CAMPBELL, G. ULMER, B. HASSELBERGER and I. V. HERTEL, AppL Surf. Sci. 43 (1989) 346. 35. R. LARCIPRETE and M. STUKE, Appl. Phys. B 42 (1987) 181. 36. J. D. ROBERTS and M. C. CASERIO, Basic Principles of Organic Chemistry (W. A. Benjamin, Menlo Park, 1977).
1376