pharmaceutical process development applying automated laboratory reactors
TRANSCRIPT
Pharmaceutical process development applying automated laboratory reactors Tibor Chován,a Imre Markovits,b Béla Farkas,b Kálmán Nagy,b Lajos Nagy,a Károly Nyíri,b Ferenc Szeifert,a aUniversity of Veszprém, POB 158, Veszprém, H-8200, Hungary bEGIS Pharmaceuticals Ltd., Keresztúri út 30-38., H-1106, Hungary
Abstract Application of automated laboratory reactor systems and suitable model-based approaches can speed up significantly the process development of active pharmaceutical ingredients. The paper presents the design and functions of such a reactor system including the recipe-oriented control solutions. The system performance was enhanced by implementing a model-based algorithm for estimating the process heat flow and therefore allowing the application of reaction calorimetric approaches. The application is demonstrated on two pharmaceutical process development problems. In the first, the calorimetric function was used for safety risk evaluation of a chemical reduction step. In the second, optimal process parameters of a crystallization step were determined. These examples underline that pharmaceutical and fine chemical industries can benefit from the application automated reactors and appropriate model-based methods. Keywords: reaction calorimetry, process development, crystallization, risk evaluation, pharmaceutical industry.
1. Introduction Majority of pharmaceutical and fine chemical processes are accomplished in batch or fed-batch operations. Process development generally means scaling up the batch process in a few steps. The cost and time of the development can be significantly reduced by applying efficient and reliable laboratory and pilot systems. These requirements can only be achieved by well instrumented and accurately controlled, still flexible systems. The information gathered by these systems at different scales can provide a sound basis for the later application of simulation-based approaches which opens lots of new possibilities in process development. The typical unit of pharmaceutical and fine chemical processes is an autoclave with a stirrer, a heating-cooling jacket, feeding systems and a condensator with collectors. This unit inherently has reasonable flexibility since it can execute lots of different operations (like thermal operations, reactions, crystallization, extraction, distillation, etc.). This study presents a laboratory scale solution and its application. Main objectives of the use of laboratory scale equipments are to collect kinetic information of the processes taking place, to optimize the laboratory procedures experimentally and to provide efficient recipes for the further development steps.
2. Automated laboratory reactor systems At laboratory scale the main tool is the automated laboratory reactor system (ALRS) which allows conducting well defined and reproducible experiments, optimizing the process experimentally and, with suitable analytics, determining kinetic information.
and 9th International Symposium on Process Systems EngineeringW. Marquardt, C. Pantelides (Editors) © 2006 Published by Elsevier B.V.
16th European Symposium on Computer Aided Process Engineering
1089
Besides fulfilling the above requirements, the ALRS developed here is prepared to execute the same process operations as those of the pilot and plant scale, particularly:
• reactions: different reactions under predefined conditions, • heating and cooling operations: to given temperature or following a time program, • feeding: one or more components at given flow rates, • boiling operations: reflux and distillation, • crystallization: different methods (cooling, evaporation, dilution), • extraction: component removal (mixing and feeding).
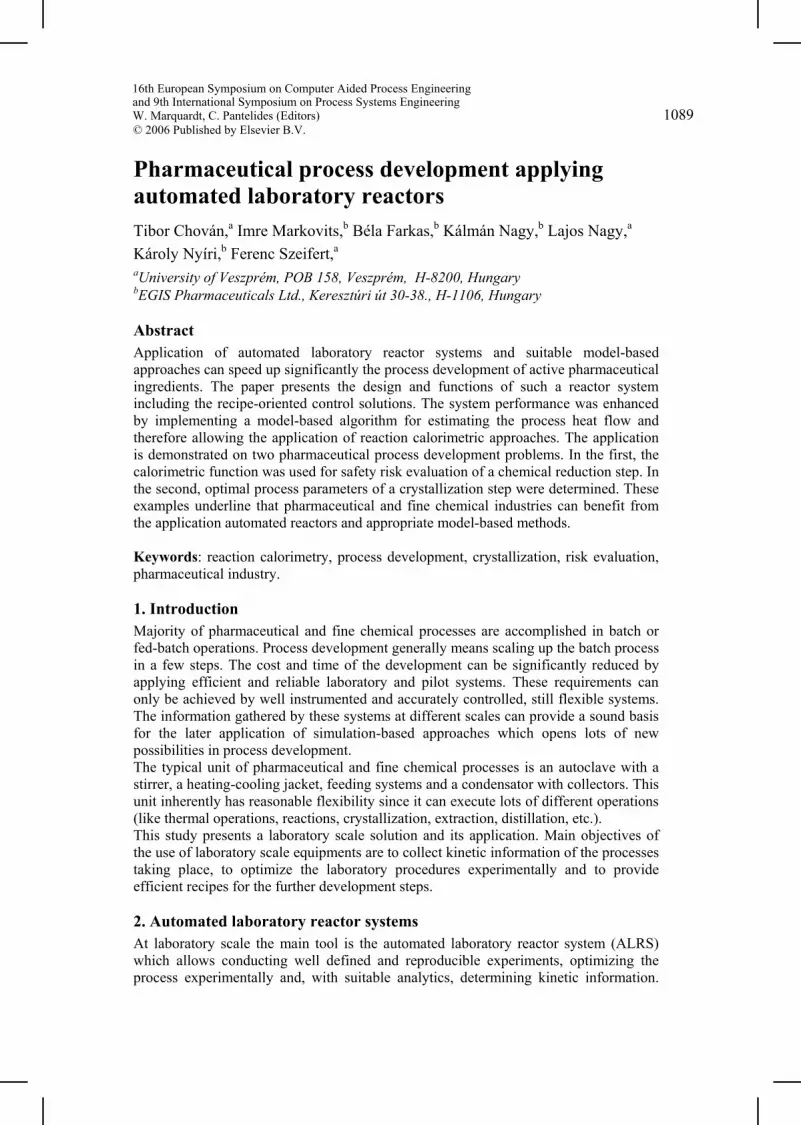
2.1. The design and control of the reactor system The system was designed with a modular structure assuring that new equipments and instrumentation can be easily implemented. The structure of the reactor system is given in Fig. 1 in form of an overview screen. The precise and reproducible experimental procedures are assured by an extensive instrumentation and a PC-based control subsystem. This subsystem can also be implemented on existing, manually operated laboratory reactors. The main features of the control system are:
• collection of all measured and calculated data as well as process events, • export of collected data for later evaluation, • control of experimental procedures based on recipes (separate recipe editor), • control of independent instrumentation (pumps, stirrer, thermostat, etc.), • precise reactor temperature control by model-based algorithm, • several operator screens for monitoring and control of the experiments.
Figure 1. Overview screen of the reactor system
2.2. Reaction calorimetry Reaction calorimetry provides a very general method to evaluate the heat effects of different processes taking place in the reactor and to follow the general progress of processing steps. Special laboratory instruments, the so called reaction calorimeters, allow precise measurements of heat effects, however their implementation and operation is quite expensive. In many cases a well designed and instrumented reactor system complemented with suitable evaluation software can provide adequate information for the analysis of the heat effects [1]. Calorimetric functions of the automated laboratory reactor system can be derived from the following heat and component balances of the reactor:
T. Chován et al.1090

QTTFTTTF
TTcFTTcFdt
dTcm
ev
inpinpp
+−−−++
+−+−=
)()()2
(
)()(
1132
12,211,11
αα
21 FFdtdm += , the initial conditions are 00,11 ,,0 mmTTt === . (1)
The first two terms r.h.s. of the unsteady-state heat balance are the heat flows carried by the two feeds, the 3rd is the heat transfer between the jacket and the reactor, the 4th is the heat loss, while the 5th is the gross heat flow corresponding to the processes (e.g. reactions, crystallization, etc.) taking place in the reactor. The calorimeter function involves determining the heat flow, )(tQ . First the model parameters ( vp FFc )(,, αα ) are estimated by evaluating data collected in some experiments. Then the )(tQ heat flow can be calculated on-line based on the measurements of 21, FF (or maybe m ) as well as the (accurate) measurements of temperatures involved in the model. Based on the measured and estimated variables of the model, )(tQ can be calculated applying different methods. Difficulties might emerge calculating the differential term, dtdT /1 from measured data. To avoid this problem, a technique based on an inverse formation was elaborated to estimate the )(tQ heat flow. This calculation was available in the model-based control algorithm of reactor temperature almost as a “side product”, therefore in spite of its apparent complexity it can be employed at low “cost”.
State feedback compensator
Model Eq. (1)
Q
T1
T1 T1,m
measured variables
estimated parameters
Figure 2. Scheme for on-line calculation of the heat flow rate
The inverting was solved using the method known from the Globally Linearizing Control (GLC) [2] as shown in Fig. 2. Since the relative order of the nonlinear model, Eq. (1) is one, the following linear model can be defined between the temperature described by the model and the measured reactor temperature ( mT ,1 ):
mTTdt
dT,11
1 =+τ , (2)
where τ is the first order time constant of the filtered inverse. By substituting dtdT /1 expressed from Eq. (1) into Eq. (2), then rearranging the relationship to obtain )(tQ , the following “state feedback compensator” is obtained:
Pharmaceutical Process Development Applying Automated Laboratory Reactors 1091
+−+−−−= )()([)()( 12,211,11,1 TTcFTTcFTTcm
tQ inpinpmp
τ
])()()2
( 1132
ev TTFTTTF −−−++ αα (3)
This way Eq. (3) provides the process heat flow, )(tQ . Modifying parameter τ , the errors caused by the measurement noise can be appropriately reduced. The accuracy of the method was tested by a standard heat flow generated by an electric heater.
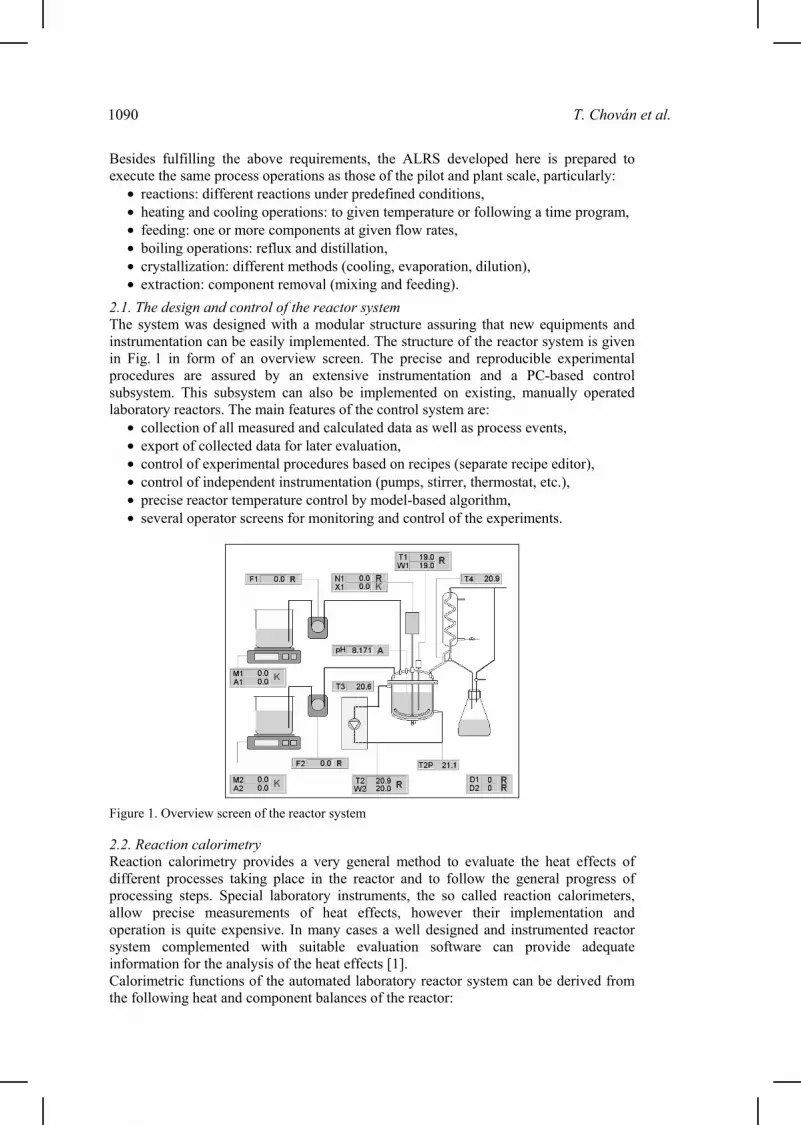
3. Industrial application of ALRS The following two application examples are taken from real-life process development problems of EGIS Pharmaceuticals Ltd. These examples are aimed at demonstrating the broad range of possible applications and the benefits expected. 3.1. Study of a reduction step of a pharmaceutical intermediate 3.1.1. Safety risk evaluation of reaction Safety risk evaluation is an important issue before scaling-up the process. The questions of interest are the rate of the heat evolution and whether it carries any risk regarding the scale-up. The observed temperature profile and the heat flow curve of the examined reaction (a reduction of a carbon-carbon double bond with sodium borohydride using cobalt containing catalyst) can be seen in Fig. 3. The three peaks correspond to the three heat evolving steps: preparation, reaction, and cleavage. The main observations are: The heat flow curve shows sensitively the exothermic reaction steps. The reaction heat for each peak ( cleavreactprep QQQ ,, ) can be calculated and their ratio is 30:20:1:: =cleavreactprep QQQ . During the cleavage the prompt heat evolution is able to warm up the reaction mixture by 15°C. In the worst case, if all heat is released at the same time, this is still not enough to make the reaction mixture boil. Therefore the conclusion is that there is only a minor safety risk. On the other hand, it is proved, that ALRS is useful to get a quick, still sufficiently accurate estimation on the safety risk, enabling to speed up the process development. 3.1.2. Heat flow curve and the conversion The objective was to reveal whether the heat flow analysis can reliably indicate the reaction rate. Integrating the heat flow curve of the reduction allows the estimation of the conversion. For comparison, a periodic sampling and a subsequent off-line analysis by high-pressure liquid chromatography (HPLC) was performed to determine conversion.
020406080
100120
0 50 100 150 200 250 300 350 400Time [min]
Hea
t flo
w [W
]
051015202530
Tem
pera
ture
[°C
]
Treactor
Heat flow
1 2 3
Step of reduction 1: Preparation: addition of the catalyst to the reaction mixture
2: Addition of reducing agent and reduction, 3: Cleavage by acetone
Figure 3. Reaction temperature and heat flow during the reduction step
T. Chován et al.1092

0
20
40
60
80
100
0 90 180 270 360Time [min]
Con
vers
ion
[%]
HPLC
Heat flow analysis
Figure 4. Comparison of conversion values determined by heat flow calculation and by HPLC
It can be concluded that the agreement between the two methods is reasonably good at the end of the reaction; therefore the heat flow measurement can serve as an online analytic tool determining the end of reaction as shown on Fig. 4. 3.2. Crystallization process development of an active pharmaceutical ingredient (API) In the second example the optimization of a crystallization step of an API was aimed at. The objective was to determine the parameters or parameter sets which have significant influence on the particle size distribution (PSD) of the crystalline product. Two crystallization techniques were examined: crystallization by cooling and by dilution. 3.2.1. Cooling crystallization A typical crystallization heat flow curve is shown on Fig. 5. The single peak refers to the crystallization, and features of the peak convey important information for the process development. The start of the peak indicates the start of crystallization; this feature made it possible to determine the width of the metastable zone and revealed the effect of stirrer speed. The metastable zone turned out to be quite broad supporting the application of seeding. The effect of stirrer speed during crystallization is rather interesting. The application of high stirrer speed caused a slight decrease in the median crystal size of the API. The plausible explanation is the attrition effect of the stirrer, but this was not justified by the experiments. Instead, the heat flow analysis revealed that in this case the crystallization started at higher temperature, which means, that the stirrer speed has larger effect on the crystal nucleation than on crystal growth. For the comparison of PSD of the API produced by different methods the median crystal size was used. The particle size distribution obtained and the experimental conditions are presented on Fig. 6 and 7.
-10
-5
0
5
10
0 20 40 60 80 100 120Time [min]
Hea
t flo
w [W
]
0
20
40
60
80
100
Tem
pera
ture
[°C
]Treactor
Heat flow
Figure 5. Heat flow curve of the 3rd crystallization experiment
Pharmaceutical Process Development Applying Automated Laboratory Reactors 1093

35 4254 57 65 65
81 83 8494
108
020406080
100120
1. 2. 3. 4. 5. 6. 7. 8. 9. 10. 11.Number of experiment
Med
ian
crys
tal s
ize
[μm
]
Figure 6. Particle size distribution of API vs. No. of experiment
The experiments showed, that large crystals were produced by seeding at a temperature as high as possible, cooling with a low cooling rate (cooling rate C) and applying the suspension reheating-cooling method (D, E), on the other hand small crystals formation is favored using very fast cooling rate (A) and high stirrer speed.
No. Cooling profile
nstirrer [min-1]
Tseeding [°C]
1 A 150 - 2 B 450 - 3 B 150 - 4 B 300 - 5 B 150 60 6 A 150 - 7 C 150 - 8 B 150 65 9 E 150 -
10 D 150 - 20
30
40
50
60
70
80
0 100 200 300 400Time [min]
Tem
pera
ture
[°C
]
A
E
B
D
C
11 B 150 75
Figure 7. Experimental conditions
3.2.2. Crystallization by antisolvent addition (dilution) The particle size distribution was studied during the crystallization of the API by antisolvent addition. The parameters to alter were the feeding rate of the antisolvent, the intensity of mixing, the temperature of antisolvent addition, the combined cooling and salting-out method. It was found that the most sensitive parameter on PSD is the feeding rate of the antisolvent, which is inversely proportional to PSD. The median crystal size was between 25-75 μm varying the parameters of crystallization.
4. Conclusions The automated laboratory reactor system presented in the paper provides great flexibility in process development through its modular design and advanced control solutions. The algorithm implemented to estimate the process heat effects allows the application of reaction calorimetric approaches. The two real-life application examples, one from chemical and one from the physico-chemical development, illustrate well how ALRS can be used in the pharmaceutical process development, and justify that it is an essential tool for speeding up this type R&D activity.
References [1] R.N. Landau, 1996, Thermochimica Acta, 289, 101. [2] J. Madar, J. Abonyi, F. Szeifert, 2005, Artificial Intelligence, 18, 341.
T. Chován et al.1094