american pharmaceutical - cphi.com
TRANSCRIPT

American Pharmaceutical
The Review of American Pharmaceutical Business & Technology
Volume 23 Issue 5 | July/August 2020
Microbiological Attributes, Speci� cations, and Risk
Assessment of Culture-Based � erapeutic Products
Quantitative NMR in Biotherapeutic Drug Development
Modeling the E� ects of Supply Chain and Operator Disruptions on Cell � erapy Manufacturing Facility
Operations During the COVID-19 Pandemic
Microbiology Roundtable
www.americanpharmaceuticalreview.com
Volume 23 Issue 5 | July/August 2020
SHOW ISSUE:
15th Annual PDA Global Conference on Pharmaceutical Microbiology - Virtual

SimplifyingProgress
Biomanufacturing has to innovate.To ultimately make new therapeutics more affordable for patients.
Sartorius is part of the solution.With technologies to accelerate process development and to manufacture biologics more efficiently.
sartorius.com/simplifying-progress

CONTRACT MANUFACTURING
Biologics | Aseptic Fill Finish | Drug Product | Potent Hot Melt Extrusion | Fermentation | ADCs | APIs
abbviecontractmfg.com
Experience Unrivaled
Aseptic Fill FinishEnable your product to commercial success by leveraging our pharmaceutical and CMO expertise.

Editorial
EDITOR-IN-CHIEF | Mike Auerbach
WEB CONTENT EDITOR | Andrea Lyn Van Benschoten
Sales
NATIONAL SALES MANAGER | Laura Zoibi Rice
ProductionART DIRECTOR | Jennifer Campbell
[email protected] MANAGER | Allison Chelminiak
CorporateCEO | Paul Gatti
GROUP PUBLISHER | Laura Zoibi Rice
ACCOUNT COORDINATOR | Dorothy Fuentes
American Pharmaceutical Review
Published by
CompareNetworks, Inc.
395 Oyster Point Blvd. #300
South San Francisco, CA 94080
www.comparenetworks.com
E-mail: [email protected]
Website: www.americanpharmaceuticalreview.com
Printed in the USA
American Pharmaceutical Review (ISSN 1099-8012) is published
seven times a year (February, March, April, June, August,
October, December) by CompareNetworks, Inc.
395 Oyster Point Blvd. #300 South San Francisco, CA 94080.
Subscription Rate (7 issues) 1 year $135.00.
Periodicals postage paid at South San Francisco, CA 94080 and
additional mailing offi ces.
POSTMASTER: Send change of addresses to
American Pharmaceutical Review, 395 Oyster Point Blvd. #300,
South San Francisco, CA 94080.
Publication Agreement #40739004.
Return undeliverable Canadian addresses to:
IMEX, PO Box 25542, London, ON N6C 6B2, Canada,
Email: [email protected]
Copyright rests with the publishers.
All rights reserved ©2020
CompareNetworks, Inc.
No part of this publication may be reproduced, stored in a retrieval
system or transmitted in any form or by any means electronic,
mechanical, photocopying, recording or otherwise without the prior
written permission of the copyright holder. While the publishers
believe that all information contained in this publication was correct
at the time of going to press, they can accept no liability for any
inaccuracies that may appear or loss suff ered directly or indirectly by
any reader as a result of any advertisement, editorial, photographs or
other material published in American Pharmaceutical Review.
2 | | July/August 2020
E-S
can
Mic
ro
Current HVLD
Au
tom
ated
In
line Solutions
PTI - Packaging Technologies and Inspection
914.337.2005 | www.ptiusa.com | Hawthorne, New York
Global Leaders of Container Closure
Integrity Test Equipment
COMPLETE CCI SOLUTIONS PROVIDER FOR NEW VACCINES
• CCI test equipment – offline and automated inline solutions
• Test method consulting and support
• System validation
• 21 CFR part 11 compliance
• Backed by 35+ years of CCI expertise and experience
Drug safety & quality starts with insuring
Container Closure Integrity

COVER FEATURES
10 MICROBIOLOGYMicrobiological Attributes, Specifications, and Risk Assessment of Culture-Based Therapeutic ProductsTony Cundell, PhDPrincipal ConsultantMicrobiological Consulting, LLC
36 SPECTROSCOPYQuantitative NMR in Biotherapeutic Drug Development: An Efficient General-Purpose Tool for Process AnalyticsGennady Khirich & Ken SkidmoreAnalytical OperationsGenentech
44 MANUFACTURINGModeling the Effects of Supply Chain and Operator Disruptions on Cell Therapy Manufacturing Facility Operations During the COVID-19 PandemicKan Wang,1 Yi Liu,1,2 Junxuan Li,3 Chip White,1 Ben Wang,1 Bruce L. Levine4
1Georgia Tech Manufacturing Institute, Georgia Institute of Technology, Atlanta, GA 2School of Chemical and Biomolecular Engineering, Georgia Institute of Technology, Atlanta, GA 3H. Milton Stewart School of Industrial and Systems Engineering, Georgia Institute of Technology, Atlanta, GA 4Center for Cellular Immunotherapies and Department of Pathology and Laboratory Medicine, Perelman School of Medicine, University of Pennsylvania, Philadelphia, PA
60 MICROBIOLOGY ROUNDTABLEMicrobiology Roundtable
July/August 2020 | Volume 23, Issue 5
www.americanpharmaceuticalreview.com | | 3

18 MICROBIOLOGY
Functional Challenges for Alternative Bacterial Endotoxins Tests Part 2: ComparabilityJames Akers,1 Dennis E. Guilfoyle,2 David Hussong,3 Karen McCullough,4 Robert Mello,5 Donald Singer,6 Edward Tidswell,7 and Radhakrishna Tirumalai8
1Akers Kennedy Associates, Inc., Leawood, KS2Johnson and Johnson, New Brunswick, NJ3Eagle Analytical, Houston, TX4MMI Associates, Whitehouse Station, NJ5Mello PharmAssociates, LLC, Reisterstown, MD6Ecolab Life Sciences, St. Paul, MN7Merck & Co, West Point, PA8North Potomac, MD
28 BIOPHARMACEUTICAL DEVELOPMENT
Opportunities and Pitfalls in the Analysis of Subvisible Particles during Biologics Product Development and Quality ControlDanny K. Chou, PharmD, PhD, President, Compassion BioSolution, LLCMark Bumiller, Technology Manager, Entegris, Inc.
48 DRUG DEVELOPMENT
Orchestrating the Digital Cell and Gene Therapy Treatment Journey Around the PatientJosh Fyffe, Omkar Kawalekar, Hussain MoorajDeloitte Consulting LLP
54 SPECTROSCOPY
Paving the Way for Real Time Process Monitoring in Biomanufacturing
Dhanuka P. Wasalathanthri, Matthew S. Rehmann, Jay M. West, Michael C. Borys, Julia Ding, and Zhen Jian Li Global Product Development & Supply Bristol Myers Squibb Company
76 MANUFACTURING
Pfizer Case Studies Leveraging Multivariate Analysis for Initial Diagnostics and Process UnderstandingJosé-Miguel Montenegro-Alvarado, Manager, Process Analytical Technology ProjectsGlobal Technology & Engineering / Process Monitoring, Automation & ControlPfizer
86 MANUFACTURING
Impact of COVID-19 on Manufacturing of Cell and Gene Therapy and Biotech Products, and Overall Clinical Trial LandscapeMo Heidaran, Heath Coats, Kurt Brorson and Steve Winitsky Parexel International
IN THIS ISSUE »
4 | | July/August 2020
SPECIAL FEATURES
8 CNPerspectives
9 Social Media Connections
34 QC Corner with MilliporeSigma
82 2020 INTERPHEX Award Winners
84 An Interview with Lonza Pharma & Biotech
100 Sponsored Content by Lonza Pharma & Biotech
112 Equipment Focus
116 Editor's Top Tech
REGULAR FEATURES
6 Message from the Editor
7 Editorial Advisory Board
118 P.I.N. Points
120 Advertiser's Index
92 SPECTROSCOPY
Applying Microfluidic Modulation Spectroscopy in Vaccine Formulation to Identify Intermolecular Beta-sheet Aggregation of AntigensPatrick L. Ahl,1 Garrett Baird,2 Christopher Farrell,1 William J. Smith,1 Jeffrey Blue,1 and Libo Wang3 1Merck & Co., Inc., MRL, West Point, PA 2Merck & Co., Inc., MMD, West Point, PA 3RedShift BioAnalytics Inc., Burlington, MA
96 BIOPHARMACEUTICAL PROCESSING
What Does Digitalization Really Mean to Drug Substance Manufacturing? A Case StudyBonnie K. ShumSenior Engineer (PT Innovation and MSAT, Technology Acceleration Team)Genentech, Inc., A member of the Roche Group
104 VENDOR VIEWPOINT
LAL and rFC Comparison Study CaveatsKevin WilliamsBiomerieux
114 VENDOR VIEWPOINT
Process Analytical Technology and Real-Time TOC Testing of Pharmaceutical Grade Water SystemsMichelle NeumeyerLife Sciences Product Applications Specialist for the Sievers line of Analytical instrumentsSUEZ – Water Technologies & Solutions

w w w . a c c i u s a . c o m • 8 8 8 . 3 9 5 . 2 2 2 1
Pursuing Sustainabil ity Excellence
Since 2011, Associates of Cape Cod, Inc. , has had a growing commitment to
taking a responsible role in making sure we do our part to ensure that we
reduce the environmental footpr int on our operat ions. We endeavor to work with
partners and suppl iers who share common goals and contr ibut ions to col lect ive ly
operate in a susta inable manner to benef i t the environment.
Associates of Cape Cod, Inc.Your Endotoxin & Glucan Experts
D O I N G O U R PA RT . . .
TO ENSURE A HEALTHY WORLDTO ENSURE A HEALTHY WORLD
MKT20-046

6 | | July/August 2020
Way back in 2009, before this pandemic, before murder hornets, before everything else 2020 has thrown at us – Apple introduced its iPhone 3G.
It truly seems like an eon ago, especially since Apple is now selling the iPhone 11, but back then the 3G was a big deal, and Apple put together a very extensive advertising and marketing program to support the 3G.
One of the most popular ads was the famous “There’s an app for that” commercial. Basically, this commercial promoted the fact that the 3G could run any of the numerous apps that were available at the time. From recipes, to directions, to counting calories – “There’s an app for that” was the tagline. The ad and in particular the tagline became so popular that Apple actually trademarked the phrase in 2010. Who knew?
The phrase has also infi ltrated our regular conversations – being used as a catch-all whenever someone mentions they have a problem:
Me: I can’t fi nd my socks.
You: There’s an app for that.
As the number of apps has exploded since 2009, we fi nd ourselves downloading, testing out, and keeping the good ones and deleting the bad.
Healthcare and wellness apps abound. From tracking steps and miles, to keeping a log of your important numbers (think glucose, blood pressure, etc.) apps are available for practically anything healthcare related.
And of course, pharmacies off er their own apps. Ostensibly designed so users can keep track of, and reorder prescriptions, they also off er shopping for anything they off er in the store. Come for the prescriptions, stay for the gummy bears.
Anyway, I use an app from one of the major pharmacies. I also subscribe to their text alerts. When a prescription is refi lled, I get an alert on my phone, which includes a link. The link opens the app on my phone. From there I can see my prescription, cost, etc.
Now, this year, going into a pharmacy is not on my list of things I want to do. So, using an app for refi lling prescriptions and scheduling delivery is great feature.
Or is it?
The defi nition of the word glitch is: a usually minor malfunction or a minor problem that causes a temporary setback. And that’s exactly what I encountered with this app.
The app says you can have your prescription delivered – but there is no button to do that. Not on the app or on the website.
I searched and searched for that button- to no avail. Finally, I made an old-fashioned phone call to the pharmacy. They were happy to help and got everything straightened out. When I mentioned the problem with the app – they were nonplussed. I guess they were too overworked to care, and frankly, I don’t blame them.
So, perhaps, after we can get out of 2020, they can update their app. It will be time to build a better app for that.
Mike [email protected]
» Message from the Editor »
Th ere (Should be a Better) App for Th at

Shaukat Ali, Ph.D.Technical Support ManagerBASF Corporation
Ghulam Shabir Arain, Ph.D., CSci, CChem, FRSC, FCQIManaging DirectorDGS Pharma Consulting Ltd., UK
Katherine Bakeev, Ph.D.Director of Analytical Services and Support B&W Tek, Inc.
Douglas J. Ball, MSDiplomate, American Board of Toxicology; Research Fellow, Drug Safety Research & DevelopmentPfizer Global Research & Development
Suraj Baloda, Ph.D.Founder and PresidentSARMICON, LLC.
Rory BudihandojoDirector, Quality Systems AuditBoehringer Ingelheim Shanghai Pharmaceuticals Co., Ltd.
Harsh Chauhan, Ph.D.Assistant ProfessorSchool of Pharmacy & Health ProfessionsCreighton University
Robert V. ChimentiSr. Strategic Applications EngineerInnovative Photonic Solutions Adjunct Professor Rowan University
Emil W. Ciurczak, Ph.D.Doramaxx Consulting
Rick E. CooleyRetiredEli Lilly & Co., Inc.
Weiguo Dai, Ph.D.Scientific Director, Janssen Fellow, Drug Product DevelopmentJohnson and Johnson
Nila Das, Ph.D.Senior Research InvestigatorBristol-Myers Squibb
Vivek Dave, Ph.D.Assistant Professor, Pharmaceutical SciencesSt. John Fisher College, Wegmans School of Pharmacy
Michael Dong, Ph.D.ConsultantMWD Consulting
Dr. Thomas DürigSr. R&D Director, Pharmaceutical and Food IngredientsAshland Inc.
Walter Dziki, Ph.D.Associate Research FellowAbbott Laboratories
Stuart Farquharson, Ph.D.President & CEOReal-Time Analyzers, Inc.
John Finkbohner, Ph.D.Director, Regulatory AffairsMedImmune
Adam S. GoldsteinSenior Manager, Clinical Purification, Operations/Development Genentech
Davy Guillarme, Ph.D.Senior Lecturer, School of Pharmaceutical SciencesUniversity of Geneva, University of Lausanne
Chris HallingSenior Manager, Global Communications and European MarketingCatalent Pharma Solutions
Brian Lingfeng HeResearch InvestigatorBristol-Myers Squibb
Ronald Iacocca, Ph.D.Senior Research Advisor, Product and Process PerformanceEli Lilly & Co.
Maik W. Jornitz Vice President of Business Development G-Con Manufacturing, LLC
Hemant N. Joshi, Ph.D., MBAPrincipalTara Innovations LLC
Ian Lewis, Ph.D.Director of MarketingKaiser Optical Systems, Inc.
Ralph Lipp, Ph.D.President and CEOLipp Life Sciences LLC
Jack LysfjordPrincipal ConsultantLysfjord Consulting LLC
Steven R. Maple, Ph.D.Head of Pharmaceutical Technology Development Dept.Lilly Research Laboratories, Eli Lilly & Co., Inc.
Jerold M. MartinSenior Vice President, Scientific AffairsPall Life Sciences
John P. MayerSenior Research Scientist Indiana University
Michael J. Miller, Ph.D.PresidentMicrobiology Consultants, LLC
Ronald W. Miller, Ph.D., MBAPresident , Technology ConsultantMiller Pharmaceutical
Ganapathy Mohan, Ph.D.Head of Global CMC Regulatory AffairsMerck, Sharp and Dohme Corp.
Shane R. Needham, Ph.D.Laboratory DirectorAlturas Analytics, Inc.
Daniel L. Norwood, MSPH, Ph.D.Distinguished Research FellowBoehringer Ingelheim Pharmaceuticals, Inc.
Mehul PatelGlobal Marketing Director Endotoxin and Microbial Detection Charles River
David RadspinnerDirector of Marketing and Applications Support for BioProcess ProductionThermo Fisher Scientific
Aniruddha M. Railkar, Ph.D.Director of CMCTarsa Therapeutics
Gary E. RitchiePresidentCouncil For Near Infrared Spectroscopy
Rodolfo J. Romañach, Ph.D.Professor of ChemistryUniversity of Puerto Rico, Mayagüez Campus
Shouvik Roy, Ph.D.Principal Scientist, Organizational Unit Leader in Drug Product EngineeringAmgen
Jim RydzakInvestigator, Strategic Technology DivisionGlaxoSmithKline
Ronak SavlaFellowCatalent Applied Drug Delivery Institute
Ken SeufertManaging Director, North AmericaMEGGLE USA Inc.
Jaleel ShujathIndustry Strategist, Life SciencesOpenText
Donald C. SingerGSK Senior Fellow, R&D GlaxoSmithKline
Onkar N. Singh, Ph.D., MBADirector, Pharmaceutical Development at CONRADEastern Virginia Medical School
Allen Templeton, Ph.D.Associate Vice PresidentFormulation Sciences Merck Research Laboratories
Zhenyu Wang, Ph.D.Associate Principle Scientist and Group LeaderRespiratory Product DevelopmentMerck & Co.
Wayne K. Way, Ph.D.Analytical Business Marketing ManagerMilliporeSigma
Larry Wigman, Ph.D.Principal Scientific ManagerGenentech
» Editorial Advisory Board »
www.americanpharmaceuticalreview.com | | 7

8 | | July/August 2020
Waiting for a Vaccine: Why Will the COVID-19 Vaccine Take at Least 18 Months?
The response of the biomedical community and biopharmaceutical industry to the COVID-19 pandemic has been rapid and far-reaching. In less than fi ve months, the global R&D community has identifi ed more than 115 vaccine candidates, with 73 in pre-clinical stages and eight actively engaged in Phase I clinical testing. While this type of a response is proof of the strong, international biomedical infrastructure that has been built over the past century, many people across the globe are anxiously awaiting a return to normalcy. One of the only feasible paths towards that is nations achieving widespread immunity – hopefully through a vaccine. Despite this critical need, many experts anticipate that vaccine development will likely take at least 18 months, which is already an ambitious target.
https://bit.ly/2ELjztV
American Pharmaceutical Review is one of several outstanding publications available from CompareNetworks, Inc. Here is a look at the insightful content our readers may enjoy from four of our sister resources: Pharmaceutical Outsourcing, Biocompare, Labcompare, and DentalCompare.
Desperately Seeking COVID-19 Vaccines
As coronavirus works its way through humanity, the path to normalcy becomes murkier rather than clearer. Herd immunity appears to be much more easily achieved than originally thought. At the same time, reports from a former COVID epicenter, Italy, suggest the virus may be weakening. Absent these encouraging trends a third path, vaccine-based immunity, is a time-proven way to combat deadly infectious diseases. Many questions remain though: How eff ective will COVID-19 vaccines be? Vaccines against polio and other childhood diseases have saved millions of lives, but the track record for infl uenza vaccines is quite spotty, with eff ectiveness ranging year to year from around 60% to as low as 19%, with viral mutations making last year's vaccines obsolete.
https://bit.ly/2DgdBBb
CNPerspectives
Digital Data Logging to Achieve Safe Storage and Compliance
Many vaccines and pharmaceuticals stored in medical refrigerators and freezers must be held at a precise temperature as required by regulators like the CDC and state and local health departments or instructions from the manufacturer. Even when cold storage temperature is not regulated, it makes sense to protect valuable medications, research samples and specimens from becoming ruined because exact conditions are not maintained. The most eff ective way to do this is to equip medical refrigerators and freezers with continuous temperature monitoring devices. A monitoring system can detect problems such as unexpected temperature changes inside the unit, power outages, unauthorized access and doors left open for an extended time. The system sends alerts via email, phone call or text message to designated personnel when conditions fall outside of the preset range. Today’s monitoring systems can protect multiple refrigerators and freezers.
https://bit.ly/33vVkdy
ADA Continues to Provide Guidance As Practices Reopen
In March, the American Dental Association (ADA) urged dentists to postpone elective procedures and only treat emergencies until the end of April in an eff ort to slow the spread of COVID-19, conserve personal protective equipment (PPE) and keep dental emergency patients out of hospitals. Now, as practices reopen, the ADA continues to off er guidance to help dentists navigate this new normal.The ADA’s Advisory Task Force for Dental Practice Recovery developed a free toolkit with recommended measures to take to protect patients, staff and dentists from COVID-19 so dentists can safely treat patients again.
https://bit.ly/33ux2AB

U.S. FDA@US_FDA
To date, the FDA has currently authorized 198 tests under EUAs; these include 161 molecular tests, 35 antibody tests, and 2 antigen tests.
Connect with American Pharmaceutical Review at:
facebook.com/AmericanPharmaceuticalReview
twitter.com/ampharmrev
linkedin.com/groups/American-Pharmaceutical- Review-3889659
AMERICAN PHARMACEUTICAL REVIEW
Social Media Connections
Mayo Clinic@MayoClinic
Acute symptoms of #COVID19, such as cough, fever and shortness of breath, are now widely known. What is not known, however, is what symptoms and complications may linger long after an initial COVID-19 infection. Learn more from @drgregpoland.
Thermo Fisher@ThermoFisherPR
Our response to #covid19testing continues to expand with a new highly automated, real-time PCR solution designed to analyze up to 6,000 samples a day. http://ow.ly/1B2D50ARB6f
Johns Hopkins Bloomberg School of Public Health@JohnsHopkinsSPH
How close are we to a #COVID19 vaccine? What do effi cacy trials entail? What would make a vaccine "successful?"https://twitter.com/JohnsHopkinsSPH/status/128919035806 5143809/photo/1
HHS.gov@HHSGov
If you have recovered from #COVID19, confi rmed by a positive test, please donate plasma now. You can liter-ally help save lives. There are thousands of locations across the country that have set up safe ways for you to donate. Find one at http://coronavirus.gov.
GSK@GSK
Last week we announced we’d reached an agreement with the United States government and @GOVUK to supply 160m potential doses of the #COVID19 vaccine candidate we’re co-developing with @sanofi . Find out about our partnerships in the fi ght against COVID-19: https://gsk.to/2C0vW4u
NIH@NIH
The new studies are part of #NIH’s Accelerating COVID-19 Therapeutic Interventions and Vaccines (ACTIV) program, a public-private partnership to speed development of the most promising treatments and vaccine candidates. Read more about #ACTIV: https://t.co/BTmUNX6pyG?amp=1
CDC@CDCgov
As of July 28, the cumulative number of #COVID19 cases reported in the U.S. surpassed 4 million. Wear a mask when around people who don’t live in your household. Stay 6 feet away from others & wash your hands often. See more data: https://bit.ly/31sonOh
www.americanpharmaceuticalreview.com | | 9
»
10 | | July/August 2020
MICROBIOLOGY »
Tony Cundell, PhDPrincipal Consultant,Microbiological Consulting, LLC
Microbiological Attributes, Specifications, and Risk Assessment of Culture-Based Therapeutic Products
AbstractA major challenge with emerging heterogeneous, live culture-based products is setting consistent, risk-based microbial specifications to protect the recipients of these product from potential microbial infection. A review of the literature and the published regulatory requirements demonstrates a lack of consensus as to donor and/or product infectious disease screening that may inevitably harm patients along with increased costs and delayed product availability. This review article addresses the microbiological attributes, specifications, screening methods, and risk assessment of these unique products and makes recommendations as to the path forward.
IntroductionCurrently our microbiological standards largely address pharma-ceutical drug products, botanicals and dietary supplements that are either sterile or have a moderate to low microbiological content using traditional culture-based methods. Emerging products, which may have health claims that contain live microbiological cultures, include probiotics, fecal microbiota transplantations, fecal-derived consortium cultures and therapeutic bacteriophage products, although sharing some common attributes, they lack comprehensive microbial standards. These live biotherapeutic products challenge standard-setting organizations, regulators, and microbiologists alike. Fundamental questions that must be answered include what is the microbial contamination risk associated with these products that target different at-risk patient populations, what would be their acceptable unintended bioburden level, and what microorganisms would be objectionable in these products, and how do we assess their formulated microbiological purity?
Description of These Emerging Biological Products
ProbioticsThe definition of probiotics found in the Food and Agriculture Organization/World Health Organization (FAO/WHO) guidelines is “Probiotics are live microorganisms which when administered in adequate amounts confer a health benefit on the host”

Rapid ENDOZYME® II GO is the latest member of bioMérieux’s ENDONEXT™ range of endotoxin detection assays based onrecombinant horseshoe crab Factor C (rFC).
Not only does ENDOZYME II GO eliminate the need to harvest horseshoe crab blood, it ushers in a new era of smarter,
more efficient quality control testing. ENDOZYME II GO features GOPLATE™, an innovative microplate pre-loaded
with required Control Standard Endotoxin (CSE) for standard curves and internal controls:
• Less processing time - over 50% time-saving compared to conventional kinetic chromogenic LAL
• Provides exceptional accuracy, precision and 100% endotoxin-specificity
• Significant reduction of invalid results and OOS
WE’RE MAKING ENDOTOXIN TESTING FASTER, EASIER, AND ECOLOGICALLY FRIENDLY.
biomerieux-industry.com/Endotoxin©2
02
0 b
ioM
érie
ux,
Inc.
• B
IOM
ER
IEU
X a
nd
th
e B
IOM
ER
IEU
X lo
go a
nd
EN
DO
NE
XT,
EN
DO
ZY
ME
an
d G
OP
LA
TE
are
use
d p
end
ing
and
/or
reg
iste
red
trad
emar
ks b
elo
ng
ing
to b
ioM
érie
ux,
or
on
e o
f its
su
bsi
dia
ries
, or
on
e o
f its
co
mp
anie
s P
aten
ts: w
ww
.bio
mer
ieu
x-u
sa.c
om
/pat
ents
• P
RN
18
-03
75-0
0

The U. S. Food and Drug Administration (FDA) has defined probiotics as live microbial food supplements which beneficially affect the host animal by improving its intestinal microbial balance. If a probiotic is marketed in the U.S.A. to prevent, treat or cure a disease then the FDA would consider the product as a live biotherapeutic agent and would require regulatory review and approval by the FDA Center for Biologics Research and Evaluation (CBER).
According to USP <64> Probiotic Tests probiotics are live microorganisms that, when administered in adequate amounts, may confer health benefits to the recipient. Probiotics are typically identified at the strain level as their characteristics and benefits are considered strain-specific. The USP chapter applies to probiotics produced in specialized fermenters under strict hygiene conditions for dietary supplements or pharmaceutical applications. Fermentation media are formulated to the specific growth requirements of the microbial species or strain and typically contain nutrients such as proteins, carbohydrates, vitamins, and minerals. After the microbial cells are grown, they are harvested, usually by centrifugation. Suitable protectants may be added to the concentrated probiotic biomass, and the biomass is freeze-dried or spray-dried to a powdered form. The dried biomass then undergoes formulation, which may involve blending one or more strains with suitable excipients. Formulated probiotic ingredients can be further processed into a range of dosage forms, e.g., compressed tablets, powder-filled capsules, softgels, powders, or gels.
Typically, dietary supplements are either fermented dairy products like yogurt containing live bacterial cultures, milk, juices or desserts fortified with live cultures or capsulated probiotics or suspensions marketed as dietary supplements. Probiotics have been mainly selected from the genera Lactobacillus and Bifidobacterium, because of their long history of safe use in fermented milk by the dairy industry and their natural presence in the human intestinal tract. Probiotics are promising but their efficacy is largely unproven in clinical trials (Su et al, 2020).
Regulatory and compendial expectations may be found in the FAO/WHO Guidelines, U.S. Code of Federal Regulations 21 CFR 170.3(i) Subchapter B Food for Human Consumption, USP <64> Probiotic Tests and the Food Chemical Codex Appendix XV: Microbial Food Cultures Including Probiotics.
Fecal Microbiota TransplantationsThe publication of a randomized clinical trial (van Nood et al, 2013) showing that fecal transplantation was superior to vancomycin treatment of chronic, recurrent Clostridium difficile infection jump-started this field. Since this publication, the use of fecal microbiota transplantation (FMT) to treat chronic C. difficile (C. diff.) infection not responding to standard antibiotic therapies has become a recognized and established treatment option. As described by Carlson (2020), at a 2013 FDA-stakeholder workshop, the FDA noted that the use of FMT and any clinical studies to evaluate its safety and effectiveness to treat or prevent C. diff. infection are subject to regulation by the FDA. Following this workshop, CBER issued a draft guidance document for industry for immediate implementation. This outlined a policy to exercise enforcement discretion regarding the requirements for Investigational New Drug (IND) applications in the use of FMT when used to treat C. diff. infections not responsive to standard therapies.
These materials can be administered as suspensions in the upper or lower gastrointestinal tract or as encapsulated materials administrated orally. The relative infection risk of these modes of administration is largely unknown.
Fecal-Derived Microbial Consortium ProductsAn innovation to fecal microbiota transplantation is the isolation of individual species from the intestinal microbiota, their production in anaerobic pure culture from well characterized master and working cell banks, and manufacture as pharmaceutical dosage forms to treat patients with intestinal microbiota malfunctions including chronic C. diff. infections (Petrof et al., 2013). Multiple companies currently have these products in randomized, double-blinded clinical trials.
Bacteriophage Therapeutic ProductsViruses termed bacteriophages that infect and replicate in bacterial cultures, are of interest to microbiologists because of the their role in the contamination of starter cultures in cheese and other dairy product manufacturing, probiotics, bacterial cell cultures used for the production of biopharmaceuticals, and the increased potential usage as therapeutic phage preparations. Felix D’Hérelle working at the Pasteur Institute described bacteriophage, first seen in 1917, as spots on the culture plates of the dysentery bacillus Shigella dysenteriae and recognized their therapeutic value in treating dysentery. Interest in their therapeutic value was largely eclipsed by the discovery and development of antibiotics but lately due the prevalence of multi-drug resistance organisms, e.g., methicillin-resistant Staphylococcus aureus, interest in therapeutic bacteriophage has been renewed.
Phage therapy uses obligate lytic phages that selectively kill their antibiotic-resistant bacterial hosts. Major advantages are their host specificity, lack of effect on mammalian cells and other human microbiota outside their host range and safety for parenteral, topical, inhalation and oral administration (Furfaro et al, 2018; Fernandez et al, 2019).
The quality and safety requirements of a therapeutic bacteriophage product will depend on the dosage form and will include a quantitative determination of the active ingredient, i.e., the bacteriophage in plaque-forming units per weight or volume using the target bacterium, a genomic identity test, the host range on a panel of target organisms, residual nucleic acid and other cellular components, sterility (sterile dosage forms), bacterial endotoxin content (parenteral products), and absence of potential pathogens (non-sterile dosage forms).
Setting Microbial Requirements for Live Culture Therapeutic Products
Requirements of the Different Therapeutic ProductsA comparison of the salient features and microbiological testing requirements of live culture products is found in Table 1.
»
12 | | July/August 2020
MICROBIOLOGY »

As a starting point to evaluate microbiological specifi cations, we can use the USP/Ph. Eur./J. P. pharmacopeial requirements for non-sterile drug products (Table 2).
In addition, there is a U.S. Federal Good Manufacturing Practices (GMP) requirement as found in 21 CFR 211.113 Control of microbiological contamination to exclude objectionable microorganisms from
non-sterile drug products. The reader is referred to the 2014 PDA Technical Report No. 67 Exclusion of Objectionable Microorganisms from Non-sterile Pharmaceutical and OTC Drug Products, Medical Devices and Cosmetics.
Other USP guidance for microbiological specifi cation setting may be found in USP <64> Probiotics Tests.
Table 1. Comparison of Live Microorganism Therapeutic Products
Salient Features Probiotics Fecal Microbiota Transplantation
Fecal-derived Microbial Consortia
Bacteriophage Therapeutic Products
Characteristics Live dairy-derived culturesMixed intestinal populations within fecal matter to suppress C. diffi cile infections
Anaerobic cultures of selected intestinal isolates to treat chronic intestinal infection
Bacteriophages with the ability to infect and lyse targeted drug-resistant organisms
Microbial EnumerationPlate counts on selective media and fl ow cytometry
None Plate counts on selective mediaLysis plaques in lawns of the targeted bacteria
Identity and Strain PurityRT-PCR methods or comparable technology
Whole Metagenome Sequencing RT-PCR methods Host specifi city and RT-PCR methods
Screening for Pathogens Enrichment and elective mediaEnrichment and selective media including chromogenic media
Enrichment and selective media and RT-PCR methods
Enrichment and selective media and RT-PCR methods
Screening for Antibiotic ResistanceAntibiotic resistance gene detection
Disk diff usion and dilution screening methods
Antibiotic resistance gene detection N.A.
Screening for Intestinal Adherence None None None N.A
« MICROBIOLOGY »
www.americanpharmaceuticalreview.com | | 13
Enhance your process understanding of bioburden and biofilm risks with theIMD-W™ Instantaneous Microbial Detection™ system. With it, you’re armed to detect and respond to threats in real time.
• Quality Risk Management Tool for UPW and WFI• Detects Particles and Determines
Biologic Status Instantaneously• On-Line or At-Line• Continuous Monitoring or Point Sampling
Really Get to Know Your Water System
IMD-WTM and instantaneous microbial detectionTM are trademarks of Azbil Corp. and instantaneous microbial detectionTM are trademarks of Azbil Corp.
www.biovigilant.com

Challenges Associated with Microbiological Testing
Identity TestingA consensus is developing that identity testing based on the genotype as advocated in USP <64> Probiotics Tests represents the best approach. Type stains can be recognized by PCR methods with specifi c primers for the specifi c strain used in the product. In the future, if the equipment and reagent costs become aff ordable, whole genome sequencing (WGS) may replace 16s rRNA base sequencing as the method of choice.
Microbial ContentAs potency has always been a prerequisite to setting an effi cacious and safe dosage, the author believes that the number of viable microorganisms in the product must be known and may be part of the labeling requirements. A product, like a probiotic, containing large numbers of viable organisms, e.g. billions per g, must be diluted into a countable range and enumerated on a selective culture medium using the appropriate incubation conditions. Products containing multiple microorganisms that are closely related will present unique challenges to microbial enumeration. Carlson (2020) discussed the diffi culties in establishing FMT potency for release and stability testing by enumerating an anaerobic microbiota through microbial count, viable staining or a qPCR approach.
Tests for Specifi ed MicroorganismsCultural isolation of contaminating microorganisms from the high background of the product is a challenge and strategies include exploiting physiological requirements such as media selection, incubation temperature, and presence or absence of oxygen (aerobic, anaerobic or microaerophilic conditions) and CO2 supplemented atmosphere. Overgrowth of the culture can be suppressed using antibiotics, media formulation, thermal shock, fi ltration, and bacteriophages (Lagler et al, 2015). For robust, live culture therapeutic products based on purifi ed strains grown in cell culture such as microbial ecosystem and bacteriophage therapies, the specifi ed microorganisms for each dosage form contained in USP <1111> should be suffi cient. For example, it would be hard to justify screening lyophilized pure cultures of intestinal-derived anaerobic bacteria delivered orally in a capsule for the absence of S. aureus, P. aeruginosa, C. albicans and A. niger. Screening for the absence of E. coli and C. sporogenes may be justifi ed.
Contaminating MicroorganismsRecent USP dietary supplement monographs for probiotics have requirements for an absence of Listeria spp. in 25 g. The author questions the justifi cation for this requirement.
The FDA Bad Bug Book states: “Many foods have been associated with L. monocytogenes. Examples include raw milk, inadequately pasteurized milk, chocolate milk, cheeses (particularly soft cheeses), ice cream, raw vegetables, raw poultry and meats (all types), fermented raw-meat sausages, hot dogs and deli meats, and raw and smoked fi sh and other
»
14 | | July/August 2020
MICROBIOLOGY »
Table 3. Probiotic Microbiological Quality Limit Requirements (Based on USP<64>)
Test Parameter Non-Spore-forming Bacteria Spore-forming Bacteria Yeast and Mold
IdentityIdentifi cation for Lactobacillus and Bifi dobacterium strains by PCR with specifi c primers
Identifi cation of strains by PCR with specifi c primers
Identifi cation of strains by PCR with specifi c primers
EnumerationNLT 100% of the labeled viable cell count, in cfu/g
NLT 100% of the labeled viable cell count, in cfu/g
NLT 100% of the labeled viable cell count, in cfu/g
Limits for Contaminating MicroorganismsNon-lactic acid bacteria NMT 5 x 10³ cfu/g and Yeast and Mold NMT 100 cfu/g
Yeast and Mold NMT 100 cfu/gTotal Aerobic Microbial Count NMT 1 x 10³ cfu/g
Specifi ed Microorganisms Absence of E. coli and Salmonella spp. (In 10 g) Absence of E. coli and Salmonella spp. (In 10 g) Absence of E. coli and Salmonella spp. (In 10 g)
Other Potential Specifi ed Microorganisms Based on a risk assessment Based on a risk assessment Based on a risk assessment
Table 2. Microbiological Quality Limit Requirements of Non-Sterile Drug Products (Based on USP <1111>)
Route of Administration Total Aerobic Microbial Count (cfu/g or cfu/mL)
Total Combined Yeasts/Molds Count (cfu/g or cfu/mL)
Specifi ed Microorganism(s)(In 1 g or 1 mL)
Non-aqueous preparations for oral use 103 102 Absence of E. coli
Aqueous preparations for oral use 102 101 Absence of E. coli
Rectal Use 103 102 N.A.
Vaginal Use 102 101 Absence of S. aureus, P. aeruginosa and C. albicans
Oromucosal Use 102 101 Absence of S. aureus and P. aeruginosa
Cutaneous Use 102 101 Absence of S. aureus and P. aeruginosa

seafood. L. monocytogenes can grow in refrigerated temperatures, which makes this microorganism a particular problem for the food industry.”
A recent review of probiotic manufacturing emphasizes that ultra-high temperature sterilization is used for the culture media, purifi ed cultures are used as the source of inocula, the cultures are harvested by centrifugation, frozen by liquid nitrogen and lyophilized so the risk of listeria contamination is slight (Fenster et al, 2019).
With a heterogeneous therapeutic product like FMT the fecal mate-rial of the donor may contain intestinal pathogens without present-ing symptoms of recognizable illness. As with other donations of human tissues, both the donor and stool samples may be screened to known pathogens.
In Tables 4, 5 and 6 the pathogen screening recommended by the Australian Therapeutic Goods Authority (TGA), Health Canada, the FDA, and a European Consensus Conference are summarized. The reader should be aware that, although there is not a strong consensus, screening requirements are evolving, and these summaries may not represent current regulatory thinking.
The source documents are the Australian TGA Draft Standards for Fecal Microbiota Transplant dated November 2019, the Health Canada website, Carlson (2020) for the FDA position and Cammarota et al (2017) for the European consensus.
This is a very extensive list for pathogens screening, which may be arguably unnecessary with healthy donors who exhibit no signs of intestinal infection. According to Bakken et al (2011) this can be achieved by PCR screening for C. diff . toxin B, routine screening for enteric bacterial pathogens, and screening for fecal Giardia and Cryptosporidium antigens.
One attractive solution is to use multiplex qPCR technologies that are increasingly used in a clinical setting. For example, the BIOFIRE® FILMARRAY® Gastrointestinal (GI) Panel tests for the 22 most common gastrointestinal pathogens (see Table 7) including viruses, bacteria and parasites that causes infectious diarrhea and other gastrointestinal symptoms in clinical specimens (Buss et al 2015).
Table 6. Screening donors and/or stool samples for human disease causing viruses
Viruses Australian TGA
Health Canada FDA European Consensus
Conference
SARS-CoV-2 No Yes No N.A.
HIV-1/2 No Yes No Donor only
Hepatitis B and C No Yes No Donor only
HTLV-I/II No Yes No No
Rotavirus Yes Yes Yes As required
Norovirus Yes Yes Yes Yes
Adenovirus No Yes Yes No
Enterovirus Yes No Yes No
Table 7. BIOFIRE® FILMARRAY® GI Panel targets:
Bacteria Diarrheagenic E. coli/Shigella
Campylobacter (jejuni, coli & upsaliensis)Clostridium diffi cile (Toxin A/B)Plesiomonas shigelloidesSalmonella spp.Yersinia enterocoliticaVibrio (parahaemolyticus, vulnifi cus, & cholerae)Vibrio cholera
E. coli O157Enteroaggregative E. coli (EAEC)Enteropathogenic E. coli (EPEC)Enterotoxigenic E. coli (ETEC) lt/sShiga-like toxin-producing E. coli (STEC) stx1/stx2 E. coli O157Shigella/Enteroinvasive E. coli (EIEC)
Viruses Parasites
Adenovirus F 40/41AstrovirusNorovirus GI/GIIRotavirus ASapovirus (I, II, IV, and V)
CryptosporidiumCyclospora cayetanensisEntamoeba histolyticaGiardia lamblia
« MICROBIOLOGY »
www.americanpharmaceuticalreview.com | | 15
Table 4. Screening donors and stool samples for bacterial pathogens
Bacterial Pathogen
Australian TGA Health Canada FDA
European Consensus Conference
Clostridium diffi cile Yes No Yes Yes
Salmonella spp. Yes Yes Yes Yes
Shigella spp. Yes Yes Yes Yes
Campylobacter spp. Yes Yes Yes Yes
Vibrio spp. No Yes Yes As required
Yersinia spp. No Yes Yes Yes
Piesiomonas spp. No Yes Yes No
Listeria spp. No Yes No As required
Aeromonas spp. No Yes No No
E. coli O157 No Yes Yes Yes
Vancomycin-resistant enterococci
Yes Yes Yes Yes
Extended-spectrum β- lactamase enterobacteriaceae
Yes Yes Yes Yes
Carbapenem-resistant enterobacteriaceae
Yes Yes Yes Yes
Methicillin-resistant Staphylococcus aureus
No Yes Yes Yes
Helicobacter pylori NoUpper gastro-intestinal tract delivery only
No No
Table 5. Screening donors and stool samples for human parasites
Parasites Australian TGA
Health Canada FDA European Consensus
Conference
Giardia spp. Yes No* Yes Yes
Cryptosporidium spp. Yes No Yes Yes
Cyclospora spp. No No Yes As required
Isospora spp. No No Yes As required
Microsporidia spp. No No Yes No
Entamoeba histolytica Yes No Yes Donor only
Ova and other parasites
No Yes Yes No
* No specifi c recommendations from Health Canada

On June 13, 2019, the FDA informed health care providers and patients of the potential risk of serious or life-threatening infections with the use of fecal microbiota for transplantation (FMT). Bacterial infections caused by multi-drug resistant organisms (MDROs) have occurred due to transmission of a MDRO from use of investigational FMT, resulting in the death of one individual.
According to the FDA, FMT donor stool testing must now include MDRO testing to exclude use of material that tests positive for MDROs. As E. coli is a major component of the intestinal microbiota, screening of the absence of E. coli would not be an effective strategy, as isolates would need to be screen for their antibiotic resistance. The MDRO tests should at minimum include extended spectrum beta-lactamase (ESBL)-producing Enterobacteriaceae, vancomycin-resistant enterococci (VRE), carbapenem-resistant Enterobacteriaceae (CRE), and methicillin-resistant Staphylococcus aureus (MRSA). Culture of nasal or peri-rectal swabs is an acceptable alternative to stool testing for MRSA only.
On April 7, 2020 the FDA issued another safety alert warning health care providers of the potential risk of life-threatening infections due enteropathogenic E. coli (EPEC) and shigatoxin-producing E. coli (STEC) following the investigative us of fecal microbiota for transplantation (FMT). Details of the circumstances of the FMT related infections were recently published (DeFilipp et al, 2020)
The screening options are: 1) conducting dilution and disk diffusion antibiotic susceptibility screening of potential enteric bacterial pathogens, 2) using selective or chromogenic solid media for specific enteric pathogens, 3) use toxin EIA screening methods, 4) RT-PCR gene screening for antibiotic resistance, and 5) Whole Genomic Sequencing (WGS) methods.
Risk Assessment and Mitigation
Risk AnalysisIn terms of relative risk of microbial infection to the recipients, fecal matter transplantations because of their heterogeneous nature and the uncertainty of the health status of the donor represent the greatest risk and bacteriophages because they are not human pathogens represent the lowest risk to the recipient. Probiotics derived from dairy cultures that have a long history of safe use, but have unproven medical benefits, have a low risk. The risk associated with intestinal-derived stool repopulating products needs more scientific or regulatory definition. Strict and facultative anaerobes are isolated from fecal microbiota as pure cultures, identified, characterized, and stored frozen as master and working cell banks. Working cell banks are used to inoculate sterile anaerobic culture broth incubated in an anaerobic isolation chamber, the cells are harvested by centrifugation, lyophilized, and encapsulated in hard shell capsules for oral administration. Using this approach, the microbial composition of this product will be known and the risk of bacterial and viral contaminants largely eliminated.
Based on the above discussion, this suggests the following order of microbial risk: fecal matter transplant >> fecal-derived stool repopulating products ≥ probiotics > bacteriophage therapeutic products.
Blaser (2019) pointed out that at least 10,000 FMT, and probably a lot more, are being performed in the U.S. annually and as a biological product heterogeneous across donors carries a real risk of transmission of infectious agents in treating patients with recurrent C. difficile infection and often other comorbidities.
To determine what pathogen should be monitored and the donor and/or stool material excluded from transplantation, we need to examine the risk to the recipient. Given the relatively recent introduction of FMT and the low numbers of annual transplantation this is a relative small body of experience. Using prevalence and severity of foodborne illness as a measure of risk, the epidemiological data suggests that the highest risk would be associated with Salmonella spp., Campylobacter spp., STEC E. coli and Yersinia enterocolitica. In contrast, foodborne Listeria monocytogenes infections, although they occur at a low frequency, are associated a high rate of hospitalization and death per 100, 000 patients (See Table 8).
Specific Challenges Associated with Microbial Screening Test
Screening for Clostridium difficileClostridium difficile can be detected by a culture method using Clostridium difficile Selective Agar or Clostridium difficile toxin gene detection by PCR assay. As C. difficile may be a normal part of the intestinal microbiota without exhibiting symptoms, the gastroenteritis disease is best detected using the PCR assay.
Screening for Enteric PathogensMethods for screening for enteric bacterial pathogens may be obtained from many sources including the FDA Bacteriological Analytical Manual, the USDA/FSIS Microbiological Laboratory Guidebook, CDC Guidelines, the USP and the ASM Manual of Clinical Microbiology. Screening of specific foodstuffs for pathogens is risk-based (Table 8) and clinical microbiologists respond to patient histories and symptoms while that pathway may not be available for live culture products.
As stated above, E. coli is major component of the intestinal microbiota so screening must be directed toward enteropathogenic strains. For example, Shiga Toxin-Producing E. coli O157:H7 can be conveniently detected by a culture method using either sorbitol MacConkey agar or E. coli O157:H7-specific chromogenic agar. Shiga toxin 1 and 2 by enzyme immuno-assay (EIA) from enrichment broth supernatants or detection of the genes encoding these toxins by PCR is required for diagnosis of infection due to non- O157:H7 STEC.
Screening for SARS-CoV-2 CoronavirusOn March 23, 2020 the FDA in response to literature publications issued a safety alert addressing the use of FMT and SARS-CoV-2 recommending the identification of donors currently or recently infected with the virus, testing donors and/or donor stool for SARS-
»
16 | | July/August 2020
MICROBIOLOGY »

CoV-2, and developing criteria for the exclusion of donors and donor stool based on screening and testing.
Screening for Other Important AttributesTo re-establish microbial populations in the gut microbiota, attributes like acid and bile tolerance (oral administration only), adherence to the intestinal wall, and the absence of genes for antibiotic resistance should be considered during product development.
ConclusionsThe advent of emerging live culture products is an ongoing challenge in terms of setting microbiological requirements. A small production experience base with these products compounds this challenge. The author encourages continued research and development for these innovative products. Perhaps with information from the NIH Microbial Human genome project, the pharmaceutical industry can apply this knowledge on how to prepare therapeutic probiotics for patients in need of these products.
References1. Australian Government, Department of Health, Therapeutic Goods Administration TGA
regulation of faecal microbiota transplant (M) products in Australia 19 September 2019
2. Bakke, J. et al, 2011 Treating Clostridium diffi cile infection with fecal microbiota transplantation. Clin Gastroenterol Hepatol. 9(12):1044–1049
3. Blaser M.J. 2019 Fecal microbiota transplantation for dysbiosis – predictable risks N.E. J. Med. 381:2064-2066
4. Buss, S. N. et al 2015 Multicenter evaluation of the BioFire FilmArray gastrointestinal panel for etiologic diagnosis of infectious gastroenteritis J. Clin. Micro. 53(3): 915-925
5. Carlson, P. E. 2020. Regulatory considerations for fecal microbiota transplantation products. Cell Host & Microbe 27: 173-175
6. Cammarota, G. et al 2017 European consensus conference on faecal microbiota transplantation in clinical practice. Gut 66: 569-580
7. DeFilipp, Z. et al 2020 Drug-resistant E. coli bacteremia transmitted by fecal microbiota transplant. N.E. J. Med. 381(921): 2043-2050
8. FDA. 2014 Draft Guidance for Industry: Enforcement Policy Regarding Investigational New Drug Requirements for Use of Fecal Microbiota for Transplantation to Treat Clostridium diffi cile Infection Not Responsive to Standard Therapies. Silver Spring, MD: US Food and Drug Administration.
9. Fenster, K. et al 2019 The production and delivery of probiotics: A review of a practical approach microorganisms 7, 83; doi;10.3390/microrganisms7030083
10. Fernandez, L. et al 2019 The perfect bacteriophage for therapeutic applications – a quick guide. Antibiotics 8:126-132
11. Furfaro, L.L. et al 2018 Bacteriophage therapy: clinical trials and regulatory hurdles Frontiers in Cellular and Infectious Microbiology 8:376-383
12. Health Canada. 2015 Guidance Document: Fecal Microbiota Therapy Used in the Treatment of Clostridium diffi cile Infections. Ottawa, ON: Health Canada.
13. Lagier, J-C 2015 The rebirth of culture in microbiology through the example of culturomics to study human gut microbiota. Clin. Microbial. Rev. 28(1): 237-262
14. Petrof, E. O. et al 2013 Stool substitute transplant therapy for the eradiation of Clostridium diffi cile infection: RePOOPulating the gut. Microbiome 1:3-12
15. Pirnay et al 2015 Quality and safety requirements for sustainable phage therapy products Pharm Res. 32: 2173-2179
16. Scallan et al, 2011 Foodborne illness acquired in the United States – Major Pathogens Emerg. Infect. Dis. 17(1): 7–15
17. Su GL, Ko CW, Bercik P, Falck-Ytter Y, Sultan S, Weizman AV, Morgan RL, AGA Clinical Practice Guidelines on the Role of Probiotics in the Management of Gastrointestinal Disorders, Gastroenterology (2020), doi: https://doi.org/10.1053/j.gastro.2020.05.059.
18. Van Nood. E. et al 2013 Duodenal infusion of donor feces for recurrent Clostridium diffi cileN. E. J. Med. 368(5): 407-415
« MICROBIOLOGY »
www.americanpharmaceuticalreview.com | | 17
Table 8. Foodborne Illness Acquired in the U. S. - Major Pathogens (After Scallan et al, 2011)
Pathogen Foodborne % Number of Illness Annually Hospitalization Rate Death Rate
Campylobacter spp. 80 845,000 17 0.1
Clostridium perfi ngens 100 966,000 0.6 <0.1
E. coli STEC O157 82 63,000 46.2 0.5
E. coli STEC Non-O157 100 113,000 12.8 0.3
E. coli ETEC 100 18,000 0.8 0
Listeria monocytogenes 99 1,600 94 15.9
Salmonella spp. Non-typhoidal 94 1,028,000 27.2 0.5
Staphylococcus aureus foodborne 100 241,000 6.4 <0.1
Vibrio parahaemolyticus 86 40,000 22.5 0.9
Yersinia enterocolitica 90 108,000 34.4 2.0
Cryptosporidium spp. 9 680,000 25 0.3
Cyclospora cayetanensis 99 12,000 6.5 0.0
Giardia intestinalis 7 1,122,000 8.8 0.1
Norovirus 26 5,462,000 0.03 <0.1

»
18 | | July/August 2020
MICROBIOLOGY »
James Akers,1 Dennis E. Guilfoyle,2 David Hussong,3 Karen McCullough,4 Robert Mello,5 Donald Singer,6 Edward Tidswell,7 and Radhakrishna Tirumalai8
1Akers Kennedy Associates, Inc., Leawood, KS 2Johnson and Johnson, New Brunswick, NJ 3Eagle Analytical, Houston, TX 4MMI Associates, Whitehouse Station, NJ 5Mello PharmAssociates, LLC, Reisterstown, MD 6Ecolab Life Sciences, St. Paul, MN 7Merck & Co, West Point, PA 8North Potomac, MD
Functional Challenges for Alternative Bacterial Endotoxins Tests Part 2: Comparability
Note: The views expressed in this article are solely those of the individual authors and do not necessarily reflect the opinions of organizations with which the authors may be affiliated.
IntroductionPart one of this three-part series examined the scientific basis for recombinant methods and the history and extensive studies utilized previously for the acceptance of alternate tests in the field of pyrogen and bacterial endotoxins testing. As reported in part one, we believe there are three necessary elements to a complete validation of a recombinant method’s ability to assure continued product quality and patient safety (Akers, et al., 2020):
1. Comparability of analytical capability per USP <1225>,
2. Product specific suitability testing per USP <85> and
3. The demonstration of equivalent or better test results than the compendial method per USP <1223>
Suitability and Comparability Some have suggested that the recombinant reagents are merely variants of the naturally sourced lysate and therefore, by extension, can be easily substituted for the natural reagent(s) with minimal evaluation beyond a suitability test as described in USP <85>. The components and formulation of naturally sourced and recombinant reagents are clearly NOT the same. The natural lysate contains many molecular entities necessary to the innate immunity of the living animal, and which are missing in recombinant reagents (Obayashi, et al; 1985; Ding and Navas, 1995; Ding and Ho, 2001; Iwanaga, 2002; Mizumura, et al, 2017; Muori et al, 2019; Akers, et al, 2020.) For these reasons, methods using reagents from recombinant sources are alternatives that are minimally related to the naturally derived reagent .


There are publications in the scientifi c literature that address validation of alternative recombinant methods in terms of product suitability/PPC recovery (Loverock, et al., 2010; Bolden and Kelly, 2017; Abate, et al., 2017; Bolden 2020; Marius, et al., 2020). The “Test for Interfering Factors” (formerly known as “Inhibition/Enhancement Testing”) described in USP <85> (USP 2020a) is a product-specifi c demonstration that test interference arising from a product formulation can be mitigated such that a known level of calibration analyte activity can be quantitatively recovered. This same test is also used as a system suitability test for routine bacterial endotoxin testing.
Although published studies have demonstrated suitability for recom-binant methods, we believe that these data do not demonstrate test result equivalence (comparability) between reference compendial methods and recombinant methods as required by USP and FDA (USP 2020b; USP 2020c and FDA 2012). Most of the published studies claim-ing comparability include data from test articles that have no measur-able autochthonous endotoxin activity in any segment of the manu-facturing process. It is not possible to claim comparability when the impurity that is being measured, in this case, endotoxins activity, is absent in the test article at quantifi able levels. The recovery of the analyte (RSE or CSE) does not experimentally confi rm the alternative method’s abil-ity to recover natural product contaminants.
GlossaryTerms and acronyms used in this publication are provided below.
Term or Acronym Defi nition
Endotoxins from autochthonous sources
Endotoxins generated by microorganisms adapted to and indigenous within a specifi c niche or environment. In our current context, that environment is the product, manufacturing system and associated utilities which includes those endotoxins from microbial contamination of ingredients such as water.
Calibration Standards (Analytes)
Calibration standards also known as analytes include the USP Reference Endotoxin Standard (RSE) and secondary Control Standard Endotoxins (CSEs). All the calibration standards purchased from USP or included in test kits are currently prepared from hot phenol (Westphal) extracted, purifi ed and formulated lipopolysaccharide. RSE is prepared from Escherichia coli O113:H10:K(-) and CSEs may be prepared from any of several diff erent species/strains of E. coli. Secondary calibration analytes must be calibrated against the primary standard (RSE).
Recombinant Reagents
Two types of recombinant reagents are currently either commercially available or are in development. Recombinant Factor C (rFC) is a recombinant reagent containing only the Factor C zymogen protease cloned from the horseshoe crab’s natural clotting cascade. Recombinant Cascade Reagents (rCR) are recombinant reagents containing all three zymogen proteases cloned from the natural clotting cascade. (Akers, et al., 2020)
Relative recoveryEndotoxins activity in a sample quantitated by recombinant methods as a percentage of endotoxins activity quantitated in the same sample by standard compendial methods.
Reference Compendial Method(s)
The compendial methods found in the USP 2019, <85> “Bacterial Endotoxins Tests”
Approach Used for Data ReassessmentThere is a lack of data in the public domain that relate assayable levels of endotoxins activity in a test article using both the standard compendial method(s) and recombinant methods. We have reviewed relevant articles and have re-assessed the reported data, where possible, to understand genuine “head to head” comparability between recombinant and reference compendial methods. We are most interested in the alternative method’s ability to detect and quantify Gram negative bacterial endotoxins from the organisms likely to be found in a healthcare product manufacturing setting.
In the cited publications (below), we reassessed each sample by calculating the endotoxins activity test result for each recombinant method as a percentage of the corresponding value for the recovery of endotoxins activity determined using the referenced compendial method. We call this “relative recovery.”
For example, if Alternative Method 1 detects 3 EU/mL for Sample 1 and the Reference Compendial Method used for the same sample detects 5 EU/mL, then the calculated relative recovery for Method 1 as applied to Sample 1 is
(3 EU/mL ÷ 5 EU/mL) x 100 or 60%, meaning that the Alternative Method 1 recovered 60% of activity relative to the referenced USP method.
Unless otherwise noted, the reassessment parameters we applied include:
• Where multiple reference compendial methods were provided in a study, we compared the recovery of each recombinant method to the average of the reference compendial methods.
• Test results below any method’s LOQ or test results accompanied by invalid Positive Product Control (PPC) results were not included in reassessments.
• After the calculation of the relative recovery for each sample, the results were divided into a series of recovery ranges and graphed. The graphs represent the number of samples in each of the defi ned ranges. This presentation of the data enables visualization of possible method-specifi c variability within the data set.
• The data are referenced to a 50-200% recovery relative to the referenced compendial method. This recovery range is illustrated in each of the fi gures by a gray box around the data that fall within this range. Each fi gure is accompanied by a table (Tables 2-5) that provides a matrix of the results sorted by method within the referenced study. The compendial BET assumes a maximum potential variability of 50-200%. We have used that range here for convenience although data within that range may not be indicative of comparability depending on Gaussian distribution of individual test results.
• Recombinant methods for each publication are labeled “Method 1, 2, 3.” Although the same method may have been used in multiple studies, they are not uniformly labeled from study to study.
»
20 | | July/August 2020
MICROBIOLOGY »

pda.org/2020micro
OCTOBER 19-21VIRTUAL EXHIBITION: OCT. 19-20
2020 PDA RAPID MICROBIOLOGICAL METHODS WORKSHOP: OCT. 22-23#PDAmicro
NOW VIRTUAL!
This year marks a milestone for this popular Conference – 15 years of expert presentations, deep insights into regulations and advances, and constant inquiry that drives the industry forward.
We will be looking back across the years to see the ways in which the field has evolved and how we can take those lessons learned into the future.
Join us in October from the comfort of your home or office as we examine these questions and many more.
To learn more and register, visit pda.org/2020micro
15th AnnualPDA GlobalConference onPharmaceuticalMicrobiologyKeeping Microbiology in the Loop

Reassessment of published data can be challenging as there are numerous sources of analytical variation that may not have been addressed or reported in each publication but could contribute empirically to overall variability within and between studies.
• Recombinant reagents have no glucan pathway. Therefore, valid comparability studies should require the use of glucan blockers to <85> referenced methods to reduce or eliminate the eff ects of the Factor G pathway on the reference test results. If not blocked, the presence of glucans could cause the measured endotoxins activity using the naturally sourced lysate to be overestimated in comparison to the recombinant reagents thereby reducing relative recovery values.
• We cannot ascertain if the comparability tests were conducted simultaneously on the same prepared sample. The use of diff erent prepared samples or samples held under varying conditions could impact test results.
• The use of RSE for all calibration including standard curve preparation and PPC will eliminate the lot and method-specifi c requirement for potency determination of CSEs, which could add to the variability of the tests.
Results
Study 1: Th orne et al. 2010 An article published by Thorne and co-workers compared the relative recovery of endotoxins activity in air samples from livestock facilities using both the reference compendial kinetic chromogenic method and an rFC product. The Thorne study was extensive, looking at approximately 400 field samples and 500 field-derived laboratory samples.
While the Thorne data demonstrate a fairly consistent level of comparability between detection of endotoxins activity by the compendial and recombinant methods, the types of Gram-negative microorganisms and endotoxins typically found in livestock facility dust are irrelevant to the recovery of endotoxins autochthonous to parenteral manufacturing facilities, equipment and utilities (Zucker et al., 2000; Zhao et al., 2014, Reid, 2019). In addition, the methods used for airborne sample collection and preparation are inconsistent with methods used in a pharmaceutical laboratory.
Study 2: Chen and Mozier, 2013Chen and Mozier provide one of the few published comparability studies conducted on routine parenteral product intermediates with assayable levels of endotoxins from autochthonous manufacturing sources. Their study design is complex and looks not only at a comparison of the recombinant method to four diff erent compendial reference methods on thirteen diff erent sample formulations and one CSE control, but also measures levels of glucan activity and examines the eff ect of freeze/thaw cycles on test data. Glucan blockers were not used except as noted. In addition, the study was conducted by
diff erent analysts and diff erent laboratories. Of the thirteen product samples the original source authors eliminated three from their analysis (23%) because of loss of activity during freeze/thaw. Table 1, ordered by increasing glucan activity, is a summary of all samples tested in the study.
Table 1. Comparison of rFC and Compendial Standard Methods, Chen and Mozier 2013
Sample Glucan pg/mL Relative Recovery (no glucan blocker)
1 negative 106%
2 negative 66%
11 negative 77%
13 negative 76%
141 Not tested 92%
7 20 131%
10 47 28%
3 112 90%
6 7600 41%
8 >20000 19%
1Sample 14 is the 1 EU/mL control
The data presented in Table 1 is a compilation of data from the measurement of glucan activity and relative recovery using the recombinant Factor C method. All samples with no glucan (samples 1, 2, 11, 13) fell within the 50-200% recovery range, but generally below 100% recovery. Data for samples 7, 10, 3, 6, and 8 suggest, as expected, that lower glucan levels have less of an eff ect on relative recovery than high glucan levels. The outlier in this case is sample 10, identifi ed as a protein in a lipid formulation. Although these data were generated without the use of a glucan blocker, Chen and Mozier demonstrated that adding a glucan blocker to the standard methods for the analyses of Samples 6 and 8 did reduce their reactivity to the glucans (data not shown). The blocking data suggest that the eff ectiveness of the blocker depends not only on the sample but also on which reference compendial method is used.
Study 3: Reich et al. 2014Reich and co-workers presented a study that compared the recovery of endotoxins activity in a few “natural waters” including rivers, swimming ponds, quarries, spring water, tap water, rain barrel water, mineral water and deionized water. It was unclear from the description of the experimental design if the standard method was supplemented with a glucan neutralizing buff er. These data are summarized in Figure 1 and Table 2.
Figure 1 indicates that 29% of all samples tested fell below 50% - 200% recovery range. Recombinant analysis of a deionized water sample recovered only 7% of the standard lysate activity using methods 2 and 3 (data not shown) and was not compared to Method 1. Figure 1 and Table 2 suggest the pattern of endotoxins detection activity recovery in this study is much lower for Method 1 than for Methods 2 and 3, and Method 3 over-estimated endotoxins activity in three cases.
» MICROBIOLOGY »
22 | | July/August 2020

Study 4: Kikuchi et al. 2017Kikuchi et al. (2017) examined recoveries of endotoxins activity from three diff erent sources: 1) purifi ed LPS from a variety of Gram-negative microorganisms, 2) “Naturally Occurring Endotoxin” (NOE), a suspension of outer membrane vesicles and cell wall components shed from Gram-negative microorganisms grown under laboratory conditions and 3) water drawn from various sources the authors labeled “natural waters”. These natural waters were lake water, river water, household wastewater (domestic sewage), mineral water and tap water.
This study used three reference kinetic chromogenic methods: K-QCL (Lonza), ES-II (Fuji Film/Wako), an LAL reagent with a glucan blocker included in the formulation (Tsuchiya, et al., 1990), and Endospecy (Seikagaku), a TAL lysate where the Factor G pathway has been fractionated out of the formulation (Obayashi et al., 1985). Since Endospecy has no Factor G pathway, it was the most relevant comparator for re-assessment of the relative recovery calculations for the two rFC reagents and one rCR reagent. Because of the importance of the Kikuchi data to understanding both the questions of glucan involvement and detection of endotoxins from autochthonous sources, we are reporting our re-assessment only of the samples identifi ed as “natural waters.” (Note that the “household waste” data point was eliminated from our re-assessment of “natural waters” as it is irrelevant to healthcare product manufacturing.)
The re-assessed data comparing relative recovery for “natural waters” are shown in Figure 2 and Table 3.
This re-assessment indicated that one-third of all samples tested, representing all recombinant methods, fell below 50% relative recovery. Because all reagents compared in this re-analysis had no glucan pathway, the data suggest the under-estimation of activity resulted from something other than glucan activity.
Summary data in Table 3 indicate that Methods 1 and 2 showed similar underestimation results. Method 3 was signifi cantly diff erent in that two-thirds of the samples recovered under 50% of the standard method.
Study 5: Reid, 2019A study reported by Nicola Reid tested samples from pharmaceutical waters sampled a) post-deionization and b) post-carbon treatment, the former being a direct feed to WFI generation. In this analysis, methods evaluated included three rFC methods and one rCR method. The referenced compendial methods were supplemented with glucan blockers as instructed by the reagent manufacturers. Data from the deionized water study are presented in Figure 3 and Table 4.
Figure 3 shows that 41% samples tested using the three recombinant methods recovered less than 50% of endotoxins activity relative to a referenced kinetic chromogenic compendial method. The data in Table 4 further illustrates that, relative to the referenced method, all alternate recombinant methods had signifi cant numbers of under-quantitated samples, with Method 4 showing 89% of all samples tested by that method being underestimated.
« MICROBIOLOGY »
www.americanpharmaceuticalreview.com | | 23
Figure 1. Relative Recovery, Natural Waters, Reich et al.
Table 2. Comparison of Three Recombinant Methods, Reich et al.
Recovery Range Method 1 Method 2 Method 3
0-50% 64% 19% 14%
51-200 36% 81% 64%
>200 0% 0% 21%
Figure 2. Relative Recovery, Natural Waters, Kikuchi et al.
Table 3. Comparison of Three Recombinant Methods for Natural Waters, Kikuchi et al.
Recovery Range Method 1 Method 2 Method 3
<50% 17% 17% 67%
51-200% 83% 83% 33%
>200% 0% 0% 0%

The Reid study also analyzed water sampled from the post-carbon treatment stage upstream of the WFI production process (Figure 4 and Table 5).
Data presented in Figure 4 and Table 5 suggest that the relative recoveries of endotoxins activity in water sampled after carbon treatment were consistently low in the four alternative methods, with a total of 82% of the all samples tested showing relative recoveries less than 50%. Method 3 did not recover activity in any sample above the 50% relative recovery mark.
Study 6, Piehler, et al. 2020In 2020 Piehler and co-workers published an article on the comparison of LAL and rFC assays over the course of fi ve years while employing commercially available profi ciency test samples used for the training of laboratory analysts. While all testing results confi rmed the labeled nominal value of the profi ciency sample within the range of 50-200%, one sample did not meet the relative recovery requirements of this re-assessment study.
The authors indicated that each of these profi ciency samples were of unknown composition. However, when we contacted the manufacturer of these products, we were told that they were purifi ed, formulated and lyophilized LPS (personal communication). The source and identity of the bacterial species used to generate the purifi ed LPS was not disclosed. Although one result fell below 50%, the overall pattern of these results clustered around 100% recovery, which would be expected by any method using only purifi ed LPS.
Discussion This report presents no original experimental data. It is a review in which we reassessed data available from published reports purporting to evaluate comparability among multiple reference compendial methods and available recombinant methods. In our opinion while none of these studies meets comparability
» MICROBIOLOGY »
24 | | July/August 2020
Table 4. Comparison of Four Recombinant Methods for Pharmaceutical Deionized Water, Reid
Recovery Range Method 1 Method 2 Method 3 Method 4
<50% 20% 20% 40% 89%
51-200% 80% 80% 60% 11%
>200% 0 0 0 0
Figure 4. Relative Recovery, Pharmaceutical Carbon Treated Waters, Reid
Table 5. Comparison of Four Recombinant Methods for Pharmaceutical Carbon Treated Water, Reid
Recovery Range Method 1 Method 2 Method 3 Method 4
<50% 71% 86% 100% 71%
51-200% 29% 14% 0% 29%
>200% 0% 0% 0% 0%
Figure 5. Relative Recovery, Profi ciency Samples, Piehler et al.
Figure 3. Relative Recovery, Pharmaceutical Deionized Waters, Reid

requirements in the compendial sense, they do provide general trends that merit discussion.
The Thorne study is unique, but since it is undoubtedly picking up aerosolized endotoxins from enteric microorganisms autochthonous to livestock pens, we believe that the results are not relevant to the Gram-negative non-fermenting aquatic microorganisms typically found in pharmaceutical water systems (Reid, 2019). Enterobacteriaceae species are exceedingly uncommon in parenteral manufacturing or implantable device manufacturing systems, ingredients or components.
The Chen and Mozier study objectives were clearly relevant in that they included testing of pharmaceutical product intermediates and therefore the possibility of measuring autochthonous endotoxins and glucans. However, the number of experimental variables made the data diffi cult to interpret. The exclusion of some data and inclusion of “outliers” may question the robustness of the assays. Still, we do feel that if the experimental variables were reduced and controlled, this type of study design with suffi cient replicate samples would be precisely what is needed to demonstrate comparability. However, we would expect to see such studies performed by many sponsoring laboratories on the widest possible array of ingredients, intermediates, product formulations and components. It is only with a large population of studies that the capability, ruggedness and
reproducibility of an alternate method can be known with suffi cient statistical weight.
Despite some authors’ stated beliefs that comparability between the recombinant reagents and the standard compendial methods are established, we found that there are consistent patterns of low relative recovery among recombinant methods for testing of “natural” and pharmaceutical waters (Table 6).
In our re-assessment of the data, although the Reich, Kikuchi and Reid reported analysis performed with diff erent types of waters (“natural” and “pharmaceutical”), a consistent pattern indicates that under-estimation by the recombinant reagents emerged in all these studies. Additionally, each study appeared to refl ect a level of method-specifi c bias, suggesting that, at this point in their development, the recombinant methods are not similar enough in formulation or performance to be considered interchangeable.
« MICROBIOLOGY »
www.americanpharmaceuticalreview.com | | 25
Table 6. Summary Table, Average of All Samples, All Methods
Recovery Range
Reich, et al
Kikuchi, et al
Reid Deionized
Reid, Post Carbon
<50% 29% 33% 41% 82%
51-200% 63% 67% 59% 18%
>200% 7% 0% 0% 0%
In this webinar, attendees will receive an introduction to the groundbreaking Sievers Eclipse BET Platform to understand why it was created and how it works to simplify and automate endotoxin assay setup, while maintaining full compliance with USP <85>. With Eclipse, compliant 21-sample assays can be set up in as little as 9 minutes, leading to substantial efficiency gains.
This webinar will also focus on how to evaluate this revolutionary technology. From comparability of analytical results across platforms to data integrity and validation testing, this webinar will leave attendees with a solid understanding of how the Eclipse platform stacks up next to other technology on the market, and how it can be evaluated and validated in a QC lab to demonstrate viability for routine endotoxin testing.
IN THIS WEBINAR YOU’LL LEARN:
• Why and how the Sievers Eclipse platform was developed• How the Eclipse platform increases efficiency and automates endotoxin testing• How the Eclipse platform aligns with USP <85>, EP 2.6.14, and JP 4.01• Comparability of analytical results across different platforms• Data integrity• Validation testing and validation tools available to customers
View ON-DEMAND at: https://bit.ly/2XNqSZ6 SPEAKERS
Dave Wadsworth(Presenter)Global Product Manager, Bio-DetectionSUEZ
Sydney Jannetta(Presenter)Product Application Specialist, Life Sciences SUEZ
Mike Auerbach(Moderator)Editor-in-Chief,American Pharmaceutical Review
ON-DEMAND WEBINAR
SIEVERS ECLIPSE BET PLATFORM
A Closer Look at Efficiency Gains, Comparability, and Analytical Results

The Kikuchi data are particularly insightful because that was the only study in which possible glucan interference was mitigated by the removal of the Factor G pathway in the referenced formulation. Despite this unique formulation, the data follow the same overall patterns of under-estimation as the other investigations using water sourced testing materials.
Data offered by Reid (2019) represent the only studies of true pharmaceutical waters, and do not exhibit significantly different patterns in recoveries than did the Reich and Kikuchi studies. The data consistently show a tendency toward low recovery, and overestimation by any recombinant method was rare. The proprietary nature of these different recombinant reagents and their formulations prevent us from discerning the possible cause(s) of these analytical differences.
The validation of alternative recombinant methods requires a clear and statistically supportable demonstration of the equivalence of test results compared to the compendial methods (USPa, USPb, USPc, USPd, 2020; FDA, 2012). A satisfactory outcome in positive product control (PPC), performed using RSE or CSE, must not be presumed to be sufficient to demonstrate “validation” of recombinant methods or any other category of alternative method. The purpose of the PPC is a system suitability control conducted using existing validated test methods to assure that no residual product interference remains in the prepared sample. Alone, the PPC test is an insufficient criterion for the establishment of equivalency or non-inferiority to the compendial methods.
We acknowledge that each of the studies that were re-assessed represents a statistically small data set and that significantly, most studies were published without a detailed explanation of their experimental designs. The small data set does not allow for a clear statistical conclusion regarding non-inferiority of any of the evaluated alternative methods to the reference compendial method. However, even with differences in experimental design, our observed consistent pattern of underestimation of autochthonous endotoxins activity by recombinant reagents can potentially represent a patient safety risk. It would be irresponsible to assume recombinant reagent comparability until a sufficient number of well-designed studies with consistent appropriate statistical assessments have been completed.
Any meaningful studies to prove equivalence, comparability or non-inferiority of a test method must be designed to generate enough data to establish statistical reproducibility. Three trials are often considered sufficient in some validation exercises but demonstrating the suitability of a new assay approach to replace an established compendial method requires indisputable confidence. A new compendial method can be accepted as validated only after rigorous testing has been conducted and peer-reviewed by suitable field experts to ensure that the method has been assessed over a full range of test conditions and with appropriate statistical validity.
Our recommendations for future comparability studies include:
1. Construct a well-controlled experimental design with a clear objective.
2. Clearly define material handling to assure homogeneity and stability of test samples.
3. Coordinate testing to assure that all analyses are done concurrently and on the same sample.
4. Use glucan blockers for reference methods to diminish the risk of standard method over-estimation of endotoxins activity.
5. Employ RSE as the calibration standard to eliminate variation associated with CSE potency determination.
6. Select test samples containing assayable levels of activity that can properly assess contamination arising from autochthonous sources.
7. Define and establish a standard algorithm to evaluate data from comparability studies.
ConclusionWhile we are always hopeful that better, quicker, and less environmentally impactful analyses become available for industry application, continued product quality and patient safety require that we do not accept any alternative method under any circumstance until it has been thoroughly studied and comparability data are scientifically vetted and pass compendial, statistical and regulatory scrutiny. Given these concerns, the authors believe that the current published studies are not complete validation studies demonstrating comparability or equivalence. We believe they are best characterized as preliminary or proof of concept studies for wholly new test methods with the implication that further, much more detailed and controlled comparability studies need to be conducted.
References1. Abate, Wondwossen, Anas A. Sattar, Jian Liu, Myra E. Conway and Simon K. Jackson. 2017.
Evaluation of recombinant factor C assay for the detection of divergent lipopolysaccharide structural species and comparison with Limulus amebocyte lysate-based assays and a human monocyte activity assay. Vol.66:888-897 Journal of Medical Microbiology.
2. Akers, James, Dennis Guilfoyle, David Hussong, Karen McCullough, Robert Mello, Donald Singer, Edward Tidswell, Radhakrishna Tirumalai. 2020. Functional Challenges for Alternative Bacterial Endotoxins Tests. Part 1. Attributes for Alternative Tests. Am Pharm. Rev. 23(4): 76-81
3. Bolden, Jay. 2020. Application of Recombinant Factor C Reagent for the Detection of Bacterial Endotoxins in Pharmaceutical Products and Comparability to Limulus Amebocyte Lysate. Pharmacopeial Forum, Stimuli to the Revision Process. 45(3)
4. Bolden, Jay and Kelly Smith. 2017. Application of Recombinant Factor C Reagent for the Detection of Bacterial Endotoxins in Pharmaceutical Products. J Pharm Sci and Tech 71: 405-412
5. Chen, Lin and Ned Mozier. 2013. Comparison of Limulus amebocyte lysate test methods for endotoxin measurement in protein solutions. Journal of Pharmaceutical and Biomedical Analysis. 80:180–185
6. Ding, J.L. and B. Ho. 2001. A new era in pyrogen testing. TRENDS in Biotechnology (8)
7. Ding, J.L. and T. Navas. 1995. Molecular cloning and sequence analysis of Factor C cDNA from the Singapore horseshoe crab, Carcinoscorpius rotundicauda. Mol. Marine Biol. And Biotech. 4(1): 90-103
8. Iwanaga, Sadaaki. 2002. The molecular basis of innate immunity in the horseshoe crab. Current Opinion in Immunology. 14(1): 87-95.
9. Kambayashi, J., M. Yokota, M. Sakon, E. Shiba, T. Kawasaki, T. Mori, M. Tsuchiya, H. Oishi, S. Matsuura. 1991. A novel endotoxin-specific assay by turbidimetry with Limulus amoebocyte lysate containing β-glucan. Journal of Biochemical and Biophysical Methods. 22(2): 93-100
» MICROBIOLOGY »
26 | | July/August 2020

10. Kikuchi, Y., Y. Haishima, C. Fukui, T. Murai, Y. Nakagawa, A. Ebisawa. 2017. “Collaborative Study on the Bacterial Endotoxins Test Using Recombinant Factor C-based Procedure for Detection of Lipopolysaccharides,” Pharmaceutical and Medical Device Regulatory Science 48: 252-260.
11. Loverock, Bruce, Barry Simon, Allen Burgenson, and Alan Baines. 2010. A Recombinant Factor C Procedure for the Detection of Gram-negative Bacterial Endotoxin. Pharmacopeial Forum, Stimuli to the Revision Process. Vol. 36(1):321-329
12. Marius, Marine, Frederic Vacher and Thierry Bonnevay. 2020. Comparison of LAL and recombinant Factor C endotoxin testing assays in human vaccines with complex matrices. PDA Journal of Pharmaceutical Science and Technology March 2020, pdajpst.2019.010389; DOI: https://doi.org/10.5731/pdajpst.2019.010389
13. Mizumura, Hikaru, Norihiko Ogura, Jun Aketagawa, Maki Aizawa, Yuki Kobayashi, Shun-ichiro Kawabata, Toshio Oda. 2017. Genetic engineering approach to develop next-generation reagents for endotoxin quantifi cation. Innate Immunity 23(2): 136-146
14. Muroi, Masashi, Norihiko Ogura, Hikaru Mizumura, Jun Aketagawa, Toshio Oda, Ken-ichi Tanamoto. 2019. Application of a Recombinant Three-Factor Chromogenic Reagent, PyroSmart, for Bacterial Endotoxins Test Filed in the Pharmacopeias. Biol. Pharm. Bull 42(12):2024-2037
15. Obayashi T, Tamura H, Tanaka S, Ohki M, Takahashi S, Arai M, Masuda M, Kawai T. 1985. A new chromogenic endotoxin-specifi c assay using recombined limulus coagulation enzymes and its clinical applications. Clin Chim Acta. 149(1):55-65.
16. Piehler M, R. Roeder, S. Blessing and J. Reich. 2020. Comparison of LAL and rFC Assays - Participation in a Profi ciency Test Program between 2014 and 2019. Microorganisms 2020, 8, 418; doi:10.3390/microorganisms8030418
17. Reich J, K. Heed K, H. Grallert. Detection of naturally occurring bacterial endotoxins in water samples. European Pharmaceutical Review [Internet]. 2014 Dec 23 [cited 2018 Apr 3];19(6):67–8. https://www.europeanpharmaceuticalreview.com/whitepaper/29826/whitepaper-detection-of-naturally-occurring-bacterial-endotoxins-in-water-samples/
18. Reid, Nicola. 2019. A global perspective for quantify8ing all endotoxins within pharmaceutical water systems. Presented at PharmaLab, Dusseldorf, Germany.
19. Thorne, Peter S., Sarah S. Perry, Rena Saito, Patrick T. O’Shaughnessy, John Mehaff y, Nervana Metwali Thomas Keefe, Kelley J. Donham, Stephen J. Reynolds. 2010. Evaluation of the Limulus Amebocyte Lysate and Recombinant Factor C Assays for Assessment of Airborne Endotoxin. Appl. Env. Microbiol. 76(15): 4988-4995.
20. Tsuchiya, M., A. Takaoka, N Tokioka, S. Natsuura. 1990. Development of an endotoxin-specifi c Limulus amebocyte lysate test blocking beta-glucan-mediated pathway by carboxymethylated curdlan and its application. J. Journal Bacteriol. 45(6): 903-911
21. United States Food and Drug Administration. 2012. Guidance for Industry: Pyrogen and Endotoxins Testing: Questions and Answers. https://www.fda.gov/regulatory-information/search-fda-guidance-documents/guidance-industry-pyrogen-and-endotoxins-testing-questions-and-answers
22. United States Pharmacopeia. 2020a. <85>, “Bacterial Endotoxins Test.”
23. United States Pharmacopeia. 2020b. <1223>, “Validation of Alternative Microbial Methods”
24. United States Pharmacopeia. 2020c. General Notices 6.30
25. United States Pharmacopeia. 2020d <1225>, “Validation of Compendial Procedures”
26. Zhao, Yang, Andre J.A. Aarnink, Mart C.M. DeJong, Peter W.G. Groot Koerkamp. 2014. Airborne Microorganisms from Livestock Production Systems and Their Relation to Dust. Critical Reviews in Environmental Science and Technology. 44: 11071-1128
27. Zucker BA, Trojan S, Müller W. 2000 Airborne gram-negative bacterial fl ora in animal houses. J Vet Med B Infect Dis Vet Public Health. 47(1):37-46. doi:10.1046
/j.1439-0450.2000.00308.
« MICROBIOLOGY »
www.americanpharmaceuticalreview.com | | 27
Regulatory requirements, lot release, in-process testing, risk mitigation, live mycoplasma requirements, sensitivity, specificity, validation considerations, 28-day vs same day, compendial vs. rapid microbial – What are your mycoplasma questions? Our panel of experts will answer all your questions regarding implementation and validation of a rapid mycoplasma system.
In this on-demand webinar, you will get answers to your questions.
Topics covered:
• Key points to consider before validating a qPCR Mycoplasma method
• Different approaches to address regulatory comparability requirements of qPCR to compendial method
• Validation guidance for qPCR mycoplasma method
Who should view:
• QC/QA Managers
• Process Analytics Managers
• Process Development Managers
• Regulatory Affairs Managers
SPEAKERS
Mycoplasma Matters Answers to Your Real-World Mycoplasma Testing Questions
Register and view on-demand at https://bit.ly/30pN8tx
ON-DEMAND WEBINAR
John DuguidPresenter
Senior Director, Research & Development, Vericel Corporation
Mike Brewer Presenter
Director, Global Principal Consultant, Regulatory,Thermo Fisher Scientific
Michael SherriffPresenter
Associate Director, Pharma Analytics,Thermo Fisher Scientific
Suzy BrownPresenter
Field Application Specialist, Pharma Analytics,Thermo Fisher Scientific
Darren BauerPresenter
Product Manager,Thermo Fisher Scientific
Mike Auerbach Moderator
Editor-in-Chief, American Pharmaceutical Review

»
28 | | July/August 2020
BIOPHARMACEUTICAL DEVELOPMENT »
Danny K. Chou, PharmD, PhDPresidentCompassion BioSolution, LLC
Mark BumillerTechnology ManagerEntegris, Inc.
Opportunities and Pitfalls in the Analysis of Subvisible Particles during Biologics Product Development and Quality Control
IntroductionSubvisible particulate matter testing in injectable drugs has been required for many parenteral drugs since USP <788> was fi rst implemented in the early nineteen eighties.1 The acceptance criteria has not changed through the years with a focus on particle counts at 10 and 25 µm per container for small volume parenterals (SVP) and large volume parenterals (LVP), see Figure 1.
Now that protein based therapeutics are more common, USP<787> was written to accommodate the diff erences in the products and sample volumes. Other trends in both industry and regulatory oversight have
Figure 1. Particle count limits in SVP and LVP
been to better understand and quantify protein aggregation and associated immunogenicity.2,3
The relationship between interest in quantifying protein aggregation and enhancing particle counting measurement techniques at smaller sizes (below 2 um and submicron range) is driven by multiple infl uences including:
• Protein products contain a wide size range of aggregates, nm –μm and it is highly useful to characterize and better understand what sub-population is more relevant to drug safety
• Subvisible Particles are critical species on the Protein Aggregation Pathway
• Subvisible particle counts provides a sensitive indication of protein aggregation
• Formation of subvisible particles (nano& micro) is an early step on aggregation pathway and precursor to visible particulate formation
• Even trace levels of particles can impact subsequent stability of protein solutions; aggregates beget aggregates
Other factors contributing to the interest in extending the range of analytical techniques include the need to better understand the

Let’s Bond! Each Step Change Can Advance Your Chromatography ProcessAs your partner of choice, Sartorius off ers streamlined solutions with expert design and operational support so that you can focus on maximizing yield at any scale.
Schedule a consultation today: www.sartorius.com/lets-bond
Simplifying Progress
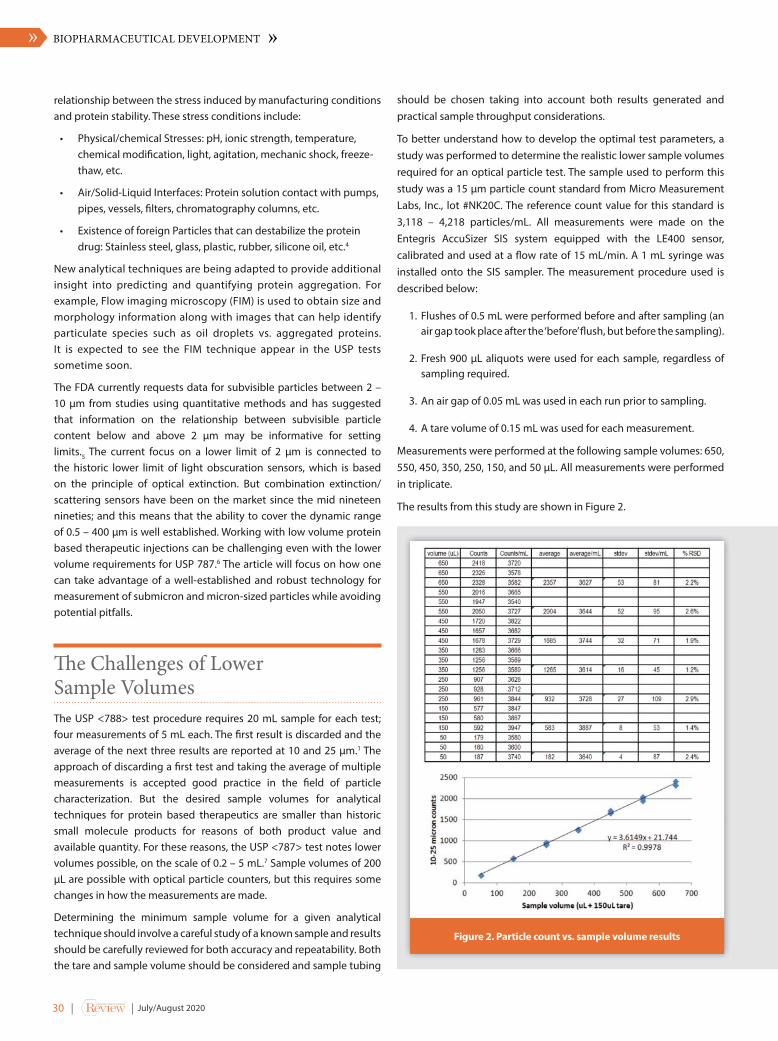
relationship between the stress induced by manufacturing conditions and protein stability. These stress conditions include:
• Physical/chemical Stresses: pH, ionic strength, temperature, chemical modifi cation, light, agitation, mechanic shock, freeze-thaw, etc.
• Air/Solid-Liquid Interfaces: Protein solution contact with pumps, pipes, vessels, fi lters, chromatography columns, etc.
• Existence of foreign Particles that can destabilize the protein drug: Stainless steel, glass, plastic, rubber, silicone oil, etc.4
New analytical techniques are being adapted to provide additional insight into predicting and quantifying protein aggregation. For example, Flow imaging microscopy (FIM) is used to obtain size and morphology information along with images that can help identify particulate species such as oil droplets vs. aggregated proteins. It is expected to see the FIM technique appear in the USP tests sometime soon.
The FDA currently requests data for subvisible particles between 2 – 10 µm from studies using quantitative methods and has suggested that information on the relationship between subvisible particle content below and above 2 µm may be informative for setting limits.5 The current focus on a lower limit of 2 µm is connected to the historic lower limit of light obscuration sensors, which is based on the principle of optical extinction. But combination extinction/scattering sensors have been on the market since the mid nineteen nineties; and this means that the ability to cover the dynamic range of 0.5 – 400 µm is well established. Working with low volume protein based therapeutic injections can be challenging even with the lower volume requirements for USP 787.6 The article will focus on how one can take advantage of a well-established and robust technology for measurement of submicron and micron-sized particles while avoiding potential pitfalls.
Th e Challenges of Lower Sample VolumesThe USP <788> test procedure requires 20 mL sample for each test; four measurements of 5 mL each. The fi rst result is discarded and the average of the next three results are reported at 10 and 25 µm.1 The approach of discarding a fi rst test and taking the average of multiple measurements is accepted good practice in the fi eld of particle characterization. But the desired sample volumes for analytical techniques for protein based therapeutics are smaller than historic small molecule products for reasons of both product value and available quantity. For these reasons, the USP <787> test notes lower volumes possible, on the scale of 0.2 – 5 mL.7 Sample volumes of 200 µL are possible with optical particle counters, but this requires some changes in how the measurements are made.
Determining the minimum sample volume for a given analytical technique should involve a careful study of a known sample and results should be carefully reviewed for both accuracy and repeatability. Both the tare and sample volume should be considered and sample tubing
should be chosen taking into account both results generated and practical sample throughput considerations.
To better understand how to develop the optimal test parameters, a study was performed to determine the realistic lower sample volumes required for an optical particle test. The sample used to perform this study was a 15 μm particle count standard from Micro Measurement Labs, Inc., lot #NK20C. The reference count value for this standard is 3,118 – 4,218 particles/mL. All measurements were made on the Entegris AccuSizer SIS system equipped with the LE400 sensor, calibrated and used at a fl ow rate of 15 mL/min. A 1 mL syringe was installed onto the SIS sampler. The measurement procedure used is described below:
1. Flushes of 0.5 mL were performed before and after sampling (an air gap took place after the ‘before’ fl ush, but before the sampling).
2. Fresh 900 µL aliquots were used for each sample, regardless of sampling required.
3. An air gap of 0.05 mL was used in each run prior to sampling.
4. A tare volume of 0.15 mL was used for each measurement.
Measurements were performed at the following sample volumes: 650, 550, 450, 350, 250, 150, and 50 μL. All measurements were performed in triplicate.
The results from this study are shown in Figure 2.
Figure 2. Particle count vs. sample volume results
»
30 | | July/August 2020
BIOPHARMACEUTICAL DEVELOPMENT »

Another experimental parameter worth consideration when minimizing sample volume is mixing. Mechanical stir bars can’t fi t into very small sample containers or well plates when using automated techniques. The older approach of mixing by hand during the measurement is cumbersome and cannot adapt well to automation. One new approach is push/pull mixing using the syringe sampler itself. The sample is pulled up through the sensor and pushed back into the container multiple times prior to the actual analysis.
When working with protein based therapeutics it is worth investigating if this push/pull mixing introduces enough shear and/or interfacial stress on the sample to induce aggregation. Parameters to study include the inner diameter (ID) of the sample tube/needle and the number of times the sample is transported. If the sample undergoes three push/pull mixes and then 4 measurements the sample makes 10 trips [(3x2) + 4] through sample tube/needle. Previous studies have reported on the eff ect of interfacial stress on protein aggregation (8). When done properly in a systematic way, this measurement technique can essentially serve as a method to study small scale interfacial stress impact on the protein. For this study, a short investigation was carried out before performing the studies shown in this paper and a larger ID needle was chosen to minimize the interfacial stress experienced by the protein samples.
Experimental MethodMaterials: The protein used was NIST reference material 8671 (NISTmAb), humanized IgG1κ monoclonal antibody lot number 14HB-D-002, expiration date April 2021, concentration 10 mg/mL. Two vials of the same lot number were used (“older” and “new”). NISTmAb is a homodimer that has undergone biopharmaceutical industry standard upstream and downstream purifi cation to remove process related impurities with a molecular weight of approximately 150 kDa. The intensity mean diameter was analyzed using the Entegris, Inc. Nicomp DLS system with a 35 mW laser at 658 nm wavelength and high gain avalanche photo diode detector at 90°. The information value for observed average hydrodynamic diameter by dynamic light scattering (DLS) is 9.96 nm.
The protein aggregates were measured using the Entegris, Inc. AccuSizer A2000 MPA microplate analyzer with the model LE400 sensor, dynamic range 0.5 – 400 µm. This instrument is based on the principle of single particle optical sizing (SPOS), an advancement on the older technique of light obscuration. The intensity mean diameter was analyzed by DLS at a concentration of 1 mg/mL, temperature of 23 C, measurement duration of 7 minutes at concentration of 1 mg/mL. The reported intensity mean was 10.2 nm.
Measurement protocol: A well in the microplate was fi lled with 1.5 mL of the diluted sample. Mixing was performed using the push/pull technique prior to the fi rst analysis. The tare volume was 100 µL and sample volume of 250 µL. Four analysis were performed, the fi rst discarded and then the last three were averaged. The sample was pushed to waste after every measurement, although sample preservation is an option.
Results
Aggregation Study # 1; New vs. older NIST 8671 sampleA plot of particle count/mL vs particle size for the new vs. older sample is shown in Figure 3. The higher count in the 1 micron and below range is an indication that the older sample had experienced a higher degree of aggregation, presumably due to the additional freeze, thaw cycle and possible aging.
Study 2: Diluent selection; PBS vs. DI waterIt is well documented that proteins are typically more stable in buff ers such as phosphate buff er saline (PBS) than in distilled water (DI). A short study was performed to investigate the eff ect of diluting the NIST 8671 mAb in fi ltered PBS vs. fi ltered DI water. First the diluents were analyzed to establish an acceptable background. Then 25 µL of NIST 8671 was diluted into 9.9 mL of fi ltered PBS and DI water. The results are shown in Figure 4. While the DI water reported a lower background particle count than the PBS, the diluted protein counts were lower in the PBS than in the DI water. This indicates that dilution in DI water probably caused a greater degree of aggregation.
« BIOPHARMACEUTICAL DEVELOPMENT »
www.americanpharmaceuticalreview.com | | 31
Figure 3. Particle concentration for new (blue) vs. old (red) NIST 8671 sample

Study 3: Before and aft er heat stress at 60°C at three concentrations.
Sample preparation: Exposing the protein sample to elevated temperatures can cause unfolding and aggregation. Samples were
prepared at three concentrations; 20, 30, and 40 µL diluted into 9.9
mL filtered DI water. The samples were analyzed immediately after
preparation, and then after four, and twenty hours heat exposure
at 60°C.
The same measurement protocol as described above was followed
for all measurements.
Results: Figures 4-6 show concentration in particle count/mL vs. size
for the unstressed (T0), after fours hours (T4), and after 20 hours
(T20) heat stress at 60°C.
The increase in particle count after exposure to heat stress tracks the
expected aggregation behavior. The after heat stress concentrations
for the 40 µL exceed the sensor concentration limit at 0.5 µm, but
that does not change the study conclusion. As shown in fi gures 1
to 3, all samples would pass the USP<787> evaluation criteria at the
10 µm and 25 µm size range. However, data below 2 um provides
much greater insight into the changes that are occurring as the
protein is exposed to longer periods of thermal stress. With further
method development and optimization, the wider dynamic range of
the combined light obscuration and light scattering detector may
enable the application of SPOS technology in both formulation and
process development.
ConclusionsSeveral learning points were discovered over the course of these
studies. First, additional care must be taken when performing low
volume optical particle counting measurements. The choice of sample
tube or needle should be investigated to avoid shear or pumping
induced aggregation during the analysis. Push/pull mixing appears to
be a valid alternative to assure a well-mixed sample during the analyses.
Finally, this study shows that, for product development purposes, the
most useful data is generated from particles smaller than 2 µm; and
reporting and studying submicron particles can provide additional
insight into protein aggregation mechanisms.
References1. United States Pharmacopeia, <788>: Particulate Matter in Injections
2. Singh SK, Afonina N, Awwad M, et al. An industry perspective on the monitoring
of subvisible particles as a quality attribute for protein therapeutics. J Pharm Sci.
2010;99(8):3302-3321.
3. Food and Drug Administration (US) Guidance for Industry: Immunogenicity Assessment for
Therapeutic Protein Products. August 2014
4. Singh SK, Toler MR. Monitoring of subvisible particles in therapeutic proteins. Methods Mol
Biol. 2012;899:379-401.
Figure 4. Heat stress study for 20 µL sample
Figure 5. Heat stress study for 30 µL sample
Figure 6. Heat stress study for 40 µL sample
»
32 | | July/August 2020
BIOPHARMACEUTICAL DEVELOPMENT »

5. Kirshner, Susan, Offi ce of Biotechnology Products, Division of Therapeutic Proteins,
Regulatory Expectations for Analysis of Aggregates and Particles, 2012
6. Andrea Hawe, Frank Schaubhut, Raimund Geidobler, Michael Wiggenhorn, Wolfgang
Friess, Markus Rast, Christian de Muynck, Gerhard Winter, Pharmaceutical feasibility
of sub-visible particle analysis in parenterals with reduced volume light obscuration
methods, European Journal of Pharmaceutics and Biopharmaceutics, Volume 85, Issue 3,
Part B,2013, Pages 1084-1087
7. United States Pharmacopeia, <787>: Subvisible Particulate Matter in Therapeutic Protein
Injections
8. Douglas Nesta, Tatiana Nanda, Jing He, Matthew Haas, Shirley Shpungin, Igor Rusanov,
Robert Sweder and Charlene Brisbane. Aggregation from Shear Stress and Surface
Interaction: Molecule-Specifi c or Universal Phenomenon? Bioprocess International. April
17, 2017
About the AuthorsDanny Chou is a patient-centered biopharmaceutical industry veteran
with expertise in biopharmaceutical characterization, pre-formulation,
formulation, and fi ll-fi nish operations. Dr Chou has over 15 years of ex-
perience developing formulations and analytical methods for protein
pharmaceuticals and 20 years of combined clinical and R&D experience in
the pharmaceutical industry. Dr Chou is a subject matter expert in the de-
velopment and implementation of rational strategies for increasing pro-
tein stability during processing, storage, and delivery in both liquid and
solid state. Dr Chou also has extensive experience managing research and
manufacturing outsourcing both as a client as well as a contract research
service provider.
Mark Bumiller has worked in the fi eld of particle size analysis for over
thirty-fi ve years. Positions held include Product Manager at Hiac Royco
(5 years), Technical Support Manager and Vice President of Business
Development at Malvern Instruments (17 years), Vice President of Particle
Products at Horiba (6 years) and Technology Manager at Particle Sizing
Systems, LLC, and now Entegris (6 years). He has served as a member
of the expert committee for USP 788, the executive committee of the
International Fine Particle Research Institute (IFPRI) and the executive
committee of Particle Technology Forum of the American Institute of
Chemical Engineers. Mark is an active member of Technical Committee 24
within ISO helping to write standards for particle size and zeta potential
analysis. His B.S. in chemical engineering was earned at Carnegie Mellon
University in Pittsburgh, PA.
« BIOPHARMACEUTICAL DEVELOPMENT »
www.americanpharmaceuticalreview.com | | 33
Formulation and Development Strategies for Amorphous Solid Dispersion Drug Products
A large and increasing fraction of orally administered small molecules in pharma company pipelines have poor oral absorption due to low aqueous solubility or dissolution rate. To address this trend, evaluating formulation approaches for increasing oral bioavailability are becoming routine early on in formulation development programs. Amorphous solid dispersions (ASDs) are a prevalent technology for addressing oral bioavailability challenges, given the applicability and scalability of the technology across a diverse compound property space.
Developing ASDs requires an integrated approach, where bioperformance, physical and chemical stability as well as manufacturability are all considered. This webinar covers some general strategies for developing a successful amorphous solid dispersion formulation, from formulation intermediates to final dosage forms. Aspects of formulation screening, stability and manufacture will be covered including strategies for incorporating ASDs into immediate release tablets.
A case study demonstrating successful formulation of ASDs into a novel dosage form architecture will be presented.
In this webinar you’ll learn:
• Formulation screening strategies for amorphous solid dispersions• Details on an integrated approach for developing ASDs including performance,
stability and manufacture• Strategy for incorporating ASDs into dosage forms, including a novel dosage form
architecture for ASDs
SPEAKERS
Aaron Stewart(Presenter)Associate Principal ScientistLonza Pharma and Biotech
Jesus Rosales Soto(Presenter)Scientist IIILonza Pharma and Biotech
Mike Auerbach(Moderator)Editor-in-Chief, American Pharmaceutical Review
View ON-DEMAND at https://bit.ly/3idNJo1
ON-DEMAND WEBINAR

QC CORNER
Examining extractables and leachables is an important
safety issue as these substances can adversely impact the
health of patients. While assessing impurities arising from
the synthesis and degradation of the pharmaceutical
product itself has received much consideration over many
years, greater attention is now being paid to the migration
of mobile chemical substances from plastic components
used in the packaging and manufacturing processes of
pharmaceutical products.
Testing for leachables (substances that migrate under
normal conditions) and extractables (those that migrate
when exposed to solvent under harsh conditions) is critical
for the pharmaceutical and medical device industries
where packaging safety and toxicology studies are required
for product registration. To enable the identification of
potential extractables, the materials are exposed to stressing
conditions such as strong solvents, elevated temperatures,
and/or increased surface area. Substances observed are
identified and characterized per appropriate FDA, USP, or
ICH guidelines and further evaluated by a toxicologist to
determine if the substance is a potential hazard.
A new challenge: single-use systems
Single-use manufacturing systems, now widely used in the
pharmaceutical industry, are for the most part made from
plastic materials, and can be used to replace many of the fixed
stainless steel components that previously predominated
process equipment. The transition has facilitated a more
flexible way of manufacturing pharmaceuticals and led to
the current hot topic of continuous manufacturing. It allows
rapid switching between different products in the same
manufacturing suite, simply by exchanging one module for
another once a run is complete.
However, single-use systems come with their own
challenges, notably extractables and leachables. A safety
assessment must be performed to ensure that the polymeric
materials coming into contact with the drug product
do not contain impurities that might migrate out of the
material and into the final product at a level that negatively
impacts patient safety. Leachable substances also have the
potential to impede a drug’s efficacy or cause production
issues. For example, a breakdown product of the secondary
antioxidant Irgafos 168, found in polyethylene-film based
bags, has been discovered to inhibit cell growth.
Regulatory Expectations for E&L Evaluation
Although formal guidelines for E&L assessments have
not yet been enacted for Single Use Systems, there is
nonetheless a regulatory expectation that researchers will
test for these potentially harmful contaminants. Agencies
such as the FDA’s Center for Biologics Evaluation and
Research recommend a risk-based approach to evaluation.
As discussed, the purpose of evaluating extractables &
leachables is to demonstrate patient safety with respect to
the identity and quantity of potential leachables in the final
drug product and their potential toxicity to patients. The
purpose is not to test every material that comes in contact
with the product during the manufacturing process, but to
Single-use systems underline the rising significance of extractables and leachables studies
Janmeet Anant, Ph.D.Senior Regulatory Expert, BioprocessMilliporeSigma
Wayne K. Way, Ph.D.Pharma Analysis & QC StrategyMilliporeSigma
34 | | July/August 2020
Trust our analytical products for your prescription and OTC generic drugs compendial testing.
• Product characterization• Method development• Quality control• Release
Visit usSigmaAldrich.com/ PharmaCompendialQC
WHAT IFCOMPLETE CONFIDENCE CAME IN A PILL?
The life science business of Merck KGaA, Darmstadt, Germany operates as MilliporeSigma in the U.S. and Canada.
© 2020 Merck KGaA, Darmstadt, Germany and/or its affi liates. All Rights Reserved. MilliporeSigma and the vibrant M are trademarks of Merck KGaA, Darmstadt, Germany or its affi liates. All other trademarks are the property of their respective owners. Detailed information on trademarks is available via publicly accessible resources. 30772 02/20
30772_MSIG_Compendial_Testing_56x254.indd 130772_MSIG_Compendial_Testing_56x254.indd 1 2/28/20 11:02 AM2/28/20 11:02 AM
evaluate the risk and perform extractables testing based on the risk assessment. The
risk assessments published by both BPOG and USP <1665> draft, Characterization
of Plastic Materials, Components, and Systems Used in the Manufacturing of
Pharmaceutical Drug Products and Biopharmaceutical Drug Substances and
Products. evaluates criteria including temperature and duration of contact, chemical
nature of the process stream, materials of construction, and distance to the final drug
product/clearance steps.
Single-use system testing
Over the last few years, the implementation of specific extractable protocols for single-
use manufacturing systems have been based on two main efforts: the Biophorum
Operations Group (BPOG) industry protocol and USP <665> for fluid-contact plastic
components used in pharmaceutical processing, which is still in draft form and yet
to be finalized. The USP <665> draft guidance does not define any requirements
for analytical techniques, while the BPOG extractables protocol specifies the use of
liquid (LC) and gas chromatography (GC) linked with mass spectrometry (MS) for
identification and quantitation.
Reference materials for extractables and leachables
Reference standards may be used for a variety of purposes, for example to calculate a
relative retention time, ascertain system suitability, determine accuracy and identify
impurities. It is preferable to use reference materials that are certified to quantify a
specific extractable compound by a response factor or a calibration curve.
Given the number and chemical diversity of extractables, it is unreasonable to
expect that authentic reference compounds will be available to confirm each and
every identification. It is therefore necessary that levels of identification confidence
be established and appropriately utilized. Data typically available from GC/MS and
LC/MS analyses are used to identify individual extractables. Certified reference
materials can streamline this identification process, especially for priority substances
of toxicological concern. These materials are commercially available as individual
compounds or as mixtures of a larger number of common extractables.
Looking for certified reference materials?Find more than 200 certified reference materials (including mixtures) and analytical standards to screen for commonly found extractables and leachables.
sigmaaldrich.com/extractablesandleachables
www.americanpharmaceuticalreview.com | | 35

»
36 | | July/August 2020
SPECTROSCOPY »
Gennady Khirich & Ken SkidmoreAnalytical OperationsGenentech
Quantitative NMR in Biotherapeutic Drug Development: An Effi cient General-Purpose Tool for Process Analytics
Nuclear Magnetic Resonance (NMR) spectroscopy is a mature and versatile technology with a vast and rich history.1-6 It off ers non-destructive quantitative access to structural and dynamic information at the atomic level, and is a common analytical technology encountered in industry.7-15 Quantitative NMR (qNMR),16-18 which is the use of NMR for the identifi cation and quantifi cation of a target compound, is of particular importance within the pharmaceutical industry,19-22 where it is mostly used in support of small molecule applications where tracking impurities and maintaining mass balance plays a central role. With signifi cant advances in modern NMR instrumentation and software, the successful and routine implementation of qNMR in less traditional settings has become more common. One such setting involves applying qNMR to small molecule process impurities (SMPI) during the development and validation of the biopharmaceutical manufacturing process.23 Such analytics are typically performed in complex matrices comprised of protein, excipients, surfactants, buff er components, and salts and have historically resided within the domains of technologies based on mass spectrometry and chromatography. However, the fl exibility and speed off ered by NMR for the development and execution of such analyses has proven to challenge conventional wisdom with respect to selecting the appropriate analytical strategy for a given task.
From an analytical standpoint, the manufacturing process of protein-based biotherapeutics may be thought of as consisting of four major stages (Figure 1), each with its own set of unique questions to answer and challenges to overcome. The fi rst is cell culture and harvest, where the concentrations of media components, metabolites, and additives may need to be known during seed train media design or in the analysis of harvested cell culture fl uid. Next, there are a series of chromatographic purifi cation steps - which may be customized for a biotherapeutic if needed - with each chromatography pool representing a diff erent analytical matrix of buff er and dilute protein. Here it is often of interest to see how each purifi cation step performs with respect to clearance of certain target compounds, to see if a resin is suitable for reuse, or to assess whether buff ers have been
prepared improperly. Subsequently, the fi nal chromatography pool is processed via ultrafi ltration/diafi ltration (UFDF) to form a UFDF pool. This is a highly pure solution consisting of concentrated protein (≤ ~250 mg/mL) in its diafi ltration (DF) buff er, and is a particularly salient place to verify whether process components have been reduced to target levels and whether any unanticipated process impurities/leachables have been introduced (vide infra), particularly in the case of monoclonal antibodies (mAbs). Finally, drug substance (DS) and drug product (DP) involve matrices consisting of concentrated proteins in their respective full formulations. These contain components of the DF buff er along with excipients such as sugars, surfactants, and radical scavengers (i.e. amino acids). Of relevance here are any impurities/leachables introduced from the process of conditioning the UFDF pool, from storage in single-use technology (SUT) items, and/or from vials/stoppers/syringes. Rather than developing individual analytical protocols for measuring individual compounds in each matrix (as is common practice), the testing may be streamlined into a generic agglomeration of qNMR applications, treating many analytical scenarios on near-equal footing in terms of resources and workfl ow needed to execute a given study.
Figure 1. A generalization of the manufacturing process of a biotherapeutic (monoclonal antibody), with non-exhaustive lists
of salient qNMR applications at each stage.

Leading experts in:
Chemistry
Biochemistry
Microbiology
Molecular &Cell Biology
Virology
Global Services: Method Development/OptimizationValidation/Qualification/TransferProduct Release TestingStability Storage & Testing
Raw Materials TestingImpurities & Residuals TestingCharacterizationCell Banking
Cell Line CharacterizationViral ClearanceBioassaysProfessional Scientific Services
If the threat of unknown compounds lurking in your product is keeping you up at night, our Extractables & Leachables team will eliminate the nightmare of uncertainty.
Our clients say our E&L data quality is the best for seamless regulatory acceptance because we have:
• The Eurofins Extractables Index, a >1,500 compound proprietary database for LC/MS.
• Greater than 15 years experience in single-use, container closure, drug delivery device and medical device testing.
• Over 30 dedicated elite scientists focused strictly on study design, guidance and execution.
• Capacity and state-of-the-art instrumentation to perform studies following USP, PQRI and BPOG guidances and ISO 10993 standards.
Know your unknowns and look no further than the #1 E&L Lab in the industry at Eurofins.com/BPT.
We all fear the unknown.
www.Eurofins.com/BPT
BioPharmaProduct Testing

Hydrogen is ubiquitously found in virtually all organic compounds. Its natural isotopic abundance is > 99.9% in the form of protium, which is also conveniently NMR-active and is usually referred to simply as a proton with symbol 1H. Since the majority of organic molecules have at least a single non-labile proton, 1H-NMR thus serves the role as a generic detector of organic matter due to its ability to function as a universal proton detector. This is in contrast to other analytical detection schemes which may be based on a molecule’s ionization effi ciency, separability, or chromophoric sensitivity – all of which may diff er from one organic analyte to another.
All magnetically distinct sets of protons give rise to NMR signals which take the form of various peak patterns, dispersed across a spectrum (Figure 2). A peak’s location corresponds to that nucleus’ magnetic response to controlled perturbation with radiofrequency (RF) pulses against a static background magnetic fi eld provided by a superconducting NMR magnet. This response is directly related to the exact chemical environment for a given proton within the context of the structure of the overall molecule. Moreover, the integrated area of each NMR signal is stoichiometrically proportional to the number of equivalent nuclei in the entire sample that contribute to that particular signal. This is the fundamental principle that renders NMR quantitative. Two additional unique advantages are as follows. First, the quantitative nature of NMR signals is not infl uenced by the identity of the compound from which they originate (i.e. “a mole of protons is a mole of protons”a); thus, there are no diff erential response factors that may confound analysis. Second, a given compound may result in an NMR spectrum comprised of multiple sets of peaks, any of which may be deemed as a suitable quantitative probe for a given analysis and as dictated by its circumstances. Concomitantly, most qNMR work can
be reduced to simple variations of spiking studies where an analytical standard is added into an appropriate matrix to determine the identity of all resolvable signals for a given target compound within that matrix. This is particularly convenient because any clear signal from a target analyte may be used as a quantitative probe, even if all other signals from that analyte are overlapped/obscured by other larger signals.
Modern qNMR operations concerned with trace process impurities should be performed on high-fi eld instrumentation (≥ 400 MHz) equipped with cryogenically-cooled probes on spectrometers with stable hardware with high dynamic range capability. The homogeneity of the static magnetic fi eld prior to each spectral acquisition is crucial, as well. This not only maintains high resolution and sensitivity, but also enhances the ability to adequately suppress solvent signal (i.e. water). This is crucial as the eff ective magnitude of the water signal is multiple orders of magnitude larger than any signal from the next most concentrated component in any solution. If not adequately suppressed, the entire spectrum may be dominated by this single signal, interfering with further analysis.
One of the hallmark challenges of analyzing SMPI in bioprocess samples is the presence of protein, oftentimes in high concentration. While traditional methods to remove protein – such as centrifugal fi ltration and precipitation with organic solvent – may be used to overcome this challenge, these all amount to additional sample manipulation and represent additional potential sources of analytical error. This challenge may readily and elegantly be overcome with NMR by employing CPMG trains24-26 during experimental execution. Such RF pulse sequence elements serve to fi lter out signals based on diff erential molecular weights of all solution components, as shown in Figure 3. Actual NMR signal acquisition occurs only after virtually all of the signals from high molecular weight species (i.e ~145 kDa mAbs) have decayed below detection. When coupled with robust water suppression, the resulting spectra appear as high-quality small molecule spectra that are amenable to quantitative analysis with minimal-to-no interference from protein signal. It is prudent to use direct analytical standards spiked directly into an external sample of an appropriate analytical matrix. Relative to the traditional method of using indirect internal standards, there is (1) a signifi cant reduction in the total acquisition time per spectrumb, and (2) maintenance of a so-called “apples-to-apples” approach for quantitatively comparing any analyte across multiple samples for a given analytical matrix.
With the analytical artillery established above, many problems with small molecule process impurities that have traditionally been perceived as challenging and/or laborious become rendered routine. This includes but is not limited to raw material purity analysis and clearance during the purifi cation process, the performance of chromatographic resins and column confi gurations, and the analysis of the introduction and/or removal of leachables at various stages of the manufacturing process. Such methods may fi nd use both in R&D as well as during formal process validation. Facilities equipped for qNMR applications can readily achieve quantifi cation limits as low as 0.5 µg/mL in approximately 15 minutes of scan time per spectrum in favorable cases, with lower limits attainable with longer scan times.
Figure 2. 1H NMR spectrum of L-histidine in 90% H2O / 10% D2O. Non-labile protons in each unique chemical environment give rise to resonances at a diff erent location (chemical shift, δ). In this example, signals from the protons attached to the
alpha (α)-carbon produce a set of signals around δ = 3.15 ppm, protons attached to the beta (β)-carbon produce a set of signals
at approximately δ = 3.9 ppm, and the two non-labile protons on the imidazole ring produce two singlet resonances at δ = 7.1 ppm
and 8.1 ppm.
aKnowledge of structural information is needed to make an accurate species-to-species peak area comparison.
»
38 | | July/August 2020
SPECTROSCOPY »


The UFDF stage is a remarkably convenient point in the manufacturing process to conduct impurities testing by NMR. The non-protein components in this matrix are the buff ering agents, typically no more than two. After proper suppression of the water and protein signals, spectra are produced which are not overcrowded with signals, maximizing the likelihood of successfully detecting and quantifying any potential impurities without interference from other components. This is in contrast to trace impurities testing by NMR performed in formulated solutions such as DS and DP, where spectral crowding from high concentration excipient signals renders certain spectral regions analytically inaccessible. Even so, testing in DS/DP for downstream impurities is indispensable, though challenging. Figures 3 and 4 show the detection, identifi cation, and quantifi cation of multiple process impurities detected in both a mAb UFDF pool and within a fully formulated Fab during process development. In the latter, the sugar signals dominate an important region of the spectrum, rendering that region inaccessible without invoking emerging qNMR approaches such as CRAFT.27-28 Still, successful partial screening for impurities in formulated matrices is possible with NMR, as seen in Figure 4.
There are other advantages to performing impurities testing at the highly pure UFDF stage. Any signals detected in the NMR spectrum that do not correspond to either buff er or residual unsuppressed protein signal must be impurities, without the need to resort to comparison with a representative control sample which may not be readily available. However, if the upstream contributing source of a particular set of impurities is to be identifi ed (i.e. viral fi lters), then a control sample representing the same exact analytical matrix prior to exposure through the relevant process step is required. Additionally, the absence of the signals of any upstream raw material analytes in the UFDF pool
implies that they were adequately cleared throughout the purifi cation process. Indeed, it is currently common practice in the industry to test for upstream impurities directly in DS via other analytical methods. However, developing and optimizing individual methods using such technologies to ensure the clearance of every concerning upstream analyte in each product’s formulated matrix is at best an unreasonably demanding task to achieve in practice. By conducting such testing in the UFDF pool by NMR, the overall workfl ow is streamlined and there is less downstream demand for resources since the space of upstream analytical targets that need to be tested downstream in the more complex formulated DS matrix is signifi cantly minimized.
An active area of concern with particularly stringent challenges and demands across many industries involves the investigation and characterization of extractables and leachables (E&L).22,29-32
Any material that comes into contact with a biotherapeutic during manufacturing (tubing, fi lters, vials/stoppers/syringes, etc.) may be a potential source of leachables. Of recent and immediate concern are the ever more popular SUT items, which are routinely replacing their stainless-steel counterparts due to high cleaning costs and other resource-conserving incentives. Some examples of how SUT items are utilized in the manufacturing process include storage bags for transferring in-process samples between sites and for bulk stability studies, and multistage fi lling assemblies used during the production of DP. Typically, leachable species are expected to be ones that are also observed in extractions performed under various exaggerated conditions (acidic, basic, and organic) to represent real-world worst-case scenarios. This expectation is not necessarily satisfi ed in practice as extractables summary reports provided by vendors are often not fully representative of what is seen during actual testing and do not always match the results obtained from in-house extraction eff orts. Ensuring that total leachable levels are low and that the totality of detectable but unidentifi ed leachable species is at an absolute minimum is of
» SPECTROSCOPY »
40 | | July/August 2020
Figure 3. Spectra of a mAb UFDF pool with (maroon) and without (green) CPMG protein suppression; these two
spectra are of the same exact sample (but are not presented with identical scaling). Additionally, a spectrum of the same UFDF pool with various analytes spiked in at 1 µg/mL (blue)
is provided. The concentration of each residual impurity was found to be < 1 µg/mL. Analyte abbreviations: IPA –
isopropanol; PG – propylene glycol.
Figure 4. (Bottom) Spectrum of a fully formulated Fab biotherapeutic, highlighting the dominant formulation
components. (Top) The two analytically accessible regions of the bottom spectrum with the intensity scaled to emphasize
the trace impurities. Residual unsuppressed protein signals are identifi ed by asterisks (*).
bUsing direct external standards circumvents the usual need to wait ~5×T1 when using 90° pulses, thus reducing experimental acquisition times as compared with methods that rely on using indirect internal standards.

utmost priority with respect to product quality and patient safety. While such analytical investigations are commonly performed with GC-MS and LC-MS, NMR allows for a holistic and sensitive assessment of leachables without the need for target-specifi c optimization, thus presenting a convenient and agile analytical path for an extensive evaluation of process impurities.
When an appropriate pre-process control sample is present, detection of trace leachables added by a process are readily detected by the presence of any new signals in the 1H-NMR spectra of the samples being tested relative to the control sample spectrum. If such a control sample is not readily available, the analytical matrix prepared separately without the protein may usually act as a suitable alternative. While the identities of some detected leachables may be known a priori or identifi ed by spiking appropriately selected analytes, it is very diffi cult to assign the exact chemical identities to all detected signals attributed to leachables. In such circumstances, semi-quantitative protocols involving appropriate surrogate standards and based on toxicologically worst-case assumptions may be considered.26 Although such approaches tend to overestimate the actual total concentration of unidentifi ed leachables by design, they enable the use of NMR as an eff ective leachables screening tool in conjunction with an appropriate analytical surrogate standard. Any measured totalities exceeding an established clearance threshold indicate a need for further characterization of the fi ndings and a potential investigation to
remedy the process. While NMR can, in principle, provide the identities of all detected species through the use of more sophisticated multidimensional spectroscopic methods for structure elucidation,33
this is often not achievable in practice in such circumstances since (1) the target analytes are present in trace quantities, and (2) not all signals from a target analyte may be resolvable from other signals present in a spectrum. This underscores the importance of combining NMR data with orthogonal methods, where an accurate or even tentative identifi cation of leachable species is more readily achieved. Given that no single analytical technology and its methods are optimal for every leachables investigation, the most complete leachables profi le for a given process may be attained by combining NMR data with GC-MS, and LC-MS, thus covering a signifi cantly more comprehensive sampling of the analytical space of non-volatile, semi-volatile, and volatile impurities.
Figure 5 depicts spectra of the diluent (formulation buff er) of an antibody therapeutic before and after contact with a SUT in the form of a gamma irradiated fi lling assembly (GIFA). The diluent was passed through such assemblies both at the lab (milliliter) and manufacturing (liter) scales, and the resulting spectra are compared with those of the diluent passed through non-gamma irradiated assemblies (nGIFA). Although some leachables are introduced from the latter, signifi cantly more leachables species were observed to be introduced from the former, which were semi-quantitated to be above an acceptable threshold. Simple visual
« SPECTROSCOPY »
www.americanpharmaceuticalreview.com | | 41
A Novel At-Line Pharmaceutical-Grade Mycoplasma Testing Solution: Sample to Results in Less than One-Hour
With a small footprint, two minutes hands on-time, and less than one-hour time-to-result, BIOFIRE® Mycoplasma makes it easy to quickly test diverse sample types at any point in the manufacturing process. This new “molecular lab in a pouch” fully automates the extraction, amplification, and detection steps; allowing easy implementation of at-line in-process controls to better secure the manufacturing process.
BIOFIRE’s multiplex PCR-based system meets the regulatory requirements of all major pharmacopoeias for final product Mycoplasma release testing. Data integrity and traceability are assured through 21 CFR Part 11 compliant software. With BIOFIRE Mycoplasma, you no-longer have to wait days for outsourced in-process results to know your manufacturing process is on track.
After a presentation of the technology, a summary of the primary validation results will be shown, and validation data obtained from different evaluation studies realized by pharma companies on bioproduction products will be presented.
In this webinar you’ll learn about:
• How this “lab in a pouch” technology works
• Primary validation data• Biopharmaceutical company
evaluation data
SPEAKERS
Sylvanie Cassard Guilloux(Presenter) Healthcare Global Solution Manager,bioMérieux
Lori Daane(Presenter) Director, Healthcare Scientific Affairs,bioMérieux
Mike Auerbach(Moderator)Editor-in-Chief, American Pharmaceutical Review
View ON-DEMAND at https://bit.ly/30z9usM
Who should attend:
• Microbiology QC manager/director• Analytical lab scientists• Bioproduction (upstream) Manufacturing manager• People interested in rapid mycoplasma testing
ON-DEMAND WEBINAR

inspection of the spectra confi rms the same leachables species from
the GIFA are introduced into the diluent regardless of the scale of the
operation. Moreover, these leachables were observed to persist at
unacceptable levels even after extensive fl ushing with diluent at the
manufacturing scale. This is in contrast to the lower levels of leachables
introduced by the nGIFA, which may be shown to clear below acceptable
thresholds after an additional round of diluent is passed through. The
general use of NMR to quickly screen and evaluate these samples has
facilitated the ability to make scientifi cally-sound business decisions to
ensure product quality and patient safety.
Within the scope of this publication, we have demonstrated the power
and versatility of qNMR in the assessment of SMPI in the development
of manufacturing processes of biotherapeutics. The examples provided
are by no means exhaustive and the methodology can be tailored
and applied to many perceived analytical challenges encountered in
bioprocessing. We have found this to be the most effi cient and robust
approach to accomplish these goals time and time again.
AcknowledgmentsThe authors would like to thank Shelley Elvington for critical reading
of the manuscript and feedback. The authors would also like to
acknowledge Noah Wake for helping collect some of the NMR spectra
presented here, as well as Malinda Cheung, Jessica Yang, and Jeremey
Yokogawa for their contributions to the investigation of the gamma-
irradiated single use technology.
References1. Rabi, I. I.; Zacharias, J. R.; Millman, S.; Kusch, P., A New Method of Measuring Nuclear
Magnetic Moment. Phys Rev 1938, 53 (4), 318-318.
2. Bloch, F.; Hansen, W. W.; Packard, M., Nuclear Induction. Phys Rev 1946, 69 (3-4), 127-127.
3. Purcell, E. M.; Torrey, H. C.; Pound, R. V., Resonance Absorption by Nuclear Magnetic Moments in a Solid. Phys Rev 1946, 69 (1-2), 37-38.
4. Hahn, E. L., Spin Echoes. Phys Rev 1950, 80 (4), 580-594.
5. Ernst, R. R.; Anderson, W. A., Application of Fourier Transform Spectroscopy to Magnetic Resonance. Review of Scientifi c Instruments 1966, 37 (1), 93-102.
6. Ramsey, N. F., Early History of Magnetic Resonance. Physics in Perspective 1999, 1 (2), 123-135.
7. Kao, Y. H.; Bender, J.; Hagewiesche, A.; Wong, P.; Huang, Y. F.; Vanderlaan, M., Characterization of fi lter extractables by proton NMR spectroscopy: Studies on intact fi lters with process buff ers. Pda J Pharm Sci Tech 2001, 55 (5), 268-277.
8. Lin, M.; Shapiro, M. J.; Wareing, J. R., Diff usion-Edited NMR−Affi nity NMR for Direct Observation of Molecular Interactions. Journal of the American Chemical Society 1997, 119 (22), 5249-5250.
9. Vogt, F. G., Evolution of solid-state NMR in pharmaceutical analysis. Future Medicinal Chemistry 2010, 2 (6), 915-921.
10. Edwards, J. C., A Review of Applications of NMR Spectroscopy in the Petroleum Industry. Nadkarni, R., Ed. ASTM International: West Conshohocken, PA, 2011; pp 423-472.
11. Taraban, M. B.; Truong, H. C.; Feng, Y.; Jouravleva, E. V.; Anisimov, M. A.; Yu, Y. B., Water Proton NMR for In Situ Detection of Insulin Aggregates. J Pharm Sci-Us 2015, 104 (12), 4132-4141.
12. Yu, Y. B.; Taraban, M. B.; Wang, W.; Briggs, K. T., Improving Biopharmaceutical Safety through Verifi cation-Based Quality Control. Trends Biotechnol 2017, 35 (12), 1140-1155.
13. Taraban, M. B.; Briggs, K. T.; Merkel, P.; Yu, Y. B., Flow Water Proton NMR: In-Line Process Analytical Technology for Continuous Biomanufacturing. Anal Chem 2019, 91 (21), 13538-13546.
14. Coupland, J., Determination of Solid Fat Content by Nuclear Magnetic Resonance. Current Protocols in Food Analytical Chemistry 2001, 00 (1), D3.1.1-D3.1.8.
15. Schumacher, S.; Rothenhäusler, B.; Willmann, A.; Thun, J.; Moog, R.; Kuentz, M., Time domain NMR as a new process monitoring method for characterization of pharmaceutical hydrates. J Pharmaceut Biomed 2017, 137.
16. Bharti, S. K.; Roy, R., Quantitative 1H NMR spectroscopy. TrAC Trends in Analytical Chemistry 2012, 35, 5-26.
17. Simmler, C.; Napolitano, J. G.; McAlpine, J. B.; Chen, S.-N.; Pauli, G. F., Universal quantitative NMR analysis of complex natural samples. Current Opinion in Biotechnology 2014, 25, 51-59.
18. Malz, F.; Jancke, H., Validation of quantitative NMR. J Pharmaceut Biomed 2005, 38 (5), 813-823.
19. Holzgrabe, U.; Deubner, R.; Schollmayer, C.; Waibel, B., Quantitative NMR spectroscopy—Applications in drug analysis. J Pharmaceut Biomed 2005, 38 (5), 806-812.
20. Diehl, B.; Malz, F.; Holzgrabe, U., Quantitative NMR spectroscopy in the quality evaluation of active pharmaceutical ingredients and excipients. Spectroscopy Europe 2007, 19, 15-19.
21. Holzgrabe, U., Quantitative NMR spectroscopy in pharmaceutical applications. Prog Nucl Magn Reson Spectrosc 2010, 57 (2), 229-40.
22. Magarian, N.; Lee, K.; Nagpal, K.; Skidmore, K.; Mahajan, E., Clearance of extractables and leachables from single-use technologies via ultrafi ltration/diafi ltration operations. Biotechnology progress 2016, 32.
23. Shukla, A. A.; Hubbard, B.; Tressel, T.; Guhan, S.; Low, D., Downstream processing of monoclonal antibodies—Application of platform approaches. Journal of Chromatography B 2007, 848 (1), 28-39.
24. Carr, H. Y.; Purcell, E. M., Eff ects of Diff usion on Free Precession in Nuclear Magnetic Resonance Experiments. Phys Rev 1954, 94 (3), 630-638.
25. Meiboom, S.; Gill, D., Modifi ed Spin-Echo Method for Measuring Nuclear Relaxation Times. The Review of Scientifi c Instruments 1958, 29 (8), 688-691.
26. Skidmore, K.; Hewitt, D.; Kao, Y. H., Quantitation and characterization of process impurities and extractables in protein-containing solutions using proton NMR as a general tool. Biotechnol Prog 2012, 28 (6), 1526-33.
» SPECTROSCOPY »
42 | | July/August 2020
Figure 5. (A) Spectra of a formulation buff er (no protein) prior to and after contact with tubing components from various setups
of a SUT fi lling assembly. Gamma irradiation is commonly used for sterilization and may potentially contribute to the detectable leachables after contact with buff er or product.
Observed leachables contributed directly from gamma irradiation are marked with a red γ, while leachables inherent to the SUT item prior to gamma irradiation are marked with a red asterisk (*). (B) The same spectra but with the intensity scaled
to highlight the main signals of the gamma irradiation-induced leachable IPA observed through the Poloxamer 188 signal. As an illustration of the sensitivity achievable by NMR, the IPA 13C
satellite peaks – which are ~1% the intensity of the main IPA signals in B – are shown in A.

27. Krishnamurthy, K., CRAFT (complete reduction to amplitude frequency table)--robust and time-efficient Bayesian approach for quantitative mixture analysis by NMR. Magn Reson Chem 2013, 51 (12), 821-9.
28. Scott, A. B.; Tim, A. S.; David, J. R.; Krish, K., Quantitative NMR Analysis of Complex Mixtures Using CRAFT (Complete Reduction to Amplitude Frequency Table) Method. Current Metabolomics 2015, 3 (1), 21-31.
29. Wakankar, A. A.; Wang, Y. J.; Canova‐Davis, E.; Ma, S.; Schmalzing, D.; Grieco, J.; Milby, T.; Reynolds, T.; Mazzarella, K.; Hoff, E.; Gomez, S.; Martin‐Moe, S., On Developing a Process for Conducting Extractable–Leachable Assessment of Components Used for Storage of Biopharmaceuticals. J Pharm Sci-Us 2010, 99 (5), 2209-2218.
30. Huang, M.; Horwitz, T. S.; Zweiben, C.; Singh, S. K., Impact of extractables/leachables from filters on stability of protein formulations. J Pharm Sci-Us 2011, 100 (11), 4617-4630.
31. Ding, W., Risk-Based Scientific Approach for Determination of Extractables/Leachables from Biomanufacturing of Antibody–Drug Conjugates (ADCs). In Antibody-Drug Conjugates, Ducry, L., Ed. Humana Press: Totowa, NJ, 2013; pp 303-311.
32. Jahn, M., Leachables and Extractables: From Regulatory Expectations to Laboratory Assessment. In Challenges in Protein Product Development, Warne, N. W.; Mahler, H.-C., Eds. Springer International Publishing: Cham, 2018; pp 337-351.
33. Morris, G. A., Modern Nmr Techniques for Structure Elucidation. Magnetic Resonance in Chemistry 1986, 24 (5), 371-403.
Author BiographiesGennady Khirich is a Scientist working in the small molecule process
impurities group within Analytical Operations at Genentech, where he
has been doing NMR since 2016. He specializes in rapid development
and execution of qNMR techniques in complex matrices both for R&D
and process validation purposes. Currently, he has been exploring the
use of 2D NMR methods at natural 13C abundance along with various
chemometric techniques for detection of changes in higher order
structure in antibody therapeutics, as well as to establish analytical
similarity for comparability studies. Prior to joining Genentech, he has
completed a B.S. in physics at the City College of New York, followed
by completion of his Ph.D. in biophysical chemistry at Yale University,
with an emphasis on using NMR relaxation methods to study functional
conformational dynamics in enzymes.
Ken Skidmore is a Senior Scientist in the Analytical Operations
department at Genentech. Initially hired as an NMR spectroscopist
with a focus on qNMR, he now leads a group responsible for assessing
impurities during biologics drug development. His group uses a variety
of techniques (NMR, GC-MS, LC-MS, ICP-MS) to investigate extractables,
leachables, clearance of process components, raw material composition,
and stock solution stability. In addition, he helps author leachables
documentation for BLA filings and manages outsourced work with
contract laboratories.
« SPECTROSCOPY »
www.americanpharmaceuticalreview.com | | 43
Advancements in the Characterization of Pharmaceuticals by DSC
Differential Scanning Calorimetry is a simple, yet powerful technique to gain a broad understanding of the characteris-tics of pharmaceutical materials, from the crystalline structure that exists to the compatibility of a specific formulation.
Many of the properties that are explored using DSC are critical components of understanding the impact of process-ing conditions as well as the stability of the formulation that could ultimately alter the stability and dissolution rates of the final product.
In this webinar, we will explore the use of new technologies and some advanced DSC techniques of the analysis of pharmaceutical materials to better understand how to collect the necessary information critical to the advancement of pharmaceutical development.
In this webinar you’ll learn:
• The use of DSC will help detect and quantify the amorphous content of a material and provide guidance in the development of lyophilization methods.
• The DSC can also be used as a tool to understand the stability and compatibility of the tested materials.
• The technology incorporated into the new Discovery X3 DSC provides pharmaceutical researchers capabilities that simply aren’t possible with a traditional DSC.
Who should attend:
• Anyone in the pharmaceutical R&D, manufacturing, QC/QA area
SPEAKERS
Jason Saienga Ph.D.(Presenter) Product Manager – Thermal Analysis and Thermal ConductivityTA Instruments - Waters LLC
Mike Auerbach(Moderator)Editor-in-Chief, American Pharmaceutical Review
View ON-DEMAND at https://bit.ly/3kmsrXd
ON-DEMAND WEBINAR

»
44 | | July/August 2020
MANUFACTURING »
Kan Wang,1 Yi Liu,1,2 Junxuan Li,3 Chip White,1 Ben Wang,1 Bruce L. Levine4
1Georgia Tech Manufacturing Institute, Georgia Institute of Technology, Atlanta, GA2School of Chemical and Biomolecular Engineering, Georgia Institute of Technology, Atlanta, GA3H. Milton Stewart School of Industrial and Systems Engineering, Georgia Institute of Technology, Atlanta, GA4Center for Cellular Immunotherapies and Department of Pathology and Laboratory Medicine, Perelman School of Medicine, University of Pennsylvania, Philadelphia, PA
Modeling the Effects of Supply Chain and Operator Disruptions on Cell Therapy Manufacturing Facility Operations During the COVID-19 Pandemic
IntroductionDuring the COVID-19 pandemic, the delivery of healthcare and the supply chains for critical reagents and supplies needed for the manufacturing both of established and novel therapies have been disrupted. Some critical materials may be unavailable as they could be used to produce COVID-19 related drugs or vaccines. Personal Protective Equipment (PPE), disinfectant wipes, and related materials used in clean room manufacturing facilities are likely to be in short supply for many months, if not longer. For advanced therapies, many critical materials used in the production and testing of cell, gene, and tissue therapies are obtained from sole suppliers. Some materials are unique, and some may be obtained from backup suppliers, though not all manufacturers may have pre-qualified all critical materials from backup suppliers. Further, sole suppliers or back up suppliers may be running at reduced capacity due to staffing shortages, or their own raw material supply chain disruptions. Air cargo service has dropped from pre-pandemic levels (15% as of 11 May 2020,1 26% as of 5 June 2020)2 due to the significant drop in the number of people traveling by plane
(96% reduction as of 9 April 2020).3 Passenger airlines, which also carry air cargo along with passengers, were responsible for approximately 45% of air cargo capacity prior to the pandemic, and often COVID-19 countermeasures have been prioritized.1
If all materials needed for the manufacture of advanced therapies were available, the production and testing is still likely to be affected in areas where stay at home orders are in effect or may be placed in to effect following local outbreaks. And even when stay at home orders are lifted, it is certain that the availability of operators will be affected due to 1) distancing restrictions in laboratories and manufacturing facilities, 2) conversion to shifts with reduced staffing to minimize close working conditions, and 3) the possibility of COVID-19 resurgence and operator or support staff infections or quarantines. With these multi-factorial impacts on advanced therapies manufacturing, it is of heightened interest to assess various scenarios for the impact on patient access to clinical trials and to commercial products. From this information, mitigation strategies may be prioritized, and applicable to COVID-19 and future pandemics and other global disruptions of supply chains.

- C H E C K M A T E –
M O V E 7
INJECTA. CHECKMATE IN 7.
FLEXIBILITY
1SCALABILITY
2QUALITY
ENHANCEMENT
4MODULARITY
3HIGH
CONTAINMENT
5ADVANCED
COMPLIANCE
6CHECKMATE
7
Move into the future of aseptic processing with InjectaFlexibility. Scalability. Modularity. Quality Enhancement. High Containment. Advanced Compliance.
Each move targets a specific need. Each move is part of a synchronised strategy.
Each move converges into a future-looking concept for aseptic processing, using advanced
technologies, latest-generation robotics and patented innovations.
Each move leads to Checkmate.

MethodsUsing a computational simulation model, we previously developed,4
our goal was to investigate how the reduced availability in reagents
(and materials), and operators could aff ect the supply chain of cell
and gene therapy products, using Chimeric Antigen Receptor (CAR)
T cells as an exemplar product. A fi rst hypothesis to test is that there
are lower bounds on reagent availability and operator availability that
are needed to avoid adverse impacts on patients. A second hypothesis
is that a priority queue (PQ) policy can alleviate the adverse impact of
reagent or operator shortages.
At baseline, before supply chain disruptions our assumption of normal
operations in a CAR T cell manufacturing facility is a fi rst-come-fi rst-
served policy (sometimes referred to a fi rst-in-fi rst-out, or FIFO, policy),
where the order of the manufacturing requests are solely based on
the request arrival time. Another policy for determining the order of
manufacturing requests, which is akin to triage, is to assign the most
seriously ill patients go to the front of the line, where the sickest
patient requests are serviced FIFO and all other patient requests are
also serviced FIFO. We refer to this policy as a priority policy (or priority
queue, PQ) for ordering manufacturing requests, where in this case
priority is determined on the basis of patient health status.
These two confi gurations were run through the simulation model to
fi nd the response surface, a method for mapping both the functional
behavior of a system relative to parameter values and the variability
of the behavior. In Experiment 1, given a current patient demand of
CAR-T therapy, the model was queried to fi nd the response surface
of patient adverse outcome versus decreases in reagents and labor.
Reduced operator availability may be due to illness, leave, staff spacing
requirements, or partly as the result of PPE shortage, for example.
Only properly equipped personnel counts as ‘available operator’. We
defi ne the adverse outcome for patients as mortality due to disease
or progression that cannot be salvaged through any available therapy.
This ‘what if’ simulation study considered diff erent durations (3
months, 6 months, and 9 months) of a pandemic. In Experiment 2,
the priority queue policy was added and the same simulations as in
Experiment 1 were run.
Results of Simulation Model QueriesFor an autologous CAR T cell therapy, we assume therapy
manufacturing can only begin if there is an initial collection of
lymphocytes by leukapheresis from the patient (the raw material), an
idle bioreactor, a suffi cient amount of available reagent supply, and a
suffi cient number of available operators. We further assume that the
number of bioreactors is large enough to ensure that for every patient
leukapheresis collection, there will be an available idle bioreactor.
From the query, we observe that patient adverse outcome expresses an
“s-curve” dependence for both reagent and operator availability. This
dependence, most notably illustrated in the 6-month FIFO Adverse
Outcome Rate graph in (Figure 1), implies that the adverse outcome
rate stays relatively fl at as critical reagent availability percent decreases
until a threshold is achieved. The fi rst threshold, as marked by the
contour line, refl ects the point at which the gradient of the response
surface starts to increase. Once reagent availability percent falls below
this threshold, then there is a marked increase in adverse outcome
rate until a second threshold is achieved, after which the adverse
outcome rate fl attens out again. This phenomenon also occurs as the
operator availability percent decreases. For the 3-month, 6-month,
and 9-month durations of the pandemic impact, from our simulation
the fi rst threshold levels at which the adverse impact will not escalate:
Duration Reagent availability % compared to normal
Operator availability % compared to normal
3 months 29.6% 39.2%
6 months 52.7% 46.1%
9 months 62.9% 49.2%
When these thresholds are less than 100%, this indicates a resilient system that can withstand signifi cant drops in reagent and operator availability without signifi cant impact on patient adverse outcome rate. This resilience is due to a signifi cant amount of ‘cushion’ reagent availability and operator availability, each of which incurs cost. If these thresholds were closer to 100%, then the system would be considered ‘running leaner’ and would incur less cushion-related expenses. The lack of symmetry regarding adverse outcome rate should also be noted as operator availability percent and reagent availability percent decrease. This asymmetry is due to the fact that reagents can be stored in inventory whereas operators cannot. Although it is not assumed in these simulation runs that operators can be on-call, it is expected that such an assumption would tend to produce symmetries in adverse outcome rate as operator availability percent and reagent availability percent decrease. The magnitude of the asymmetry may also be addressed by cross training of staff in multiple laboratory functions to ensure greater cushion.
Implementing the priority queue (PQ) assignment scenario has only a modest impact on the value of the fi rst threshold, compared to FIFO. However, once the reagent availability percent and/or the operator availability percent falls below this threshold, the increase in adverse outcome rate is considerably slower than the increase in adverse outcome rate for the FIFO case. Using the 9-month case as an example, the adverse outcome rate reaches 20% when operator availability percent equals 37.6% with FIFO, compared to 26.5% with PQ. The adverse outcome rate reduction due to PQ relative to FIFO is more signifi cant when the operator availability percent is lower than the fi rst threshold. The maximum reduction in adverse outcome rate due to PQ, relative to FIFO, for the 9-month case is more than 5%.
When both reagent availability percent and operator availability percent are above the fi rst threshold, therapy manufacturing begins immediately for virtually all arriving leukapheresis collections for both classes of patients, whether the queuing discipline is FIFO or PQ, and
»
46 | | July/August 2020
MANUFACTURING »

hence there is little diff erence in the performance of these queuing
disciplines. If operator availability percent is above the fi rst threshold,
then the FIFO and PQ systems perform similarly, for all values of the
reagent availability percent. However, for any value of the reagent
availability percent, the greater the decline in operator availability percent the better PQ performs, relative to FIFO, and hence operator availability is especially important under these conditions.
Summary of Main FindingsThe fi ndings from this simulation model confi rmed that as postulated there are lower bounds on reagent availability and operator availability that are needed to avoid adverse impacts on patient access to treatments or experimental therapies during signifi cant supply chain and operator availability disruptions. The exact numbers of personnel, bioreactors, and reagent stock levels depend on the facility confi guration and treatment rates. Priority queuing has only a modest impact on the value of the lower bounds, compared to FIFO. However, once the reagent availability percentage and/or the operator availability percentage falls below this threshold, the increase in adverse outcome rate is considerably slower than the increase in adverse outcome rate for the FIFO case.
Discussion and Implications Simulation models are useful to design options and contingency plans for advanced cell therapy manufacturing facility supply chain and personnel disruptions and to help maintain the lower bounds where patients are not adversely aff ected by treatment delays. While Priority Queuing has only a modest eff ect as examined in the scenarios modeled here, for some patients the ability to receive treatment may be life changing or lifesaving. Stringency of a priority queue may need to become greater when staff availability declines. Future interrogations using this simulation model can assess a dynamic priority queue, where the manufacturing order is determined by considering the request arrival time and the real-time patient health status. Disruption events may be of variable intensity as restrictions are implemented and lifted in a staged fashion. Additionally, the time dependency of availabilities can be modeled. The fi ndings presented here also reinforce the contrast from manufacturing of shelf stable products or drugs and the manufacturing of on demand therapies.
Even before the COVID-19 pandemic, “just in time” inventory systems for advanced therapies in very ill patients was thought to be somewhat perilous. In addition to re-examining stocking and equipment levels, staffi ng, cross-training, and redesign of spaces to ensure adequate supplies and distance among staff are required contingency planning to ensure as many patients as possible may receive treatment during times of global supply chain and personnel availability disruptions.
References1. Max Finkel, The Coronavirus Is Shaking Air Cargo to Its Core, 11 May 2020, https://www.
gizmodo.com.au/2020/05/the-coronavirus-is-shaking-air-cargo-to-its-core/
2. Accenture report, ‘COVID-19: Eff ects on Air Cargo Capacity’, 5 June 2020 https://www.accenture.com/us-en/insights/travel/coronavirus-air-cargo-capacity
Figure 1. Response surfaces (left column) and their contour plots (right column) of patient mortality vs. reagent availability
and operator availability under FIFO policy in diff erent disruption durations: 3 months (row 1), 6 months (row 2) and 9
months (row 3).
Figure 2. The reduction in patient mortality by employing PQ policy over FIFO policy. Row 1 shows the contour plots of the
mortality with FIFO policy and the mortality with PQ policy. Row 2 shows the diff erence in mortality. The lower left plot shows the
reduction in mortality over the reagent availability – operator availability plane. The lower right plot shows the average
reduction in mortality as a function of operator availability.
« MANUFACTURING »
www.americanpharmaceuticalreview.com | | 47

»
48 | | July/August 2020
DRUG DEVELOPMENT »
Josh Fyff e, Omkar Kawalekar, Hussain MoorajDeloitte Consulting LLP
Orchestrating the Digital Cell and Gene Therapy Treatment Journey Around the Patient
Life sciences companies supplying individualized cell and gene therapies (CGTs) will need to create digital capabilities that orbit around the patient and clinical service providers to achieve market uptake and product sustainability.
Cell and Gene Therapies (CGTs) are a nascent yet burgeoning element in the evolution of therapeutic technology (Figure 1). With more than 900 fi rms globally focused on these advanced therapies and over 1,000 cell and/or gene therapy clinical trials currently underway, the industry could see a tsunami of approvals - as many as 10 to 20 new therapies per year - starting in 2025.1 This wave of CGT development and deployment is compounded by pharmaceutical companies’ growing spending to include more CGT off erings in their drug portfolios. In 2018, investors committed over US$13 billion globally to advanced therapies, including cell, gene, and gene-modifi ed cell therapy. In 2019, nineteen CGT-related M&A deals worth over US$156 billion were completed.2 CGTs are becoming a staple of biopharma’s menu; however, simply off ering these lifesaving therapies is not enough.
Compared to chemical-based pharmaceuticals, CGTs depend more on clinical institutions and hospital networks to facilitate drug administration to yield the most eff ective results (and, in some circumstances, any results at all). Because of this, CGT-supplying organizations and, notably, pharmaceutical parent companies, may need to adapt historical processes, roles, and value chain organizational structures to be able to deliver their product and
Figure 1. Cell and gene therapies (CGTs) represent the next evolution of personalized health care.

Now offering Aseptic-filled Liquid Captisol.
Facilitate your drug discovery and development activities with Liquid Captisol. Liquid Captisol is a 50% aqueous concentrate of Captisol® (Betadex Sulfobutyl Ether Sodium USP/NF) that has been aseptic-filled into 250 mL plastic bottles. The product will help you to move quickly into phase solubility studies, formulation development or safety studies. Now quickly dilute to your desired concentration and determine solubility or dose preclinically. Captisol has been used extensively to provide improved solubility, stability, bioavailability and dosing of challenging ingredients. Liquid Captisol is protected under our all-aqueous patented process and included within our extensive safety database. Accelerate your drug discovery and development and order non-clinical grade Liquid Captisol.
CAPTISOL.com

successfully collaborate with point-of-care (POC) providers. This article discusses the need for life sciences companies to create new digital capabilities that accommodate CGTs’ - specifi cally autologous, ex-vivotherapies - unique requirements, manage unavoidable exception scenarios, and build potential diff erentiators in their digital off erings. We also assess the prospects of an industry utility and a logical systems architecture to maximize the returns on companies’ IT investments.
New System Requirements for Most CGT Products CGT advances are accelerating the convergence of pharmaceutical companies and POC providers. For more advanced CGTs, the defi nition of a treatment center versus a pharmaceutical company gets blurry as personalized therapies become localized/regionalized around the treatment center. Autologous, ex-vivo CGT suppliers have to plan their manufacturing around patient inputs; the patient’s cells being extracted and delivered to the manufacturing site is a physical constraint that all ecosystem participants have to navigate and accommodate. As such, traditional demand and capacity planning models do not map cleanly to CGT product manufacturing processes. Manufacturing according to schedule means that the patient has promptly provided cells on the initial treatment timeline, which frequently is not the case. Additionally, the concept of track and trace (referred to as Chain of Identity [COI] and Chain of Custody [COC]) is absolutely critical to ensure that the intended patient receives the right drug product. This requires an unprecedented degree of tracking the biological product from start to fi nish (COI), while also continuously recording each change of the product’s ownership (COC).
Thus, a CGT manufacturing organization (whether a contractor or vertically integrated within a CGT manufacturer) needs to conceive upstream processes to handle material quality and timing at a greater degree of variance than in traditional manufacturing. Specifi cally, operations likely need to shift from using inventory to de-risk supply to providing a just-in-time (JIT) value chain with varying and hard-to-defi ne material input, delivery, and service windows (Figure 2).
Developing Clinically Connected and Digitally Enabled CGT ProcessesIf CGT manufacturing and/or therapy delivery are prohibitively diffi cult, elongated, or expensive, patients likely will not benefi t even if drug discoveries and approvals continue. Thus, it is vital that CGT suppliers build a value chain around the patient that is both clinically connected and digitally enabled. The benchmark is to design these processes and capabilities to best harmonize with clinical service providers and the patient. As one CGT executive put it, “We’re building the plane as we’re fl ying it.”
Given the intersection between CGT suppliers and clinical service
providers, roles that accurately represent POC needs are recommended
staples of a CGT resource mix. A resulting example of a new sub-
function that depicts this role is patient operations, team members
that operate at the delicate intersection of manufacturing process,
treatment site, and patient.
CGT manufacturers should seek and use a broad swath of input from
various functions so that gaps in the external treatment lifecycle
experience can be identifi ed and closed, potentially using new digital
off erings that support:
• Treatment timeline visibility: Knowing when the POC will receive the fi nished product back at the infusion site so they can coordinate with the patient, or search for alternative treatment options that can return a viable product sooner.
• Treatment updates: Receiving key updates throughout the treatment lifecycle so that intermediary steps can be taken with the patient to prepare them for eventual infusion, maximizing treatment effi cacy.
• Notifi cation preferences: Having the digital infrastructure to allow hospitals to receive more or fewer notifi cations, as desired.
• Role permissions: Having system-based role defi nitions (the ability to submit an order) versus function-based role defi nitions (nurse) to enable fl exibility when setting up new treatment centers and users.
• Localized data capture: Being able to capture diff erent
treatment information from the POC based on geography and
indication factors (e.g., capturing a Medical Record Number for a
commercial order instead of a Treatment Protocol Subject ID for
a clinical order); this also requires regulatory alignment.
Building Diff erentiated Capabilities with Digital InvestmentsIn addition to building and/or strengthening the above capabilities, leading CGT suppliers will look for ways to responsibly diff erentiate in four core areas that can drive value at POC:
Figure 2. Best in-class organizations set up a suppply chain that can handle both traditional and CGT drug manufacturing.
»
50 | | July/August 2020
DRUG DEVELOPMENT »

• Ease integration with external partners. Build a platform that
seamlessly integrates with other stakeholders’ systems, such as
hospital EHRs, 3PL systems, and patient registries.
• Own the indication by leading in patient education.
Enhance applications to become an education portal for
patients and caregivers.
• Continuously improve process and outcomes. Run analytics
on the longitudinal order/patient-specifi c data captured
along the patient and cell journey to help inform operational
performance as well as patient outcomes.
• Engage proactively with regulators on requirements. Use
data-driven insights to engage with regulatory authorities early
and help fl ex requirements (e.g., at the time of Biologics License
Application [BLA] fi ling).
Forward-thinking CGTs will focus on features that make life easier for
service providers and the respective hospital network. Effi ciencies
created over time in a phased approach, in conjunction with
positive product outcomes, should drive competitive advantage and
marketplace diff erentiation.
Managing ExceptionsPairing POC stakeholders with Information Technology (IT) and
other functions can help CGT suppliers unlock solutions (or process
improvements) to handle common exceptions that arise in the CGT
treatment lifecycle. Autologous ex-vivo therapies require physical
material from a patient, creating variability in manufacturing raw
material and manufacturing timing on an order-by-order-basis. Both
factors have impacts across the treatment lifecycle and manifest
themselves in common exception scenarios such as:
• Apheresis (pick up) rescheduling: According to anonymized
large providers of CGTs, apheresis reschedules happen in 40
percent to 60 percent of all orders. The most frequent causes
are patient availability or health condition, along with timely
insurance approval. Systems supporting CGT scheduling must be
able to accommodate these changes.
• Out-of-specifi cation: It is a common manufacturing scenario
to have outcomes that do not yield required cell counts for
compliant doses, forcing the manufacturing run to terminate or
go out-of-specifi cation. Digital capabilities should handle these
exception scenarios.
• Holding fi nished product inventory: In some cases,
manufacturing for an order may be completed but the infusion
location does not have the capacity to hold the fi nished material
as planned. The ability to digitally pause order movement
and treatment timelines should be embedded within these
capabilities.
CGT suppliers require a robust process and digital capabilities to maintain manufacturing slots amid raw material arrival uncertainty. This process must also accommodate for off sets between variant pick-up locations and manufacturing plants. Ideally, a CGT supplier will create a tollgate oriented around the apheresis center where order scheduling and capacity confi rmation can occur.
To digitally manage out-of-specifi cation orders, the CGT supplier should fi rst consider the communication process back to the site, then align on the presentation of that manufacturing determination. From a cost perspective, creating the right system identifi ers can drive an effi cient re-valuation process for commercially out-of-specifi cation orders.
For all processes, CGT fi rms should constantly pressure test systems against the unlikely, have an approach offl ine, or deviations to cover edge cases. The supplier must be able to deliver the most eff ective
dose in an effi cient manner.
Leveraging Industry Utilities While diff erentiating digitally can drive value and improve the customer experience, it is important that CGT suppliers know where to diff erentiate versus standardize. Exceptions handling resiliency and nuanced POC requirements are two current digital diff erentiation rallying points, and others may be emerging.
Still, there are times when diff erentiation may be cumbersome. Leveraging industry utilities can enable development of standardized off erings to aid clinical service and POC providers. For example, the expected infl ux of new therapies - 10 to 20 new off erings per year starting in 20251 - has the potential to create disarray at POCs: If every CGT supplier is using a diff erent portal for their products, bottlenecks will form for clinical service providers.
There currently is no aligned “portal provider” or single industry solution to be the face of CGTs at POC. Several existing products provide out-of-the-box functionality; these platforms compete with custom builds that are often more costly but have more fl exibility
Figure 3. Representative CGT portal architecture.
« DRUG DEVELOPMENT »
www.americanpharmaceuticalreview.com | | 51

to meet specific requirements. Figure 3 shows a representative CGT portal architecture that can operate as a consolidated point of entry.
Developing an industry-standard portal for pharma and POC providers may require guidance from a knowledgeable intermediary to bridge requirements and trade-offs. Deloitte’s Industry Working Group (IWG) was formed in collaboration with several CGT players to address areas where standardization is needed. The IWG brings together CGT industry experts, including top pharma executives, clinicians, apheresis nurses, quality assurance staff, and regulatory advisors, as well as technology solution company executives. The IWG discussed the topic of an industry utility at its most recent session (early 2020). The general consensus is to focus on patient outcomes and standardize shared aspects of CGT processes to lessen the burden on POC providers. Having a common landing portal shared across industry participants would be a considerable improvement over current disintermediated systems.
Labeling is another area where standardization is preferred over differentiation at POC. Labeling is an essential component of the apheresis and finished product processes, and a regulatory mandate for transporting blood products and maintaining chain of identity. To assist in achieving labeling standardization, Deloitte started the IWG Labeling Initiative. In close collaboration with the Standards Coordination Body, IWG prepared a proposal for standardizing the minimum required elements for labeling the apheresis product for autologous cell therapy manufacturing. These elements include label size, material, layout, and minimum data requirements, among others. Standardization will achieve efficiencies at POC by not having to consume or manage different labels across CGT suppliers.
Creating a Patient-Centric Architecture If CGT suppliers are going to build a patient-centric, clinically connected value chain, they also should develop an enabling technology architecture. There currently is no one-size-fits-all solution for applications being leveraged across CGT processes such as ordering, scheduling, labeling, billing, and manufacturing. Creating a digital product that can facilitate a CGT treatment from beginning to end will require multiple applications to be integrated with specific lifecycle functions. The applications mix will likely include Manufacturing Execution Systems (MES), Customer Resource Management (CRM), templating software, treatment portals, middleware, and Enterprise Resource Planning (ERP) systems. When aligning the architecture to a CGT digital product, developers should:
• Consider a role-based architecture where end users can access only a subset of applications for greater operational efficiencies
• Determine where to leverage market and standard product applications where process and feature customization is limited
• Evaluate requirements for current and future releases and map them to potential fulfillment systems
• Limit integration calls across applications to reduce churn and Application Program Interface (API) chatter to create a more streamlined digital process
• Confirm native combinability for selected applications prior to design and build and select applications that have robust APIs to accommodate flexible scaling
• Assess digital roadmap capabilities against market products when evaluating a buy-versus-build approach
Outcomes MatterUltimately, CGT product uptake depends on the manufacturer successfully delivering at two fundamental “moments of truth”: (1) Was the product available and ready to be used on time and at the right location when the patient needed it, and (2) did the therapy bring about the outcomes that the physician and patient expected and desired?
CGT suppliers should challenge the process by asking:
1. What levers can we push to deliver the product back to the
patient faster while remaining in compliance?
2. How can we accurately forecast a treatment timeline at the
moment of order submission?
3. What technical and procedural constraints are required
to confirm logistics information is accurate on a
transactional basis?
4. Are there signals we can provide POC providers to increase
product efficacy or patient readiness?
5. Are there any internal processes we can compliantly adjust
to increase product efficacy?
The CGT industry could greatly benefit from a digital solution that strives to addresses this set of questions while also ultimately enabling a positive answer to the two key moments of truth.
Endnotes1. Commissioner of Food and Drugs - Food and Drug Administration Scott Gottlieb M.D.,
“Evaluation and research on new policies to advance development of safe and effective cell and gene therapies,” US FDA, press release, January 15, 2019, https://www.fda.gov/news-events/press-announcements/statement-fda-commissioner-scott-gottlieb-md-and-peter-marks-md-phd-director-center-biologics.
2. Deloitte analysis of M&A deals; data sourced via Thomson One Banker.
3. Deloitte analysis based on CGT client discussions.
Author BiographiesJosh Fyffe, is a senior consultant in Deloitte Consulting LLP’s Customer and Marketing practice, focusing on life sciences and cell and gene therapies. In the last three years, Fyffe has worked closely with biopharma
»
52 | | July/August 2020
DRUG DEVELOPMENT »

companies to define system capabilities and roadmaps for CGT products
through scoping workshops, SME engagements, industry certification
requirements, and global regulatory considerations. Josh maintains a
detailed understanding of these requirements and processes to inform
client-specific architectural and design considerations.
Omkar U. Kawalekar, PhD, is a manager in Deloitte Consulting
LLP’s Strategy & Analytics practice and leads eminence for Deloitte’s
NextGen Therapy practice. With a graduate degree in cell & gene
therapy from the University of Pennsylvania, he has primarily worked
with executives at small and large biotech companies, defining and
implementing transformative capabilities as they develop, manufacture,
and commercialize cell and gene therapies. He continues to present at
numerous scientific conferences and publishes regularly in this field.
Hussain Mooraj is a principal and leads Deloitte Consulting LLP’s
NextGen Therapy practice and is the New England regional lead for life
sciences. He brings more than 25 years of experience in manufacturing,
supply chain, enterprise technology, sales and marketing, and strategy
consulting to his role. Mooraj works closely with senior executives from
global life sciences firms, helping them transform their end-to-end
businesses and build startup organizations to be able to launch lifesaving
new therapies, especially on the CAR-T and gene therapy side.
AcknowledgementsThe authors would like to thank Michael Cislo, Rajesh Singh, Jeffrey
Lacey, and the many others who contributed their insights to this article.
This publication contains general information only and Deloitte is not,
by means of this publication, rendering accounting, business, financial,
investment, legal, tax, or other professional advice or services. This
publication is not a substitute for such professional advice or services,
nor should it be used as a basis for any decision or action that may
affect your business. Before making any decision or taking any
action that may affect your business, you should consult a qualified
professional advisor.
Deloitte shall not be responsible for any loss sustained by any person
who relies on this publication.
As used in this document, “Deloitte” means Deloitte Consulting LLP,
a subsidiary of Deloitte LLP. Please see www.deloitte.com/us/about
for a detailed description of our legal structure. Certain services may
not be available to attest clients under the rules and regulations of
public accounting.
Copyright © 2020 Deloitte Development LLC. All rights reserved.
« DRUG DEVELOPMENT »
www.americanpharmaceuticalreview.com | | 53

»
54 | | July/August 2020
BIOPHARMACEUTICAL PROCESSING »
Dhanuka P. Wasalathanthri,* Matthew S. Rehmann, Jay M. West, Michael C. Borys, Julia Ding, and Zhen Jian LiGlobal Product Development & Supply Bristol Myers Squibb Company
*E-mail: [email protected]
Paving the Way for Real Time Process Monitoring in Biomanufacturing
IntroductionThe typical manufacturing process for biopharmaceuticals includes a cell culture process that generates the molecule of interest (upstream processing), a process to purify the molecule by removing process and product-related impurities (downstream processing), followed by formulation or lyophilization into the final drug product.1 Despite the complexity of biomanufacturing processes, a significant amount of research and development has been invested into real time process monitoring to facilitate continuous manufacturing of biologics2 and real time release (RTR) initiatives.3 A systematic approach is essential for successful development and implementation of technology infrastructure for real time process monitoring.4 A typical framework for implementation involves identification of critical process parameters (CPPs) that affect the critical quality attributes (CQAs) followed by deployment of appropriate analytical tools at critical control points (CCPs) of the unit operations involved in the manufacturing of the product.3,5 Analytical sensors capable of acquiring real time information from the process and cyber-physical systems for automated data piping, processing and/or visualization are key components of any monitoring platform.6,7
True real-time data collection is enabled by integration of analytical tools in an in-line fashion, where the sensors and probes are placed within bioprocess streams and data acquisition is performed without removing samples from the unit operation. Vibrational spectroscopy such as Raman and Fourier Transform Mid Infrared (Mid-IR), UV-Visible such as Variable Path length Slope (VPE) spectroscopy, capacitance and Multi Angle Light Scattering (MALS) are common in-line analytical techniques for monitoring of bioprocesses.4 Owing to the advancements in these technologies with bioprocess compatible
probes, flow cells, integration scaffolds and improved analytical capabilities (such as superior sensitivities and response times), their utility in biomanufacturing for real time monitoring has gained significant momentum in recent years.2 Even though these physical sensors enable real time acquisition of process information related to CPPs and CQAs, it is also vital to establish a data management infrastructure for automated piping, analysis, and visualization of results.8 The combination of process analytical sensors with an integrated data management platform (Figure 1) allows operators and scientists to monitor the results from the process in real time and make rapid process decisions enabling more robust control during manufacturing. Automated feedback and/or feedforward mechanisms can be used in some applications to control CPPs and achieve a target product profile.
Here, we review some of the most commonly deployed in-line process analytical technology (PAT) tools for real time monitoring of CPPs and CQAs in biomanufacturing processes and provide our perspective for their use in clinical and commercial manufacturing of biopharmaceuticals. Several case studies are discussed to emphasize the aforementioned key aspects of a typical real time monitoring platform.
In-Line Vibrational Spectroscopy
Raman Raman spectroscopy has grown in popularity since the publication of a seminal report by Abu-Absi et al. describing the use of Raman to monitor multiple upstream process parameters, such as glucose, lactate, and viable cell density, in an in-line fashion.9 Modern Raman

spectrometers for bioprocess applications off er sterilizable probes or non-contact optics and often integrated multivariate data analysis (MVDA) systems to streamline integration into cell culture bioprocess systems. Typical Raman sample collection parameters yield a new measurement every 10 to 15 minutes, which is an appropriate timescale to capture cell culture process dynamics and is far more frequent than traditional offl ine sampling, which is typically performed once or twice per day.
The most common use for Raman spectroscopy in bioprocessing is to monitor glucose and lactate in the cell culture bioreactor. In a typical application, the Raman probe is sterilized and placed directly in contact with cell culture (Figure 2). Spectra from the Raman system are analyzed by multivariate techniques, such as partial
« BIOPHARMACEUTICAL PROCESSING »
www.americanpharmaceuticalreview.com | | 55
Figure 1. Technological Framework for Real Time Monitoring of Bioprocesses
Figure 2. Raman for real-time monitoring of glucose in a cell culture bioreactor. (a) Schematic representation, where the
Raman probe is positioned in-line in contract with the cell culture matrix and data are sent to a system with multivariate data
analysis software to enable real-time visualization. Optionally, feedback control loops can be included to regulate bioreactor
nutrient content. (b) Sample data comparing traditional offl ine sampling (blue dots) to Raman-based monitoring (black line). Real-time data collection and analysis enable more frequent
measurements, allowing users to collect more information about the bioprocess.
AdvantaFlex®, NewAge Industries AdvantaPure® and NewAge® reg. TMs NewAge® Industries, Inc.
MANUFACTURED BYEMPLOYEE OWNED SOUTHAMPTON, PA,USA888-884-6986
Weldable & Sealable TPE
• Time tested & reliable• Moldable for fluid transfer
systems & container closures • Ideal for Single-Use
applications includingvaccine production
www.advantapure.com/apr6
Made in USAwith Solar PowerLearn more today
▼
APR AdvFlex half JulAug20.qxp_Layout 1 7/14/20 9:48 AM Page 1

least squares, resulting in a prediction of nutrient or metabolite concentration, which can be plotted and visualized in real time. In some applications, model predictions are linked with control systems to enable their use in regulating feed rates and, as a result, bioreactor nutrient concentrations.10 In addition to glucose, lactate, and cell density, recent studies have reported the use of Raman to predict amino acid concentration,11 protein titer,12 glycosylation site occupancy,13 and culture pH14 in real-time. Thus, a notable advantage of Raman is the ability to use Raman spectra to predict multiple upstream variables with a single technique. However, since the prediction of these compounds from Raman spectra requires a model, care must be taken to characterize the model to understand its limitations and avoid its potential failure points.
Strategies to manage spectroscopic data are critical to a successful implementation of Raman technology. Traditionally, models have been developed on a product-by-product basis and managed using fi t-for-purpose PAT data management software. A recent trend in the literature has been a shift from cell line- and product-specifi c models to generic models that can be applied across multiple cell lines or multiple products.15,16 For example, Mehdizadeh et al., pooled calibration set data from multiple cell lines (seven total cell lines) and multiple scales of cultivation (1-L, 3-L, and 500-L) to generate PLS models for prediction of glucose, lactate, and viable cell density.16 The authors’ models predicted glucose, lactate, and viable cell density accurately for a new cell line not included in the calibration set. A generic model streamlines integration of Raman into multi-product facilities, but it can be challenging to build comprehensive calibration data sets to encompass potential sources of variation without compromising the accuracy of the generic model. Tulsyan et al. recently proposed an alternate approach using just-in-time learning as a generic framework for building models across diff erent modalities, cell lines, media types, and process conditions.17,18 The just-in-time approach stores diverse spectral data in a library and uses a machine learning algorithm to select the most relevant calibration data for any individual spectrum. Further advances in data processing and analysis should continue to provide improved accuracy and fl exibility of Raman systems.
Mid-IRThe application of Mid-IR spectroscopy in bioprocess monitoring is not as well-established as Raman, likely due to the spectral interference from water present in the matrix and lack of instrumental confi guration for easy integration into unit operations. However, modern Mid-IR spectrometers are capable of automatically subtracting water absorbance as part of background correction during spectral acquisition, and a variety of fi ber optic probes, fl ow cells and attenuated total refl ectance sensors are currently available to facilitate their in-line signal acquisition.19 Mid-IR techniques are capable of capturing a single spectrum as quickly as ten seconds. This makes Mid-IR highly attractive for unit operations where quality attributes change rapidly during the process, such as ultrafi ltration/diafi ltration (UF/DF) and Protein A purifi cation steps.20,21 The application of MVDA at the fi ngerprint regions corresponding to multiple analytes of interest in the process enables real time monitoring of multiple CPPs and CQAs simultaneously.22 For example, Mid-IR spectroscopic sensors were used
to monitor multiple excipients and protein concentration variations during the UF/DF unit operation of biomanufacturing.20 In brief, the technology platform featured integration of Mid-IR probe sensors into a UF/DF process by direct in-line insertion and through custom-made fl ow cells and acquired spectral signals were then shuttled automatically into a process monitoring software platform with pre-loaded MVDA models for real time monitoring of excipients and protein concentrations (Figure 3). This technology demonstrates the key features of a typical real time monitoring platform where results are generated almost instantly during the process (i.e., a measurement frequency of every 40 seconds), and in-built visualization capabilities enable rapid process decision making (Figure 3).20
In-Line UV-Vis SpectroscopyUV-Vis is one of the most well-established methods for determining drug product concentration during downstream bioprocessing, typically by measuring absorbance at 280 nm.23 In-line UV-Vis fl ow cells have been a part of bioprocesses for decades. However, their dynamic range is limited by their use as single path length detectors, or if multiple path lengths are used, it is required to manually switch between them.24 Variable Pathlength Slope (VPE) instruments, which measure absorbance at multiple path lengths automatically at a fi xed wavelength to determine the concentration, have been an important breakthrough for UV-Vis analytical methods.25 These instruments have a dynamic range that is orders of magnitude greater than their traditional fi xed-path length counterparts; thus, protein samples from less than 1 mg/mL to over 200 mg/mL can be tested rapidly and accurately without dilution.26 To ensure accuracy of the measurements in VPE technologies, specifi c algorithms are built into the software to scan the path lengths and search for a starting path length at midpoint optical density (OD) where Beer’s law shows the best linearity. A signifi cant advantage of determining concentration by slope, as opposed to using a single or a few path lengths, is that this approach eliminates unwanted background eff ects. Thus, VPE is highly amenable to platforming, with minimal development required for individual biopharmaceuticals to achieve high accuracy in late-stage downstream processing.
» BIOPHARMACEUTICAL PROCESSING »
56 | | July/August 2020
Figure 3. Mid-IR Sensor Platform for Real Time Monitoring of Protein and Excipient Concentrations at UF/DF Unit Operation. (a)
Schematic representation, where sensor probes are positioned at the bulk solution and retentate line through a fl ow cell
respectively for real time acquisition of spectra. The spectra are then automatically fed into the process monitoring platform for real time visualization of results; (b) Photographic illustration of
the set up.

VPE technology in conjunction with a fl ow cell (In-line VPE) allows in-line integration to unit operations of the bioprocess and hence real time acquisition of UV signals. For example, in-line VPE tools enable real time monitoring of protein concentration in UF/DF unit operations. As shown in Figure 3, the integration of an In-line VPE tool at the retentate line during an UF/DF operation allows protein concentration measurements in real time. Protein concentration is part of the control strategy of a typical biomanufacturing process; e.g., diafi ltration and fi nal ultrafi ltration during UF/DF step are performed at pre-determined concentrations. Thus, a PAT platform such as In-line VPE makes a signifi cant contribution towards complete automation of this unit operation by providing real time protein concentration variations during the process while allowing feedback or feedforward control.
In-line VPE technology is not limited to quantifi cation of the drug product during downstream purifi cation unit operations. For example, Brestrich and coworkers recently demonstrated the utility of in-line VPE technology and MVDA for real time monitoring and quantitation of selective proteins with a broad dynamic range of concentrations during downstream unit operations.27 The authors claim monitoring of downstream chromatography runs with highly loaded columns where product and product-related impurity peak concentrations varied between 30 g/L -80 g/L, and 4 g/L to 20 g/L respectively.27 In summary, VPE technology with suffi cient precision and dynamic range can now be used in many downstream operations with real time decision making capability.3 It is highly likely this technology will be a critical component of the control strategy for bioprocessing in the years to come.
Future PerspectiveIntensifi ed and continuous biomanufacturing platforms1,28 with real time process monitoring capabilities are attractive developments to enhance productivity, reduce cost of goods and support a growing pipeline of therapeutic modalities. While there are well-established PAT tools for real time measurements in bioprocesses, several unmet needs for certain parameters and quality attributes such as host cell proteins, bioburden, and residual DNA still exist. This could be due to
the lack of in-line or on-line technologies, and inherent analytical assay challenges such as sample pretreatment needs. On-line PAT tools, where a sample is taken out from the process stream in an automated fashion for analysis, can be employed for the types of analysis which involve signifi cant sample preparation and pretreatment before analysis. In addition to applications in real time process monitoring, as adoption of PAT technologies becomes more widespread in the biopharmaceutical industry, they are likely to be increasingly used in adaptive process control using automated feedback or feedforward loops to improve process robustness. Finally, real time analytics not only enables precise monitoring and control of the process but also leads to collection of enormous amounts of data that can then be used for more holistic understanding of the manufacturing process using advanced data interrogation techniques.29
References1. Zydney AL. Perspectives on integrated continuous bioprocessing - opportunities and
challenges. Curr Opin Chem Eng. 2015;10:8-13. doi:10.1016/j.coche.2015.07.005.
2. Holzberg TR, Watson V, Brown S, et al. Sensors for biomanufacturing process development: facilitating the shift from batch to continuous manufacturing. Curr Opin Chem Eng. 2018;22(October):115-127. doi:10.1016/j.coche.2018.09.008.
3. Jiang M, Severson KA, Love JC, et al. Opportunities and challenges of real-time release testing in biopharmaceutical manufacturing. Biotechnol Bioeng. 2017;114(11):2445-2456. doi:10.1002/bit.26383.
4. Wasalathanthri DP, Rehmann, MS, Song, Y, Gu Y, Luo M, Shao, C, Chemmalil L, Lee, J, Ghose S, Borys MC, Ding J, Li ZJ. Technology Outlook for Real Time Quality Attribute and Process Parameter Monitoring in Biopharmaceutical Development – A Review. Biotechnol Bioeng. 2020; 1-17. doi:10.1002/bit.27461
5. ICH. (2009). Pharmaceutical development Q8(R2). Retrieved from https://database.ich.org/sites/default/fi les/Q8_R2_Guideline.pdf.
6. Steinwandter V, Borchert D, Herwig C. Data science tools and applications on the way to Pharma 4.0. Drug Discov Today. 2019;24(9):1795-1805. doi:10.1016/j.drudis.2019.06.005.
7. Wasalathanthri DP, Ding J, Li ZJ. Real Time Process Monitoring in Biologics Development. Am Pharm Rev. 2020;23(April):72-75.
8. Cao H, Mushnoori S, Higgins B, et al. A systematic framework for data management and integration in a continuous pharmaceutical manufacturing processing line. Processes. 2018;6(5):1-21. doi:10.3390/pr6050053.
9. Abu-Absi NR, Kenty BM, Cuellar ME, et al. Real time monitoring of multiple parameters in mammalian cell culture bioreactors using an in-line Raman spectroscopy probe. Biotechnol Bioeng. 2011;108(5):1215-1221. doi:10.1002/bit.23023.
10. Berry BN, Dobrowsky TM, Timson RC, Kshirsagar R, Ryll T, Wiltberger K. Quick generation of Raman spectroscopy based in-process glucose control to infl uence biopharmaceutical protein product quality during mammalian cell culture. Biotechnol Prog. 2016;32(1):224-234. doi:10.1002/btpr.2205.
11. Bhatia H, Mehdizadeh H, Drapeau D, Yoon S. In-line monitoring of amino acids in mammalian cell cultures using raman spectroscopy and multivariate chemometrics models. Eng Life Sci. 2018;18(1):55-61. doi:10.1002/elsc.201700084.
12. André S, Cristau L Saint, Gaillard S, Devos O, Calvosa É, Duponchel L. In-line and real-time prediction of recombinant antibody titer by in situ Raman spectroscopy. Anal Chim Acta. 2015;892:148-152. doi:10.1016/j.aca.2015.08.050.
13. Li MY, Ebel B, Paris C, Chauchard F, Guedon E, Marc A. Real-time monitoring of antibody glycosylation site occupancy by in situ Raman spectroscopy during bioreactor CHO cell cultures. Biotechnol Prog. 2018;34(2):486-493. doi:10.1002/btpr.2604.
14. Raff erty C, O’Mahony J, Burgoyne B, Rea R, Balss KM, Latshaw DC. Raman spectroscopy as a method to replace off -line pH during mammalian cell culture processes. Biotechnol Bioeng. 2020;117(1):146-156. doi:10.1002/bit.27197.
« BIOPHARMACEUTICAL PROCESSING »
www.americanpharmaceuticalreview.com | | 57
Figure 4. Real time protein concentration monitoring using VPE technology in UF/DF unit operation. (a) A schematic
representation of the setup, where VPE instrument is positioned in-line; (b) Real time variation of protein
concentration during the process.)

15. Webster TA, Hadley BC, Hilliard W, Jaques C, Mason C. Development of generic raman models for a GS-KOTM CHO platform process. Biotechnol Prog. 2018;34(3):730-737. doi:10.1002/btpr.2633.
16. Mehdizadeh H, Lauri D, Karry KM, Moshgbar M, Procopio-Melino R, Drapeau D. Generic Raman-based calibration models enabling real-time monitoring of cell culture bioreactors. Biotechnol Prog. 2015;31(4):1004-1013. doi:10.1002/btpr.2079.
17. Tulsyan A, Wang T, Schorner G, Khodabandehlou H, Coufal M, Undey C. Automatic real-time calibration, assessment, and maintenance of generic Raman models for online monitoring of cell culture processes. Biotechnol Bioeng. 2019. doi:10.1002/bit.27205.
18. Tulsyan A, Schorner G, Khodabandehlou H, Wang T, Coufal M, Undey C. A machine-learning approach to calibrate generic Raman models for real-time monitoring of cell culture processes. Biotechnol Bioeng. 2019;116(10):2575-2586. doi:10.1002/bit.27100.
19. (a) Bruker Optics. FT-IR / FT-NIR Process Spectrometers. Available at: https://www.bruker.com/fileadmin/user_upload/8-PDF-Docs/OpticalSpectrospcopy/FT-NIR/MATRIX-F/Brochures/MATRIX-F_Brochure_EN.pdf. Accessed on June 20, 2020. (b) Mettler Toledo. ReactIR In Situ Reaction Analysis Available at: https://www.mt.com/us/en/home/products/L1_AutochemProducts/ReactIR.html. Accessed on June 20, 2020.
20. Wasalathanthri DP, Feroz H, Puri N, Hung J, Lane G, Holstein M, Chemmalil L, Both D, Ghose S, Ding J, Li ZJ. Real Time Monitoring of Quality Attributes by In-line Fourier Transform Infrared Spectroscopic Sensors at Ultrafiltration and Diafiltration of Bioprocess. Biotechnol Bioeng. 2020; Accepted.
21. Großhans S, Rüdt M, Sanden A, et al. In-line Fourier-transform infrared spectroscopy as a versatile process analytical technology for preparative protein chromatography. J Chromatogr A. 2018;1547:37-44. doi:10.1016/j.chroma.2018.03.005
22. Wasalathanthri DP, Tewari JC, Kang X, Hincapie M, Barrett SL, Pollock JS. Multivariate spectral analysis and monitoring for biomanufacturing. 2019; Patent No. US 2019/0272894 A1. United States. Available at: https://patents.google.com/patent/US20190272894A1/en.
23. LONZA. Technical Reference Guide- Determination of Protein Concentration. Available at: https://knowledge.lonza.com/downloadasset.ashx?assetId=31460. Accessed July 1, 2020.
24. Flowers PA, Callender SA. Variable path length transmittance cell for ultraviolet, visible, and infrared spectroscopy and spectroelectrochemistry. Anal Chem. 1996;68(1):199-202. doi:10.1021/ac950580w.
25. Shih, T, Salerno M. Validating Slope Spectroscopy Methods: A Formula for Robust Measurements. C-Technologies White Paper 2008; Available at: https://cdn.technologynetworks.com/TN/Resources/PDF/spwp2.pdf. Accessed July 1, 2020.
26. McKechnie WS, Tugcu N, Kandula S. Accurate and Rapid Protein Concentration Measurement of In-Process, High Concentration Protein Pools. Biotechnol Prog. 2018;34(5):1234-1241. doi:10.1002/btpr.2695
27. Brestich N, Rüdt M, Büchler D, Hubbuch J. Selective protein quantification for preparative chromatography using variable pathlength UV/Vis spectroscopy and partial least squares regression. Chem Eng Sci. 2018;176:157-164. doi:10.1016/j.ces.2017.10.030.
28. Xu J, Xu X, Huang C, et al. Biomanufacturing evolution from conventional to intensified processes for productivity improvement: a case study. MAbs. 2020;0(0). doi:10.1080/19420862.2020.1770669
29. Hong MS, Severson KA, Jiang M, Lu AE, Love JC, Braatz RD. Challenges and opportunities in biopharmaceutical manufacturing control. Comput Chem Eng. 2018;110:106-114. doi:10.1016/j.compchemeng.2017.12.007.
Author BiographiesDhanuka Wasalathanthri, Ph.D. is a Senior Scientist at Bristol Myers Squibb where he leads the process analytical technology (PAT) initiatives & strategies at Biologic development in Devens MA. His broad spectrum
of expertise in PAT space features the utility of multi-dimensional chromatography, spectroscopy & chemometrics, microfluidic sensors, and mass spectrometry for real time monitoring of product quality attributes and process parameters. He represents several academic, and
industry consortia. Dhanuka received his Ph.D. in Analytical Chemistry from University of Connecticut in 2014, and his work is published in peer-reviewed scientific journals.
Matthew Rehmann, Ph.D. is a Senior Scientist at Bristol Myers Squibb (BMS) in the Upstream Bioprocess Development department in Devens, MA. He has expertise in PAT for cell culture systems with a focus on Raman
spectroscopy. He received his PhD in Chemical Engineering from the University of Delaware in 2016.
Jay M. West, Ph.D. has worked at BMS Biological Drug Development for six years performing high throughput analytics and process analytical technology. He has worked at Northeastern University and Regeneron
Pharmaceuticals, has a Ph.D. in Biochemistry (Boston College), M.S. Physical Chemistry (University at Albany) and B.S. Chemistry (Rensselaer). He is primary author on seven publications and a co-author on seven additional publications.
Michael Borys, Ph.D. is a Director of Upstream Biologics Development at Bristol Myers Squibb (BMS) located in Devens, Massachusetts. Here he leads a team of process development scientists to define commercial cell culture
manufacturing processes. He has extensive experience for intensification of upstream processes to increase cell culture performance and titers, as well as for inclusion of PAT applications. He and his teams have an extensive track record for publications in various bioengineering journals covering issues related to biologics commercialization. Dr. Borys received his Ph.D. from Northwestern University, and his B.S. from Iowa State University, both in chemical engineering.
Julia Ding, Ph.D. is a Director of Analytical Development at Bristol Myers Squibb (BMS) where she is leading BMS global process analytical network. Julia Ding plays an important role in analytical strategy advancement at BMS where she
serves an active role in BMS biologic specification committee and biologic comparability council. Prior to this, Julia Ding is a Director of Commercial Method Development and Process Analytical Development for late phase programs at BMS. Julia Ding was a manager leading a multifunctional analytical team at PPD before joining BMS in 2016. Julia Ding obtained her Ph.D. in physical organic chemistry from Emory University and postdoc research from University of California at Berkeley.
Zheng Jian Li, Ph.D. is an Executive Director at Bristol Myers Squibb (BMS) where he is leading the Biologics Analytical Development and Attribute Sciences. Before this role, he was the Executive Director at BMS leading the
Late Stage Biologics Development. He has extensive experiences in the manufacturing process development for Biological molecules including various modalities and expression systems. His teams have extensive publications in various world well known Journals, which covers all aspects of issues related to biologics commercialization. Dr Li received his Ph.D. in Chemical and Biochemical Engineering from University of Maryland Baltimore County in 2000.
» BIOPHARMACEUTICAL PROCESSING »
58 | | July/August 2020

LEARN MORE AT WWW.INTERPHEX.COM/RECONNEX-365
Premier Association Sponsor
to source from INTERPHEX exhibitors, discover technical content and schedule digital meetings with key decision makers and suppliers. Stay connected—365 days a year.
The year-round virtual platform Products
Articles Case Studies Webinars Videos Demos Exhibitor Brochures Find a New Supplier
& more!
Virtually explore
PRESENTED BY INTERPHEX
Want to be connected with an exhibitor or customer? The INTEPHEX team will work to set up virtual meetings for you to help you stay connected.

»
60 | | July/August 2020
MICROBIOLOGY ROUNDTABLE »
Veronika WillsManager Technical ServicesAssociates of Cape Cod
Dr. Tim SandleHead of Microbiology and Sterility AssuranceBio Products Laboratory Limited
Christopher ParkerMicrobiology Associate ManagerCambrex
Jonathan StewartManager, Quality ControlCatalent Biologics Bloomington
Alan Hoff meisterSenior Global Technology & Market Development Manager Microbial SolutionsCharles River Laboratories
Sahil ParikhMarketing Manager, Microbial DetectionCharles River Laboratories
Duncan BarlowTechnology & Marketing Development Specialist Microbial SolutionsCharles River Laboratories
Dave NobileTechnical Services ManagerContec, Inc.
Microbiology RoundtableHarolyn M. Clow, MS, SM (NRCM)Manager, Bio/Pharmaceutical Microbiology Eurofi ns
Jeanne MoldenhauerVice PresidentExcellent Pharma Consulting
Peggy BanarhallProduct ManagerMETTLER TOLEDO Process Analytics
Akash TrivediBusiness Development ManagerMETTLER TOLEDO Thornton
Jim CannonPharmaceutical Market ManagerMETTLER TOLEDO Thornton
Tony Cundell, PhDPrincipal ConsultantMicrobiological Consulting, LLC
Jennifer W. VavalSenior Laboratory Operations ManagerNelson Laboratories Fairfi eld, Inc.
Jonathan Swenson, B.S. SM (NRCM)Sr. Laboratory Operations ManagerNelson Laboratories, LLC
Dr. Michael MillerPresident, Microbiology ConsultantsOwner, rapidmethods.com
David Jones, PhDDirector of Technical Marketing and Industry Aff airsRapid Micro Biosystems
Azita KazemiMicrobiology ManagerSGS North America, Inc.
Michelle NeumeyerLife Sciences Product Applications Specialist Sievers line of analytical instrumentsSUEZ – Water Technologies & Solutions
Dave WadsworthGlobal Product Manager, Bio-DetectionSUEZ – Water Technologies & Solutions
Mike DingleField Application SpecialistTSI
Paula Peacos, MSMS, Senior ConsultantValSource, Inc.

Looking back at the last year, what are some critical industry issues affecting efforts to detect and eliminate microbiological contaminants?
Veronika Wills, Manager Technical Services, Associates of Cape Cod: Over the last year, one of many focuses of the pharmaceutical
industry has been ensuring detection of microbiological contaminants
(e.g. bacterial endotoxins) with the additional challenge of doing
so in a sustainable way. A well-balanced approach to sustainability
efforts spanning the 3Rs (Reduce, Replace, Refine) is implemented by
many as part of their strategic growth plans, and here at Associates
of Cape Cod, Inc. we also strive towards the same. The LAL industry,
one of the pipelines feeding into pharma, is expected to be constantly
improving. For example, waste and consumption of LAL reagents is
being reduced, processes refined and in some situations, alternate
reagents used as replacement for LAL. While the LAL reagents do not
exactly fall under the definition of animal testing (the LAL industry
does not use crabs for testing; only a small proportion of horseshoe
crab hemolymph is removed and then later refined into a final
product that supports in-vitro testing), there may be other drivers
for a replacement of LAL reagents e.g. a sustainable supply chain. It
has to be noted, however, that such replacement will have little to no
impact on the crab population. In fact there is evidence to suggest that
in areas where the populations are managed and LAL manufacturers
exist, the horseshoe crab populations are doing much better than
where there is little focus.
Dr. Tim Sandle, Head of Microbiology and Sterility Assurance at Bio Products Laboratory Limited: There has been some interesting
developments with microbial detection technology. As with most
technological waves, developments spring from outside of the pharma
sector and then become adopted later (such is the conservative nature
of our sector).
It’s clear that we need platforms for rapid detection and characterization
of microbial agents are critically needed to prevent and respond to
contamination issues. The advancement of such technologies can
help, at last, for microbial methods to fit in with the process analytical
technology paradigm.
I think the area that will grow fastest is with monitoring pharmaceutical
water systems for microbial contamination. This includes miniaturized
biomolecular techniques and real-time monitoring systems, taking
the form of online meters, such as ATP-metry and flow cytometry.
As such instruments develop, so do the key operational met-
rics like speed to results, identification depth, reproducibility, and
multiparametricity.
A second area of technological advance is with molecular probes,
which help to look for specific pathogens in materials. For instance,
probe tests for a particular sequence of DNA and small groups of
probes can be used to check for specific bacteria or viruses up to the
species level.
Christopher Parker, Microbiology Associate Manager at Cambrex: Over the last year, several disinfectants have been discontinued from being manufactured including Vesphene II and LPH II. These disinfectants are commonly used in cleanroom environments as part of the routine cleaning. As a result of the disinfectants being discontinued, new disinfectants need to identified and validated through disinfectant qualifications for each facility that is affected by the change.
Alan Hoffmeister, Senior Global Technology & Market Development Manager, Microbial Solutions, Charles River Laboratories: The rush in some quarters to adopt recombinant alternatives to the proven Limulus Amebocyte Lysate (LAL) assay for bacterial endotoxin testing. Without substantive, statistically meaningful data from testing naturally contaminated samples to prove the recombinant alternative’s equivalence, there is a potential risk to ongoing product quality and patient safety. This could be the most critical issue affecting the industry for the fore-seeable future.
Jeanne Moldenhauer, Vice President, Excellent Pharma Consulting:
• Reluctance to go to newer, more sensitive detection methods.
• Reduced budgets due to COVID-19 pandemic.
• Lack of appropriately qualified people.
Peggy Banarhall, Product Manager, METTLER TOLEDO Process Analytics; Akash Trivedi, Business Development Manager, METTLER TOLEDO Thornton; Jim Cannon, Pharmaceutical Market Manager, METTLER TOLEDO Thornton: Since the FDA announced its Process Analytical Technology (PAT) initiative in 2004, the industry has moved towards online measurement of various critical parameters to ensure overall process control and the resulting quality assurance. This includes parameters such as total organic carbon (TOC) and conductivity for Purified Water and Water-for-Injection. However, the industry has been slow to adopt a similar overall control strategy for detecting microbial contaminants, which would include online rapid microbial methods (RMM) as a complement to the validated method of plate counts. USP and other agencies have highlighted that plate counts are only an estimate of the microbial population in a water system and that RMMs should be used as part of the overall control strategy for pharmaceutical water systems. Alternative microbial methods report a different measurement signal, which does not correlate with the traditional CFU plate count. The industry needs more education and experience with adopting such RMMs and different measurement units, which has slowed the march towards the goal of overall process control which provides various benefits in terms of time, cost and resource savings.
Tony Cundell, Ph.D., Principal Consultant, Microbiological Consulting, LLC: The industry response to the recent EU Annex 1 revision that wisely emphasizes that processes, equipment, facilities and manufacturing activities should be managed in accordance with Quality Risk Management (QRM) principles that provide a proactive means of identifying, scientifically evaluating, and controlling potential risks to product quality, including microbial contamination, will be critical to our efforts to eliminate microbiological contaminants. This is an opportunity
« MICROBIOLOGY ROUNDTABLE »
www.americanpharmaceuticalreview.com | | 61
» MICROBIOLOGY ROUNDTABLE »
62 | | July/August 2020
for pharmaceutical companies to take a fresh look at the risks associated with microbial contamination and re-engineer their manufacturing operations. Let’s take advantage of this opportunity to improve our sterility assurance levels.
Obviously the COVID-19 pandemic has overturned our lives, seriously damaged the global economy, and threatened the pharmaceutical supply chain. During my self-isolation in the suburbs of New York City I had the opportunity, through my involvement with the PDA COVID-19 Task Force, to co-author a 12,000 word review article entitled Controls to Minimize Disruption of the Pharmaceutical Supply Chain during the COVID-19 Pandemic that was posted on the PDA website as accepted for publication on May 28, 2020 and officially published in the July-August 2020 issue of the PDA Journal of Pharmaceutical Science and Technology. We concluded that as SARS-CoV-2 is a highly communicable human respiratory virus, the largest risk to the supply chain is primarily absenteeism amongst line employees preventing the manufacture, testing, and distribution of drug products and secondly the unavailability of pharmaceutical ingredients, testing supplies and packaging components needed to make these products, not drug product contamination. It was gratifying to find that most of the positions taken in the review article were supported by the industry, as determined by a PDA membership survey, and by the FDA as presented in June 19 2020 Guidance for Industry - GMP Considerations for Responding to COVID-19 Infection in Employees in Drug and Biological Products Manufacturing.
Although, most of us are not directly involved with SARS-CoV-2 vaccine production, we are all cheering from the sideline. In the interests of innovation in vaccine development, I am hoping that the new mRNA approach, taken by at least two companies, will be amongst the winners.
Dr. Michael Miller, President, Microbiology Consultants, Owner of rapidmethods.com: Time to result. We continue to use 19th century methods for the testing of contaminants within manufacturing areas, in-process samples and finished product. Advances in rapid microbiological methods have come a long way, and the industry now has the tools to employ faster detection, enumeration and identification technologies. Real-time detection of contaminants in air and water are currently available, and next generation Raman spectroscopy technologies are being developed that can detect, quantify and identify single cells in a matter of minutes.
David Jones, Director of Technical Marketing and Industry Affairs, Rapid Micro Biosystems: Even before COVID-19 the manual nature and the length time for QC Micro results were challenging for biologic manufactures. Now that companies need to utilize all of their capacity waiting for results or having to rely on a labor intensive in person process has become an even greater problem. Detection of potential contaminants from the production environment is a function of the site’s sampling plan and frequency of sampling. But even the best and most frequently sampling plan is hindered by having to wait 5-7 days for results. This causes a significant time lag between when the site becomes aware they may have a contamination issues and this is compounded by the tremendous back log of results to be analyzed to
obtain tracking and trending data needed to interpret recurring issues. The ability to detect potential contaminants faster and recognize trends sooner requires a much more automated, streamlined process. With the time lag associated with manual methods, there is difficulty determining root cause or activities which resulted in contamination simply because no one can remember exactly what they were doing seven days earlier or even longer. The workload per tech is overloaded and they many times struggle to simply complete tasks with no remaining time to think through an issue and resolve. Detection of potential contamination hotspots earlier in the process is critical to eliminating contamination rather than awaiting final sterility results as it is beyond fixing at that point.
Azita Kazemi, Microbiology Manager, SGS North America, Inc.: One of the critical industry issues is effective cleaning procedures and analytical methods must be available to determine the CFUs in rinsates prior to the manufacturing campaign and/or in the finished product.
A cleaning operation, followed by drying, must take place as soon as possible after production has stopped, irrespective whether a succeeding product is scheduled for that specific equipment. This prevents possible build-up of microorganisms in the equipment.
Also, products purchased from suppliers of active ingredients, inter-mediates and/or raw materials must meet all quality criteria, including those related to prevention and/or control of microbial contamination.
Michelle Neumeyer, Life Sciences Product Applications Specialist for the Sievers line of analytical instruments at SUEZ – Water Technologies & Solutions; Dave Wadsworth, Global Product Manager, Bio-Detection at SUEZ – Water Technologies & Solutions: Monitoring endotoxins in ultrapure water, in process components, and final drug product continues to present significant issues within the industry. Most notably is the manual and cumbersome assay setup process, which presents significant opportunity for error, thus leading to costly retests. Additionally, data integrity gaps with manual test methods such as gel-clot, or inadequate software with a kinetic method, continue to impact businesses’ abilities to detect endotoxins routinely with complete confidence.
Mike Dingle, Field Application Specialist, TSI: Operating under a pandemic has obviously been a critical issue for all industries, and this industry is no different. Those whose job it is to detect and eliminate microbiological contamination are probably one of the best to understand and deal with this. In fact, the encouraged behaviors that are new to most are commonplace practices for those in the world of contamination control. With that said, even these professionals have likely needed to make some adjustments to their work routines as well.
Efforts to limit contact between personnel has led to such practices as operators working split shifts and management working from home as much as possible. This has amplified the issues associated with the extremely manual nature of traditional microbiological methods. If these practices are to continue, the drive to explore and implement more automated test methods and electronic systems will accelerate. These will reduce crowding in the lab, while also improving data integrity and accessibility.

S AV E TH EDAT E
D E T A I L S W I L L B E A N N O U N C E D O N S O C I A L M E D I A
O C T . O 1 ' 2 0
@contecinc

Paula Peacos, MS, Senior Consultant, ValSource, Inc.: The increased focus on risk-analyses (as well as the quality of those analyses) and holistic facility contamination control programs has required microbiologists to increase their baseline knowledge of the processes they support. Identification of the critical contamination control points throughout the process has prompted better, more thoughtful design of supporting control programs such as EM, gowning, cleaning and disinfection, facility design, in-process testing programs, training programs, etc. All of this in turn allows for more proactive measures to be employed and can also improve the success of microbiological root cause analyses during investigation by identifying the areas of highest risk.
Cell and gene therapies have emerged as a “hot topic” in the industry. What are some unique microbiological challenges associated with these products?
Sandle: The critical nature of gene therapy means that it is essential to keep cells free from contamination by microorganisms. The problem is that the risk of microbial contamination is high, reflecting the complexity of cell production procedures, which typically involve multiple stages. Each stage requires a level of accuracy and the highest standards of environmental control.
A proactive approach to minimizing contamination is through maintaining an aseptic environment, and this is best achieved through the adoption of barrier technology (such as isolators).
As well as contamination from bacteria and fungi, viruses present a significant risk. It is important that manufacturers develop safety strategies to reduce the risk of virus contamination and implement these based on an understanding of the main viral risks (such as enveloped or non-enveloped viruses) and the appropriate inactivation methods which will eliminate the viruses but, at the same time, not damage the product.
Best practice tips are with the selection of appropriate starting and raw materials; testing cell banks to ensure they are free from detectable viruses; and manufacturing steps designed to remove and inactivate undetected adventitious and endogenous viral contaminants.
Parker: The challenges of working with cell and gene therapies include the short expiration dates and susceptibility for contamination of cell lines. Many companies are turning to rapid microbial testing to combat the short expiration dates of these products. A robust environmental monitoring program and aseptic training are required to overcome the challenges of working with these cell cultures.
Sahil Parikh, Marketing Manager, Microbial Detection, Charles River Laboratories: The most frequent challenge with delivering these emerging therapies to patients is their short shelf life. Since these therapies must be administered to the patient, sometimes within 24 hours, they are often done so at risk, ahead of the final results of contamination testing, such as final sterility. While every effort is made to ensure the product is aseptic and free of contamination, the
patient is still at risk. Therefore, providers of these therapies should
take advantage of confirming the safety of these products as quickly
after administration as possible so that healthcare providers can
treat a potential infection. Additionally, these types of drug products
have compositions different than traditional small, or even large,
molecule products. Rapid microbiology can provide solutions to these
challenges if they are selected carefully and have a wide product
compatibility range. Rapid sterility testing can reduce the fourteen
days of risk a patient is exposed to down to 5-7 days, eliminating over
a week of unnecessary exposure to potential infection.
Dave Nobile, Technical Services Manager, Contec, Inc.: Cell and
gene therapy manipulation is overwhelmingly performed within
the confines of a minienvironment such as a biosafety cabinet (BSC)
or isolator. This personalized medicine approach requires that each
manipulation is dedicated to a single patient, with no product or
materials unrelated to that patient in the minienvironment during
each manipulation.
For volume production this requires many mini environments that
must be cleaned and sterilized between each manipulation event.
This can mean cleaning, disinfecting, and stabilizing each mini
environment multiple times a day. Such frequent interaction between
technician and mini environment significantly increases the risk of
microbial contamination of the mini environment from the usual
sources; the technician, garments, gloves, wipes (used for cleaning),
solutions, and the necessary materials and hardware brought into the
mini environment for manipulation.
While sterility and control of these potential contaminant sources is
critical, the sheer volume and repetition of cleaning and disinfecting the
mini environments between each manipulation event can be daunting,
posing risks to microbial control due to complacency, deviation from
protocol, or both. For robust and effective microbial control under such
frequent activity, it is critical to create validated standard operating
procedures (SOP) in which the entire cleaning/disinfection protocol is as
simple and efficient as possible, and that operators have the best tools
and materials to execute the SOPs most easily.
Harolyn M. Clow, MS, SM (NRCM), Manager, Bio/Pharmaceutical Microbiology, Eurofins: Rapid microbiological testing is crucial for cell
and gene therapies due to the pace of production and patient needs.
Implementing and qualifying rapid methods that detect microbial
contamination at the same or greater sensitivity as conventional and
currently accepted tests can be challenging due to the various matrices
and potential interferences from inherent materials in the products.
Interactions with reagents used in the rapid testing may also need to
be considered. Some manufacturers currently require suitability on
each produced therapy due to the unique patient variable, i.e., every
lot is a different “formulation.” Establishing a robust suitability for the
stable matrix can demonstrate the variable components do not impact
recoveries of microbial contamination when using conventional
or rapid methods, allowing more rapid testing without concurrent
suitability to decrease time and cost.
» MICROBIOLOGY ROUNDTABLE »
64 | | July/August 2020

Moldenhauer:
• Many of these therapies are specifi c to individuals, resulting in small batch sizes. This makes it diffi cult to have appropriate samples to do all the testing that might be desired or needed to resolve issues.
• Reluctance to go to newer, more sensitive, rapid, or alternative methods.
• Keeping personnel motivated to stay at a company. For example, it is easier to change jobs rather than get promotions or salary advances that employees expect.
Barnarhall, Trivedi, Cannon: The industry has seen a tremendous increase in such innovative therapies, off ering hope of recovery to countless patients. However, a number of such therapies require a turnaround time of 2-4 days from extraction to re-injection of cells into the patient. To reduce risk of contamination during such a process, plate counts fall short as the incubation period is at least 5 days to get results. This requires rethinking the control strategy completely, to ensure the process is always under control thus reducing risk of contamination. RMMs, including for the water used for the process, are key to this overall process control strategy. While plate counts would still give a confi rmation about the water quality at the end of the incubation period, knowing that the process is under control using the measurements from the RMMs allows the industry to minimize the risk to releasing product within the required turnaround time. The needs of cell and gene therapy products tell us that innovation in patient treatments requires innovation in manufacturing, processing and monitoring of raw materials.
Cundell: Cell and gene therapies have a seemingly unlimited potential for addressing unmet medical needs. Microbial contamination, i.e., the absence of mycoplasma, bacteria, fungi and viruses, is a critical quality attribute of these unique products. Given the multiple steps from donor selection, cell harvesting, transformation and expansion, formulation, packaging, shipment to administration, microbial contamination risk identifi cation and mitigation are critical
activities. To develop a more holistic approach
to mitigating microbial contamination in
Advanced Therapeutic Medicinal Products
(ATMPs) I co-authored a review article
entitled Risk Assessment Approach to Microbial
Contamination Control of Cell Therapies
published in the May-June 2020 issue of the
PDA J. Pharm. Sci. & Tech.
Why is getting it right important? Peter Marks,
M.D., Ph.D., Director of the FDA’s Center for
Biologics Evaluation and Research stated:
“As the regulators of these novel therapies,
we know that the framework we construct
for product development and review will
set the stage for continued advancement of
this cutting-edge fi eld and further enable
TRUST TSI
tsi.com/data-integrity
HASSLE-FREEDATA INTEGRITY
TSI offers enhanced environmental monitoring data integrity capabilities with select model particle counters. They’re for use by GMP users to ensure complete, consistent, and accurate data according to ALCOA+ principles.
« MICROBIOLOGY ROUNDTABLE »
www.americanpharmaceuticalreview.com | | 65

innovators to safely develop effective therapies for many diseases with unmet medical needs.”
Miller: The need to quickly release these products due to short shelf life and/or the ability to administer the therapies in patients as rapidly as possible. Furthermore, many new advanced therapy medicinal products (ATMPs) are manufactured in very small volumes which do not allow batches to be tested for sterility according to current compendial requirements. For example, Tables 2 and 3 in USP chapter 71 would require an amount for sterility testing that would leave too little drug for a positive clinical outcome. Fortunately, the compendia and regulatory authorities have addressed these challenges with updates to recommended testing strategies and policies. The reader should refer to USP chapter 1071 (Rapid Microbial Tests for Release of Sterile Short-Life Products: A Risk-Based Approach), Ph. Eur. Chapter 2.6.27 (Microbiological Examination of Cell-Based Preparations), 21 CFR 610.12 (Amendments to Sterility Test Requirements for Biological Products), FDA’s 2020 guidance on cell therapy (Chemistry, Manufacturing, and Control (CMC) Information for Human Gene Therapy Investigational New Drug Applications), the European Union’s 2018 guidance on ATMPs (Guidelines on Good Manufacturing Practice Specific to Advanced Therapy Medicinal Products), and the guidance provided at http://rapidmicromethods.com.
Jones: The microbiological testing for cell and gene therapy manufacture has been an interesting challenge for the industry and regulators. The requirements vary as to components of the process. The viral vectors can be mass produced and bottled and stored frozen so manufacturing and testing mimics standard biologic process testing. The patient product however usually has a critical shelf life and should be “Sterile” for administration to the patient. The pressure is on to make a clean product as often the patient will not survive long enough for a second round in the case of a failed sterility test. Microbial methods that allow faster enumeration for raw material, in process and EM samples in <1-2 days would allow QC to determine the risk of contamination in the final product so it can be released at 3-5 days if still negative with lower risk. There has been discussion on whether the product sterility test needs to be for sterility or can have a higher specification to account for what would be an “infectious dose of bacteria”. Levels of <100cfu have been proposed. In that scenario a sterility test that enumerates contamination would be required rather than the traditional presence/absence test.
Kazemi: Cell and gene therapy product manufacturers face the challenge of microbial control. Manufacturing requires a fully aseptic process with no sterilization. The heat, gas, or radiation associated with the sterilization process will kill immune cells whereas sterile filtration will remove immune cells. The final product usually has a very short shelf life and thus presents a significant challenge with respect to traditional safety tests such as Mycoplasma (agar/broth) and sterility. Alternatives are respectfully, PCR based Mycoplasma testing (same day), and rapid sterility in automated microbial growth systems (~7 days), neither of which are approved by the FDA, and discussions should be had apriori with appropriate justification, and supporting data.
Dingle: The manufacture of cell and gene therapies can vary greatly, and they all come with their own special set of challenges. One challenge these processes tend to share is that they must be performed aseptically throughout because there is no sterilization method that can be used that will not also render the product ineffective. To add to that challenge, the final product may need to be administered to the patient prior to the availability of results if traditional, culture based, microbiological test methods are employed.
Emerging technologies such as gloveless isolators and rapid, or even real-time microbiological detection systems, can mitigate many of these concerns. Viable particle detection using real-time technologies (non-growth based) can assure environmental control without introducing risk through human intervention. However, as with all new technologies, they come with their own challenges involving validation and regulatory acceptance.
Peacos: One of the most challenging issues in my opinion is the exceedingly short turnaround time for some of these processes, especially some of the autologous treatments and therapies which must be administered to the patient as soon as possible after production. This generally requires the use of rapid methods for critical microbiological tests such as sterility. However, some critical controls such as EM still take 5-7 days for results to be obtained. Identification of any isolates recovered takes place after that. Shipping samples to a third party for processing increases that time. Many of these processes are also still very manual in nature, requiring very robust and proactive contamination control measures to be in place, especially as many of the production turnaround times are so short.
The rapidity with which new technology in this area is emerging is also pressuring regulatory bodies and the industry to rapidly determine and publish new regulatory and guidance documents to ensure the necessary controls and standards are in place. For example, many of these products have a very small batch size, requiring innovative sampling and testing strategies to ensure accurate and reliable results, which recently issued guidance documents have helped to address.
What are some must have essentials that have to be incorporated into a microbiological monitoring program to ensure effectiveness?
Wills: Over the last year, one of many focuses of the pharmaceutical industry has been ensuring detection of microbiological contaminants (e.g. bacterial endotoxins) with the additional challenge of doing so in a sustainable way. A well-balanced approach to sustainability efforts spanning the 3Rs (Reduce, Replace, Refine) is implemented by many as part of their strategic growth plans, and here at Associates of Cape Cod, Inc. we also strive towards the same. The LAL industry, one of the pipelines feeding into pharma, is expected to be constantly improving. For example, waste and consumption of LAL reagents is being reduced, processes refined and in some situations, alternate reagents used as replacement for LAL. While the LAL reagents do not exactly fall under the definition of animal testing (the LAL industry does not use crabs for testing; only a small proportion of horseshoe
» MICROBIOLOGY ROUNDTABLE »
66 | | July/August 2020

crab hemolymph is removed and then later refined into a final product that supports in-vitro testing), there may be other drivers for a replacement of LAL reagents e.g. a sustainable supply chain. It has to be noted, however, that such replacement will have little to no impact on the crab population. In fact there is evidence to suggest that in areas where the populations are managed and LAL manufacturers exist, the horseshoe crab populations are doing much better than where there is little focus.
Sandle: Environmental monitoring programs need to be well-thought and planned. It’s important to establish what the frequency of sampling will be and what this will be based on (such as biasing the program towards areas where open processing occurs). Care also needs to be given to sample site selection, and this should be based on established risk methodology (such as HACCP).
The essentials also include thinking about the different vectors of contamination, such as from people, water, material and transfer and so on, and what the most appropriate methods will be in relation to the contamination transfer points. Airflow visualization can assist with this.
Attention also needs to be given the most appropriate agars and incubation regimes (temperature and time combinations), especially where dual temperature incubation is undertaken.
Overall program effectiveness needs to be gained from regular review. Has the room design changed, for example? Are there new shift patterns? Is a different product being processed? Such questions can prompt the necessity of undertaking a review.
Parker: An effective environmental monitoring program requires an adequate risk assessment to determine the greatest areas of vulnerability for the facility. Environmental monitoring samples provide a snapshot in time of the cleanroom environment and trending over time is required for an accurate assessment of the state of control.
Parikh: Rapid microbiology has been a must-have essential for a comprehensive and efficient microbiology monitoring program and quality system. The industry, by and large, has been slow to adopt rapid detection methods, even though many industry drivers such as data integrity have demonstrated their value. Moreover, increasing speed-to-patient and reducing inventory holding costs have also been drivers, but have certainly moved up in priority as prominent and key drivers this year. Increasingly, pharmaceutical manufacturers have come to realize how rapid methods can ensure business continuity in the face of increased market demand, staffing limitations, and the need to reduce operating costs, all while ensuring their products are 100% safe for use. We have been working closely with many organizations to validate rapid detection systems quickly and efficiently over the last year, as well as support current customers in expanding the use of their current systems. These organizations have been able to adapt with changes in the industry, their patients, and internal organizational restructuring by relying on their rapid detection systems to deliver faster results and improving speed-to-market, inventory, and the burden on their quality control laboratory
Clow: An effective microbiological monitoring program consists of more than the physical collection of samples to detect contamination. An effective program uses chemical and microbiological cleaning validation to ensure cleaning and disinfection agent residuals are consistently removed or reduced to levels that will not be inhibitory to the recovery of microorganisms when standard cleaning methods are executed. An end-user disinfectant efficacy study provides evidence of the relative effectiveness of selected disinfectants on the types of expected or recovered microorganisms in the facility. The physical environmental monitoring collection events then act as sentinels to confirm the continued effectiveness of the cleaning agent, cleaning procedures, and frequency of cleaning to maintain the cleanliness level desired. This three-pronged approach allows more complete assessment of possible contamination sources and effective remediation steps when unexpected environmental monitoring excursions are observed.
Moldenhauer:
• A system for tracking and trending of data in a timely fashion, so that one can respond to issues.
• Qualified or validated methods.
• Earlier detection methods.
• Management support.
• Qualified personnel, e.g., understanding pharmaceutical microbiology.
Barnarhall, Trivedi, Cannon:
• Overall control strategy for processes, to drive home quality by design and lean quality principles. Such process control strategies would include traditional methods as well as RMMs, to provide continuous monitoring and control.
• Increased sensitivity and faster response time, in keeping with the evolving needs of the industry as it launches new therapies.
• Continuous online monitoring of all parameters, including microbiological monitoring, to have a full picture of the health of the process.
• Definition of proactive and quick steps, relying on RMMs’ output, to mitigate issues before they occur.
• Corporate strategies and planning should include capital investment needed to improve quality by design and the cost of quality, including RMMs. This was the intent of FDA’s Process Analytical Technology initiative, to help the industry meet the challenges new therapies bring.
Cundell: The pharmaceutical industry must be aware that it is facility design and operation, validated sterilization processes, and aseptic practices not microbiological monitoring that prevents microbiological contamination of our products. Microbiological monitoring programs should be viewed as tools to confirm the effectiveness of our controls and detect any adverse trends. Methods employed for air, surface, and personnel monitoring have serious limitations in terms of microbial recovery, analytical capabilities, and timeliness to obtaining the results.
« MICROBIOLOGY ROUNDTABLE »
www.americanpharmaceuticalreview.com | | 67

The recommendations contained in USP <1116> Microbiological Control and Monitoring of Aseptic Processing Environments to track isolation frequency and not numerical alert and action levels is good science and is slowly gaining traction in our industry.
New monitoring technologies especially laser-induced fluorescent particulate monitoring that can provide a stream of data have a huge promise and should be viewed as a process analytical technology. Transitioning from monitoring once per shift to continuous data collection requires we do not over react to the occasional monitoring excursion with emphasis on overall environmental control and the recognition that some interventions may potentially contaminate our operation and product associated with these excursions should be isolated and, if necessary, rejected.
Jennifer W. Vaval, Senior Laboratory Operations Manager, Nelson Laboratories Fairfield, Inc.: Environmental monitoring should be established in the laboratory. This formal program should clearly define the expectations and evaluate all circumstances involving the microbiological quality of the processes. The amount of documentation and tracking should be clearly defined per the SOP and the regulating authority (ie. International Standards Organization (ISO)). Each technique used must be validated to make sure that the adopted method/procedure accurately provides the desired information and allows for trending and traceability.
Miller: The ability to trend data and to move toward alternative methods for environmental monitoring. USP chapter 1116 is an excellent resource for recommendations on trending EM data rather than applying absolute limits. Additionally, the revision to Annex 1 proposes that rapid or automated monitoring systems should be considered to expedite the detection of microbiological contamination issues and to reduce the risk to product. In fact, the revision notes that the types of monitoring methods listed in the table for viable particle contamination (i.e., air samples, settle plates, contact plates and glove prints) are examples only and that other methods can be used. Furthermore, Annex 1 clarifies that the action limits in the same table refer to the colony forming unit (cfu), and that if different or new technologies are used that present results in a manner unlike the cfu, the manufacturer should scientifically justify the limits applied and where possible correlate them to the cfu.
Jones: A key component to an effective EM program is the speed to data review. The use of manual input of microbial data to Excel spreadsheets and monthly review is an imperfect way to either determine facility trends or to implement remedial action in a timely manner. To be effective the testing needs to be performed using a rapid microbial method that automatically downloads the results to a software package such as MODA that can analyze the data and show hot spots or trends in near real time. Having the excursion data pushed to the decision makers immediately should facilitate fast responses that minimize more serious events.
Kazemi: According to 21 CFR 211.113(b), you must begin with a well written Environmental Monitoring Plan since the real value of a microbiological monitoring program lies in its ability to confirm consistent, high-quality environmental conditions at all times. The
procedure must be presented clearly for easy understanding of personnel performing environmental monitoring. Training is a key point to prevent microbiological contamination that, in some cases, may be the cause of human error in the manufacturing and testing laboratories.
A crucial element in an effective EM procedure is to determine the correct sites for sampling, the frequency of sampling, and right testing methods such as contact surface sampling and swabbing of difficult to reach surfaces. The program should have well-presented trending information that will be a guide for tracking the contamination path.
Routine testing should be carefully determined to present meaningful information during normal manufacturing hours, and a data library of the facility’s typical recovered microorganisms provides helpful data for OOS investigations. It is very important to set the correct alert and action levels of contamination. Therefore, appropriate actions need to be taken every time when the specifications are reached.
Neumeyer and Wadsworth: From a purified water monitoring perspective, using technology that reduces human interaction with sampling and analysis has greatly increased sample integrity and process efficiencies. For example, when testing for total organic carbon and conductivity in purified water, some instruments can 1) do simultaneous testing of both quality attributes from a single vial, and 2) automate the analysis with autosamplers and software. Online TOC and conductivity analysis is another way to reduce or eliminate sampling, laboratory analysis, and human errors. Online analysis gives the highest level of control and compliance of a purified water system with real-time TOC and conductivity data.
Just as with TOC and conductivity, reducing human interaction and the associated variability with endotoxin detection is a fantastic way to ensure effectiveness. By implementing an endotoxin detection system that reduces human errors by simplifying and streamlining assay setup, laboratories can reduce risks and improve operational efficiency. Of course, it is imperative that any automated system be fully validated and remain fully compliant.
Dingle: The basics of what goes into a microbiological monitoring program is straightforward and well-understood, but what makes it effective or not is how it is implemented. The key to an effective monitoring program is to establish the program based on risk to product and patients, not strictly to meet the regulatory requirements. The program must be able to demonstrate the manufacturing environment remains in adequate control so as not to put product at risk. The GMPs, along with all the other standards and guides, provide a good start, but it is impossible for them to be prescriptive enough to assume that compliance will guarantee effectiveness. Recognition of this can be seen with the increased focus on risk in the draft updates to Annex 1.
Another important component of an effective monitoring program is to make sure that procedures, personnel, systems, etc. are in place to assure that data is reviewed and trended in a timely manner. A very well thought out program that does a first-rate job of collecting all the right data immediately becomes ineffective if no one notices an excursion or adverse trend in time to do something about it.
» MICROBIOLOGY ROUNDTABLE »
68 | | July/August 2020

Peacos: There are two major items that are critical to the success of the EM program. First is a sound program design based on an end to end process-based risk assessment. Critical points in the process where contamination can enter must be properly identified, and the appropriate EM measures applied. The EM program must also be monitored for its efficacy and adjusted as needed, when needed.
Second is a robust trending program. Again, program design is critical to obtain the most useful information. Detailed and robust data analysis is essential. The resulting trending report should be much more than a simple presentation of the data collected from one interval to the next. A good trending program allows the microbiologist to identify and mitigate issues before they become problems as well as to identify opportunities for improvements in supporting programs.
Both of these elements have a huge impact on the success or failure of the larger facility contamination program.
When designing new, or renovating older facilities, how important is the cooperation between equipment vendors, microbiology technology providers and sponsors? What advice can you offer to make this relationship successful?
Sandle: The aging pharmaceutical facility is something gaining regulatory attention. As newer pharmaceutical manufacturing has been moving to countries where labor rates are lower, this has resulted in many facilities in higher-income countries receiving less attention and such ‘aging facilities’ go on to have operational issues. Such issues include struggling to adapt to new processes and the problems associated with weaker fabric.
The extent of the problems of aging facilities means that different parties need to come together. If a new surface is being fitted for example, the microbiologist will need to assess this surface in relation to disinfectant efficacy studies, for example. If new equipment is to be fitted, it may need to be assessed for particle generation and hence overall environmental impact. Further with equipment, consideration also needs to be given as to how the equipment will be cleaned and sanitized and how this will be assessed.
Parker: A good working relationship with your stakeholders and supply chain is vital when designing new or renovating older facilities. To have a successful relationship, there must be an understanding and forecasting of events so the vendor can meet the needs of the facility. The vendor should also be flexible as there are always unpredictable situations that can arise and need action in return. Understanding the importance of meeting timelines is important for both the facility as well as the stakeholders involved.
Parikh: Cooperation and collaboration between equipment vendors and their customers, especially in today’s business environment, is not just important: it is critical. Organizations like Charles River, who provide quality control testing equipment, must truly act as partners for their customers. Quality control solutions, such as rapid microbiology testing equipment, must be supported to routine use,
not just to the point of sale. This involves supporting and providing
additional solutions for validation, which we now offer, which is always
necessary with a new instrument, but has seldom been supported by
the supplier. We believe that this paradigm needed to change, and as
suppliers and experts in these technologies, the burden can no longer
be solely placed on the customer. That being said, we advise quality
control laboratories to inquire about what support offerings a vendor
can provide to ensure a newly purchased instrument can go into
routine use as quickly as possible and supported year after year. This is
the true measure of a successful working relationship.
Nobile: Whether designing new or rehabilitating an existing facility,
cooperation as well as coordination between the designers, equipment
suppliers, construction contractors, and the contamination control
engineers/microbiologists is critical. When done effectively, the
result is a facility that operates most efficiently, is easier to clean and
maintain, and is easier to keep under microbial control over a much
longer service life.
All too often, facilities exhibit the result when such coordination is
absent: room layouts and equipment configurations that are inefficient
or simply not usable, wall and floor materials that are more difficult to
keep clean, panel seams that fail prematurely, poorly planned piping
and electrical lines that require more time and effort to clean and
maintain, return air vent louvers that are impossible to clean reliably,
and manually operated doors and lights to name just a few issues.
Cleanliness requirements in pharmaceutical cleanrooms have become
more stringent at the same time labor and other costs to maintain
the cleanliness and microbial control in cleanrooms have increased.
Influencing these facility costs is best done at the outset of the design/
planning process. Design, layout, and equipment and systems choices
made early, with knowledgeable stakeholders involved, will result in
facilities that enable the lowest cost and most efficient cleanroom
operation, ease of maintenance, and longest service life possible.
Clow: Cooperation and collaboration are essential. Clear
communication and prior planning is more essential. By ensuring
that clear communication is flowing between all parties, and having
effective planning in advance, facility validation programs related to
new designs and renovations will progress more smoothly. Be clear
on roles and expectations of each party. Listen to your vendors and
providers and also consider their business expertise and suggestions to
make your project more efficient. Incorporate multi-way agreements,
if feasible, so vendors and providers can communicate and coordinate
activities to more quickly meet project needs and provide sponsors
with suggestions. Plan as far ahead as possible with your providers to
ensure all items have been thoughtfully considered, including what
actions to take if steps are delayed or things go wrong. If everyone
knows the purpose and end goal, vendors and providers can more
rapidly identify issues that require adjustment to plans so they can stay
on target. Giving everyone the bigger picture and allowing vendors
and providers to be active in ongoing planning so they can rapidly
make necessary adjustments, increases the chances of success for all.
« MICROBIOLOGY ROUNDTABLE »
www.americanpharmaceuticalreview.com | | 69

Moldenhauer:
• Vendors need to learn more about how their equipment will be used at the site as well as understand the needs of the company, e.g., validation support, system needs, issues with the types of products made, and the like.
• Companies should develop User Requirements that clearly define ALL the requirements that must be met for the company to successfully use the system.
• Validation and Implementation really requires joint effort and work. Both groups need to work together to develop pathways to achieve the desire validation result.
• Vendors for new technologies need to be honest, especially about throughput and how to achieve the throughputs that they claim.
Barnarhall, Trivedi, Cannon: The relationship between these three entities is essential to move the industry forward and collectively improve our product offerings, processes and raw materials. Equipment vendors and microbiology technology providers need to understand industry trends and be ready to provide solutions to the stakeholders’ needs when they implement new processes. At the same time, stakeholders should involve the other entities at an earlier stage and leverage their expertise to understand new product developments, technology and improved methods. Stakeholders should be open to implementing such methods, in their quest to continuously improve quality, reduce analysis time and increase cost savings. Participation in the industry meetings by various organizations like ISPE and PDA will help all entities to align on industry trends. Close collaboration and educational exchange between the entities, not unlike that conducted by SME’s (Subject Matter Experts) with pharmaceutical engineers regarding the state-of-the-art for system design, would help stakeholders learn about and plan for adoption of improved methods. This on-going collaboration is essential to moving our industry forward.
Cundell: With facility design, construction, and commissioning, the keys are corporate sponsorship, project management, and teamwork. Late in my career at Schering-Plough I participated in the construction of a new non-sterile global clinical supply manufacturing facility in Summit, New Jersey. The facility was modular, designed by a Swedish company, constructed in Poland, shipped, and assembled in New Jersey. Decisions had to be well considered, timely and final. This provided us with focus and a sense of urgency. The in-process microbiology laboratory was constructed connected to the manufacturing facility and samples arrived via a pass through. My R&D microbiology group was kept informed with the overall progress of the project and was engaged on a need basis on facility design, utilities, equipment purchase, and commissioning and process and equipment validation. Key milestones were celebrated and the project was brought in on schedule.
Jonathan Swenson, B.S. SM(NRCM), Sr. Laboratory Operations Manager, Nelson Laboratories, LLC: It is important to find the right team to have a successful build. Having vendors and consultants
that fit your communication needs is vital to reduce the number of missteps. The last thing you want to deal with is getting a piece of equipment that won’t fit through your laboratory doorway or dealing with an incubator that won’t stay in range because the room is too cold during the winter.
Understanding the available technology, your current needs and more importantly looking at future growth before you finalize plans will save you time with last minute changes and frustration. For example, if your current benchtop pure water system is near capacity you should review the return on investment for a larger dedicated system rather than planning on buying multiple benchtop systems. This approach will help you from dealing with an equipment spend approval after the budget has already been finalized.
Miller: The relationship between manufacturers and suppliers is of the utmost importance. This should initially be achieved by putting a robust and formal contract in place detailing each party’s responsibilities, commitments and expected milestones for the project.
Jones: It is critical that vendors or technology providers becoming an integral part of this new design or renovation provide insight early in the process to ensure designs and layout accommodate not only the dimensions required for their equipment but the additional requirements specific to their product. Having to retrofit a new building with items overlooked in the design will not only add cost but will delay startup as well. Something as simple as placement of electrical outlets needed for equipment to accessibility to ethernet cables, anything overlooked becomes critical as they struggle to meet their deadlines. The vendor should work to be included in projects from the beginning with walk-thru visits and blueprint reviews to ensure success while providing your customer with the guidance they need. Listening to the customer’s overall goal and having them walk through how things will work will allow you to make suggestions on their workflow design based on your experience with other site buildouts or current customer layouts.
Kazemi: Having positive vendor and equipment provider relationships goes a long way in deciding the outcome of your project. SGS recently converted a 19,500 square foot manufacturing facility into a modern, well equipped microbiology facility complete with ISO 6 Cleanrooms and ISO 8 laboratories under state-of-the-art HEPA controls. Proper vendor resource management was a key factor in the completion of the building renovation on time. Companies should hold regular review meetings to foster good communication, listening and adapting to changes; asking for vendor feedback will help avoid potential problems. Monitoring the project’s KPIs through regular communication allows both parties to stay on course.
Neumeyer and Wadsworth: It is extremely important to have communication and coordination in the very early stages of a project. This allows for the correct implementation from the beginning, rather than having to retroactively implement what is required. For example, some water purification systems are fitted with sensor TOC technology for cost savings without coordination with the end user or other technology providers. Is important to have instrumentation on a water system that can generate validated, qualified data in order to support
» MICROBIOLOGY ROUNDTABLE »
70 | | July/August 2020

GMP activities and important decisions. Having these conversations and choosing appropriate technology early in the process can avoid being stuck with technology that is not fit for purpose. Another aspect to consider is the longer-term relationship with various equipment vendors and providers. Ideally, it will be a true partnership that results in successful projects across facilities.
Dingle: Cooperation between all parties is critical. Too often microbiology has been an afterthought in these projects. Part of the reason is that traditional microbiology has not needed lots of consideration. For example, if using a settle plate to monitor, a surface to set the plate on is all that is needed - not a lot of planning needs to go into the design. However, today, designing a new or renovated facility offers a great opportunity to implement any of a number of rapid or alternative microbiological methods that have become more prevalent over the last few years. These methods may have requirements that will affect design and will be very difficult to implement if they are not in the plan from the beginning. This means that a good user requirement specifications (URS) document will need to created early on in the process. Since most users will have limited knowledge of these methods, extensive involvement of the equipment vendors, microbiology technology providers, and sponsors is necessary to assure success.
Peacos: Cooperation between these entities is always extremely helpful. That being said, it is important to cultivate an open, transparent and collaborative relationship with each member of your project team. As these providers are interested in assuring the success of their clients and are also usually eager to improve and expand the scope of the services they provide and their problem-solving skills, such a relationship can facilitate cooperation between the suppliers. Making them see the potential benefit for their own business is of course critical in achieving this goal. That being said, it is important to make sure you speak to the right contacts. It is also important to make sure you have someone on your internal team with the appropriate business/negotiating skills if you opt to engage in such discussions. All that being said, some entities will always be more receptive to cooperation than others, especially when it comes to proprietary knowledge and confidentiality, but if you can get them to work together, some pretty innovative solutions can result that are beneficial to all.
Over the next few years, what do you see as some of the most critical industry issues that will affect microbiology identification, detection, and removal efforts?
Wills: We expect that the industry will continue to evolve under the current pressures of developing high-profile vaccines and drugs. Along with that, we look forward to seeing the developments in the acceptance of recombinant reagents not only in the US but also globally as the recombinant reagents become more commercially available worldwide. We are very much looking forward to ongoing collection and sharing of data on endotoxin concentrations when using recombinant reagents and their potential uptake where appropriate.
Sandle: With microbial identification I think we’ll see more requirements for the use of genotypic methods. Technology that can sequence or match microbial contaminants, showing how different organisms relate to each other has always been very useful, especially when making product release or reject decisions. As this technology becomes more affordable, its use should decrease.
With detection, the adoption of spectrophotometric particle counters is slowly edging forwards. These technologies can help to differentiate inert and biologic particles and to provide some useful real-time assessments of environmental control in cleanrooms, enabling processes to be halted if there is an apparent microbial risk in an area.
With microbial removal, the battle may be easier with microbial exclusion. The latest draft of EU MPG Annex 1 has given the industry a strong nudge towards the adoption of barrier technology.
With more direct microbial removal, there’s some interesting work going on with microbial enzymes designed to remove a wide variety of contaminants from various surfaces. One method is based on the affinity of microbes for hydrocarbons that are digested, producing harmless carbon dioxide, water, and soluble fatty acids, as an alternative to solvent cleaning.
Parker: As emphasis on the biologics field increases, methods of sterilization and monitoring must adapt to the rise in demand. The shorter stability dating of biologics will challenge the industry to complete testing closer to the date of manufacturing. Rapid microbiological analyses, with greater accuracy, must be developed and accepted by regulatory bodies. As many biologics are unable to be terminally sterilized, greater emphasis will be placed on aseptic manufacturing to prevent contamination and an environmental monitoring strategy to detect contamination.
Jonathan Stewart, Manager, Quality Control, Catalent Biologics, Bloomington: The most critical issues affecting microbiology identification, detection, and removal efforts are contracted bacterial and fungal ID, Limulus Amebocyte Lysate (LAL) derived from horseshoe crabs, and supply of laboratory items in the wake of stressed global demand.
As the time-to-result demands become shorter, the key to timely investigations lies in rapid on-site identification technology. This is a core requirement of any microbiology lab and will continue to be a critical quality requirement in the future.
For decades, the bacterial endotoxin test (BET) has been heavily dependent on animal-derived biproducts and animal model tests. Moving from rabbit pyrogen testing to horseshoe crab-derived reagents was a big step but had obvious drawbacks. In the coming years, it is critical for novel drugs to move away from traditional BET methods into new synthetic pathways proven to provide equivalent reliable results.
Global supply and demand for products essential to laboratory testing is another concern. Current demand for essential personal protective equipment (PPE) such as masks is exceeding the burst capacity of many manufacturers resulting in a drop in supply. Redundant suppliers and
« MICROBIOLOGY ROUNDTABLE »
www.americanpharmaceuticalreview.com | | 71

appropriate reorder points should mitigate testing delays, enabling the provided test results to help maintain the supply of safe and effective drugs to patients.
Hoffmeister: A critical topic will be pharmacopoeia harmonization. Pharmacopoeia harmonization or “convergence” provides better support for global regulatory agencies and addresses the global nature of bio/pharmaceutical manufacturing and supply, which ultimately benefits global patients who rely on these medicines to extend and improve their lives. The sheer number of pharmacopoeias and the current lack of broad harmonization add complexity to a company’s processes for compendial monitoring and compliance. Any level of harmonization is beneficial and moves in the right direction to help provide medicines with consistent quality to patients around the world. As the pharmacopeia start to differentiate their chapters it can cause a headache for pharmaceutical organizations to ensure compliance and harmonization of their processes globally.
Duncan Barlow, Technology & Marketing Development Specialist, Microbial Solutions, Charles River Laboratories: Over the last few years there have been increased cases of product recalls due to contamination by fungi. Very few product recalls related to fungal contamination have had a species level identification associated with them. There are many examples of fungal species associated with risk of infection to patients (e.g., Aspergillus fumigatus is a common organism that can cause serious infections in immunocompromised patients). With the increased focus from regulators on understanding to species level what organisms are found in production environments it will become more important to be able to accurately identify fungal contaminants. The advantages of this knowledge are clear: trending of isolates is required and fully understanding what species you have present will allow for accurate risk assessment and proactive remedial action. It will also aide in getting to root cause in the event of product contamination and ultimately ensure patient safety. In the past, fungi may only have been reported as “black” or “green” mold. As an industry, we need to do better than that! With recent advances in technology such as MALDI-TOF, but more importantly the reference libraries, there’s no excuses anymore for lack of species level identifications for fungal isolates.
Clow: There is increased attention on detection and identification of Burkholderia cepacia in the industry. When a presumptive positive is obtained, two common identification methods, MALDI Biotyper testing and 16S Gene Sequencing, have limitations in identifying or ruling out B. cepacia. The 16S Gene Sequencing identifies the Burkholderia cepacia complex, which currently includes 21 different species. This may not be specific enough in some situations. The Burkholderia cepacia complex can only be fully identified by performing Multilocus Sequencing Typing (MLST) which can be expensive. As more compendial guidance is provided related to testing for the presence of B. cepacia, the industry must address and balance the identification limitations with testing requirements, contamination risks, and remediation measures.
Moldenhauer:
• Microbial detection will increasingly go to chemistry-based methodologies, e.g., MALDI-TOF. Microbiologists do not
typically understand these types of systems. As such, there will either be chemists in the microbiology laboratory and/or the microbiologists will need to learn about the key parameters for the chemistry-based methods they are using.
• Companies need to come to realize that rapid and alternative methods are a reality. Regulators are accepting of these methods. This should remove some of the fear associated with the use of these technologies. Many of these newer methods are superior to the detection methods that are currently available.
• Eliminating microbial contamination will go forward in a couple of different directions. First, we should be looking at products that “prevent” contamination rather than responding after it is already contaminated. There are many products available that prevent contamination, e.g., antibacterial paints, antifungal building materials, mold preventative agents, and the like.
In addition to consideration of “preventing contamination”, we need to look at the newer types of sanitizers and disinfecting agents available. There are several water-based technologies available, e.g., ozonated water (has an extra oxygen) and autoionized water (that has extra hydronium ions with a positive charge). Both of these types of products are superior in that in addition to being effective against vegetative cells, they are effective against spores, fungi, and viruses. Many are effective against coronaviruses as well. Another benefit of these newer types of disinfectants include the fact that the products are non-corrosive. Many traditional disinfectants and sanitizers that are chemically-based can cause damage to steel surfaces, and the damage can provide more opportunities for biofilm formation.
Barnarhall, Trivedi, Cannon: Microbial contamination remains a significant risk in the production of pharmaceutical products. Some of the issues the industry will have to tackle are:
• New and innovative therapies from the industry will continue to put pressure on their teams to minimize this risk, as existing detection methods do not provide information fast enough to act on. Pursuing and adopting RMM’s and other alternative methods of monitoring water systems, raw materials and final products will prove essential to mitigating such microbial risk.
• RMM’s provide the opportunity for real-time data collection and process analysis, which is certainly part of the increased use of analytics and data integrity.
• Gaining acceptance of RMMs as a validated method by collaboratively working with vendors, stakeholders and regulatory bodies, to replace plate counts as processes require faster and faster turnaround time for results.
• Defining overall control strategies for adoption across their facilities, to minimize risk and implement lean quality principles. This will necessitate adoption of RMMs to achieve overall process control.
Cundell: After making huge advances in clinical microbiology as a first-line identification method, the potential of MALDI-TOF mass spectrometry for microbial identification in the pharmaceutical
» MICROBIOLOGY ROUNDTABLE »
72 | | July/August 2020

industry is finally being realized, especially in support of environmental and water monitoring. Given the high capital cost of the instrumentation, contract microbiological testing laboratories have been highly successful in offering this service especially when supported by 23S and 16S rRNA base sequencing. For pharmaceutical QC labs, with a high volume of microbial identifications annually, the low cost per identification and the short time to a result makes the return on investment very favorable.
An emerging technology that is being evaluated by the pharmaceutical industry is Raman spectrometry that has the potential to combine microbial enumeration with single cell identification. With a technology that provides unique intensity-wavelength spectra for different microorganisms there will be serious database limitations initially and any microorganisms identified to genus or species must be evaluated for their objectionableness, if recovered from non-sterile pharmaceutical products. A challenge will be evaluating the potential impact of a wider range of isolators. I believe that the approaches found in the 2014 PDA Technical Report No. 67 Exclusion of Objectionable Microorganisms from Non-sterile Pharmaceutical and OTC Drug Products, Medical Devices and Cosmetics are still applicable.
Our response to objectionable microorganisms could be more nuanced. The impact of human pathogens depends on the genus, species, strain type, antibiotic resistance profile, route of administration. and the infectious dose. With modern molecular technologies, including repPCR, multi-locus sequence typing, and whole genomic sequencing, we may be better positioned to determine the pathogenicity of microorganism isolated from a pharmaceutical product.
Miller: The ability to have a champion at the manufacturing site who will be the sole point of control for the implementation of next generation microbiology methods, as well as a commitment from the senior leadership team to support these types of programs. The future of medicine will include personalized treatments, such as gene and cell therapies, that require the industry to think out of the box in terms of contamination control, in-process microbiology competences and the release of finished product much faster than conventional pharmaceuticals.
Jones: As with many sectors of the pharmaceutical industry the implementation of automation and robotics will have a significant effect on the quality of the microbial data. Minimizing the involvement of the human in the process will reduce the possibility of false positive test results due to having more people in the clean areas or sampling or test issues. Starting points have been with the installation of steam in place sampling systems for a range of collection bags/bottles to reduce the introduction of organisms either to the fermenter or to the collected sample. These units could facilitate the use of robots as sample collection devices that perform the EM testing and transport the test samples to another robot that performs the analytical test. After testing, the result, the meta data around the sample and the test equipment can be fed back into the databases that are being designed as part of the digitization of the manufacturing 4.0. Times, they are a-changin!
Kazemi: I see accurate rapid microbial test methods instead of traditional microbiological methods as one of the most critical
industry issues. It allows for a faster time to results, enabling companies to release raw materials quickly, transfer in-process work to the next stage, and bring finished products to market. This shortens the production cycle, reduces inventory requirements, and frees up working capital.
Neumeyer and Wadsworth: Leveraging Process Analytical Technology is increasingly important in environmental monitoring programs. Traditional sampling methods and laboratory analysis are just not sufficient for the demand for safe and effective medicines. When looking for more efficient and quality methodology, look for ways to deploy process analytical technology. For analytical methods that continue to require laboratory-based testing, it will be critical to deploy techniques and technologies that improve efficiency. Particularly in the endotoxin detection market, efficiency gains are highly desired, but it is important to achieve efficiency in a sustainable fashion. By leveraging automated technology that relies less on natural resources, laboratories can implement solutions that have positive impacts on personnel, business goals, and the environment.
Dingle: The continued progression toward new technologies and test methods is one of the biggest issues that will affect the industry in the coming years. Regulatory agencies have been pushing for this change for some time, but lack of clear direction on how this can be done has severely hampered implementation due to fears of how they may be received by inspectors. While many liked the idea of making changes, and could see advantages in doing so, most were averse to the risk because the old ways were viewed as “good enough” and did not require an extensive effort to defend.
The industry is changing though, and there are a number of situations where the old ways may no longer be “good enough”. For example, if a product must be administered within days, waiting two weeks for a sterility test result is an obvious issue. This is one of the reasons why rapid sterility testing is one of the areas where the most progress has been made with more detailed guidance documents being generated. However, changes like switching from batch to continuous manufacturing and the surge in cell and gene therapies have necessitated the use of new technologies like gloveless isolators and real-time continuous viable particle counters where clear guidance still does not exist. Fortunately, a clearer path to implementation is starting to emerge as interactions between users, regulators and instrument vendors are shedding light on validation and implementation expectations.
Peacos: I think emerging pathogens will become a larger issue. As identification techniques improve, we are finding that some organisms previously thought to be generally innocuous may actually be more virulent, more resistant or otherwise more problematic than previously thought. There have also been studies published recently suggesting that some organisms may have been incorrectly identified or classified in the past. This combined with the rise of antibiotic resistance in general makes me think that we are going to see more challenges like the Burkhoderia cepacia complex in the near future, which required the industry to rapidly develop the specific detection method now required by USP<60>.
« MICROBIOLOGY ROUNDTABLE »
www.americanpharmaceuticalreview.com | | 73

Most GMP manufacturers are spending some amount of time on sampling and analysis. Online TOC monitoring for purified water and cleaning validation can eliminate or significantly reduce sampling.
How many cumulative hours per week are spent taking grab samples for TOC and/or conductivity monitoring?
50.0%28.08%
16.44%
5.48%
■ 1-4 Hours ■ 4-8 Hours
■ >8 Hours ■ None
Please rank your concerns with grab sampling for TOC and conductivity.(1 = Biggest concern, 4 = Least concern)
Data and sample integrity
▪ Time delay in releasing results ▪ Analyst time and resources ▪ Cost *COMBINED 51.28%
▪ Reducing or eliminating grab sampling▪ Real-time data and real-time release▪ Process control and efficiency gains▪ Eliminating laboratory errors *COMBINED 54.89%
Rated: 1 - Most desirable
48.72%
*57.72%45.11%
Do you monitor purified water systems in real time with online TOC and/or conductivity analysis?
Yes, the water systemsare monitored online
Yes, with some grab samples for Point-of-Use
No, there are onlineanalyzers on the water
system, but it is forinformation only
No, we are exclusively taking grab samples
33.33% 29.93%
20.41% 16.33%
Nearly half of respondents believed data integrity is as important as
ever in an increasingly electronic industry. It’s important to use instrumentation and software
that can meet the rigors of data integrity guidance and 21 CFR
Part 11 regulations.
With the demand for efficiency and quality in CGMP facilities, over 63% of the industry has implemented some level of online analysis. Those who are not performing online monitoring may have equipment that is not fit for purpose and cannot be validated. When choosing online technology it’s important to choose instrumentation that is quantitative and can be validated to the appropriate requirements.
Does your TOC instrument distinguish between inorganic carbon and total carbon?
50.0%
Half of respondents do not have appropriate equipment or are unsure if their instrument distinguishes inorganic carbon from total carbon as required by USP <643>. The other half are using equipment fit for purpose for measuring TOC in pharmaceutical grade water per USP <643>. Implementing instrumentation that distinguishes between inorganic carbon present in the sample and CO2generated from oxidation is important for compliance requirements and process understanding.
50.0%
How quickly are Out-of-Specification or Out-of-Trend results from your purified water system detected?
66% of respondents experienced some delays, with 23% reporting delays up to several days. Furthermore, 80% had at least a moderate impact, with 40% having a high impact. Delays in detecting OOS/OOT results can impact batches, equipment, and leave the root cause unclear for a period. With online analysis, OOS/OOT results are detected in real time allowing for immediate remediation while limiting or eliminating impact to equipment and batches.
Data integrity and 21 CFR Part 11 compliance
Which of the following is most desirable about online TOC and conductivity analysis?(1- Most desirable, 5-Least desirable)
YES
NO
■ In real time with online analysis■ Within hours of taking grab samples■ Within days of taking grab samples
43.36%
33.63%23.01%
YES
NO/UNSURE*COMBINED
2020 Purified Water Monitoring SurveyAmerican Pharmaceutical Review recently conducted a survey of our readers to determine their thoughts regarding pure water monitoring. Specifically, the survey asked questions regarding Total Organic Carbon (TOC) monitoring, sampling and analysis for purified water production. Please see the results of our survey below.
Rated: 1 - Biggest concern
74 | | July/August 2020

LEARN MORE AT WWW.INTERPHEX.COM
SAVE THE
DATE
Premier AssociationSponsor
for pharma, bio, device development & manufacturing
THEEVENT
2021
TUESDAY, APRIL 20 -THURSDAY APRIL 22
Javits Center,NYC

»
76 | | July/August 2020
MANUFACTURING »
José-Miguel Montenegro-AlvaradoManager, Process Analytical Technology Projects Global Technology & Engineering / Process Monitoring, Automation & ControlPfizer
Pfizer Case Studies Leveraging Multivariate Analysis for Initial Diagnostics and Process Understanding
IntroductionThis article provides an introductory overview of Multivariate Analysis (MVA) including a brief review of some of its benefits and limitations. The manuscript intends to demonstrate that there may be opportunity to further the use of MVA tools at early stages of investigations as a routine diagnostic tool using medium-sized data sets as part of a more holistic approach to root cause identification. The article then briefly expands on case studies in which MVA tools were leveraged for initial diagnostics and to gather actionable information on potential opportunity areas.
Multivariate Analysis has been described by Divino as a “set of statistical models that examine patterns in multidimensional data by considering, at once, several data variables”.1 Today’s widespread availability of computers coupled with ever-increasing computing capabilities – even for average office configurations – makes leveraging MVA for routine diagnostic purposes a possibility. As stated by Olkin and Sampson “with the continued and dramatic growth of computational power, multivariate methodology plays an increasingly important role in data analysis, and multivariate techniques, once solely in the realm of theory, are now finding value in application”.2
There is arguably an opportunity to further expand the use of MVA tools especially for initial investigational assessments with medium-sized data sets. This perceived gap may relate to multiple factors. However, we should not underestimate the potential benefits of incorporating MVA on a day-to-day basis as a complementary tool to help identify seemingly elusive root causes.
Benefits of Multivariate AnalysisThere are tangible benefits for using Multivariate Analysis tools and the intention is to review some of the relevant ones in this section. From a high-level perspective, a fundamental benefit of MVA tools is to help extract knowledge from data. Mercer et al. assert that “one of the most common phrases used when discussing the benefits of MVA is its ability to convert data into information”.3 In other words, MVA tools support data mining in ways to discern relevant factors that may be used to steer behavior of your variable(s) of interest.
When going through procedural specifics of MVA tools, there are also advantages such as simplified visualization of complex data sets via reduced number of principal components or latent variables.

According to Dempster “balance makes possible the effi cient storage of data as multiway arrays where the labeling of individual values of variables can be represented very compactly [….] The benefi ts include […] simpler interpretation of the results of analysis”.4 Combining numerous variables into a limited set of principal components or latent variables by merging projections into common planes to reduce data dimensionality can signifi cantly simplify both visualization of input data and interpretation of MVA results.
Another benefi t of MVA tools is help reveal empirical relationships and interactions among diff erent variables which represents a more holistic approach versus univariate (‘one-independent-variable-at-a-time’) approaches. Batholomew states that “with multivariate data […] there is now the possibility of investigating the relationships between variables”.5 MVA tools not only help understand relative behavior between each independent variable (Xn) and the variable of interest (Y), but also helps visualize combined interactions between variables and confi rm if a set of factors is more relevant to explaining (Y) behavior than only focusing on a single suspected variable. MVA tools are also capable of analyzing diff erent types of inputs as “the data may be metrical, categorical, or a mixture of the two”5 which means data sets can combine quantitative and qualitative data and still be able to perform concurrent analyses.
Limitations of Multivariate AnalysisMultivariate Analysis tools are not infallible. There are limitations and it is important to understand them in order to reduce their infl uence in the analysis outcomes.
A basic checkpoint for all types of modeling – not just MVA – is to ensure the quality and representativeness of training data sets, as the principle ‘garbage in/garbage out’ implies. Oftentimes this is not necessarily under the control of the person performing the MVA. For example, while an experienced analyst may emphasize the need for a minimum quantity of representative data incorporating process variability sources (i.e., diff erent batches, diff erent material suppliers, variability in actual process and environmental parameters, data from golden batches and ‘out-of-spec’ batches, etc.) there are still aspects of the data that may lack desired accuracy or resolution levels. An example may be raw materials property values reported by vendors. Sometimes when comparing large amounts of raw material batches, they show little – if any – variability in property values one from the other. It seems there are not enough signifi cant digits in the reported property values as to be able to clearly discern its impact using MVA techniques. In some cases, it may be recommended to performed in-house testing if the test resolution can be signifi cantly improved.
Another limitation worth noting – more so in this article encouraging use of MVA for medium-sized data sets – is that, as a general rule of thumb, the larger the sample data set, the more reliable the results of the analysis. As stated by Jackson “for multivariate techniques to give meaningful results, they need a large sample of data”.6
Keeping this in mind, medium-sized data sets can still help provide hints, but before getting to conclusions you should use the MVA
outcomes complementary to other process historical information and investigation tools, and consider increasing your MVA data set looking to either further confi rm or challenge initial fi ndings.
There are additional limitations and particularities to consider but it is not possible to expand on all of them due to article size constraints, so instead some of them are mentioned for awareness: minimize missing data values as possible, challenge for random correlations (casualty versus causality), and avoid overfi tting – especially with medium-sized data sets for initial diagnostics, it is recommended to use a reduced number of principal components or latent variables.
A Look at Case StudiesThis section intends to review actual case studies in which MVA tools were leveraged for initial assessments of medium-sized historical data sets. The activities are aimed at improving process understanding and identifying hints on the interrelationships of variables that may lead to reduce variability and increase process robustness.
Before reviewing the case studies, and in order to facilitate understanding and interpretation of results for readers with little or no experience with MVA tools, a short glossary of terms follows (Table 1).
Case Study 1Scope: Preliminary diagnostic assessing the role of raw material properties on fi nished product dissolution variability for a non-sterile solid oral dosage form.
« MANUFACTURING »
www.americanpharmaceuticalreview.com | | 77
Table 1. Simplifi ed glossary of terms relating to multivariate analysis mentioned in this article.
No. Term Reference Description*
1 PLSPartial Least Squares Projection to Latent Structures modeling. PLS modeling consists of concurrent projections of both the X and Y spaces on low dimensional hyper planes.
2 R2XFraction of X variation modeled in that component (or latent variable), using the X model
3 R2Xc / R2X(Cum)Cumulative R2X up to the specifi ed component (or latent variable)
4 R2YFraction of Y variation modeled in that component (or latent variable), using the Y model
5 R2Xc / R2Y(Cum)Cumulative R2Y up to the specifi ed component (or latent variable)
6 Q2Fraction of Y variation predicted by the X model in that component (or latent variable), according to cross-validation
7 Q2(Cum)Cumulative Q2 up to the specifi ed component (or latent variable)
8 VIP Plot
For PLS, VIP (Variable Importance to Projection) plot is a weighted sum of squares of the PLS weights, considering the amount of explained Y-variance in each dimension. Terms with higher values are the most relevant for explaining Y.
9 Score Scatter PlotDisplays the scores in a two-dimensional plot with each axis representing a principal component or latent variable.
10 Loading Column Plot
Depicts correlation structure between X and Y variables. Allows interpretation of how X and Y variables combine in the projections, and how X variables relate to Y variables including covariance relationships.
*Reference description of terms in glossary were adapted and are based on SIMCA Help electronic manual7

Description: This is a medium-sized historical data set that included raw material properties from testing results documented in certifi cates of analysis for the raw materials, and from fi nished product dissolution tests results.
Outcomes: A two principal components Partial Least Squares (PLS) model was fi tted as part of initial diagnostic. Figure 1 provides a summary of fi t for the model with a cumulative R2Y just over 30%.
Reviewing the Variable Importance to Projection (VIP) plot depicted in Figure 2, the top empirical variables infl uencing dissolution variability are preliminary identifi ed as 1) high proportion of coarse material for confectioner’s sugar, and 2) high values for two properties of the Active Pharmaceutical Ingredient (API): Phenyl acid and water content.
Exploring the relative variability of API properties values, which comprise two of the top three ranked VIP variables, MVA tools were used to compare API properties from two suppliers used for the manufacturing process. Figure 3 summarizes fi ndings via a score scatter plot. The comparison revealed quantitative diff erences in the variability of API property values between suppliers. In terms of the fi rst principal component (t1), while some overlapping is observed for API material property values and variability seems similar in terms of range, quantitative diff erences in average aggregate values are visually noted. In general, API Supplier 1 (batch scores in black color)
aggregate average value arguably lies in the top/left quadrant of the plot, API Supplier 2 (batch scores in red color) aggregate average value lies somewhere in the right quadrants of the plot.
When considering diff erences in second principal component (t2), average aggregate values for the two suppliers seem to diff er much less relative to t1. However, the variability of API Supplier 2 (red) is considerably larger – about double in range – than the dispersion of values observed for API Supplier 1 (black).
Actionable Information: The additional understanding of supplier diff erences in API material properties coupled with identifying the properties (phenyl acid and water contents) that infl uence our Y variable of interest the most, also gives actionable information once these correlations are confi rmed with additional historical data and complementary process observations. Using this knowledge, potential actions aiming to reduce fi nished product dissolution variability may include: 1) Negotiate with API Supplier 2 to establish narrower acceptable ranges for these API properties, and/or 2) modeling may be leveraged to select API material batches based on their properties values to increase chances of attaining desired dissolution values.
In terms of dealing with a high proportion of coarse material for confectioner’s sugar, there are diff erent ways that may be explored to reduce the proportion of coarse material. These may include adding or modifying sieving and/or milling process steps. At this stage it would be helpful to have a technology available to measure particle size distribution (PSD) as depicted in Figure 4. This way quantitative measurements can be evaluated in the MVA model to estimate the overall impact on fi nished product dissolution values before eff orts to incorporate any changes to the actual process.
Case Study 2Scope: Leveraging historical data for preliminary diagnostics on the role of raw material properties and process parameters with severity of recurrent sticking issues at the tablet compression stage.
» MANUFACTURING »
78 | | July/August 2020
Figure 1. Case Study 1 PLS model fi t summary using two principal components for initial diagnostic.
Figure 2. Case Study 1 resulting VIP plot ranking relevance of independent variables for initial diagnostic.
Figure 3. Case Study 1 resulting score scatter plot comparing API material properties for two suppliers.

Description: This is a medium-sized data set compiled from historical data that included raw material properties from results captured in certifi cates of analysis, and actual process parameters as measured and recorded in master batch records during processing. The annotations on the number of stops due to sticking issues at the compression stage were used as an indicator of sticking severity.
Outcomes: A two principal components PLS model was fi tted as part of initial diagnostic initiatives. Figure 5 provides a summary of fi t for the model which exhibits a cumulative R2Y of 37.4%.
Looking at the results for the VIP plot in Figure 6, the top variables related to sticking severity were preliminary identifi ed as 1) granulation time for one of the tablet layers formulation (bi-layer tablet product), and 2) small diff erences in quantity of two raw materials added as part of the bi-layer tablet formulation.
Actionable Information: The additional understanding of how higher granulation times for one of the tablet layers aff ects severity of stickiness at the tablet compression step is an important hint. The granulation process is stopped after reaching a threshold torque value measurement for the granulator motor, not using a fi xed time.
Thus, granulation times may be less variable if material is evenly and similarly spread throughout the granulator for each batch before starting the process. According to the loading column plot (Figure 7), the higher the process granulation time, the more severe sticking is observed at the tablet compression step. Also, there may be additional ways to improve uniformity in the addition of the granulating agent like using a pump for uniform spray rate of liquid instead of gravity feed addition.
The other variables identifi ed relate to the quantity of two materials added to the process. Although formulation has a fi xed theoretical value for raw materials, there is some small tolerance allowed in the actual weight of the materials. And according to MVA results the two materials identifi ed – even in small quantity diff erences – relate to sticking severity. For example, let’s focus on the ingredient labeled as MetoCarb (Methocarbamol). According to Figure 7, the higher the MetoCarb added to the process, the higher the sticking severity. MetoCarb has a relatively low melting point. Thus, the longer high shear processes take – such as granulation – the higher the temperature the product reaches. This would also apply to other processes including compression and any in-process milling step performed. But from the MVA data set, the granulation step exhibited large variability in duration and the magnitude of the variability was empirically related to sticking severity. It is likely that the higher the
« MANUFACTURING »
www.americanpharmaceuticalreview.com | | 79
Figure 4. Particle size distribution comparison between de-lumped and non-de-lumped confectioner’s sugar.
Figure 5. Case Study 2 PLS model fi t summary using two principal components for initial diagnostic.
Figure 6. Case Study 2 resulting VIP plot ranking relevance of independent variables for initial diagnostic.
Figure 7. Case Study 2 resulting loading column plot showing covariance relationships of X/Y variables.

granulation times and the higher the product temperatures, the more melting of MetoCarb occurs; and the more MetoCarb available during these high shear steps, the more there is to melt. Along with efforts to reduce variability and shorten granulation times, another consideration may include finding ways to reduce the rise of product temperature during high shear process steps.
Final RemarksThis article provided a high-level overview on Multivariate Analysis, reviewed some of its benefits and limitations, and intended to illustrate its usefulness as a routine tool for initial diagnostics leveraging medium-sized data sets. Actual case studies were briefly presented with emphasis on scope and outcomes for each case. The author argues that there is still opportunity to further increase the use of MVA tools on a more regular basis. Findings and hints from MVA can be a complementary source of knowledge for informed decision-making. MVA also aligns well to ‘smart manufacturing’ or ‘intelligence-based manufacturing’ initiatives while promoting a ‘right-first-time’ mindset to resolving issues.
Nowadays we often acquire tons of process data, yet sometimes when issues arise it is still difficult to identify a definitive factor or set of factors to label as the root cause. Instead, many investigations still seemingly rely on ‘one-independent-variable-at-a-time’ approaches which may prompt mixing inconclusive data with assumptions into technical rationales that funnel to ‘more probable causes’. Then focus quickly switches into establishing plans to avoid recurrence placing all bets on the potential suspect(s). In some extreme cases this may turn into trial and error iterative cycles. Robustness should be incorporated into our analyses by taking advantage of available contemporary tools and resources. But this needs to be done in a natural and organic manner. One that does not require additional considerable burden each time in order to happen. It means that – along with computing power availability – training of technical personnel is widespread at key levels of the organization and MVA software packages and tutorials are in place, and technical colleagues are encouraged to use these tools regularly to increase their confidence and proficiency, so widespread use of the tools on a routine basis becomes the new normal.
It is also important to have realistic and reasonable expectations from using MVA tools. While they can provide valuable insight, there are limitations which may be implicitly sourced in the data used, the analyst proficiency with the tools, or just the reality of your system of study. Interpretation of results need to consider limitations and particularities and use the information from MVA results in a complementary way. The aim is to improve the level of confidence for decision-making by leveraging a more holistic approach.
AcknowledgementsMany colleagues were directly and indirectly involved supporting the activities in the case studies described in this article. Since the list is too long to mention them individually, the author prefers to collectively
thank the Pfizer network of technical colleagues that made these and other similar efforts possible.
References1. Divino, R. (N.S.). An Introduction to Multivariate Data Analysis: What it is, and some of
the techniques at your disposal. Electronically retrieved on June 15, 2020 from Medium at https://towardsdatascience.com/an-introduction-to-multivariate-data-analysis-ece93ceb1ed3?gi=457be3114156.
2. Olkin, I. and Sampson, A.R. (2001). Multivariate Analysis: Overview. Published in International Encyclopedia of the Social & Behavioral Sciences, 2001. Electronically retrieved on June 15, 2020 from ScienceDirect at https://www.sciencedirect.com/topics/medicine-and-dentistry/multivariate-analysis.
3. Mercer, E.; Mack, J.; Tahir, F.; Lovett, D. (2018). Application of Multivariate Process Modeling for Monitoring and Control Applications in Continuous Pharmaceutical Manufacturing. Published in Multivariate Analysis in the Pharmaceutical Industry (Book), 2018. Electronically retrieved on June 15, 2020 from ScienceDirect at https://www.sciencedirect.com/topics/medicine-and-dentistry/multivariate-analysis.
4. Dempster, A.P. (1971). An Overview of Multivariate Data Analysis. Published in Journal of Multivariate Analysis 1(3), September 1971, pp. 316-346. Electronically retrieved on June 15, 2020 from ScienceDirect at https://www.sciencedirect.com/science/article/pii/0047259X71900066.
5. Batholomew, D.J. (2010). Analysis and Interpretation of Multivariate Data. Published in International Encyclopedia of Education (Third Edition), 2010. Electronically retrieved on June 15, 2020 from ScienceDirect at https://www.sciencedirect.com/topics/medicine-and-dentistry/multivariate-analysis.
6. Jackson, J. (2018). Multivariate Techniques: Advantages and Disadvantages. Electronically retrieved on July 11, 2020 from The Classroom at https://www.theclassroom.com/multivariate-techniques-advantages-disadvantages-8247893.html.
7. MKS Umetrics AB (1998-2015). SIMCA 14.1 Help Electronic Manual installed in computer.
Author BiographyJosé-Miguel Montenegro-Alvarado is Manager of Process Analytical Technology (PAT) projects as part of Pfizer’s Global Technology & Engineering (GT&E)/Global Engineering (GE) / Process Monitoring, Automation
and Control (PMAC) Team. Based in Puerto Rico, in his current role Montenegro is responsible for technical support and facilitates deployment of PAT to Pfizer’s Small Molecule Operations that include manufacturing sites for non-sterile Solid Oral Dosages (SOD) and Active Pharmaceutical Ingredient (API) operations.
Montenegro’s academic background includes Bachelor’s and Master’s degrees in Chemical Engineering at the University of Puerto Rico – Mayagüez with a minor equivalency in Economics. His professional career in the pharmaceutical industry started in 2001 at the Searle & Co. Caguas site after industrial internships in medical devices with Baxter and Techno-Plastics Industries. After mergers and acquisitions (Pharmacia, Pfizer), in 2007 Montenegro was recruited by Pfizer Center Functions as part of the Process Analytical Sciences Group (PASG). Throughout time Montenegro has interfaced with over 20 Pfizer sites in four different continents including United States, Puerto Rico, Australia, Argentina, Brazil, Italy, Mexico, Spain and Venezuela. In 2010 Montenegro transitioned into his current role as Manager – PAT projects.
» MANUFACTURING »
80 | | July/August 2020

TECHNICAL PROGRAM featuring Live Sessions and Oral and Poster Sessions that can be accessed on demand for an extended period
SHORT COURSESon practical topics taught by experts presented via a video conferencing platform starting in October; register early for discounted pricing
VIRTUAL EXPOSITION HALL view online product showcases, demo videos, brochures, press releases, and engage in live chats with exhibitor booth personnel
CALL FOR PAPERS poster abstract submission ends September 4, 2020 eas.org
PROGRAM
EAS IS NOW VIRTUAL!
November 16-18, 2020
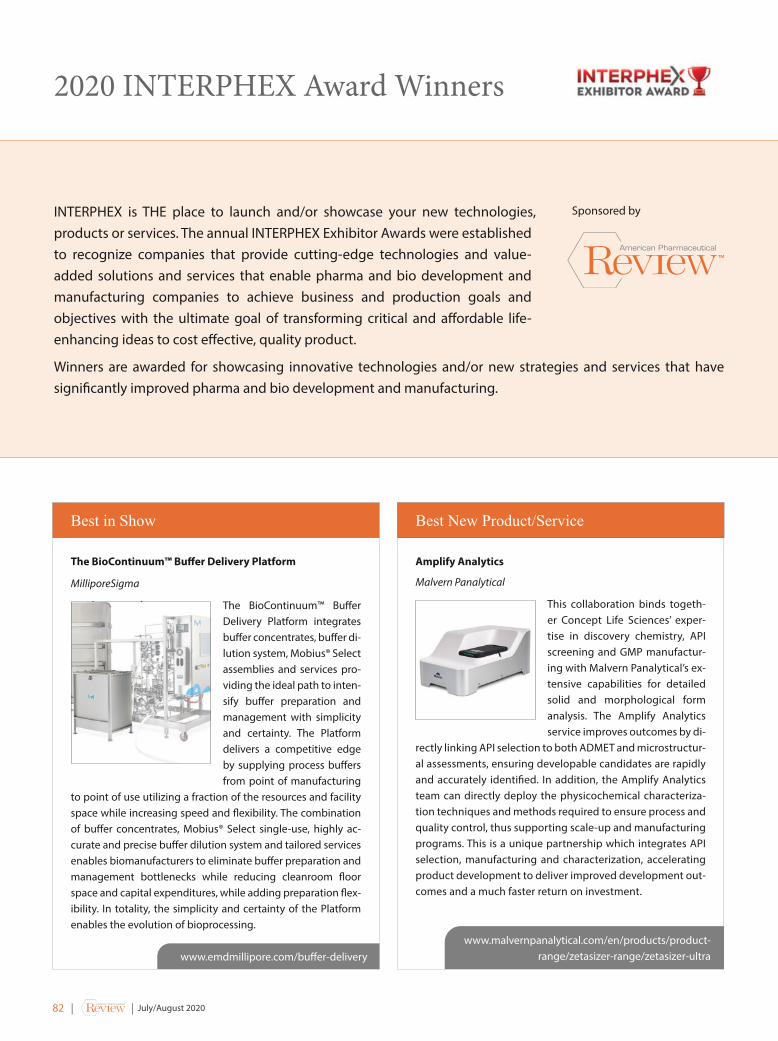
82 | | July/August 2020
The BioContinuum™ Buffer Delivery Platform
MilliporeSigma
The BioContinuum™ Buffer Delivery Platform integrates buffer concentrates, buffer di-lution system, Mobius® Select assemblies and services pro-viding the ideal path to inten-sify buffer preparation and management with simplicity and certainty. The Platform delivers a competitive edge by supplying process buffers from point of manufacturing
to point of use utilizing a fraction of the resources and facility space while increasing speed and flexibility. The combination of buffer concentrates, Mobius® Select single-use, highly ac-curate and precise buffer dilution system and tailored services enables biomanufacturers to eliminate buffer preparation and management bottlenecks while reducing cleanroom floor space and capital expenditures, while adding preparation flex-ibility. In totality, the simplicity and certainty of the Platform enables the evolution of bioprocessing.
Best in Show
Amplify Analytics
Malvern Panalytical
This collaboration binds togeth-er Concept Life Sciences’ exper-tise in discovery chemistry, API screening and GMP manufactur-ing with Malvern Panalytical’s ex-tensive capabilities for detailed solid and morphological form analysis. The Amplify Analytics service improves outcomes by di-
rectly linking API selection to both ADMET and microstructur-al assessments, ensuring developable candidates are rapidly and accurately identified. In addition, the Amplify Analytics team can directly deploy the physicochemical characteriza-tion techniques and methods required to ensure process and quality control, thus supporting scale-up and manufacturing programs. This is a unique partnership which integrates API selection, manufacturing and characterization, accelerating product development to deliver improved development out-comes and a much faster return on investment.
Best New Product/Service
2020 INTERPHEX Award Winners
www.emdmillipore.com/buffer-deliverywww.malvernpanalytical.com/en/products/product-
range/zetasizer-range/zetasizer-ultra
INTERPHEX is THE place to launch and/or showcase your new technologies, products or services. The annual INTERPHEX Exhibitor Awards were established to recognize companies that provide cutting-edge technologies and value-added solutions and services that enable pharma and bio development and manufacturing companies to achieve business and production goals and objectives with the ultimate goal of transforming critical and affordable life-enhancing ideas to cost effective, quality product.
Winners are awarded for showcasing innovative technologies and/or new strategies and services that have significantly improved pharma and bio development and manufacturing.
Sponsored by

www.americanpharmaceuticalreview.com | | 83
The BioReliance® Blazar™ Platform
MilliporeSigma
The BioReliance® Blazar™ Platform meets the need to accelerate detection of ad-ventitious viral contamina-tion. This rapid molecular platform/degenerate PCR approach detects panel specifi c targeted viruses
and related, but unknown viral contaminants and benefi ts the industry in several ways. It accelerates the broad and sensi-tive detection of adventitious viruses by replacing biological growth-based systems with a molecular approach. It provides manufacturers with accurate and highly sensitive viral detec-tion in just days. Combining the breadth of detection of NGS with the speed and sensitivity of PCR. The Blazar™ Platform re-lies on degenerate PCR primers enabling coverage of beyond 5000 viral variants and will drive transformation of biosafety testing, particularly since the current method was developed in 1964. The Blazar™ platform enables biopharma to bring therapies to market faster.
Editor’s Choice
PolarDry Electrostatic Systems
Fluid Air
PolarDry Electrostatic Systems were designed around a complete line of patent-pending ma-chines enabling easy scale-up from R&D through production size models. The systems
utilize electrostatic technology which drives water to the shell and active to the core, lowering the evaporation temperature and eliminating active ingredient loss, degradation, or denat-uralization. Harnessing the electrostatic eff ect, the dispersed active driven into the core is microencapsulated, virtually eliminating surface active, resulting in stunning encapsulation effi ciency. PolarDry Electrostatic Systems off er a revolutionary way to process powder ingredients, at lower temperatures, to produce a better-quality drug, with a longer shelf life.
Best Technologies Innovation
TOC Analyzers and Sievers Eclipse Bacterial Endotoxins Testing (BET) Platform
SUEZ - Sievers
The new BET Platform, along with Sievers TOC Analyzers platform, automates endotoxin assay setup through precise microfl uidic liquid handling and embedded endo-toxin standards. It maintains full compliance with the harmonized pharmacopoeias with embedded
standards derived from the reference standard endotoxin produced by the USP along with FDA licensed limulus amoe-bocyte lysate. The Eclipse enhances the product development lifecycle by simplifying an otherwise antiquated and cumber-some benchtop assay and decreasing demand on natural re-sources. Using the Eclipse, manufacturers can gain operational effi ciency by reducing pipetting steps by up to 89%, reducing analyst time by up to 85% and reducing the use of horseshoe crab lysate by up to 90%. The Eclipse enables fully compliant, 21-sample assay setup in as little as 9 minutes.
Effi ciency Champion
AccuFlux® Integrity Test Instrument
Meissner Filtration Products
The AccuFlux® tests and delivers industry standard fi lter integrity test results (i.e. bubble point, dif-fusive fl ow, pressure hold, water intrusion) for critical applications in a fraction of the time that cur-rently available integrity test in-struments require, thus saving
valuable operator and manufacturing time. The AccuFlux® can test fi lter integrity pre- and post-use to guarantee steril-ity for qualifi ed release of fi nal product to market. With the AccuFlux®, for example, a bubble point or diff usive fl ow test can be performed in 3 minutes or less. That reduces the time required by an operator to perform this test by 70%, which streamlines effi ciencies and reduces total cost of labor.
Biotech Innovation
www.suezwatertechnologies.com/products/analyzers-instruments/sievers-eclipse
http://fi les.aievolution.com/prd/ipx2001/abstracts/abs_1224/accufl ux-fi lter-integrity-tester.pdf
www.fl uidairinc.com/index.html
https://www.emdmillipore.com/US/en/services/biopharmaceutical-manufacturing/Rapid-Molecular-
Testing/Jk2b.qB.e1wAAAFwEPEXejXl,nav
SPONSORED BY AMERICAN
PHARMACEUTICAL REVIEW

84 | | July/August 2020
Can you tell us about Lonza and the products and services the company offers to help pharmaceutical companies develop and manufacture products?
Lonza is a contract development and manufacturing organization (CDMO) that provides drug substance and drug product manufacturing services for partner pharma and biotech companies. These services include the entire spectrum from pre-clinical to commercial manufacturing services. While Lonza has capabilities for handling conventional molecules, it specializes in difficult-to-handle molecules, such as antibody-drug conjugates (ADC) or highly-potent active pharmaceutical ingredients (API), and specialty drug product formulations for poorly bioavailable molecules. Importantly, each area that Lonza specializes in is steeped in rigorous scientific based methods.
What are some current drug development issues pharmaceutical companies are dealing with? Specifically, can you speak to issues regarding bioavailability?
Pharmaceutical pipelines are increasingly populated with BCS Class II and BCS Class IV molecules that are low solubility and may also have low gut epithelium permeability.
Due to the growing incidence of low drug solubility in the pharmaceutical discovery and development pipeline the number of enabling technologies that are employed to improve oral drug absorption and bioavailability (BA) are also growing. Commonly used technologies in this area include: salts, cocrystals, amorphous solid dispersions, nano and micro-cystals manufactured by particle size reduction, cyclodextrin complexation, and lipid-based technologies.
Many of these technologies have been shown to enhance drug BA, however the most notable commercial products are those that utilize lipid-based technologies—an example is Neoral® (cyclosporine, Abbott), a liquid-filled capsule—amorphous solid dispersions, examples include Zepatier® (grasopervir and elbasvir, Merck) and Simpirica (sarolaner, Zoetis that are produced by spray drying for human and animal health, respectively, and nanocrystals—here an example is Emend® (aprepitant, Merck), a nanocrystal-containing tablet. The commercial precedence of these key enabling technologies supports their continued utilization in addressing the estimated 40-
70% of the NCE development pipeline candidates that are regarded as poorly water-soluble. Of recent note the most commonly used technology in the past decade to enhance oral bioavailability is spray-dried amorphous dispersions.
Why is First-In-Human such an important milestone for pharmaceutical companies?
First-in-human (FIH) clinical trials are an important milestone for pharmaceutical companies as they are the first demonstration of a compound’s safety in healthy human volunteers. Prior to FIH, a compound has been extensively studied in animal models to look for signs of toxicity at doses many times higher than projected for humans—this does not guarantee that the compound will be safe for humans. For many biotech companies that do not intend to take their compound all the way to commercial, this is often a place where a partnership or sale of the molecule is undertaken.
Following the Phase I study, Phase II studies are undertaken. The goal of the Phase II trial is then to demonstrate that the compound is efficacious in the patient population under controlled conditions. If the compound is determined to both safe and efficacious then the company can proceed to Phase III trials and, upon success, to commercial manufacture.
Can you detail Lonza’s approach to helping pharmaceutical companies deliver bioavailability-challenged products to the clinic? What products, technologies, and expertise does the company offer for this specific challenge?
Lonza’s approach to helping pharmaceutical companies deliver bioavailability-challenged products to the clinic is multi-faceted. First, Lonza aims to partner with our clients to form project teams that are seamless and, for many clients, are projections of their own internal capabilities.
Second, Lonza uses science-based technology selection to make sure that the technology chosen to improve bioavailability is optimal. These technology selection methods include in vivo predictive methods that are rapid and bulk-sparing and include in silico evaluation of compounds based on physical-chemical properties.
Because Lonza has line-of-sight to commercial production of the three primary bioavailability-enhancing technologies (amorphous
AN INTERVIEW WITH...
David K. Lyon, PhDSr. Fellow, Research
Lonza

solid dispersion, micronization, lipid-based formulation) we are not prejudiced to a specific technology but can instead base the formulation on the client’s target product profile (TPP) and technology best suited to the molecule.
Finally, Lonza can combine the premier manufacturing capabilities with world-class scientific capabilities to bring the best formulation forward for our clients.
Looking forward, does Lonza anticipate adding or developing additional products or services to its portfolio to foster faster and efficient drug development? In addition to bioavailability, are there any other drug development issues the company views as becoming more prevalent in the near future?
Lonza continues to improve upon it’s leadership position in bioavailability-enhancing technologies. An example of this is when it became clear that the client portfolio of compounds entrusted to us were not only poorly water soluble but increasingly poorly organic-solvent soluble we invested in new technology development. This development effort resulted in a “temperature-shift” process in which a suspension of the compound in the organic solvent is heated above the solvent’s boiling point by passing it through a heat-exchanger immediately prior to the spray-drying chamber. This causes the compound to dissolve to as much as ten-to-twenty-fold above its room temperature solubility creating a much more efficient process by reducing processing times.
Similarly, in our micronization business we recognized that the compound portfolio was increasing in potency—largely due to increasing number of oncology compounds being developed—requiring new handling capabilities. This led to the design and construction of new jet mills with high containment capabilities. These new mills allow handling of these highly potent active pharmaceutical ingredients (HPAPI) for drug product and compliment Lonza’s HPAPI synthesis business, as well.
While oral bioavailability remains a large challenge and will remain a staple of our formulation business, two obvious challenges remain. The first is largely due to the number of compounds being accelerated to the clinic and commercial by small biopharma—namely the time to get to the first human trial—and the second are molecules that are poorly permeable in addition to poorly soluble…BCS Class IV compounds.
In the first case Lonza has developed a fixed-time, fixed-cost offering that provides rapid
drug substance synthesis to drug product manufacture including technology selection and solid form characterization.
In the second case, we are working towards an offering aimed at poorly permeable molecules that include proprietary lipid formulations encapsulated in a capsule made of enteric materials to protect the drug substance as it passes through the gastro-intestinal tract. It is early days for this technology but we are hoping to partner with a client soon.
www.americanpharmaceuticalreview.com | | 85

»
86 | | July/August 2020
MANUFACTURING »
Mo Heidaran, Heath Coats, Kurt Brorson and Steve WinitskyParexel International
Impact of COVID-19 on Manufacturing of Cell and Gene Therapy and Biotech Products, and Overall Clinical Trial Landscape
Novel coronavirus SARS-CoV-2, the causative agent for COVID-19, has disrupted the global clinical trial landscape in just a few short months. This virus is part of a larger family called Coronaviridae, which includes viruses that can infect only animals, cause mild colds or be communicable and pathogenic like the SARS virus of the early 2000’s. COVID-19 is highly transmissible and can progress to life-threatening complications. While the main public health concern at the present is human-to-human spread of infection, there are other issues related to viral spread - for example, potential contamination of biologics that are intended for human use. One question manufacturers are likely to have is whether the virus could infiltrate the medicinal supply, like HIV and hepatitis virus did in the 1980’s. FDA has recognized this possibility and has just released draft guidance to address GMP considerations during the COVID-19 outbreak: “Good Manufacturing Practice Considerations for Responding to COVID-19 Infection in Employees in Drug and Biological Products Manufacturing: Guidance for Industry” (June 2020).1
FDA has acknowledged that the risk varies between product classes and recommends a risk-based approach considering multiple factors, such as personnel practices, robustness of process controls and testing and clearance by purification. While FDA very sensibly recommends each firm conduct a product-risk assessment, in the estimation of the authors there’s a very low risk of SARS-CoV-2 contamination affecting protein-based biotech products. In this case multiple levels of safety precautions like use of established cell banks, timely in-process material screening and virus filtration are feasible. However, the authors believe theoretical risk of disease transmission through cell-based products that the appears to be higher as some of the routine biopharmaceutical safety precautions are not feasible. FDA acknowledges as such in a footnote in the June 2020 guidance. In this article we will discuss the relative risks and potential mitigation strategies specific to cell and gene therapy, as well as biotech products. It’s important to keep in mind that although SARS-CoV-2 contamination of cell therapy-based products has not been observed, it’s still important to be aware of the theoretical risks of viral contamination until more information about the true risks becomes available.

Impact on Existing Non-COVID Clinical Trials and COVID-Related ActivitiesThe spread of COVID-19 globally has disrupted existing clinical trials for many reasons, as summarized in a recent Nature news article.2
At the same time, the pandemic has created a massive mobilization of private and government resources to facilitate development of novel diagnostics, prophylactic vaccines and treatments. Cell and gene therapy manufacturers have participated in all facets of this mobilization. As of May 12, 2020, according to clinicaltrials.gov, there are approximately 70 ongoing trials of cell and gene therapies that are intended to prevent or treat COVID-19. Gene therapy approaches are being applied to develop non-traditional prophylactic vaccines. Cell therapy products, which have anti-inflammatory mechanisms of action that appear well-suited for a COVID-19 therapy, are also being studied.3
Cell and gene therapies comprise a wide variety of products, including: 1) autologous and allogeneic off-the-shelf cellular products; 2) gene modified autologous and allogeneic off-the-shelf cellular products; 3) gene therapy products; 4) tissue engineered products that can include scaffolds or cellular components isolated
from HCT/Ps; and 5) other products, such as acellular products manufactured from Human Cells, Tissues, and Cellular and Tissue-Based Products (HCT/Ps).
Background on SARS-CoV-2 (Also Referred to as HCov-19) is the Causative Agent for the Novel Infectious Disease Known as COVID-19 SARS-CoV-2 belongs to a broad family of viruses that are composed of enveloped capsid containing positive sense single-stranded RNA. Transmission occurs primarily through spread of respiratory droplets and indirect contact with contaminated surfaces, on which viral particles can remain for days, depending on the composition of the surface -- e.g., steel, plastic, copper, or cardboard.4 There is also concern of GI involvement arising from viral RNA being detectable in stool samples from infected persons. As reports of COVID-19 infection were linked to the Hunan Market in Wuhan China, it has been presumed that the source of this virus is animals. It is difficult to know when the initial transmission from animals to humans
« MANUFACTURING »
www.americanpharmaceuticalreview.com | | 87

occurred. The earliest report linking this disease with the Wuhan market, which had been visited by the first patient to be hospitalized with what was later diagnosed as COVID-19, notes that this patient started exhibiting symptoms as early as December 12, 2019.5 The exact mechanisms of transmission of SARS-CoV-2 are very complex, but what is known is that it appears to be transmitted much more easily than flu virus, and infected people who are asymptomatic can still transmit the virus to others.
In the most vulnerable population, elderly and immune compromised patients with pre-existing medical conditions, the viral illness can progress rapidly to life-threatening pulmonary, hematologic, cardiovascular, and renal conditions.
There are no vaccines or approved therapies that are effective in preventing or treating COVID-19 infection. Like other large enveloped viruses, SARS-CoV-2 is sensitive to detergents and alcohol, which can be used as disinfectants.6
The Potential Impact of SARS-CoV-2 on Drug ManufacturingDuring manufacture of cell and gene therapy products, viral contamination can come from a number of different sources, which include: 1) contaminated HCT/Ps; 2) contaminated supply biological raw materials; 3) manufacturing environment, including infected personnel/operators; and 4) infected clinical site personnel who prepare the final drug product and administer it to patients.
There is at most a low risk of SARS-CoV-2 transmission to biotech products that are commonly amenable to closed-system manufacturing, filtration and viral reduction steps.7,8 Biopharmaceutical manufacture has several unique features that mitigate against SARS-CoV-2 risk. The use of cell lines (CHO, murine myeloma) and protein-free culture conditions make it unlikely that this form of manufacturing will promote SARS-CoV-2 propagation. In addition, based on the timing of MCB and WCB development and production prior to the presumed date of the start of human-to-human transmission (December of 2019), the vast majority are safe from this standpoint.5 Further, bioreactor harvests are routinely screened for adventitious viruses using sensitive assays. This product class can also be subjected to virus retentive filtration during drug substance purification, a key safety step with respect to viruses; as Coronaviruses are a family of large enveloped viruses, they too are likely to be removed. All of these considerations are mentioned in the 2020 FDA guidance as risk factors firms should consider during their process specific CoV-2 risk assessment.
Unlike biotech products, it is virtually impossible in some cases to subject cell and gene therapy drug products to viral inactivation steps, as the process of inactivation has been shown to adversely impact product quality. Similarly, viral filters are effective in filtering out viral particles, but can also remove the actual product; therefore, filtration is generally not feasible in this situation. For these reasons, it’s important to focus on preventing the spread of communicable diseases by off-the-shelf cell therapy products, including allogeneic CAR-T products, through establishing Donor Eligibility (DE) for Human cells, Tissues,
and Cellular and Tissue-Based Products (HCT/Ps) that are collected from allogeneic donors. Currently, DE requirements, as per 21 CFR 1271 Subpart C, do not include testing of donors for Coronavirus, but FDA has recently been very proactive in changing the requirements as the public is confronted with new infectious agents. For example, in response to the recent outbreak of Zika Virus, the agency issued several guidance documents in which Zika Virus was added to the list of Relevant Communicable Disease Agents and Diseases (RCDAD) for HCT/Ps and blood derived products. Questions as to whether Coronavirus poses a significant risk of disease transmission when products are derived from allogeneic sources or cultured and manipulated in the presence of human-derived components remain to be answered. However, in view of the complexity of these products, the authors concur that the risk of disease transmission for Coronavirus will need to be evaluated using a risk-based case-by-case approach, as suggested by the 2020 FDA guidance document, depending on the scientific data.
Table 1 summarizes factors that could potentially impact the risk of COVID-19 disease transmission in cell and gene therapy manufacturing, which include:
Supply chain quality: Cell and gene therapy manufacturing can involve a variety of biological materials that are derived from humans and animals. The risk of contamination of the materials sourced from human plasma and blood remain to be clarified, but implementation of voluntary screening and testing of the donor and donor materials for SARS-CoV-2 may be a prudent measure.
Manufacturing process (open versus closed systems): Although there is a current trend toward a shift from the use of open manufacturing platforms to more closed systems, a large number of products for early phase studies are still manufactured in less-closed and/or more open platforms – utilizing in all cases a biological safety cabinet for environmental control which are sometimes located in a non-cGMP environment. This lower level of control introduces an additional risk of product contamination by operators potentially infected with SARS-CoV-2.
Manufacturing operators#: Historically, personnel who are respon-sible for manufacturing cell and gene therapies, similar to others in this industry, do not typically undergo any thorough infectious disease screening or testing procedures on a frequency beyond the normal population#. It should be noted that the FDA guidance recommends firms follow CDC guidance for COVID-infected employees at manufac-turing sites.1
Manufacturing facility: In the current environment, an increasing number of products are being manufactured in multi-product facilities, which increases the risk associated with cross-contamination. For example, it is possible that the same clean room facility is being used for autologous and allogeneic product manufacturing.
Clinical site environment and operators (collection, product manipulation at clinical site): Another aspect of operator control relates to what happens to cell and gene therapy products at the clinical sites, where some of them undergo further manipulation (thaw and wash and testing) prior to administration in largely non-cGMP environments.
» MANUFACTURING »
88 | | July/August 2020

HCT/P, blood donor screening and testing: The quality of biological source material is probably the most important aspect of quality control. The agency has published advisory guidance documents suggesting that donors be screened for COVID-19 infection when these starting biological materials are used for manufacturing of the fi nal drug products.9 However, due to the evolving understanding of the disease transmission and prioritization of testing for public health screening, it is not clear when the agency may formalize their specifi c recommendations regarding COVID-19 infection of donors.
Producer cells or cell lines: Most cell lines that are used to manufacture viral products (AAV and lentiviral vectors) are derived from human and primate source materials, which in theory could be more permissive to SARS-CoV-2 infection than CHO cells for example. This, in turn, is expected to increase the risk of disease transmission, provided that these lines are exposed to contaminated materials or infected operators.
Viral clearance: Unlike traditional biopharmaceutical products, most cell and gene therapy products cannot undergo viral inactivation steps. This issue may not apply to acellular products, such as exosomes, which are derived from human cell lines, and certain gene therapy products. For example, some small gene therapy vectors in theory could still be fi ltered with large virus retentive fi lters, for example that target viruses greater than 50-60 nm. Whether this step has been implemented for these products on a widescale basis is not publicly available. The inability to undergo viral inactivation steps could contribute to a higher risk of disease transmission
Product fi ltration: Unlike biotech products, cell therapy products cannot undergo a 0.2 micron sterile fi ltration step and/or virus
retentive fi ltration, Tangential Flow Filtration (TFF) or TFD methods typically used for biotechnology products.
Batch size: Although the batch size for autologous products is N=1, the batch size of some off -the-shelf products manufactured from HCT/Ps is scaled to potentially treat a large number of patients.
Patient population: The risk of disease transmission should also be viewed in terms of the risk to the intended patient population. Various factors, such as patient age, general health, and immune status, are likely to impact the risk to a given patient populations.
Time for testing: In general, for products which have a long shelf life (e.g., cryopreserved products,) there is suffi cient time to conduct testing of the DS/DP in a manner that allows all test results to be available prior to release. However, for fresh products, there is a limited time available between completion of manufacturing and administration to patients, which makes it very diffi cult to conduct product testing.
Table 2 provides a summary of risks associated with each type of product, with the highest risk of transmission being associated with off -the shelf allogeneic products that are comprised of either tissue engineering products, cell therapies, or gene modifi ed cellular products. This next highest risk is for tier 2 risk products that include autologous products, followed by products that are closer in nature to biotech products, such as gene therapy (AAV) products or exosomes (defi ned as Tier 3).
Although it is very diffi cult to know exactly how this novel virus will impact manufacture of products in the cell and gene therapy space, it is safe to say that a risk-based approach to prevent transmission of SARS-CoV-2 is a prudent approach.
« MANUFACTURING »
www.americanpharmaceuticalreview.com | | 89
Table 1. Summary of risk factors associated with transmission of SARS-Cov-2
Autologous cell Therapy
Allogeneic cell therapy
Autologous gene modifi ed cells
Allogeneic gene modifi ed cells
Gene TherapyTissue Engineering (Autologous)
Tissue EngineeringAllogeneic cells (HCT/P)
Acellular product from allogeneic cells (HCTP)
HCT/P Donor Eligibility
NA Yes NA Yes NA NA Yes Yes
Biological Raw Materials
Yes Yes Yes Yes Yes Yes Yes Yes
Producer cell or cell lines
NA NA NA NA Yes NA NA Yes
Manufacturing platform
Yes Yes Yes Yes Yes Yes Yes Yes
Manufacturing operators
Yes Yes Yes Yes Yes Yes Yes Yes
Clinical Site Operators
Yes Yes Yes Yes Yes* Yes Yes Yes*
Lack of viral clearance
Yes Yes Yes YesViral clearance extremely challenging
Yes YesViral clearance is possible
Product fi ltration
No No No No Yes No No Yes
Batch size N=1 large N=1 large large N=1 large large
Patient population
Patient age, health and pretreatment
Patient age, health and pretreatment
Patient age, health and pretreatment
Patient age, health and pretreatment
Patient age, health and pretreatment
Patient age, health and pretreatment
Patient age, health and pretreatment
Patient age, health and pretreatment
NA: Not Applicable; *For viral products and acellular products such as exosomes manipulation of products at clinical site is typically less than cellular or gene modifi ed cellular products or tissue engineered products.

Recommendations for Cell and Gene Th erapy ProductsIn view of current uncertainty related to SARS-CoV-2 virus disease transmission, diagnostic and testing, the authors concur that implementation of a case-by-case review of the product’s risk profi le, as recommended by the FDA guidance, is warranted to mitigate risk of disease transmission. The authors propose that this goal could be accomplished by instituting a subset, or all, of the recommendations outlined below:
For all allogeneic off -the-shelf products that belong to the highest risk category, the following is recommended:
1. Voluntary testing of the fi nal drug product using sensitive
validated tests for SARS-CoV-2
2. Voluntary screening of donors for tissue HCTPs recovered
after January 1, 2020*+9
3. Voluntary testing of human-derived materials manufactured
from tissue collected after January 1, 2020
4. Voluntary screening and/or testing of all operators who
come into contact with the product. Comply with recent
FDA guidance on COVID-19 impacted facility personnel.
5. Implement rigorous application of CGMP including
considerations for product segregation, cleaning and
environmental controls, line clearance and change over during
manufacturing and product manipulation at the clinical site.
Impact on Biotech ProductsThe risk profi le for SARS-CoV-2 contamination of biopharmaceuticals as discussed above is very low. SARS-CoV-2 is unlikely to get introduced in the fi rst place, given the pre-existence of cell banks and extent of closed processing from start to fi nish during manufacturing. The most conceivable portal of entry to open parts of the process would be from asymptomatic operators, perhaps during pre-culture open manipulations. However, extensive gowning, use of LAF hoods and other aseptic procedure precautions strongly mitigate against this risk. It should be noted that the FDA guidance recommends fi rms to follow CDC guidance for COVID-infected employees at manufacturing sites.1
Propagation of SARS-CoV-2 in a commercial CHO cell bioreactor culture is at most a low risk. Based on a literature review, three of four cases of attempts to grow Coronaviruses in CHO failed;10-13 the only successful case was a diff erent Coronavirus and only in serum containing media. Thus, propagation of Cov-2 in protein-free CHO cell bioreactor cultures is very unlikely, but not impossible. In contrast, routine harvest testing by the routine indicator cell co-cultivation screen is highly likely to detect contaminating SARS-CoV-2; this new virus as well as the related CoV-1 virus that caused the SARS outbreak in the last decade forms CPE in Vero cells very rapidly.13
In contrast to some of cell and gene therapy products, process clearance of Coronaviruses during biotechnology manufacture is likely to be very robust. Clearance evaluation of smaller and more hardy viruses like parvoviruses is an industry standard practice, as outlined in the regulatory guidance ICH Q5A.14 A typical bioprocess can remove nine to ten+ log10 of hardy and small viruses like Parvovirus, and several log10 more of larger enveloped viruses like murine retrovirus. Coronaviruses are ss (+) strand RNA viruses that are enveloped and relatively large (100-160 nm, depending on the type). The large size of Coronaviruses all but assures complete clearance by both small and large virus retentive fi lters that are standard in bioprocessing. Many biotech manufacturing schemes also include detergent inactivation steps, which would likely dissolve their membranes.
These procedures are mandated by the International Conference on Harmonization14 already and almost completely assure the safety of biotech products with respect to Coronavirus. They also address the main recommendations of the June 2020 FDA guidance for assessing the overall Cov-2 risk of bioprocesses:
• The potential for the production cell line to replicate SARS-CoV-2
• Whether current cell bank and harvest testing for viruses would detect SAR-CoV-2
• The eff ectiveness of viral clearance and inactivation steps for SARS-CoV-2
• Controls are in place for procedures taking place in open systems (e.g., buff er and media preparation areas)
In the authors’ estimation, CoV-2 is unlikely to get introduced in the fi rst place, and propagation of in CHO cell bioreactor cultures is unlikely but not impossible. Routine harvest testing that is in place is highly likely to detect contamination by CoV-2. If present, Coronavirus would be completely removed from the product stream by virus fi ltration and probably by other steps.
» MANUFACTURING »
90 | | July/August 2020
Table 2. Proposed level of risk to product contamination
Autologous cell Therapy
Allogeneic cell therapy
Autologous gene modifi ed cells
Allogeneic gene modifi ed cells
Gene TherapyTissue Engineering Autologous
Tissue EngineeringAllogeneic cells (HCT/P)
Acellular product from allogeneic cells (HCT/P)
Accumulative Risk
Tier 2 Tier 1 Tier 2 Tier 1 Tier 3 Tier 2 Tier 1 Tier 3
Tier 1: Highest Risk, Tier 2: Medium Risk and Tier 3: Lowest Risk

Overall ConclusionsIn conclusion, we fully support the recommendations in the June 2020 FDA guidance for industry covering GMP considerations in the Coronavirus era.
• Although the risk posed by the Cov-2 virus is minimal in terms of getting into or remaining in biopharmaceutical products.
• The nature of the supply chain poses a relatively higher risk of disease transmission as human donor material collection is involved. This needs to be balanced against the fact that, although the impact of COVID-19 on clinical trial operation has been significant, the pandemic has generated a sense of urgency and new opportunities for the development of therapies supported by private and public governmental agencies, particularly in the field of cell and gene therapy.
• Prudent flexibility is key. As an example, if a sponsor is currently developing an allogeneic cellular product, the theoretical risks discussed do not necessarily warrant a change in the development plan, Rather, gaining a thorough understanding of the potential risks should allow the sponsor to determine whether or not implementation of additional mitigation procedures may be prudent.
In summary, it’s clear that cell and gene therapy as well as biotechnology product field should stay the course but with some adjustments and enhancements to viral safety approaches.
References*The draft guidance published April 1, 2020 states:
“At this time, FDA does not recommend that establishments use laboratory tests to screen asymptomatic HCT/P donors. Based on available information, it appears that SARS-CoV-2 has only been detected in blood samples of a small percentage of severely ill patients. The HCT/P establishment’s responsible person must evaluate a prospective donor and determine eligibility (21 CFR 1271.50). Based on the limited information available at this time, establishments may wish to consider, whether, in the 28 days prior to HCT/P recovery, the donor
• cared for, lived with, or otherwise had close contact with individuals diagnosed with or suspected of having COVID-19 infection; or
• been diagnosed with or suspected of having COVID-19 infection.
For HCT/Ps regulated as biological products under Section 351 of the Public Health Service Act, FDA is continually assessing available scientific evidence, and evaluating benefits and risks, to determine whether SARS-CoV-2 testing is warranted on certain types of HCT/Ps used in the manufacture of a biological product and/or warranted for the final product.
FDA will continue to monitor the situation and will issue updates as information becomes available”.
+ Donor testing is not recommended at this time since as outlined in regulation donor testing must be performed using FDA licensed, cleared or approved test kit and testing must be conducted by a CLIA certified lab or lab meeting equivalent requirements as determined by the Center for Medicare and Medicaid Services and for the timing of specimen collection for testing, manufacturers must collect the donor specimen for testing at the time of recovery of cells or tissue from the donor or up to 7 days before and after recovery except for leukocyte rich cells whereby manufacturers may collect donor specimens 30 days before recovery (21 CFR 1271 .80).
# “Any person shown at any time (either by medical examination or supervisory observation) to have an apparent illness or open lesions that may adversely affect the safety or quality of drug products shall be excluded from direct contact with components, drug product containers, closures, in-process materials, and drug products until the condition is corrected or determined by competent medical personnel not to jeopardize the safety or quality of drug products. All personnel shall be instructed to report to supervisory personnel any health conditions that may have an adverse effect on drug products” (21 CFR 211.28 (d)).
References1. FDA. 2020. Good Manufacturing Practice Considerations for Responding to COVID-19
Infection in Employees in Drug and Biological Products Manufacturing. US Food and Drug Administration, Silver Spring Maryland
2. https://www.nature.com/articles/d41586-020-00889-6
3. https://www.linkedin.com/feed/update/urn:li:activity:6670885699127951360
4. https://www.nih.gov/news-events/news-releases/new-coronavirus-stable-hours-surfaces
5. https://science.sciencemag.org/content/367/6485/1412.full
6. https://www.cdc.gov/coronavirus/2019-ncov/community/organizations/cleaning-disinfection.html
7. https://regulatory-access.parexel.com/covid-19/virus-filtration-a-key-manufacturing-step-keeping-medicines-safe-including-from-emerging-viruses-like-covid-19-4
8. https://regulatory-access.parexel.com/covid-19/regulatory-blog-bioprocessing-and-biologics-risk-from-coronavirus-4
9. https://www.fda.gov/vaccines-blood-biologics/safety-availability-biologics/2020-safety-and-availability-communications
10. Francis MJ. 2003. Propagation of bovine coronavirus in chinese hamster ovary cells. United States Patent 6514502: Schering-Plough Veterinary Corporation.
11. Berting, A., Farcet, M., Kriel, T. 2010. Virus Susceptibility of Chinese Hamster Ovary (CHO) Cells and Detection of Viral Contaminations by Adventitious Agent Testing Biotechnol. Bioeng. 106:598
12. Wiebe, ME, Becker, F, Lazar R, May L, Casto B, Semense M, Fautz C, Garnick R, Miller C, Masover G, Bergmann D, Lubiniecki AS. A multifaceted approach to assure that recombinant tPA is free of adventitious virus. In: Advances in animal cell biology and technology for bioprocesses. Speir RE, editor. London: Butterworths: 1989, 68-71.
13. Mossel, E., Huang, C., Narayanan, K., Makino, S., Tesh, R., Peters, C. . 2005 Exogenous ACE2 Expression Allows Refractory Cell Lines To Support Severe Acute Respiratory Syndrome Coronavirus Replication. J. Virology 79(6): 3846-3850
14. ICH. 1998. Q5A (R1) Quality of Biotechnological Products: Viral Safety Evaluation of Biotechnology Products Derived from Cell Lines of Human or Animal Origin. International Conference on Harmonization, Geneva Switzerland
« MANUFACTURING »
www.americanpharmaceuticalreview.com | | 91

»
92 | | July/August 2020
SPECTROSCOPY »
Patrick L. Ahl,1 Garrett Baird,2 Christopher Farrell,1 William J. Smith,1 Jeffrey Blue,1 and Libo Wang3
1Merck & Co., Inc., MRL, West Point, PA USA2Merck & Co., Inc., MMD, West Point, PA USA3RedShift BioAnalytics Inc., Burlington, MA USA
Applying Microfluidic Modulation Spectroscopy in Vaccine Formulation to Identify Intermolecular Beta-sheet Aggregation of Antigens
Vaccines are a cornerstone of modern medicine and have been successfully deployed to substantially reduce the threat posed by infectious diseases such as diphtheria, hepatitis, and polio.1 While COVID-19 is currently the focus of intense vaccine development activity, diseases such as malaria and HIV remain important ongoing targets; vaccines to reduce the impact of cancer are also a long-term goal. Successful vaccination relies on introducing an antigen into the body that ‘trains’ it to produce antibodies in the event of a subsequent encounter with a specific virus or bacteria. Commercial vaccine formulations include adjuvants, antibiotics, preservatives, and stabilizers to ensure safe delivery of the intact antigen to the patient, and to maximize effectiveness.
In this article we consider the potential impact of antigen unfolding and aggregation in vaccine formulations and the techniques available for detection and application in formulation studies. A primary focus is the use of Microfluidic Modulation Spectroscopy (MMS), a powerful new technique that securely identifies conformational instability and aggregation by sensitively detecting changes in intermolecular beta-sheet structure. The benefits of MMS relative to conventional FTIR spectroscopy are illustrated via experimental data.
The Impact of Protein Unfolding and Aggregation in VaccinesThe efficacy of biotherapeutic proteins is defined by their structure, both primary and higher order (secondary, tertiary, and quaternary). However, proteins in solution are labile, prone to conformational change that can be triggered by thermal, chemical, or mechanical stress. Protein unfolding is often a precursor to aggregation and is associated with the disruption of secondary structure, which is defined by interactions between units on the peptide backbone.
Vaccination relies on introducing an antigen into the body that will stimulate an effective response against the virus or bacteria associated with a specific illness. Preventing unfolding and aggregation of the antigen is therefore essential, to preserve the effectiveness and safety of the formulated vaccine. Unfolding results in a loss of desirable antigenic sites and affects the ability of the antigen to trigger a response, fundamentally compromising the immunization process. Furthermore, unfolding, can change adsorptive interactions with contacted surfaces, during processing and storage, and with adjuvants. Contacted surface interactions potentially alter delivered dose and/or stability, while a reduction in antigen adsorption to an adjuvant can undermine the activity enhancement such additives deliver.
Where unfolding leads to aggregation, additional issues arise. For example, the aggregation of antigen molecules reduces accessibility to the target antigenic site. It may also result in improper pre-clinical or clinical dosing as a result of antigen loss by precipitation. Aggregation may further compromise the effectiveness of an adjuvant, depending on the mechanism of action and, like unfolding, may increase chemical instability, for example, by increased ester or peptide bond hydrolysis.
In summary, unfolding and aggregation can alter both the dose of antigen delivered, and its effectiveness, via a range of mechanisms. Formulating and manufacturing vaccines to preclude these effects relies on having appropriate analytical techniques for detection.
Detecting Conformational Instability and AggregationFigure 1 shows the mechanisms and pathways associated with protein unfolding and aggregation and is useful in providing context for the analytical techniques used for their investigation. Native protein

monomers can coalesce into larger protein particles via two distinct routes. In the absence of unfolding monomers may form highly organized structures that separate from a solution in the form of crystals (lower pathway). Alternatively, proteins may partially unfold with interactions between unfolded regions resulting in the formation of stable intermolecular anti-parallel beta sheet structure (yellow). This structure has been linked with the formation of soluble oligomers that go on to coalesce into soluble and insoluble aggregates.2
Techniques used to assess and investigate unfolding and aggregation include chromatographic, particle sizing, calorimetric and spectroscopic methods, electron microscopy and bioassays. Together they form an orthogonal biophysical characterization set that detects and elucidates diff erent aspects of unfolding and aggregation behavior, prior to, or after the formation of aggregates.
For example, diff erential scanning calorimetry (DSC) detects the onset of unfolding. A DSC system measures changes in the thermal properties of a protein sample as they begin to deviate from those associated with the native, folded state. In contrast, particle sizing techniques such as dynamic light scattering (DLS) identify and quantify oligomers and aggregates; unfolding of a discrete monomer, unaccompanied by any increase in size is undetectable. In vitro and in vivo bioassays such as enzyme-linked immunosorbent assays and cell-based assays provide alternative insight by quantifying the impact of conformational instability, while electron microscopy is mostly applicable for characterization of the crystals formed by the dimerization or oligomerization of unfolded monomers.
Spectroscopic techniques such as Fourier-transform infrared (FTIR) spectroscopy provide information about unfolding and aggregation from measurements of higher order structure. More specifi cally, FTIR measurements across the Amide I band detect the formation of the intermolecular beta sheet structure which is associated with a peak in the 1620 to 1625cm-1 range. The Amide I band wavelengths are associated with the C=O stretch vibration of peptide linkages and the strength of bonds along the protein backbone which is highly sensitive to changes in secondary structure. IR spectroscopy is one of very few techniques that can be used to directly monitor aggregation, even before aggregates are present at appreciable levels.
However, from a practical perspective conventional FTIR spectroscopy often lacks utility for biotherapeutic workfl ows. Ill-suited to automation it is a relatively slow, manually intensive technique that additionally lacks sensitivity. MMS is a relative new technique that addresses these limitations enhancing the viability of measurements of secondary structure for vaccine formulation studies. The following studies illustrate its potential and application.
Case Study: Applying Orthogonal Biophysical Techniques to Investigate Protein AggregationFigure 2 shows data from thermal stress testing of a mAb, anti-TSLP (Thymic Stromal Lymphopoietin) antibody, selected as a representative example of a mAb antibody.
DSC data (Figure 2 - top) show two peaks, the fi rst at around 70°C with a second larger peak evident at around 84oC. These peaks indicate two discrete unfolding events, a plausible rationale being that one is associated with behavior in the Fab (antigen binding) region while the other is associated with the Fc region.3
DLS data (Figure 2 – middle) from a temperature ramp to around 70°C indicate that at temperatures above ~60°C the radius of the protein particles begins to increase, from around 2 to 10 nm. This is consistent with the formation of partially unfolded clusters. The second set of DLS data, from a higher temperature ramp (Figure 2 – bottom) shows that, in contrast, at around 80°C, there is a much more dramatic increase in particle size, to around 1000 nm (1 µm). This suggests substantially more signifi cant aggregation. Conventional FTIR analysis was carried out to generate structural information to elucidate these observations (see Figure 3).
While FTIR data were gathered across both the Amide I and Amide II regions, changes in the Amide I wavelengths alone are suffi cient to detect structural diff erences associated with the application of thermal stress. FTIR absorption spectra (Figure 3 - left) for samples stressed to 25°C and 72°C (blue and green traces respectively) are closely similar whereas the sample at 85°C generates a broader Amide I peak. Presenting the results in the form of -1 x 2nd derivative spectra (right), a standard strategy to resolve absorption peaks within a band, shows that this broadening is associated with the development of a peak at around 1625 cm-1; the wavelength associated with inter-molecular anti-parallel beta-sheet structure and by extension, the formation of aggregates.4,5,6,7,8 In contrast, the other two samples exhibit a peak at 1639cm-1 a wavelength correlated with intra-molecular parallel beta-sheet structure, an expected structural feature of the unaggregated mAb.
These data illustrate the ability of FTIR to detect the structural changes associated with aggregation. The absorbance of water in the Amide I region makes it diffi cult to get a good FTIR signal, necessitating measurement at relatively high concentrations. Here a concentration of 40 mg/mL was required which is far from representative of the few µg per mL typically associated with vaccine formulations.
« SPECTROSCOPY »
www.americanpharmaceuticalreview.com | | 93
Figure 1. Schematic showing the mechanisms of protein aggregation and crystal formation.

» SPECTROSCOPY »
94 | | July/August 2020
protein antigen. In this study, control and heat stressed (65°C for 30 minutes) samples were measured at a concentration of 3 and 6 mg/mL. A control sample was also run at 10 mg/mL, creating 5 sets of data in total. Once the samples were loaded into the 24 well sample plate all aspects of analysis including data processing were automated. As a result, all the MMS measurements were completed in substantially less time than the single FTIR analysis reported in the preceding study, and with less manual input.
Absorbance spectra (Figure 4 left) show a broadening of the Amide I peak for the thermally stressed samples (orange and yellow traces) relative to the control samples. An interesting point to note is the very low levels of absorbance of the measurements. These samples were run at relatively low concentration and the absolute absorption was correspondingly low. However, signal to noise ratio was excellent and exceptional sensitivity was observed in the data, following automated buff er subtraction. The corresponding -1 x 2nd Derivative Absorbance plot provides better resolution of the Amide I peak. It shows that thermal stress results in a second peak at ~1620 cm-1 indicating the development of anti-parallel beta sheet structure and associated aggregation.
The results shown in Figure 5 illustrate the ways in which the MMS data can be automatically processed to enhance its informational value.
Figure 3. FTIR data for the mAb antibody provides evidence that thermal stress results in structural changes consistent with the
formation of aggregates.
Figure 2. DSC and DLS data for a mAb antibody provide evidence of unfolding and aggregate formation due to thermal stress.
Furthermore, FTIR measurements are manual rather than automated including sample loading and data processing; background and buff er spectra were measured separately for this system and then manually subtracted from the sample spectra. Overall measurement proved slow, diffi cult, manually intensive and temperature sensitive.
Detecting Aggregation with MMSTo compare the utility of MMS with conventional FTIR a follow-up study was carried out, investigating aggregation of a non-mAb
Figure 4. MMS data for a non-mAb antigen provides clear evidence that heat stress has induced aggregation in the sample.

One approach is to use the Similarity or Area of Overlap tool (upper
plot) which enables quantitative comparison of the 2nd Derivative
spectra of a set of measurements, even if they are conducted at
diff erent concentrations. For this comparison the user assigns a
baseline measurement, in this case the spectra measured for the 10
mg/mL control sample, and all other measurements are compared
to it, following normalization of the area under the curve on the
basis of concentration. Proteins with closely comparable structure
will exhibit a high Area of Overlap, even when measured at diff erent
concentrations, while dissimilar proteins with be associated with lower
values, even if measured at the same concentration.
Here the control samples are all closely similar with an Area of
Overlap of 97.67 and 95.28% for the 6 mg/mL and 3 mg/mL samples,
respectively. In contrast thermal stress reduces the Area of Overlap
to 74.08 and 73.61% for the 6 mg/mL and 3 mg/mL samples. These
results illustrate the simplicity and eff ectiveness of using Area of
Overlap analyses to compare and quantify the level of aggregation in
diff erent samples.
Further insight into the structural changes induced by thermal stress
can be gained from estimates of the quantities of diff erent types of
« SPECTROSCOPY »
www.americanpharmaceuticalreview.com | | 95
secondary structure in each sample. To generate these estimates the
software automatically fi ts the 2nd derivative spectra for a specifi c
sample to a collection of standard spectra with established structural
forms. Figure 5 (bottom) shows the results which include estimates for
the quantity of parallel beta sheet, unorganized, alpha helix, turn, and
anti-parallel beta sheet in each sample. The level of anti-parallel beta
sheet structure in the 3 mg/mL and 6 mg/mL samples increases to
29.5 and 28.2% respectively, relative to corresponding control values
of 3.1and 2.7%. These data directly quantify the extent of aggregation
in terms of its impact on the secondary structure of the protein.
ConclusionThe unfolding and aggregation of antigens is detrimental to the safety
and effi cacy of vaccines and must be rigorously controlled to the point
of delivery to the patient. The structural changes associated with
aggregation can be detected from changes in IR adsorption across the
Amide I band, with adsorption at ~ 1620 – 1625 cm-1 securely correlated
with formation of the intermolecular anti-parallel beta-sheet structure
observed in aggregates. Conventional transmission mode FTIR can
detect this structure but only at high protein concentrations (~> 30 mg
/mL). Equally importantly measurement is slow, complex and manual.
In contrast, MMS can easily detect the formation of anti-parallel
β-sheet formation at relatively low protein concentrations, in the
range 1 to 6 mg /mL. Automated measurement, including advanced
data processing, makes the technique well-suited to high-throughput
screening and a valuable tool for vaccine development.
References1. Nabel, G.J. (2013) Designing Tomorrow’s Vaccines. N Engl J Med. 368(6), 551-560
2. Wang, W., Roberts, C., J. (2013) Non-Arrhenius protein aggregation. AAPS J., 15, 840-851
3. Ionescu, R.,M., Vlasak, J., Price, C., Kirchmeier, M. (2008) Contribution of variable domains to the stability of humanized IgG1 monoclonal antibodies. J Pharm Sci. 97, 1414-1426
4. Sathya Devi, V., Coleman, D.R., Truntzer J., (2011) Thermal unfolding curves of high concentration bovine IgG measured by FTIR spectroscopy. Protein J, 30, 395-403
5. Tian, F., Middaugh, C., R., Off erdahl, T., Munson, E., Sane, S., Rytting. J., H., (2007) Spectroscopic evaluation of the stabilization of humanized monoclonal antibodies in amino acid formulations. Int J Pharm., 335, 20-31
6. Matheus, S., Friess, W., H.C. Mahler, H.,C., (2006) FTIR and DSC as analytical tools for high-concentration protein formulations. Pharm Res., 23,1350-1363
7. van de Weert. M., Haris, P.I., Hennink, W.,E., Crommelin, D.,J., (2001) Fourier transform infrared spectrometric analysis of protein conformation: eff ect of sampling method and stress factors. Anal Biochem, 297, 160-169
8. Dong ,A., Matsuura, J., Manning, M.,C., Carpenter, J.,F., (1998) Intermolecular beta-sheet results from trifl uoroethanol-induced nonnative alpha-helical structure in beta-sheet predominant proteins: infrared and circular dichroism spectroscopic study. Arch Biochem Biophys. 355, 275-281
Figure 5. Area of Overlap and Secondary Structure Estimates quantify the change induced by thermal stress.

»
96 | | July/August 2020
BIOPHARMACEUTICAL PROCESSING »
Bonnie K. ShumSenior Engineer (PT Innovation and MSAT, Technology Acceleration Team)Genentech, Inc., A member of the Roche Group
What Does Digitalization Really Mean to Drug Substance Manufacturing? A Case Study
IntroductionAdvanced data analytics tools are used throughout the biopharmaceutical industry, from leveraging computational biology for drug discovery, to increasing process understanding and improvement through predictive monitoring, to smart packaging and blockchain supply chain, and to targeted patient engagement programs for better treatment outcomes. As biologics manufacturing comprises complex and relatively poorly understood processes, digital technologies such as process models can transform data into insights and thus are key enablers for the future. Given the complexity of unit operations and processes in the drug substance (DS) manufacturing realm, enabling proactive measures before a problem arises via predictive technologies is of particular interest for the biopharmaceutical industry. As a result, major eff orts of digitalization in DS manufacturing focus on process models and the realization of their potential.
Data Analytics in BioprocessingThe data analytics ascendancy model as described by Gartner (Maoz, 2013) can be broken down into 4 main stages; Figure 1 illustrates the steps and how they are applied in bioprocessing.
Figure 1. Data Analytics Ascendancy Model and Applications in Bioprocessing

1. Descriptive Analytics – “What happened?”, this type of analytics provides insights into the past and an understanding of how the manufacturing process is performing by providing context to interpret the data. An example is data visualization such as control charts for cell growth in the bioreactors.
2. Diagnostics Analytics – “Why did this happen?”, this is a deeper analysis such as root cause analysis, exploring the data and making correlations. Examples include chromatogram review and batch-scale comparison models.
3. Predictive Analytics – “What will happen?”, most applicable in today’s bioprocessing and modeling to allow forecasting and better anticipation of future failures. An example of this is real time multivariate data analysis (MVDA) process monitoring.
4. Prescriptive Analytics – “How can we make it happen?”, last stage of the continuum, focusing on driving manufacturing toward optimal outcome by proactive decision support, with smart factory concept using advanced automation for optimized setpoints and controls as an example.
Implementation in the Real World
Managing Analytics InfrastructuresIn order for advanced analytics and process models to be useful and sustainable, a robust infrastructure solution for process data management and dissemination of data analytics and visualization is required. An example of a modular analytics environment is shown in Figure 2 and consists of three core components:
1. Data structure and connections to manufacturing data
sources (green)
2. Calculation engine/analytics layer (orange)
3. Virtual machines and/or applications (blue), user-interface
and database hosting service
With this modular data analytics environment, independent calculation packages (modules) with new mathematical approaches can be added with user-specifi c interfaces developed and updated within the analytics environment application accordingly.
Business Processes For streamlined implementation and sustainability of data analytics technologies, especially in a complex DS manufacturing network, it is essential to establish a clear and robust business process. One of the most important elements of the business process is defining roles and responsibilities. From the example depicted in Figure 2, roles and responsibilities can be split between the analytics environment (shared components) and each independent calculation module or application.
The roles at the analytics environment level are intended to develop
and maintain shared needs and services:
• Environment Process Owner – Accountable for all technical
aspects of module integration into the analytics environment
with in-depth knowledge of bioprocessing, IT, automation, and
business analytics
• Environment Business Process Owner – Responsible for
design, establishment, and sustainment of business process
and driving improvement strategy and vision of the analytics
environment
• IT Product Manager – Support data access to the environment
and ensure infrastructure is in place at the enterprise level
Module-specifi c roles are needed to address an application’s respective
approach and requirements:
• Module Process Owner – Accountable for module/application
specifi c mathematical approach or vendor management,
visualization within the analytics platform, and user support
• Module Business Process Owner – Owner of module specifi c
business process and responsible for driving improvement and
vision for the module
• Module Technical SME – Acts as module superuser and
promotes usage or tool for support of manufacturing processes.
Responsible for building and improving of models within
module/application
Case Study: Chromatography Transition Analysis As column chromatography is an essential component in protein
biologics purifi cation processes, monitoring the performance of
liquid chromatography columns is necessary to ensure product
quality. Column pack integrity is associated with the chromatography
« BIOPHARMACEUTICAL PROCESSING »
www.americanpharmaceuticalreview.com | | 97
Figure 2. High Level Architecture for Data Analytics Management

separation capability and resolution, and the default method of
determining column packing effi ciency is pulse injection testing.
The method uses an injection of a well-detected and inert chemical
tracer to the liquid fl ow close to the column inlet, and the broadening
of this pulse is analyzed when measured as an elution peak at the
column outlet. This method is impractical for ongoing monitoring of
production-scale chromatography columns in routine manufacturing
operations due to the need of auxiliary equipment and buff ers and
associated labor and resources.
Transition analysis (TA) utilizes existing in-process data to monitor
the performance of packed bed columns through analysis of signals
such as pH, conductivity, and optical density at the column outlet as
a response to chromatography transitions (Larson et al., 2003). The
resulting breakthrough curve from a transition (see Figure 3) can be
analyzed by utilizing the fi rst derivative of the response curve.
Value of Chromatography Transition AnalysisCompared to visual review of chromatograms and the use of a pulse
injection test for column integrity, transition analysis provides several
advantages. The analysis can be performed with in-process data
during or after each batch, without impact to normal operations.
Not only does the method detect integrity failures, it is also used to
monitor the performance of columns in manufacturing over the
column lifetime and provides trends rather than a snapshot. Through
lifecycle monitoring of transition analysis parameters, performance
degradation and column failures may become predictable, resulting in
reduction of batch losses and ability to maintain process consistency.
Additionally, the use of chromatography transition analysis supports
continuous improvement eff orts and improved process knowledge. By
continuing to improve column packing techniques at the production
scale, improved separation performances and yield can be achieved.
Building Network CapabilityThe diversity of equipment, data infrastructure, IT systems, processes and products in a global manufacturing network with multiple drug substance facilities must be taken into consideration. The goal is to deploy a standardized and fl exible chromatography column health monitoring strategy to streamline analytics and facilitate cross-site and/or cross-product comparison.
In order to build the capability for chromatography TA across a manufacturing network, the fi rst step is knowledge building. Column integrity can be modeled using various transition analysis methods, and by implementing continuous column monitoring and piloting the calculation methods at diff erent sites, data can be collected to understand feasibility and applicability. Once the data are available, comparative analysis of the transition analysis data can be performed across the diff erent manufacturing sites and processes. Based on the analysis, harmonization of the appropriate methods can enable establishment of network procedures on business processes and clear decision making. Additionally, in order to implement a sustainable tool across the network, the tool should have a robust centralized infrastructure (e.g. sustainable analytics architecture) while enabling automated business decision making (e.g. column repacking).
Evaluation of Methods
A variety of methods exists for chrom TA with comparable capability to detect column integrity changes. The evaluation to determine the appropriate method(s) for implementation should be based on an ob-jective comparison via acceptance testing based on criteria compris-ing desired characteristics of the fi nal tool. Other factors to consider include resources required for development, ease of implementation, tool simplicity, and site systems (IT/Automation) compatibility.
Generally, an objective method selection test consists of the following steps: 1) defi ning and prioritizing requirements for method selection of fi nal tool, 2) defi ning acceptance criteria and ranking procedures, 3) designing tests and data set selection, and 4) running the tests by applying the predetermined criteria. For transition analysis, the key
» BIOPHARMACEUTICAL PROCESSING »
98 | | July/August 2020
Figure 3. Column Integrity Testing: Pulse Injection vs. Transition Analysis
Figure 4. Acceptance Testing: Sensitive to Trend/Failure

parameters should demonstrate the same magnitude of detection level as traditional pulse injection test parameters, and the acceptance criteria primarily focus on sensitivity, robustness, and correlation to the classical pulse injection output. The data set used for methods evaluation must be representative and sufficient to cover the range of variability with regards to resin type, data sampling rates, and data artifacts that may exist.
An example acceptance testing and evaluation for sensitivity to trend/failure is depicted in Figure 4.
1. Data Collection – Process data for each chromatography column type are collected. Failure data refers to all available cycles from poorly performing column packs, and good data refers to all available cycles from other (non-failure) packs of the same resin type and product.
2. Generate Overlays – With the data collected, transition analysis outputs are plotted against cumulative cycle number for each metric and resin type to create an overlay for visualization.
3. Determine Optimal Threshold – The threshold for unacceptable failure can be determined based on a cost function assuming each breakthrough run is equivalent to the cost of not utilizing a set number of resin cycles. The cost function used can be customizable based on risk tolerance and resin costs for the column being monitored.
4. Evaluation Accuracy – A confusion matrix is used to show true positives, true negatives, false positives, and false negatives and determine model performance (accuracy, precision, sensitivity, specificity).
5. Compare Methods – The methods are objectively evaluated by comparing the accuracy, precision, and detection capability of the methods.
Network Implementation
One or more chromatography TA calculation methods can be selected for implementation across a manufacturing network based on acceptance criteria evaluation from methods testing. The selected method(s) can be a standalone parameter or a combination of calculated parameters demonstrating strong sensitivity to trend and step change as well as robustness when data artifacts are present for every in-scope site and process. To improve predictive capability, auxiliary parameters for interpretation and analysis can also be considered and included in the tool.
For smooth transition from a pilot tool to implementation, each manufacturing site across the network should assess readiness from both a technological and workforce standpoint. Calculation modules, such as transition analysis for chromatography columns, should not be standalone tools, should be amenable to minimal maintenance and oversight, and could be hosted on an analytics environment as described earlier or on an enterprise level solution. Each of the sites must ensure that data connections are in place with the appropriate
level of contextualization to ensure the calculation can be performed
consistently. From a workforce readiness perspective, a centralized
organization acting as owner of the technology and know-how as well
as a user group with data science and analytics capability are essential
for the adoption and long-term success of these tools.
Next Steps
The ultimate goal of establishing chromatography TA capability is
the evaluation of mined data and interpretation of the results. Once
column monitoring is in place, the next step is to further test the
predictive capabilities of the models to determine effectiveness of
failure prediction across the sites and for the different column types.
Like all model-based analytics, the evaluation of the algorithms
is an iterative process wherein user feedback enables continuous
improvement in the quality of results.
ConclusionsIn order to implement and sustain digital transformation, the
appropriate scope of digitalization efforts must be proactively
defined for the focus area. In the case of digitalization of biologics
drug substance manufacturing, data analytics for manufacturability
and reliability is a logical first step. The grouping of related efforts
allows for synergy in the infrastructure solution as well as the business
processes. Roles and responsibilities for development, adoption, and
sustainment of digitalization tools should be clearly defined in order to
identify gaps for needed skills set; when the people and tools are fit for
purpose, capability building can be expedited. As digitalization is still
in its infancy for the biopharmaceutical industry, change management
is crucial not just for the IT and automation systems but also for the
workforce, with a focus on mindset shift as well as adapting to a more
agile way of working.
AcknowledgementsThe author would like to recognize the members of the Roche
Chromatography Transition Analysis network project team for their
contribution to the development of a network program for column
health monitoring and thanks to the Digital Clone Platform team for
their work on analytics infrastructure and business process definitions.
Reference1. Maoz, M. 2013. How IT Should Deepen Big Data Analysis to Support Customer-Centricity.
Gatner G00248980. Available at: https://www.gartner.com/en/documents/2531116/how-it-should-deepen-big-data-analysis-to-support-custom. Assessed May 20, 2020.
2. Larson TM, Davis J, Lam H, Cacia J. Use of process data to assess chromatographic performance in production-scale protein purification columns. Biotechnol Prog. 2003;19(2):485-492. Doi: 10.1021/bp025639g
« BIOPHARMACEUTICAL PROCESSING »
www.americanpharmaceuticalreview.com | | 99

»
100 | | July/August 2020
SPONSORED CONTENT »
Leigh Ford, Vincent Jannin and Hassan BenameurLonza Pharma & Biotech
Unlocking the Use of Lipid-Based Formulations with Lipophilic Salts to Address Bioavailability Challenges in Small Molecule Drug Development
Drug developers have traditionally benefi ted from the ionizability of
acidic or basic drugs to form ionic salts that increase water solubility.1-3
However, this increased water solubility does not always relate to
improved oral bioavailability, and therefore specialized technologies
are needed to address bioavailability challenges. Lipid-based
formulations (LBFs) are widely used in drug development to improve
the oral absorption of poorly water-soluble drugs, which continue to
dominate the development pipeline.4, 5 To render the target API more
lipid-soluble and to reach the dose while unlocking the benefi ts of
LBFs, a recent strategy has been to utilize a similar approach to ionic
salts, but instead of pairing the ionized drug with a small inorganic
or small organic counterion, a bulky, asymmetric non-polar organic
counterion is utilized. These so-called lipophilic salts (LSs) may also be
referred to as ionic liquids (ILs) or hydrophobic ion pairs (HIPs).
Lipid-Based Technology Applications
Lipid-based formulations using liquid-fi lled hard capsule or soft gel
formats have been used extensively in the biopharma market to
address a range of formulation challenges. Lipid- or liquid-based
approaches have been used for better ensuring dose uniformity for
low-dose applications, as well as to better ensure safe handling of
highly potent API. LBF approaches – primarily soft gels – have also been
extensively used in life cycle management strategies, especially in
over-the-counter applications. Fixed-dose combinations and colonic
delivery are additional areas of application. However, addressing
bioavailability challenges remains the primary LBF application where
lipid/solvent-based formulation approaches are especially eff ective
in improving the solubility of highly lipophilic compounds. Neoral®
(cyclosporine), Xtandi® (enzalutamide) and Lynparza® (olaparib)
are only a few examples of marketed drugs utilizing lipid-based
formulations to address poor or inconsistent solubility challenges.
These compounds that are well-suited to LBFs for oral absorption
enhancement are often described as “grease ball” type drugs (Figure
1). Such drugs typically exhibit solvation-limited solubility and thus
LBFs can improve their solubility by making changes to the local
solubilization environment in the GI tract. The solvation-limited
solubility of grease ball compounds is generally linked to a high
partition coeffi cient (LogP), with a cut-off value of 2 to 3.6 Alternatively,
for “brick dust” type drugs, where strong solid-state forces limit
solubility, an amorphous formulation approach is advantageous.
Generally the cut-off value for solid-state limited solubility of brick
dust compounds is a melting temperature (Tm) of 200°C.6
In addition to improving drug micellar solubilization, an LBF may
also increase drug absorption through bypassing drug dissolution,
recruiting endogenous solubilizers such as biliary components to
Figure 1. Brick dust and greaseball drugs: different barriers to water solubility for these two classes of poorly
water-soluble compounds.

eff ectively shuttle drug to the site of absorption, and promoting the
uptake of certain drugs into the lymphatic system.7,8
A common problem in lipid solution development is diffi culty
identifying an LBF which can suffi ciently dissolve a drug in order to
reach a target concentration. This is defi ned by the maximal drug
solubility in the LBF, while the target concentration is dependent on
the target drug dose and the target drug-to-formulation ratio.
• The solubility of the drug in an LBF vehicle is key to the success
of developing a viable lipid solution formulation. For example, in
instances where solubility in a range of lipidic excipients is low, a
lipid solution can only be developed if the target dose is low or if
there is scope to utilize larger or multiple dosage units.
• The target drug dose is determined by the pharmacological
potency of the molecule and oral bioavailability, with higher
doses most often refl ecting low potency. Unless there is scope
to decrease the dose by increasing drug bioavailability, the
dose is fi xed and cannot be modifi ed by the formulator. In
the context of developing a lipid solution, a high dose will
therefore usually translate to a need for a high target drug
solubility in lipidic excipients.
• The target drug-to-formulation ratio defi nes the ideal
dosage form size and number of dosage units per dose. The
practicality of using a large number of dosage units (i.e., high
pill burden) or large dosage form size is tempered by a number
of drawbacks including the negative impact on compliance,
increased risk of formulation induced adverse eff ects and basic
administration challenges.9
Strategies to improve drug solubility, and therefore drug loading, in
LBFs may therefore unlock the broader use and evaluation of LBFs for
more drugs.
Salts Combined with LBFs to Enhance Oral Absorption
Lipophilic salts provide a promising approach to achieving higher
solubility in lipids. Lipophilic salt forms of a drug typically exhibit
depressed melting points relative to the free acid or base or traditional
salt form and tend to exhibit substantially improved solubility in lipidic
excipients without any structural changes to the drug. This allows
also transforming ‘brick dust’ compounds into ‘grease balls,’ which are
more amenable to LBFs. As a snapshot example, the relative solubility
diff erence in a model LBF of erlotinib hydrochloride (marketed form,
Tm = 244°C), erlotinib free base (Tm = 157°C) and erlotinib lipophilic
salt (docusate form, Tm = 71°C) is depicted in Figure 2. Despite
exhibiting low aqueous solubility and a clogP of 3.1, the hydrochloride
salt form of erlotinib has very low solubility in the model LBF and as
such ~90 g of formulation was required to dissolve a single dose. This
equates to 110 size 00 capsules. In contrast, the same erlotinib dose
can be delivered in a single capsule using a lipophilic salt approach.10
The overall benefi ts of increasing oral drug exposure include i.
reduced dose, ii. reduced food eff ects, iii. reduced variability and iv.
reduced eff ect of drug-drug absorption related interactions. LBFs
can eff ectively improve the oral absorption of poorly water-soluble
drugs. A performance synergy between lipophilic salts and LBFs can
also exist, which in turn may lead to improved absorption from the
fasted state.
The fi rst publication to describe this benefi t when combining
lipophilic salts and LBFs looked at cinnarizine and itraconazole.11 In the
case of cinnarizine, the lipophilic salt (decyl sulfate salt) solubility in
an LBF containing medium-chain lipidic excipients was 3.5-fold higher
than that of the free base and allowed dissolving the drug dose. The
exposure obtained in rats from this formulation was over 3.5-fold
higher than the exposure obtained using an aqueous suspension of
the free base and nearly 2-fold higher than that of a suspension of
cinnarizine free base in the same LBF, all dosed at the same free base
equivalent dose. This boost in exposure when combining lipophilic
salts and LBFs was attributed to the fact that dissolving the drug in
the lipid vehicle using the LS approach was able to bypass traditional
dissolution, which is likely to have limited exposure when using a
suspended crystalline form of cinnarizine in the same LBF.
The benefi t of using a dissolved lipophilic salt/LBF formulation on
oral absorption was more pronounced for itraconazole.11 In this case
a Self-Emulsifying Drug Delivery Systems (SEDDS) containing long-
chain lipids and suspended itraconazole free base (Tm = 170°C, LogP
= 5.66) yielded negligible exposure in rats, yet the same formulation
containing the lipophilic salt (docusate, Tg = 47−53°C) in solution
yielded an exposure level that was 2–3 fold higher than that of the
currently marketed amorphous drug formulation (Sporanox®). This
aspect highlights the performance benefi t of using lipophilic salts in
combination with LBFs.
The potential advantages of this technology have also been
investigated for four model kinase inhibitors.10 There are now over
40 FDA-approved kinase inhibitors for the treatment of cancers and
« SPONSORED CONTENT »
www.americanpharmaceuticalreview.com | | 101
Figure 2. Illustrating the significant impact of lipophilic salt formation on the drug solubility within an LBF vehicle. In
this example, the drug is erlotinib and only the lipophilic salt form (docusate) can be delivered in a single capsule at the
target clinical dose. Adapted from 10.

» SPONSORED CONTENT »
various auto-immune diseases, yet drugs in this class are plagued by
instances of low aqueous solubility, low and variable absorption and
food-affected pharmacokinetics.12,13 Using simple “off-the-shelf” LBFs
to provide an initial proof-of-concept, it was possible to achieve at
least 100 mg/g drug loading in LBF when using docusate lipophilic
salt forms of erlotinib and cabozantinib.
More recently the LS approach has been applied to lumefantrine, a
model poorly water-soluble drug.14 In vivo studies found that the LS
form, lumefantrine docusate, in a model SEDDS formulation with long
chain-lipids showed significantly higher plasma exposure (up to 35-
fold higher) compared to a free base aqueous suspension.
Conclusions
Years of experimentation have shown that transforming drugs into
lipophilic salts is a viable strategy to increase the number of drugs with
access to the absorption-enhancing benefits of LBFs. The underlying
mechanisms for the performance benefit of the combination of
lipophilic salts and LBF likely reflect the ability to deliver high drug
concentrations molecularly dispersed (dissolved) in an LBF, thereby
avoiding the potentially absorption-rate-limiting step of dissolution.
In addition, the lipophilic salt showed increased solubility in dispersed
and digested LBFs when compared to the free base or free acid,
indicating that the presence of the lipophilic counterion can play an
important role in promoting drug absorption.
The extent to which a lipophilic counterion improves solubility in the GI
tract will be dependent on the extent of drug ionization, with maximal
solubility gain in lipid-based colloids when both drug and counterion
are fully ionized. An additional factor worth mentioning is that the
higher lipid solubility of the lipophilic salts across a range of lipidic
excipients unlocks the use of a broader range of lipidic excipients.
Critically, for enhancing oral absorption, long-chain lipids are often
more effective in solubilizing drug in the GI tract and promoting drug
absorption than medium-chain lipid formulations or simple cosolvent
systems.15-17 But long-chain lipids have been historically limited by
lower drug loading capacity in comparison to, for example, medium-
chain lipidic excipients and cosolvents. The use of lipophilic salts
may help to overcome this solubility limitation and help to increase
bioavailability of ionizable small drugs and patient compliance by
reducing pill burden and adverse effects.
Formulators may falter if they take a one-size-fits-all approach to
enabling technology selection for improving low solubility and
bioavailability. To determine whether lipophilic salts and LBF are
the optimal technology approach for a bioavailability-challenged
molecule, drug developers may benefit from a holistic tech selection
approach that analyzes all dimensions of the drug’s problem
statement. As bioavailability-challenged molecules continue to rise in
number, having access to a range of enabling technologies, including
LBF-based approaches, will be increasingly important for effective and
timely drug development.
References
1. Berge, S. M.; Bighley, L. D.; Monkhouse, D. C., Pharmaceutical salts. J. Pharm. Sci. 1977, 66 (1), 1-19.
2. Serajuddin, A. T., Salt formation to improve drug solubility. Adv Drug Deliv Rev 2007, 59 (7), 603-616.
3. Stahl, P. H.; Wermuth, C. G., Handbook of Pharmaceutical Salts: Properties, Selection and Use. 2002; Vol. 24, p 21.
4. Boyd, B. J.; Bergström, C. A. S.; Vinarov, Z.; Kuentz, M.; Brouwers, J.; Augustijns, P.; Brandl, M.; Bernkop-Schnürch, A.; Shrestha, N.; Préat, V.; Müllertz, A.; Bauer-Brandl, A.; Jannin, V., Successful oral delivery of poorly water-soluble drugs both depends on the intraluminal behavior of drugs and of appropriate advanced drug delivery systems. European Journal of Pharmaceutical Sciences 2019, 137, 104967.
5. Williams, H. D.; Trevaskis, N. L.; Charman, S. A.; Shanker, R. M.; Charman, W. N.; Pouton, C. W.; Porter, C. J., Strategies to address low drug solubility in discovery and development. Pharmacol. Rev. 2013, 65 (1), 315-499.
6. Bergström, C. A. S.; Larsson, P., Computational prediction of drug solubility in water-based systems: Qualitative and quantitative approaches used in the current drug discovery and development setting. International Journal of Pharmaceutics 2018, 540 (1), 185-193.
7. Porter, C. J.; Trevaskis, N. L.; Charman, W. N., Lipids and lipid-based formulations: optimizing the oral delivery of lipophilic drugs. Nat. Rev. Drug Discov. 2007, 6 (3), 231-248.
8. Jannin, V., Complex Interplay Between Solubilization, Digestion, Supersaturation and Absorption of Poorly Soluble Drugs with Lipid-Based Formulations. Current Drug Delivery 2018, 15 (6), 749-751.
9. Ingersoll, K. S.; Cohen, J., The impact of medication regimen factors on adherence to chronic treatment: a review of literature. J. Behav. Med. 2008, 31 (3), 213-224.
10. Williams, H. D.; Ford, L.; Han, S.; Tangso, K. J.; Lim, S.; Shackleford, D. M.; Vodak, D.; Benameur, H.; Pouton, C. W.; Scammells, P. J.; Porter, C. J., Enhancing the Oral Absorption of Kinase Inhibitors Using Lipophilic Salts and Lipid Based Formulations Mol. Pharm. 2018, 15 (12), 5678-5696.
11. Sahbaz, Y.; Williams, H. D.; Nguyen, T.-H.; Saunders, J.; Ford, L.; Charman, S. A.; Scammells, P. J.; Porter, C. J., Transformation of poorly water-soluble drugs into lipophilic ionic liquids enhances oral drug exposure from lipid based formulations. Mol. Pharm. 2015, 12 (6), 1980-1991.
12. Herbrink, M.; Nuijen, B.; Schellens, J. H.; Beijnen, J. H., Variability in bioavailability of small molecular tyrosine kinase inhibitors. Cancer Treat. Rev. 2015, 41 (5), 412-422.
13. Rowland, A.; Van Dyk, M.; Mangoni, A. A.; Miners, J. O.; McKinnon, R. A.; Wiese, M. D.; Rowland, A.; Kichenadasse, G.; Gurney, H.; Sorich, M. J., Kinase inhibitor pharmacokinetics: comprehensive summary and roadmap for addressing inter-individual variability in exposure. Expert Opin. Drug Metab. Toxicol. 2017, 13 (1), 31-49.
14. Tay, E.; Nguyen, T. H.; Ford, L.; Williams, H. D.; Benameur, H.; Scammells, P. J.; Porter, C. J. H., Ionic Liquid Forms of the Antimalarial Lumefantrine in Combination with LFCS Type IIIB Lipid-Based Formulations Preferentially Increase Lipid Solubility, In Vitro Solubilization Behavior and In Vivo Exposure. Pharmaceutics 2019, 12 (17).
15. Christensen, J. Ø.; Schultz, K.; Mollgaard, B.; Kristensen, H. G.; Mullertz, A., Solubilisation of poorly water-soluble drugs during in vitro lipolysis of medium-and long-chain triacylglycerols. Eur. J. Pharm. Sci. 2004, 23 (3), 287-296.
16. Porter, C. J.; Kaukonen, A. M.; Boyd, B. J.; Edwards, G. A.; Charman, W. N., Susceptibility to lipase-mediated digestion reduces the oral bioavailability of danazol after administration as a medium-chain lipid-based microemulsion formulation. Pharm. Res. 2004, 21 (8), 1405-1412.
17. Williams, H. D.; Sassene, P.; Kleberg, K.; Bakala‐N’Goma, J. C.; Calderone, M.; Jannin, V.; Igonin, A.; Partheil, A.; Marchaud, D.; Jule, E., Toward the establishment of standardized in vitro tests for lipid‐based formulations, part 1: Method parameterization and comparison of in vitro digestion profiles across a range of representative formulations. J. Pharm. Sci. 2012, 101 (9), 3360-3380.
102 | | July/August 2020

KEY REASONS TO ATTEND THE VIRTUAL CONFERENCE: • EXPLORE the latest industry case studies in platform
approaches and connected devices
• GAIN insights from regulatory and notifi ed bodies on the pre-fi lled syringes environment
• HEAR from key industry players from San Francisco and the West Coast to learn about new innovations in the combination products space
• ENGAGE in the key challenges and topics of the fi eld in two interactive half-day workshops
• Virtual conference benefi ts include virtual exhibition booths packed with information, networking features to chat and share contact details with other attendees, and virtual meetings and networking socials. For full details, see p.5
www.prefi lled-sanfrancisco.com Register online or fax your registration to +44 (0) 870 9090 712 or call +44 (0) 870 9090 711
FREE ACCESS FOR PHARMACEUTICAL AND BIOTECHNOLOGY COMPANIES @SMIPHARM #SMiPFSUSA
Virtual Conference: Online Access Only
SMi Group Proudly Presents...
CONFERENCE: 14TH - 15TH
WORKSHOPS: 16TH
SEPT 2020Device Innovations, Regulation Updates and Formulation
Insights for Enhanced PFS Delivery
Pre-Filled Syringes San Francisco
SPONSORED BY
CHAIRS FOR 2020:Shannon Clark, Principal, UserWise
Steven Badelt, Founder and Managing Partner, Suttons Creek, Inc.
FEATURED 2020 SPEAKERS INCLUDE:• Christine Lynn Lanning, Distinguished Scientist, Device
Area Leader, Safety Assessment/Merck & Co., Inc• Khaudeja Bano, Executive Medical Director, Combination
Product Safety Head, Amgen• Kristina Lauritsen, Combination Products Regulatory
Advisor, FDA/CDER*• Jace Blackburn, Smart Device Engineer, Genentech • James Leamon, Director of Biologics Device
Development, Jazz Pharmaceuticals• Walter Goodwin, Device Engineer, Device Development &
Clinical Packaging Engineering, Gilead Sciences• Natalie Abts, Head of Human Factors Engineering, Device
and Packaging Development, Genentech• Katie Atkinson, Manager, Human Factors Engineering,
Bigfoot Biomedical...And Many More!
PLUS TWO INTERACTIVE POST CONFERENCE WORKSHOPS WEDNESDAY 16TH SEPTEMBER 2020 | VIRTUAL CONFERENCE: ONLINE ACCESS ONLY
A: A Notifi ed Body roadmap to Article 117 and pre-fi lled syringes regulatory strategy
Workshop Leader: BSI08.30 - 12.30
B: Human Factors and Risk ManagementWorkshop Leaders: Denise Forkey, Senior Human Factors Engineer, Userwise
Miles Buroker, Human Factors Engineer, Userwise13.00 - 17.00

104American Pharmaceutical Review | July/August 2020
Kevin Williams
Biomerieux
LAL and rFC Comparison Study Caveats
If we want to scientifically understand the dynamics of LAL and rFC in terms of equivalency, then we must be able to sort out some conflicting data. Five broad claims have been made by a single LAL manufacturer against rFC which suggest that rFC underestimates endotoxin content. Here these five broad claims are refuted:
a. Natural and non-microbiologically controlled water sources are an inappropriate matrix to demonstrate equivalence due to the LAL false positive Factor G pathway.
b. Data that shows lower endotoxin results for rFC versus LAL invariably is derived from non-microbiologically controlled water including deionized water.
c. LAL results do not always give the true answer in the presence of beta-glucans (βG), cellulosic residues or surfactant/zwittergent. Importantly, beta-glucan blocking buffers (βGBB) cannot completely negate these effects.
d. Despite a recent LAL manufacturer’s claim that Factor B is needed in addition to Factor C to detect endotoxin, there is a simple proof that Factor C is the lone biosensor for endotoxin.
e. The compendial validation requirements are contained in USP <1225> and require that such efforts are “fit for use” in that only drug products and substances going into injectable drug products are subject to endotoxin validation.
a). Natural and non-microbiologically controlled water sources are an inappropriate matrix to demonstrate equivalence due to the LAL false positive Factor G pathway.
The testing for endotoxin in pharmaceutical manufacturing begins with the testing of purified waters.1 Naturally sourced and non-microbiologically controlled water sources including pre-filtration, carbon filtration or deionized water are not tested for endotoxin by pharmaceutical manufacturers. These waters remain largely uncharacterized in terms of microbiological content. Contents that affect a blood-based test like LAL includes various organic substances including glucans, cellulose, surfactants and detergents, all of which may skew test results. In many cases, such tests are in effect non-reproducible given that they are based upon a point in time that includes the uncontrolled environment from which they have come. Fungi which contain beta-glucans in particular are ubiquitous in the environment as responsible for the breakdown of organic materials in the ecosystem.
It is well documented that the potential contaminants sometimes found in pharmaceutical waters comes from biofilm2 present in purified water systems which is not the same thing as natural water contaminants that contain uncharacterized organic and microbiological substances in addition to endotoxin including beta-glucans and cellulosic residues. Most importantly, purified waters are monitored for total organic carbon (TOC) whereas potable waters including DI are not.
VENDOR VIEWPOINT
Kevin Williams spent 30 years at Eli Lilly & Company developing endotoxin assays
and detection technology in the QC lab. He then worked at Hospira(now Pfizer), Lonza, GE Water before moving to bioMérieux. He
has authored several books on endotoxin (Endotoxins second and third edition,
Informa) including, most recently Endotoxin Detection and Control in Pharma, Limulus, and
Mammalian Systems(2019, Springer Nature).

Sandle in “Characterizing the Microbiota of a Pharmaceutical Water System-A Metadata Study”3 conducted a fifteen year study of the microbiological quality of the three main types of waters listed as:
1. Potable water sources (mains) > deionized – Bacteria are not the only microorganisms that inhabit source waters; there will be a complete ecosystem in operation which includes fungi, protozoans and algae.
2. Purified water – product of reverse osmosis – biofilm and low level contaminants are Gram Negative bacteria.
3. WFI - Water-for-Injection systems – almost no contaminants (endotoxin or bacteria)
Potable water is a natural feed water for purified and WFI water but is not controlled according to injectable drug standards (no endotoxin testing) and, importantly, is neither microbiologically or TOC controlled and contains beta-glucans as organic matter.
Sandle reviewed the quality of the various water classes (potable, purified, and WFI) in an extensive 15 year study. He described the water microbiological quality by water type. Bold added to highlight microbiological limits.
• Potable: Over the period of review, 1,040 samples were taken. Samples typically recovered microorganisms although few samples (201) were above the action level of 30,000 Colony Forming Units (CFU)/100 ml.
• Purified: The process of manufacturing the purified water was via reverse osmosis. For the study, 6,300 samples were tested. Of these, some 315 samples exceeded the action level of 100 CFU/100 ml (5%) and 347 isolates were recovered. The most common genera were “Pseudomonad type” organisms, with Ralstonia being the most prevalent.
• WFI: Few microorganisms are typically recovered from Water-for- Injection (WFI) systems. This is due to the nature of the method of producing the water (either reverse osmosis or distillation of purified water) and the distribution of the water, where the water is typically held at 80°C or higher..
· The review of data for the fifteen year time period shows that samples rarely exceed the specification for the water system (which is set by the pharmacopeia at 10 CFU/100 ml).
· Gram-negative bacteria are arguably the primary contaminants of WFI. From the 46,800 samples taken during the review period, only 300 samples detected Gram-negative rods (a rate of 0.6%) Of these 300 samples, 439 Gram-negative rods were recovered (less than two different organisms per sample.)
To aid the understanding of the microbiological quality of potable water Wenfa Ng4 gives a good visualization of the prevalence and variety of potable water contaminants, including DI water as shown in Figure 1.
VENDOR VIEWPOINT
105American Pharmaceutical Review | www.americanpharmaceuticalreview.com
Figure 1. Microbes were recovered from deionized and tap water in significant numbers (with 0.1 g/L yeast extract) at 30°C after multiple days of incubation. From Ng, CC 3.0.
False activation of LAL via βG’s and cellulosic residues in portable water is inevitable and is not a phenomenon seen in purified and WFI waters. The additional cascade factor G activates the LAL clotting cascade via proclotting enzyme separate from endotoxin activation via Factor C.5
(b) Data that shows lower endotoxin results for rFC versus LAL invariably is derived from non-microbiologically controlled water including deionized water.
Data that has been used to demonstrate non-equivalence is from non-microbiologically controlled waters such as pre-filtration, carbon filter or deionized water. The often referenced Kikuchi study6 used both purified water containing naturally occurring endotoxins (NOEs) as well as naturally sourced waters (river, lake and sewer). This later set of waters has been repeatedly referenced by those desiring to show non-equivalence. But does it really show non-equivalence?
In terms of the recovery of specific bacterial types in purified water, the Kikuchi study showed similar recoveries for all organisms. There were some instances where LAL recovered more and some where rFC recovered more but results are overall comparable. Significantly, where one method set was better than the other the differences within the recoveries for the specific organism and methods showed significant divergence (LAL vs. LAL and rFC vs.rFC). These comparisons are shown in Table 1.
A couple of the organisms that appear to give better recovery using LAL are shown below: E. coli J5 and E. coli O111. Five of the six values for each data set agree except for the one over-recovery by one of the LALs using ES-II (turbidimetric). The issues that rFC cannot resolve is that one LAL doesn’t agree with another LAL or when LAL values are pushed up by the presence of βG’s or cellulosic residues.
The next Kikuchi table (Table 2) below (Table 3 here) used NOE as added to purified water (rows 1-5) and also various “natural waters” including those from rivers, lakes, and sewage (rows 6-11). The consistency and equivalence of the data can be seen intuitively without statistical analysis for both sets. The simple averages are provided in Table 4.
From derived Table 4 below we can see that LAL and rFC determinations for NOE in purified water agree while the values obtained when

testing endotoxin in natural waters tend to show higher endotoxin values with LAL relative to rFC. This can be attributed to the presence of βG’s, cellulose, and/or surfactant/detergents in natural waters. According to Roslansky and Novitsky7 the presence of any of these can contribute to an increase in sensitivity of LAL response due to the Factor G pathway. Blood systems, even of primitive animals, are extremely complex matrices and likely contain a dozen proteins (8 of which are known to be part of the LAL cascade).a The contention that the use of βGBB’s can block all non-endotoxin reactivity in the LAL cascade will be examined in the next section.
The Endospecy product which does not contain Factor G shows signifi cantly lower results than either the ES-II or KQCL LAL values indicating that these samples likely do contain β-glucans which makes the ES-II and KQCL values likely infl ated. In general, the NOEs in purifi ed waters produce very close recoveries (LAL vs. rFC) whereas NOEs in natural waters typically show more activity with LAL for the reasons discussed here. Bolden and Smith also demonstrated the equivalence of rFC and LAL using purifi ed water relevant bacteria in actual pharmaceutical buff er systems.8
c). LAL results do not always give the true answer in the presence of beta-glucans (βG), cellulosic residues or surfactant/zwittergent. Importantly, beta-glucan blocking buff ers (βGBB) cannot completely negate these eff ects.
Lost in the sudden deluge of comparability data intending to compare LAL to rFC are the inherent diff erences seen when comparing various LAL results. Similarly to the results shown in Table 2 above, LAL often can be seen to diff er LAL to LAL, and often to a degree equal to or larger than the diff erence seen between LAL and rFC test comparisons. Invariably, the data used to claim non-equivalence comes from non-microbiologically controlled water sources and, in some cases, uses a limited set of LAL types that are expected to better agree with each other.
More research is needed on βGBB effi cacy in overcoming LAL false positive results and the widespread use of a “glucan blocking buff er”. It is mostly assumed by industry participants that βGBB will provide 100% knock out of the eff ects of βG’s when using LAL. However, the study by Roslansky and Novitsky showed that the method
VENDOR VIEWPOINT
106American Pharmaceutical Review | July/August 2020
aIncluding the following proteins: Factor C, Factor G, Factor B, proclotting enzyme, coagulogen, and the three serine protease inhibitors LICI 1, 2, and 3.
Table 1. From Kikuchi et al. Diff erent NOEs and Endotoxin recovery
Table 2. Derived from Kikuchi Table 1 shows the upward bias formed from a single LAL type.

of extraction of lysate during LAL manufacture either by using chloroform extraction, addition of zwittergent (surfactant) or both, has a signifi cant eff ect on both endotoxin and glucan sensitivity and causes LAL results to diff er signifi cantly from one another.
Furthermore, the addition of cellulosic residues from naturally sourced waters adds an activity that is diff erent from that of conventional 1,3-D-β-glucan. This was seen in the Roslansky and Novitsky study where the test recovery is seen to diff er depending upon the anti-glucan enzyme treatment used glucanase (1,3 beta glucans) or cellulase (1,4 beta glucans). Cellulosic residues can be expected to occur in natural source waters as the breakdown products of fungi, grass, wood, and various other plant derived materials. The issue of cellulosic breakdown products was fi rst seen in pharmaceutical manufacturing samples and called LAL reactive material (LRM). The blocking of 1,3 beta glucans is not the same as the blocking of 1,4 beta glucans as represented by cellulose in the Roslansky and Novitsky study.
Some maintain that only 1-3 β-D glucans are LAL reactive and that cellulosic residues are not. However, Henne et al. showed that “aqueous extracts of cellulose hollow fi bers (CHF) exhibit positive reactions in some Limulus amebocyte lysate (LAL) tests”, where “oxidative or acidic degradation of cellulose does not result in the formation of LAL-reactive material (LAL-RM). On the other hand, sterile cotton wool shows LAL reactivity, and cellulose acetate regains LAL reactivity when it is saponifi ed. Thus, it appears likely that the
LAL-RM found in CHF is of purely cellulosic origin and cross reacts
with a number of commercially available lysates.”9 Nagasawa et al.
draw a similar conclusion: “we cannot predict the biological activity
of (1-3) β-D-glucan from cellulose materials, because its structural
features are not clear.”
VENDOR VIEWPOINT
107American Pharmaceutical Review | www.americanpharmaceuticalreview.com
Table 3. Naturally occuring endotoxin (NOE)パネルによるライセート試薬と組換え試薬の評価naturally occurring endotoxin 測定値(EU/mL)*1
no. 由来 native endotoxin Endospecy ES-II Kinetic-QCL Pyrosmart PyroGene EndoZyme
1 Escherichia coli 543 621 554 404 818 743
2 Enterobacter clocae 897 1329 1176 298 1287 1098
3 Psuedomonas aeroginosa 2400 4141 2768 2840 3376 2456
4 Rastonia picketti 214 360 254 92 454 244
5 Serratia marcescens 400 504 447 108 459 312
水 (Water)
6 湖沼水 (Pond) 95.6 100.7 139.5 62.7 72.0 35.3
7 河川水 1 (Amata river) 222.0 247.6 295.0 244.5 231.0 134.0
8 河川水 2 (Nagase river) 204.5 284.4 303.5 82.5 198.5 98.0
9 生活排水(家庭排水用浄化槽) (Septic Tank) 111.0 160.3 164.0 86.0 138.0 77.9
10 市販ミネラルウォーター (Mineral Water) 0.114 0.116 0.140 0.088 0.034 0.030
11 水道水 (Tap Water) 8.105 10.964 14.820 10.285 4.830 1.295
*1 2 機関の平均値
Table 4. Averages derived from Kikuchi et al. Table 2. rLAL is a recombinant product that contains all the cascade proteins rather than just Factor C as in rFC.
NOE AveragesEndospecy (LAL with no Factor G) ES-II (LAL) KQCL (LAL) Pyrosmart (rLAL) PyroGene (rFC) EndoZyme (rFC)
890.8 1391 1039 748.2 1278.8 970.6
In Purifi ed water 1215 1124.7
In Natural water 106.8 134.0 152.8 81.0 107.3 57.7
Figure 2. Cellulose is a (1-4) β -D-glucan composed of repeat glucose units (left). β-glucans are (1-3) β-D-glucans connected at carbon atoms 1 and 4 (right). Cellulase breaks the cellulosic bonds while laminarinase/glucanase breaks (1-3) β -glucan bonds rendering them LAL inactive. Alternatively, βGBB seeks to displace 1-3 β-D-glucans by occupying the Factor G receptors in LAL. There are a myriad variety of forms of glucans (branching etc.) and one can expect some natural forms to have higher affi nity to Factor G than the common forms used in blocking buff ers.

The Roslansky and Novitsky study presents compelling evidence that one LAL does not always equal another LAL. This can be seen in reactivity to both various Glucans as well as Zwittergent content as commonly added to LAL in the LAL manufacturing process.
In Table 5, the 0.02% and 0.03% zwittergent conc. shows that the diff erence in LAL recovery is 1.56 versus 6.25 pg/ml (a four-fold diff erence). At 0.04% zwittergent content, the endotoxin recovery for the same LAL test has swelled to 25 pg/mL a 16X diff erential versus that containing 0.03% zwittergent.
Roslansky and Novitsky describe the LAL activity of cellulose residues as a separate phenomenon from that of (1-3) β-D Glucans:
By using the gel-clot method and Pyrotell, the activity of LAL-RM was reduced from 10 to 0.125 ng/ml after digestion with cellulase. The amount of activity left could be attributed to the intrinsic endotoxin contamination of the cellulase, since water plus enzyme had activity nearly identical to that of the digested LAL-RM. Cellulase had no eff ect on endotoxin. This enzyme reduced the activity of laminarin from 8,000 to 2,000 ng/ml and, therefore, is most likely contaminated with a trace amount of a P-(1,3)-hydrolase. The digestion experiments support the contention that LAL-RM is a glucan with primarily β-(1,4) linkages and that it is diff erent from laminarin, which has predominantly β-(1,3) linkages.
LAL reactive material was also found to be associated with hemodialysis and dialyzer fi ltration and identifi ed as a cellulose-derived mixture.11,12
A simple set of data generatedb using today’s available LALs supports the fi ndings of Roslansky and Novitsky as shown in Table 6. A natural local water was tested by rFC and three diff erent LALs with and without βGBB. Enzymatic treatment of the water prior to LAL testing was also performed in lieu of βGBB, as per the method described by Roslansky and Novitsky. This included treatment with either
VENDOR VIEWPOINT
108American Pharmaceutical Review | July/August 2020
glucanase or cellulase. The results show the exaggeration of results using LAL when testing natural water due to glucan and/or cellulose eff ects. The use of βGBB for natural (source) waters only reduces a fraction of the non-endotoxin eff ect. The dynamics shown here rarely if ever come into play in pharmaceutical manufacturing because non-microbiologically controlled waters are never tested except as requested by LAL suppliers for rFC – LAL equivalence studies.
A second simple experiment shows, via a diff erent method, that natural waters are not a suitable matrix for comparison studies. LAL
Table 5. Eff ect of increasing Zwittergent concentrations on sensitivity to endotoxin and laminarin by using Pyrotell and MAL-
style LAL. Note that the MAL-style LAL refers to LAL containing Zwittergent. A very low amount of zwittergent can inhibit LAL glucan reactivity whereas increasing concentrations clearly will
enhance it.
Sensitivity (pg/ml)a
Zwittergent conc. (%) MAL-style LAL Pyrotell
Endotoxin Laminarin Endotoxin Laminarin
0.0 6.25 2,500 6.25 <8000
0.01 3.125 16,000 6.25 <8000
0.02 1.56 1,000,000 6.25 16,000
0.03 1.56 2,500,000 6.25 5,000,000
0.04 25 50,000,000 NDb ND
aSensitivity is the minimum conc. of endotoxin or laminarin to give a positive gel-clot endpoint.bND, not done.
Figure 3. Enhancement of standard endotoxin lines by three concentrations of curdlan: 250 ng/mL (+), 25 ng/ml (), and 2.5 ng/ml (). No curdlan was added to the standard line (). Endotoxin standards were spiked with curdlan and were assayed by the kinetic turbidimetric method. Derived from Roslansky & Novitsky.
Table 6. It is instructive that all three LAL results after enzymatic treatment end up at the level that was obtained initially by rFC.
Natural Water Reactivity (EU/mL)
No treatment (1:1000 LRW)
β-Glucan Blocking Buff er Added
Pre-treated w/Glucanase treatment
Pre-treated w/Cellulase treatment
rFC 74.2 NA NA NA
LAL 1 254 208 107 104
LAL 2 559 375 212 48.8
LAL 3 426 337 112 79
bpreliminary data being followed up on in a larger study

gave an initial result of 28.3 EU/mL. After addition of 100 EU/mL of RSE the test was performed again and the result was 464 EU/mL. Use of βGBB reduced the result slightly to 326 EU/mL, but glucanase treatment of this sample prior to addition of the 100 EU/mL RSE gave 133 EU/mL.
However, when rFC was tested an initial value of 18 EU/mL was obtained. When 100 EU/mL of RSE was added to this water and the test was repeated, the result was 132 EU/mL.
The synergistic eff ects of natural water containing glucans on endotoxin are obvious. Eff orts to confound equivalency tests and present the data as “pharmaceutically relevant” should be viewed as purely commercial. The variance seen is not because the endotoxin is “natural” or “purifi ed” endotoxin as here both have acted similarly. This is not a matter of rFC “under detecting” endotoxin, rather it is the case of LAL exaggerating the results due to beta-glucan-endotoxin synergistic eff ects, an eff ect which does not occur in the testing of purifi ed waters.
d) Despite a recent LAL manufacturer’s claim that Factor B is needed in addition to Factor C to detect endotoxin, there is a simple proof that Factor C is the lone biosensor for endotoxin.
Most recently one LAL manufacturer has made the claim that not only Factor C but also Factor B is needed for detecting endotoxin. The longstanding view is that Factor C is the lone natural “biosensor” for endotoxin. There are more than a few contradictions in this new view (that you need Factor B to detect endotoxin) but there is a simple explanation as to why it is false.
VENDOR VIEWPOINT
109American Pharmaceutical Review | www.americanpharmaceuticalreview.com
Figure 4. Large granules within the amebocytes contain all the Limulus clotting cascade factors(left). To release the factors, Factor C exists on the granulocyte surface. When Factor C contacts LPS then the contents of the granules are released into the hemolymph (called exocytosis). At right, the empty amebocytes after exocytosis (degranulation) are shown(right). From Armstrong.13
According to Wang, Ho and Ding: “Circulating Factor C derived from hepatocytes binds Gram-negative bacteria or LPS and triggers a further exocytosis of cellular Factor C from the large granules of amebocytes. The LPS activated Factor C initiates the serine protease cascade.”14 This can also be seen in the Koshiba et al. fi gure below. See also Cerenius and Söderhäll15 and as described here by Ariki et al.16
The exocytosis of clotting system components is initiated by the binding of LPS to the membrane-associated form of factor C. Factor C is an LPS-responsive serine proteinase zymogen. It is present, as are the other components of the cascade, in the large granules of hemocytes. In addition, this protein is present in discrete areas in the cell membrane. Binding in membrane-associated factor C results in the exocytosis of coagulation system components including more factor C. This activation has been likened to the activation of platelets by thrombin through proteinase-activated receptors.
The Koshiba et al. fi gure below shows that it is the interaction between Lipid A and the “tripeptide motif” of Factor C that utilizes the precise spacing of tryptophan and lysine hydrophobic amino acids that is responsible for endotoxin detection. Signifi cantly, Factor B is not released until Factor C exocytosis brings about the release of LAL cascade factors from the large granules in Limulusblood. Therefore, it is Factor C that is the biosensor that determines if endotoxin is present in the hemolymph milieu before Factor B is even released into the milieu. If Factor B were needed to bind endotoxin, then the release of cascade factors could not occur.
The old adage that “correlation is not causation” applies here. If Factor B touches Factor C during LPS binding (after it has been let out of the
Table 7. LAL versus rFC testing in a natural water matrix. Samples for LAL testing must be vigorously treated for natural and non-microbiologically controlled waters to give accurate endotoxin results.
Natural Water Matrix Reactivity (EU/mL)
Reagent Initial Endotoxin measurement After Addition of 100 EU/mL (LPS) Using β-Glucan Blocking Buff er Using Glucanase
LAL 28.3 464 326 133
rFC 18 132 NA NA
Figure 5. from Koshiba et al.17 Model of bacterial recognition by Factor C. The recognition of LPS on Gram-negative bacteria by membrane-bound Factor C initiates the horseshoe crab innate immune response by releasing all cascade factors into the hemolymph.

granule by Factor C) that does not suggest that rFC numbers should be lower than LAL numbers (the purpose for proposing the idea in the first place). In fact it suggests the opposite, namely as Masakazu Tsuchiya stated in his article18 it would make LAL more selective than rFC and thus would bind fewer not more LPS molecule types: “These findings suggest that the role of Factor B in the cascade system is not only to activate proclotting enzyme, but to increase specificity of LAL to endotoxin.”
e). Compendial validation requirements are contained in USP <1225> and require that such efforts are “fit for use” in that only drug products and substances going into drug products are subject to validation.
Validation efforts should be “fit for use” or “fit for its intended purpose”19 in that the validation pertains to that which is to be tested routinely. Non-microbiologically controlled waters are not a part of routine endotoxin testing. Significant efforts have gone into validating the various commercial rFC products now available including supplier validations as well as numerous drug manufacture performed validations, some of which have resulted in FDA approval for marketed end-products. These validation efforts do not employ river, lake, sewer, pre-filtration, carbon bed, or deionized water which are not within scope for endotoxin testing in pharmaceutical manufacturing. Science, by definition, must be reproducible, otherwise, it is dependent upon the single anecdotal instance from which it was generated. This is to say that the content of non-microbiologically controlled water will vary greatly. Scientifically, validation test materials must be highly characterized and provide a reproducible matrix for confirmatory studies as well as support the actual articles to be placed under routine test.
According to USP General Notices 3.10.10:
Applicability of Standards to Drug Products, Drug Substances, and Excipients
The applicable USP or NF standard applies to any article marketed in the United States that (1) is recognized in the compendium and (2) is intended or labeled for use as a drug or as an ingredient in a drug.
Natural and other non-microbiologically controlled waters do not fit into a relevant category for compendial testing. Endotoxin test users are free to follow existing compendial requirements for validation of relevant articles including purified waters as stated in USP <1225> to validate their products for routine test or may follow EP 2.6.32 which, like USP <85>, requires only product suitability testing (inhibition / enhancement testing). The addition of a new USP informational-only endotoxin chapter will not alter USP <1225> requirements.
ConclusionThese studies taken together make it clear that the testing of non-microbiologically controlled waters using various LALs cannot produce a “gold standard” result, even when using βGBB, due to the background presence of beta-glucans. Purified waters which are monitored for TOC do not have this organic backdrop. The temptation
VENDOR VIEWPOINT
110American Pharmaceutical Review | July/August 2020
to include data from source waters in an effort to compare “natural endotoxin” should be resisted or should at least include enzymatic treatment of such waters given that βGBB provides only a partial reduction of non-endotoxin effects on LAL. The testing of purified waters provides the appropriate test matrix to achieve “gold standard” results when endotoxin test comparisons are desired.
References1. Water for Pharmaceutical Use, FDA, current as of 08/27/2014, accessed 07/09/2020.
2. Tim Sandle, The Problem of Biofilms and Pharmaceutical Water Systems, Amer. Pharm. Rev., Friday, December 22, 2017, accessed July 9, 2020.
3. Sandle T (2015) Characterizing the Microbiota of a Pharmaceutical Water System-A Metadata Study. SOJ Microbiol. Infect Dis 3(2): 1-8.
4. Ng W. 2018. Microbes in deionized and tap water: Implications for maintenance of laboratory water production system. PeerJ Preprints 6:e181v6 https://doi.org/10.7287/peerj.preprints.181v6.
5. Hodes, D. S., D. Heon, A. Hass, A. C. Hyatt, and H. L. Hodes. 1987. Reaction of fungal products with amebocyte lysates of the Japanese horseshoe crab, Tachypleus tridentatus. J. Clin. Microbiol. 25:1701-1704.
6. Kikuchi et al., Collaborative study on the bacterial endotoxins test using recombinant Factor C-based procedure for the detection of lipopolysaccharides, Pharm. And Med. Device Regulatory Science, Vol. 48, No. 4, 252-260 (2017).
7. Roslansky and Novitsky, Sensitivity of Limulus amebocyte lysate (LAL) to LAL-reactive glucans, Associates of Cape Cod, Inc., Box 224, Woods Hole, Massachusetts 02543, JOURNAL OF CLINICAL MICROBIOLOGY, Nov. 1991, p. 2477-2483.
8. Application of recombinant Factor C reagent for the detection of bacterial endotoxins in pharmaceutical products, Bolden and Smith, PDA Journal of Pharmaceutical Science and Technology September 2017, 71 (5) 405-412.
9. Henne et al., Hollow-fiber dialyzers and their pyrogenicity testing by Limulus amebocyte lysate, Artificial Organs, Aug;8(3):299-305, 1984.
10. Nagasawa et al., Experimental proof of contamination of blood components by (1-3)-β-D-glucan caused by filtration with cellulose filters in the manufacturing process, Jour. Artificial Organs (2003) 6:49–54.
11. Pearson FC, BohenJ, Lee W, Bruszer G, Sagona M, Dawe R, Jakubowski G, Morrison D, Dinarello C. Comparison of chemical analyses of hollow-fiber dialyzer extracts. Artificial Organs 1984; 8: 291- 298.
12. A Study on Limulus Amebocyte Lysate (LAL) Reactive Material Derived from Dialyzers,YOSHIOKA et al., Japanese Jour. Surgery, VOL 19, No. 1 pp. 38-41, 1989.
13. Peter B. Armstrong, MOTILITY OF THE LIMULUS BLOOD CELL, J. Cell Sci. 37, 169-180 (1979).
14. Wang, Ho and Ding, Transcriptional Regulation of Limulus Factor C, THE JOURNAL OF BIOLOGICAL CHEMISTRY, Vol. 278, No. 49, Issue of December 5, pp. 49428–49437, 2003.
15. Lage Cerenius Kenneth Söderhäll, Coagulation in Invertebrates, Journ. Innate Immunity, Published online: November 6, 2010, accessed 7/11/2020.
16. Ariki et al., A serine protease zymogen functions as a pattern-recognition receptor for lipopolysaccharides, Proc Natl Acad Sci., 2004, Jan 27;101(4):953-8.
17. Takumi Koshiba, Tomoyuki Hashii, and Shun-ichiro Kawabata, A Structural Perspective on the Interaction between Lipopolysaccharide and Factor C, a Receptor Involved in Recognition of Gram-negative Bacteria, . THE JOURNAL OF BIOLOGICAL CHEMISTRY VOL. 282, NO. 6, pp. 3962–3967, February 9, 2007.
18. Masakazu Tsuchiya, INNOVATIVE MECHANISM OF LIMULUS AMEBOCYTE LYSATE ACTIVATION TO ACHIEVE SPECIFICITY AND SENSITIVITY TO ENDOTOXIN; COMPARISON WITH RECOMBINANT FACTOR C REAGENTS, Microbial Solutions, Charles River, Charleston, SC, USA, International Journal of Development Research Vol. 10, Issue, 06, pp. 36751-36756, June, 2020.
19. Analytical Procedures and Methods Validation for Drugs and Biologics Guidance for Industry, Guidance for Industry, FDA (HHS/CDER/CBER) 2015.

October 13-15
2 0 2 0For 2020, BIO Investor Forum will transition to a comprehensive three-day virtual education
and partnering event to support biotech innovators, helping them find investors and strategic partners to advance their company to the next stage in their business life cycle.
3-Day BIO Investor Forum Digital will feature: Three days of enhanced BIO One-on-One Partnering™,
including a new, flexible meeting scheduling capability for business development networking.
Two days of interactive educational sessions, with speaker Q&A, focused on the most pressing industry topics including COVID-19, Infectious Diseases/ Vaccines, Oncology, Business Development, Election Outlook, and more.
A library of on-demand company presentations, showcasing a company’s pipeline, R&D activities, and fundraising goals.
The BIO SPARK Showcase will spotlight early stage assets from the university setting.
Enhanced networking featuring informal small group and face-to-face video interactivity.
Access to an increased global investor audience.
Complimentary registration is available for investors.For more information and to register for the event, please go to bio.org/investorforum.
topics including COVID-19, Infectious Diseases/ Vaccines, Oncology, Business Development, Election Outlook, and more.
Enhanced networking featuring informal small group and face-to-face video interactivity.
Access to an increased global investor audience.
NeoplasmAll OthersMusculoskeletal diseaseGenetic disorder
Psychiatric disorderOcular disease
Genitourinary disease
Respiratory disease
Metabolic disorder
Hematological disease
Degeneration
Endocrine disease
Dermatological diseaseImmune disorder Gastrointestinal disease
Neurological disease
Infectious disease
Inflammatory disease
Cardiovascular disease
14%7%
8%
7%
7%6%
6%6%5%5%
4%4%4%4%3%3%
3%2%2%
Companies by Primary Therapeautic Area:
ACCELERATE Discovery. AMPLIFY Returns.

EQUIPMENT
FOCUS
Single-Use, Closed-System Sampling Solution
The OmniTop Sample Tubes® Adjustable Vol-ume Sampling System (AVSS) lowers contami-nation risk and greatly reduces volume loss by enabling technicians to collect an exact amount of media needed to perform routine sampling in bioprocessing operations. This patent-pending system is designed for high-integrity product sampling applications such as monoclonal antibodies (mAbs) and cell and gene therapy processes, as well as final fill operations. The OmniTop Sampling Sys-tem (AVSS) standardizes the bioprocessing sampling process, contributing to increased processing efficiency that enables faster speed to market and implementation by multiple re-search or testing facilities.
Avantor
www.avantorsciences.com
High Pressure Reactor
The Asynt Multicell Parallel High Pressure Reactor is a cost effective lightweight unit fabricated in 316 Stainless Steel suitable for numerous stirred or non-stirred applications. These include hydrogenations and applica-tions where air sensitive materials are used or any other reaction where pressure or tem-perature are required. As standard these offer the user the ability to screen 10 x 30 ml reac-tions at pressures of up to 50 bar and up to 200C, all at the same pressure and tempera-ture. Upgrades to the system to cover a wider range of requirements:
• Higher pressures to 100bar
• Temperatures to 350 °C
• Individual temperature control for each reactor cell
• Alternative materials, Hastelloy, Inconnel for example.
• Larger volumes (4 positions) to 150 mL
• Sampling under pressure
• Additions under pressure
• Individual pressure setting for every reactor cell.
Asynt Ltd
www.asynt.com
Portable Transmission Raman Spectrometer
The QTRam® is a powered by the company’s patented STRaman® technology optimized for rapid and nondestructive quantitative analysis and is ideal for content uniformity testing of finished products such as tablets and capsules. The updated QTRam is a compact, portable transmission Raman for content uniformity testing that can measure multiple compo-nents with one spectrum. Enhancements have been made to the compliant BWAnalyst® software run on the touch-friendly embedded tablet computer. The newest software update follows an intuitive workflow and includes Ra-man shift calibration.
B&W Tek LLC
www.bwtek.com
Live-Cell Imaging System
The CytoSMART Lux2 Duo Kit offers a straight-forward, cost-effective solution for researchers carrying out immediate side-by-side compari-sons between cell cultures. The CytoSMART Lux2 – Duo Kit is a compact automated sys-tem, specifically designed to operate from within CO2- incubators and hypoxia cham-bers. Two devices operate via a single laptop, saving precious lab space. Gathering real-time insight into the progression of cell growth is now completely non-invasive. Bright-field imaging is deployed to create real time time-lapse videos, accessible remotely. Samples are also imaged under identical conditions, providing a robust platform for unambiguous comparison between cell culture variables, re-taining data integrity."
The main features and benefits of the Cy-toSMART Lux2 Duo Kit include:
• Two sample stages for simultaneous side-by-side comparison
• Non-invasive, label-free image analysis
• Full remote access, no need to enter the lab to inspect cell cultures
• Cost effective solution: two imaging devices connected to one laptop, including unlimited storage
CytoSMART
www.cytosmart.com
112 | | July/August 2020

EQUIPMENT
FOCUS
www.americanpharmaceuticalreview.com | | 113
Tangential Flow Filtration System
The Minimate™ EVO TFF system allows high productivity, reproducibility, and simple con-trol compared to stirred-cell technologies. The Minimate system is designed for highly reliable buffer exchange or protein concentration of samples up to 1 liter. In tests, the Minimate TFF system was able to concentrate a 1-liter protein solution five times faster than a comparable stirred-cell system. This finding was confirmed by an independent researcher for the purifica-tion of the Cyclooxygenase-2 enzyme resulting in a reduction in processing time over three-fold without the loss of protein activity. The Minimate EVO system’s improvements over the first-generation Minimate include accurate transmembrane pressure (TMP) differential calculations with the integrated upstream and downstream pressure gauges. This allows great-er user control and easier validation. In addition, the Minimate EVO features improved stirring, more durable tubing and connections, and overall easier setup and operation. The Mini-mate EVO system includes a variable-speed, roller-head peristaltic pump for gentle process-ing, two pressure gauges, valves, tubing, and 500 mL reservoir with a magnetic stir bar and stir plate -- all assembled on a compact drip tray.
Pall Corporation
www.pall.com
Benchtop Pure Water Solution
Company has redesigned its benchtop pure water solution, launching the Milli-Q® IX 7003/7005/7010/7015 Type 2 water purifica-tion system. The system provides laboratories with a reliable and consistent source of high-quality pure water that meets the require-ments of both critical applications, such as for microbiology culture media, as well as general uses, including preparing buffers and rinsing glassware. Water from the system can also feed equipment and instruments, making it an ideal and versatile solution for most laborato-ries. Milli-Q® IX pure water system can have full confidence that water is not a variable in their analyses. Powerful purification technologies, an intelligent pure water storage solution, and convenient quality monitoring at the point of dispense supports scientists in achieving reli-able and reproducible results. In addition, in-tegrated data management automatically se-cures data and provides rapid data access and full traceability for audits.
MilliporeSigma
www.sigmaaldrich.com
Bacterial Endotoxins Testing (BET) Platform
The Eclipse platform decreases assay setup time by up to 85% and reduces Limulus Ame-bocyte Lysate (LAL) reagent use by up to 90% while meeting all requirements of the harmo-nized pharmacopoeia: USP <85>, EP 2.6.14 and JP 4.01. Through new technology, the Eclipse platform significantly decreases pipetting steps, reduces operator-to-operator variability, and simplifies assay setup. The Eclipse platform leverages precise microfluidic liquid handling and embedded endotoxin to automate kinetic chromogenic assays. Throughput of 21 samples per plate is maintained without the complexity of robotics or the time and technique demands of a traditional assay.
SUEZ Water Technologies & Solutions
www.suezwatertechnologies.com
High-Resolution Mass Spectrometer
The Orbitrap Exploris 240 mass spectrometer expands the proven Orbitrap Exploris platform and delivers mass accuracy, sensitivity and re-solving power across a wide dynamic range. With new-generation system architecture and instrument control software, the system provides simple yet powerful data acquisition capabilities, addressing the most demanding analytical challenges for small- and large-mol-ecule applications. The system offers positive/negative mode switching for comprehensive sample coverage, fast scan speeds and func-tionalities including the company’s AcquireX intelligent data acquisition workflow that en-able greater automation. Performance of the Orbitrap Exploris 240 mass spectrometer is further enhanced with access to powerful new software functionality to improve data acquisi-tion and processing:
Thermo Fisher Scientific
www.thermofisher.com

114American Pharmaceutical Review | July/August 2020
Michelle Neumeyer
Life Sciences Product Applications Specialist for the Sievers line of Analytical instruments
SUEZ – Water Technologies & Solutions
Process Analytical Technology and Real-Time TOC Testing of Pharmaceutical Grade Water Systems
Real-time total organic carbon (TOC) and conductivity testing enables optimized monitoring programs for pharmaceutical grade water systems. With online monitoring, manufacturers achieve better process control, efficiency gains, and risk management for CGMP processes.
Benefits of Real-time TOC Testing
• Reduce or eliminate costs, resources, contamination, laboratory errors, and delays in data associated with traditional grab sampling.
• Detect and remediate out-of-specification (OOS) or out-of-trend (OOT) results in real time.
• Demonstrate a continuous state of control and system validation.
• Document and predict trends, and use data to establish alert and action levels for a given system.
• Use total organic carbon, inorganic carbon, and conductivity data together for root cause analysis.
• Embrace US FDA Process Analytical Technology (PAT) Guidance for quality and efficiency gains.
• Leverage like-for-like TOC membrane technology to move from laboratory methodology to online technology.
The pharmaceutical industry demands lean processes and continuous improvement. Efficient processes allow for safe, high quality products to be available to patients when needed. The US FDA’s guidance document on Process Analytical Technology (PAT) not only describes how and when to deploy technology, it also strongly encourages manufacturers to embrace PAT within their systems. PAT gives continuous process understanding, process control, and efficiency gains to CGMP processes. When thinking about how to optimize the monitoring of pharmaceutical grade water systems, consider deploying PAT.
Total organic carbon (TOC) and conductivity monitoring are crucial aspects of purified water system quality and control. Producing TOC and conductivity data in real time using PAT ensures a controlled and understood process while saving sampling and analysis time. Pharmaceutical grade water is integral to safe and effective medicine and is often in use throughout multiple shifts of manufacturing drug product. Real-time monitoring of purified water systems ensures water in use for batches or equipment meets regulatory and internal quality requirements before, after, and at the time of use.
VENDOR VIEWPOINT
Michelle Neumeyer is the Life Sciences Product Applications
Specialist for the Sievers line of Analytical instruments at SUEZ – Water Technologies & Solutions. Previously,
Michelle worked in Quality at Novartis and AstraZeneca, ensuring compliant water
systems, test methods and instrumentation. Michelle has a B.A. from University of
Colorado, Boulder in Molecular, Cellular and Developmental Biology.

Process Analytical Technology (PAT) Process Analytical Technology (PAT) guidance is a nonbinding
FDA document that encourages innovation and quality in CGMP
manufacturing. The key advantage of PAT is building quality into
products while gaining efficiencies throughout the process. This
is accomplished with robust design, reliability, risk management,
and ease of use. Advantages of PAT allow for quality by design,
demonstrated validation, process understanding, and process control.
Understanding and controlling a purified water system requires the
ability to accurately and reliably measure quality attributes, and use
the data to make important quality decisions. From there, the water
purification process can be controlled and adjusted to maintain a
desired, validated state. Purified water systems that demonstrate a
high degree of process understanding and control provide inherent
quality gains. For example, when out-of-trend (OOT) or out-of-
specification (OOS) results are detected in real-time, inputs or water
system characteristics can be remediated before quality suffers.
When seeking ways to optimize pharmaceutical grade water systems,
consider embracing PAT guidance to deploy real-time TOC and
conductivity monitoring.
Real-Time TOC Data for Continuous Control and Root Cause AnalysisTotal organic carbon and conductivity testing are required for
pharmaceutical grade water systems used for CGMP manufacturing.
These analyses are governed by USP <643> and USP <645>,
respectively. Although these analyses are compulsory, they also
provide valuable data to manufacturers to reduce waste and increase
process efficiency, specifically when monitoring in real time with
online technology. Online TOC technology, especially technology that
provides total organic carbon, inorganic carbon, and conductivity
data together, enables accurately predicting and understanding
trends in a water system. Alert and action levels should be set based
on established historical data to demonstrate the utmost control of a
water system.
While USP <643> for Total Organic Carbon is in fact a limit test, it is
prudent to establish control specifications based off trending data. For
example, if a water system is consistently producing 50ppb water and
the online TOC analyzer starts measuring data points around 300 ppb,
it is still within the USP <643> acceptance limit of 500ppb. However,
this shows a deviation from the 50ppb trend. This may be within USP
specification, but it is a serious red flag showing the system is out of
trend and out of control. Without appropriate alert and action levels,
this excursion will go undetected. Furthermore, the underlying cause
of a 250ppb TOC increase from normal levels will go undetected
and the root cause will be neither identified nor remediated. Setting
appropriate alerts and action levels requires using validated and
quantitative TOC technology.
ValidationTo use PAT to its full potential, technology must be qualified, and
methods must be validated per USP and ICH requirements. Without
proper validation, the value of real-time data is lost. Equivalency studies/
comparability protocols are needed when moving from laboratory to
online, highlighting the verification and implementation approach.
It is important to have a documented implementation strategy for
demonstrating equivalency. From there, assess any discrepancies,
if applicable. For example, perhaps results are slightly different from
lab to online due to a change in temperature or the change in sample
handling. Observed changes may be acceptable for the method
transfer; however, these types of variances need to be acknowledged
and assessed. It is important to note that some methodology transfers
may be easier than others, based on the type of technology deployed.
If using conductometric TOC technology in the lab, method transfer to
online conductometric technology becomes simplified since they are
like-for-like technology.
While the FDA encourages PAT implementation, inspectors will
maintain the usual level of scrutiny and tailor it to the technology.
It is important to understand what makes for compliant technology
and a compliant process. PAT implementation needs to be able to
withstand the same level of inspection as any other CGMP process
especially when thinking about data integrity. Data integrity is
not a new concept, however, as electronic records and electronic
signatures have become the industry standard, there is more scrutiny
on data integrity compliance. Do your TOC and conductivity data
stand up to the requirements of ALCOA+ and 21 CFR Part 11? ALCOA+
is not the end all be all of data integrity, but challenging processes
and data management against these principles is certainly a good
place to start. Data generation and data management practices need
to be clearly defined and compliant to data integrity regulations
when deploying PAT.
SummaryWhen looking for process optimization and process improvement
opportunities for CGMP water systems, Process Analytical Technology
(PAT) should be considered for TOC and conductivity testing. The FDA
guidance document encourages manufactures to embrace PAT in
processes for quality and efficiency gains. Online TOC and conductivity
monitoring gives these quality and efficiency gains while offering
robust process understanding and control. Real-time data generation
and release eliminates or significantly reduces sample integrity issues,
quality control resources, laboratory errors, sampling costs, and delays
associated with traditional laboratory analysis of purified water. Finally,
improved process understanding allows for timely and detailed root
cause analysis, risk identification, risk mitigation, trend analysis, and
real-time detection of OOS or OOT results. There are myriad benefits
of using Process Analytical Technology and Real-Time TOC Testing for
Pharmaceutical Grade Water Systems.
VENDOR VIEWPOINT
115American Pharmaceutical Review | www.americanpharmaceuticalreview.com

EDITOR’S
TOP|TECH »
Laser Particle Sizer
The ANALYSETTE 22 NeXT operates like ev-ery FRITSCH Laser Particle Sizer with the pat-ented Reverse Fourier design which has es-tablished itself by now as a general standard. The Laser Particle Sizer operates with only one laser and does not need an additional light source even for backward scattering. Therefore it records the entire measuring range with only one scan. That makes your work significantly faster – you can conduct more measurements in the same time if necessary. And see live how the measuring result develops. The ideal method of prepa-ration for particle size measurement is the wet dispersion. With its cleverly reduced design and solid, robust engineering, the dispersion unit of the ANALYSETTE 22 NeXT is designed for an especially long service life and is practically maintenance-free. Doing completely without valves and moveable seals in the sample circulation system en-sures for example that no dead spaces occur and no sample material can accumulate and settle. A powerful centrifugal pump with in-dividually adjustable speed ensures stable measuring in the dispersion unit. To measure samples tending to agglomerate, simply add the optionally available high-performance ultrasonic box to the sample circuit.
FRITSCH GmbH • Milling and Sizing
www.fritsch.de
Smart Cap Pill Dispenser
Pill Connect was developed to prompt pa-tients to take their medications on time and to send a report back to the doctor to advise them of their patients adherence re-cord. The prompt comes from an app on their mobile phone which when acknowl-edged ejects a pill or capsule from the bot-tle through the dispensing cap. Should the patient not wish to take their medication due to illness or an adverse reaction they can respond through the app. The dispens-ing mechanism in the smart cap can be ad-justed to handle pills or capsules of differ-ent sizes. The dispensing cap can be made to fit on any size pill bottle. The app can be loaded onto android or apple phones.
Elucid Digital Health
https://elucid-mhealth.com
Self-Adjusting System for High-Precision Top Labeling
Now available on the company’s 452E Top La-beler, the novel system automatically adjusts on-product label position to ensure tight tolerances, even with particularly challeng-ing applications. With an output of up to 250 products per minute, the aesthetics-minded 452E Top Labeler is ideally suited for appli-cations in which final presentation and ap-pearance is paramount. The system works as follows: A camera first inspects the products after labeling, checking not only for the pres-ence of the labels but also their positioning. The data collected regarding the label posi-tion is subsequently used for fully-automat-ed adjustment of ensuing label applications. The tracking system can intervene to make corrections in two ways: It achieves the adap-tation in the run direction of the products by advancing or retarding the label start signal; in a lateral direction, it can readjust the two side belts that guide products using a linear servo motor.
HERMA GmbH
www.herma.us
Corrugated Crates
J-Crates are customized corrugated crating solutions that offer a bevy of benefits in-cluding reduced shipping costs, maximiza-tion of warehousing space, and increased sustainability. The J-Crate concept is simple: rather than the typical all-wood crate typi-cally used to transport large items, this solu-tion comprises a wooden base surrounded by sturdy yet pliable corrugated material. The lightweight shipper saves on transport costs and, since it can collapse to be barely wider than the base wood component, takes up exponentially less space than standard crates. Moreover, many countries charge fees for disposing of conventional wooden crates upon item delivery; J-Crates eliminate this cost as the materials can be recycled, re-purposed and reused several times over. The corrugated containers have been proven to keep even the most fragile items secure dur-ing transport, as the structure can withstand 4,000 lbs of pressure (the same amount as a standard wooden pallet).
PACT, LLC
www.pactww.com
»
116 | | July/August 2020

EDITOR’S
TOP|TECH »
www.americanpharmaceuticalreview.com | | 117
Sterile Deep Well Plates
Company offers an extensive range of sterile deep well microplates for sensitive biological and drug discovery applications. Deep well microplates are an important class of func-tional plasticware used for sample prepara-tion, compound storage, mixing, transport and fraction collection. They are widely used in life science laboratories and are available in different sizes and plate formats, the most commonly used being 96 well and 384 well plates made from virgin polypropylene. The range of high quality deep well plates are available in several formats, well shapes and volumes (240 µl up to 2.2 ml). In addition, for researchers working in molecular biology, cell biology or drug discovery applications, all Porvair deep well plates are available sterile to eliminate the risk of contamination. Porvair Sciences sterile deep well plates contain no contaminants that may leach out and affect stored sample or bacterial or cell growth.
Porvair
www.porvair-sciences.com
Syringe Filters
Acrodisc® syringe filters with universal water-wettable polytetrafluoroethylene (wwPTFE) membranes are designed for analytical instru-ment applications. The new syringe filter helps protect HPLC/UHPLC columns and instrumen-tation from particulate buildup, plus helps ensure accurate data. The versatile Acrodisc syringe filter with wwPTFE membrane is ideal for aqueous samples and solutions containing aggressive organic solvents. Accurate analysis is ensured with HPLC certification for low levels of UV-absorbing extractables. In addition, Ac-rodisc syringe filters with wwPTFE membranes’ universal use helps avoid the expense and in-convenience of keeping a variety of filtration products in inventory. Acrodisc syringe filters with wwPTFE are available in 13 mm and 25 mm. The 13 mm Acrodisc syringe filter is avail-able with a minispike outlet that offers low hold-up volume and easy filtration into autos-ampler vials. This feature filters four times as much sample with the same hold-up loss as a typical 4 mm filter.
Pall Corporation
www.pall.com/lab
Powder Filling Systems
The MicroRobot 50 microdosing machine is designed for filling cytostatic powders into vials. Three anthropomorphic robots ensure reliable processes protected by an isolator.The technology is particularly suited for dosing sticky or hygroscopic pharmaceutical powders with irregular shapes. It can also be used to fill sterile liquids. For high containment applica-tions up to level OEB 5, the Macofar MicroRo-bot 50 can be supplied with isolator technol-ogy. Alternatively, it can be configured with cRABS or oRABS for non-cytotoxic products.During the production process, three anthro-pomorphic robots transport the vials under an isolator to the dosing, stoppering and capping stations. Since the robots work independently of specific formats, the product change times are significantly shorter. The servo-driven transfer system generally reduces the concen-tration of particles in critical areas and with it the risk of contamination. Furthermore, thanks to the clearly structured system concept, the MicroRobot 50 is readily accessible and easy to clean.
Romaco
www.romaco.com
High-Performance Tandem Liquid Chromatograph Mass Spectrometer
The LCMS-8060NX triple quadrupole liquid chromatograph mass spectrometer (LC-MS/MS features world-class sensitivity and acquisi-tion speeds, increased robustness to minimize downtime, unparalleled ease of use for greater workflow efficiency and analytical intelligence functions to maximize laboratory output. New-ly developed ion-focus lenses, in the state-of-the-art integrated electrospray probe, propel ions into the LCMS-8060NX with the greatest of efficiency. Neutral particles are expelled to reduce noise and provide the highest stability. A new heat-assist design increases desolvation efficiency and promotes superior ionization of a wide range of compounds. Furthermore, the system’s unique UFsweeper technology effec-tively sweeps ions from the collision cell with-out deceleration, maintaining high-sensitivity analysis even at high acquisition speeds.
Shimadzu Scientific Instruments Inc.
www.ssi.shimadzu.com
»
Pharmaceutical
P.IP.IP .N. Points
N. oints
N. PointsPPatent Innovation News
118 | | July/August 2020
Sunny Christian M.S. (RA), Neelam Sharma, M.S. and Hemant N. Joshi, Ph.D., MBA*Tara Innovations, LLCwww.tarainovations.com and www.tara-marketing.com *[email protected]
The purpose of this column is to highlight and summarize recent key patents in the pharmaceutical arena issued by the US Patent Offi ce in April-May 2020.
Blister Package for Pharmaceutical Cartridges; M.S. Bergey; MannKind Corp., US; U.S. Patent # 10,625,034.; April 21, 2020. Blister packaging has been in use for years to protect products. In the pharmaceutical industry, blister packaging has been used to deliver tablets, capsules and powders. Generally, blister packs consist of a rigid base sheet having cavities and a cover sheet. An inhalation drug delivery system may include a cartridge containing dry powder formulation, which may be sensitive to degradation by moisture. The present patent discloses a blister packaging system for cartridges used for inhalers. The base sheet includes two or more horizontal rows of interconnected cavities. The cavity has a dome structure allowing placement of the cartridge.
Spider Venom Peptides and Methods of Use for Modulating Sodium Channels; P. Alewood, Z. Dekan, J. Deuis, R. Lewis, and I. Vetter; Th e University of Queensland, AU; U.S. Patent # 10,662,229; May 26, 2020.Pamphobeteus nigricolor is a large species of tarantula found in Colombia and Brazil. Present invention is related to the venom of Pamphobeteus nigricolor, capable of inhibiting voltage gated sodium channels to treat or prevent neuropathic, infl ammatory, and nociceptive pain. Venomous animals produce venom rich in bioactive components that modulate a wide range of ion channels and receptors. Due to these exquisite properties, venom components have found use in the treatment and management of several conditions. The paralytic function of spider venom is because of peptides that modulate the activity of neuronal ion channels and receptors, such as voltage-gated potassium, calcium and sodium channels. Such peptides may be useful in the treatment or prevention of conditions associated with sodium channel activity.
Injection Mechanism Utilizing a Vial; A. Limaye; Becton, Dickinson and Company, US; U.S. Patent # 10,653,830; May 19, 2020.Present invention discloses a delivery system in the form of a vial injector to dispense a liquid medicament. It comprises of a medicament storage chamber, a fl uid communication chamber, an outlet port to dispense medicament and a vertical orientation indicator. It has been designed to provide an injection mechanism for delivering a medicament that is simple to manufacture, by using fewer components and materials. It addresses and claims to provide a solution to the problem of inconvenience for a user to carry a vial and one or more syringes when using traditional glass vials and the challenge of high thumb pressure when injecting viscous formulations when using pen injectors.

www.americanpharmaceuticalreview.com | | 119
Acoustic Th erapy Device;P.M. Bonutti; P Tech, US; U.S. Patent # 10,639,052; May 5, 2020.Acoustic signals are alternative energy source. The present patent discloses a minimally invasive therapeutic system where an external power source is provided for transmitting energy non-invasively through the skin and body of a patient to a medical implant. The medical implant is surgically or percutaneously positioned at a treatment site and generally includes an energy focusing device. The energy focusing device focuses the energy signal into the treatment site to fragment the particulate material. The sensor assembly will utilize the energy signal to image and monitor the treatment site. The system also includes a control unit including a computer for data storage and display.
Methods and Systems for Optothermal Particle Control; Y. Zheng, L., Lin, and X. Peng; Th e University of Texas System, Austin, US; U.S. Patent # 10,620,121; April 14, 2020.Electromagnetic fi elds react with free electrons in metals such as gold or silver accounting for metal’s conductivity and optical properties. Free electrons on a metal’s surface oscillate collectively when hit by light, forming a surface plasmon. This patent involves illuminating a fi rst location of a plasmonic substrate with electromagnetic radiation. The plasmonic substrate can be in thermal contact with a liquid sample comprising a plurality of particles. The electromagnetic radiation comprises a wavelength that overlaps with at least a portion of the plasmon resonance energy of the plasmonic substrate. The plasmonic surface is in thermal contact with a liquid, which may be water, having a fi rst temperature. In the proximal region, there is a second confi nement region with a second temperature greater than the fi rst temperature. The patent describes a light-based, low-powered, and versatile tweezer for all-optical manipulation of nanoparticles and cells.
Light-Activated Cation Channel and Uses Th ereof; K. Deisseroth, and E.S. Boyden; Leland Stanford Junior University, US; U.S. Patent # 10,627,410; April 21, 2020.Cations such as sodium, potassium, calcium, and lithium travel between cytoplasm of the human cell and outside of the cell through cation channels. Such a fl ow of ions generates electric current and a change in voltage across the cell membrane. Conductance and transmission of signals in neurons are associated with the movement of cations. This patent involves administering an implantable prosthetic device comprising a cell-expressing light-activated cation channel protein into a subject. A light source is introduced near the implantable prosthetic device, which activates the cation channel protein expressed in the cell. The light source is an implantable type.
Formulations and Methods for Treating Ulcerative Colitis; K. Shailubhai, G.S. Jacob, and P. Griffi n; Bausch Health Ireland Ltd., Dublin, IE; U.S. Patent # 10,653,744; May 19, 2020.Ulcerative colitis is a chronic or long-lasting disease that causes infl ammation or ulcers of the inner lining of the large intestine; mainly the colon. Currently, there is no therapy to cure the disease. Treatment mainly depends on reduction of symptoms. This patent provides composition and methods to prevent, treat or alleviate a symptom of ulcerative colitis comprising administering to a patient dolcanatide. Dolcanatide is a guanylate cyclase C (GC-C) agonist, which works by increasing intestinal fl uid secretion, which can soften stools and stimulate bowel movements. This is a rectal drug delivery system administered once daily for 28 days prior to bedtime as an enema or suppository.

» ADVERTISER'S INDEX »
120 | | July/August 2020
»
Company Page # Web Address
AbbVie Contract Manufacturing 1 www.abbviecontractmfg.com
AdvantaPure 55 www.advantapure.com/apr6
Associates of Cape Cod 5 www.acciusa.com
Bio Investor Forum Digital 111 www.bio.org/investorforum
Biomérieux 11 www.biomerieux-industry.com/Endotoxin
Biomérieux Webinar 41 https://bit.ly/30z9usM
Biovigilant 13 www.biovigilant.com
Captisol 49 www.captisol.com
Catalent CV4 www.catalent.com/manufacturing
Charles River 19 www.criver.com/LALcartridges
Contec 63 www.contecinc.com
Eastern Analytical Symposium & Exposition 81 www.eas.org
Eurofins 37 www.Eurofins.com/BPT
IMA Life 45 www.ima.it
INTERPHEX 75 www.interphex.com
INTERPHEX Reconnex 365 59 www.interphex.com/reconnex-365
JRS Pharma 39 www.jrspharma.com
Lonza Webinar 33 https://bit.ly/3idNJo1
MilliporeSigma 35 www.SigmaAldrich.com/PharmaCompendialQC
PDA Global Conference on Pharmaceutical Microbiology 21 www.pda.org/2020micro
Pre-Filled Syringes San Francisco 103 www.prefilled-sanfrancisco.com
PTI 2 www.ptiusa.com
Sartorius CV2, 29 www.sartorius.com/letsbond
SUEZ CV3, 74 www.suezwatertechnologies.com/sievers
SUEZ Webinar 25 https://bit.ly/2XNqSZ6
TA Instruments Webinar 43 https://bit.ly/3kmsrXd
ThermoFisher Scientific Webinar 27 https://bit.ly/30pN8tx
TSI 65 www.tsi.com/data-integrity
The contact directory is for information purposes only. While every effort has been made to ensure it is accurate and complete, any errors or omissions are not the responsibility of the publisher.

• Immediate results for release of water and process control• Reduced data reporting time and laboratory errors• Comply with 21 CFR Part 11 and data integrity guidelines
www.suezwatertechnologies.com/sievers *Trademark of SUEZ; may be registered in one or more countries
discover the power of Sievers* online monitoring for real-time release of purified water
save time, reduce costs, ensure complianceAll purified water systems are susceptible to occasional out-of-trend (OOT) or out-of-specification (OOS) results. Real-time TOC and Stage 1 conductivity monitoring enables you to immediately investigate, identify a root cause, take corrective action, and save precious resources.
benefits of real-time TOC and Stage 1 conductivity monitoring:

PHARMACEUTICAL MANUFACTURING TECHNOLOGY IS SCIENCE. CUSTOMIZED SOLUTIONS AT THE RIGHT SCALE IS ART.
us + 1 888 SOLUTION (765-8846) EUR 00800 8855 6178 catalent.com/manufacturing © 2020 Catalent, Inc. All rights reserved
Successful product launches and reliable commercial supply are built on cutting-edge manufacturing science, seamless tech transfers, and the art of customized solutions at the right scale.
Catalent’s track record in supporting hundreds of tech transfers and product launches every year, coupled with industry leading manufacturing technologies, customizable suites and flexible end-to-end solutions at the right scale, will help get your products, orphan or blockbuster, to market faster, turning your science into commercial success. Catalent, where science meets art.