ph?/£>a4~?f - international atomic energy agency
TRANSCRIPT
pH?/£>A4~?f
PNRI-B (NC)?003
DETERMINATION OF DAILY INTAKE OF ELEMENTS FROM PHILIPPINE TOTAL DIET SAMPLES
USING INDUCTIVELY COUPLED PLASMA-ATOMIC EMISSION SPECTROMETRY
6.C. de Leon, K. Shiraishi, H. Kawamura, Y. Igaraishi, M.V. Palattao, and E.M. Azanon
Philippine Nuclear Research Institute Diliman, Quezon City, Philippines
October 1990
PNRI-B (NC)?003
DETERMINATION OF DAILY INTAKE OF ELEMENTS FROM PHILIPPINE TOTAL DIET SAMPLES
USING INDUCTIVELY COUPLED PLASMA-ATOMIC EMISSION SPECTROMETRY
G.C. de Leon, K. Shiraishi, H. Kawamura, Y. Igaraishi, M.V. Palattao, and E.M. Azanon
Philippine Nuclear Research Institute Dili man, Quezon City, Philippines
October 1990
DETERMINATION OF DAILY INTAKE QF ELEMENTS FROM PHILIPPINE TOTAL DIET SAMPLES
USING INDUCTIVELY COUPLED PLASMA-ATOMIC EMISSION SPECTROMETRY G. C. De Leon,* K. Shiraishi,** H. Kawamura,** Y. Igaraishi,** M.V. Palattao,* E.M. Azanon*
1.0 BACKGROUND In the fields of radiation protection and nutrition,
knowledge on the elemental intakes of man is very important. In nutrition, information on the total contents of food intakes, including trace elements, could greatly contribute to the improvement of human nutrition through better assessment and planning. In radiation protection, on the other hand, the determination of stable elements in diet and tissues is very vital for the calculation of metabolism parameters concerning uptake and deposition of radionuclides in the human body.
A total diet is composed of many kinds of foods - cereals, meat and meat products, fish and other marine products, vegetables and fruits - all of which consist of varying amounts of different elements. At present, however, there is still a dearth of information on the quantity of elemental constituents of dietary intakes, most especially in Asian countries.
Recently, some types of data banks which could provide information on national food supply as well as per capita nutrient intakes have been available. One is the Food and Agriculture Organization's (FAO) interlinked computer storage and processing system. However, only major components - vitamins and major minerals - are currently stored in the FAO data bank <1>. A few countries now have their own Food Composition Table (FCT). »vl*o, tlatft on national food supply are available from individual countries' Food Balance Sheets. Nevertheless, these data do not take into consideration the wide variation in intake among different individuals in a population (1), thus, for radiation protection purposes, these are not advisable to use in the calculation of age and* sex specific elemental intakes from total diet.
In the Philippines, the Food and Nutrition Research Institute (FNRI) has published a Food Composition Table (2) which gives information on the nutrient contents of some 1323 food items. However, although this FCT provides a lot of useful information/data, it still has some limitations like incomplete analysis of the food composition components, relatively large variations in values obtained, and absence of analysis for fast foods, which a e at present very popular especially in urban
* Philippine Nuclear Research Institute ** National Institute of Radiological Sciences (Japan)
1
areas. Food consumption surveys are also performed by the FNRI every five years (3,4,5). The main objective of the survey is to assess the food situation and nutritional status of the population, but the data provided ars not sufficient for use in radiation protection because it is not age and sex specific (assumed equal shares for all members including- children) and it was performed only for one season of the year.
For an accurate concentration and age and sex specific dietary intake estimates of elements, an application of a reliable analytical method of analysis is recommended. Nevertheless, in the absence of sophisticated equipment and costly materials necessary for quantitative analysis, calculations based on site specific dietary survey and FC1 could be considered.
During the past few decades, great progress in analytical measurement has been accomplished. The improvement made possible the reliable analysis of food samples, not only for major, but also for minor and trace elements. Inductively Coupled Plasma-Atomic Emission Spectrometry (ICP-AES) is an analytical method commonly employed today in food sample analysis. Shiraishi, et, al. (6,7,8,9,10) have conducted studies on elemental composition of Japanese diet. Among Asian countries at present, Japan has thF> most number of information on the elemental constituents of dietary samplers.
The PNRI, in connection with the dose projection study ot the mothballed Philippine Nuclear Power Plant (PNPP-1), conducted a dietary survey of 885 families composed of 4469 individual*, (11, 12) in the vicinity of the PNPP-1 (Bataan) which is a rural area. The survey covered a one week food consumption period, and specified the age and sex of individuals. The quantity of some elements on the daily food intakes from the Bataan survey is at present being calculated using the FNF<I Food Composition Table. The elements »re limited to Na, K, Mg,Zn, Cu, Mn, and I, which are the only ones available from the FCT. Likewise, calculations of these elements in diet using some data from the Food and Nutrition . Research Institute (FNRI) were undertaken.
This study, aims to conduct quantitative analysis of Philippine total diet samples - determining some major, minor and trace elemental composition - and to compare the results with the calculated values from the Bataan survey and some limited FNRI data.
The study also hopes to provide information on the conduct of quantitative analysis of food samples to other developing countries participating in the project "Establishment of Asian Reference Man" which aims to obtain a uniform set of data by using a standard procedure.
2
2.0 METHODOLOGY As a general rule, the analysis of diet samples must take
into account a number of factors like the nature of the sample, the analytical instruments/techniques to be applied, and the materials, facilities, and method to be used.
2.1 Nature of Sample The study aims to determine dietary elemental composition
of Philippine total diet samples. Sample collection was confined to middle income residents of Metro Manila during the months of November, December and January. These samples were classified into the following age groupst *
3 - lO Children 1 1 - 2 0 Teenagers 2 1 - 4 0 Young Adults 41 & above Elder Adults
The Filipino dietary intake could be classified into three general categories: 1) commercially prepared foods, 2) unprocessed fresh foods, and 3) table ready meals. In this study, the third one was used, applying duplicate meal sampling.
2.2 The Instrument :_ ICP-AE9 Several studies (6, 7, 9, 10, 18, 19, 20, 21, 22) have
demonstrated the specific capabilities of Atomic Emission Spectroscopy using ICP and direct current plasma <DCP) for the determination of many elements in food samples. Jones (14) showed that Na, K, P, Ca, Mg, Fe, Zn, Cu, Mn, and Sr can be routinely determined in a wide variety of foods using conventional pneumatic nebulization ICP-AES.
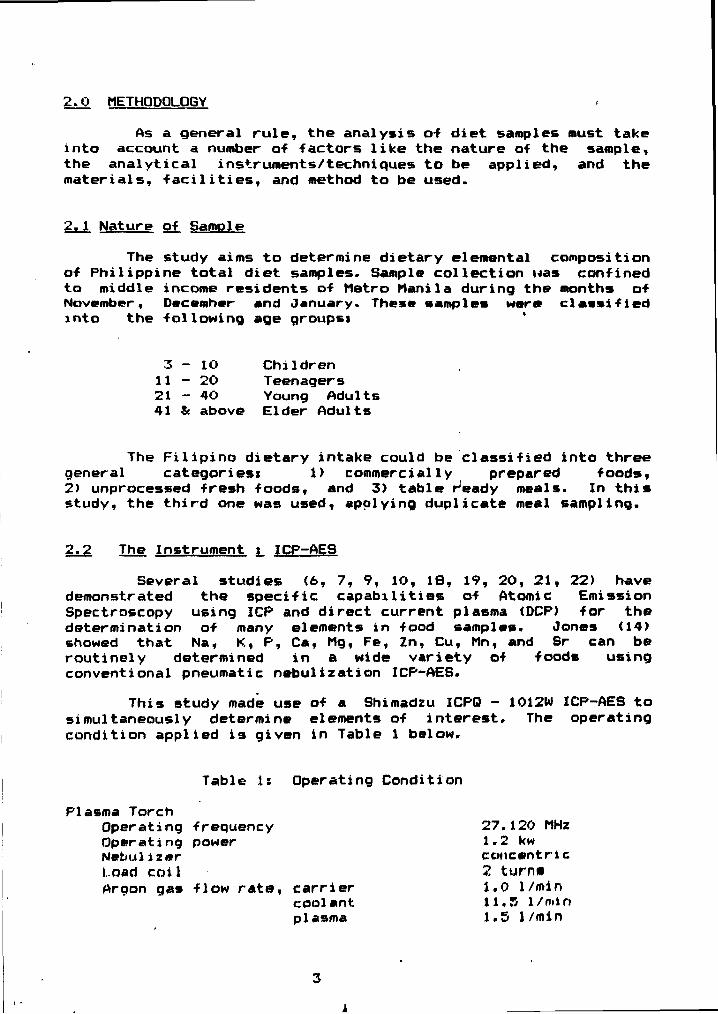
This study made use of a Shimadzu ICPQ - 1012W ICP-AES to simultaneously determine elements of interest. The operating condition applied is given in Table 1 below.
Table 1: Operating Condition Plasma Torch
Operating frequency Operating power Nebulizer load coil Argon gas flow rate,
27.120 MHz 1.2 kw concentric 2 turns
carrier 1.0 1/min coolant 11.3 1/min plasma 1.5 1/min
3
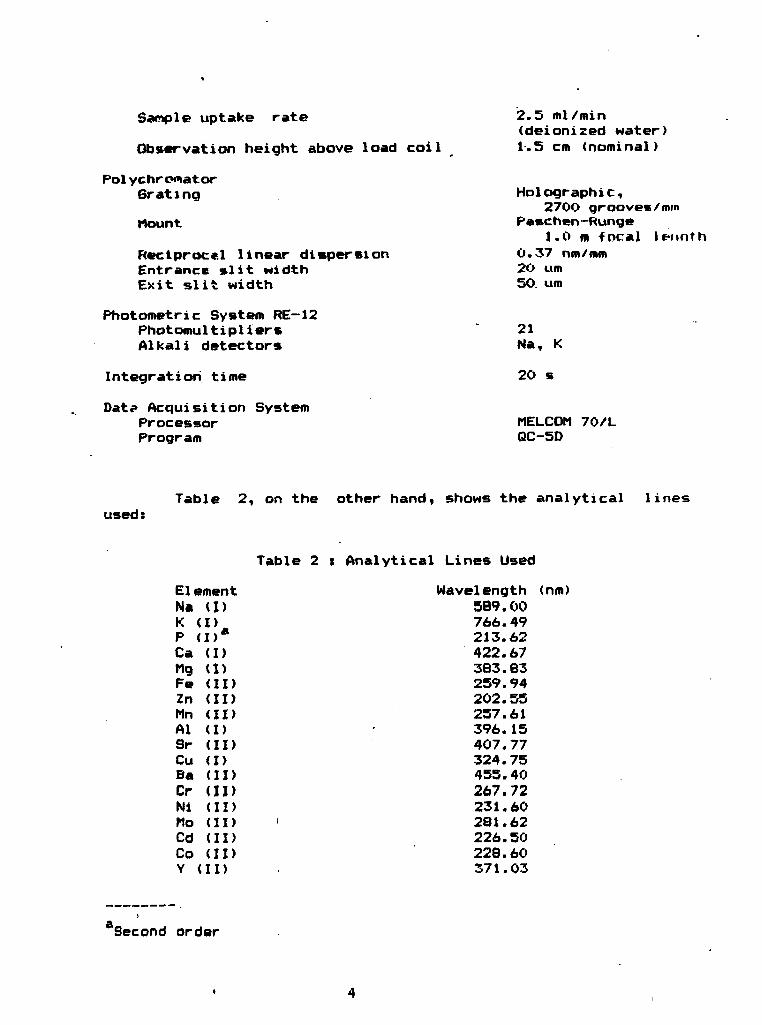
Sactple uptake rate Observation height above load coil
Pol ychrcwator Grating Mount Reciprocal linear dispersion Entrance slit width Exit slit width
Photometric System RE-12 Photomultipiiers Alkali detectors
Integration time Date* Acquisition System
Processor Program
2.5 ml/min (deionized water) 1.5 cm (nominal)
Holographic, 270O grooves/mm
Paschen-Runge 1.0 m f n c a l I emit h
0 . 3 7 nm/mm 20 urn 50. um
21 Na, K
20 s
MEL.COM 7 0 / L QC-5D
used: Table 2, on the other hand, shows the analytical lines
Table 2 t Analytical Lines Used Element Wavelength (ran) Nil (I) 589.00 K <I) 766.49 P (I)* 213.62 Ca (I) 422.67 Mg (1) 383.83 Fe (II) 259.94 Zn <II) 202.55 Mn (II) 257.61 Al (I) 396.15 Sr (II) 407.77 Cu (I) 324.75 Ba (II) 455.40 Cr (II) 267.72 Ni (II) 231.60 Mo (II) ' 281.62 Cd (II) 226.50 Co (II) 228.60 Y (II) 371.03
Second order
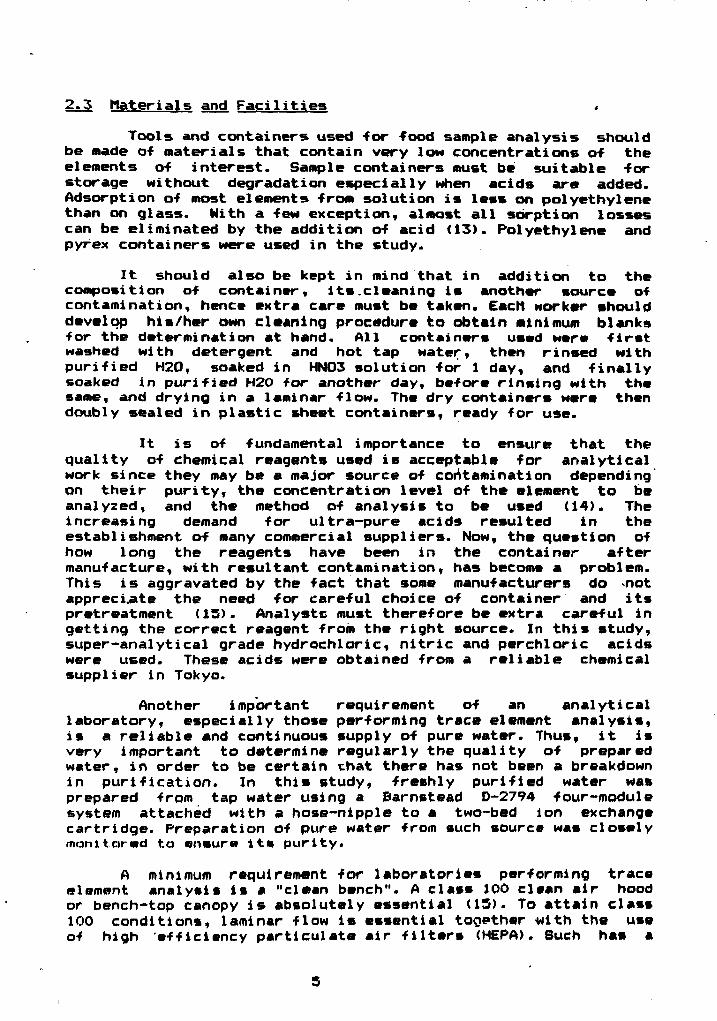
2.3 Materials and Facilities « Tools and containers used for food sample analysis should
be made of materials that contain very low concentrations of the elements of interest. Sample containers must be suitable for storage without degradation especially when acids are added. Adsorption of most elements from solution is less on polyethylene than on glass. Nith a few exception, almost all sorption losses can be eliminated by the addition of acid (13). Polyethylene and pyrex containers were used in the study.
It should also be kept in mind that in addition to the composition of container, its.cleaning is another source of contamination, hence extra care must be taken. Each worker should develop his/her own cleaning procedure to obtain minimum blanks for the determination at hand. All containers used were first washed with detergent and hot tap water, then rinsed with purified H20, soaked in HN03 solution for 1 day, and finally soaked in purified H20 for another day, before rinsing with the same, and drying in a laminar flow. The dry containers were then doubly sealed in plastic sheet containers, ready for use.
It is of fundamental importance to ensure that the quality of chemical reagents used is acceptable for analytical work since they may be a major source of contamination depending' on their purity, the concentration level of the element to be analyzed, and the method of analysis to be used (14). The increasing demand for ultra-pure acids resulted in the establishment of many commercial suppliers. Now, the question of how long the reagents have been in the container after manufacture, with resultant contamination, has become a problem. This is aggravated by the fact that some manufacturers do -not appreciate the need for careful choice of container and its pretreatment <15). Analysts must therefore be extra careful in getting the correct reagent from the right source. In this study, super—analytical grade hydrochloric, nitric and perchloric acids were used. These acids were obtained from a reliable chemical supplier in Tokyo.
Another important requirement of an analytical laboratory, especially those performing trace element analysis, is a reliable and continuous supply of pure water. Thus, it is very important to determine regularly the quality of prepmred water, in order to be certain that there has not been a breakdown in purification. In this study, freshly purified water was prepared from tap water using a Barnstead D-2794 four-module system attached with a hose-nipple to a two-bed ion exchange cartridge. Preparation of pure water from such source was closely monitored to nnsurw its purity*
A minimum requirement for laboratories performing trace element analysis is a "clean bench". A class 100 clean air hood or bench-top canopy is absolutely essential (13). To attain class 100 conditions, laminar flow is essential together with the use of high efficiency particulate air filters (HEPA). Such has a
S
minimum e f - f i c i e n c y r a t i n g of 99 .97% f o r 0 . 3 um p a r t i c l e s ( 1 6 ) . I n t h e s t u d y , a c i d d i g e s t i o n and subsequent procedures f o r sample p r e p a r a t i o n were c a r r i e d out i n a c l a s s 100 c l e a n a i r hood, i n s t a l l e d i n a c l e a n room.
2 . 4 Method
2 . 4 . 1 Dry ing
Dur ing oven d r y i n g of food samples , i t i s i m p o r t a n t t o c o n t r o l t h e t e m p e r a t u r e s i n c e a t around 100°C and above , t h e b i o l o g i c a l m a t r i x may decompose, depending upon t h e n a t u r e of t h e sample , and t h i s may r e s u l t i n l o s s of r e s i d u a l d ry m a t t e r and i n t r i n s i c a l l y v o l a t i l e e l e m e n t s ( 1 4 ) . Recommended d r v i n a t e m p e r a t u r e i s between 60-BO C.
2 . 4 . 2 HorooqenIz a t i on
Thf? a n a l y s t should see t o i t t h a t sample used i n t h e a n a l y s i s i s a r e p r e s e n t a t i v e of t h e s i m p l e t o be a n a l y z e d .
2 . 4 . 3 Dry Ashing
The temperature for dry ashing varies but an upper limit of 450 C is recommended since at temperatures • around 500 C voltit.i 1 i;:ation of «* large? number of elements such as Aq, As, Co, Cr, Hg, I, K, Na, Pb , Sb, Se, Sn, and Te, may occur (21). Samples can be ashed for about 16 to 24 hours. Ashing time depends on the type and quantity of the material (13).
3.0 PROCEDURE
lii. Sample and Sample Collection
Each diet sample was prepared in private homes under the guidance of a researcher. Each sample consisted of three full meals - breakfast, lunch and supper, and two snacks - morning and afternoon. Samples include liquid intakes like water, coffee, milk, tea, softdrinks, and juice.
Samples collected were placed in plastic containers and transported to PNRI for drying. To ensure that no significant change in sample composition occurred during the sampling, transport, and storage steps, sample collection was cautiously performed by one of the authors.
>, 2 Bainp I'' FTWJr 'it j OP
Thf edible portion of the diet sample was separated, placed ih a pyrex container, weighed, mixed thoroughly, and dried
6
in an oven at 60 C, half covered. urying time was about one week per sample.
Sample materials were thoroughly mixed aqain after dryinq to enhance homogenelty. However, regardless of the care taken t > homoaenize the sample matprials, a ?ub-sample may not always br-representative of the whole sample (13). Hence, to lessen the error arising from the heterogeneity of the composite, three random aliquot portions from each sample were taken for analysis.
Dried samples were placed in porcelain dish separately, and ashed in an electric muffle furnace at 450 C. Ashing time was about 20 hours. Ashed samples were weighed and then stored in polyethylene vials prior to analysis.
3.3 Preparation of Sample Solution The procedure developed by Shiraishi, et, al. (6, 7, 8.
9, 10) was applied to the dry ashed food samples. An aliquot, approximately 0.25 g, was taken and placed in a vacuum oven at about 80 C for two hours be-fore re-weighing. Then it was digested in a 50 ml borosilicate glass beaker covered with watch glass, containing about one <1) ml concentrated nitric acid, at. temperature between 100 - 150 C for about two hours, before drying up at about 200 C. This was done in a Thermolyne HP--11415P ceramic top hot plate. About one (1) ml concentratprl nitric acid and 0.5 ml 617. percholoric acid were added next, and digestion was repeated.
When the mixture turned white, it was dried up at about 200 C. About one (1) ml concentrated HC1 was then added to convert the nitrate into chloride, and the mixture was heated at about 80-100 C for about two hours, then dried. The white solid was then dissolved in freshly prspareti purified water and a few drops of concentrated HC1, with gentle heating until a clear solution was obtained. The solution was cooled, filtered, and the volume was made to 25 ml with the addition of purified water. Polyethylene vials were used to contain the prepared sample solutions.
The prepared solution has 1"/. ash content and 0.25M HC1 concentration. Compatibility of the ashing procedure with post digestion chemistry and the determinative step is critical. For example, excessively high dissolved solid content of a test solution caused by milligram or gram quantities from the food material itself, can cause intolerable instrument difficulties for 1CP-AES due to volatilization interference or to test solution introduction problems. For most determinative methods, a test solution with a relatively low matrix salt content (1-27. dissolved 3olids) free of suspended particulates is most readily compatible (15).
During the digestion procedure, care was taken to introduce only minimum amount of acids to lessen the possibility of contamination.
3.4 Preparation of NBS Standards
Four sets of NBS SRM 1577A Bovine Liver standard (revised 3/1/86) weighing one gram each were prepared, applying similar procedure used for the food samples.
3.5 Preparation of Standard Solutions
Stock solutions (lOOO ug cm ) were • prepared by dissolving standard materials in HCl and then diluting with purified water. The "Specpure" materials containing Ca, lig, K, Ma, Fe, Zn, Cu, Mn and Sr were obtained from Johnson Matthey Hhemirals, Rnvston. Standard solutions were prepared in two groups by diluting the stock solutions. The tirst was for major elements - Na, K, Ca, Mg, and P, and the second for the minor and trace elements.
3..6 Elemental Analysis
For major element analysis (Na, K, Ca, Mg, and P), food sample solution was further diluted 25 times with a final HCl concentration of 0.IN. Using the ICP-AES operating conditions shown in Table 1, matrix matching between the sample solutions and the standard solution were performed.
Calibration curve for each of the analyte was made using four (4) concentrations, e.g., 0, 250, 500 and 1000 ug/ml of the analyte.
On the other hand, minor and trace elements - Fe, Zn, Hn, Al, Sr, Cu, Ba, and Y - in the sample solutions were determined using matrix matching method without dilution.
4.0 RESULTS AND DISCUSSIONS
4.1 Analvsis of NBS Sample
The major elements in NBS standard were determined first before the minor elements. The value obtained were in good agreement with the certified NBS value, i.e., 5 '/. difference.
For minor elements, the results also showed good agreement with thr> MB?! Certified value with error of 5V. except, for f e < 16'/.) .
8
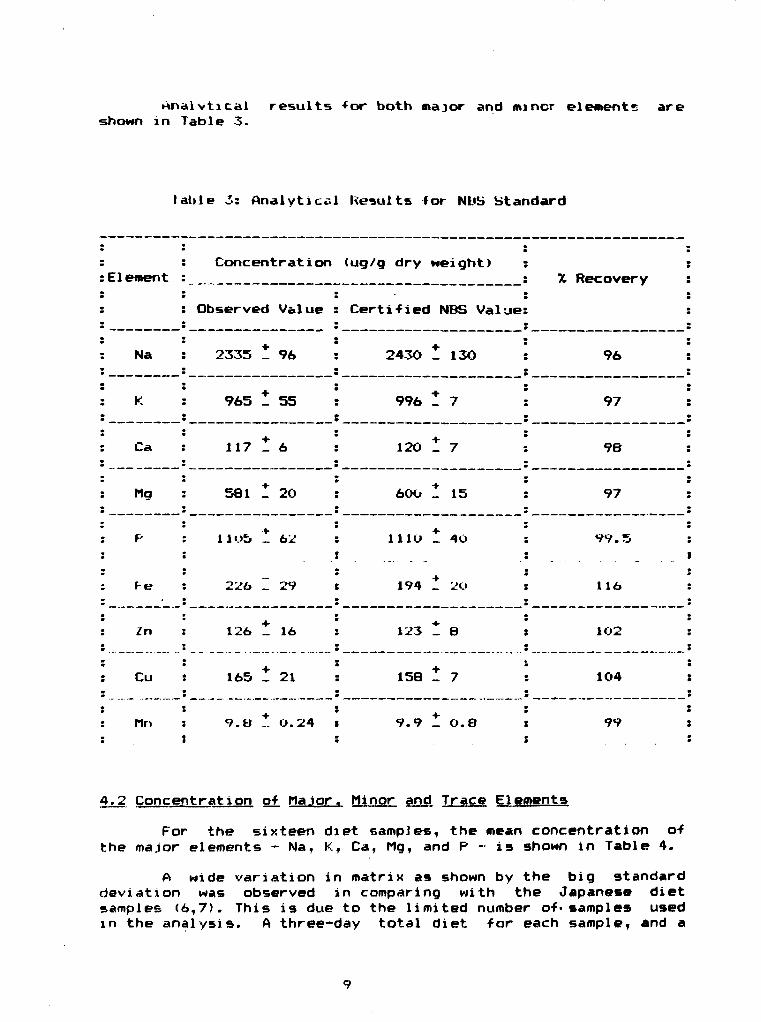
Analytical results -for both major and miner elements are shown in Table 3.
table 3: Analytical Results for NbS Standard
:Element : Concentration <ug/g dry weight)
~L Recovery : :Element :
Observed Value : . Certified NBS Value:
~L Recovery :
: Na 2335 * 96 : 2430 Z 130 : 96 :
: K 965 * 55 996 1 7 : 97 :
: Ca : 117 * 6 : 120 Z 7 : 98 :
: Mg 581 Z 20 : 60O * 15 : 97 :
: P 11 «.»5 Z 62
: 226 Z 29
: lllO Z 40 f ...... .. ! 194 * 20
: 99.5 : : » ; 116 :
: /n
: Cu
126 * 16
i 165 Z 21
! 123 1 8
: 158 * 7
t 102 :
104 :
: fin * * 9.B * 0.24 i 9.9 t O.e
< s 9V : > •
m
4.2 Concentration of. Major. Minor and Trace Elements For the sixteen diet samples, the mean concentration of
the major elements - Na, K, Ca, Mg, and P - is shown in Table 4. A wide variation in matrix as shown by the big standard
deviation was observed in comparing with the Japanese diet samples (6,7). This is due to the limited number of- samples used in the analysis. A three-day total diet for each sample, and a
9
• »
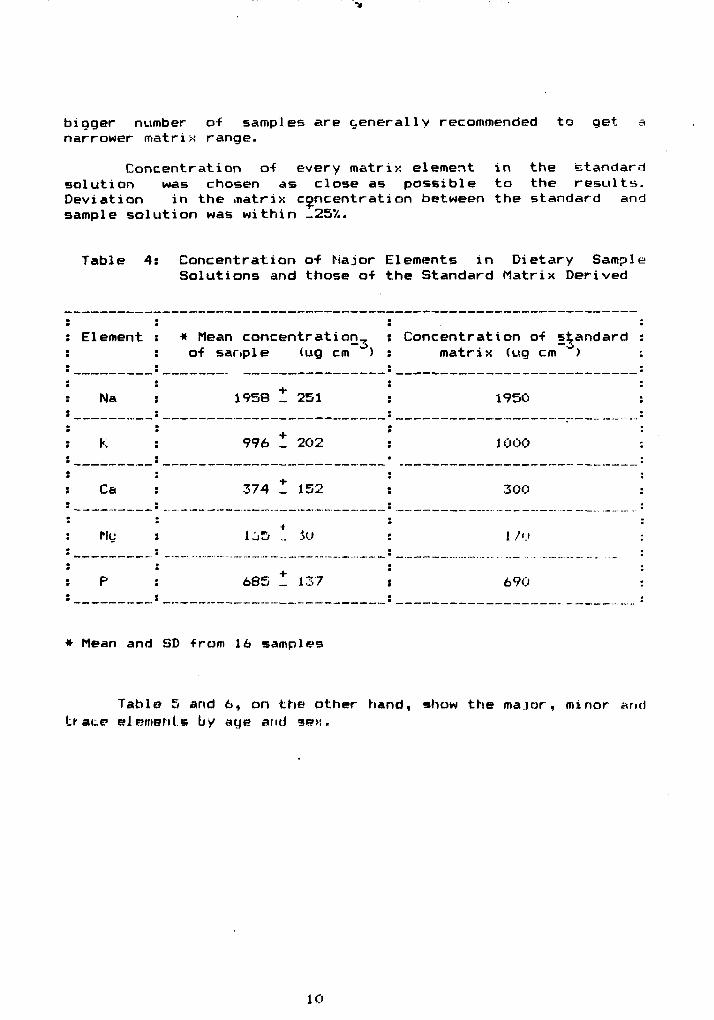
biager number of samples s.re cenerally recommended to get a narrower matrix range-
Concentration o-f every matrix, element in the standard solution was chosen as close as possible to the results. Deviation in the matrix concentration between the standard and sample solution was within -25*/..
Table 4: Concentration o-f Major Elements in Dietary Sample Solutions and those o-f the Standard Matrix Derived
: Element : * Mean concentration., o-f sar.pl e (ug cm °) s
Concentration of standard matrix (ug cm "")
: Na :
1958 t 251 1950
: K : 996 t 202 1000
: Ca
: My
: P
374 1 152
1.J3 t 4u
685 1 137
300
690
* Mean and SD from 16 samples
Table 5 and 6, on the other hand, show the major, minor and trace elements by age and 3«?>s.
10
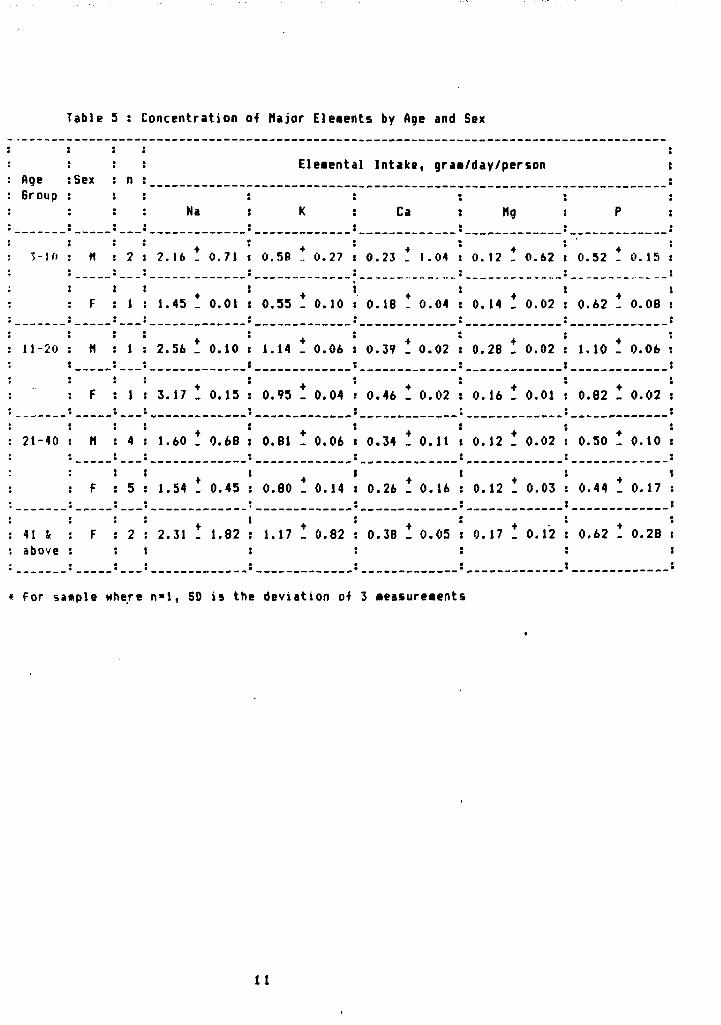
Table 5 : Concentration of Major Elements by Age and Sex
Age : Sex • n Eleaental Intake, gra«/day/person
Group : Sex • n
Na K Ca : Mg P :
5-1 ft M 2 2.16 ! 0.71 i 0.5B * 0.27 i 0.23 * 1.04 s 0.12 * 0.62 i *
0.52 ! 0.15 t • •
F 1 1.45 . 0.01 + 0.55 _ 0.10 0.18 * 0.04 : 0.14 ! 0.02 0.62 . 0.08 :
11-20 M 1 2.56 ! 0.10 1.14 ! 0.06 : 0.39 ! 0.02 : 0.28 ! 0.02 • 1.10 ! 0.06 :
: F i 1 : 3.17 ! 0.15 0.95 ! 0.04 0.46 ! 0.02 : 0.16 ! 0.01 0.82 - 0.02 :
21-40 M : 4 : 1.60 ! 0.68 0.81 - 0.06 t 0.34 ! 0.11 » 0.12 ! 0.02 » a • m
0.50 ! 0.10 :
: F ! : 5 : 1.54 . 0.45 i 0.80 . 0.14 : 0.26 - 0.16 : 0.12 - 0.03
1 • » : 0.44 _ 0.17 : i :
41 fe above
: F : 2 : 2.31 ! 1.82 ! 1.17 ! 0.82 : 0.38 ! 0.05 : 0.17 ! 0.12
:_ :
: 0.62 ! 0.28 :
For sample where n=l, SD is the deviation of 3 •easureaents
11
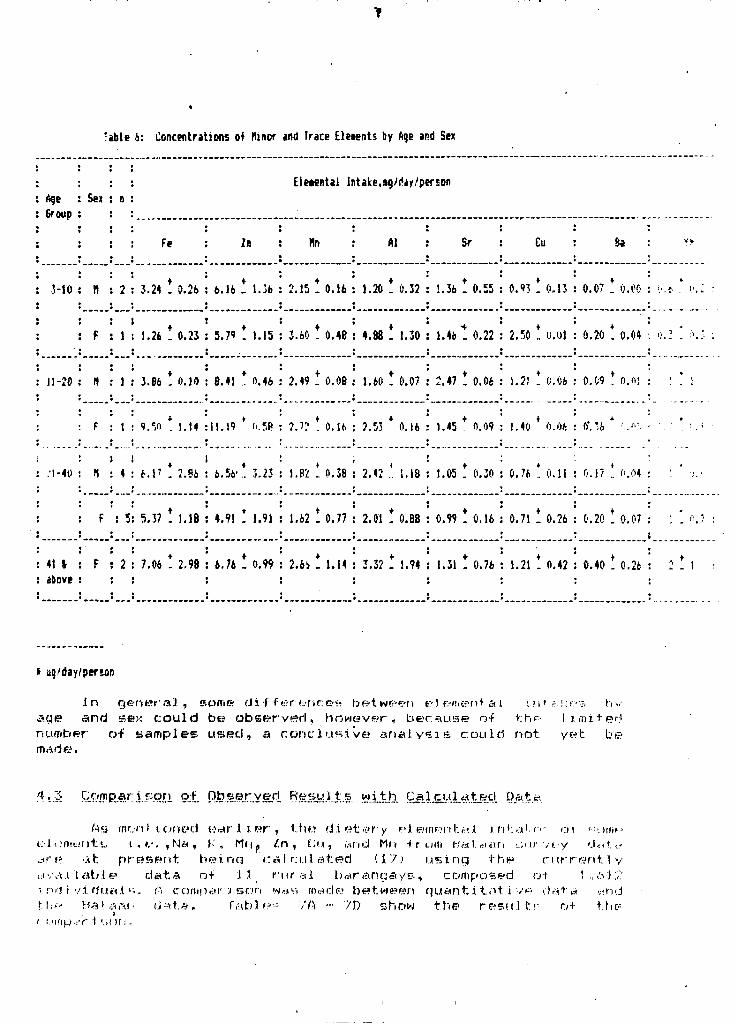
Table 6: Concentrations of Minor and Trace Eleients by Age and Sex
Age : Sex Group :
n Elemental Intake,sg/iUy/person
n
Fe Zn : tin : Al Sr Cu 6a : ?•
M O : tl 2
. 1
3.24 ! 0.26
1.26 ! 0.23
6.16 ! 1.56 : 2.15 ! 0.16 : 1.20 ! 0.32
5.71 ! 1.15 : 3.60 * 0.4B : 4.88 ! 1.30
1.36 ! 0.55
1.46 t 0.22
0.93 *. 0.13
2.50 ! 0.01
0.07 . 0.00 : v.t . i ' .: :
0.20 * 0.04 : •>.? * ' . ; ;
11-20 : » 1
1
4
3.86 ! 0.10
9.7i *. 1.14
• t.V . 2.86
8.41 ! 0.*6 : 2.49 ! 0.08 : 1.60 ! 0.07
11.19 * n.SB : 7.7? ! 0.16 : J.53 * 0.16
6.56'.'. 3.23 : 1.82 1 0.38 : 2.42 .'. 1.18
2.47 ! 0.06
1.45 + 0.09
1.05 * 0.30
1.2) ! 0.06 0.09 ! O.ftl : : ! 1
.-1-40 : ri
1
1
4
3.86 ! 0.10
9.7i *. 1.14
• t.V . 2.86
8.41 ! 0.*6 : 2.49 ! 0.08 : 1.60 ! 0.07
11.19 * n.SB : 7.7? ! 0.16 : J.53 * 0.16
6.56'.'. 3.23 : 1.82 1 0.38 : 2.42 .'. 1.18
2.47 ! 0.06
1.45 + 0.09
1.05 * 0.30
1.40 * 0.06
0.76 ! 0.11 0.17 ! f>.04 : '. ' :.'
: F : 5 5.37 ! 1.18 4.91 I 1.91 : 1.62 ! 0.77 : 2.01 ! O.BB 0.99 ! 0.16 0.71 ! 0.26 0.20 ". 0,07 : i I 0.? :
41 t : F above :
: 2
i
7.06 ! 2.98 6.76 ! 0.99 : 2.6i 1 1.14 s 3.32 ! 1.94 1.31 ! 0.76 . 1.21 ! 0.42 0.40 ! 0.26 : 2 ! 1
i aq'day/per'on
I n g e - n e r a l , Eome d i f f e r e n c ; e s b e t w e e n eH enre?n+si i ! i t ; . ! . : f - ; b y acje a n d sex c o u l d b e o b s e r v e d , h o w e v e r , b e c a u s e o f t i ne ' l im i - t - ed number o f s a m p l e s u s e d , a c o n c l u s i v e a n a l y s i s c o u l d n o t y**t b e m a d e .
4 . 3 G o f n e a r l s o r i o f . O b s e r v e r ! . Resy . l t . 5 w i j t h C a l . c u l a . t e d D a t a
Ms mon I i. o n t n l H d r l i e r , t h e d i e t a r y *<Jeinf-nta l . i n h a ' f " o t •--. xn?1
el( ;n iwi i t<; , i . f . , N a , K, Mr i j, ^ n , C u , a n d Mr» t r u i n H a i n a n •„.; > u- v i.. y Oaf. ,.:< j i r f? -jih prt»EiPr»t b e i n n i::« I r . u la te»d ( 1 7 ) u=>inq t h p c u r r e n t l y i i ' ;a. i l a b l e d a t a o f 1.1 r u r a.L b a r a n g a y s , c o m p o s e d o i 1,,6'J:.? -. m l i v i di.ici.1 i i . Ti c o m p a r i s o n wavi rneade; b e t w e e n q u a n t i. t a t i V P d a t a >-<.\v.i \.\:f B<j* .sr<n d - d . a . Tab) »••'•- /A - 7D show t h e r e s u l t ' " o f the--
> ' ! 'Idp.:'r i '.,!')(: .
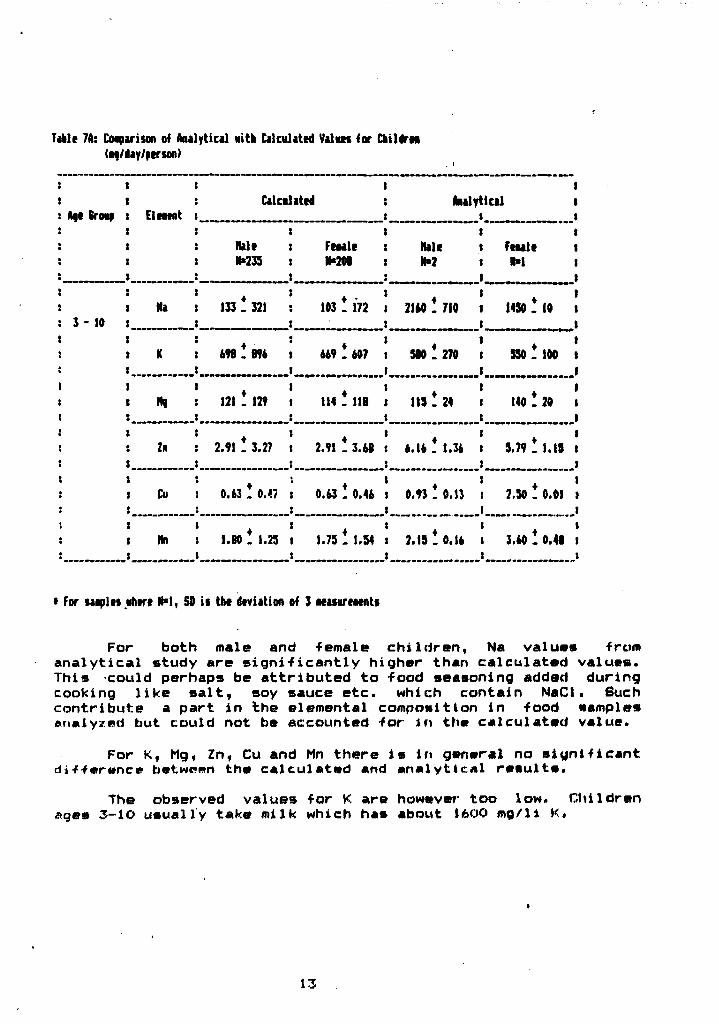
Table 7A: Comparison of Analytical mtk Calculated Value* lor Children (•f/day/ierson)
Aft firotp
3 - 10
Eletent
tb
Zn
Cu
Hn
Calculated Analytical
Hale N*23S
133 ! 321
698.896
121 . 129
2.91 . 3.27
0.63 . 0.47
1.80 . 1.25
Feaale Male N*20l i N>2
103 ! 172 i 2IM ! 710
669 ! 607 I NO ! 270
114 ! 118 ( IIS ! 2*
2.91 ! 3.68 : 6.16 ! 1.36
0.63 ! 0.46 ! 0.93 ! 0.13
1.75 ! 1.54 t 2.15 ! 0.16
Feaale KM
1450 . 10
550. 100
140 ! 20
5.79 . 1 . 1 5
2.50 . 0.01
3.60 I 0.48
• For staples where 8*1, 5D if the deviation of 3 Masureeents
For both male and f e m a l e c h i l d r e n , Na v a l u e s f rom a n a l y t i c a l s t u d y a r e s i g n i f i c a n t l y h i g h e r than c a l c u l a t e d v a l u e s . T h i s cou ld perhaps be a t t r i b u t e d t o food seasoning added d u r i n g cooking l i k e s a l t , soy sauce e t c . which c o n t a i n NaCl • Such c o n t r i b u t e a p a r t i n t h e e l e m e n t a l compos i t ion i n food samples ana lyzed but cou ld not be accounted f o r I n t h e c a l c u l a t e d v a l u e .
For K, Mg, Zn , Cu and Mn t h e r e i s i n g e n e r a l no s i g n i f i c a n t d i f f e r e n c e between t h e c a l c u l a t e d and a n a l y t i c a l r e s u l t s .
The observed v a l u e s f o r K a r e however t o o low. C h i l d r e n ages 5 - 1 0 u s u a l l y t a k e m i l k which has about 1600 m g / l i K.
13
y
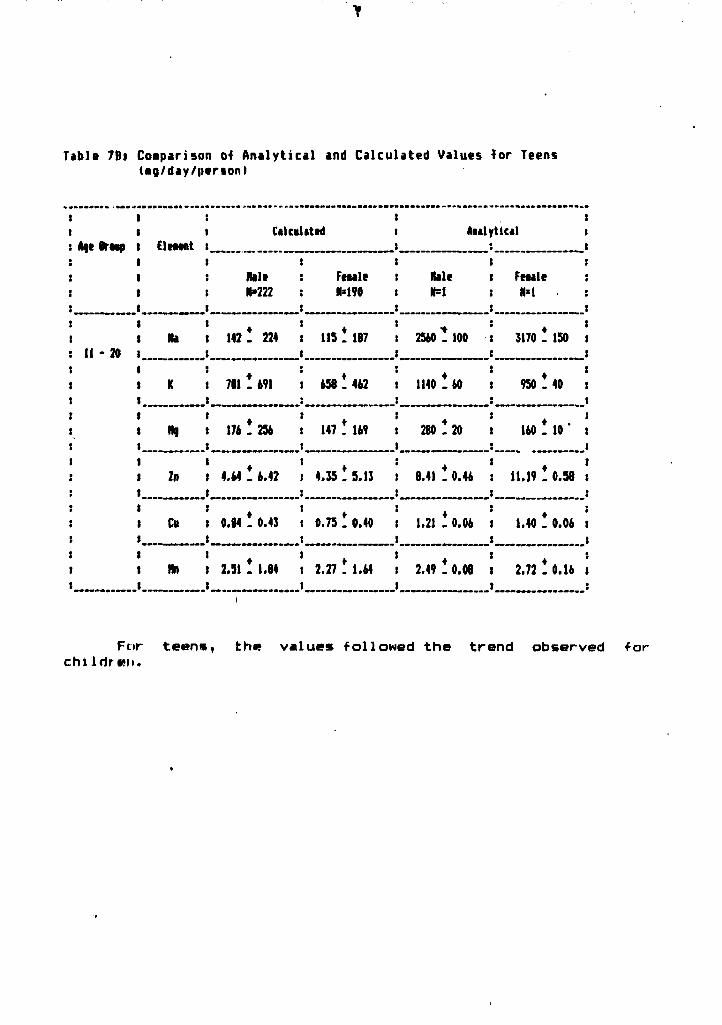
Table 7Bi Comparison of Analytical and Calculated Values for Teens <ng/day/ptrson)
Aft 9ro«p
11 - 2 0
i i
ElMMt I. :
Calculate
lUli U»222
Feule N*190
t
Na
2n
Cu
Hn
142
711
176
4.64
0.84
224 i US ! 1B7
691 t 658 . 462
256 : 147 . 169 : 1 •
6.42 i 4 ,35 .5 .13 • « » • • « _ _ _ * — — • • . . • • • • » • » J M
« ™
0.43 : 0.75 . 0.40 j
2.51 I I.B4 t 2.27 ! 1.64 I
Analytical
Rale N=l
2540 ! 100
1140 ! 60
280 ! 20
8.41 . 0.46
1.21 - 0.06
2.49 . 0.08
Feaale
3170 . 150
950 ! 40
160 ! 10
11.19 . 0.58
1.40 . 0.06
2.72 . 0.16
For t e e n s , the va lues fol lowed the trend observed for childr rn.
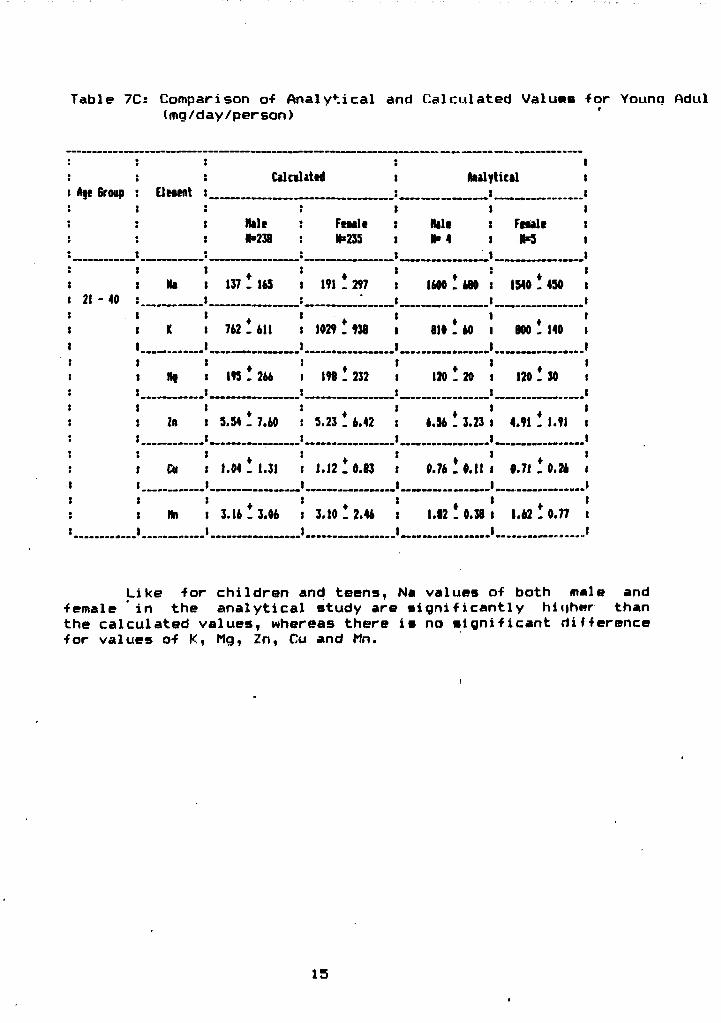
Table 7C: Comparison of Analytical and Calculated Valutts for Younq Adul (mg/day/person)
: Calculated Analytical 1 : Aft Sroop l ElHMt : 1 ' «
ible Fettle i Kali 1 Feiale 1 11*238 N-235 i fc>4 1 INS t
i Na i 137 ! 165 J 191 ! 297 1600 ! 480 1540 ! 450 1 : 2 1 - 4 0 * : I 1
I K I 762 ! 611 t 1029! 938 Bio! 60 BOO ! 140 1
t : • •
i Ho i 195 ! 266 i 19B ! 232 1 120 ! 20 1 120 ! 30 1
: : In ! 5.54 ! 7.60 : 5.23! 6.42 6.56 ! 3.23 1 4.91 ! 1.91 1
t t Ctt » 1.04 ! 1.31 I 1.12! 0.83 i 0.76 ! 0.11 l 0.71 ! 0.26 (
• * I Hn t 3.16 ! 3.06 ( 3.10 ! 2.46 t 1.12 ! 0.38 l 1.62 ! 0.77 1 \
Like for children and teens, Na values of both male and female ' in the analytical study are significantly hiijhur than the calculated values, whereas there is no significant difference for values of K, Mg, Zn, Cu and Mn.
15
y
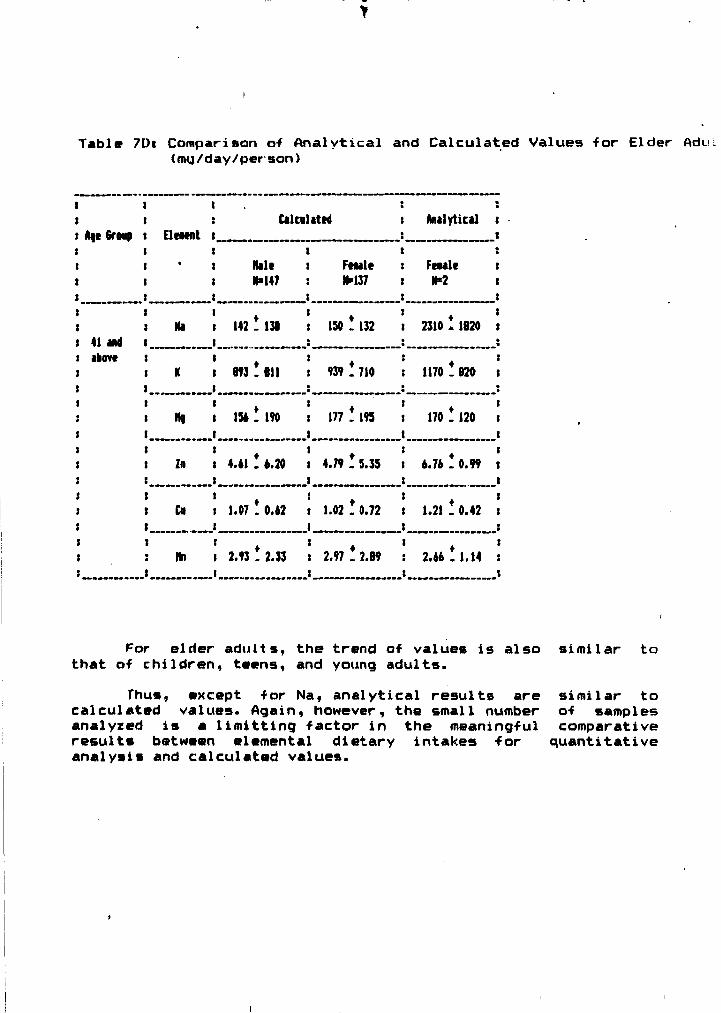
Table 7Di Comparison of Analytical and Calculated Values for Elder Adu: (mq/day/per son)
i : : i i Calculated Analytical :
t Ate 6ronp i ElMMt 1 —! ' » Halt : Ftaale Feult :
11*147 14-137 i N*2 i
t 41 art i above
Hi 142 ! 138 ISO ! 132 : 2310 ! 1820 t t 41 art i above
I K 893 ! 611 939 ! 710 : 1170 ! 820 i
I * 154 ! 190 i 177 ! 195 t 170 ! 120 I
: Zfl i 4.61 ! 6.20 i 4.79 ! 5.35 : 6.76 ! 0.99 t
i Cu I 1.07 ! 0.42 i 1.02 ! 0.72 t 1.21 ! 0.42 t
• Hn I 2.93 ! 2.33 I 2.97 ! 2.89 : 2.66 ! 1.14 :
5 (
For elder adults, the trend of values is also similar to that of children, teens, and young adults.
Thus, except for Na, analytical results are similar to calculated values. Again, however, the small number of samples analyzed is a limitting factor in the meaningful comparative results between elemental dietary intakes for quantitative analysis and calculated values.
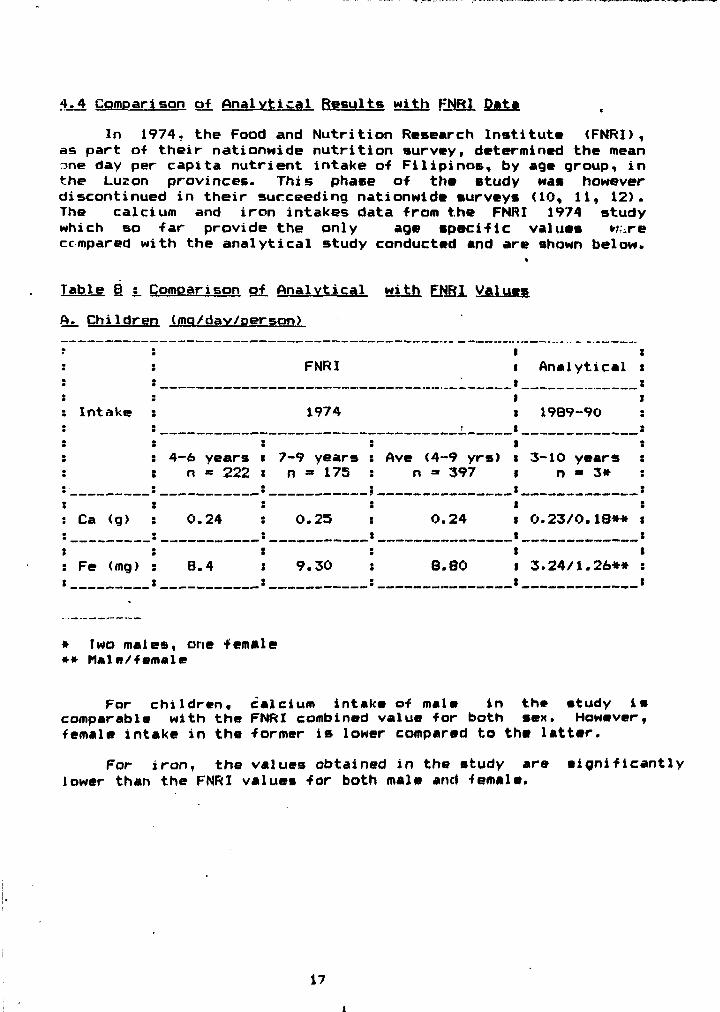
4.4 Comparison of Analytical Results with FNRj pata
In 1974, the Food and Nutrition Research Institute (FNRI), as part of their nationwide nutrition survey, determined the mean m e day per capita nutrient intake of Filipinos, by age group, in the Luzon provinces. This phase of the study was however discontinued in their succeeding nationwide surveys (10, 11, 12). The calcium and iron intakes data from the FNRI 1974 study which so far provide the only age specific values w;re ccmpared with the analytical study conducted and are shown below.
Table 8 :_ Comparison o£ Analytical with F_NJR|I. Values
A. Children <<nq/day/person)
FNRI Analytical i
Intake 1974 ! |
I 1989-90 :
! 4" -6 years i n - 222 i
* > i 7-9 years i n - 175
•
Ave (4-9 yrs) n = 397
i 3-10 years : I n » 3* :
Ca (g) 0.24 : 0.25 t m m
t 0.24 i i 0.23/0.18** :
Fe < mg) 8.4 ! 9.30 8.80 I 3.24/1.26** : l t
* two males, one female ** Male/female
study is However,
For children, calcium intake of male in the stud comparable with the FNRI combined value for both sex. How female intake in the former is lower compared to the latter.
For iron, the values obtained in the study »ra significantly lower than the FNRI values for both male and female.
17 i
B. Teens <mQ/dav/per»on>
FNRI Analytical s
t Intake : 1974 1989--90 :
10 - 19 years 1 . 1 1 - 2 0 years 3
: Ca (g) t
Male 1 Female 1 n«275 1 n-286
«... 1 1
0.33 :i 0.26 1 m
t Male ( n-1 1-1 0.39
t t 1 : : • a
Female : n-l t
0.46 :
: Fe (mg) 3 3 :
1 11.70 :, 7.03 s 3.86
m
• • 9.50 s
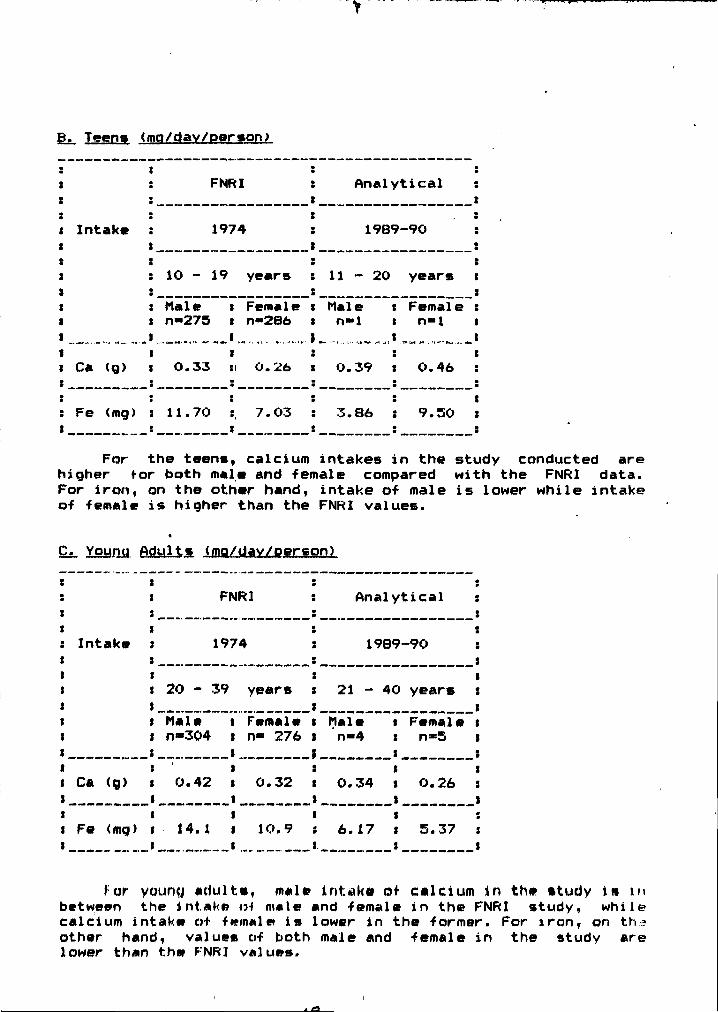
For the teens, calcium intakes in the study conducted are higher for both male and female compared with the FNRI data. For iron, on the other hand, intake of male is lower while intake of female is higher than the FNRI values.
£i. YOL)PJI aduiis. (fng/Uay/pgrson?
FNRI Analyt .ical 3
Intake 1 1974 1989--90 s
20 -
Male n-304
39 years 21 - 40 years 3 20 -
Male n-304
t Female 1 n- 276
;
Male n-4
1 3 3
Female 3 n«S s
Ca <g) 1 0.42 1 0.32 3 1 1
0.34 • • 3 1
0.26 3
Fe (mg) t 14.1 1 10.9 3 m m
1. 6.17
3 3 a m
5.37 »
for young adults, male intake of calcium in the study in in between the intake iH male and female in the FNRI study, while calcium intake of female is lower in the former. For iron, on th;? other hand, values of both male and female in the study are lower than the FNRI values.
D. Elder Adults (mo/dav/person)
: Intake •
3 :
FNRI : Analytical t
: Intake •
3 :
! 1974 1989-90 t : Intake •
3 :
t 40 and above : 41 and above i
: Intake •
3 : : Male
t n=137 : Female '
: n=15B Female i
t n « 2 I
: Ca (g) s
: Fe (mg) •
l 0.40 1 _ , _. t » I 13-38 • •
t i i 0.32 t 0.38 l » .,., » ..... . »
l l I 10.90 J 7.06 i
• 1
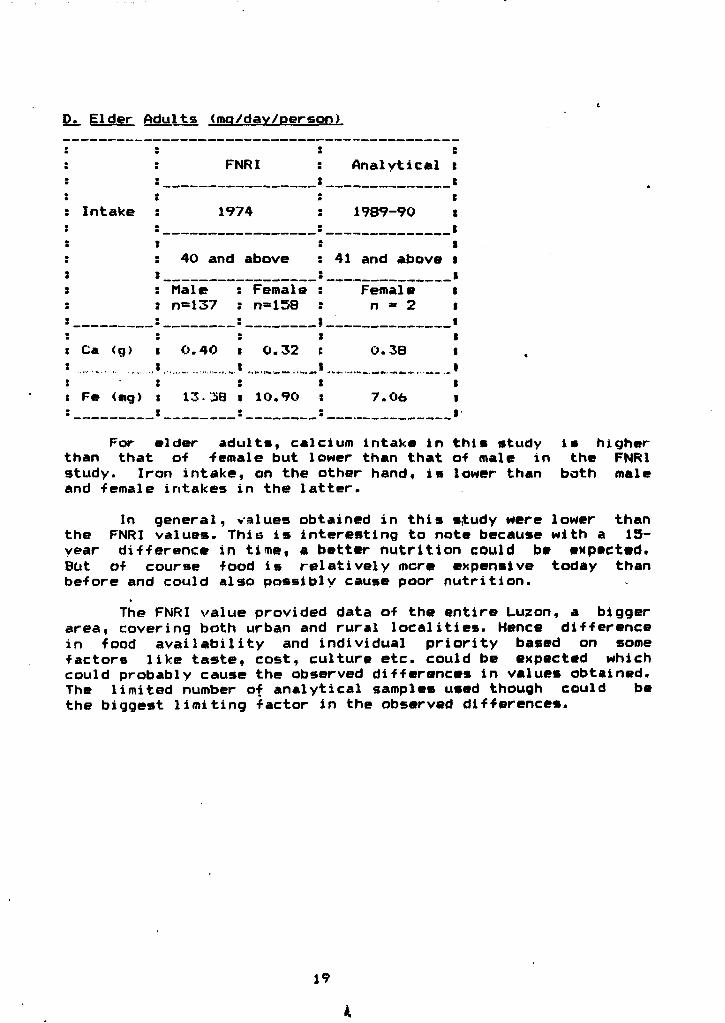
For elder adults, calcium intake in this study is higher than that of female but lower than that of male in the FNRI study. Iron intake, on the other hand, is lower than both male and female intakes in the latter.
In general, values obtained in this s,tudy were lower than the FNRI values. This is interesting to note because with a 15-year difference in tine, a better nutrition could be expected. But of course food is relatively mere expensive today than before and could also possibly cause poor nutrition.
The FNRI value provided data of the entire Luzon, a bigger area, covering both urban and rural localities. Hence difference in food availability and individual priority based on some factors like taste, cost, culture etc. could be expected which could probably cause the observed differences in values obtained. The limited number of analytical samples used though could be the biggest limiting factor in the observed differences.
19
k
>
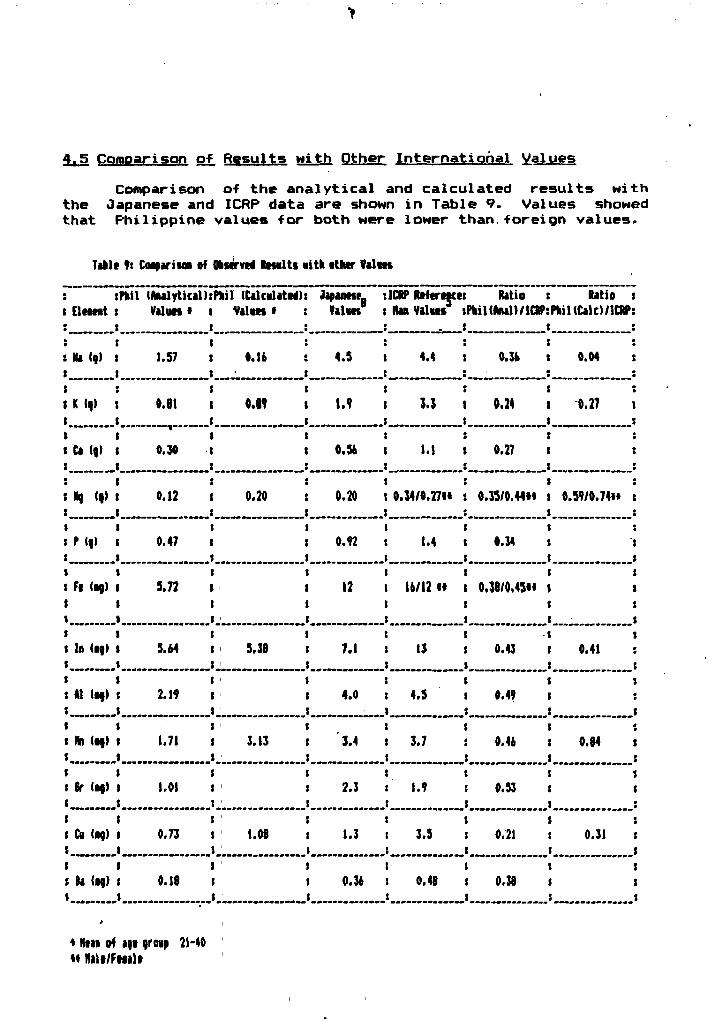
4,5 Comparison of Results with Other International Values Comparison of the analytical and calculated results with
the Japanese and ICRP data are shown in Table 9. Values showed that Philippine values for both were lower than, foreign values.
Title 9s Coaoaritoa of 0 nerve*1 Rewltt oith other Valm
: sPMl tAMlyticalhPiil (Calculated)8 Japanese. sICRP References Ratio Ratio s t ElHmt t Value* • i Valro # Valets 8 Han ViWes sPkiKAnaU/IOtPtPkiHCalO/lCRP: • • • • * • • * 8 8 1 8 8 8 8 8 : IU <9> 8 1.57 ! 0.14 : 4.5 8 4.4 : 0.3b 8 0.04 : • • • • • • # • • • • t * • • i • • • • • • • • m m
• • • a 1 • • •
J K If) : 0.81 i 0.89 i I.? i 3.3 t 0.24 1 0.27 i I I 8 . 8 .8 . . 8 8 8 X 1 8 8 8 8 8 8 t Ca (a.) 8 0.30 : 8 0.54 i 1.1 i 0.27 I :
8 8 8 8 8 8 8 8 8 Kg (9) i 0.12 t 0.20 s 0.20 t 0.34/0.27i« 8 0.35/0.44** j 0.59/0.74i» :
8 1 8 8 8 8 8 8 8 P (o) 8 0.47 8 8 0.92 8 1.4 8 0.34 8 :
8 ft (ag> i 5.72 8 8 1 8 8 8 8 12 I 16/12 « l 0.38/0.45** \ \ 8 8 8 8 8 8 8 8 8_ _ . 8
8 lo <og> i 5.64 8
8 A] (eg) 8 2.19 8
8 8 8 - 8 S 3.38 8 7.1 8 13 8 0.43 8 0.41 s
8 8 8 8 8 8 8 8 8 8 8 4.0 8 4.5 8 0.49 8 8__ 8 8 „ . 8 . . . 8
t Hn (eg) 8 1.71 8 8 8 8 8 8
3.13 8 3.4 8 3.7 s 0.46 8 0.84 : 8 8 8 ,8 . „ 8
8 Sr (Of) 8 1.01 8 8 8 8 8 8 8 2.3 8 1.9 8 0.33 8 8
. . . . 8 . . . . . 8 8 . . 8
8 Cu (*)> 8 0.73 8 8 8 8 8 8
1.08 8 1.3 I 3.3 8 0.21 8 0.31 s 8 I 8 8 8
t t» (eg) 8 0.18 8 8 1 8 8 8 8 0.36 t 0.48 8 0.38 8 8
. . . . . . . . 8 . . . . 8 8 . . . 8 8
>
* Htm of aft group 21-40 « Ilitff/Fiiilf
5.0 CONCLUSION Analytical results from the analysis of total diet
samples were, in general, similar to the calculated results from Bataan survey, but showed some differences compared with the FNRI values. However, because of the limited number of samples analyzed a conclusive analysis could not yet be deduced from these results.
The observed analytical and calculated results were in general lower compared with the Japanese value*, and much lower than the ICRP values. This clearly shows the necessity of having a Reference Asian Man for radiation protection purposes.
Toward this end, more diet samples will be analyzed to have representative quantitative data. A three-day total diet sample will be used for analysis in order to.get a smaller matrix variation. Sampling in Metro Manila, to represent urban area, as well as in selected rural areas will be tried. Also, calculations based on dietary survey from Metro Manila will be carried out to have an idea of the calculated values from.the urban area and be able to fairly compare with urban analytical results and rural analytical and calculated values. Economic status of the rural and urban sample population for both the analytical and calculated studies will be considered to have a better profile of •the country's dietary characteristics.
As a whole, the methodology could be used as guide by other member countries of the IAEA Coordinated Reference Man project who are just starting to obtain elemental composition of dietary samples.
ACKNOWLEDGEMENT; The authors would like to thank the Science and Technology
Agency of Japan, through the National Institite of Radiological Sciences, for making the analytical study possible, and the PNRI personnel who provided the food samples.
Special thanks is given to Ms. Lilia R. de la Paz and Ms. Elvie Sombrito of PNRI for their valuable comments and suggestions.
Many thanks also to Ms Teiko Sato of NIRS for her assistance in processing the analytical data.
21
REFERENCES 1. Maturu, N. Rao, "The Need for More Information on the Trace
Element Content of Foods for Improving Human Nutrition" IAEA TRS 197 Elemental Analysis of Biological Materials, pp 29-37, IAEA, Vienna (1980).
2. Food and Nutrition Research Institute, Food Composition Tables. Philippines <19B0). FNRI and NSDB, Manila.
3. Food and Nutrition Research Institute, First National Nutrition Survey. Philippioes. 197B. FNRI, Manila
4. Food and Nutrition Research Institute, Second National Nutrition Survey, Philippines. 1982. FNRI,Manila
5. Food and Nutrition Research Institute, Third National Nutr i t i on Survey. Philippines. 1987. FNRI, Manila.
6. Shiraishi, K., Kawamura, H., and Tanaka, 6. (1985) "Simultaneous Multielement Analysis of Total Diet Samples bv ICC Afc!V, Analytical Science* 1, 521-525.
/. Shiraishi,, K. , Kawamura, H. and lanaka, H. (17B6) "Daily Intake of Element's as Estimated from Analysis of Total Di'-t Samples in Relation to Reference Japanese Man" J_s_ Radiat. Res. 27, 121-129.
8. Shiraishi, K., Kawamura, H., Ouchi, M. , and Tanaka, 6. (1986) "Determination of 15 Mineral Elements in Total Diet Samples by ICP-AES", in Japanese, Nippon Eiyo Shokuryo Gakkaishi 39 (3), 209-215.
9. Shiraishi, K., Yamagami, Y., Kameoka,K. and Kawamura, H. (1938), "Mineral Contents in Model Diet Sample for Different Age Groups", Jj_ Nutr. Sci. Vitaminol. . 34, 55-65.
10. Shiraishi, K., Yoshimuzu, K., Tanaka, G. and Kawamura, H. (1989),"Daily Intake of 11 Elements in Relation to Reference Japanese Man", Health Physics. 57 (4) 551-557.
11. Marasigan, C.J., De la Paz, L.R., Estacio, F.J., and Palattao, M.V.B. "Age and Site Specific Consumption Coefficients for the Plume Exposure Pathway (PEP) of the Emergency Planning Zone (EPZ) of thePNPP-1, The Nucleus, vol n i l , no.l, 1984, Manila.
12. Marasigan, C.J., L.R. De La Paz, J.F.L. Estacio, M.V.fc<. Palattao, and A.B. Anden,"Dietary Usage Factor for Ingestion Dose Calculations", The Nucleus. vol xxlll, no. 1, 1985, Manila.
13. Wolnik, K.A., Fricke, F.L., Capar, S.6., Braude, G.L., Meyer. M.W. , Satzger, R.D. , and Bonnin, E. (1983a) J.. Aoric. Food
22
14. Evans . W.H. and D e l l a r D. (1982) A n a l y s t (London) 1 0 7 , 9 7 7 -9 9 3 .
15. Jones , John , W. "Food Samples" Q u a n t i t a t i v e T r a c e A n a l y s i s of B i o l o g i c a l M a t e r i a l s , Mc k e n z i e , Hugh H. and Smythe L l o y d E. eds . pp 3 5 3 - 3 6 5 , E l s e v i e r ( 1 9 6 3 ) .
16. M u n t e r , R . C . , Grande, R.A. and Ann, P .C. (1979) ICP I n f . N e w s l . 5 , 3 6 8 - 3 8 3 .
17 . Azanon, E . l i . , 6 . C . De Leon , L .R . de l a P a z , " C a l c u l a t i o n s of E lementa l I n t a k e s f rom Bataan D i e t a r y S u r v e y " , U n p u b l i s h e d .
18 . G e e n f i e l d , S . , Jones , I . L . and B a r r y , C . T . ( 1964 ) A n a l v s t ( L o n d o n ) , 8 9 , 7 1 3 - 7 2 0 .
19. G r e e n f i e l d , S. (1965) P r o c . Soc. A n a l . Chew. 2 , H l - 1 1 5 .
2 0 . Wendt, R .H . and F a s s e l , V . A . (1965) A n a l . Chem. 3 7 , 9 2 0 - 9 2 2 .
? 1 . K i m b e r l y , M . M . , D i P i e t r o , E . S . and P a s c h a l , D .C. "Emission Spect roscopy" Q u a n t i t a t i y e Trace A n a l y s i s of B i o l o g i c a l M a t e r i a l e , Mf l**n?if>, llnqh A. and ftrnvthe, I 1 oyr l , f . t?d*i pp 1 5 5 - 1 7 6 , E l s e v i e r .
2 2 . D a h l q u i s t , R .L . and K n o l l , J.W. (197B) A p p l . Spect rosc 3 2 , 1 - 3 0 .

Ne regret that som of the pages in the microfiche copy of this report may nol be up to the propei legibility standards ven though the be* possible copy was used for preparing " ter fiche UlsflimK: