perspective: tipping the scales: search for drifting constants from molecular spectra
TRANSCRIPT

THE JOURNAL OF CHEMICAL PHYSICS 140, 010901 (2014)
Perspective: Tipping the scales: Search for drifting constantsfrom molecular spectra
Paul Jansen, Hendrick L. Bethlem, and Wim UbachsDepartment of Physics and Astronomy, LaserLaB, VU University Amsterdam, De Boelelaan 1081,1081 HV Amsterdam, The Netherlands
(Received 29 October 2013; accepted 5 December 2013; published online 2 January 2014)
Transitions in atoms and molecules provide an ideal test ground for constraining or detecting apossible variation of the fundamental constants of nature. In this perspective, we review molecularspecies that are of specific interest in the search for a drifting proton-to-electron mass ratio μ.In particular, we outline the procedures that are used to calculate the sensitivity coefficients fortransitions in these molecules and discuss current searches. These methods have led to a rate ofchange in μ bounded to 6 × 10⁻¹⁴/yr from a laboratory experiment performed in the present epoch.On a cosmological time scale, the variation is limited to |�μ/μ| < 10−5 for look-back times of 10–12× 109 years and to |�μ/μ| < 10−7 for look-back times of 7× 10⁹ years. The last result, obtainedfrom high-redshift observation of methanol, translates into μ/μ = (1.4 ± 1.4) × 10−17/yr if a linearrate of change is assumed. © 2014 AIP Publishing LLC. [http://dx.doi.org/10.1063/1.4853735]
I. INTRODUCTION
The fine-structure constant, α ≈ 1/137, which determinesthe overall strength of the electromagnetic force, and theproton-to-electron mass ratio, μ = mp/me ≈ 1836, which re-lates the strengths of the forces in the strong sector to those inthe electro-weak sector,1 are the two dimensionless parame-ters that are required for the description of the gross structureof atomic and molecular systems.2 The values of these twoconstants ensure that protons are stable, that a large numberof heavy elements could form in the late evolution stage ofstars, and that complex molecules based on carbon chemistryexist.3 If these constants would have had only slightly differ-ent values, even by fractions of a percent, our Universe wouldhave looked entirely different. The question whether this finetuning is coincidental or if the constants can be derived from a– yet unknown – theory beyond the standard model of physics,is regarded as one of the deepest mysteries in science. One so-lution to this enigma may be that the values of the fundamen-tal constants of nature may vary in time, or may obtain differ-ent values in distinct parts of the (multi)-Universe. Searchesfor drifting constants are motivated by this perspective.
Theories that predict spatial-temporal variations of α andμ can be divided into three classes. The first class comprises aspecial type of quantum field theories that permit variation ofthe coupling strengths. Bekenstein4 postulated a scalar fieldfor the permittivity of free space; this quintessential field thencompensates the energy balance in varying α scenarios to ac-commodate energy conservation as a minimum requirementfor a theory. Based on this concept various forms of dila-ton theories with coupling to the electromagnetic part of theLagrangian were devised, combined with cosmological mod-els for the evolution of matter (including dark matter) anddark energy under the assumptions of general relativity. Suchscenarios provide a natural explanation for variation of fun-damental constants over cosmic history, i.e., as a function ofred-shift parameter z. The variation will freeze out under con-
ditions, where the dark energy content has taken over fromthe matter content in the Universe, a situation that has beenreached almost completely.5 These theories provide a ratio-nale for searches of drifting constants at large look-back timestoward the origin of the Universe, even if laboratory experi-ments in the modern epoch were to rule out such variations.The second class of theories connects drifting constants to theexistence of high order dimensions as postulated in many ver-sions of modern string theory.6 Kaluza-Klein theories, firstdevised in the 1920s, showed that formulations of electromag-netism in higher dimensions resulted in different effective val-ues of α, after compactification to the four observed dimen-sions. Finally, the third class of theories, known as Chameleonscenarios, postulate that additional scalar fields acquire massdepending on the local matter density.7
Experimental searches for temporal variation of funda-mental constants were put firmly on the agenda of contempo-rary physics by the ground-breaking study of Webb et al.8 Anindication of a varying α was detected by comparing metal ab-sorptions at high redshift with corresponding transitions thatwere measured in the laboratory. As the observed transitionshave in general a different dependence on α, a variation man-ifests itself as a frequency shift of a certain line with respectto another. This is the basis of the many-multiplet method forprobing a varying fine structure constant.9 The findings trig-gered numerous laboratory tests that compare transitions mea-sured in different atoms and molecules over the course of afew years and thus probe a much shorter time scale for driftingconstants. In later work, Webb and co-workers10, 11 found in-dication for a spatial variation of α in terms of a dipole acrossthe Universe.
Spectroscopy provides a search ground for probing driftsin both α and μ. While electronic transitions, including spin-orbit interactions, are sensitive to α, vibrational, rotational,and tunneling modes in molecules are sensitive to μ. Hyper-fine effects, such as in the Cs-atomic clock12, 13 and the 21-cmline of atomic hydrogen,14 depend on both α and μ, as do
0021-9606/2014/140(1)/010901/13/$30.00 © 2014 AIP Publishing LLC140, 010901-1
010901-2 Jansen, Bethlem, and Ubachs J. Chem. Phys. 140, 010901 (2014)
�-doublet transitions in molecules.15 The same holds forcombined high-redshift observations of a rotational transitionin CO and a fine structure transition in atomic carbon,16 plac-ing a tight constraint on the variation of the combination α2μ
at a redshift as high as z = 5.2. Within the framework of grandunification schemes theories have been developed that relatedrifts in μ and α via
�μ
μ= R
�α
α, (1)
where the proportionality constant R should be large, on theorder of 20–40, even though its sign is not predicted.1, 17 Thiswould imply that μ is a more sensitive test ground than α
when searching for varying constants.The sensitivity of a spectroscopic experiment searching
for a temporal variation of μ (and similarly for α) can be ex-pressed as (
∂μ
∂t
) /μ =
(∂ν
ν
)/(Kμ�t), (2)
assuming a linear drift. Here, (∂μ/∂t)/μ is the fractional rateof change of μ, ∂ν/ν is the fractional frequency precision ofthe measurement, Kμ is the inherent sensitivity of a transitionto a variation of μ, and �t is the time interval that is probed inthe experiment. For a sensitive test, one needs transitions thatare observed with a good signal to noise and narrow linewidth,and that exhibit high Kμ. In order to detect a possible variationof μ, at least two transitions possessing a different sensitivityare required.
Note that, for detecting a variation of μ, it is not nec-essary to actually determine its value. In fact, in most casesthis is impossible, since the exact relation between the valueof μ and the observed molecular transitions is not known.Only for the most simple systems such as H+
2 and HD+,recently it became feasible to directly extract informationon the value of μ from spectroscopic measurements.18, 19 Sofar, the numerical value of the proton-electron mass ratio,μ = 1836.15267245 (75), is known at a fractional accuracy of4.1 × 10−10 and included in CODATA,20, 21 while constraintson the fractional change of μ are below 10−14/yr, as will bediscussed in this paper.
The most stringent independent test of the time varia-tion of μ in the current epoch was set by comparing vi-brational transitions in SF6 with a cesium fountain over thecourse of two years. The SF6 transitions were measured witha fractional accuracy of ∼10−14 and have a sensitivity ofKμ = − 1
2 , whereas the sensitivity coefficient of the Cs tran-sition is Kμ ≈ −1,12, 13 resulting in a limit on the variation of�μ/μ of 5.6 × 10⁻¹⁴/yr.22
In order to improve the constraints – or to detect a time-variation – attention has shifted to molecular species that pos-sess transitions with greatly enhanced sensitivity coefficients.Unfortunately, the transitions that have an enhanced sensitiv-ity are often rather exotic, i.e., transitions involving highly ex-ited levels in complex molecules that pose considerable chal-lenges to experimentalists and are difficult or impossible toobserve in galaxies at high red-shift. Nevertheless, a num-ber of promising systems have been identified that might lead
to competitive laboratory and astrophysical tests in the nearfuture.
In this perspective, we review the current status of labo-ratory and astrophysical tests on a possible time-variation ofμ. In particular, we outline the procedures for determiningthe sensitivity coefficients for the different molecular species.Reviews on the topic of varying constants were presented byUzan,23 approaching the subject from a perspective of funda-mental physics, and by Kozlov and Levshakov,24 approachingthe topic from a molecular spectroscopy perspective.
II. DEFINITION OF SENSITIVITY COEFFICIENTS
The induced frequency shift of a certain transition as aresult of a drifting constant is – at least to first order – propor-tional to the fractional change in α and μ and is characterizedby its sensitivity coefficients Kα and Kμ via
�ν
ν= Kα
�α
α+ Kμ
�μ
μ, (3)
where �ν/ν = (νobs − ν0)/ν0 is the fractional change in thefrequency of the transition and �μ/μ = (μobs − μ0)/μ0 isthe fractional change in μ, both with respect to their current-day values. From Eq. (3), we can derive an expression for Kμ
(and similarly for Kα)
Kμ = μ
Ee − Eg
(dEe
dμ− dEg
dμ
), (4)
where Eg and Ee refer to the energy of the ground and excitedstate, respectively. Note that the concept of a ground state maybe extended to any lower state in a transition, even if this cor-responds to a metastable state or a short-lived excited state ina molecule. This definition of Kμ yields opposite signs to thatused in Refs. 25–27.
Although electronic transitions in atoms are sensitive toα, they are relatively immune to a variation of μ. For instance,the frequency of the radiation emitted by a hydrogen-like el-ement with nuclear charge Ze and mass number A in a transi-tion between levels a and b is given by
νab = Z2 μred
me
R∞
(1
n2a
− 1
n2b
), (5)
where μred = Ampme/(Amp + me) and R∞ is the Rydbergconstant. In order to find the sensitivity coefficients of thesetransitions, we apply Eq. (4) and obtain
Kμ = 1
1 + Aμ, (6)
resulting in sensitivity coefficients of 5.4 × 10⁻⁴ for thetransitions of the Lyman series in atomic hydrogen (A = 1).
Let us now turn to transitions in molecules. Within theframework of the Born-Oppenheimer approximation, the totalenergy of a molecule is given by a sum of uncoupled energycontributions, hence, we may rewrite Eq. (4) as
Kμ ≈∑
i Kiμ�Ei∑
i �Ei
, (7)
where the summation index i runs over the different en-ergy contributions, such as electronic, vibrational, and
010901-3 Jansen, Bethlem, and Ubachs J. Chem. Phys. 140, 010901 (2014)
rotational energy. It is generally assumed that the neutron-to-electron mass ratio follows the same behavior as the proton-to-electron mass ratio and no effects depending on quarkstructure persist.28 Under this assumption all baryonic mat-ter may be treated equally and μ is proportional to the massof the molecule. Hence, from the well-known isotopic scalingrelations we find Kel
μ = 0, Kvibμ = − 1
2 , and K rotμ = −1.
The inverse dependence of the sensitivity coefficient onthe transition frequency suggests that Kμ is enhanced for near-degenerate transitions, i.e., when the different energy contri-butions in the denominator of Eq. (7) cancel each other. Thisenhancement is proportional to the energy that is being can-celled and to the difference in the sensitivity coefficients ofthe energy terms. Since in general Eel � Evib � Erot, can-cellations between electronic, vibrational, and rotational ener-gies are unexpected. Nevertheless, transitions with enhancedsensitivity due to a cancellation of vibrational and electronicenergies have been identified in Cs2
29 and NH+.30 Whereascancellations between electronic and vibrational energies arepurely coincidental, near-degeneracies occur as a rule in morecomplex molecules such as molecular radicals or poly-atomicmolecules. These molecules have additional energy contribu-tions that are comparable in magnitude to rotational and vibra-tional energies and exhibit a different functional dependenceon μ. For instance, molecules in electronic states with non-zero electronic angular momentum have fine-structure split-tings that are comparable to vibrational splittings in heavymolecules31 and to rotational splittings in light molecules.32
Likewise, molecules that possess nuclear spin have hyper-fine splittings that can be comparable to rotational splittings.33
In polyatomic molecules, splittings due to classically forbid-den large-amplitude motions, such as inversion34–36 or inter-nal rotation,24, 37 can be comparable to rotational splittings.Finally, the Renner-Teller splitting that originates from theinteraction between electronic and vibrational angular mo-menta in linear polyatomic molecules, can be comparable torovibrational splittings.38
As discussed in the Introduction, the sensitivity of a testdepends both on the sensitivity coefficient and the fractionalprecision of the measured transition (see Eq. (2)). For en-hancements originating from cancellations between differ-ent modes of energy, the sensitivity scales as the inversefrequency, i.e., when two energy terms in the numerator ofEq. (4) are very similar, the sensitivity coefficient becomeslarge while the transition frequency becomes small. The res-olution of astrophysical observations is usually limited byDoppler broadening which implies that the fractional preci-sion, δν/ν, is independent of the frequency. Thus, for astro-physical tests the advantage of low frequency transitions withenhanced sensitivity is evident. For laboratory tests, the mo-tivation for choosing low frequency transitions is less obvi-ous. Due to the advances in frequency comb and optical clocktechniques, the fractional precision of optical transitions hasbecome superior to those in the microwave domain.39, 40 Itwas therefore argued by Zelevinsky et al.41 and others, thatthe best strategy for testing the time-variation of fundamentalconstants is to measure an as large as possible energy inter-val and accept the rather limited sensitivity coefficient that isassociated with it. It may be true that optical clocks have a
better fractional accuracy but microwave measurements stillhave a smaller absolute uncertainty. For instance, the mostaccurate optical clock based on a transition in Al+ at 267 nm(1.12 PHz) has a fractional accuracy of 2.3 × 10⁻¹⁷, whichcorresponds to an absolute uncertainty of 27 mHz,42 whilethe most accurate microwave clock, based on a transition inCesium at 9.2 GHz has a fractional accuracy of 2 × 10⁻¹⁶
corresponding to an absolute uncertainty of 2 μHz.43 It thusmakes sense to measure transitions in the microwave region,but only if favorable enhancement schemes are available. Anadditional advantage is that, in some well-chosen cases, tran-sitions with opposite sensitivity coefficients can be used toeliminate systematic effects.
The remainder of this paper can be divided into two parts.In the first part, consisting of Secs. III A and III B, the useof diatomic molecules in studies of a time-varying μ is dis-cussed. In particular, Sec. III A reviews the calculation ofsensitivity coefficients for rovibronic transitions in molecu-lar hydrogen and carbon monoxide and describes how thesetransitions are used to constrain temporal variation of μ ona cosmological time scale. Section III B shows that the dif-ferent mass dependence of rotational and spin-orbit constantsresults in “accidental” degeneracies for specific transitions.The second part of the paper consists of Secs. IV A–IV C anddiscusses the use of polyatomic molecules, in particular thosethat possess a classically forbidden tunneling motion.
III. TESTING THE TIME INDEPENDENCE OF μ
USING DIATOMIC MOLECULES
A. Transitions in molecular hydrogenand carbon monoxide
Molecular hydrogen has been the target species of choicefor μ variation searches on a cosmological time scale, in par-ticular at higher redshifts (z > 2). The wavelengths of theLyman and Werner absorption lines in H2 and HD can be de-tected in high-redshifted interstellar clouds and galaxies in theline of sight of quasars and may be compared with accuratemeasurements of the same transitions performed in laborato-ries on earth. While Thompson proposed using high-redshiftH2 lines as a search ground for a varying proton-electronmass ratio,44 Varshalovich and Levshakov45 first calculatedKμ sensitivity coefficients for the H2 molecule. Later updatedvalues for sensitivity coefficients of H2 were obtained in asemi-empirical (SE) fashion, based on newly establishedspectroscopic data,25, 26 and via ab initio (AI) calculations.46
In the semi-empirical approach, rovibrational level ener-gies of the relevant electronic states are fitted to a Dunhamexpansion47
E(ν, J ) =∑k,l
Ykl
(ν + 1
2
)k
[J (J + 1) − �2]l , (8)
where � is the projection of the orbital angular momentumon the molecular axis, i.e., � = 0 and 1 for � and states,respectively, and Ykl are the fitting parameters. The advan-tage of the Dunham representation of molecular states is thatthe coefficients scale to first order as Ykl ∝ μ
l−k/2red , with μred
the reduced mass of the molecule.26, 47 The coefficients from
010901-4 Jansen, Bethlem, and Ubachs J. Chem. Phys. 140, 010901 (2014)
the Dunham expansion can thus be used to determine the sen-sitivity coefficients through
dE
dμ=
∑k,l
dYkl
dμ
(ν + 1
2
)k
[J (J + 1) − �2]l ,
(9)
withdYkl
dμ≈ −Ykl
μ
(l + k
2
).
By inserting Eqs. (8) and (9) into Eq. (4), sensitivity co-efficients are obtained within the Born-Oppenheimer approx-imation. The mass dependence of the potential minima ofground and excited states is partly accounted for by includ-ing the adiabatic correction. Neglecting the dependence onthe nuclear potential, its effect is approximated to that of thenormal mass shift or Bohr shift,48 RH/R∞ = mp/(mp + me),on the levels of an electron bound to a H+
2 core, due to thefinite mass of the latter
�Ead = − �E∞2(μ + 1)
= −�E(μ)
2μ + 1, (10)
where �Eμ is the difference of the empirical Y00 values ofthe (deperturbed) B1�+
u or C1u state and the X1�+g ground
state. The mass dependence of Eq. (10) introduces an ad-ditional term that should be included in the parenthesis ofEq. (4) representing the adiabatic correction
d
dμ�Ead = − �Ead
μ + 1. (11)
In order to account for nonadiabatic interaction, mix-ing between different electronic states should be included.In Refs. 25 and 26, a model is adopted in which the multi-dimensional problem is approximated by incorporating onlythe interaction of the dominant electronic states. The valuesfor the resulting interaction matrix elements are obtained froma fit to the experimental data. This procedure provides boththe deperturbed level energies to which the Dunham coef-ficients are fitted, as well as the superposition coefficientsof the mixed states, ci. The sensitivity coefficients for theperturbed states are given by
Kμ =∑
i
c2i K
iμ, (12)
where i = 0 refers to the state under consideration and Kiμ are
the sensitivity coefficients of the perturbing states. In particu-lar for some levels where a strong interaction between B 1�+
u
and C 1u states occurs, the non-adiabatic interaction con-tributes significantly to the values of Kμ.
The procedures, following this SE procedure outlinedin the above, yield Kμ coefficients for the Lyman lines (inthe B 1�+
u –X 1�+g system) and Werner lines (in the C 1u–
X 1�+g system) in the range (−0.05, +0.02). These re-
sults agree with values obtained from AI calculations within�Kμ = KAI
μ − KSEμ < 3 × 10⁻⁴, so at the 1% level, provid-
ing confidence that a reliable set of sensitivity coefficients forH2 is available. For the HD molecule, a set of Kμ coefficientswas obtained via ab initio calculations.50
A full set of accurate laboratory wavelengths wasobtained in spectroscopic studies with the Amsterdam nar-rowband extreme ultraviolet (XUV) laser setup. Coherent
and tunable radiation at wavelengths 92–112 nm is producedstarting from a Nd:VO4-pumped continuous wave (CW) ringdye laser, subsequent pulse amplification in a three-stagetraveling-wave pulsed dye amplifier, frequency doubling ina KDP-crystal to produce UV-light, and third harmonic gen-eration in a pulsed jet of Xe gas.51 The spectroscopy of thestrong dipole allowed transitions in the Lyman bands andWerner bands was performed in a configuration with a col-limated beam of H2 molecules perpendicularly crossing theoverlapping XUV and UV beams via the method of 1 + 1resonance-enhanced photo-ionization. Calibration of theabsolute frequency scale in the XUV was established via com-parison of the CW-output of the ring laser with on-line record-ing of saturated absorption lines of I2 and fringes of a Fabry-Perot interferometer, which was stabilized against of HeNelaser. Wavelength uncertainties, for the major part related toresidual Doppler effects, AC-Stark induced effects and fre-quency chirp in the pulsed dye amplifier, as well as to sta-tistical effects, were carefully addressed leading to calibratedtransition frequencies of the Lyman and Werner band lines inthe range 92–112 nm at an absolute accuracy of 0.004 cm−1
or 0.000004 nm, corresponding to a relative accuracy of5 × 10−8. A detailed description of the experimental proce-dures and of the results is given in a sequence of papers.52–54
Similar investigations of the XUV-laser spectrum of HD wereperformed in view of the fact that HD lines were also observedin high-redshift spectra towards quasar sources.55, 56
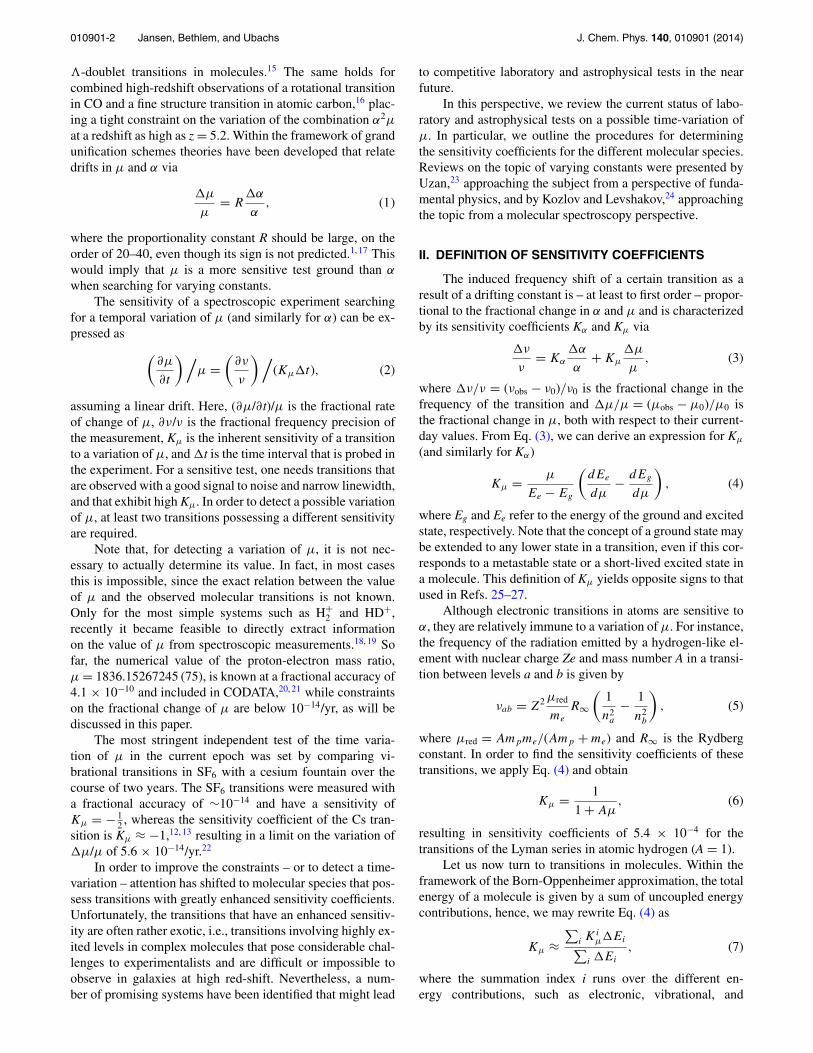
Additional spectroscopic studies of H2 were performedassessing the level energies in these excited states in an indi-rect manner, thereby verifying and even improving the tran-sition frequencies in the Lyman and Werner bands.57, 58 Thedata set of laboratory wavelengths obtained for both H2 andHD, has reached an accuracy that can be considered exact forthe purpose of comparison with quasar data, where accuraciesare never better than 10−7. A typical recording of a HD line isshown in Fig. 1. A full listing of all relevant parameters on the
94849.0 94849.5 94850.0 94850.5
wavenumber (cm-1)
HDB – X(4,0) R(0)
105.4295105.4300105.4305105.4310
wavelength (nm)
*
FIG. 1. Representative high-resolution spectrum. Recording of the R(0) linein the B − X(4, 0) band of HD (upper) with etalon markers (lower) and an I2-saturation spectrum (middle) for calibration. The line marked with an asterisk(*) is the a2 hyperfine component of the B − X(8, 4) R(49) transition line inI2 at 15 808.13518 cm−1 used as an absolute reference.49 Note that the I2 andetalon spectra shown is at the 6th fundamental, whereas the XUV axis shownis the 6th harmonic.
010901-5 Jansen, Bethlem, and Ubachs J. Chem. Phys. 140, 010901 (2014)
laboratory absorption spectrum of H2 and HD, including in-formation on the intensities, is made available in digital formin the supplementary material of Ref. 56.
High quality data on high redshift absorbing systems, interms of signal-to-noise (S/N) and resolution, is available onlyfor a limited number of objects. In view of the transparencywindow of the earth’s atmosphere (λ > 300 nm), absorbingsystems at z > 2 will reveal a sufficient number of lines toperform a �μ/μ constraining analysis. The systems observedand analyzed so far are: Q0347-383 at zabs = 3.02, Q0405-443 at zabs = 2.59, Q0528-250 at zabs = 2.81, Q2123-005 atzabs = 2.05, and Q2348-011 at zabs = 2.42. Note that the ob-jects denoted by “Q” are background quasars, which in moststudies focusing on H2 spectra are considered as backgroundlight sources, and are indicated by their approximate right as-cension (in hours, minutes, and seconds) as a first coordinateand by their declination (in degrees, arcminutes, and arcsec-onds, north with “+” and south with “−”) as a second coor-dinate. Hence, Q0347-383 refers to a bright quasar locatedat RA = 03:49:43.64 and dec = −38:10:30.6 in so-calledJ2000 coordinates (the slight discrepancies in numbers relateto the fact that most quasars were discovered some 30 yearsago, in the epoch when the B1950 coordinate system was inuse; hence, they derive their names from the older, shiftedcoordinate frame). These coordinates imply that Q0347-383is observable during night-time observations in October anda few months before and after. This quasar source is knownto be located at zemis = 3.21 from a Lyman-α intensity peakin its emission spectrum, while the absorbing galaxy contain-ing one or more clouds with H2 is at zabs = 3.02. From theanalysis of the redshifted H2 spectrum, a 7-digit accuracyvalue for the redshift is obtained, in the case of Q0347-383zabs = 3.024 899 0(12).25 Such an accurate determination ofzabs is required for the μ-variation analysis, since it sets theexact value of the Doppler shift of the absorbing cloud.
Relevant parameters for the analysis are the H2 col-umn density, which should be sufficient to yield absorptionof at least the lowest J-levels, hence, N(H2) >1014 cm−2
and lower than 1019 cm−2 to avoid full saturation of thelines, and the brightness of the background quasar whichshould produce a high S/N in a reasonable amount of ob-serving time. The absorbing system toward Q2123-005 hasthe favorable condition that the magnitude of the quasarbackground source (Rmag = 15.8) is the brightest of all H2
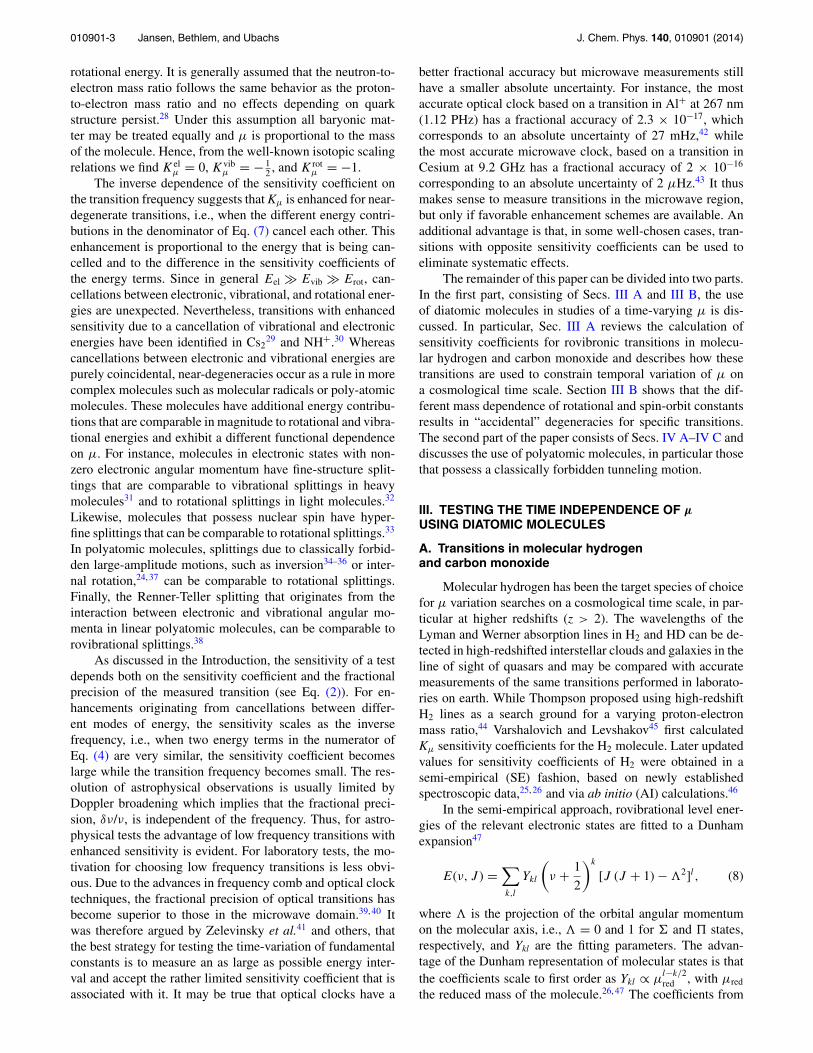
bearing systems observed so far. This system has been ob-served from both the Very Large Telescope (VLT) (Paranal,Chile), equipped with the Ultraviolet-Visible Echelle Spec-trometer (UVES) and with the Keck Telescope (Hawaii,USA) equipped with the HIRES spectrometer. For a com-parison of observed spectra, see Fig. 2. The results fromthe analyses, �μ/μ = (5.6 ± 5.5stat ± 2.9syst) × 10−6 forthe Keck spectrum59 and �μ/μ = (8.5 ± 3.6stat ± 2.2syst)× 10−6 for the VLT spectrum,60 are tightly constraining andin good agreement with each other. This result eases con-cerns on systematic effects associated with each of the in-struments. Brightness of the other background quasars is typ-ically Rmag = 17.5, while Q2348-011 is the weakest withRmag = 18.3. The latter only delivered a poor constraintfor reasons of low brightness and from a second damped-
3098 3100 3102 3104
3098 3100 3102 3104
0
1
0
1
Nor
mal
ized
Flu
x
W0Q3 L7R0 L7R1 W0R5 L7P1W0P3
L7R2 W0Q4
Wavelength ( )A
W0Q3 L7R0 L7R1 W0R5 L7P1W0P3
L7R2 W0Q4
UVE
S-VLT
HIRES-Keck
FIG. 2. Comparison between the spectrum of Q2123-005 in the 3097–3106 Å range observed with HIRES-Keck59 (upper panel) and UVES-VLT60
(lower panel). For both panels, fits to the molecular hydrogen lines are shownas the solid green lines and their velocity components are indicated by thetick marks that are shown above the spectrum. Tick marks indicating the po-sitions of Lyman-α lines and Fe II lines are shown with a slight offset. H2spectral line identifications are shown at the bottom. Residuals from the fitare shown above the observed spectra.
Lyman absorber taking away many H2 lines by its Lymancutoff.61
Since the number of suitable H2 absorber systems at highredshift is rather limited, additional schemes are required toimprove the current constraint on μ variation at redshiftsz > 1. Recent observations of vacuum ultraviolet transitions incarbon monoxide at high redshift64–67 make CO a promisingtarget species for probing variation of μ. An additional advan-tage of the CO A − X bands is that its wavelengths range from130 to 154 nm, that is, at longer wavelengths than Lyman-α,so that the CO spectral features in typical quasar spectra willfall outside the region of the so-called Lyman-α forest (pro-vided that the emission redshift of the quasar zem is not toofar from the redshift zabs of the intervening galaxy exhibit-ing the molecular absorption). The occurrence of the Lyman-forest lines is a major obstacle in the search for μ variationvia molecular hydrogen lines.
In order to prepare for a μ-variation analysis, accu-rate laboratory measurements on the A − X system of COwere performed, using laser-based excitation and Fourier-transform absorption spectroscopy,27 yielding transition fre-quencies at an accuracy better than �λ/λ = 3 × 10⁻⁷. Alsoa calculation of Kμ sensitivity coefficients was performed,which required a detailed analysis of the structure of the A1
state of CO and its perturbation by a number of nearby lyingsinglet and triplet states.68
B. Near-degeneracies in diatomic radicals
In Sec. III A, we discussed sensitivity coefficients fortransitions in diatomics with closed-shell electronic states,that is, molecules that have zero electronic orbital angularmomentum.
Let us now turn to diatomic open-shell molecules in a2 electronic state that have a nonzero projection of orbitalangular momentum along the molecular axis. The overallangular momentum J depends on the coupling between the
010901-6 Jansen, Bethlem, and Ubachs J. Chem. Phys. 140, 010901 (2014)
orbital angular momentum L, the spin angular momentum S,and the rotational angular momentum R. Depending on theenergy scales that are associated with these momenta, the cou-pling between the vectors is described by the different Hund’scases.
When only rotation and spin-orbit coupling are consid-ered, the Hamiltonian matrix for a 2 electronic state in aHund’s case (a) basis is given by69(
12A + Bz −B
√z
−B√
z − 12A + B (z + 2)
),
(13)
with z =(
J + 1
2
)2
− 1,
where A and B refer to the spin-orbit and rotational constant,respectively. For a given value of J, the lower energy level islabelled as F1 and the upper as F2. The eigenfunctions of theHamiltonian matrix (13) are
|F2〉 = aJ
∣∣ 32
⟩ − bJ
∣∣ 12
⟩and |F1〉 = bJ
∣∣ 32
⟩ + aJ
∣∣ 12
⟩,
(14)where
a2J = X + (A − 2B)
2X, and b2
J = X − (A − 2B)
2X, (15)
and
X =√
(A − 2B)2 + 4B2z. (16)
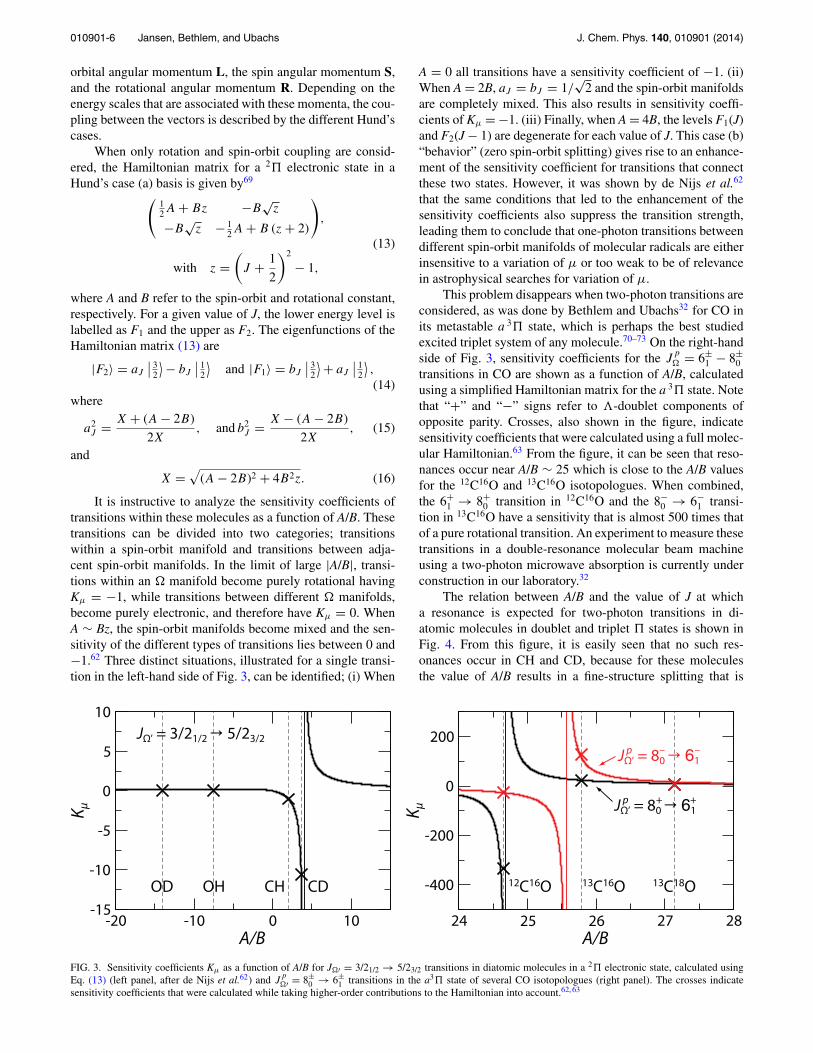
It is instructive to analyze the sensitivity coefficients oftransitions within these molecules as a function of A/B. Thesetransitions can be divided into two categories; transitionswithin a spin-orbit manifold and transitions between adja-cent spin-orbit manifolds. In the limit of large |A/B|, transi-tions within an � manifold become purely rotational havingKμ = −1, while transitions between different � manifolds,become purely electronic, and therefore have Kμ = 0. WhenA ∼ Bz, the spin-orbit manifolds become mixed and the sen-sitivity of the different types of transitions lies between 0 and−1.62 Three distinct situations, illustrated for a single transi-tion in the left-hand side of Fig. 3, can be identified; (i) When
A = 0 all transitions have a sensitivity coefficient of −1. (ii)When A = 2B, aJ = bJ = 1/
√2 and the spin-orbit manifolds
are completely mixed. This also results in sensitivity coeffi-cients of Kμ = −1. (iii) Finally, when A = 4B, the levels F1(J)and F2(J − 1) are degenerate for each value of J. This case (b)“behavior” (zero spin-orbit splitting) gives rise to an enhance-ment of the sensitivity coefficient for transitions that connectthese two states. However, it was shown by de Nijs et al.62
that the same conditions that led to the enhancement of thesensitivity coefficients also suppress the transition strength,leading them to conclude that one-photon transitions betweendifferent spin-orbit manifolds of molecular radicals are eitherinsensitive to a variation of μ or too weak to be of relevancein astrophysical searches for variation of μ.
This problem disappears when two-photon transitions areconsidered, as was done by Bethlem and Ubachs32 for CO inits metastable a 3 state, which is perhaps the best studiedexcited triplet system of any molecule.70–73 On the right-handside of Fig. 3, sensitivity coefficients for the J
p
� = 6±1 − 8±
0transitions in CO are shown as a function of A/B, calculatedusing a simplified Hamiltonian matrix for the a 3 state. Notethat “+” and “−” signs refer to �-doublet components ofopposite parity. Crosses, also shown in the figure, indicatesensitivity coefficients that were calculated using a full molec-ular Hamiltonian.63 From the figure, it can be seen that reso-nances occur near A/B ∼ 25 which is close to the A/B valuesfor the 12C16O and 13C16O isotopologues. When combined,the 6+
1 → 8+0 transition in 12C16O and the 8−
0 → 6−1 transi-
tion in 13C16O have a sensitivity that is almost 500 times thatof a pure rotational transition. An experiment to measure thesetransitions in a double-resonance molecular beam machineusing a two-photon microwave absorption is currently underconstruction in our laboratory.32
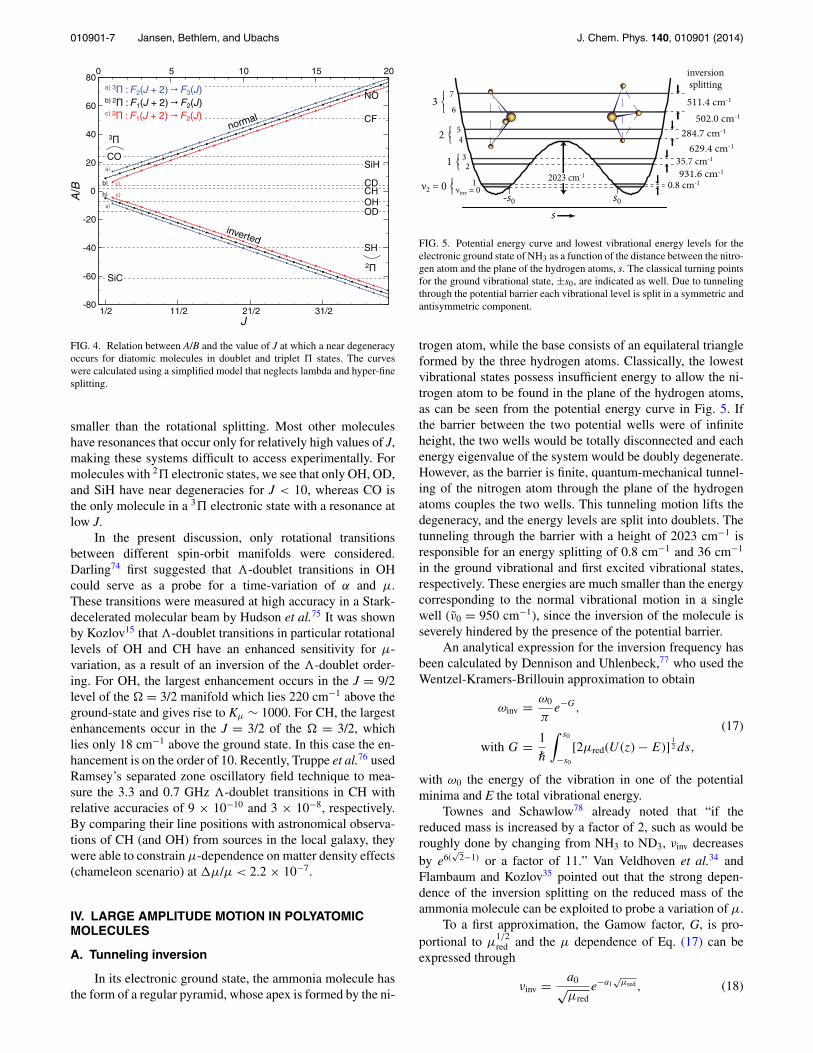
The relation between A/B and the value of J at whicha resonance is expected for two-photon transitions in di-atomic molecules in doublet and triplet states is shown inFig. 4. From this figure, it is easily seen that no such res-onances occur in CH and CD, because for these moleculesthe value of A/B results in a fine-structure splitting that is
FIG. 3. Sensitivity coefficients Kμ as a function of A/B for J�′ = 3/21/2 → 5/23/2 transitions in diatomic molecules in a 2 electronic state, calculated usingEq. (13) (left panel, after de Nijs et al.62) and J
p�′ = 8±
0 → 6±1 transitions in the a3 state of several CO isotopologues (right panel). The crosses indicate
sensitivity coefficients that were calculated while taking higher-order contributions to the Hamiltonian into account.62, 63
010901-7 Jansen, Bethlem, and Ubachs J. Chem. Phys. 140, 010901 (2014)
FIG. 4. Relation between A/B and the value of J at which a near degeneracyoccurs for diatomic molecules in doublet and triplet states. The curveswere calculated using a simplified model that neglects lambda and hyper-finesplitting.
smaller than the rotational splitting. Most other moleculeshave resonances that occur only for relatively high values of J,making these systems difficult to access experimentally. Formolecules with 2 electronic states, we see that only OH, OD,and SiH have near degeneracies for J < 10, whereas CO isthe only molecule in a 3 electronic state with a resonance atlow J.
In the present discussion, only rotational transitionsbetween different spin-orbit manifolds were considered.Darling74 first suggested that �-doublet transitions in OHcould serve as a probe for a time-variation of α and μ.These transitions were measured at high accuracy in a Stark-decelerated molecular beam by Hudson et al.75 It was shownby Kozlov15 that �-doublet transitions in particular rotationallevels of OH and CH have an enhanced sensitivity for μ-variation, as a result of an inversion of the �-doublet order-ing. For OH, the largest enhancement occurs in the J = 9/2level of the � = 3/2 manifold which lies 220 cm−1 above theground-state and gives rise to Kμ ∼ 1000. For CH, the largestenhancements occur in the J = 3/2 of the � = 3/2, whichlies only 18 cm−1 above the ground state. In this case the en-hancement is on the order of 10. Recently, Truppe et al.76 usedRamsey’s separated zone oscillatory field technique to mea-sure the 3.3 and 0.7 GHz �-doublet transitions in CH withrelative accuracies of 9 × 10⁻¹⁰ and 3 × 10⁻⁸, respectively.By comparing their line positions with astronomical observa-tions of CH (and OH) from sources in the local galaxy, theywere able to constrain μ-dependence on matter density effects(chameleon scenario) at �μ/μ < 2.2 × 10⁻⁷.
IV. LARGE AMPLITUDE MOTION IN POLYATOMICMOLECULES
A. Tunneling inversion
In its electronic ground state, the ammonia molecule hasthe form of a regular pyramid, whose apex is formed by the ni-
s0
s
2023 cm-1
inversionsplitting
0.8 cm-1νinv = 0
1
45
6
7
23
⎧⎨⎩
⎧⎨⎩
⎧⎨⎩
⎧⎨⎩
3
ν2 = 0
1
2
35.7 cm-1
284.7 cm-1
511.4 cm-1
502.0 cm-1
629.4 cm-1
931.6 cm-1
-s0
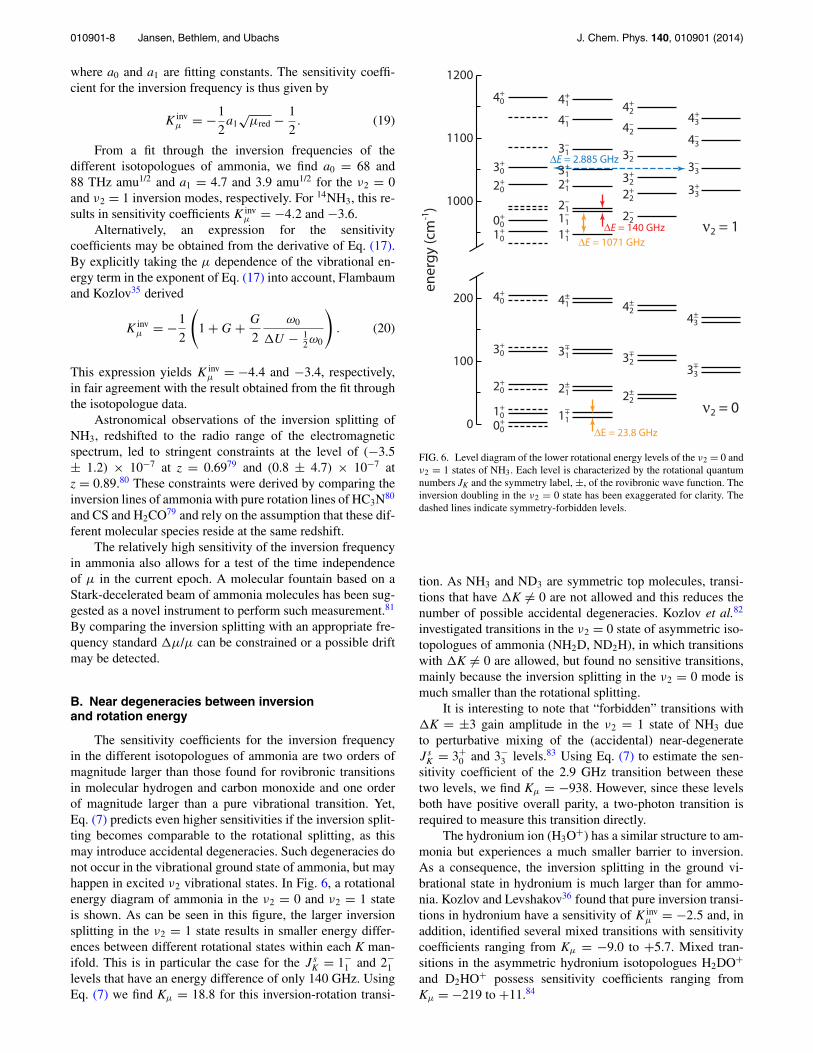
FIG. 5. Potential energy curve and lowest vibrational energy levels for theelectronic ground state of NH3 as a function of the distance between the nitro-gen atom and the plane of the hydrogen atoms, s. The classical turning pointsfor the ground vibrational state, ±s0, are indicated as well. Due to tunnelingthrough the potential barrier each vibrational level is split in a symmetric andantisymmetric component.
trogen atom, while the base consists of an equilateral triangleformed by the three hydrogen atoms. Classically, the lowestvibrational states possess insufficient energy to allow the ni-trogen atom to be found in the plane of the hydrogen atoms,as can be seen from the potential energy curve in Fig. 5. Ifthe barrier between the two potential wells were of infiniteheight, the two wells would be totally disconnected and eachenergy eigenvalue of the system would be doubly degenerate.However, as the barrier is finite, quantum-mechanical tunnel-ing of the nitrogen atom through the plane of the hydrogenatoms couples the two wells. This tunneling motion lifts thedegeneracy, and the energy levels are split into doublets. Thetunneling through the barrier with a height of 2023 cm−1 isresponsible for an energy splitting of 0.8 cm−1 and 36 cm−1
in the ground vibrational and first excited vibrational states,respectively. These energies are much smaller than the energycorresponding to the normal vibrational motion in a singlewell (ν0 = 950 cm−1), since the inversion of the molecule isseverely hindered by the presence of the potential barrier.
An analytical expression for the inversion frequency hasbeen calculated by Dennison and Uhlenbeck,77 who used theWentzel-Kramers-Brillouin approximation to obtain
ωinv = ω0
πe−G,
(17)
with G = 1
¯
∫ s0
−s0
[2μred(U (z) − E)]12 ds,
with ω0 the energy of the vibration in one of the potentialminima and E the total vibrational energy.
Townes and Schawlow78 already noted that “if thereduced mass is increased by a factor of 2, such as would beroughly done by changing from NH3 to ND3, νinv decreasesby e6(
√2−1) or a factor of 11.” Van Veldhoven et al.34 and
Flambaum and Kozlov35 pointed out that the strong depen-dence of the inversion splitting on the reduced mass of theammonia molecule can be exploited to probe a variation of μ.
To a first approximation, the Gamow factor, G, is pro-portional to μ
1/2red and the μ dependence of Eq. (17) can be
expressed through
νinv = a0√μred
e−a1√
μred , (18)
010901-8 Jansen, Bethlem, and Ubachs J. Chem. Phys. 140, 010901 (2014)
where a0 and a1 are fitting constants. The sensitivity coeffi-cient for the inversion frequency is thus given by
K invμ = −1
2a1
√μred − 1
2. (19)
From a fit through the inversion frequencies of thedifferent isotopologues of ammonia, we find a0 = 68 and88 THz amu1/2 and a1 = 4.7 and 3.9 amu1/2 for the ν2 = 0and ν2 = 1 inversion modes, respectively. For 14NH3, this re-sults in sensitivity coefficients K inv
μ = −4.2 and −3.6.Alternatively, an expression for the sensitivity
coefficients may be obtained from the derivative of Eq. (17).By explicitly taking the μ dependence of the vibrational en-ergy term in the exponent of Eq. (17) into account, Flambaumand Kozlov35 derived
K invμ = −1
2
(1 + G + G
2
ω0
�U − 12ω0
). (20)
This expression yields K invμ = −4.4 and −3.4, respectively,
in fair agreement with the result obtained from the fit throughthe isotopologue data.
Astronomical observations of the inversion splitting ofNH3, redshifted to the radio range of the electromagneticspectrum, led to stringent constraints at the level of (−3.5± 1.2) × 10−7 at z = 0.6979 and (0.8 ± 4.7) × 10−7 atz = 0.89.80 These constraints were derived by comparing theinversion lines of ammonia with pure rotation lines of HC3N80
and CS and H2CO79 and rely on the assumption that these dif-ferent molecular species reside at the same redshift.
The relatively high sensitivity of the inversion frequencyin ammonia also allows for a test of the time independenceof μ in the current epoch. A molecular fountain based on aStark-decelerated beam of ammonia molecules has been sug-gested as a novel instrument to perform such measurement.81
By comparing the inversion splitting with an appropriate fre-quency standard �μ/μ can be constrained or a possible driftmay be detected.
B. Near degeneracies between inversionand rotation energy
The sensitivity coefficients for the inversion frequencyin the different isotopologues of ammonia are two orders ofmagnitude larger than those found for rovibronic transitionsin molecular hydrogen and carbon monoxide and one orderof magnitude larger than a pure vibrational transition. Yet,Eq. (7) predicts even higher sensitivities if the inversion split-ting becomes comparable to the rotational splitting, as thismay introduce accidental degeneracies. Such degeneracies donot occur in the vibrational ground state of ammonia, but mayhappen in excited ν2 vibrational states. In Fig. 6, a rotationalenergy diagram of ammonia in the ν2 = 0 and ν2 = 1 stateis shown. As can be seen in this figure, the larger inversionsplitting in the ν2 = 1 state results in smaller energy differ-ences between different rotational states within each K man-ifold. This is in particular the case for the J s
K = 1−1 and 2−
1levels that have an energy difference of only 140 GHz. UsingEq. (7) we find Kμ = 18.8 for this inversion-rotation transi-
43–
33–
33+
43+
42–
32–
22–
32+
42+
22+
41–
31–
21–
40+
30+
20+
00+
31+
41+
21+
11–
11+10
+
40+
30+
20+
10+
1200
1100
1000
200
100
0 00+
41±
22±21
±
±31
±11
43±
±33
42±
±32
ΔE = 140 GHz
ΔE = 2.885 GHz
ΔE = 1071 GHz
ν2 = 0
ν2 = 1
ener
gy
(cm
-1)
ΔE = 23.8 GHz
FIG. 6. Level diagram of the lower rotational energy levels of the ν2 = 0 andν2 = 1 states of NH3. Each level is characterized by the rotational quantumnumbers JK and the symmetry label, ±, of the rovibronic wave function. Theinversion doubling in the ν2 = 0 state has been exaggerated for clarity. Thedashed lines indicate symmetry-forbidden levels.
tion. As NH3 and ND3 are symmetric top molecules, transi-tions that have �K �= 0 are not allowed and this reduces thenumber of possible accidental degeneracies. Kozlov et al.82
investigated transitions in the ν2 = 0 state of asymmetric iso-topologues of ammonia (NH2D, ND2H), in which transitionswith �K �= 0 are allowed, but found no sensitive transitions,mainly because the inversion splitting in the ν2 = 0 mode ismuch smaller than the rotational splitting.
It is interesting to note that “forbidden” transitions with�K = ±3 gain amplitude in the ν2 = 1 state of NH3 dueto perturbative mixing of the (accidental) near-degenerateJ s
K = 3+0 and 3−
3 levels.83 Using Eq. (7) to estimate the sen-sitivity coefficient of the 2.9 GHz transition between thesetwo levels, we find Kμ = −938. However, since these levelsboth have positive overall parity, a two-photon transition isrequired to measure this transition directly.
The hydronium ion (H3O+) has a similar structure to am-monia but experiences a much smaller barrier to inversion.As a consequence, the inversion splitting in the ground vi-brational state in hydronium is much larger than for ammo-nia. Kozlov and Levshakov36 found that pure inversion transi-tions in hydronium have a sensitivity of K inv
μ = −2.5 and, inaddition, identified several mixed transitions with sensitivitycoefficients ranging from Kμ = −9.0 to +5.7. Mixed tran-sitions in the asymmetric hydronium isotopologues H2DO+
and D2HO+ possess sensitivity coefficients ranging fromKμ = −219 to +11.84

010901-9 Jansen, Bethlem, and Ubachs J. Chem. Phys. 140, 010901 (2014)
C. Internal rotation: From methanol to methylamine
While inversion doublets of ammonia-like moleculesexhibit large sensitivity coefficients, even larger sensitivitycoefficients arise for molecules that exhibit internally hin-dered rotation, in which one part of a molecule rotates withrespect to the remainder. This is another example of a clas-sically forbidden tunneling motion that is frequently encoun-tered in polyatomic molecules. This subject of the interactionbetween such hindered rotation, also referred to as torsion,and its quantum mechanical description has been investigatedsince the 1950s.85–90
In this section, we outline the procedure for obtaining thesensitivity coefficients in internal rotor molecules containinga C3v symmetry group and show that a particular combinationof molecular parameters can be identified that results in thehighest sensitivity coefficients. The fact that methanol pos-sesses transitions with enhanced sensitivity coefficients wasdiscovered independently by Jansen et al.37 and by Levshakovet al.91
One of the simplest molecules that exhibits hinderedinternal rotation is methanol (CH3OH). Methanol, schemat-ically depicted on the right-hand side of Fig. 7, consists ofa methyl group (CH3) with a hydroxyl group (OH) attached.The overall rotation of the molecule is described by three ro-tational constants A, B, and C, associated with the momentsof inertia Ia, Ib, and Ic, respectively, along the three princi-pal axes of the molecule. The total angular momentum of themolecule is given by the quantum number J, while the projec-tion of J onto the molecule fixed axis is given by K.
In addition to the overall rotation, the flexible CO bondallows the methyl group to rotate with respect to the hydroxylgroup, denoted by the relative angle γ . This internal rota-tion is not free but hindered by a threefold potential barrier,92
shown on the left-hand side of Fig. 7, with minima and max-ima that correspond to the staggered and eclipsed configura-tion of the molecule, respectively. The vibrational levels inthis well are denoted by ν t.
When we neglect the slight asymmetry of the moleculeas well as higher-order terms in the potential and centrifu-gal distortions, the lowest-order Hamiltonian can be written
FIG. 7. Variation of the potential energy of methanol with the relative rota-tion of the OH group with respect to the CH3 group and a schematic repre-sentation of the molecule. Shown are the J = 1, |K| = 1 energies of the lowesttorsion-vibrational levels.
as
H = 1
2
P 2a
Ia
+ 1
2
P 2b
Ib
+ 1
2
P 2c
Ic
+ 1
2
1
Iredp2
γ + 1
2V3(1−cos 3γ ),
(21)
with Ired = Ia1Ia2
Ia
.
The first three terms describe the overall rotation aroundthe a, b, and c axis, respectively. The fourth term describes theinternal rotation around the a axis, with Ired the reduced mo-ment of inertia along the a-axis, Ia2 the moment of inertia ofthe methyl group along its own symmetry axis and Ia1 the partof Ia that is attributed to the OH group; Ia1 = Ia − Ia2. Notethat in the derivation of Eq. (21) an axis transformation wasapplied in order to remove the coupling between internal andoverall rotation. The fifth term is the lowest order term aris-ing from the torsional potential. If the potential were infinitelyhigh, the threefold barrier would result in three separate har-monic potentials, whereas the absence of the potential barrierwould result in doubly degenerate free-rotor energy levels.In the case of a finite barrier, quantum-mechanical tunnelingmixes the levels in different wells of the potential. As a result,each rotational level is split into three levels of different tor-sional symmetry, labeled as A, E1, or E2. Following Lees,90
E1 and E2-symmetries are labeled by the sign of K; i.e, levelswith E1-symmetry are denoted by a positive K-value, whereaslevels with E2-symmetry are denoted by a negative K-value.For K �= 0, A levels are further split into ± components bymolecular asymmetry. For K = 0, only single E and A+ levelsexist.
The splitting between the different symmetry levels isrelated to the tunneling frequency between the different tor-sional potential wells and is therefore very sensitive to thereduced moment of inertia, similar to the inversion of the am-monia molecule. It was shown by Jansen et al.37, 93 that a puretorsional transition in methanol has a sensitivity coefficient ofKμ = −2.5. However, pure torsional transitions are forbid-den, since they possess a different torsional symmetry. Sen-sitivity coefficients for allowed transitions in methanol andother internal rotor molecules can be obtained by calculatingthe level energies as a function of μ and taking the numericalderivative, in accordance with Eq. (4). This can be achievedby scaling the different parameters in the molecular Hamilto-nian according to their μ dependence. The physical interpre-tation of the lowest-order constants is straightforward and thescaling relations can be derived unambiguously. Higher orderparameters pose a problem since their physical interpretationis not always clear. Jansen et al.37, 93 derived the scaling rela-tions for these higher-order constants by considering them aseffective products of lower-order torsional and rotational op-erators. Ilyushin et al.94 showed that the scaling of the higherorder constants only contributes marginally to the sensitivitycoefficient of a transition.
Jansen et al.37, 93 employed the state-of-the art effectiveHamiltonian that is implemented in the BELGI code95 togetherwith a set of 119 molecular parameters.96, 97 Similar calcula-tions were performed by Levshakov et al.91 using a simplermodel containing only six molecular parameters. The two re-sults are in excellent agreement and sensitivity coefficients for
010901-10 Jansen, Bethlem, and Ubachs J. Chem. Phys. 140, 010901 (2014)
Relative Velocity (km s-1)
0
-0.1
Lin
e-to
-Co
nti
nu
um
Rati
o (%
)
Kµ = -33
120600-60-120
3-1 20 E
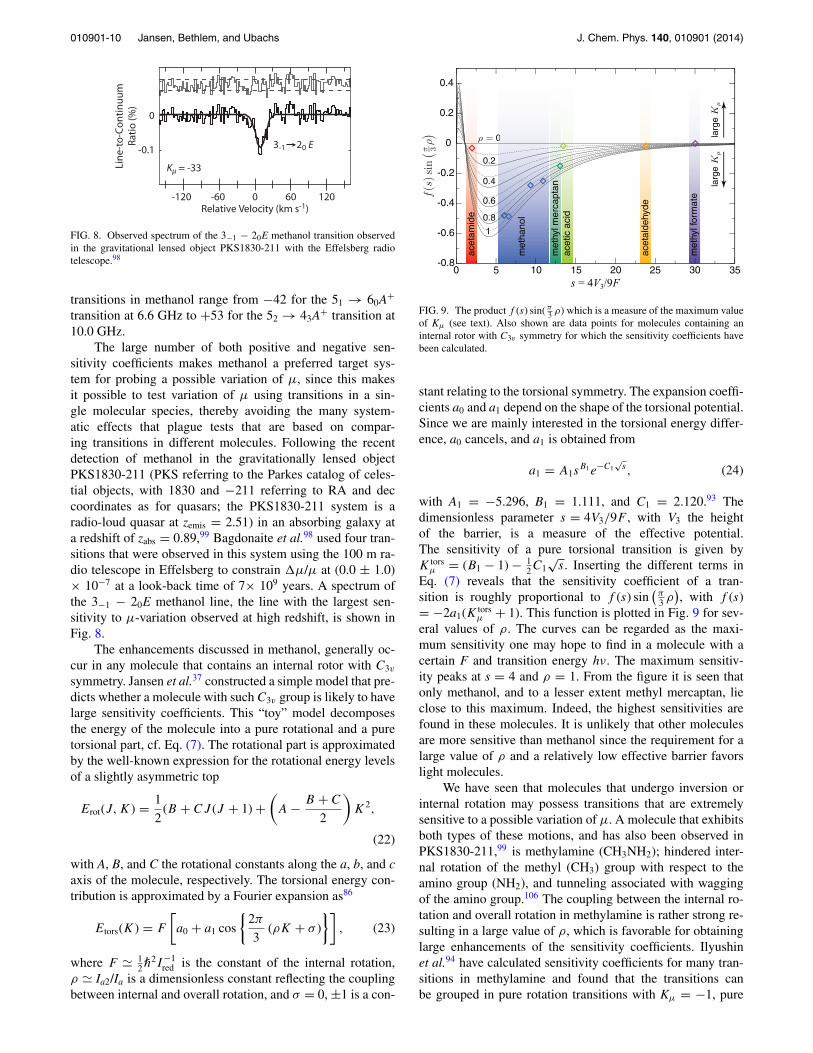
FIG. 8. Observed spectrum of the 3−1 − 20E methanol transition observedin the gravitational lensed object PKS1830-211 with the Effelsberg radiotelescope.98
transitions in methanol range from −42 for the 51 → 60A+
transition at 6.6 GHz to +53 for the 52 → 43A+ transition at10.0 GHz.
The large number of both positive and negative sen-sitivity coefficients makes methanol a preferred target sys-tem for probing a possible variation of μ, since this makesit possible to test variation of μ using transitions in a sin-gle molecular species, thereby avoiding the many system-atic effects that plague tests that are based on compar-ing transitions in different molecules. Following the recentdetection of methanol in the gravitationally lensed objectPKS1830-211 (PKS referring to the Parkes catalog of celes-tial objects, with 1830 and −211 referring to RA and deccoordinates as for quasars; the PKS1830-211 system is aradio-loud quasar at zemis = 2.51) in an absorbing galaxy ata redshift of zabs = 0.89,99 Bagdonaite et al.98 used four tran-sitions that were observed in this system using the 100 m ra-dio telescope in Effelsberg to constrain �μ/μ at (0.0 ± 1.0)× 10−7 at a look-back time of 7× 10⁹ years. A spectrum ofthe 3−1 − 20E methanol line, the line with the largest sen-sitivity to μ-variation observed at high redshift, is shown inFig. 8.
The enhancements discussed in methanol, generally oc-cur in any molecule that contains an internal rotor with C3v
symmetry. Jansen et al.37 constructed a simple model that pre-dicts whether a molecule with such C3v group is likely to havelarge sensitivity coefficients. This “toy” model decomposesthe energy of the molecule into a pure rotational and a puretorsional part, cf. Eq. (7). The rotational part is approximatedby the well-known expression for the rotational energy levelsof a slightly asymmetric top
Erot(J,K) = 1
2(B + CJ (J + 1) +
(A − B + C
2
)K2,
(22)
with A, B, and C the rotational constants along the a, b, and caxis of the molecule, respectively. The torsional energy con-tribution is approximated by a Fourier expansion as86
Etors(K) = F
[a0 + a1 cos
{2π
3(ρK + σ )
}], (23)
where F � 12¯
2I−1red is the constant of the internal rotation,
ρ � Ia2/Ia is a dimensionless constant reflecting the couplingbetween internal and overall rotation, and σ = 0, ±1 is a con-
f(s
)sin
π 3ρ)
1
0.8
0.6
0.4
0.2
ρ = 0
s = 4V3/9F
000
0 5 10 15 20 25 30 35-0.8
-0.6
-0.4
-0.2
0
0.2
0.4
met
hyl f
orm
ate
acet
alde
hyde
acet
ic a
cid
met
hyl m
erca
ptan
met
hano
l
acet
amid
e
larg
e K
μla
rge
Kμ
FIG. 9. The product f (s) sin( π3 ρ) which is a measure of the maximum value
of Kμ (see text). Also shown are data points for molecules containing aninternal rotor with C3v symmetry for which the sensitivity coefficients havebeen calculated.
stant relating to the torsional symmetry. The expansion coeffi-cients a0 and a1 depend on the shape of the torsional potential.Since we are mainly interested in the torsional energy differ-ence, a0 cancels, and a1 is obtained from
a1 = A1sB1e−C1
√s , (24)
with A1 = −5.296, B1 = 1.111, and C1 = 2.120.93 Thedimensionless parameter s = 4V3/9F , with V3 the heightof the barrier, is a measure of the effective potential.The sensitivity of a pure torsional transition is given byK tors
μ = (B1 − 1) − 12C1
√s. Inserting the different terms in
Eq. (7) reveals that the sensitivity coefficient of a tran-sition is roughly proportional to f (s) sin
(π3 ρ
), with f (s)
= −2a1(K torsμ + 1). This function is plotted in Fig. 9 for sev-
eral values of ρ. The curves can be regarded as the maxi-mum sensitivity one may hope to find in a molecule with acertain F and transition energy hν. The maximum sensitiv-ity peaks at s = 4 and ρ = 1. From the figure it is seen thatonly methanol, and to a lesser extent methyl mercaptan, lieclose to this maximum. Indeed, the highest sensitivities arefound in these molecules. It is unlikely that other moleculesare more sensitive than methanol since the requirement for alarge value of ρ and a relatively low effective barrier favorslight molecules.
We have seen that molecules that undergo inversion orinternal rotation may possess transitions that are extremelysensitive to a possible variation of μ. A molecule that exhibitsboth types of these motions, and has also been observed inPKS1830-211,99 is methylamine (CH3NH2); hindered inter-nal rotation of the methyl (CH3) group with respect to theamino group (NH2), and tunneling associated with waggingof the amino group.106 The coupling between the internal ro-tation and overall rotation in methylamine is rather strong re-sulting in a large value of ρ, which is favorable for obtaininglarge enhancements of the sensitivity coefficients. Ilyushinet al.94 have calculated sensitivity coefficients for many tran-sitions in methylamine and found that the transitions canbe grouped in pure rotation transitions with Kμ = −1, pure
010901-11 Jansen, Bethlem, and Ubachs J. Chem. Phys. 140, 010901 (2014)
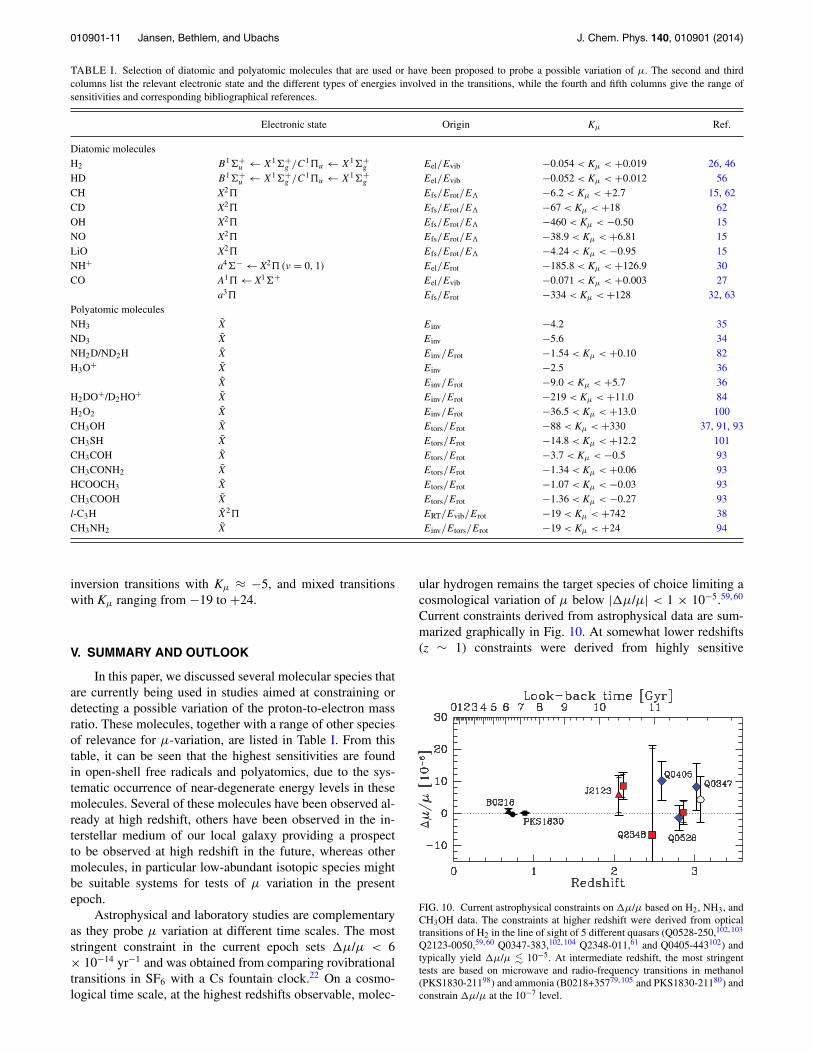
TABLE I. Selection of diatomic and polyatomic molecules that are used or have been proposed to probe a possible variation of μ. The second and thirdcolumns list the relevant electronic state and the different types of energies involved in the transitions, while the fourth and fifth columns give the range ofsensitivities and corresponding bibliographical references.
Electronic state Origin Kμ Ref.
Diatomic moleculesH2 B1�+
u ← X1�+g /C1u ← X1�+
g Eel/Evib −0.054 < Kμ < +0.019 26, 46HD B1�+
u ← X1�+g /C1u ← X1�+
g Eel/Evib −0.052 < Kμ < +0.012 56CH X2 Efs/Erot/E� −6.2 < Kμ < +2.7 15, 62CD X2 Efs/Erot/E� −67 < Kμ < +18 62OH X2 Efs/Erot/E� −460 < Kμ < −0.50 15NO X2 Efs/Erot/E� −38.9 < Kμ < +6.81 15LiO X2 Efs/Erot/E� −4.24 < Kμ < −0.95 15NH+ a4�− ← X2 (ν = 0, 1) Eel/Erot −185.8 < Kμ < +126.9 30CO A1 ← X1�+ Eel/Evib −0.071 < Kμ < +0.003 27
a3 Efs/Erot −334 < Kμ < +128 32, 63Polyatomic moleculesNH3 X Einv −4.2 35ND3 X Einv −5.6 34NH2D/ND2H X Einv/Erot −1.54 < Kμ < +0.10 82H3O+ X Einv −2.5 36
X Einv/Erot −9.0 < Kμ < +5.7 36H2DO+/D2HO+ X Einv/Erot −219 < Kμ < +11.0 84H2O2 X Einv/Erot −36.5 < Kμ < +13.0 100CH3OH X Etors/Erot −88 < Kμ < +330 37, 91, 93CH3SH X Etors/Erot −14.8 < Kμ < +12.2 101CH3COH X Etors/Erot −3.7 < Kμ < −0.5 93CH3CONH2 X Etors/Erot −1.34 < Kμ < +0.06 93HCOOCH3 X Etors/Erot −1.07 < Kμ < −0.03 93CH3COOH X Etors/Erot −1.36 < Kμ < −0.27 93l-C3H X2 ERT/Evib/Erot −19 < Kμ < +742 38CH3NH2 X Einv/Etors/Erot −19 < Kμ < +24 94
inversion transitions with Kμ ≈ −5, and mixed transitionswith Kμ ranging from −19 to +24.
V. SUMMARY AND OUTLOOK
In this paper, we discussed several molecular species thatare currently being used in studies aimed at constraining ordetecting a possible variation of the proton-to-electron massratio. These molecules, together with a range of other speciesof relevance for μ-variation, are listed in Table I. From thistable, it can be seen that the highest sensitivities are foundin open-shell free radicals and polyatomics, due to the sys-tematic occurrence of near-degenerate energy levels in thesemolecules. Several of these molecules have been observed al-ready at high redshift, others have been observed in the in-terstellar medium of our local galaxy providing a prospectto be observed at high redshift in the future, whereas othermolecules, in particular low-abundant isotopic species mightbe suitable systems for tests of μ variation in the presentepoch.
Astrophysical and laboratory studies are complementaryas they probe μ variation at different time scales. The moststringent constraint in the current epoch sets �μ/μ < 6× 10⁻¹⁴ yr−1 and was obtained from comparing rovibrationaltransitions in SF6 with a Cs fountain clock.22 On a cosmo-logical time scale, at the highest redshifts observable, molec-
ular hydrogen remains the target species of choice limiting acosmological variation of μ below |�μ/μ| < 1 × 10−5.59, 60
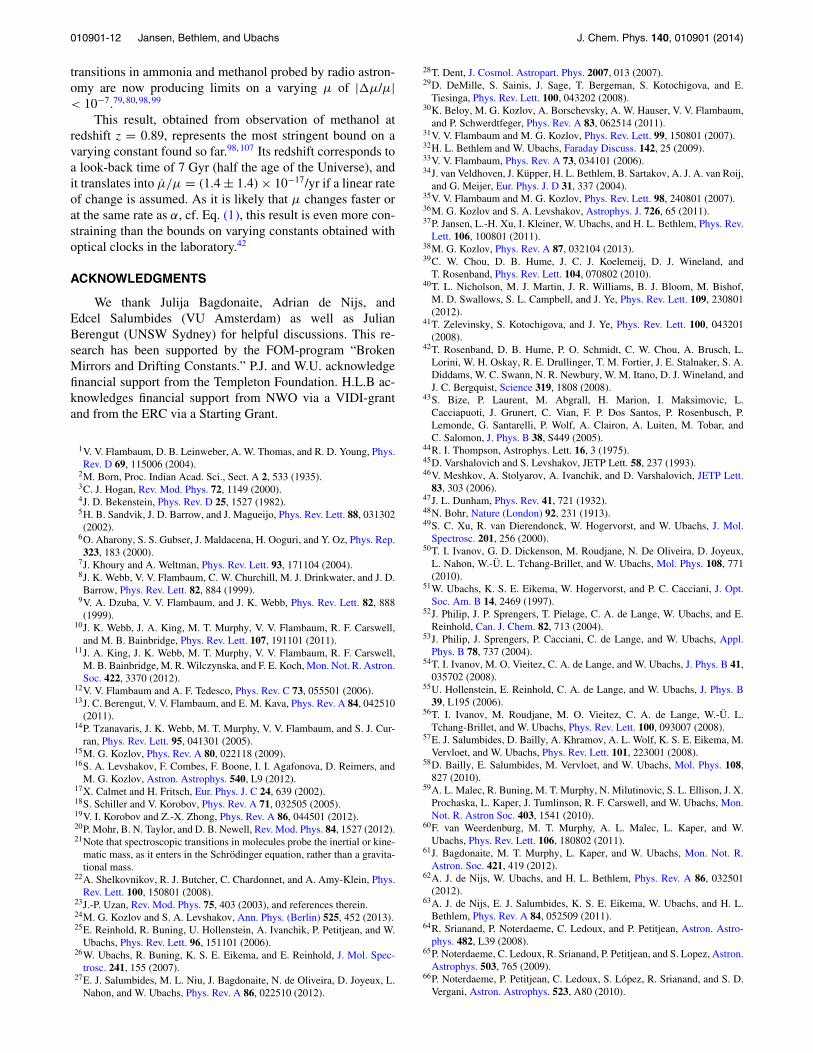
Current constraints derived from astrophysical data are sum-marized graphically in Fig. 10. At somewhat lower redshifts(z ∼ 1) constraints were derived from highly sensitive
FIG. 10. Current astrophysical constraints on �μ/μ based on H2, NH3, andCH3OH data. The constraints at higher redshift were derived from opticaltransitions of H2 in the line of sight of 5 different quasars (Q0528-250,102, 103
Q2123-0050,59, 60 Q0347-383,102, 104 Q2348-011,61 and Q0405-443102) andtypically yield �μ/μ � 10−5. At intermediate redshift, the most stringenttests are based on microwave and radio-frequency transitions in methanol(PKS1830-21198) and ammonia (B0218+35779, 105 and PKS1830-21180) andconstrain �μ/μ at the 10−7 level.
010901-12 Jansen, Bethlem, and Ubachs J. Chem. Phys. 140, 010901 (2014)
transitions in ammonia and methanol probed by radio astron-omy are now producing limits on a varying μ of |�μ/μ|< 10−7.79, 80, 98, 99
This result, obtained from observation of methanol atredshift z = 0.89, represents the most stringent bound on avarying constant found so far.98, 107 Its redshift corresponds toa look-back time of 7 Gyr (half the age of the Universe), andit translates into μ/μ = (1.4 ± 1.4) × 10−17/yr if a linear rateof change is assumed. As it is likely that μ changes faster orat the same rate as α, cf. Eq. (1), this result is even more con-straining than the bounds on varying constants obtained withoptical clocks in the laboratory.42
ACKNOWLEDGMENTS
We thank Julija Bagdonaite, Adrian de Nijs, andEdcel Salumbides (VU Amsterdam) as well as JulianBerengut (UNSW Sydney) for helpful discussions. This re-search has been supported by the FOM-program “BrokenMirrors and Drifting Constants.” P.J. and W.U. acknowledgefinancial support from the Templeton Foundation. H.L.B ac-knowledges financial support from NWO via a VIDI-grantand from the ERC via a Starting Grant.
1V. V. Flambaum, D. B. Leinweber, A. W. Thomas, and R. D. Young, Phys.Rev. D 69, 115006 (2004).
2M. Born, Proc. Indian Acad. Sci., Sect. A 2, 533 (1935).3C. J. Hogan, Rev. Mod. Phys. 72, 1149 (2000).4J. D. Bekenstein, Phys. Rev. D 25, 1527 (1982).5H. B. Sandvik, J. D. Barrow, and J. Magueijo, Phys. Rev. Lett. 88, 031302(2002).
6O. Aharony, S. S. Gubser, J. Maldacena, H. Ooguri, and Y. Oz, Phys. Rep.323, 183 (2000).
7J. Khoury and A. Weltman, Phys. Rev. Lett. 93, 171104 (2004).8J. K. Webb, V. V. Flambaum, C. W. Churchill, M. J. Drinkwater, and J. D.Barrow, Phys. Rev. Lett. 82, 884 (1999).
9V. A. Dzuba, V. V. Flambaum, and J. K. Webb, Phys. Rev. Lett. 82, 888(1999).
10J. K. Webb, J. A. King, M. T. Murphy, V. V. Flambaum, R. F. Carswell,and M. B. Bainbridge, Phys. Rev. Lett. 107, 191101 (2011).
11J. A. King, J. K. Webb, M. T. Murphy, V. V. Flambaum, R. F. Carswell,M. B. Bainbridge, M. R. Wilczynska, and F. E. Koch, Mon. Not. R. Astron.Soc. 422, 3370 (2012).
12V. V. Flambaum and A. F. Tedesco, Phys. Rev. C 73, 055501 (2006).13J. C. Berengut, V. V. Flambaum, and E. M. Kava, Phys. Rev. A 84, 042510
(2011).14P. Tzanavaris, J. K. Webb, M. T. Murphy, V. V. Flambaum, and S. J. Cur-
ran, Phys. Rev. Lett. 95, 041301 (2005).15M. G. Kozlov, Phys. Rev. A 80, 022118 (2009).16S. A. Levshakov, F. Combes, F. Boone, I. I. Agafonova, D. Reimers, and
M. G. Kozlov, Astron. Astrophys. 540, L9 (2012).17X. Calmet and H. Fritsch, Eur. Phys. J. C 24, 639 (2002).18S. Schiller and V. Korobov, Phys. Rev. A 71, 032505 (2005).19V. I. Korobov and Z.-X. Zhong, Phys. Rev. A 86, 044501 (2012).20P. Mohr, B. N. Taylor, and D. B. Newell, Rev. Mod. Phys. 84, 1527 (2012).21Note that spectroscopic transitions in molecules probe the inertial or kine-
matic mass, as it enters in the Schrodinger equation, rather than a gravita-tional mass.
22A. Shelkovnikov, R. J. Butcher, C. Chardonnet, and A. Amy-Klein, Phys.Rev. Lett. 100, 150801 (2008).
23J.-P. Uzan, Rev. Mod. Phys. 75, 403 (2003), and references therein.24M. G. Kozlov and S. A. Levshakov, Ann. Phys. (Berlin) 525, 452 (2013).25E. Reinhold, R. Buning, U. Hollenstein, A. Ivanchik, P. Petitjean, and W.
Ubachs, Phys. Rev. Lett. 96, 151101 (2006).26W. Ubachs, R. Buning, K. S. E. Eikema, and E. Reinhold, J. Mol. Spec-
trosc. 241, 155 (2007).27E. J. Salumbides, M. L. Niu, J. Bagdonaite, N. de Oliveira, D. Joyeux, L.
Nahon, and W. Ubachs, Phys. Rev. A 86, 022510 (2012).
28T. Dent, J. Cosmol. Astropart. Phys. 2007, 013 (2007).29D. DeMille, S. Sainis, J. Sage, T. Bergeman, S. Kotochigova, and E.
Tiesinga, Phys. Rev. Lett. 100, 043202 (2008).30K. Beloy, M. G. Kozlov, A. Borschevsky, A. W. Hauser, V. V. Flambaum,
and P. Schwerdtfeger, Phys. Rev. A 83, 062514 (2011).31V. V. Flambaum and M. G. Kozlov, Phys. Rev. Lett. 99, 150801 (2007).32H. L. Bethlem and W. Ubachs, Faraday Discuss. 142, 25 (2009).33V. V. Flambaum, Phys. Rev. A 73, 034101 (2006).34J. van Veldhoven, J. Küpper, H. L. Bethlem, B. Sartakov, A. J. A. van Roij,
and G. Meijer, Eur. Phys. J. D 31, 337 (2004).35V. V. Flambaum and M. G. Kozlov, Phys. Rev. Lett. 98, 240801 (2007).36M. G. Kozlov and S. A. Levshakov, Astrophys. J. 726, 65 (2011).37P. Jansen, L.-H. Xu, I. Kleiner, W. Ubachs, and H. L. Bethlem, Phys. Rev.
Lett. 106, 100801 (2011).38M. G. Kozlov, Phys. Rev. A 87, 032104 (2013).39C. W. Chou, D. B. Hume, J. C. J. Koelemeij, D. J. Wineland, and
T. Rosenband, Phys. Rev. Lett. 104, 070802 (2010).40T. L. Nicholson, M. J. Martin, J. R. Williams, B. J. Bloom, M. Bishof,
M. D. Swallows, S. L. Campbell, and J. Ye, Phys. Rev. Lett. 109, 230801(2012).
41T. Zelevinsky, S. Kotochigova, and J. Ye, Phys. Rev. Lett. 100, 043201(2008).
42T. Rosenband, D. B. Hume, P. O. Schmidt, C. W. Chou, A. Brusch, L.Lorini, W. H. Oskay, R. E. Drullinger, T. M. Fortier, J. E. Stalnaker, S. A.Diddams, W. C. Swann, N. R. Newbury, W. M. Itano, D. J. Wineland, andJ. C. Bergquist, Science 319, 1808 (2008).
43S. Bize, P. Laurent, M. Abgrall, H. Marion, I. Maksimovic, L.Cacciapuoti, J. Grunert, C. Vian, F. P. Dos Santos, P. Rosenbusch, P.Lemonde, G. Santarelli, P. Wolf, A. Clairon, A. Luiten, M. Tobar, andC. Salomon, J. Phys. B 38, S449 (2005).
44R. I. Thompson, Astrophys. Lett. 16, 3 (1975).45D. Varshalovich and S. Levshakov, JETP Lett. 58, 237 (1993).46V. Meshkov, A. Stolyarov, A. Ivanchik, and D. Varshalovich, JETP Lett.
83, 303 (2006).47J. L. Dunham, Phys. Rev. 41, 721 (1932).48N. Bohr, Nature (London) 92, 231 (1913).49S. C. Xu, R. van Dierendonck, W. Hogervorst, and W. Ubachs, J. Mol.
Spectrosc. 201, 256 (2000).50T. I. Ivanov, G. D. Dickenson, M. Roudjane, N. De Oliveira, D. Joyeux,
L. Nahon, W.-Ü. L. Tchang-Brillet, and W. Ubachs, Mol. Phys. 108, 771(2010).
51W. Ubachs, K. S. E. Eikema, W. Hogervorst, and P. C. Cacciani, J. Opt.Soc. Am. B 14, 2469 (1997).
52J. Philip, J. P. Sprengers, T. Pielage, C. A. de Lange, W. Ubachs, and E.Reinhold, Can. J. Chem. 82, 713 (2004).
53J. Philip, J. Sprengers, P. Cacciani, C. de Lange, and W. Ubachs, Appl.Phys. B 78, 737 (2004).
54T. I. Ivanov, M. O. Vieitez, C. A. de Lange, and W. Ubachs, J. Phys. B 41,035702 (2008).
55U. Hollenstein, E. Reinhold, C. A. de Lange, and W. Ubachs, J. Phys. B39, L195 (2006).
56T. I. Ivanov, M. Roudjane, M. O. Vieitez, C. A. de Lange, W.-Ü. L.Tchang-Brillet, and W. Ubachs, Phys. Rev. Lett. 100, 093007 (2008).
57E. J. Salumbides, D. Bailly, A. Khramov, A. L. Wolf, K. S. E. Eikema, M.Vervloet, and W. Ubachs, Phys. Rev. Lett. 101, 223001 (2008).
58D. Bailly, E. Salumbides, M. Vervloet, and W. Ubachs, Mol. Phys. 108,827 (2010).
59A. L. Malec, R. Buning, M. T. Murphy, N. Milutinovic, S. L. Ellison, J. X.Prochaska, L. Kaper, J. Tumlinson, R. F. Carswell, and W. Ubachs, Mon.Not. R. Astron Soc. 403, 1541 (2010).
60F. van Weerdenburg, M. T. Murphy, A. L. Malec, L. Kaper, and W.Ubachs, Phys. Rev. Lett. 106, 180802 (2011).
61J. Bagdonaite, M. T. Murphy, L. Kaper, and W. Ubachs, Mon. Not. R.Astron. Soc. 421, 419 (2012).
62A. J. de Nijs, W. Ubachs, and H. L. Bethlem, Phys. Rev. A 86, 032501(2012).
63A. J. de Nijs, E. J. Salumbides, K. S. E. Eikema, W. Ubachs, and H. L.Bethlem, Phys. Rev. A 84, 052509 (2011).
64R. Srianand, P. Noterdaeme, C. Ledoux, and P. Petitjean, Astron. Astro-phys. 482, L39 (2008).
65P. Noterdaeme, C. Ledoux, R. Srianand, P. Petitjean, and S. Lopez, Astron.Astrophys. 503, 765 (2009).
66P. Noterdaeme, P. Petitjean, C. Ledoux, S. López, R. Srianand, and S. D.Vergani, Astron. Astrophys. 523, A80 (2010).
010901-13 Jansen, Bethlem, and Ubachs J. Chem. Phys. 140, 010901 (2014)
67P. Noterdaeme, P. Petitjean, R. Srianand, C. Ledoux, and S. López, Astron.Astrophys. 526, L7 (2011).
68M. Niu, E. J. Salumbides, D. Zhao, N. De Oliveira, D. Joyeux, L. Nahon,R. W. Field, and W. Ubachs, Mol. Phys. 111, 2163 (2013).
69J. Brown and A. Carrington, Rotational Spectroscopy of DiatomicMolecules (Cambridge University Press, 2003).
70R. S. Freund and W. Klemperer, J. Chem. Phys. 43, 2422 (1965).71B. G. Wicke, R. W. Field, and W. Klemperer, J. Chem. Phys. 56, 5758
(1972).72R. J. Saykally, T. A. Dixon, T. G. Anderson, P. G. Szanto, and R. C.
Woods, J. Chem. Phys. 87, 6423 (1987).73S. Yamamoto and S. Saito, J. Chem. Phys. 89, 1936 (1988).74J. Darling, Phys. Rev. Lett. 91, 011301 (2003).75E. R. Hudson, H. J. Lewandowski, B. C. Sawyer, and J. Ye, Phys. Rev.
Lett. 96, 143004 (2006).76S. Truppe, R. J. Hendricks, S. K. Tokunaga, H. J. Lewandowski, M. G.
Kozlov, C. Henkel, E. A. Hinds, and M. R. Tarbutt, Nature Commun. 4,2600 (2013).
77D. M. Dennison and G. E. Uhlenbeck, Phys. Rev. 41, 313 (1932).78C. H. Townes and A. L. Schawlow, Microwave Spectroscopy (Dover Pub-
lications, 1975).79N. Kanekar, Astrophys. J. Lett. 728, L12 (2011).80C. Henkel, K. M. Menten, M. T. Murphy, N. Jethava, V. V. Flambaum, J.
A. Braatz, S. Muller, J. Ott, and R. Q. Mao, Astron. Astrophys. 500, 725(2009).
81H. L. Bethlem, M. Kajita, B. Sartakov, G. Meijer, and W. Ubachs, Eur.Phys. J. Spec. Top. 163, 55 (2008).
82M. G. Kozlov, A. V. Lapinov, and S. A. Levshakov, J. Phys. B 43, 074003(2010).
83D. Laughton, S. Freund, and T. Oka, J. Mol. Spectrosc. 62, 263 (1976).84M. G. Kozlov, S. G. Porsev, and D. Reimers, Phys. Rev. A 83, 052123
(2011).85D. Kivelson, J. Chem. Phys. 22, 1733 (1954).86C. C. Lin and J. D. Swalen, Rev. Mod. Phys. 31, 841 (1959).87D. R. Herschbach, J. Chem. Phys. 31, 91 (1959).
88B. Kirtman, J. Chem. Phys. 37, 2516 (1962).89R. M. Lees and J. B. Baker, J. Chem. Phys. 48, 5299 (1968).90R. M. Lees, Astrophys. J. 184, 763 (1973).91S. A. Levshakov, M. G. Kozlov, and D. Reimers, Astrophys. J. 738, 26
(2011).92J. D. Swalen, J. Chem. Phys. 23, 1739 (1955).93P. Jansen, I. Kleiner, L.-H. Xu, W. Ubachs, and H. L. Bethlem, Phys. Rev.
A 84, 062505 (2011).94V. V. Ilyushin, P. Jansen, M. G. Kozlov, S. A. Levshakov, I. Kleiner, W.
Ubachs, and H. L. Bethlem, Phys. Rev. A 85, 032505 (2012).95J. T. Hougen, I. Kleiner, and M. Godefroid, J. Mol. Spectrosc.
163, 559 (1994) (program available at http://www.ifpan.edu.pl/~kisiel/introt/introt.htm#belgi).
96L. H. Xu, R. M. Lees, and J. T. Hougen, J. Chem. Phys. 110, 3835 (1999).97L. H. Xu, J. Fisher, R. M. Lees, H. Y. Shi, J. T. Hougen, J. C. Pearson,
B. J. Drouin, G. A. Blake, and R. Braakman, J. Mol. Spectrosc. 251, 305(2008), and references therein.
98J. Bagdonaite, P. Jansen, C. Henkel, H. L. Bethlem, K. M. Menten, and W.Ubachs, Science 339, 46 (2013).
99S. Muller, A. Beelen, M. Guélin, S. Aalto, J. H. Black, F. Combes, S. Cur-ran, P. Theule, and S. Longmore, Astron. Astrophys. 535, A103 (2011).
100M. G. Kozlov, Phys. Rev. A 84, 042120 (2011).101P. Jansen, L.-H. Xu, I. Kleiner, H. L. Bethlem, and W. Ubachs, Phys. Rev.
A 87, 052509 (2013).102J. A. King, J. K. Webb, M. T. Murphy, and R. F. Carswell, Phys. Rev. Lett.
101, 251304 (2008).103J. A. King, M. T. Murphy, W. Ubachs, and J. K. Webb, Mon. Not. R.
Astron. Soc. 417, 3010 (2011).104M. Wendt and P. Molaro, Astron. Astrophys. 541, A69 (2012).105M. T. Murphy, V. V. Flambaum, S. Muller, and C. Henkel, Science 320,
1611 (2008).106M. Tsuboi, A. Y. Hirakawa, T. Ino, T. Sasaki, and K. Tamagake, J. Chem.
Phys. 41, 2721 (1964).107J. Bagdonaite, M. Daprà, P. Jansen, H. L. Bethlem, W. Ubachs, S. Muller,
C. Henkel, and K. M. Menten, Phys. Rev. Lett. 111, 231101 (2013).