personal incomes statistics 2014-15 tables 3.1-3.11 - gov.uk
TRANSCRIPT
1
Coverage: United Kingdom Theme: The Economy Released: 02 March 2017 (table 3.10 revised 19 April 2017) Next update: January 2018/February 2018 Frequency of release: Annually Media contact: HMRC Press Office (Individuals) 03000 585 024 new [email protected]
Out-of-hours: 07860 359544 Statistical contacts: Jeremy Reuben Tel: 03000 589 465 Claire Price Tel: 03000 528 243 Team email address: [email protected]
Knowledge, Analysis and Intelligence Data, Policy & Co-ordination HM Revenue and Customs Room 3/59 100 Parliament Street LONDON SW1A 2BQ Website: https://www.gov.uk/government/collections/personal-incomes-statistics
Personal Incomes Statistics 2014-15
Tables 3.1-3.11
2
Personal Incomes statistics - Contents
Personal Incomes statistics ............................................................................. 2
About these statistics ....................................................................................... 3
New or updated statistics in this release ......................................................... 3 SECTION 1: Introduction and background information ............................... 4
What is the Survey of Personal Incomes? ...................................................... 4 What does this publication tell me? ................................................................. 5
Who might be interested? ................................................................................ 5 User engagement ............................................................................................. 5 Publication and revision strategy ..................................................................... 6 Statistical contacts ............................................................................................ 6
SECTION 2: Personal Incomes statistics ....................................................... 7
Summary of key statistics ................................................................................ 7 Table 3.2 – Distribution of median and mean income and tax by age range and gender, 2014-15 ...................................................................................... 12
Table 3.3 – Distribution of total income before and after tax by gender, 2014-15..................................................................................................................... 14 Table 3.4 – Income tax liabilities of starting, “savers”, basic, higher and additional rate taxpayers, by largest source of income, 2014-15 ................ 16
Table 3.5 – Income and deductions, 2014-15 .............................................. 18 Table 3.6 – Profit, employment and pension income, 2014-15 ................... 20 Table 3.7 – Property, interest, dividend and other income, 2014-15........... 22 Table 3.8 – Deductions and reliefs, 2014-15 ................................................ 24
Table 3.9 – Self employment income assessable to tax, 2014-15 .............. 27 Table 3.10 – Income of individuals with self employment sources, 2014-15 ......................................................................................................................... 29 Table 3.11 – Income and tax, by gender, region and country, 2014-15...... 31
Annex A: National Statistics Tables 3.1 to 3.11, 2014-15........................... 33
Notes on the tables......................................................................................... 33 Annex B: Data sources and Methodology .................................................. 55
Coverage of the SPI ....................................................................................... 56
UK Standard Industrial Classification of Economic Activities 2007 (SIC2007) ......................................................................................................................... 59 Estimates and measures of precision ........................................................... 60 Precision of estimates: sub UK areas ........................................................... 61
Methodological Changes since the 2013-14 SPI.......................................... 62 Annex C: Glossary of Terms .......................................................................... 63
3
About these statistics
This is a National Statistics publication produced by HM Revenue and
Customs (HMRC). For more information on National Statistics and governance of statistics produced by public bodies please see the UK Statistics Authority website (www.statisticsauthority.gov.uk).
The tables in this publication provide detailed breakdowns of individuals liable to UK income tax (taxpayers) and their incomes using sample based estimates.
New or updated statistics in this release
2014-15 SPI
This release contains the first release of personal incomes statistics from the Survey of Personal Incomes for 2014-15. There are no new or updated
statistics for earlier years. 2015-16 SPI
National Statistics from SPI survey data for 2015-16 are expected to be released in January / February 2018. In accordance with the Code of Practice for Official Statistics, the exact date of publication will be given not less than one calendar month before publication on both the HMRC website and Office
for National Statistics publication hub. Delay to the 2008-09 SPI
The 2008-09 SPI is still unavailable but HMRC remains committed to producing the 2008-09 SPI and National Statistics Tables 3.1 to 3.15a for 2008-09 and will announce their publication dates as soon as they have been confirmed.
Amendments to 2014-15 SPI tables
This publication was originally released in March 2017. A mistake affecting 4 figures was subsequently found in Table 3.10. Therefore Table 3.10 has been
corrected in this re-issue of the publication. All other tables remain unchanged. A National Statistics breach report covering this has been published on the
Internet page for this release.
4
SECTION 1: Introduction and background information
What is the Survey of Personal Incomes?
The Survey of Personal Incomes (SPI) is based on information held by HMRC on individuals who could be liable to UK income tax. It is carried out annually
by HMRC and covers income assessable to tax for each tax year. Uses of the SPI
The SPI is compiled to provide a quantified evidence base from which to cost proposed changes to tax rates, personal allowances and other tax reliefs for Treasury Ministers. It is used to inform policy decisions within HMRC and the Treasury, as well as for tax modelling and forecasting purposes. In addition, it
is used to provide summary information for the National Accounts that are prepared by the Office for National Statistics. Finally, it is used to provide information to Members of Parliament, other Government Departments, companies, organisations and individuals.
Sample Design
HMRC holds information about individuals who could be liable to UK income
tax in three operational computer systems.
1. The National Insurance and PAYE Service (NPS) system covers all employees and occupational pension recipients with a Pay-As-You-
Earn (PAYE) record. NPS replaced the Computerisation of PAYE (COP) system.
2. The Computerised Environment for Self Assessment (CESA) system
covers people with self-employment, rental or untaxed investment income. It also covers those with higher incomes and other people with complex tax affairs. Where people have both NPS and CESA records, their CESA record is selected because it provides a more complete
picture of their taxable income.
3. The Claims system covers people without NPS or CESA records who have had too much tax deducted at source and claim a repayment.
Separate samples are drawn from each of these systems and then joined together to create the SPI.
For more information about how the SPI is constructed, its coverage and methodological changes from previous SPIs, please see Annex B.
5
What does this publication tell me?
All the statistics in this publication provide detailed information on individuals liable to UK income tax and their incomes, including gender, age, income
source, income by source and tax distribution. Tables are based on a sample of administrative data for the relevant tax year. Tax liabilities are modelled using the HM Revenue and Customs Personal Tax
Model. Methods used to calculate income tax liabilities are described in Annex B of the latest Income Tax Liabilities Statistics bulletin, available at: https://www.gov.uk/government/collections/income-tax-statistics-and-distributions.
Who might be interested?
These tables would be of interest to policy makers in government, academics, journalists, think tanks, and other research bodies. They would be of use to individuals or organisations interested in the distributions of numbers and
amounts of personal incomes, for example by taxpayer marginal rate or income band. Users may also like to view the tables on Income Tax Liabilities which are available at: https://www.gov.uk/government/collections/income-tax-statistics-and-distributions.
User engagement
We are committed to providing impartial quality statistics that meet our users’ needs. We encourage our users to engage with us so we can improve our
official statistics and identify gaps in the statistics that we produce. Comments or queries on these statistics can be sent to the statistical contacts named at the end of this section, or through the feedback form link below. We
will review user comments on a quarterly basis and use this information to influence the development of our official statistics. We will summarise and publish user comments at regular intervals. https://www.gov.uk/government/organisations/hm-revenue-
customs/about/statistics#contact-us The results from the last full user consultation held between February and May 2012 are in the ‘User engagement’ section available at:
https://www.gov.uk/government/collections/personal-incomes-statistics
6
Publication and revision strategy
These statistics are published annually, usually in January/February. Release dates will be announced on the UK Statistics Hub and the HMRC National
Statistics website (Scheduled updates). Any changes to the publication date will be announced on the HMRC National Statistics website (Announcements).
Statistical contacts
Enquiries about these statistics should be directed to the statisticians who are responsible for this publication:
Jeremy Reuben or Claire Price Tel: 03000 589 465 Tel: 03000 528 243
Team email address: [email protected] Knowledge, Analysis and Intelligence
Data, Policy & Co-ordination HM Revenue and Customs Room 3/59 100 Parliament Street
LONDON SW1A 2BQ Any media enquiries should be directed to the HMRC Press Office contacts
listed on the front page of this release.
7
SECTION 2: Personal Incomes statistics
The statistics in Section 2 provide analyses of the incomes of UK taxpayers and the income tax to which they are liable for the 2014-15 tax year based on
Tables 3.1 to 3.11 in Annex A. These tables are derived from the annual Survey of Personal Incomes where the latest tax year is 2014-15. Data sources and methods are described in more detail in Annex B.
Summary of key statistics
The key findings for 2014-15:
There were 30.7 million individual income taxpayers; 17.6 million were male and 13.1 million were female (Table 3.2).
Total income was approximately £977 billion and the total tax liabilities were around £167 billion (Table 3.3).
Of the 30.7 million taxpayers, 82% (25.1 million taxpayers) were liable at the basic rate, 14% (4.3 million taxpayers) liable at the higher rate, 2% (0.7 million taxpayers) liable at the “savers” rate and 1% were liable at each of the starting rate (0.3 million taxpayers) and additional rate (0.3 million
taxpayers) (Table 3.4).
Total income comprises profit, employment and pension income plus property, interest, dividend and other income, of which (Table 3.5, 3.6 and
3.7):
o Self employment income: £78.2 billion (8%) o Employment income: £672.0 billion (69%)
o Pension income: £140.3 billion (14%) o Property, interest, dividend and other income: £86.9 billion (9%)
The South East region has the highest number of taxpayers, with around
4.5 million (15%) of the total figure. However, the highest total income amount was located in London, with around £177 billion (18%) of all income (Table 3.11).
Compared to 2013-14:
The total number of taxpayers has increased by 0.3 million; the number of males has increased by 0.2 million and females has increased by 0.1
million.
Taxpayers’ total income has risen by £26 billion and total tax has risen by £2 billion.
The average amount of total income for taxpayers has risen by £500 and the average amount of total tax has risen by £20.

8
Note that individual figures have been rounded independently to three significant figures. Therefore, the sum of component items may not
necessarily add to the totals shown.
9
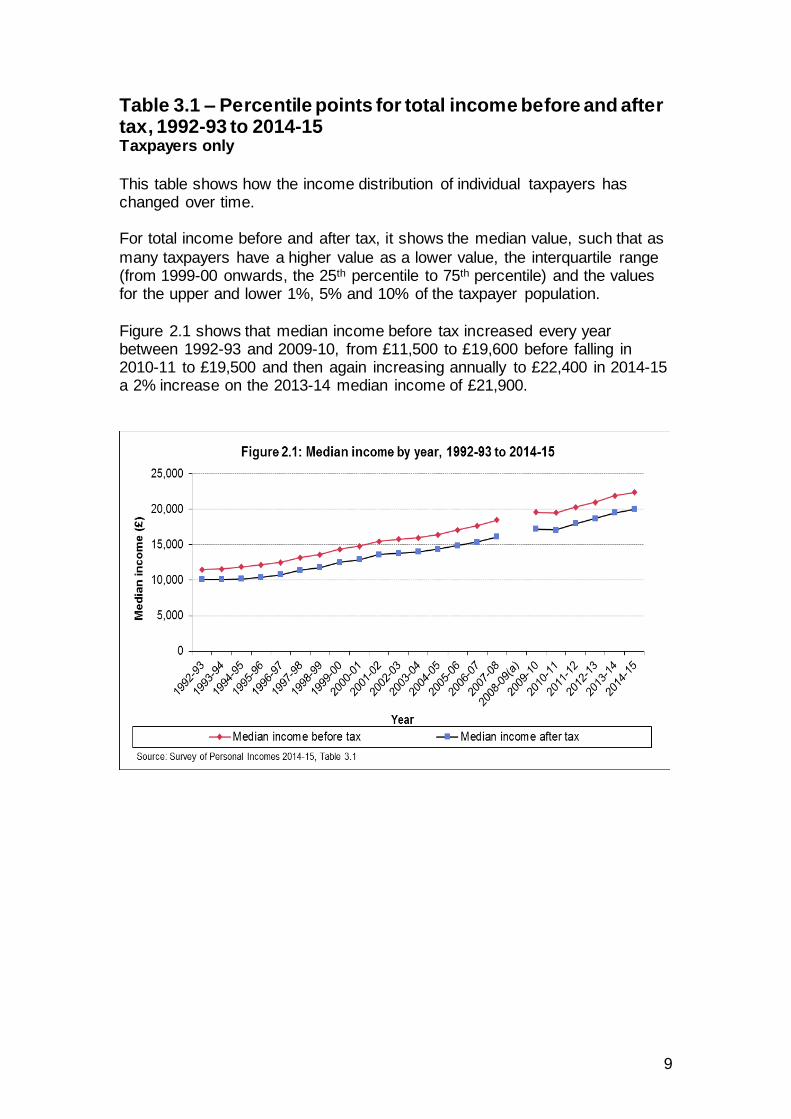
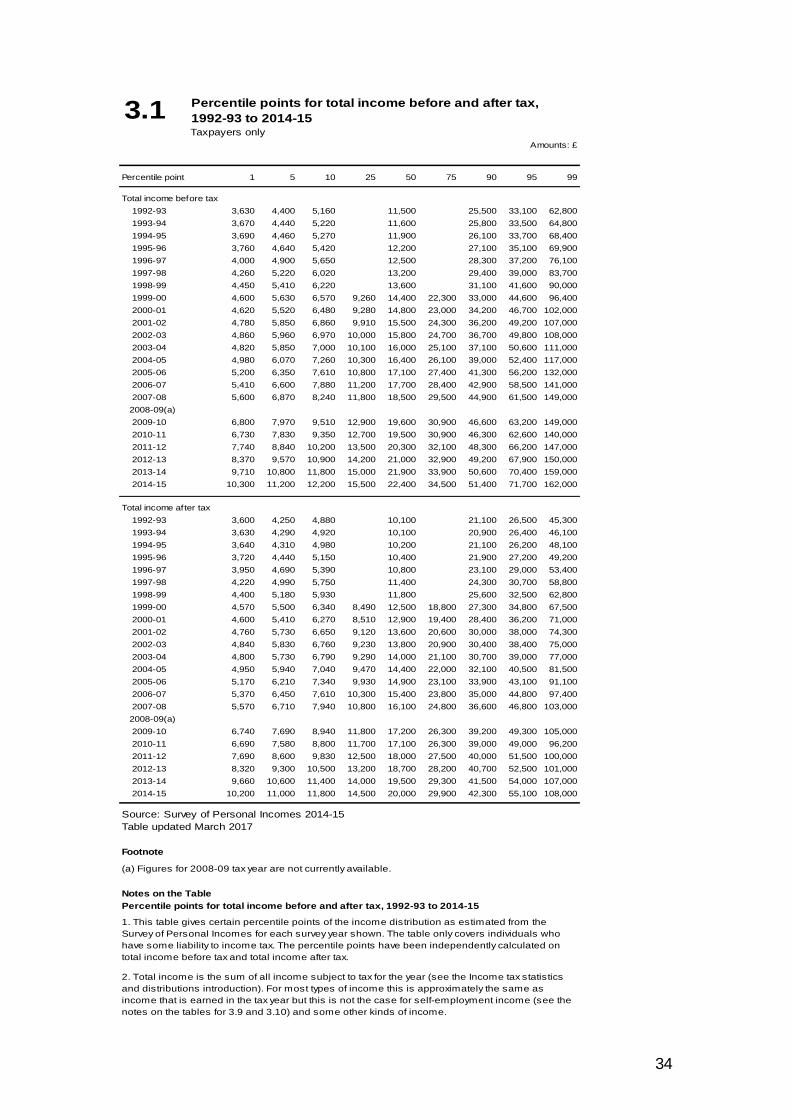
Table 3.1 – Percentile points for total income before and after tax, 1992-93 to 2014-15 Taxpayers only
This table shows how the income distribution of individual taxpayers has changed over time. For total income before and after tax, it shows the median value, such that as
many taxpayers have a higher value as a lower value, the interquartile range (from 1999-00 onwards, the 25th percentile to 75th percentile) and the values for the upper and lower 1%, 5% and 10% of the taxpayer population.
Figure 2.1 shows that median income before tax increased every year between 1992-93 and 2009-10, from £11,500 to £19,600 before falling in 2010-11 to £19,500 and then again increasing annually to £22,400 in 2014-15 a 2% increase on the 2013-14 median income of £21,900.
10
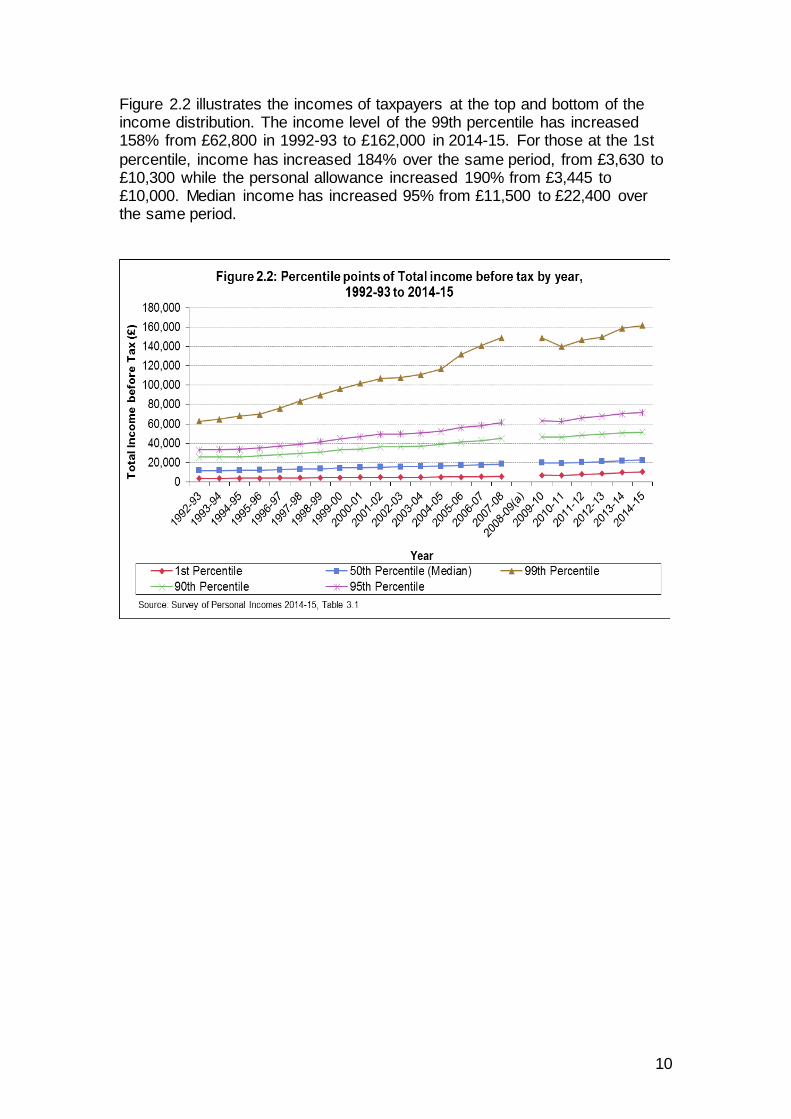
Figure 2.2 illustrates the incomes of taxpayers at the top and bottom of the income distribution. The income level of the 99th percentile has increased 158% from £62,800 in 1992-93 to £162,000 in 2014-15. For those at the 1st
percentile, income has increased 184% over the same period, from £3,630 to £10,300 while the personal allowance increased 190% from £3,445 to £10,000. Median income has increased 95% from £11,500 to £22,400 over the same period.
11
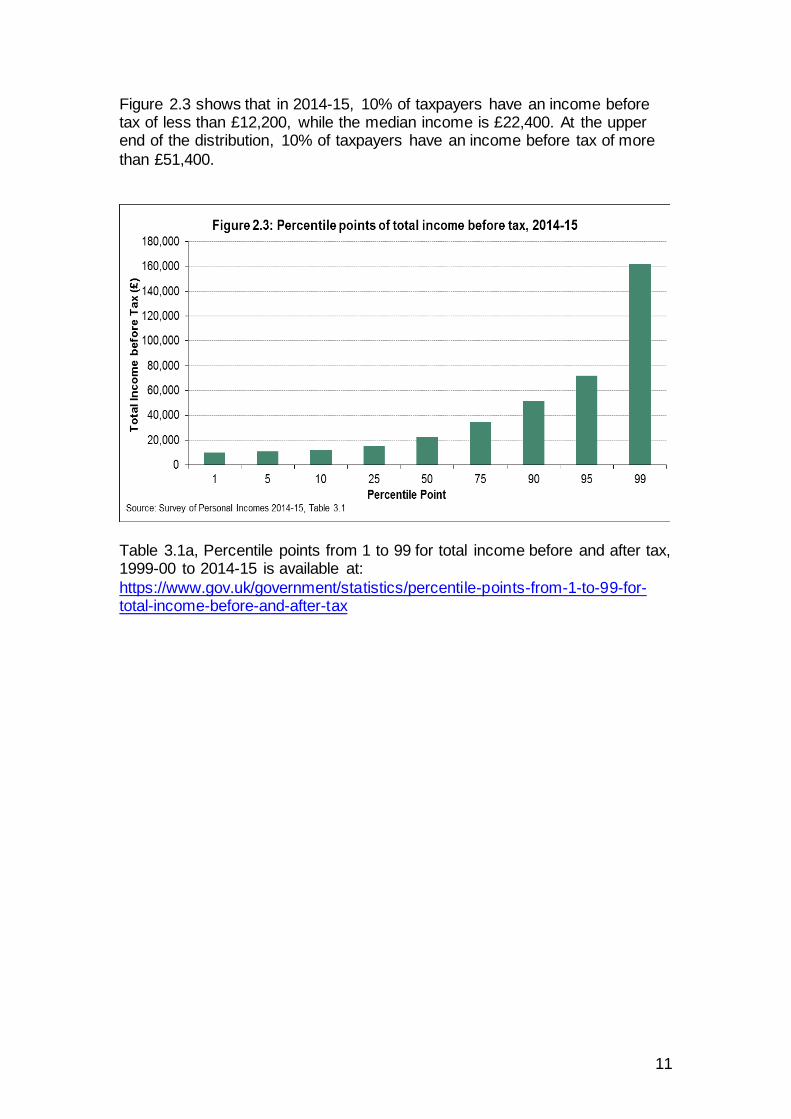
Figure 2.3 shows that in 2014-15, 10% of taxpayers have an income before tax of less than £12,200, while the median income is £22,400. At the upper end of the distribution, 10% of taxpayers have an income before tax of more
than £51,400.
Table 3.1a, Percentile points from 1 to 99 for total income before and after tax, 1999-00 to 2014-15 is available at:
https://www.gov.uk/government/statistics/percentile-points-from-1-to-99-for-total-income-before-and-after-tax
12
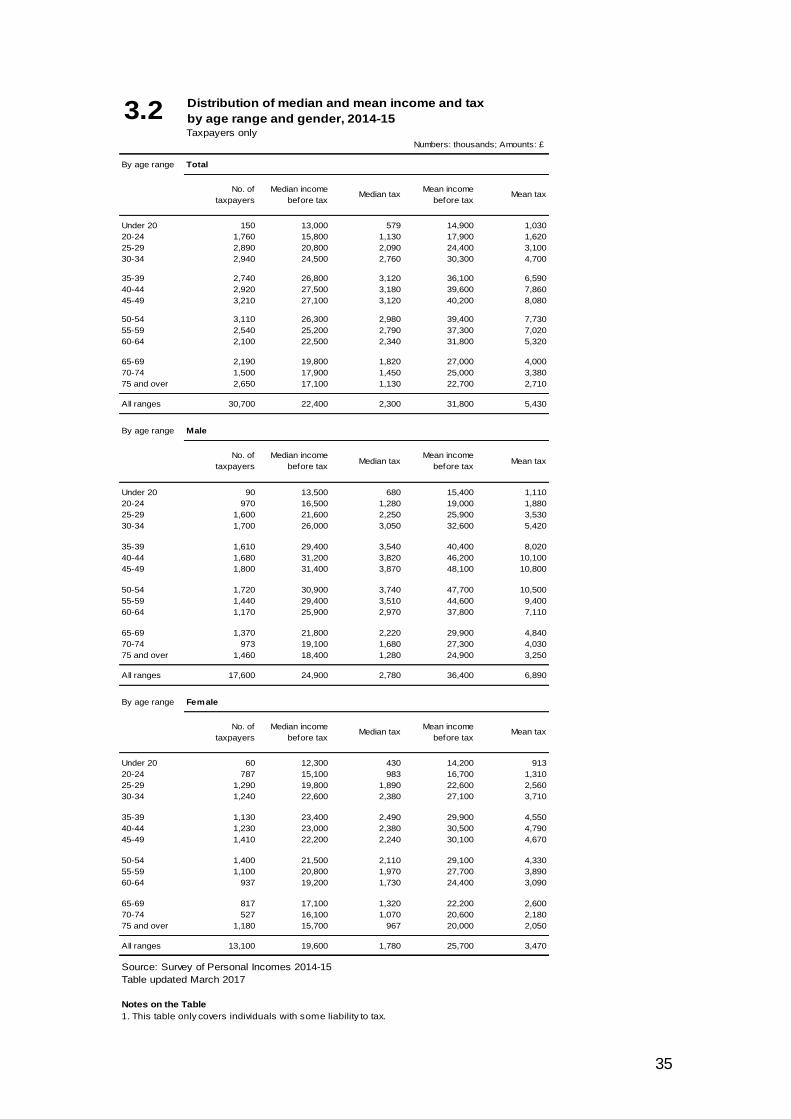
Table 3.2 – Distribution of median and mean income and tax by age range and gender, 2014-15 Taxpayers only
This table provides estimates by age and gender of taxpayer numbers and the mean and median values of tax and income before tax.
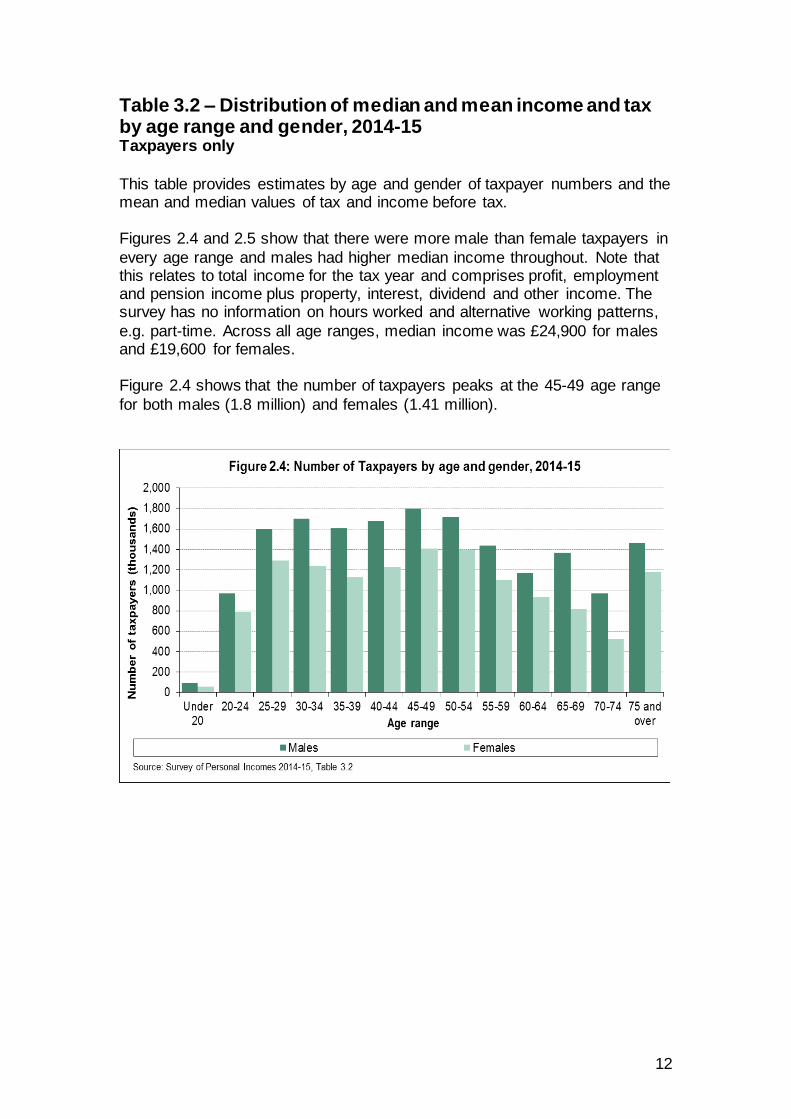
Figures 2.4 and 2.5 show that there were more male than female taxpayers in
every age range and males had higher median income throughout. Note that this relates to total income for the tax year and comprises profit, employment and pension income plus property, interest, dividend and other income. The survey has no information on hours worked and alternative working patterns,
e.g. part-time. Across all age ranges, median income was £24,900 for males and £19,600 for females. Figure 2.4 shows that the number of taxpayers peaks at the 45-49 age range
for both males (1.8 million) and females (1.41 million).
13
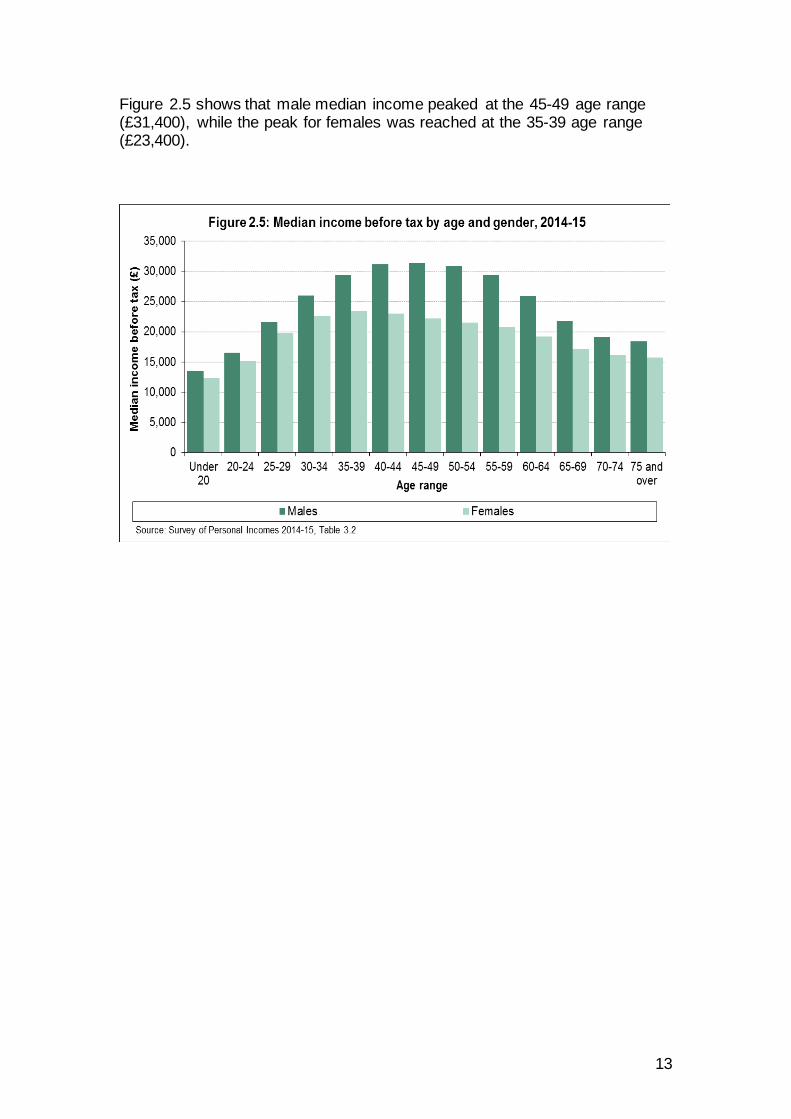
Figure 2.5 shows that male median income peaked at the 45-49 age range (£31,400), while the peak for females was reached at the 35-39 age range (£23,400).
14
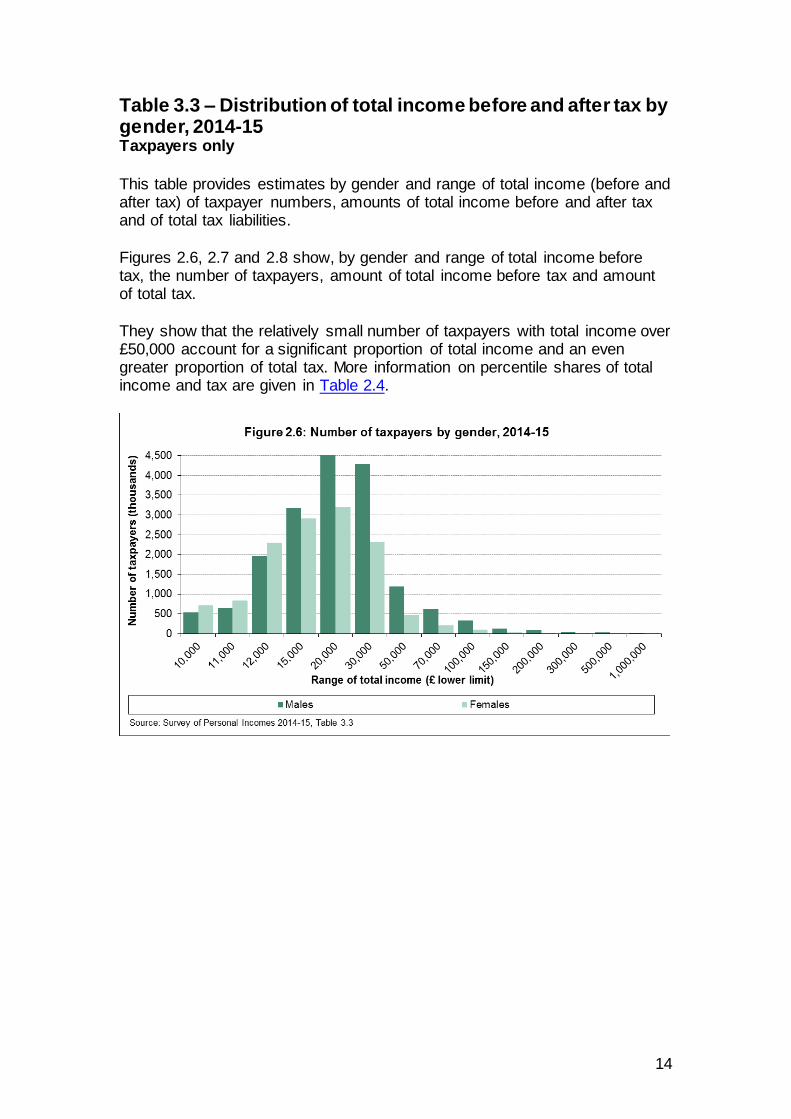
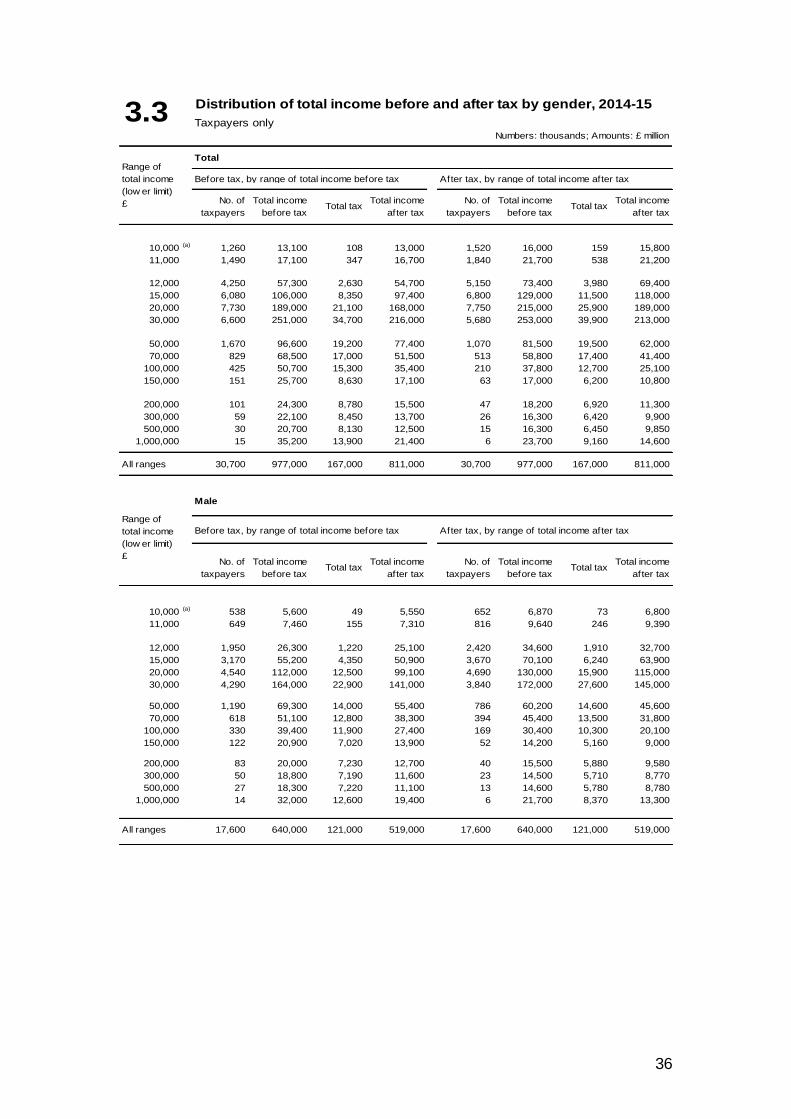
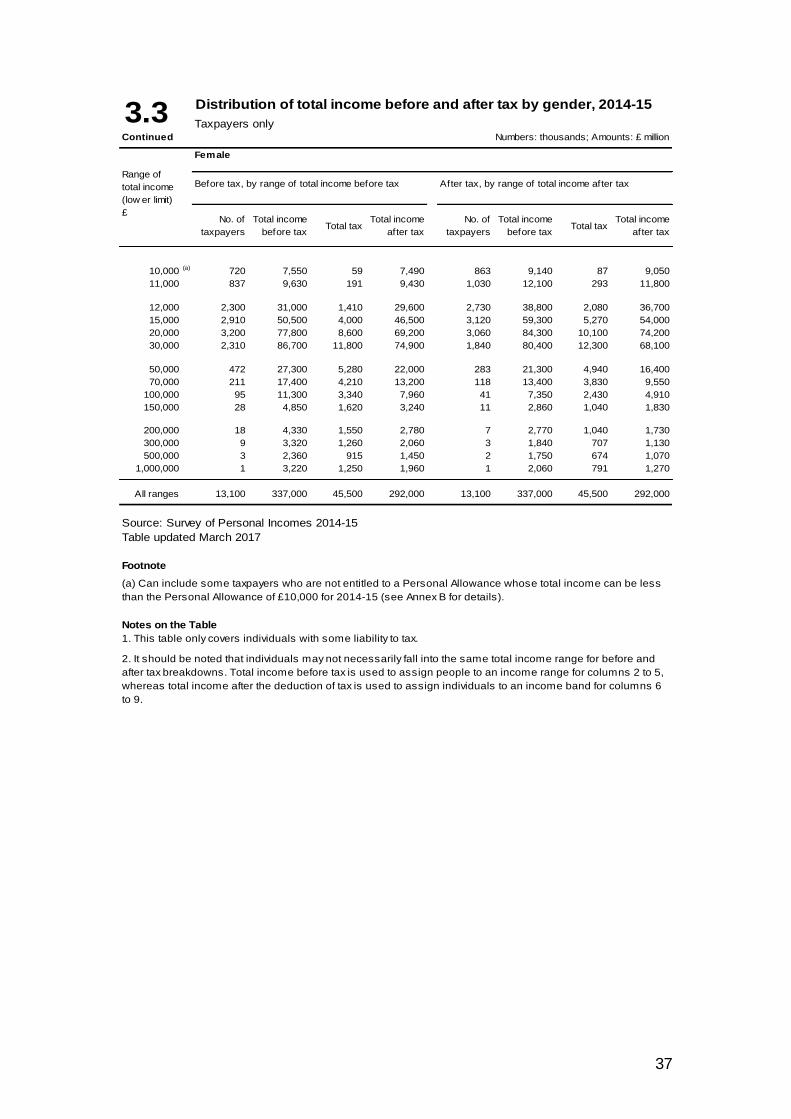
Table 3.3 – Distribution of total income before and after tax by gender, 2014-15 Taxpayers only
This table provides estimates by gender and range of total income (before and after tax) of taxpayer numbers, amounts of total income before and after tax and of total tax liabilities.
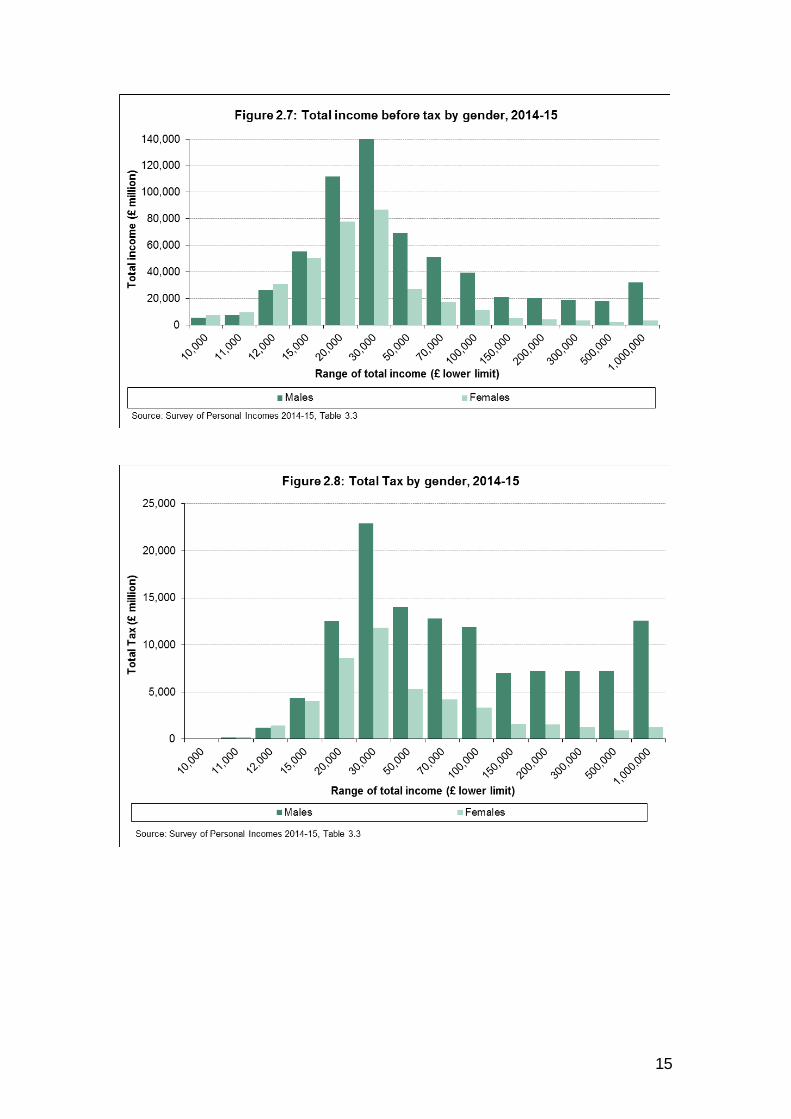
Figures 2.6, 2.7 and 2.8 show, by gender and range of total income before tax, the number of taxpayers, amount of total income before tax and amount of total tax.
They show that the relatively small number of taxpayers with total income over £50,000 account for a significant proportion of total income and an even greater proportion of total tax. More information on percentile shares of total income and tax are given in Table 2.4.
15
16
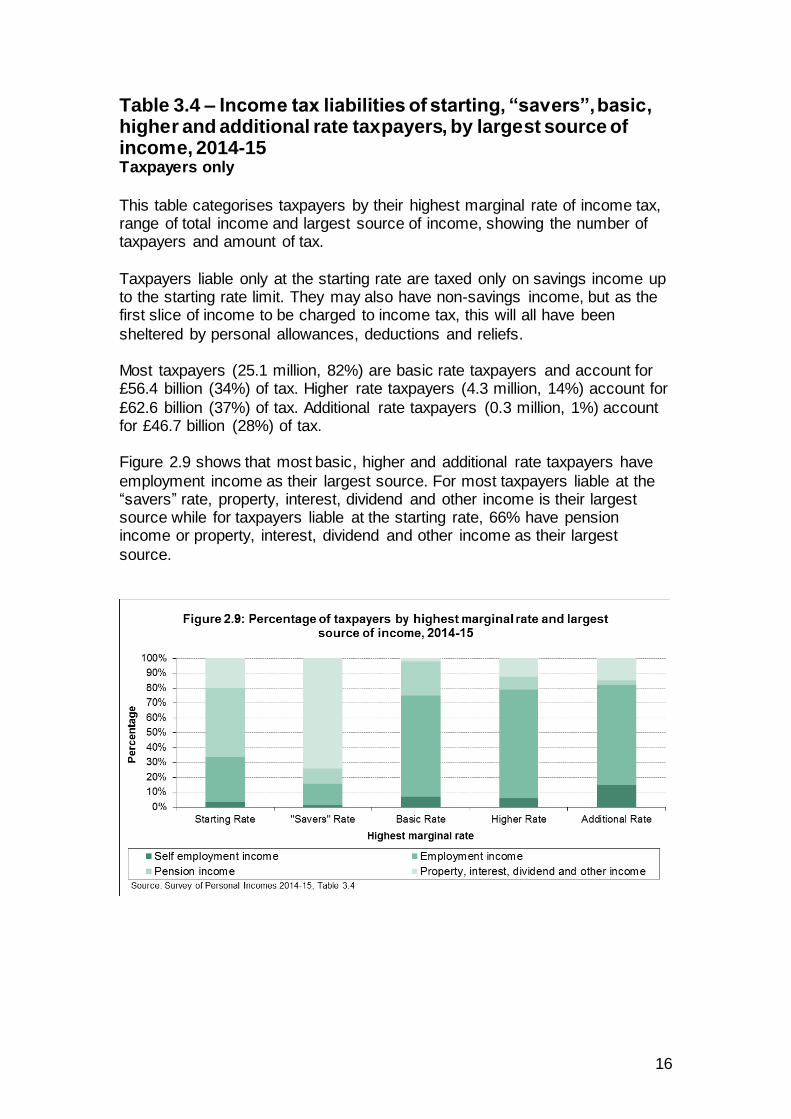
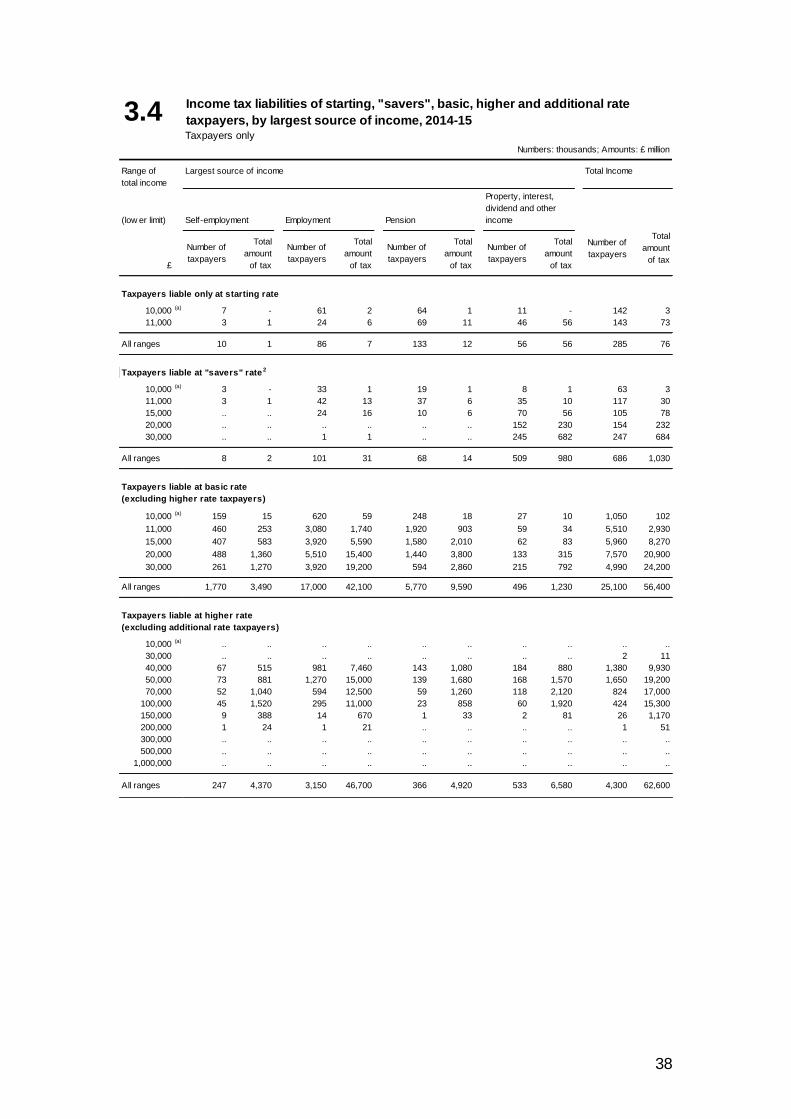
Table 3.4 – Income tax liabilities of starting, “savers”, basic, higher and additional rate taxpayers, by largest source of income, 2014-15 Taxpayers only
This table categorises taxpayers by their highest marginal rate of income tax, range of total income and largest source of income, showing the number of taxpayers and amount of tax.
Taxpayers liable only at the starting rate are taxed only on savings income up to the starting rate limit. They may also have non-savings income, but as the first slice of income to be charged to income tax, this will all have been
sheltered by personal allowances, deductions and reliefs. Most taxpayers (25.1 million, 82%) are basic rate taxpayers and account for £56.4 billion (34%) of tax. Higher rate taxpayers (4.3 million, 14%) account for
£62.6 billion (37%) of tax. Additional rate taxpayers (0.3 million, 1%) account for £46.7 billion (28%) of tax. Figure 2.9 shows that most basic, higher and additional rate taxpayers have
employment income as their largest source. For most taxpayers liable at the “savers” rate, property, interest, dividend and other income is their largest source while for taxpayers liable at the starting rate, 66% have pension income or property, interest, dividend and other income as their largest
source.
17
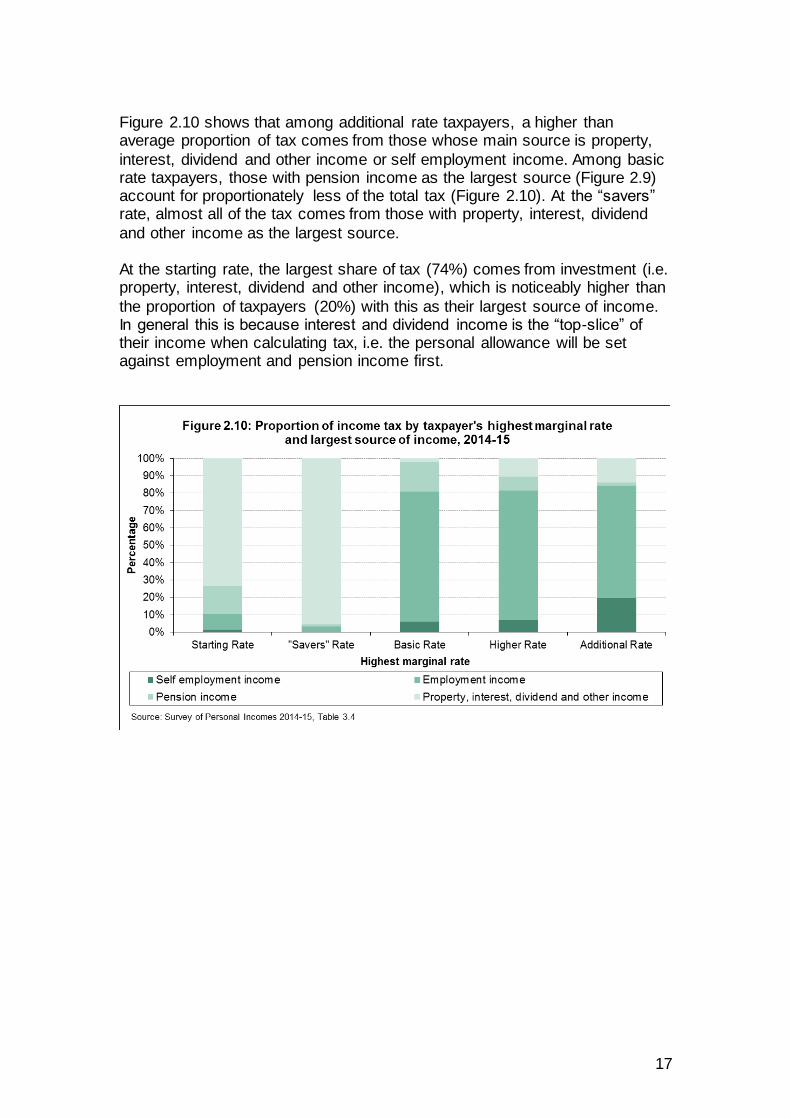
Figure 2.10 shows that among additional rate taxpayers, a higher than average proportion of tax comes from those whose main source is property,
interest, dividend and other income or self employment income. Among basic rate taxpayers, those with pension income as the largest source (Figure 2.9) account for proportionately less of the total tax (Figure 2.10). At the “savers” rate, almost all of the tax comes from those with property, interest, dividend
and other income as the largest source. At the starting rate, the largest share of tax (74%) comes from investment (i.e. property, interest, dividend and other income), which is noticeably higher than
the proportion of taxpayers (20%) with this as their largest source of income. In general this is because interest and dividend income is the “top-slice” of their income when calculating tax, i.e. the personal allowance will be set against employment and pension income first.
18
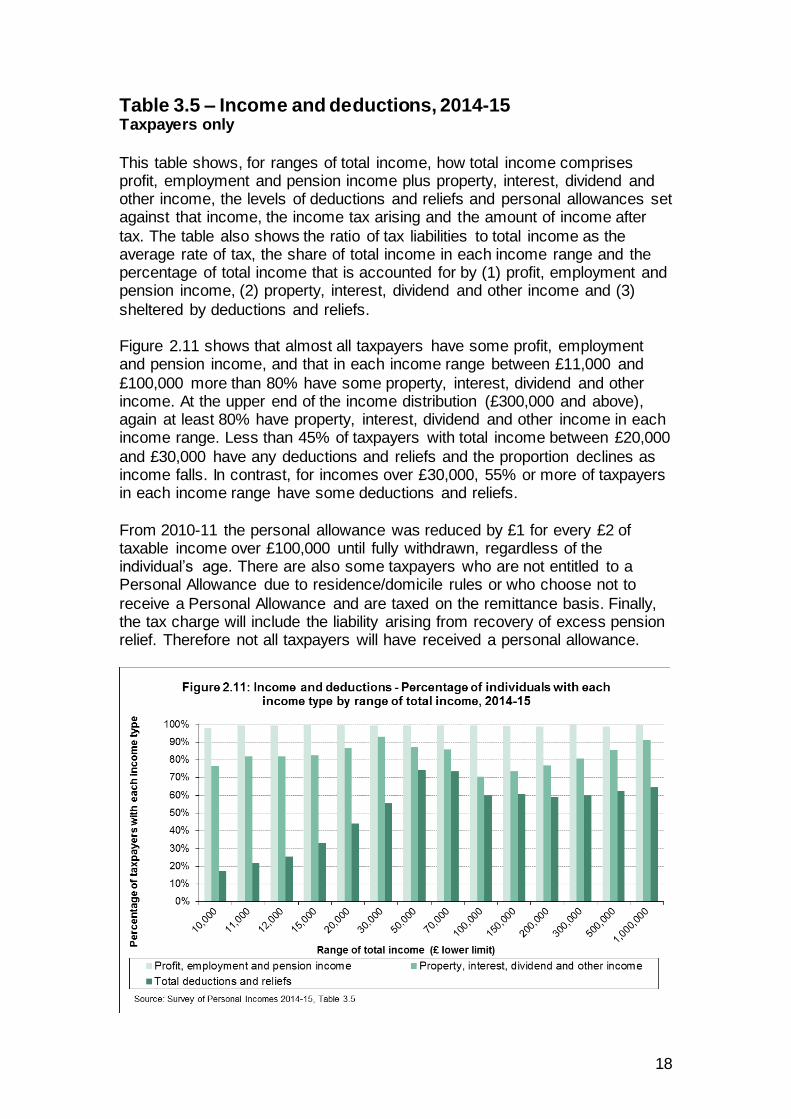
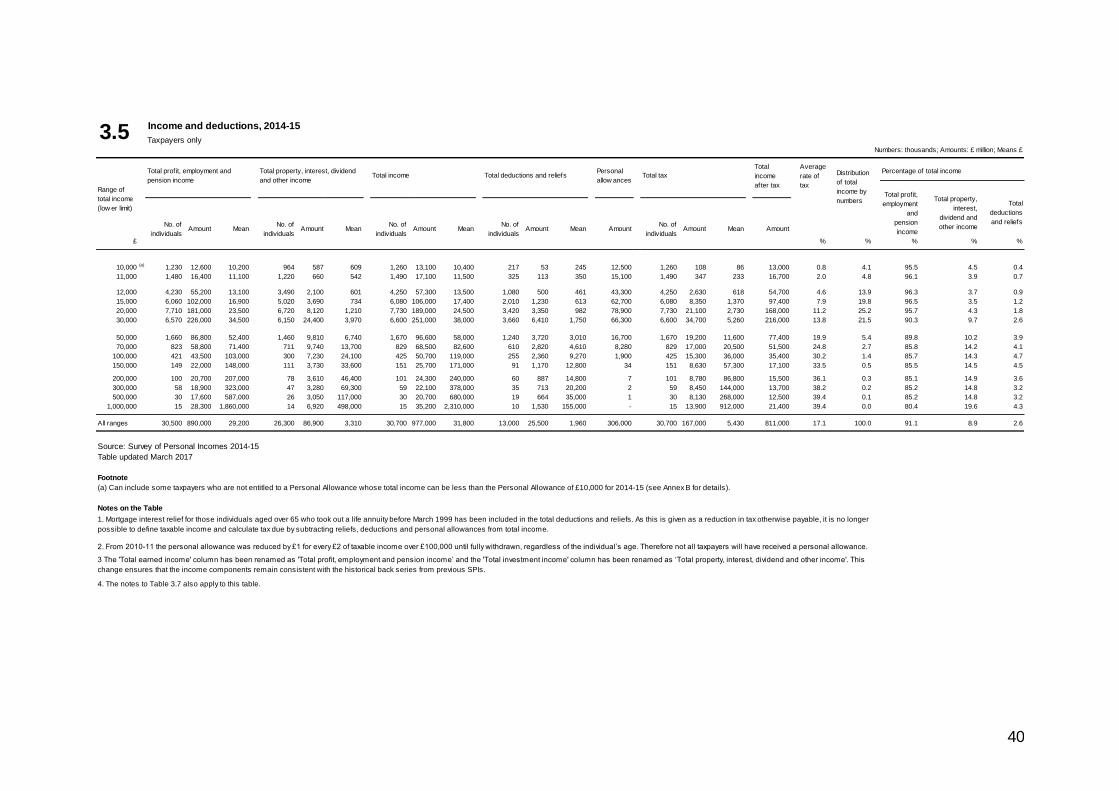
Table 3.5 – Income and deductions, 2014-15 Taxpayers only
This table shows, for ranges of total income, how total income comprises profit, employment and pension income plus property, interest, dividend and other income, the levels of deductions and reliefs and personal allowances set against that income, the income tax arising and the amount of income after
tax. The table also shows the ratio of tax liabilities to total income as the average rate of tax, the share of total income in each income range and the percentage of total income that is accounted for by (1) profit, employment and pension income, (2) property, interest, dividend and other income and (3)
sheltered by deductions and reliefs. Figure 2.11 shows that almost all taxpayers have some profit, employment and pension income, and that in each income range between £11,000 and
£100,000 more than 80% have some property, interest, dividend and other income. At the upper end of the income distribution (£300,000 and above), again at least 80% have property, interest, dividend and other income in each income range. Less than 45% of taxpayers with total income between £20,000
and £30,000 have any deductions and reliefs and the proportion declines as income falls. In contrast, for incomes over £30,000, 55% or more of taxpayers in each income range have some deductions and reliefs.
From 2010-11 the personal allowance was reduced by £1 for every £2 of taxable income over £100,000 until fully withdrawn, regardless of the individual’s age. There are also some taxpayers who are not entitled to a Personal Allowance due to residence/domicile rules or who choose not to
receive a Personal Allowance and are taxed on the remittance basis. Finally, the tax charge will include the liability arising from recovery of excess pension relief. Therefore not all taxpayers will have received a personal allowance.
19
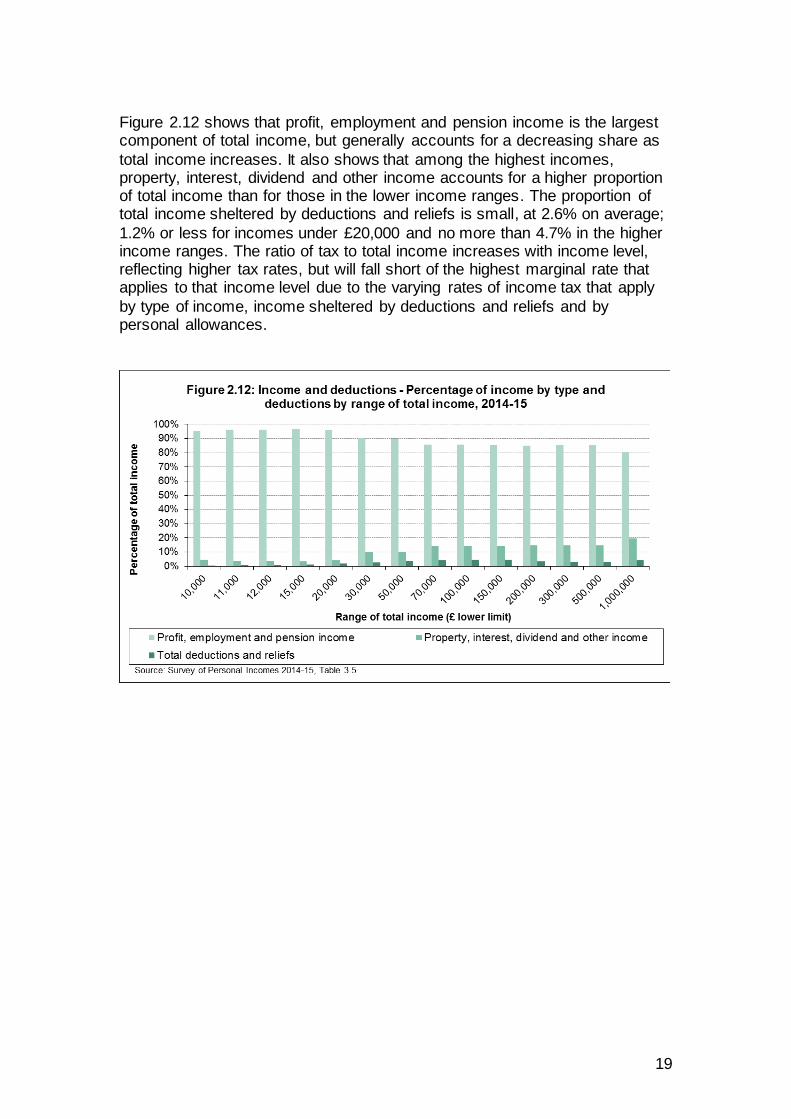
Figure 2.12 shows that profit, employment and pension income is the largest component of total income, but generally accounts for a decreasing share as
total income increases. It also shows that among the highest incomes, property, interest, dividend and other income accounts for a higher proportion of total income than for those in the lower income ranges. The proportion of total income sheltered by deductions and reliefs is small, at 2.6% on average;
1.2% or less for incomes under £20,000 and no more than 4.7% in the higher income ranges. The ratio of tax to total income increases with income level, reflecting higher tax rates, but will fall short of the highest marginal rate that applies to that income level due to the varying rates of income tax that apply
by type of income, income sheltered by deductions and reliefs and by personal allowances.
20
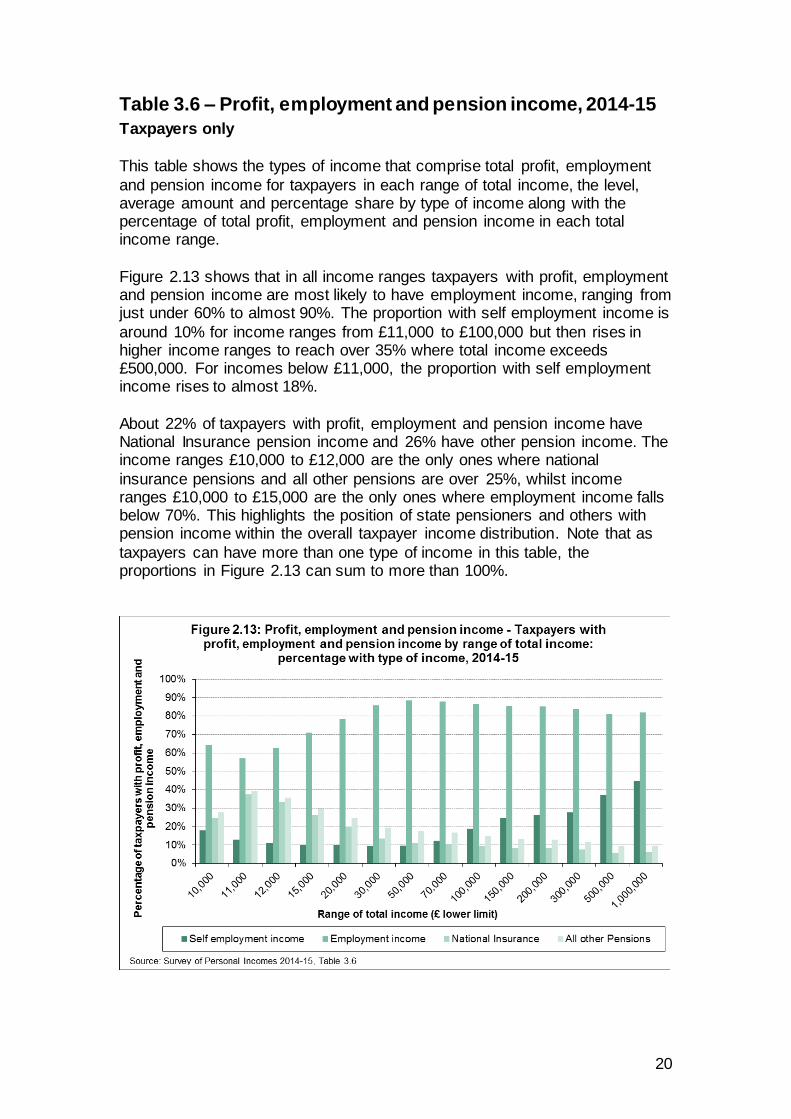
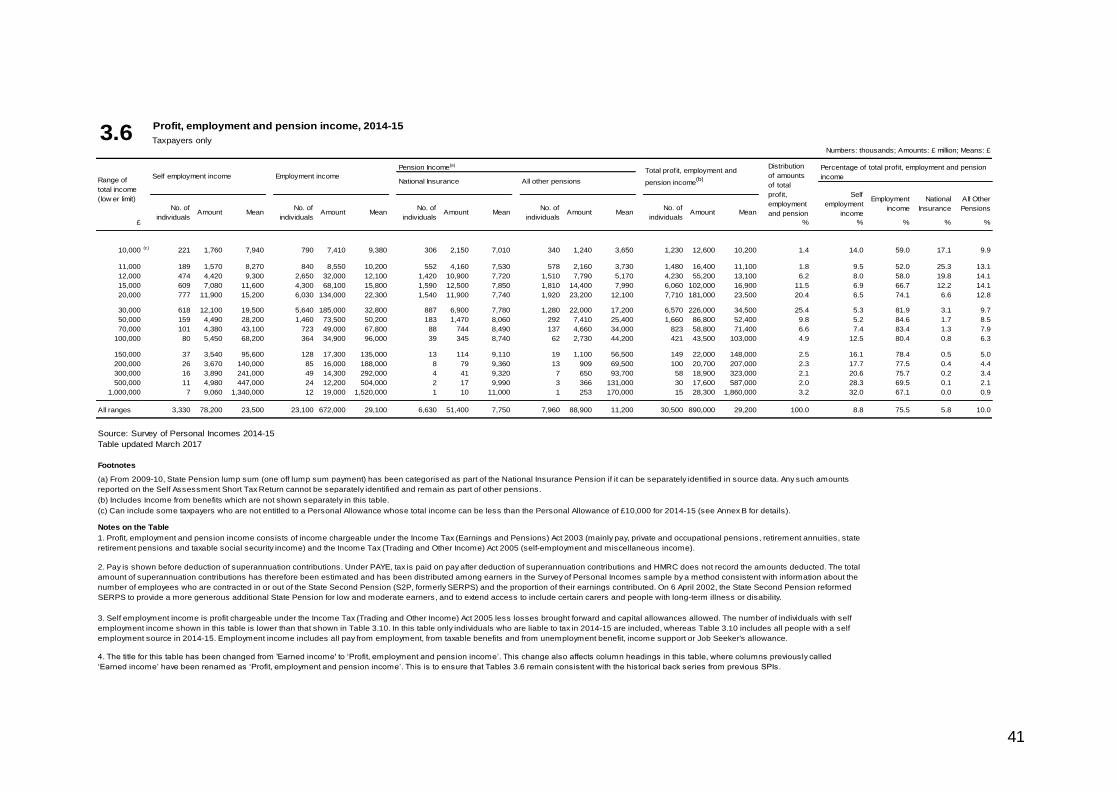
Table 3.6 – Profit, employment and pension income, 2014-15
Taxpayers only
This table shows the types of income that comprise total profit, employment
and pension income for taxpayers in each range of total income, the level, average amount and percentage share by type of income along with the percentage of total profit, employment and pension income in each total income range.
Figure 2.13 shows that in all income ranges taxpayers with profit, employment and pension income are most likely to have employment income, ranging from just under 60% to almost 90%. The proportion with self employment income is
around 10% for income ranges from £11,000 to £100,000 but then rises in higher income ranges to reach over 35% where total income exceeds £500,000. For incomes below £11,000, the proportion with self employment income rises to almost 18%.
About 22% of taxpayers with profit, employment and pension income have National Insurance pension income and 26% have other pension income. The income ranges £10,000 to £12,000 are the only ones where national
insurance pensions and all other pensions are over 25%, whilst income ranges £10,000 to £15,000 are the only ones where employment income falls below 70%. This highlights the position of state pensioners and others with pension income within the overall taxpayer income distribution. Note that as
taxpayers can have more than one type of income in this table, the proportions in Figure 2.13 can sum to more than 100%.
21
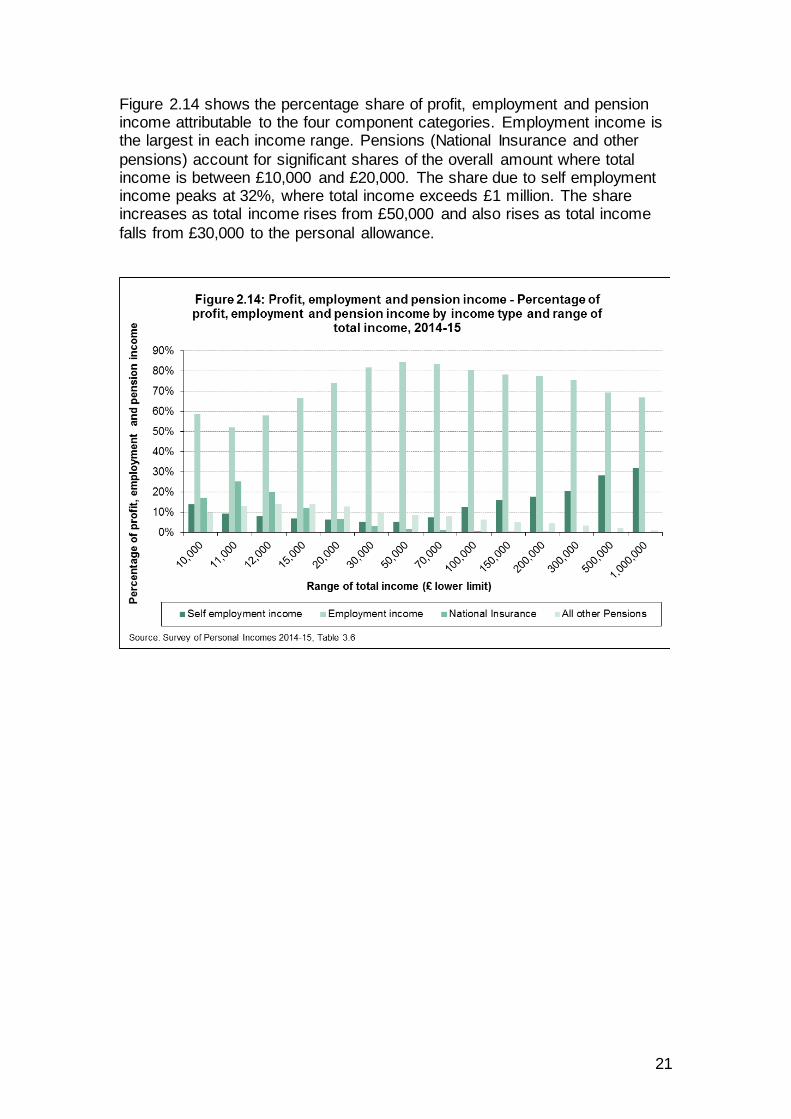
Figure 2.14 shows the percentage share of profit, employment and pension income attributable to the four component categories. Employment income is the largest in each income range. Pensions (National Insurance and other
pensions) account for significant shares of the overall amount where total income is between £10,000 and £20,000. The share due to self employment income peaks at 32%, where total income exceeds £1 million. The share increases as total income rises from £50,000 and also rises as total income
falls from £30,000 to the personal allowance.
22
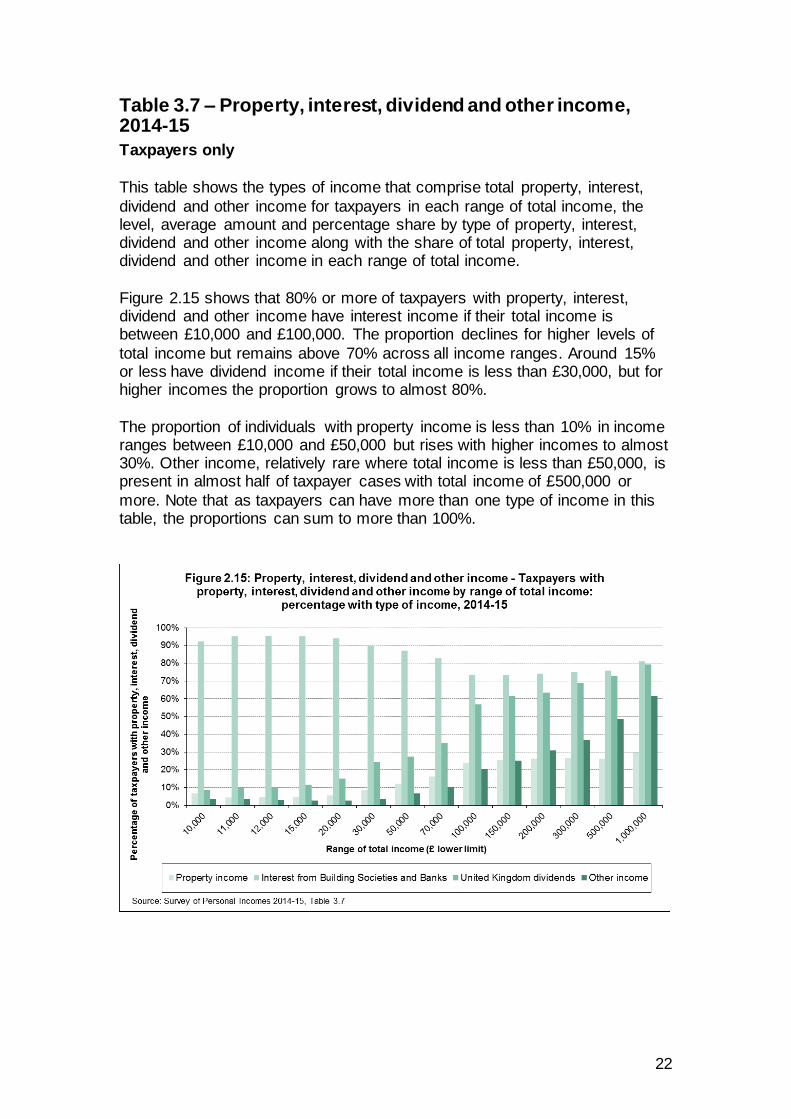
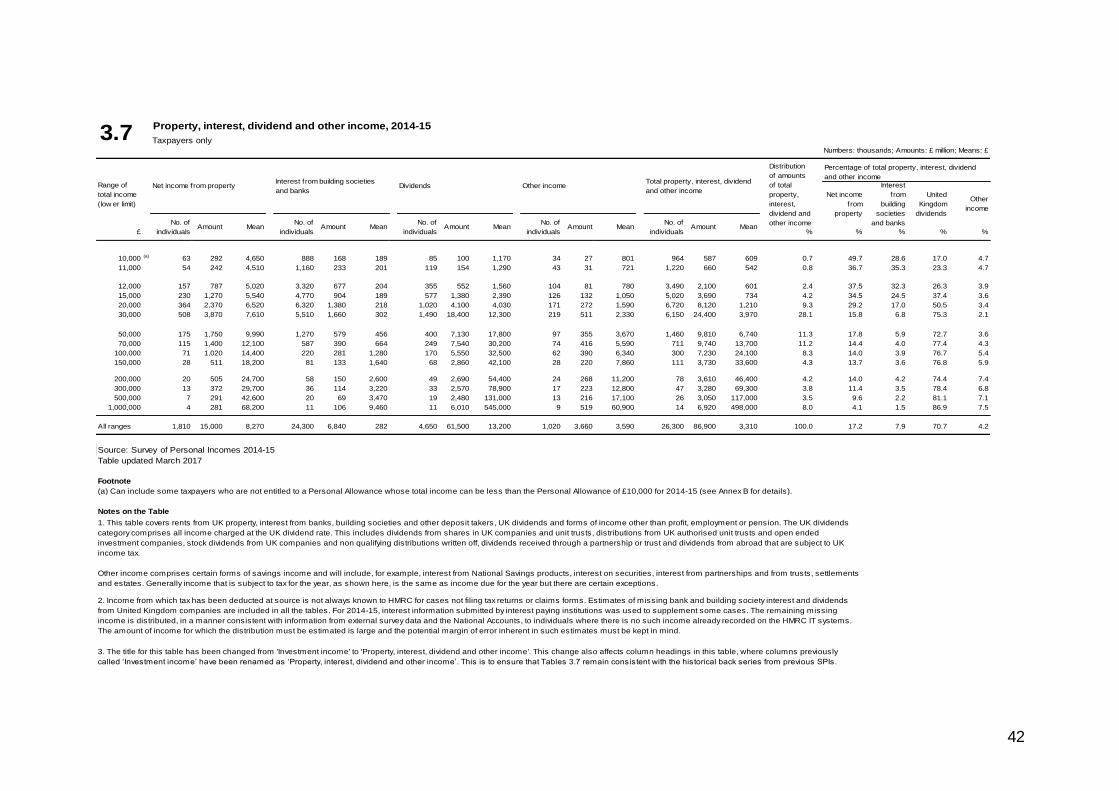
Table 3.7 – Property, interest, dividend and other income, 2014-15
Taxpayers only
This table shows the types of income that comprise total property, interest,
dividend and other income for taxpayers in each range of total income, the level, average amount and percentage share by type of property, interest, dividend and other income along with the share of total property, interest, dividend and other income in each range of total income.
Figure 2.15 shows that 80% or more of taxpayers with property, interest, dividend and other income have interest income if their total income is between £10,000 and £100,000. The proportion declines for higher levels of
total income but remains above 70% across all income ranges. Around 15% or less have dividend income if their total income is less than £30,000, but for higher incomes the proportion grows to almost 80%.
The proportion of individuals with property income is less than 10% in income ranges between £10,000 and £50,000 but rises with higher incomes to almost 30%. Other income, relatively rare where total income is less than £50,000, is present in almost half of taxpayer cases with total income of £500,000 or
more. Note that as taxpayers can have more than one type of income in this table, the proportions can sum to more than 100%.
23
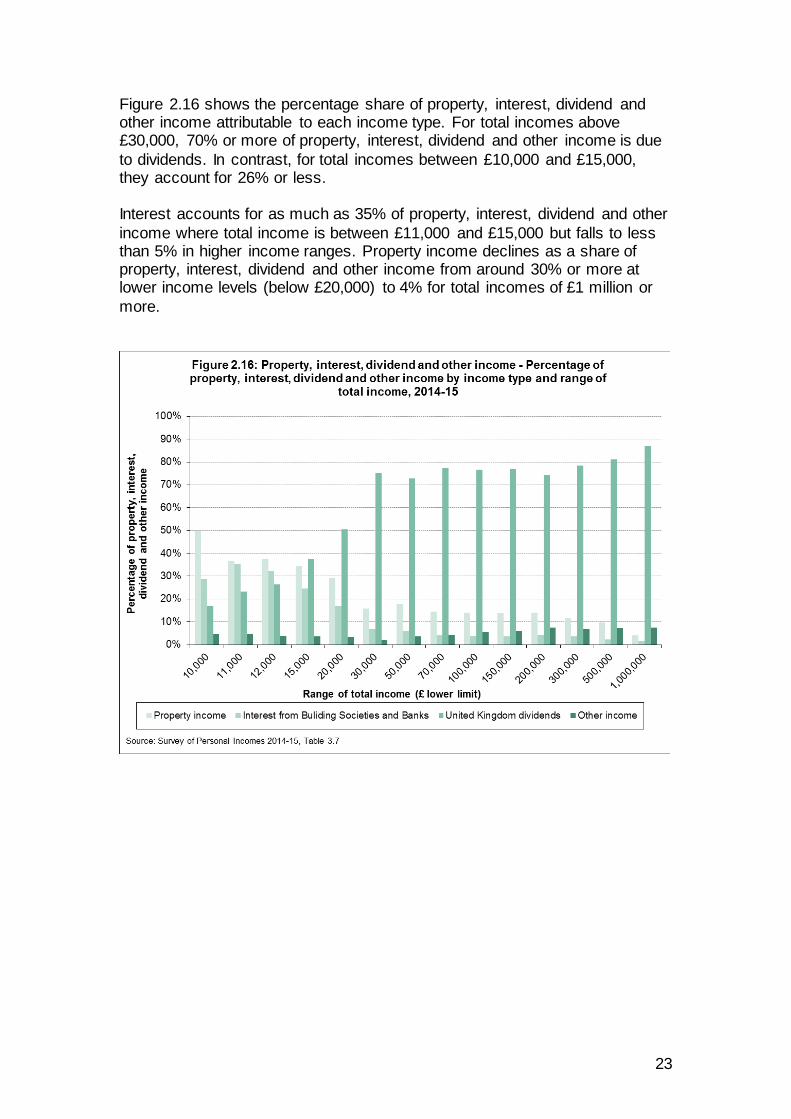
Figure 2.16 shows the percentage share of property, interest, dividend and other income attributable to each income type. For total incomes above £30,000, 70% or more of property, interest, dividend and other income is due
to dividends. In contrast, for total incomes between £10,000 and £15,000, they account for 26% or less. Interest accounts for as much as 35% of property, interest, dividend and other
income where total income is between £11,000 and £15,000 but falls to less than 5% in higher income ranges. Property income declines as a share of property, interest, dividend and other income from around 30% or more at lower income levels (below £20,000) to 4% for total incomes of £1 million or
more.
24
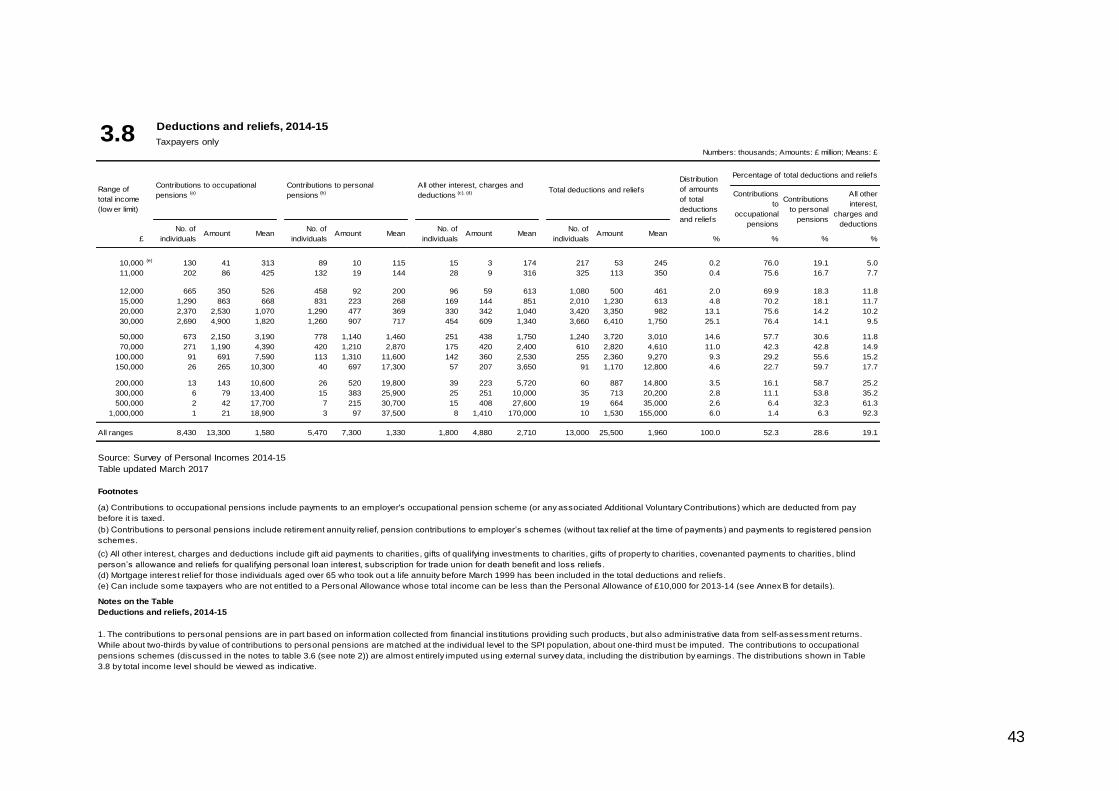
Table 3.8 – Deductions and reliefs, 2014-15
Taxpayers only
This table shows the types of deductions and reliefs set against total income
by taxpayers in each range of total income. Deductions and reliefs are the amounts deducted from total income, along with personal allowances, to arrive at the amount of taxable income subject to
an income tax charge. This includes amounts for contributions to occupational and personal pensions, and a variety of other deductions and reliefs including charitable giving and loss relief etc.
The table shows the size and relative importance of each relief type by income range and the share of total deductions and reliefs that arise in each total income range.
Note that occupational and personal pension contributions are imputed onto the sample records for many individuals within the SPI in order to get a full estimate of total income for all cases. Consequently, distributions by total income range should be viewed as indicative (see Annex B).
25
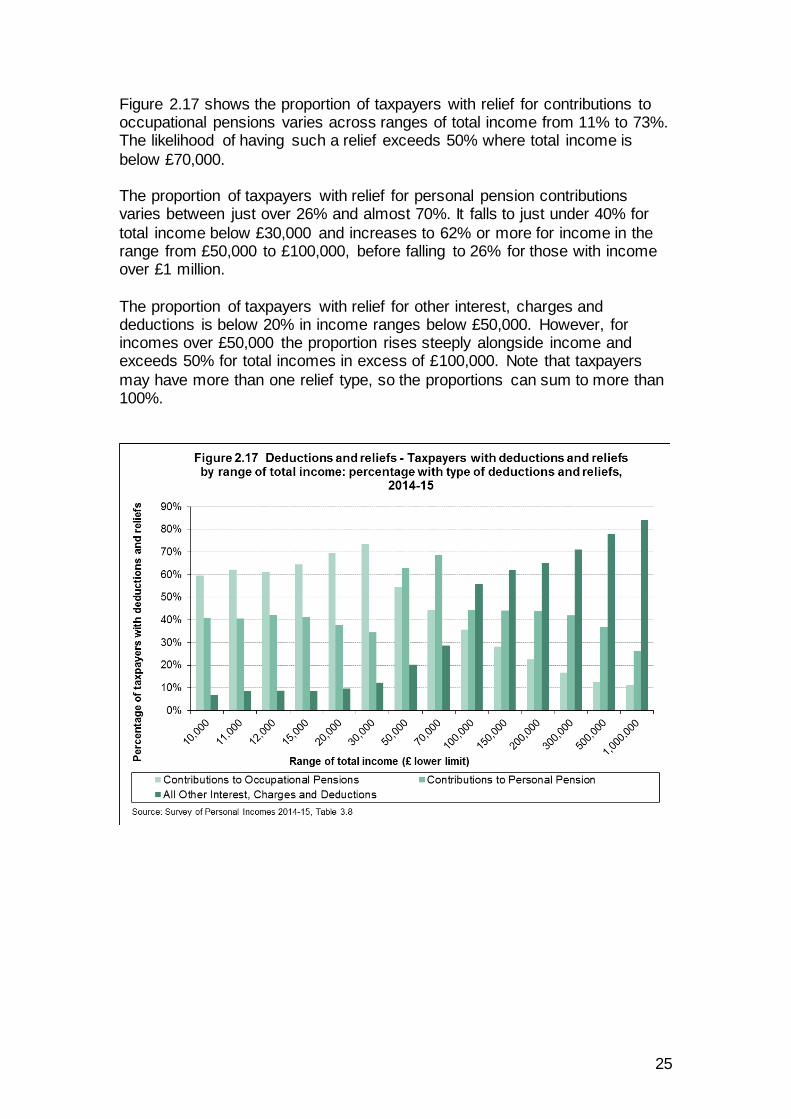
Figure 2.17 shows the proportion of taxpayers with relief for contributions to occupational pensions varies across ranges of total income from 11% to 73%. The likelihood of having such a relief exceeds 50% where total income is
below £70,000. The proportion of taxpayers with relief for personal pension contributions varies between just over 26% and almost 70%. It falls to just under 40% for
total income below £30,000 and increases to 62% or more for income in the range from £50,000 to £100,000, before falling to 26% for those with income over £1 million.
The proportion of taxpayers with relief for other interest, charges and deductions is below 20% in income ranges below £50,000. However, for incomes over £50,000 the proportion rises steeply alongside income and exceeds 50% for total incomes in excess of £100,000. Note that taxpayers
may have more than one relief type, so the proportions can sum to more than 100%.
26
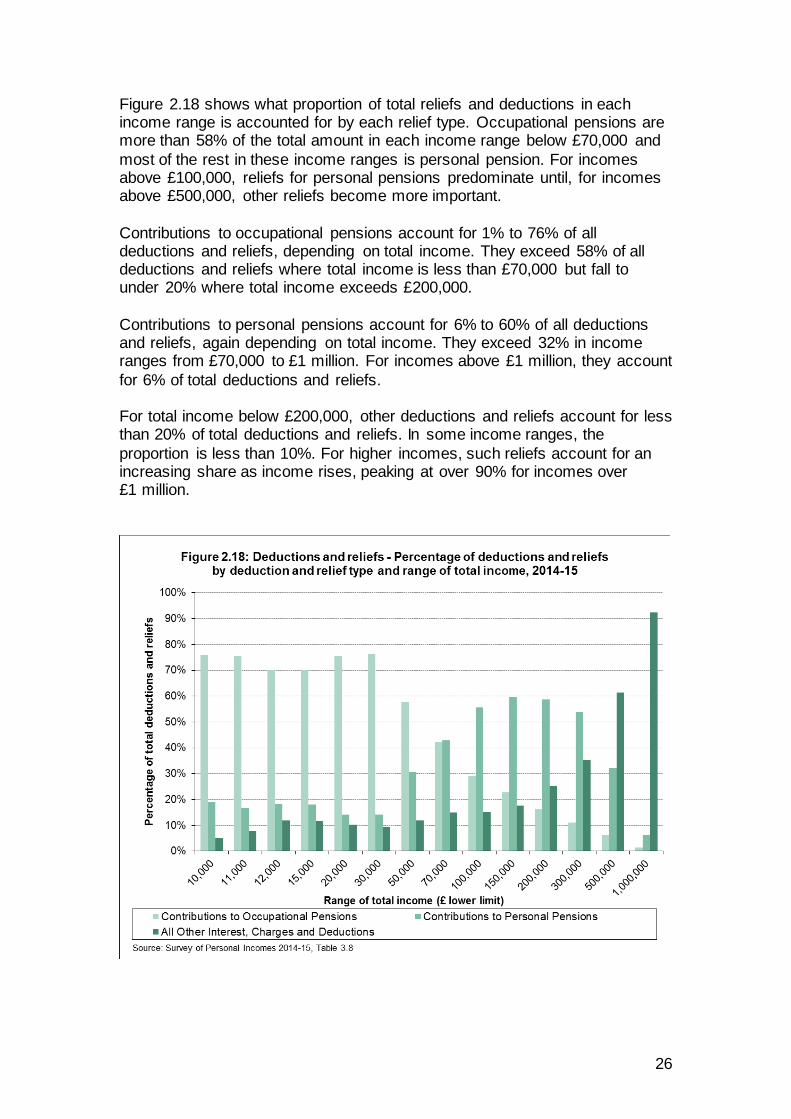
Figure 2.18 shows what proportion of total reliefs and deductions in each income range is accounted for by each relief type. Occupational pensions are more than 58% of the total amount in each income range below £70,000 and
most of the rest in these income ranges is personal pension. For incomes above £100,000, reliefs for personal pensions predominate until, for incomes above £500,000, other reliefs become more important.
Contributions to occupational pensions account for 1% to 76% of all deductions and reliefs, depending on total income. They exceed 58% of all deductions and reliefs where total income is less than £70,000 but fall to under 20% where total income exceeds £200,000.
Contributions to personal pensions account for 6% to 60% of all deductions and reliefs, again depending on total income. They exceed 32% in income ranges from £70,000 to £1 million. For incomes above £1 million, they account
for 6% of total deductions and reliefs. For total income below £200,000, other deductions and reliefs account for less than 20% of total deductions and reliefs. In some income ranges, the
proportion is less than 10%. For higher incomes, such reliefs account for an increasing share as income rises, peaking at over 90% for incomes over £1 million.
27
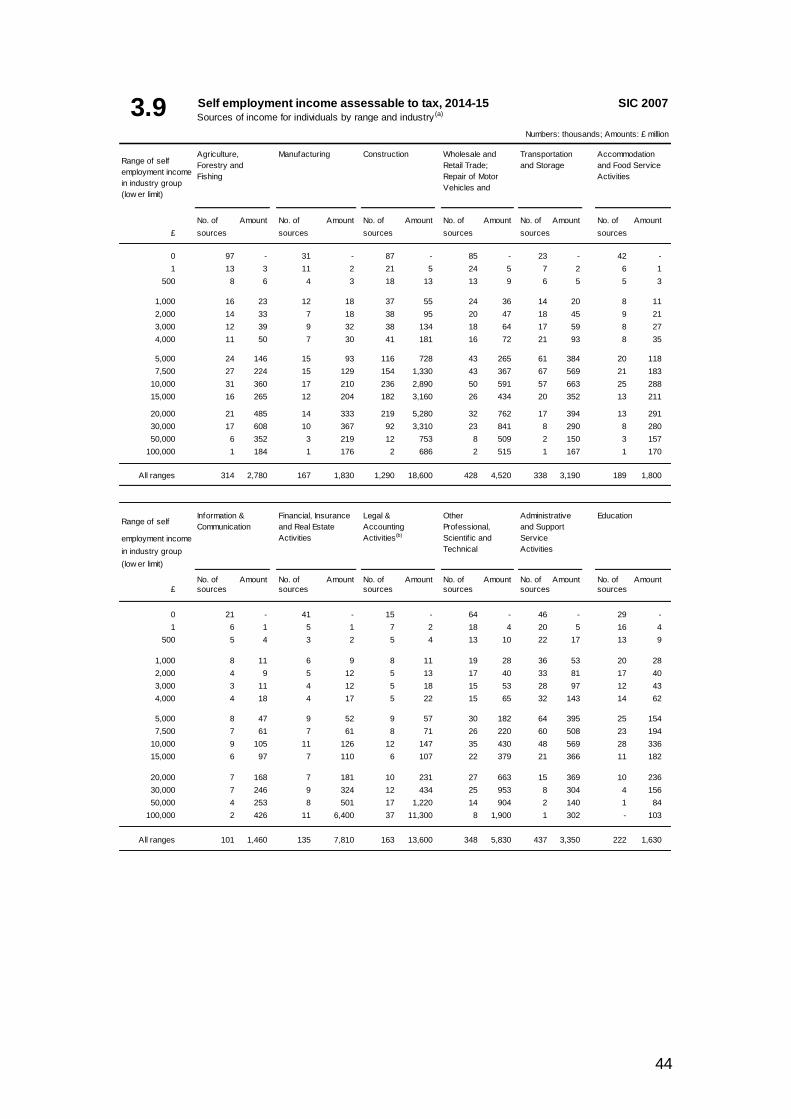
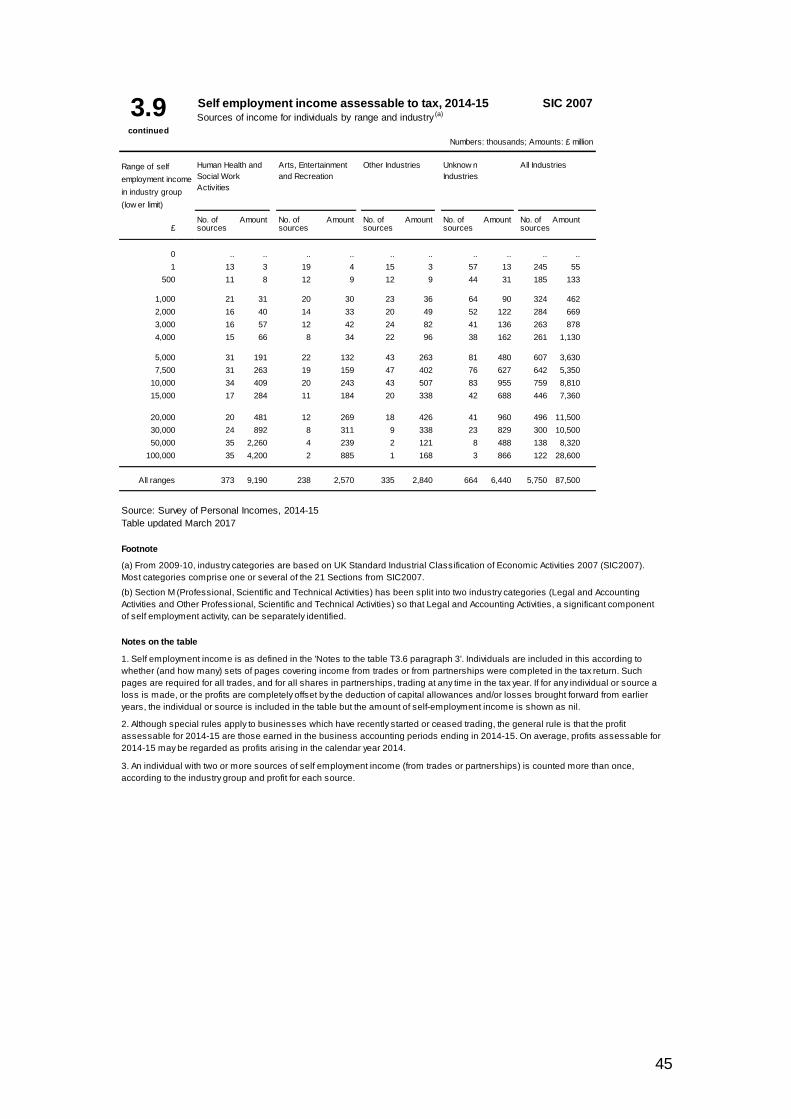
Table 3.9 – Self employment income assessable to tax, 2014-15
Sources of income for individuals by range and industry
This table shows the number of sources of self employment income and the
amount of profit for those sources, ranged on the self employment income from the source. The sources of all individuals in the survey, whether taxpayers or not, are recorded.
An individual may have several instances of self employment income from activity both as a sole trader and as a partner in a partnership. Where there are multiple instances as a sole trader, one instance is designated the primary source and all other instances are amalgamated into a single secondary
source. Similarly for multiple instances of partner income, one instance is designated the primary source and all other instances are amalgamated into a single secondary source. Where multiple instances exist, the secondary source record contains the sum of income amounts and is allocated to the
industry of the most significant of those secondary sources. Consequently, the table may count up to four sources of self employment income for each individual. The number of individuals underlying this table is shown in Table 3.10.
The table shows that there were 5.75 million self employment sources, accounting for £87.5 billion profit. In this table, loss making sources are shown in the zero range of self employment income.
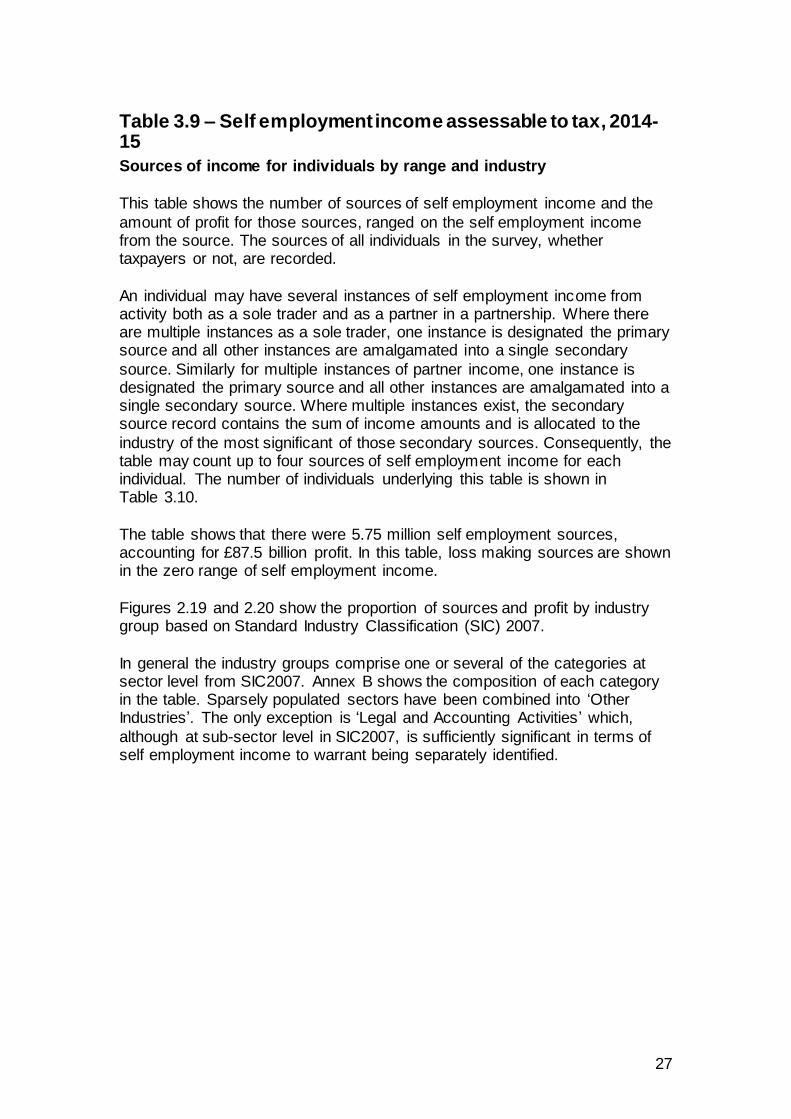
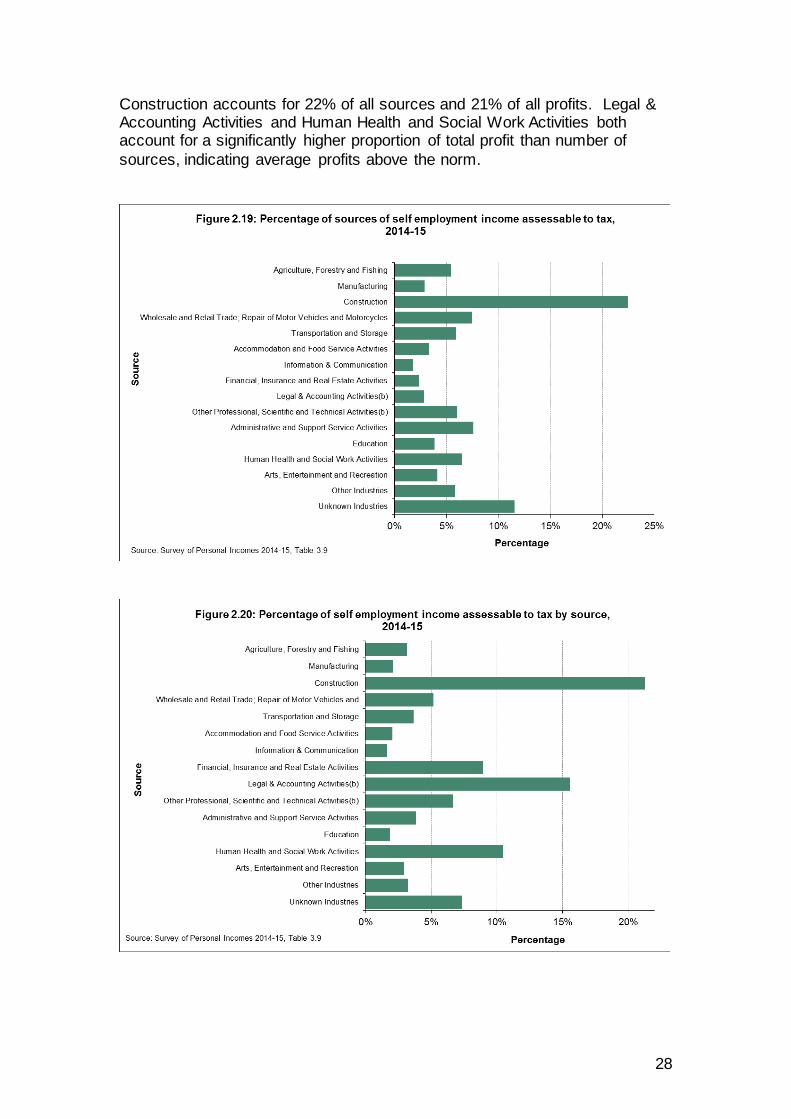
Figures 2.19 and 2.20 show the proportion of sources and profit by industry group based on Standard Industry Classification (SIC) 2007.
In general the industry groups comprise one or several of the categories at sector level from SIC2007. Annex B shows the composition of each category in the table. Sparsely populated sectors have been combined into ‘Other Industries’. The only exception is ‘Legal and Accounting Activities’ which,
although at sub-sector level in SIC2007, is sufficiently significant in terms of self employment income to warrant being separately identified.
28
Construction accounts for 22% of all sources and 21% of all profits. Legal & Accounting Activities and Human Health and Social Work Activities both account for a significantly higher proportion of total profit than number of
sources, indicating average profits above the norm.
29
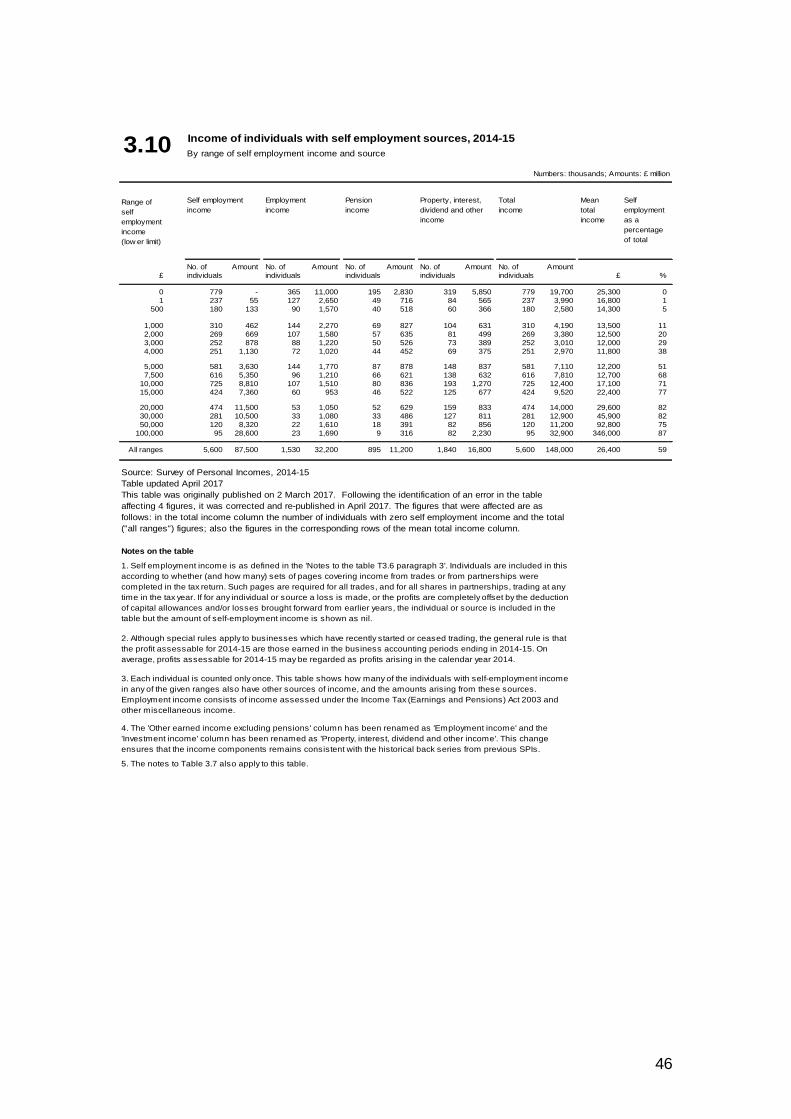
Table 3.10 – Income of individuals with self employment sources, 2014-15
By range of self employment income and source
This table comprises individuals with self employment income sources,
whether they are taxpayers or not. It shows, for ranges of self employment income, the composition of total income, average total income and the proportion of total income that is accounted for by self employment income.
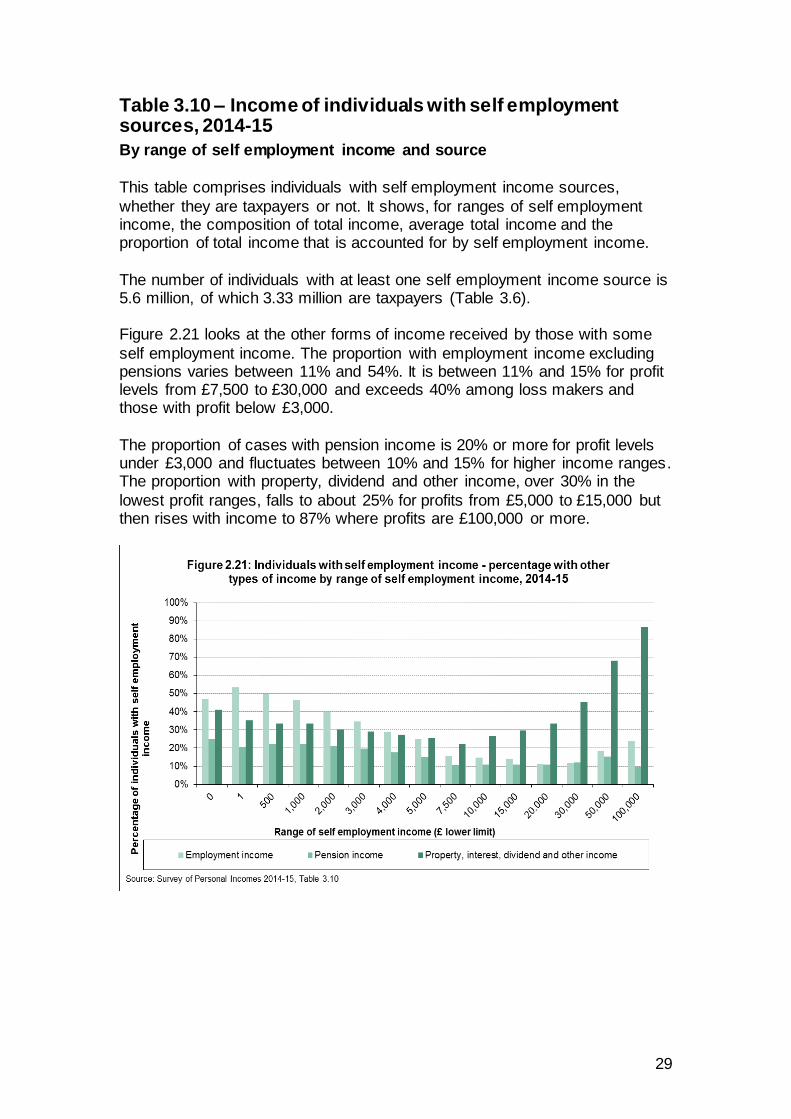
The number of individuals with at least one self employment income source is 5.6 million, of which 3.33 million are taxpayers (Table 3.6). Figure 2.21 looks at the other forms of income received by those with some
self employment income. The proportion with employment income excluding pensions varies between 11% and 54%. It is between 11% and 15% for profit levels from £7,500 to £30,000 and exceeds 40% among loss makers and those with profit below £3,000.
The proportion of cases with pension income is 20% or more for profit levels under £3,000 and fluctuates between 10% and 15% for higher income ranges. The proportion with property, dividend and other income, over 30% in the
lowest profit ranges, falls to about 25% for profits from £5,000 to £15,000 but then rises with income to 87% where profits are £100,000 or more.
30
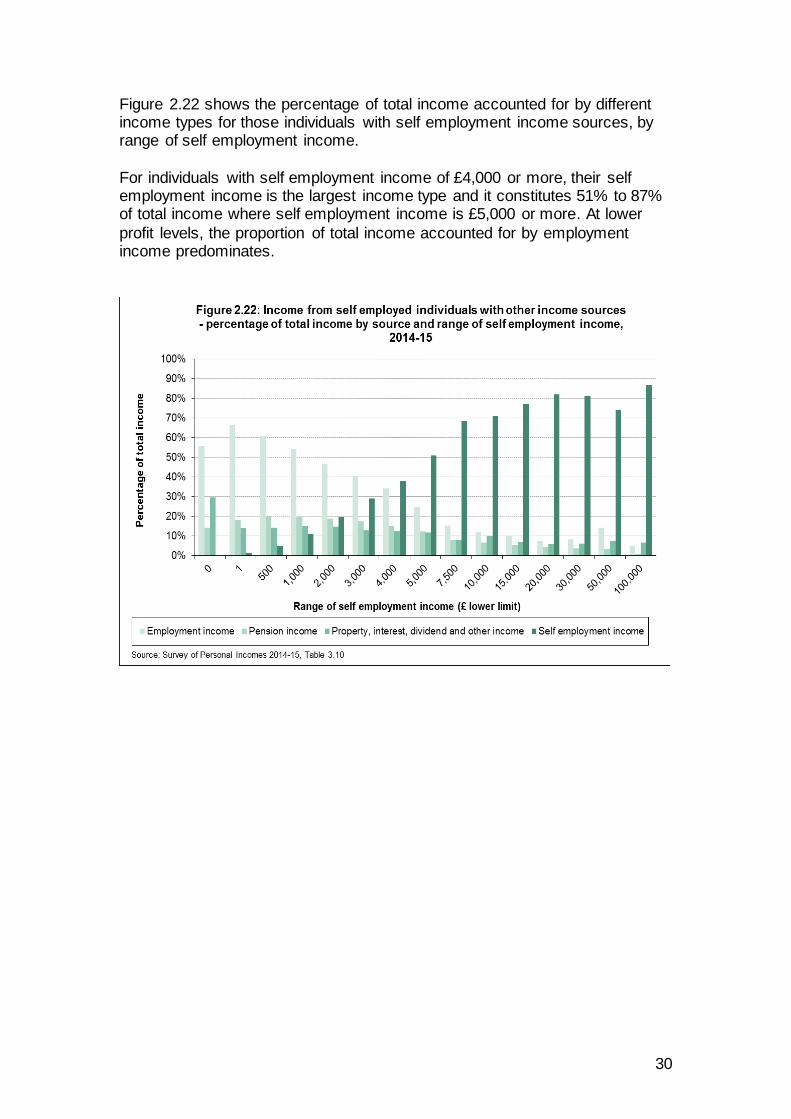
Figure 2.22 shows the percentage of total income accounted for by different income types for those individuals with self employment income sources, by range of self employment income.
For individuals with self employment income of £4,000 or more, their self employment income is the largest income type and it constitutes 51% to 87% of total income where self employment income is £5,000 or more. At lower
profit levels, the proportion of total income accounted for by employment income predominates.
31
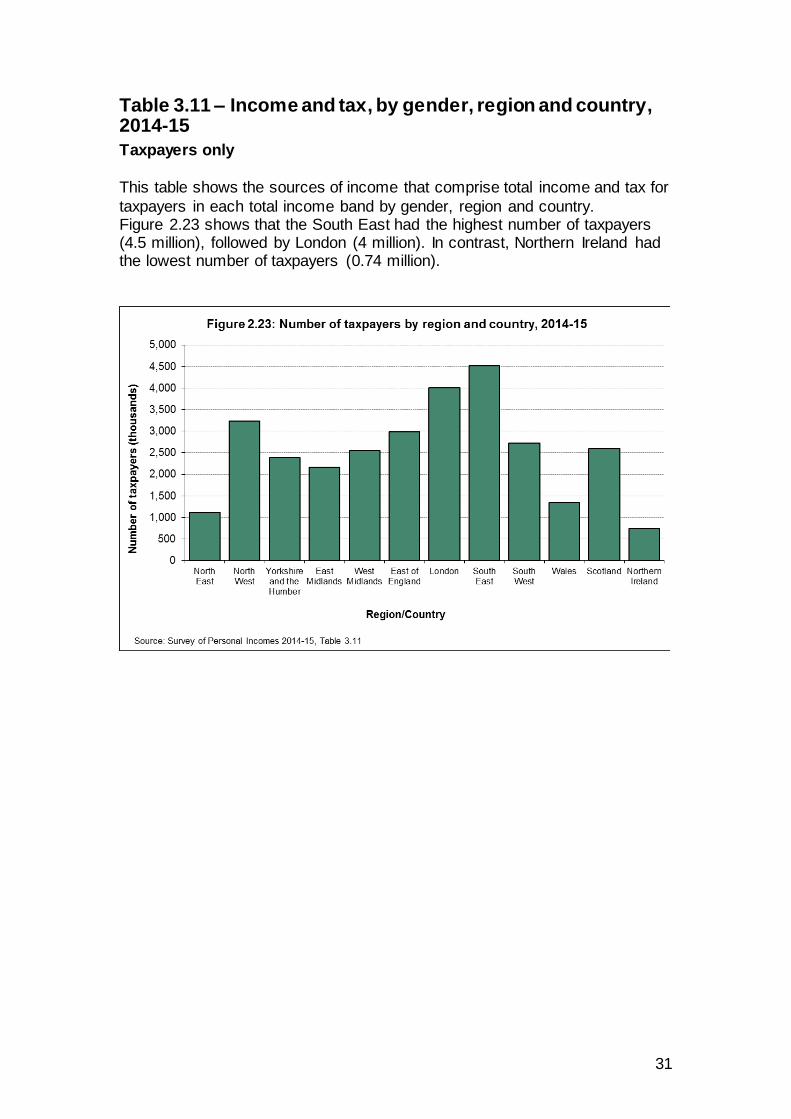
Table 3.11 – Income and tax, by gender, region and country, 2014-15
Taxpayers only
This table shows the sources of income that comprise total income and tax for
taxpayers in each total income band by gender, region and country. Figure 2.23 shows that the South East had the highest number of taxpayers (4.5 million), followed by London (4 million). In contrast, Northern Ireland had the lowest number of taxpayers (0.74 million).
32
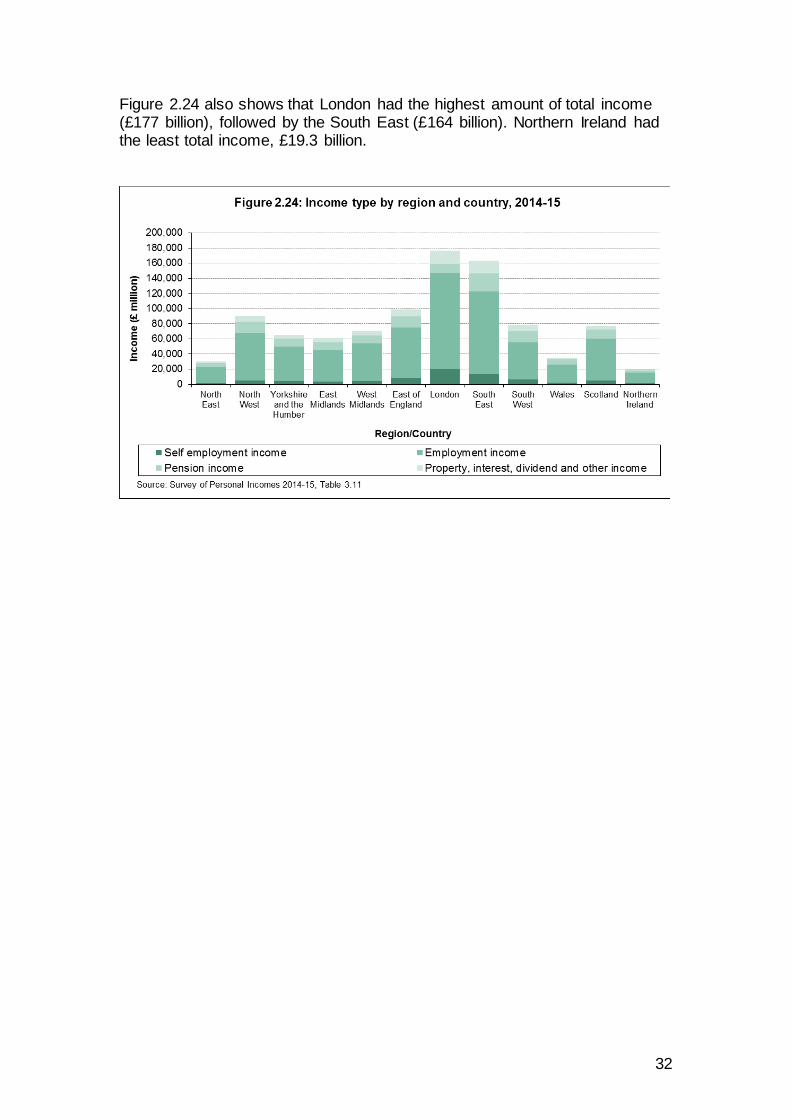
Figure 2.24 also shows that London had the highest amount of total income (£177 billion), followed by the South East (£164 billion). Northern Ireland had the least total income, £19.3 billion.
33
Annex A: National Statistics Tables 3.1 to 3.11, 2014-15
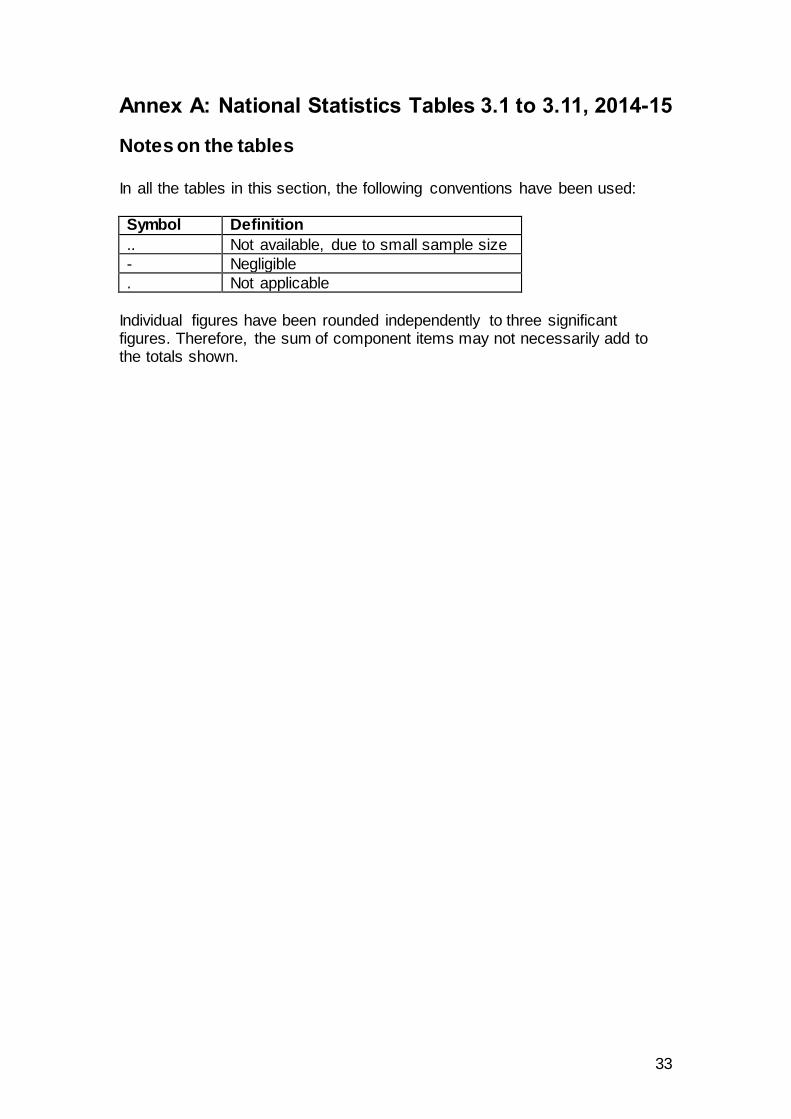
Notes on the tables
In all the tables in this section, the following conventions have been used: Symbol Definition
.. Not available, due to small sample size
- Negligible
. Not applicable
Individual figures have been rounded independently to three significant figures. Therefore, the sum of component items may not necessarily add to the totals shown.
34
Percentile points for total income before and after tax,
1992-93 to 2014-15Taxpayers only
Amounts: £
Percentile point 1 5 10 25 50 75 90 95 99
Total income before tax
1992-93 3,630 4,400 5,160 11,500 25,500 33,100 62,800
1993-94 3,670 4,440 5,220 11,600 25,800 33,500 64,800
1994-95 3,690 4,460 5,270 11,900 26,100 33,700 68,400
1995-96 3,760 4,640 5,420 12,200 27,100 35,100 69,900
1996-97 4,000 4,900 5,650 12,500 28,300 37,200 76,100
1997-98 4,260 5,220 6,020 13,200 29,400 39,000 83,700
1998-99 4,450 5,410 6,220 13,600 31,100 41,600 90,000
1999-00 4,600 5,630 6,570 9,260 14,400 22,300 33,000 44,600 96,400
2000-01 4,620 5,520 6,480 9,280 14,800 23,000 34,200 46,700 102,000
2001-02 4,780 5,850 6,860 9,910 15,500 24,300 36,200 49,200 107,000
2002-03 4,860 5,960 6,970 10,000 15,800 24,700 36,700 49,800 108,000
2003-04 4,820 5,850 7,000 10,100 16,000 25,100 37,100 50,600 111,000
2004-05 4,980 6,070 7,260 10,300 16,400 26,100 39,000 52,400 117,000
2005-06 5,200 6,350 7,610 10,800 17,100 27,400 41,300 56,200 132,000
2006-07 5,410 6,600 7,880 11,200 17,700 28,400 42,900 58,500 141,000
2007-08 5,600 6,870 8,240 11,800 18,500 29,500 44,900 61,500 149,000
2008-09(a)
2009-10 6,800 7,970 9,510 12,900 19,600 30,900 46,600 63,200 149,000
2010-11 6,730 7,830 9,350 12,700 19,500 30,900 46,300 62,600 140,000
2011-12 7,740 8,840 10,200 13,500 20,300 32,100 48,300 66,200 147,000
2012-13 8,370 9,570 10,900 14,200 21,000 32,900 49,200 67,900 150,000
2013-14 9,710 10,800 11,800 15,000 21,900 33,900 50,600 70,400 159,000
2014-15 10,300 11,200 12,200 15,500 22,400 34,500 51,400 71,700 162,000
Total income after tax
1992-93 3,600 4,250 4,880 10,100 21,100 26,500 45,300
1993-94 3,630 4,290 4,920 10,100 20,900 26,400 46,100
1994-95 3,640 4,310 4,980 10,200 21,100 26,200 48,100
1995-96 3,720 4,440 5,150 10,400 21,900 27,200 49,200
1996-97 3,950 4,690 5,390 10,800 23,100 29,000 53,400
1997-98 4,220 4,990 5,750 11,400 24,300 30,700 58,800
1998-99 4,400 5,180 5,930 11,800 25,600 32,500 62,800
1999-00 4,570 5,500 6,340 8,490 12,500 18,800 27,300 34,800 67,500
2000-01 4,600 5,410 6,270 8,510 12,900 19,400 28,400 36,200 71,000
2001-02 4,760 5,730 6,650 9,120 13,600 20,600 30,000 38,000 74,300
2002-03 4,840 5,830 6,760 9,230 13,800 20,900 30,400 38,400 75,000
2003-04 4,800 5,730 6,790 9,290 14,000 21,100 30,700 39,000 77,000
2004-05 4,950 5,940 7,040 9,470 14,400 22,000 32,100 40,500 81,500
2005-06 5,170 6,210 7,340 9,930 14,900 23,100 33,900 43,100 91,100
2006-07 5,370 6,450 7,610 10,300 15,400 23,800 35,000 44,800 97,400
2007-08 5,570 6,710 7,940 10,800 16,100 24,800 36,600 46,800 103,000
2008-09(a)
2009-10 6,740 7,690 8,940 11,800 17,200 26,300 39,200 49,300 105,000
2010-11 6,690 7,580 8,800 11,700 17,100 26,300 39,000 49,000 96,200
2011-12 7,690 8,600 9,830 12,500 18,000 27,500 40,000 51,500 100,000
2012-13 8,320 9,300 10,500 13,200 18,700 28,200 40,700 52,500 101,000
2013-14 9,660 10,600 11,400 14,000 19,500 29,300 41,500 54,000 107,000
2014-15 10,200 11,000 11,800 14,500 20,000 29,900 42,300 55,100 108,000
Source: Survey of Personal Incomes 2014-15
Table updated March 2017
Footnote
(a) Figures for 2008-09 tax year are not currently available.
Notes on the Table
Percentile points for total income before and after tax, 1992-93 to 2014-15
3.1
1. This table gives certain percentile points of the income distribution as estimated from the
Survey of Personal Incomes for each survey year shown. The table only covers individuals who
have some liability to income tax. The percentile points have been independently calculated on
total income before tax and total income after tax.
2. Total income is the sum of all income subject to tax for the year (see the Income tax statistics
and distributions introduction). For most types of income this is approximately the same as
income that is earned in the tax year but this is not the case for self-employment income (see the
notes on the tables for 3.9 and 3.10) and some other kinds of income.
35
Distribution of median and mean income and tax
by age range and gender, 2014-15Taxpayers only
Numbers: thousands; Amounts: £
By age range Total
Under 20 150 13,000 579 14,900 1,030
20-24 1,760 15,800 1,130 17,900 1,620
25-29 2,890 20,800 2,090 24,400 3,100
30-34 2,940 24,500 2,760 30,300 4,700
35-39 2,740 26,800 3,120 36,100 6,590
40-44 2,920 27,500 3,180 39,600 7,860
45-49 3,210 27,100 3,120 40,200 8,080
50-54 3,110 26,300 2,980 39,400 7,730
55-59 2,540 25,200 2,790 37,300 7,020
60-64 2,100 22,500 2,340 31,800 5,320
65-69 2,190 19,800 1,820 27,000 4,000
70-74 1,500 17,900 1,450 25,000 3,380
75 and over 2,650 17,100 1,130 22,700 2,710
All ranges 30,700 22,400 2,300 31,800 5,430
By age range Male
Under 20 90 13,500 680 15,400 1,110
20-24 970 16,500 1,280 19,000 1,880
25-29 1,600 21,600 2,250 25,900 3,530
30-34 1,700 26,000 3,050 32,600 5,420
35-39 1,610 29,400 3,540 40,400 8,020
40-44 1,680 31,200 3,820 46,200 10,100
45-49 1,800 31,400 3,870 48,100 10,800
50-54 1,720 30,900 3,740 47,700 10,500
55-59 1,440 29,400 3,510 44,600 9,400
60-64 1,170 25,900 2,970 37,800 7,110
65-69 1,370 21,800 2,220 29,900 4,840
70-74 973 19,100 1,680 27,300 4,030
75 and over 1,460 18,400 1,280 24,900 3,250
All ranges 17,600 24,900 2,780 36,400 6,890
By age range Female
Under 20 60 12,300 430 14,200 913
20-24 787 15,100 983 16,700 1,310
25-29 1,290 19,800 1,890 22,600 2,560
30-34 1,240 22,600 2,380 27,100 3,710
35-39 1,130 23,400 2,490 29,900 4,550
40-44 1,230 23,000 2,380 30,500 4,790
45-49 1,410 22,200 2,240 30,100 4,670
50-54 1,400 21,500 2,110 29,100 4,330
55-59 1,100 20,800 1,970 27,700 3,890
60-64 937 19,200 1,730 24,400 3,090
65-69 817 17,100 1,320 22,200 2,600
70-74 527 16,100 1,070 20,600 2,180
75 and over 1,180 15,700 967 20,000 2,050
All ranges 13,100 19,600 1,780 25,700 3,470
Source: Survey of Personal Incomes 2014-15
Table updated March 2017
Notes on the Table
1. This table only covers individuals with some liability to tax.
3.2
Mean taxNo. of
taxpayers
Median income
before taxMedian tax
Mean income
before tax
Mean tax
No. of
taxpayers
Median income
before taxMedian tax
Mean income
before taxMean tax
No. of
taxpayers
Median income
before taxMedian tax
Mean income
before tax
36
Distribution of total income before and after tax by gender, 2014-15
Taxpayers onlyNumbers: thousands; Amounts: £ million
Total
10,000 (a) 1,260 13,100 108 13,000 1,520 16,000 159 15,800
11,000 1,490 17,100 347 16,700 1,840 21,700 538 21,200
12,000 4,250 57,300 2,630 54,700 5,150 73,400 3,980 69,400
15,000 6,080 106,000 8,350 97,400 6,800 129,000 11,500 118,000
20,000 7,730 189,000 21,100 168,000 7,750 215,000 25,900 189,000
30,000 6,600 251,000 34,700 216,000 5,680 253,000 39,900 213,000
50,000 1,670 96,600 19,200 77,400 1,070 81,500 19,500 62,000
70,000 829 68,500 17,000 51,500 513 58,800 17,400 41,400
100,000 425 50,700 15,300 35,400 210 37,800 12,700 25,100
150,000 151 25,700 8,630 17,100 63 17,000 6,200 10,800
200,000 101 24,300 8,780 15,500 47 18,200 6,920 11,300
300,000 59 22,100 8,450 13,700 26 16,300 6,420 9,900
500,000 30 20,700 8,130 12,500 15 16,300 6,450 9,850
1,000,000 15 35,200 13,900 21,400 6 23,700 9,160 14,600
All ranges 30,700 977,000 167,000 811,000 30,700 977,000 167,000 811,000
Male
10,000 (a) 538 5,600 49 5,550 652 6,870 73 6,800
11,000 649 7,460 155 7,310 816 9,640 246 9,390
12,000 1,950 26,300 1,220 25,100 2,420 34,600 1,910 32,700
15,000 3,170 55,200 4,350 50,900 3,670 70,100 6,240 63,900
20,000 4,540 112,000 12,500 99,100 4,690 130,000 15,900 115,000
30,000 4,290 164,000 22,900 141,000 3,840 172,000 27,600 145,000
50,000 1,190 69,300 14,000 55,400 786 60,200 14,600 45,600
70,000 618 51,100 12,800 38,300 394 45,400 13,500 31,800
100,000 330 39,400 11,900 27,400 169 30,400 10,300 20,100
150,000 122 20,900 7,020 13,900 52 14,200 5,160 9,000
200,000 83 20,000 7,230 12,700 40 15,500 5,880 9,580
300,000 50 18,800 7,190 11,600 23 14,500 5,710 8,770
500,000 27 18,300 7,220 11,100 13 14,600 5,780 8,780
1,000,000 14 32,000 12,600 19,400 6 21,700 8,370 13,300
All ranges 17,600 640,000 121,000 519,000 17,600 640,000 121,000 519,000
Total income
after tax
Range of
total income
(low er limit)
£
Before tax, by range of total income before tax After tax, by range of total income after tax
No. of
taxpayers
Total income
before taxTotal tax
Total income
after tax
3.3
No. of
taxpayers
Total income
before taxTotal tax
No. of
taxpayers
No. of
taxpayers
Total income
before taxTotal tax
Total income
after taxTotal tax
Range of
total income
(low er limit)
£
Before tax, by range of total income before tax After tax, by range of total income after tax
Total income
after tax
Total income
before tax
37
Distribution of total income before and after tax by gender, 2014-15
Taxpayers onlyContinued Numbers: thousands; Amounts: £ million
Female
10,000 (a) 720 7,550 59 7,490 863 9,140 87 9,050
11,000 837 9,630 191 9,430 1,030 12,100 293 11,800
12,000 2,300 31,000 1,410 29,600 2,730 38,800 2,080 36,700
15,000 2,910 50,500 4,000 46,500 3,120 59,300 5,270 54,000
20,000 3,200 77,800 8,600 69,200 3,060 84,300 10,100 74,200
30,000 2,310 86,700 11,800 74,900 1,840 80,400 12,300 68,100
50,000 472 27,300 5,280 22,000 283 21,300 4,940 16,400
70,000 211 17,400 4,210 13,200 118 13,400 3,830 9,550
100,000 95 11,300 3,340 7,960 41 7,350 2,430 4,910
150,000 28 4,850 1,620 3,240 11 2,860 1,040 1,830
200,000 18 4,330 1,550 2,780 7 2,770 1,040 1,730
300,000 9 3,320 1,260 2,060 3 1,840 707 1,130
500,000 3 2,360 915 1,450 2 1,750 674 1,070
1,000,000 1 3,220 1,250 1,960 1 2,060 791 1,270
All ranges 13,100 337,000 45,500 292,000 13,100 337,000 45,500 292,000
Source: Survey of Personal Incomes 2014-15
Table updated March 2017
Footnote
Notes on the Table
1. This table only covers individuals with some liability to tax.
Range of
total income
(low er limit)
£
Before tax, by range of total income before tax After tax, by range of total income after tax
(a) Can include some taxpayers who are not entitled to a Personal Allowance whose total income can be less
than the Personal Allowance of £10,000 for 2014-15 (see Annex B for details).
3.3
2. It should be noted that individuals may not necessarily fall into the same total income range for before and
after tax breakdowns. Total income before tax is used to assign people to an income range for columns 2 to 5,
whereas total income after the deduction of tax is used to assign individuals to an income band for columns 6
to 9.
No. of
taxpayers
Total income
before taxTotal tax
Total income
after tax
No. of
taxpayers
Total income
before taxTotal tax
Total income
after tax
38
Income tax liabilities of starting, "savers", basic, higher and additional rate
taxpayers, by largest source of income, 2014-15Taxpayers only
Numbers: thousands; Amounts: £ million
Range of Largest source of income
total income
(low er limit) Self-employment Employment Pension
£
Taxpayers liable only at starting rate
10,000 (a) 7 - 61 2 64 1 11 - 142 3
11,000 3 1 24 6 69 11 46 56 143 73
All ranges 10 1 86 7 133 12 56 56 285 76
Taxpayers liable at "savers" rate 2
10,000 (a) 3 - 33 1 19 1 8 1 63 3
11,000 3 1 42 13 37 6 35 10 117 30
15,000 .. .. 24 16 10 6 70 56 105 78
20,000 .. .. .. .. .. .. 152 230 154 232
30,000 .. .. 1 1 .. .. 245 682 247 684
All ranges 8 2 101 31 68 14 509 980 686 1,030
Taxpayers liable at basic rate
(excluding higher rate taxpayers)
10,000 (a) 159 15 620 59 248 18 27 10 1,050 102
11,000 460 253 3,080 1,740 1,920 903 59 34 5,510 2,930
15,000 407 583 3,920 5,590 1,580 2,010 62 83 5,960 8,270
20,000 488 1,360 5,510 15,400 1,440 3,800 133 315 7,570 20,900
30,000 261 1,270 3,920 19,200 594 2,860 215 792 4,990 24,200
All ranges 1,770 3,490 17,000 42,100 5,770 9,590 496 1,230 25,100 56,400
Taxpayers liable at higher rate
(excluding additional rate taxpayers)
10,000 (a) .. .. .. .. .. .. .. .. .. ..
30,000 .. .. .. .. .. .. .. .. 2 11
40,000 67 515 981 7,460 143 1,080 184 880 1,380 9,930
50,000 73 881 1,270 15,000 139 1,680 168 1,570 1,650 19,200
70,000 52 1,040 594 12,500 59 1,260 118 2,120 824 17,000
100,000 45 1,520 295 11,000 23 858 60 1,920 424 15,300
150,000 9 388 14 670 1 33 2 81 26 1,170
200,000 1 24 1 21 .. .. .. .. 1 51
300,000 .. .. .. .. .. .. .. .. .. ..
500,000 .. .. .. .. .. .. .. .. .. ..
1,000,000 .. .. .. .. .. .. .. .. .. ..
All ranges 247 4,370 3,150 46,700 366 4,920 533 6,580 4,300 62,600
Number of
taxpayers
Number of
taxpayers
Total
amount
of tax
Number of
taxpayers
Total
amount
of tax
3.4
Total
amount
of tax
Number of
taxpayers
Total
amount
of tax
Total Income
Property, interest,
dividend and other
income
Number of
taxpayers
Total
amount
of tax
39
Income tax liabilities of starting, "savers", basic, higher and additional rate
taxpayers, by largest source of income, 2014-15Continued Taxpayers only
Numbers: thousands; Amounts: £ million
Range of Largest source of income
total income
(low er limit) Self-employment Employment Pension
£
Taxpayers liable at additional rate 3
10,000 (a) .. .. .. .. .. .. .. .. .. ..
150,000 12 708 88 5,440 5 312 19 995 124 7,460
200,000 15 1,280 67 6,040 3 282 14 1,140 100 8,730
300,000 11 1,500 38 5,650 1 203 9 1,100 58 8,450
500,000 8 1,970 18 5,070 - 108 4 983 30 8,130
1,000,000 4 3,660 9 7,940 .. .. 2 2,230 15 13,900
All ranges 49 9,110 220 30,100 10 961 48 6,440 328 46,700
All Taxpayers 2,090 17,000 20,600 119,000 6,350 15,500 1,640 15,300 30,700 167,000
Source: Survey of Personal Incomes 2014-15
Table updated March 2017
Footnote
Notes on the Table
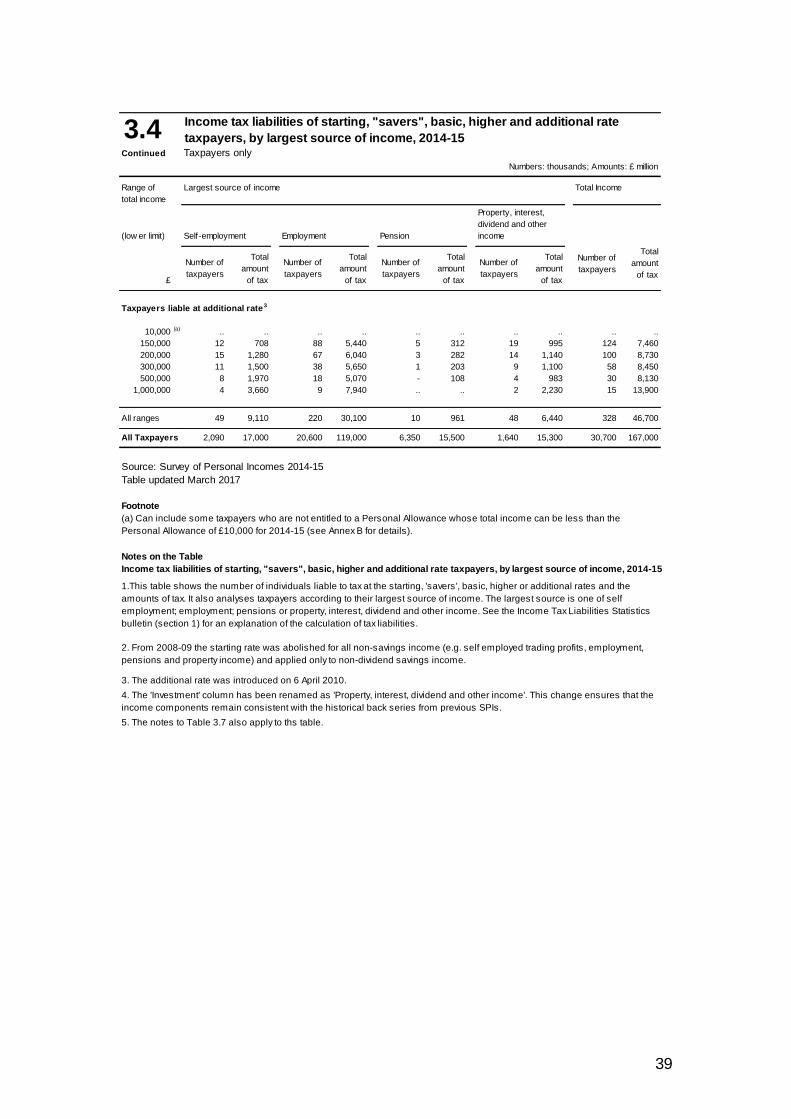
Income tax liabilities of starting, "savers", basic, higher and additional rate taxpayers, by largest source of income, 2014-15
(a) Can include some taxpayers who are not entitled to a Personal Allowance whose total income can be less than the
Personal Allowance of £10,000 for 2014-15 (see Annex B for details).
5. The notes to Table 3.7 also apply to ths table.
4. The 'Investment' column has been renamed as 'Property, interest, dividend and other income'. This change ensures that the
income components remain consistent with the historical back series from previous SPIs.
1.This table shows the number of individuals liable to tax at the starting, 'savers', basic, higher or additional rates and the
amounts of tax. It also analyses taxpayers according to their largest source of income. The largest source is one of self
employment; employment; pensions or property, interest, dividend and other income. See the Income Tax Liabilities Statistics
bulletin (section 1) for an explanation of the calculation of tax liabilities.
2. From 2008-09 the starting rate was abolished for all non-savings income (e.g. self employed trading profits, employment,
pensions and property income) and applied only to non-dividend savings income.
3. The additional rate was introduced on 6 April 2010.
Total
amount
of tax
Number of
taxpayers
Total
amount
of tax
Number of
taxpayers
Total
amount
of tax
Number of
taxpayers
Number of
taxpayers
Total
amount
of tax
3.4
Total Income
Property, interest,
dividend and other
income
Number of
taxpayers
Total
amount
of tax
40
Income and deductions, 2014-15
Taxpayers onlyNumbers: thousands; Amounts: £ million; Means £
£ % % % % %
10,000 (a) 1,230 12,600 10,200 964 587 609 1,260 13,100 10,400 217 53 245 12,500 1,260 108 86 13,000 0.8 4.1 95.5 4.5 0.4
11,000 1,480 16,400 11,100 1,220 660 542 1,490 17,100 11,500 325 113 350 15,100 1,490 347 233 16,700 2.0 4.8 96.1 3.9 0.7
12,000 4,230 55,200 13,100 3,490 2,100 601 4,250 57,300 13,500 1,080 500 461 43,300 4,250 2,630 618 54,700 4.6 13.9 96.3 3.7 0.9
15,000 6,060 102,000 16,900 5,020 3,690 734 6,080 106,000 17,400 2,010 1,230 613 62,700 6,080 8,350 1,370 97,400 7.9 19.8 96.5 3.5 1.2
20,000 7,710 181,000 23,500 6,720 8,120 1,210 7,730 189,000 24,500 3,420 3,350 982 78,900 7,730 21,100 2,730 168,000 11.2 25.2 95.7 4.3 1.8
30,000 6,570 226,000 34,500 6,150 24,400 3,970 6,600 251,000 38,000 3,660 6,410 1,750 66,300 6,600 34,700 5,260 216,000 13.8 21.5 90.3 9.7 2.6
50,000 1,660 86,800 52,400 1,460 9,810 6,740 1,670 96,600 58,000 1,240 3,720 3,010 16,700 1,670 19,200 11,600 77,400 19.9 5.4 89.8 10.2 3.9
70,000 823 58,800 71,400 711 9,740 13,700 829 68,500 82,600 610 2,820 4,610 8,280 829 17,000 20,500 51,500 24.8 2.7 85.8 14.2 4.1
100,000 421 43,500 103,000 300 7,230 24,100 425 50,700 119,000 255 2,360 9,270 1,900 425 15,300 36,000 35,400 30.2 1.4 85.7 14.3 4.7
150,000 149 22,000 148,000 111 3,730 33,600 151 25,700 171,000 91 1,170 12,800 34 151 8,630 57,300 17,100 33.5 0.5 85.5 14.5 4.5
200,000 100 20,700 207,000 78 3,610 46,400 101 24,300 240,000 60 887 14,800 7 101 8,780 86,800 15,500 36.1 0.3 85.1 14.9 3.6
300,000 58 18,900 323,000 47 3,280 69,300 59 22,100 378,000 35 713 20,200 2 59 8,450 144,000 13,700 38.2 0.2 85.2 14.8 3.2
500,000 30 17,600 587,000 26 3,050 117,000 30 20,700 680,000 19 664 35,000 1 30 8,130 268,000 12,500 39.4 0.1 85.2 14.8 3.2
1,000,000 15 28,300 1,860,000 14 6,920 498,000 15 35,200 2,310,000 10 1,530 155,000 - 15 13,900 912,000 21,400 39.4 0.0 80.4 19.6 4.3
All ranges 30,500 890,000 29,200 26,300 86,900 3,310 30,700 977,000 31,800 13,000 25,500 1,960 306,000 30,700 167,000 5,430 811,000 17.1 100.0 91.1 8.9 2.6
Source: Survey of Personal Incomes 2014-15
Table updated March 2017
Footnote
Notes on the Table
4. The notes to Table 3.7 also apply to this table.
3.5
Range of
total income
(low er limit)
Total profit, employment and
pension income
Total property, interest, dividend
and other incomeTotal income
No. of
individualsAmount Mean
No. of
individuals
Total deductions and reliefsPersonal
allow ancesTotal tax
Amount MeanNo. of
individuals
Total
income
after tax
Average
rate of
tax
Distribution
of total
income by
numbers
Percentage of total income
Total profit,
employment
and
pension
income
Total property,
interest,
dividend and
other income
Total
deductions
and reliefsAmount Mean Amount
(a) Can include some taxpayers who are not entitled to a Personal Allowance whose total income can be less than the Personal Allowance of £10,000 for 2014-15 (see Annex B for details).
Amount
3 The 'Total earned income' column has been renamed as 'Total profit, employment and pension income’ and the 'Total investment income' column has been renamed as ‘Total property, interest, dividend and other income'. This
change ensures that the income components remain consistent with the historical back series from previous SPIs.
No. of
individuals
No. of
individuals
1. Mortgage interest relief for those individuals aged over 65 who took out a life annuity before March 1999 has been included in the total deductions and reliefs. As this is given as a reduction in tax otherwise payable, it is no longer
possible to define taxable income and calculate tax due by subtracting reliefs, deductions and personal allowances from total income.
2. From 2010-11 the personal allowance was reduced by £1 for every £2 of taxable income over £100,000 until fully withdrawn, regardless of the individual’s age. Therefore not all taxpayers will have received a personal allowance.
Amount Mean AmountMean
41
Profit, employment and pension income, 2014-15
Taxpayers onlyNumbers: thousands; Amounts: £ million; Means: £
£ % % % % %
10,000 (c) 221 1,760 7,940 790 7,410 9,380 306 2,150 7,010 340 1,240 3,650 1,230 12,600 10,200 1.4 14.0 59.0 17.1 9.9
11,000 189 1,570 8,270 840 8,550 10,200 552 4,160 7,530 578 2,160 3,730 1,480 16,400 11,100 1.8 9.5 52.0 25.3 13.1
12,000 474 4,420 9,300 2,650 32,000 12,100 1,420 10,900 7,720 1,510 7,790 5,170 4,230 55,200 13,100 6.2 8.0 58.0 19.8 14.1
15,000 609 7,080 11,600 4,300 68,100 15,800 1,590 12,500 7,850 1,810 14,400 7,990 6,060 102,000 16,900 11.5 6.9 66.7 12.2 14.1
20,000 777 11,900 15,200 6,030 134,000 22,300 1,540 11,900 7,740 1,920 23,200 12,100 7,710 181,000 23,500 20.4 6.5 74.1 6.6 12.8
30,000 618 12,100 19,500 5,640 185,000 32,800 887 6,900 7,780 1,280 22,000 17,200 6,570 226,000 34,500 25.4 5.3 81.9 3.1 9.7
50,000 159 4,490 28,200 1,460 73,500 50,200 183 1,470 8,060 292 7,410 25,400 1,660 86,800 52,400 9.8 5.2 84.6 1.7 8.5
70,000 101 4,380 43,100 723 49,000 67,800 88 744 8,490 137 4,660 34,000 823 58,800 71,400 6.6 7.4 83.4 1.3 7.9
100,000 80 5,450 68,200 364 34,900 96,000 39 345 8,740 62 2,730 44,200 421 43,500 103,000 4.9 12.5 80.4 0.8 6.3
150,000 37 3,540 95,600 128 17,300 135,000 13 114 9,110 19 1,100 56,500 149 22,000 148,000 2.5 16.1 78.4 0.5 5.0
200,000 26 3,670 140,000 85 16,000 188,000 8 79 9,360 13 909 69,500 100 20,700 207,000 2.3 17.7 77.5 0.4 4.4
300,000 16 3,890 241,000 49 14,300 292,000 4 41 9,320 7 650 93,700 58 18,900 323,000 2.1 20.6 75.7 0.2 3.4
500,000 11 4,980 447,000 24 12,200 504,000 2 17 9,990 3 366 131,000 30 17,600 587,000 2.0 28.3 69.5 0.1 2.1
1,000,000 7 9,060 1,340,000 12 19,000 1,520,000 1 10 11,000 1 253 170,000 15 28,300 1,860,000 3.2 32.0 67.1 0.0 0.9
All ranges 3,330 78,200 23,500 23,100 672,000 29,100 6,630 51,400 7,750 7,960 88,900 11,200 30,500 890,000 29,200 100.0 8.8 75.5 5.8 10.0
Source: Survey of Personal Incomes 2014-15
Table updated March 2017
Footnotes
(b) Includes Income from benefits which are not shown separately in this table.
Notes on the Table
4. The title for this table has been changed from 'Earned income' to ‘Profit, employment and pension income’. This change also affects column headings in this table, where columns previously called
‘Earned income’ have been renamed as ‘Profit, employment and pension income’. This is to ensure that Tables 3.6 remain consistent with the historical back series from previous SPIs.
1. Profit, employment and pension income consists of income chargeable under the Income Tax (Earnings and Pensions) Act 2003 (mainly pay, private and occupational pensions, retirement annuities, state
retirement pensions and taxable social security income) and the Income Tax (Trading and Other Income) Act 2005 (self-employment and miscellaneous income).
2. Pay is shown before deduction of superannuation contributions. Under PAYE, tax is paid on pay after deduction of superannuation contributions and HMRC does not record the amounts deducted. The total
amount of superannuation contributions has therefore been estimated and has been distributed among earners in the Survey of Personal Incomes sample by a method consistent with information about the
number of employees who are contracted in or out of the State Second Pension (S2P, formerly SERPS) and the proportion of their earnings contributed. On 6 April 2002, the State Second Pension reformed
SERPS to provide a more generous additional State Pension for low and moderate earners, and to extend access to include certain carers and people with long-term illness or disability.
3. Self employment income is profit chargeable under the Income Tax (Trading and Other Income) Act 2005 less losses brought forward and capital allowances allowed. The number of individuals with self
employment income shown in this table is lower than that shown in Table 3.10. In this table only individuals who are liable to tax in 2014-15 are included, whereas Table 3.10 includes all people with a self
employment source in 2014-15. Employment income includes all pay from employment, from taxable benefits and from unemployment benefit, income support or Job Seeker's allowance.
(a) From 2009-10, State Pension lump sum (one off lump sum payment) has been categorised as part of the National Insurance Pension if it can be separately identified in source data. Any such amounts
reported on the Self Assessment Short Tax Return cannot be separately identified and remain as part of other pensions.
(c) Can include some taxpayers who are not entitled to a Personal Allowance whose total income can be less than the Personal Allowance of £10,000 for 2014-15 (see Annex B for details).
No. of
individualsAmount Mean
Distribution
of amounts
of total
profit,
employment
and pension
Percentage of total profit, employment and pension
income
Self
employment
income
Employment
income
National
Insurance
All Other
PensionsNo. of
individuals
Total profit, employment and
pension income(b)
No. of
individualsAmount
Pension Income(a)
National Insurance All other pensions
Amount MeanMean
3.6
Range of
total income
(low er limit)
Self employment income Employment income
No. of
individualsAmount Mean
No. of
individualsAmount Mean
42
Property, interest, dividend and other income, 2014-15
Taxpayers onlyNumbers: thousands; Amounts: £ million; Means: £
£ % % % % %
10,000 (a) 63 292 4,650 888 168 189 85 100 1,170 34 27 801 964 587 609 0.7 49.7 28.6 17.0 4.7
11,000 54 242 4,510 1,160 233 201 119 154 1,290 43 31 721 1,220 660 542 0.8 36.7 35.3 23.3 4.7
12,000 157 787 5,020 3,320 677 204 355 552 1,560 104 81 780 3,490 2,100 601 2.4 37.5 32.3 26.3 3.9
15,000 230 1,270 5,540 4,770 904 189 577 1,380 2,390 126 132 1,050 5,020 3,690 734 4.2 34.5 24.5 37.4 3.6
20,000 364 2,370 6,520 6,320 1,380 218 1,020 4,100 4,030 171 272 1,590 6,720 8,120 1,210 9.3 29.2 17.0 50.5 3.4
30,000 508 3,870 7,610 5,510 1,660 302 1,490 18,400 12,300 219 511 2,330 6,150 24,400 3,970 28.1 15.8 6.8 75.3 2.1
50,000 175 1,750 9,990 1,270 579 456 400 7,130 17,800 97 355 3,670 1,460 9,810 6,740 11.3 17.8 5.9 72.7 3.6
70,000 115 1,400 12,100 587 390 664 249 7,540 30,200 74 416 5,590 711 9,740 13,700 11.2 14.4 4.0 77.4 4.3
100,000 71 1,020 14,400 220 281 1,280 170 5,550 32,500 62 390 6,340 300 7,230 24,100 8.3 14.0 3.9 76.7 5.4
150,000 28 511 18,200 81 133 1,640 68 2,860 42,100 28 220 7,860 111 3,730 33,600 4.3 13.7 3.6 76.8 5.9
200,000 20 505 24,700 58 150 2,600 49 2,690 54,400 24 268 11,200 78 3,610 46,400 4.2 14.0 4.2 74.4 7.4
300,000 13 372 29,700 36 114 3,220 33 2,570 78,900 17 223 12,800 47 3,280 69,300 3.8 11.4 3.5 78.4 6.8
500,000 7 291 42,600 20 69 3,470 19 2,480 131,000 13 216 17,100 26 3,050 117,000 3.5 9.6 2.2 81.1 7.1
1,000,000 4 281 68,200 11 106 9,460 11 6,010 545,000 9 519 60,900 14 6,920 498,000 8.0 4.1 1.5 86.9 7.5
All ranges 1,810 15,000 8,270 24,300 6,840 282 4,650 61,500 13,200 1,020 3,660 3,590 26,300 86,900 3,310 100.0 17.2 7.9 70.7 4.2
Source: Survey of Personal Incomes 2014-15
Table updated March 2017
Footnote
Notes on the Table
Mean
3.7
Range of
total income
(low er limit)
Net income from propertyInterest from building societies
and banksDividends
MeanNo. of
individualsAmount AmountMean
No. of
individualsAmount
3. The title for this table has been changed from 'Investment income' to 'Property, interest, dividend and other income'. This change also affects column headings in this table, where columns previously
called ‘Investment income’ have been renamed as ‘Property, interest, dividend and other income’. This is to ensure that Tables 3.7 remain consistent with the historical back series from previous SPIs.
1. This table covers rents from UK property, interest from banks, building societies and other deposit takers, UK dividends and forms of income other than profit, employment or pension. The UK dividends
category comprises all income charged at the UK dividend rate. This includes dividends from shares in UK companies and unit trusts, distributions from UK authorised unit trusts and open ended
investment companies, stock dividends from UK companies and non qualifying distributions written off, dividends received through a partnership or trust and dividends from abroad that are subject to UK
income tax.
Other income comprises certain forms of savings income and will include, for example, interest from National Savings products, interest on securities, interest from partnerships and from trusts, settlements
and estates. Generally income that is subject to tax for the year, as shown here, is the same as income due for the year but there are certain exceptions.
2. Income from which tax has been deducted at source is not always known to HMRC for cases not filing tax returns or claims forms. Estimates of missing bank and building society interest and dividends
from United Kingdom companies are included in all the tables. For 2014-15, interest information submitted by interest paying institutions was used to supplement some cases. The remaining missing
income is distributed, in a manner consistent with information from external survey data and the National Accounts, to individuals where there is no such income already recorded on the HMRC IT systems.
The amount of income for which the distribution must be estimated is large and the potential margin of error inherent in such estimates must be kept in mind.
(a) Can include some taxpayers who are not entitled to a Personal Allowance whose total income can be less than the Personal Allowance of £10,000 for 2014-15 (see Annex B for details).
MeanNo. of
individuals
Net income
from
property
Other income
Distribution
of amounts
of total
property,
interest,
dividend and
other income
Percentage of total property, interest, dividend
and other income
Interest
from
building
societies
and banks
United
Kingdom
dividends
Other
income
Total property, interest, dividend
and other income
AmountNo. of
individualsAmount
No. of
individualsMean
43
Deductions and reliefs, 2014-15
Taxpayers onlyNumbers: thousands; Amounts: £ million; Means: £
£ % % % %
10,000 (e) 130 41 313 89 10 115 15 3 174 217 53 245 0.2 76.0 19.1 5.0
11,000 202 86 425 132 19 144 28 9 316 325 113 350 0.4 75.6 16.7 7.7
12,000 665 350 526 458 92 200 96 59 613 1,080 500 461 2.0 69.9 18.3 11.8
15,000 1,290 863 668 831 223 268 169 144 851 2,010 1,230 613 4.8 70.2 18.1 11.7
20,000 2,370 2,530 1,070 1,290 477 369 330 342 1,040 3,420 3,350 982 13.1 75.6 14.2 10.2
30,000 2,690 4,900 1,820 1,260 907 717 454 609 1,340 3,660 6,410 1,750 25.1 76.4 14.1 9.5
50,000 673 2,150 3,190 778 1,140 1,460 251 438 1,750 1,240 3,720 3,010 14.6 57.7 30.6 11.8
70,000 271 1,190 4,390 420 1,210 2,870 175 420 2,400 610 2,820 4,610 11.0 42.3 42.8 14.9
100,000 91 691 7,590 113 1,310 11,600 142 360 2,530 255 2,360 9,270 9.3 29.2 55.6 15.2
150,000 26 265 10,300 40 697 17,300 57 207 3,650 91 1,170 12,800 4.6 22.7 59.7 17.7
200,000 13 143 10,600 26 520 19,800 39 223 5,720 60 887 14,800 3.5 16.1 58.7 25.2
300,000 6 79 13,400 15 383 25,900 25 251 10,000 35 713 20,200 2.8 11.1 53.8 35.2
500,000 2 42 17,700 7 215 30,700 15 408 27,600 19 664 35,000 2.6 6.4 32.3 61.3
1,000,000 1 21 18,900 3 97 37,500 8 1,410 170,000 10 1,530 155,000 6.0 1.4 6.3 92.3
All ranges 8,430 13,300 1,580 5,470 7,300 1,330 1,800 4,880 2,710 13,000 25,500 1,960 100.0 52.3 28.6 19.1
Source: Survey of Personal Incomes 2014-15
Table updated March 2017
Footnotes
Notes on the Table
Deductions and reliefs, 2014-15
Percentage of total deductions and reliefs
Contributions
to
occupational
pensions
(a) Contributions to occupational pensions include payments to an employer's occupational pension scheme (or any associated Additional Voluntary Contributions) which are deducted from pay
before it is taxed.
(d) Mortgage interest relief for those individuals aged over 65 who took out a life annuity before March 1999 has been included in the total deductions and reliefs.
Total deductions and reliefs
MeanNo. of
individuals
Distribution
of amounts
of total
deductions
and reliefs
Contributions
to personal
pensions
All other
interest,
charges and
deductions
All other interest, charges and
deductions (c), (d)
1. The contributions to personal pensions are in part based on information collected from financial institutions providing such products, but also administrative data from self-assessment returns.
While about two-thirds by value of contributions to personal pensions are matched at the individual level to the SPI population, about one-third must be imputed. The contributions to occupational
pensions schemes (discussed in the notes to table 3.6 (see note 2)) are almost entirely imputed using external survey data, including the distribution by earnings. The distributions shown in Table
3.8 by total income level should be viewed as indicative.
Amount MeanMeanAmountNo. of
individuals
(b) Contributions to personal pensions include retirement annuity relief, pension contributions to employer’s schemes (without tax relief at the time of payments) and payments to registered pension
schemes.
(c) All other interest, charges and deductions include gift aid payments to charities, gifts of qualifying investments to charities, gifts of property to charities, covenanted payments to charities, blind
person’s allowance and reliefs for qualifying personal loan interest, subscription for trade union for death benefit and loss reliefs.
No. of
individualsAmount
(e) Can include some taxpayers who are not entitled to a Personal Allowance whose total income can be less than the Personal Allowance of £10,000 for 2013-14 (see Annex B for details).
3.8
Amount MeanNo. of
individuals
Range of
total income
(low er limit)
Contributions to occupational
pensions (a)
Contributions to personal
pensions (b)
44
Self employment income assessable to tax, 2014-15 SIC 2007Sources of income for individuals by range and industry (a)
Numbers: thousands; Amounts: £ million
No. of Amount No. of Amount No. of Amount No. of Amount No. of Amount No. of Amount
£ sources sources sources sources sources sources
0 97 - 31 - 87 - 85 - 23 - 42 -
1 13 3 11 2 21 5 24 5 7 2 6 1
500 8 6 4 3 18 13 13 9 6 5 5 3
1,000 16 23 12 18 37 55 24 36 14 20 8 11
2,000 14 33 7 18 38 95 20 47 18 45 9 21
3,000 12 39 9 32 38 134 18 64 17 59 8 27
4,000 11 50 7 30 41 181 16 72 21 93 8 35
5,000 24 146 15 93 116 728 43 265 61 384 20 118
7,500 27 224 15 129 154 1,330 43 367 67 569 21 183
10,000 31 360 17 210 236 2,890 50 591 57 663 25 288
15,000 16 265 12 204 182 3,160 26 434 20 352 13 211
20,000 21 485 14 333 219 5,280 32 762 17 394 13 291
30,000 17 608 10 367 92 3,310 23 841 8 290 8 280
50,000 6 352 3 219 12 753 8 509 2 150 3 157
100,000 1 184 1 176 2 686 2 515 1 167 1 170
All ranges 314 2,780 167 1,830 1,290 18,600 428 4,520 338 3,190 189 1,800
Range of self
employment income
in industry group
(low er limit)
No. of Amount No. of Amount No. of Amount No. of Amount No. of Amount No. of Amount
£ sources sources sources sources sources sources
0 21 - 41 - 15 - 64 - 46 - 29 -
1 6 1 5 1 7 2 18 4 20 5 16 4
500 5 4 3 2 5 4 13 10 22 17 13 9
1,000 8 11 6 9 8 11 19 28 36 53 20 28
2,000 4 9 5 12 5 13 17 40 33 81 17 40
3,000 3 11 4 12 5 18 15 53 28 97 12 43
4,000 4 18 4 17 5 22 15 65 32 143 14 62
5,000 8 47 9 52 9 57 30 182 64 395 25 154
7,500 7 61 7 61 8 71 26 220 60 508 23 194
10,000 9 105 11 126 12 147 35 430 48 569 28 336
15,000 6 97 7 110 6 107 22 379 21 366 11 182
20,000 7 168 7 181 10 231 27 663 15 369 10 236
30,000 7 246 9 324 12 434 25 953 8 304 4 156
50,000 4 253 8 501 17 1,220 14 904 2 140 1 84
100,000 2 426 11 6,400 37 11,300 8 1,900 1 302 - 103
All ranges 101 1,460 135 7,810 163 13,600 348 5,830 437 3,350 222 1,630
3.9
Wholesale and
Retail Trade;
Repair of Motor
Vehicles and
Motorcycles
Transportation
and Storage
Accommodation
and Food Service
Activities
Range of self
employment income
in industry group
(low er limit)
Agriculture,
Forestry and
Fishing
Manufacturing Construction
Administrative
and Support
Service
Activities
EducationInformation &
Communication
Financial, Insurance
and Real Estate
Activities
Legal &
Accounting
Activities(b)
Other
Professional,
Scientif ic and
Technical
Activities(b)
45
Self employment income assessable to tax, 2014-15 SIC 2007Sources of income for individuals by range and industry (a)
continued
Numbers: thousands; Amounts: £ million
Range of self
employment income
in industry group
(low er limit)
No. of Amount No. of Amount No. of Amount No. of Amount No. of Amount£ sources sources sources sources sources
0 .. .. .. .. .. .. .. .. .. ..
1 13 3 19 4 15 3 57 13 245 55
500 11 8 12 9 12 9 44 31 185 133
1,000 21 31 20 30 23 36 64 90 324 462
2,000 16 40 14 33 20 49 52 122 284 669
3,000 16 57 12 42 24 82 41 136 263 878
4,000 15 66 8 34 22 96 38 162 261 1,130
5,000 31 191 22 132 43 263 81 480 607 3,630
7,500 31 263 19 159 47 402 76 627 642 5,350
10,000 34 409 20 243 43 507 83 955 759 8,810
15,000 17 284 11 184 20 338 42 688 446 7,360
20,000 20 481 12 269 18 426 41 960 496 11,500
30,000 24 892 8 311 9 338 23 829 300 10,500
50,000 35 2,260 4 239 2 121 8 488 138 8,320
100,000 35 4,200 2 885 1 168 3 866 122 28,600
All ranges 373 9,190 238 2,570 335 2,840 664 6,440 5,750 87,500
Source: Survey of Personal Incomes, 2014-15
Table updated March 2017
Footnote
Notes on the table
3.9
3. An individual with two or more sources of self employment income (from trades or partnerships) is counted more than once,
according to the industry group and profit for each source.
(a) From 2009-10, industry categories are based on UK Standard Industrial Classification of Economic Activities 2007 (SIC2007).
Most categories comprise one or several of the 21 Sections from SIC2007.
(b) Section M (Professional, Scientific and Technical Activities) has been split into two industry categories (Legal and Accounting
Activities and Other Professional, Scientific and Technical Activities) so that Legal and Accounting Activities, a significant component
of self employment activity, can be separately identified.
1. Self employment income is as defined in the 'Notes to the table T3.6 paragraph 3'. Individuals are included in this according to
whether (and how many) sets of pages covering income from trades or from partnerships were completed in the tax return. Such
pages are required for all trades, and for all shares in partnerships, trading at any time in the tax year. If for any individual or source a
loss is made, or the profits are completely offset by the deduction of capital allowances and/or losses brought forward from earlier
years, the individual or source is included in the table but the amount of self-employment income is shown as nil.
2. Although special rules apply to businesses which have recently started or ceased trading, the general rule is that the profit
assessable for 2014-15 are those earned in the business accounting periods ending in 2014-15. On average, profits assessable for
2014-15 may be regarded as profits arising in the calendar year 2014.
All IndustriesHuman Health and
Social Work
Activities
Arts, Entertainment
and Recreation
Other Industries Unknow n
Industries
46
Income of individuals with self employment sources, 2014-15
By range of self employment income and source
Numbers: thousands; Amounts: £ million
No. of Amount No. of Amount No. of Amount No. of Amount No. of Amount
£ individuals individuals individuals individuals individuals £ %
0 779 - 365 11,000 195 2,830 319 5,850 779 19,700 25,300 0
1 237 55 127 2,650 49 716 84 565 237 3,990 16,800 1
500 180 133 90 1,570 40 518 60 366 180 2,580 14,300 5
1,000 310 462 144 2,270 69 827 104 631 310 4,190 13,500 11
2,000 269 669 107 1,580 57 635 81 499 269 3,380 12,500 20
3,000 252 878 88 1,220 50 526 73 389 252 3,010 12,000 29
4,000 251 1,130 72 1,020 44 452 69 375 251 2,970 11,800 38
5,000 581 3,630 144 1,770 87 878 148 837 581 7,110 12,200 51
7,500 616 5,350 96 1,210 66 621 138 632 616 7,810 12,700 68
10,000 725 8,810 107 1,510 80 836 193 1,270 725 12,400 17,100 71
15,000 424 7,360 60 953 46 522 125 677 424 9,520 22,400 77
20,000 474 11,500 53 1,050 52 629 159 833 474 14,000 29,600 82
30,000 281 10,500 33 1,080 33 486 127 811 281 12,900 45,900 82
50,000 120 8,320 22 1,610 18 391 82 856 120 11,200 92,800 75
100,000 95 28,600 23 1,690 9 316 82 2,230 95 32,900 346,000 87
All ranges 5,600 87,500 1,530 32,200 895 11,200 1,840 16,800 5,600 148,000 26,400 59
Source: Survey of Personal Incomes, 2014-15
Table updated April 2017
Notes on the table
5. The notes to Table 3.7 also apply to this table.
4. The 'Other earned income excluding pensions' column has been renamed as 'Employment income' and the
'Investment income' column has been renamed as 'Property, interest, dividend and other income'. This change
ensures that the income components remains consistent with the historical back series from previous SPIs.
3.10
3. Each individual is counted only once. This table shows how many of the individuals with self-employment income
in any of the given ranges also have other sources of income, and the amounts arising from these sources.
Employment income consists of income assessed under the Income Tax (Earnings and Pensions) Act 2003 and
other miscellaneous income.
Range of
self
employment
income
(low er limit)
Self employment
income
Employment
income
This table was originally published on 2 March 2017. Following the identification of an error in the table
affecting 4 figures, it was corrected and re-published in April 2017. The figures that were affected are as
follows: in the total income column the number of individuals with zero self employment income and the total
("all ranges") figures; also the figures in the corresponding rows of the mean total income column.
1. Self employment income is as defined in the 'Notes to the table T3.6 paragraph 3'. Individuals are included in this
according to whether (and how many) sets of pages covering income from trades or from partnerships were
completed in the tax return. Such pages are required for all trades, and for all shares in partnerships, trading at any
time in the tax year. If for any individual or source a loss is made, or the profits are completely offset by the deduction
of capital allowances and/or losses brought forward from earlier years, the individual or source is included in the
table but the amount of self-employment income is shown as nil.
2. Although special rules apply to businesses which have recently started or ceased trading, the general rule is that
the profit assessable for 2014-15 are those earned in the business accounting periods ending in 2014-15. On
average, profits assessable for 2014-15 may be regarded as profits arising in the calendar year 2014.
Self
employment
as a
percentage
of total
Pension
income
Property, interest,
dividend and other
income
Total
income
Mean
total
income
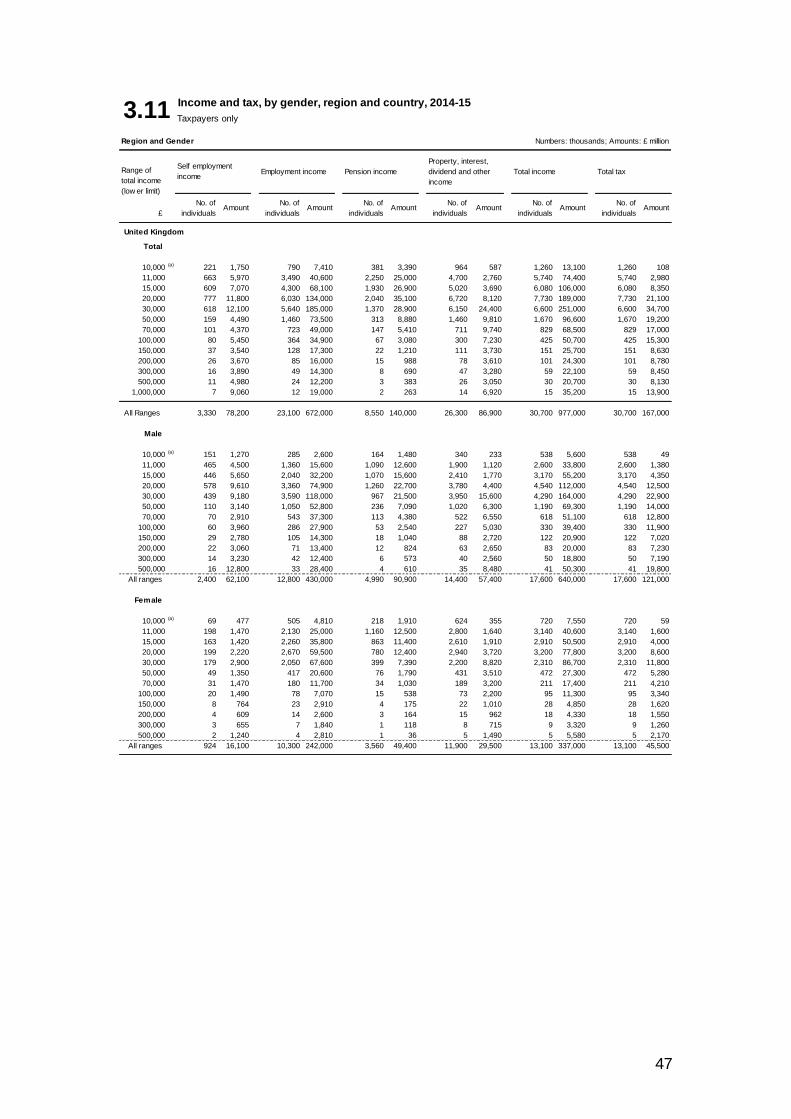
47
Income and tax, by gender, region and country, 2014-15
Taxpayers only
Region and Gender Numbers: thousands; Amounts: £ million
£
United Kingdom
Total
10,000 (a) 221 1,750 790 7,410 381 3,390 964 587 1,260 13,100 1,260 108
11,000 663 5,970 3,490 40,600 2,250 25,000 4,700 2,760 5,740 74,400 5,740 2,980
15,000 609 7,070 4,300 68,100 1,930 26,900 5,020 3,690 6,080 106,000 6,080 8,350
20,000 777 11,800 6,030 134,000 2,040 35,100 6,720 8,120 7,730 189,000 7,730 21,100
30,000 618 12,100 5,640 185,000 1,370 28,900 6,150 24,400 6,600 251,000 6,600 34,700
50,000 159 4,490 1,460 73,500 313 8,880 1,460 9,810 1,670 96,600 1,670 19,200
70,000 101 4,370 723 49,000 147 5,410 711 9,740 829 68,500 829 17,000
100,000 80 5,450 364 34,900 67 3,080 300 7,230 425 50,700 425 15,300
150,000 37 3,540 128 17,300 22 1,210 111 3,730 151 25,700 151 8,630
200,000 26 3,670 85 16,000 15 988 78 3,610 101 24,300 101 8,780
300,000 16 3,890 49 14,300 8 690 47 3,280 59 22,100 59 8,450
500,000 11 4,980 24 12,200 3 383 26 3,050 30 20,700 30 8,130
1,000,000 7 9,060 12 19,000 2 263 14 6,920 15 35,200 15 13,900
All Ranges 3,330 78,200 23,100 672,000 8,550 140,000 26,300 86,900 30,700 977,000 30,700 167,000
Male
10,000 (a) 151 1,270 285 2,600 164 1,480 340 233 538 5,600 538 49
11,000 465 4,500 1,360 15,600 1,090 12,600 1,900 1,120 2,600 33,800 2,600 1,380
15,000 446 5,650 2,040 32,200 1,070 15,600 2,410 1,770 3,170 55,200 3,170 4,350
20,000 578 9,610 3,360 74,900 1,260 22,700 3,780 4,400 4,540 112,000 4,540 12,500
30,000 439 9,180 3,590 118,000 967 21,500 3,950 15,600 4,290 164,000 4,290 22,900
50,000 110 3,140 1,050 52,800 236 7,090 1,020 6,300 1,190 69,300 1,190 14,000
70,000 70 2,910 543 37,300 113 4,380 522 6,550 618 51,100 618 12,800
100,000 60 3,960 286 27,900 53 2,540 227 5,030 330 39,400 330 11,900
150,000 29 2,780 105 14,300 18 1,040 88 2,720 122 20,900 122 7,020
200,000 22 3,060 71 13,400 12 824 63 2,650 83 20,000 83 7,230
300,000 14 3,230 42 12,400 6 573 40 2,560 50 18,800 50 7,190
500,000 16 12,800 33 28,400 4 610 35 8,480 41 50,300 41 19,800
All ranges 2,400 62,100 12,800 430,000 4,990 90,900 14,400 57,400 17,600 640,000 17,600 121,000
Female
10,000 (a) 69 477 505 4,810 218 1,910 624 355 720 7,550 720 59
11,000 198 1,470 2,130 25,000 1,160 12,500 2,800 1,640 3,140 40,600 3,140 1,600
15,000 163 1,420 2,260 35,800 863 11,400 2,610 1,910 2,910 50,500 2,910 4,000
20,000 199 2,220 2,670 59,500 780 12,400 2,940 3,720 3,200 77,800 3,200 8,600
30,000 179 2,900 2,050 67,600 399 7,390 2,200 8,820 2,310 86,700 2,310 11,800
50,000 49 1,350 417 20,600 76 1,790 431 3,510 472 27,300 472 5,280
70,000 31 1,470 180 11,700 34 1,030 189 3,200 211 17,400 211 4,210
100,000 20 1,490 78 7,070 15 538 73 2,200 95 11,300 95 3,340
150,000 8 764 23 2,910 4 175 22 1,010 28 4,850 28 1,620
200,000 4 609 14 2,600 3 164 15 962 18 4,330 18 1,550
300,000 3 655 7 1,840 1 118 8 715 9 3,320 9 1,260
500,000 2 1,240 4 2,810 1 36 5 1,490 5 5,580 5 2,170
All ranges 924 16,100 10,300 242,000 3,560 49,400 11,900 29,500 13,100 337,000 13,100 45,500
Property, interest,
dividend and other
income
Total income Total tax
No. of
individualsAmount
No. of
individualsAmount
No. of
individualsAmount
3.11
Range of
total income
(low er limit)
Self employment
incomeEmployment income Pension income
No. of
individualsAmount
No. of
individualsAmount
No. of
individualsAmount
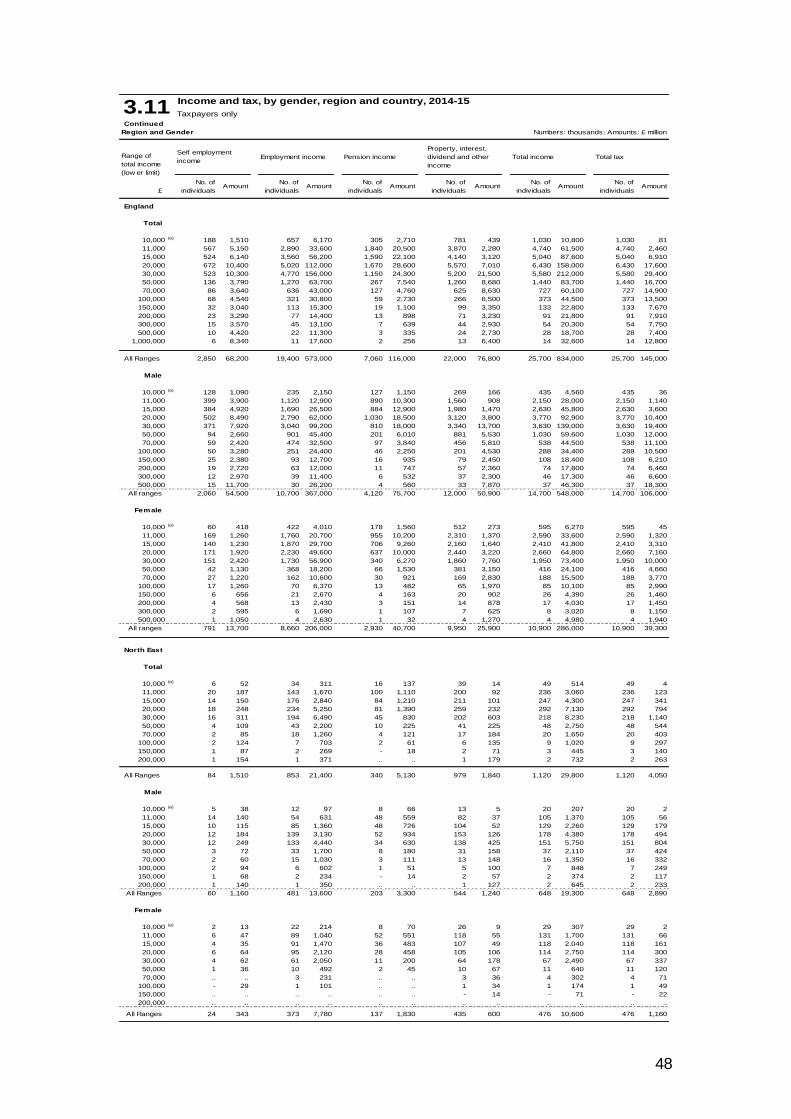
48
Income and tax, by gender, region and country, 2014-15
Taxpayers only
Continued
Region and Gender Numbers: thousands; Amounts: £ million
£
England
Total
10,000 (a) 188 1,510 657 6,170 305 2,710 781 439 1,030 10,800 1,030 81
11,000 567 5,150 2,890 33,600 1,840 20,500 3,870 2,280 4,740 61,500 4,740 2,460
15,000 524 6,140 3,560 56,200 1,590 22,100 4,140 3,120 5,040 87,600 5,040 6,910
20,000 672 10,400 5,020 112,000 1,670 28,600 5,570 7,010 6,430 158,000 6,430 17,600
30,000 523 10,300 4,770 156,000 1,150 24,300 5,200 21,500 5,580 212,000 5,580 29,400
50,000 136 3,790 1,270 63,700 267 7,540 1,260 8,680 1,440 83,700 1,440 16,700
70,000 86 3,640 636 43,000 127 4,760 625 8,630 727 60,100 727 14,900
100,000 68 4,540 321 30,800 59 2,730 266 6,500 373 44,500 373 13,500
150,000 32 3,040 113 15,300 19 1,100 99 3,350 133 22,800 133 7,670
200,000 23 3,290 77 14,400 13 898 71 3,230 91 21,800 91 7,910
300,000 15 3,570 45 13,100 7 639 44 2,930 54 20,300 54 7,750
500,000 10 4,420 22 11,300 3 335 24 2,730 28 18,700 28 7,400
1,000,000 6 8,340 11 17,600 2 256 13 6,400 14 32,600 14 12,800
All Ranges 2,850 68,200 19,400 573,000 7,060 116,000 22,000 76,800 25,700 834,000 25,700 145,000
Male
10,000 (a) 128 1,090 235 2,150 127 1,150 269 166 435 4,560 435 36
11,000 399 3,900 1,120 12,900 890 10,300 1,560 908 2,150 28,000 2,150 1,140
15,000 384 4,920 1,690 26,500 884 12,900 1,980 1,470 2,630 45,800 2,630 3,600
20,000 502 8,490 2,790 62,000 1,030 18,500 3,120 3,800 3,770 92,900 3,770 10,400
30,000 371 7,920 3,040 99,200 810 18,000 3,340 13,700 3,630 139,000 3,630 19,400
50,000 94 2,660 901 45,400 201 6,010 881 5,530 1,030 59,600 1,030 12,000
70,000 59 2,420 474 32,500 97 3,840 456 5,810 538 44,500 538 11,100
100,000 50 3,280 251 24,400 46 2,250 201 4,530 288 34,400 288 10,500
150,000 25 2,380 93 12,700 16 935 79 2,450 108 18,400 108 6,210
200,000 19 2,720 63 12,000 11 747 57 2,360 74 17,800 74 6,460
300,000 12 2,970 39 11,400 6 532 37 2,300 46 17,300 46 6,600
500,000 15 11,700 30 26,200 4 560 33 7,870 37 46,300 37 18,300
All ranges 2,060 54,500 10,700 367,000 4,120 75,700 12,000 50,900 14,700 548,000 14,700 106,000
Female
10,000 (a) 60 418 422 4,010 178 1,560 512 273 595 6,270 595 45
11,000 169 1,260 1,760 20,700 955 10,200 2,310 1,370 2,590 33,600 2,590 1,320
15,000 140 1,230 1,870 29,700 706 9,260 2,160 1,640 2,410 41,800 2,410 3,310
20,000 171 1,920 2,230 49,600 637 10,000 2,440 3,220 2,660 64,800 2,660 7,160
30,000 151 2,420 1,730 56,900 340 6,270 1,860 7,760 1,950 73,400 1,950 10,000
50,000 42 1,130 368 18,200 66 1,530 381 3,150 416 24,100 416 4,660
70,000 27 1,220 162 10,600 30 921 169 2,830 188 15,500 188 3,770
100,000 17 1,260 70 6,370 13 482 65 1,970 85 10,100 85 2,990
150,000 6 656 21 2,670 4 163 20 902 26 4,390 26 1,460
200,000 4 568 13 2,430 3 151 14 878 17 4,030 17 1,450
300,000 2 595 6 1,690 1 107 7 625 8 3,020 8 1,150
500,000 1 1,050 4 2,630 1 32 4 1,270 4 4,980 4 1,940
All ranges 791 13,700 8,660 206,000 2,930 40,700 9,950 25,900 10,900 286,000 10,900 39,300
North East
Total
10,000 (a) 6 52 34 311 16 137 39 14 49 514 49 4
11,000 20 187 143 1,670 100 1,110 200 92 236 3,060 236 123
15,000 14 150 176 2,840 84 1,210 211 101 247 4,300 247 341
20,000 18 248 234 5,250 81 1,390 259 232 292 7,130 292 794
30,000 16 311 194 6,490 45 830 202 603 218 8,230 218 1,140
50,000 4 109 43 2,200 10 225 41 225 48 2,750 48 544
70,000 2 85 18 1,260 4 121 17 184 20 1,650 20 403
100,000 2 124 7 703 2 61 6 135 9 1,020 9 297
150,000 1 87 2 269 - 18 2 71 3 445 3 140
200,000 1 154 1 371 .. .. 1 179 2 732 2 263
All Ranges 84 1,510 853 21,400 340 5,130 979 1,840 1,120 29,800 1,120 4,050
Male
10,000 (a) 5 38 12 97 8 66 13 5 20 207 20 2
11,000 14 140 54 631 48 559 82 37 105 1,370 105 56
15,000 10 115 85 1,360 48 726 104 52 129 2,260 129 179
20,000 12 184 139 3,130 52 934 153 126 178 4,380 178 494
30,000 12 249 133 4,440 34 630 138 425 151 5,750 151 804
50,000 3 72 33 1,700 8 180 31 158 37 2,110 37 424
70,000 2 60 15 1,030 3 111 13 148 16 1,350 16 332
100,000 2 94 6 602 1 51 5 100 7 848 7 249
150,000 1 68 2 234 - 14 2 57 2 374 2 117
200,000 1 140 1 350 .. .. 1 127 2 645 2 233
All Ranges 60 1,160 481 13,600 203 3,300 544 1,240 648 19,300 648 2,890
Female
10,000 (a) 2 13 22 214 8 70 26 9 29 307 29 2
11,000 6 47 89 1,040 52 551 118 55 131 1,700 131 66
15,000 4 35 91 1,470 36 483 107 49 118 2,040 118 161
20,000 6 64 95 2,120 28 458 105 106 114 2,750 114 300
30,000 4 62 61 2,050 11 200 64 178 67 2,490 67 337
50,000 1 36 10 492 2 45 10 67 11 640 11 120
70,000 .. .. 3 231 .. .. 3 36 4 302 4 71
100,000 - 29 1 101 .. .. 1 34 1 174 1 49
150,000 .. .. .. .. .. .. - 14 - 71 - 22
200,000 .. .. .. .. .. .. .. .. .. .. .. ..
All Ranges 24 343 373 7,780 137 1,830 435 600 476 10,600 476 1,160
Total income
Amount
Total tax
No. of
individualsAmount
No. of
individualsAmount
No. of
individualsAmount
No. of
individualsAmount
No. of
individuals
No. of
individualsAmount
3.11
Range of
total income
(low er limit)
Self employment
incomeEmployment income Pension income
Property, interest,
dividend and other
income
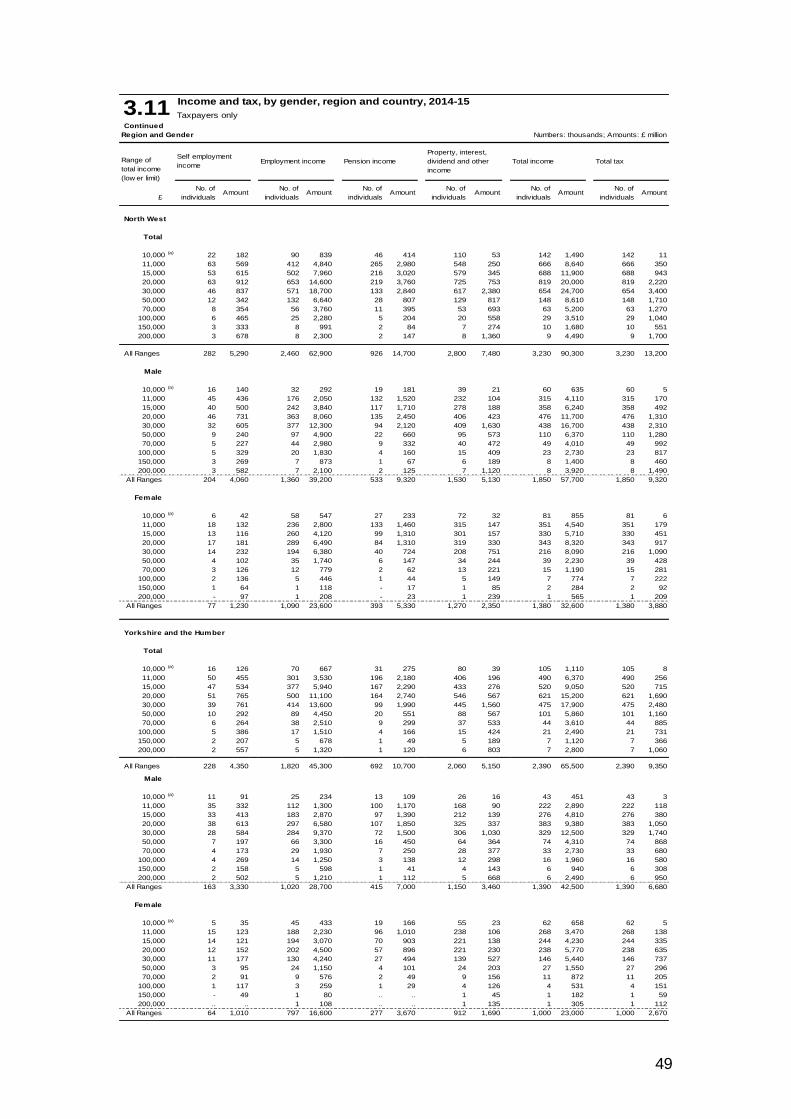
49
Income and tax, by gender, region and country, 2014-15
Taxpayers only
Continued
Region and Gender Numbers: thousands; Amounts: £ million
£
North West
Total
10,000 (a) 22 182 90 839 46 414 110 53 142 1,490 142 11
11,000 63 569 412 4,840 265 2,980 548 250 666 8,640 666 350
15,000 53 615 502 7,960 216 3,020 579 345 688 11,900 688 943
20,000 63 912 653 14,600 219 3,760 725 753 819 20,000 819 2,220
30,000 46 837 571 18,700 133 2,840 617 2,380 654 24,700 654 3,400
50,000 12 342 132 6,640 28 807 129 817 148 8,610 148 1,710
70,000 8 354 56 3,760 11 395 53 693 63 5,200 63 1,270
100,000 6 465 25 2,280 5 204 20 558 29 3,510 29 1,040
150,000 3 333 8 991 2 84 7 274 10 1,680 10 551
200,000 3 678 8 2,300 2 147 8 1,360 9 4,490 9 1,700
All Ranges 282 5,290 2,460 62,900 926 14,700 2,800 7,480 3,230 90,300 3,230 13,200
Male
10,000 (a) 16 140 32 292 19 181 39 21 60 635 60 5
11,000 45 436 176 2,050 132 1,520 232 104 315 4,110 315 170
15,000 40 500 242 3,840 117 1,710 278 188 358 6,240 358 492
20,000 46 731 363 8,060 135 2,450 406 423 476 11,700 476 1,310
30,000 32 605 377 12,300 94 2,120 409 1,630 438 16,700 438 2,310
50,000 9 240 97 4,900 22 660 95 573 110 6,370 110 1,280
70,000 5 227 44 2,980 9 332 40 472 49 4,010 49 992
100,000 5 329 20 1,830 4 160 15 409 23 2,730 23 817
150,000 3 269 7 873 1 67 6 189 8 1,400 8 460
200,000 3 582 7 2,100 2 125 7 1,120 8 3,920 8 1,490
All Ranges 204 4,060 1,360 39,200 533 9,320 1,530 5,130 1,850 57,700 1,850 9,320
Female
10,000 (a) 6 42 58 547 27 233 72 32 81 855 81 6
11,000 18 132 236 2,800 133 1,460 315 147 351 4,540 351 179
15,000 13 116 260 4,120 99 1,310 301 157 330 5,710 330 451
20,000 17 181 289 6,490 84 1,310 319 330 343 8,320 343 917
30,000 14 232 194 6,380 40 724 208 751 216 8,090 216 1,090
50,000 4 102 35 1,740 6 147 34 244 39 2,230 39 428
70,000 3 126 12 779 2 62 13 221 15 1,190 15 281
100,000 2 136 5 446 1 44 5 149 7 774 7 222
150,000 1 64 1 118 - 17 1 85 2 284 2 92
200,000 - 97 1 208 - 23 1 239 1 565 1 209
All Ranges 77 1,230 1,090 23,600 393 5,330 1,270 2,350 1,380 32,600 1,380 3,880
Yorkshire and the Humber
Total
10,000 (a) 16 126 70 667 31 275 80 39 105 1,110 105 8
11,000 50 455 301 3,530 196 2,180 406 196 490 6,370 490 256
15,000 47 534 377 5,940 167 2,290 433 276 520 9,050 520 715
20,000 51 765 500 11,100 164 2,740 546 567 621 15,200 621 1,690
30,000 39 761 414 13,600 99 1,990 445 1,560 475 17,900 475 2,480
50,000 10 292 89 4,450 20 551 88 567 101 5,860 101 1,160
70,000 6 264 38 2,510 9 299 37 533 44 3,610 44 885
100,000 5 386 17 1,510 4 166 15 424 21 2,490 21 731
150,000 2 207 5 678 1 49 5 189 7 1,120 7 366
200,000 2 557 5 1,320 1 120 6 803 7 2,800 7 1,060
All Ranges 228 4,350 1,820 45,300 692 10,700 2,060 5,150 2,390 65,500 2,390 9,350
Male
10,000 (a) 11 91 25 234 13 109 26 16 43 451 43 3
11,000 35 332 112 1,300 100 1,170 168 90 222 2,890 222 118
15,000 33 413 183 2,870 97 1,390 212 139 276 4,810 276 380
20,000 38 613 297 6,580 107 1,850 325 337 383 9,380 383 1,050
30,000 28 584 284 9,370 72 1,500 306 1,030 329 12,500 329 1,740
50,000 7 197 66 3,300 16 450 64 364 74 4,310 74 868
70,000 4 173 29 1,930 7 250 28 377 33 2,730 33 680
100,000 4 269 14 1,250 3 138 12 298 16 1,960 16 580
150,000 2 158 5 598 1 41 4 143 6 940 6 308
200,000 2 502 5 1,210 1 112 5 668 6 2,490 6 950
All Ranges 163 3,330 1,020 28,700 415 7,000 1,150 3,460 1,390 42,500 1,390 6,680
Female
10,000 (a) 5 35 45 433 19 166 55 23 62 658 62 5
11,000 15 123 188 2,230 96 1,010 238 106 268 3,470 268 138
15,000 14 121 194 3,070 70 903 221 138 244 4,230 244 335
20,000 12 152 202 4,500 57 896 221 230 238 5,770 238 635
30,000 11 177 130 4,240 27 494 139 527 146 5,440 146 737
50,000 3 95 24 1,150 4 101 24 203 27 1,550 27 296
70,000 2 91 9 576 2 49 9 156 11 872 11 205
100,000 1 117 3 259 1 29 4 126 4 531 4 151
150,000 - 49 1 80 .. .. 1 45 1 182 1 59
200,000 .. .. 1 108 .. .. 1 135 1 305 1 112
All Ranges 64 1,010 797 16,600 277 3,670 912 1,690 1,000 23,000 1,000 2,670
Total income Total tax
No. of
individualsAmount
No. of
individualsAmount
No. of
individualsAmountAmount
No. of
individualsAmount
No. of
individualsAmount
Property, interest,
dividend and other
income
3.11
Range of
total income
(low er limit)
Self employment
incomeEmployment income Pension income
No. of
individuals
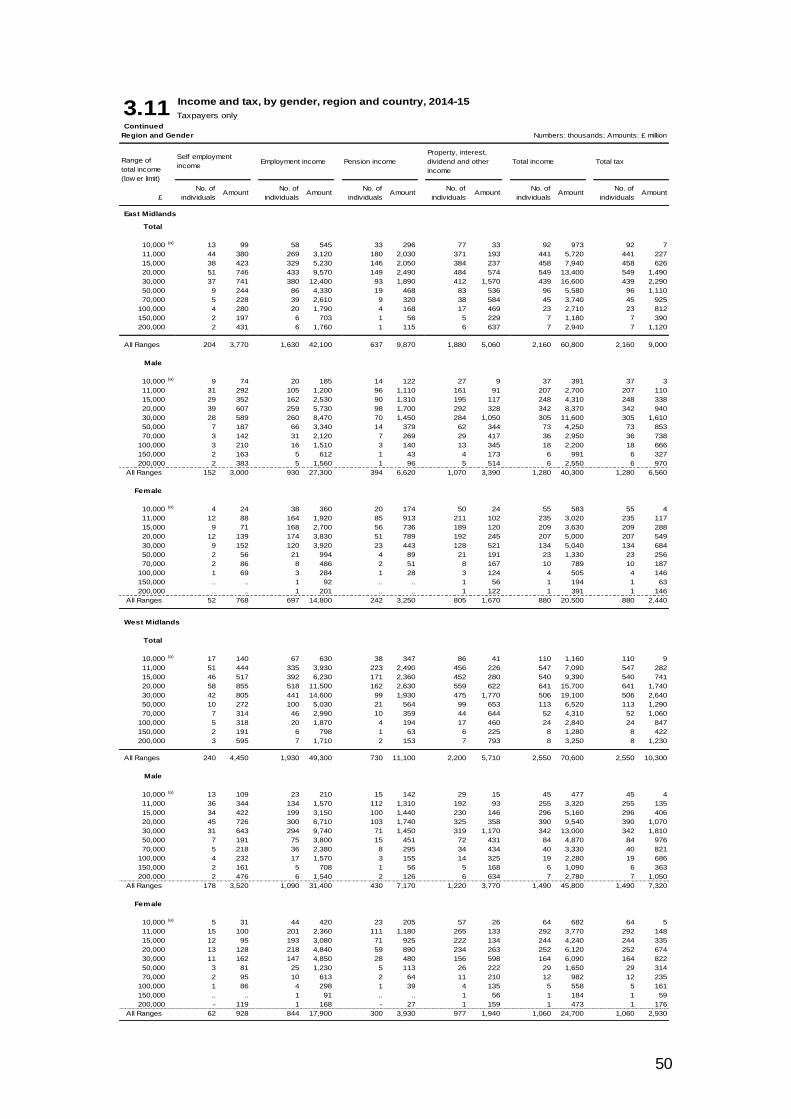
50
Income and tax, by gender, region and country, 2014-15
Taxpayers only
Continued
Region and Gender Numbers: thousands; Amounts: £ million
£
East Midlands
Total
10,000 (a) 13 99 58 545 33 296 77 33 92 973 92 7
11,000 44 380 269 3,120 180 2,030 371 193 441 5,720 441 227
15,000 38 423 329 5,230 146 2,050 384 237 458 7,940 458 626
20,000 51 746 433 9,570 149 2,490 484 574 549 13,400 549 1,490
30,000 37 741 380 12,400 93 1,890 412 1,570 439 16,600 439 2,290
50,000 9 244 86 4,330 19 468 83 536 96 5,580 96 1,110
70,000 5 228 39 2,610 9 320 38 584 45 3,740 45 925
100,000 4 280 20 1,790 4 168 17 469 23 2,710 23 812
150,000 2 197 6 703 1 56 5 229 7 1,180 7 390
200,000 2 431 6 1,760 1 115 6 637 7 2,940 7 1,120
All Ranges 204 3,770 1,630 42,100 637 9,870 1,880 5,060 2,160 60,800 2,160 9,000
Male
10,000 (a) 9 74 20 185 14 122 27 9 37 391 37 3
11,000 31 292 105 1,200 96 1,110 161 91 207 2,700 207 110
15,000 29 352 162 2,530 90 1,310 195 117 248 4,310 248 338
20,000 39 607 259 5,730 98 1,700 292 328 342 8,370 342 940
30,000 28 589 260 8,470 70 1,450 284 1,050 305 11,600 305 1,610
50,000 7 187 66 3,340 14 379 62 344 73 4,250 73 853
70,000 3 142 31 2,120 7 269 29 417 36 2,950 36 738
100,000 3 210 16 1,510 3 140 13 345 18 2,200 18 666
150,000 2 163 5 612 1 43 4 173 6 991 6 327
200,000 2 383 5 1,560 1 96 5 514 6 2,550 6 970
All Ranges 152 3,000 930 27,300 394 6,620 1,070 3,390 1,280 40,300 1,280 6,560
Female
10,000 (a) 4 24 38 360 20 174 50 24 55 583 55 4
11,000 12 88 164 1,920 85 913 211 102 235 3,020 235 117
15,000 9 71 168 2,700 56 736 189 120 209 3,630 209 288
20,000 12 139 174 3,830 51 789 192 245 207 5,000 207 549
30,000 9 152 120 3,920 23 443 128 521 134 5,040 134 684
50,000 2 56 21 994 4 89 21 191 23 1,330 23 256
70,000 2 86 8 486 2 51 8 167 10 789 10 187
100,000 1 69 3 284 1 28 3 124 4 505 4 146
150,000 .. .. 1 92 .. .. 1 56 1 194 1 63
200,000 .. .. 1 201 .. .. 1 122 1 391 1 146
All Ranges 52 768 697 14,800 242 3,250 805 1,670 880 20,500 880 2,440
West Midlands
Total
10,000 (a) 17 140 67 630 38 347 86 41 110 1,160 110 9
11,000 51 444 335 3,930 223 2,490 456 226 547 7,090 547 282
15,000 46 517 392 6,230 171 2,360 452 280 540 9,390 540 741
20,000 58 855 518 11,500 162 2,630 559 622 641 15,700 641 1,740
30,000 42 805 441 14,600 99 1,930 475 1,770 506 19,100 506 2,640
50,000 10 272 100 5,030 21 564 99 653 113 6,520 113 1,290
70,000 7 314 46 2,990 10 359 44 644 52 4,310 52 1,060
100,000 5 318 20 1,870 4 194 17 460 24 2,840 24 847
150,000 2 191 6 798 1 63 6 225 8 1,280 8 422
200,000 3 595 7 1,710 2 153 7 793 8 3,250 8 1,230
All Ranges 240 4,450 1,930 49,300 730 11,100 2,200 5,710 2,550 70,600 2,550 10,300
Male
10,000 (a) 13 109 23 210 15 142 29 15 45 477 45 4
11,000 36 344 134 1,570 112 1,310 192 93 255 3,320 255 135
15,000 34 422 199 3,150 100 1,440 230 146 296 5,160 296 406
20,000 45 726 300 6,710 103 1,740 325 358 390 9,540 390 1,070
30,000 31 643 294 9,740 71 1,450 319 1,170 342 13,000 342 1,810
50,000 7 191 75 3,800 15 451 72 431 84 4,870 84 976
70,000 5 218 36 2,380 8 295 34 434 40 3,330 40 821
100,000 4 232 17 1,570 3 155 14 325 19 2,280 19 686
150,000 2 161 5 708 1 56 5 168 6 1,090 6 363
200,000 2 476 6 1,540 2 126 6 634 7 2,780 7 1,050
All Ranges 178 3,520 1,090 31,400 430 7,170 1,220 3,770 1,490 45,800 1,490 7,320
Female
10,000 (a) 5 31 44 420 23 205 57 26 64 682 64 5
11,000 15 100 201 2,360 111 1,180 265 133 292 3,770 292 148
15,000 12 95 193 3,080 71 925 222 134 244 4,240 244 335
20,000 13 128 218 4,840 59 890 234 263 252 6,120 252 674
30,000 11 162 147 4,850 28 480 156 598 164 6,090 164 822
50,000 3 81 25 1,230 5 113 26 222 29 1,650 29 314
70,000 2 95 10 613 2 64 11 210 12 982 12 235
100,000 1 86 4 298 1 39 4 135 5 558 5 161
150,000 .. .. 1 91 .. .. 1 56 1 184 1 59
200,000 - 119 1 168 - 27 1 159 1 473 1 176
All Ranges 62 928 844 17,900 300 3,930 977 1,940 1,060 24,700 1,060 2,930
Pension income
Property, interest,
dividend and other
income
No. of
individualsAmount
Total income Total tax
No. of
individualsAmount
No. of
individualsAmount
No. of
individualsAmount
3.11
Range of
total income
(low er limit)
Self employment
incomeEmployment income
No. of
individualsAmount
No. of
individualsAmount
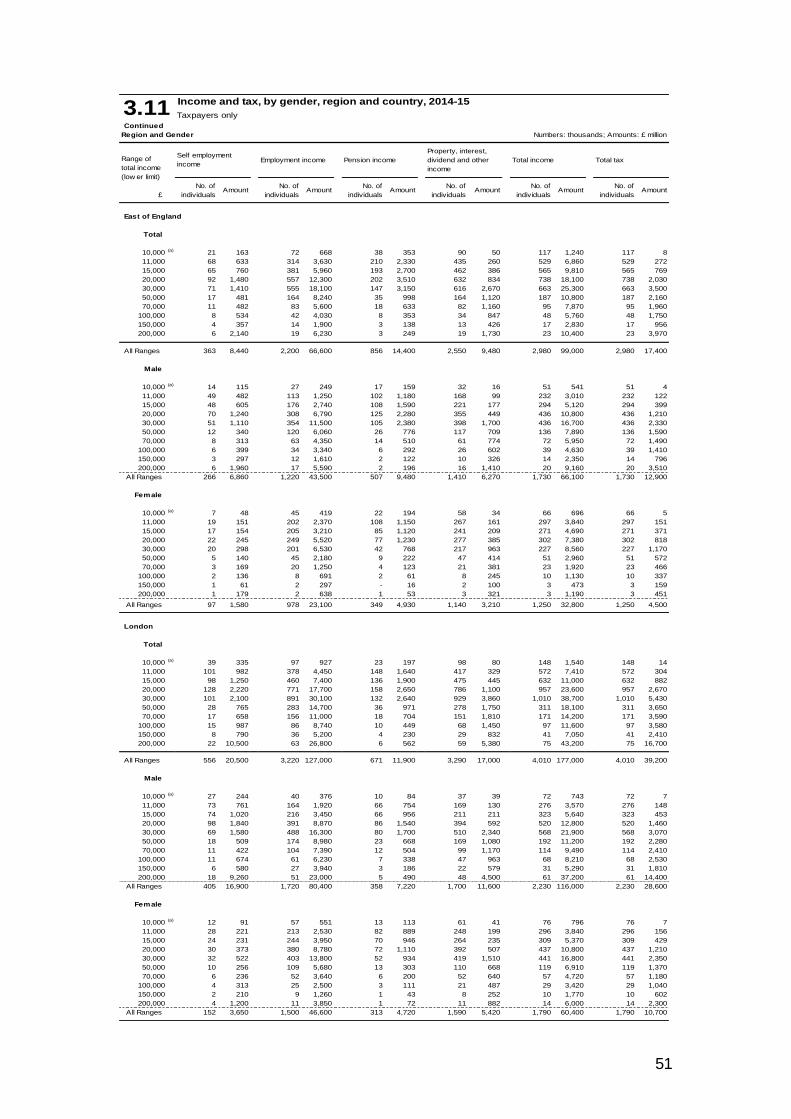
51
Income and tax, by gender, region and country, 2014-15
Taxpayers only
Continued
Region and Gender Numbers: thousands; Amounts: £ million
£
East of England
Total
10,000 (a) 21 163 72 668 38 353 90 50 117 1,240 117 8
11,000 68 633 314 3,630 210 2,330 435 260 529 6,860 529 272
15,000 65 760 381 5,960 193 2,700 462 386 565 9,810 565 769
20,000 92 1,480 557 12,300 202 3,510 632 834 738 18,100 738 2,030
30,000 71 1,410 555 18,100 147 3,150 616 2,670 663 25,300 663 3,500
50,000 17 481 164 8,240 35 998 164 1,120 187 10,800 187 2,160
70,000 11 482 83 5,600 18 633 82 1,160 95 7,870 95 1,960
100,000 8 534 42 4,030 8 353 34 847 48 5,760 48 1,750
150,000 4 357 14 1,900 3 138 13 426 17 2,830 17 956
200,000 6 2,140 19 6,230 3 249 19 1,730 23 10,400 23 3,970
All Ranges 363 8,440 2,200 66,600 856 14,400 2,550 9,480 2,980 99,000 2,980 17,400
Male
10,000 (a) 14 115 27 249 17 159 32 16 51 541 51 4
11,000 49 482 113 1,250 102 1,180 168 99 232 3,010 232 122
15,000 48 605 176 2,740 108 1,590 221 177 294 5,120 294 399
20,000 70 1,240 308 6,790 125 2,280 355 449 436 10,800 436 1,210
30,000 51 1,110 354 11,500 105 2,380 398 1,700 436 16,700 436 2,330
50,000 12 340 120 6,060 26 776 117 709 136 7,890 136 1,590
70,000 8 313 63 4,350 14 510 61 774 72 5,950 72 1,490
100,000 6 399 34 3,340 6 292 26 602 39 4,630 39 1,410
150,000 3 297 12 1,610 2 122 10 326 14 2,350 14 796
200,000 6 1,960 17 5,590 2 196 16 1,410 20 9,160 20 3,510
All Ranges 266 6,860 1,220 43,500 507 9,480 1,410 6,270 1,730 66,100 1,730 12,900
Female
10,000 (a) 7 48 45 419 22 194 58 34 66 696 66 5
11,000 19 151 202 2,370 108 1,150 267 161 297 3,840 297 151
15,000 17 154 205 3,210 85 1,120 241 209 271 4,690 271 371
20,000 22 245 249 5,520 77 1,230 277 385 302 7,380 302 818
30,000 20 298 201 6,530 42 768 217 963 227 8,560 227 1,170
50,000 5 140 45 2,180 9 222 47 414 51 2,960 51 572
70,000 3 169 20 1,250 4 123 21 381 23 1,920 23 466
100,000 2 136 8 691 2 61 8 245 10 1,130 10 337
150,000 1 61 2 297 - 16 2 100 3 473 3 159
200,000 1 179 2 638 1 53 3 321 3 1,190 3 451
All Ranges 97 1,580 978 23,100 349 4,930 1,140 3,210 1,250 32,800 1,250 4,500
London
Total
10,000 (a) 39 335 97 927 23 197 98 80 148 1,540 148 14
11,000 101 982 378 4,450 148 1,640 417 329 572 7,410 572 304
15,000 98 1,250 460 7,400 136 1,900 475 445 632 11,000 632 882
20,000 128 2,220 771 17,700 158 2,650 786 1,100 957 23,600 957 2,670
30,000 101 2,100 891 30,100 132 2,640 929 3,860 1,010 38,700 1,010 5,430
50,000 28 765 283 14,700 36 971 278 1,750 311 18,100 311 3,650
70,000 17 658 156 11,000 18 704 151 1,810 171 14,200 171 3,590
100,000 15 987 86 8,740 10 449 68 1,450 97 11,600 97 3,580
150,000 8 790 36 5,200 4 230 29 832 41 7,050 41 2,410
200,000 22 10,500 63 26,800 6 562 59 5,380 75 43,200 75 16,700
All Ranges 556 20,500 3,220 127,000 671 11,900 3,290 17,000 4,010 177,000 4,010 39,200
Male
10,000 (a) 27 244 40 376 10 84 37 39 72 743 72 7
11,000 73 761 164 1,920 66 754 169 130 276 3,570 276 148
15,000 74 1,020 216 3,450 66 956 211 211 323 5,640 323 453
20,000 98 1,840 391 8,870 86 1,540 394 592 520 12,800 520 1,460
30,000 69 1,580 488 16,300 80 1,700 510 2,340 568 21,900 568 3,070
50,000 18 509 174 8,980 23 668 169 1,080 192 11,200 192 2,280
70,000 11 422 104 7,390 12 504 99 1,170 114 9,490 114 2,410
100,000 11 674 61 6,230 7 338 47 963 68 8,210 68 2,530
150,000 6 580 27 3,940 3 186 22 579 31 5,290 31 1,810
200,000 18 9,260 51 23,000 5 490 48 4,500 61 37,200 61 14,400
All Ranges 405 16,900 1,720 80,400 358 7,220 1,700 11,600 2,230 116,000 2,230 28,600
Female
10,000 (a) 12 91 57 551 13 113 61 41 76 796 76 7
11,000 28 221 213 2,530 82 889 248 199 296 3,840 296 156
15,000 24 231 244 3,950 70 946 264 235 309 5,370 309 429
20,000 30 373 380 8,780 72 1,110 392 507 437 10,800 437 1,210
30,000 32 522 403 13,800 52 934 419 1,510 441 16,800 441 2,350
50,000 10 256 109 5,680 13 303 110 668 119 6,910 119 1,370
70,000 6 236 52 3,640 6 200 52 640 57 4,720 57 1,180
100,000 4 313 25 2,500 3 111 21 487 29 3,420 29 1,040
150,000 2 210 9 1,260 1 43 8 252 10 1,770 10 602
200,000 4 1,200 11 3,850 1 72 11 882 14 6,000 14 2,300
All Ranges 152 3,650 1,500 46,600 313 4,720 1,590 5,420 1,790 60,400 1,790 10,700
AmountNo. of
individualsAmount Amount
No. of
individualsAmount
3.11
AmountNo. of
individualsAmount
Range of
total income
(low er limit)
Self employment
incomeEmployment income
No. of
individuals
Pension income
Property, interest,
dividend and other
income
Total income Total tax
No. of
individuals
No. of
individuals
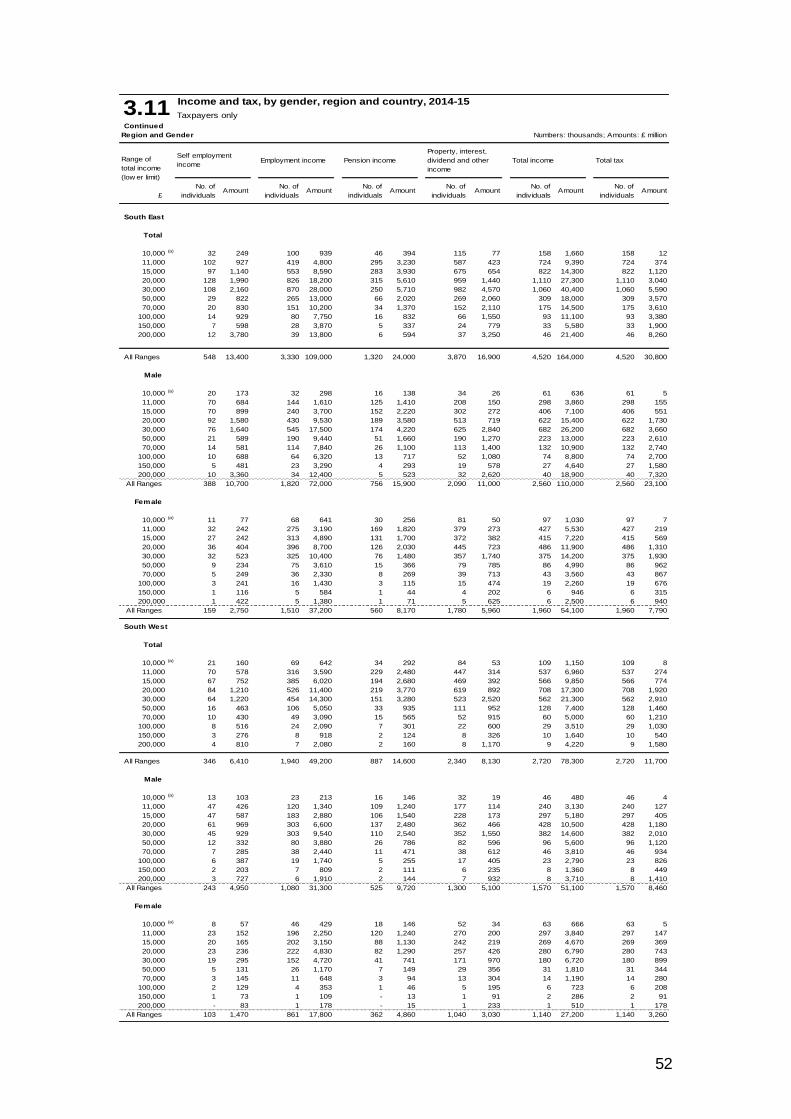
52
Income and tax, by gender, region and country, 2014-15
Taxpayers only
Continued
Region and Gender Numbers: thousands; Amounts: £ million
£
South East
Total
10,000 (a) 32 249 100 939 46 394 115 77 158 1,660 158 12
11,000 102 927 419 4,800 295 3,230 587 423 724 9,390 724 374
15,000 97 1,140 553 8,590 283 3,930 675 654 822 14,300 822 1,120
20,000 128 1,990 826 18,200 315 5,610 959 1,440 1,110 27,300 1,110 3,040
30,000 108 2,160 870 28,000 250 5,710 982 4,570 1,060 40,400 1,060 5,590
50,000 29 822 265 13,000 66 2,020 269 2,060 309 18,000 309 3,570
70,000 20 830 151 10,200 34 1,370 152 2,110 175 14,500 175 3,610
100,000 14 929 80 7,750 16 832 66 1,550 93 11,100 93 3,380
150,000 7 598 28 3,870 5 337 24 779 33 5,580 33 1,900
200,000 12 3,780 39 13,800 6 594 37 3,250 46 21,400 46 8,260
All Ranges 548 13,400 3,330 109,000 1,320 24,000 3,870 16,900 4,520 164,000 4,520 30,800
Male
10,000 (a) 20 173 32 298 16 138 34 26 61 636 61 5
11,000 70 684 144 1,610 125 1,410 208 150 298 3,860 298 155
15,000 70 899 240 3,700 152 2,220 302 272 406 7,100 406 551
20,000 92 1,580 430 9,530 189 3,580 513 719 622 15,400 622 1,730
30,000 76 1,640 545 17,500 174 4,220 625 2,840 682 26,200 682 3,660
50,000 21 589 190 9,440 51 1,660 190 1,270 223 13,000 223 2,610
70,000 14 581 114 7,840 26 1,100 113 1,400 132 10,900 132 2,740
100,000 10 688 64 6,320 13 717 52 1,080 74 8,800 74 2,700
150,000 5 481 23 3,290 4 293 19 578 27 4,640 27 1,580
200,000 10 3,360 34 12,400 5 523 32 2,620 40 18,900 40 7,320
All Ranges 388 10,700 1,820 72,000 756 15,900 2,090 11,000 2,560 110,000 2,560 23,100
Female
10,000 (a) 11 77 68 641 30 256 81 50 97 1,030 97 7
11,000 32 242 275 3,190 169 1,820 379 273 427 5,530 427 219
15,000 27 242 313 4,890 131 1,700 372 382 415 7,220 415 569
20,000 36 404 396 8,700 126 2,030 445 723 486 11,900 486 1,310
30,000 32 523 325 10,400 76 1,480 357 1,740 375 14,200 375 1,930
50,000 9 234 75 3,610 15 366 79 785 86 4,990 86 962
70,000 5 249 36 2,330 8 269 39 713 43 3,560 43 867
100,000 3 241 16 1,430 3 115 15 474 19 2,260 19 676
150,000 1 116 5 584 1 44 4 202 6 946 6 315
200,000 1 422 5 1,380 1 71 5 625 6 2,500 6 940
All Ranges 159 2,750 1,510 37,200 560 8,170 1,780 5,960 1,960 54,100 1,960 7,790
South West
Total
10,000 (a) 21 160 69 642 34 292 84 53 109 1,150 109 8
11,000 70 578 316 3,590 229 2,480 447 314 537 6,960 537 274
15,000 67 752 385 6,020 194 2,680 469 392 566 9,850 566 774
20,000 84 1,210 526 11,400 219 3,770 619 892 708 17,300 708 1,920
30,000 64 1,220 454 14,300 151 3,280 523 2,520 562 21,300 562 2,910
50,000 16 463 106 5,050 33 935 111 952 128 7,400 128 1,460
70,000 10 430 49 3,090 15 565 52 915 60 5,000 60 1,210
100,000 8 516 24 2,090 7 301 22 600 29 3,510 29 1,030
150,000 3 276 8 918 2 124 8 326 10 1,640 10 540
200,000 4 810 7 2,080 2 160 8 1,170 9 4,220 9 1,580
All Ranges 346 6,410 1,940 49,200 887 14,600 2,340 8,130 2,720 78,300 2,720 11,700
Male
10,000 (a) 13 103 23 213 16 146 32 19 46 480 46 4
11,000 47 426 120 1,340 109 1,240 177 114 240 3,130 240 127
15,000 47 587 183 2,880 106 1,540 228 173 297 5,180 297 405
20,000 61 969 303 6,600 137 2,480 362 466 428 10,500 428 1,180
30,000 45 929 303 9,540 110 2,540 352 1,550 382 14,600 382 2,010
50,000 12 332 80 3,880 26 786 82 596 96 5,600 96 1,120
70,000 7 285 38 2,440 11 471 38 612 46 3,810 46 934
100,000 6 387 19 1,740 5 255 17 405 23 2,790 23 826
150,000 2 203 7 809 2 111 6 235 8 1,360 8 449
200,000 3 727 6 1,910 2 144 7 932 8 3,710 8 1,410
All Ranges 243 4,950 1,080 31,300 525 9,720 1,300 5,100 1,570 51,100 1,570 8,460
Female
10,000 (a) 8 57 46 429 18 146 52 34 63 666 63 5
11,000 23 152 196 2,250 120 1,240 270 200 297 3,840 297 147
15,000 20 165 202 3,150 88 1,130 242 219 269 4,670 269 369
20,000 23 236 222 4,830 82 1,290 257 426 280 6,790 280 743
30,000 19 295 152 4,720 41 741 171 970 180 6,720 180 899
50,000 5 131 26 1,170 7 149 29 356 31 1,810 31 344
70,000 3 145 11 648 3 94 13 304 14 1,190 14 280
100,000 2 129 4 353 1 46 5 195 6 723 6 208
150,000 1 73 1 109 - 13 1 91 2 286 2 91
200,000 - 83 1 178 - 15 1 233 1 510 1 178
All Ranges 103 1,470 861 17,800 362 4,860 1,040 3,030 1,140 27,200 1,140 3,260
No. of
individualsAmount
3.11
Range of
total income
(low er limit)
Self employment
incomeEmployment income
No. of
individualsAmount
Pension income
Property, interest,
dividend and other
income
Total income Total tax
No. of
individualsAmount
No. of
individualsAmount
No. of
individualsAmount
No. of
individualsAmount
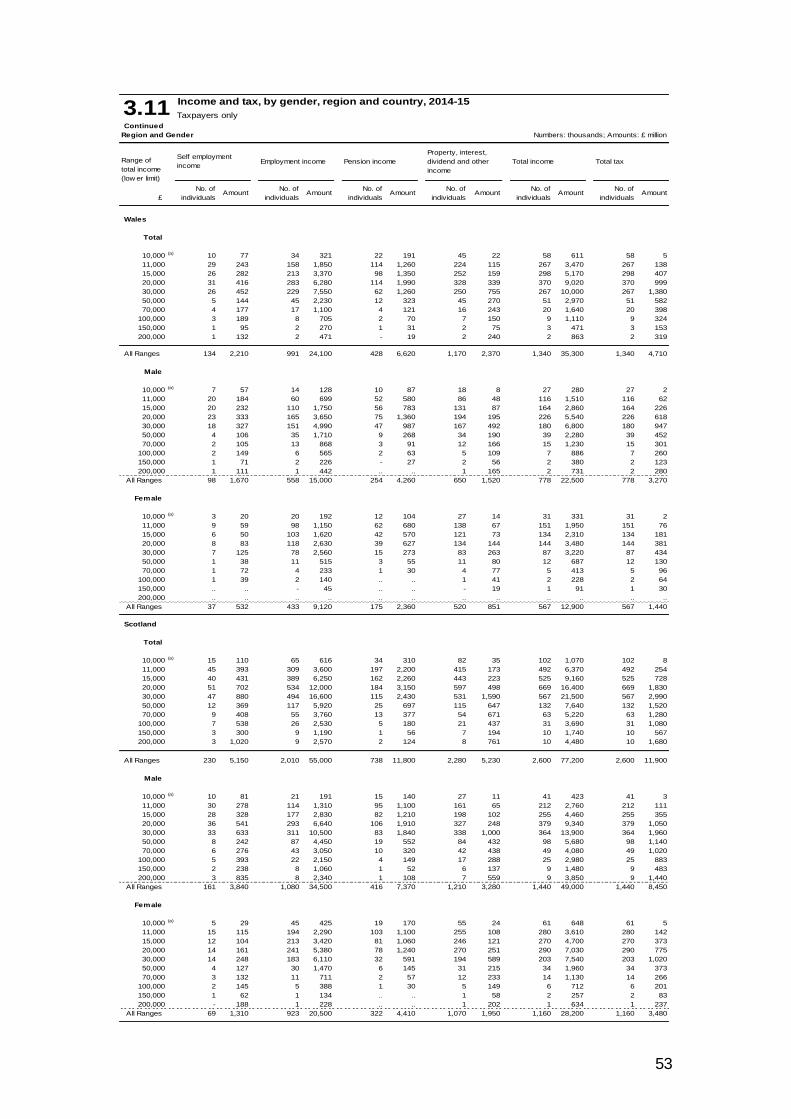
53
Income and tax, by gender, region and country, 2014-15
Taxpayers only
Continued
Region and Gender Numbers: thousands; Amounts: £ million
£
Wales
Total
10,000 (a) 10 77 34 321 22 191 45 22 58 611 58 5
11,000 29 243 158 1,850 114 1,260 224 115 267 3,470 267 138
15,000 26 282 213 3,370 98 1,350 252 159 298 5,170 298 407
20,000 31 416 283 6,280 114 1,990 328 339 370 9,020 370 999
30,000 26 452 229 7,550 62 1,260 250 755 267 10,000 267 1,380
50,000 5 144 45 2,230 12 323 45 270 51 2,970 51 582
70,000 4 177 17 1,100 4 121 16 243 20 1,640 20 398
100,000 3 189 8 705 2 70 7 150 9 1,110 9 324
150,000 1 95 2 270 1 31 2 75 3 471 3 153
200,000 1 132 2 471 - 19 2 240 2 863 2 319
All Ranges 134 2,210 991 24,100 428 6,620 1,170 2,370 1,340 35,300 1,340 4,710
Male
10,000 (a) 7 57 14 128 10 87 18 8 27 280 27 2
11,000 20 184 60 699 52 580 86 48 116 1,510 116 62
15,000 20 232 110 1,750 56 783 131 87 164 2,860 164 226
20,000 23 333 165 3,650 75 1,360 194 195 226 5,540 226 618
30,000 18 327 151 4,990 47 987 167 492 180 6,800 180 947
50,000 4 106 35 1,710 9 268 34 190 39 2,280 39 452
70,000 2 105 13 868 3 91 12 166 15 1,230 15 301
100,000 2 149 6 565 2 63 5 109 7 886 7 260
150,000 1 71 2 226 - 27 2 56 2 380 2 123
200,000 1 111 1 442 .. .. 1 165 2 731 2 280
All Ranges 98 1,670 558 15,000 254 4,260 650 1,520 778 22,500 778 3,270
Female
10,000 (a) 3 20 20 192 12 104 27 14 31 331 31 2
11,000 9 59 98 1,150 62 680 138 67 151 1,950 151 76
15,000 6 50 103 1,620 42 570 121 73 134 2,310 134 181
20,000 8 83 118 2,630 39 627 134 144 144 3,480 144 381
30,000 7 125 78 2,560 15 273 83 263 87 3,220 87 434
50,000 1 38 11 515 3 55 11 80 12 687 12 130
70,000 1 72 4 233 1 30 4 77 5 413 5 96
100,000 1 39 2 140 .. .. 1 41 2 228 2 64
150,000 .. .. - 45 .. .. - 19 1 91 1 30
200,000 .. .. .. .. .. .. .. .. .. .. .. ..
All Ranges 37 532 433 9,120 175 2,360 520 851 567 12,900 567 1,440
Scotland
Total
10,000 (a) 15 110 65 616 34 310 82 35 102 1,070 102 8
11,000 45 393 309 3,600 197 2,200 415 173 492 6,370 492 254
15,000 40 431 389 6,250 162 2,260 443 223 525 9,160 525 728
20,000 51 702 534 12,000 184 3,150 597 498 669 16,400 669 1,830
30,000 47 880 494 16,600 115 2,430 531 1,590 567 21,500 567 2,990
50,000 12 369 117 5,920 25 697 115 647 132 7,640 132 1,520
70,000 9 408 55 3,760 13 377 54 671 63 5,220 63 1,280
100,000 7 538 26 2,530 5 180 21 437 31 3,690 31 1,080
150,000 3 300 9 1,190 1 56 7 194 10 1,740 10 567
200,000 3 1,020 9 2,570 2 124 8 761 10 4,480 10 1,680
All Ranges 230 5,150 2,010 55,000 738 11,800 2,280 5,230 2,600 77,200 2,600 11,900
Male
10,000 (a) 10 81 21 191 15 140 27 11 41 423 41 3
11,000 30 278 114 1,310 95 1,100 161 65 212 2,760 212 111
15,000 28 328 177 2,830 82 1,210 198 102 255 4,460 255 355
20,000 36 541 293 6,640 106 1,910 327 248 379 9,340 379 1,050
30,000 33 633 311 10,500 83 1,840 338 1,000 364 13,900 364 1,960
50,000 8 242 87 4,450 19 552 84 432 98 5,680 98 1,140
70,000 6 276 43 3,050 10 320 42 438 49 4,080 49 1,020
100,000 5 393 22 2,150 4 149 17 288 25 2,980 25 883
150,000 2 238 8 1,060 1 52 6 137 9 1,480 9 483
200,000 3 835 8 2,340 1 108 7 559 9 3,850 9 1,440
All Ranges 161 3,840 1,080 34,500 416 7,370 1,210 3,280 1,440 49,000 1,440 8,450
Female
10,000 (a) 5 29 45 425 19 170 55 24 61 648 61 5
11,000 15 115 194 2,290 103 1,100 255 108 280 3,610 280 142
15,000 12 104 213 3,420 81 1,060 246 121 270 4,700 270 373
20,000 14 161 241 5,380 78 1,240 270 251 290 7,030 290 775
30,000 14 248 183 6,110 32 591 194 589 203 7,540 203 1,020
50,000 4 127 30 1,470 6 145 31 215 34 1,960 34 373
70,000 3 132 11 711 2 57 12 233 14 1,130 14 266
100,000 2 145 5 388 1 30 5 149 6 712 6 201
150,000 1 62 1 134 .. .. 1 58 2 257 2 83
200,000 - 188 1 228 .. .. 1 202 1 634 1 237
All Ranges 69 1,310 923 20,500 322 4,410 1,070 1,950 1,160 28,200 1,160 3,480
Amount
Pension income
Property, interest,
dividend and other
income
Total income Total tax
3.11
Range of
total income
(low er limit)
Self employment
incomeEmployment income
No. of
individualsAmount
No. of
individualsAmount
No. of
individuals
No. of
individualsAmount
No. of
individualsAmount
No. of
individualsAmount
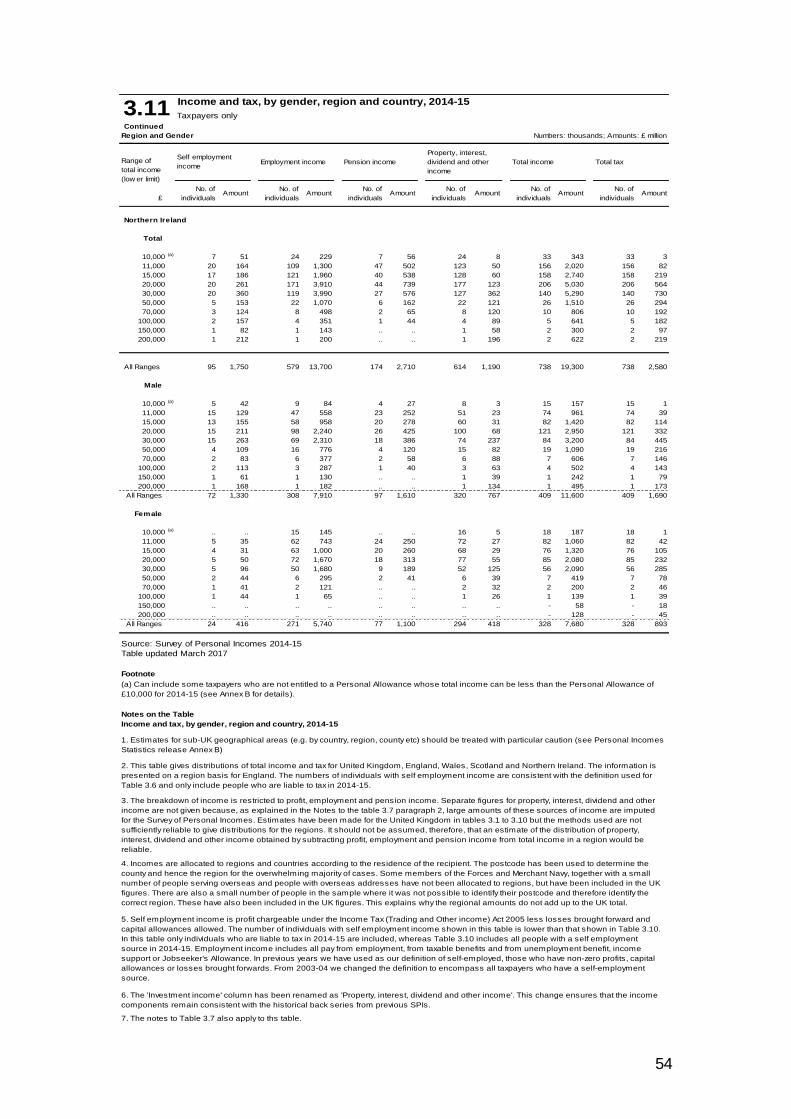
54
Income and tax, by gender, region and country, 2014-15
Taxpayers only
Continued
Region and Gender Numbers: thousands; Amounts: £ million
£
Northern Ireland
Total
10,000 (a) 7 51 24 229 7 56 24 8 33 343 33 3
11,000 20 164 109 1,300 47 502 123 50 156 2,020 156 82
15,000 17 186 121 1,960 40 538 128 60 158 2,740 158 219
20,000 20 261 171 3,910 44 739 177 123 206 5,030 206 564
30,000 20 360 119 3,990 27 576 127 362 140 5,290 140 730
50,000 5 153 22 1,070 6 162 22 121 26 1,510 26 294
70,000 3 124 8 498 2 65 8 120 10 806 10 192
100,000 2 157 4 351 1 44 4 89 5 641 5 182
150,000 1 82 1 143 .. .. 1 58 2 300 2 97
200,000 1 212 1 200 .. .. 1 196 2 622 2 219
All Ranges 95 1,750 579 13,700 174 2,710 614 1,190 738 19,300 738 2,580
Male
10,000 (a) 5 42 9 84 4 27 8 3 15 157 15 1
11,000 15 129 47 558 23 252 51 23 74 961 74 39
15,000 13 155 58 958 20 278 60 31 82 1,420 82 114
20,000 15 211 98 2,240 26 425 100 68 121 2,950 121 332
30,000 15 263 69 2,310 18 386 74 237 84 3,200 84 445
50,000 4 109 16 776 4 120 15 82 19 1,090 19 216
70,000 2 83 6 377 2 58 6 88 7 606 7 146
100,000 2 113 3 287 1 40 3 63 4 502 4 143
150,000 1 61 1 130 .. .. 1 39 1 242 1 79
200,000 1 168 1 182 .. .. 1 134 1 495 1 173
All Ranges 72 1,330 308 7,910 97 1,610 320 767 409 11,600 409 1,690
Female
10,000 (a) .. .. 15 145 .. .. 16 5 18 187 18 1
11,000 5 35 62 743 24 250 72 27 82 1,060 82 42
15,000 4 31 63 1,000 20 260 68 29 76 1,320 76 105
20,000 5 50 72 1,670 18 313 77 55 85 2,080 85 232
30,000 5 96 50 1,680 9 189 52 125 56 2,090 56 285
50,000 2 44 6 295 2 41 6 39 7 419 7 78
70,000 1 41 2 121 .. .. 2 32 2 200 2 46
100,000 1 44 1 65 .. .. 1 26 1 139 1 39
150,000 .. .. .. .. .. .. .. .. - 58 - 18
200,000 .. .. .. .. .. .. .. .. - 128 - 45
All Ranges 24 416 271 5,740 77 1,100 294 418 328 7,680 328 893
Source: Survey of Personal Incomes 2014-15
Table updated March 2017
Footnote
Notes on the Table
Income and tax, by gender, region and country, 2014-15
(a) Can include some taxpayers who are not entitled to a Personal Allowance whose total income can be less than the Personal Allowance of
£10,000 for 2014-15 (see Annex B for details).
3.11
Range of
total income
(low er limit)
Self employment
incomeEmployment income
No. of
individualsAmount
No. of
individualsAmount
5. Self employment income is profit chargeable under the Income Tax (Trading and Other income) Act 2005 less losses brought forward and
capital allowances allowed. The number of individuals with self employment income shown in this table is lower than that shown in Table 3.10.
In this table only individuals who are liable to tax in 2014-15 are included, whereas Table 3.10 includes all people with a self employment
source in 2014-15. Employment income includes all pay from employment, from taxable benefits and from unemployment benefit, income
support or Jobseeker's Allowance. In previous years we have used as our definition of self-employed, those who have non-zero profits, capital
allowances or losses brought forwards. From 2003-04 we changed the definition to encompass all taxpayers who have a self-employment
source.
Pension income
Property, interest,
dividend and other
income
Total income Total tax
1. Estimates for sub-UK geographical areas (e.g. by country, region, county etc) should be treated with particular caution (see Personal Incomes
Statistics release Annex B)
2. This table gives distributions of total income and tax for United Kingdom, England, Wales, Scotland and Northern Ireland. The information is
presented on a region basis for England. The numbers of individuals with self employment income are consistent with the definition used for
Table 3.6 and only include people who are liable to tax in 2014-15.
3. The breakdown of income is restricted to profit, employment and pension income. Separate figures for property, interest, dividend and other
income are not given because, as explained in the Notes to the table 3.7 paragraph 2, large amounts of these sources of income are imputed
for the Survey of Personal Incomes. Estimates have been made for the United Kingdom in tables 3.1 to 3.10 but the methods used are not
sufficiently reliable to give distributions for the regions. It should not be assumed, therefore, that an estimate of the distribution of property,
interest, dividend and other income obtained by subtracting profit, employment and pension income from total income in a region would be
reliable.
4. Incomes are allocated to regions and countries according to the residence of the recipient. The postcode has been used to determine the
county and hence the region for the overwhelming majority of cases. Some members of the Forces and Merchant Navy, together with a small
number of people serving overseas and people with overseas addresses have not been allocated to regions, but have been included in the UK
figures. There are also a small number of people in the sample where it was not possible to identify their postcode and therefore identify the
correct region. These have also been included in the UK figures. This explains why the regional amounts do not add up to the UK total.
7. The notes to Table 3.7 also apply to ths table.
6. The 'Investment income' column has been renamed as 'Property, interest, dividend and other income'. This change ensures that the income
components remain consistent with the historical back series from previous SPIs.
No. of
individualsAmount
No. of
individualsAmount
No. of
individualsAmount
No. of
individualsAmount
55
Annex B: Data sources and Methodology
The data sources and methods used to compile statistics in this release are set out below:
The tables in this publication are derived from the annual Survey of Personal Incomes (SPI).
The sample survey is based on information held by HMRC on persons who could be liable to UK income tax for the income tax year. It is carried out annually and covers the income assessable for tax in each tax year. The tables in this publication are based on the surveys for 2014-15 and earlier.
Samples were selected from three HMRC operational computer systems, which are as follows:
1. The National Insurance and PAYE Service (NPS) system covers all employees and occupational pension recipients with a Pay-As-You-Earn (PAYE) record.
2. The Computerised Environment for Self Assessment (CESA) system covers people with self-employment, rental or untaxed investment income. It also covers directors, those subject to higher rate tax and other people with complex tax affairs. Where people have both NPS
and CESA records, their CESA record is selected because it provides a more complete picture of their taxable income.
3. The Claims system covers people without NPS or CESA records who
have had too much tax deducted at source and claim a repayment. Separate samples were drawn from each of these systems and different sampling strategies were used for each. The samples were structured as
follows: (a) The PAYE population from NPS was stratified by gender and by the sum of pay plus occupational pension income for the previous tax year. Where the
previous year’s income was not available cases were stratified by gender and by whether they were a higher rate or additional rate taxpayer for the current tax year based on information available at the time the sample was drawn. The sampling fractions varied from 1 in 10 for individuals with high incomes
and rare allowances to about 1 in 200 for people with low combined pay and pensions. In all, about 411,600 individuals were selected from NPS for inclusion in the 2014-15 SPI.
56
(b) For the SA population from CESA, the main source of income (self employment or employment/occupational pension) and ranges of income and tax were used to stratify the sample, with the sampling fraction varying from 1
in 1 for cases with very high income or tax up to about 1 in 200 for employees and occupational pensioners with smaller income or tax for 2014-15. In all, about 309,100 individuals were selected from SA for inclusion in the 2014-15 SPI.
(c) For claims cases, a random sample of about 1 in 20 was selected for inclusion in the SPI. This led to around 10,000 cases being selected for the survey.
Once data was collected for the three constituent parts of the sample, the data sets were joined together. After allowing for non-response and for records that failed data validation tests, there were about 730,700 valid cases on the
2014-15 final SPI file.
Coverage of the SPI
Not all of the individuals in the SPI sample are taxpayers. About 21 per cent have no income tax liability because deductions and reliefs and personal allowances exceed their total income. Where income exceeds the threshold for the operation of PAYE (£10,000 for 2014-15), the SPI provides the most
comprehensive and accurate official source of data on personal incomes. However, as HMRC does not hold information for all people with personal incomes below the tax threshold, the SPI is not a representative data source for this part of the population and no attempt has been made to estimate the
numbers of cases below the tax threshold or the amount of their incomes. Therefore the National Statistics in this publication - with the exception of Tables 3.9 and 3.10 - only cover individuals liable to UK income tax
(taxpayers) and their incomes. An individual with income below the personal allowance can still be a taxpayer in some circumstances. This can arise where individuals who have income
liable to UK tax do not qualify for a personal allowance under the residence and /or domicile rules. Some people who do qualify for the personal allowance choose to give up their personal allowance as part of the qualifying conditions for having their income taxed under the “remittance basis”. These taxpayers
may only have a small amount of income liable to UK tax (i.e. below where the personal allowance is set), but this income is still liable to tax and is charged at the starting, and/or basic rates.
57
Most sources of income are liable for income tax and adding all these sources together will give an individual’s total income assessable for tax for the tax year. There are some sources of income that are not liable for tax. As they do
not contribute towards an individual’s taxable income; they are excluded from the SPI; these sources include some social security benefits and income from some tax efficient savings vehicles (e.g. Individual Savings Accounts and some National Savings & Investment products).
Capital Gains arising from the disposal of assets are subject to Capital Gains Tax (CGT) and are not treated as income for income tax purposes, so gains from the disposal of assets are not included in the SPI.
The coverage of investment income for the sample drawn from NPS is incomplete. This is because in order to operate the PAYE system for most individuals HMRC does not need information on interest from which tax has
been deducted at source, nor on dividends and associated tax credit. In order to create a full picture of total income for this survey, it is necessary to impute values of bank and building society interest and dividends to some sample cases.
For interest and dividends imputation, the amount for each SPI case:
is known for cases in Self Assessment from the amount declared on
the Self Assessment Return can be inferred or estimated reasonably for NPS cases where there is
an adjustment to the tax code for higher rate taxpayers is supplemented with information from interest paying institutions
is unknown for NPS cases where there is no coding adjustment - typically no liability at the higher rate.
Where no information at case level is available from HMRC administrative
systems, estimated values are imputed to cases so that the population as a whole has amounts consistent with evidence from other sources (for example, amounts of tax accounted for by deposit takers and the propensity to hold interest bearing accounts as indicated by household surveys).
For interest income, starting from control totals at UK level, for the number of cases with interest and the total amount of that interest, the numbers of cases and amounts of interest in Self Assessment cases and those NPS cases with
coding adjustments are deducted to leave targets for the remainder of the taxpayer population. These targets are at UK level – no attempt is made to control the targets to sub-UK geographical units. The cases to which amounts are attached by the imputation process and the amounts attached are
determined by probabilistic methods with just the UK targets and distributions in mind. For dividend income, the number of non SA cases with dividend income and distribution of imputed amounts were inferred from Family Resources Survey data for 2014-15.
As with investment income, HMRC does not have complete information about superannuation or personal pension contributions.
58
Under PAYE, tax is paid on pay after the deduction of superannuation contributions and therefore HMRC does not need to record the contributions deducted from gross pay. For a small proportion of individuals, the
superannuation contribution has been taken directly from an end of year return submitted by employers. For others, their total amount of superannuation contributions has been estimated and has been distributed among earners in the SPI sample, based on information from the Annual
Survey of Hours and Earnings produced by the Office for National Statistics. Relief at basic rate is given at source for employee contributions to personal pensions. As this is the correct amount of relief for basic rate taxpayer
employees, HMRC does not need to collect personal pensions data for this group of taxpayers. To compile complete estimates for personal pensions and total income for the SPI, a significant proportion of the amount of personal pension contributions has been imputed using data from external data
sources. The estimated value for this and for superannuation contributions has been combined with other pension reliefs and included in these statistics.
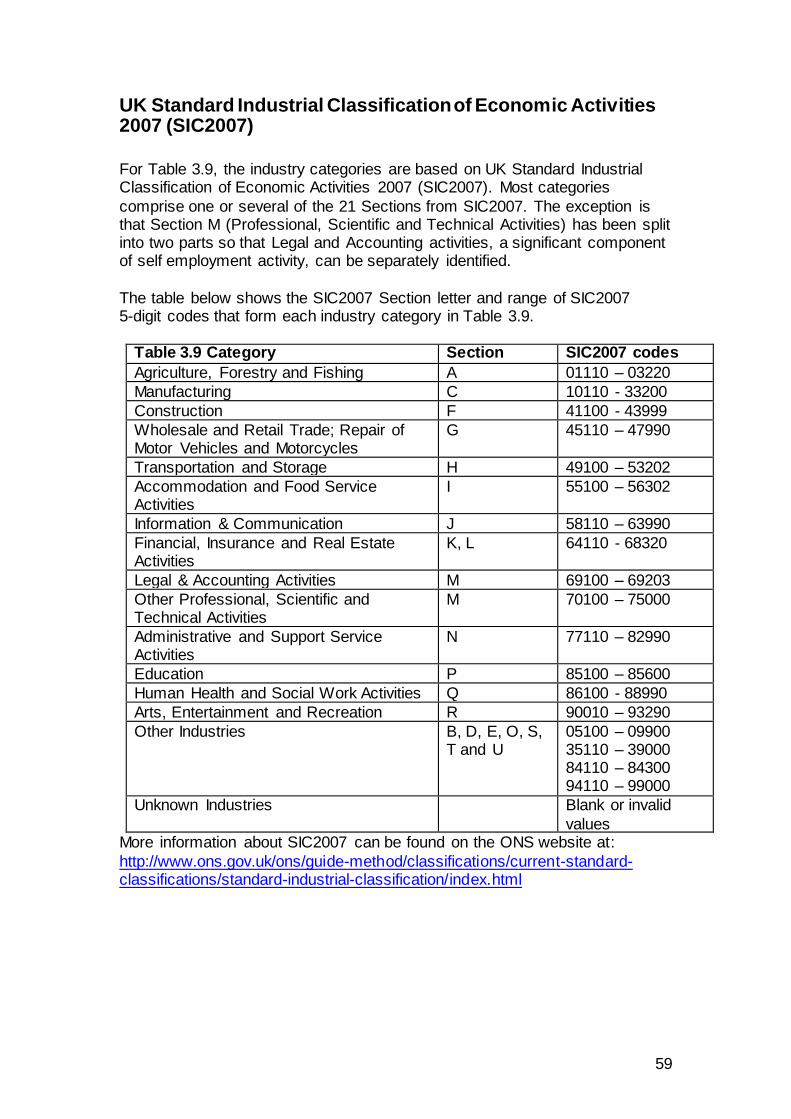
59
UK Standard Industrial Classification of Economic Activities 2007 (SIC2007)
For Table 3.9, the industry categories are based on UK Standard Industrial Classification of Economic Activities 2007 (SIC2007). Most categories
comprise one or several of the 21 Sections from SIC2007. The exception is that Section M (Professional, Scientific and Technical Activities) has been split into two parts so that Legal and Accounting activities, a significant component of self employment activity, can be separately identified.
The table below shows the SIC2007 Section letter and range of SIC2007 5-digit codes that form each industry category in Table 3.9.
Table 3.9 Category Section SIC2007 codes
Agriculture, Forestry and Fishing A 01110 – 03220
Manufacturing C 10110 - 33200
Construction F 41100 - 43999
Wholesale and Retail Trade; Repair of Motor Vehicles and Motorcycles
G 45110 – 47990
Transportation and Storage H 49100 – 53202
Accommodation and Food Service Activities
I 55100 – 56302
Information & Communication J 58110 – 63990
Financial, Insurance and Real Estate Activities
K, L 64110 - 68320
Legal & Accounting Activities M 69100 – 69203
Other Professional, Scientific and Technical Activities
M 70100 – 75000
Administrative and Support Service Activities
N 77110 – 82990
Education P 85100 – 85600
Human Health and Social Work Activities Q 86100 - 88990
Arts, Entertainment and Recreation R 90010 – 93290
Other Industries B, D, E, O, S, T and U
05100 – 09900 35110 – 39000 84110 – 84300 94110 – 99000
Unknown Industries Blank or invalid
values More information about SIC2007 can be found on the ONS website at:
http://www.ons.gov.uk/ons/guide-method/classifications/current-standard-classifications/standard-industrial-classification/index.html
60
Estimates and measures of precision
Population and sample design
The SPI aims to cover all individuals with a UK income tax liability. The sample drawn from HMRC operational computer systems will include some cases where income is less than allowances so no tax liability arises. The section above explains how the records in each operational computer system
are grouped (stratified) before the sample is selected. A random sample of records is drawn from each grouping (stratum) – the proportion of cases selected varies from stratum to stratum. Reliability of estimates
As with all sample surveys, estimates from the SPI have a sampling error attached to them. A statistic (e.g. an estimate of a mean or a total from a
random sample) will be subject to sampling variation – its value will vary from one sample to the next if repeated random samples are drawn. The Standard Error of the statistic measures the extent of the variability. It reflects how much spread exists in the observations from the sample and the size of the sample.
In general, the larger the sample size, the smaller the Standard Error. To a lesser extent, the standard error of the statistic will decline as the proportion of the population surveyed increases, but only by taking measurements for the
whole population can sampling error for the statistic be removed entirely. A Confidence Interval for the statistic is constructed from the Standard Error. It gives an estimated range of values which is likely to include the estimated
population size statistic. If independent samples are taken repeatedly from the same population and the Confidence Interval is calculated for each sample, then a proportion (known as the Confidence Level) of such intervals will include the unknown population parameter.
A 95% Confidence Interval is one that if compiled repeatedly would encompass the population parameter 19 times in 20. For a given sample size, narrower intervals can be compiled if a greater risk of failing to encompass the
true population value is acceptable, whereas if greater certainty of including the true value is required, the interval will be wider. The Upper and Lower boundaries of the Confidence Interval are called the
Confidence Limits. They are a function of the statistic, the Standard Error of the statistic and the degree of confidence required of the interval. The calculation of sampling errors assumes a simple random sampling
method but can be extended to more complex sample designs. The sample for the SPI, as described earlier, is selected using a stratified sample.
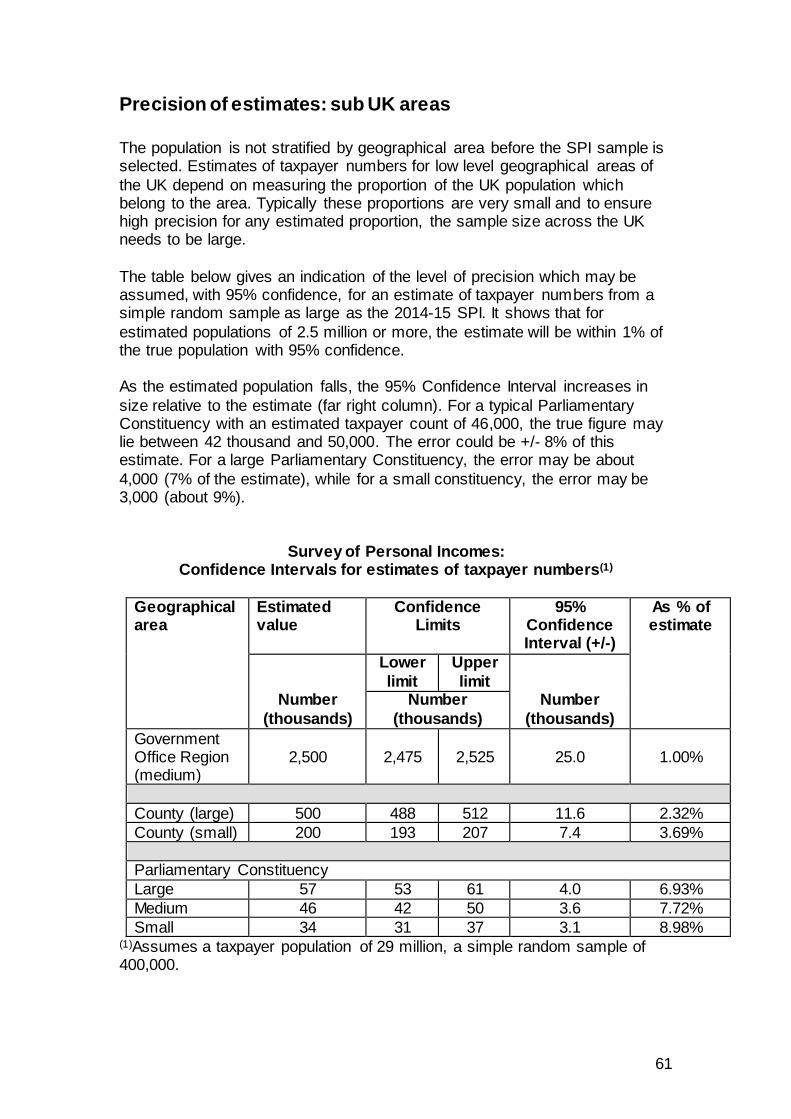
61
Precision of estimates: sub UK areas
The population is not stratified by geographical area before the SPI sample is selected. Estimates of taxpayer numbers for low level geographical areas of
the UK depend on measuring the proportion of the UK population which belong to the area. Typically these proportions are very small and to ensure high precision for any estimated proportion, the sample size across the UK needs to be large.
The table below gives an indication of the level of precision which may be assumed, with 95% confidence, for an estimate of taxpayer numbers from a simple random sample as large as the 2014-15 SPI. It shows that for
estimated populations of 2.5 million or more, the estimate will be within 1% of the true population with 95% confidence. As the estimated population falls, the 95% Confidence Interval increases in
size relative to the estimate (far right column). For a typical Parliamentary Constituency with an estimated taxpayer count of 46,000, the true figure may lie between 42 thousand and 50,000. The error could be +/- 8% of this estimate. For a large Parliamentary Constituency, the error may be about
4,000 (7% of the estimate), while for a small constituency, the error may be 3,000 (about 9%).
Survey of Personal Incomes: Confidence Intervals for estimates of taxpayer numbers(1)
Geographical area
Estimated value
Confidence Limits
95% Confidence Interval (+/-)
As % of estimate
Lower
limit
Upper
limit
Number
(thousands)
Number
(thousands)
Number
(thousands)
Government Office Region (medium)
2,500
2,475
2,525
25.0
1.00%
County (large) 500 488 512 11.6 2.32%
County (small) 200 193 207 7.4 3.69%
Parliamentary Constituency
Large 57 53 61 4.0 6.93%
Medium 46 42 50 3.6 7.72%
Small 34 31 37 3.1 8.98% (1)Assumes a taxpayer population of 29 million, a simple random sample of 400,000.
62
In practice, estimates will reflect the more complex SPI sample design. Broadly speaking, as sample size changes by a factor x, the Confidence
Interval will change by a factor x1
, so a fourfold increase in sample size will halve the Confidence Interval.
Year on year changes in published estimates of taxpayer numbers within small geographical areas (e.g. districts and constituencies) should be viewed with caution. They involve measuring small differences between two very
small proportions. The Confidence Interval for the difference could be large relative to the measured difference, so any observed change may be due to sampling fluctuation alone.
Similar precision, or relative precision, to that shown in the table above in estimates for subsets of taxpayers (e.g. pensioners or higher rate taxpayers) in small geographical areas (e.g. districts and constituencies) requires even greater national samples, far in excess of the present sample size of the SPI.
Estimates in such detail are not considered sufficiently reliable to be published.
Methodological Changes since the 2013-14 SPI
Changes to the PAYE Data
There have been no changes to the PAYE data. Changes to the Self Assessment Data
There have been no changes to the Self Assessment data. Changes to the Claims Data
There have been no changes to the claims data. Changes to the Imputation Process
There have been no changes to the imputation process.
63
Annex C: Glossary of Terms
Annex C aims to explain acronyms, abbreviations and terms associated with personal incomes and income tax liabilities. Allowances
The amount of income which an individual can receive before being liable for income tax. The personal allowance is an example of an allowance.
Average rate of tax
The ratio of income tax liability to total income, where income is measured before deductions, reliefs and allowances.
Basic rate limit
The highest income point for taxable income (after allowances) at which basic rate income tax is charged.
CESA (Computerised Environment for Self Assessment)
The computer system used to administer Self Assessment from which SA data for the SPI has been extracted since 1996-97. See Self Assessment (SA).
COP (Computerisation of PAYE)
The computer system which used to administer PAYE until it was replaced by NPS and from which PAYE data for the SPI was extracted
for tax years 1997-98 to 2007-08 inclusive.
Deductions and Reliefs
Amounts deducted from total income, along with personal allowances
to arrive at the amount of taxable income subject to an income tax charge. This includes amounts for contributions to occupational and personal pensions, and a variety of other Deductions and Reliefs including charitable giving and loss relief etc.
Dividend Income
Income derived from shares. Geographical Areas
Some tables present information for sub-UK areas described as Government Office Region, County, District and Parliamentary Constituency. Administrative and Political geographical areas are not
held on taxpayers’ records. For the SPI, the areas are attached by matching the individual’s postcode to the Office for National Statistics Postcode Directory.
Industry
Industry categories are based on UK Standard Industrial Classification of Economic Activities 2007 (SIC2007). Income from self employment (sole trade and partner) is assigned an industry using the business text
descriptions supplied on Self Assessment Returns.
64
National Insurance and PAYE System (NPS)
NPS is the computer system HMRC uses to administer PAYE. It replaced COP and is the source of PAYE data for SPI for tax year
2008-09 onwards. National Insurance Recording System 2 (NIRS2)
The computer system used to monitor payment of National Insurance
(NI) contributions and to calculate and prove entitlement to contributory benefits. These include Job Seekers Allowance (JSA) and the National Insurance Pension. It provides contribution information to a number of government departments.
P14s
Form P14 is an End of Year summary for an employment that is submitted by the employer to HMRC, showing pay, tax and NI
contributions for the year. The employer provides similar information to the employee on an end of year certificate, form P60.
Pay As You Earn (PAYE)
PAYE is the system used by HMRC to collect and account for income tax on earnings from employment and pensions. Income Tax and National Insurance Contributions are deducted by the employer and paid over to HMRC on behalf of the individual for each pay period.
Personal Allowance
The amount of income you can receive for the tax year without having to pay tax on it.
Savings Income
A particular class of income that includes interest on bank and building society accounts.
Self Assessment (SA)
SA is a system where an individual declares their income and can calculate their own income tax due after the end of the tax year.
Taxpayers included in SA can be higher earners, self-employed and taxpayers with complex tax affairs.
Starting rate limit/Starting rate for savings limit
The highest income point for taxable income (after allowances) at which starting rate income tax is charged. From 2008-09 the starting rate was abolished for non-savings income and applied only to non-dividend savings income.
65
Superannuation contributions
The regular amounts paid by an employee into an employer occupational pension fund; these are deducted from the employee’s
salary. Superannuation contributions to an authorised fund or scheme are not liable to income tax and the employer would deduct the amount of superannuation contributions from the gross pay before assessing the income tax liability through PAYE.
Survey of Personal Incomes (SPI)
An annual survey of individuals who could be liable for income tax derived from HMRC administrative systems holding data on persons
within PAYE, SA and income tax claims. Tax liabilities
The amount of income tax due on taxable income after applying tax
rates to the tax base. The income tax liability for each sample case in SPI is calculated by reference to the amounts of income by type, deductions and reliefs and the tax regime parameters that apply for the year. The calculated liability for a tax year will differ from the amount of
tax receipts collected in a financial year. Tax receipts
The amount of income tax collected by HMRC. The SPI measures the
amount of income tax liability for a tax year, but not the amount of receipts in the financial year.
Taxable income
Income assessable to income tax after allowances. Taxpayer
An individual calculated to have a positive income tax liability for the tax
year, based on the income, allowances, reliefs and deductions for the year.
66
Total income
The sum of an individual’s components of income taken into account in calculating income tax. This includes earnings from employment, profits
from self-employment, pension income, some social security benefits, savings income, income from shares (dividends), rental income, and income paid from trusts. It excludes:
gains from the disposal of assets that are classified as capital gains
interest, dividends or bonuses from tax exempt investments (for
example, ISAs and National Savings & Investments Savings Certificates)
interest and terminal bonuses from Save As You Earn Schemes
Premium Bond, National Lottery and gambling prize winnings
Total income is calculated before relief for contributions to occupational and personal pensions, other deductions and reliefs or personal allowances.
In the tax system, income is streamed into three main categories: dividends; savings income (not dividends); and non-savings income as different rules apply.