persistent fluctuations in stride intervals under fractal auditory stimulation
TRANSCRIPT
Seediscussions,stats,andauthorprofilesforthispublicationat:https://www.researchgate.net/publication/260996883
PersistentFluctuationsinStrideIntervalsunderFractalAuditoryStimulation
ARTICLEinPLOSONE·MARCH2014
ImpactFactor:3.23·DOI:10.1371/journal.pone.0091949·Source:PubMed
CITATIONS
11
READS
57
4AUTHORS:
VivienMarmelat
UniversityofNebraskaatOmaha
14PUBLICATIONS102CITATIONS
SEEPROFILE
KjerstinTorre
UniversitédeMontpellier
43PUBLICATIONS978CITATIONS
SEEPROFILE
PeterJBeek
VUUniversityAmsterdam
347PUBLICATIONS7,853CITATIONS
SEEPROFILE
AndreasDaffertshofer
VUUniversityAmsterdam
148PUBLICATIONS4,263CITATIONS
SEEPROFILE
Availablefrom:VivienMarmelat
Retrievedon:04February2016
Persistent Fluctuations in Stride Intervals under FractalAuditory StimulationVivien Marmelat1,2, Kjerstin Torre1, Peter J. Beek2,3, Andreas Daffertshofer2*
1Movement to Health Laboratory, Montpellier-1 University, EuroMov, Montpellier, France, 2MOVE Research Institute Amsterdam, Faculty of Human Movement Sciences,
VU University Amsterdam, Amsterdam, Netherlands, 3 School for Sport and Education, Brunel University, Uxbridge, Middlesex, United Kingdom
Abstract
Stride sequences of healthy gait are characterized by persistent long-range correlations, which become anti-persistent inthe presence of an isochronous metronome. The latter phenomenon is of particular interest because auditory cueing isgenerally considered to reduce stride variability and may hence be beneficial for stabilizing gait. Complex systems tend tomatch their correlation structure when synchronizing. In gait training, can one capitalize on this tendency by using a fractalmetronome rather than an isochronous one? We examined whether auditory cues with fractal variations in inter-beatintervals yield similar fractal inter-stride interval variability as isochronous auditory cueing in two complementaryexperiments. In Experiment 1, participants walked on a treadmill while being paced by either an isochronous or a fractalmetronome with different variation strengths between beats in order to test whether participants managed to synchronizewith a fractal metronome and to determine the necessary amount of variability for participants to switch from anti-persistent to persistent inter-stride intervals. Participants did synchronize with the metronome despite its fractalrandomness. The corresponding coefficient of variation of inter-beat intervals was fixed in Experiment 2, in whichparticipants walked on a treadmill while being paced by non-isochronous metronomes with different scaling exponents. Asexpected, inter-stride intervals showed persistent correlations similar to self-paced walking only when cueing containedpersistent correlations. Our results open up a new window to optimize rhythmic auditory cueing for gait stabilization byintegrating fractal fluctuations in the inter-beat intervals.
Citation: Marmelat V, Torre K, Beek PJ, Daffertshofer A (2014) Persistent Fluctuations in Stride Intervals under Fractal Auditory Stimulation. PLoS ONE 9(3):e91949. doi:10.1371/journal.pone.0091949
Editor: Alfonso Fasano, University of Toronto, Italy
Received September 8, 2013; Accepted February 18, 2014; Published March 20, 2014
Copyright: � 2014 Marmelat et al. This is an open-access article distributed under the terms of the Creative Commons Attribution License, which permitsunrestricted use, distribution, and reproduction in any medium, provided the original author and source are credited.
Funding: This work was supported by SKILLS, an Integrated Project (FP6-IST Contract #035005) of the Commission of the European Community. AndreasDaffertshofer received financial support from the Netherlands Organisation for Scientific Research (NWO grant #400-08-127). The funders had no role in studydesign, data collection and analysis, decision to publish, or preparation of the manuscript.
Competing Interests: The authors have declared that no competing interests exist.
* E-mail: [email protected]
Introduction
The assessment of mean and standard deviation alone often
does not suffice to discriminate between optimal and constrained
behavior or between healthy and pathological performances [1–3].
The temporal structure of fluctuations, here synonym for the
serial-lag correlation of consecutive events, may contain valuable
information about the functional organization of the system
generating these events [4–6]. The presence of long-range
correlations or 1/f noise, be it in cortical activity, EMG activity,
or macroscopic gait dynamics, is considered a generic marker for
systems that can adequately adapt to perturbations in their
environment [5,7–9]. Many clinical studies revealed dependencies
of the correlation structure of gait to different pathologies like
amyotrophic lateral sclerosis [1], Huntington’s disease [1–2], and
Parkinson’s disease [1,9].
External cueing may alter the temporal correlation structure of
gait. Isochronous auditory cues are particularly known for
changing the typical fractal dynamics of healthy gait [10–11].
Persistent (positive) long-range correlations in stride intervals of
self-paced gait may switch to anti-persistent (negative) correlations
if an isochronous metronome is present [12]. This qualitative
change of gait dynamics may be indicative of ‘local’ (i.e. short-
term) coupling processes, allowing for cycle-by-cycle entrainment
of the movements with the metronome. Isochronous pacing thus
constrains the locomotor system to (a narrow band around) the
isolated metronome frequency, which is contrary to self-paced
walking where the locomotion covers a broad range of frequencies
with a power-law distribution [9,12–13]. In spite of this
constraining feature, the beneficial capacity of isochronous
auditory cueing for gait rehabilitation in the presence of
neurodegenerative diseases has been demonstrated in several
studies. For instance, stride length, cadence, and speed all increase
[14], whereas inter-stride variability and occurrence of freezing
decrease (see, e.g., [2], and for a systematic review [15]). Could
this beneficial capacity be amplified if cueing contains variability
similar to that of healthy gait? And does the presence of fractality
in the cueing streams prepare walkers to cope with potential future
irregularities in the natural environment?
Introducing variability and fractality in cueing streams is not
new. Kaipust and co-workers [16] submitted that isochronous
cueing might not be optimal for gait rehabilitation. They showed
that participants were sensitive to the correlation structure of
cueing fluctuations. However, their participants were not instruct-
ed to synchronize their gait to the metronome. It might be that
subjects just ignored the metronome and fell back to their own,
fractal gait structure, which would question the effect of fractal
cueing. Hove and co-workers [17] showed that the correlation
PLOS ONE | www.plosone.org 1 March 2014 | Volume 9 | Issue 3 | e91949

structure of stride times in patients suffering Parkinson’s disease
changed towards that of healthy gait when using an interactive
rhythmic auditory stimulation, i.e. when stimulus timing changed
in response to the participant’s instant tempo. However, why this
adjustment occurred remains unclear. Was it because the patients
synchronized to the stimulus or vice versa?
We investigated the effect of fractal cueing when subjects were
explicitly asked to synchronize with the metronome. We hypoth-
esized that, unlike isochronous pacing, persistent long-range
correlated auditory cueing preserves the fractal dynamics of stride
intervals in healthy subjects. To test this hypothesis, we conducted
two complementary experiments in which we measured inter-
stride intervals (ISIs). In Experiment 1 participants walked when
paced by either isochronous or fractal cues with different inter-
beat interval (IBIs) coefficients of variation to determine the
‘optimal’ amount of variation in the cueing. In Experiment 2
participants walked when paced by either isochronous or non-
isochronous cues with different scaling exponents characterizing
the IBIs’s correlation structure. We expected that subjects would
synchronize with any metronome but we expected stride intervals
to present persistent, long-range correlations only when cues
resemble the fractal fluctuations present in voluntary, self-paced
walking.
Assessing the Correlation StructureCentral to our data analysis are estimates of the scaling behavior
of serial-lag correlations that we briefly summarize before
outlining our experimental approach. We employed the detrended
fluctuations analysis (DFA) [18], which was deemed suitable here
in view of its applicability to relatively short time series [19]. DFA
assesses the relationship between the magnitude of fluctuations of
the variable and the duration over which these fluctuations are
observed. If the correlation structure is scale free (fractal), then this
relationship should obey the form
F nð Þ!na ð1Þ
where F denotes the fluctuation strength and n is a time interval
that provides a measure of the aforementioned duration. The
scaling exponent a is of essential interest: a fully random series
(white noise) corresponds to a=0.5; time series containing anti-
persistent correlations have a,0.5, and persistent correlations
imply a.0.5. The exponent a should be bounded to the interval
[0,1] because otherwise the time series under study is non-
stationary rendering subsequent, conventional statistics invalid.
We also note that a is closely related to the Hurst exponent that is
often used to characterize fractal stochastic processes – a equals
the Hurst exponent if the to-be-analyzed time series has been
generated by stationary series, i.e. fractal Gaussian noise.
Detrended Fluctuation AnalysisTo obtain the scaling exponent a one first integrates the mean-
centered time series under study, which reads for the discrete time
series Y:
Y (k)~Xki~1
y(i){�yy½ � ð2Þ
where N corresponds to the number of samples in the series. Then,
the integrated time series is divided into non-overlapping intervals
of n data points (here 10,n,N/2). Within every interval the time
series Y kð Þ,:::,Y kznð Þ½ � is fitted by a line Ytrend k,nð Þ, which can
be interpreted as a linear, local trend. That trend is subsequently
removed yielding per interval of length n, the mean characteristic
magnitude of fluctuation F(n) as
F nð Þ~ffiffiffiffiffiffiffiffiffiffiffiffiffiffiffiffiffiffiffiffiffiffiffiffiffiffiffiffiffiffiffiffiffiffiffiffiffiffiffiffiffiffiffiffiffiffiffiffiffiffiffiffiffiffiffiffiffiffiffiffiffiffi1
N
XN
k~1Y kð Þ{Ytrend k,nð Þð Þ2
rð3Þ
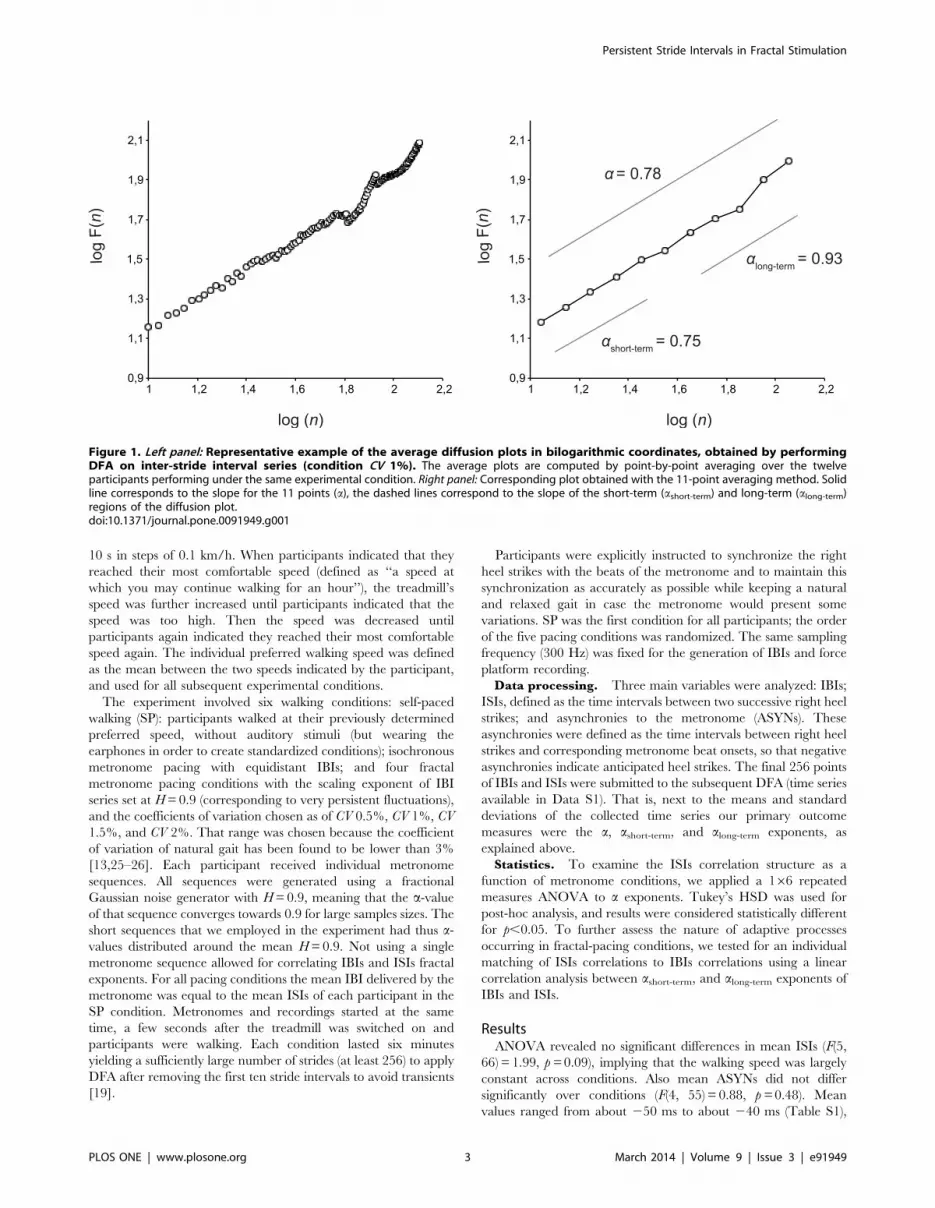
As log(na) = a?log(n), the scaling exponent a can be estimated by a
slope of the diffusion plot, i.e. the log-log plot of F as a function of n
(Figure 1, left panel) – we note that when determining a on that
logarithmic scale, n should be sampled exponentially in order to
avoid a bias in the fit towards larger n-values (Figure 1, right
panel).
Short-term and Long-term CorrelationsWe expected what may be referred to as ‘complexity matching’:
when two complex systems interact, they are likely to entrain [20–
22]. That is, we expected a strong correlation between fractal
exponents of ISIs and IBIs. Because complexity matching is more
likely to be manifest on long-term scales [23], we also examined
the short- and long-term regions of the diffusion plots, in addition
to the overall scaling exponent a (Figure 1, right panel). While the
precise separation of short- and long-term regions might be
somewhat arbitrary, one may state as a rule of thumb that short-
term fluctuations account for local (brief) adaptations, whereas
long-term fluctuations reveal more global (durable) changes,
possibly in coordination. To guarantee proper sample sizes for
reliable exponent estimates, we defined ashort-term as the slope of
the first half of the diffusion plot and along-term as the slope of the
second half. More precisely, ashort-term and along-term included F(n)-
values over the intervals n=10 … 31 and n=50 … 128,
respectively, for time series with 256 data-points. Note that
ashort-term does not refer to short-term gait events, e.g., one or two
strides, but to the length of the time series under study.
Experiment 1 – Determining the OptimalCoefficient of Variation
We used an isochronous and a set of fractal auditory pacing
signals that differed in fluctuation strength (the coefficients of
variation of the inter-beat interval were 0.5%, 1%, 1.5%, and 2%,
respectively) to determine the conditions in which subjects gait was
influenced by the presence of fractal cues, here synonym of cues
with persistent, long-range correlations.
MethodsParticipants. After giving written informed consent, twelve
healthy volunteers (seven female, age = 2866 years) participated in
the experiment.Ethics. The ethics committee of the Faculty of Human
Movement Sciences, VU University Amsterdam, approved the
experiment prior to its conductance.Apparatus and equipment. Participants walked on a
treadmill in which a single large force platform was embedded
(ForceLink, Culemborg, The Netherlands), allowing for online
detection of foot contact [24]. Computer-generated rhythmic
auditory stimuli (pitch 600 Hz) were administered through
earphones (right ear), to pace the right heel strikes. IBIs were
generated containing fractal Gaussian noise with corresponding
scaling exponent (Hurst exponent H). Short audio samples of
metronomes are available in Audio S1, and the Table S2 provides
mean and standard deviations of IBIs series.Tasks and procedure. We first determined the individual
preferred walking speeds. The treadmill speed was increased every
Persistent Stride Intervals in Fractal Stimulation
PLOS ONE | www.plosone.org 2 March 2014 | Volume 9 | Issue 3 | e91949
10 s in steps of 0.1 km/h. When participants indicated that they
reached their most comfortable speed (defined as ‘‘a speed at
which you may continue walking for an hour’’), the treadmill’s
speed was further increased until participants indicated that the
speed was too high. Then the speed was decreased until
participants again indicated they reached their most comfortable
speed again. The individual preferred walking speed was defined
as the mean between the two speeds indicated by the participant,
and used for all subsequent experimental conditions.
The experiment involved six walking conditions: self-paced
walking (SP): participants walked at their previously determined
preferred speed, without auditory stimuli (but wearing the
earphones in order to create standardized conditions); isochronous
metronome pacing with equidistant IBIs; and four fractal
metronome pacing conditions with the scaling exponent of IBI
series set at H=0.9 (corresponding to very persistent fluctuations),
and the coefficients of variation chosen as of CV 0.5%, CV 1%, CV
1.5%, and CV 2%. That range was chosen because the coefficient
of variation of natural gait has been found to be lower than 3%
[13,25–26]. Each participant received individual metronome
sequences. All sequences were generated using a fractional
Gaussian noise generator with H=0.9, meaning that the a-valueof that sequence converges towards 0.9 for large samples sizes. The
short sequences that we employed in the experiment had thus a-values distributed around the mean H=0.9. Not using a single
metronome sequence allowed for correlating IBIs and ISIs fractal
exponents. For all pacing conditions the mean IBI delivered by the
metronome was equal to the mean ISIs of each participant in the
SP condition. Metronomes and recordings started at the same
time, a few seconds after the treadmill was switched on and
participants were walking. Each condition lasted six minutes
yielding a sufficiently large number of strides (at least 256) to apply
DFA after removing the first ten stride intervals to avoid transients
[19].
Participants were explicitly instructed to synchronize the right
heel strikes with the beats of the metronome and to maintain this
synchronization as accurately as possible while keeping a natural
and relaxed gait in case the metronome would present some
variations. SP was the first condition for all participants; the order
of the five pacing conditions was randomized. The same sampling
frequency (300 Hz) was fixed for the generation of IBIs and force
platform recording.
Data processing. Three main variables were analyzed: IBIs;
ISIs, defined as the time intervals between two successive right heel
strikes; and asynchronies to the metronome (ASYNs). These
asynchronies were defined as the time intervals between right heel
strikes and corresponding metronome beat onsets, so that negative
asynchronies indicate anticipated heel strikes. The final 256 points
of IBIs and ISIs were submitted to the subsequent DFA (time series
available in Data S1). That is, next to the means and standard
deviations of the collected time series our primary outcome
measures were the a, ashort-term, and along-term exponents, as
explained above.
Statistics. To examine the ISIs correlation structure as a
function of metronome conditions, we applied a 166 repeated
measures ANOVA to a exponents. Tukey’s HSD was used for
post-hoc analysis, and results were considered statistically different
for p,0.05. To further assess the nature of adaptive processes
occurring in fractal-pacing conditions, we tested for an individual
matching of ISIs correlations to IBIs correlations using a linear
correlation analysis between ashort-term, and along-term exponents of
IBIs and ISIs.
ResultsANOVA revealed no significant differences in mean ISIs (F(5,
66) = 1.99, p = 0.09), implying that the walking speed was largely
constant across conditions. Also mean ASYNs did not differ
significantly over conditions (F(4, 55) = 0.88, p = 0.48). Mean
values ranged from about 250 ms to about 240 ms (Table S1),
Figure 1. Left panel: Representative example of the average diffusion plots in bilogarithmic coordinates, obtained by performingDFA on inter-stride interval series (condition CV 1%). The average plots are computed by point-by-point averaging over the twelveparticipants performing under the same experimental condition. Right panel: Corresponding plot obtained with the 11-point averaging method. Solidline corresponds to the slope for the 11 points (a), the dashed lines correspond to the slope of the short-term (ashort-term) and long-term (along-term)regions of the diffusion plot.doi:10.1371/journal.pone.0091949.g001
Persistent Stride Intervals in Fractal Stimulation
PLOS ONE | www.plosone.org 3 March 2014 | Volume 9 | Issue 3 | e91949

that is, participants slightly anticipated the metronome as has often
been observed in sensorimotor synchronization [27]. This suggests
that in all conditions participants were able to adapt to the cueing.
Mean a exponents obtained in IBIs and ISIs series are
summarized in Table 1. For the ISIs series the ANOVA revealed
a significant effect of pacing conditions on the global a-exponents(F(5, 66) = 36.34; p,0.001, Figure 2, left panel). Tukey’s HSD
analysis indicated that a differed between SP and ISO conditions
(p,0.001) with persistent long-range correlations for SP but anti-
persistent correlations for ISO (mean a=0.7560.12 and
a=0.2360.13, respectively). ISO was also significantly different
from all of the fractal-pacing conditions (CV 0.5% to CV 2% all p,
0.001). The mean a exponent in the CV 0.5% condition (mean
a=0.5960.17) was close to white noise, and significantly smaller
than those of all other fractal-pacing conditions (CV 1%, p=0.004;
CV 1.5%, p,0.001; and CV 2%, p,0.001).
In-depth analysis revealed however, that the mean a exponent
obtained for CV 0.5% did not correspond to any of the individual
series’ exponents. In fact the group showed a bimodal distribution:
Eight participants switched from anti-persistent to persistent long-
range correlations at CV 0.5%, whereas the remaining four
participants switched at CV 1%. To address this bimodality we
performed an additional 2(sub-groups)66(pacing) ANOVA with
repeated measures and found a significant effect of interaction
between sub-groups and pacing conditions (F(5, 55) = 2.56;
p=0.038, see Figure 2, right panel). Tukey’s HSD analysis
showed that in CV 0.5% the first sub-group produced long-range
correlations in CV 0.5% (mean a=0.6960.11), which were
qualitatively different from ISO (p,0.001) but not from other
pacing conditions. The second sub-group produced anti-persistent
ISIs (mean a=0.4060.02) that were qualitatively similar to
correlations obtained in ISO pacing (p=0.426). Post-hoc analysis
confirmed that the two sub-groups differed only in CV 0.5%
condition (p=0.031).
The results of the linear correlation analysis on ashort-term and
along-term exponents of IBIs and ISIs series are depicted in Figure 3.
We found no significant correlation between ashort-term exponents
for all fractal-pacing conditions (Figure 3, upper panel), while along-
term exponents were positively correlated for all fractal-pacing
conditions (r10 ranging from 0.76 to 0.98, Figure 3, lower panel).
This suggests that the observed complexity matching cannot be the
consequence of the aggregation of short-term corrections.
Experiment 2–Varying the MetronomeCorrelation
Our next step in investigating our participants’ ability to
synchronize to fractal versus isochronous cueing was to compare
different IBIs correlation structures for a fixed coefficient of
variation. We expected that the fractal structure of ISIs would only
be preserved for fractal-pacing conditions that agree with the
correlation structure of self-paced walking. We therefore used
metronomes with different IBI structures: anti-persistent, uncor-
related, and persistent.
MethodsParticipants. Twelve volunteers (five female, age 2866
years) participated in the experiment after providing informed
written consent. As in Experiment 1, all participants were healthy
and none had any neuromuscular disorder or recent injury at the
time of study. One participant of Experiment 2 also took part in
Experiment 1.
Ethics. The ethics committee of the Faculty of Human
Movement Sciences, VU University Amsterdam, The Nether-
lands, approved the experiment prior to its conductance.
Apparatus and equipment. The equipment was the same as
in Experiment 1.
Tasks and procedure. The protocol was identical to
Experiment 1 except for the use of different fractal cueing
sequences. The conditions were: SP (see Experiment 1); ISO (see
Experiment 1); and four non-isochronous cueing sequences with
distinct scaling exponents, H 0.2, H 0.5, H 0.6, and H 0.9. In the
latter four conditions, the IBIs coefficient of variation was fixed to
1%. Isochronous and non-isochronous conditions were sought to
present the least differences. We thus chose the lowest CV in which
Figure 2. Mean a exponent (DFA) of inter-beat intervals (white triangles) and inter-stride intervals (squares) in Experiment 1. (*: p,0.05; N.S.: non-significant differences; error bars: standard deviation). Left panel: The evolution of a for all participants taken together (n=12) could beinterpreted as a progressive increase with increasing CV. Right panel: Qualitatively different changes in a exhibited by two subgroups: group 1 (blacksquares, n=8) shows an abrupt switch from anti-persistent to persistent long-range correlations at CV= 0.5%, while group 2 (white squares, n= 4)switches at CV= 1%.doi:10.1371/journal.pone.0091949.g002
Persistent Stride Intervals in Fractal Stimulation
PLOS ONE | www.plosone.org 4 March 2014 | Volume 9 | Issue 3 | e91949

we observed persistent fluctuations in ISIs for all participants in
Experiment 1.
Data processing. Signal processing and estimates of IBIs,
ISIs, and ASYNs agreed entirely with Experiment 1.
Statistics. We applied a 166 repeated measures ANOVA to
all outcome measures. As in Experiment 1, Tukey’s HSD was used
for post-hoc analysis. Results were considered statistically different
for p,0.05. We also used a linear correlation analysis between a,ashort-term, and along-term exponents of IBIs and ISIs.
ResultsMean a exponents obtained in IBIs and ISIs series are given in
Table 2. For ISIs series, ANOVA revealed a significant effect of
pacing conditions on a exponents (F(5, 66) = 33.33; p,0.001).
Tukey’s HSD analysis showed that a differed between SP and ISO
conditions (p,0.001) with persistent long-range correlations for SP
(mean a=0.7960.09) and anti-persistent correlations for ISO
(mean a=0.2560.15). SP differed from the three non-fractal non-
isochronous conditions (H 0.2, H 0.5, and H 0.6 all p,0.001). The
a exponents in the H 0.9 condition differed from all other pacing
conditions (ISO, p,0.001; H 0.2, p,0.001; H 0.5, p = 0.004; H
0.6, p=0.004), but not from the SP condition (H 0.9, p=0.099).
The results of linear correlation analysis on ashort-term and along-term exponents of IBIs and ISIs series in the four non-isochronous
conditions are shown in Figure 4. The correlation between ashort-term exponents (Figure 4, upper panel) was significant only for H
0.5 (r10=0.61). The correlation between along-term exponents
(Figure 4, lower panel) was significant only for H 0.6 (r10=0.66)
and H 0.9 (r10=0.90). This result suggests a sensitivity of ISIs for
the long-range structure of fluctuations of IBIs only when
persistent fluctuations were present.
Experiments 1 & 2– RevisitedIn order to assess possible contributions of short-term behavioral
correction to the matching of IBIs and ISIs long-term correlation
properties, we further determined the cross-correlation between
IBIs and ISIs series. Since the conventional cross-correlation is
highly sensitive to the presence of persistent trends in the time
series, which would lead to a systematic overestimation of the local
co-variations between IBIs and ISIs [20], we used a windowed
cross-correlation analysis (WCC): the cross-correlation between
the first windows of 15 samples of IBIs and ISIs series was
determined after locally detrending each series. These windows
were shifted sample-by-sample yielding a series of N–15 cross-
correlation coefficients at lag 0 (with N= length of the time series).
Table 1. Mean fractal exponents (aDFA) and standard deviation (italics) of inter-beat intervals and inter-stride intervals estimatedfrom all conditions in Experiment 1.
Experiment 1 ISO CV 0.5% CV 1% CV 1.5% CV 2% SP
Inter-beat intervals (IBI) – 0.94 1.00 0.99 0.97 –
– 0.11 0.10 0.11 0.10 –
Inter-stride intervals (ISI) 0.28a 0.60a 0.78 0.85 0.85 0.73
0.14 0.13 0.10 0.10 0.14 0.12
ap,0.05 when compared to SP condition.doi:10.1371/journal.pone.0091949.t001
Figure 3. Correlation between a exponents (DFA) of inter-beat intervals and inter-stride intervals obtained in the four conditionswith fractal metronome in Experiment 1. Upper panel: short-term region of diffusion plots. Lower panel: long-term region of diffusion plots.Significance threshold (*) for correlation coefficients is set at p,0.05 (r10 = 0.58). For the CV=0.5% condition, subpanels separately show thecorrelations for the two subgroups of participants (n= 4, upper subpanel, and n= 8, lower subpanel).doi:10.1371/journal.pone.0091949.g003
Persistent Stride Intervals in Fractal Stimulation
PLOS ONE | www.plosone.org 5 March 2014 | Volume 9 | Issue 3 | e91949

The same procedure was repeated by considering different lags
between IBIs and ISIs series, from lag 210 to lag 10 samples. We
note that a significant cross-correlation coefficient at lag 0 would
evidence that current ISI and IBI have similar lengths. The
threshold of significance for 15-point windowed cross-correlation
was given as r13 = 0.51 (p,0.05).
WCC revealed no significant correlation between IBIs and ISIs
series in Experiment 1 (Figure 5). Overall, correlations increased
with increasing variability (CV) in fractal IBIs with a maximum at
lag two. In Experiment 2, WCC also showed no significant
correlation between IBIs and ISIs series, and the maximum
correlation was again found at lag two.
Discussion
The findings of both experiments support our central hypothesis
that when paced by a fractal metronome the correlation structure
of stride intervals presents persistent fluctuations, contrary to
isochronous cueing when the correlation structure of stride
intervals presents anti-persistent fluctuations. We found a negative
mean asynchrony in all cueing conditions, suggesting that
participants were able to synchronize to the metronome
irrespective of its correlation structure: even anti-persistent cueing
could be followed. along-term exponents of ISIs and IBIs agreed only
when IBIs presented fractal fluctuations implying that the
persistent fluctuations in stride intervals were mainly influenced
by the long-term correlations in the cueing.
In line with earlier reports [11–13] stride intervals exhibited
persistent long-range correlations during self-paced walking and
were anti-persistent during isochronous paced walking. The
presence of long-range correlations is often considered a hallmark
of healthy and adaptive complex systems [5,28]. When the system
is altered (by pathology or external constraints imposed on the
subjects), deviations from this optimal behavioral dynamics may
occur [8,29]. In this respect, anti-persistence in stride intervals
during isochronous pacing reveals a more rigid behavior: the gait
dynamics is reduced to the regular tempo (single scale) of the
metronome. For rehabilitation this may imply that patients only
‘learn’ to walk to the isolated cueing beat without the capacity to
flexibly adapt to potential perturbations [16].
Stride intervals also presented anti-persistence when the IBIs
presented anti-persistent or random fluctuations. Unlike isochro-
nous, anti-persistent or random pacing, the use of a fractal
metronome enables the locomotor system to maintain the fractal
dynamics of gait, similar to self-paced gait dynamics (see Figure 2).
The results of Experiment 2 suggest that this is due to the
persistent, long-range correlations of inter-beat variations and not
to the fact that the presented metronomes were merely variable
Table 2. Mean fractal exponents (aDFA) and standard deviation (italics) of inter-beat intervals and inter-stride intervals estimatedfrom all conditions in Experiment 2.
Experiment 2 ISO H 0.2 H 0.5 H 0.6 H 0.9 SP
Inter-beat intervals (IBI) – 0.23 0.52 0.57 0.91 –
– 0.04 0.03 0.08 0.15 –
Inter-stride intervals (ISI) 0.25a 0.26a 0.44a 0.44a 0.64 0.79
0.15 0.11 0.13 0.09 0.17 0.09
ap,0.05 when compared to SP condition.doi:10.1371/journal.pone.0091949.t002
Figure 4. Correlation between a exponents (DFA) of inter-beat intervals and inter-stride intervals obtained in the four conditionswith non-isochronous metronome in Experiment 2. Upper panel: short-term region of diffusion plots. Lower panel: long-term region ofdiffusion plots. Significance threshold (*) for correlation coefficients is set at p,0.05 (r10 = 0.58).doi:10.1371/journal.pone.0091949.g004
Persistent Stride Intervals in Fractal Stimulation
PLOS ONE | www.plosone.org 6 March 2014 | Volume 9 | Issue 3 | e91949

(Figure 4). This agrees with recent findings that ISIs in elderly that
listened to a chaotic metronome contained persistent correlations
similar to those with no metronome [16]. According to Experi-
ment 1, the fractal exponents of stride intervals between
isochronous pacing and increasingly variable, fractal-pacing
conditions were either anti-persistent or persistent, revealing that
stride dynamics differed completely between isochronous and
fractal pacing. Inter-individual differences in the CV 0.5%
condition might be explained by differences in the perception of
inter-beat variations of the metronome [29,30].
The results in the fractal-pacing conditions (i.e., all conditions in
Experiment 1, and H 0.9 in Experiment 2) revealed that, in
general, the average fractal exponents of stride intervals tended
toward the exponents of the inter-beat intervals presented. In both
experiments this largely agreed with the exponents observed in
self-paced stride intervals (Figures 2 & 4). In H 0.9 condition the
mean fractal exponent decreased compared to self-paced condi-
tion. This might be due to individuals that produced anti-
persistent fluctuations: a candidate, albeit speculative, explanation
is that CV=1% did not suffice for these participants (as CV=0.5%
was not enough for some others in Experiment 1). Hence, at first
glance, participants could just have walked at their preferred speed
without any effective synchronization to the auditory stimuli
rendering this finding not necessarily indicative of adaptive
behavior (like in [16]). In fact, synchronization with a fractal
metronome (i.e. a largely unpredictable signal) appears quite
counterintuitive. However, mean asynchronies obtained in the
four fractal-pacing conditions in Experiment 1 and the four non-
isochronous pacing conditions in Experiment 2 were similar to
asynchronies obtained for isochronous pacing (< 240 ms, which
is in line with earlier reports, e.g., [11,27]), thus indicating effective
synchronization with slight anticipation. Importantly, the CV of
IBIs were below the mean asynchronies: the mean deviations were
about 6, 12, 18 and 23 ms for CV 0.5, CV 1, CV 1.5 and CV 2,
respectively. Consequently the negative mean asynchrony may
have occurred by chance because participants simply adjusted the
mean stride intervals to the mean beat intervals. If it was the case,
however, we should not have observed any difference in the
structure of stride intervals between isochronous and fractal
pacing. Our results clearly demonstrate that the presence of fractal
fluctuations in the metronome influenced the statistical signature
of stride intervals.
Recent findings [31] underscored that the locomotor system
cannot be ‘healthy’ by producing persistent fluctuations when self-
paced and – by the same token – ‘unhealthy’ by producing anti-
persistent fluctuations with isochronous cueing. Dingwell and co-
workers [31] suggested that the diminution of the fractal structure
in cueing conditions in elderly and in pathology might reflect an
increase in stride-to-stride gait control (‘cautious gait’). Our results
do not support this idea. We argue that participants controlled
their strides at least as much (and maybe even more) with
isochronous conditions as in non-isochronous conditions. In
particular in Experiment 1, the metronomes with coefficient of
variations of 2% were more variable so that we expected
participants to be more careful to not miss any beats (as they
were instructed to do so). Participants succeeded and asynchronies
were about 250 ms, similar to those in isochronous conditions.
However, ISIs were persistent (a= 0.85, see Table 1) and similar to
the self-paced conditions. That is, our results are not in favor of the
hypothesis that fractal exponents decrease with increased control.
We are aware that the results presented here are not sufficient to
discard this interesting hypothesis and further studies should
examine it in more detail. Simulations of stride intervals in non-
isochronous conditions may indeed help to unravel the control
mechanisms that are at work here. These numerical assessments
are beyond the scope of the present paper but will be reported
elsewhere.
Our results further provide evidence for a ubiquitous, strong
correlation between the individual ISIs exponents and those of the
corresponding IBIs series over the long-term region of the DFA
Figure 5. Mean coefficients of windowed (15-point window) cross-correlation functions (from lag210 to lag 10) between inter-beatintervals series and inter-stride intervals series, for the four fractal-metronome pacing conditions in Experiment 1. The black dashedline shows the significance threshold (r13 = 0.5139, p,.05).doi:10.1371/journal.pone.0091949.g005
Persistent Stride Intervals in Fractal Stimulation
PLOS ONE | www.plosone.org 7 March 2014 | Volume 9 | Issue 3 | e91949

plot (Figures 3 & 4). We consider this matching of fractal
exponents a hallmark of strong anticipation. Strong anticipation is
described as a global synchronization on a broad range of time
scales instead of local step-to-step corrections to achieve synchro-
nization [20–22]. We verified that the matching of the temporal
correlation structures occurred mainly on the long-term part of the
DFA plot: for the four fractal-pacing conditions of Experiment 1,
our results showed very high correlations between DFA exponents
of individual ISIs and IBIs series computed over the long-term
region, but no significant correlation between exponents computed
over the short-term region. Importantly, this correlation between
DFA exponents on the long-term region occurred in Experiment 2
only when the IBIs series contained fractal long-range correlations
(H 0.6 and H 0.9), but not in the case of anti-persistent correlations
(H 0.2) or random fluctuations (H 0.5).
To our knowledge, the distinction between short-term and long-
term regions of the diffusion plot represents an original method-
ological approach, which allows one to identify the relative
contributions of local short-term and global long-term fluctuations
to sensorimotor synchronization. To complement this analysis, we
used windowed cross-correlation analysis, which specifically
assesses the local co-variations of inter-stride and -beat intervals.
This analysis showed no significant cross-correlation at any lag
(from lag 210 to +10), nor in any of the four fractal-pacing
conditions in Experiments 1 and 2. Synchronization with a
variable stimulus has been described as ‘‘a mix of reaction,
proaction, and synchrony’’ ( [22], p. 5274). Recall that the
maximum (lag two) coefficient increased as the variance in the
inter-beat intervals increased, suggesting that too much variability
might involve more and more reactive processes. Taken together,
we may suggest that persistence of the long-range correlated gait
dynamics in fractal-pacing conditions mainly results from the
matching of the long-range correlation structure of stride intervals
performed onto the IBIs series presented.
Our interpretation strongly capitalizes on the estimated scaling
exponents a, which brings us to the study’s major weakness: the
brevity of pacing sequences profoundly limits the reliability of aestimates. DFA and related methods like the rescaled-range
analysis, power spectral density estimates, wavelet-based scaling
estimates, etc. all require a large number of samples, in particular
if the expected (or generated) scaling exponents are larger than
0.5. The persistent long-range correlations do not only camouflage
possible non-stationarities in the data but also cause a significant
spread of a estimates. For instance, in the case of H=0.9,
numerical simulations of fractal Gaussian noise with N=256
samples may yield standard deviations that can readily exceed
Da= 0.15. Although DFA appears to be the most reliable
approach to assess the presence of long-range correlations
[19,32] we realize that our results should be interpreted with
great caution although this lack of reliability is not necessarily
reflected in the group statistics. We note that these considerations
do not only apply to the estimates of a but also to those of ashort-term and along-term. That is, future studies should aim for
significantly longer pacing sequences, i.e. much longer walking
protocols (preferably N $600 strides, see [33]). Given the
plenitude of conditions in our experimental design, however, such
extended protocols were not deemed feasible for answering our
research questions.
Another limitation that should be mentioned is that the
participants in the present study walked on a treadmill, which is
known to be different from over-ground walking, putatively due to
differences in the perceptual information generated. In particular,
compared to over-ground walking, treadmill walking appears to be
characterized by a less correlated pattern in the stride intervals and
greater gait stability [25]. This could imply that the results of the
present study would have been even more pronounced over
ground; however, this remains speculation as long as a direct
empirical comparison remains absent. Hence, also in this regard,
the present results must be qualified.
In conclusion, the presence of long-range correlations in
auditory cues enabled participants to maintain their ‘normal’,
fractal gait pattern. This complexity matching of inter-stride
intervals structures seemed to rely on strong anticipation processes
with the attunement of ISIs and IBIs fractal exponents on the long-
term region of DFA diffusion plots (supported by the absence of
local cross-correlations). Our results may form a first step towards
a better understanding of the effect of (correlations in) auditory
cueing on gait. The present findings may open new opportunities
for optimizing cueing protocols in gait rehabilitation. In particular,
further investigations should verify a potential ‘‘carry-over’’ effect
of a fractal metronome to stride-time dynamics.
Supporting Information
Table S1 Means and standard deviations of the series of
asynchronies (standard deviations in italics) from all conditions
in Experiment 1 (upper panel) and Experiment 2 (lower panel).
(EPS)
Table S2 Means and standard deviations of the series of inter-
beat intervals (standard deviations in italics) from all conditions in
Experiment 1 (upper panel) and Experiment 2 (lower panel).
(EPS)
Audio S1 Audio examples of pacing signals (only 15 seconds).
File names corresponds to the conditions (for example :
Exp1_CV1 correspond to a fractal metronome used in Experi-
ment 1, in condition CV=1%).
(ZIP)
Data S1 Time series from Experiment 1 and Experiment 2 (.xls
files). Each sheet correspond to a particular condition for a
particular variable (for example : in the file « data_expe1_multi-
pleCV », the sheet ISI CV 1% corresponds to stride-time series of
participants in the condition CV=1% in Experiment 1). Each
column corresponds to an individual participant.
(ZIP)
Acknowledgments
The authors thank Melvyn Roerdink for technical assistance and
comments and Didier Delignieres for valuable discussions.
Author Contributions
Conceived and designed the experiments: VM PB AD. Performed the
experiments: VM. Analyzed the data: VM KT AD. Contributed reagents/
materials/analysis tools: VM AD. Wrote the paper: VM KT PB AD.
References
1. Hausdorff JM, Lertratanakul A, Cudkowicz ME, Peterson AL, Kaliton D, et al.
(2000) Dynamic markers of altered gait rhythm in amyotrophic lateral sclerosis.
J Appl Physiol 88: 2045–2053.
2. Hausdorff JM, Mitchell SL, Firtion R, Peng CK, Cudkowicz ME, et al. (1997)
Altered fractal dynamics of gait: Reduced stride-interval correlations with aging
and Huntington’s disease. J Appl Physiol 82: 262–269.
Persistent Stride Intervals in Fractal Stimulation
PLOS ONE | www.plosone.org 8 March 2014 | Volume 9 | Issue 3 | e91949
3. Vaillancourt DE, Newell KM (2002) Changing complexity in human behavior
and physiology through aging and disease. Neurobiol Aging 23: 1–11.4. Madison G (2001) Variability in isochronous tapping: Higher order dependen-
cies as a function of intertap interval. J Exp Psychol Human 27: 411–422.
5. Van Orden GC, Holden JC, Turvey MT (2003) Self-organization of cognitiveperformance. J Exp Psychol Gen 132: 331–350.
6. Werner G (2010) Fractals in the nervous system: conceptual implications fortheoretical neuroscience. Front Physio 1: 15. doi: 10.3389/fphys.2010.00015.
7. Barnes A, Bullmore ET, Suckling J (2009) Endogenous human brain dynamics
recover slowly following cognitive effort. PLoS ONE 4(8): e6626. doi:10.1371/journal.pone.0006626.
8. Goldberger AL (2006) Complex systems. Proc Am Thorac Soc 3: 467–472.9. Hausdorff JM (2007) Gait dynamics, fractals and falls: Finding meaning in the
stride-to-stride fluctuations of human walking. Hum Mov Sci 26: 555–589.10. Hausdorff JM, Purdon PL, Peng CK, Ladin Z, Wei JY, et al. (1996) Fractal
dynamics of human gait: stability of long-range correlations in stride interval
fluctuation. J Appl Physiol 80: 1448–1457.11. Terrier P, Deriaz O (2012) Persistent and anti-persistent pattern in stride-to-
stride variability of treadmill walking: influence of rhythmic auditory cueing.Hum Mov Sci 31(6): 1585–97.
12. Delignieres D, Torre K (2009) Fractal dynamics of human gait: a reassessment of
the 1996 data of Hausdorff et al. J Appl Physiol 106: 1272–1279.13. Hausdorff JM, Peng CK, Ladin Z, Wei JY, Goldberger AR (1995) Is walking a
random walk? Evidence for long-range correlations in stride interval of humangait. J Appl Physiol 78: 349–358.
14. McIntosh GC, Brown SH, Rice RR, Thaut MH (1997) Rhythmic auditory-motor facilitation of gait patterns in patients with Parkinson’s disease. J Neurol
Neurosur Ps 62: 22–26.
15. Lim I, van Wegen E, de Goede C, Deutekom M, Nieubower A, et al. (2005)Effects of external rhythmical cueing on gait in patients with Parkinson’s disease:
a systematic review. Clin Rehabil 19 (7): 695–713.16. Kaipust JP, McGrath D, Mukherjee M, Stergiou N (2012) Gait variability is
altered in older adults when listening to auditory stimuli with differing temporal
structures. Ann Biomed Eng 41(8): 1595–1603.17. Hove MJ, Suzuki K, Uchitomi H, Orimo S, Miyake Y (2012) Interactive
rhythmic auditory stimulation reinstates natural 1/f timing in gait of Parkinson’spatients. PLoS one 7(3): e32600.
18. Peng CK, Mietus J, Hausdorff JM, Havlin S, Stanley HE, et al. (1993) Long-range anti-correlations and non-Gaussian behavior of the heart-beat. Phys Rev
Lett 70: 1343–1346.
19. Delignieres D, Ramdani S, Lemoine L, Torre K, Fortes M, et al. (2006) Fractal
analysis for short time series: a reassessement of classical methods. J Math
Psychol 50: 525–544.
20. Marmelat V, Delignieres D (2012) Strong anticipation: complexity matching in
interpersonal coordination. Exp Brain Res 222: 137–148.
21. Stephen DG, Dixon J (2011) Strong anticipation: multifractal cascade dynamics
modulate scaling in synchronization behaviors. Chaos Solitons Fract 44: 160–
168.
22. Stephen DG, Stepp N, Dixon J, Turvey MT (2008) Strong anticipation:
sensitivity to long-range correlations in synchronization behavior. Physica A 387:
5271–5278.
23. Delignieres D, Marmelat V (2013) Strong anticipation and long-range cross-
correlation: Application of Detrended Cross-Correlation Analysis to human
behavioral data. Physica A 394: 47–60.
24. Roerdink M, Coolen H, Clairbois HE, Lamoth CJC, Beek PJ (2008) Online gait
event detection using a large force platform embedded in a treadmill. J Biomech
41: 2628–32.
25. Terrier P, Deriaz O (2011) Kinematic variability, fractal dynamics and local
dynamic stability of treadmill walking. J Neuroeng Rehab 8: 12, doi:10.1186/
1743-0003-8-12.
26. Terrier P, Turner V, Schutz Y (2005) GPS analysis of human locomotion:
Further evidence for long-range correlations in stride-to-stride fluctuations of
gait parameters. Hum Mov Sci 24(1): 97–115.
27. Repp BH (2005) Sensorimotor synchronization: a review of the tapping
literature. Psychon Bull Rev 12: 969–992.
28. Lipsitz LA, Goldberger AL (1992) Loss of ‘Complexity’ and ageing. J Am Med
Assoc 267: 1806–1809.
29. Goldberger AL, Amaral LAN, Hausdorff JM, Ivanov PC, Peng CK, et al. (2002)
Fractal dynamics in physiology: alterations with disease and aging. Proc Natl
Acad Sci USA 99: 2466–2472.
30. Ehrle N, Samson S (2005) Auditory discrimination of anisochrony: Influence of
the tempo and musical backgrounds of listeners. Brain Cognition 58: 133–147.
31. Dingwell JB, Cusumano JP (2010) Re-interpreting detrended fluctuation
analyses of stride-to-stride variability in human walking. Gait Posture 32: 348–
353.
32. Weron R (2002) Estimating long-range dependence: finite sample properties and
confidence intervals. Physica A 312: 285–299.
33. Damouras S, Chang MD, Seijdic E, Chau T (2010) An empirical examination of
detrended fluctuation analysis for gait data. Gait Posture 31: 336–340.
Persistent Stride Intervals in Fractal Stimulation
PLOS ONE | www.plosone.org 9 March 2014 | Volume 9 | Issue 3 | e91949