performance with purpose
TRANSCRIPT

PERFORMANCE WITH PURPOSE
2025AGENDA
SUSTAINABILITY REPORT 2016

About This Report 1A Letter from Indra Nooyi 3About PepsiCo 6Global Performance 8Perspectives from Dr. Mehmood Khan 10GRI Material Aspects 12PwP Performance Dashboard 14
PRODUCTS 20 PLANET 36 PEOPLE 54
Governance 70GRI Index 71
CONTENTS
At a typical barbecue, Brazilians enjoy grilled entrées, salad, Elma Chips — zero-added-salt potato chips that are often sprinkled on rice dishes — and refreshing beverages.
ON THE COVER:Quaker 3 Minutos, a whole-grain, oat-based product fortified with vitamins and minerals, is helping consumers in several countries across Latin America get the daily nutrition they need.
PEPSICO IS WORKING TO CREATE A HEALTHIER FUTURE FOR PEOPLE AND OUR PLANET.
OUR PERFORMANCE WITH PURPOSE 2025 AGENDA IS DESIGNED TO DELIVER NEEDED CHANGE ACROSS OUR COMPANY, VALUE CHAIN, INDUSTRY AND WORLD.
ABOUT THIS REPORTInaugural progress on our 2025 Agenda is reported in the following pages in the context of shared global challenges and coordinated industry action. We profile thought leaders and spotlight promising solutions around the world. We also high-light the primary United Nations Sustainable Development Goals to which our company’s efforts are intended to contribute.Detailed information on our governance, management, programs, progress and next steps on sustainability issues of importance to our stakeholders, as well as additional 2016 performance data, is conveniently cataloged in our new, interactive A–Z Topics on pepsico.com — replacing a separate Global Reporting Initiative report. This information is also summarized in our GRI Index on pages 71–76 of this report.

SUSTAINABILITYA LETTER FROM
INDRA NOOYI
As I sat down to write my letter for this year’s Sustainability Report, I began reflecting on the meaning of sustainability. It’s been used so often, and in so many contexts, that I wanted to start this year’s report by returning to first principles and defining what sustainability means to me — and all of us at PepsiCo.
The root of the word sustain is defined as “cause to continue for an extended period or without interruption.”
2 | 3 PepsiCo Sustainability Report 2016

WE ARE ALL IN. SUSTAINABILITY IS WHO WE ARE. IT’S WHAT FUELS OUR BUSINESS. AND IT’S WHY I BELIEVE PEPSICO’S BEST DAYS ARE YET TO COME.
SUSTAINABILITY IS A BYWORD FOR LEADERSHIP IN THE 21ST CENTURY.
That definition informs how I think about sustainability:
How can we keep ourselves, our planet and our communities healthy for an extended period of time?
How can we ensure we’re consuming the right foods and beverages, so that we thrive into our senior years?
How can we ensure we’re responsible stewards of our planet, so it will con-tinue to provide its bounty of resources for ourselves, our children and our grandchildren?
How can we ensure we’re growing in our careers, while also meeting our responsibilities as family members, friends and members of diverse commu-nities, so that the places we call home can continue to support generation after generation?
These are big questions, and I don’t claim to have any easy answers. But I believe corporations, large and small, have a significant role to play in addressing them.
From the goods and services we produce, to the energy and natural resources we use, to the lives and livelihoods we support, corporations have a big impact on our communities. And when we act responsibly, we can contribute to the sustainability of our way of life around the world.
we ultimately fall short, it won’t be for lack of research, or investment or collaboration. It won’t be for lack of heart. Because we are committed to sustainability.
We are all in. Sustainability is who we are. It’s what fuels our business. And it’s why I believe PepsiCo’s best days are yet to come.
Stakeholders — from investors, to non-governmental organizations (NGOs), to governments — are closely watching our progress to make sure we continue to lead, and in many cases, they’re helping us along the way. Ultimately, however, we’re taking the steps out-lined in these pages not simply because someone else wants us to take them, but because we know they’re the right thing to do for our business and the right thing to do for our world. We know that sustainability is a byword for leadership in the 21st century.
When we started on this journey in 2006, PepsiCo was among the first movers in our industry to embrace sustainability. Today, more and more businesses are joining us, lending their voices and acting more respon-sibly around the world. That’s good news. Together, we can align around a common vision and work together to achieve it, bringing our world closer to the definition of sustainability I cited earlier, and creating a virtuous cycle that can sustain our way of life, without interruption, over the next generation and beyond.
Sincerely,
INDRA K. NOOYICHAIRMAN AND CEO
When it comes to our Products, we’ll continue making great- tasting treats to be enjoyed in moderation as part of a balanced diet. At the same time, we need to continue finding new, innovative ways of offering more nutritious foods and beverages without compromis-ing taste.
When it comes to our Planet, we’ll need to continue investing in new solutions to curb emissions and cut water use — especially in areas like agriculture — while also taking steps to continue reducing packaging materials and waste without asking consum-ers and communities to sacrifice convenience.
When it comes to our People, we’ll need to continue enhancing the skills and diversity of our workforce even as we navigate a period of unprecedented change and disruption from new tech-nologies and trends like automation.
But I’m absolutely confident that we can deliver on the Performance with Purpose 2025 Agenda we announced last year. The goals we’ve set are not only ambitious and aspirational — they’re also achievable, so long as we’re willing to work for them. And we’re leveraging all of the know-how and tools at our disposal — from developing new packaging technologies, to applying the science behind behavioral economics to nudge consumers toward healthier options, to investing $100 million to help millions more women and girls enter the workforce ready to succeed.
The pages that follow are a report card on our progress over the past year. I’m proud of the strides we are making and the way we’re harnessing the power of our global scale to drive meaningful change across countries and conti-nents. And if there are any goals where
That belief in acting responsibly is what led all of us at PepsiCo to embark on our sustainability journey — what we call Performance with Purpose — more than 10 years ago. It’s what led us to reduce the added sugars, sodium and saturated fat — and dial up the nutrition — in many of our foods and beverages; curb our environmental footprint, saving more than $600 million between 2011 and 2015; and reinvest in our workforce, farmers and communi-ties, creating opportunities for people across the markets we serve.
Today, we’re more dedicated to Performance with Purpose than ever before. Because we know that while our financial results will always be a critical measure of our success, the way we’ll sustain our company, not only from year to year but decade to decade, is by offering our consumers the kinds of more nutritious choices they need to grow and thrive.
The way we’ll sustain our business and maintain our license to operate in today’s resource- strained world is by reducing and replenishing the water we use, while also cutting back on our energy use, carbon emissions, packag-ing and waste.
The way we’ll sustain a world-class workforce is by empowering all of our associates — no matter what they look like, where they come from or who they love — to build not only a career, but a life.
Of course, doing all of this won’t be easy. While we’ve achieved some good progress, much work lies ahead.
4 | 5 PepsiCo Sustainability Report 2016

PEPSICOPRODUCTS ARE
ENJOYED BY CONSUMERS >1 BILLION TIMES A DAY
REACH
>250,000
EMPLOYEESPEOPLE
PRODUCTS ARE SOLD IN >200 COUNTRIES AND TERRITORIES
AROUND THE WORLDSCALE
Wang Xuezheng works at our LEED®-certified Quaker facility in Beijing, China, supporting the introduction of new and nutritious oatmeal products for Chinese consumers.
Portfolio of 22 billion-dollar brands that generated more than $1 billion each in estimated annual retail sales in 2016• Spanning Beverages, Snacks and Nutrition
Performance with Purpose is PepsiCo’s vision to deliver top-tier financial performance over the long term by integrating sustainability into our business strategy.
6 | 7 PepsiCo Sustainability Report 2016

LIFEWTR, a premium water pH- balanced with electrolytes added for taste, features the work of emerging artists on its labels — including a series exclusively dedicated to women artists.
100
150
200
250
GLOBAL PERFORMANCE
NET REVENUES North America Beverages 34% Latin America 11% Asia, Middle East & North Africa 10% Quaker Foods North America 4% Europe Sub-Saharan Africa 16% Frito-Lay North America 25%
MIX OF NET REVENUES Food 52% Beverage 48%
MIX OF NET REVENUES U.S. 58% Outside U.S. 42%
Return on PepsiCo stock investment (including dividends) and the S&P 500CUMULATIVE TOTAL SHAREHOLDER RETURN*
IN U.S. DOLLARS 12/06 12/07 12/08 12/09 12/10 12/11 12/12 12/13 12/14 12/15 12/16 PEPSICO $100.00 $123.89 $91.72 $105.14 $116.32 $121.85 $129.64 $161.60 $189.49 $206.06 $222.13 S&P 500 $100.00 $105.49 $66.46 $84.05 $96.71 $98.75 $114.56 $151.66 $172.42 $174.81 $195.72
*$100 invested on 12/31/06 in stock or index, including reinvestment of dividends. Fiscal year ending December 31.Copyright© 2017 Standard & Poor’s, a division of S&P Global. All rights reserved.
Above charts reflect 2016 performance.
2016 FINANCIAL HIGHLIGHTS*
>$7 BILLION
CASH RETURNED TO SHAREHOLDERS
>$1BILLION
ANNUAL PRODUCTIVITY SAVINGS
$62.8 BILLION
NET REVENUES
* For additional information regarding our 2016 financial performance, please refer to our 2016 Annual Report on Form 10-K.
8 | 9 PepsiCo Sustainability Report 2016

PERSPECTIVES FROM DR. MEHMOOD KHAN
Across our own global operations, brands and network of business partners, PepsiCo is doing just that. We’ve set specific goals as part of our Performance with Purpose (PwP) 2025 Agenda to guide the continued transformation of our products to better meet changing nutri-tion needs; safeguard natural resources; and support prosperity around the world.
We’re using our global reach and deep expertise to accelerate progress in these areas — continually learning, implement-ing strategy and improving our approach through lessons learned, as is the nature of progress. Recognizing that systemic change will come only from action across value chains and collaboration across sectors to create and scale solutions, we convene partners and work to bring nascent technologies to larger markets.
This past year, I’ve been inspired to see PepsiCo increase our engagement with disruptive start-ups, cutting-edge academic institutions, innovative NGOs, competitors and governmental agencies around the world to address complex shared challenges — some of which are described in this report.
The global food system is at an inflection point. Intensifying, interrelated challenges — in public health and nutrition, climate change, resource scarcity, human rights and other areas — require us to act. The vast network of farmers, traders, processors, suppliers, manufacturers and retailers that feed our world must embrace change to create a healthier future for people and our planet.
NEEDED: SYSTEMIC CHANGE
The further expansion of our Sustainable Farming Initiative over the past year, for example, connects us with thou-sands more farmers and multi- sector partners. Together, we’re working to improve working conditions, protect the environment, and stimulate growth in agricultural communities — from the American Midwest to South Asia. Another example is our involvement in the New Plastics Economy initiative, led by the Ellen MacArthur Foundation, which challenges stakeholders to rethink and redesign packaging to get beyond incremental change. And through our own Nutrition Greenhouse project, PepsiCo is backing some of the world’s most exciting early-stage food and beverage innovators.
Are we moving fast enough? Frankly, not in all areas. But our trajectory is clear and our determination absolute. It is in this spirit that I am eager to continue working with PepsiCo’s team and our partners around the world to create a healthier future for us all.
DR. MEHMOOD KHANVice Chairman, PepsiCo; Executive Vice President, PepsiCo Chief Scientific Officer, Global Research and Development
SOURCING & AGRICULTURAL RAW
MATERIALS
MANUFACTURING & PACKAGING
MARKETING & SALES
DISTRIBUTION CUSTOMER, CONSUMER USE &
END OF PRODUCT LIFE
Hundreds of the Florida orange groves from which PepsiCo sources use state-of-the-art irrigation and high-tech tools to maximize yields and reduce environmental impact.
An expanding family of Tropicana beverages, including organic, probiotic and reduced- calorie options, make it easier for consumers to make nutritious choices.
Polyethylene terephthalate (PET) packaging, accepted by virtually all municipal recycling systems, is used for many of our Tropicana products.
At our Ft. Pierce, Fla. facility, harvested rainwater reduces municipal water use by ~11%, and ~20% of electricity comes from a carbon- neutral source. Also, here and at other sites, unused parts of oranges become feed for U.S. dairy farmers — resulting in zero food waste.
Shipping product by trains and sprinter vans, both more fuel efficient than traditional delivery trucks, significantly reduces carbon emissions.
The journey of Tropicana juice sourced in Florida, illustrated below, shows how we’re working to implement our 2025 Agenda at every stage of our value chain. Throughout the life cycles of thousands of our products, we work to increase nutrition, reduce environmental impact and enhance livelihoods.
CREATING SOLUTIONS ACROSS OUR VALUE CHAIN
10 | 11 PepsiCo Sustainability Report 2016

GRI MATERIAL ASPECTS*
PepsiCo has identified Material Aspects, defined by the Global Reporting Initiative (GRI) Sustainability Reporting Guidelines as those matters that are most important socially, environmentally and economically to both our external and internal stakeholders. Since our last formal assessment to identify GRI Material Aspects in 2013, we’ve retested them in subsequent years with internal and external stakeholders.
INNOVATING MORE NUTRITIOUS OPTIONS
RESPONSIBLE MARKETING OF OUR PRODUCTS
QUALITY & FOOD SAFETY
WATER
CLIMATE CHANGE
AGRICULTURE
PACKAGING & WASTE
HUMAN RIGHTS
DIVERSITY & ENGAGEMENT
WORKPLACE SAFETY
TALENT ATTRACTION, ENGAGEMENT & GROWTH
CORPORATE GOVERNANCE, RISK MANAGEMENT & COMPLIANCE
FINANCIAL PERFORMANCE & ORGANIZATIONAL PROFILE
PUBLIC POLICY ENGAGEMENT
STAKEHOLDER ENGAGEMENT
COMMUNITY INVESTMENT & PHILANTHROPY
SOURCING & AGRICULTURAL RAW
MATERIALS
PROD
UCTS
PLAN
ETPE
OPLE
COM
PANY
&
GOVE
RNAN
CE
MANUFACTURING & PACKAGING
MARKETING & SALES
DISTRIBUTION CUSTOMER, CONSUMER USE &
END OF PRODUCT LIFE
GRI MATERIAL ASPECTS
VALUE CHAIN
In 2016, while developing our PwP 2025 goals, we reviewed our Material Aspects in the context of PepsiCo’s priorities. Members of our manage-ment team met with a significant number of stakeholders throughout this process to reconfirm that those aspects and matters align with our corporate priorities, support our PwP 2025 Agenda and reinforce the integration of sus-tainability throughout our business.
Our Material Aspects represent the issues that we plan to continue managing, measuring and reporting on. This report focuses on those Material Aspects that align with our PwP goals. Reporting on the remaining Material Aspects, such as the Responsible Marketing of Our Products or Quality & Food Safety, can be found in our new A–Z Topics on pepsico.com. PepsiCo is committed to addressing every Material Aspect we’ve identified, and our reporting efforts are in accordance with the GRI G4 Core Guidelines. Our GRI Index can be found on pages 71–76 of this report.
Year-round engagement with diverse stakeholders informs our sustainability reporting and overarching sustainability strategy, and we intend to complete a formal materiality assessment with external and internal stakeholders by the end of 2017. We believe this process will help us continue to learn about emerging sustainability topics, better inform our efforts and help PepsiCo work to create value for society.
* In this report and in our other sustainability communications and statements, when we use the terms “material,” “materiality” and similar terms, we are using such terms to refer to topics that reflect PepsiCo’s significant economic, environmental and social impacts or to topics that substantially influence the assessments and decisions of stakeholders in what the GRI Sustainability Reporting Guidelines define as “Material Aspects.” We are not using these terms as they have been defined by or construed in accordance with the securities laws or any other laws of the U.S. or any other jurisdiction, or as these terms are used in the context of financial statements and financial reporting, and nothing in this report or other sustainability communications and statements should be construed to indicate otherwise.
12 | 13 PepsiCo Sustainability Report 2016

PwP PERFORMANCE DASHBOARD
An on-the-go Brazilian mom packs school lunches, including Kero Coco Kids and Fandangos made with whole grain corn flour, which are within the nutrient limits of our PwP Products goals.
FOCUS AREA GOAL2015 BASELINE
2016 STATUS
2025 TARGET COMMENTARY
Added Sugars At least 2/3 of our global beverage portfolio volume will have 100 Calories or fewer from added sugars per 12-oz. serving
39% 40% 67% Reported numbers represent Top 10 PepsiCo Beverage markets (63% of global bever-age volume by close of 2016); target and execution set up at global level.
Sodium At least 3/4 of our global foods portfolio volume will not exceed 1.3 milligrams of sodium per Calorie
51% 55% 75% Reported numbers represent Top 10 PepsiCo Foods markets (79% of global food volume by close of 2016); target and exe-cution set up at global level.
Saturated Fat At least 3/4 of our global foods portfolio volume will not exceed 1.1 grams of saturated fat per 100 Calories
64% 66% 75% Reported numbers represent Top 10 PepsiCo Foods markets (79% of global food volume by close of 2016); target and exe-cution set up at global level.
Positive Nutrition Increase positive nutrition — like whole grains, fruits & vegetables, dairy, protein and hydration — by expanding our portfolio containing one or more of these ingredients
26.6% 27.0% >26.6% Metric measures products classified as Everyday Nutrition portfolio as % of total PepsiCo net revenue.
Rate of sales growth of what we refer to as our Everyday Nutrition products will outpace the rate of sales growth in the balance of our product portfolio
N/A Everyday Nutrition sales growth outpaced balance of portfolio by 2 percentage points in 2016.
Each year, rate of Everyday Nutrition sales growth out-paces rate of sales growth of rest of portfolio.
Execution in progress.
Provide access to at least 3 billion servings of nutritious foods and beverages to underserved consumers and communities, through a variety of channels, and through programs supported by the PepsiCo Foundation
0 266 million 3 billion Metric counts servings beginning in 2016, including affordable nutrition business in Mexico and Food for Good; calculation methodology for affordable nutrition business in Sub-Saharan Africa and for PepsiCo Foundation in progress.
Performance on our 2025 Agenda has been gathered into one easy-to-view dashboard this year. Performance status is presented here in context — alongside where we’ve started (our baselines) and where we’re headed (our targets). Key performance details are provided in the far-right column.
N/A = not available14 | 15 PepsiCo Sustainability Report 2016

FOCUS AREA GOAL2015 BASELINE
2016 STATUS
2025 TARGET COMMENTARY
Water Improve the water-use efficiency of our direct agricultural supply chain by 15% in high-water-risk sourcing areas
N/A N/A 15% Baseline validation in progress; high-water-risk locations defined by WRI’s Aqueduct tool.
Build on the 25% improvement in water-use efficiency achieved to date with an additional 25% improvement by 2025, with a focus on manufacturing operations in high- water-risk areas
0% 1% 25% Execution in progress.
Maximize water reuse in high-water-risk areas and strive to have 100% of wastewater from our operations meet PepsiCo’s high standards for protection of the environment
N/A 90% (Baseline)
100% 2016 baseline year; where wastewater discharges not metered, 2016 baseline volume estimated based on production and process data.
Work to provide appropriate access to safe water, sanitation and hygiene (WASH) for 100% of our own manufacturing employees
N/A 80% (Baseline)
100% 2016 performance reflects compliance with Tier 1 WASH criteria (see definition in Water section of A–Z Topics on pepsico.com).
Replenish 100% of the water we consume in manufacturing operations located in high-water-risk areas, and ensure that such replenishment takes place in the same watershed where the extraction has occurred
Each year, progress will be measured vs. volume of con-sumed water in previous year.
26% 100% Replenishment benefits claimed for local activities are capped at 100% to prevent overachieving projects from inflating global progress mea-surement. Have over-delivered replenishment targets in India and Jordan.
Advocate for strong water governance in communities and watersheds where we operate, promoting water solutions that meet local needs
Qualitative Goal Initiating and supporting col-laborative efforts; establishing local partnerships.
Initiate and support collaborative efforts with other stake-holders to address water risk and mitigate water insecurity
Qualitative Goal Initiating and supporting col-laborative efforts; establishing local partnerships.
With the PepsiCo Foundation and its partners, work to provide access to safe water to a total of 25 million people since 2006 in the world’s most at-water-risk areas, with a focus on communities near where PepsiCo works
9 million (cumulative since 2006)
11 million (cumulative 2006–2016)
25 million Execution in progress.
Climate Reduce absolute greenhouse gas (GHG) emissions by at least 20% by 2030 (Scope 1 & 2 performance)
Reduce absolute greenhouse gas (GHG) emissions by at least 20% by 2030 (Scope 3 performance)
0 0.7%
1%
20% (2030)
Execution in progress; prog-ress prior to 2015 focused on energy efficiency in legacy operations.
FOCUS AREA GOAL2015 BASELINE
2016 STATUS
2025 TARGET COMMENTARY
Waste Strive to design 100% of our packaging to be recoverable or recyclable
N/A N/A 100% Baseline validation and execution in progress.
Partner to increase packaging recycling and recovery rates Qualitative Goal Partnerships established and further opportunities being explored.
Strive to achieve zero waste to landfill across all of our direct operations through efficient and responsible waste management
8% 7% <1% Baseline reflects full scope of PepsiCo operations as of 2015; past reported measurements reflected performance against legacy operations with 2006 baseline.
Work to reduce the food waste we generate in our direct operations by 50%
N/A N/A 50% Baseline validation and execution in progress.
Sustainable Sourcing
Through PepsiCo’s Sustainable Farming Initiative (SFI), sustain-ably source our direct agricultural raw materials by 2020:
% of volume engaged through SFI
22% 34% 100% (2020)
Focus on positive impact within social and environmental dimensions while striving to meet goal; target references in-scope volume.
Through PepsiCo’s SFI, sustainably source our direct agricultural raw materials by 2020:
% of volume sustainably sourced and verified by a third party
0% 0% 100% (2020)
Seek to sustainably source our non- direct major agricultural raw material ingredients by 2025
TBD TBD TBD Focus on positive impact within social and environmental dimensions. Metrics in development.
Sustainably source 100% of our palm oil by 2020 8% 16% 100% (2020)
Progress based on procure-ment of certified sustainable palm oil using RSPO standard. Work through 2016 focused on developing partnerships across value chain; execution to begin scaling in 2017.
Sustainably source 100% of our cane sugar by 2020 0% 0% 100% (2020)
Progress based on procure-ment of certified cane sugar using Bonsucro standard. Work through 2016 focused on developing partnerships across value chain; execution to begin scaling in 2017.
16 | 17 PepsiCo Sustainability Report 2016

A breakeven business within PepsiCo, Food for Good creates delicious pre- packed meals that meet United States Department of Agriculture (USDA) nutrition standards — enjoyed here by students in Texas, where the program began. Using PepsiCo’s logistical and nutrition expertise, we intend to expand Food for Good to reach more underserved communities and help families get the nutrition they need.
>50 MILLIONnutritious servings as of 2016U.S. cities to date: 18Partners include: USDA, Share Our Strength and Feeding America
FOOD FOR GOOD
FOCUS AREA GOAL2015 BASELINE
2016 STATUS
2025 TARGET COMMENTARY
Human Rights Continue to advance respect for human rights in our operations
Goal progress will be measured through qualitative and quantitative metrics that are being developed. Please see the Human Rights section in A–Z Topics on pepsico.com for further information about our approach to human rights.
Programs and initiatives identified.
Continue to advance respect for human rights with third-party suppliers
Goal progress will be measured through qualitative and quantitative metrics that are being developed. Please see the Human Rights section in A–Z Topics on pepsico.com for further information about our approach to human rights.
Programs and initiatives identified.
Extend the principles of our Supplier Code of Conduct (SCoC) to all franchisees and joint venture partners
Goal progress will be measured through qualitative and quantitative metrics that are being developed. Please see the Human Rights section in A–Z Topics on pepsico.com for further information about our approach to human rights.
Programs and initiatives being explored.
Expand SFI across 7 million acres to increase responsible agricultural practices, improve crop yields and growers’ livelihoods, and advance respect for workers’ fundamental human rights
N/A N/A 7 million Baseline validation in progress.
Diversity Strive to achieve gender parity in our management roles 37% 38% 50% Execution in progress.
Strive to achieve pay equity for women N/A U.S. — women paid within 1% of men, based on base compensation.
100% U.S. baseline validated; extend-ing pay equity review process to 62% of global employees by end of 2017.
Prosperity Benefit at least 12.5 million women and girls around the world in communities near where we work
0 6 million 12.5 million In 2016, 6 million women and girls benefited from invest-ments made prior to 2016 in safe water access and Diplomas Now educational programs. 12.5 million target includes goal of enabling 1.5 million young women to progress through school and succeed in the workforce.
Invest $100 million to support initiatives to benefit at least 12.5 million women and girls in communities near where we work
$0 $0 $100 million First projects launch in 2017.
18 | 19 PepsiCo Sustainability Report 2016

PRODUCTSRisks to human health from obesity, and noncommunicable diseases such as diabetes and cardiovascular illnesses, are rising. Contributing factors may include the nutritional profiles of some food products, high caloric intake, genetics, sedentary lifestyles, limited access to more nutritious options, urbanization and aging populations. At the same time, too many people suffer from some form of undernutrition.
UN Sustainable Development Goals 2 and 3 highlight the need to improve the global diet, increase food security and reduce disease.
20 | 21 PepsiCo Sustainability Report 2016

Systemic change takes leaders and experts who understand the trends shaping the world. Industry has the scale and technical know-how to lead, but leadership also means embracing disruptive changes in how business is done.
WANTED:GAME CHANGERS
50% rise in obesity, 1980–20142
1 in 9 persons suffers from chronic undernourishment3
~33% of food produced for human consumption is lost or wasted each year4
~31% estimated population growth by 20501
“ We can only achieve a healthy world through healthy, accessible food if every sector commits to and takes the responsible actions. Business must be recognized as part of the solution.”
Linda Fried Dean of the Columbia University Mailman School of Public Health and public health leader
Photo: Studiosmith/Leslye Smith22 | 23 PepsiCo Sustainability Report 2016

• Improve on-farm storage and optimize harvests
• Manage supply chain efficacy, including through refrigerated transportation
• Raise consumer awareness• Improve use-by labeling
• Apply nutrition science and taste expertise to create more nutritious product options
• Leverage technological advances, seasonings and ingredients to enhance products’ nutritional profiles
INCREASING ACCESS
MAKING HEALTHIER PRODUCTS
REDUCING FOOD WASTE
• Make nutritious options more affordable
• Leverage distribution expertise to increase access to nutrition, including in food deserts and in rural farming communities
• Advertise and promote more nutritious options
INDUSTRY MUST LEAP
FORWARD
Advances in agriculture, manufacturing and science revolutionized food production in the mid-20th century. More people gained access to safe and nutritious food. And the social contract between industry and consumers was simple: products were safe, affordable, easy to access and great- tasting.The social contract has changed. While consumers still want great-tasting foods and drinks, they now demand much more from the products they purchase.
Partnership for a Healthier America (PHA) works with the private sector to help build healthier futures for children. PHA will independently verify and report on PepsiCo’s U.S. progress against our public commitment to reduce added sugars, sodium and saturated fat in our product portfolio.
“ PepsiCo’s efforts to create more, healthier options for Americans, as well as proactive actions and innovations that promote healthier lifestyles, can influence positive change here and around the world.”
— Nancy Roman, President and CEO, Partnership for a Healthier America
As always, clear nutritional labeling, responsible marketing practices and high standards for food quality and safety remain fundamental to industry action. Information on PepsiCo’s work in these areas can be found in A–Z Topics on pepsico.com.
24 | 25 PepsiCo Sustainability Report 2016
FIRM LIMITSSETTING
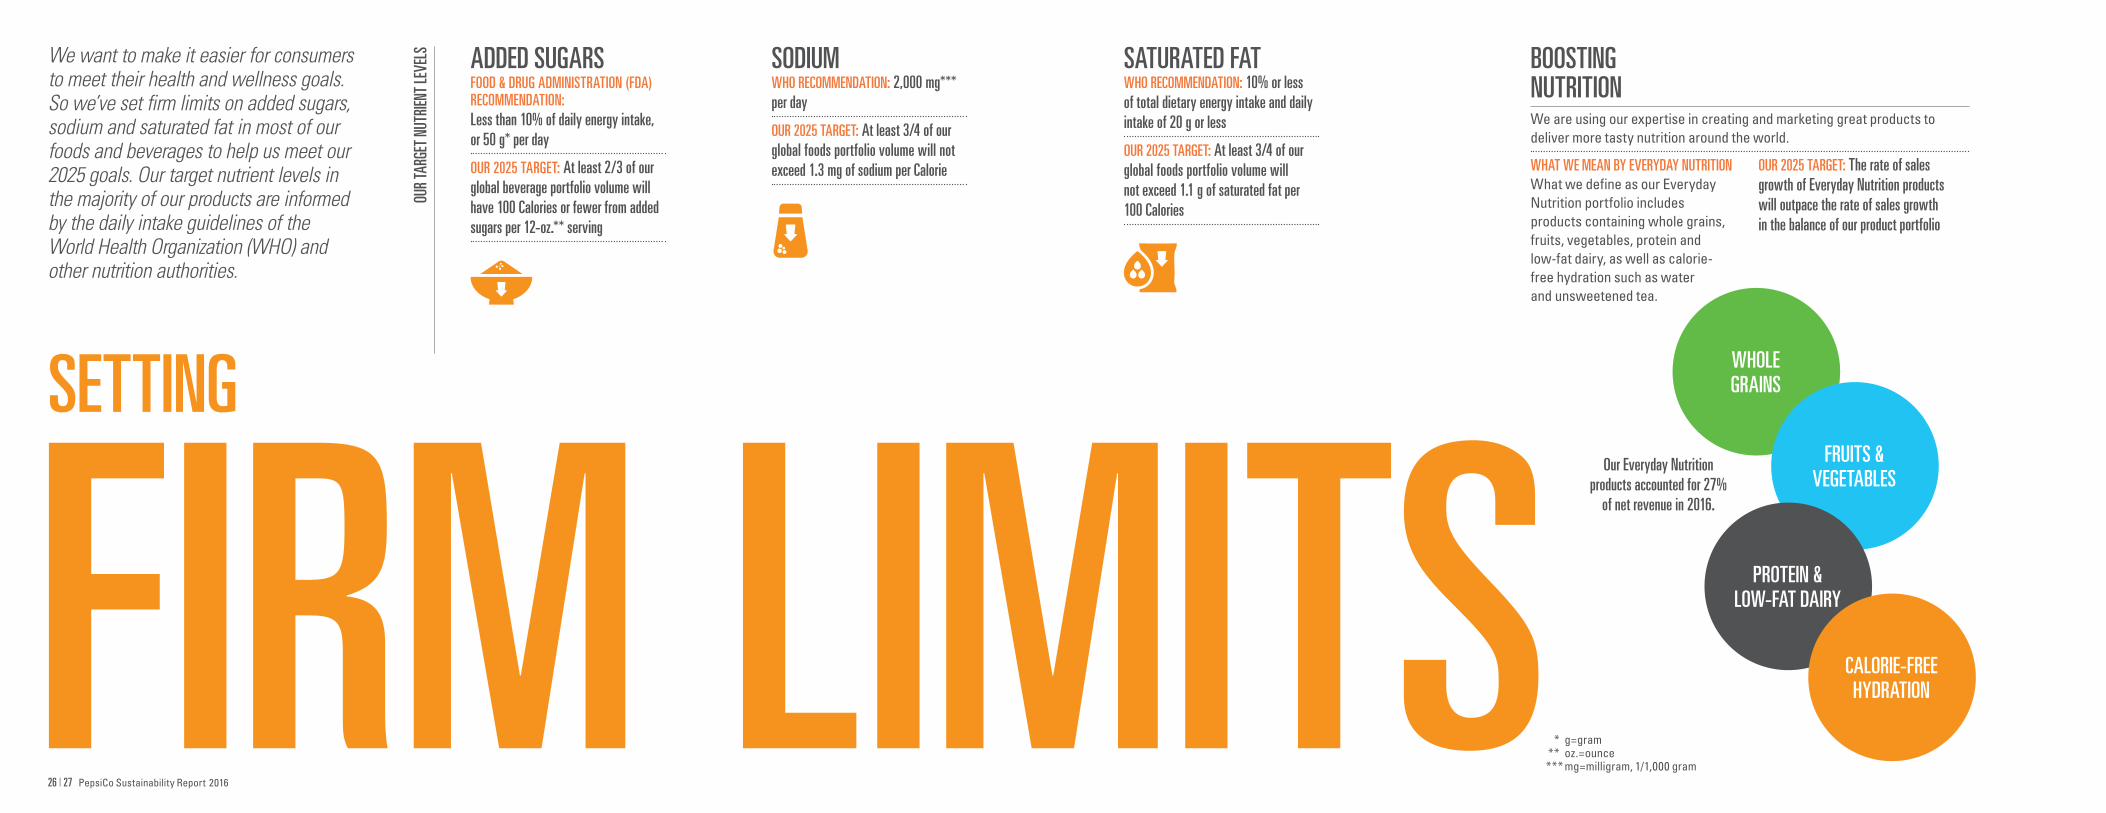
We want to make it easier for consumers to meet their health and wellness goals. So we’ve set firm limits on added sugars, sodium and saturated fat in most of our foods and beverages to help us meet our 2025 goals. Our target nutrient levels in the majority of our products are informed by the daily intake guidelines of the World Health Organization (WHO) and other nutrition authorities.
ADDED SUGARSFOOD & DRUG ADMINISTRATION (FDA) RECOMMENDATION:Less than 10% of daily energy intake, or 50 g* per day
OUR 2025 TARGET: At least 2/3 of our global beverage portfolio volume will have 100 Calories or fewer from added sugars per 12-oz.** serving
SODIUMWHO RECOMMENDATION: 2,000 mg*** per day
OUR 2025 TARGET: At least 3/4 of our global foods portfolio volume will not exceed 1.3 mg of sodium per Calorie
SATURATED FATWHO RECOMMENDATION: 10% or less of total dietary energy intake and daily intake of 20 g or less
OUR 2025 TARGET: At least 3/4 of our global foods portfolio volume will not exceed 1.1 g of saturated fat per 100 Calories
OUR
TARG
ET N
UTRIE
NT LE
VELS BOOSTING
NUTRITIONWe are using our expertise in creating and marketing great products to deliver more tasty nutrition around the world.
WHAT WE MEAN BY EVERYDAY NUTRITION What we define as our Everyday Nutrition portfolio includes products containing whole grains, fruits, vegetables, protein and low-fat dairy, as well as calorie-free hydration such as water and unsweetened tea.
OUR 2025 TARGET: The rate of sales growth of Everyday Nutrition products will outpace the rate of sales growth in the balance of our product portfolio
WHOLE GRAINS
FRUITS & VEGETABLES
PROTEIN & LOW-FAT DAIRY
CALORIE-FREE HYDRATION
Our Everyday Nutrition products accounted for 27%
of net revenue in 2016.
* g=gram ** oz.=ounce *** mg=milligram, 1/1,000 gram
26 | 27 PepsiCo Sustainability Report 2016

INNOVATING PRODUCTS IN BRAZIL
Dietary preferences are evolving in Brazil, trending toward more nutritious options as the lifestyles of its growing population change. PepsiCo continues to transform our portfolio to provide more of what Brazilian consumers want today. Our investments in Brazil exemplify how we’re adapting to serve changing local markets around the globe.
PERFECT SWEETNESS
Population: 211 million (2017 est.)5
Ongoing economic recession — est. 2016 GDP growth rate: −3.6%6
Unemployment (May 2017): 13.3%7
World’s 5th largest market for healthy foods & beverages8
Made from locally harvested green coconuts, our Kero Coco coconut water contains only 40 Calories per serving. And our new Kero Coco Kids line offers small portions and no added sugars.
SPOTLIGHT ON BRAZIL
INVESTING TO DELIGHT TODAY’S CONSUMERSWe’re adding to our growing portfolio of more nutritious foods and beverages for Brazilian consumers, with products such
as those featured below. With the opening of our Brazil Research & Development Center in 2017, we’ll continue to expand our offerings, while also providing employment and partnering with local growers to source ingredients native to South America.
Quaker Fruit+Oats bars
• Made with oats and 100% real fruit
• No added sugars, zero trans fat
• Source of fiber and vitamin C
• <60 Calories per serving
Toddynho ready- to-drink chocolate milk for kids
• Now with 25% fewer added sugars
Drinkfinity• Customizable
hydration system• Pods that contain dry
and liquid ingredients pop into the top of a reusable vessel and are mixed with water
Elma Chips with zero added salt
• Shoestring- shaped potato chips
• Meets our reduced sodium level
eQlibri crackers
• An average of 30% less sodium
• New tapioca and chia seed varieties
Fandangos made with whole grain corn flour
• Meets our reduced sodium and satu-rated fat levels
28 | 29 PepsiCo Sustainability Report 2016

QUENCHING THIRST, REDUCING ADDED SUGARSWe continue to make progress on reducing added sugars — by reformulating many of our existing carbonated soft drinks and creating delicious new choices with fewer added sugars. We’re also adding to our lineup of low- and zero- calorie teas, coffees and waters.
ZERO CALORIES
During the National Football League’s Super Bowl LI Halftime Show (pictured here), the most- watched musical event of all time across all platforms, we proudly promoted zero calories.
The Halftime Show marked PepsiCo’s fifth year of sponsorship and our first featuring a zero- calorie product — Pepsi Zero Sugar. And we also debuted LIFEWTR in an ad during the game.
We were making a statement: we’re focused on the continued transformation of our beverage portfolio, and we’re putting the full force of our marketing muscle behind zero- and low- calorie products.
Pepsi Zero Sugar has seen double- digit growth, year-to-date, since taking center stage. Touchdown.
MARKETING
ADDED SUGARS PERFORMANCE
ALL THE FIZZ, FEWER CALSOUR NEWEST REDUCED- CALORIE* CARBONATED SOFT DRINKS:
Pepsi with maximum taste and zero sugar• Enjoyed across 30 global markets
7UP and Mirinda• Recipes with 30% fewer added sugars,
rolling out to >80 markets around the world and replacing the full-sugar versions
Mtn Dew Spiked Lemonade• 100 Calories in the U.S.
OUR BRAND-NEW DRINKS WITH FEWER CALORIES*:
Lemon Lemon• 70 Calories, already available in the
U.S., Canada and Western Europe, with aspirations for global distribution
IZZE Fusions• 60 Calories in the U.S., with similar
plans for expanding into global markets
*Per 12-oz. serving.
LOW OR ZERO CALSOUR LATEST TEAS, COFFEES, WATER AND MORE — WITH PLANS TO INTRODUCE IN ADDITIONAL MARKETS:
• Unsweetened Pure Leaf Iced Teas in the U.S.• Starbucks Black Iced Coffee Unsweetened
in the U.S.• Starbucks Cold Brew Black Unsweetened
in the U.S.• KeVita, a fermented probiotic and
kombucha beverage, in the U.S.• LIFEWTR, a premium water, in the U.S.
and CanadaProjected retail sales for LIFEWTR, launched in early 2017, are already $200 million on an annualized basis.
30 | 31 PepsiCo Sustainability Report 2016

To reduce sodium, we’re creating new recipes and ways to season foods using seasonings and ingredients from around the world. We’re also using smaller salt particles to enhance taste while reducing a product’s overall sodium level.
LESS SODIUM
LESS SATURATED FAT
We continue to seek new ways to cook with oils that are lower in saturated fat, such as sunflower and canola oils. PepsiCo is working with others to help build the supply of high oleic sunflower oil, or HOSO, for example, which currently doesn’t meet market demand.
Notable recent reductions include:
• Our Cheetos brand in Mexico, with 65% less saturated fat after switching to a blend of canola and palm oils in 2016 and early 2017
• Bluebird Thinly Cut Potato Chips in New Zealand, with 75% less saturated fat compared with chips cooked in 100% palm oil
• Classic Lay’s Potato Chips in Canada, Turkey and the U.S., with less than 0.7 g of saturated fat per 100 Calories
Our newest reductions include:
• Smartfood Delight Sea Salt Popcorn in the U.S., with 0.8 mg sodium per Calorie
• Oven Baked Lay’s BBQ product in the U.S., with less sodium through the use of alternative seasonings
• Artesanas Potato Chips in the Iberia region, with 17.5% less sodium
• Classic (Salted) Lay’s Potato Chips in Brazil, Canada, China, India, Russia, Saudi Arabia, Turkey, the U.K. (Walkers brand) and the U.S., with less than 1.3 mg of sodium per Calorie
SERVING UP FLAVOR, REDUCING SODIUM & SATURATED FATWe’re exploring ways to further reduce sodium and saturated fat while still delivering snacks that consumers savor around the world.
SODIUM AND SATURATED FAT PERFORMANCE
NEW RECIPES
NEW WAYS TO COOK
32 | 33 PepsiCo Sustainability Report 2016

POSITIVE NUTRITION PERFORMANCE
ACTION• PepsiCo’s first collaborative incubator
program: Nutrition Greenhouse– Offers €25,000 grants and 6 months
of partnering– Selected companies are working
with PepsiCo’s functional and brand experts to accelerate the growth of their businesses
PROGRESS• 8 emerging nutrition, health and
wellness brands selected to participate– One will receive an additional
€100,000 at the end of the program
ACTION• PepsiCo participates in Consumer
Goods Forum’s (CGF’s) Collaboration for Healthier Lives– Multi- manufacturer, multi- retailer
health and wellness pilots– Aim to incentivize shoppers to make
healthier choices and drive growth in nutrition categories by leveraging grocery and drug stores as hubs for community health and wellness
PROGRESS• Launched pilot in collaboration with
local public health initiative, Healthy Washington County (Md.)– Developing in-store activities for
shoppers that combine healthier products with recipes, offers and education
Hagerstown, MarylandEurope India and the Philippines
ACTION• Created Quaker Oats+Milk in India
with PepsiCo’s patented SoluOats technology– Provides the nutrition of oats in a
smooth and drinkable beverage– Designed to address nutrient deficits
in local markets around world
PROGRESS• One serving of Quaker Oats+Milk
provides:– 10% of the recommended daily fiber
requirement– 15% of the recommended
daily calcium requirement (for average person)
• More markets to come
SHARING EXPERTISE
EVERY YEAR, ABOUT A MILLION CHILDREN contract tuberculosis (TB), a highly infectious bacterial disease that primarily affects the lungs. Some 200,000 do not survive because they reject the extremely bitter- tasting medicine over long-term treatments. Working with TB Alliance, a nonprofit that’s developing better TB drugs, PepsiCo’s Research and Development team has applied its taste expertise to block the bitterness of certain types of pediatric TB medicines.
Photo: John-Michael Maas for TB Alliance
INCREASING NUTRITIOUS OPTIONSWe are growing our portfolio of nutritious products to meet rising consumer demand for them. By incentivizing shoppers to make healthier choices, partnering with emerging nutrition brands and developing products that meet specific dietary needs, we are striving to become a leader in Everyday Nutrition.
As part of our Positive Nutrition goal, we aim to provide access to 3 billion servings of nutritious foods and beverages to underserved communities and consum-ers by 2025. Providing affordable choices such as Quaker 3 Minutos, featured on the covers of this report, is helping us tackle one of the main barriers to access: price.
We’ve consulted with experts in behavioral science to learn how to better market nutritious products — to encourage purchases that contribute to a balanced diet without restricting anyone’s choices. Expanding our line of nutritious products will also help us to contribute to global public health efforts.
Please see A–Z Topics on pepsico.com for more information.
NUDGING CONSUMERS
34 | 35 PepsiCo Sustainability Report 2016

PLANETFreshwater is limited. The climate is changing due largely to greenhouse gas emissions. Waste is polluting land and sea. And in many regions, current agricultural practices are not sustainable.
United Nations Sustainable Development Goals 6, 12 and 13 illustrate the interrelated challenges of water insecurity, global warming, excess waste and unsustainable food production.
36 | 37 PepsiCo Sustainability Report 2016
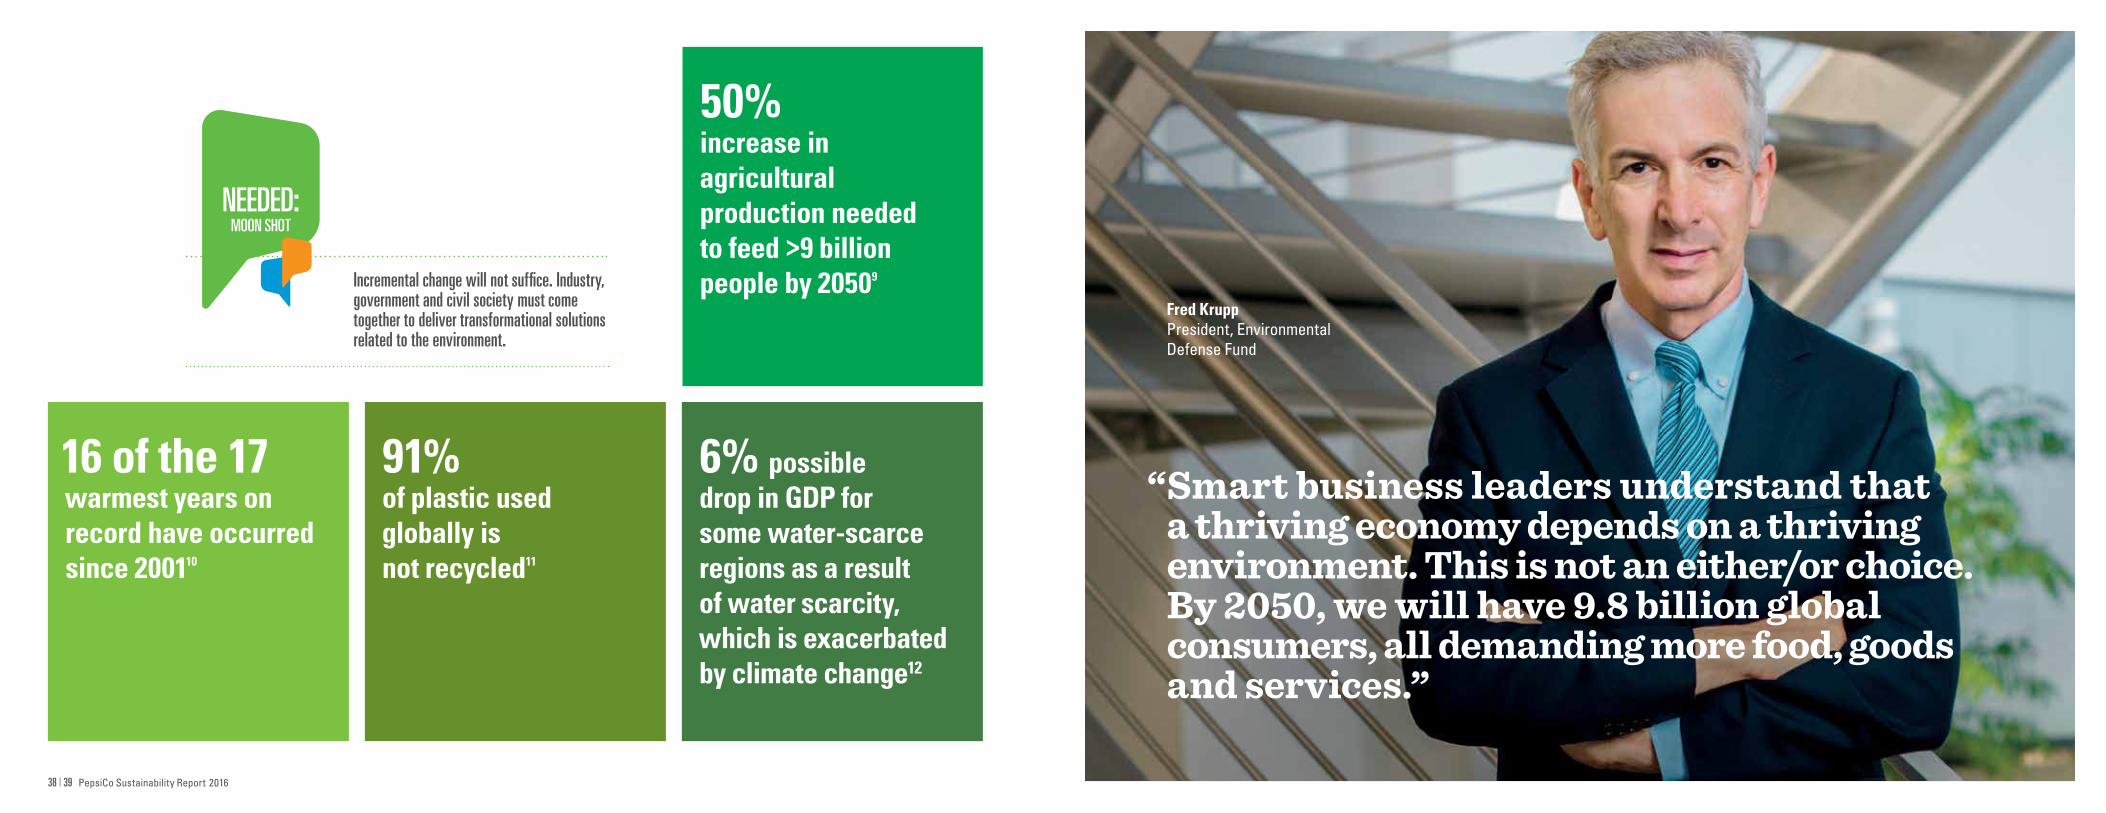
Incremental change will not suffice. Industry, government and civil society must come together to deliver transformational solutions related to the environment.
NEEDED:MOON SHOT
16 of the 17warmest years on record have occurred since 200110
91%of plastic used globally is not recycled11
6% possibledrop in GDP for some water- scarce regions as a result of water scarcity, which is exacerbated by climate change12
50%increase in agricultural production needed to feed >9 billion people by 20509
“ Smart business leaders understand that a thriving economy depends on a thriving environment. This is not an either/or choice. By 2050, we will have 9.8 billion global consumers, all demanding more food, goods and services.”
Fred KruppPresident, Environmental Defense Fund
38 | 39 PepsiCo Sustainability Report 2016

EMERGENCY
A SHARED WATER
The global supply of freshwater — the basis for human life and development — is limited. And it’s being depleted. Contributing factors include rising global temperatures and current levels of freshwater withdrawal, especially for agriculture.
Source: World Resources Institute, WRI Aqueduct 2014
Overall Water Risk• Low risk• Low to medium risk• Medium to high risk• High risk• Extremely high risk• No data
“As water challenges increase around the globe,
it’s critical for businesses to prioritize the sustainable
use and security of precious water resources. Water is a
local issue, and will impact each geography in distinct ways.”
Betsy Otto Global Water Program Director,
World Resources Institute
40 | 41 PepsiCo Sustainability Report 2016

MUSTLEAD
INDUSTRY
The private sector is the biggest consumer of freshwater globally, with agriculture and industry using the greatest amount. Companies operating at the intersection of food and water, such as PepsiCo, can mobilize their resources and leverage their scale to help protect this precious resource and help make it more accessible.
Contributing to SDGs 6 and 12 will mean implementing solutions at scale and collaborating within and across sectors to deliver solutions that last.
• Minimizing use and maximizing reuse
• Returning water locally
• Using on-farm conservation tools, including efficient irrigation
• Returning water locally• Influencing supply chains
IMPACTFUL SOLUTIONS
• Creating smart public policies and regulations
• Enhancing and repairing infrastructure
• Using digital management tools
• Engaging the public
12%Municipal
19%Industrial
69%Agricultural
GLOBAL WATER USE13
At our Sabritas Center for Agricultural Development in Toluca, Mexico (pictured here), workers harvest mini- tubers, the first generation of
potato seeds, in a hydroponic greenhouse. Find out more on page 50.
“ Collaboration across sectors is necessary to achieve a sustainable water future. With increas-ing stress on this valuable resource, protecting water and the land around our watersheds has never been more important. The Nature Conservancy’s work with PepsiCo aims to do just that — demonstrating that investing in nature is not only economically viable, but critical to addressing the food and water needs of our growing global community.”
Mark Tercek President and CEO, The Nature Conservancy
Innovative water solutions and promising technologies need to be scaled up. Companies that rely on agriculture must work with more of their growers to implement relevant solutions across a range of geographies.
WANTED:AGRO- AMBASSADORS
Photo: David Lauridsen
42 | 43 PepsiCo Sustainability Report 2016

HOW WE MEASURE REPLENISHMENT
We contribute to replenishing watersheds that source our operations in high-water-risk locations. Our aim is to return billions
of liters to the local communities where they’re needed most.
RETHINKING, REPLENISHING AND REUSING WATERFrom the very start of Performance with Purpose, in 2006, water stewardship has been one of PepsiCo’s top priorities. Informed by a
holistic view of our value chain, our water strategy is focused on the local watersheds where we operate. Our work is designed to enable long-term water security for our business and for others who depend on water availability—what we refer to as Positive Water Impact.
Our complete water strategy can be found in the Water section of A–Z Topics on pepsico.com.
2Treated wastewater discharged locally
1Water we use as an
ingredient in our products and in our manufacturing
processes
“ PepsiCo has been a driving force for the advancement of global water stewardship, providing unwavering support and technical insights in the beverage sector’s journey towards maximizing positive impact at the watershed level.”— Nick MartinAssociate Director and Water Working Group Facilitator, Beverage Industry Environmental Roundtable (BIER)
Selected Geographies
Replenishment Activities
2015 Water Consumption
Water Replenished in 2016
INDIAAurungabad, Nelamangala, Mamandur, Mahul, Channo, Pune, Bharuch, Palakkad and Sri City
• Check dams for water storage during dry season
• Aquifer recharge wells• Rainwater harvesting
structures for community and school use
1.22 billion liters
1.22 billion liters
JORDANAmman
• Rainwater harvesting• Groundwater recharges• Municipal water treatment• Operational water-use
efficiency
494.4 million liters
494.4 million liters
LATIN AMERICAMexico, Dominican Republic, Brazil and Guatemala
• Watershed restoration through TNC Water Funds
737.2 million liters
73.2 million liters
U.S.Arizona, Colorado and California
• Watershed restoration projects across multiple watersheds, through the Recycle for Nature program with TNC
3.4 billion liters
865 million liters
Total 2016 Replenishment Volume 2.65 BILLION LITERS
ACTING LOCALLYThe table below shows selected geographies where PepsiCo has active water replenishment programs.
• In 2016, PepsiCo replenished ~2.7 billion liters of water in high-water-risk areas, bringing us 26% of the way to our goal of 100% replenishment by 2025.
• Replenishment benefits claimed for local activities are capped at 100% of PepsiCo consumption volume to prevent overachieving projects from inflating global progress measurement. Examples include projects in India and Jordan, where our actual replenishment total exceeds our local consumption.
3Minimum amount of
water we work to replenish locally
44 | 45 PepsiCo Sustainability Report 2016

RETURNING WATER IN JORDAN
Partnering with the Ministry of Water and Irrigation, PepsiCo has helped return more water locally than we’ve consumed in Jordan. Our work in this country is one example of our approach to replenishment in high-water-risk locations where we operate.
SUPPORTING LOCAL WATER SECURITYFor three consecutive years, PepsiCo has returned more than 600 million liters of water annually
to local watersheds in Jordan through the practices and investments illustrated below. Our support of local water security as detailed here has been independently validated by Lloyd’s.
“ We had to walk long distances in search of water. The dam provided a reliable source of water with good quality. For me and my herd, it saves us a lot of time and effort spent in foraging for water. We are very grateful for the partnership between the Ministry of Water and Irrigation, Jordan Valley Water Authority and PepsiCo Jordan, which created a beneficial project relieving hardships in our livelihoods.”
— Goat and sheep herder (pictured at left) in Wadi Al Ahmar
Population: ~7.7 million14
Of which >2.7 million are recent or long-term refugees15
One of the world’s most water- stressed countries16
SPOTLIGHT ON JORDAN
RECHARGING GROUNDWATER AT ABU QATAF AND WADI AL AHMAR SAND DAMS
INCREASING WATER-USE EFFICIENCIES AND INVESTING IN WATER- SAVING TECHNOLOGY AT THE PEPSICO JORDAN MANUFACTURING FACILITY
COLLECTING RAINWATER AT AL JEEZA POND
TREATING MUNICIPAL WATER AT WADI ZQAIQ TREATMENT UNIT, TO PROVIDE CLEAN DRINKING WATER TO LOCAL RESIDENTS
46 | 47 PepsiCo Sustainability Report 2016

ACTING ON CLIMATE SCIENCEWe believe industry and governments should commit to science-based action to limit global temperature increases to no more than 2˚ Celsius above pre- industrial levels. PepsiCo’s 2030 GHG emission reduction goal accounts for both our current footprint and anticipated business growth between now and 2030.
PROGRESS
• PepsiCo Mexico Foods initiated a power purchase agreement, which supplied 73% of its power from wind energy, April–December 2016 (average monthly basis).
• Partnerships are informing our renewable energy procurement strategy:– Joined Business Renew-
ables Center, at the Rocky Mountain Institute
– Signed on to the Renewable Energy Buyers’ Principles, an initiative facilitated by World Resources Institute and World Wildlife Fund
8%OPERATIONS Onsite energy generation, fleet fuel, purchased electricity
SCOPE 1+2
WATER & CLIMATE PERFORMANCE
92%AGRICULTURE Land use, dairy farms, soil, applied fertilizer
PACKAGING Materials, energy used in production
THIRD-PARTY TRANSPORTATION Miles covered, fuel used
OTHERIncludes product coolers, home refrigerators, product use
PROGRESS
• Scope 3 emissions down 0.5 million metric tonnes in 2016 — equivalent to 1% of our 2030 target reduction — through:
–Reducing emissions in our agricultural supply chain –Increasing recyclable materials in packaging and developing alternative pack-aging materials –Upgrading our vending and cooling equipment, and using HFC-free refrigerants, resulting in a 12% reduction in emissions from this equip-ment in 2016
SCOPE 3
PRIORITIZING HIGH WATER RISKHelping to create greater water-use efficiencies among our growers in high-water-risk locations is a high- impact area of our water strategy. Continuing to provide safe water access for vulnerable commu-nities is also an important part of our approach to supporting local water security.
SAFE WATER FOR VULNERABLE COMMUNITIES
ACTION• Access to safe water provided for
>11 million people around the world: 2006–2016– Funded by PepsiCo Foundation and
its partners• In Latin America, currently funding
municipalities to use Hydro-BID, a digital tool that estimates freshwater availability in water- scarce regions today and tomorrow:– Public- private partnership: PepsiCo,
PepsiCo Foundation and Inter- American Development Bank
– Enables better governance of water resources
PROGRESS• >100 specialists with Peru’s National
Water Authority, which anticipates less water availability in the future due to climate change, use Hydro-BID to evaluate water projects and guide policies
MORE CROPS PER DROP
ACTION• Supplying direct growers with efficient
irrigation equipment• Providing training on other efficient
practices, like using cover crops that help the soil retain more water
• Investing in new technologies, like i-crop, to save even more water
• Replaced flood irrigation with drip irrigation with farmers on more than 2,600 acres in India in 2016
PROGRESS• >800 million liters of annual water
saved in Maharashtra (2016, verified by Deloitte)– Expanded the number of growers
implementing water- saving drip irrigation in 2016 compared with 2015
– Increased reliable supply of potatoes for the growers and our business
Maharashtra, India Latin America
WE’RE MOVING BEYOND OUR FOUR WALLS TO TACKLE SUPPLY CHAIN EMISSIONS,
ACCOUNTING FOR 92% OF OUR CARBON FOOTPRINT.
PepsiCo has been recognized for our
work to address water risk across our supply chain by the World Wildlife Fund and Ceres
as part of their AgWater Challenge.
48 | 49 PepsiCo Sustainability Report 2016

UPDATE ON PALM OILWe have made important progress in sustainable palm oil, and we are committed to doing much more as we work toward our goal to source 100% physically certified sustainable palm oil by 2020.
PALM OIL40% of the world’s palm oil is produced by smallholders, whose participation in the shift to sustainable palm oil is essential.17 We source significant volumes from Southeast Asia and Latin America — where we are evaluating impact programs and other ways to build capabilities among smallholders.
As local industry grows, we’re working with suppliers to improve management of High Conservation Value Areas (areas having biological, ecological, social or cultural value of outstanding significance or critical importance). Where possible, we seek to drive change on the ground and use our influence to address potential deforestation and human rights issues before they materialize.
CANE SUGARIn Thailand, India and Mexico, certified sustainable volumes of cane sugar are not yet at scale. By engaging suppliers and developing an action plan in Thailand, the country’s first-ever certified sustainable cane sugar volumes were produced in 2016.
We will continue to support sustainable production in Thailand and work to better understand and overcome systemic challenges.
Target for physically certified palm oil by year-end 2017: 30% AMOUNT OF PALM OIL
PURCHASED BY PEPSICO (2016):
<0.8% OF GLOBAL SUPPLY
TRACEABILITY TO MILL LEVEL AS OF JUNE 2017: 89% (UP FROM 65% IN 2015)
SUSTAINABLE SOURCING PERFORMANCE
FARMING FOR THE FUTUREWe are increasing investment in our direct growers to meet standards for sustainable sourcing. Through our Sustainable Farming Initiative, for instance, we support growers to use less water, reduce emissions and get more crops from their efforts. For more on SFI and other ways we engage with our suppliers, see pages 60–65.
POTATO11.5 million potato mini-tubers, or seeds, are developed at our Sabritas Center for Agricultural Development in Toluca, Mexico. After development, these seeds are delivered to local potato growers, whose crops are sourced for our Sabritas potato chips across the country.
The research performed at the center enhances the final Sabritas product quality as well as the security of local supply. The breeds also have important environmental and economic benefits for farmers and the country:
• Breeds are suited to the local growing environment and are less susceptible to diseases that can reduce crop yields.
• PepsiCo Mexico contracts with participating farmers to buy up to 100% of their crop, giving them certainty in the sale upon harvest.
• 97% of PepsiCo Mexico’s potato supply is harvested in Mexican fields.
• Annual revenue generated by participating farmers who subsequently supply potatoes to PepsiCo Mexico is >$70 million.
This coordinated action to realize economic and environ-mental benefits in Toluca is typical of our work with growers in countries around the world.
“It is paramount that all actors avoid short- termism while setting time-bound commitments and working to implement those commitments with urgency. This, together with reporting on progress transparently, will put us on the path to a more sustainable palm oil industry.”Darrel Webber CEO, Roundtable on Sustainable Palm Oil
DIRECTLY SOURCED KEY
CROPS INCLUDEPOTATOES, CORN, OATS,
ORANGES
INDIRECTLY SOURCED KEY
CROPS INCLUDECANE SUGAR, WHEAT, CORNMEAL, PALM OIL
THE CROPS WE SOURCE
Our most recent Palm Oil Action Plan Progress Report is available in A–Z Topics on pepsico.com.
Photo: Global Environmental Facility
50 | 51 PepsiCo Sustainability Report 2016

65%
LESS
PLAS
TIC MATERIALS: LESS IS MOREDrinkfinity, our new beverage system, comes with pods that contain ingredients like chia seeds, electrolytes and green coffee extract that allow consumers to create their own beverage. The vessel is reusable, and the pods contain up to 65 percent less plastic than a comparable 20-oz. ready-to-drink beverage bottle. With Drinkfinity purchases, we’ll help Water.org provide safe water to people in need.
WASTE PERFORMANCE
We’re DEVELOPING new packaging materials with less environmental impact.• For example, we’re working with
biotechnology leader Danimer Scientific on developing bio-based compostable packaging for PepsiCo’s snack brands.
We’re FUNDING local recycling programs in many mar-kets to make sure our bags and bottles have the best chance of being reused.• The PepsiCo Foundation is a founding
member of the Closed Loop Fund, which is investing $100 million to raise recycling rates in the U.S.
• We’re also a partner of The Recycling Partnership, working to improve curbside recycling for 20 million U.S. households.
CHANGING OUR PACKAGING
CHANGING BEHAVIOR
We’re REDUCING our use of packaging material and increasing our use of recycled material.• For example, in 2016, in select
markets we used 143 million pounds of food-grade recycled polyethylene terephthalate (rPET), an increase of approximately 3 percent, or 4 million pounds, versus 2015.
We’re JOINING forces to create scalable change.
• We’re a Core Partner of the New Plastics Economy, an initiative led by the Ellen MacArthur Foundation that brings together industry, government, NGOs, scientists, students and citizens to help create a circular economy for plastics.
We’re REMOVING the materials that make our packaging non- recyclable.• For example, we’re converting
shrink sleeves (a frequently used label on beverage containers and other packages) to recyclable material on Gatorade and Lipton Pure Leaf products.
SQUEEZING WASTEWe are rethinking how we package many of our products to address a range of associated environmental and social challenges. This includes working with others to support and leverage new technology and scale solutions. We’re also encouraging consumers to recycle and funding recycling infrastructure in many markets where our products are sold.
Please see A–Z Topics on pepsico.com for more information.
52 | 53 PepsiCo Sustainability Report 2016

PEOPLEPersistent inequalities in income and opportunity. High unemploy-ment rates, especially among young people. Skill gaps related to technology. These are among the factors undermining shared prosperity today. And in agriculture — which accounts for nearly 70 percent of employment in low- income countries18 — unjust labor practices and human rights violations often endure.
United Nations Sustainable Development Goal 8 provides a shared platform to create growth and more humane and fulfilling work for all people.
54 | 55 PepsiCo Sustainability Report 2016

20 –30%decrease in yields for female farmers due to unequal access to productive resources like land, finance and technology22
12.8%global youth unemployment: ~3X the rate for adults21
Richest 10% of population’s income is 9X that of the poorest 10%, and on average women earn 16% less than men19
67% of U.S.manufacturing employers unable to fill technical jobs with mid- skilled employees20
Multinationals are in a powerful position to set the example. Integrating targets for socially sustainable supply chains with their bottom lines, they can raise the bar on how business is conducted — and experienced — in a global economy.
NEEDED:STANDARD BEARERS
“ We must increase the ability of smallholder farmers to scale up their agricultural yields and provide markets for them to sell those yields to ensure that we can create sustainable and durable agricultural value chains that support the food security of families, as well as their economic viability.”
Ertharin Cousin Distinguished Fellow at Chicago Council on Global Affairs, Visiting Scholar at Stanford University and former World Food Programme Director
56 | 57 PepsiCo Sustainability Report 2016

Developing more direct relationships between industries reliant on agriculture and their growers would bring greater visibility to on-the- ground conditions, opening more opportunities for tangible improvements.
WANTED:BRIDGE BUILDERS
Industry should work to advance the quality of life and prosperity of all workers that contribute to its products and services, using its influence and global reach to help improve labor practices and respect for human rights. Within agriculture, improving rights and protections for women, migrant and child workers is critical to advancing decent work conditions.
INDUSTRY MUST REDEFINE
WETHE HUMAN FACE OF AGRICULTURESource: World Bank — WDI: Employment in agriculture (% of total employment). OurWorldInData.org/employment-in-agriculture
MIGRANT WORKERS IN AGRICULTURE
16 millionworkers, many with unpredictable work schedules and work situations prone to illness and injury24
FEMALE AGRICULTURAL LANDOWNERS
<30% of total ownership in most countries, with some of the lowest rates in sub- Saharan Africa and South Asia and less than 15% in the U.S., U.K., Norway and Finland23
CHILD LABORERS WORKING IN AGRICULTURE
>98 milliongirls and boys, many with limited access to quality education, inadequate technology, and work involving high hazards and risks25
Share of persons of working age who were
engaged in any activity to produce goods or provide services for pay or
profit in the agriculture sector (agriculture, hunting, forestry
and fishing).
SHARE OF THE LABOR FORCE EMPLOYED IN AGRICULTURE (IN %), 2015
No data 0 105 90604020
58 | 59 PepsiCo Sustainability Report 2016

We conducted audits on labor rights at 77 PepsiCo sites, which led to completed action plans in 2016.
In 2016, 794 on-site audits of first-tier suppliers were conducted by the SSP using the Sedex Members Ethical Trade Audit procedure, which is a compilation of good practice in ethical audit technique, or recognized through its Mutual Audit Recognition Process.
Meeting Our Standards
Our Supplier Code of Conduct sets out the expectations we have of our business partners in the areas of business integrity, labor practices, health and safety, and environmental management. It is our practice to include compliance with the Code as a condition of our supplier contracts, training in which is available online in six languages.
In 2016, approximately 95% of our top targeted key suppliers completed SCoC training — up from 88% in 2015.
RESPECTING
HUMAN RIGHTSOur aim is to ensure that the human rights of all people in our business, value chain and communities that we impact are respected as described in the Universal Declaration of Human Rights and the International Labour Organization’s Declaration on Fundamental Principles and Rights at Work.
OUR APPROACH TO HUMAN RIGHTS — IN OUR OPERATIONS AND SUPPLY CHAIN
Our governance of human rights
• Day-to-day responsibility sits with our Chief Human Rights Officer (CHRO), who chairs our Human Rights Operating Council, made up of senior representatives across the company.
• The CHRO reports to a member of PepsiCo’s Executive Committee, our Executive Vice President, Government Affairs, General Counsel and Corporate Secretary.
• At the Board level, our Public Policy and Sustainability Committee assists the Board’s oversight of human rights.
What we stand for
We’re committed to advancing respect for human rights throughout our value chain. We have the ability to contribute to positive human rights impacts and recognize that we have a responsibility to prevent, mitigate and address adverse impacts through our direct operations and to use our leverage to encourage our suppliers and business partners to respect human rights in our broader value chain.
Our areas of greatest impact (salient issues)
• Freedom of association • Vulnerable workers• Human right to water • Working hours and wages• Land rights • Workplace safety
See our Statement on Salient Human Rights Issues in the Human Rights section of A–Z Topics on pepsico.com for additional information.
Our standards and how we manage them
Our Global Human Rights Statement and Statement on Salient Human Rights Issues set out our overall approach to human rights. These are complemented by a number of relevant policies and commitments, including our Human Rights Workplace Policy, Land Rights Policy, Forestry Stewardship Policy, and Palm Oil Commitments and Sustainable Agriculture Policy.
IN OUR OPERATIONS• Our Code of Conduct and Human Rights Workplace Policy apply to all PepsiCo employees, members of the Board and
joint ventures over which we have management control.• Our Global Labor Human Rights Assessment Program assesses potential human rights impacts at all of our nearly
300 company-owned manufacturing sites. The program takes steps to identify and address the root cause of each issue found, including through the introduction of on-site corrective action plans to remediate non- compliances.
WITH OUR SUPPLIERS• Our Supplier Code of Conduct (SCoC) applies to suppliers, vendors, contractors, consultants, agents and other providers
of goods and services who do business with PepsiCo entities worldwide.• Our Sustainable Sourcing Program (SSP) assesses conduct of our direct suppliers.• Our Sustainable Farming Initiative defines our expectations related to respecting human rights and reinforcing sustain-
able agricultural practices at the farm level. See more about SFI on pages 62–63.– In action: An independent assessment, called “Land Tenure and Other Human Rights Issues in the Oil Palm and
Sugarcane Sectors in Mexico,” is designed to inform PepsiCo and others in the palm oil supply chain on human rights risks and barriers to sustainable production in Mexico.
WITH STAKEHOLDERS• We consult regularly with external stakeholders on our overall approach to human rights, on specific allegations and on
our salient issues. For example, we are a participant in Shift’s Business Learning Program, which helps us review and improve our approach to human rights management and performance.
How concerns can be raised
• All employees have an obligation to report suspected violations of our Values, our Code, our policies or applicable laws through our Speak Up! Hotline, which is also available to anyone who has a complaint or suspects that PepsiCo is not upholding its standards and commitments on human rights.
• In July 2017, PepsiCo launched an enhanced grievance mechanism for agricultural commodities to reflect the serious-ness of some of the complaints, the scrutiny that palm oil and other raw materials are under, and the complexity of both the supply chains and the issues. Our aim is to uphold our policies and to achieve outcomes that help people whose rights may have been affected, in a way that is satisfactory to all parties of the complaint.– In action: Human rights–related issues have been highlighted by external organizations in Brazil, Indonesia, and India
and Pakistan. In each situation, we have conducted a thorough investigation into the allegations, and when necessary, engaged in mitigating actions.
“ At a time when trust in large institutions, governments and corporations is at historic lows, we must be emboldened more than ever to help promote security and prosperity for all, especially the vulnerable. By design, Performance with Purpose works to use PepsiCo’s scale and influence to promote trust, dignity and opportunity.”
Tony West Executive VP, Government Affairs, General Counsel and Corporate Secretary, PepsiCo
HUMAN RIGHTS PERFORMANCE
More information is available in the Human Rights section of A–Z Topics on pepsico.com.
Photo: 2017 Guerrero Howe, LLC/Photo by Kristin Deitrich
60 | 61 PepsiCo Sustainability Report 2016

CULTIVATING GROWTH FOR GROWERS
Through our Sustainable Farming Initiative, or SFI, PepsiCo assesses and works with our direct growers to optimize economic, social and environmental on-farm practices and outcomes. Lessons learned from early SFI participants like Black Gold Farms, in Live Oak, Florida (pictured here), are strengthening this program as we extend its reach in other countries.
SPOTLIGHT ON SFI
“ What the Sustainable Farming Initiative does for us, as farm-ers, is make us look inside our operation to make sure we’re using water correctly, make sure we’re treating our people properly, make sure we’re pro-tecting the land. It has allowed us to really take a good hard look at ourselves in the mirror and find ways we can improve.”
– Leah Brakke, fourth- generation potato farmer (pictured at left with John Perry,
PepsiCo Global Procurement )
Growers assessed in 2016: ~500 across 18 countries
SFI implementation (2013–2016): 33 countries with active programs representing >35,000 growers
Crops addressed thus far: 9 — canola, cassava, orange, coconut, corn, oats, plantain, potato and sunflower
PARTNERING WITH FARMERSThrough SFI, we encourage and support best practices that benefit growers, their workers and our business. As part of the larger SFI Framework, which comprises additional environmental
and economic goals, PepsiCo works with participating growers to achieve the social goals illustrated below — to promote the well-being of agricultural workers and surrounding communities.
HEALTH & SAFETYProvide working conditions
that protect and support worker health and safety and promote personal wellness
EMPLOYMENT PRACTICES
Protect worker rights, including freedom of association and nondiscrimination, and uphold international standards for
employment practices
The full SFI Framework is available in A–Z Topics on pepsico.com.
COMMUNITYProtect and improve the local community through positive social impacts and mitigation of adverse environmental effects related to land and natural resources (such as through the use of i-crop to
reduce water use, shown here)
EMPLOYMENT CONDITIONS
Provide working and living conditions, including proper hours, wages and
housing, that protect worker rights and ensure fair and reasonable treatment
62 | 63 PepsiCo Sustainability Report 2016
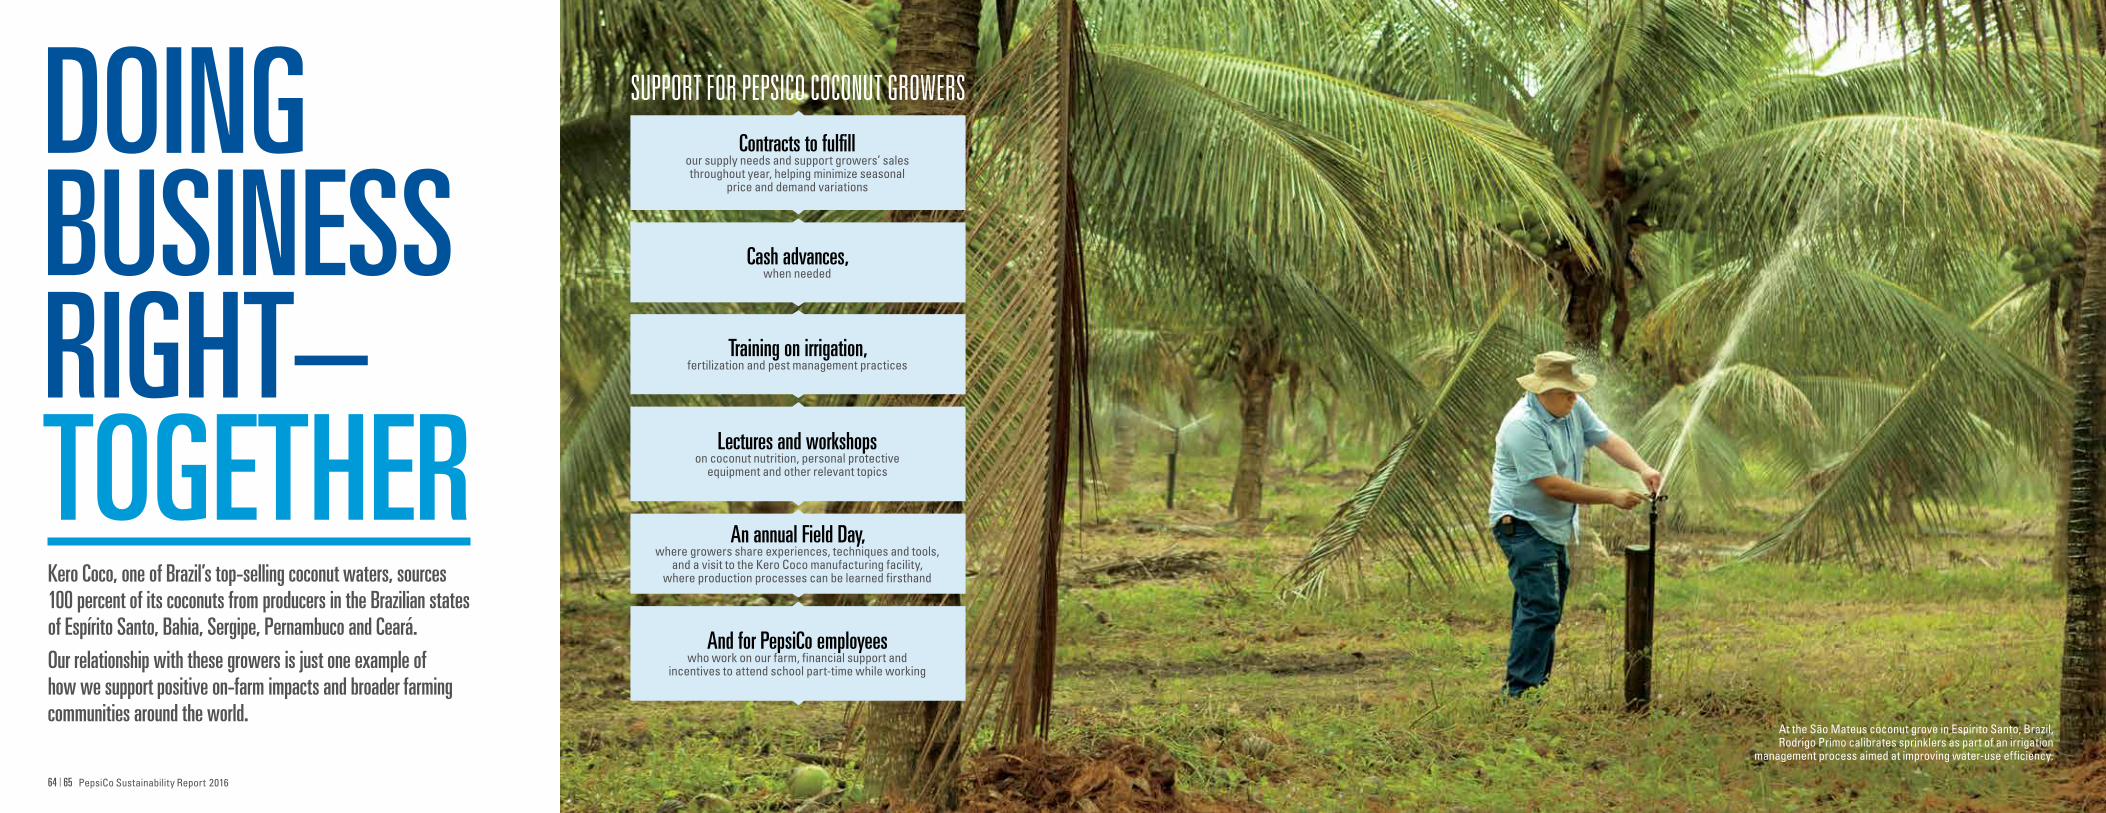
DOING BUSINESS RIGHT– TOGETHERKero Coco, one of Brazil’s top- selling coconut waters, sources 100 percent of its coconuts from producers in the Brazilian states of Espírito Santo, Bahia, Sergipe, Pernambuco and Ceará.Our relationship with these growers is just one example of how we support positive on-farm impacts and broader farming communities around the world.
Contracts to fulfill our supply needs and support growers’ sales throughout year, helping minimize seasonal
price and demand variations
Cash advances, when needed
Training on irrigation, fertilization and pest management practices
An annual Field Day, where growers share experiences, techniques and tools,
and a visit to the Kero Coco manufacturing facility, where production processes can be learned firsthand
Lectures and workshops on coconut nutrition, personal protective
equipment and other relevant topics
And for PepsiCo employees who work on our farm, financial support and
incentives to attend school part-time while working
SUPPORT FOR PEPSICO COCONUT GROWERS
At the São Mateus coconut grove in Espírito Santo, Brazil, Rodrigo Primo calibrates sprinklers as part of an irrigation
management process aimed at improving water-use efficiency.
64 | 65 PepsiCo Sustainability Report 2016

DIVERSITY PERFORMANCE
FOSTERING EQUALITYDiversity, a core PepsiCo value since our inception, has helped propel our company forward for decades. We define diversity broadly, including personality, lifestyle, ways of thinking, work experience, ethnicity, race, religion, gender, gender identity, sexual orientation, marital status, age, national origin, disability and veteran status.
A particular focus of our efforts is on increasing women’s participation in the workforce. Studies show that companies with women in management roles are more profitable. In support of women’s advancement and our own business goals, we’re making progress toward our Performance with Purpose goals in this area.
A LOCAL APPROACHWe recognize that fostering inclusion and
engagement in our business and surrounding communities around the world requires distinct
approaches suited to the local markets where we operate. For example, we support racial and gender diversity among our workforce in North America, the development of underrepresented populations
in countries like South Africa, and the broader inclusion of women in emerging
and developing markets.
EQUAL PAY FOR EQUAL WORKPepsiCo has a long- standing practice of managing pay programs that ensure pay equity across our employee groups.
ACTION• Increased pay- equity efforts in 2016• Implemented more extensive global pay equity
review process –Analysis performed in the U.S. and U.K.
PROGRESS• Among PepsiCo’s professionals in the U.S., women are paid
within 1% of men overall,* after controlling for legitimate drivers of pay, such as level, tenure and performance ratings
–Expect to reach a total of 21 countries by year-end 2017 with pay equity analysis, representing 62% of the company’s salaried employees**
• Signed the White House Equal Pay Pledge in 2016 –Committed to improve hiring practices, performance assessments, promotion decisions and pay equity assessments
*Based on base compensation.**Excluding top senior executives.
U.S. and U.K.
SPEAKING VOLUMESDuring Women’s History Month, Stacy’s Pita Chips, itself founded by a woman, honored notable women who fight for their beliefs with limited- edition packaging modeled after the real posters and signs they have used to make their voices heard.
SUPPORT FOR WORKING CAREGIVERSOne way to foster career progression at PepsiCo is to provide concrete assis-tance for the working caregivers among us. This assistance, in turn, supports our efforts to reach gender parity in management.
ACTION• Provided on-site or near-site childcare
PROGRESS• Will continue to evaluate global need
New York, Texas, Mexico, India and Pakistan
To support working caregivers and their children, like Trevor Tamsen and his son (pictured here), PepsiCo opened PEPstart, a new on-site Bright Horizons Early Education Center at our Purchase, New York headquarters in fall 2017.
WOMEN IN MANAGEMENTIn 2016, 38 percent of management roles throughout PepsiCo were filled by women, up from a baseline of 37 percent in 2015.
ACTION• Developed a food safety internship
program in 2016 with the U.S. Pakistan Women’s Council
–Draws female talent from top uni-versities across Pakistan, including the young women at left attending a training session –Provides immersion and training in supply chain management, safety and manufacturing
PROGRESS• Multiple universities specializing
in agriculture and food technology have joined
• PepsiCo will continue to work toward gender parity in management roles, using programs and tools tailored to the diverse countries where we work
Pakistan
66 | 67 PepsiCo Sustainability Report 2016

In Pakistan, solar-powered Liter of Light fixtures illuminate an outdoor classroom at dusk.
PROSPERITY PERFORMANCE
In addition to giving our female talent at PepsiCo every opportunity to lead, we are investing to accelerate young women’s chances of succeeding in the workplace around the world, which in turn has the power to help build more sustainable communities.
To achieve this, PepsiCo and the PepsiCo Foundation will invest $100 million supporting initiatives to benefit at least 12.5 million women and girls around the world near our global operations.
NURTURING PROSPERITY
SUPPORT FOR EDUCATION
ACTION• Investments in the Tomooh education
program since 2007, in partnership with the UN World Food Programme
–Aims to improve school attendance and combat malnutrition
PROGRESS• Scholarships, mentoring and healthy
food have reached >200,000 students and their families in Egypt alone, with increased enrollment rates in >100 Egyptian schools
Upper Egypt, Jordan and Lebanon
WORKFORCE READINESS
ACTION• PepsiCo India is running the Nayee
Disha program –Supports long-term expansion of the female talent pool in India –Aims to increase female participation rates in the Indian workforce — one of lowest in the world –Launched in coordination with a consortium of large Indian as well as multinational organizations, including the UN Development Programme –Comprises an industry- awareness workshop followed by individual assessments to help young women become workplace-ready
PROGRESS• Outreach to >11,000 young women at
over 50 colleges to date –PepsiCo is the first company to visit many of these colleges –More than 2,000 Indian women have been certified as qualified for job and internship placements through the program –More outreach to come
India
Please see A–Z Topics on pepsico.com for more information.
SUSTAINING LIGHTPartnering with the Liter of Light organization, PepsiCo supports access to light for communities where we do business in India, Malaysia, Mexico, Dominican Republic, Colombia, Egypt, Philippines, Yemen and Pakistan. Liter of Light provides affordable solar- powered light to people with limited or no access to electricity.
Through this collaboration, hundreds of thousands of lights have been installed. Light increases safety — especially for women and girls — improves sanitation, enables studying after dark and enhances quality of life.
Even better, Liter of Light trains many young people and women cooperatives on how to build their own lights. Sales create a viable revenue source and support long-term benefits for these entrepreneurs.
TECHNICAL JOBS TRAINING
ACTION• PepsiCo’s Frito-Lay division has
worked with U.S. educators to create an industrial maintenance program that addresses local workforce needs in the U.S. state of Georgia, shown below
–Connects high school students with technical training and employment opportunities within the community
PROGRESS• A potential model for other parts of
the country• These types of programs boost the
number of people trained with high-tech skills and support the future of the U.S. manufacturing industry
Georgia, U.S.
68 | 69 PepsiCo Sustainability Report 2016

MATERIAL ASPECT GRI INDICATOR REPORT LINKS OMISSION STATEMENTSSUSTAINABILITY PILLAR: PRODUCTS
Disclosure on Management Approach
G4-DMA Sustainability Report What We Believe A–Z Topics
Innovating More Nutritious Options
FP6 Percentage of total sales volume of consumer products, by product cat-egory, that are lowered in saturated fat, trans fats, sodium and added sugars
Sustainability Report Saturated Fat (A–Z) Sodium (A–Z) Sugar (A–Z)
FP7 Percentage of total sales volume of consumer products, by product category, that contain increased nutritious ingredients like fiber, vitamins, minerals, phytochemicals or functional food additives
Sustainability Report Nutrition (A–Z)
Responsible Marketing of Our Products
G4-PR3 Type of product and service information required by the organi-zation’s procedures for product and service information and labeling, and percentage of significant product and service categories subject to such information requirements
Nutrition Labeling (A–Z)
G4-PR7 Total number of incidents of non-compliance with regulations and voluntary codes concerning marketing communications, including advertising, promotion and sponsorship, by type of outcomes
Advertising and Marketing to Children (A–Z) Nutrition Labeling (A–Z)
Quality and Food Safety FP5 Percentage of production volume manufactured in sites certified by an independent third party according to internationally recognized food safety management system standards
Product Safety and Quality (A–Z)
SUSTAINABILITY PILLAR: PLANETDisclosure on Management Approach
G4-DMA Sustainability Report What We Believe A–Z Topics
G4-14 Explanation of whether and how the precautionary approach or principle is addressed by the organization
To protect our business, PepsiCo takes into account environmental risks — as defined in the GRI definition of Precautionary Principle — when planning its operations, procurement and environmental initiatives. We evaluate opportunities to mitigate our impacts on our surrounding environments in many ways, including opportunities to reduce our use of fuel, water and packaging. We review current and potential threats, plan for a variety of scenarios and act where appropriate and feasible.
Water G4-EN8 Total water withdrawal by source Water (A–Z) Sustainability Report CDP Water
GOVERNANCEROLES AND RESPONSIBILITIESGOVERNANCE AS A DRIVER OF PERFORMANCEWe believe strong sustainability governance is the foundation for delivering on Performance with Purpose (PwP). At PepsiCo, sustainability topics are integrated into, and not separate from, our business.
ROLE OF THE BOARD OF DIRECTORSAs stewards of PepsiCo, our Board plays an essential role in determining strategic priorities and considers sustain-ability issues an integral part of its business oversight. To align with our PwP 2025 Agenda, in early 2017, our Board redefined the roles of its Committees by creating a Public Policy and Sustainability Committee. The Committee assists the Board in providing more focused oversight for the Company’s policies, programs and related risks that concern key public policy and sustainability matters.
ROLE OF PEPSICO’S SENIOR LEADERSHIPIn 2016, PepsiCo reviewed its sustainability governance structure to identify opportunities to strengthen the inte-gration of PwP into its business agenda and processes. Beginning in 2017, the PepsiCo Executive Committee (PEC) assumed direct oversight of the sustainability agenda, strategic decisions and performance manage-ment. The PEC is made up of the Chairman & CEO, Sector CEOs and top functional leaders, ensuring that sustain-ability is a key accountability for every member of our senior leadership team.
Strategy and progress against our PwP goals are discussed during meetings of the full PEC on a quar-terly basis. In between these quarterly meetings, PEC members remain actively engaged in executing against our PwP goals, driving the agenda with their teams.
Dr. Mehmood Khan, Vice Chairman, PepsiCo, and Executive Vice President, PepsiCo Chief Scientific Officer, Global Research and Development, oversees the Company’s implementation of PwP 2025 goals. Dr. Khan brings deep science-based knowledge and insights to guide the Company’s product portfolio transformation, as well as an intimate understanding of the challenges and opportunities that lie at the intersection of food, the environment and people.
THEMATIC AND GEOGRAPHIC LEADERSHIPThe PEC has empowered select Senior Vice Presidents and Vice Presidents within the Company, referred to as Theme Leads, to create and oversee global strategy and execution for each of the PwP goals. These Theme Leads, selected for their subject-matter expertise, work with teams comprising representatives from key func-tions and all geographic sectors to ensure successful implementation of processes across our businesses.
SUSTAINABILITY OFFICEIn 2016, PepsiCo formed a Sustainability Office to drive governance and delivery of the Company’s sustainability agenda. The Sustainability Office works closely with Theme and Functional Leads from across the business to ensure continued performance progress against our PwP 2025 Agenda. It also plays a key role in bringing a sustainability lens to long-term corporate strategic planning and key business processes, ensuring that PwP is always embedded into the fabric of what we do as a company.
Another key role of the Sustainability Office is managing the integrity of the data on which we report. While our data management process has always been rigorous, our PwP 2025 Agenda, with its new set of goals, was the right opportunity to evaluate processes, outline improve-ments and implement enhancements to build on the strong foundation already in place.
A team within the Sustainability Office leads development of the robust data governance structure underpinning each of our PwP 2025 goals, ensuring accuracy, consistency and precision of the data, while driving accountability among our teams. It continues to work on capability to increase confidence in not only our internal data, but also data collected throughout our supply chain.
This GRI Index corresponds to sustainability information presented in A–Z Topics on pepsico.com, in our annual Sustainability Report and as part of external reporting such as our Annual Report, Proxy Statement and 10-K filings. Sustainability information in our A–Z Topics and Sustainability Report is prepared in accordance with the GRI G4 Core Guidelines and reflects performance in calendar year 2016. We report annually on the sustainability topics that were identified through our materiality determination process and which we believe represent PepsiCo’s economic, environmental and
social performance. Unless otherwise noted, we use GRI-defined indicators to demonstrate performance for each aspect. Indicators with “FP” corre-spond to the G4 Food Processing Sector Disclosures. Note that not all indicators represented in the GRI Index are disclosed fully — in some cases, only partial information is included due to limited availability of information. Omission statements are provided where required based on the GRI G4 Core Guidelines. For more information on the Global Reporting Initiative and the GRI G4 Core Guidelines, please visit globalreporting.org.
GRI INDEX: Reporting Informed by GRI G4
BOARD OF DIRECTORS
PUBLIC POLICY AND SUSTAINABILITY COMMITTEEPEPSICO EXECUTIVE COMMITTEE
ROLES AND RESPONSIBILITIES
76: ROLES AND RESPONSIBILITIES DIAGRAM B
- EXECUTION MANAGEMENT- LOCAL MONITORING- BEST PRACTICE SHARING
SECTOR GOAL LEADS
- STRATEGIC FRAMEWORK- PERFORMANCE MANAGEMENT- DATA INTEGRITY
SUSTAINABILITY OFFICE
- PwP GOAL ROAD MAP OWNERSHIP- SUBJECT-MATTER EXPERTISE- THOUGHT LEADERSHIP AND INSIGHTS
THEMATIC LEADS
70 | 71 PepsiCo Sustainability Report 2016

MATERIAL ASPECT GRI INDICATOR REPORT LINKS OMISSION STATEMENTSSUSTAINABILITY PILLAR: PLANET
G4-EN 24 Total number and total volume of recorded significant spills CDP Water
G4-EN29 Monetary value of significant fines and total number of non-monetary sanctions for non-compliance with environmental laws and regulations
CDP Water
G4-EC7 Development and impact of infrastructure investments and services supported
Water (A–Z) Sustainability Report
Climate Change G4-EN3 Energy consumption within the organization CDP Climate
G4-EN15 Direct greenhouse gas (GHG) emissions (Scope 1) CDP Climate Climate Change (A–Z) Sustainability Report
G4-EN16 Energy indirect greenhouse gas (GHG) emissions (Scope 2) CDP Climate Climate Change (A–Z) Sustainability Report
G4-EN17 Other indirect greenhouse gas (GHG) emissions (Scope 3) CDP Climate Climate Change (A–Z) Sustainability Report
G4-EN18 Greenhouse gas (GHG) emissions intensity CDP Climate
G4-EN19 Reduction of greenhouse gas (GHG) emissions CDP Climate Climate Change (A–Z) Sustainability Report
G4-EN30 Significant environmental impacts of transporting products and other goods and materials for the organization’s operations, and transporting members of the workforce
Fleet Efficiency (A–Z) Climate Change (A–Z)
G4-EC2 Risks and opportunities posed by climate change that have the poten-tial to generate substantive changes in operations, revenue or expenditure
Annual Report/10-K CDP Climate
Agriculture G4-EN33 Significant actual and potential negative environmental impacts in the supply chain and action taken
Sustainable Sourcing (A–Z) PepsiCo suppliers to which this indi-cator applies (farmers) exercise due care and attention in their farming activities and practices. However, many do not commonly conduct formal impact assessments, there-fore the information requested by GRI is currently unavailable.
FP1 Percentage of purchased volume from suppliers compliant with company’s sourcing policy
Sustainable Sourcing (A–Z) The information requested by GRI for this indicator is currently unavail-able. PepsiCo is working to provide this information in future reporting.
Packaging and Waste G4-EN2 Percentage of materials used that are recycled input materials Packaging (A–Z)
G4-EN23 Total weight of waste by type and disposal method Waste (A–Z) At this time, we are unable to respond to this indicator with the level of granularity required by GRI. As we refine our data gath-ering and validation processes as part of our PwP 2025 Agenda, we intend to respond to this indicator in the future.
GRI INDEX: REPORTING INFORMED BY GRI G4
MATERIAL ASPECT GRI INDICATOR REPORT LINKS OMISSION STATEMENTSSUSTAINABILITY PILLAR: PEOPLE
Disclosure on Management Approach
G4-DMA Sustainability Report What We Believe A–Z Topics
Talent Attraction, Engagement and Growth
G4-LA1 Total number and rates of new employee hires and employee turn-over by age group, gender and region
Talent (A–Z)
G4-LA10 Programs for skills management and lifelong learning that support the continued employability of employees and assist them in managing career endings
Talent (A–Z)
Diversity and Engagement
G4-10 Report the total number of employees by employment contract and gender
Talent (A–Z)
G4-LA12 Composition of governance bodies and breakdown of employees per employee category according to gender, age group, minority group membership and other indicators of diversity
Talent (A–Z) Proxy Statement Annual Report
G4-LA13 Ratio of basic salary and remuneration of women to men by employee category, by significant locations of operation
Pay Equity (A–Z)
Workplace Safety G4-LA6 Type of injury and rates of injury, occupational diseases, lost days, and absenteeism, and total number of work-related fatalities, by region and by gender
Environmental, Health & Safety (A–Z) While we have made select 2016 data such as LTIR and fleet safety information available online, we are not able to report all health and safety information with the granular-ity required by GRI. As we advance our health and safety programs, we intend to expand our reporting in the future.
G4-LA7 Workers with high incidence or high risk of diseases related to their occupation
Environmental, Health & Safety (A–Z)
Human Rights G4-HR2 Total hours of employee training on human rights policies or procedures concerning aspects of human rights that are relevant to operations, including the percentage of employees trained
Human Rights (A–Z)
G4-HR9 Total number and percentage of operations that have been subject to human rights reviews or impact assessments
Human Rights (A–Z)
G4-HR11 Percentage of new suppliers that were screened using human rights criteria
Human Rights (A–Z) Sustainable Sourcing (A–Z)
G4-LA15 Significant actual and potential negative impacts for labor practices in the supply chain and actions taken
Human Rights (A–Z) Sustainable Sourcing (A–Z)
COMPANY & GOVERNANCEStrategy and Analysis G4-1 CEO Letter Sustainability Report
G4-2 Description of key impacts, risks and opportunities 10-K/Annual Report/CEO Letter
Company Profile G4-3 Name of the organization 10-K/Annual Report
G4-4 Primary brands, products and/or services 10-K/Annual Report
G4-5 Location of organization’s headquarters 10-K/Annual Report
G4-6 Number of countries where the organization operates 10-K/Annual Report
G4-7 Nature of ownership and legal information 10-K/Annual Report
GRI INDEX: REPORTING INFORMED BY GRI G4
72 | 73 PepsiCo Sustainability Report 2016
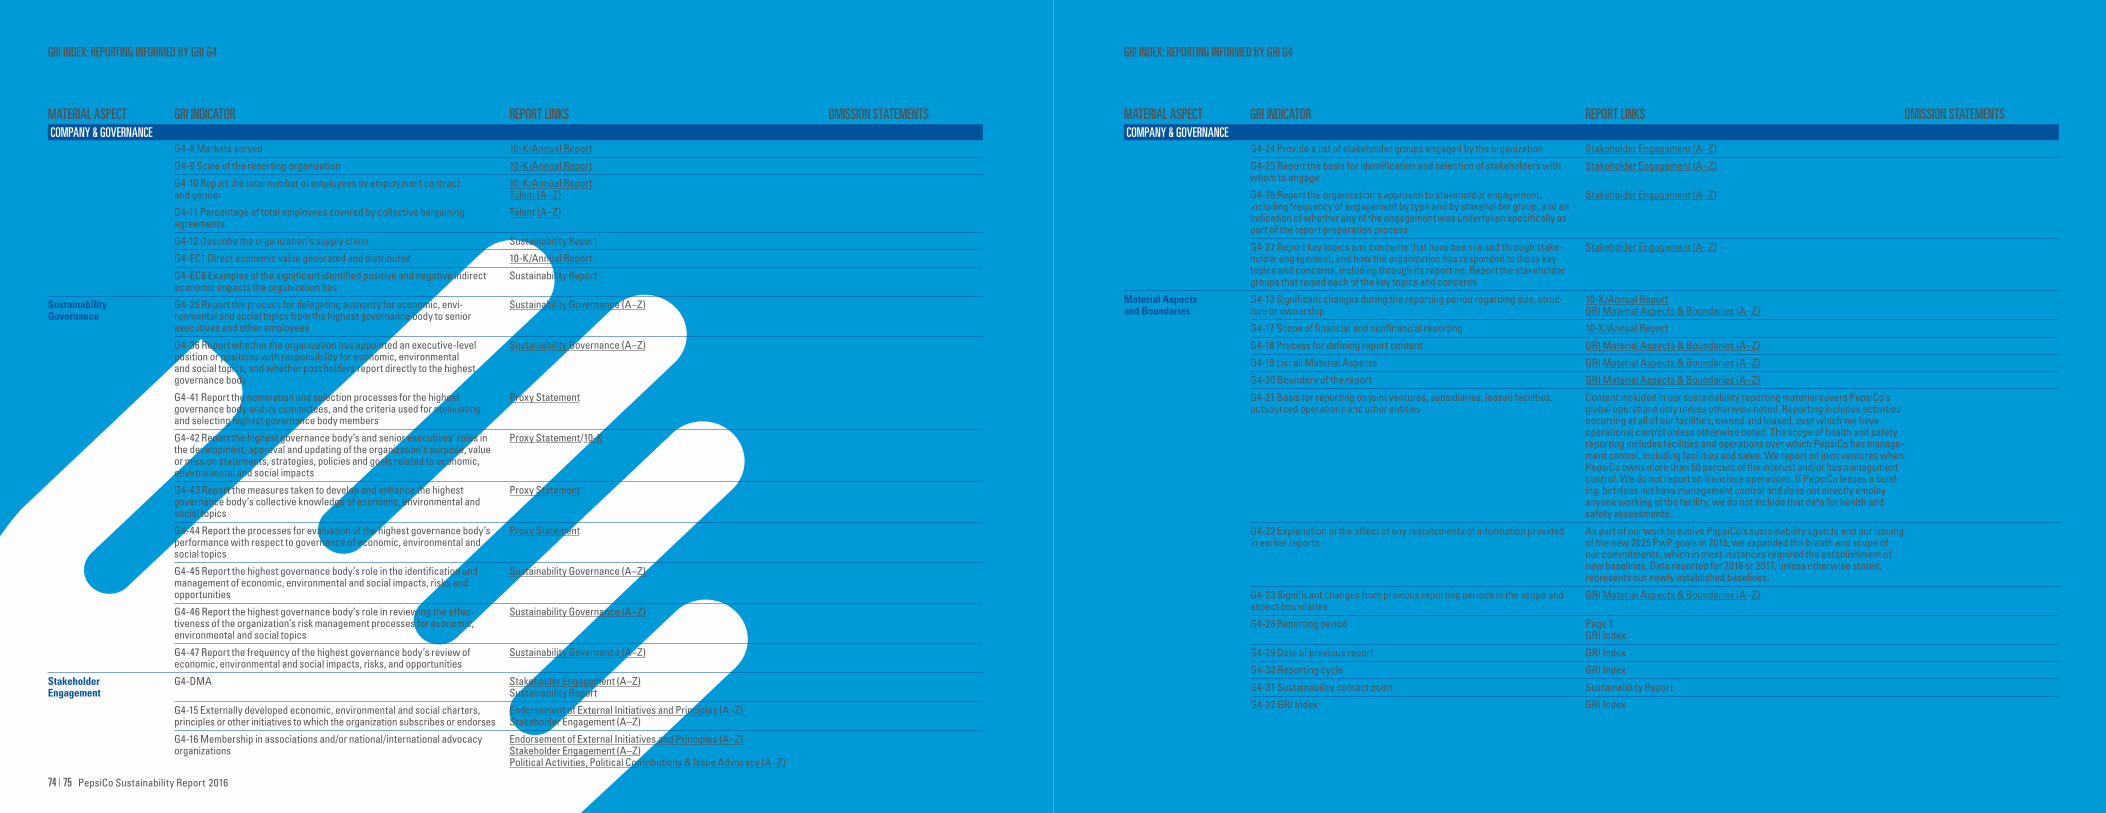
GRI INDEX: REPORTING INFORMED BY GRI G4
MATERIAL ASPECT GRI INDICATOR REPORT LINKS OMISSION STATEMENTSCOMPANY & GOVERNANCE
G4-8 Markets served 10-K/Annual Report
G4-9 Scale of the reporting organization 10-K/Annual Report
G4-10 Report the total number of employees by employment contract and gender
10-K/Annual Report Talent (A–Z)
G4-11 Percentage of total employees covered by collective bargaining agreements
Talent (A–Z)
G4-12 Describe the organization’s supply chain Sustainability Report
G4-EC1 Direct economic value generated and distributed 10-K/Annual Report
G4-EC8 Examples of the significant identified positive and negative indirect economic impacts the organization has
Sustainability Report
Sustainability Governance
G4-35 Report the process for delegating authority for economic, envi-ronmental and social topics from the highest governance body to senior executives and other employees
Sustainability Governance (A–Z)
G4-36 Report whether the organization has appointed an executive-level position or positions with responsibility for economic, environmental and social topics, and whether post holders report directly to the highest governance body
Sustainability Governance (A–Z)
G4-41 Report the nomination and selection processes for the highest governance body and its committees, and the criteria used for nominating and selecting highest governance body members
Proxy Statement
G4-42 Report the highest governance body’s and senior executives’ roles in the development, approval and updating of the organization’s purpose, value or mission statements, strategies, policies and goals related to economic, environmental and social impacts
Proxy Statement/10-K
G4-43 Report the measures taken to develop and enhance the highest governance body’s collective knowledge of economic, environmental and social topics
Proxy Statement
G4-44 Report the processes for evaluation of the highest governance body’s performance with respect to governance of economic, environmental and social topics
Proxy Statement
G4-45 Report the highest governance body’s role in the identification and management of economic, environmental and social impacts, risks and opportunities
Sustainability Governance (A–Z)
G4-46 Report the highest governance body’s role in reviewing the effec-tiveness of the organization’s risk management processes for economic, environmental and social topics
Sustainability Governance (A–Z)
G4-47 Report the frequency of the highest governance body’s review of economic, environmental and social impacts, risks, and opportunities
Sustainability Governance (A–Z)
Stakeholder Engagement
G4-DMA Stakeholder Engagement (A–Z) Sustainability Report
G4-15 Externally developed economic, environmental and social charters, principles or other initiatives to which the organization subscribes or endorses
Endorsement of External Initiatives and Principles (A–Z) Stakeholder Engagement (A–Z)
G4-16 Membership in associations and/or national/international advocacy organizations
Endorsement of External Initiatives and Principles (A–Z) Stakeholder Engagement (A–Z) Political Activities, Political Contributions & Issue Advocacy (A–Z)
GRI INDEX: REPORTING INFORMED BY GRI G4
MATERIAL ASPECT GRI INDICATOR REPORT LINKS OMISSION STATEMENTSCOMPANY & GOVERNANCE
G4-24 Provide a list of stakeholder groups engaged by the organization Stakeholder Engagement (A–Z)
G4-25 Report the basis for identification and selection of stakeholders with whom to engage
Stakeholder Engagement (A–Z)
G4-26 Report the organization’s approach to stakeholder engagement, including frequency of engagement by type and by stakeholder group, and an indication of whether any of the engagement was undertaken specifically as part of the report preparation process
Stakeholder Engagement (A–Z)
G4-27 Report key topics and concerns that have been raised through stake-holder engagement, and how the organization has responded to those key topics and concerns, including through its reporting. Report the stakeholder groups that raised each of the key topics and concerns
Stakeholder Engagement (A–Z)
Material Aspects and Boundaries
G4-13 Significant changes during the reporting period regarding size, struc-ture or ownership
10-K/Annual Report GRI Material Aspects & Boundaries (A–Z)
G4-17 Scope of financial and nonfinancial reporting 10-K/Annual Report
G4-18 Process for defining report content GRI Material Aspects & Boundaries (A–Z)
G4-19 List all Material Aspects GRI Material Aspects & Boundaries (A–Z)
G4-20 Boundary of the report GRI Material Aspects & Boundaries (A–Z)
G4-21 Basis for reporting on joint ventures, subsidiaries, leased facilities, outsourced operations and other entities
Content included in our sustainability reporting material covers PepsiCo’s global operations only unless otherwise noted. Reporting includes activities occurring at all of our facilities, owned and leased, over which we have operational control unless otherwise noted. The scope of health and safety reporting includes facilities and operations over which PepsiCo has manage-ment control, including facilities and sales. We report on joint ventures when PepsiCo owns more than 50 percent of the interest and/or has management control. We do not report on franchise operations. If PepsiCo leases a build-ing, but does not have management control and does not directly employ anyone working at the facility, we do not include that data for health and safety assessments.
G4-22 Explanation of the effect of any restatements of information provided in earlier reports
As part of our work to evolve PepsiCo’s sustainability agenda and our issuing of the new 2025 PwP goals in 2016, we expanded the breath and scope of our commitments, which in most instances required the establishment of new baselines. Data reported for 2016 or 2017, unless otherwise stated, represents our newly established baselines.
G4-23 Significant changes from previous reporting periods in the scope and aspect boundaries
GRI Material Aspects & Boundaries (A–Z)
G4-28 Reporting period Page 1 GRI Index
G4-29 Date of previous report GRI Index
G4-30 Reporting cycle GRI Index
G4-31 Sustainability contact point Sustainability Report
G4-32 GRI Index GRI Index
74 | 75 PepsiCo Sustainability Report 2016

GRI INDEX: REPORTING INFORMED BY GRI G4
MATERIAL ASPECT GRI INDICATOR REPORT LINKS OMISSION STATEMENTSCOMPANY & GOVERNANCE
G4-33 Policy and current practice with regard to seeking external assurance for the report
PepsiCo seeks external assurance of its direct greenhouse gas emissions (Scope 1), indirect greenhouse gas emissions (Scope 2), downstream greenhouse gas emissions (Scope 3), energy consumption and production, waste generation, water consumption, and health and safety data from our company-owned plants. For more information, please refer to the complete verification statement from Bureau Veritas in A–Z Topics.
Public Policy and Political Engagement
G4-DMA Public Policy and Political Engagement (A–Z) Political Activities, Political Contributions & Issue Advocacy (A–Z) Sustainability Report
G4-SO6 Total value of political contributions by country and recipient/beneficiary
Political Activities, Political Contributions & Issue Advocacy (A–Z)
Corporate Governance, Risk Management & Compliance
G4-34 Governance structure of organization, including committees of highest governance body
10-K/Proxy Statement
G4-37 Process for consultation between stakeholders and the highest governance body on economic, environmental and social topics. If consultation is delegated, describe to whom and any feedback processes to the highest governance body
Stakeholder Engagement (A–Z) Sustainability Governance (A–Z)
G4-38 Report the composition of the highest governance body and its committees
Proxy Statement
G4-39 Report whether the chair of the highest governance body is also an executive officer
Proxy Statement
G4-40 Report the nomination and selection processes for the highest governance body and its committees, and the criteria used for nominating and selecting highest governance body members
Proxy Statement
G4-49 Report the process for communicating critical concerns to the highest governance body
Sustainability Governance (A–Z)
G4-51 Report the remuneration policies for the highest governance body and senior executives
Proxy Statement
G4-56 Describe the organization’s values, principles, standards and norms of behavior such as codes of conduct and codes of ethics
Ethics and Integrity (A–Z)
G4-57 Report the internal and external mechanisms for seeking advice on ethical and lawful behavior, and matters related to organizational integrity, such as helplines or advice lines.
Ethics and Integrity (A–Z)
G4-58 Report the internal and external mechanisms for reporting concerns about unethical or unlawful behavior, and matters related to organizational integrity, such as escalation through line management, whistleblowing mechanisms or hotlines
Ethics and Integrity (A–Z)
G4-SO4 Communication and training on anti-corruption policies and procedures
Ethics and Integrity (A–Z)
Community Investment & Philanthropy
G4-DMA Global Citizenship website At this time there are no relevant GRI indicators that directly correspond with PepsiCo’s Material Aspect. PepsiCo monitors and reports on this aspect through the KPIs discussed on our Global Citizenship website.
PEPSICO WEBSITEFor more information about our company, our sustainability priorities, our policies and the awards we’ve received, please see our corporate website at www.pepsico.com and http://www.pepsico.com/Purpose.
For greater detail on our sustainability performance, see our new, interactive A–Z Topics on pepsico.com.
For additional information about PepsiCo, please see our latest annual report at www.pepsico.com/investors.
We also welcome any inquiries on this report or our Performance with Purpose journey through email at [email protected].
This Sustainability Report was printed with Forest Stewardship Council® (FSC®)–certified paper made from post-consumer recycled fiber, using sustainable energy and fully recyclable toners. PepsiCo continues to reduce the costs and environmental impact of sustainability report printing and mailing by utilizing a distribution model that drives increased online readership and fewer printed copies. You can learn more about our environmental efforts at pepsico.com.
ENDNOTES1 Population Reference Bureau, 2017 World Population Data Sheet, accessed August 31, 2017, http://www.prb.org/Publications/Datasheets/2017/2017-world-population- data-sheet.aspx.2 World Health Organization, Obesity and Overweight Fact Sheet, accessed August 31, 2017, http://www.who.int/mediacentre/factsheets/fs311/en/.3 World Hunger Education Service, Hunger Notes, 2016 World Hunger and Poverty Facts and Statistics, accessed August 31, 2017, http://www.worldhunger.org/2015-world- hunger-and-poverty-facts-and-statistics/.4 UN Food and Agriculture Organization, Food wastage footprint: Impacts on natural resources, Summary Report, 2013, 12, http://www.fao.org/docrep/018/i3347e/i3347e.pdf.5 Worldometers, Brazil Population, accessed August 31, 2017, http://www.worldometers.info/world-population/brazil-population/.6 The World Bank, Global Economic Prospects, Data, accessed August 31, 2017, http://www.worldbank.org/en/publication/global-economic-prospects#data.7 Trading Economics, Brazil Unemployment Rate, accessed August 31, 2017, https://trading economics.com/brazil/unemployment-rate.8 O Globo, July 2016, accessed September 5, 2017, https://oglobo.globo.com/economia/lucro-natureba-brasil-ja-o-5-maior-mercado- de-alimentacao-saudavel-19818758.9 The World Bank, TheDATABlog, Chart: Globally, 70% of Freshwater Used for Agriculture, accessed August 31, 2017, https://blogs.worldbank.org/opendata/chart-globally-70-freshwater-used-agriculture.10 NASA, Climate, accessed August 31, 2017, https://www.nasa.gov/press-release/nasa- noaa-data-show-2016-warmest-year-on-record-globally.11 National Geographic (originally sourced from: Production, use and fate of all plastics ever made, Roland Geyer, Jenna R. Jambeck and Kara Lavender, Law Science Advances, Vol 3 #7 (July 19, 2017)), http://news.nationalgeographic.com/2017/07/plastic-produced-recycling-waste-ocean-trash-debris-environment/.12 High and Dry: Climate Change, Water, and the Economy, © 2016 International Bank for Reconstruction and Development / The World Bank.13 Food and Agriculture Organization of the United Nations, AQUASTAT, Water withdrawal by sector, accessed August 31, 2017, http://www.fao.org/nr/water/aquastat/tables/WorldData-Withdrawal_eng.pdf.
14 United Nations, UN data, Jordan, accessed August 31, 2017, http://data.un.org/CountryProfile.aspx?crName=JORDAN.15 Amnesty International Report 2016/17: The State of the World’s Human Rights, https://www.amnesty.org/download/Documents/POL1048002017ENGLISH.PDF.16 World Resources Institute, Ranking the World’s Most Water-Stressed Countries in 2040, accessed August 31, 2017, http:// www.wri.org/blog/2015/08/ranking-world’s-most-water-stressed-countries-2040.17 Roundtable on Sustainable Palm Oil, RSPO Smallholders Introduction, accessed August 31, 2017, http://www.rspo.org/smallholders.18 World Bank Group, Future of Food: Shaping the Food System to Deliver Jobs, © 2017 International Bank for Reconstruction and Development/The World Bank, http://documents.worldbank.org/curated/en/406511492528621198/pdf/114394-WP-PUBLIC-18-4-2017-10-56-45-ShapingtheFood SystemtoDeliverJobs.pdf.19 In OECD countries. The Organisation for Economic Co-operation and Development (OECD), Inequality and Income, accessed August 31, 2017, http://www.oecd.org/social/inequality.htm#income.20 FSG, The Global STEM Paradox, accessed August 31, 2017, http://www.fsg.org/publications/global-stem-paradox.21 In 2016. Youth unemployment rate refers to young people aged 15–24 years who are seeking work. United Nations, Department of Economic and Social Affairs, Sustainable Development Goal 8, accessed July 31, 2017, https://sustainabledevelopment.un.org/sdg8.22 Brief: Help Women Farmers ‘Get to Equal,’ The World Bank, accessed August 31, 2017, http://www.worldbank.org/en/topic/agriculture/brief/women-farmers-getting- to-equal.23 World Bank — WDI: Employment in agriculture (% of total employment), accessed August 31, 2017, https://ourworldindata.org/employment-in-agriculture.24 Migrant Workers in Commercial Agriculture, Philip L. Martin, © International Labour Organization, 2016.25 Refers to youth aged 5–17 years. Includes farming, fishing, aquaculture, forestry and livestock. ILO, http://www.ilo.org/ipec/areas/Agriculture/lang--en/index.htm, and ILO, http://www.ilo.org/ipec/areas/Agriculture/WCMS_172416/lang--en/index.htm.
FORWARD-LOOKING STATEMENTSThis PepsiCo, Inc. (“PepsiCo” or the “Company”) Sustainability Report contains statements reflecting our views about our future performance that constitute “ forward-looking statements” within the meaning of the Private Securities Litigation Reform Act of 1995. Forward-looking statements are generally identified through the inclusion of words such as “aim,” “anticipate,” “believe,” “drive,” “estimate,” “expect,” “goal,” “intend,” “may,” “plan,” “project,” “strategy,” “target” and “will” or similar state-ments or variations of such terms and other similar expressions. Forward-looking statements inherently involve risks and uncertainties that could cause actual results to differ materially from those predicted in such statements, including changes in demand for PepsiCo’s products, changes in, or failure to comply with, applicable laws and regulations, imposition or proposed imposition of new or increased taxes, imposition of labeling or warning requirements on PepsiCo’s products, changes in law related to packaging and disposal of PepsiCo’s products, PepsiCo’s ability to compete effectively and the other factors discussed in the risk factors section of PepsiCo’s most recent annual report on Form 10-K and subsequent reports on Forms 10-Q and 8-K. Investors are cautioned not to place undue reliance on any such forward-looking statements, which speak only as of the date they are made. PepsiCo undertakes no obligation to update any forward-looking statements, whether as a result of new information, future events or otherwise.
This publication contains many valuable trademarks owned and/or used by PepsiCo, Inc. and its subsidiaries and affiliates in the U.S. and internationally to distinguish prod-ucts and services of outstanding quality. All other trademarks featured herein are the property of their respective owners.D
esig
n by
Add
ison
w
ww
.add
ison
.com
76 | 77 PepsiCo Sustainability Report 2016

CORPORATE HEADQUARTERSPepsiCo, Inc.700 Anderson Hill RoadPurchase, NY 10577
Quaker 3 Minutos is a versatile, oat-based breakfast staple that Mexican consumers typically add to smoothies with fruit or to hot beverages such as atole. This quick-prep, nutritious option is being introduced to more markets across Latin America.