growth with purpose
TRANSCRIPT

2021 ANNUAL REPORT
Growth With Purpose

Our diverse, inclusive workforce energizes our
ceaseless innovation.
We invest in upskilling our people and the other
makers of the world.
We work as one across the world to deliver
meaningful results.
Our people make a difference every day, helping us thrive as a business and as a force for good.

12021 ANNUAL REPORT
Our purpose-driven culture and commitment to stakeholder capitalism has never played a more foundational role as the global pandemic’s effects reverberated across the globe. Stanley Black & Decker customers and employees joined the essential workforce that helped keep the world moving forward. We focused on doing everything we could to keep our workers safe and supply chains moving, boosting production to address unprecedented product demand and helping our communities recover. At the same time, our focus on performance and innovation and our commitment to creating long-term shareholder value was unwavering.
Amidst a dynamic operating environment, the Stanley Black & Decker team delivered a record-breaking performance in 2021—including all-time high revenue, organic growth and adjusted earnings per share.* I want to once again personally thank our 60,000-plus diverse and high performing employees for their continued commitment to our organization. I am truly grateful for the personal investment they make every day to ensure our success going forward.
Creating a Stronger and More Focused EnterpriseDuring 2021, we successfully announced several strategic actions to strengthen and focus our business portfolio into a faster growing, more profitable franchise. We completed two significant outdoor power equipment acquisitions that added $3 billion of annualized revenue and announced the divestiture of our Electronic Security business for a premium valuation of 16 times EBITDA.
In addition to the benefit of focus, these portfolio moves position us to return $4 billion of capital to our shareholders through share repurchases that we expect to complete in 2022. We also raised our dividend by 13% in July, our 54th consecutive increase, which extends our record for the longest, consecutive quarterly and annual dividend payments among industrial companies.
To Our StakeholdersAs the world’s largest tool company, Stanley Black & Decker has been built to serve the makers and creators, those doing the hard work, day in and day out, to create a better world around us. We are For Those Who Make The World—and we strive every day to fulfill this purpose. James M. Loree Chief Executive Officer
* Excludes Acquisition-Related and Other Charges
2 STANLEY BLACK & DECKER
Key 2021 Accomplishments• Record revenue, organic growth and adjusted
earnings per share*• Focused our portfolio with the sale of our Electronic Security
business and the acquisitions of MTD and Excel to create the world’s largest outdoor power equipment business
• Earned 60+ innovation awards in 2021, with 35% of 2021 tools revenue derived from new products launched within the prior three years
• Award-Winning Recognition: • Dow Jones Sustainability Indices’ World Index for
4th consecutive year• 100 Best Corporate Citizens for outstanding ESG
Performance (3BL Media)• Fortune’s World’s Most Admired, #1 in Category• Perfect score of 100 on the Corporate Equality Index• Forbes 2021 World’s Best Employers, America’s
Best Large Employers and America’s Best Employers for Women
• Fast Company’s Best Workplaces for Innovators
A Strong 2021 Performance from the World’s Largest Tool Company In 2021, we capitalized on extraordinarily strong customer demand fueled by macro trends, including the reconnection with home and garden, eCommerce and electrification. With our innovative products and portfolio of leading brands, we are uniquely positioned to leverage these secular tailwinds.
Full-year revenue totaled $15.6 billion, a 20% increase from the prior year, including 17% organic growth with all our businesses contributing. Our full-year operating margin rate was 13.9%*, and we delivered record diluted EPS* of $10.48, up 30% over the prior year. We navigated a dynamic market and operating backdrop and prioritized serving the
strong demand. We actively addressed this environment by adding capacity and new suppliers, and implementing price increases to support our margins. Accordingly, free cash flow was temporarily muted as we strategically prioritized building the inventory required to serve our customers and help navigate the stretched global supply chain, as well as support the strong demand we see for 2022.
Tools & Storage achieved 20% organic growth, in 2021, as the business served a persistently strong tool market driven by a consumer refocused on their home and garden, eCommerce and strong professional demand. These trends were evident across all global markets, including North America (+16%), Europe (+27%) and emerging markets (+40%). Innovation also fueled our success in 2021 as a steady stream of new products were brought to market across all our brands and categories, with over 2,000 new introductions.
The Industrial business grew 3% organically in the face of mixed end-markets. The industrial fastener and attachment tool businesses delivered mid-teens growth, offsetting COVID-driven sector headwinds in the automotive and aerospace sectors.
Building the Supply Chain of the FutureThe Stanley Black & Decker Operating Model (SBD Operating Model) also supports our growing manufacturing base and supply chain. As the world’s largest tool company and the only major power tool manufacturer domiciled in the U.S., we expanded to 50 manufacturing facilities across America as well as more than 100 facilities worldwide to serve our local customers abroad. To support this manufacturing ecosystem, we are taking the opportunity to reimagine our supply chain for the future to be more efficient and to better serve our customers. This includes capacity expansion, strategic sourcing, factory automation and AI, and supporting U.S. manufacturing here at home.
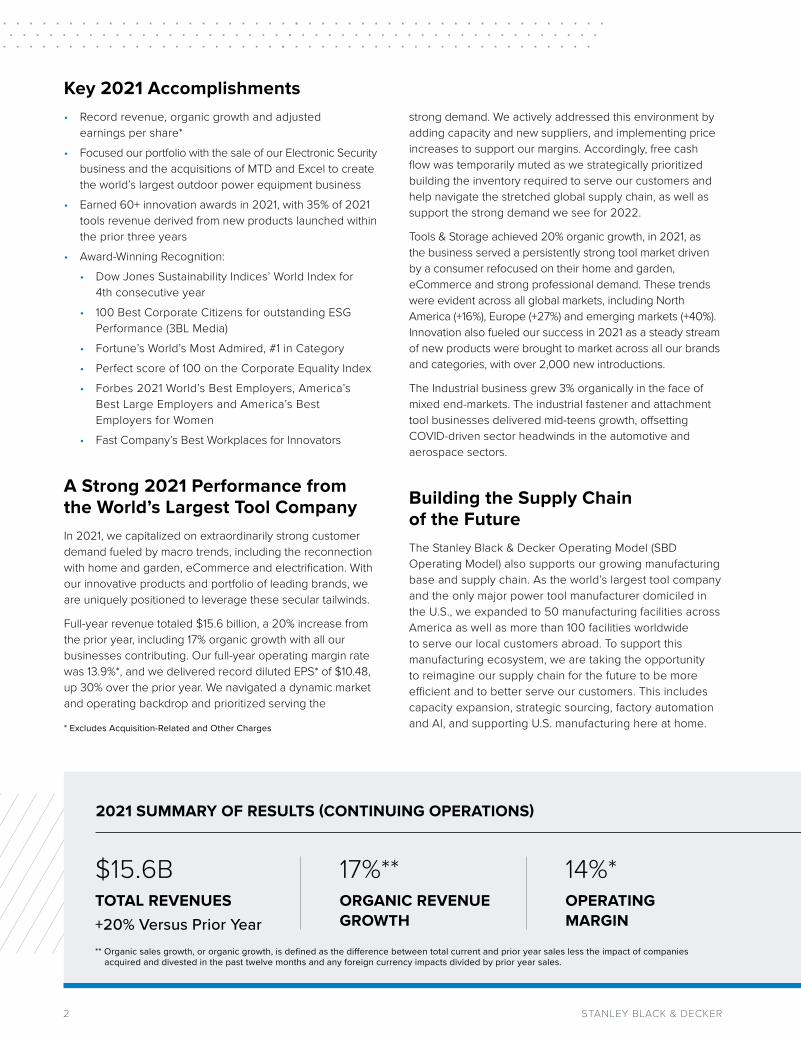
2021 SUMMARY OF RESULTS (CONTINUING OPERATIONS)
$15.6BTOTAL REVENUES
+20% Versus Prior Year
14%*OPERATING MARGIN
17%**ORGANIC REVENUE GROWTH
* Excludes Acquisition-Related and Other Charges
** Organic sales growth, or organic growth, is defined as the difference between total current and prior year sales less the impact of companies acquired and divested in the past twelve months and any foreign currency impacts divided by prior year sales.
32021 ANNUAL REPORT
We took multiple, targeted actions in 2021 to navigate the global supply chain and position our business for the necessary capacity, sourcing, operational efficiency and resilience to best serve our customers. Key investments included adding capacity consistent with our “Make Where We Sell” strategy, co-investing with strategic sourcing partners with a focus on batteries and semiconductors, and investing in automation to support productivity, labor efficiency and competitive cost.
Our capacity additions are on track and, in 2021, we opened two new power tool plants and one new hand tool facility in North America. These new manufacturing plants will enable shorter lead times and be accompanied by parallel regional development of our supply chain base over time, enhancing local sourcing and speed to market.
As it relates to strategic sourcing, we have added new battery and semiconductor suppliers and made co-investments with key partners that put us in a strong position as we enter 2022. We have the necessary battery supply and capacity to support significant growth in Tools and to support our electrification strategy in Outdoor. Semiconductor shortages
have been a pain point for many global industrial companies, including us. Accordingly, we have been investing to improve supply to enable significant Tools growth, adding new secondary and tertiary suppliers for chips, co-investing with tier one suppliers to improve their capacity, and taking actions to lower lead times across our supply base.
We are also advancing our state-of-the-art Industry 4.0 capabilities, driving automation throughout our manufacturing environment. This will make our U.S. manufacturing plants more competitive, as well as improve productivity in factories across the globe.
Attractive Growth BackdropWhile strengthening our supply chain we are also investing to keep our market and brand vitality fresh across key growth catalysts, including innovation, eCommerce, and electrification that will position us for sustained share gains into the future.
Across the board, we have competitive strategic differentiators that make us the world’s leading tool company. Our iconic brands, DeWALT, CRAFTSMAN,
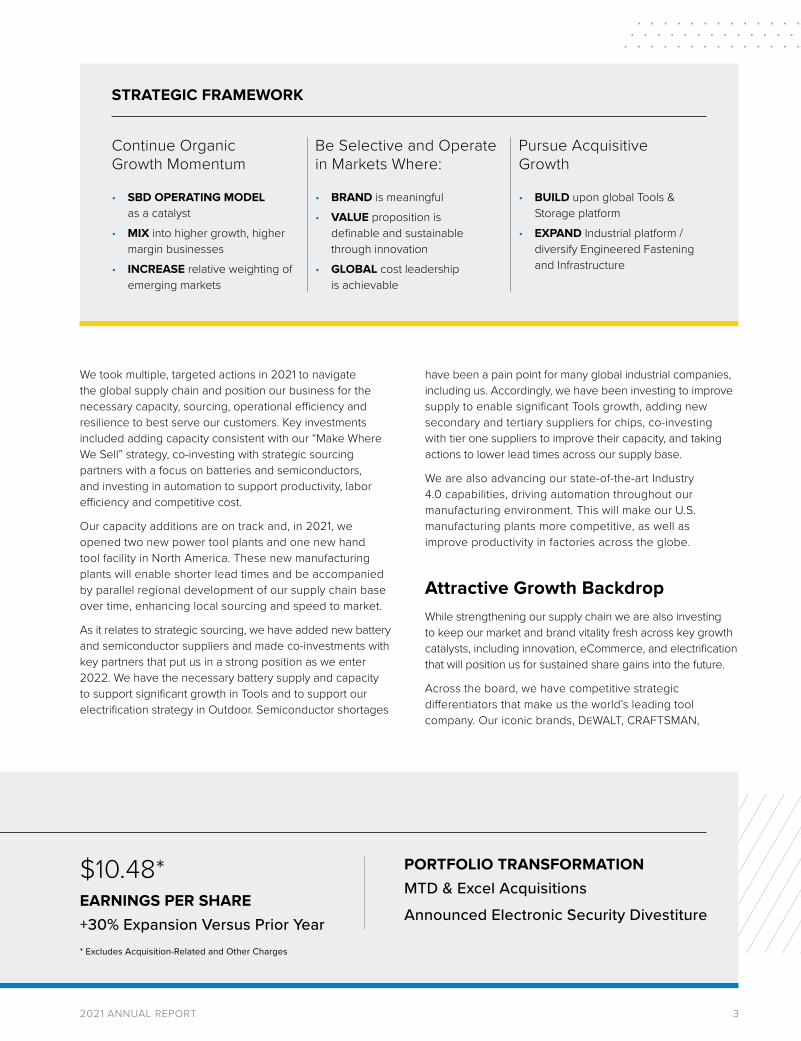
2021 SUMMARY OF RESULTS (CONTINUING OPERATIONS)
$10.48*EARNINGS PER SHARE
+30% Expansion Versus Prior Year
PORTFOLIO TRANSFORMATION
MTD & Excel Acquisitions Announced Electronic Security Divestiture
STRATEGIC FRAMEWORK
Continue Organic Growth Momentum
• SBD OPERATING MODEL as a catalyst
• MIX into higher growth, higher margin businesses
• INCREASE relative weighting of emerging markets
Be Selective and Operate in Markets Where:
• BRAND is meaningful• VALUE proposition is
definable and sustainable through innovation
• GLOBAL cost leadership is achievable
Pursue Acquisitive Growth
• BUILD upon global Tools & Storage platform
• EXPAND Industrial platform / diversify Engineered Fastening and Infrastructure
* Excludes Acquisition-Related and Other Charges
4 STANLEY BLACK & DECKER
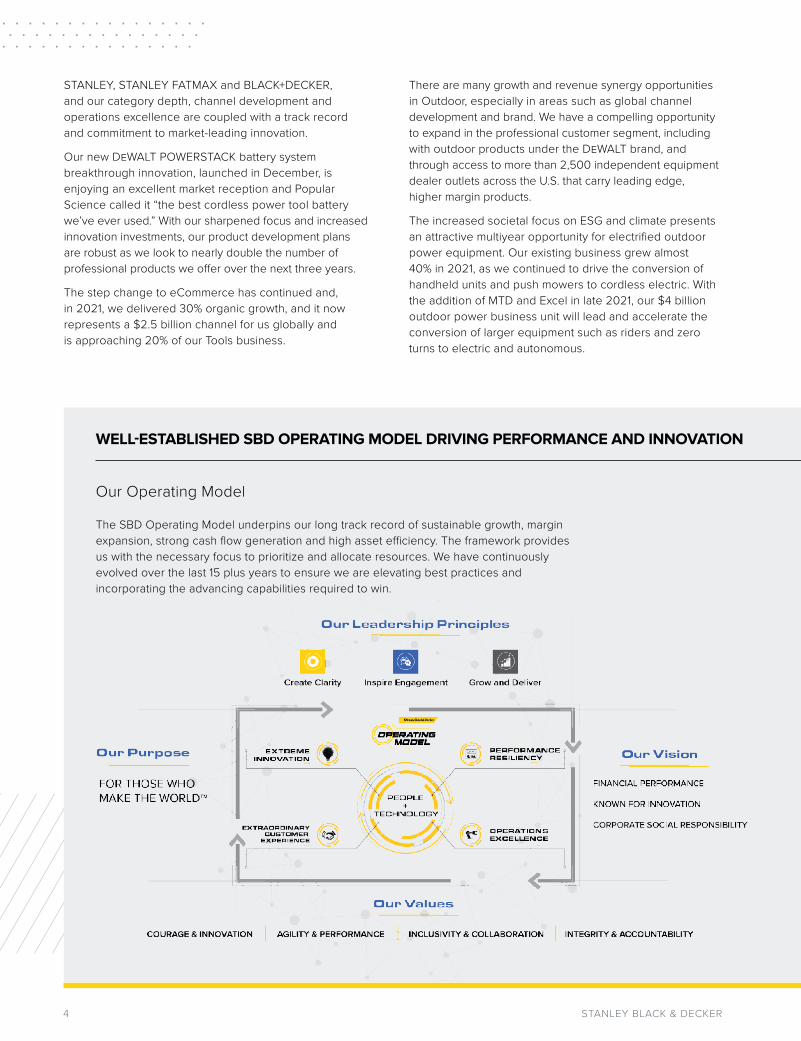
Our Operating Model
The SBD Operating Model underpins our long track record of sustainable growth, margin expansion, strong cash flow generation and high asset efficiency. The framework provides us with the necessary focus to prioritize and allocate resources. We have continuously evolved over the last 15 plus years to ensure we are elevating best practices and incorporating the advancing capabilities required to win.
WELL-ESTABLISHED SBD OPERATING MODEL DRIVING PERFORMANCE AND INNOVATION
STANLEY, STANLEY FATMAX and BLACK+DECKER, and our category depth, channel development and operations excellence are coupled with a track record and commitment to market-leading innovation.
Our new DeWALT POWERSTACK battery system breakthrough innovation, launched in December, is enjoying an excellent market reception and Popular Science called it “the best cordless power tool battery we’ve ever used.” With our sharpened focus and increased innovation investments, our product development plans are robust as we look to nearly double the number of professional products we offer over the next three years.
The step change to eCommerce has continued and, in 2021, we delivered 30% organic growth, and it now represents a $2.5 billion channel for us globally and is approaching 20% of our Tools business.
There are many growth and revenue synergy opportunities in Outdoor, especially in areas such as global channel development and brand. We have a compelling opportunity to expand in the professional customer segment, including with outdoor products under the DeWALT brand, and through access to more than 2,500 independent equipment dealer outlets across the U.S. that carry leading edge, higher margin products.
The increased societal focus on ESG and climate presents an attractive multiyear opportunity for electrified outdoor power equipment. Our existing business grew almost 40% in 2021, as we continued to drive the conversion of handheld units and push mowers to cordless electric. With the addition of MTD and Excel in late 2021, our $4 billion outdoor power business unit will lead and accelerate the conversion of larger equipment such as riders and zero turns to electric and autonomous.
52021 ANNUAL REPORT
WELL-ESTABLISHED SBD OPERATING MODEL DRIVING PERFORMANCE AND INNOVATION
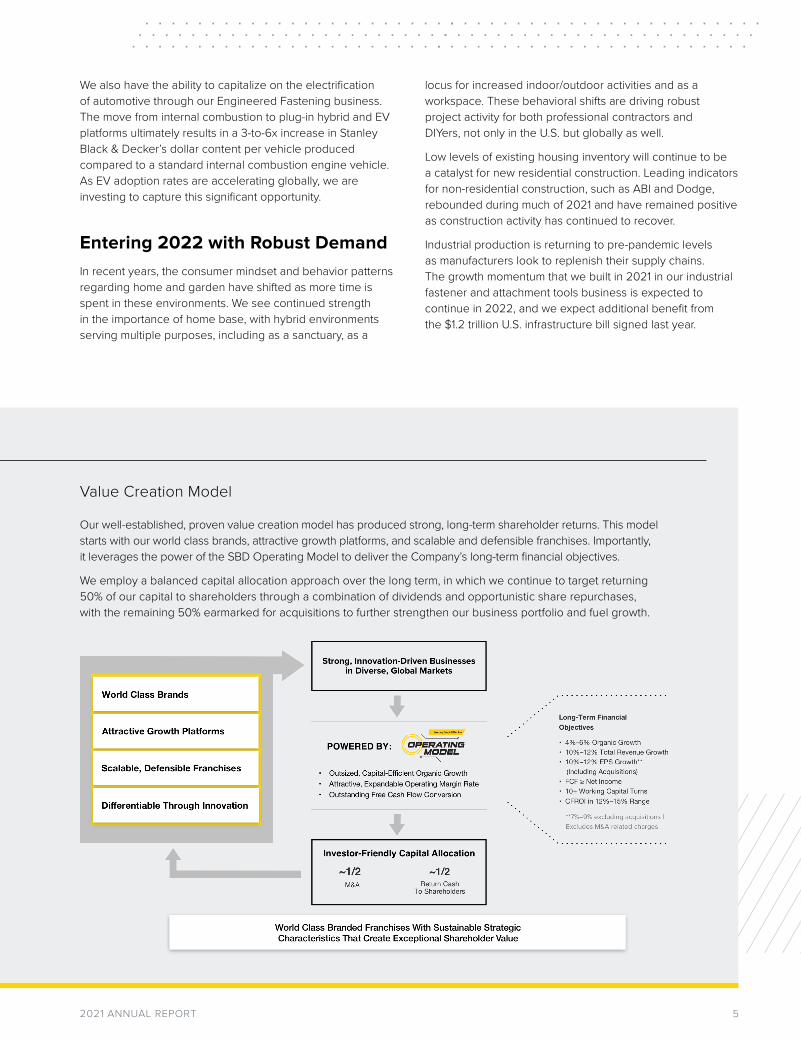
Value Creation Model
Our well-established, proven value creation model has produced strong, long-term shareholder returns. This model starts with our world class brands, attractive growth platforms, and scalable and defensible franchises. Importantly, it leverages the power of the SBD Operating Model to deliver the Company’s long-term financial objectives.
We employ a balanced capital allocation approach over the long term, in which we continue to target returning 50% of our capital to shareholders through a combination of dividends and opportunistic share repurchases, with the remaining 50% earmarked for acquisitions to further strengthen our business portfolio and fuel growth.
We also have the ability to capitalize on the electrification of automotive through our Engineered Fastening business. The move from internal combustion to plug-in hybrid and EV platforms ultimately results in a 3-to-6x increase in Stanley Black & Decker’s dollar content per vehicle produced compared to a standard internal combustion engine vehicle. As EV adoption rates are accelerating globally, we are investing to capture this significant opportunity.
Entering 2022 with Robust DemandIn recent years, the consumer mindset and behavior patterns regarding home and garden have shifted as more time is spent in these environments. We see continued strength in the importance of home base, with hybrid environments serving multiple purposes, including as a sanctuary, as a
locus for increased indoor/outdoor activities and as a workspace. These behavioral shifts are driving robust project activity for both professional contractors and DIYers, not only in the U.S. but globally as well.
Low levels of existing housing inventory will continue to be a catalyst for new residential construction. Leading indicators for non-residential construction, such as ABI and Dodge, rebounded during much of 2021 and have remained positive as construction activity has continued to recover.
Industrial production is returning to pre-pandemic levels as manufacturers look to replenish their supply chains. The growth momentum that we built in 2021 in our industrial fastener and attachment tools business is expected to continue in 2022, and we expect additional benefit from the $1.2 trillion U.S. infrastructure bill signed last year.
6 STANLEY BLACK & DECKER
Our Commitment to DEI LeadershipDiverse workplaces are critical to advancing innovation, solving problems and developing solutions to the wide range of challenges we face in this complex, ever-changing world. Stanley Black & Decker is committed to building an inclusive culture where employees feel valued and heard, and are positioned to succeed. Early in 2021, we created a Chief Diversity Officer position reporting to me and responsible for accelerating our DEI progress and strengthening our accountability. Today, the Company has 12,000 employees engaged in nine employee resource groups across the globe formed around various dimensions of diversity, where my team and I also serve as executive sponsors. These groups fuel our pipeline of leadership talent and also serve as agents of change in our communities, helping to advance our ESG initiatives. We are committed to achieving 50-50 gender parity in our leadership by 2030. Today, approximately 33% of our global workforce are women, and about 34% of our U.S. workforce are racially or ethnically diverse. My direct staff and our Board of Directors are also comprised of approximately one-third women leaders and have racially or ethnically diverse representation. Stanley Black & Decker participates in the Business Roundtable Diversity & Inclusion Index, where many of the largest U.S.-based employers are committed to building more inclusive environments. And we are proud to be a signatory of Paradigm for Parity, committing to addressing the gender gap in corporate leadership.
Our Commitment to ESG LeadershipAt Stanley Black & Decker, we have a comprehensive approach to ESG—rooted in our purpose and grounded in stakeholder capitalism. The need for sustainable business practices has never been more critical, ushering in a new age of ESG for corporate America where corporations need to step up on societal issues to keep the world moving
forward. It’s the most significant generational movement that I have encountered in four decades in business. Nowhere is this more pressing than addressing one of the world’s biggest challenges of reducing carbon emissions to tackle climate change.
To accelerate our roadmap to achieve Net Zero, we are on a path to eliminate our Scope 1 and Scope 2 emissions by 2030. Our goal is 35% reduction in Scope 3 emissions in the same timeframe. A key factor for this reduction is driving our suppliers to follow our lead and set science-based emission reduction targets to reduce their Scope 1 and Scope 2 carbon emissions. We also have a business opportunity related to ESG as we apply circular design and lower the environmental impact of our packaging and support electrification in outdoor products and automotive. I believe business has an opportunity, and an obligation in order to sustain their own future existence, to act now.
More detail on our ESG strategy and actions will be available in our 2021 ESG report that will launch in April.
Stanley Black & Decker’s Future Has Never Been BrighterWith a focused strategy, robust secular growth drivers and a strong ESG commitment, I am truly optimistic about the multiyear runway for expansion we see for 2022 and beyond.
I want to thank you for your investment, as well as the confidence you have placed in our company and our team.
Sincerely,
James M. Loree Chief Executive Officer
72021 ANNUAL REPORT
RECOGNIZING GEORGE W. BUCKLEY AND WELCOMING ANDREA J. AYERS AS CHAIR
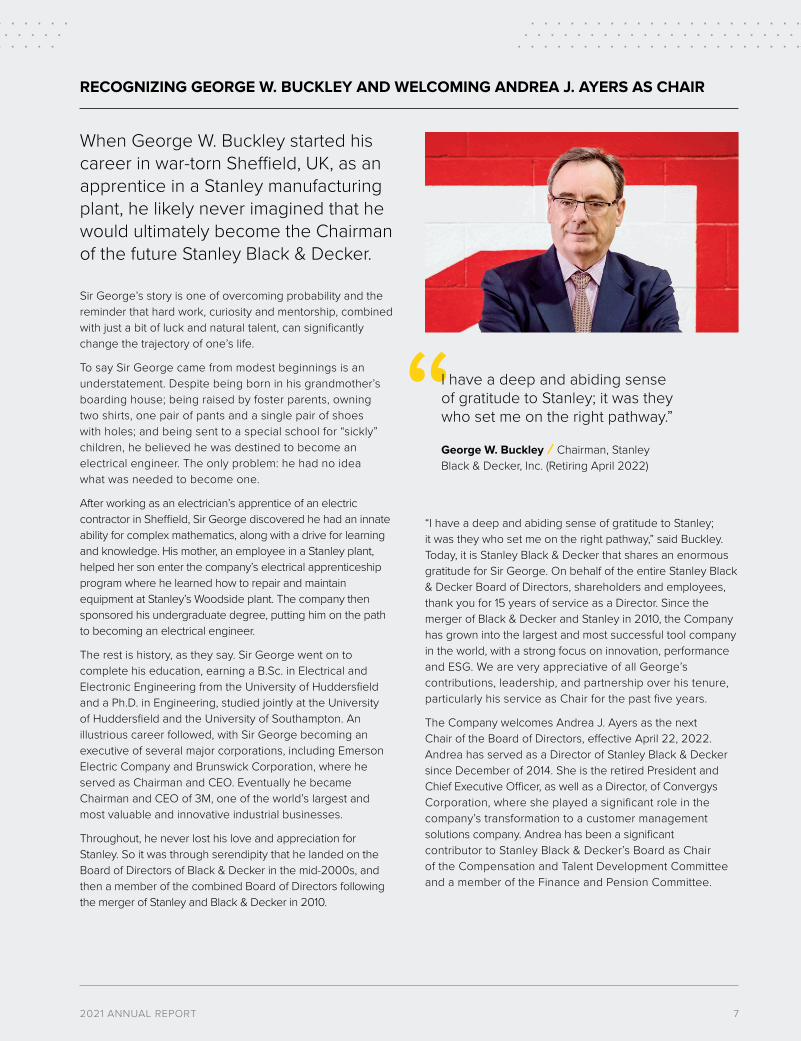
When George W. Buckley started his career in war-torn Sheffield, UK, as an apprentice in a Stanley manufacturing plant, he likely never imagined that he would ultimately become the Chairman of the future Stanley Black & Decker.
Sir George’s story is one of overcoming probability and the reminder that hard work, curiosity and mentorship, combined with just a bit of luck and natural talent, can significantly change the trajectory of one’s life.
To say Sir George came from modest beginnings is an understatement. Despite being born in his grandmother’s boarding house; being raised by foster parents, owning two shirts, one pair of pants and a single pair of shoes with holes; and being sent to a special school for “sickly” children, he believed he was destined to become an electrical engineer. The only problem: he had no idea what was needed to become one.
After working as an electrician’s apprentice of an electric contractor in Sheffield, Sir George discovered he had an innate ability for complex mathematics, along with a drive for learning and knowledge. His mother, an employee in a Stanley plant, helped her son enter the company’s electrical apprenticeship program where he learned how to repair and maintain equipment at Stanley’s Woodside plant. The company then sponsored his undergraduate degree, putting him on the path to becoming an electrical engineer.
The rest is history, as they say. Sir George went on to complete his education, earning a B.Sc. in Electrical and Electronic Engineering from the University of Huddersfield and a Ph.D. in Engineering, studied jointly at the University of Huddersfield and the University of Southampton. An illustrious career followed, with Sir George becoming an executive of several major corporations, including Emerson Electric Company and Brunswick Corporation, where he served as Chairman and CEO. Eventually he became Chairman and CEO of 3M, one of the world’s largest and most valuable and innovative industrial businesses.
Throughout, he never lost his love and appreciation for Stanley. So it was through serendipity that he landed on the Board of Directors of Black & Decker in the mid-2000s, and then a member of the combined Board of Directors following the merger of Stanley and Black & Decker in 2010.
“I have a deep and abiding sense of gratitude to Stanley; it was they who set me on the right pathway,” said Buckley. Today, it is Stanley Black & Decker that shares an enormous gratitude for Sir George. On behalf of the entire Stanley Black & Decker Board of Directors, shareholders and employees, thank you for 15 years of service as a Director. Since the merger of Black & Decker and Stanley in 2010, the Company has grown into the largest and most successful tool company in the world, with a strong focus on innovation, performance and ESG. We are very appreciative of all George’s contributions, leadership, and partnership over his tenure, particularly his service as Chair for the past five years.
The Company welcomes Andrea J. Ayers as the next Chair of the Board of Directors, effective April 22, 2022. Andrea has served as a Director of Stanley Black & Decker since December of 2014. She is the retired President and Chief Executive Officer, as well as a Director, of Convergys Corporation, where she played a significant role in the company’s transformation to a customer management solutions company. Andrea has been a significant contributor to Stanley Black & Decker’s Board as Chair of the Compensation and Talent Development Committee and a member of the Finance and Pension Committee.
“I have a deep and abiding sense of gratitude to Stanley; it was they who set me on the right pathway.”
George W. Buckley Chairman, Stanley Black & Decker, Inc. (Retiring April 2022)
8 STANLEY BLACK & DECKER
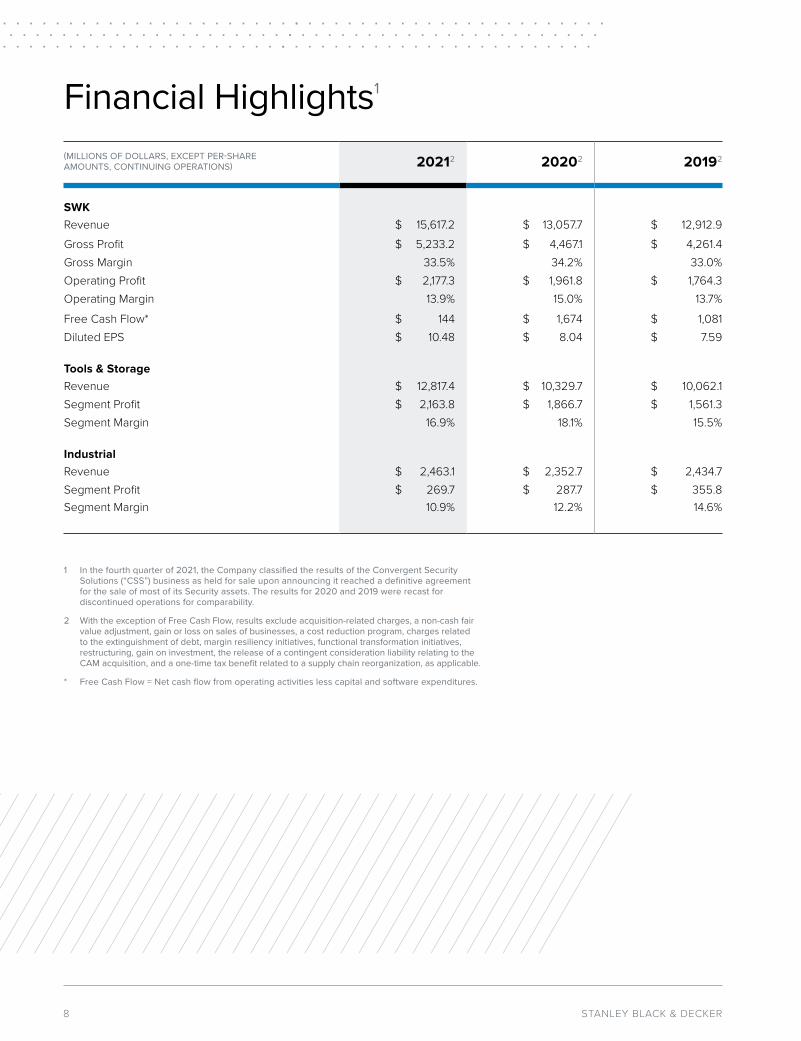
Financial Highlights1
(MILLIONS OF DOLLARS, EXCEPT PER-SHARE AMOUNTS, CONTINUING OPERATIONS) 20212 20202 20192
SWKRevenue $ 15,617.2 $ 13,057.7 $ 12,912.9 Gross Profit $ 5,233.2 $ 4,467.1 $ 4,261.4 Gross Margin 33.5% 34.2% 33.0%Operating Profit $ 2,177.3 $ 1,961.8 $ 1,764.3 Operating Margin 13.9% 15.0% 13.7%
Free Cash Flow* $ 144 $ 1,674 $ 1,081 Diluted EPS $ 10.48 $ 8.04 $ 7.59
Tools & StorageRevenue $ 12,817.4 $ 10,329.7 $ 10,062.1 Segment Profit $ 2,163.8 $ 1,866.7 $ 1,561.3 Segment Margin 16.9% 18.1% 15.5%
IndustrialRevenue $ 2,463.1 $ 2,352.7 $ 2,434.7 Segment Profit $ 269.7 $ 287.7 $ 355.8 Segment Margin 10.9% 12.2% 14.6%
1 In the fourth quarter of 2021, the Company classified the results of the Convergent Security Solutions (“CSS”) business as held for sale upon announcing it reached a definitive agreement for the sale of most of its Security assets. The results for 2020 and 2019 were recast for discontinued operations for comparability.
2 With the exception of Free Cash Flow, results exclude acquisition-related charges, a non-cash fair value adjustment, gain or loss on sales of businesses, a cost reduction program, charges related to the extinguishment of debt, margin resiliency initiatives, functional transformation initiatives, restructuring, gain on investment, the release of a contingent consideration liability relating to the CAM acquisition, and a one-time tax benefit related to a supply chain reorganization, as applicable.
* Free Cash Flow = Net cash flow from operating activities less capital and software expenditures.
92021 ANNUAL REPORT
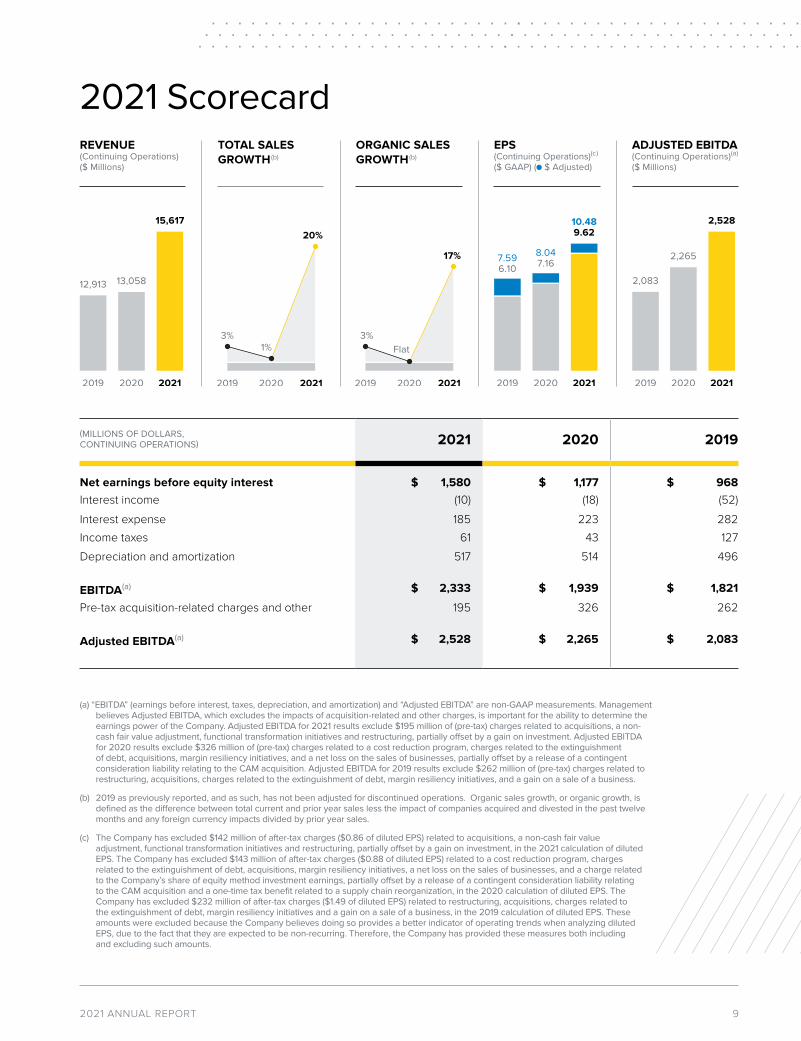
2021 Scorecard
(MILLIONS OF DOLLARS, CONTINUING OPERATIONS) 2021 2020 2019
Net earnings before equity interest $ 1,580 $ 1,177 $ 968Interest income (10) (18) (52)Interest expense 185 223 282 Income taxes 61 43 127 Depreciation and amortization 517 514 496
EBITDA(a) $ 2,333 $ 1,939 $ 1,821
Pre-tax acquisition-related charges and other 195 326 262
Adjusted EBITDA(a) $ 2,528 $ 2,265 $ 2,083
REVENUE(Continuing Operations) ($ Millions)
TOTAL SALES GROWTH (b)
ORGANIC SALES GROWTH (b)
EPS(Continuing Operations)(c) ($ GAAP) ( $ Adjusted)
ADJUSTED EBITDA(Continuing Operations)(a) ($ Millions)
2019
2,083
2020
2,265
2021
2,528
2019
7.596.10
2020
7.168.04
2021
10.489.62
2019
3%
2020
Flat
2021
17%
2019
3%
2020
1%
2021
20%
2019
12,913
2020
13,058
2021
15,617
(a) “EBITDA” (earnings before interest, taxes, depreciation, and amortization) and “Adjusted EBITDA” are non-GAAP measurements. Management believes Adjusted EBITDA, which excludes the impacts of acquisition-related and other charges, is important for the ability to determine the earnings power of the Company. Adjusted EBITDA for 2021 results exclude $195 million of (pre-tax) charges related to acquisitions, a non-cash fair value adjustment, functional transformation initiatives and restructuring, partially offset by a gain on investment. Adjusted EBITDA for 2020 results exclude $326 million of (pre-tax) charges related to a cost reduction program, charges related to the extinguishment of debt, acquisitions, margin resiliency initiatives, and a net loss on the sales of businesses, partially offset by a release of a contingent consideration liability relating to the CAM acquisition. Adjusted EBITDA for 2019 results exclude $262 million of (pre-tax) charges related to restructuring, acquisitions, charges related to the extinguishment of debt, margin resiliency initiatives, and a gain on a sale of a business.
(b) 2019 as previously reported, and as such, has not been adjusted for discontinued operations. Organic sales growth, or organic growth, is defined as the difference between total current and prior year sales less the impact of companies acquired and divested in the past twelve months and any foreign currency impacts divided by prior year sales.
(c) The Company has excluded $142 million of after-tax charges ($0.86 of diluted EPS) related to acquisitions, a non-cash fair value adjustment, functional transformation initiatives and restructuring, partially offset by a gain on investment, in the 2021 calculation of diluted EPS. The Company has excluded $143 million of after-tax charges ($0.88 of diluted EPS) related to a cost reduction program, charges related to the extinguishment of debt, acquisitions, margin resiliency initiatives, a net loss on the sales of businesses, and a charge related to the Company’s share of equity method investment earnings, partially offset by a release of a contingent consideration liability relating to the CAM acquisition and a one-time tax benefit related to a supply chain reorganization, in the 2020 calculation of diluted EPS. The Company has excluded $232 million of after-tax charges ($1.49 of diluted EPS) related to restructuring, acquisitions, charges related to the extinguishment of debt, margin resiliency initiatives and a gain on a sale of a business, in the 2019 calculation of diluted EPS. These amounts were excluded because the Company believes doing so provides a better indicator of operating trends when analyzing diluted EPS, due to the fact that they are expected to be non-recurring. Therefore, the Company has provided these measures both including and excluding such amounts.
10 STANLEY BLACK & DECKER
At a Glance
LEADING BRANDS
Tools & Storage STANLEY
DeWALT
CRAFTSMAN
Cub Cadet
BLACK+ DECKER
Troy-Bilt
PORTER-CABLE
BOSTITCH
Powers
Lenox
Irwin
Facom
MAC Tools
Sidchrome
Proto
Vidmar
Lista
Robomow
WOLF-Garten
Hustler Turf
Industrial STANLEY Engineered Fastening
STANLEY Infrastructure
STANLEY LaBounty
STANLEY Oil & Gas
Aerofit
Bristol
Consolidated Aerospace Manufacturing
CribMaster
EA Patton
Pengo
Paladin
Voss
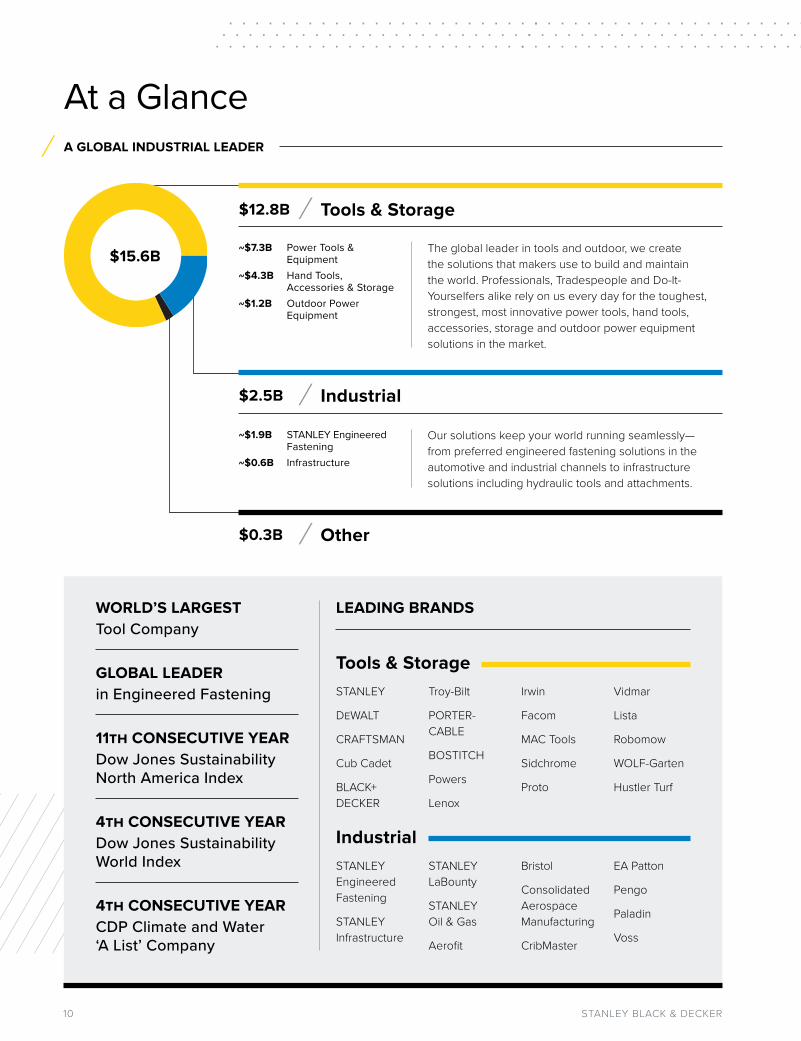
A GLOBAL INDUSTRIAL LEADER
Tools & Storage$12.8B
~$7.3B Power Tools & Equipment
~$4.3B Hand Tools, Accessories & Storage
~$1.2B Outdoor Power Equipment
The global leader in tools and outdoor, we create the solutions that makers use to build and maintain the world. Professionals, Tradespeople and Do-It-Yourselfers alike rely on us every day for the toughest, strongest, most innovative power tools, hand tools, accessories, storage and outdoor power equipment solutions in the market.
Industrial$2.5B
~$1.9B STANLEY Engineered Fastening
~$0.6B Infrastructure
Our solutions keep your world running seamlessly—from preferred engineered fastening solutions in the automotive and industrial channels to infrastructure solutions including hydraulic tools and attachments.
Other$0.3B
11th CONSECUTIVE YEARDow Jones Sustainability North America Index
4th CONSECUTIVE YEARDow Jones Sustainability World Index
4th CONSECUTIVE YEARCDP Climate and Water ‘A List’ Company
GLOBAL LEADERin Engineered Fastening
WORLD’S LARGESTTool Company
$15.6B
112021 ANNUAL REPORT
500,000
100,000
200,000
300,000
400,000
018 19 20 21 2030171615
SBT
Base
line
mT
CO
2e
Science-Based Target (SBT)
18 19 20 2021 2030
500,000,000
28,931,542
8,875,052
206,539169,53018 19 20 2021 2030
10,000,000
2,677,103
1,815,960
671,838203,230
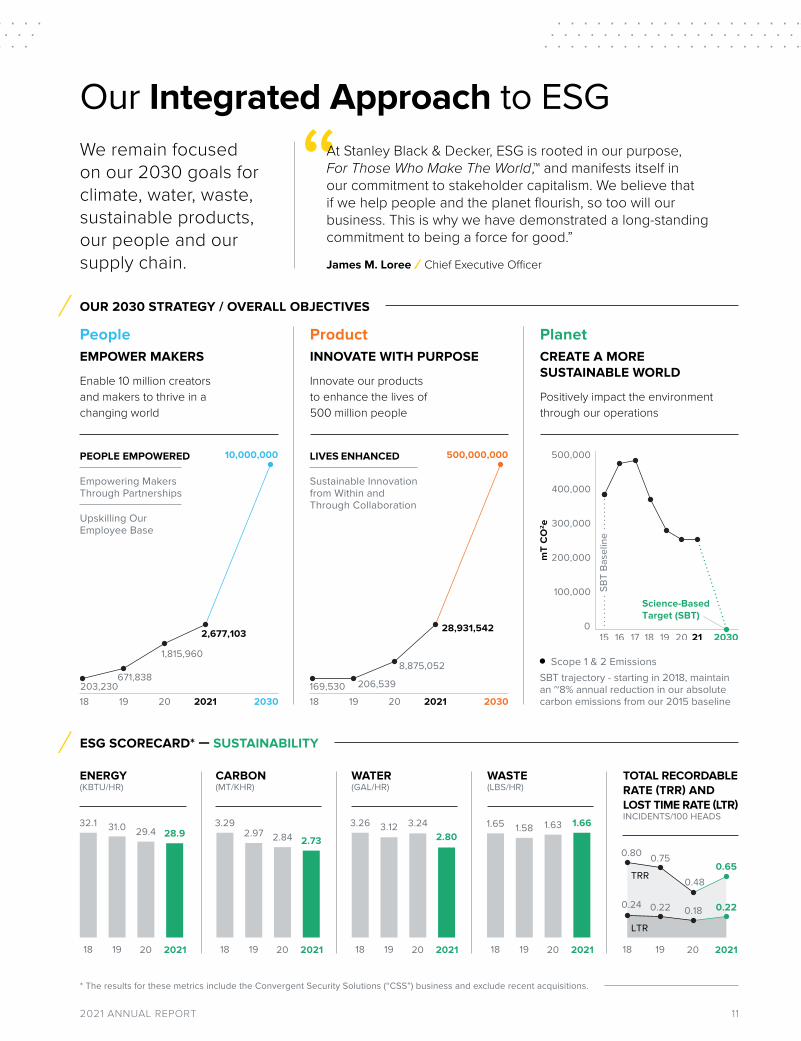
Our Integrated Approach to ESG We remain focused on our 2030 goals for climate, water, waste, sustainable products, our people and our supply chain.
ESG SCORECARD* — SUSTAINABILITY
Upskilling Our Employee Base
OUR 2030 STRATEGY / OVERALL OBJECTIVES
PeopleEMPOWER MAKERS
Enable 10 million creators and makers to thrive in a changing world
ProductINNOVATE WITH PURPOSE
Innovate our products to enhance the lives of 500 million people
PlanetCREATE A MORE SUSTAINABLE WORLD
Positively impact the environment through our operations
Scope 1 & 2 EmissionsSBT trajectory - starting in 2018, maintain an ~8% annual reduction in our absolute carbon emissions from our 2015 baseline
LIVES ENHANCED
Sustainable Innovation from Within and Through Collaboration
PEOPLE EMPOWERED
Empowering Makers Through Partnerships
ENERGY(KBTU/HR)
CARBON(MT/KHR)
WATER(GAL/HR)
WASTE(LBS/HR)
TOTAL RECORDABLE RATE (TRR) AND LOST TIME RATE (LTR)INCIDENTS/100 HEADS
0.24
LTR
TRR
0.22 0.18 0.22
0.80 0.75
0.480.65
1918 20 20211918
1.65 1.58 1.63 1.66
20 20211918
3.26 3.12 3.242.80
20 20211918
3.292.97 2.84 2.73
20 20211918
32.1 31.0 29.4 28.9
20 2021
“At Stanley Black & Decker, ESG is rooted in our purpose, For Those Who Make The World,™ and manifests itself in our commitment to stakeholder capitalism. We believe that if we help people and the planet flourish, so too will our business. This is why we have demonstrated a long-standing commitment to being a force for good.”
James M. Loree Chief Executive Officer
* The results for these metrics include the Convergent Security Solutions (“CSS”) business and exclude recent acquisitions.
12 STANLEY BLACK & DECKER
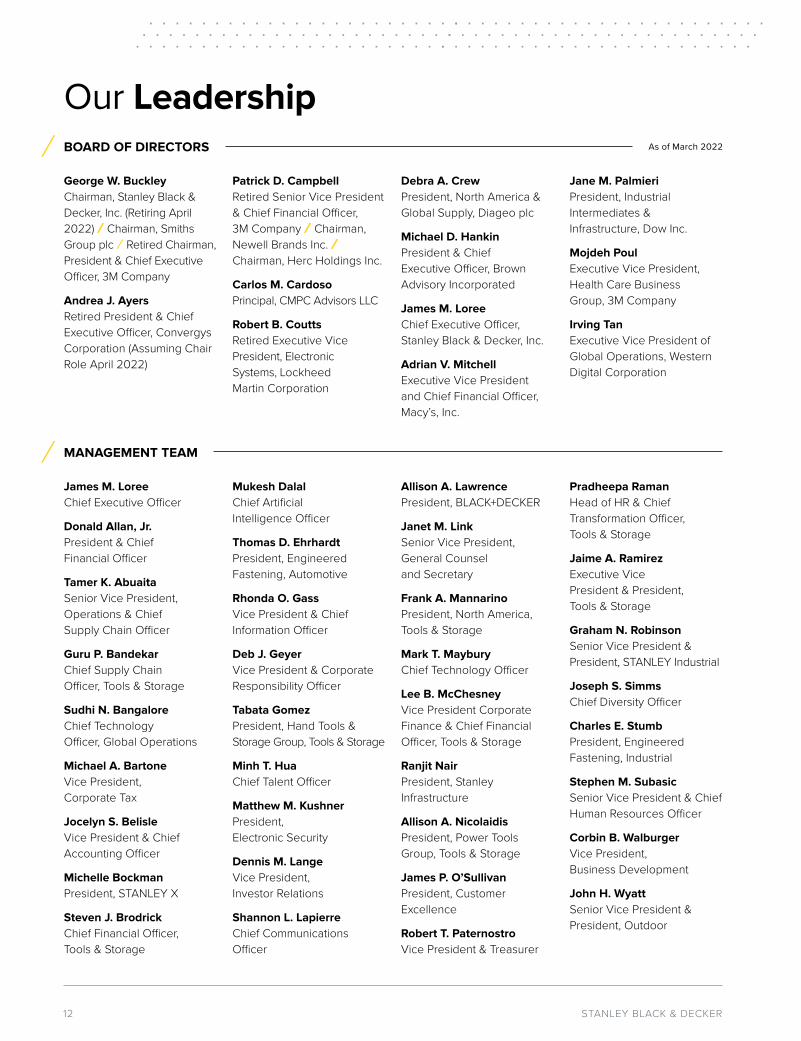
Our Leadership
MANAGEMENT TEAM
BOARD OF DIRECTORS
George W. Buckley Chairman, Stanley Black & Decker, Inc. (Retiring April 2022) Chairman, Smiths Group plc Retired Chairman, President & Chief Executive Officer, 3M Company
Andrea J. Ayers Retired President & Chief Executive Officer, Convergys Corporation (Assuming Chair Role April 2022)
Patrick D. Campbell Retired Senior Vice President & Chief Financial Officer, 3M Company Chairman, Newell Brands Inc. Chairman, Herc Holdings Inc.
Carlos M. Cardoso Principal, CMPC Advisors LLC
Robert B. Coutts Retired Executive Vice President, Electronic Systems, Lockheed Martin Corporation
Debra A. Crew President, North America & Global Supply, Diageo plc
Michael D. Hankin President & Chief Executive Officer, Brown Advisory Incorporated
James M. Loree Chief Executive Officer, Stanley Black & Decker, Inc.
Adrian V. Mitchell Executive Vice President and Chief Financial Officer, Macy’s, Inc.
Jane M. Palmieri President, Industrial Intermediates & Infrastructure, Dow Inc.
Mojdeh Poul Executive Vice President, Health Care Business Group, 3M Company
Irving Tan Executive Vice President of Global Operations, Western Digital Corporation
James M. Loree Chief Executive Officer
Donald Allan, Jr. President & Chief Financial Officer
Tamer K. Abuaita Senior Vice President, Operations & Chief Supply Chain Officer
Guru P. Bandekar Chief Supply Chain Officer, Tools & Storage
Sudhi N. Bangalore Chief Technology Officer, Global Operations
Michael A. Bartone Vice President, Corporate Tax
Jocelyn S. Belisle Vice President & Chief Accounting Officer
Michelle Bockman President, STANLEY X
Steven J. Brodrick Chief Financial Officer, Tools & Storage
Mukesh Dalal Chief Artificial Intelligence Officer
Thomas D. Ehrhardt President, Engineered Fastening, Automotive
Rhonda O. Gass Vice President & Chief Information Officer
Deb J. Geyer Vice President & Corporate Responsibility Officer
Tabata Gomez President, Hand Tools & Storage Group, Tools & Storage
Minh T. Hua Chief Talent Officer
Matthew M. Kushner President, Electronic Security
Dennis M. Lange Vice President, Investor Relations
Shannon L. Lapierre Chief Communications Officer
Allison A. Lawrence President, BLACK+DECKER
Janet M. Link Senior Vice President, General Counsel and Secretary
Frank A. Mannarino President, North America, Tools & Storage
Mark T. Maybury Chief Technology Officer
Lee B. McChesney Vice President Corporate Finance & Chief Financial Officer, Tools & Storage
Ranjit Nair President, Stanley Infrastructure
Allison A. Nicolaidis President, Power Tools Group, Tools & Storage
James P. O’Sullivan President, Customer Excellence
Robert T. Paternostro Vice President & Treasurer
Pradheepa Raman Head of HR & Chief Transformation Officer, Tools & Storage
Jaime A. Ramirez Executive Vice President & President, Tools & Storage
Graham N. Robinson Senior Vice President & President, STANLEY Industrial
Joseph S. Simms Chief Diversity Officer
Charles E. Stumb President, Engineered Fastening, Industrial
Stephen M. Subasic Senior Vice President & Chief Human Resources Officer
Corbin B. Walburger Vice President, Business Development
John H. Wyatt Senior Vice President & President, Outdoor
As of March 2022
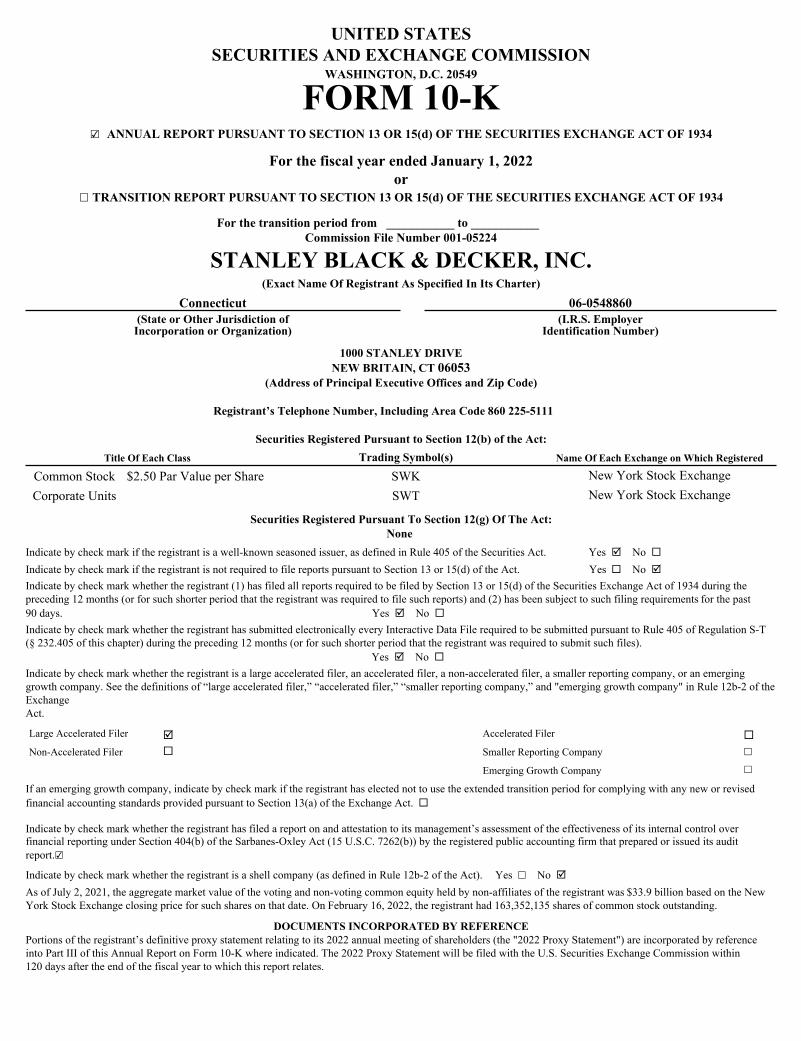
UNITED STATESSECURITIES AND EXCHANGE COMMISSION
WASHINGTON, D.C. 20549
FORM 10-K ☑ ANNUAL REPORT PURSUANT TO SECTION 13 OR 15(d) OF THE SECURITIES EXCHANGE ACT OF 1934
For the fiscal year ended January 1, 2022 or
☐ TRANSITION REPORT PURSUANT TO SECTION 13 OR 15(d) OF THE SECURITIES EXCHANGE ACT OF 1934
For the transition period from ___________ to ___________ Commission File Number 001-05224
STANLEY BLACK & DECKER, INC. (Exact Name Of Registrant As Specified In Its Charter)
Connecticut 06-0548860(State or Other Jurisdiction of
Incorporation or Organization) (I.R.S. Employer
Identification Number)
1000 STANLEY DRIVE NEW BRITAIN, CT 06053
(Address of Principal Executive Offices and Zip Code)
Registrant’s Telephone Number, Including Area Code 860 225-5111
Securities Registered Pursuant to Section 12(b) of the Act:Title Of Each Class Trading Symbol(s) Name Of Each Exchange on Which Registered
Common Stock $2.50 Par Value per Share SWK New York Stock ExchangeCorporate Units SWT New York Stock Exchange
Securities Registered Pursuant To Section 12(g) Of The Act:None
Indicate by check mark if the registrant is a well-known seasoned issuer, as defined in Rule 405 of the Securities Act. Yes þ No ¨Indicate by check mark if the registrant is not required to file reports pursuant to Section 13 or 15(d) of the Act. Yes ̈ No þIndicate by check mark whether the registrant (1) has filed all reports required to be filed by Section 13 or 15(d) of the Securities Exchange Act of 1934 during the preceding 12 months (or for such shorter period that the registrant was required to file such reports) and (2) has been subject to such filing requirements for the past 90 days. Yes þ No ¨Indicate by check mark whether the registrant has submitted electronically every Interactive Data File required to be submitted pursuant to Rule 405 of Regulation S-T (§ 232.405 of this chapter) during the preceding 12 months (or for such shorter period that the registrant was required to submit such files).
Yes þ No ¨Indicate by check mark whether the registrant is a large accelerated filer, an accelerated filer, a non-accelerated filer, a smaller reporting company, or an emerging growth company. See the definitions of “large accelerated filer,” “accelerated filer,” “smaller reporting company,” and "emerging growth company" in Rule 12b-2 of the Exchange Act.
Large Accelerated Filer þ Accelerated Filer ¨
Non-Accelerated Filer ¨ Smaller Reporting Company ☐Emerging Growth Company ☐
If an emerging growth company, indicate by check mark if the registrant has elected not to use the extended transition period for complying with any new or revised financial accounting standards provided pursuant to Section 13(a) of the Exchange Act. ¨
Indicate by check mark whether the registrant has filed a report on and attestation to its management’s assessment of the effectiveness of its internal control over financial reporting under Section 404(b) of the Sarbanes-Oxley Act (15 U.S.C. 7262(b)) by the registered public accounting firm that prepared or issued its audit report.☑Indicate by check mark whether the registrant is a shell company (as defined in Rule 12b-2 of the Act). Yes ☐ No þAs of July 2, 2021, the aggregate market value of the voting and non-voting common equity held by non-affiliates of the registrant was $33.9 billion based on the New York Stock Exchange closing price for such shares on that date. On February 16, 2022, the registrant had 163,352,135 shares of common stock outstanding.
DOCUMENTS INCORPORATED BY REFERENCEPortions of the registrant’s definitive proxy statement relating to its 2022 annual meeting of shareholders (the "2022 Proxy Statement") are incorporated by reference into Part III of this Annual Report on Form 10-K where indicated. The 2022 Proxy Statement will be filed with the U.S. Securities Exchange Commission within 120 days after the end of the fiscal year to which this report relates.
TABLE OF CONTENTS
PART IITEM 1. BUSINESS ....................................................................................................................................... 3ITEM 1A. RISK FACTORS .............................................................................................................................. 10ITEM 1B. UNRESOLVED STAFF COMMENTS .......................................................................................... 24ITEM 2. PROPERTIES .................................................................................................................................. 24ITEM 3. LEGAL PROCEEDINGS ................................................................................................................ 24ITEM 4. MINE SAFETY DISCLOSURES.................................................................................................... 25
PART IIITEM 5. MARKET FOR THE REGISTRANT’S COMMON EQUITY, RELATED STOCKHOLDER
MATTERS AND ISSUER PURCHASES OF EQUITY SECURITIES ......................................... 26ITEM 6. REMOVED AND RESERVED ....................................................................................................... 28ITEM 7. MANAGEMENT’S DISCUSSION AND ANALYSIS OF FINANCIAL CONDITION AND
RESULTS OF OPERATIONS ........................................................................................................ 28ITEM 7A. QUANTITATIVE AND QUALITATIVE DISCLOSURES ABOUT MARKET RISK ................ 51ITEM 8. FINANCIAL STATEMENTS AND SUPPLEMENTARY DATA ................................................ 51ITEM 9. CHANGES IN AND DISAGREEMENTS WITH ACCOUNTANTS ON ACCOUNTING AND
FINANCIAL DISCLOSURE........................................................................................................... 51ITEM 9A. CONTROLS AND PROCEDURES ................................................................................................ 52ITEM 9B. OTHER INFORMATION ............................................................................................................... 53
PART IIIITEM 10. DIRECTORS, EXECUTIVE OFFICERS AND CORPORATE GOVERNANCE OF THE
REGISTRANT .................................................................................................................................54
ITEM 11. EXECUTIVE COMPENSATION ................................................................................................... 56ITEM 12. SECURITY OWNERSHIP OF CERTAIN BENEFICIAL OWNERS AND MANAGEMENT
AND RELATED STOCKHOLDER MATTERS ............................................................................ 56ITEM 13. CERTAIN RELATIONSHIPS AND RELATED TRANSACTIONS, AND DIRECTOR
INDEPENDENCE ........................................................................................................................... 58ITEM 14. PRINCIPAL ACCOUNTANT FEES AND SERVICES ................................................................. 58
PART IVITEM 15. EXHIBITS AND FINANCIAL STATEMENT SCHEDULE ......................................................... 58ITEM 16. FORM 10-K SUMMARY ............................................................................................................... 60SIGNATURES 61
EX-10.17(e)EX-21EX-23EX-24EX-31.1(a)EX-31.1(b)EX-32.1EX-32.2
2
FORM 10-K
PART I
ITEM 1. BUSINESS
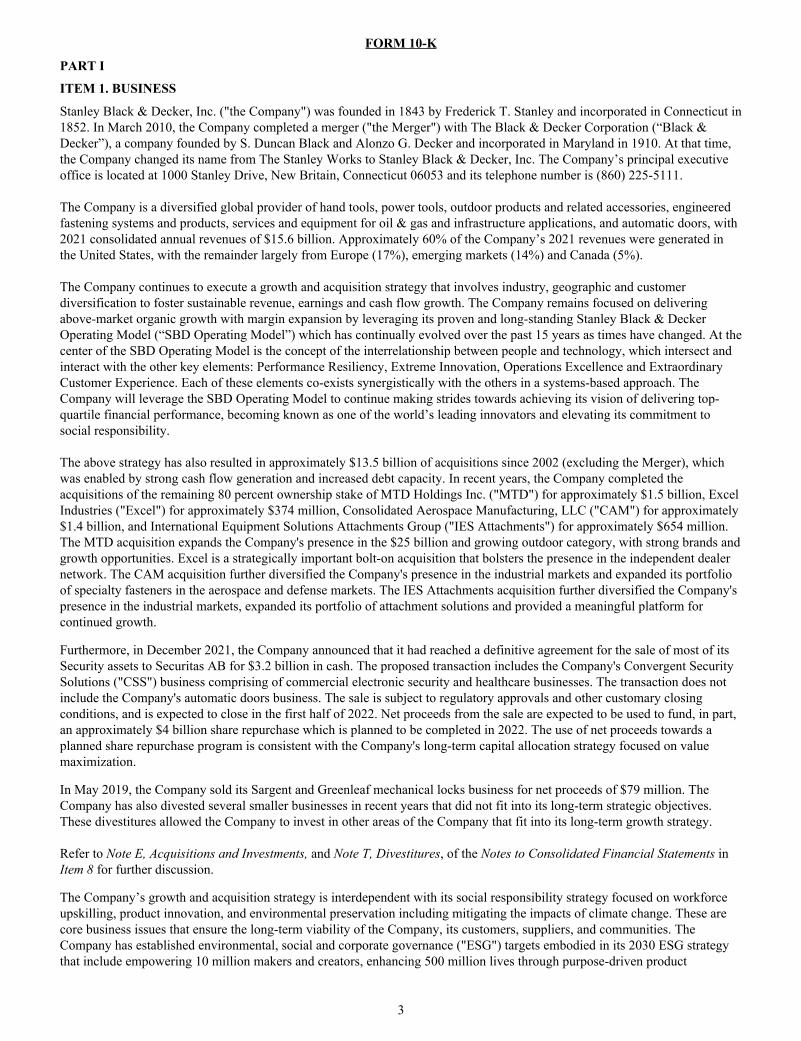
Stanley Black & Decker, Inc. ("the Company") was founded in 1843 by Frederick T. Stanley and incorporated in Connecticut in 1852. In March 2010, the Company completed a merger ("the Merger") with The Black & Decker Corporation (“Black & Decker”), a company founded by S. Duncan Black and Alonzo G. Decker and incorporated in Maryland in 1910. At that time, the Company changed its name from The Stanley Works to Stanley Black & Decker, Inc. The Company’s principal executive office is located at 1000 Stanley Drive, New Britain, Connecticut 06053 and its telephone number is (860) 225-5111.
The Company is a diversified global provider of hand tools, power tools, outdoor products and related accessories, engineered fastening systems and products, services and equipment for oil & gas and infrastructure applications, and automatic doors, with 2021 consolidated annual revenues of $15.6 billion. Approximately 60% of the Company’s 2021 revenues were generated in the United States, with the remainder largely from Europe (17%), emerging markets (14%) and Canada (5%).
The Company continues to execute a growth and acquisition strategy that involves industry, geographic and customer diversification to foster sustainable revenue, earnings and cash flow growth. The Company remains focused on delivering above-market organic growth with margin expansion by leveraging its proven and long-standing Stanley Black & Decker Operating Model (“SBD Operating Model”) which has continually evolved over the past 15 years as times have changed. At the center of the SBD Operating Model is the concept of the interrelationship between people and technology, which intersect and interact with the other key elements: Performance Resiliency, Extreme Innovation, Operations Excellence and Extraordinary Customer Experience. Each of these elements co-exists synergistically with the others in a systems-based approach. The Company will leverage the SBD Operating Model to continue making strides towards achieving its vision of delivering top-quartile financial performance, becoming known as one of the world’s leading innovators and elevating its commitment to social responsibility.
The above strategy has also resulted in approximately $13.5 billion of acquisitions since 2002 (excluding the Merger), which was enabled by strong cash flow generation and increased debt capacity. In recent years, the Company completed the acquisitions of the remaining 80 percent ownership stake of MTD Holdings Inc. ("MTD") for approximately $1.5 billion, Excel Industries ("Excel") for approximately $374 million, Consolidated Aerospace Manufacturing, LLC ("CAM") for approximately $1.4 billion, and International Equipment Solutions Attachments Group ("IES Attachments") for approximately $654 million. The MTD acquisition expands the Company's presence in the $25 billion and growing outdoor category, with strong brands and growth opportunities. Excel is a strategically important bolt-on acquisition that bolsters the presence in the independent dealer network. The CAM acquisition further diversified the Company's presence in the industrial markets and expanded its portfolio of specialty fasteners in the aerospace and defense markets. The IES Attachments acquisition further diversified the Company's presence in the industrial markets, expanded its portfolio of attachment solutions and provided a meaningful platform for continued growth.
Furthermore, in December 2021, the Company announced that it had reached a definitive agreement for the sale of most of its Security assets to Securitas AB for $3.2 billion in cash. The proposed transaction includes the Company's Convergent Security Solutions ("CSS") business comprising of commercial electronic security and healthcare businesses. The transaction does not include the Company's automatic doors business. The sale is subject to regulatory approvals and other customary closing conditions, and is expected to close in the first half of 2022. Net proceeds from the sale are expected to be used to fund, in part, an approximately $4 billion share repurchase which is planned to be completed in 2022. The use of net proceeds towards a planned share repurchase program is consistent with the Company's long-term capital allocation strategy focused on value maximization.
In May 2019, the Company sold its Sargent and Greenleaf mechanical locks business for net proceeds of $79 million. The Company has also divested several smaller businesses in recent years that did not fit into its long-term strategic objectives. These divestitures allowed the Company to invest in other areas of the Company that fit into its long-term growth strategy.
Refer to Note E, Acquisitions and Investments, and Note T, Divestitures, of the Notes to Consolidated Financial Statements in Item 8 for further discussion.
The Company’s growth and acquisition strategy is interdependent with its social responsibility strategy focused on workforce upskilling, product innovation, and environmental preservation including mitigating the impacts of climate change. These are core business issues that ensure the long-term viability of the Company, its customers, suppliers, and communities. The Company has established environmental, social and corporate governance ("ESG") targets embodied in its 2030 ESG strategy that include empowering 10 million makers and creators, enhancing 500 million lives through purpose-driven product
3

innovation, becoming carbon-neutral, landfill-free across its operations, and reducing water use in water stressed and scarce areas. The carbon neutrality target includes third-party approved science-based targets to reduce absolute scope 1 and 2 greenhouse gas emissions by greater than 100% by 2030, and to reduce supply chain emissions by 35%. The Company’s ESG strategy considers all life-cycle stages including material procurement from supply chain partners, product design, manufacturing, distribution and transportation, product use, product service and end-of-life. Refer to section "Human Capital Management" for additional information regarding the Company's commitment to upskilling its employees and improving diversity, equity and inclusion.
Description of the Business
The Company’s operations are classified into two reportable business segments: Tools & Storage and Industrial. The Company has one non-reportable business operating segment, Mechanical Access Solutions ("MAS"). All reportable segments have significant international operations and are exposed to translational and transactional impacts from fluctuations in foreign currency exchange rates.
Additional information regarding the Company’s business segments and geographic areas is incorporated herein by reference to the material captioned “Business Segment Results” in Item 7 and Note P, Business Segments and Geographic Areas, of the Notes to Consolidated Financial Statements in Item 8.
Tools & Storage
The Tools & Storage segment is comprised of the Power Tools Group ("PTG"), Hand Tools, Accessories & Storage ("HTAS"), and Outdoor Power Equipment ("Outdoor") businesses. Annual revenues in the Tools & Storage segment were $12.8 billion in 2021, representing 82% of the Company’s total revenues.
The PTG business includes both professional and consumer products. Professional products include professional grade corded and cordless electric power tools and equipment including drills, impact wrenches and drivers, grinders, saws, routers and sanders, as well as pneumatic tools and fasteners including nail guns, nails, staplers and staples, concrete and masonry anchors. Consumer products include corded and cordless electric power tools sold primarily under the BLACK+DECKER® brand, and home products such as hand-held vacuums, paint tools and cleaning appliances.
The HTAS business sells hand tools, power tool accessories and storage products. Hand tools include measuring, leveling and layout tools, planes, hammers, demolition tools, clamps, vises, knives, saws, chisels and industrial and automotive tools. Power tool accessories include drill bits, screwdriver bits, router bits, abrasives, saw blades and threading products. Storage products include tool boxes, sawhorses, medical cabinets and engineered storage solution products.
The Outdoor business primarily sells corded and cordless electric lawn and garden products, including hedge trimmers, string trimmers, lawn mowers, pressure washers and related accessories, and gas powered lawn and garden products, including lawn tractors, zero turn ride on mowers, walk behind mowers, snow blowers, residential robotic mowers, utility terrain vehicles (UTVs), handheld outdoor power equipment, garden tools, and parts and accessories to professionals and consumers under the DEWALT®, CUB CADET®, BLACK+DECKER®, CRAFTSMAN®, TROY-BILT®, and HUSTLER® brand names.
The segment sells its products to professional end users, distributors, independent dealers, retail consumers and industrial customers in a wide variety of industries and geographies. The majority of sales are distributed through retailers, including home centers, mass merchants, hardware stores, and retail lumber yards, as well as third-party distributors, independent dealers, and a direct sales force.
Industrial
The Industrial segment is comprised of the Engineered Fastening and Infrastructure businesses. Annual revenues in the Industrial segment were $2.5 billion in 2021, representing 16% of the Company’s total revenues.
The Engineered Fastening business primarily sells highly engineered components such as fasteners, fittings and various engineered products, which are designed for specific application across multiple verticals. The product lines include externally threaded fasteners, blind rivets and tools, blind inserts and tools, drawn arc weld studs and systems, engineered plastic and mechanical fasteners, self-piercing riveting systems, precision nut running systems, micro fasteners, high-strength structural fasteners, axel swage, latches, heat shields, pins, and couplings. The business sells to customers in the automotive, manufacturing, electronics, construction, and aerospace industries, amongst others, and its products are distributed through direct sales forces and, to a lesser extent, third-party distributors.
The Infrastructure business consists of the Attachment Tools and Oil & Gas product lines. Attachment Tools sells hydraulic tools and high quality, performance-driven heavy equipment attachment tools for off-highway applications. Oil & Gas sells and
4
rents custom pipe handling, joint welding and coating equipment used in the construction of large and small diameter pipelines, and provides pipeline inspection services. The Infrastructure business sells to the oil and natural gas pipeline industry and other industrial customers. The products and services are primarily distributed through a direct sales force and, to a lesser extent, third-party distributors.
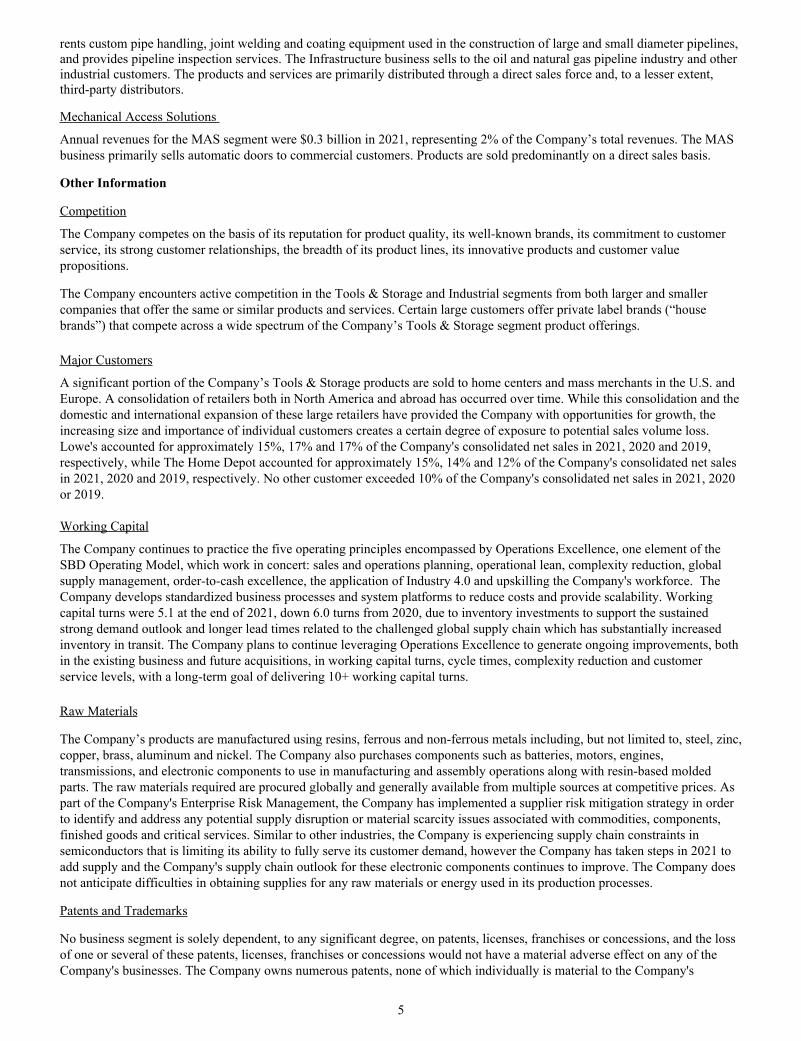
Mechanical Access Solutions
Annual revenues for the MAS segment were $0.3 billion in 2021, representing 2% of the Company’s total revenues. The MAS business primarily sells automatic doors to commercial customers. Products are sold predominantly on a direct sales basis.
Other Information
Competition
The Company competes on the basis of its reputation for product quality, its well-known brands, its commitment to customer service, its strong customer relationships, the breadth of its product lines, its innovative products and customer value propositions.
The Company encounters active competition in the Tools & Storage and Industrial segments from both larger and smaller companies that offer the same or similar products and services. Certain large customers offer private label brands (“house brands”) that compete across a wide spectrum of the Company’s Tools & Storage segment product offerings.
Major Customers
A significant portion of the Company’s Tools & Storage products are sold to home centers and mass merchants in the U.S. and Europe. A consolidation of retailers both in North America and abroad has occurred over time. While this consolidation and the domestic and international expansion of these large retailers have provided the Company with opportunities for growth, the increasing size and importance of individual customers creates a certain degree of exposure to potential sales volume loss. Lowe's accounted for approximately 15%, 17% and 17% of the Company's consolidated net sales in 2021, 2020 and 2019, respectively, while The Home Depot accounted for approximately 15%, 14% and 12% of the Company's consolidated net sales in 2021, 2020 and 2019, respectively. No other customer exceeded 10% of the Company's consolidated net sales in 2021, 2020 or 2019.
Working Capital
The Company continues to practice the five operating principles encompassed by Operations Excellence, one element of the SBD Operating Model, which work in concert: sales and operations planning, operational lean, complexity reduction, global supply management, order-to-cash excellence, the application of Industry 4.0 and upskilling the Company's workforce. The Company develops standardized business processes and system platforms to reduce costs and provide scalability. Working capital turns were 5.1 at the end of 2021, down 6.0 turns from 2020, due to inventory investments to support the sustained strong demand outlook and longer lead times related to the challenged global supply chain which has substantially increased inventory in transit. The Company plans to continue leveraging Operations Excellence to generate ongoing improvements, both in the existing business and future acquisitions, in working capital turns, cycle times, complexity reduction and customer service levels, with a long-term goal of delivering 10+ working capital turns.
Raw Materials
The Company’s products are manufactured using resins, ferrous and non-ferrous metals including, but not limited to, steel, zinc, copper, brass, aluminum and nickel. The Company also purchases components such as batteries, motors, engines, transmissions, and electronic components to use in manufacturing and assembly operations along with resin-based molded parts. The raw materials required are procured globally and generally available from multiple sources at competitive prices. As part of the Company's Enterprise Risk Management, the Company has implemented a supplier risk mitigation strategy in order to identify and address any potential supply disruption or material scarcity issues associated with commodities, components, finished goods and critical services. Similar to other industries, the Company is experiencing supply chain constraints in semiconductors that is limiting its ability to fully serve its customer demand, however the Company has taken steps in 2021 to add supply and the Company's supply chain outlook for these electronic components continues to improve. The Company does not anticipate difficulties in obtaining supplies for any raw materials or energy used in its production processes.
Patents and Trademarks
No business segment is solely dependent, to any significant degree, on patents, licenses, franchises or concessions, and the loss of one or several of these patents, licenses, franchises or concessions would not have a material adverse effect on any of the Company's businesses. The Company owns numerous patents, none of which individually is material to the Company's
5
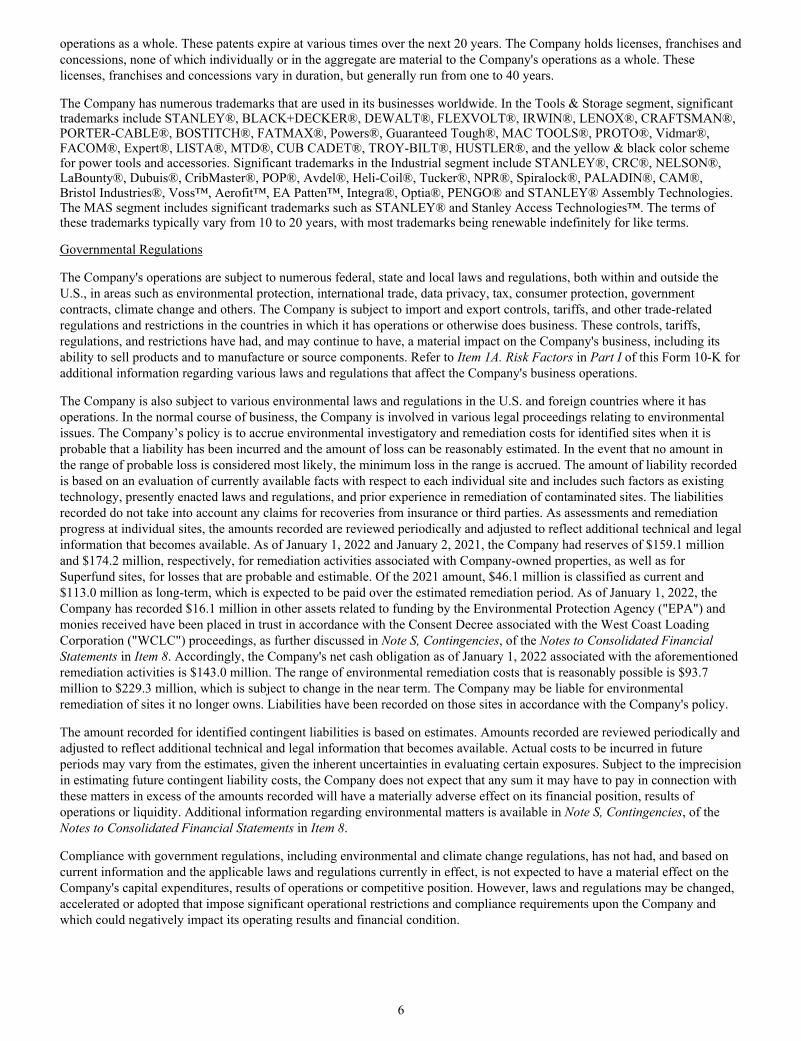
operations as a whole. These patents expire at various times over the next 20 years. The Company holds licenses, franchises and concessions, none of which individually or in the aggregate are material to the Company's operations as a whole. These licenses, franchises and concessions vary in duration, but generally run from one to 40 years.
The Company has numerous trademarks that are used in its businesses worldwide. In the Tools & Storage segment, significant trademarks include STANLEY®, BLACK+DECKER®, DEWALT®, FLEXVOLT®, IRWIN®, LENOX®, CRAFTSMAN®, PORTER-CABLE®, BOSTITCH®, FATMAX®, Powers®, Guaranteed Tough®, MAC TOOLS®, PROTO®, Vidmar®, FACOM®, Expert®, LISTA®, MTD®, CUB CADET®, TROY-BILT®, HUSTLER®, and the yellow & black color scheme for power tools and accessories. Significant trademarks in the Industrial segment include STANLEY®, CRC®, NELSON®, LaBounty®, Dubuis®, CribMaster®, POP®, Avdel®, Heli-Coil®, Tucker®, NPR®, Spiralock®, PALADIN®, CAM®, Bristol Industries®, Voss™, Aerofit™, EA Patten™, Integra®, Optia®, PENGO® and STANLEY® Assembly Technologies. The MAS segment includes significant trademarks such as STANLEY® and Stanley Access Technologies™. The terms of these trademarks typically vary from 10 to 20 years, with most trademarks being renewable indefinitely for like terms.
Governmental Regulations
The Company's operations are subject to numerous federal, state and local laws and regulations, both within and outside the U.S., in areas such as environmental protection, international trade, data privacy, tax, consumer protection, government contracts, climate change and others. The Company is subject to import and export controls, tariffs, and other trade-related regulations and restrictions in the countries in which it has operations or otherwise does business. These controls, tariffs, regulations, and restrictions have had, and may continue to have, a material impact on the Company's business, including its ability to sell products and to manufacture or source components. Refer to Item 1A. Risk Factors in Part I of this Form 10-K for additional information regarding various laws and regulations that affect the Company's business operations.
The Company is also subject to various environmental laws and regulations in the U.S. and foreign countries where it has operations. In the normal course of business, the Company is involved in various legal proceedings relating to environmental issues. The Company’s policy is to accrue environmental investigatory and remediation costs for identified sites when it is probable that a liability has been incurred and the amount of loss can be reasonably estimated. In the event that no amount in the range of probable loss is considered most likely, the minimum loss in the range is accrued. The amount of liability recorded is based on an evaluation of currently available facts with respect to each individual site and includes such factors as existing technology, presently enacted laws and regulations, and prior experience in remediation of contaminated sites. The liabilities recorded do not take into account any claims for recoveries from insurance or third parties. As assessments and remediation progress at individual sites, the amounts recorded are reviewed periodically and adjusted to reflect additional technical and legal information that becomes available. As of January 1, 2022 and January 2, 2021, the Company had reserves of $159.1 million and $174.2 million, respectively, for remediation activities associated with Company-owned properties, as well as for Superfund sites, for losses that are probable and estimable. Of the 2021 amount, $46.1 million is classified as current and $113.0 million as long-term, which is expected to be paid over the estimated remediation period. As of January 1, 2022, the Company has recorded $16.1 million in other assets related to funding by the Environmental Protection Agency ("EPA") and monies received have been placed in trust in accordance with the Consent Decree associated with the West Coast Loading Corporation ("WCLC") proceedings, as further discussed in Note S, Contingencies, of the Notes to Consolidated Financial Statements in Item 8. Accordingly, the Company's net cash obligation as of January 1, 2022 associated with the aforementioned remediation activities is $143.0 million. The range of environmental remediation costs that is reasonably possible is $93.7 million to $229.3 million, which is subject to change in the near term. The Company may be liable for environmental remediation of sites it no longer owns. Liabilities have been recorded on those sites in accordance with the Company's policy.
The amount recorded for identified contingent liabilities is based on estimates. Amounts recorded are reviewed periodically and adjusted to reflect additional technical and legal information that becomes available. Actual costs to be incurred in future periods may vary from the estimates, given the inherent uncertainties in evaluating certain exposures. Subject to the imprecision in estimating future contingent liability costs, the Company does not expect that any sum it may have to pay in connection with these matters in excess of the amounts recorded will have a materially adverse effect on its financial position, results of operations or liquidity. Additional information regarding environmental matters is available in Note S, Contingencies, of the Notes to Consolidated Financial Statements in Item 8.
Compliance with government regulations, including environmental and climate change regulations, has not had, and based on current information and the applicable laws and regulations currently in effect, is not expected to have a material effect on the Company's capital expenditures, results of operations or competitive position. However, laws and regulations may be changed, accelerated or adopted that impose significant operational restrictions and compliance requirements upon the Company and which could negatively impact its operating results and financial condition.
6
Human Capital Management
At Stanley Black & Decker, human capital management proliferates what the Company considers to be its Purpose (why the organization exists), Values (intrinsically important priorities), Leadership Principles (how the senior leadership thinks about problems and people), and Operating Model (the long-term plan of action and priorities). The Company is aware that the world in which it operates necessitates acceleration of how it prioritizes human capital and the enhanced focus on empathic leadership, health and well-being and the growing needs of a globally diverse workforce.
The Company believes its strategic focus on its people, culture and employer brand differentiates it in this dynamic, competitive landscape. Tenets of its strategic focus include employee experience powered by the intersection of people and technology, hybrid working models, understanding how to maximize talent by leveraging people analytics, and driving leadership behaviors such as agility, inclusion, flexibility, among others in its management teams. The Company continues to focus and invest in talent and people experiences, which it believes is critical to its continued success as a 179-year-old organization.
As of January 1, 2022, the Company had approximately 71,300 employees, inclusive of recently acquired businesses and approximately 8,000 employees included in the aforementioned pending sale of the CSS business, in over 60 countries. Approximately 37% of total employees were employed in the U.S. In addition, the Company had approximately 10,400 temporary contractors globally, primarily in operations. The workforce is comprised of approximately 69% hourly-paid employees, principally in manufacturing, distribution centers and security monitoring operations, and 31% salaried employees. There were approximately 1,500 U.S. employees covered by collective bargaining agreements dispersed among 28 different local labor unions, and a majority of European employees are represented by Works Councils. Six U.S. collective bargaining agreements are scheduled for renegotiation in the next 12 months. The Company strives to maintain a positive relationship with all its employees, as well as the unions and works councils representing them, where applicable.
Talent Attraction, Development, and Retention
Attraction
In 2021, the Company invested in its employer of choice branding and specialty recruiting. Examples of branding investments include launching a program for new hires to notify their social media networks upon joining the Company, new app-based technology that allows colleagues to share curated news about the Company externally, and a refresh of the Company’s public website. Examples of recruiting investments include dedicated resources to source diverse talent, a new recruiting client resource management platform, and organizing internal recruiting teams to better focus on highly technical roles with skills shortages such as data scientists, software engineers, and battery engineers.
The Company also has an emphasis on university recruiting at historically black colleges and universities and professional associations such as the Society of Hispanic Professional Engineers to expand its reach to identify diverse candidates. Approximately 37% of global new hires in 2021 were female, inclusive of recently acquired businesses, versus 35% in 2020, and in the U.S. approximately 45% of new employees were racially or ethnically diverse, inclusive of recently acquired businesses, versus 47% in 2020.
Development
Talent development is a key enabler of the SBD Operating Model where people and technology sit at the center. Performance feedback is designed to happen in real time throughout the year. Lifelong learning is supported internally through the Stanley Black & Decker University and externally with third-party partners. The Company offers over 30,000 training courses to its colleagues, and employees attended more than 25,000 hours of online voluntary learning in 2021. Additionally, the Company focuses on leadership development anchored around its Leader Principles, Values and newly introduced leader habits and behaviors that highlight the importance of attributes like empathy, inclusivity and listening. The Company invested in AI-based video technology to help its operations employees learn outside of the classroom and to increase uptake. In 2021, the Company invested in development and talent initiatives for its operations workforce through a dedicated operations-focused Workforce Readiness organization. With a focus on critical skills, up-skilling initiatives, and future career opportunities across its operations workforce, the Company is educating and developing the workforce together with advancements in manufacturing capabilities.
Retention
The Company monitors organizational health through a variety of channels including employee opinion surveys, townhalls, roundtables, listening sessions, and an internal communications and social collaboration platform called Workplace. The
7
Company’s People Analytics team has built an interactive cloud-based organizational portal that provides leaders with over 30 metrics related to headcount, hiring, and retention to enhance insight from people data and add new dimensions of forward looking, predictive capability.
Compensation
Compensation and benefits are globally managed and tailored by country to maintain market competitiveness, and effectively attract, retain, and reward employees. The Company’s portfolio of programs is designed in the context of its compensation philosophy underpinned by the tenets of competitive pay, pay for performance, alignment with shareholder interests, and the Company's intent to provide fair and equitable pay supporting an inclusive culture. In addition to standard compensation and benefits packages, a sizable portion of managers and select individual contributors receive annual incentives contingent on achievement of business objectives, and all employees are generally eligible for special recognition awards.
Diversity, Equity & Inclusion
The Company is committed to building and nurturing an inclusive culture of passion and belonging where employees feel valued, heard, and are positioned to succeed. As of January 1, 2022, the Company's Board of Directors (the “Board”) is comprised of 36% female and 9% racially or ethnically diverse directors. The Chief Executive Officer (“CEO”) and his direct staff are comprised of 36% female leaders versus 27% in 2020, and 36% racially or ethnically diverse leaders versus 20% in 2020. Females represent approximately 33% of the global workforce versus 31% in 2020. In the U.S., approximately 34% of employees are racially or ethnically diverse versus 33% in 2020. A copy of the Company's most recently filed Equal Employment Opportunity report to the U.S. government (EEO-1) can be found on the Company’s website.
In early 2021, the Chief Diversity Officer (“CDO”) position was created and added to the CEO’s direct reports. The CDO, with the support of a dedicated team of diversity, equity, and inclusion (“DEI”) professionals, intends to promote a broad approach to DEI with the goal of accelerating Company performance, optimizing organizational culture, enhancing transparency, and strengthening accountability. The Company is continuing to execute initiatives across the global workforce designed to foster an inclusive workplace and facilitate equitable career development opportunities. The Company provides training and guidance to employees regarding diversity, including inclusive workforce training and DEI training for new hires. An internal knowledge library of DEI resources is available on the Company intranet. Management monitors hiring, retention, promotion and continued progress toward achieving the Company's diversity goals. DEI quarterly reviews are completed by management to increase diverse representation at all levels of the organization by: 1) creating consistent visibility to employee demographic data and trends, 2) highlighting female and racially diverse talent, and 3) increasing leadership accountability for creating a diverse and inclusive workplace. Mentorship programs have been created to grow the next generation of talent at the Company by pairing employee resource groups (“ERGs”) leadership, women, people of color, and early career talent with the Company’s leaders to encourage leadership development and mentor allyship. The Company also prioritizes investing in its communities by supporting individuals and organizations that advance DEI goals across cities and regions in which it operates.
The Company has nine ERGs with more than 90 local chapters across the globe, and two regional inclusion councils newly formed in 2021. Over 12,000 employees are engaged with the Company’s ERGs and Inclusion Councils. These ERGs are formed around various dimensions of diversity and participation across groups is encouraged. The ERGs include Abilities (including cognitive, social-emotional, and physical abilities), African Ancestry, Asian Heritage, Hispanic/Latino, Developing Professionals, Pride & Allies (LGBTQ+), Veterans, Women, and Working Parents. Company executives and leaders actively participate, sponsor and engage with the ERGs. The CEO and more than 75% of his direct staff also serve as an executive sponsor for one or more ERGs providing executive sponsorship and support, which serve as one of the cornerstones for inclusion and engagement of talent at scale.
The Company launched a racial equity roadmap in 2020 with ten actions to confront racism and social injustice throughout its communities and across the world, which includes specific goals across culture, career, and community focus areas. Each of the ten items were initiated in 2021. Through the RISE (Reach. Inspire. Support. Engage.) Community program the Company provides Scholar students access to expanded experiential learning beyond their classrooms. The Company’s mission is to help its RISE Scholars discover their passions, expose them to business, technology, potential STEM career opportunities, and help to develop them as leaders.
The Company is a signatory of Paradigm for Parity committing to addressing the gender gap in corporate leadership. The Company also participates in the Business Roundtable Diversity & Inclusion Index, where many of the largest U.S.-based employers are committed to building a more inclusive environment. The Company's CEO was among the signatories of the CEO Action for Diversity & Inclusion.
8
Employee Wellness, Health and Safety
The Company is committed to providing competitive benefits to attract and retain talent, that vary by country, including benefits and programs to support the broad wellness of its employees’ healthy lifestyles, mental health, and retirement readiness. The Company also supports its employees and promotes work/life balance through benefits such as paid parental leave, paid time off, flexible work arrangement and virtual/hybrid working model policies.
In 2021, the Company's continued commitment to ensuring the health and safety of its employees and supply chain partners was demonstrated through its agile and adaptive response to the ongoing coronavirus pandemic (“COVID-19”). Under the guidance of the Chief Medical Officer, the Company was able to sustain business operations by implementing safety measures and wellness policies, oversight, and systems, including expansion of the Employee Assistance Program to be available globally. The Company maintained virtual working for its office employees around the globe where feasible, while providing the necessary technical and collaboration support to enable its employees to succeed in a virtual working environment. The Company believes its adopted hybrid work model is likely to outlast the pandemic and will be a key enabler to support the broad needs of its employee whether they perform work on-site to fully virtual. Additional information regarding the Company's response to COVID-19 is available under the caption “COVID-19 Pandemic” in Item 7.
The Company’s Environmental, Health and Safety (“EHS”) Management System Plan describes the core elements of health and safety responsibility and accountability, including policies and procedures, designed in alignment with global standards, the Company’s Code of Business Ethics, applicable law and individual facility needs. Health and safety requirements apply to all employees and operating unit locations worldwide, including all manufacturing facilities, distribution centers, warehouses, field service centers, retail, office locations and mobile units, as well as to the Company's subsidiaries and joint ventures (in which the Company exercises decision making control over operations). Legal requirements may vary in different countries in which the Company’s facilities are located. Primary measures of safety performance include Total Recordable Incident Rate ("TRIR") and the Lost Time Incident Rate ("LTIR") based upon the number of incidents per 100 employees (or per 200,000 work hours). Through December 2021, the Company reported a TRIR of 0.65, a LTIR of 0.22 and zero work-related fatalities. Reported total workforce numbers include employees and supervised contractors.
Governance and Oversight
The CEO and the management Executive Committee are entrusted with developing and advancing the Company’s human capital strategy which is reviewed annually with periodic updates on progress with the Board. The Chief Human Resources Officer (“CHRO”), who reports directly to the CEO, is charged with the development and stewardship of this strategy on an enterprise-wide basis. This incorporates a broad range of dimensions, including culture, values, labor and employee relations, leadership expectations and capabilities, talent development, performance management and total rewards. Each year, the Company conducts an extensive talent review with its CEO where the leadership team, key talent, succession plans and new investments are reviewed. Afterwards, the CEO, CHRO, and Chief Talent Officers lead a talent review with the Compensation & Talent Development Committee of the Board and the entire membership of the Board, at least annually. In 2021, the CHRO presented a 3-year strategic plan to the Executive Committee and the Board on human capital and talent strategies.
Code of Business Ethics, Workplace Harassment Prevention, and Managing Unconscious Bias training, among others, are provided to employees and the content is regularly reviewed and updated. All employees have access to the INTEGRITY@SBD platform where support, guidance and resources are available. Employees are encouraged to raise any concerns through multiple channels, including through the confidential Integrity Helpline, without fear of retaliation or retribution.
Additional information regarding the Company's Human Capital programs and initiatives is available in the Company's Annual Sustainability Report and in the Company’s Environmental, Social and Governance Report located under the Social Responsibility section of the Company’s website. The information on the Company’s website is not, and is not intended to be, part of this Form 10-K and is not incorporated into this report by reference.
Research and Development Costs
Research and development costs, which are classified in Selling, general and administrative ("SG&A"), were $276.3 million, $200.0 million and $240.8 million for fiscal years 2021, 2020 and 2019, respectively. In 2021, the Company returned to normalized spend levels as the Company continues to focus on becoming known as one of the world's greatest innovators and remains committed to generating new core and breakthrough innovations. The reduction in spending in 2020 versus 2019 was primarily due to the temporary cost actions taken in response to COVID-19.
9
Available Information
The Company’s website is located at http://www.stanleyblackanddecker.com. This URL is intended to be an inactive textual reference only. It is not intended to be an active hyperlink to the Company's website. The information on the Company's website is not, and is not intended to be, part of this Form 10-K and is not incorporated into this report by reference. The Company makes its Forms 10-K, 10-Q, 8-K and amendments to each available free of charge on its website as soon as reasonably practicable after filing them with, or furnishing them to, the U.S. Securities and Exchange Commission ("SEC").
ITEM 1A. RISK FACTORS
The Company’s business, operations and financial condition are subject to various risks and uncertainties. You should carefully consider the risks and uncertainties described below, together with all of the other information in this Annual Report on Form 10-K, including those risks set forth under the heading entitled "Cautionary Statements Under the Private Securities Litigation Reform Act of 1995" in Item 7, and in other documents that the Company files with the SEC, before making any investment decision with respect to its securities. If any of the risks or uncertainties actually occur or develop, the Company’s business, financial condition, results of operations and future growth prospects could change. Under these circumstances, the trading prices of the Company’s securities could decline, and you could lose all or part of your investment in the Company’s securities.
Business and Operational Risks
The Company’s business is subject to risks associated with sourcing and manufacturing.
The Company imports large quantities of finished goods, component parts and raw materials. Lead times for these items vary significantly and are increasing in light of global shortages of critical components, including semiconductors. Global supply chain constraints in the wake of the COVID-19 pandemic continue to decrease the Company's visibility into availability and lead times for the products and their component parts and raw materials. In addition, the Company’s ability to import these items in a timely and cost-effective manner has been and may continue to be affected by conditions at ports or issues that otherwise affect transportation and warehousing providers, such as fluctuations in freight costs, port and shipping capacity, labor disputes and shortages, severe weather due to climate change or increased homeland security requirements in the U.S. and other countries. In 2021, the Company experienced significantly higher freight costs compared to freight costs incurred in 2020 and 2019. These issues have and could delay importation of products or require the Company to locate alternative ports or warehousing providers to avoid disruption to customers. These alternatives have not and in the future may not be available on short notice or have and could result in higher transit costs, which could have an adverse impact on the Company’s business and financial condition.
Substantially all of its import operations are subject to customs requirements and to tariffs and quotas set by governments through mutual agreements, bilateral actions or, in some cases unilateral action. In addition, the countries in which the Company’s products and materials are manufactured or imported from (including importation into the U.S. of the Company's products manufactured overseas) may from time to time impose additional quotas, duties, tariffs or other restrictions on its imports (including restrictions on manufacturing operations) or adversely modify existing restrictions. In recent years, changes in U.S. policy regarding international trade, including import and export regulation and international trade agreements, have negatively impacted the Company’s business. For example, in 2018 the U.S. imposed tariffs on steel and aluminum as well as on goods imported from China and certain other countries, which resulted in retaliatory tariffs by China and other countries. Similar U.S. actions and any corresponding retaliatory efforts, could result in an increase in supply chain costs that the Company may not be able to offset or otherwise adversely impact the Company’s results of operations. Imports are also subject to unpredictable foreign currency variation which may increase the Company’s cost of goods sold. Adverse changes in these import costs and restrictions, or failure by the Company’s suppliers to comply with customs regulations or similar laws, could harm the Company’s business.
The Company’s operations are also subject to the effects of international trade agreements and regulations such as the United States-Mexico-Canada Agreement, and the activities and regulations of the World Trade Organization. Although these trade agreements generally have positive effects on trade liberalization, sourcing flexibility and cost of goods by reducing or eliminating the duties and/or quotas assessed on products manufactured in a particular country, trade agreements can also impose requirements that adversely affect the Company’s business, such as setting quotas on products that may be imported from a particular country into key markets including the U.S. or the European Union ("EU"), or making it easier for other
10
companies to compete, by eliminating restrictions on products from countries where the Company’s competitors source products.
In addition, the Company has a number of key suppliers in South Korea. Escalation of hostilities with North Korea and/or military action in the region could cause disruptions in the Company's supply chain which could, in turn, cause product shortages, delays in delivery and/or increases in the Company's cost incurred to produce and deliver products to its customers.
The Company also relies on its suppliers to provide high quality products and to comply with applicable laws. The Company’s ability to find qualified suppliers who meet its standards, including a majority having carbon emission reduction targets, and supply products in a timely, cost-effective and efficient manner is a significant challenge with the increasing demand from customers, especially with respect to goods sourced from outside the U.S. For certain products, the Company may rely on one or very few suppliers. A supplier’s failure to meet the Company’s standards, provide products in a timely, cost-effective and efficient manner, or comply with applicable laws is beyond the Company’s control. These issues could have a material negative impact on the Company's business and profitability. Poor quality or an insecure supply chain, may also adversely affect the reliability and reputation of the Company.
The effects of climate change, such as extreme weather conditions, could also place capacity constraints on the Company’s supply chain. For example, steel and copper are critical to the design of the Company's products and some countries, including Chile and Australia, where steel and copper are sourced from have experienced and are expected to continue to experience severe weather due to climate change. A severe weather event in these countries could cause disruptions in the Company's supply chain which could, in turn, cause product shortages, delays in delivery and/or increases in the Company's cost incurred to produce and deliver products to its customers.
The continued adverse effects of the COVID-19 pandemic and an indeterminate recovery period could have a materially negative impact on the Company’s business, operations, financial condition, results of operations, and liquidity, the nature and extent of which is highly uncertain.
The impact of the COVID-19 pandemic has adversely affected, and may continue to adversely affect, the Company’s business, financial condition, workforce and operations and the operations of its customers, distributors, suppliers and contractors. There continues to be significant uncertainty regarding restrictions on the Company's access to its manufacturing facilities or on its support operations or workforce, or similar limitations for its distributors and suppliers. These measures have limited and could continue to limit customer demand and has and could continue to limit the Company's capacity to meet customer demand, which could have a material negative impact on its financial condition and results of operations.
The COVID-19 pandemic has adversely affected global economics and markets and has resulted in disruptions in commerce that will continue to evolve, including with respect to financial and other economic activities, services, travel and supply chains. Global and national health concerns could lead to further and/or increased volatility in global capital and credit markets. A sustained downturn in customer demand or other economic conditions could result in material charges related to bad debt or inventory write-offs, restructuring charges, or impairments of long-lived assets, including both tangible and intangible assets. Furthermore, a sustained downturn in financial markets and asset values could adversely affect the Company’s cost of capital, liquidity and access to capital markets, in addition to potentially increasing its pension funding obligations to ensure its pension plans continue to be adequately funded.
The ongoing COVID-19 pandemic has caused the Company to modify its business practices (including employee travel, employee work locations, and cancellation of physical participation in meetings, events and conferences). The Company has announced an internal vaccine protocol. The Department of Labor’s Occupational Safety and Health Administration (“OSHA”) had issued rules requiring that employers with more than 100 employees in the U.S. have employee populations that are fully vaccinated against or tested weekly for COVID-19, however, the implementation of the OSHA rules was stayed by the Supreme Court on January 13, 2022 and the OSHA withdrew the rules on January 25, 2022. Although OSHA left open the possibility that it might try to finalize a permanent vaccine and testing rule in the future, vaccine protocols are currently state and employer-specific. It is currently not possible to predict with certainty the impact any future rules and the Company's vaccination policy will have on its workforce. Additional vaccine mandates may also be implemented in other jurisdictions in which the Company operates and the Company may take further actions as may be required by government authorities or that the Company determines are in the best interests of its employees, customers, distributors, suppliers and contractors. There is no certainty that such measures will be sufficient to mitigate the risks posed by the virus, and the Company's ability to perform critical functions could be harmed and vaccine mandates could result in higher than usual employee attrition rates and adversely impact the operations of the Company if higher than usual customer demand of its products continues similar to demand levels experienced during the second half of 2020 and during 2021. Furthermore, as a result of the ongoing COVID-19 pandemic, in 2020 the Company executed certain temporary and permanent cost reduction measures including adjustments to its supply chain and manufacturing labor base to match the demand environment and reductions in staffing, compensation and benefits in a manner that allows the Company to respond to changes in demand, some of which were reversed and some were made
11
permanent. These cost reduction measures may not prove to be successful and the Company may need to undertake further measures that could adversely impact its business and/or its ability to ramp up operations in a timely manner.
Continued uncertainties related to the COVID-19 pandemic have caused, and may continue to cause, disruptions in the Company's supply chain, cause delay, or limit the ability of, customers to continue to operate and perform, including in making timely payments to the Company, result in the Company's inability to meet its consumers' and customers' needs due to disruptions in manufacturing and supply arrangements caused by the loss or disruption of essential manufacturing and supply elements, and cause other unpredictable events.
In addition, the ongoing COVID-19 pandemic may also limit the Company’s resources or delay the Company’s ability to implement strategic initiatives. If strategic initiatives are delayed, such initiatives may not achieve some or all of the expected benefits, which could have a material adverse effect on the Company’s competitive position, business, financial condition and results of operations and cash flows.
The continued spread of COVID-19 has caused, and may continue to cause, significant reductions in demand or significant volatility in demand for certain of the Company’s products. As lockdowns occurred in the first and second quarters of 2020 and the work from home trend continued in 2021, those subject to lockdowns and working from home engaged in home improvement projects in large numbers, and demand for the Company’s products at its retail partners increased significantly. As different geographical areas anticipate and begin moving into a recovery era, demand for the Company’s products may decrease as focus shifts to activities outside the home.
The degree to which COVID-19 ultimately affects the Company’s business, liquidity, results and operations will depend on future developments, which continue to be highly uncertain and cannot be predicted. These uncertainties, include, but are not limited to, the duration and spread of the outbreak and the resurgence in cases,, its severity, the actions to contain the virus or treat its impact, the availability of vaccines, effectiveness against new variants of COVID-19 and achievement of sufficient vaccination levels, supply chain disruptions, competition in the labor market and how quickly and to what extent economic and operating conditions can become more predictable and certain.
Changes in customer preferences, the inability to maintain mutually beneficial relationships with large customers, inventory reductions by customers, and the inability to penetrate new channels of distribution could adversely affect the Company’s business.
The Company has certain significant customers, particularly home centers and major retailers. In 2021, the two largest customers comprised approximately 29% of net sales, with U.S. and international mass merchants and home centers collectively comprising approximately 46% of net sales. The loss or material reduction of business, the lack of success of sales initiatives, or changes in customer preferences or loyalties for the Company’s products, related to any such significant customer could have a material adverse impact on the Company’s results of operations and cash flows. In addition, the Company’s major customers are volume purchasers, a few of which are much larger than the Company and have strong bargaining power with suppliers. This limits the ability to recover cost increases through higher selling prices. Furthermore, unanticipated inventory adjustments by these customers can have a negative impact on the Company's net sales.
In times of tough economic conditions, the Company has experienced significant distributor inventory corrections reflecting de-stocking of the supply chain associated with difficult credit markets. Such distributor de-stocking exacerbated sales volume declines pertaining to weak end user demand and the broader economic recession. The Company’s results may be adversely impacted in future periods by such customer inventory adjustments. Further, the inability to continue to penetrate new channels of distribution may have a negative impact on the Company’s future results.
The Company faces active global competition and if it does not compete effectively, its business may suffer.
The Company faces active competition and resulting pricing pressures. The Company’s products compete on the basis of, among other things, its reputation for product quality, its well-known brands, price, innovation and customer service capabilities. The Company competes with both larger and smaller companies that offer the same or similar products and services or that produce different products appropriate for the same uses. These companies are often located in countries such as China, Taiwan and India where labor and other production costs are substantially lower than in the U.S., Canada and Western Europe. Also, certain large customers offer house brands that compete with some of the Company’s product offerings as a lower-cost alternative. To remain profitable and defend market share, the Company must maintain a competitive cost structure, develop new products and services, lead product innovation, respond to competitor innovations and enhance its existing products in a timely manner. The Company may not be able to compete effectively on all of these fronts and with all of its competitors, and the failure to do so could have a material adverse effect on its sales and profit margins.
12
Operations Excellence, one element of the SBD Operating Model, is a continuous operational improvement process applied to many aspects of the Company’s business such as procurement, quality in manufacturing, maximizing customer fill rates, integrating acquisitions and other key business processes. In the event the Company is not successful in effectively applying the Operations Excellence principles to its key business processes, including those of acquired businesses, its ability to compete and future earnings could be adversely affected.
In addition, the Company may have to reduce prices on its products and services, or make other concessions, to stay competitive and retain market share. Price reductions taken by the Company in response to customer and competitive pressures, as well as price reductions and promotional actions taken to drive demand that may not result in anticipated sales levels, could also negatively impact its business. The Company engages in restructuring actions, sometimes entailing shifts of production to low-cost countries, as part of its efforts to maintain a competitive cost structure. If the Company does not execute restructuring actions well, its ability to meet customer demand may decline, or earnings may otherwise be adversely impacted. Similarly, if such efforts to reform the cost structure are delayed relative to competitors or other market factors, the Company may lose market share and profits.
Customer consolidation could have a material adverse effect on the Company’s business.
A significant portion of the Company’s products are sold through home centers and mass merchant distribution channels in the U.S. and Europe. A consolidation of retailers in both North America and abroad has occurred over time and the increasing size and importance of individual customers creates risk of exposure to potential volume loss. The loss of certain larger home centers as customers would have a material adverse effect on the Company’s business.
Low demand for new products and the inability to develop and introduce new products at favorable margins could adversely impact the Company’s performance and prospects for future growth.
The Company’s competitive advantage is due in part to its ability to develop and introduce new products in a timely manner at favorable margins. The uncertainties associated with developing and introducing new products, such as market demand, the unavailability of raw materials necessary for production of the Company's products and costs of development and production, may impede the successful development and introduction of new products on a consistent basis. Introduction of new technology may result in higher costs to the Company than that of the technology replaced. That increase in costs, which may continue indefinitely or until increased demand and greater availability in the sources of the new technology drive down its cost, could adversely affect the Company’s results of operations. Market acceptance of the new products introduced in recent years and scheduled for introduction in future years may not meet sales expectations due to various factors, such as the failure to accurately predict market demand, end-user preferences, evolving industry standards, or the emergence of new or disruptive technologies. Moreover, the ultimate success and profitability of the new products may depend on the Company’s ability to resolve technical and technological challenges in a timely and cost-effective manner, and to achieve manufacturing efficiencies. The Company’s investments in productive capacity and commitments to fund advertising and product promotions in connection with these new products could erode profits if those expectations are not met.
The pace of technological change continues to accelerate and the Company's ability to react effectively to such change may present significant competitive risks.
The pace of technological change is increasing at an exponential rate. The continued creation, development and advancement of new technologies such as 5G data networks, artificial intelligence, blockchain, quantum computing, data analytics, 3-D printing, robotics, sensor technology, data storage, neural networks, augmented reality, amongst others, as well as other technologies in the future that are not foreseen today, continue to transform the Company’s processes, products and services.
In order to remain competitive, the Company will need to stay abreast of such technologies, require its employees to continue to learn and adapt to new technologies and be able to integrate them into its current and future business models, products, services and processes and also guard against existing and new competitors disrupting its business using such technologies. The Company’s strategy, value creation model, operating model and innovation ecosystem have important technological elements and many of the Company’s products and offerings are based on technological advances, including artificial intelligence, machine learning, advanced analytics and the Internet of Things. In addition, the Company will need to compete for talent in a competitive market that is familiar with such technologies including upskilling its workforce. Higher than expected employee attrition rates may also result in difficulties to recruit and obtain talent needed to compete effectively. There can be no assurance that the Company will continue to compete effectively with its industry peers due to technological changes, which could result in a material adverse effect on the Company's business and results of operations.
The Company has significant operations outside of the United States, which are subject to political, legal, economic and other risks arising from operating outside of the United States.
13
The Company generates a significant portion of its total revenue outside of the United States. Business operations outside of the United States are subject to political, economic and other risks inherent in operating in certain countries, such as:
• the difficulty of enforcing agreements and protecting assets through legal systems outside the U.S. including intellectual property rights, which may not be recognized, and which the Company may not be able to protect outside the U.S. to the same extent as under U.S. law;
• managing widespread operations and enforcing internal policies and procedures such as compliance with U.S. and foreign anti-bribery, anti-corruption, and sanctions regulations;
• trade protection measures and import or export licensing requirements including those related to the U.S.'s relationship with China;
• the application of certain labor regulations outside of the United States;• compliance with a wide variety of non-U.S. laws and regulations;• ongoing stability or changes in the general political and economic conditions in the countries where the Company
operates, particularly in emerging markets;• the threat of nationalization and expropriation;• increased costs and risks of doing business and managing a workforce in a wide variety of jurisdictions;• the increased possibility of cyber threats in certain jurisdictions;• government controls limiting importation of goods;• government controls limiting payments to suppliers for imported goods;• limitations on, or impacts from, the repatriation of foreign earnings; and • exposure to wage, price and capital controls.
Changes in the political or economic environments in the countries in which the Company operates could have a material adverse effect on its financial condition, results of operations or cash flows. Additionally, the Company is subject to complex U.S., foreign and other local laws and regulations that are applicable to its operations abroad, such as the Foreign Corrupt Practices Act of 1977, the UK Bribery Act of 2010 and other anti-bribery and anti-corruption laws. Although the Company has implemented internal controls, policies and procedures and employee training and compliance programs to deter prohibited practices, such measures may not be effective in preventing employees, contractors or agents from violating or circumventing such internal policies and violating applicable laws and regulations. Any determination that the Company has violated anti-bribery or anti-corruption laws or sanctions regulations could have a material adverse effect on the Company’s business, operating results and financial condition. Compliance with international and U.S. laws and regulations that apply to the Company’s international operations increases the cost of doing business in foreign jurisdictions. Violations of such laws and regulations may result in severe fines and penalties, criminal sanctions, administrative remedies or restrictions on business conduct, and could have a material adverse effect on the Company’s reputation, its ability to attract and retain employees, its business, operating results and financial condition.
The Company’s success depends on its ability to improve productivity and streamline operations to control or reduce costs.
The Company is committed to continuous productivity improvement and evaluating opportunities to reduce fixed costs, simplify or improve processes, and eliminate excess capacity. The Company has undertaken restructuring actions, the savings of which may be mitigated by many factors, including economic weakness, inflation, competitive pressures, higher labor costs and decisions to increase costs in areas such as sales promotion or research and development above levels that were otherwise assumed. Failure to achieve, or delays in achieving, projected levels of efficiencies and cost savings from such measures, or unanticipated inefficiencies resulting from manufacturing and administrative reorganization actions in progress or contemplated, would adversely affect the Company’s business and financial results.
The performance of the Company may suffer from business disruptions with catastrophic losses affecting distribution centers and other infrastructure, or other costs associated with information technology, system implementations, or cyber security risks.
The Company relies heavily on digital technology, including from third parties, to manage and operate its businesses and record and process transactions. Digital technology plays a crucial role in effectively operating the Company’s physical operations, notably manufacturing sites, distribution centers, security alarm monitoring facilities, offices and processing centers, which are distributed in various geographic locations. Factors that are hard to predict or are beyond the Company’s control, like weather (including any potential effects of climate change), natural disasters, supply and commodity shortages, fire, explosions, acts or threats of war or terrorism, political unrest, cybersecurity breaches, sabotage, generalized labor unrest or public health crises, including pandemics, could damage or disrupt the Company’s digital technology infrastructure, or that of its suppliers or distributors. If the Company does not effectively plan for or respond to disruptions in its operations, or cannot quickly repair
14
damage to its systems, the Company may be late in delivering or unable to deliver products and services to its customers, and the quality and safety of its products and services might be negatively affected. If a material or extended disruption occurs, the Company may lose its customers’ or business partners’ confidence or suffer damage to its reputation, and long-term consumer demand for its products and services could decline. Although the Company maintains business interruption insurance, it may not fully protect the Company against all adverse effects that could result from significant disruptions. These events could materially and adversely affect the Company’s product sales, financial condition, results of operations, and reputation.
In addition, the Company is in the process of system integrations, conversions, and capability additions such as eCommerce, Artificial Intelligence and Data Analytics to drive enhanced business outcomes. There can be no assurances that expected expense or revenue synergies will be achieved or that there will not be delays to the expected timing of system integrations, conversions or capability additions. It is possible the costs to complete the system integrations, conversions or capability additions may exceed expectations, and that significant costs may be incurred that will require immediate expense recognition as opposed to capitalization. The risk of disruption to key operations and overall business is increased when complex system changes, such as integrations, conversions or capability additions are undertaken. If systems fail to function effectively, or become damaged, operational delays may ensue and the Company may be forced to make significant expenditures to remedy such issues. Any significant disruption in the Company’s digital technology could have a material adverse impact on its business and results.
Despite efforts to prevent such situations and maintaining insurance policies and loss control and risk management practices that partially mitigate these risks, the Company’s digital technologies may be affected by damage or interruption from, among other causes, power outages, system failures or cyber attacks.
Industry and Economic Risks
The Company’s results of operations could be negatively impacted by inflationary or deflationary economic conditions which could affect the ability to obtain raw materials, component parts, freight, energy, labor and sourced finished goods in a timely and cost-effective manner, as well as lead to changes in interest rate environments which impact its cost of funds, the general strength of the economy and demand for its products in the market.
The Company’s products are manufactured using both ferrous and non-ferrous metals including, but not limited to, steel, zinc, copper, brass, aluminum, and nickel. Additionally, the Company uses other commodity-based materials for components and packaging including, but not limited to, plastics, resins, wood and corrugated products. The Company’s cost base also reflects significant elements for freight, energy and labor. The Company also sources certain finished goods directly from vendors. If the Company is unable to mitigate inflationary increases through various customer pricing actions and cost reduction initiatives, its profitability may be adversely affected.
Conversely, in the event there is deflation, the Company may experience pressure from its customers to reduce prices, and there can be no assurance that the Company would be able to reduce its cost base (through negotiations with suppliers or other measures) to offset any such price concessions which could adversely impact results of operations and cash flows.
Further, as a result of inflationary or deflationary economic conditions, the Company believes it is possible that a limited number of suppliers may either cease operations or require additional financial assistance from the Company in order to fulfill their obligations. In a limited number of circumstances, the magnitude of the Company’s purchases of certain items is of such significance that a change in established relationships with suppliers or increase in the costs of purchased raw materials, component parts or finished goods could result in manufacturing interruptions, delays, inefficiencies or an inability to market products. Changes in value-added tax rebates, currently available to the Company or to its suppliers, could also increase the costs of the Company’s manufactured products, as well as purchased products and components, and could adversely affect the Company’s results.
In addition, many of the Company’s products incorporate battery technology. As the world moves towards a lower-carbon economy and as other industries begin to adopt similar battery technology for use in their products or increase their current consumption of battery technology, the increased demand could place capacity constraints on the Company’s supply chain. In addition, increased demand for battery technology may also increase the costs to the Company for both the battery cells as well as the underlying raw materials such as cobalt and lithium, among others. If the Company is unable to mitigate any possible supply constraints, related increased costs or drive alternative technology through innovation, its profitably and financial results could be negatively impacted.
Uncertainty about the financial stability of economies outside the U.S. could have a significant adverse effect on the Company's business, results of operations and financial condition.
15
The Company generates approximately 40% of its revenues outside the U.S., including 17% from Europe and 14% from various emerging market countries. Each of the Company’s segments generates sales in these marketplaces. While the Company believes any downturn in the European or emerging marketplaces might be offset to some degree by the relative stability in North America, the Company’s future growth, profitability and financial liquidity could be affected, in several ways, including but not limited to the following:
• depressed consumer and business confidence may decrease demand for products and services;• customers may implement cost reduction initiatives or delay purchases to address inventory levels;• significant declines of foreign currency values in countries where the Company operates could impact both the revenue
growth and overall profitability in those geographies;• a slowing or contracting Chinese economy could reduce China’s consumption and negatively impact the Company’s
sales in that region, as well as globally;• a devaluation of foreign currencies could have an effect on the credit worthiness (as well as the availability of funds)
of customers in those regions impacting the collectability of receivables;• a devaluation of foreign currencies could have an adverse effect on the value of financial assets of the Company in the
effected countries; and• the impact of an event (individual country default, Brexit, or break up of the Euro) could have an adverse impact on
the global credit markets and global liquidity potentially impacting the Company’s ability to access these credit markets and to raise capital.
The Company is exposed to market risk from changes in foreign currency exchange rates which could negatively impact profitability.
The Company manufactures and sells its products in many countries throughout the world. As a result, there is exposure to foreign currency risk as the Company enters into transactions and makes investments denominated in multiple currencies. The Company’s predominant currency exposures are related to the Euro, Canadian Dollar, British Pound, Australian Dollar, Brazilian Real, Argentine Peso, Chinese Renminbi (“RMB”) and the Taiwan Dollar. In preparing its financial statements, for foreign operations with functional currencies other than the U.S. dollar, asset and liability accounts are translated at current exchange rates, while income and expenses are translated using average exchange rates. With respect to the effects on translated earnings, if the U.S. dollar strengthens relative to local currencies, the Company’s earnings could be negatively impacted. Although the Company utilizes risk management tools, including hedging, as it deems appropriate, to mitigate a portion of potential market fluctuations in foreign currencies, there can be no assurance that such measures will result in all market fluctuation exposure being eliminated. The Company generally does not hedge the translation of its non-U.S. dollar earnings in foreign subsidiaries but may choose to do so in certain instances.
The Company sources many products from China and other low-cost countries for resale in other regions. To the extent the RMB or other currencies appreciate, the Company may experience cost increases on such purchases. The Company may not be successful at implementing customer pricing or other actions in an effort to mitigate the related cost increases and thus its profitability may be adversely impacted.
Financing Risks
The Company has incurred, and may incur in the future, significant indebtedness, and may in the future issue additional equity securities, including in connection with mergers or acquisitions, which may impact the manner in which it conducts business or the Company’s access to external sources of liquidity. The potential issuance of such securities may limit the Company’s ability to implement elements of its growth strategy and may have a dilutive effect on earnings.
As described in Note H, Long-Term Debt and Financing Arrangements, of the Notes to Consolidated Financial Statements in Item 8, the Company has a five-year $2.5 billion committed credit facility and $2.0 billion 364-day committed credit facilities. No amounts were outstanding against either of these facilities on January 1, 2022. As of January 1, 2022, the Company had $4.4 billion principal amount of indebtedness.
The instruments and agreements governing certain of the Company’s current indebtedness contain requirements or restrictive covenants that include, among other things:
• a limitation on creating liens on certain property of the Company and its subsidiaries;• a restriction on entering into certain sale-leaseback transactions;• customary events of default. If an event of default occurs and is continuing, the Company might be required to repay
all amounts outstanding under the respective instrument or agreement; and
16
• maintenance of a specified financial ratio. The Company has an interest coverage covenant that must be maintained to permit continued access to its committed revolving credit facilities. The interest coverage ratio tested for covenant compliance compares adjusted Earnings Before Interest, Taxes, Depreciation and Amortization to adjusted Interest Expense ("adjusted EBITDA"/"adjusted Interest Expense"); such adjustments to interest or EBITDA include, but are not limited to, removal of non-cash interest expense and stock-based compensation expense. The interest coverage ratio must not be less than 2.5 times through December 31, 2021 and not less than 3.5 times thereafter and is computed quarterly, on a rolling twelve months (last twelve months) basis. Under this covenant definition, the interest coverage ratio was 14.9 times EBITDA or higher in each of the 2021 quarterly measurement periods. Management does not believe it is reasonably likely the Company will breach this covenant. Failure to maintain this ratio could adversely affect further access to liquidity.
Future instruments and agreements governing indebtedness may impose other restrictive conditions or covenants. Such covenants could restrict the Company in the manner in which it conducts business and operations as well as in the pursuit of its growth and acquisition strategy.
The Company is exposed to counterparty risk in its hedging arrangements.
From time to time, the Company enters into arrangements with financial institutions to hedge exposure to fluctuations in currency and interest rates, including forward contracts, options and swap agreements. The Company may incur significant losses from hedging activities due to factors such as demand volatility. The failure of one or more counterparties to the Company’s hedging arrangements to fulfill their obligations could adversely affect the Company’s results of operations.
Tight capital and credit markets or the failure to maintain credit ratings could adversely affect the Company by limiting the Company’s ability to borrow or otherwise access liquidity.
The Company’s long-term growth plans are dependent on, among other things, the availability of funding to support corporate initiatives and complete appropriate acquisitions and the ability to increase sales of existing product lines. While the Company has not encountered financing difficulties to date, the capital and credit markets have experienced extreme volatility and disruption in the past and may again in the future. Market conditions could make it more difficult for the Company to borrow or otherwise obtain the cash required for significant new corporate initiatives and acquisitions.
Furthermore, there could be a number of follow-on effects from a credit crisis on the Company’s businesses, including insolvency of key suppliers resulting in product delays; inability of customers to obtain credit to finance purchases of the Company’s products and services and/or customer insolvencies.
In addition, the major rating agencies regularly evaluate the Company for purposes of assigning credit ratings. The Company’s ability to access the credit markets, and the cost of these borrowings, is affected by the strength of its credit ratings and current market conditions. Failure to maintain credit ratings that are acceptable to investors may adversely affect the cost and other terms upon which the Company is able to obtain financing, as well as its access to the capital markets.
Discontinuation, reform or replacement of the London Inter-bank Offered Rate ("LIBOR") and other benchmark rates, or uncertainty related to the potential for any of the foregoing, may adversely affect the Company.
A portion of the Company’s indebtedness bears interest at rates that fluctuate with changes in certain short-term prevailing interest rates, including the LIBOR. In March 2021, UK Financial Conduct Authority announced that all LIBOR settings will either cease to be provided by any administrator or no longer be representative immediately after December 31, 2021. Banks currently reporting information used to set U.S. dollar LIBOR are presently expected to stop doing so during 2023. In addition, other regulators have suggested reforming or replacing other benchmark rates. These may be replaced by the Secured Overnight Financing Rate or other benchmark rates over the next several years. The discontinuation, reform or replacement of LIBOR or any other benchmark rates may have an unpredictable impact on contractual mechanics in the credit markets or cause disruption to the broader financial markets. These changes, and related uncertainty as to the nature of such potential discontinuation, reform or replacement may create incremental uncertainty in obtaining financing or increase the cost of borrowing. At this time, the Company cannot predict the overall effect of the modification or discontinuation of LIBOR or the establishment of alternative benchmark rates.
The Company is exposed to credit risk on its accounts receivable.
The Company’s outstanding trade receivables are not generally covered by collateral or credit insurance. While the Company has procedures to monitor and limit exposure to credit risk on its trade and non-trade receivables, there can be no assurance
17
such procedures will effectively limit its credit risk and avoid losses, which could have an adverse effect on the Company’s financial condition and operating results.
If the Company were required to write-down all or part of its goodwill, indefinite-lived trade names, or other definite-lived intangible assets, its net income and net worth could be materially adversely affected.
As a result of the Black and Decker merger and other acquisitions, the Company has approximately $8.8 billion of goodwill, approximately $2.5 billion of indefinite-lived trade names and approximately $2.2 billion of net definite-lived intangible assets on January 1, 2022. The Company is required to periodically, at least annually, determine if its goodwill or indefinite-lived trade names have become impaired, in which case it would write down the impaired portion of the asset. The definite-lived intangible assets, including customer relationships, are amortized over their estimated useful lives and are evaluated for impairment when appropriate. Impairment of intangible assets may be triggered by developments outside of the Company’s control, such as worsening economic conditions, technological change, intensified competition or other factors, which could have an adverse effect on the Company’s financial condition and results of operations.
If the investments in employee benefit plans do not perform as expected, the Company may have to contribute additional amounts to these plans, which would otherwise be available to cover operating expenses or other business purposes.
The Company sponsors pension and other post-retirement defined benefit plans. The Company’s defined benefit plan assets are currently invested in equity securities, government and corporate bonds and other fixed income securities, money market instruments and insurance contracts. The Company’s funding policy is generally to contribute amounts determined annually on an actuarial basis to provide for current and future benefits in accordance with applicable law which require, among other things, that the Company make cash contributions to under-funded pension plans. During 2021, the Company made cash contributions to its defined benefit plans of approximately $40 million and expects to contribute $41 million to its defined benefit plans in 2022.
There can be no assurance that the value of the defined benefit plan assets, or the investment returns on those plan assets, will be sufficient in the future. It is therefore possible that the Company may be required to make higher cash contributions to the plans in future years which would reduce the cash available for other business purposes, and that the Company will have to recognize a significant pension liability adjustment which would decrease the net assets of the Company and result in higher expense in future years. The fair value of the defined benefit plan assets on January 1, 2022 was approximately $2.6 billion.
Strategic Risks
The successful execution of the Company’s business strategy depends on its ability to recruit, retain, train, motivate, and develop employees and execute effective succession planning.
The success of the Company’s efforts to grow its business depends on the contributions and abilities of key executives and management personnel, its sales force and other personnel, including the ability of its sales force to adapt to any changes made in the sales organization and achieve adequate customer coverage. The Company must therefore continue to recruit, retain, train and motivate management, sales and other personnel sufficiently to maintain its current business and support its projected growth. In addition, the Company must invest heavily in reskilling and upskilling its employees, including placing an emphasis on lifelong learning. Additionally, any unplanned turnover or inability to attract and retain key employees could have a negative effect on the Company’s results of operations.
A shortage of key employees might jeopardize the Company’s ability to implement its growth strategy, and changes in the key management team can result in loss of continuity, loss of accumulated knowledge, departure of other key employees, disruptions to the Company’s operations and inefficiency during transitional periods. The Company’s reputation, business, revenue and results of operations could be materially and adversely affected if it is unable to recruit, retain, train, motivate, and develop employees and successfully execute organizational change and management transitions at leadership levels.
The Company’s acquisitions, exiting of businesses, divestitures, strategic investments and alliances and joint ventures, as well as general business reorganizations, may result in financial results that are different than expected and certain risks for its business and operations.
As part of the Company's strategy, it may acquire businesses or assets, divest businesses or assets, enter into strategic alliances and joint ventures, and make investments to further its business (collectively, “business combination and investment transactions”), and also handle any post-closing issues, such as integration. For example, in 2021, the Company completed the MTD Holdings Inc. ("MTD") and Excel Industries ("Excel") acquisitions, as well as smaller acquisitions, and may make
18
additional acquisitions in the future. In December 2021, the Company announced it entered into an agreement to divest its commercial electronic security and healthcare businesses, which it expects to complete in the first half of 2022, pending regulatory approvals and other customary closing conditions.
Risks associated with business combination and investment transactions include the following, any of which could adverselyaffect the Company's financial results, including its effective tax rate:
• the failure to identify the most suitable candidates for acquisitions;• difficulty in finding buyers or alternative exit strategies on acceptable terms in a timely manner, or the Company may
dispose of a business at a price or on terms that are less desirable than the Company had anticipated for a divestiture; • the ability to conduct due diligence with respect to business combination and investment transactions, and the ability to
evaluate the results of such due diligence, which is dependent on the veracity and completeness of statements anddisclosures made or actions taken by third parties or their representatives and the failure to identify significant issueswith the target company’s product quality, financial disclosures, accounting practices or internal control deficiencies orthe factors necessary to estimate reasonably accurate costs, timing and other matters;
• for an acquisition or other combination, the acquired business may have differing or inadequate cybersecurity anddata protection controls, which could impact its exposure to data security incidents and potentially increaseanticipated costs or time to integrate the business;
• the difficulties and cost in obtaining any necessary regulatory approvals;• the ability to identify and close on appropriate acquisition opportunities within desired time frames at reasonable cost;• the anticipated additional revenues from the acquired companies do not materialize, despite extensive due diligence; • the acquired businesses will lose market acceptance or profitability; • the impact of divestitures on the Company's revenue growth may be larger than projected, as the Company may
experience greater dis-synergies than expected;• the diversion of Company management’s attention and other resources; • incurring significant restructuring charges and amortization expense, assuming liabilities and ongoing or new lawsuits
related to the transaction or otherwise, potential impairment of acquired goodwill and other intangible assets, and increasing the Company's expenses and working capital requirements;
• the incurrence of unexpected costs and liabilities, including those associated with undisclosed pre-closing regulatory violations by the acquired business;
• for a divestiture, if the Company does not satisfy pre-closing conditions and necessary regulatory and governmental approvals on acceptable terms, it may prevent the Company from completing the transaction;
• continued financial involvement in a divested business, such as through continuing equity ownership, guarantees, indemnities or other financial obligations; and
• the loss of key personnel, distributors, clients or customers of acquired companies.
In addition, the success of the Company’s long-term growth and acquisition strategy will depend in part on successful general reorganization including its ability to:
• combine businesses, product or service offerings and operations or fully realize all of the anticipated benefits of any particular business combination and investment transaction;
• integrate departments, systems and procedures; and• obtain cost savings and other efficiencies from such reorganizations, including the Company's margin resiliency
initiative.
In addition, the current and the proposed changes to the U.S. and foreign regulatory approval process and requirements in connection with an acquisition may cause approvals to take longer than anticipated to obtain, not be forthcoming or contain burdensome conditions, which may jeopardize, delay or reduce the anticipated benefits of the transaction to the Company and could impede the execution of the Company's business strategy. Failure to effectively integrate acquired companies, strategic investments and alliances, consummate or manage any future acquisitions, exit businesses or consummate divestitures, or general business reorganizations, and mitigate the related risks, may adversely affect the Company’s existing businesses and harm its operational results due to large write-offs, significant restructuring costs, contingent liabilities, substantial depreciation, and/or adverse tax or other consequences. The Company cannot ensure that such integrations and reorganizations will be successfully completed or that all of the planned synergies and other benefits will be realized.
Expansion of the Company’s activity in emerging markets may result in risks due to differences in business practices and cultures.
The Company’s growth plans include efforts to increase revenue from emerging markets through both organic growth and acquisitions. Local business practices in these regions may not comply with U.S. laws, local laws or other laws applicable to the Company. When investigating potential acquisitions, the Company seeks to identify historical practices of target companies that
19
would create liability or other exposures for the Company were they to continue post-completion or as a successor to the target. Where such practices are discovered, the Company assesses the risk to determine whether it is prepared to proceed with the transaction. In assessing the risk, the Company looks at, among other factors, the nature of the violation, the potential liability, including any fines or penalties that might be incurred, the ability to avoid, minimize or obtain indemnity for the risks, and the likelihood that the Company would be able to ensure that any such practices are discontinued following completion of the acquisition through implementation of its own policies and procedures. Due diligence and risk assessment are, however, imperfect processes, and it is possible that the Company will not discover problematic practices until after completion, or that the Company will underestimate the risks associated with historical activities. Should that occur, the Company may incur fees, fines, penalties, injury to its reputation or other damage that could negatively impact the Company's earnings.
Legal, Tax, Regulatory and Compliance Risks
The Company’s brands are important assets of its businesses and violation of its trademark rights by imitators, or the failure of its licensees or vendors to comply with the Company’s product quality, manufacturing requirements, marketing standards, and other requirements could negatively impact revenues and brand reputation. Any inability to protect the Company's other intellectual property rights could also reduce the value of its products and services or diminish its competitiveness.
The Company considers its intellectual property rights, including patents, trademarks, copyrights and trade secrets, and licenses held, to be a significant part and valuable aspect of its business. The Company attempts to protect its intellectual property rights through a combination of patent, trademark, copyright and trade secret laws, as well as licensing agreements and third-party nondisclosure and assignment agreements.
The Company’s trademarks have a reputation for quality and value and are important to the Company's success and competitive position. Unauthorized use of the Company’s trademark rights may not only erode sales of the Company’s products, but may also cause significant damage to its brand name and reputation, interfere with its ability to effectively represent the Company to its customers, contractors, suppliers, and/or licensees, and increase litigation costs. Similarly, failure by licensees or vendors to adhere to the Company’s standards of quality and other contractual requirements could result in loss of revenue, increased litigation, and/or damage to the Company’s reputation and business. There can be no assurance that the Company’s ongoing efforts to protect its brand and trademark rights and ensure compliance with its licensing and vendor agreements will prevent all violations.
In addition, the Company's ability to compete could be negatively impacted by its failure to obtain and adequately protect its intellectual property and preserve its associated intellectual property rights, including patents, copyrights, trade secrets, and licenses, as well as its products and any new features of its products or processes. The Company's patent applications may not be approved and any patents owned could be challenged, invalidated or designed around by third parties. In addition, the Company's patents may not be of sufficient scope or strength to provide meaningful protection or commercial advantage.
The Company is exposed to risks related to cybersecurity. The Company’s operations rely on the secure processing, storage and transmission of confidential, sensitive, proprietary and other types of information relating to its business operations, as well as confidential and sensitive information about its customers and employees maintained in the Company’s computer systems and networks, certain products and services, and in the computer systems and networks of its third-party vendors. Cyber threats are rapidly evolving as data thieves and hackers have become increasingly sophisticated and carry out direct large-scale, complex attacks against a company or through vendor software supply chain compromises. In particular, the Company is increasingly relying on its digital technology to support its operations as it manages the impact of COVID-19, including supporting remote-work protocols for a substantial number of the Company’s employees in regions impacted by the spread of COVID-19 and future, ongoing hybrid-work protocols, which can increase cyber risks. The Company is not able to anticipate or prevent all such attacks and could be held liable for any resulting material security breach or data loss. In addition, it is not always possible to deter misconduct by employees or third-party vendors.
Breaches of the Company’s technology systems, or those of the Company’s vendors, whether from circumvention of security systems, denial-of-service attacks or other cyber-attacks, hacking, “phishing” attacks, computer viruses, ransomware or malware, employee or insider error, malfeasance, social engineering, vendor software supply chain compromises, physical breaches or other actions, have and may result in manipulation or corruption of sensitive data, material interruptions or malfunctions in the Company’s or such vendors’ websites, applications, data processing, and certain products and services, or disruption of other business operations. Furthermore, any such breaches could compromise the confidentiality and integrity of material information held by the Company (including information about the Company’s business, employees or customers), as
20

well as sensitive personally identifiable information, the disclosure of which could lead to identity theft. Breaches of the Company’s products that rely on technology and internet connectivity can expose the Company to product and other liability risk and reputational harm. Measures that the Company takes to avoid, detect, mitigate or recover from material incidents, including implementing and conducting training on insider trading policies for the Company’s employees and maintaining contractual obligations for the Company’s third-party vendors, can be expensive, and may be insufficient, circumvented, or may become ineffective.
The Company has invested and continues to invest in risk management and information security and data privacy measures in order to protect its systems and data, including employee training, organizational investments, incident response plans, table top exercises and technical defenses. The cost and operational consequences of implementing, maintaining and enhancing further data or system protection measures could increase significantly to overcome increasingly intense, complex, and sophisticated global cyber threats. Despite the Company’s best efforts, it is not fully insulated from data breaches and system disruptions. Recent well-publicized security breaches at other companies have led to enhanced government and regulatory scrutiny of the measures taken by companies to protect against cyber-attacks, and may in the future result in heightened cybersecurity requirements, including additional regulatory expectations for oversight of vendors and service providers. Any material breaches of cybersecurity, including the accidental loss, inadvertent disclosure or unapproved dissemination of proprietary information or sensitive or confidential data, or media reports of perceived security vulnerabilities to the Company’s systems, products and services or those of the Company’s third parties could cause the Company to experience reputational harm, loss of customers and revenue, fines, regulatory actions and scrutiny, sanctions or other statutory penalties, litigation, liability for failure to safeguard the Company’s customers’ information, or financial losses that are either not insured against or not fully covered through any insurance maintained by the Company. The report, rumor or assumption regarding a potential breach may have similar results, even if no breach has been attempted or occurred. Any of the foregoing may have a material adverse effect on the Company’s business, operating results and financial condition.
The Company is exposed to risks related to compliance with data privacy laws.
To conduct its operations, the Company regularly moves data across national borders, and consequently is subject to a variety of continuously evolving and developing laws and regulations in the United States and abroad regarding privacy, data protection and data security. The scope of the laws that may be applicable to the Company is often uncertain and may be conflicting, particularly with respect to foreign laws. For example, the European Union’s General Data Protection Regulation (“GDPR”), which became effective in May 2018, greatly increased the jurisdictional reach of European Union law and added a broad array of requirements for handling personal data, including the public disclosure of significant data breaches. Similarly, the California Consumer Privacy Act of 2018 (“CCPA”), which became effective in January 2020, provided, among other things, a new private right of action for data breaches, required companies that process information on California residents to make new disclosures to consumers about their data collection, use and sharing practices, and provided consumers with additional rights. The California Privacy Rights Act of 2020, which will become effective on January 1, 2023, amends and expands the CCPA, creating new industry requirements, consumer privacy rights and enforcement mechanisms. Virginia and Colorado have also passed robust privacy laws that will come into effect on January 1 and July 1, 2023, respectively. The Company's reputation and brand and its ability to attract new customers could also be adversely impacted if the Company fails, or is perceived to have failed, to properly respond to security breaches of its or third party’s information technology systems. Such failure to properly respond could also result in similar exposure to liability.
Additionally, other countries have enacted or are enacting data localization laws that require data to stay within their borders. In many cases, these laws and regulations apply not only to transfers between unrelated third parties but also to transfers between the Company and its subsidiaries.
All of these evolving compliance and operational requirements impose significant costs that are likely to increase over time. Privacy laws that may be implemented in the future, and court decisions impacting activities across borders, including the Schrems II decision invalidating the EU - U.S. Privacy Shield, will continue to require changes to certain business practices, thereby increasing costs, or may result in negative publicity, require significant management time and attention, and may subject the Company to remedies that may harm its business, including fines or demands or orders that the Company modify or cease existing business practices.
Significant judgment and certain estimates are required in determining the Company’s worldwide provision for income taxes. Future tax law changes and audit results may materially increase the Company’s prospective income tax expense.
The Company is subject to income taxation in the U.S. as well as numerous foreign jurisdictions. Significant judgment is required in determining the Company’s worldwide income tax provision and accordingly there are many transactions and computations for which the final income tax determination is uncertain. The Company considers many factors when evaluating and estimating its tax positions and tax benefits, which may require periodic adjustments, and which may not accurately
21
anticipate actual outcomes. The Company periodically assesses its liabilities and contingencies for all tax years still subject to audit based on the most currently available information, which involves inherent uncertainty. The Company is routinely audited by income tax authorities in many tax jurisdictions. Although management believes the recorded tax estimates are reasonable, the ultimate outcome of any audit (or related litigation) could differ materially from amounts reflected in the Company’s income tax accruals. Additionally, the global income tax provision can be materially impacted due to foreign currency fluctuations against the U.S. dollar since a significant amount of the Company’s earnings are generated outside the United States. Lastly, it is possible that future income tax legislation may be enacted that could have a material impact on the Company’s worldwide income tax provision, cash tax liability, and effective tax rate beginning with the period that such legislation becomes enacted.
Climate change and climate change legislation or regulations may adversely affect the Company's business.
The effects of climate change, such as severe weather, including droughts and water scarcity, could impact the Company’s business. The effects of climate change could also disrupt the Company’s operations by impacting the availability and costs of materials needed for manufacturing and could increase insurance and other operating costs. There may be operational risk due to the significant impact climate change could pose to employees’ lives, the Company’s supply chain, or electrical power availability from climate-related weather events. The Company also face risks related to the transition to a lower-carbon economy, such as its ability to successfully adopt new technology or to comply with more stringent and increasingly complex environmental regulations or requirements for the Company's manufacturing facilities and business operations, increased prices related to freight and shipping costs and other permitting requirements.
There continues to be a lack of consistent climate legislation, which creates economic and regulatory uncertainty. Increased public awareness and concern regarding global climate change may result in more international, regional and/or federal requirements or other stakeholder expectations that could mandate more restrictive or expansive standards, more prescriptive reporting of environmental, social and governance metrics than the voluntary commitments the Company adopted, or require related changes on a more accelerated time frame than the Company anticipates. A number of governmental bodies have finalized, proposed or are contemplating legislative and regulatory changes in response to the potential effect of climate change. Such legislation or regulation has and potentially could include provisions for a “cap and trade” system of allowances and credits or a carbon tax or require increased measurement of metrics and disclosure, among other provisions. The Company currently purchases renewable energy certificates (“RECs”) to mitigate the impact of carbon tax and is also assessing expanding its use of solar panels as an alternative energy source. If carbon tax legislation is changed or adopted, the Company may not be able to mitigate the future impact of carbon tax through the purchase of RECs and the use of solar panels or other measures. The Company may also face reputational risks and risks to the Company's investor confidence and market share if the Company is unable to make progress on the Company's voluntary environmental goals or is unable to keep apace with the progress made by the Company's peers. If environmental laws or regulations are either changed or adopted and impose significant operational restrictions and compliance requirements on the Company, they may have a material adverse effect on the Company’s business, access to credit, capital expenditures, operating results and financial condition.
The Company’s failure to continue to successfully avoid, manage, defend, litigate and accrue for claims and litigation could negatively impact its results of operations or cash flows.
The Company is exposed to and becomes involved in various litigation matters arising out of the ordinary routine conduct of its business, including, from time to time, actual or threatened litigation relating to such items as commercial transactions, product liability, workers compensation, arrangements between the Company and its distributors, franchisees or vendors, intellectual property claims and regulatory actions.
In addition, the Company is subject to environmental laws in each jurisdiction in which business is conducted. Some of the Company’s products incorporate substances that are regulated in some jurisdictions in which it conducts manufacturing operations. The Company has been and could be in the future subject to liability if it does not comply with these regulations. In addition, the Company is currently, and may in the future be held responsible for remedial investigations and clean-up costs resulting from the discharge of hazardous substances into the environment, including sites that have never been owned or operated by the Company but at which it has been identified as a potentially responsible party under federal and state environmental laws and regulations. Changes in environmental and other laws and regulations in both domestic and foreign jurisdictions could adversely affect the Company’s operations due to increased costs of compliance and potential liability for non-compliance.
The Company manufactures products, configures and installs security systems and performs various services that create exposure to product and professional liability claims and litigation. The failure of the Company’s products, systems and services to be properly manufactured, configured, installed, designed or delivered, resulting in personal injuries, property damage or business interruption could subject the Company to claims for damages. The Company has and is currently
22
defending product liability claims, some of which have resulted in settlements or monetary judgments against the Company. The costs associated with defending ongoing or future product liability claims and payment of damages could be substantial. The Company’s reputation could also be adversely affected by such claims, whether or not successful.
There can be no assurance that the Company will be able to continue to successfully avoid, manage and defend such matters. In addition, given the inherent uncertainties in evaluating certain exposures, actual costs to be incurred in future periods may vary from the Company’s estimates for such contingent liabilities.
The Company’s products could be recalled.
The Company maintains an awareness of and responsibility for the potential health and safety impacts on its customers. The Company's product development processes include tollgates for product safety review, and extensive testing is conducted on product safety. Safety reviews are performed at various product development milestones, including a review of product labeling and marking to ensure safety and operational hazards are identified for the customer.
Despite safety and quality reviews, the Consumer Product Safety Commission or other applicable regulatory bodies may require, or the Company may voluntarily institute, the recall, repair or replacement of the Company’s products if those products are found not to be in compliance with applicable standards or regulations. A recall could increase the Company's costs and adversely impact its reputation.
The Company’s sales to government customers exposes it to business volatility and risks, including government budgeting cycles and appropriations, procurement regulations, governmental policy shifts, early termination of contracts, audits, investigations, sanctions and penalties.
The Company derives a portion of its revenues from contracts with the U.S. government, state and local governments and foreign governments. Government contractors must comply with specific procurement regulations and other requirements. These requirements, although customary in government contracts, could impact the Company’s performance and compliance costs, including limiting or delaying the Company’s ability to share information with its business partners, customers and investors, which may negatively impact the Company’s business and reputation.
The U.S. government may demand contract terms that are less favorable than standard arrangements with private sector customers and may have statutory, contractual or other legal rights to terminate contracts with the Company. For example, the U.S. government may have contract clauses that permit it to terminate any of the Company’s government contracts and subcontracts at its convenience, and procurement regulations permit termination for default based on the Company’s performance. In addition, changes in U.S. government budgetary priorities could lead to changes in the procurement environment, affecting availability of government contracting or funding opportunities. Changes in government procurement policy, priorities, regulations, technology initiatives and requirements, and/or contract award criteria may negatively impact the Company’s potential for growth in the government sector. Changes in government cybersecurity and system requirements could negatively impact the Company’s eligibility for the award of future contracts, negatively impacting the Company’s business and reputation.
Government contracts laws and regulations impose certain risks, and contracts are generally subject to audits, investigations and approval of policies, procedures and internal controls for compliance with procurement regulations and applicable law. If violations of law are found, they could result in civil and criminal penalties and administrative sanctions, including termination of contracts, refund of a portion of fees received, forfeiture of profits, suspension of payments, fines and suspensions or debarment from future government business. Each of these factors could negatively impact the Company’s business, results of operations, financial condition, and reputation.
Other Risks
The Company’s results of operations and earnings may not meet guidance or expectations.
The Company’s results of operations and earnings may not meet guidance or expectations. The Company may provide public guidance on expected results of operations for future periods. This guidance is comprised of forward-looking statements subject to risks and uncertainties, including the risks and uncertainties described in this Form 10-K and in the Company’s other public filings and public statements, and is based necessarily on assumptions the Company makes at the time it provides such guidance. The Company’s guidance may not always be accurate. The Company may also choose to withdraw guidance, as it did in response to the uncertainty of the COVID-19 pandemic, or lower guidance in future periods. If, in the future, the Company’s results of operations for a particular period do not meet its guidance or the expectations of investment analysts, the Company
23
reduces its guidance for future periods, or the Company withdraws guidance, the market price of the Company’s common stock could decline significantly.
The Company has identified material weaknesses in its internal control over financial reporting. If not remediated, the Company’s failure to establish and maintain effective disclosure controls and procedures and internal control over financial reporting could result in material misstatements in its financial statements and a failure to meet its reporting and financial obligations, each of which could have a material adverse effect on the Company’s financial condition and the trading price of its common stock.
Subsequent to the filing of its 2020 Form 10-K, the Company received comments from the SEC Staff regarding its accounting for equity units issued in May 2017 and November 2019 (the “Equity Units”). Upon further reflection of the comments received by the Staff and the nature of the Equity Units, the Company determined that errors were made in its original accounting conclusions resulting from material weaknesses in its internal control over financial reporting for such instruments. A material weakness is a deficiency, or a combination of deficiencies, in internal control over financial reporting, such that there is a reasonable possibility that a material misstatement of a company’s annual or interim financial statements will not be prevented or detected on a timely basis.
As discussed in Item 9A. Controls and Procedures of this Annual Report on Form 10-K, the Company’s management has evaluated its assessment of the effectiveness of internal control over financial reporting and its disclosure controls and procedures and concluded that they were not effective as of January 1, 2022.
The Company is committed to remediating its material weaknesses as promptly as possible. Management is in the process of implementing its remediation plan. However, there can be no assurance as to when the material weaknesses will be remediated or that additional material weaknesses will not arise in the future. If the Company is unable to maintain effective internal control over financial reporting, its ability to record, process and report financial information timely and accurately could be adversely affected, which could subject the Company to litigation or investigations, require management resources, increase costs, negatively affect investor confidence and adversely impact its stock price.
ITEM 1B. UNRESOLVED STAFF COMMENTS
None.
ITEM 2. PROPERTIES
As of January 1, 2022, the Company and its subsidiaries owned or leased significant facilities used for manufacturing, distribution and sales offices in 23 states and 20 countries. The Company leases its corporate headquarters in New Britain, Connecticut. The Company has 110 facilities including its corporate headquarters that are larger than 100,000 square feet, as follows:
Owned Leased Total
Tools & Storage ......................................................................................... 46 38 84Industrial ..................................................................................................... 14 7 21Mechanical Access Solutions ..................................................................... 1 1 2Corporate ................................................................................................... 2 1 3Total ........................................................................................................... 63 47 110
The combined size of these facilities is approximately 29 million square feet. The buildings are in good condition, suitable for their intended use, adequate to support the Company’s operations, and generally fully utilized. Excluded from the table above, the Company identified one lease, larger than 100,000 square feet, which is part of discontinued operations.
ITEM 3. LEGAL PROCEEDINGS
The Company has identified that certain expenses it incurred in previous years constituted undisclosed perquisites. The Company has voluntarily disclosed this information to the U.S. Securities and Exchange Commission ("SEC") and is cooperating with the SEC’s investigation of this matter. For the named executive officers in fiscal year 2021, the Company has calculated the amount of the undisclosed perquisites to be up to approximately $225,000 in 2020 and up to approximately $350,000 in 2019. These amounts relate principally to use of corporate aircraft and will be included in the Company’s proxy statement for its 2022 annual shareholders meeting.
24
The Company is committed to upholding the highest standards of corporate governance and is continuously focused on ensuring the effectiveness of its policies, procedures, and controls. The Company is in the process, with the assistance of professional advisors, of reviewing and further enhancing relevant policies, procedures, and controls.
Currently the Company does not believe that this matter will have a material impact on its financial condition or results of operations, although it is possible that a loss related to this matter may be incurred. Given the ongoing nature of this matter, management cannot predict the duration, scope, or outcome of the SEC’s investigation or estimate the potential magnitude of any such loss or range of loss, or the cost of the ongoing SEC investigation. Any determination that the Company’s expense and perquisite reporting practices were not in compliance with existing laws or regulations could result in the imposition of fines, civil or criminal penalties, equitable remedies, including disgorgement, injunctive relief, or other sanctions against the Company. The Company also may become a party to litigation or other legal proceedings over these matters.
In the normal course of business, the Company is involved in various lawsuits and claims, including product liability, environmental, intellectual property, contract and commercial, advertising, employment and distributor claims, and administrative proceedings. The Company does not expect that the resolution of these matters will have a materially adverse effect on the Company’s consolidated financial position, results of operations or liquidity.
ITEM 4. MINE SAFETY DISCLOSURES
Not applicable.
25
PART II
ITEM 5. MARKET FOR THE REGISTRANT’S COMMON EQUITY, RELATED STOCKHOLDER MATTERS AND ISSUER PURCHASES OF EQUITY SECURITIES
The Company’s common stock is listed and traded on the New York Stock Exchange, Inc. (“NYSE”) under the abbreviated ticker symbol “SWK”, and is a component of the Standard & Poor’s (“S&P”) 500 Composite Stock Price Index. The Company’s high and low quarterly stock prices on the NYSE for the years ended January 1, 2022 and January 2, 2021 follow: 2021 2020
High Low
Dividend PerCommon
Share High Low
Dividend PerCommon
Share
QUARTER:First ............................................................. $ 202.07 $ 169.35 $ 0.70 $ 172.53 $ 72.03 $ 0.69 Second ........................................................ $ 220.69 $ 194.92 $ 0.70 $ 148.23 $ 92.13 $ 0.69 Third ........................................................... $ 209.43 $ 174.87 $ 0.79 $ 166.25 $ 135.61 $ 0.70 Fourth ......................................................... $ 196.61 $ 171.07 $ 0.79 $ 190.94 $ 161.48 $ 0.70 Total ........................................................... $ 2.98 $ 2.78
As of February 4, 2022, there were 8,755 holders of record of the Company’s common stock. Information required by Item 201(d) of Regulation S-K concerning securities authorized for issuance under equity compensation plans can be found under Item 12 of this Annual Report on Form 10-K.
Issuer Purchases of Equity Securities
The following table provides information about the Company’s purchases of equity securities that are registered by the Company pursuant to Section 12 of the Securities Exchange Act of 1934 for the three months ended January 1, 2022:
2021
Total Number Of Shares Purchased
(a) Average Price Paid
Per Share
Total Number Of Shares
Purchased As Part Of A Publicly
Announced Planor Program
Maximum Number Of Shares That MayYet Be Purchased
Under The Program(b)
October 3 - November 6 ............ 3,980 $ 180.09 — 20,000,000 November 7 - December 4 ........ 58,996 177.99 — 20,000,000 December 5 - January 1 ............. 15,877 187.71 — 20,000,000 Total ........................................... 78,853 $ 180.05 — 20,000,000
(a) The shares of common stock in this column were deemed surrendered to the Company by participants in various benefit
plans of the Company to satisfy the participants’ taxes related to vesting or delivery of time-vesting restricted share units under those plans.
(b) On April 23, 2021, the Board of Directors approved a new repurchase program of up to 20.0 million shares of the Company's common stock (the "April 2021 Program") and terminated the previously approved repurchase program. As of January 1, 2022, the authorized shares available for repurchase under April 2021 Program totaled 20.0 million shares. On February 16, 2022, the Board of Directors terminated the April 2021 Program and approved a new repurchase program of up to the greater of (i) 20.0 million shares of the Company’s common stock; and (ii) the number of shares of the Company’s common stock in the aggregate that can be purchased for an amount up to $2.5 billion. As of February 16, 2022, the authorized shares available for purchase under the new program totaled the greater of (i) 20.0 million shares; and (ii) the number of shares in the aggregate that can be purchased for an amount up to $2.5 billion. The new repurchase program does not have an expiration date. The Company may repurchase shares under the repurchase program through open market purchases, privately negotiated transactions or share repurchase programs, including one or more accelerated share repurchase programs (under which an initial payment for the entire repurchase amount may be made at the inception of the program). Such repurchases may be funded from cash on hand, short-term borrowings or other sources of cash at the Company’s discretion, and the Company is under no obligation to repurchase any shares pursuant to the repurchase program. In the second quarter of 2021, the Company net-share settled capped call options and received 344,004 shares. This transaction was completed under the approved repurchase program in place prior to the April 2021 Program. The currently authorized shares available for repurchase under the new repurchase program do not include approximately 3.6 million shares reserved and authorized for purchase under the Company’s approved repurchase program in place prior to the April 2021 Program relating to a forward share purchase contract entered into
26
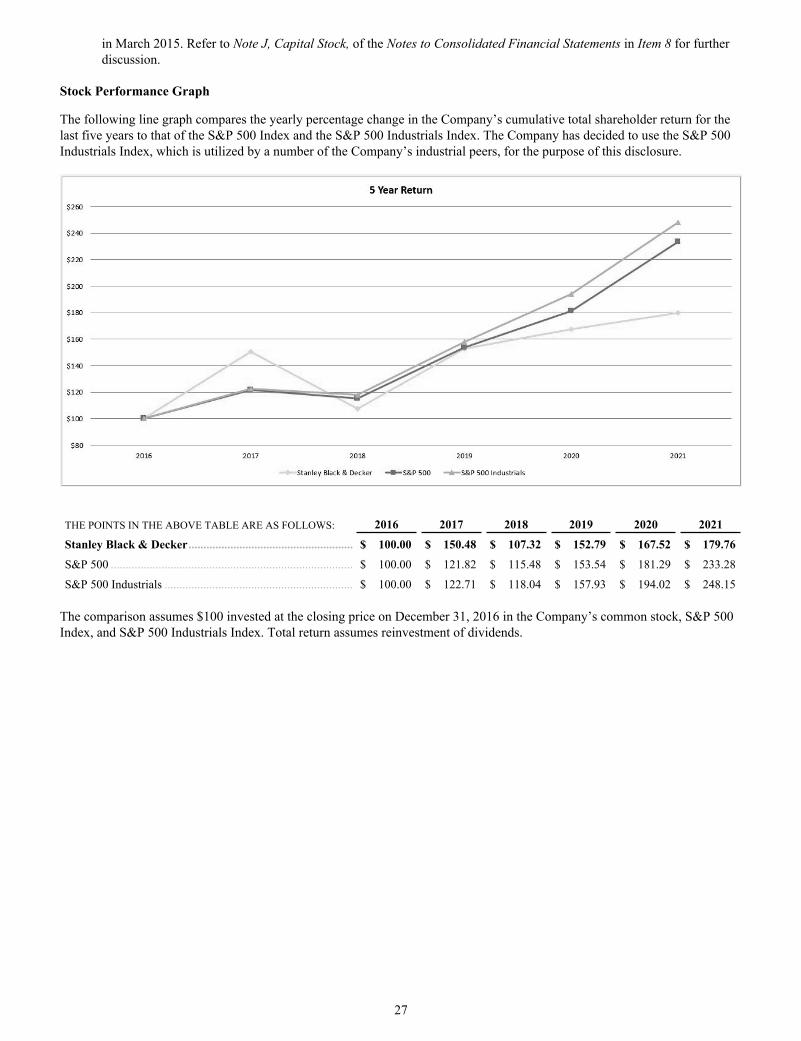
in March 2015. Refer to Note J, Capital Stock, of the Notes to Consolidated Financial Statements in Item 8 for further discussion.
Stock Performance Graph
The following line graph compares the yearly percentage change in the Company’s cumulative total shareholder return for the last five years to that of the S&P 500 Index and the S&P 500 Industrials Index. The Company has decided to use the S&P 500 Industrials Index, which is utilized by a number of the Company’s industrial peers, for the purpose of this disclosure.
THE POINTS IN THE ABOVE TABLE ARE AS FOLLOWS: 2016 2017 2018 2019 2020 2021
Stanley Black & Decker ....................................................... $ 100.00 $ 150.48 $ 107.32 $ 152.79 $ 167.52 $ 179.76
S&P 500 ................................................................................. $ 100.00 $ 121.82 $ 115.48 $ 153.54 $ 181.29 $ 233.28
S&P 500 Industrials ............................................................... $ 100.00 $ 122.71 $ 118.04 $ 157.93 $ 194.02 $ 248.15
The comparison assumes $100 invested at the closing price on December 31, 2016 in the Company’s common stock, S&P 500 Index, and S&P 500 Industrials Index. Total return assumes reinvestment of dividends.
27
ITEM 6. REMOVED AND RESERVED
ITEM 7. MANAGEMENT’S DISCUSSION AND ANALYSIS OF FINANCIAL CONDITION AND RESULTS OF OPERATIONS
The financial and business analysis below provides information which the Company believes is relevant to an assessment and understanding of its consolidated financial position, results of operations and cash flows. This financial and business analysis should be read in conjunction with the Consolidated Financial Statements and related notes. All references to “Notes” in this Item 7 refer to the Notes to Consolidated Financial Statements included in Item 8 of this Annual Report.
The following discussion and certain other sections of this Annual Report on Form 10-K contain statements reflecting the Company’s views about its future performance that constitute “forward-looking statements” under the Private Securities Litigation Reform Act of 1995. These forward-looking statements are based on current expectations, estimates, forecasts and projections about the industry and markets in which the Company operates as well as management’s beliefs and assumptions. Any statements contained herein (including without limitation statements to the effect that Stanley Black & Decker, Inc. or its management “believes,” “expects,” “anticipates,” “plans” and similar expressions) that are not statements of historical fact should be considered forward-looking statements. These statements are not guarantees of future performance and involve certain risks, uncertainties and assumptions that are difficult to predict. There are a number of important factors that could cause actual results to differ materially from those indicated by such forward-looking statements. These factors include, without limitation, those set forth, or incorporated by reference, below under the heading “Cautionary Statements Under The Private Securities Litigation Reform Act Of 1995.” The Company does not intend to update publicly any forward-looking statements whether as a result of new information, future events or otherwise.
Strategic Objectives
The Company continues to pursue a growth and acquisition strategy, which involves industry, geographic and customer diversification to foster sustainable revenue, earnings and cash flow growth, and employ the following strategic framework in pursuit of its vision to deliver top-quartile financial performance, become known as one of the world’s leading innovators and elevate its commitment to ESG:
• Continue organic growth momentum by leveraging the SBD Operating Model to drive innovation and commercial excellence, while diversifying toward higher-growth, higher-margin businesses;
• Be selective and operate in markets where brand is meaningful, the value proposition is definable and sustainable through innovation, and global cost leadership is achievable; and
• Pursue acquisitive growth on multiple fronts by building upon its existing global tools platform and expanding the outdoor products category, expanding the Industrial platform in Engineered Fastening and Infrastructure, and pursuing adjacencies with sound industrial logic.
Execution of the above strategy has resulted in approximately $13.5 billion of acquisitions since 2002 (excluding the Black & Decker merger), several divestitures, improved efficiency in the supply chain and manufacturing operations, and enhanced investments in organic growth, enabled by cash flow generation and increased debt capacity. In addition, the Company's continued focus on diversification and organic growth has resulted in improved financial results and an increase in its global presence. The Company also remains focused on leveraging its SBD Operating Model to deliver success in the 2020s and beyond. The latest evolution of the SBD Operating Model builds on the strength of the Company's past while embracing changes in the external environment to ensure the Company has the right skillsets, incorporates technology advances in all areas, maintains operational excellence, drives efficiency in business processes and resiliency into its culture, delivers extreme innovation and ensures the customer experience is world class. The operating model underpins the Company's ability to deliver above-market organic growth with margin expansion, maintain efficient levels of selling, general and administrative expenses ("SG&A") and deliver top-quartile asset efficiency.
The Company’s long-term financial objectives remain as follows:
28
• 4-6% organic revenue growth;• 10-12% total revenue growth;• 10-12% total EPS growth (7-9% organically) excluding acquisition-related charges; • Free cash flow equal to, or exceeding, net income;• Deliver 10+ working capital turns; and• Cash Flow Return On Investment ("CFROI") between 12-15%.
In terms of capital allocation, the Company remains committed, over time, to returning approximately 50% of excess capital to shareholders through a strong and growing dividend as well as opportunistically repurchasing shares. The remaining capital (approximately 50%) will be deployed towards acquisitions.
Pending Sale of Convergent Security Solutions ("CSS")
In December 2021, the Company announced that it had reached a definitive agreement for the sale of most of its Security assets to Securitas AB for $3.2 billion in cash. The proposed transaction includes the Company's CSS business comprising of commercial electronic security and healthcare businesses. The transaction does not include the Company's automatic doors business. The sale is subject to regulatory approvals and other customary closing conditions, and is expected to close in the first half of 2022. Net proceeds from the sale are expected to be used to fund, in part, an approximately $4 billion share repurchase which is planned to be completed in 2022. The use of net proceeds towards a planned share repurchase program is consistent with the Company's long-term capital allocation strategy focused on value maximization.
Acquisitions and Investments
On December 1, 2021, the Company acquired the remaining 80 percent ownership stake in MTD Holdings Inc. ("MTD"), a privately held global manufacturer of outdoor power equipment. The Company previously acquired a 20 percent interest in MTD in January 2019. With over $2.6 billion of revenue in 2021, MTD designs, manufactures and distributes lawn tractors, zero turn ride on mowers, walk behind mowers, snow blowers, residential robotic mowers, handheld outdoor power equipment and garden tools for both residential and professional consumers under well-known brands like Cub Cadet® and Troy-Bilt®.
On November 12, 2021, the Company acquired Excel Industries ("Excel"). Excel is a leading designer and manufacturer of premium commercial and residential turf-care equipment under the brands of Hustler Turf Equipment® and BigDog Mower Co®. The Company believes this is a strategically important bolt-on acquisition that bolsters the presence in the independent dealer network.
The Company expects the combination of MTD, Excel and its existing outdoor strategic business unit in Tools & Storage will create a global leader in the $25 billion and growing outdoor category, with strong brands and growth opportunities. As part of the integration of these businesses, the Company plans to design, develop and manufacture battery and electric-powered solutions for professional and residential users. This will position the combined businesses to be a leader as preferences shift from gas powered equipment toward electrified solutions in outdoor power equipment.
On February 24, 2020, the Company acquired Consolidated Aerospace Manufacturing, LLC ("CAM"), an industry-leading manufacturer of specialty fasteners and components for the aerospace and defense markets. The acquisition further diversified the Company's presence in the industrial markets and expanded its portfolio of specialty fasteners in the aerospace and defense markets.
On March 8, 2019, the Company acquired the International Equipment Solutions Attachments businesses, Paladin and Pengo, ("IES Attachments"), manufacturers of high quality, performance-driven heavy equipment attachment tools for off-highway applications. The acquisition further diversified the Company's presence in the industrial markets, expanded its portfolio of attachment solutions and provided a meaningful platform for growth.
Refer to Note E, Acquisitions and Investments, for further discussion.
Divestitures
On May 30, 2019, the Company sold its Sargent and Greenleaf mechanical locks business within the Security segment. The Company has also divested several smaller businesses in recent years that did not fit into its long-term strategic objectives. These divestitures allow the Company to invest in other areas of the Company that fit into its long-term growth strategy.
Refer to Note T, Divestitures, for further discussion of the Company's divestitures.
COVID-19 Pandemic
29
The novel coronavirus ("COVID-19") outbreak has adversely affected the Company's workforce and operations, as well as the operations of its customers, distributors, suppliers and contractors. The COVID-19 pandemic has also resulted in significant volatility and uncertainty in the markets in which the Company operates. To successfully navigate through this unprecedented period, the Company has remained focused on the following key priorities:
• Ensuring the health and safety of its employees and supply chain partners; • Maintaining business continuity and financial strength and stability; • Serving its customers as they provide essential products and services to the world; and • Doing its part to mitigate the impact of the virus across the globe.
To respond to the volatile and uncertain environment, the Company implemented a comprehensive cost reduction and efficiency program in 2020, which delivered approximately $625 million of net savings across 2021 and 2020. Cost actions executed under the program included headcount reductions, furloughs, reduced employee work schedules, a voluntary retirement program, and footprint rationalizations. The Company took steps in 2020 to make some of the cost actions permanent while certain employees were returned to full-time status. This ensured the sustainability of the cost reduction program into 2021 while providing more employment stability for the Company's remaining associates.
Driving Further Profitable Growth by Fully Leveraging The Company's Core Franchises
Each of the Company's franchises share common attributes: they have world-class brands and attractive growth characteristics, they are scalable and defensible, they can differentiate through innovation, and they are powered by the SBD Operating Model.
• The Tools & Storage business is the tool company to own, with strong brands, proven innovation, global scale, and a broad offering of power tools, hand tools, outdoor products, accessories, and storage & digital products across many channels in both developed and developing markets.
• The Engineered Fastening business is a highly profitable, GDP+ growth business offering highly engineered, value-added innovative solutions with recurring revenue attributes and global scale.
While diversifying the business portfolio through strategic acquisitions remains important, management recognizes that the core franchises described above are important foundations that continue to provide strong cash flow and growth prospects. Management is committed to growing these businesses through innovative product development, brand support, continued investment in emerging markets and a sharp focus on global cost competitiveness.
Continuing to Invest in the Stanley Black & Decker Brands
The Company has a strong portfolio of brands associated with high-quality products including STANLEY®, BLACK+DECKER®, DEWALT®, FLEXVOLT®, IRWIN®, LENOX®, CRAFTSMAN®, PORTER-CABLE®, BOSTITCH®, PROTO®, MAC TOOLS®, FACOM®, Powers®, LISTA®, Vidmar®, GQ® and through the 2021 acquisitions of MTD and Excel added Cub Cadet®, Troy-Bilt® and Hustler® in the Americas. Among the Company's most valuable assets, STANLEY®, BLACK+DECKER® and DEWALT® are recognized as three of the world's great brands, while CRAFTSMAN® is recognized as a premier American brand.
The National Collegiate Athletic Association sponsorship delivered an estimated 308+ million views through TV-visible DEWALT® branding at 25 colleges and universities across five (Atlantic Coast Conference, Big Ten, Big 12, Pac-12 and Mountain West) Division 1 conferences.
During 2021, the Company also announced its “Official Tools” sponsorship with McLaren Racing in Formula 1 – a partnership well on track for 2022. In 2021, the McLaren team sported the DEWALT® logo on the car for 16 races starting at the British Grand Prix in July.
The STANLEY®, DEWALT® and CRAFTSMAN® brands continue to have prominent signage in Major League Baseball ("MLB") stadiums appearing in many MLB games. The Company has also maintained long-standing NASCAR and NHRA racing sponsorships, which provided brand exposure during nearly 60 events in 2021 with the STANLEY®, DEWALT®, CRAFTSMAN®, IRWIN® and MAC TOOLS® brands. The Company also advertises in the English Premier League, which is the number one soccer league in the world, featuring STANLEY®, BLACK+DECKER® and DEWALT® brands to a global audience. In 2014, the Company became a sponsor for one of the world’s most popular football clubs, FC Barcelona ("FCB"), including player image rights, hospitality assets and stadium signage. In 2018, the Company was announced as the first ever shirt sponsor for the FCB Women's team in support of its commitment to global diversity and inclusion.
30
The above marketing initiatives highlight the Company's strong emphasis on brand building and commercial support, which has resulted in more than 300 billion global brand impressions – an annual increase of 110% – from digital and traditional advertising and strong brand awareness. Allocating brand and advertising spend judiciously will continue to be the Company’s focus. Among the goals: being front and center in an emerging digital landscape, evolving proven marketing programs that tie trusted global brands with societal purpose and tapping into technologies to build meaning 1:1 experiences with customers, consumers, employees and shareholders in line with the Company’s mission and vision.
The SBD Operating Model: Winning in the 2020s
Over the past 15 years, the Company has successfully leveraged its proven and continually evolving operating model to focus the organization to sustain top-quartile performance, resulting in asset efficiency, above-market organic growth and expanding operating margins. In its first evolution, the Stanley Fulfillment System ("SFS") focused on streamlining operations, which helped reduce lead times, realize synergies during acquisition integrations, and mitigate material and energy price inflation. In 2015, the Company launched a refreshed and revitalized SFS operating system, entitled SFS 2.0, to drive from a more programmatic growth mentality to a true organic growth culture by more deeply embedding breakthrough innovation and commercial excellence into its businesses, and at the same time, becoming a significantly more digitally-enabled enterprise. The latest evolution occurred in 2020, when the Company launched the SBD Operating Model: Winning in the 2020s, which recognized the changing dynamics of the world in which the Company operates, including the acceleration of technological change, geopolitical instability and the changing nature of work.
At the center of the model is the concept of the interrelationship between people and technology. The remaining four categories are: Performance Resiliency; Extreme Innovation; Operations Excellence and Extraordinary Customer Experience. Each of these elements co-exists synergistically with the others in a systems-based approach.
People and Technology This pillar emphasizes the Company's belief that the right combination of digitally proficient people applying technology such as artificial intelligence, machine learning, advanced analytics, Internet of Things and others in focused ways can be an enormous source of value creation and sustainability for the Company. It also brings to light the changing nature of work and the talent and skillsets required for individuals and institutions to thrive in the future. With technology infiltrating the workplace at an increasingly rapid pace, the Company believes that the winners in the 2020s will invest heavily in reskilling, upskilling and lifelong learning with an emphasis on the places where people and technology intersect. In other words, technology can make humans more powerful and productive if, and only if, humans know how to apply the technology to maximum advantage. The Company has created plans and programs, as well as a new leadership model to ensure people have the right skills, tools and mindsets to thrive in this era. The ability for employees to embrace technology, learn and relearn new skills and take advantage of the opportunities presented in this new world will be critical to the Company's success.
Performance ResiliencyThe Company views performance resiliency as the agility, flexibility and adaptability to sustain strong performance in a variety of operating environment conditions, which requires planning for the unexpected and anticipating exogenous volatility as the new normal. Technology, applied to key business processes, products and business models, will be a key enabler for value creation and performance resiliency as the Company executes sustainable, ongoing transformation across the enterprise.
Extreme InnovationThe Company has a historically strong foundation in innovation, launching more than 1,000 products a year, including breakthroughs such as DEWALT Flexvolt, Atomic, Xtreme, and the launch of DEWALT PowerStack in December 2021. In recent years, the Company has expanded its innovation-focused internal teams and external partnerships, but now it is growing that innovation ecosystem at a rapid pace, expanding the number of external collaborations with start-ups and entrepreneurs, academic institutions, research labs and others. This innovation culture, which includes a focus on social impact in addition to the Company's traditional product and customer focus, enables the Company to introduce products to market faster and reimagine how to operate in today’s technology-enabled, fast-paced world.
Operations ExcellenceAn intense focus on operations excellence and asset efficiency is mandatory in a dynamic world in which the bar for competitiveness is always moving higher. To help maintain the Company's edge, a much more agile, adaptable and technology-enabled supply chain is necessary to manufacture closer to its customers. This “Make Where We Sell” strategy will improve customer responsiveness, lower lead times, reduce costs and mitigate geopolitical and currency risk while facilitating improvements in carbon footprint.
Extraordinary Customer Experience
31
Customers are increasingly demanding world-class experiences from their brands and expectations for execution at the customer level are growing every day. It is no longer sufficient to have great products on the shelf or in the catalog. The Company knows that to sustain market share growth, it needs to evolve and adapt to provide the types of experiences that customers now expect. Each of the Company's businesses evaluates and works to systematically improve its various customer journeys and acts on customer insights to continuously deliver an extraordinary customer experience. As previously noted, the interaction between people and technology will define success in this area.
Leveraging the SBD Operating Model, the Company is building a culture in which it strives to become known as one of the world’s great innovative companies by embracing the current environment of rapid innovation and digital transformation. The Company continues to build a vast innovation focused ecosystem to pursue faster innovation and to remain aware of and open to new technologies and advances by leveraging both internal initiatives and external partnerships. The innovation ecosystem used in concert with the SBD Operating Model is anticipated to allow the Company to apply innovation to its core processes in manufacturing and back office functions to reduce operating costs and inefficiencies, develop core and breakthrough product innovations within each of its businesses, and pursue disruptive business models to either push into new markets or change existing business models before competition or new market entrants capture the opportunity. The Company continues to make progress towards this vision, as evidenced by the creation of Innovation Everywhere, a program that encourages and empowers all employees to implement value creation and cost savings using collaborative and innovative solutions, breakthrough innovation teams, the Stanley Ventures group, which invests capital in new and emerging start-ups in core focus areas, the Techstars partnership, which selects start-ups from around the world with the goal of bringing breakthrough technologies to market, the Manufactory 4.0, which is the Company's epicenter for Industry 4.0 technology development and partnership, and STANLEY X, a Silicon Valley based team, which is building its own set of disruptive initiatives and exploring new business models.
The Company has made a significant commitment to the SBD Operating Model and management believes that its success will be characterized by continued asset efficiency, organic growth in the 4-6% range in the long-term as well as expanded operating margin rates over the next 3 to 5 years as the Company leverages the growth and pursues structural cost reductions with the margin resiliency initiatives.
The Company believes that the SBD Operating Model will serve as a powerful value driver in the years ahead, ensuring the Company is positioned to win in the 2020s by developing and obtaining the right people and technology to deliver performance resiliency, extreme innovation, operations excellence and an extraordinary customer experience. The operating model, in concert with the Company's innovation ecosystem, will enable the Company to change as rapidly as the external environment which directly supports achievement of the Company's long-term financial objectives, including its vision, and further enables its shareholder-friendly capital allocation approach, which has served the Company well in the past and will continue to do so in the future.
Segments
The Company’s operations are classified into two reportable business segments: Tools & Storage and Industrial. The Company has one non-reportable business operating segment, Mechanical Access Solutions ("MAS").
Tools & Storage
The Tools & Storage segment is comprised of the Power Tools Group ("PTG"), Hand Tools, Accessories & Storage ("HTAS"), and Outdoor Power Equipment ("Outdoor") businesses.
The PTG business includes both professional and consumer products. Professional products include professional grade corded and cordless electric power tools and equipment including drills, impact wrenches and drivers, grinders, saws, routers and sanders, as well as pneumatic tools and fasteners including nail guns, nails, staplers and staples, concrete and masonry anchors. Consumer products include corded and cordless electric power tools sold primarily under the BLACK+DECKER® brand, and home products such as hand-held vacuums, paint tools and cleaning appliances.
The HTAS business sells hand tools, power tool accessories and storage products. Hand tools include measuring, leveling and layout tools, planes, hammers, demolition tools, clamps, vises, knives, saws, chisels and industrial and automotive tools. Power tool accessories include drill bits, screwdriver bits, router bits, abrasives, saw blades and threading products. Storage products include tool boxes, sawhorses, medical cabinets and engineered storage solution products.
32
The Outdoor business primarily sells corded and cordless electric lawn and garden products, including hedge trimmers, string trimmers, lawn mowers, pressure washers and related accessories, and gas powered lawn and garden products, including lawn tractors, zero turn ride on mowers, walk behind mowers, snow blowers, residential robotic mowers, utility terrain vehicles (UTVs), handheld outdoor power equipment, garden tools, and parts and accessories to professionals and consumers under the DEWALT®, CUB CADET®, BLACK+DECKER®, CRAFTSMAN®, TROY-BILT®, and HUSTLER® brand names.
Industrial
The Industrial segment is comprised of the Engineered Fastening and Infrastructure businesses.
The Engineered Fastening business primarily sells highly engineered components such as fasteners, fittings and various engineered products, which are designed for specific application across multiple verticals. The product lines include externally threaded fasteners, blind rivets and tools, blind inserts and tools, drawn arc weld studs and systems, engineered plastic and mechanical fasteners, self-piercing riveting systems, precision nut running systems, micro fasteners, high-strength structural fasteners, axel swage, latches, heat shields, pins, and couplings.
The Infrastructure business consists of the Attachment Tools and Oil & Gas product lines. Attachment Tools sells hydraulic tools and high quality, performance-driven heavy equipment attachment tools for off-highway applications. Oil & Gas sells and rents custom pipe handling, joint welding and coating equipment used in the construction of large and small diameter pipelines and provides pipeline inspection services.
RESULTS OF OPERATIONS
The Company’s results represent continuing operations and exclude the commercial electronic security and healthcare businesses following the aforementioned announced divestiture in December 2021, unless specifically noted. The operating results of these businesses previously were included in the Security segment and have been classified as discontinued operations.
Certain Items Impacting Earnings
The Company has provided a discussion of its results both inclusive and exclusive of acquisition-related and other charges. Organic growth is also utilized to describe results aside from the impacts of foreign currency fluctuations, acquisitions during their initial 12 months of ownership, and divestitures. The results and measures, including gross profit, selling, general, and administrative ("SG&A"), Other, net, and segment profit, on a basis excluding acquisition-related and other charges, and organic growth are Non-GAAP financial measures. The Company considers the use of Non-GAAP financial measures relevant to aid analysis and understanding of the Company’s results and business trends aside from the material impact of these items and ensures appropriate comparability to operating results of prior periods.
The Company’s operating results at the consolidated level as discussed below include and exclude acquisition-related and other charges impacting gross profit, SG&A, and Other, net. The Company’s business segment results as discussed below include and exclude acquisition-related and other charges impacting gross profit and SG&A. These amounts for the year-to-date periods of 2021, 2020 and 2019 are as follows:
33
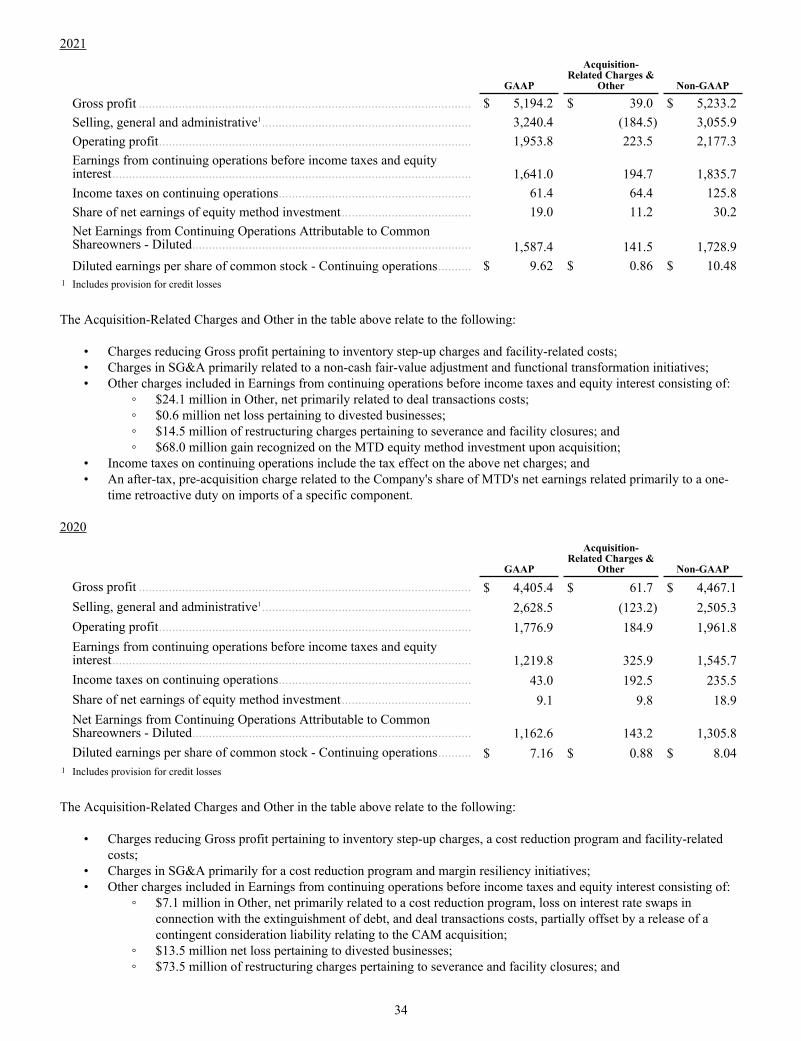
2021
GAAP
Acquisition-Related Charges &
Other Non-GAAP
Gross profit .................................................................................................... $ 5,194.2 $ 39.0 $ 5,233.2 Selling, general and administrative1
............................................................... 3,240.4 (184.5) 3,055.9 Operating profit .............................................................................................. 1,953.8 223.5 2,177.3 Earnings from continuing operations before income taxes and equity interest ............................................................................................................ 1,641.0 194.7 1,835.7 Income taxes on continuing operations .......................................................... 61.4 64.4 125.8 Share of net earnings of equity method investment ....................................... 19.0 11.2 30.2 Net Earnings from Continuing Operations Attributable to Common Shareowners - Diluted .................................................................................... 1,587.4 141.5 1,728.9 Diluted earnings per share of common stock - Continuing operations .......... $ 9.62 $ 0.86 $ 10.48
1 Includes provision for credit losses
The Acquisition-Related Charges and Other in the table above relate to the following:
• Charges reducing Gross profit pertaining to inventory step-up charges and facility-related costs; • Charges in SG&A primarily related to a non-cash fair-value adjustment and functional transformation initiatives;• Other charges included in Earnings from continuing operations before income taxes and equity interest consisting of:
◦ $24.1 million in Other, net primarily related to deal transactions costs;◦ $0.6 million net loss pertaining to divested businesses;◦ $14.5 million of restructuring charges pertaining to severance and facility closures; and◦ $68.0 million gain recognized on the MTD equity method investment upon acquisition;
• Income taxes on continuing operations include the tax effect on the above net charges; and• An after-tax, pre-acquisition charge related to the Company's share of MTD's net earnings related primarily to a one-
time retroactive duty on imports of a specific component.
2020
GAAP
Acquisition-Related Charges &
Other Non-GAAP
Gross profit .................................................................................................... $ 4,405.4 $ 61.7 $ 4,467.1 Selling, general and administrative1
............................................................... 2,628.5 (123.2) 2,505.3 Operating profit .............................................................................................. 1,776.9 184.9 1,961.8 Earnings from continuing operations before income taxes and equity interest ............................................................................................................ 1,219.8 325.9 1,545.7 Income taxes on continuing operations .......................................................... 43.0 192.5 235.5 Share of net earnings of equity method investment ....................................... 9.1 9.8 18.9 Net Earnings from Continuing Operations Attributable to Common Shareowners - Diluted .................................................................................... 1,162.6 143.2 1,305.8 Diluted earnings per share of common stock - Continuing operations .......... $ 7.16 $ 0.88 $ 8.04
1 Includes provision for credit losses
The Acquisition-Related Charges and Other in the table above relate to the following:
• Charges reducing Gross profit pertaining to inventory step-up charges, a cost reduction program and facility-related costs;
• Charges in SG&A primarily for a cost reduction program and margin resiliency initiatives;• Other charges included in Earnings from continuing operations before income taxes and equity interest consisting of:
◦ $7.1 million in Other, net primarily related to a cost reduction program, loss on interest rate swaps in connection with the extinguishment of debt, and deal transactions costs, partially offset by a release of a contingent consideration liability relating to the CAM acquisition;
◦ $13.5 million net loss pertaining to divested businesses;◦ $73.5 million of restructuring charges pertaining to severance and facility closures; and
34
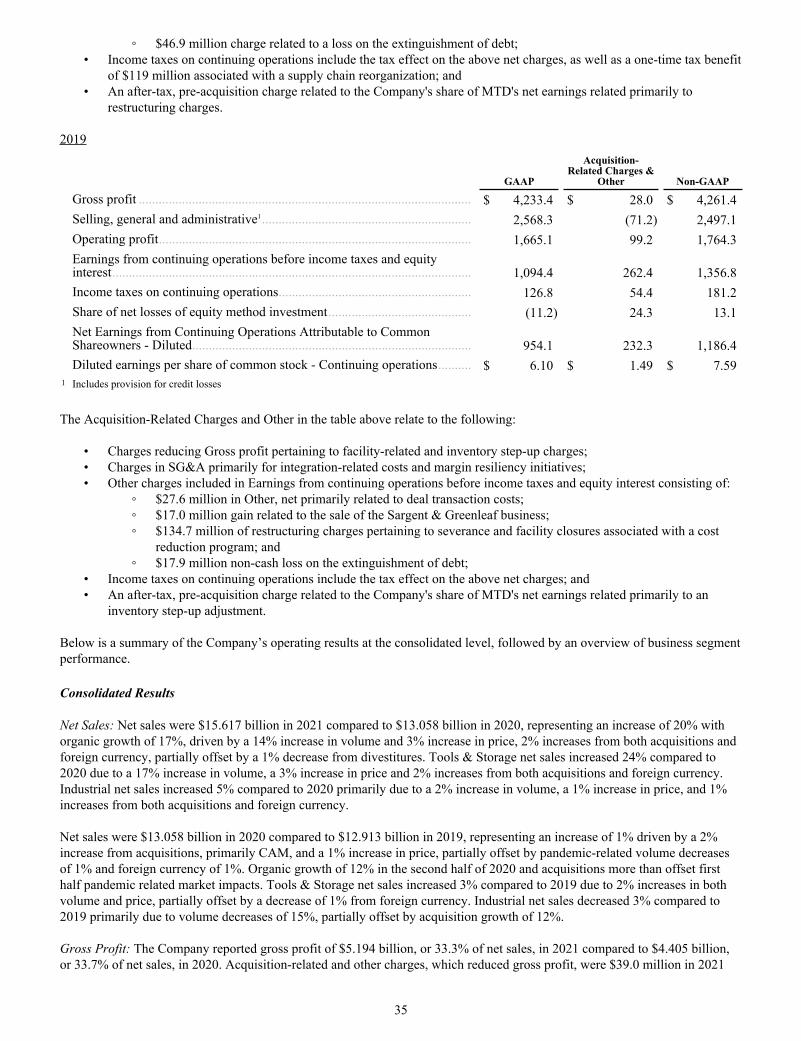
◦ $46.9 million charge related to a loss on the extinguishment of debt;• Income taxes on continuing operations include the tax effect on the above net charges, as well as a one-time tax benefit
of $119 million associated with a supply chain reorganization; and• An after-tax, pre-acquisition charge related to the Company's share of MTD's net earnings related primarily to
restructuring charges.
2019
GAAP
Acquisition-Related Charges &
Other Non-GAAP
Gross profit .................................................................................................... $ 4,233.4 $ 28.0 $ 4,261.4 Selling, general and administrative1
............................................................... 2,568.3 (71.2) 2,497.1 Operating profit .............................................................................................. 1,665.1 99.2 1,764.3 Earnings from continuing operations before income taxes and equity interest ............................................................................................................ 1,094.4 262.4 1,356.8 Income taxes on continuing operations .......................................................... 126.8 54.4 181.2 Share of net losses of equity method investment ........................................... (11.2) 24.3 13.1 Net Earnings from Continuing Operations Attributable to Common Shareowners - Diluted .................................................................................... 954.1 232.3 1,186.4 Diluted earnings per share of common stock - Continuing operations .......... $ 6.10 $ 1.49 $ 7.59
1 Includes provision for credit losses
The Acquisition-Related Charges and Other in the table above relate to the following:
• Charges reducing Gross profit pertaining to facility-related and inventory step-up charges; • Charges in SG&A primarily for integration-related costs and margin resiliency initiatives;• Other charges included in Earnings from continuing operations before income taxes and equity interest consisting of:
◦ $27.6 million in Other, net primarily related to deal transaction costs;◦ $17.0 million gain related to the sale of the Sargent & Greenleaf business;◦ $134.7 million of restructuring charges pertaining to severance and facility closures associated with a cost
reduction program; and◦ $17.9 million non-cash loss on the extinguishment of debt;
• Income taxes on continuing operations include the tax effect on the above net charges; and• An after-tax, pre-acquisition charge related to the Company's share of MTD's net earnings related primarily to an
inventory step-up adjustment.
Below is a summary of the Company’s operating results at the consolidated level, followed by an overview of business segment performance.
Consolidated Results
Net Sales: Net sales were $15.617 billion in 2021 compared to $13.058 billion in 2020, representing an increase of 20% with organic growth of 17%, driven by a 14% increase in volume and 3% increase in price, 2% increases from both acquisitions and foreign currency, partially offset by a 1% decrease from divestitures. Tools & Storage net sales increased 24% compared to 2020 due to a 17% increase in volume, a 3% increase in price and 2% increases from both acquisitions and foreign currency. Industrial net sales increased 5% compared to 2020 primarily due to a 2% increase in volume, a 1% increase in price, and 1% increases from both acquisitions and foreign currency.
Net sales were $13.058 billion in 2020 compared to $12.913 billion in 2019, representing an increase of 1% driven by a 2% increase from acquisitions, primarily CAM, and a 1% increase in price, partially offset by pandemic-related volume decreases of 1% and foreign currency of 1%. Organic growth of 12% in the second half of 2020 and acquisitions more than offset first half pandemic related market impacts. Tools & Storage net sales increased 3% compared to 2019 due to 2% increases in both volume and price, partially offset by a decrease of 1% from foreign currency. Industrial net sales decreased 3% compared to 2019 primarily due to volume decreases of 15%, partially offset by acquisition growth of 12%.
Gross Profit: The Company reported gross profit of $5.194 billion, or 33.3% of net sales, in 2021 compared to $4.405 billion, or 33.7% of net sales, in 2020. Acquisition-related and other charges, which reduced gross profit, were $39.0 million in 2021
35
and $61.7 million in 2020. Excluding these charges, gross profit was 33.5% of net sales in 2021 compared to 34.2% in 2020, as higher volume, productivity, price realization, and mix benefits from innovation were more than offset primarily by commodity inflation and higher supply chain costs to serve demand.
The Company reported gross profit of $4.405 billion, or 33.7% of net sales, in 2020 compared to $4.233 billion, or 32.8% of net sales, in 2019. Acquisition-related and other charges, which reduced gross profit, were $61.7 million in 2020 and $28.0 million in 2019. Excluding these charges, gross profit was 34.2% of net sales in 2020, compared to 33.0% in 2019, driven by productivity, margin resiliency initiatives and price realization.
SG&A Expenses: Selling, general and administrative expenses, inclusive of the provision for credit losses (“SG&A”), were $3.240 billion, or 20.7% of net sales, in 2021 compared to $2.629 billion, or 20.1% of net sales, in 2020. Within SG&A, acquisition-related and other charges totaled $184.5 million in 2021 and $123.2 million in 2020. Excluding these charges, SG&A was 19.6% of net sales in 2021 compared to 19.2% in 2020, reflecting growth investments deployed across the businesses.
SG&A expenses were $2.629 billion, or 20.1% of net sales, in 2020 compared to $2.568 billion, or 19.9% of net sales, in 2019. Within SG&A, acquisition-related and other charges totaled $123.2 million in 2020 and $71.2 million in 2019. Excluding these charges, SG&A was 19.2% of net sales in 2020 compared to 19.3% in 2019, primarily reflecting the benefits of cost management programs implemented in response to the global pandemic, partially offset by growth investments to pursue market recoveries and opportunities across the businesses that emerged during the pandemic.
Distribution center costs (i.e. warehousing and fulfillment facility and associated labor costs) are classified within SG&A. This classification may differ from other companies who may report such expenses within cost of sales. Due to diversity in practice, to the extent the classification of these distribution costs differs from other companies, the Company’s gross margins may not be comparable. Such distribution costs classified in SG&A amounted to $416.5 million, $347.3 million and $326.5 million in in 2021, 2020 and 2019, respectively.
Other, net: Other, net totaled $190.1 million, $217.8 million, and $201.1 million in 2021, 2020, and 2019, respectively. Excluding acquisition-related and other charges, Other, net totaled $166.0 million, $210.7 million, and $173.5 million in 2021, 2020, and 2019, respectively. The year-over-year decrease in 2021 was primarily due to appreciation of Stanley Ventures' investments. The year-over-year increase in 2020 driven by higher intangible asset amortization and negative impacts from foreign currency.
Loss (gain) on Sales of Businesses: During 2021, the Company reported a $0.6 million net loss on divestitures. During 2020, the Company reported a $13.5 million net loss primarily relating to the sale of a product line within Oil & Gas. During 2019, the Company reported a $17.0 million gain relating to the sale of the Sargent and Greenleaf business.
Gain on equity method investment: Upon the acquisition of MTD in the fourth quarter of 2021, the Company recognized a $68.0 million gain on its previously held equity method investment. Refer to Note E, Acquisitions and Investments, for further discussion.
Loss on Debt Extinguishments: During the fourth quarter of 2020, the Company extinguished $1.154 billion of its notes payable and recognized a $46.9 million pre-tax loss primarily due to a make-whole premium payment. In 2019, the Company extinguished $750 million of its notes payable and recognized a $17.9 million pre-tax loss primarily related to the write-off of deferred financing fees.
Interest, net: Net interest expense in 2021 was $175.6 million compared to $205.1 million in 2020 and $230.3 million in 2019. The decrease in 2021 compared to 2020 was primarily driven by lower U.S. interest rates on commercial paper borrowings and lower interest expense related to the extinguishment of notes payable in the fourth quarter of 2020, partially offset by lower interest income due to a decline in rates. The decrease in net interest expense in 2020 versus 2019 was primarily driven by lower U.S. interest rates and lower average balances relating to the Company's commercial paper borrowings, partially offset by lower interest income due to a decline in rates.
Income Taxes: On March 11, 2021, the American Rescue Plan Act of 2021 (the “ARPA”) was enacted. The ARPA, among other things, includes provisions to expand the IRC Section 162(m) disallowance for deduction of certain compensation paid by publicly held corporations, provide a 100% COBRA subsidy, temporarily increase the income exclusion for dependent care assistance, and to extend and modify the employee retention credit and the Families First Coronavirus Response Act paid leave credit. On March 27, 2020, the Coronavirus Aid, Relief and Economic Security Act (the “CARES Act”) was enacted. The CARES Act, among other things, includes provisions relating to refundable payroll tax credits, deferment of employer social
36
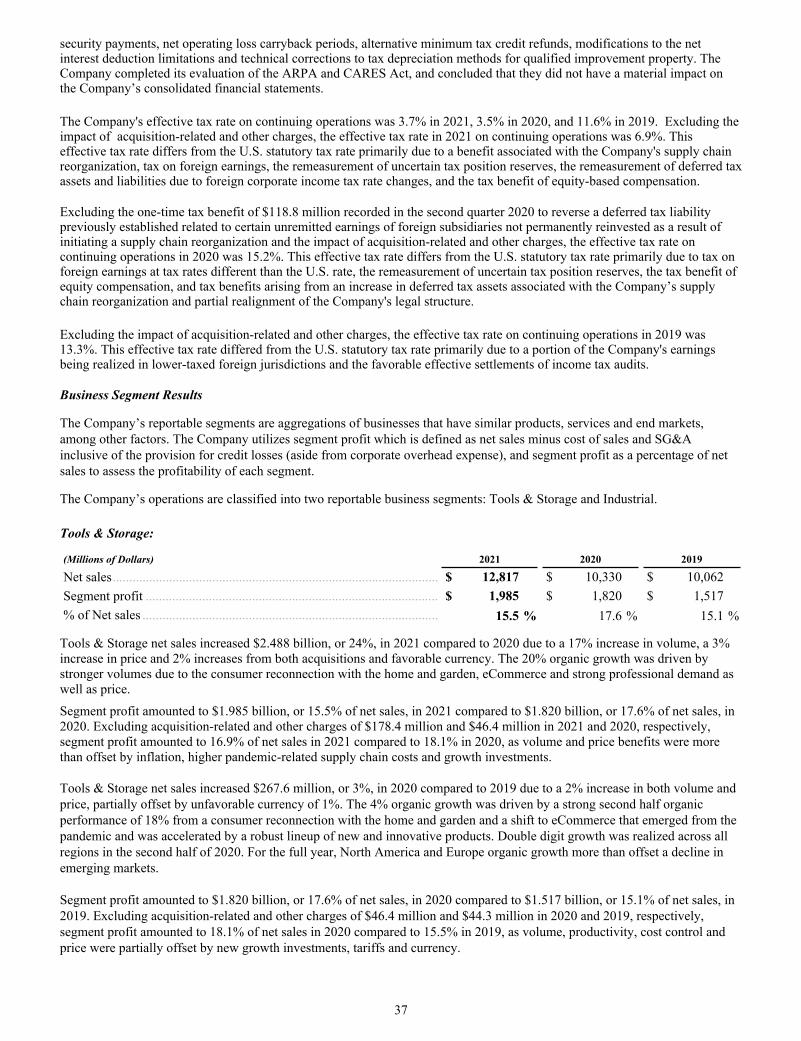
security payments, net operating loss carryback periods, alternative minimum tax credit refunds, modifications to the net interest deduction limitations and technical corrections to tax depreciation methods for qualified improvement property. The Company completed its evaluation of the ARPA and CARES Act, and concluded that they did not have a material impact on the Company’s consolidated financial statements.
The Company's effective tax rate on continuing operations was 3.7% in 2021, 3.5% in 2020, and 11.6% in 2019. Excluding the impact of acquisition-related and other charges, the effective tax rate in 2021 on continuing operations was 6.9%. This effective tax rate differs from the U.S. statutory tax rate primarily due to a benefit associated with the Company's supply chain reorganization, tax on foreign earnings, the remeasurement of uncertain tax position reserves, the remeasurement of deferred tax assets and liabilities due to foreign corporate income tax rate changes, and the tax benefit of equity-based compensation.
Excluding the one-time tax benefit of $118.8 million recorded in the second quarter 2020 to reverse a deferred tax liability previously established related to certain unremitted earnings of foreign subsidiaries not permanently reinvested as a result of initiating a supply chain reorganization and the impact of acquisition-related and other charges, the effective tax rate on continuing operations in 2020 was 15.2%. This effective tax rate differs from the U.S. statutory tax rate primarily due to tax on foreign earnings at tax rates different than the U.S. rate, the remeasurement of uncertain tax position reserves, the tax benefit of equity compensation, and tax benefits arising from an increase in deferred tax assets associated with the Company’s supply chain reorganization and partial realignment of the Company's legal structure.
Excluding the impact of acquisition-related and other charges, the effective tax rate on continuing operations in 2019 was 13.3%. This effective tax rate differed from the U.S. statutory tax rate primarily due to a portion of the Company's earnings being realized in lower-taxed foreign jurisdictions and the favorable effective settlements of income tax audits.
Business Segment Results
The Company’s reportable segments are aggregations of businesses that have similar products, services and end markets, among other factors. The Company utilizes segment profit which is defined as net sales minus cost of sales and SG&A inclusive of the provision for credit losses (aside from corporate overhead expense), and segment profit as a percentage of net sales to assess the profitability of each segment.
The Company’s operations are classified into two reportable business segments: Tools & Storage and Industrial.
Tools & Storage:
(Millions of Dollars) 2021 2020 2019
Net sales .................................................................................................. $ 12,817 $ 10,330 $ 10,062 Segment profit ........................................................................................ $ 1,985 $ 1,820 $ 1,517 % of Net sales ......................................................................................... 15.5 % 17.6 % 15.1 %
Tools & Storage net sales increased $2.488 billion, or 24%, in 2021 compared to 2020 due to a 17% increase in volume, a 3% increase in price and 2% increases from both acquisitions and favorable currency. The 20% organic growth was driven by stronger volumes due to the consumer reconnection with the home and garden, eCommerce and strong professional demand as well as price.
Segment profit amounted to $1.985 billion, or 15.5% of net sales, in 2021 compared to $1.820 billion, or 17.6% of net sales, in 2020. Excluding acquisition-related and other charges of $178.4 million and $46.4 million in 2021 and 2020, respectively, segment profit amounted to 16.9% of net sales in 2021 compared to 18.1% in 2020, as volume and price benefits were more than offset by inflation, higher pandemic-related supply chain costs and growth investments.
Tools & Storage net sales increased $267.6 million, or 3%, in 2020 compared to 2019 due to a 2% increase in both volume and price, partially offset by unfavorable currency of 1%. The 4% organic growth was driven by a strong second half organic performance of 18% from a consumer reconnection with the home and garden and a shift to eCommerce that emerged from the pandemic and was accelerated by a robust lineup of new and innovative products. Double digit growth was realized across all regions in the second half of 2020. For the full year, North America and Europe organic growth more than offset a decline in emerging markets.
Segment profit amounted to $1.820 billion, or 17.6% of net sales, in 2020 compared to $1.517 billion, or 15.1% of net sales, in 2019. Excluding acquisition-related and other charges of $46.4 million and $44.3 million in 2020 and 2019, respectively, segment profit amounted to 18.1% of net sales in 2020 compared to 15.5% in 2019, as volume, productivity, cost control and price were partially offset by new growth investments, tariffs and currency.
37
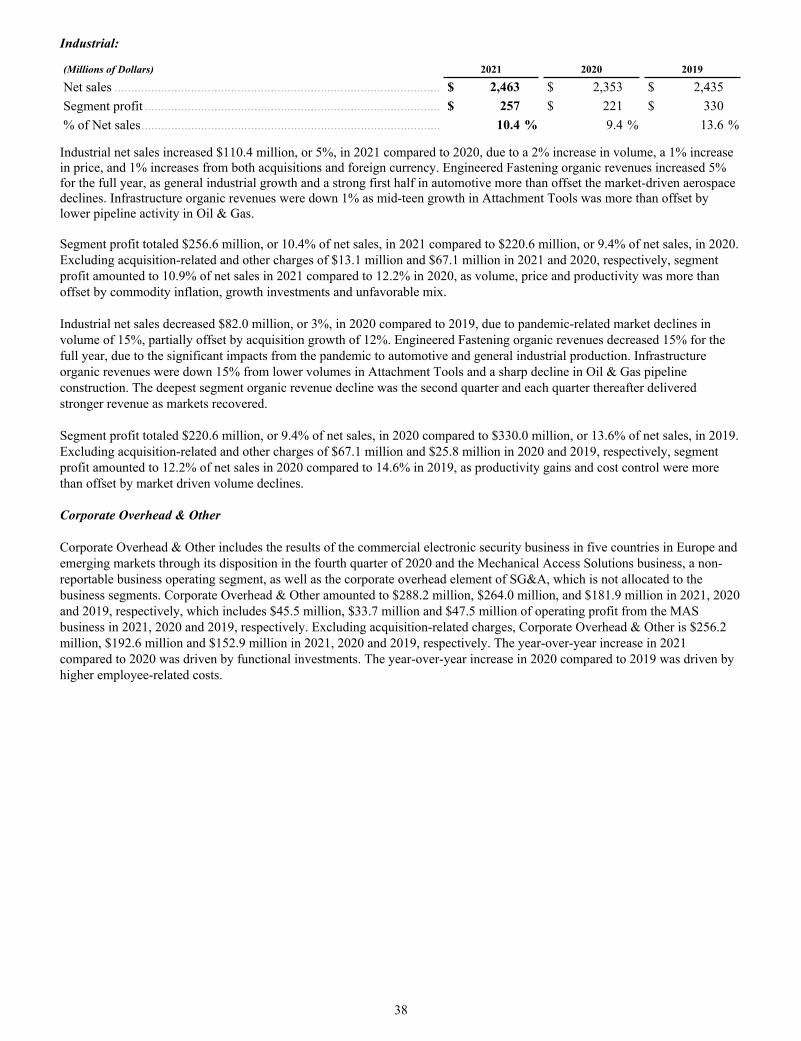
Industrial:
(Millions of Dollars) 2021 2020 2019
Net sales .................................................................................................. $ 2,463 $ 2,353 $ 2,435 Segment profit ......................................................................................... $ 257 $ 221 $ 330 % of Net sales .......................................................................................... 10.4 % 9.4 % 13.6 %
Industrial net sales increased $110.4 million, or 5%, in 2021 compared to 2020, due to a 2% increase in volume, a 1% increase in price, and 1% increases from both acquisitions and foreign currency. Engineered Fastening organic revenues increased 5% for the full year, as general industrial growth and a strong first half in automotive more than offset the market-driven aerospace declines. Infrastructure organic revenues were down 1% as mid-teen growth in Attachment Tools was more than offset by lower pipeline activity in Oil & Gas.
Segment profit totaled $256.6 million, or 10.4% of net sales, in 2021 compared to $220.6 million, or 9.4% of net sales, in 2020. Excluding acquisition-related and other charges of $13.1 million and $67.1 million in 2021 and 2020, respectively, segment profit amounted to 10.9% of net sales in 2021 compared to 12.2% in 2020, as volume, price and productivity was more than offset by commodity inflation, growth investments and unfavorable mix.
Industrial net sales decreased $82.0 million, or 3%, in 2020 compared to 2019, due to pandemic-related market declines in volume of 15%, partially offset by acquisition growth of 12%. Engineered Fastening organic revenues decreased 15% for the full year, due to the significant impacts from the pandemic to automotive and general industrial production. Infrastructure organic revenues were down 15% from lower volumes in Attachment Tools and a sharp decline in Oil & Gas pipeline construction. The deepest segment organic revenue decline was the second quarter and each quarter thereafter delivered stronger revenue as markets recovered.
Segment profit totaled $220.6 million, or 9.4% of net sales, in 2020 compared to $330.0 million, or 13.6% of net sales, in 2019. Excluding acquisition-related and other charges of $67.1 million and $25.8 million in 2020 and 2019, respectively, segment profit amounted to 12.2% of net sales in 2020 compared to 14.6% in 2019, as productivity gains and cost control were more than offset by market driven volume declines.
Corporate Overhead & Other
Corporate Overhead & Other includes the results of the commercial electronic security business in five countries in Europe and emerging markets through its disposition in the fourth quarter of 2020 and the Mechanical Access Solutions business, a non-reportable business operating segment, as well as the corporate overhead element of SG&A, which is not allocated to the business segments. Corporate Overhead & Other amounted to $288.2 million, $264.0 million, and $181.9 million in 2021, 2020 and 2019, respectively, which includes $45.5 million, $33.7 million and $47.5 million of operating profit from the MAS business in 2021, 2020 and 2019, respectively. Excluding acquisition-related charges, Corporate Overhead & Other is $256.2 million, $192.6 million and $152.9 million in 2021, 2020 and 2019, respectively. The year-over-year increase in 2021 compared to 2020 was driven by functional investments. The year-over-year increase in 2020 compared to 2019 was driven by higher employee-related costs.
38
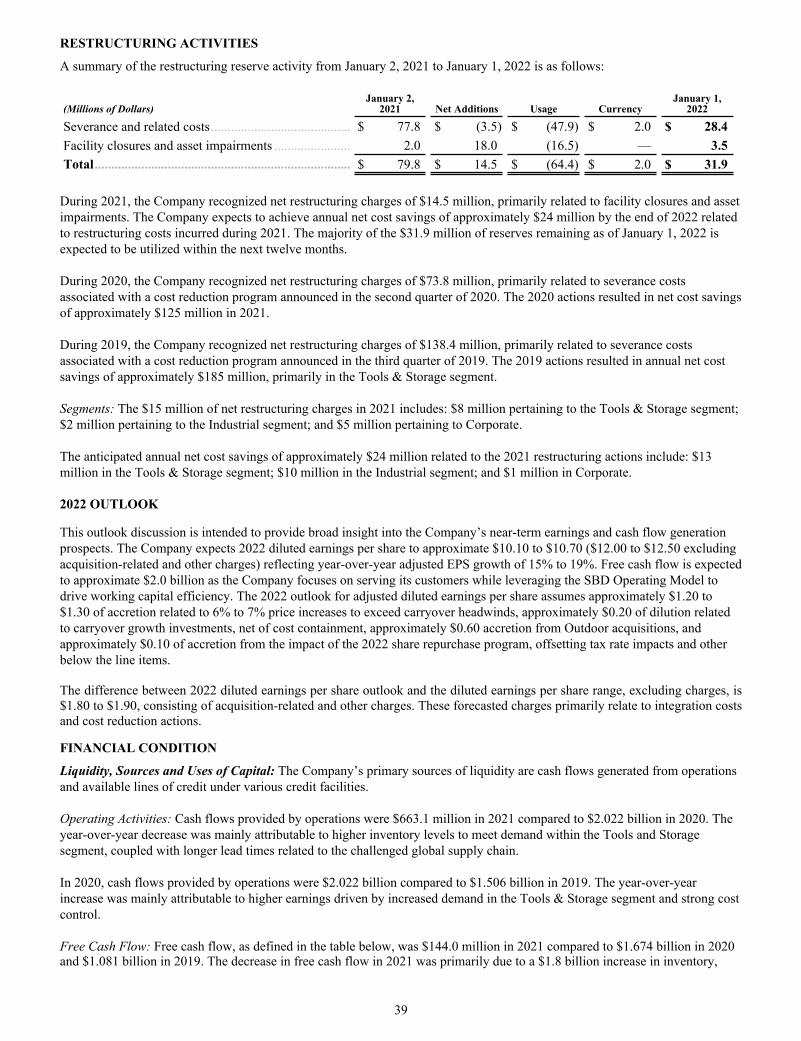
RESTRUCTURING ACTIVITIES
A summary of the restructuring reserve activity from January 2, 2021 to January 1, 2022 is as follows:
(Millions of Dollars)January 2,
2021 Net Additions Usage CurrencyJanuary 1,
2022
Severance and related costs .......................................... $ 77.8 $ (3.5) $ (47.9) $ 2.0 $ 28.4 Facility closures and asset impairments ....................... 2.0 18.0 (16.5) — 3.5 Total ............................................................................. $ 79.8 $ 14.5 $ (64.4) $ 2.0 $ 31.9
During 2021, the Company recognized net restructuring charges of $14.5 million, primarily related to facility closures and asset impairments. The Company expects to achieve annual net cost savings of approximately $24 million by the end of 2022 related to restructuring costs incurred during 2021. The majority of the $31.9 million of reserves remaining as of January 1, 2022 is expected to be utilized within the next twelve months.
During 2020, the Company recognized net restructuring charges of $73.8 million, primarily related to severance costs associated with a cost reduction program announced in the second quarter of 2020. The 2020 actions resulted in net cost savings of approximately $125 million in 2021.
During 2019, the Company recognized net restructuring charges of $138.4 million, primarily related to severance costs associated with a cost reduction program announced in the third quarter of 2019. The 2019 actions resulted in annual net cost savings of approximately $185 million, primarily in the Tools & Storage segment.
Segments: The $15 million of net restructuring charges in 2021 includes: $8 million pertaining to the Tools & Storage segment; $2 million pertaining to the Industrial segment; and $5 million pertaining to Corporate.
The anticipated annual net cost savings of approximately $24 million related to the 2021 restructuring actions include: $13 million in the Tools & Storage segment; $10 million in the Industrial segment; and $1 million in Corporate.
2022 OUTLOOK
This outlook discussion is intended to provide broad insight into the Company’s near-term earnings and cash flow generation prospects. The Company expects 2022 diluted earnings per share to approximate $10.10 to $10.70 ($12.00 to $12.50 excluding acquisition-related and other charges) reflecting year-over-year adjusted EPS growth of 15% to 19%. Free cash flow is expected to approximate $2.0 billion as the Company focuses on serving its customers while leveraging the SBD Operating Model to drive working capital efficiency. The 2022 outlook for adjusted diluted earnings per share assumes approximately $1.20 to $1.30 of accretion related to 6% to 7% price increases to exceed carryover headwinds, approximately $0.20 of dilution related to carryover growth investments, net of cost containment, approximately $0.60 accretion from Outdoor acquisitions, and approximately $0.10 of accretion from the impact of the 2022 share repurchase program, offsetting tax rate impacts and other below the line items.
The difference between 2022 diluted earnings per share outlook and the diluted earnings per share range, excluding charges, is $1.80 to $1.90, consisting of acquisition-related and other charges. These forecasted charges primarily relate to integration costs and cost reduction actions.
FINANCIAL CONDITION
Liquidity, Sources and Uses of Capital: The Company’s primary sources of liquidity are cash flows generated from operations and available lines of credit under various credit facilities.
Operating Activities: Cash flows provided by operations were $663.1 million in 2021 compared to $2.022 billion in 2020. The year-over-year decrease was mainly attributable to higher inventory levels to meet demand within the Tools and Storage segment, coupled with longer lead times related to the challenged global supply chain.
In 2020, cash flows provided by operations were $2.022 billion compared to $1.506 billion in 2019. The year-over-year increase was mainly attributable to higher earnings driven by increased demand in the Tools & Storage segment and strong cost control.
Free Cash Flow: Free cash flow, as defined in the table below, was $144.0 million in 2021 compared to $1.674 billion in 2020 and $1.081 billion in 2019. The decrease in free cash flow in 2021 was primarily due to a $1.8 billion increase in inventory,
39

excluding acquisitions, to support the strong demand outlook and longer lead times related to the challenged global supply chain. This included a substantial increase in inventory in transit of $600 million as well as higher unit costs associated with inflation. At least $500 million of this inventory increase is anticipated to reverse in 2022. Management considers free cash flow an important indicator of its liquidity, as well as its ability to fund future growth and provide dividends to shareowners, and is useful information for investors. Free cash flow does not include deductions for mandatory debt service, other borrowing activity, discretionary dividends on the Company’s common and preferred stock and business acquisitions, among other items.
(Millions of Dollars) 2021 2020 2019
Net cash provided by operating activities ................................................. $ 663 $ 2,022 $ 1,506 Less: capital and software expenditures ................................................... (519) (348) (425) Free cash flow ........................................................................................... $ 144 $ 1,674 $ 1,081
Investing Activities: Cash flows used in investing activities totaled $2.624 billion in 2021, driven by business acquisitions of $2.044 billion, net of cash acquired, primarily related to the MTD and Excel acquisitions, and capital and software expenditures of $519 million.
Cash flows used in investing activities in 2020 totaled $1.577 billion, driven by business acquisitions of $1.324 billion, net of cash acquired, primarily related to the CAM acquisition, and capital and software expenditures of $348 million.
Cash flows used in investing activities in 2019 totaled $1.209 billion, driven by business acquisitions of $685 million, mainly related to IES Attachments, capital and software expenditures of $425 million and purchases of investments of $261 million, which mainly related to the 20 percent investment in MTD.
Financing Activities: Cash flows provided by financing activities totaled $919 million in 2021 primarily driven by net short-term borrowings of $2.225 billion and $131 million of proceeds from issuances of common stock, partially offset by the redemption and conversion of preferred stock for $750 million, cash dividend payments on common stock of $475 million, and $75 million related to the termination of interest rate swaps.
Cash flows provided by financing activities totaled $616 million in 2020 primarily driven by net proceeds from debt issuances of $2.223 billion, proceeds generated from the remarketing of the Series C Preferred Stock of $750 million and $147 million of proceeds from issuances of common stock, partially offset by payments on long-term debt of $1.154 billion, cash dividend payments of $432 million, net repayments of short-term borrowings of $343 million under the Company's commercial paper program, and a $250 million Craftsman deferred purchase price payment.
Cash flows used in financing activities in 2019 totaled $293 million primarily driven by payments on long-term debt of $1.150 billion and cash dividend payments of $402 million, partially offset by $735 million in net proceeds from the issuance of equity units and net proceeds from debt issuances of $496 million.
Fluctuations in foreign currency rates negatively impacted cash by $62 million in 2021 and $1 million in 2019 due to the strengthening of the U.S. Dollar against other currencies. Fluctuations in foreign currency rates positively impacted cash by $23 million in 2020 due to the weakening of the U.S. dollar against other currencies.
Refer to Note H, Long-Term Debt and Financing Arrangements, and Note J, Capital Stock, for further discussion regarding the Company's debt and equity arrangements.
Credit Ratings and Liquidity:
The Company maintains strong investment grade credit ratings from the major U.S. rating agencies on its senior unsecured debt (S&P A, Fitch A-, Moody's Baa1), as well as its commercial paper program (S&P A-1, Fitch F1, Moody's P-2). There were no changes to any of the Company's credit ratings during 2021, however, S&P and Fitch revised their outlooks to ‘stable’ from ‘negative’in the first half of 2021 as a result of the Company's strong performance during the COVID-19 pandemic. Refer to Item 1A. Risk Factors in Part I of this Form 10-K for further discussion of the risks associated with the ongoing COVID-19 pandemic. Failure to maintain strong investment grade rating levels could adversely affect the Company’s cost of funds, liquidity and access to capital markets, but would not have an adverse effect on the Company’s ability to access its existing committed credit facilities.
Cash and cash equivalents totaled $142 million and $1.242 billion as of January 1, 2022 and January 2, 2021, respectively, which was primarily held in the U.S.
40
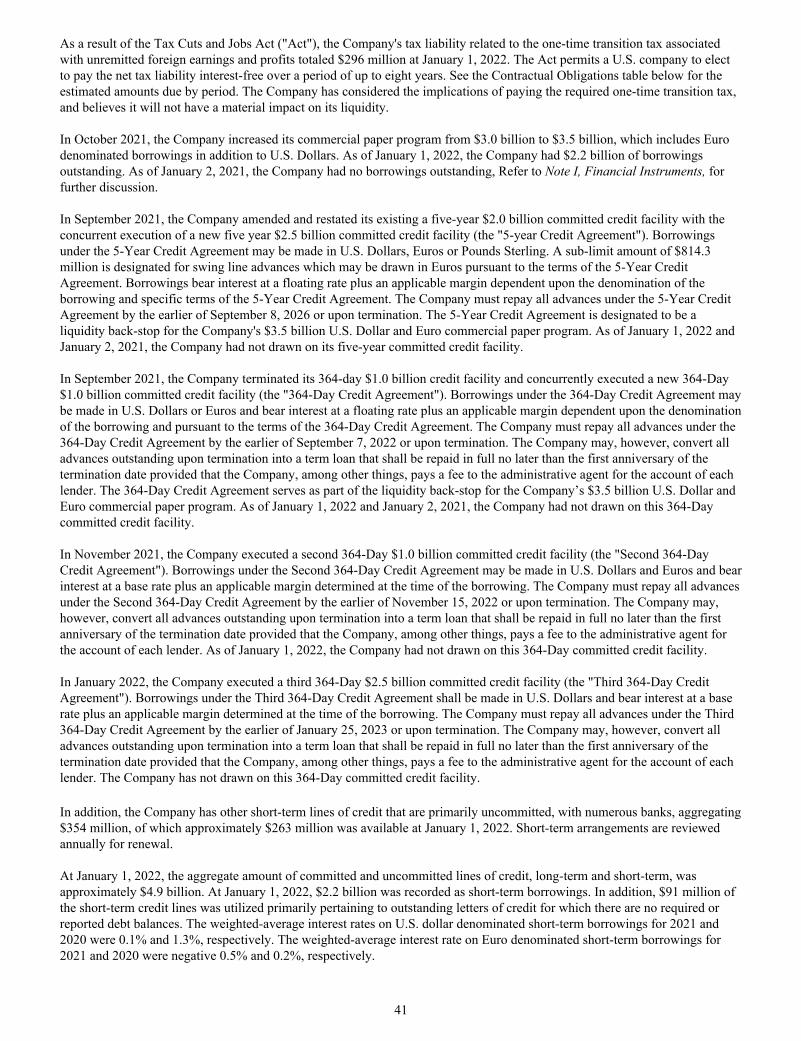
As a result of the Tax Cuts and Jobs Act ("Act"), the Company's tax liability related to the one-time transition tax associated with unremitted foreign earnings and profits totaled $296 million at January 1, 2022. The Act permits a U.S. company to elect to pay the net tax liability interest-free over a period of up to eight years. See the Contractual Obligations table below for the estimated amounts due by period. The Company has considered the implications of paying the required one-time transition tax, and believes it will not have a material impact on its liquidity.
In October 2021, the Company increased its commercial paper program from $3.0 billion to $3.5 billion, which includes Euro denominated borrowings in addition to U.S. Dollars. As of January 1, 2022, the Company had $2.2 billion of borrowings outstanding. As of January 2, 2021, the Company had no borrowings outstanding, Refer to Note I, Financial Instruments, for further discussion.
In September 2021, the Company amended and restated its existing a five-year $2.0 billion committed credit facility with the concurrent execution of a new five year $2.5 billion committed credit facility (the "5-year Credit Agreement"). Borrowings under the 5-Year Credit Agreement may be made in U.S. Dollars, Euros or Pounds Sterling. A sub-limit amount of $814.3 million is designated for swing line advances which may be drawn in Euros pursuant to the terms of the 5-Year Credit Agreement. Borrowings bear interest at a floating rate plus an applicable margin dependent upon the denomination of the borrowing and specific terms of the 5-Year Credit Agreement. The Company must repay all advances under the 5-Year Credit Agreement by the earlier of September 8, 2026 or upon termination. The 5-Year Credit Agreement is designated to be a liquidity back-stop for the Company's $3.5 billion U.S. Dollar and Euro commercial paper program. As of January 1, 2022 and January 2, 2021, the Company had not drawn on its five-year committed credit facility.
In September 2021, the Company terminated its 364-day $1.0 billion credit facility and concurrently executed a new 364-Day $1.0 billion committed credit facility (the "364-Day Credit Agreement"). Borrowings under the 364-Day Credit Agreement may be made in U.S. Dollars or Euros and bear interest at a floating rate plus an applicable margin dependent upon the denomination of the borrowing and pursuant to the terms of the 364-Day Credit Agreement. The Company must repay all advances under the 364-Day Credit Agreement by the earlier of September 7, 2022 or upon termination. The Company may, however, convert all advances outstanding upon termination into a term loan that shall be repaid in full no later than the first anniversary of the termination date provided that the Company, among other things, pays a fee to the administrative agent for the account of each lender. The 364-Day Credit Agreement serves as part of the liquidity back-stop for the Company’s $3.5 billion U.S. Dollar and Euro commercial paper program. As of January 1, 2022 and January 2, 2021, the Company had not drawn on this 364-Day committed credit facility.
In November 2021, the Company executed a second 364-Day $1.0 billion committed credit facility (the "Second 364-Day Credit Agreement"). Borrowings under the Second 364-Day Credit Agreement may be made in U.S. Dollars and Euros and bear interest at a base rate plus an applicable margin determined at the time of the borrowing. The Company must repay all advances under the Second 364-Day Credit Agreement by the earlier of November 15, 2022 or upon termination. The Company may, however, convert all advances outstanding upon termination into a term loan that shall be repaid in full no later than the first anniversary of the termination date provided that the Company, among other things, pays a fee to the administrative agent for the account of each lender. As of January 1, 2022, the Company had not drawn on this 364-Day committed credit facility.
In January 2022, the Company executed a third 364-Day $2.5 billion committed credit facility (the "Third 364-Day Credit Agreement"). Borrowings under the Third 364-Day Credit Agreement shall be made in U.S. Dollars and bear interest at a base rate plus an applicable margin determined at the time of the borrowing. The Company must repay all advances under the Third 364-Day Credit Agreement by the earlier of January 25, 2023 or upon termination. The Company may, however, convert all advances outstanding upon termination into a term loan that shall be repaid in full no later than the first anniversary of the termination date provided that the Company, among other things, pays a fee to the administrative agent for the account of each lender. The Company has not drawn on this 364-Day committed credit facility.
In addition, the Company has other short-term lines of credit that are primarily uncommitted, with numerous banks, aggregating $354 million, of which approximately $263 million was available at January 1, 2022. Short-term arrangements are reviewed annually for renewal.
At January 1, 2022, the aggregate amount of committed and uncommitted lines of credit, long-term and short-term, was approximately $4.9 billion. At January 1, 2022, $2.2 billion was recorded as short-term borrowings. In addition, $91 million of the short-term credit lines was utilized primarily pertaining to outstanding letters of credit for which there are no required or reported debt balances. The weighted-average interest rates on U.S. dollar denominated short-term borrowings for 2021 and 2020 were 0.1% and 1.3%, respectively. The weighted-average interest rate on Euro denominated short-term borrowings for 2021 and 2020 were negative 0.5% and 0.2%, respectively.
41
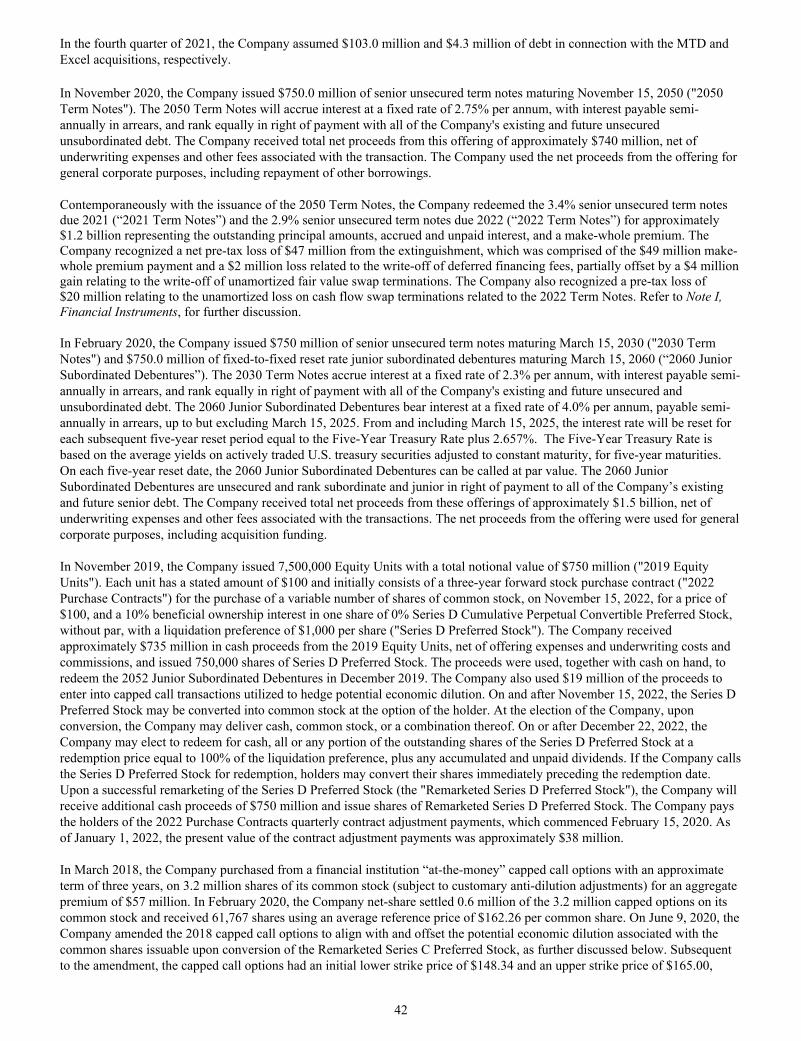
In the fourth quarter of 2021, the Company assumed $103.0 million and $4.3 million of debt in connection with the MTD and Excel acquisitions, respectively.
In November 2020, the Company issued $750.0 million of senior unsecured term notes maturing November 15, 2050 ("2050 Term Notes"). The 2050 Term Notes will accrue interest at a fixed rate of 2.75% per annum, with interest payable semi-annually in arrears, and rank equally in right of payment with all of the Company's existing and future unsecured unsubordinated debt. The Company received total net proceeds from this offering of approximately $740 million, net of underwriting expenses and other fees associated with the transaction. The Company used the net proceeds from the offering for general corporate purposes, including repayment of other borrowings.
Contemporaneously with the issuance of the 2050 Term Notes, the Company redeemed the 3.4% senior unsecured term notes due 2021 (“2021 Term Notes”) and the 2.9% senior unsecured term notes due 2022 (“2022 Term Notes”) for approximately $1.2 billion representing the outstanding principal amounts, accrued and unpaid interest, and a make-whole premium. The Company recognized a net pre-tax loss of $47 million from the extinguishment, which was comprised of the $49 million make-whole premium payment and a $2 million loss related to the write-off of deferred financing fees, partially offset by a $4 million gain relating to the write-off of unamortized fair value swap terminations. The Company also recognized a pre-tax loss of $20 million relating to the unamortized loss on cash flow swap terminations related to the 2022 Term Notes. Refer to Note I, Financial Instruments, for further discussion.
In February 2020, the Company issued $750 million of senior unsecured term notes maturing March 15, 2030 ("2030 Term Notes") and $750.0 million of fixed-to-fixed reset rate junior subordinated debentures maturing March 15, 2060 (“2060 Junior Subordinated Debentures”). The 2030 Term Notes accrue interest at a fixed rate of 2.3% per annum, with interest payable semi-annually in arrears, and rank equally in right of payment with all of the Company's existing and future unsecured and unsubordinated debt. The 2060 Junior Subordinated Debentures bear interest at a fixed rate of 4.0% per annum, payable semi-annually in arrears, up to but excluding March 15, 2025. From and including March 15, 2025, the interest rate will be reset for each subsequent five-year reset period equal to the Five-Year Treasury Rate plus 2.657%. The Five-Year Treasury Rate is based on the average yields on actively traded U.S. treasury securities adjusted to constant maturity, for five-year maturities. On each five-year reset date, the 2060 Junior Subordinated Debentures can be called at par value. The 2060 Junior Subordinated Debentures are unsecured and rank subordinate and junior in right of payment to all of the Company’s existing and future senior debt. The Company received total net proceeds from these offerings of approximately $1.5 billion, net of underwriting expenses and other fees associated with the transactions. The net proceeds from the offering were used for general corporate purposes, including acquisition funding.
In November 2019, the Company issued 7,500,000 Equity Units with a total notional value of $750 million ("2019 Equity Units"). Each unit has a stated amount of $100 and initially consists of a three-year forward stock purchase contract ("2022 Purchase Contracts") for the purchase of a variable number of shares of common stock, on November 15, 2022, for a price of $100, and a 10% beneficial ownership interest in one share of 0% Series D Cumulative Perpetual Convertible Preferred Stock, without par, with a liquidation preference of $1,000 per share ("Series D Preferred Stock"). The Company received approximately $735 million in cash proceeds from the 2019 Equity Units, net of offering expenses and underwriting costs and commissions, and issued 750,000 shares of Series D Preferred Stock. The proceeds were used, together with cash on hand, to redeem the 2052 Junior Subordinated Debentures in December 2019. The Company also used $19 million of the proceeds to enter into capped call transactions utilized to hedge potential economic dilution. On and after November 15, 2022, the Series D Preferred Stock may be converted into common stock at the option of the holder. At the election of the Company, upon conversion, the Company may deliver cash, common stock, or a combination thereof. On or after December 22, 2022, the Company may elect to redeem for cash, all or any portion of the outstanding shares of the Series D Preferred Stock at a redemption price equal to 100% of the liquidation preference, plus any accumulated and unpaid dividends. If the Company calls the Series D Preferred Stock for redemption, holders may convert their shares immediately preceding the redemption date. Upon a successful remarketing of the Series D Preferred Stock (the "Remarketed Series D Preferred Stock"), the Company will receive additional cash proceeds of $750 million and issue shares of Remarketed Series D Preferred Stock. The Company pays the holders of the 2022 Purchase Contracts quarterly contract adjustment payments, which commenced February 15, 2020. As of January 1, 2022, the present value of the contract adjustment payments was approximately $38 million.
In March 2018, the Company purchased from a financial institution “at-the-money” capped call options with an approximate term of three years, on 3.2 million shares of its common stock (subject to customary anti-dilution adjustments) for an aggregate premium of $57 million. In February 2020, the Company net-share settled 0.6 million of the 3.2 million capped options on its common stock and received 61,767 shares using an average reference price of $162.26 per common share. On June 9, 2020, the Company amended the 2018 capped call options to align with and offset the potential economic dilution associated with the common shares issuable upon conversion of the Remarketed Series C Preferred Stock, as further discussed below. Subsequent to the amendment, the capped call options had an initial lower strike price of $148.34 and an upper strike price of $165.00,
42
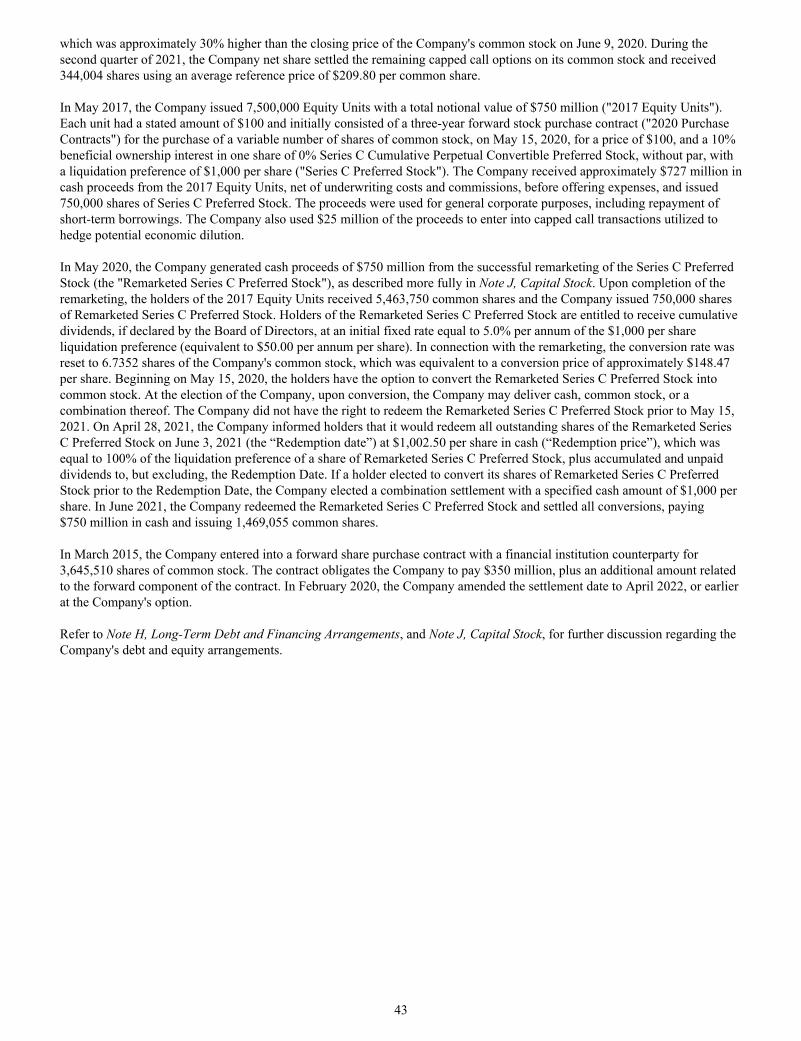
which was approximately 30% higher than the closing price of the Company's common stock on June 9, 2020. During the second quarter of 2021, the Company net share settled the remaining capped call options on its common stock and received 344,004 shares using an average reference price of $209.80 per common share.
In May 2017, the Company issued 7,500,000 Equity Units with a total notional value of $750 million ("2017 Equity Units"). Each unit had a stated amount of $100 and initially consisted of a three-year forward stock purchase contract ("2020 Purchase Contracts") for the purchase of a variable number of shares of common stock, on May 15, 2020, for a price of $100, and a 10% beneficial ownership interest in one share of 0% Series C Cumulative Perpetual Convertible Preferred Stock, without par, with a liquidation preference of $1,000 per share ("Series C Preferred Stock"). The Company received approximately $727 million in cash proceeds from the 2017 Equity Units, net of underwriting costs and commissions, before offering expenses, and issued 750,000 shares of Series C Preferred Stock. The proceeds were used for general corporate purposes, including repayment of short-term borrowings. The Company also used $25 million of the proceeds to enter into capped call transactions utilized to hedge potential economic dilution.
In May 2020, the Company generated cash proceeds of $750 million from the successful remarketing of the Series C Preferred Stock (the "Remarketed Series C Preferred Stock"), as described more fully in Note J, Capital Stock. Upon completion of the remarketing, the holders of the 2017 Equity Units received 5,463,750 common shares and the Company issued 750,000 shares of Remarketed Series C Preferred Stock. Holders of the Remarketed Series C Preferred Stock are entitled to receive cumulative dividends, if declared by the Board of Directors, at an initial fixed rate equal to 5.0% per annum of the $1,000 per share liquidation preference (equivalent to $50.00 per annum per share). In connection with the remarketing, the conversion rate was reset to 6.7352 shares of the Company's common stock, which was equivalent to a conversion price of approximately $148.47 per share. Beginning on May 15, 2020, the holders have the option to convert the Remarketed Series C Preferred Stock into common stock. At the election of the Company, upon conversion, the Company may deliver cash, common stock, or a combination thereof. The Company did not have the right to redeem the Remarketed Series C Preferred Stock prior to May 15, 2021. On April 28, 2021, the Company informed holders that it would redeem all outstanding shares of the Remarketed Series C Preferred Stock on June 3, 2021 (the “Redemption date”) at $1,002.50 per share in cash (“Redemption price”), which was equal to 100% of the liquidation preference of a share of Remarketed Series C Preferred Stock, plus accumulated and unpaid dividends to, but excluding, the Redemption Date. If a holder elected to convert its shares of Remarketed Series C Preferred Stock prior to the Redemption Date, the Company elected a combination settlement with a specified cash amount of $1,000 per share. In June 2021, the Company redeemed the Remarketed Series C Preferred Stock and settled all conversions, paying $750 million in cash and issuing 1,469,055 common shares.
In March 2015, the Company entered into a forward share purchase contract with a financial institution counterparty for 3,645,510 shares of common stock. The contract obligates the Company to pay $350 million, plus an additional amount related to the forward component of the contract. In February 2020, the Company amended the settlement date to April 2022, or earlier at the Company's option.
Refer to Note H, Long-Term Debt and Financing Arrangements, and Note J, Capital Stock, for further discussion regarding the Company's debt and equity arrangements.
43
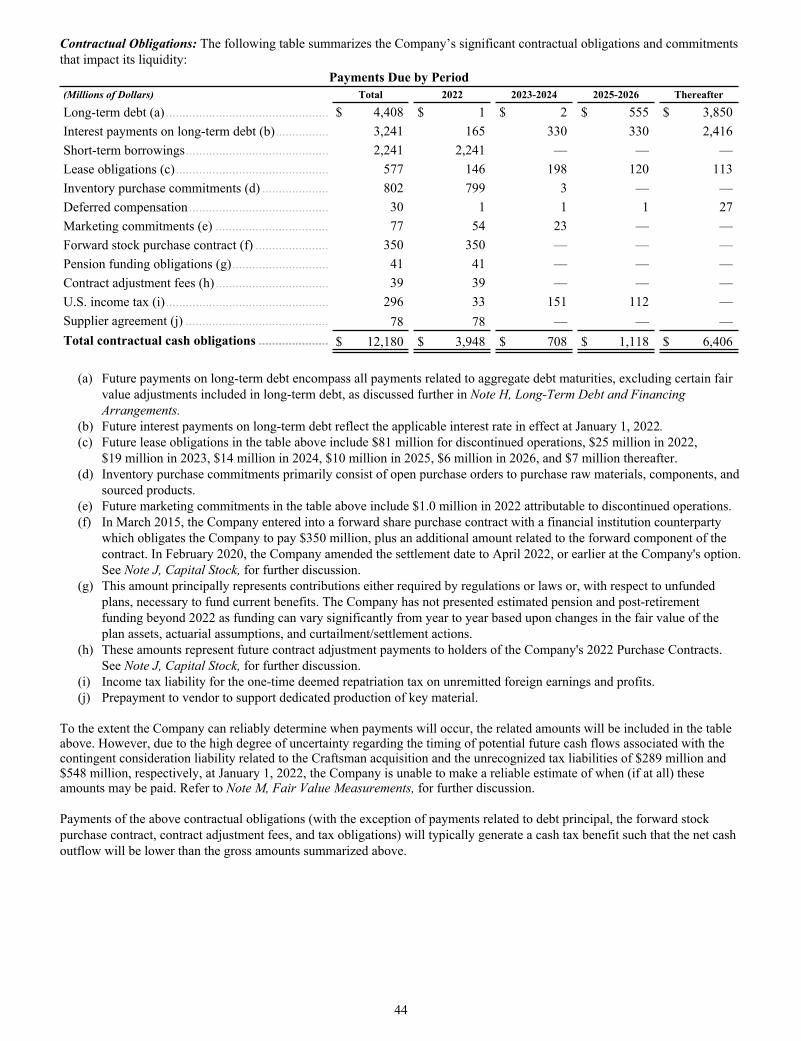
Contractual Obligations: The following table summarizes the Company’s significant contractual obligations and commitments that impact its liquidity:
Payments Due by Period(Millions of Dollars) Total 2022 2023-2024 2025-2026 Thereafter
Long-term debt (a) ................................................. $ 4,408 $ 1 $ 2 $ 555 $ 3,850 Interest payments on long-term debt (b) ................ 3,241 165 330 330 2,416 Short-term borrowings ........................................... 2,241 2,241 — — — Lease obligations (c) .............................................. 577 146 198 120 113 Inventory purchase commitments (d) .................... 802 799 3 — — Deferred compensation .......................................... 30 1 1 1 27 Marketing commitments (e) .................................. 77 54 23 — — Forward stock purchase contract (f) ...................... 350 350 — — — Pension funding obligations (g) ............................. 41 41 — — — Contract adjustment fees (h) .................................. 39 39 — — — U.S. income tax (i) ................................................. 296 33 151 112 — Supplier agreement (j) ........................................... 78 78 — — — Total contractual cash obligations ..................... $ 12,180 $ 3,948 $ 708 $ 1,118 $ 6,406
(a) Future payments on long-term debt encompass all payments related to aggregate debt maturities, excluding certain fair
value adjustments included in long-term debt, as discussed further in Note H, Long-Term Debt and Financing Arrangements.
(b) Future interest payments on long-term debt reflect the applicable interest rate in effect at January 1, 2022. (c) Future lease obligations in the table above include $81 million for discontinued operations, $25 million in 2022,
$19 million in 2023, $14 million in 2024, $10 million in 2025, $6 million in 2026, and $7 million thereafter. (d) Inventory purchase commitments primarily consist of open purchase orders to purchase raw materials, components, and
sourced products.(e) Future marketing commitments in the table above include $1.0 million in 2022 attributable to discontinued operations. (f) In March 2015, the Company entered into a forward share purchase contract with a financial institution counterparty
which obligates the Company to pay $350 million, plus an additional amount related to the forward component of the contract. In February 2020, the Company amended the settlement date to April 2022, or earlier at the Company's option. See Note J, Capital Stock, for further discussion.
(g) This amount principally represents contributions either required by regulations or laws or, with respect to unfunded plans, necessary to fund current benefits. The Company has not presented estimated pension and post-retirement funding beyond 2022 as funding can vary significantly from year to year based upon changes in the fair value of the plan assets, actuarial assumptions, and curtailment/settlement actions.
(h) These amounts represent future contract adjustment payments to holders of the Company's 2022 Purchase Contracts. See Note J, Capital Stock, for further discussion.
(i) Income tax liability for the one-time deemed repatriation tax on unremitted foreign earnings and profits. (j) Prepayment to vendor to support dedicated production of key material.
To the extent the Company can reliably determine when payments will occur, the related amounts will be included in the table above. However, due to the high degree of uncertainty regarding the timing of potential future cash flows associated with the contingent consideration liability related to the Craftsman acquisition and the unrecognized tax liabilities of $289 million and $548 million, respectively, at January 1, 2022, the Company is unable to make a reliable estimate of when (if at all) these amounts may be paid. Refer to Note M, Fair Value Measurements, for further discussion.
Payments of the above contractual obligations (with the exception of payments related to debt principal, the forward stock purchase contract, contract adjustment fees, and tax obligations) will typically generate a cash tax benefit such that the net cash outflow will be lower than the gross amounts summarized above.
44

Other Significant Commercial Commitments:Amount of Commitment Expirations Per Period
(Millions of Dollars) Total 2022 2023-2024 2025-2026 Thereafter
U.S. lines of credit $ 4,500 $ 2,000 $ — $ 2,500 $ —
Short-term borrowings, long-term debt and lines of credit are explained in detail within Note H, Long-Term Debt and Financing Arrangements.
MARKET RISK
Market risk is the potential economic loss that may result from adverse changes in the fair value of financial instruments, currencies, commodities and other items traded in global markets. The Company is exposed to market risk from changes in foreign currency exchange rates, interest rates, stock prices, bond prices and commodity prices, amongst others.
Exposure to foreign currency risk results because the Company, through its global businesses, enters into transactions and makes investments denominated in multiple currencies. The Company’s predominant currency exposures are related to the Euro, Canadian Dollar, British Pound, Australian Dollar, Brazilian Real, Chinese Renminbi and the Taiwan Dollar. Certain cross-currency trade flows arising from both trade and affiliate sales and purchases are consolidated and netted prior to obtaining risk protection through the use of various derivative financial instruments which may include: purchased basket options, purchased options, collars, cross-currency swaps and currency forwards. The Company is thus able to capitalize on its global positioning by taking advantage of naturally offsetting exposures and portfolio efficiencies to reduce the cost of purchasing derivative protection. At times, the Company also enters into foreign exchange derivative contracts to reduce the earnings and cash flow impacts of non-functional currency denominated receivables and payables, primarily for affiliate transactions. Gains and losses from these hedging instruments offset the gains or losses on the underlying net exposures. Management determines the nature and extent of currency hedging activities, and in certain cases, may elect to allow certain currency exposures to remain un-hedged. The Company may also enter into cross-currency swaps and forward contracts to hedge the net investments in certain subsidiaries and better match the cash flows of operations to debt service requirements. Management estimates the foreign currency impact from its derivative financial instruments outstanding at the end of 2021 would have been an incremental pre-tax loss of approximately $30 million based on a hypothetical 10% adverse movement in all net derivative currency positions. The Company follows risk management policies in executing derivative financial instrument transactions, and does not use such instruments for speculative purposes. The Company generally does not hedge the translation of its non-U.S. dollar earnings in foreign subsidiaries, but may choose to do so in certain instances in future periods.
As mentioned above, the Company routinely has cross-border trade and affiliate flows that cause an impact on earnings from foreign exchange rate movements. The Company is also exposed to currency fluctuation volatility from the translation of foreign earnings into U.S. dollars and the economic impact of foreign currency volatility on monetary assets held in foreign currencies. It is more difficult to quantify the transactional effects from currency fluctuations than the translational effects. Aside from the use of derivative instruments, which may be used to mitigate some of the exposure, transactional effects can potentially be influenced by actions the Company may take. For example, if an exposure occurs from a European entity sourcing product from a U.S. supplier it may be possible to change to a European supplier. Management estimates the combined translational and transactional impact, on pre-tax earnings, of a 10% overall movement in exchange rates is approximately $209 million, or approximately $1.18 per diluted share. In 2021, translational and transactional foreign currency fluctuations negatively impacted pre-tax earnings from continuing operations by approximately $17 million, or approximately $0.10 per diluted share.
The Company’s exposure to interest rate risk results from its outstanding debt and derivative obligations, short-term investments, and derivative financial instruments employed in the management of its debt portfolio. The debt portfolio including both trade and affiliate debt, is managed to achieve capital structure targets and reduce the overall cost of borrowing by using a combination of fixed and floating rate debt as well as interest rate swaps, and cross-currency swaps.
The Company’s primary exposure to interest rate risk comes from its commercial paper program in which the pricing is partially based on short-term U.S. interest rates. At January 1, 2022, the impact of a hypothetical 10% increase in the interest rates associated with the Company’s commercial paper borrowings would have an immaterial effect on the Company’s financial position and results of operations.
The Company has exposure to commodity prices in many businesses, particularly brass, nickel, resin, aluminum, copper, zinc, steel, and energy used in the production of finished goods. Generally, commodity price exposures are not hedged with derivative financial instruments, but instead are actively managed through customer product and service pricing actions, procurement-driven cost reduction initiatives and other productivity improvement projects.
45
The Company has $136 million of liabilities as of January 1, 2022 pertaining to unfunded defined contribution plans for certain U.S. employees for which there is mark-to-market exposure.
The assets held by the Company’s defined benefit plans are exposed to fluctuations in the market value of securities, primarily global stocks and fixed-income securities. The funding obligations for these plans would increase in the event of adverse changes in the plan asset values, although such funding would occur over a period of many years. In 2021, 2020, and 2019, investment returns on pension plan assets resulted in increases of $81 million, $280 million, and $323 million, respectively. The Company expects funding obligations on its defined benefit plans to be approximately $41 million in 2022. The Company employs diversified asset allocations to help mitigate this risk. Management has worked to minimize this exposure by freezing and terminating defined benefit plans where appropriate.
The Company has access to financial resources and borrowing capabilities around the world. There are no instruments within the debt structure that would accelerate payment requirements solely due to a change in credit rating.
The Company’s existing credit facilities and sources of liquidity, including operating cash flows, are considered more than adequate to conduct business as normal. Accordingly, based on present conditions and past history, management believes it is unlikely that operations will be materially affected by any potential deterioration of the general credit markets that may occur. The Company believes that its strong financial position, operating cash flows, committed long-term credit facilities and borrowing capacity, and ability to access equity markets, provide the financial flexibility necessary to continue its record of annual dividend payments, to invest in the routine needs of its businesses, to make strategic acquisitions and to fund other initiatives encompassed by its growth strategy and maintain its strong investment grade credit ratings.
OTHER MATTERS
Employee Stock Ownership Plan ("ESOP") — As detailed in Note L, Employee Benefit Plans, the Company has an ESOP under which the ongoing U.S. Core and 401(k) defined contribution plans have been funded. Overall ESOP expense was affected by the market value of the Company’s stock on the monthly dates when shares were released, among other factors. The Company’s net ESOP activity resulted in expense of $59.1 million and $4.4 million in 2021 and 2020, respectively, and income of $5.1 million in 2019. U.S. defined contribution retirement plan expense increased in 2021 as all remaining unallocated shares in the ESOP were released in the first quarter of 2020. In addition, employer contributions to the plan were suspended for the last three quarters of 2020.
CRITICAL ACCOUNTING ESTIMATES — Preparation of the Company’s Consolidated Financial Statements requires management to make estimates and assumptions that affect the reported amounts of assets, liabilities, revenues and expenses. Significant accounting policies used in the preparation of the Consolidated Financial Statements are described in Note A, Significant Accounting Policies. Management believes the most complex and sensitive judgments, because of their significance to the Consolidated Financial Statements, result primarily from the need to make estimates about the effects of matters with inherent uncertainty. The most significant areas involving management estimates are described below. Actual results in these areas could differ from management’s estimates.
GOODWILL AND INTANGIBLE ASSETS — The Company acquires businesses in purchase transactions that result in the recognition of goodwill and intangible assets. The determination of the value of intangible assets requires management to make estimates and assumptions. In accordance with Accounting Standards Codification ("ASC") 350-20, Goodwill, acquired goodwill and indefinite-lived intangible assets are not amortized but are subject to impairment testing at least annually or when an event occurs or circumstances change that indicate it is more likely than not an impairment exists. Definite-lived intangible assets are amortized and are tested for impairment when an event occurs or circumstances change that indicate it is more likely than not that an impairment exists. Goodwill represents costs in excess of fair values assigned to the underlying net assets of acquired businesses. At January 1, 2022, the Company reported $8.784 billion of goodwill, $2.525 billion of indefinite-lived trade names and $2.175 billion of net definite-lived intangibles.
Management tests goodwill for impairment at the reporting unit level. A reporting unit is an operating segment as defined in ASC 280, Segment Reporting, or one level below an operating segment (component level) as determined by the availability of discrete financial information that is regularly reviewed by operating segment management or an aggregate of component levels of an operating segment having similar economic characteristics. If the carrying value of a reporting unit (including the value of goodwill) is greater than its estimated fair value, an impairment charge would be recorded for the amount that the carrying amount of the reporting unit exceeded its fair value.
As required by the Company’s policy, goodwill was tested for impairment in the third quarter of 2021. In accordance with Accounting Standards Update ("ASU") 2011-08, Intangibles - Goodwill and Other (Topic 350): Testing Goodwill for Impairment, companies are permitted to first assess qualitative factors to determine whether it is more likely than not that the
46
fair value of a reporting unit is less than its carrying amount as a basis for determining whether it is necessary to perform a quantitative goodwill impairment test. Impairment tests are completed separately with respect to the goodwill of each of the Company’s reporting units. For its annual impairment testing performed in the third quarter of 2021, the Company applied the qualitative assessment for two of its reporting units, while performing the quantitative test for three of its reporting units. Based on the results of the Company’s annual impairment testing, it was determined that the fair value of each of its reporting units is substantially in excess of its carrying amount.
In performing the qualitative assessments, the Company identified and considered the significance of relevant key factors, events, and circumstances that could affect the fair value of each reporting unit. These factors include external factors such as macroeconomic, industry, and market conditions, as well as entity-specific factors, such as actual and planned financial performance. The Company also assessed changes in each reporting unit's fair value and carrying value since the most recent date a fair value measurement was performed. As a result of the qualitative assessments performed, the Company concluded that it is more likely than not that the fair value of each of these reporting units exceeded its respective carrying value and therefore, no additional quantitative impairment testing was performed.
With respect to the quantitative tests, the Company assessed the fair values of the three reporting units based on a discounted cash flow valuation model. The key assumptions applied to the cash flow projections were discount rates, which ranged from 7.0% to 8.0%, near-term revenue growth rates over the next six years, which represented cumulative annual growth rates ranging from approximately 4% to 7%, and perpetual growth rates of 3%. These assumptions contemplated business, market and overall economic conditions. Based on the results of this testing, the Company determined that the fair value for each of these reporting units exceeded its carrying amount by in excess of 50%. Furthermore, management performed sensitivity analyses on the estimated fair values from the discounted cash flow valuation models utilizing more conservative assumptions that reflect reasonably likely future changes in the discount rate and perpetual growth rate. The discount rate was increased by 100 basis points with no impairment indicated. The perpetual growth rate was decreased by 150 basis points with no impairment indicated.
The Company also tested its indefinite-lived trade names for impairment during the third quarter of 2021 utilizing a discounted cash flow model. The key assumptions used included discount rates, royalty rates, and perpetual growth rates applied to the projected sales. The Company determined that the fair values of its indefinite-lived trade names exceeded their respective carrying amounts.
In the event that future operating results of any of the Company's reporting units or indefinite-lived trade names do not meet current expectations, management, based upon conditions at the time, would consider taking restructuring or other strategic actions, as necessary, to maximize revenue growth and profitability. A thorough analysis of all the facts and circumstances existing at that time would need to be performed to determine if recording an impairment loss would be appropriate.
DEFINED BENEFIT OBLIGATIONS — The valuation of pension and other postretirement benefits costs and obligations is dependent on various assumptions. These assumptions, which are updated annually, include discount rates, expected return on plan assets, future salary increase rates, and health care cost trend rates. The Company considers current market conditions, including interest rates, to establish these assumptions. Discount rates are developed considering the yields available on high-quality fixed income investments with maturities corresponding to the duration of the related benefit obligations. The Company’s weighted-average discount rates used to determine benefit obligations at January 1, 2022 for the United States and international pension plans were 2.80% and 1.78%, respectively. The Company’s weighted-average discount rates used to determine benefit obligations at January 2, 2021 for the United States and international pension plans were 2.39% and 1.31%, respectively. As discussed further in Note L, Employee Benefit Plans, the Company develops the expected return on plan assets considering various factors, which include its targeted asset allocation percentages, historic returns, and expected future returns. The Company’s expected rate of return assumptions for the United States and international pension plans were 4.75% and 3.25%, respectively, at January 1, 2022. The Company will use a 4.07% weighted-average expected rate of return assumption to determine the 2022 net periodic benefit cost. A 25 basis point reduction in the expected rate of return assumption would increase 2022 net periodic benefit cost by approximately $6 million on a pre-tax basis.
The Company believes that the assumptions used are appropriate; however, differences in actual experience or changes in the assumptions may materially affect the Company’s financial position or results of operations. To the extent that actual (newly measured) results differ from the actuarial assumptions, the difference is recognized in accumulated other comprehensive loss, and, if in excess of a specified corridor, amortized over future periods. The expected return on plan assets is determined using the expected rate of return and the fair value of plan assets. Accordingly, market fluctuations in the fair value of plan assets can affect the net periodic benefit cost in the following year. The projected benefit obligation for defined benefit plans exceeded the fair value of plan assets by $432 million at January 1, 2022. A 25 basis point reduction in the discount rate would have increased the projected benefit obligation by approximately $101 million at January 1, 2022. The primary Black & Decker U.S. pension and post employment benefit plans were curtailed in late 2010, as well as the only material Black & Decker
47

international plan, and in their place the Company implemented defined contribution benefit plans. The vast majority of the projected benefit obligation pertains to plans that have been frozen; the remaining defined benefit plans that are not frozen are predominantly small domestic union plans and those that are statutorily mandated in certain international jurisdictions. The Company recognized approximately $8 million of defined benefit plan income in 2021, which may fluctuate in future years depending upon various factors including future discount rates and actual returns on plan assets.
ENVIRONMENTAL — The Company incurs costs related to environmental issues as a result of various laws and regulations governing current operations as well as the remediation of previously contaminated sites. The Company’s policy is to accrue environmental investigatory and remediation costs for identified sites when it is probable that a liability has been incurred and the amount of loss can be reasonably estimated. The amount of liability recorded is based on an evaluation of currently available facts with respect to each individual site and includes such factors as existing technology, presently enacted laws and regulations, and prior experience in remediation of contaminated sites. The liabilities recorded do not take into account any claims for recoveries from insurance or third parties. As assessments and remediation progress at individual sites, the amounts recorded are reviewed periodically and adjusted to reflect additional technical and legal information that becomes available.
As of January 1, 2022, the Company had reserves of $159 million for remediation activities associated with Company-owned properties as well as for Superfund sites, for losses that are probable and estimable. The range of environmental remediation costs that is reasonably possible is $94 million to $229 million which is subject to change in the near term. The Company may be liable for environmental remediation of sites it no longer owns. Liabilities have been recorded on those sites in accordance with this policy.
INCOME TAXES — The Company accounts for income taxes under the asset and liability method in accordance with ASC 740, Income Taxes, which requires the recognition of deferred tax assets and liabilities for the expected future tax consequences of events that have been included in the financial statements. Deferred tax assets and liabilities are determined based on the differences between the financial statements and tax basis of assets and liabilities using the enacted tax rates in effect for the year in which the differences are expected to reverse. Any changes in tax rates on deferred tax assets and liabilities are recognized in income in the period that includes the enactment date.
The Company records net deferred tax assets to the extent that it is more likely than not that these assets will be realized. In making this determination, management considers all available positive and negative evidence, including future reversals of existing temporary differences, estimates of future taxable income, tax-planning strategies, and the realizability of net operating loss carryforwards. In the event that it is determined that an asset is not more likely that not to be realized, a valuation allowance is recorded against the asset. Valuation allowances related to deferred tax assets can be impacted by changes to tax laws, changes to statutory tax rates and future taxable income levels. In the event the Company were to determine that it would not be able to realize all or a portion of its deferred tax assets in the future, the unrealizable amount would be charged to earnings in the period in which that determination is made. Conversely, if the Company were to determine that it would be able to realize deferred tax assets in the future in excess of the net carrying amounts, it would decrease the recorded valuation allowance through a favorable adjustment to earnings in the period that the determination was made.
The Company records uncertain tax positions in accordance with ASC 740, which requires a two-step process. First, management determines whether it is more likely than not that a tax position will be sustained based on the technical merits of the position and second, for those tax positions that meet the more likely than not threshold, management recognizes the largest amount of the tax benefit that is greater than 50 percent likely to be realized upon ultimate settlement with the related taxing authority. The Company maintains an accounting policy of recording interest and penalties on uncertain tax positions as a component of Income taxes in the Consolidated Statements of Operations.
The Company is subject to income tax in a number of locations, including many state and foreign jurisdictions. Significant judgment is required when calculating the worldwide provision for income taxes. Many factors are considered when evaluating and estimating the Company's tax positions and tax benefits, which may require periodic adjustments, and which may not accurately anticipate actual outcomes. It is reasonably possible that the amount of the unrecognized benefit with respect to certain of the Company's unrecognized tax positions will significantly increase or decrease within the next twelve months. These changes may be the result of settlements of ongoing audits, litigation, or other proceedings with taxing authorities. The Company periodically assesses its liabilities and contingencies for all tax years still subject to audit based on the most current available information, which involves inherent uncertainty.
Additional information regarding income taxes is available in Note Q, Income Taxes.
48
CAUTIONARY STATEMENTS UNDER THE PRIVATE SECURITIES LITIGATION REFORM ACT OF 1995
This document contains “forward-looking statements” within the meaning of Section 27A of the Securities Act of 1933, as amended, and Section 21E of the Securities Exchange Act of 1934, as amended. All statements other than statements of historical fact are “forward-looking statements” for purposes of federal and state securities laws, including any projections or guidance of earnings, revenue or other financial items; any statements of the plans, strategies and objectives of management for future operations; any statements concerning proposed new products, services or developments; any statements regarding future economic conditions or performance; any statements of belief; and any statements of assumptions underlying any of the foregoing. Forward-looking statements may include, among others, the words “may,” “will,” “estimate,” “intend,” “continue,” “believe,” “expect,” “anticipate” or any other similar words.
Although the Company believes that the expectations reflected in any of its forward-looking statements are reasonable, actual results could differ materially from those projected or assumed in any of its forward-looking statements. The Company's future financial condition and results of operations, as well as any forward-looking statements, are subject to change and to inherent risks and uncertainties, such as those disclosed or incorporated by reference in the Company's filings with the Securities and Exchange Commission.
Important factors that could cause the Company's actual results, performance and achievements, or industry results to differ materially from estimates or projections contained in its forward-looking statements include, among others, the following: (i) successfully developing, marketing and achieving sales from new products and services and the continued acceptance of current products and services; (ii) macroeconomic factors, including global and regional business conditions (such as Brexit), commodity prices, inflation and deflation, and currency exchange rates; (iii) laws, regulations and governmental policies affecting the Company's activities in the countries where it does business, including those related to tariffs, taxation, data privacy, anti-bribery, anti-corruption, government contracts and trade controls such as section 301 tariffs and section 232 steel and aluminum tariffs; (iv) the economic, political, cultural and legal environment of emerging markets, particularly Latin America, Russia, China and Turkey; (v) realizing the anticipated benefits of mergers, acquisitions, joint ventures, strategic alliances or divestitures; (vi) pricing pressure and other changes within competitive markets; (vii) availability and price of raw materials, component parts, freight, energy, labor and sourced finished goods; (viii) the impact the tightened credit markets and change to LIBOR and other benchmark rates may have on the Company or its customers or suppliers; (ix) the extent to which the Company has to write off accounts receivable or assets or experiences supply chain disruptions in connection with bankruptcy filings by customers or suppliers; (x) the Company's ability to identify and effectively execute productivity improvements and cost reductions; (xi) potential business and distribution disruptions, including those related to physical security threats, information technology or cyber-attacks, epidemics, pandemics, sanctions, political unrest, war, terrorism or natural disasters; (xii) the continued consolidation of customers, particularly in consumer channels and the Company’s continued reliance on significant customers; (xiii) managing franchisee relationships; (xiv) the impact of poor weather conditions and climate change; (xv) maintaining or improving production rates in the Company's manufacturing facilities, responding to significant changes in customer preferences, product demand and fulfilling demand for new and existing products, and learning, adapting and integrating new technologies into products, services and processes; (xvi) changes in the competitive landscape in the Company's markets; (xvii) the Company's non-U.S. operations, including sales to non-U.S. customers; (xviii) the impact from demand changes within world-wide markets associated with homebuilding and remodeling; (xix) potential adverse developments in new or pending litigation and/or government investigations; (xx) the incurrence of debt and changes in the Company's ability to obtain debt on commercially reasonable terms and at competitive rates; (xxi) substantial pension and other postretirement benefit obligations; (xxii) potential regulatory liabilities, including environmental, privacy, data breach, workers compensation and product liabilities; (xxiii) attracting and retaining key employees, managing a workforce in many jurisdictions, work stoppages or other labor disruptions; (xxiv) the Company's ability to keep abreast with the pace of technological change; (xxv) changes in accounting estimates; (xxvi) the Company’s ability to protect its intellectual property rights and associated reputational impacts; (xxvii) the continued adverse effects of the COVID-19 pandemic and an indeterminate recovery period; (xxviii) the possibility that the Company does not achieve the intended financial benefits from the acquisition of MTD; (xxix) the failure to consummate, or a delay in the consummation of, the Security sale transaction for various reasons (including but not limited to failure to receive, or delay in receiving, required regulatory approvals and meet customary closing conditions); (xxx) the failure to undertake or complete, or a delay in the timing of, the share repurchase program; and (xxxi) failure to realize the expected benefits of the Company's capital allocation strategy and share repurchase program.
Additional factors that could cause actual results to differ materially from forward-looking statements are set forth in this Annual Report on Form 10-K, including under the heading “Risk Factors,” “Management’s Discussion and Analysis of Financial Condition and Results of Operations” and in the Consolidated Financial Statements and the related Notes.
49

Forward-looking statements in this Annual Report on Form 10-K speak only as of the date hereof, and forward-looking statements in documents attached that are incorporated by reference speak only as of the date of those documents. The Company does not undertake any obligation to update or release any revisions to any forward-looking statement or to report any events or circumstances after the date hereof or to reflect the occurrence of unanticipated events, except as required by law.
50

ITEM 7A. QUANTITATIVE AND QUALITATIVE DISCLOSURES ABOUT MARKET RISK
The Company incorporates by reference the material captioned “Market Risk” in Item 7 and in Note I, Financial Instruments, of the Notes to Consolidated Financial Statements in Item 8.
ITEM 8. FINANCIAL STATEMENTS AND SUPPLEMENTARY DATA
See Item 15 for an index to Financial Statements and Financial Statement Schedule. Such Financial Statements and Financial Statement Schedule are incorporated herein by reference.
ITEM 9. CHANGES IN AND DISAGREEMENTS WITH ACCOUNTANTS ON ACCOUNTING AND FINANCIAL DISCLOSURE
None.
51
ITEM 9A. CONTROLS AND PROCEDURES
Material Weaknesses in Internal Control Over Financial Reporting
The management of Stanley Black & Decker, Inc. (the "Company") is responsible for establishing and maintaining adequate internal control over financial reporting, as that term is defined under Rules 13a-15(f) and 15d-15(f) of the Securities Exchange Act of 1934, as amended (the “Exchange Act”). Under the supervision and with the participation of management, including the Chief Executive Officer and the President and Chief Financial Officer, the Company has assessed the effectiveness of its internal control over financial reporting as of the end of the period covered by this report based upon the criteria set forth by the Committee of Sponsoring Organizations (COSO) of the Treadway Commission in Internal Control — Integrated Framework (2013 Framework). Based on that assessment, the Chief Executive Officer and the President and Chief Financial Officer concluded that the Company's internal control over financial reporting was not effective to provide reasonable assurance regarding the reliability of its financial reporting and the preparation of its financial statements for external purposes in accordance with accounting principles generally accepted in the United States of America as of January 1, 2022 due to the material weaknesses in internal control described below.
A material weakness, as defined in Rule 12b-2 under the Exchange Act, is a deficiency, or a combination of deficiencies, in internal control over financial reporting, such that there is a reasonable possibility that a material misstatement of a company’s annual or interim financial statements will not be prevented or detected on a timely basis.
Subsequent to the filing of its 2020 Form 10-K, the Company received comments from the SEC Staff regarding its accounting for equity units issued in May 2017 and November 2019 (the “Equity Units”). Upon further reflection of the comments received by the Staff and the nature of the Equity Units, the Company determined that errors were made in its original accounting conclusions resulting from material weaknesses in its internal control over financial reporting for such instruments. The Company determined the errors were the result of the following deficiencies in internal control over financial reporting:
1. The design of its control to consider all the relevant authoritative accounting guidance for financial instruments with debt- and equity-like features; and
2. The design of its control to consider financial instruments with debt- and equity-like features in the calculation of earnings per share.
The Company assessed whether there was a reasonable possibility that a material misstatement would not have been prevented or detected on a timely basis as a result of the above control deficiencies. The first control deficiency could result in a determination that there are two units of account in which the forward stock purchase contracts, when evaluated separately as freestanding instruments, would be precluded from equity classification. As a result, the asset or liability related to the forward stock purchase contracts would be subject to mark-to-market accounting, which would be significantly influenced by factors outside of the Company’s control, including fluctuations in its share price. The second control deficiency resulted in material errors in the calculation of diluted earnings per share previously disclosed in the Company’s historical financial statements. Based on these factors, the Company concluded that the deficiencies noted above each rise to the level of a material weakness.
Remediation of Material Weaknesses
The Company acknowledges that its management is responsible for establishing and maintaining adequate internal control over financial reporting and assessing the effectiveness of its internal controls. The Company is committed to maintaining a strong internal control environment and implementing measures to ensure that the control deficiencies identified above are remediated as soon as possible. Management is in the process of implementing its remediation plan, which includes steps to design and implement new controls and expand education and training related to the accounting considerations for complex financing transactions. The Company will consider the material weakness remediated after the applicable controls operate for a sufficient period of time, and management has concluded, through testing, that the controls are operating effectively.
Evaluation of Disclosure Controls and Procedures
The Company’s management is responsible for establishing and maintaining adequate internal control over financial reporting. Internal control over financial reporting is a process designed to provide reasonable assurance regarding the reliability of financial reporting and the preparation of financial statements for external reporting purposes in accordance with accounting principles generally accepted in the United States of America. Because of its inherent limitations, internal control over financial reporting may not prevent or detect misstatements.
52
During the fourth quarter of 2021, the Company acquired the remaining 80 percent ownership stake in MTD Holdings Inc. ("MTD") and Excel Industries ("Excel") for approximately $1.5 billion and $374 million, respectfully. Since Stanley Black & Decker, Inc. has not yet fully incorporated the internal controls and procedures of MTD and Excel into Stanley Black & Decker, Inc.'s internal control over financial reporting, management excluded these businesses from its assessment of the effectiveness of internal control over financial reporting as of January 1, 2022. MTD accounted for 5% of Stanley Black & Decker, Inc.'s total assets as of January 1, 2022 and 1% of Stanley Black & Decker, Inc.'s net sales for the year then ended. Excel accounted less than 1% of Stanley Black & Decker, Inc.'s total assets as of January 1, 2022 and less than 1% of Stanley Black & Decker, Inc.'s net sales for the year then ended.
Other than those items noted above, there has been no change in the Company’s internal control over financial reporting that occurred during the fiscal year ended January 1, 2022 that has materially affected, or is reasonably likely to materially affect, the Company’s internal control over financial reporting.
Refer to Management’s Report On Internal Control Over Financial Reporting on page 63.
ITEM 9B. OTHER INFORMATION
None.
53
PART III
ITEM 10. DIRECTORS, EXECUTIVE OFFICERS AND CORPORATE GOVERNANCE OF THE REGISTRANT
The information required by this Item, except for certain information with respect to the Company’s Code of Ethics, the identification of the executive officers of the Company and any material changes to the procedures by which security holders may recommend nominees to the Company’s Board of Directors, as set forth below, is incorporated herein by reference to the information set forth in the section of the Company’s definitive proxy statement (which will be filed pursuant to Regulation 14A under the Exchange Act within 120 days after the close of the Company’s fiscal year) under the headings “Information Concerning Nominees for Election as Directors,” and “Board of Directors".
Available on the Company's website at http://www.stanleyblackanddecker.com under the “Who We Are” heading is the Code of Business Ethics applicable to all of its directors, officers, including the Chief Executive Officer, President and Chief Financial Officer, and Vice President, Chief Accounting Officer, and employees worldwide. The Company intends to post on its website required information regarding any amendment to, or waiver from, the Code of Business Ethics that applies to the Company's Chief Executive Officer and senior financial officers within four business days after any such amendment or waiver.
54
The following is a list of the executive officers of the Company as of February 22, 2022:
Name and Age OfficeDate Elected to
Office
James M. Loree (63) Chief Executive Officer since August 2016. President & Chief Operating Officer (2013); Executive Vice President and Chief Operating Officer (2009); Executive Vice President Finance and Chief Financial Officer (1999).
7/19/1999
Donald Allan, Jr. (57) President & Chief Financial Officer since April 2021. Executive Vice President & Chief Financial Officer (2016); Senior Vice President & Chief Financial Officer (2010); Vice President & Chief Financial Officer (2009); Vice President & Corporate Controller (2002); Corporate Controller (2000); Assistant Controller (1999).
10/24/2006
Janet M. Link (52) Senior Vice President, General Counsel and Secretary since July 2017. Executive Vice President, General Counsel, JC Penney Company, Inc. (2015); Vice President, Deputy General Counsel, JC Penney Company, Inc. (2014); Vice President, Deputy General Counsel, Clear Channel Companies (2013).
7/19/2017
Jaime A. Ramirez (54) Executive Vice President & President, Global Tools & Storage since July 2020. Senior Vice President & Chief Operating Officer, Tools & Storage (2019); Senior Vice President & President, Global Emerging Markets (2012); President, Construction & DIY, Latin America (2010); Vice President and General Manager - Latin America, Power Tools & Accessories, The Black & Decker Corporation (2008); Vice President and General Manager - Andean Region The Black & Decker Corporation (2007).
3/12/2010
John H. Wyatt (63) Senior Vice President & President, Stanley Outdoor since January 2021. Senior Vice President & President, Stanley Outdoor and Aerospace (2020); President, Stanley Engineered Fastening (2016); President, Sales & Marketing - Global Tools & Storage (2015); President, Construction & DIY, Europe and ANZ (2012); President, Construction & DIY, EMEA (2010); President-Europe, Middle East, and Africa, Power Tools and Accessories, The Black & Decker Corporation (2008); Vice President-Consumer Products (Europe, Middle East and Africa), The Black & Decker Corporation (2006).
3/12/2010
Robert H. Raff (55) Head of Outdoor Integration since July 2021. President, Stanley Security (2016); President, Stanley Electronic Security North America (2015); President, North America Sales, Construction & DIY (2010); President, Stanley National Hardware (2007); Vice President of Latin America, Construction & DIY (2005); General Manager, Construction & DIY (2002).
4/19/2018
Graham N. Robinson (53) Senior Vice President & President, Stanley Industrial since April 2020. President, Honeywell Industrial Safety (Honeywell International) (2018); President, Honeywell Sensing and Internet of Things (Honeywell International) (2016); Chief Marketing Officer and Vice President, Global Strategy & Marketing, Automation and Control Solutions (Honeywell International) (2014).
4/17/2020
Stephen Subasic (53) Senior Vice President, Chief Human Resources Officer since January 2021. Vice President, Human Resources & Corporate Talent Management (2019); Vice President, Human Resources, Global Tools & Storage (2015); Vice President, Human Resources, Construction & DIY (2011).
2/18/2021
55
ITEM 11. EXECUTIVE COMPENSATION
The information required by this Item is incorporated herein by reference to the information set forth under the sections entitled "Compensation Discussion & Analysis" and “2021 Executive Compensation” of the Company’s definitive proxy statement, which will be filed pursuant to Regulation 14A under the Exchange Act within 120 days after the end of the fiscal year covered by this Annual Report on Form 10-K.
ITEM 12. SECURITY OWNERSHIP OF CERTAIN BENEFICIAL OWNERS AND MANAGEMENT AND RELATED STOCKHOLDER MATTERS
The information required by Item 403 of Regulation S-K is incorporated herein by reference to the information set forth under the sections entitled "Security Ownership of Certain Beneficial Owners," "Security Ownership of Directors and Officers," "Compensation Discussion & Analysis" and “2021 Executive Compensation” of the Company’s definitive proxy statement, which will be filed pursuant to Regulation 14A under the Exchange Act within 120 days after the end of the fiscal year covered by this Annual Report on Form 10-K.
EQUITY COMPENSATION PLAN INFORMATION
Compensation plans under which the Company’s equity securities are authorized for issuance at January 1, 2022 follow:
(A) (B) (C)
Plan Category
Number of securities to be
issued upon exercise ofoutstanding options and
stock awards
Weighted-average exercise
price of outstanding options
Number of securitiesremaining available for
future issuance under equitycompensation plans(excluding securities
reflected in column (A))
Equity compensation plans approved by security holders .................................................................... 7,561,496 (1) $ 151.46 (2) 6,648,660 (3)
Equity compensation plans not approved by security holders (4)
................................................... — — —
Total ........................................................................ 7,561,496 $ 151.46 6,648,660
(1) Consists of 5,573,672 shares underlying outstanding stock options (whether vested or unvested) with a weighted-average exercise price of $151.46 and a weighted-average term of 7.04 years; 1,877,887 shares underlying time-vesting restricted stock units that have not yet vested and the maximum number of shares that will be issued pursuant to outstanding performance awards if all established goals are met; and 109,937 of shares earned but related to which participants elected deferral of delivery. All stock-based compensation plans are discussed in Note J, Capital Stock, of the Notes to Consolidated Financial Statements in Item 8.
(2) There is no cost to the recipient for shares issued pursuant to time-vesting restricted stock units or performance awards. Because there is no strike price applicable to these stock awards they are excluded from the weighted-average exercise price which pertains solely to outstanding stock options.
(3) Consists of 1,388,655 of shares available for purchase under the employee stock purchase plan ("ESPP") at the election of employees and 5,260,005 securities available for future grants by the Board of Directors under stock-based compensation plans. On January 22, 2018, the Board of Directors adopted the 2018 Omnibus Award Plan (the "2018 Plan") and authorized the issuance of 16,750,000 shares of the Company's common stock in connection with the awards pursuant to the 2018 Plan. No further awards will be issued under the Company's 2013 Long-Term Incentive Plan.
(4) U.S. non-highly compensated employees are eligible to contribute from 1% to 25% of their salary to a qualified tax deferred savings plan as described in the Employee Stock Ownership Plan ("ESOP") section of Note L, Employee Benefit Plans, of the Notes to the Consolidated Financial Statements in Item 8. The Company contributes an amount equal to one half of the employee contribution up to the first 7% of salary. There is a non-qualified tax deferred savings plan for highly compensated salaried employees which mirrors certain qualified plan provisions, but was not specifically approved by security holders. Eligible highly compensated salaried U.S. employees are eligible to contribute from 1% to 50% of their salary to the non-qualified tax deferred savings plan. The same matching arrangement was provided for highly compensated salaried employees in the non-qualified plan, to the extent the match was not fully met in the qualified plan, except that the arrangement for these employees is outside of the ESOP, and is not funded in advance of distributions. Effective January 1, 2019, the Company, at its discretion, will determine whether matching and core contributions will be made for the non-qualified tax deferred savings plan for a particular year. If the Company decides to make matching contributions for a year, it will make contributions, in an amount determined at its discretion, that may constitute part or all of or more than the matching contributions that would have been made pursuant to the provisions of the Stanley Black & Decker Supplemental Retirement Account Plan that were
56

in effect prior to 2019. For both qualified and non-qualified plans, the investment of the employee’s contribution and the Company’s matching contribution is controlled by the employee and may include an election to invest in Company stock. Shares of the Company’s common stock may be issued at the time of a distribution from the qualified plan. The number of securities remaining available for issuance under the plans at January 1, 2022 is not determinable, since the plans do not authorize a maximum number of securities.
57
ITEM 13. CERTAIN RELATIONSHIPS AND RELATED TRANSACTIONS, AND DIRECTOR INDEPENDENCE
The information required by Items 404 and 407(a) of Regulation S-K is incorporated by reference to the information set forth under the sections entitled "Corporate Governance," "Director Independence" and "Related Person Transactions" of the Company’s definitive proxy statement, which will be filed pursuant to Regulation 14A under the Exchange Act within 120 days after the end of the fiscal year covered by this Annual Report on Form 10-K.
ITEM 14. PRINCIPAL ACCOUNTANT FEES AND SERVICES
The information required by Item 9(e) of Schedule 14A is incorporated herein by reference to the information set forth under the section entitled “Fees of Independent Auditors” of the Company’s definitive proxy statement, which will be filed pursuant to Regulation 14A under the Exchange Act within 120 days after the end of the fiscal year covered by this Annual Report on Form 10-K.
PART IV
ITEM 15. EXHIBITS AND FINANCIAL STATEMENT SCHEDULE
(a) Index to documents filed as part of this report:
1. and 2. Financial Statements and Financial Statement Schedule.
The response to this portion of Item 15 is submitted as a separate section of this report beginning with an index thereto on page 59.
3. Exhibits
See Exhibit Index in this Form 10-K on page 128.
(b) See Exhibit Index in this Form 10-K on page 128.
(c) The response in this portion of Item 15 is submitted as a separate section of this Form 10-K with an index thereto beginning on page 59.
58
FORM 10-KITEM 15(a) (1) AND (2)STANLEY BLACK & DECKER, INC. AND SUBSIDIARIES
INDEX TO FINANCIAL STATEMENTS AND FINANCIAL STATEMENT SCHEDULE
Schedule II — Valuation and Qualifying Accounts is included in Item 15 (page 62).Management’s Report on Internal Control Over Financial Reporting (page 63).Report of Independent Registered Public Accounting Firm (PCAOB ID: 00042) — Financial Statement Opinion (page 64).Report of Independent Registered Public Accounting Firm — Internal Control Opinion (page 67).Consolidated Statements of Operations — fiscal years ended January 1, 2022, January 2, 2021, and December 28, 2019 (page 69).Consolidated Statements of Comprehensive Income — fiscal years ended January 1, 2022, January 2, 2021, and December 28, 2019 (page 70).Consolidated Balance Sheets — January 1, 2022 and January 2, 2021 (page 71).Consolidated Statements of Cash Flows — fiscal years ended January 1, 2022, January 2, 2021, and December 28, 2019 (page 72).Consolidated Statements of Changes in Shareowners’ Equity — fiscal years ended January 1, 2022, January 2, 2021, and December 28, 2019 (page 74).Notes to Consolidated Financial Statements (page 75).Selected Quarterly Financial Data (Unaudited) (page 126).Consent of Independent Registered Public Accounting Firm (Exhibit 23).
All other schedules are omitted because either they are not applicable or the required information is shown in the financial statements or the notes thereto.
59

ITEM 16. FORM 10-K SUMMARY
Not applicable.
60
SIGNATURES
Pursuant to the requirements of Section 13 or 15(d) of the Securities Exchange Act of 1934, the Company has duly caused this report to be signed on its behalf by the undersigned, thereunto duly authorized.STANLEY BLACK & DECKER, INC.
By: /s/ James M. Loree
James M. Loree, Chief Executive Officer
Date: February 22, 2022
Pursuant to the requirements of the Securities Exchange Act of 1934, this report has been signed below by the following persons on behalf of the Company and in the capacities and on the dates indicated.
Signature Title Date
/s/ James M. Loree Chief Executive Officer February 22, 2022 James M. Loree
/s/ Donald Allan, Jr. President and Chief Financial Officer February 22, 2022 Donald Allan, Jr.
/s/ Jocelyn S. Belisle Vice President and Chief Accounting Officer February 22, 2022 Jocelyn S. Belisle
* Director February 22, 2022Andrea J. Ayers
* Director February 22, 2022 George W. Buckley
* Director February 22, 2022 Patrick D. Campbell
* Director February 22, 2022 Carlos M. Cardoso
* Director February 22, 2022 Robert B. Coutts
* Director February 22, 2022Debra A. Crew
* Director February 22, 2022 Michael D. Hankin
* Director February 22, 2022Jane M. Palmieri
* Director February 22, 2022Mojdeh Poul
* Director February 22, 2022Irving Tan
*By: /s/ Janet M. Link Janet M. Link(As Attorney-in-Fact)
61
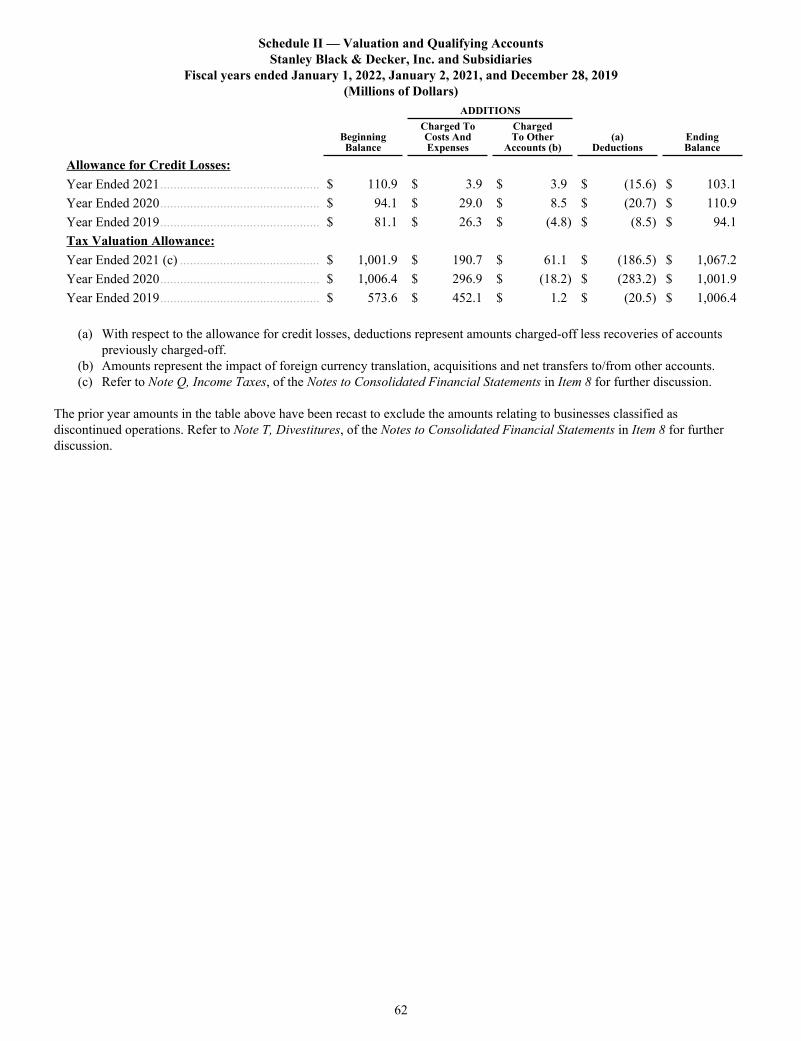
Schedule II — Valuation and Qualifying AccountsStanley Black & Decker, Inc. and Subsidiaries
Fiscal years ended January 1, 2022, January 2, 2021, and December 28, 2019 (Millions of Dollars)
ADDITIONS
BeginningBalance
Charged ToCosts AndExpenses
ChargedTo Other
Accounts (b)(a)
DeductionsEndingBalance
Allowance for Credit Losses:Year Ended 2021 ................................................ $ 110.9 $ 3.9 $ 3.9 $ (15.6) $ 103.1 Year Ended 2020 ................................................ $ 94.1 $ 29.0 $ 8.5 $ (20.7) $ 110.9 Year Ended 2019 ................................................ $ 81.1 $ 26.3 $ (4.8) $ (8.5) $ 94.1 Tax Valuation Allowance:Year Ended 2021 (c) .......................................... $ 1,001.9 $ 190.7 $ 61.1 $ (186.5) $ 1,067.2 Year Ended 2020 ................................................ $ 1,006.4 $ 296.9 $ (18.2) $ (283.2) $ 1,001.9 Year Ended 2019 ................................................ $ 573.6 $ 452.1 $ 1.2 $ (20.5) $ 1,006.4
(a) With respect to the allowance for credit losses, deductions represent amounts charged-off less recoveries of accounts
previously charged-off.(b) Amounts represent the impact of foreign currency translation, acquisitions and net transfers to/from other accounts.(c) Refer to Note Q, Income Taxes, of the Notes to Consolidated Financial Statements in Item 8 for further discussion.
The prior year amounts in the table above have been recast to exclude the amounts relating to businesses classified as discontinued operations. Refer to Note T, Divestitures, of the Notes to Consolidated Financial Statements in Item 8 for further discussion.
62
MANAGEMENT’S REPORT ON INTERNAL CONTROL OVER FINANCIAL REPORTING
The management of Stanley Black & Decker, Inc. is responsible for establishing and maintaining adequate internal control over financial reporting. Internal control over financial reporting is a process designed to provide reasonable assurance regarding the reliability of financial reporting and the preparation of financial statements for external reporting purposes in accordance with accounting principles generally accepted in the United States of America. Because of its inherent limitations, internal control over financial reporting may not prevent or detect misstatements.
During the fourth quarter of 2021, the Company acquired the remaining 80 percent ownership stake in MTD Holdings Inc. ("MTD") and Excel Industries ("Excel") for approximately $1.5 billion and $374 million, respectfully. Since Stanley Black & Decker, Inc. has not yet fully incorporated the internal controls and procedures of MTD and Excel into Stanley Black & Decker, Inc.'s internal control over financial reporting, management excluded these businesses from its assessment of the effectiveness of internal control over financial reporting as of January 1, 2022. MTD accounted for 5% of Stanley Black & Decker, Inc.'s total assets as of January 1, 2022 and 1% of Stanley Black & Decker, Inc.'s net sales for the year then ended. Excel accounted for less than 1% of Stanley Black & Decker, Inc.'s total assets as of January 1, 2022 and less than 1% of Stanley Black & Decker, Inc.'s net sales for the year then ended.
Management has assessed the effectiveness of Stanley Black & Decker, Inc.’s internal control over financial reporting as of January 1, 2022. In making its assessment, management has utilized the criteria set forth by the Committee of Sponsoring Organizations (COSO) of the Treadway Commission in Internal Control — Integrated Framework (2013 Framework). Management concluded that based on its assessment, and the existence of material weaknesses related to the accounting for equity units issued in May 2017 and November 2019, Stanley Black & Decker, Inc.’s internal control over financial reporting was not effective as of January 1, 2022. Ernst & Young LLP, Registered Public Accounting Firm included in this annual report, has issued an attestation report on the registrant’s internal control over financial reporting, a copy of which appears on page 67.
/s/ James M. LoreeJames M. Loree, Chief Executive Officer
/s/ Donald Allan, Jr.Donald Allan, Jr., President and Chief Financial Officer
63
Report of Independent Registered Public Accounting Firm
To the Shareowners and Board of Directors of Stanley Black & Decker, Inc.
Opinion on the Financial Statements
We have audited the accompanying consolidated balance sheets of Stanley Black & Decker, Inc. (the Company) as of January 1, 2022 and January 2, 2021, the related consolidated statements of operations, comprehensive income, shareowners’ equity and cash flows for each of the three years in the period ended January 1, 2022, and the related notes and the financial statement schedule listed in the Index at Item 15(a) (collectively referred to as the “consolidated financial statements”). In our opinion, the consolidated financial statements present fairly, in all material respects, the financial position of the Company at January 1, 2022 and January 2, 2021, and the results of its operations and its cash flows for each of the three years in the period ended January 1, 2022, in conformity with U.S. generally accepted accounting principles.
We also have audited, in accordance with the standards of the Public Company Accounting Oversight Board (United States) (PCAOB), the Company’s internal control over financial reporting as of January 1, 2022, based on criteria established in Internal Control-Integrated Framework issued by the Committee of Sponsoring Organizations of the Treadway Commission (2013 framework) and our report dated February 22, 2022 expressed an adverse opinion thereon.
Basis for Opinion
These financial statements are the responsibility of the Company's management. Our responsibility is to express an opinion on the Company’s financial statements based on our audits. We are a public accounting firm registered with the PCAOB and are required to be independent with respect to the Company in accordance with the U.S. federal securities laws and the applicable rules and regulations of the Securities and Exchange Commission and the PCAOB.
We conducted our audits in accordance with the standards of the PCAOB. Those standards require that we plan and perform the audit to obtain reasonable assurance about whether the financial statements are free of material misstatement, whether due to error or fraud. Our audits included performing procedures to assess the risks of material misstatement of the financial statements, whether due to error or fraud, and performing procedures that respond to those risks. Such procedures included examining, on a test basis, evidence regarding the amounts and disclosures in the financial statements. Our audits also included evaluating the accounting principles used and significant estimates made by management, as well as evaluating the overall presentation of the financial statements. We believe that our audits provide a reasonable basis for our opinion.
Critical Audit Matters
The critical audit matters communicated below are matters arising from the current period audit of the financial statements that were communicated or required to be communicated to the audit committee and that: (1) relate to accounts or disclosures that are material to the financial statements and (2) involved our especially challenging, subjective or complex judgments. The communication of critical audit matters does not alter in any way our opinion on the consolidated financial statements, taken as a whole, and we are not, by communicating the critical audit matters below, providing separate opinions on the critical audit matters or on the accounts or disclosures to which they relate.
Accounting for Acquisition of MTD Holdings, Inc.Description of the Matter
As discussed in Note E of the consolidated financial statements, the Company acquired the remaining 80 percent ownership stake of MTD Holdings, Inc., on December 1, 2021 for a total purchase price of approximately $1.5 billion, net of cash acquired. The Company previously acquired a 20 percent interest in MTD in January 2019 for $234 million. The Company allocated the purchase price, on a preliminary basis, to the assets acquired and liabilities assumed based on their respective fair values, which included identified intangible assets of $840 million.
Auditing the Company's accounting for the acquired intangible assets involved subjective auditor judgment due to the significant estimation required in management’s determination of the fair value of customer relationships and certain tradenames. The significant estimation was primarily due to the sensitivity of the significant assumptions in determining fair value, including discount rates, projected revenue growth rates and profit margins. These assumptions related to the future performance of the acquired business, are forward-looking and could be affected by future economic and market conditions.
64
How We Addressed the Matter in Our Audit
We obtained an understanding, evaluated the design and tested the operating effectiveness of the controls over the Company’s accounting for business combinations. Our audit procedures included, among other procedures, testing controls over the valuation of customer relationships, including the valuation models and underlying assumptions used to develop such estimates.
To test the estimated fair value of the customer relationships and certain tradenames, we performed audit procedures that included, among other procedures, evaluating the appropriateness of the valuation methodologies and testing the significant assumptions used in the model, as described above, including the completeness and accuracy of the underlying data. We compared the significant assumptions to current industry, market and economic trends, to the historical results of the acquired business and to other guideline companies within the same industry. We performed sensitivity analyses to evaluate the change in the fair value of the customer relationships and certain tradenames that would result from changes in the discount rates, projected revenue growth rates and profit margins. We involved our internal valuation specialists to assist with our evaluation of the methodology used by the Company as well as certain assumptions within the valuation.Annual Test of Impairment of Goodwill in the Infrastructure Reporting Unit
Description of the Matter
At January 1, 2022, the Company’s goodwill balance was approximately $8,784 million. As discussed in Note A of the consolidated financial statements, goodwill is not amortized but rather is tested for impairment at least annually at the reporting unit level. The Company’s goodwill is initially assigned to its reporting units as of the relevant acquisition date.
Auditing management’s annual goodwill impairment test for the Infrastructure reporting unit was challenging and highly judgmental due to the significant estimation required to determine the estimated fair value of the reporting unit. In particular, the fair value estimate was sensitive to the significant assumption of revenue growth, which is affected by expected future market or economic conditions.
How We Addressed the Matter in Our Audit
We obtained an understanding, evaluated the design and tested the operating effectiveness of controls over the determination of fair value, including the significant assumption of revenue growth discussed above, used in the Infrastructure goodwill impairment analysis. Our audit procedures included, among other procedures, testing controls over the Company’s budgetary process and management’s review of that information.
To test the estimated fair value of the Infrastructure reporting unit, we performed audit procedures that included, among other procedures, assessing the Company’s methodologies and testing the revenue growth assumption discussed above and the underlying data used by the Company in its analysis. We compared the revenue growth rates used by management to current industry and economic trends, including, among other factors, the price of oil and scrap metal, and considering the Company’s business model, customer base, product mix and other relevant factors. We assessed the historical accuracy of management’s estimates and performed sensitivity analyses to evaluate the change in the fair value of the reporting unit that would result from changes in the revenue growth assumption. In addition, we evaluated the reconciliation of the combined estimated fair value of the Company’s reporting units to the market capitalization of the Company and assessed the resulting control premium. Further, we involved our internal valuation specialists to assist in the evaluation of the methodology and certain assumptions used to estimate the fair value of the Infrastructure reporting unit.
Uncertain Tax Positions
65
Description of the Matter
At January 1, 2022, the Company had recorded a liability for uncertain tax positions of approximately $488 million. As discussed in Notes A and Q of the consolidated financial statements, the Company conducts business globally and, as a result, is subject to income tax in a number of locations, including many state and foreign jurisdictions. Uncertainty in a tax position may arise as tax laws are subject to interpretation. The Company uses significant judgment in (1) determining whether a tax position’s technical merits are more likely than not to be sustained and (2) measuring the amount of tax benefit that qualifies for recognition. The Company considers many factors when evaluating and estimating its tax positions such as, but not limited to, the settlements of on-going audits.
Auditing the completeness of the uncertain tax reserves is challenging and subjective due to the Company’s global operations, the many tax jurisdictions in which it operates, the distinctive nature and unique facts and circumstances of each tax position and the interpretations of tax law and legal rulings.
How We Addressed the Matter in Our Audit
We identified and tested controls around the Company’s judgments and determinations on tax positions, including the Company’s process to verify that all uncertain tax positions are identified and considered as part of the analysis and controls addressing completeness of the uncertain tax positions.
With the support of our tax professionals, we performed an evaluation of the Company’s estimates with respect to uncertain tax positions including the technical merits of the Company’s tax positions. This included assessing the Company’s analysis of jurisdictions with potential tax liabilities and other international tax considerations. We considered the Company’s judgments and the factors involved with each significant tax position. To support our evaluation, we used our knowledge of, and experience with, the application of international and local income tax laws by the relevant income tax authorities to evaluate the Company’s accounting for those tax positions. We analyzed the Company’s assumptions and data used to determine the amount of tax benefit to recognize and tested the completeness and accuracy of the data used to determine the amount of tax benefits recognized and tested the accuracy of such calculations. We also evaluated the Company’s income tax disclosures included in Note Q to the consolidated financial statements in relation to these matters.
/s/ Ernst & Young LLP
We have served as the Company’s auditor since 1932.Hartford, ConnecticutFebruary 22, 2022
66
Report of Independent Registered Public Accounting Firm
To the Shareowners and the Board of Directors of Stanley Black & Decker, Inc.
Opinion on Internal Control over Financial Reporting
We have audited Stanley Black & Decker, Inc.’s internal control over financial reporting as of January 1, 2022, based on criteria established in Internal Control—Integrated Framework issued by the Committee of Sponsoring Organizations of the Treadway Commission (2013 framework) (the COSO criteria). In our opinion, because of the effect of the material weaknesses described below on the achievement of the objectives of the control criteria, Stanley Black & Decker, Inc. (the Company) has not maintained effective internal control over financial reporting as of January 1, 2022, based on the COSO criteria.
A material weakness is a deficiency, or combination of deficiencies, in internal control over financial reporting, such that there is a reasonable possibility that a material misstatement of the company’s annual or interim financial statements will not be prevented or detected on a timely basis. The following material weaknesses have been identified and included in management’s assessment. Management has identified material weaknesses in controls related to (1) the design of its control to consider financial instruments with debt- and equity-like features in the calculation of earnings per share and (2) the design of its control to consider all the relevant authoritative accounting guidance for financial instruments with debt- and equity-like features.
As indicated in the accompanying Management’s Report on Internal Control over Financial Reporting, management’s assessment of and conclusion on the effectiveness of internal control over financial reporting did not include the internal controls of MTD Holdings, Inc. or Excel Industries, which are included in the 2021 consolidated financial statements of the Company and constituted 5% and less than 1% of total and net assets, respectively, as of January 1, 2022 and 1% and less than 1% of net sales, respectively, for the year then ended. Our audit of internal control over financial reporting of the Company also did not include an evaluation of the internal control over financial reporting of MTD Holdings, Inc. or Excel Industries.
We also have audited, in accordance with the standards of the Public Company Accounting Oversight Board (United States) (PCAOB), the consolidated balance sheets of the Company as of January 1, 2022 and January 2, 2021, related consolidated statements of comprehensive income, shareowners’ equity and cash flows for each of the three years in the period ended January 1, 2022, and the related notes and schedule listed in the Index at Item 15(a). The material weaknesses were considered in determining the nature, timing and extent of audit tests applied in our audit of the 2021 consolidated financial statements, and this report does not affect our report dated February 22, 2022, which expressed an unqualified opinion thereon.
Basis for Opinion
The Company’s management is responsible for maintaining effective internal control over financial reporting and for its assessment of the effectiveness of internal control over financial reporting included in the accompanying Management’s Report on Internal Control over Financial Reporting. Our responsibility is to express an opinion on the Company’s internal control over financial reporting based on our audit. We are a public accounting firm registered with the PCAOB and are required to be independent with respect to the Company in accordance with the U.S. federal securities laws and the applicable rules and regulations of the Securities and Exchange Commission and the PCAOB.
We conducted our audit in accordance with the standards of the PCAOB. Those standards require that we plan and perform the audit to obtain reasonable assurance about whether effective internal control over financial reporting was maintained in all material respects.
Our audit included obtaining an understanding of internal control over financial reporting, assessing the risk that a material weakness exists, testing and evaluating the design and operating effectiveness of internal control based on the assessed risk, and performing such other procedures as we considered necessary in the circumstances. We believe that our audit provides a reasonable basis for our opinion.
Definition and Limitations of Internal Control Over Financial Reporting
A company’s internal control over financial reporting is a process designed to provide reasonable assurance regarding the reliability of financial reporting and the preparation of financial statements for external purposes in accordance with generally accepted accounting principles. A company’s internal control over financial reporting includes those policies and procedures that (1) pertain to the maintenance of records that, in reasonable detail, accurately and fairly reflect the transactions and dispositions of the assets of the company; (2) provide reasonable assurance that transactions are recorded as necessary to permit preparation of financial statements in accordance with generally accepted accounting principles, and that receipts and expenditures of the company are being made only in accordance with authorizations of management and directors of the company; and (3) provide reasonable assurance regarding prevention or timely detection of unauthorized acquisition, use, or disposition of the company’s assets that could have a material effect on the financial statements.
67

Because of its inherent limitations, internal control over financial reporting may not prevent or detect misstatements. Also, projections of any evaluation of effectiveness to future periods are subject to the risk that controls may become inadequate because of changes in conditions, or that the degree of compliance with the policies or procedures may deteriorate.
/s/ Ernst & Young LLPHartford, ConnecticutFebruary 22, 2022
68
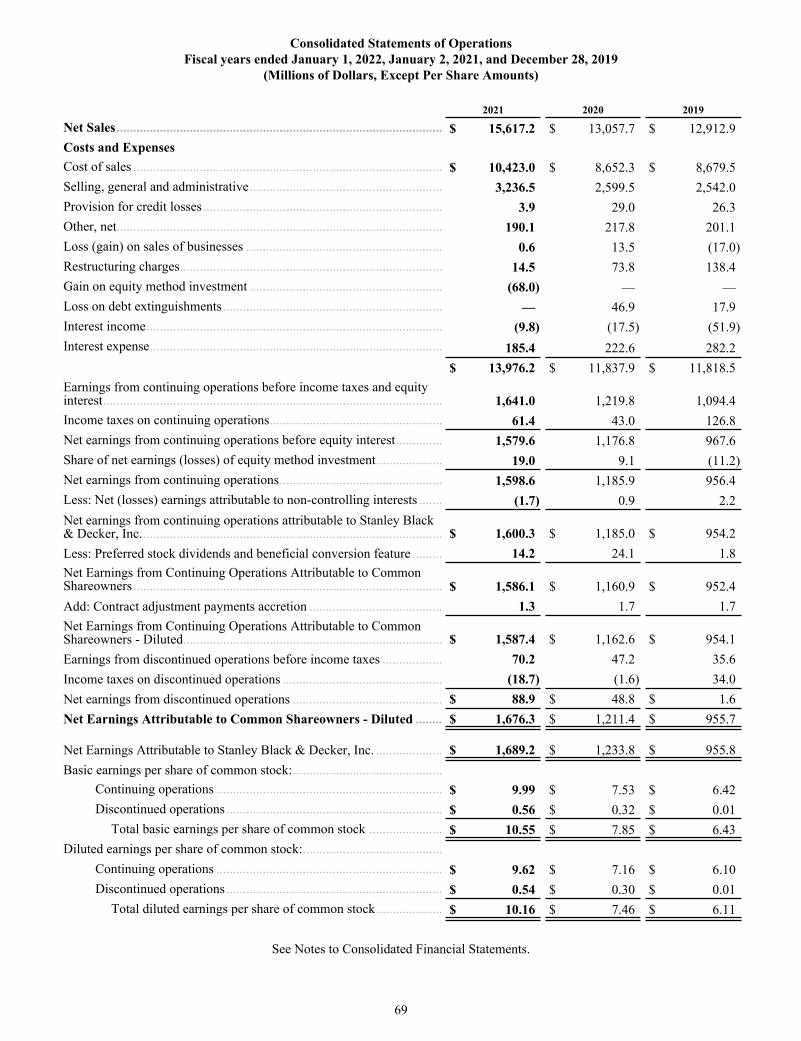
Consolidated Statements of OperationsFiscal years ended January 1, 2022, January 2, 2021, and December 28, 2019
(Millions of Dollars, Except Per Share Amounts)
2021 2020 2019
Net Sales .................................................................................................. $ 15,617.2 $ 13,057.7 $ 12,912.9 Costs and ExpensesCost of sales ............................................................................................. $ 10,423.0 $ 8,652.3 $ 8,679.5 Selling, general and administrative .......................................................... 3,236.5 2,599.5 2,542.0 Provision for credit losses ........................................................................ 3.9 29.0 26.3 Other, net .................................................................................................. 190.1 217.8 201.1 Loss (gain) on sales of businesses ........................................................... 0.6 13.5 (17.0) Restructuring charges ............................................................................... 14.5 73.8 138.4 Gain on equity method investment .......................................................... (68.0) — — Loss on debt extinguishments .................................................................. — 46.9 17.9 Interest income ......................................................................................... (9.8) (17.5) (51.9) Interest expense ........................................................................................ 185.4 222.6 282.2
$ 13,976.2 $ 11,837.9 $ 11,818.5 Earnings from continuing operations before income taxes and equity interest ...................................................................................................... 1,641.0 1,219.8 1,094.4 Income taxes on continuing operations .................................................... 61.4 43.0 126.8 Net earnings from continuing operations before equity interest .............. 1,579.6 1,176.8 967.6 Share of net earnings (losses) of equity method investment .................... 19.0 9.1 (11.2) Net earnings from continuing operations ................................................. 1,598.6 1,185.9 956.4 Less: Net (losses) earnings attributable to non-controlling interests ....... (1.7) 0.9 2.2 Net earnings from continuing operations attributable to Stanley Black & Decker, Inc. .......................................................................................... $ 1,600.3 $ 1,185.0 $ 954.2 Less: Preferred stock dividends and beneficial conversion feature ......... 14.2 24.1 1.8 Net Earnings from Continuing Operations Attributable to Common Shareowners ............................................................................................. $ 1,586.1 $ 1,160.9 $ 952.4 Add: Contract adjustment payments accretion ........................................ 1.3 1.7 1.7 Net Earnings from Continuing Operations Attributable to Common Shareowners - Diluted .............................................................................. $ 1,587.4 $ 1,162.6 $ 954.1 Earnings from discontinued operations before income taxes .................. 70.2 47.2 35.6 Income taxes on discontinued operations ................................................ (18.7) (1.6) 34.0 Net earnings from discontinued operations ............................................. $ 88.9 $ 48.8 $ 1.6 Net Earnings Attributable to Common Shareowners - Diluted ........ $ 1,676.3 $ 1,211.4 $ 955.7
Net Earnings Attributable to Stanley Black & Decker, Inc. .................... $ 1,689.2 $ 1,233.8 $ 955.8 Basic earnings per share of common stock: .............................................
Continuing operations .................................................................... $ 9.99 $ 7.53 $ 6.42 Discontinued operations ................................................................. $ 0.56 $ 0.32 $ 0.01
Total basic earnings per share of common stock ...................... $ 10.55 $ 7.85 $ 6.43 Diluted earnings per share of common stock: ..........................................
Continuing operations .................................................................... $ 9.62 $ 7.16 $ 6.10 Discontinued operations ................................................................. $ 0.54 $ 0.30 $ 0.01
Total diluted earnings per share of common stock .................... $ 10.16 $ 7.46 $ 6.11
See Notes to Consolidated Financial Statements.
69
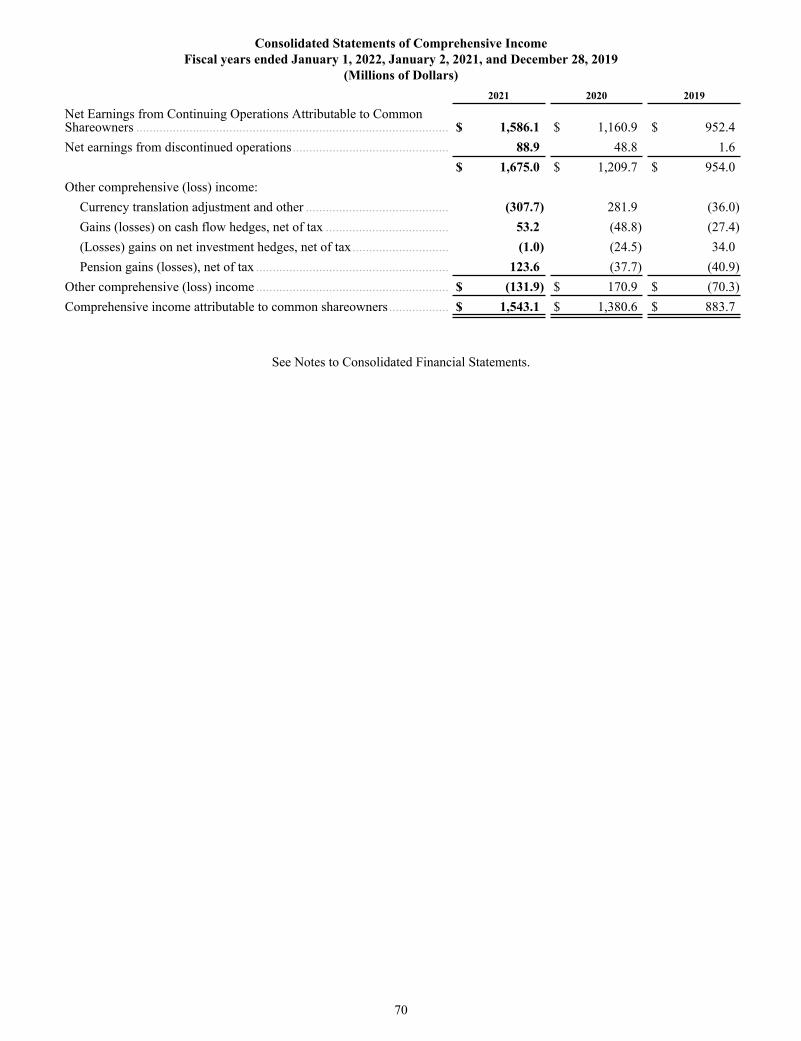
Consolidated Statements of Comprehensive IncomeFiscal years ended January 1, 2022, January 2, 2021, and December 28, 2019
(Millions of Dollars)2021 2020 2019
Net Earnings from Continuing Operations Attributable to Common Shareowners .............................................................................................. $ 1,586.1 $ 1,160.9 $ 952.4 Net earnings from discontinued operations ............................................... 88.9 48.8 1.6
$ 1,675.0 $ 1,209.7 $ 954.0 Other comprehensive (loss) income:
Currency translation adjustment and other ........................................... (307.7) 281.9 (36.0) Gains (losses) on cash flow hedges, net of tax ..................................... 53.2 (48.8) (27.4) (Losses) gains on net investment hedges, net of tax ............................. (1.0) (24.5) 34.0 Pension gains (losses), net of tax .......................................................... 123.6 (37.7) (40.9)
Other comprehensive (loss) income .......................................................... $ (131.9) $ 170.9 $ (70.3) Comprehensive income attributable to common shareowners .................. $ 1,543.1 $ 1,380.6 $ 883.7
See Notes to Consolidated Financial Statements.
70
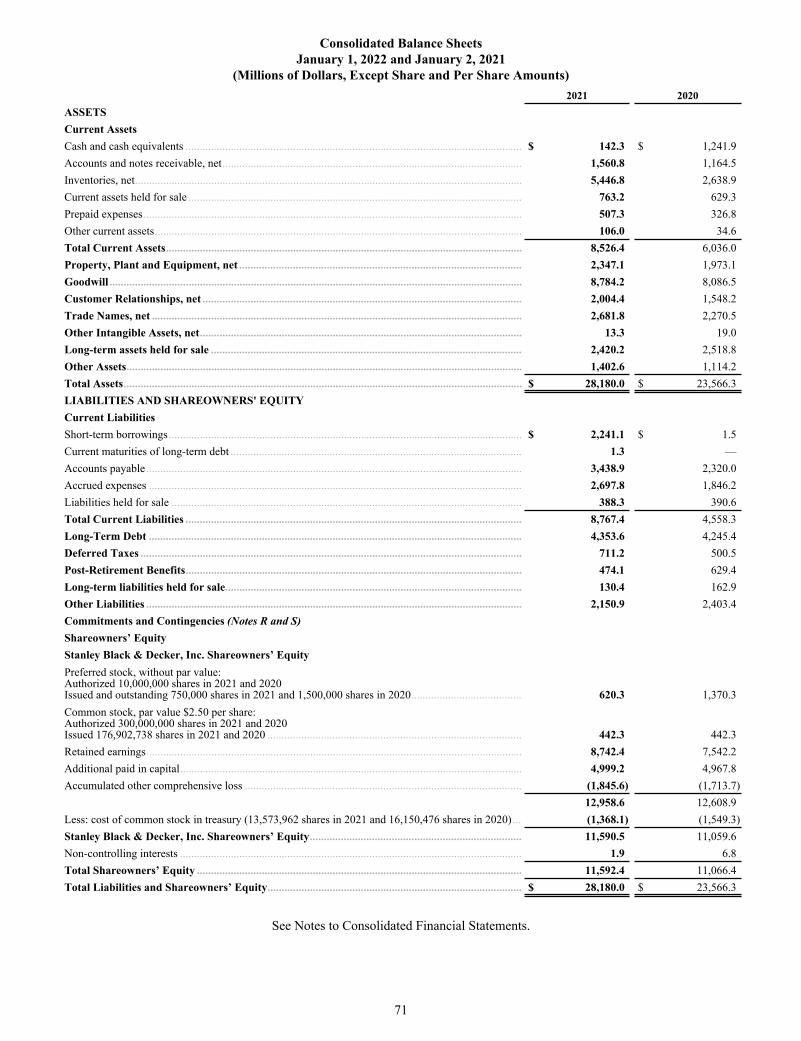
Consolidated Balance SheetsJanuary 1, 2022 and January 2, 2021
(Millions of Dollars, Except Share and Per Share Amounts)2021 2020
ASSETSCurrent AssetsCash and cash equivalents ....................................................................................................................... $ 142.3 $ 1,241.9 Accounts and notes receivable, net .......................................................................................................... 1,560.8 1,164.5 Inventories, net ......................................................................................................................................... 5,446.8 2,638.9 Current assets held for sale ...................................................................................................................... 763.2 629.3 Prepaid expenses ...................................................................................................................................... 507.3 326.8 Other current assets .................................................................................................................................. 106.0 34.6 Total Current Assets .............................................................................................................................. 8,526.4 6,036.0 Property, Plant and Equipment, net .................................................................................................... 2,347.1 1,973.1 Goodwill .................................................................................................................................................. 8,784.2 8,086.5 Customer Relationships, net ................................................................................................................. 2,004.4 1,548.2 Trade Names, net ................................................................................................................................... 2,681.8 2,270.5 Other Intangible Assets, net .................................................................................................................. 13.3 19.0 Long-term assets held for sale .............................................................................................................. 2,420.2 2,518.8 Other Assets ............................................................................................................................................ 1,402.6 1,114.2 Total Assets ............................................................................................................................................. $ 28,180.0 $ 23,566.3 LIABILITIES AND SHAREOWNERS' EQUITYCurrent LiabilitiesShort-term borrowings ............................................................................................................................. $ 2,241.1 $ 1.5 Current maturities of long-term debt ....................................................................................................... 1.3 — Accounts payable ..................................................................................................................................... 3,438.9 2,320.0 Accrued expenses .................................................................................................................................... 2,697.8 1,846.2 Liabilities held for sale ............................................................................................................................ 388.3 390.6 Total Current Liabilities ....................................................................................................................... 8,767.4 4,558.3 Long-Term Debt .................................................................................................................................... 4,353.6 4,245.4 Deferred Taxes ....................................................................................................................................... 711.2 500.5 Post-Retirement Benefits ....................................................................................................................... 474.1 629.4 Long-term liabilities held for sale ......................................................................................................... 130.4 162.9 Other Liabilities ..................................................................................................................................... 2,150.9 2,403.4 Commitments and Contingencies (Notes R and S)Shareowners’ EquityStanley Black & Decker, Inc. Shareowners’ EquityPreferred stock, without par value:Authorized 10,000,000 shares in 2021 and 2020Issued and outstanding 750,000 shares in 2021 and 1,500,000 shares in 2020 ....................................... 620.3 1,370.3 Common stock, par value $2.50 per share:Authorized 300,000,000 shares in 2021 and 2020Issued 176,902,738 shares in 2021 and 2020 .......................................................................................... 442.3 442.3 Retained earnings ..................................................................................................................................... 8,742.4 7,542.2 Additional paid in capital ......................................................................................................................... 4,999.2 4,967.8 Accumulated other comprehensive loss .................................................................................................. (1,845.6) (1,713.7)
12,958.6 12,608.9 Less: cost of common stock in treasury (13,573,962 shares in 2021 and 16,150,476 shares in 2020) ... (1,368.1) (1,549.3) Stanley Black & Decker, Inc. Shareowners’ Equity ........................................................................... 11,590.5 11,059.6 Non-controlling interests ......................................................................................................................... 1.9 6.8 Total Shareowners’ Equity ................................................................................................................... 11,592.4 11,066.4 Total Liabilities and Shareowners’ Equity .......................................................................................... $ 28,180.0 $ 23,566.3
See Notes to Consolidated Financial Statements.
71
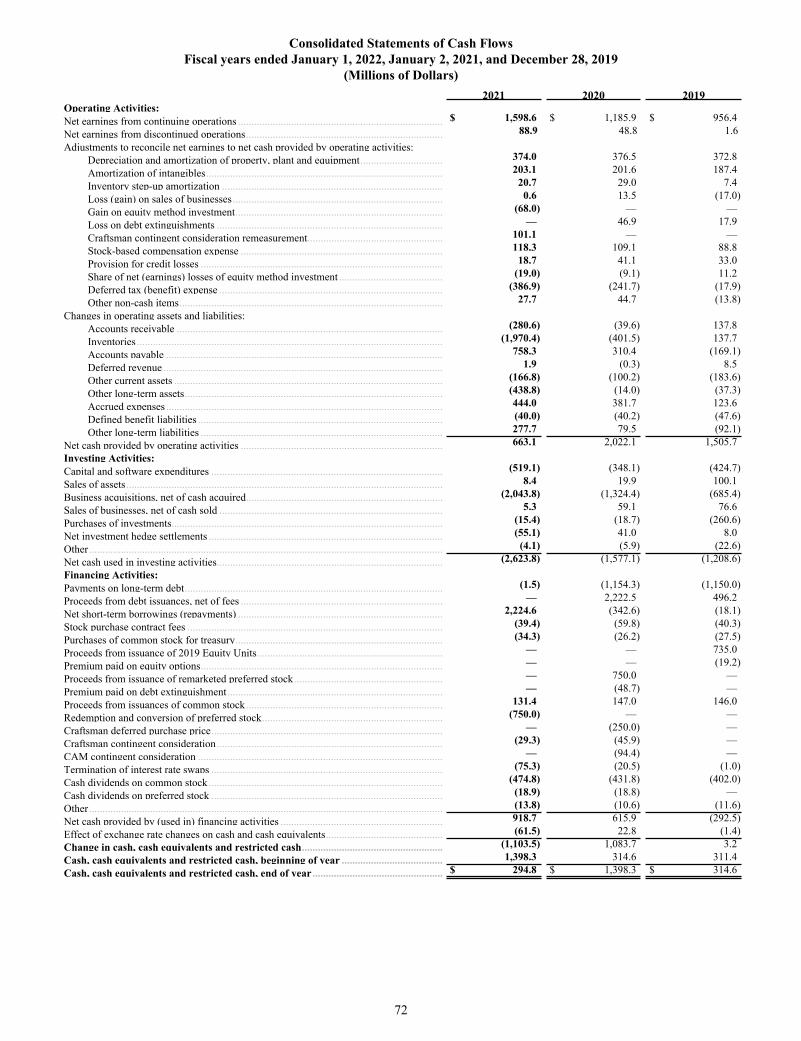
Consolidated Statements of Cash FlowsFiscal years ended January 1, 2022, January 2, 2021, and December 28, 2019
(Millions of Dollars)2021 2020 2019
Operating Activities:Net earnings from continuing operations ............................................................................. $ 1,598.6 $ 1,185.9 $ 956.4 Net earnings from discontinued operations .......................................................................... 88.9 48.8 1.6Adjustments to reconcile net earnings to net cash provided by operating activities:
Depreciation and amortization of property, plant and equipment ............................... 374.0 376.5 372.8 Amortization of intangibles ......................................................................................... 203.1 201.6 187.4 Inventory step-up amortization ................................................................................... 20.7 29.0 7.4 Loss (gain) on sales of businesses ............................................................................... 0.6 13.5 (17.0) Gain on equity method investment .............................................................................. (68.0) — — Loss on debt extinguishments ..................................................................................... — 46.9 17.9 Craftsman contingent consideration remeasurement ................................................... 101.1 — — Stock-based compensation expense ............................................................................ 118.3 109.1 88.8 Provision for credit losses ........................................................................................... 18.7 41.1 33.0 Share of net (earnings) losses of equity method investment ....................................... (19.0) (9.1) 11.2 Deferred tax (benefit) expense .................................................................................... (386.9) (241.7) (17.9) Other non-cash items ................................................................................................... 27.7 44.7 (13.8)
Changes in operating assets and liabilities:Accounts receivable .................................................................................................... (280.6) (39.6) 137.8 Inventories ................................................................................................................... (1,970.4) (401.5) 137.7 Accounts payable ........................................................................................................ 758.3 310.4 (169.1) Deferred revenue ......................................................................................................... 1.9 (0.3) 8.5 Other current assets ..................................................................................................... (166.8) (100.2) (183.6) Other long-term assets ................................................................................................. (438.8) (14.0) (37.3) Accrued expenses ........................................................................................................ 444.0 381.7 123.6 Defined benefit liabilities ............................................................................................ (40.0) (40.2) (47.6) Other long-term liabilities ........................................................................................... 277.7 79.5 (92.1)
Net cash provided by operating activities ............................................................................ 663.1 2,022.1 1,505.7 Investing Activities:Capital and software expenditures ....................................................................................... (519.1) (348.1) (424.7) Sales of assets ....................................................................................................................... 8.4 19.9 100.1 Business acquisitions, net of cash acquired .......................................................................... (2,043.8) (1,324.4) (685.4) Sales of businesses, net of cash sold .................................................................................... 5.3 59.1 76.6 Purchases of investments ...................................................................................................... (15.4) (18.7) (260.6) Net investment hedge settlements ........................................................................................ (55.1) 41.0 8.0 Other ..................................................................................................................................... (4.1) (5.9) (22.6) Net cash used in investing activities ..................................................................................... (2,623.8) (1,577.1) (1,208.6) Financing Activities:Payments on long-term debt ................................................................................................. (1.5) (1,154.3) (1,150.0) Proceeds from debt issuances, net of fees ............................................................................ — 2,222.5 496.2 Net short-term borrowings (repayments) ............................................................................. 2,224.6 (342.6) (18.1) Stock purchase contract fees ................................................................................................ (39.4) (59.8) (40.3) Purchases of common stock for treasury .............................................................................. (34.3) (26.2) (27.5) Proceeds from issuance of 2019 Equity Units ...................................................................... — — 735.0 Premium paid on equity options ........................................................................................... — — (19.2) Proceeds from issuance of remarketed preferred stock ........................................................ — 750.0 — Premium paid on debt extinguishment ................................................................................. — (48.7) — Proceeds from issuances of common stock .......................................................................... 131.4 147.0 146.0 Redemption and conversion of preferred stock .................................................................... (750.0) — — Craftsman deferred purchase price ....................................................................................... — (250.0) — Craftsman contingent consideration ..................................................................................... (29.3) (45.9) — CAM contingent consideration ............................................................................................ — (94.4) — Termination of interest rate swaps ....................................................................................... (75.3) (20.5) (1.0) Cash dividends on common stock ........................................................................................ (474.8) (431.8) (402.0) Cash dividends on preferred stock ....................................................................................... (18.9) (18.8) — Other ..................................................................................................................................... (13.8) (10.6) (11.6) Net cash provided by (used in) financing activities ............................................................. 918.7 615.9 (292.5) Effect of exchange rate changes on cash and cash equivalents ............................................ (61.5) 22.8 (1.4) Change in cash, cash equivalents and restricted cash ..................................................... (1,103.5) 1,083.7 3.2 Cash, cash equivalents and restricted cash, beginning of year ...................................... 1,398.3 314.6 311.4 Cash, cash equivalents and restricted cash, end of year ................................................. $ 294.8 $ 1,398.3 $ 314.6
72
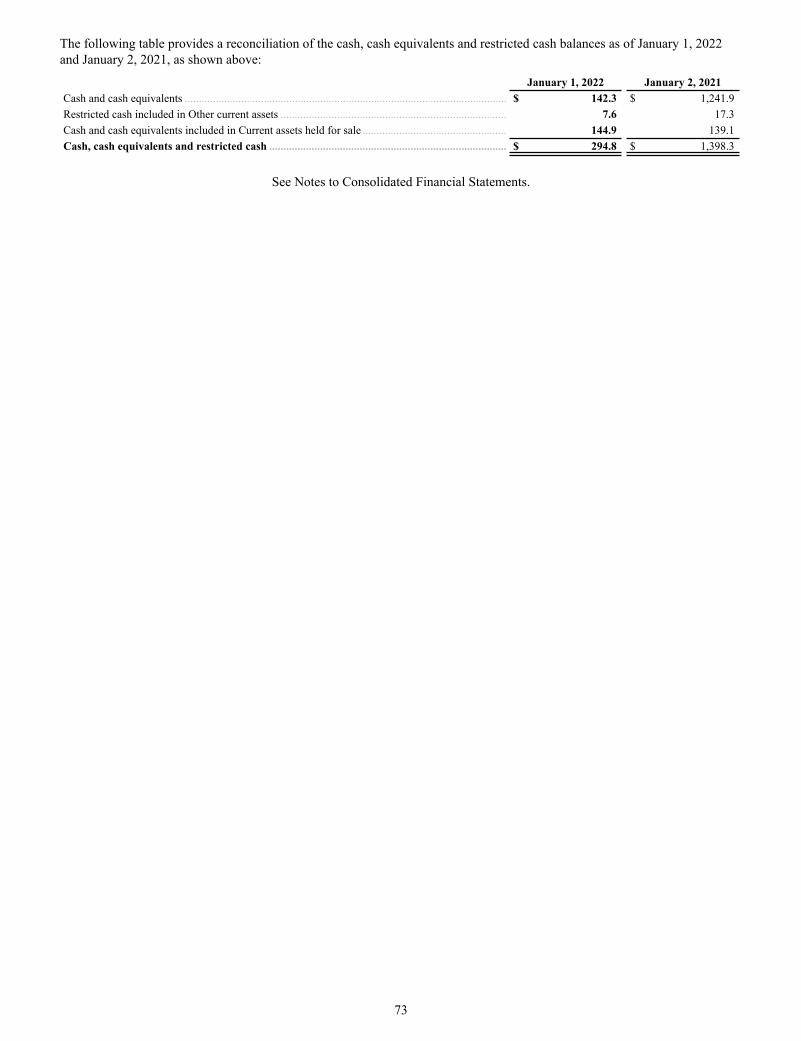
The following table provides a reconciliation of the cash, cash equivalents and restricted cash balances as of January 1, 2022 and January 2, 2021, as shown above:
January 1, 2022 January 2, 2021Cash and cash equivalents .................................................................................................................. $ 142.3 $ 1,241.9 Restricted cash included in Other current assets ................................................................................ 7.6 17.3 Cash and cash equivalents included in Current assets held for sale ................................................... 144.9 139.1 Cash, cash equivalents and restricted cash .................................................................................... $ 294.8 $ 1,398.3
See Notes to Consolidated Financial Statements.
73
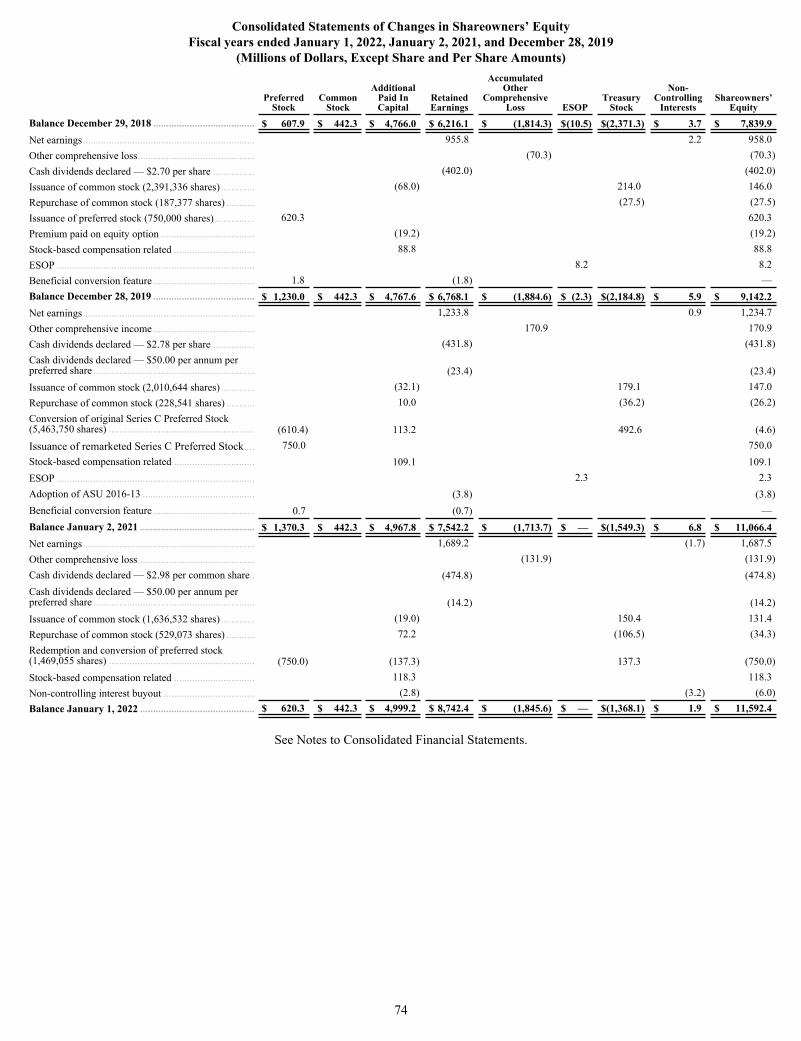
Consolidated Statements of Changes in Shareowners’ EquityFiscal years ended January 1, 2022, January 2, 2021, and December 28, 2019
(Millions of Dollars, Except Share and Per Share Amounts)
PreferredStock
CommonStock
AdditionalPaid InCapital
RetainedEarnings
AccumulatedOther
ComprehensiveLoss ESOP
TreasuryStock
Non-Controlling
InterestsShareowners’
EquityBalance December 29, 2018 ....................................... $ 607.9 $ 442.3 $ 4,766.0 $ 6,216.1 $ (1,814.3) $ (10.5) $ (2,371.3) $ 3.7 $ 7,839.9 Net earnings .................................................................. 955.8 2.2 958.0 Other comprehensive loss ............................................. (70.3) (70.3) Cash dividends declared — $2.70 per share ................ (402.0) (402.0) Issuance of common stock (2,391,336 shares) ............. (68.0) 214.0 146.0 Repurchase of common stock (187,377 shares) ........... (27.5) (27.5) Issuance of preferred stock (750,000 shares) ............... 620.3 620.3 Premium paid on equity option .................................... (19.2) (19.2) Stock-based compensation related ............................... 88.8 88.8 ESOP ............................................................................ 8.2 8.2 Beneficial conversion feature ....................................... 1.8 (1.8) — Balance December 28, 2019 ....................................... $ 1,230.0 $ 442.3 $ 4,767.6 $ 6,768.1 $ (1,884.6) $ (2.3) $ (2,184.8) $ 5.9 $ 9,142.2 Net earnings .................................................................. 1,233.8 0.9 1,234.7 Other comprehensive income ....................................... 170.9 170.9 Cash dividends declared — $2.78 per share ................ (431.8) (431.8) Cash dividends declared — $50.00 per annum per preferred share .............................................................. (23.4) (23.4) Issuance of common stock (2,010,644 shares) ............. (32.1) 179.1 147.0 Repurchase of common stock (228,541 shares) ........... 10.0 (36.2) (26.2) Conversion of original Series C Preferred Stock (5,463,750 shares) ........................................................ (610.4) 113.2 492.6 (4.6) Issuance of remarketed Series C Preferred Stock .... 750.0 750.0 Stock-based compensation related ............................... 109.1 109.1 ESOP ............................................................................ 2.3 2.3 Adoption of ASU 2016-13 ........................................... (3.8) (3.8) Beneficial conversion feature ....................................... 0.7 (0.7) — Balance January 2, 2021 ............................................ $ 1,370.3 $ 442.3 $ 4,967.8 $ 7,542.2 $ (1,713.7) $ — $ (1,549.3) $ 6.8 $ 11,066.4 Net earnings .................................................................. 1,689.2 (1.7) 1,687.5 Other comprehensive loss ............................................. (131.9) (131.9) Cash dividends declared — $2.98 per common share.. (474.8) (474.8) Cash dividends declared — $50.00 per annum per preferred share .............................................................. (14.2) (14.2) Issuance of common stock (1,636,532 shares) ............. (19.0) 150.4 131.4 Repurchase of common stock (529,073 shares) ........... 72.2 (106.5) (34.3) Redemption and conversion of preferred stock (1,469,055 shares) ........................................................ (750.0) (137.3) 137.3 (750.0) Stock-based compensation related ............................... 118.3 118.3 Non-controlling interest buyout ................................... (2.8) (3.2) (6.0) Balance January 1, 2022 ............................................ $ 620.3 $ 442.3 $ 4,999.2 $ 8,742.4 $ (1,845.6) $ — $ (1,368.1) $ 1.9 $ 11,592.4
See Notes to Consolidated Financial Statements.
74

Notes to Consolidated Financial Statements
A. SIGNIFICANT ACCOUNTING POLICIES
BASIS OF PRESENTATION — The Consolidated Financial Statements include the accounts of Stanley Black & Decker, Inc. and its majority-owned subsidiaries (collectively the “Company”) which require consolidation, after the elimination of intercompany accounts and transactions. The Company’s fiscal year ends on the Saturday nearest to December 31. There were 52 weeks in fiscal year 2021, 53 weeks in the fiscal years 2020, and 52 weeks in fiscal year 2019.
In December 2021, the Company acquired the remaining 80 percent ownership stake in MTD Holdings Inc. ("MTD"), a privately held global manufacturer of outdoor power equipment. The Company previously acquired a 20 percent interest in MTD in January 2019. Prior to closing on the remaining 80 percent ownership stake, the Company applied the equity method of accounting to the 20% investment in MTD. In November 2021, the Company acquired Excel Industries ("Excel"), a leading designer and manufacturer of premium commercial and residential turf-care equipment. These acquisitions are being accounted for as business combinations using the acquisition method of accounting and the results subsequent to the dates of acquisition are included in the Company's Tools & Storage segment.
In February 2020, the Company acquired Consolidated Aerospace Manufacturing, LLC ("CAM"). In March 2019, the Company acquired International Equipment Solutions Attachments businesses, Paladin and Pengo, ("IES Attachments"). The 2020 and 2019 acquisitions were accounted for as business combinations using the acquisition method of accounting and the results subsequent to the respective dates of acquisition are included in the Company's Industrial segment.
Refer to Note E, Acquisitions and Investments, for further discussion on these transactions.
In December 2021, upon announcing it reached a definitive agreement for the sale of most of its Security assets, the Company classified the Convergent Security Solutions ("CSS") business as held for sale on the Company's Consolidated Balance Sheets as of January 1, 2022 and January 2, 2021. The operating results of CSS have been reported as discontinued operations in the Consolidated Financial Statements. Amounts previously reported have been reclassified to conform to this presentation in accordance with Accounting Standard Codification ("ASC") 205, Presentation of Financial Statements ("ASC 205"), to allow for meaningful comparison of continuing operations.
In November 2020, the Company sold its commercial electronic operations in five countries in Europe and emerging markets within the Security segment. In October 2020, the Company sold a product line in Oil & Gas within the Industrial segment. The operating results of these businesses have been reported in the Consolidated Financial Statements through the dates of sale in 2020 and for the year ended December 28, 2019.
In May 2019, the Company sold its Sargent & Greenleaf mechanical locks business within the Security segment. The operating results of this business have been reported in the Consolidated Financial Statements through the date of sale in 2019.
Refer to Note T, Divestitures, for further discussion on these transactions.
The preparation of financial statements in conformity with accounting principles generally accepted in the United States of America requires management to make estimates and assumptions that affect the amounts reported in the financial statements. While management believes that the estimates and assumptions used in the preparation of the financial statements are appropriate, actual results could differ from these estimates. Certain amounts reported in previous years have been reclassified to conform to the 2021 presentation.
FOREIGN CURRENCY — For foreign operations with functional currencies other than the U.S. dollar, asset and liability accounts are translated at current exchange rates, while income and expenses are translated using average exchange rates. Translation adjustments are reported in a separate component of shareowners’ equity and exchange gains and losses on transactions are included in earnings.
CASH EQUIVALENTS — Highly liquid investments with original maturities of three months or less are considered cash equivalents.
ACCOUNTS AND FINANCING RECEIVABLE — Trade receivables are stated at gross invoice amounts less discounts, other allowances and provisions for credit losses. Financing receivables are initially recorded at fair value, less impairments or provisions for credit losses. Interest income earned from financing receivables that are not delinquent is recorded on the effective interest method. The Company considers any financing receivable that has not been collected within 90 days of
75
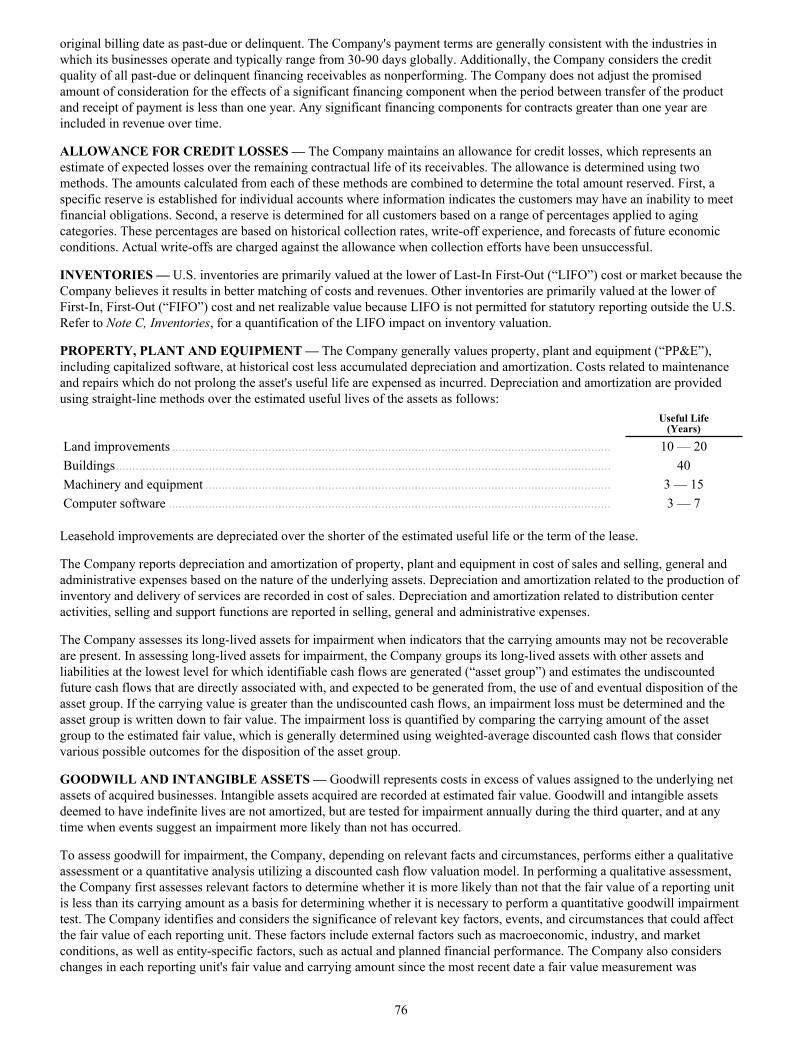
original billing date as past-due or delinquent. The Company's payment terms are generally consistent with the industries in which its businesses operate and typically range from 30-90 days globally. Additionally, the Company considers the credit quality of all past-due or delinquent financing receivables as nonperforming. The Company does not adjust the promised amount of consideration for the effects of a significant financing component when the period between transfer of the product and receipt of payment is less than one year. Any significant financing components for contracts greater than one year are included in revenue over time.
ALLOWANCE FOR CREDIT LOSSES — The Company maintains an allowance for credit losses, which represents an estimate of expected losses over the remaining contractual life of its receivables. The allowance is determined using two methods. The amounts calculated from each of these methods are combined to determine the total amount reserved. First, a specific reserve is established for individual accounts where information indicates the customers may have an inability to meet financial obligations. Second, a reserve is determined for all customers based on a range of percentages applied to aging categories. These percentages are based on historical collection rates, write-off experience, and forecasts of future economic conditions. Actual write-offs are charged against the allowance when collection efforts have been unsuccessful.
INVENTORIES — U.S. inventories are primarily valued at the lower of Last-In First-Out (“LIFO”) cost or market because the Company believes it results in better matching of costs and revenues. Other inventories are primarily valued at the lower of First-In, First-Out (“FIFO”) cost and net realizable value because LIFO is not permitted for statutory reporting outside the U.S. Refer to Note C, Inventories, for a quantification of the LIFO impact on inventory valuation.
PROPERTY, PLANT AND EQUIPMENT — The Company generally values property, plant and equipment (“PP&E”), including capitalized software, at historical cost less accumulated depreciation and amortization. Costs related to maintenance and repairs which do not prolong the asset's useful life are expensed as incurred. Depreciation and amortization are provided using straight-line methods over the estimated useful lives of the assets as follows:
Useful Life(Years)
Land improvements .................................................................................................................................... 10 — 20Buildings ..................................................................................................................................................... 40Machinery and equipment .......................................................................................................................... 3 — 15Computer software ..................................................................................................................................... 3 — 7
Leasehold improvements are depreciated over the shorter of the estimated useful life or the term of the lease.
The Company reports depreciation and amortization of property, plant and equipment in cost of sales and selling, general and administrative expenses based on the nature of the underlying assets. Depreciation and amortization related to the production of inventory and delivery of services are recorded in cost of sales. Depreciation and amortization related to distribution center activities, selling and support functions are reported in selling, general and administrative expenses.
The Company assesses its long-lived assets for impairment when indicators that the carrying amounts may not be recoverable are present. In assessing long-lived assets for impairment, the Company groups its long-lived assets with other assets and liabilities at the lowest level for which identifiable cash flows are generated (“asset group”) and estimates the undiscounted future cash flows that are directly associated with, and expected to be generated from, the use of and eventual disposition of the asset group. If the carrying value is greater than the undiscounted cash flows, an impairment loss must be determined and the asset group is written down to fair value. The impairment loss is quantified by comparing the carrying amount of the asset group to the estimated fair value, which is generally determined using weighted-average discounted cash flows that consider various possible outcomes for the disposition of the asset group.
GOODWILL AND INTANGIBLE ASSETS — Goodwill represents costs in excess of values assigned to the underlying net assets of acquired businesses. Intangible assets acquired are recorded at estimated fair value. Goodwill and intangible assets deemed to have indefinite lives are not amortized, but are tested for impairment annually during the third quarter, and at any time when events suggest an impairment more likely than not has occurred.
To assess goodwill for impairment, the Company, depending on relevant facts and circumstances, performs either a qualitative assessment or a quantitative analysis utilizing a discounted cash flow valuation model. In performing a qualitative assessment, the Company first assesses relevant factors to determine whether it is more likely than not that the fair value of a reporting unit is less than its carrying amount as a basis for determining whether it is necessary to perform a quantitative goodwill impairment test. The Company identifies and considers the significance of relevant key factors, events, and circumstances that could affect the fair value of each reporting unit. These factors include external factors such as macroeconomic, industry, and market conditions, as well as entity-specific factors, such as actual and planned financial performance. The Company also considers changes in each reporting unit's fair value and carrying amount since the most recent date a fair value measurement was
76

performed. In performing a quantitative analysis, the Company determines the fair value of a reporting unit using management’s assumptions about future cash flows based on long-range strategic plans. This approach incorporates many assumptions including discount rates, future growth rates and expected profitability. In the event the carrying amount of a reporting unit exceeded its fair value, an impairment loss would be recognized.
Indefinite-lived intangible assets are tested for impairment utilizing either a qualitative assessment or a quantitative analysis. For a qualitative assessment, the Company identifies and considers relevant key factors, events, and circumstances to determine whether it is necessary to perform a quantitative impairment test. The key factors considered include macroeconomic, industry, and market conditions, as well as the asset's actual and forecasted results. For the quantitative impairment tests, the Company compares the carrying amounts to the current fair market values, usually determined by the estimated royalty savings attributable to owning the intangible assets. Intangible assets with definite lives are amortized over their estimated useful lives to reflect the pattern over which the economic benefits of the intangible assets are consumed. Definite-lived intangible assets are also evaluated for impairment when impairment indicators are present. If the carrying amount exceeds the total undiscounted future cash flows, a discounted cash flow analysis is performed to determine the fair value of the asset. If the carrying amount of the asset was to exceed the fair value, it would be written down to fair value. No significant goodwill or other intangible asset impairments were recorded during 2021, 2020 or 2019.
FINANCIAL INSTRUMENTS — Derivative financial instruments are employed to manage risks, including foreign currency, interest rate exposures and commodity prices and are not used for trading or speculative purposes. As part of the Company’s risk management program, a variety of financial instruments such as interest rate swaps, currency swaps, purchased currency options, foreign exchange contracts and commodity contracts, may be used to mitigate interest rate exposure, foreign currency exposure and commodity price exposure. The Company recognizes all derivative instruments on the balance sheet at fair value.
Changes in the fair value of derivatives are recognized periodically either in earnings or in shareowners’ equity as a component of other comprehensive income (loss) ("OCI"), depending on whether the derivative financial instrument is undesignated or qualifies for hedge accounting, and if so, whether it represents a fair value, cash flow, or net investment hedge. Changes in the fair value of derivatives accounted for as fair value hedges are recorded in earnings in the same caption as the changes in the fair value of the hedged items. Gains and losses on derivatives designated as cash flow hedges, to the extent they are included in the assessment of effectiveness, are recorded in OCI and subsequently reclassified to earnings to offset the impact of the hedged items when they occur. In the event it becomes probable the forecasted transaction to which a cash flow hedge relates will not occur, the derivative would be terminated and the amount in accumulated other comprehensive income (loss) would be recognized in earnings. Changes in the fair value of derivatives that are designated and qualify as a hedge of the net investment in foreign operations, to the extent they are included in the assessment of effectiveness, are reported in OCI and are deferred until disposal of the underlying assets. Gains and losses representing components excluded from the assessment of effectiveness for cash flow and fair value hedges are recognized in earnings on a straight-line basis in the same caption as the hedged item over the term of the hedge. Gains and losses representing components excluded from the assessment of effectiveness for net investment hedges are recognized in earnings on a straight-line basis in Other, net over the term of the hedge.
The net interest paid or received on interest rate swaps is recognized as interest expense. Gains and losses resulting from the early termination of interest rate swap agreements are deferred and amortized as adjustments to interest expense over the remaining period of the debt originally covered by the terminated swap.
Changes in the fair value of derivatives not designated as hedges are reported in Other, net in the Consolidated Statements of Operations. Refer to Note I, Financial Instruments, for further discussion.
REVENUE RECOGNITION — The Company’s revenues result from the sale of goods or services and reflect the consideration to which the Company expects to be entitled. The Company records revenue based on a five-step model in accordance with ASC 606, Revenue from Contracts with Customers ("ASC 606"). For its contracts with customers, the Company identifies the performance obligations (goods or services), determines the transaction price, allocates the contract transaction price to the performance obligations, and recognizes the revenue when (or as) the performance obligation is transferred to the customer. A good or service is transferred when (or as) the customer obtains control of that good or service. The majority of the Company’s revenues are recorded at a point in time from the sale of tangible products.
A portion of the Company’s revenues within the CSS and Infrastructure businesses is generated from equipment leased to customers. Customer arrangements are identified as leases if they include transfer of a tangible asset which is provided to the customer in exchange for payments typically at fixed rates payable monthly, quarterly or annually. Customer leases may include terms to allow for extension of leases for a short period of time, but typically do not provide for customer termination prior to the initial term. Some customer leases include terms to allow the customer to purchase the underlying asset, which occurs occasionally, and virtually no customer leases include residual value guarantee clauses. Within the CSS business, the
77
underlying asset typically has no value at termination of the customer lease, so no residual value asset is recorded in the financial statements. For Infrastructure business leases, underlying assets are assessed for functionality at termination of the lease and, if necessary, an impairment to the leased asset value is recorded.
Provisions for customer volume rebates, product returns, discounts and allowances are variable consideration and are recorded as a reduction of revenue in the same period the related sales are recorded. Such provisions are calculated using historical averages adjusted for any expected changes due to current business conditions. Consideration given to customers for cooperative advertising is recognized as a reduction of revenue except to the extent that there is a distinct good or service and evidence of the fair value of the advertising, in which case the expense is classified as selling, general, and administrative expense.
The Company’s revenues can be generated from contracts with multiple performance obligations. When a contract involves multiple performance obligations, each obligation is separately identified and the transaction price is allocated based on the amount of consideration the Company expects to be entitled to in exchange for transferring the promised good or service to the customer.
Sales of security monitoring systems, within the CSS business, may have multiple performance obligations, including equipment, installation and monitoring or maintenance services. In most instances, the Company allocates the appropriate amount of consideration to each performance obligation based on the standalone selling price ("SSP") of the distinct goods or services performance obligation. In circumstances where SSP is not observable, the Company allocates the consideration for the performance obligations by utilizing one of the following methods: expected cost plus margin, the residual approach, or a mix of these estimation methods.
For performance obligations that the Company satisfies over time, revenue is recognized by consistently applying a method of measuring progress toward complete satisfaction of that performance obligation. The Company utilizes the method that most accurately depicts the progress toward completion of the performance obligation.
The Company’s contract sales for the installation of security intruder systems and other construction-related projects, within the CSS business, are generally recorded under the input method. The input method recognizes revenue on the basis of the Company’s efforts or inputs to the satisfaction of a performance obligation relative to the total inputs expected to satisfy that performance obligation. Revenue recognized on security contracts in process are based upon the allocated contract price and related total inputs of the project at completion. The extent of progress toward completion is generally measured using input methods based on labor metrics. Revisions to these estimates as contracts progress have the effect of increasing or decreasing profits each period. Provisions for anticipated losses are made in the period in which they become determinable. The revenues for monitoring and monitoring-related services are recognized as services are rendered over the contractual period.
The Company utilizes the output method for contract sales in the Oil & Gas product line. The output method recognizes revenue based on direct measurements of the customer value of the goods or services transferred to date relative to the remaining goods or services promised under the contract. The output method includes methods such as surveys of performance completed to date, appraisals of results achieved, milestones reached, time elapsed, and units produced or units delivered.
Contract assets or liabilities result from transactions with revenue recorded over time. If the measure of remaining rights exceeds the measure of the remaining performance obligations, the Company records a contract asset. Conversely, if the measure of the remaining performance obligations exceeds the measure of the remaining rights, the Company records a contract liability.
Incremental costs of obtaining or fulfilling a contract with a customer that are expected to be recovered are recognized and classified in Other current assets or Other assets in the Consolidated Balance Sheets and are typically amortized over the contract period. The Company recognizes the incremental costs of obtaining or fulfilling a contract as expense when incurred if the amortization period of the asset is one year or less.
Customer billings for services not yet rendered are deferred and recognized as revenue as the services are rendered. The associated deferred revenue is included in Accrued expenses or Other liabilities, as appropriate, in the Consolidated Balance Sheets.
Refer to Note B, Accounts and Notes Receivable, for further discussion.
COST OF SALES AND SELLING, GENERAL & ADMINISTRATIVE — Cost of sales includes the cost of products and services provided, reflecting costs of manufacturing and preparing the product for sale. These costs include expenses to acquire
78
and manufacture products to the point that they are allocable to be sold to customers and costs to perform services pertaining to service revenues (e.g. installation of security systems, automatic doors, and security monitoring costs). Cost of sales is primarily comprised of freight, direct materials, direct labor as well as overhead which includes indirect labor and facility and equipment costs. Cost of sales also includes quality control, procurement and material receiving costs as well as internal transfer costs. Selling, general & administrative costs ("SG&A") include the cost of selling products as well as administrative function costs. These expenses generally represent the cost of selling and distributing the products once they are available for sale and primarily include salaries and commissions of the Company’s sales force, distribution costs, notably salaries and facility costs, as well as administrative expenses for certain support functions and related overhead.
ADVERTISING COSTS — Television advertising is expensed the first time the advertisement airs, whereas other advertising is expensed as incurred. Advertising costs are classified in SG&A and amounted to $98.6 million in 2021, $76.6 million in 2020 and $90.5 million in 2019. Expense pertaining to cooperative advertising with customers reported as a reduction of Net Sales was $374.1 million in 2021, $351.0 million in 2020 and $317.8 million in 2019. Cooperative advertising with customers classified as SG&A expense amounted to $19.5 million in 2021, $15.8 million in 2020 and $5.6 million in 2019.
SALES TAXES — Sales and value added taxes collected from customers and remitted to governmental authorities are excluded from Net Sales reported in the Consolidated Statements of Operations.
SHIPPING AND HANDLING COSTS — The Company generally does not bill customers for freight. Shipping and handling costs associated with inbound and outbound freight are reported in Cost of sales. Distribution costs are classified in SG&A and amounted to $416.5 million, $347.3 million and $326.5 million in 2021, 2020 and 2019, respectively.
STOCK-BASED COMPENSATION — Compensation cost relating to stock-based compensation grants is recognized on a straight-line basis over the vesting period, which is generally four years. The expense for stock options and restricted stock units awarded to retirement-eligible employees (those aged 55 and over, and with 10 or more years of service) is recognized on the grant date, or (if later) by the date they become retirement-eligible.
POSTRETIREMENT DEFINED BENEFIT PLAN — The Company uses the corridor approach to determine expense recognition for each defined benefit pension and other postretirement plan. The corridor approach defers actuarial gains and losses resulting from variances between actual and expected results (based on economic estimates or actuarial assumptions) and amortizes them over future periods. For pension plans, these unrecognized gains and losses are amortized when the net gains and losses exceed 10% of the greater of the market-related value of plan assets or the projected benefit obligation at the beginning of the year. For other postretirement benefits, amortization occurs when the net gains and losses exceed 10% of the accumulated postretirement benefit obligation at the beginning of the year. For ongoing, active plans, the amount in excess of the corridor is amortized on a straight-line basis over the average remaining service period for active plan participants. For plans with primarily inactive participants, the amount in excess of the corridor is amortized on a straight-line basis over the average remaining life expectancy of inactive plan participants.
INCOME TAXES — The Company accounts for income taxes under the asset and liability method in accordance with ASC 740, Income Taxes, which requires the recognition of deferred tax assets and liabilities for the expected future tax consequences of events that have been included in the financial statements. Deferred tax assets and liabilities are determined based on the differences between the financial statements and tax basis of assets and liabilities using the enacted tax rates in effect for the year in which the differences are expected to reverse. Any changes in tax rates on deferred tax assets and liabilities are recognized in earnings in the period that includes the enactment date. The Company recognizes the tax on global intangible low-taxed income as a period expense in the period the tax is incurred.
The Company records net deferred tax assets to the extent that it is more likely than not that these assets will be realized. In making this determination, management considers all available positive and negative evidence, including future reversals of existing temporary differences, estimates of future taxable income, tax-planning strategies, and the realizability of net operating loss carryforwards. In the event that it is determined that an asset is not more likely that not to be realized, a valuation allowance is recorded against the asset. Valuation allowances related to deferred tax assets can be impacted by changes to tax laws, changes to statutory tax rates and future taxable income levels. In the event the Company were to determine that it would not be able to realize all or a portion of its deferred tax assets in the future, the unrealizable amount would be charged to earnings in the period in which that determination is made. Conversely, if the Company were to determine that it would be able to realize deferred tax assets in the future in excess of the net carrying amounts, it would decrease the recorded valuation allowance through a favorable adjustment to earnings in the period that the determination was made. The Company records uncertain tax positions in accordance with ASC 740, which requires a two-step process. First, management determines whether it is more likely than not that a tax position will be sustained based on the technical merits of the position and second, for those tax positions that meet the more likely than not threshold, management recognizes the largest amount of the tax benefit that is greater than 50 percent likely to be realized upon ultimate settlement with the related taxing authority. The Company maintains
79
an accounting policy of recording interest and penalties on uncertain tax positions as a component of Income taxes in the Consolidated Statements of Operations.
The Company is subject to income tax in a number of locations, including many state and foreign jurisdictions. Significant judgment is required when calculating the worldwide provision for income taxes. Many factors are considered when evaluating and estimating the Company's tax positions and tax benefits, which may require periodic adjustments, and which may not accurately anticipate actual outcomes. It is reasonably possible that the amount of the unrecognized benefit with respect to certain of the Company's unrecognized tax positions will significantly increase or decrease within the next twelve months. These changes may be the result of settlements of ongoing audits, litigation, or other proceedings with taxing authorities. The Company periodically assesses its liabilities and contingencies for all tax years still subject to audit based on the most current available information, which involves inherent uncertainty.
Refer to Note Q, Income Taxes, for further discussion.
EARNINGS PER SHARE — Basic earnings per share equals net earnings attributable to common shareowners divided by weighted-average shares outstanding during the year. Diluted earnings per share include the impact of common stock equivalents using the treasury stock method or the if-converted method, as applicable, when the effect is dilutive.
NEW ACCOUNTING STANDARDS ADOPTED — In January 2020, the Financial Accounting Standards Board ("FASB") issued Accounting Standards Update ("ASU") 2020-01, Investments-Equity Securities (Topic 321), Investments-Equity Method and Joint Ventures (Topic 323), and Derivatives and Hedging (Topic 815). The new standard clarifies the interaction of accounting for the transition into and out of the equity method. The new standard also clarifies the accounting for measuring certain purchased options and forward contracts to acquire investments. The ASU is effective for fiscal years beginning after December 15, 2020, including interim periods within those fiscal years. The Company adopted this guidance in the first quarter of 2021 and it did not have a material impact on its consolidated financial statements.
In December 2019, the FASB issued ASU 2019-12, Income Taxes (Topic 740). The new standard simplifies the accounting for income taxes by removing certain exceptions for recognizing deferred taxes for investments, performing intra-period allocation and calculating income taxes in interim periods. The new standard also adds guidance to reduce complexity in certain areas, including recognizing deferred taxes for tax goodwill and allocating taxes to members of a consolidated group. The ASU is effective for fiscal years beginning after December 15, 2020, including interim periods within those fiscal years. The Company adopted this standard in the first quarter of 2021 and it did not have a material impact on the Company’s consolidated financial statements.
RECENTLY ISSUED ACCOUNTING STANDARDS NOT YET ADOPTED — In October 2021, the FASB issued ASU 2021-08, Business Combinations (Topic 805), Accounting for Contract Assets and Contract Liabilities from Contracts with Customers. The new standard improves the accounting for acquired revenue contracts with customers in a business combination by addressing diversity in practice and inconsistency. The new standard requires an entity to recognize and measure contract assets and contract liabilities acquired in a business combination in accordance with ASC 606, Revenue from Contracts with Customers. The ASU is effective for fiscal years beginning after December 15, 2022, including interim periods within those fiscal years. Early adoption is permitted, including adoption in an interim period. The standard should be applied prospectively to business combinations occurring on or after the effective date of the amendments. The Company will adopt this guidance in the first quarter of 2022 and does not expect it to have a material impact on its consolidated financial statements.
In May 2021, the FASB issued ASU 2021-04, Earnings per share (Topic 260), Debt-Modifications and Extinguishments (Subtopic 470-50), Compensation-Stock Compensation (Topic 718), and Derivatives and Hedging – Contracts in Equity (Subtopic 815-40). The new standard clarifies and reduces diversity in an issuer’s accounting for modifications or exchanges of freestanding equity-classified written call options (for example, warrants) that remain equity classified after modification or exchange. The ASU is effective for fiscal years beginning after December 15, 2021, including interim periods within those fiscal years. Early adoption is permitted, including adoption in an interim period. The standard should be applied prospectively. The Company will adopt this guidance in the first quarter of 2022 and does not expect it to have a material impact on its consolidated financial statements.
In August 2020, the FASB issued ASU 2020-06, Debt - Debt with Conversion and Other Options (Subtopic 470-20) and Derivatives and Hedging – Contracts in Entity’s Own Equity (Subtopic 815-40). The new standard reduces the number of accounting models for convertible debt instruments and convertible preferred stock, and amends the guidance for the derivatives scope exception for contracts in an entity's own equity. The standard also amends and makes targeted improvements to the related earnings per share guidance. The ASU is effective for fiscal years beginning after December 15, 2021, including interim periods within those fiscal years. Early adoption is permitted, but no earlier than fiscal years beginning after December 15, 2020, including interim periods within those fiscal years. The standard allows for either modified or full retrospective transition methods. The Company will adopt this guidance in the first quarter of 2022.
80
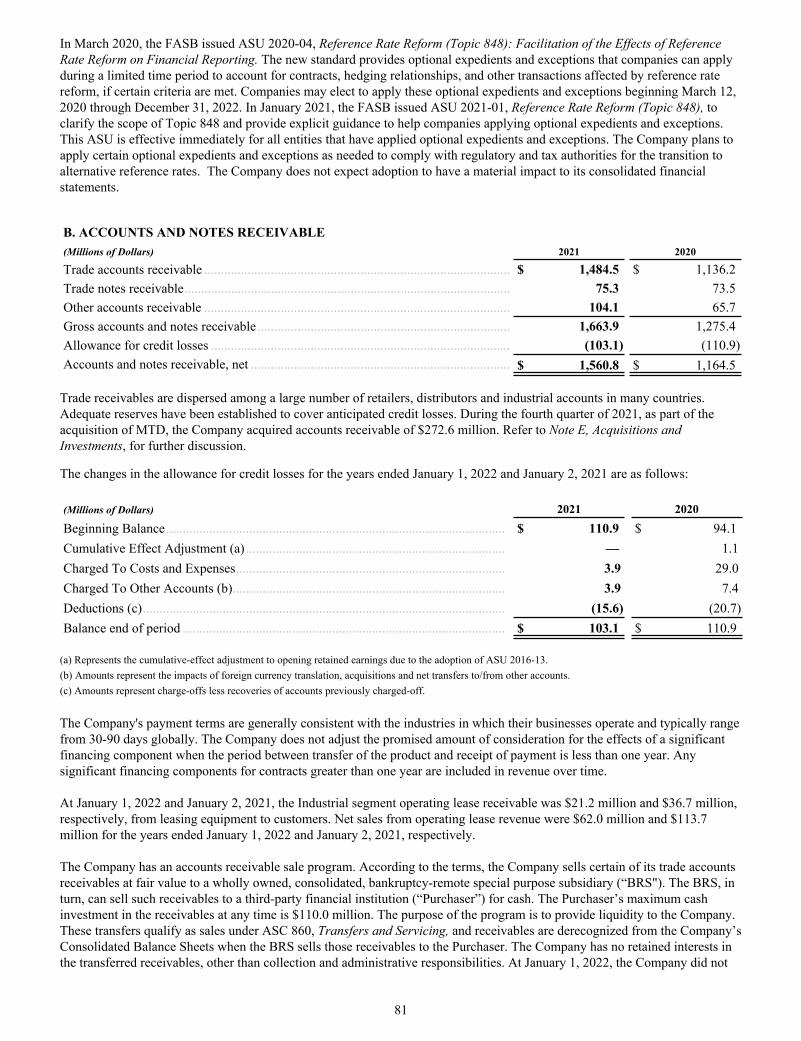
In March 2020, the FASB issued ASU 2020-04, Reference Rate Reform (Topic 848): Facilitation of the Effects of Reference Rate Reform on Financial Reporting. The new standard provides optional expedients and exceptions that companies can apply during a limited time period to account for contracts, hedging relationships, and other transactions affected by reference rate reform, if certain criteria are met. Companies may elect to apply these optional expedients and exceptions beginning March 12, 2020 through December 31, 2022. In January 2021, the FASB issued ASU 2021-01, Reference Rate Reform (Topic 848), to clarify the scope of Topic 848 and provide explicit guidance to help companies applying optional expedients and exceptions. This ASU is effective immediately for all entities that have applied optional expedients and exceptions. The Company plans to apply certain optional expedients and exceptions as needed to comply with regulatory and tax authorities for the transition to alternative reference rates. The Company does not expect adoption to have a material impact to its consolidated financial statements.
B. ACCOUNTS AND NOTES RECEIVABLE(Millions of Dollars) 2021 2020
Trade accounts receivable ............................................................................................ $ 1,484.5 $ 1,136.2 Trade notes receivable .................................................................................................. 75.3 73.5 Other accounts receivable ............................................................................................ 104.1 65.7 Gross accounts and notes receivable ............................................................................ 1,663.9 1,275.4 Allowance for credit losses .......................................................................................... (103.1) (110.9) Accounts and notes receivable, net .............................................................................. $ 1,560.8 $ 1,164.5
Trade receivables are dispersed among a large number of retailers, distributors and industrial accounts in many countries. Adequate reserves have been established to cover anticipated credit losses. During the fourth quarter of 2021, as part of the acquisition of MTD, the Company acquired accounts receivable of $272.6 million. Refer to Note E, Acquisitions and Investments, for further discussion.
The changes in the allowance for credit losses for the years ended January 1, 2022 and January 2, 2021 are as follows:
(Millions of Dollars) 2021 2020Beginning Balance ...................................................................................................... $ 110.9 $ 94.1 Cumulative Effect Adjustment (a) .............................................................................. — 1.1Charged To Costs and Expenses ................................................................................. 3.9 29.0Charged To Other Accounts (b) .................................................................................. 3.9 7.4Deductions (c) ............................................................................................................. (15.6) (20.7) Balance end of period ................................................................................................. $ 103.1 $ 110.9
(a) Represents the cumulative-effect adjustment to opening retained earnings due to the adoption of ASU 2016-13.(b) Amounts represent the impacts of foreign currency translation, acquisitions and net transfers to/from other accounts.(c) Amounts represent charge-offs less recoveries of accounts previously charged-off.
The Company's payment terms are generally consistent with the industries in which their businesses operate and typically range from 30-90 days globally. The Company does not adjust the promised amount of consideration for the effects of a significant financing component when the period between transfer of the product and receipt of payment is less than one year. Any significant financing components for contracts greater than one year are included in revenue over time.
At January 1, 2022 and January 2, 2021, the Industrial segment operating lease receivable was $21.2 million and $36.7 million, respectively, from leasing equipment to customers. Net sales from operating lease revenue were $62.0 million and $113.7 million for the years ended January 1, 2022 and January 2, 2021, respectively.
The Company has an accounts receivable sale program. According to the terms, the Company sells certain of its trade accounts receivables at fair value to a wholly owned, consolidated, bankruptcy-remote special purpose subsidiary (“BRS"). The BRS, in turn, can sell such receivables to a third-party financial institution (“Purchaser”) for cash. The Purchaser’s maximum cash investment in the receivables at any time is $110.0 million. The purpose of the program is to provide liquidity to the Company. These transfers qualify as sales under ASC 860, Transfers and Servicing, and receivables are derecognized from the Company’s Consolidated Balance Sheets when the BRS sells those receivables to the Purchaser. The Company has no retained interests in the transferred receivables, other than collection and administrative responsibilities. At January 1, 2022, the Company did not
81

record a servicing asset or liability related to its retained responsibility based on its assessment of the servicing fee, market values for similar transactions and its cost of servicing the receivables sold.
At January 1, 2022 and January 2, 2021, net receivables of approximately $100.0 million and $86.8 million, respectively, were derecognized. Proceeds from transfers of receivables to the Purchaser totaled $447.7 million and $259.6 million for the years ended January 1, 2022 and January 2, 2021, respectively, and payments to the Purchaser totaled $434.5 million and $272.8 million, respectively. The program resulted in a pre-tax loss of $2.0 million and $1.7 million for the years ended January 1, 2022 and January 2, 2021, respectively, which included service fees of $0.9 million and $0.6 million, respectively. All cash flows under the program are reported as a component of changes in accounts receivable within operating activities in the Consolidated Statements of Cash Flows since all the cash from the Purchaser is received upon the initial sale of the receivable.
As of January 1, 2022 and January 2, 2021, the Company's deferred revenue totaled $126.7 million and $131.0 million,respectively, of which $42.2 million and $39.4 million, respectively, was classified as current. Revenue recognized for the years ended January 1, 2022 and January 2, 2021 that was previously deferred as of January 2, 2021 and December 28, 2019 totaled $24.0 million and $30.4 million, respectively.
C. INVENTORIES(Millions of Dollars) 2021 2020
Finished products ......................................................................................................... $ 3,508.1 $ 1,883.6 Work in process ............................................................................................................ 393.9 169.2 Raw materials ............................................................................................................... 1,544.8 586.1 Total ............................................................................................................................. $ 5,446.8 $ 2,638.9
Net inventories in the amount of $2.6 billion at January 1, 2022 and $1.3 billion at January 2, 2021 were valued at the lower of LIFO cost or market. If the LIFO method had not been used, inventories would have been higher than reported by $228.5 million at January 1, 2022 and $45.8 million at January 2, 2021.
As part of the MTD and Excel acquisitions in the fourth quarter of 2021, the Company acquired inventory with an estimated fair value of $900.7 million and $49.9 million, respectfully. Refer to Note E, Acquisitions and Investments, for further discussion.
D. PROPERTY, PLANT AND EQUIPMENT(Millions of Dollars) 2021 2020
Land ........................................................................................................................... $ 143.1 $ 136.7 Land improvements ................................................................................................... 61.2 56.5 Buildings .................................................................................................................... 745.9 639.9 Leasehold improvements ........................................................................................... 169.6 162.9 Machinery and equipment .......................................................................................... 3,412.9 2,984.3 Computer software ..................................................................................................... 476.3 425.5 Property, plant & equipment, gross ........................................................................... $ 5,009.0 $ 4,405.8 Less: accumulated depreciation and amortization ..................................................... (2,661.9) (2,432.7) Property, plant & equipment, net ............................................................................... $ 2,347.1 $ 1,973.1
Depreciation and amortization expense associated with property, plant and equipment was as follows:(Millions of Dollars) 2021 2020 2019
Depreciation ........................................................................................... $ 326.3 $ 332.6 $ 325.2 Amortization .......................................................................................... 47.7 43.9 47.6 Depreciation and amortization expense ................................................. $ 374.0 $ 376.5 $ 372.8
The amounts above are inclusive of depreciation and amortization expense for discontinued operations amounting to $22.1 million in 2021, $21.1 million in 2020, and $19.7 million in 2019.
E. ACQUISITIONS AND INVESTMENTS
82
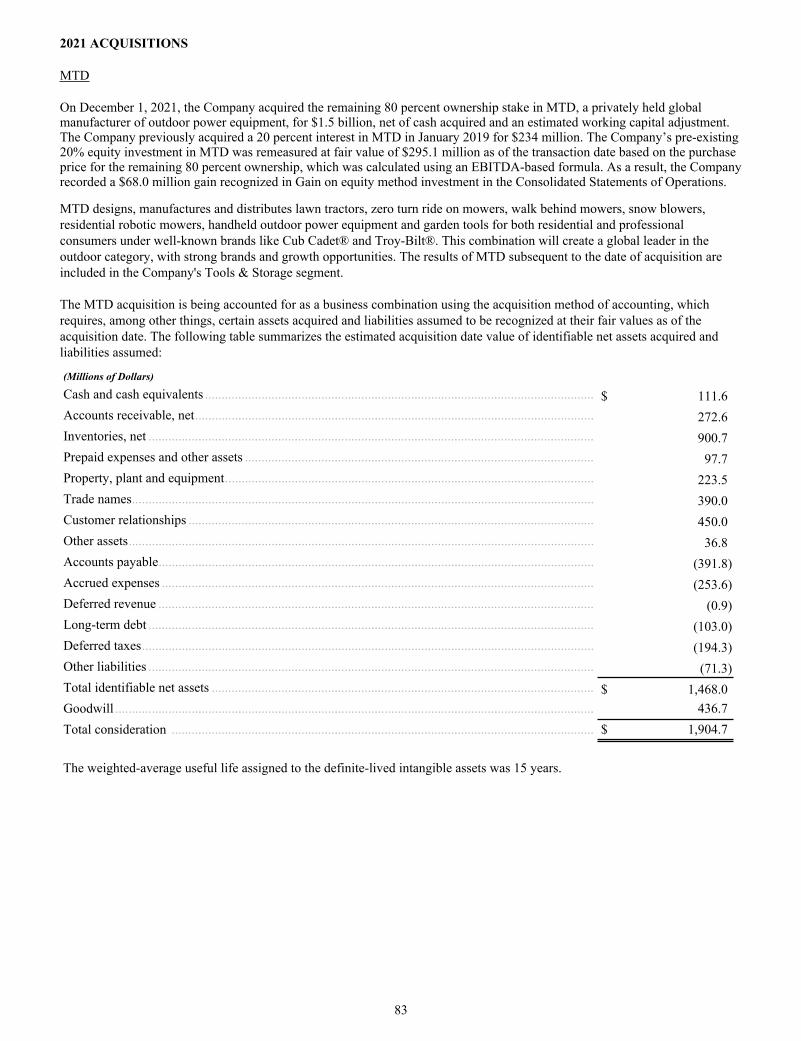
2021 ACQUISITIONS
MTD
On December 1, 2021, the Company acquired the remaining 80 percent ownership stake in MTD, a privately held global manufacturer of outdoor power equipment, for $1.5 billion, net of cash acquired and an estimated working capital adjustment. The Company previously acquired a 20 percent interest in MTD in January 2019 for $234 million. The Company’s pre-existing 20% equity investment in MTD was remeasured at fair value of $295.1 million as of the transaction date based on the purchase price for the remaining 80 percent ownership, which was calculated using an EBITDA-based formula. As a result, the Company recorded a $68.0 million gain recognized in Gain on equity method investment in the Consolidated Statements of Operations.
MTD designs, manufactures and distributes lawn tractors, zero turn ride on mowers, walk behind mowers, snow blowers, residential robotic mowers, handheld outdoor power equipment and garden tools for both residential and professional consumers under well-known brands like Cub Cadet® and Troy-Bilt®. This combination will create a global leader in the outdoor category, with strong brands and growth opportunities. The results of MTD subsequent to the date of acquisition are included in the Company's Tools & Storage segment.
The MTD acquisition is being accounted for as a business combination using the acquisition method of accounting, which requires, among other things, certain assets acquired and liabilities assumed to be recognized at their fair values as of the acquisition date. The following table summarizes the estimated acquisition date value of identifiable net assets acquired and liabilities assumed:
(Millions of Dollars)
Cash and cash equivalents ..................................................................................................................... $ 111.6 Accounts receivable, net ........................................................................................................................ 272.6 Inventories, net ...................................................................................................................................... 900.7 Prepaid expenses and other assets ......................................................................................................... 97.7 Property, plant and equipment ............................................................................................................... 223.5 Trade names ........................................................................................................................................... 390.0 Customer relationships .......................................................................................................................... 450.0 Other assets ............................................................................................................................................ 36.8 Accounts payable ................................................................................................................................... (391.8) Accrued expenses .................................................................................................................................. (253.6) Deferred revenue ................................................................................................................................... (0.9) Long-term debt ...................................................................................................................................... (103.0) Deferred taxes ........................................................................................................................................ (194.3) Other liabilities ...................................................................................................................................... (71.3) Total identifiable net assets ................................................................................................................... $ 1,468.0 Goodwill ................................................................................................................................................ 436.7 Total consideration ............................................................................................................................... $ 1,904.7
The weighted-average useful life assigned to the definite-lived intangible assets was 15 years.
83
Goodwill is calculated as the excess of the consideration transferred over the net assets recognized and represents the expected cost synergies of the combined business and assembled workforce. It is estimated that $0.6 million of goodwill will be deductible for tax purposes.
The acquisition accounting for MTD is preliminary in certain respects. During the measurement period, the Company expects to record adjustments relating to the finalization of intangible assets, inventory and property, plant and equipment valuations, working capital accounts, and opening balance sheet contingencies, amongst others.
A single estimate of fair value results from a complex series of judgments about future events and uncertainties and relies heavily on estimates and assumptions. The Company’s judgments used to determine the estimated fair value assigned to each class of assets acquired and liabilities assumed, as well as asset lives, can materially impact the Company’s results from operations.
Excel
On November 12, 2021, the Company acquired Excel Industries ("Excel") for $373.6 million, net of cash acquired and an estimated working capital adjustment. Excel is a leading designer and manufacturer of premium commercial and residential turf-care equipment under the brands of Hustler Turf Equipment and BigDog Mower Co. The results of Excel subsequent to the date of acquisition are included in the Company's Tools & Storage segment.
The Company believes this is a strategically important bolt-on acquisition as it builds an outdoor products leader. The Excel acquisition is being accounted for as a business combination, which requires, among other things, certain assets acquired and liabilities assumed to be recognized at their fair values as of the acquisition date. The estimated value of identifiable net assets acquired, which includes $37.0 million of working capital, $48.7 million of deferred tax liabilities, and $203.5 million of intangible assets, is $200.3 million. The related goodwill is $173.3 million. The amount allocated to intangible assets includes $158.0 million for customer relationships. The weighted-average useful life assigned to the intangible assets was 14 years.
Goodwill is calculated as the excess of the consideration transferred over the net assets recognized and represents the expected cost synergies of the combined business and assembled workforce. It is estimated that $0.6 million of goodwill will be deductible for tax purposes.
The acquisition accounting for Excel is preliminary in certain respects. During the measurement period, the Company expects to record adjustments relating to the finalization of intangible and inventory valuations, working capital accounts, and opening balance sheet contingencies, amongst others.
A single estimate of fair value results from a complex series of judgments about future events and uncertainties and relies heavily on estimates and assumptions. The Company’s judgments used to determine the estimated fair value assigned to each class of assets acquired and liabilities assumed, as well as asset lives, can materially impact the Company’s results from operations.
Other 2021 Acquisitions
During 2021, the Company completed two other acquisitions for a total purchase price of $207.3 million, net of cash acquired. The estimated acquisition date value of the identifiable net assets acquired is $49.5 million and working capital is $36.4 million. The related goodwill is $157.8 million. The results of these acquisitions subsequent to the dates of acquisition are included in the Company's Tools & Storage segment.
Goodwill is calculated as the excess of the consideration transferred over the net assets recognized and represents the expected cost synergies of the combined business and assembled workforce. It is estimated that $44.5 million of goodwill will be deductible for tax purposes.
The acquisition accounting for these acquisitions is preliminary in certain respects. During the measurement period, the Company expects to record adjustments relating to working capital accounts, various opening balance sheet contingencies and various income tax matters, amongst others.
2020 ACQUISITION
CAM
84
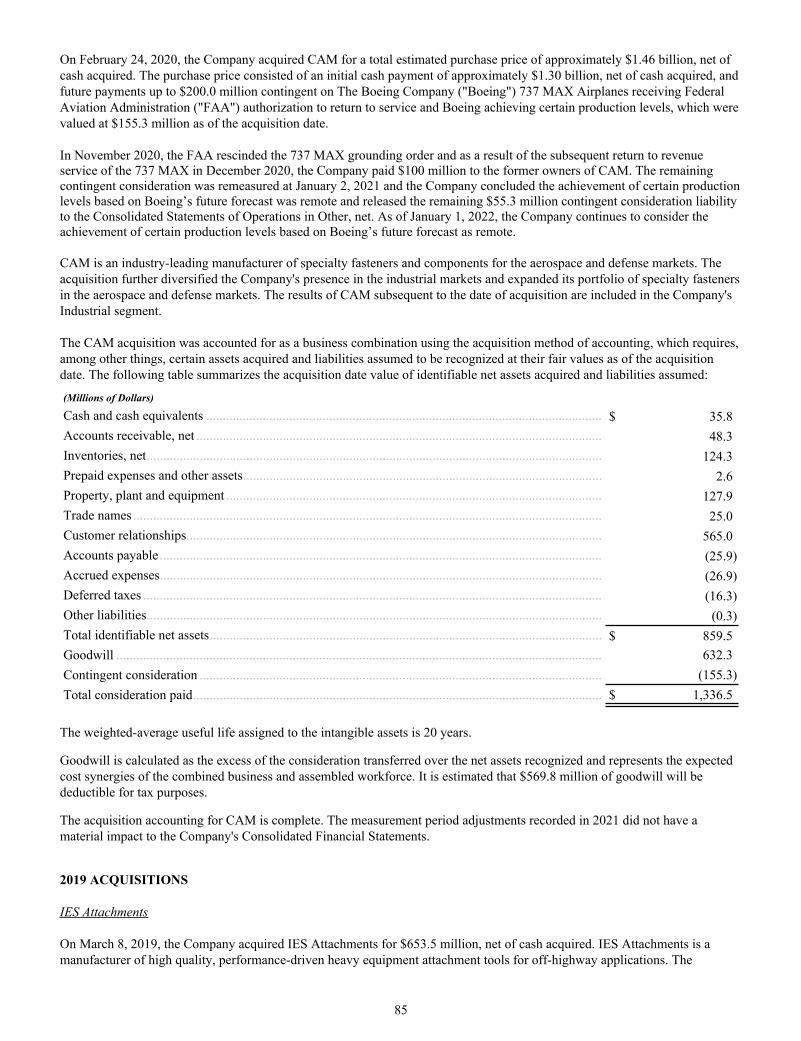
On February 24, 2020, the Company acquired CAM for a total estimated purchase price of approximately $1.46 billion, net of cash acquired. The purchase price consisted of an initial cash payment of approximately $1.30 billion, net of cash acquired, and future payments up to $200.0 million contingent on The Boeing Company ("Boeing") 737 MAX Airplanes receiving Federal Aviation Administration ("FAA") authorization to return to service and Boeing achieving certain production levels, which were valued at $155.3 million as of the acquisition date.
In November 2020, the FAA rescinded the 737 MAX grounding order and as a result of the subsequent return to revenue service of the 737 MAX in December 2020, the Company paid $100 million to the former owners of CAM. The remaining contingent consideration was remeasured at January 2, 2021 and the Company concluded the achievement of certain production levels based on Boeing’s future forecast was remote and released the remaining $55.3 million contingent consideration liability to the Consolidated Statements of Operations in Other, net. As of January 1, 2022, the Company continues to consider the achievement of certain production levels based on Boeing’s future forecast as remote.
CAM is an industry-leading manufacturer of specialty fasteners and components for the aerospace and defense markets. The acquisition further diversified the Company's presence in the industrial markets and expanded its portfolio of specialty fasteners in the aerospace and defense markets. The results of CAM subsequent to the date of acquisition are included in the Company's Industrial segment.
The CAM acquisition was accounted for as a business combination using the acquisition method of accounting, which requires, among other things, certain assets acquired and liabilities assumed to be recognized at their fair values as of the acquisition date. The following table summarizes the acquisition date value of identifiable net assets acquired and liabilities assumed:
(Millions of Dollars)
Cash and cash equivalents ....................................................................................................................... $ 35.8 Accounts receivable, net .......................................................................................................................... 48.3 Inventories, net ......................................................................................................................................... 124.3 Prepaid expenses and other assets ............................................................................................................ 2.6 Property, plant and equipment ................................................................................................................. 127.9 Trade names ............................................................................................................................................. 25.0 Customer relationships ............................................................................................................................. 565.0 Accounts payable ..................................................................................................................................... (25.9) Accrued expenses ..................................................................................................................................... (26.9) Deferred taxes .......................................................................................................................................... (16.3) Other liabilities ......................................................................................................................................... (0.3) Total identifiable net assets ...................................................................................................................... $ 859.5 Goodwill .................................................................................................................................................. 632.3 Contingent consideration ......................................................................................................................... (155.3) Total consideration paid ........................................................................................................................... $ 1,336.5
The weighted-average useful life assigned to the intangible assets is 20 years.
Goodwill is calculated as the excess of the consideration transferred over the net assets recognized and represents the expected cost synergies of the combined business and assembled workforce. It is estimated that $569.8 million of goodwill will be deductible for tax purposes.
The acquisition accounting for CAM is complete. The measurement period adjustments recorded in 2021 did not have a material impact to the Company's Consolidated Financial Statements.
2019 ACQUISITIONS
IES Attachments
On March 8, 2019, the Company acquired IES Attachments for $653.5 million, net of cash acquired. IES Attachments is a manufacturer of high quality, performance-driven heavy equipment attachment tools for off-highway applications. The
85
acquisition further diversified the Company's presence in the industrial markets, expanded its portfolio of attachment solutions and provided a meaningful platform for growth. The results of IES Attachments subsequent to the date of acquisition are included in the Company's Industrial segment.
The IES Attachments acquisition was accounted for as a business combination using the acquisition method of accounting, which requires, among other things, certain assets acquired and liabilities assumed to be recognized at their fair values as of the acquisition date. The estimated acquisition date value of identifiable net assets acquired, which included $77.8 million of working capital (primarily inventory), $78.3 million of deferred tax liabilities, and $328.0 million of intangible assets, was $342.2 million. The related goodwill was $311.3 million. The amount allocated to intangible assets included $304.0 million for customer relationships. The weighted-average useful life assigned to the intangible assets was 14 years.
Goodwill was calculated as the excess of the consideration transferred over the net assets recognized and represents the expected cost synergies of the combined business and assembled workforce. It is estimated that $2.4 million of goodwill, relating to the pre-acquisition historical tax basis of goodwill, will be deductible for tax purposes.
The acquisition accounting for IES Attachments is complete. The measurement period adjustments recorded in 2020 did not have a material impact to the Company's Consolidated Financial Statements.
Other 2019 Acquisitions
During 2019, the Company completed two other acquisitions for $32.4 million, net of cash acquired. The estimated acquisition date value of the identifiable net assets acquired, which included $6.3 million of working capital and $4.4 million of customer relationships, was $15.7 million. The related goodwill was $16.7 million. The useful lives assigned to the customer relationships was 10 years. The results of these acquisitions subsequent to the dates of acquisition are included in the Company's Industrial segment and Mechanical Access Solutions. The acquisition accounting for these acquisitions is complete. The measurement period adjustments recorded in 2020 did not have a material impact to the Company's Consolidated Financial Statements.
ACTUAL AND PRO-FORMA IMPACT FROM ACQUISITIONS
Actual Impact from Acquisitions
The net sales and net loss from the 2021 acquisitions included in the Company's Consolidated Statements of Operations for the year ended January 1, 2022 are shown in the table below. The net loss includes amortization expense relating to intangible assets recorded upon acquisition, inventory step-up charges, transaction costs, gain on MTD investment, contingent consideration expense, and other integration-related costs.
(Millions of Dollars) 2021
Net sales ............................................................................................................................................................... $ 235.5 Net loss from continuing operations attributable to common shareowners ......................................................... $ (49.7)
Pro-forma Impact from Acquisitions
The following table presents supplemental pro-forma information as if the 2021 acquisitions had occurred on December 29, 2019 and the 2020 acquisitions had occurred on December 30, 2018. The pro-forma consolidated results are not necessarily indicative of what the Company’s consolidated net sales and net earnings would have been had the Company completed the acquisitions on the aforementioned dates. In addition, the pro-forma consolidated results do not purport to project the future results of the Company.
(Millions of Dollars, except per share amounts) 2021 2020
Net sales ....................................................................................................................................... $ 18,226.7 $ 16,000.5 Net earnings from continuing operations attributable to common shareowners - Diluted ............ 1,714.3 1,138.4 Diluted earnings per share of common stock - Continuing operations ......................................... $ 10.39 $ 7.01
86
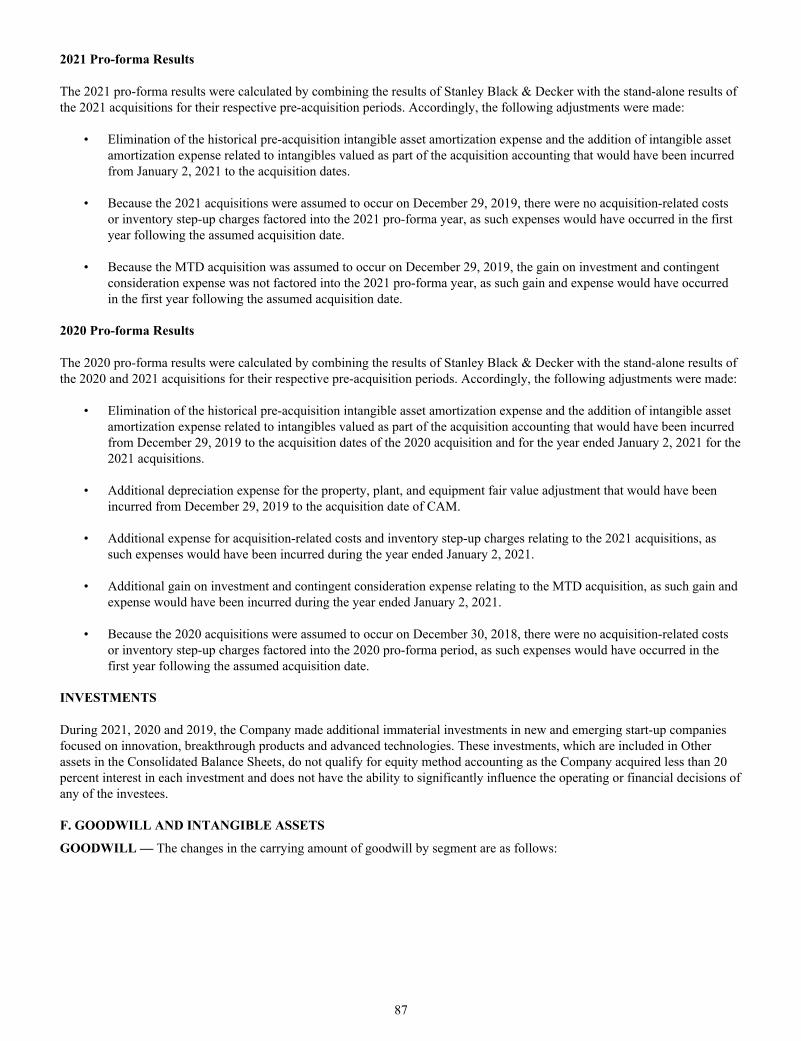
2021 Pro-forma Results
The 2021 pro-forma results were calculated by combining the results of Stanley Black & Decker with the stand-alone results of the 2021 acquisitions for their respective pre-acquisition periods. Accordingly, the following adjustments were made:
• Elimination of the historical pre-acquisition intangible asset amortization expense and the addition of intangible asset amortization expense related to intangibles valued as part of the acquisition accounting that would have been incurred from January 2, 2021 to the acquisition dates.
• Because the 2021 acquisitions were assumed to occur on December 29, 2019, there were no acquisition-related costs or inventory step-up charges factored into the 2021 pro-forma year, as such expenses would have occurred in the first year following the assumed acquisition date.
• Because the MTD acquisition was assumed to occur on December 29, 2019, the gain on investment and contingent consideration expense was not factored into the 2021 pro-forma year, as such gain and expense would have occurred in the first year following the assumed acquisition date.
2020 Pro-forma Results
The 2020 pro-forma results were calculated by combining the results of Stanley Black & Decker with the stand-alone results of the 2020 and 2021 acquisitions for their respective pre-acquisition periods. Accordingly, the following adjustments were made:
• Elimination of the historical pre-acquisition intangible asset amortization expense and the addition of intangible asset amortization expense related to intangibles valued as part of the acquisition accounting that would have been incurred from December 29, 2019 to the acquisition dates of the 2020 acquisition and for the year ended January 2, 2021 for the 2021 acquisitions.
• Additional depreciation expense for the property, plant, and equipment fair value adjustment that would have been incurred from December 29, 2019 to the acquisition date of CAM.
• Additional expense for acquisition-related costs and inventory step-up charges relating to the 2021 acquisitions, as such expenses would have been incurred during the year ended January 2, 2021.
• Additional gain on investment and contingent consideration expense relating to the MTD acquisition, as such gain and expense would have been incurred during the year ended January 2, 2021.
• Because the 2020 acquisitions were assumed to occur on December 30, 2018, there were no acquisition-related costs or inventory step-up charges factored into the 2020 pro-forma period, as such expenses would have occurred in the first year following the assumed acquisition date.
INVESTMENTS
During 2021, 2020 and 2019, the Company made additional immaterial investments in new and emerging start-up companies focused on innovation, breakthrough products and advanced technologies. These investments, which are included in Other assets in the Consolidated Balance Sheets, do not qualify for equity method accounting as the Company acquired less than 20 percent interest in each investment and does not have the ability to significantly influence the operating or financial decisions of any of the investees.
F. GOODWILL AND INTANGIBLE ASSETS
GOODWILL — The changes in the carrying amount of goodwill by segment are as follows:
87
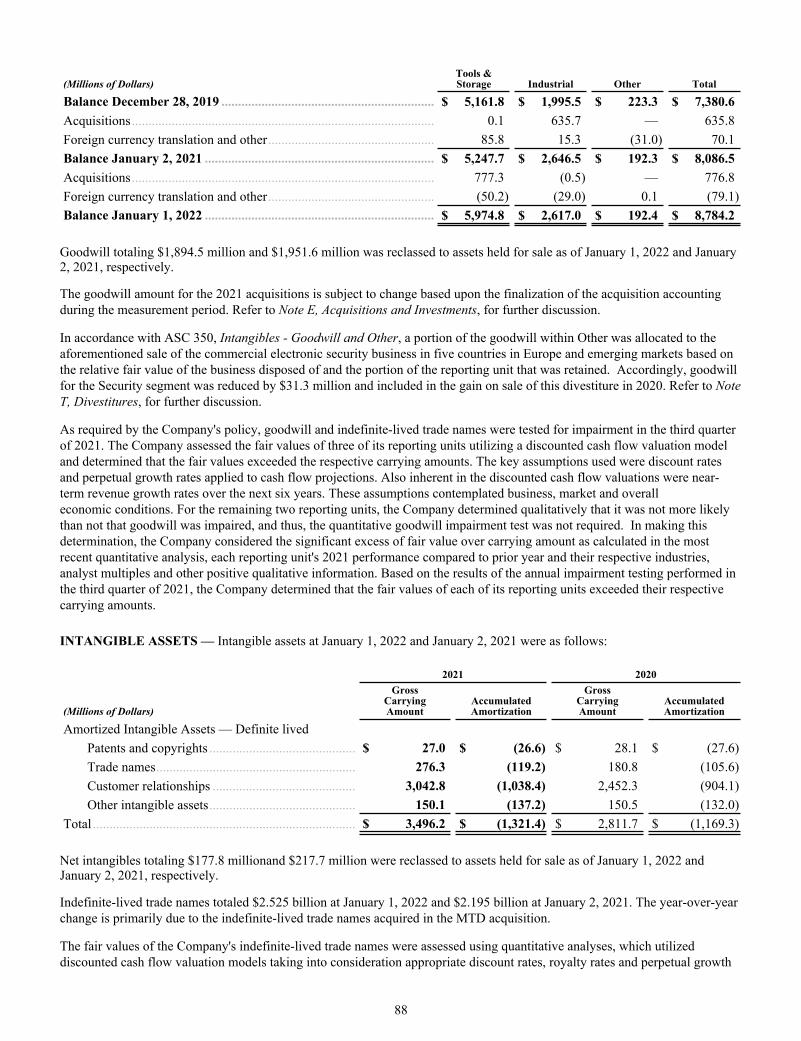
(Millions of Dollars)Tools & Storage Industrial Other Total
Balance December 28, 2019 ................................................................ $ 5,161.8 $ 1,995.5 $ 223.3 $ 7,380.6 Acquisitions ........................................................................................... 0.1 635.7 — 635.8 Foreign currency translation and other .................................................. 85.8 15.3 (31.0) 70.1 Balance January 2, 2021 ..................................................................... $ 5,247.7 $ 2,646.5 $ 192.3 $ 8,086.5 Acquisitions ........................................................................................... 777.3 (0.5) — 776.8 Foreign currency translation and other .................................................. (50.2) (29.0) 0.1 (79.1) Balance January 1, 2022 ..................................................................... $ 5,974.8 $ 2,617.0 $ 192.4 $ 8,784.2
Goodwill totaling $1,894.5 million and $1,951.6 million was reclassed to assets held for sale as of January 1, 2022 and January 2, 2021, respectively.
The goodwill amount for the 2021 acquisitions is subject to change based upon the finalization of the acquisition accounting during the measurement period. Refer to Note E, Acquisitions and Investments, for further discussion.
In accordance with ASC 350, Intangibles - Goodwill and Other, a portion of the goodwill within Other was allocated to the aforementioned sale of the commercial electronic security business in five countries in Europe and emerging markets based on the relative fair value of the business disposed of and the portion of the reporting unit that was retained. Accordingly, goodwill for the Security segment was reduced by $31.3 million and included in the gain on sale of this divestiture in 2020. Refer to Note T, Divestitures, for further discussion.
As required by the Company's policy, goodwill and indefinite-lived trade names were tested for impairment in the third quarter of 2021. The Company assessed the fair values of three of its reporting units utilizing a discounted cash flow valuation model and determined that the fair values exceeded the respective carrying amounts. The key assumptions used were discount rates and perpetual growth rates applied to cash flow projections. Also inherent in the discounted cash flow valuations were near-term revenue growth rates over the next six years. These assumptions contemplated business, market and overall economic conditions. For the remaining two reporting units, the Company determined qualitatively that it was not more likely than not that goodwill was impaired, and thus, the quantitative goodwill impairment test was not required. In making this determination, the Company considered the significant excess of fair value over carrying amount as calculated in the most recent quantitative analysis, each reporting unit's 2021 performance compared to prior year and their respective industries, analyst multiples and other positive qualitative information. Based on the results of the annual impairment testing performed in the third quarter of 2021, the Company determined that the fair values of each of its reporting units exceeded their respective carrying amounts.
INTANGIBLE ASSETS — Intangible assets at January 1, 2022 and January 2, 2021 were as follows: 2021 2020
(Millions of Dollars)
GrossCarryingAmount
AccumulatedAmortization
GrossCarryingAmount
AccumulatedAmortization
Amortized Intangible Assets — Definite livedPatents and copyrights ............................................ $ 27.0 $ (26.6) $ 28.1 $ (27.6) Trade names ............................................................ 276.3 (119.2) 180.8 (105.6) Customer relationships ........................................... 3,042.8 (1,038.4) 2,452.3 (904.1) Other intangible assets ............................................ 150.1 (137.2) 150.5 (132.0)
Total ............................................................................... $ 3,496.2 $ (1,321.4) $ 2,811.7 $ (1,169.3)
Net intangibles totaling $177.8 millionand $217.7 million were reclassed to assets held for sale as of January 1, 2022 and January 2, 2021, respectively.
Indefinite-lived trade names totaled $2.525 billion at January 1, 2022 and $2.195 billion at January 2, 2021. The year-over-year change is primarily due to the indefinite-lived trade names acquired in the MTD acquisition.
The fair values of the Company's indefinite-lived trade names were assessed using quantitative analyses, which utilized discounted cash flow valuation models taking into consideration appropriate discount rates, royalty rates and perpetual growth
88
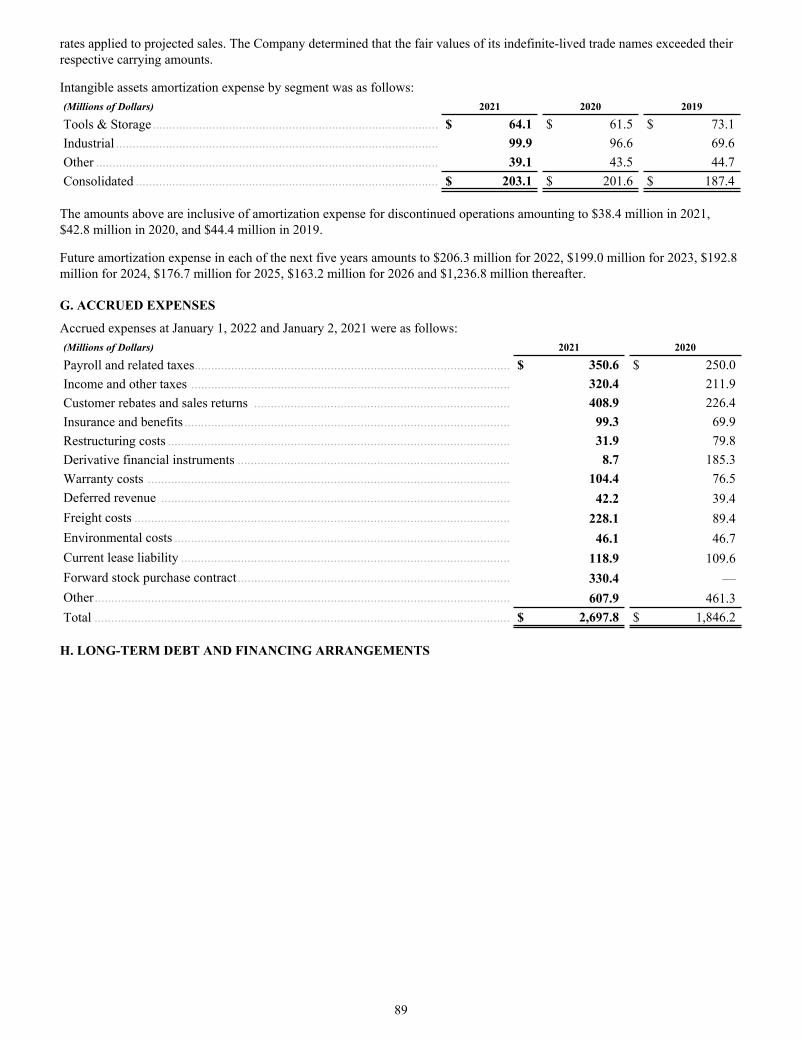
rates applied to projected sales. The Company determined that the fair values of its indefinite-lived trade names exceeded their respective carrying amounts.
Intangible assets amortization expense by segment was as follows:(Millions of Dollars) 2021 2020 2019
Tools & Storage ...................................................................................... $ 64.1 $ 61.5 $ 73.1 Industrial ................................................................................................. 99.9 96.6 69.6 Other ....................................................................................................... 39.1 43.5 44.7 Consolidated ........................................................................................... $ 203.1 $ 201.6 $ 187.4
The amounts above are inclusive of amortization expense for discontinued operations amounting to $38.4 million in 2021, $42.8 million in 2020, and $44.4 million in 2019.
Future amortization expense in each of the next five years amounts to $206.3 million for 2022, $199.0 million for 2023, $192.8 million for 2024, $176.7 million for 2025, $163.2 million for 2026 and $1,236.8 million thereafter.
G. ACCRUED EXPENSES
Accrued expenses at January 1, 2022 and January 2, 2021 were as follows:(Millions of Dollars) 2021 2020
Payroll and related taxes ............................................................................................... $ 350.6 $ 250.0 Income and other taxes ................................................................................................ 320.4 211.9 Customer rebates and sales returns ............................................................................. 408.9 226.4 Insurance and benefits .................................................................................................. 99.3 69.9 Restructuring costs ....................................................................................................... 31.9 79.8 Derivative financial instruments .................................................................................. 8.7 185.3 Warranty costs
............................................................................................................. 104.4 76.5 Deferred revenue ......................................................................................................... 42.2 39.4 Freight costs ................................................................................................................. 228.1 89.4 Environmental costs ..................................................................................................... 46.1 46.7 Current lease liability ................................................................................................... 118.9 109.6 Forward stock purchase contract .................................................................................. 330.4 — Other ............................................................................................................................. 607.9 461.3 Total ............................................................................................................................. $ 2,697.8 $ 1,846.2
H. LONG-TERM DEBT AND FINANCING ARRANGEMENTS
89
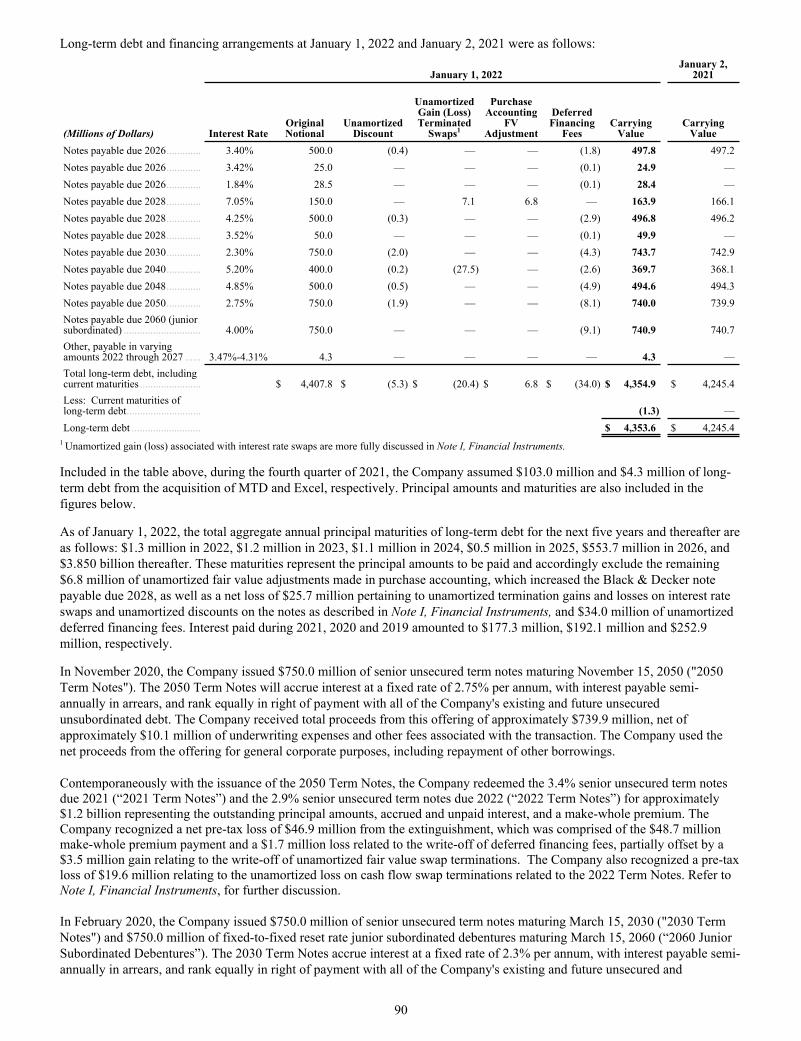
Long-term debt and financing arrangements at January 1, 2022 and January 2, 2021 were as follows:
January 1, 2022January 2,
2021
(Millions of Dollars) Interest RateOriginal Notional
Unamortized Discount
Unamortized Gain (Loss) Terminated
Swaps1
Purchase Accounting
FV Adjustment
Deferred Financing
FeesCarrying
Value Carrying
ValueNotes payable due 2026 ............. 3.40% 500.0 (0.4) — — (1.8) 497.8 497.2 Notes payable due 2026 ............. 3.42% 25.0 — — — (0.1) 24.9 — Notes payable due 2026 ............. 1.84% 28.5 — — — (0.1) 28.4 — Notes payable due 2028 ............. 7.05% 150.0 — 7.1 6.8 — 163.9 166.1 Notes payable due 2028 ............. 4.25% 500.0 (0.3) — — (2.9) 496.8 496.2 Notes payable due 2028 ............. 3.52% 50.0 — — — (0.1) 49.9 — Notes payable due 2030 ............. 2.30% 750.0 (2.0) — — (4.3) 743.7 742.9 Notes payable due 2040 ............. 5.20% 400.0 (0.2) (27.5) — (2.6) 369.7 368.1 Notes payable due 2048 ............. 4.85% 500.0 (0.5) — — (4.9) 494.6 494.3 Notes payable due 2050 ............. 2.75% 750.0 (1.9) — — (8.1) 740.0 739.9 Notes payable due 2060 (junior subordinated) ............................. 4.00% 750.0 — — — (9.1) 740.9 740.7 Other, payable in varying amounts 2022 through 2027 ...... 3.47%-4.31% 4.3 — — — — 4.3 — Total long-term debt, including current maturities ....................... $ 4,407.8 $ (5.3) $ (20.4) $ 6.8 $ (34.0) $ 4,354.9 $ 4,245.4 Less: Current maturities of long-term debt ............................ (1.3) — Long-term debt .......................... $ 4,353.6 $ 4,245.4
1 Unamortized gain (loss) associated with interest rate swaps are more fully discussed in Note I, Financial Instruments.
Included in the table above, during the fourth quarter of 2021, the Company assumed $103.0 million and $4.3 million of long-term debt from the acquisition of MTD and Excel, respectively. Principal amounts and maturities are also included in the figures below.
As of January 1, 2022, the total aggregate annual principal maturities of long-term debt for the next five years and thereafter are as follows: $1.3 million in 2022, $1.2 million in 2023, $1.1 million in 2024, $0.5 million in 2025, $553.7 million in 2026, and $3.850 billion thereafter. These maturities represent the principal amounts to be paid and accordingly exclude the remaining $6.8 million of unamortized fair value adjustments made in purchase accounting, which increased the Black & Decker note payable due 2028, as well as a net loss of $25.7 million pertaining to unamortized termination gains and losses on interest rate swaps and unamortized discounts on the notes as described in Note I, Financial Instruments, and $34.0 million of unamortized deferred financing fees. Interest paid during 2021, 2020 and 2019 amounted to $177.3 million, $192.1 million and $252.9 million, respectively.
In November 2020, the Company issued $750.0 million of senior unsecured term notes maturing November 15, 2050 ("2050 Term Notes"). The 2050 Term Notes will accrue interest at a fixed rate of 2.75% per annum, with interest payable semi-annually in arrears, and rank equally in right of payment with all of the Company's existing and future unsecured unsubordinated debt. The Company received total proceeds from this offering of approximately $739.9 million, net of approximately $10.1 million of underwriting expenses and other fees associated with the transaction. The Company used the net proceeds from the offering for general corporate purposes, including repayment of other borrowings.
Contemporaneously with the issuance of the 2050 Term Notes, the Company redeemed the 3.4% senior unsecured term notes due 2021 (“2021 Term Notes”) and the 2.9% senior unsecured term notes due 2022 (“2022 Term Notes”) for approximately $1.2 billion representing the outstanding principal amounts, accrued and unpaid interest, and a make-whole premium. The Company recognized a net pre-tax loss of $46.9 million from the extinguishment, which was comprised of the $48.7 million make-whole premium payment and a $1.7 million loss related to the write-off of deferred financing fees, partially offset by a $3.5 million gain relating to the write-off of unamortized fair value swap terminations. The Company also recognized a pre-tax loss of $19.6 million relating to the unamortized loss on cash flow swap terminations related to the 2022 Term Notes. Refer to Note I, Financial Instruments, for further discussion.
In February 2020, the Company issued $750.0 million of senior unsecured term notes maturing March 15, 2030 ("2030 Term Notes") and $750.0 million of fixed-to-fixed reset rate junior subordinated debentures maturing March 15, 2060 (“2060 Junior Subordinated Debentures”). The 2030 Term Notes accrue interest at a fixed rate of 2.3% per annum, with interest payable semi-annually in arrears, and rank equally in right of payment with all of the Company's existing and future unsecured and
90
unsubordinated debt. The 2060 Junior Subordinated Debentures bear interest at a fixed rate of 4.0% per annum, payable semi-annually in arrears, up to but excluding March 15, 2025. From and including March 15, 2025, the interest rate will be reset for each subsequent five-year reset period equal to the Five-Year Treasury Rate plus 2.657%. The Five-Year Treasury Rate is based on the average yields on actively traded U.S. treasury securities adjusted to constant maturity, for five-year maturities. On each five-year reset date, the 2060 Junior Subordinated Debentures can be called at 100% of the principal amount, plus accrued interest, if any. The 2060 Junior Subordinated Debentures are unsecured and rank subordinate and junior in right of payment to all of the Company’s existing and future senior debt. The Company received total net proceeds from these offerings of approximately $1.483 billion, net of underwriting expenses and other fees associated with the transactions. The net proceeds from these offerings were used for general corporate purposes, including acquisition funding.
In December 2013, the Company issued $400.0 million aggregate principal amount of 5.75% fixed-to-floating rate junior subordinated debentures maturing December 15, 2053 (“2053 Junior Subordinated Debentures”). The 2053 Junior Subordinated Debentures bore interest at a fixed rate of 5.75% per annum, payable semi-annually in arrears to, but excluding December 15, 2018. From and including December 15, 2018, the 2053 Junior Subordinated Debentures bore interest at an annual rate equal to three-month LIBOR plus 4.304%, payable quarterly in arrears. In February 2019, the Company redeemed all of the outstanding 2053 Junior Subordinated Debentures for $405.7 million, which represented 100% of the principal amount plus accrued and unpaid interest to the redemption date. The Company recognized a net pre-tax loss of $3.2 million from the redemption, which was comprised of a $7.8 million loss related to the write-off of deferred financing fees partially offset by a $4.6 million gain relating to an unamortized terminated interest rate swap as described in more detailed in Note I, Financial Instruments.
In July 2012, the Company issued $750.0 million of junior subordinated debentures, maturing on July 25, 2052 (“2052 Junior Subordinated Debentures”) with fixed interest payable quarterly, in arrears, at a rate of 5.75% per annum. In December 2019, the Company redeemed all of the outstanding 2052 Junior Subordinated Debentures for $760.5 million, which represented 100% of the principal amount plus accrued and unpaid interest. The Company recognized a pre-tax loss of $17.9 million from the redemption related to the write-off of unamortized deferred financing fees.
Commercial Paper and Credit Facilities
In October 2021, the Company increased its commercial paper program from $3.0 billion to $3.5 billion, which includes Euro denominated borrowings in addition to U.S. Dollars. As of January 1, 2022, the Company had $2.2 billion of borrowings outstanding. As of January 2, 2021, the Company had no borrowings outstanding, Refer to Note I, Financial Instruments, for further discussion.
In September 2021, the Company amended and restated its existing five-year $2.0 billion committed credit facility with the concurrent execution of a new five year $2.5 billion committed credit facility (the "5-year Credit Agreement"). Borrowings under the 5-Year Credit Agreement may be made in U.S. Dollars, Euros or Pounds Sterling. A sub-limit amount of $814.3 million is designated for swing line advances which may be drawn in Euros pursuant to the terms of the 5-Year Credit Agreement. Borrowings bear interest at a floating rate plus an applicable margin dependent upon the denomination of the borrowing and specific terms of the 5-Year Credit Agreement. The Company must repay all advances under the 5-Year Credit Agreement by the earlier of September 8, 2026 or upon termination. The 5-Year Credit Agreement is designated to be a liquidity back-stop for the Company's $3.5 billion U.S. Dollar and Euro commercial paper program. As of January 1, 2022 and January 2, 2021, the Company had not drawn on its five-year committed credit facility.
In September 2021, the Company terminated its 364-day $1.0 billion credit facility and concurrently executed a new 364-Day $1.0 billion committed credit facility (the "364-Day Credit Agreement"). Borrowings under the 364-Day Credit Agreement may be made in U.S. Dollars or Euros and bear interest at a floating rate plus an applicable margin dependent upon the denomination of the borrowing and pursuant to the terms of the 364-Day Credit Agreement. The Company must repay all advances under the 364-Day Credit Agreement by the earlier of September 7, 2022 or upon termination. The Company may, however, convert all advances outstanding upon termination into a term loan that shall be repaid in full no later than the first anniversary of the termination date provided that the Company, among other things, pays a fee to the administrative agent for the account of each lender. The 364-Day Credit Agreement serves as part of the liquidity back-stop for the Company’s $3.5 billion U.S. Dollar and Euro commercial paper program. As of January 1, 2022 and January 2, 2021, the Company had not drawn on this 364-Day committed credit facility.
In November 2021, the Company executed a second 364-Day $1.0 billion committed credit facility (the "Second 364-Day Credit Agreement"). Borrowings under the Second 364-Day Credit Agreement may be made in U.S. Dollars and Euros and bear interest at a base rate plus an applicable margin determined at the time of borrowing. The Company must repay all advances under the Second 364-Day Credit Agreement by the earlier of November 15, 2022 or upon termination. The Company may, however, convert all advances outstanding upon termination into a term loan that shall be repaid in full no later than the first
91
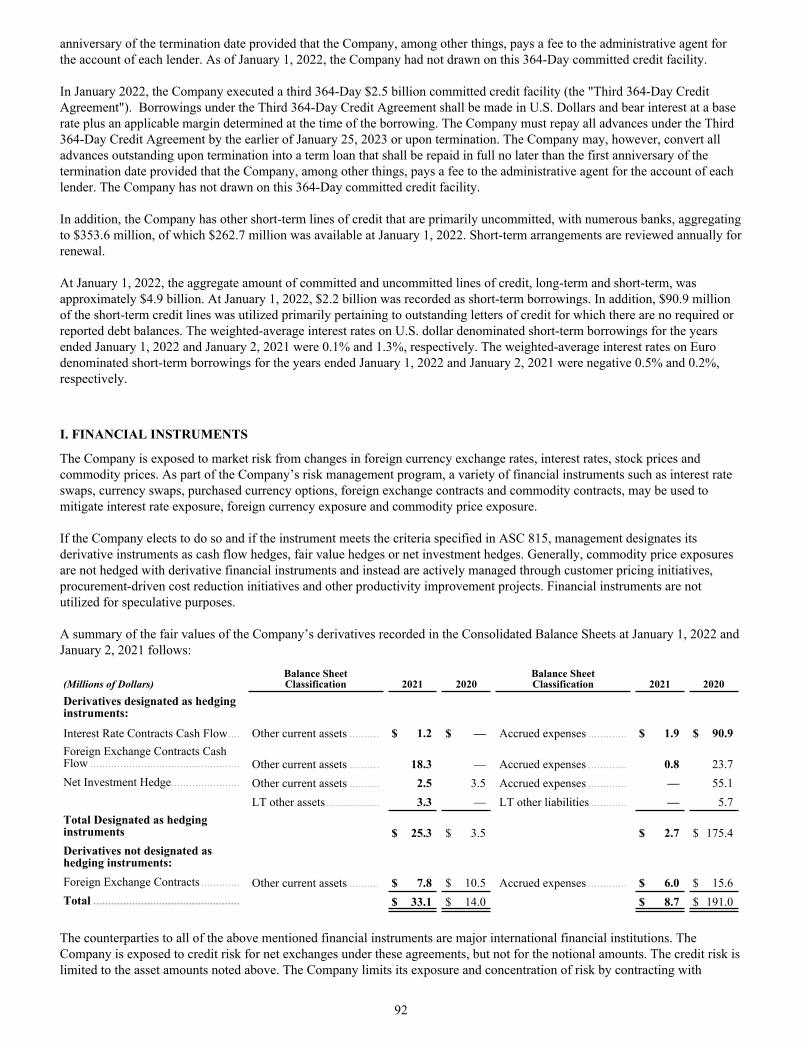
anniversary of the termination date provided that the Company, among other things, pays a fee to the administrative agent for the account of each lender. As of January 1, 2022, the Company had not drawn on this 364-Day committed credit facility.
In January 2022, the Company executed a third 364-Day $2.5 billion committed credit facility (the "Third 364-Day Credit Agreement"). Borrowings under the Third 364-Day Credit Agreement shall be made in U.S. Dollars and bear interest at a base rate plus an applicable margin determined at the time of the borrowing. The Company must repay all advances under the Third 364-Day Credit Agreement by the earlier of January 25, 2023 or upon termination. The Company may, however, convert all advances outstanding upon termination into a term loan that shall be repaid in full no later than the first anniversary of the termination date provided that the Company, among other things, pays a fee to the administrative agent for the account of each lender. The Company has not drawn on this 364-Day committed credit facility.
In addition, the Company has other short-term lines of credit that are primarily uncommitted, with numerous banks, aggregating to $353.6 million, of which $262.7 million was available at January 1, 2022. Short-term arrangements are reviewed annually for renewal.
At January 1, 2022, the aggregate amount of committed and uncommitted lines of credit, long-term and short-term, was approximately $4.9 billion. At January 1, 2022, $2.2 billion was recorded as short-term borrowings. In addition, $90.9 million of the short-term credit lines was utilized primarily pertaining to outstanding letters of credit for which there are no required or reported debt balances. The weighted-average interest rates on U.S. dollar denominated short-term borrowings for the years ended January 1, 2022 and January 2, 2021 were 0.1% and 1.3%, respectively. The weighted-average interest rates on Euro denominated short-term borrowings for the years ended January 1, 2022 and January 2, 2021 were negative 0.5% and 0.2%, respectively.
I. FINANCIAL INSTRUMENTS
The Company is exposed to market risk from changes in foreign currency exchange rates, interest rates, stock prices and commodity prices. As part of the Company’s risk management program, a variety of financial instruments such as interest rate swaps, currency swaps, purchased currency options, foreign exchange contracts and commodity contracts, may be used to mitigate interest rate exposure, foreign currency exposure and commodity price exposure.
If the Company elects to do so and if the instrument meets the criteria specified in ASC 815, management designates its derivative instruments as cash flow hedges, fair value hedges or net investment hedges. Generally, commodity price exposures are not hedged with derivative financial instruments and instead are actively managed through customer pricing initiatives, procurement-driven cost reduction initiatives and other productivity improvement projects. Financial instruments are not utilized for speculative purposes.
A summary of the fair values of the Company’s derivatives recorded in the Consolidated Balance Sheets at January 1, 2022 and January 2, 2021 follows:
(Millions of Dollars)Balance SheetClassification 2021 2020
Balance SheetClassification 2021 2020
Derivatives designated as hedging instruments:
Interest Rate Contracts Cash Flow .... Other current assets .......... $ 1.2 $ — Accrued expenses ............. $ 1.9 $ 90.9 Foreign Exchange Contracts Cash Flow .................................................. Other current assets .......... 18.3 — Accrued expenses ............. 0.8 23.7 Net Investment Hedge ....................... Other current assets .......... 2.5 3.5 Accrued expenses ............. — 55.1
LT other assets .................. 3.3 — LT other liabilities ............ — 5.7 Total Designated as hedging instruments $ 25.3 $ 3.5 $ 2.7 $ 175.4 Derivatives not designated as hedging instruments:Foreign Exchange Contracts ............. Other current assets .......... $ 7.8 $ 10.5 Accrued expenses ............. $ 6.0 $ 15.6 Total ................................................. $ 33.1 $ 14.0 $ 8.7 $ 191.0
The counterparties to all of the above mentioned financial instruments are major international financial institutions. The Company is exposed to credit risk for net exchanges under these agreements, but not for the notional amounts. The credit risk is limited to the asset amounts noted above. The Company limits its exposure and concentration of risk by contracting with
92
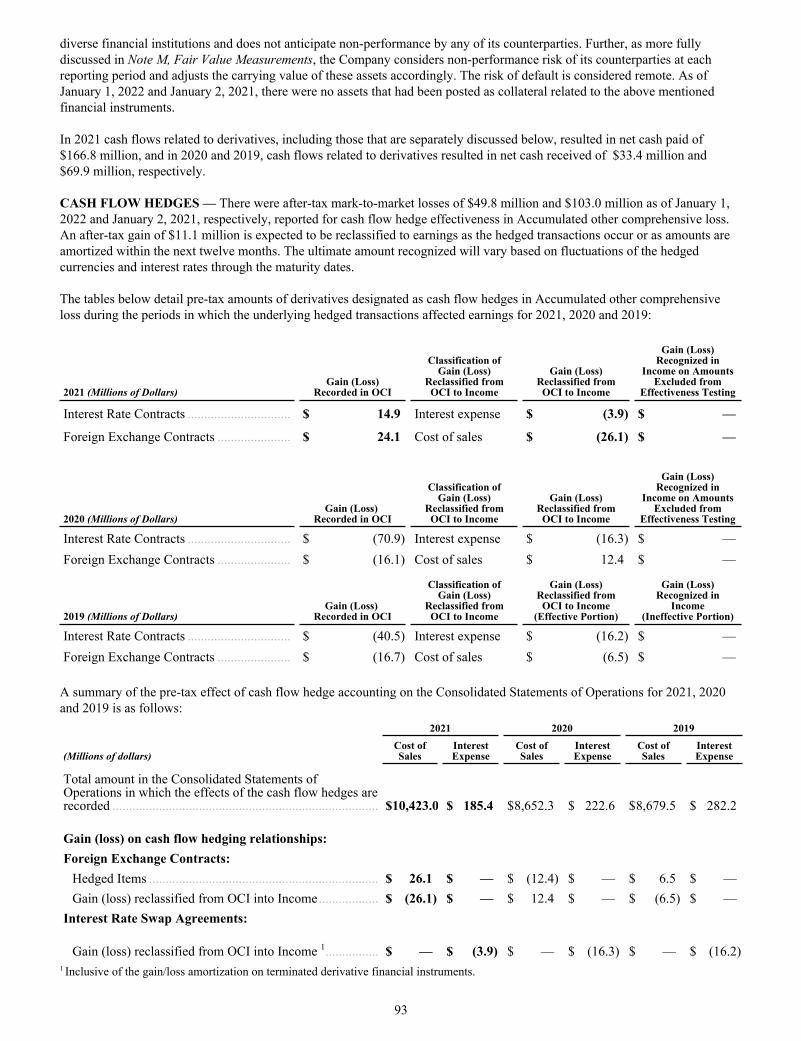
diverse financial institutions and does not anticipate non-performance by any of its counterparties. Further, as more fully discussed in Note M, Fair Value Measurements, the Company considers non-performance risk of its counterparties at each reporting period and adjusts the carrying value of these assets accordingly. The risk of default is considered remote. As of January 1, 2022 and January 2, 2021, there were no assets that had been posted as collateral related to the above mentioned financial instruments.
In 2021 cash flows related to derivatives, including those that are separately discussed below, resulted in net cash paid of $166.8 million, and in 2020 and 2019, cash flows related to derivatives resulted in net cash received of $33.4 million and $69.9 million, respectively.
CASH FLOW HEDGES — There were after-tax mark-to-market losses of $49.8 million and $103.0 million as of January 1, 2022 and January 2, 2021, respectively, reported for cash flow hedge effectiveness in Accumulated other comprehensive loss. An after-tax gain of $11.1 million is expected to be reclassified to earnings as the hedged transactions occur or as amounts are amortized within the next twelve months. The ultimate amount recognized will vary based on fluctuations of the hedged currencies and interest rates through the maturity dates.
The tables below detail pre-tax amounts of derivatives designated as cash flow hedges in Accumulated other comprehensive loss during the periods in which the underlying hedged transactions affected earnings for 2021, 2020 and 2019:
2021 (Millions of Dollars)Gain (Loss)
Recorded in OCI
Classification ofGain (Loss)
Reclassified fromOCI to Income
Gain (Loss)Reclassified from
OCI to Income
Gain (Loss)Recognized in
Income on Amounts Excluded from
Effectiveness Testing
Interest Rate Contracts ............................... $ 14.9 Interest expense $ (3.9) $ —
Foreign Exchange Contracts ...................... $ 24.1 Cost of sales $ (26.1) $ —
2020 (Millions of Dollars)Gain (Loss)
Recorded in OCI
Classification ofGain (Loss)
Reclassified fromOCI to Income
Gain (Loss)Reclassified from
OCI to Income
Gain (Loss)Recognized in
Income on Amounts Excluded from
Effectiveness Testing
Interest Rate Contracts ............................... $ (70.9) Interest expense $ (16.3) $ — Foreign Exchange Contracts ...................... $ (16.1) Cost of sales $ 12.4 $ —
2019 (Millions of Dollars)Gain (Loss)
Recorded in OCI
Classification ofGain (Loss)
Reclassified fromOCI to Income
Gain (Loss)Reclassified from
OCI to Income(Effective Portion)
Gain (Loss)Recognized in
Income(Ineffective Portion)
Interest Rate Contracts ............................... $ (40.5) Interest expense $ (16.2) $ — Foreign Exchange Contracts ...................... $ (16.7) Cost of sales $ (6.5) $ —
A summary of the pre-tax effect of cash flow hedge accounting on the Consolidated Statements of Operations for 2021, 2020 and 2019 is as follows:
2021 2020 2019
(Millions of dollars)Cost of Sales
Interest Expense
Cost of Sales
Interest Expense
Cost of Sales
Interest Expense
Total amount in the Consolidated Statements of Operations in which the effects of the cash flow hedges are recorded ................................................................................ $ 10,423.0 $ 185.4 $ 8,652.3 $ 222.6 $ 8,679.5 $ 282.2
Gain (loss) on cash flow hedging relationships:Foreign Exchange Contracts:
Hedged Items ..................................................................... $ 26.1 $ — $ (12.4) $ — $ 6.5 $ — Gain (loss) reclassified from OCI into Income .................. $ (26.1) $ — $ 12.4 $ — $ (6.5) $ —
Interest Rate Swap Agreements:
Gain (loss) reclassified from OCI into Income 1 ................ $ — $ (3.9) $ — $ (16.3) $ — $ (16.2) 1 Inclusive of the gain/loss amortization on terminated derivative financial instruments.
93
For 2021, 2020 and 2019 after-tax losses of $17.0 million, $15.4 million, and $13.1 million, respectively, were reclassified from Accumulated other comprehensive loss into earnings (inclusive of the gain/loss amortization on terminated derivative financial instruments) during the periods in which the underlying hedged transactions affected earnings.
Interest Rate Contracts: The Company enters into interest rate swap agreements in order to obtain the lowest cost source of funds within a targeted range of variable to fixed-rate debt proportions. During 2021, the Company entered into forward starting interest rate swaps totaling $400.0 million to offset expected variability on future interest rate payments associated with debt instruments expected to be issued in the future.
During 2020, the Company entered into forward starting interest rate swaps totaling $1.0 billion to offset expected variability on future interest rate payments associated with debt instruments expected to be issued in the future. The Company terminated these swaps in 2020 resulting in a loss of $20.5 million, which was recorded in Accumulated other comprehensive loss and is being amortized to interest expense over future periods.
During 2019, the Company entered into forward starting interest rate swaps totaling $650.0 million to offset expected variability on future interest rate payments associated with debt instruments expected to be issued in the future. During 2019, swaps with a notional amount of $250.0 million matured resulting in a loss of $1.0 million, which was recorded in Accumulated other comprehensive loss and is being amortized to earnings as interest expense over future periods. During 2021, the remaining notional amount of $400.0 million matured resulting in a loss of $75.3 million, which was recorded in Accumulated other comprehensive loss, and will be amortized to interest expense over future periods.
The cash flows stemming from the maturity and termination of such interest rate swaps designated as cash flow hedges discussed above are presented within other financing activities in the Consolidated Statements of Cash Flows.
In December 2020, the Company redeemed all of the outstanding 2021 Term Notes and 2022 Term Notes, as further discussed in Note H, Long-Term Debt and Financing Arrangements. As a result, the Company recorded a pre-tax loss of $19.6 million relating to the remaining unamortized loss on cash flow swap terminations related to the 2022 Term Notes.
As of January 1, 2022 and January 2, 2021, the Company had $400.0 million of forward starting swaps outstanding.
Foreign Currency Contracts
Forward Contracts: Through its global businesses, the Company enters into transactions and makes investments denominated in multiple currencies that give rise to foreign currency risk. The Company and its subsidiaries regularly purchase inventory from subsidiaries with functional currencies different than their own, which creates currency-related volatility in the Company’s results of operations. The Company utilizes forward contracts to hedge these forecasted purchases and sales of inventory. Gains and losses reclassified from Accumulated other comprehensive loss are recorded in Cost of sales as the hedged item affects earnings. There are no components excluded from the assessment of effectiveness for these contracts. At January 1, 2022, and January 2, 2021, the notional values of the forward currency contracts outstanding was $512.1 million and $595.8 million, respectively, maturing on various dates through 2022.
In January 2022, the Company entered into forward currency contracts with notional values totaling $100.0 million maturing on various dates in 2022.
Purchased Option Contracts: The Company and its subsidiaries have entered into various intercompany transactions whereby the notional values are denominated in currencies other than the functional currencies of the party executing the trade. In order to better match the cash flows of its intercompany obligations with cash flows from operations, the Company enters into purchased option contracts. Gains and losses reclassified from Accumulated other comprehensive loss are recorded in Cost of sales as the hedged item affects earnings. There are no components excluded from the assessment of effectiveness for these contracts. At January 1, 2022 and January 2, 2021 there were no outstanding option contracts.
FAIR VALUE HEDGES
Interest Rate Risk: In an effort to optimize the mix of fixed versus floating rate debt in the Company’s capital structure, the Company enters into interest rate swaps. In prior years, the Company entered into interest rate swaps related to certain of its notes payable which were subsequently terminated. Amortization of the gain/loss on previously terminated swaps is reported as a reduction of interest expense. Prior to termination, the changes in fair value of the swaps and the offsetting changes in fair
94
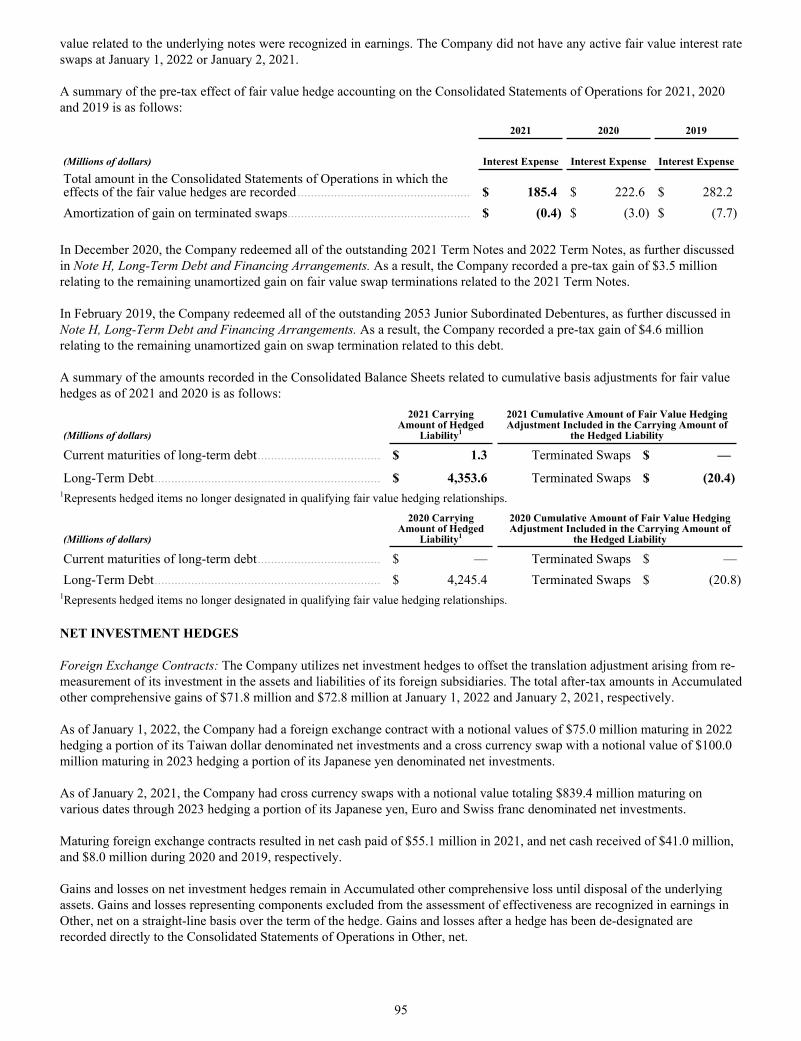
value related to the underlying notes were recognized in earnings. The Company did not have any active fair value interest rate swaps at January 1, 2022 or January 2, 2021.
A summary of the pre-tax effect of fair value hedge accounting on the Consolidated Statements of Operations for 2021, 2020 and 2019 is as follows:
2021 2020 2019
(Millions of dollars) Interest Expense Interest Expense Interest Expense
Total amount in the Consolidated Statements of Operations in which the effects of the fair value hedges are recorded .................................................... $ 185.4 $ 222.6 $ 282.2 Amortization of gain on terminated swaps ....................................................... $ (0.4) $ (3.0) $ (7.7)
In December 2020, the Company redeemed all of the outstanding 2021 Term Notes and 2022 Term Notes, as further discussed in Note H, Long-Term Debt and Financing Arrangements. As a result, the Company recorded a pre-tax gain of $3.5 million relating to the remaining unamortized gain on fair value swap terminations related to the 2021 Term Notes.
In February 2019, the Company redeemed all of the outstanding 2053 Junior Subordinated Debentures, as further discussed in Note H, Long-Term Debt and Financing Arrangements. As a result, the Company recorded a pre-tax gain of $4.6 million relating to the remaining unamortized gain on swap termination related to this debt.
A summary of the amounts recorded in the Consolidated Balance Sheets related to cumulative basis adjustments for fair value hedges as of 2021 and 2020 is as follows:
(Millions of dollars)
2021 Carrying Amount of Hedged
Liability1
2021 Cumulative Amount of Fair Value Hedging Adjustment Included in the Carrying Amount of
the Hedged Liability
Current maturities of long-term debt ..................................... $ 1.3 Terminated Swaps $ —
Long-Term Debt .................................................................... $ 4,353.6 Terminated Swaps $ (20.4) 1Represents hedged items no longer designated in qualifying fair value hedging relationships.
(Millions of dollars)
2020 Carrying Amount of Hedged
Liability1
2020 Cumulative Amount of Fair Value Hedging Adjustment Included in the Carrying Amount of
the Hedged Liability
Current maturities of long-term debt ..................................... $ — Terminated Swaps $ — Long-Term Debt .................................................................... $ 4,245.4 Terminated Swaps $ (20.8)
1Represents hedged items no longer designated in qualifying fair value hedging relationships.
NET INVESTMENT HEDGES
Foreign Exchange Contracts: The Company utilizes net investment hedges to offset the translation adjustment arising from re-measurement of its investment in the assets and liabilities of its foreign subsidiaries. The total after-tax amounts in Accumulated other comprehensive gains of $71.8 million and $72.8 million at January 1, 2022 and January 2, 2021, respectively.
As of January 1, 2022, the Company had a foreign exchange contract with a notional values of $75.0 million maturing in 2022 hedging a portion of its Taiwan dollar denominated net investments and a cross currency swap with a notional value of $100.0 million maturing in 2023 hedging a portion of its Japanese yen denominated net investments.
As of January 2, 2021, the Company had cross currency swaps with a notional value totaling $839.4 million maturing on various dates through 2023 hedging a portion of its Japanese yen, Euro and Swiss franc denominated net investments.
Maturing foreign exchange contracts resulted in net cash paid of $55.1 million in 2021, and net cash received of $41.0 million, and $8.0 million during 2020 and 2019, respectively.
Gains and losses on net investment hedges remain in Accumulated other comprehensive loss until disposal of the underlying assets. Gains and losses representing components excluded from the assessment of effectiveness are recognized in earnings in Other, net on a straight-line basis over the term of the hedge. Gains and losses after a hedge has been de-designated are recorded directly to the Consolidated Statements of Operations in Other, net.
95
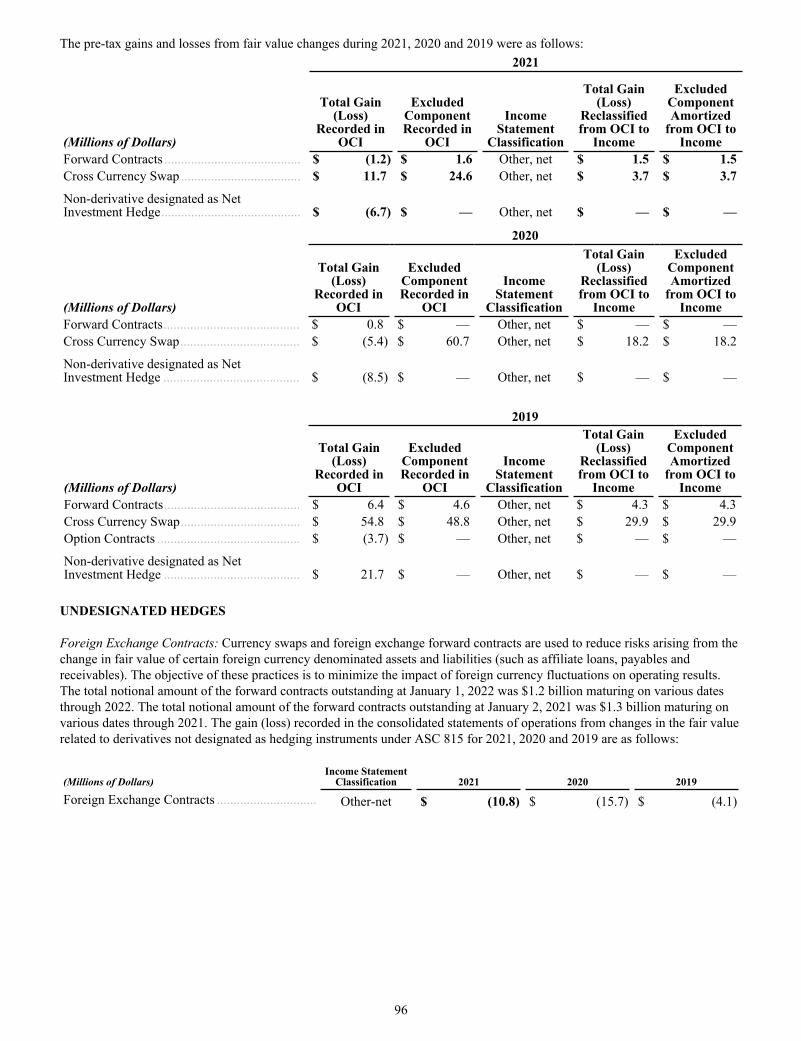
The pre-tax gains and losses from fair value changes during 2021, 2020 and 2019 were as follows:2021
(Millions of Dollars)
Total Gain (Loss)
Recorded in OCI
Excluded Component Recorded in
OCI
Income Statement
Classification
Total Gain (Loss)
Reclassified from OCI to
Income
Excluded Component Amortized
from OCI to Income
Forward Contracts ......................................... $ (1.2) $ 1.6 Other, net $ 1.5 $ 1.5 Cross Currency Swap .................................... $ 11.7 $ 24.6 Other, net $ 3.7 $ 3.7
Non-derivative designated as Net Investment Hedge .......................................... $ (6.7) $ — Other, net $ — $ —
2020
(Millions of Dollars)
Total Gain (Loss)
Recorded in OCI
Excluded Component Recorded in
OCI
Income Statement
Classification
Total Gain (Loss)
Reclassified from OCI to
Income
Excluded Component Amortized
from OCI to Income
Forward Contracts ......................................... $ 0.8 $ — Other, net $ — $ — Cross Currency Swap .................................... $ (5.4) $ 60.7 Other, net $ 18.2 $ 18.2
Non-derivative designated as Net Investment Hedge ......................................... $ (8.5) $ — Other, net $ — $ —
2019
(Millions of Dollars)
Total Gain (Loss)
Recorded in OCI
Excluded Component Recorded in
OCI
Income Statement
Classification
Total Gain (Loss)
Reclassified from OCI to
Income
Excluded Component Amortized
from OCI to Income
Forward Contracts ......................................... $ 6.4 $ 4.6 Other, net $ 4.3 $ 4.3 Cross Currency Swap .................................... $ 54.8 $ 48.8 Other, net $ 29.9 $ 29.9 Option Contracts ........................................... $ (3.7) $ — Other, net $ — $ —
Non-derivative designated as Net Investment Hedge ......................................... $ 21.7 $ — Other, net $ — $ —
UNDESIGNATED HEDGES
Foreign Exchange Contracts: Currency swaps and foreign exchange forward contracts are used to reduce risks arising from the change in fair value of certain foreign currency denominated assets and liabilities (such as affiliate loans, payables and receivables). The objective of these practices is to minimize the impact of foreign currency fluctuations on operating results. The total notional amount of the forward contracts outstanding at January 1, 2022 was $1.2 billion maturing on various dates through 2022. The total notional amount of the forward contracts outstanding at January 2, 2021 was $1.3 billion maturing on various dates through 2021. The gain (loss) recorded in the consolidated statements of operations from changes in the fair value related to derivatives not designated as hedging instruments under ASC 815 for 2021, 2020 and 2019 are as follows:
(Millions of Dollars)Income Statement
Classification 2021 2020 2019
Foreign Exchange Contracts .............................. Other-net $ (10.8) $ (15.7) $ (4.1)
96
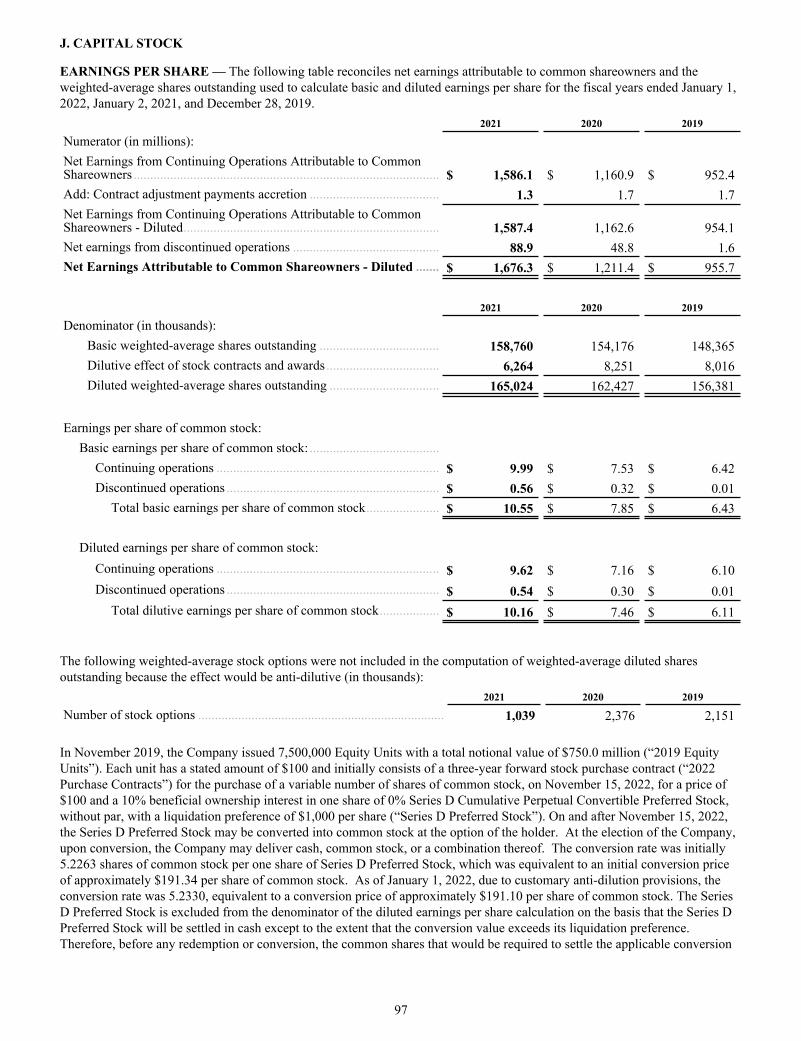
J. CAPITAL STOCK
EARNINGS PER SHARE — The following table reconciles net earnings attributable to common shareowners and the weighted-average shares outstanding used to calculate basic and diluted earnings per share for the fiscal years ended January 1, 2022, January 2, 2021, and December 28, 2019.
2021 2020 2019
Numerator (in millions):Net Earnings from Continuing Operations Attributable to Common Shareowners ............................................................................................ $ 1,586.1 $ 1,160.9 $ 952.4 Add: Contract adjustment payments accretion ....................................... 1.3 1.7 1.7 Net Earnings from Continuing Operations Attributable to Common Shareowners - Diluted ............................................................................. 1,587.4 1,162.6 954.1 Net earnings from discontinued operations ............................................ 88.9 48.8 1.6 Net Earnings Attributable to Common Shareowners - Diluted ....... $ 1,676.3 $ 1,211.4 $ 955.7
2021 2020 2019
Denominator (in thousands):Basic weighted-average shares outstanding .................................... 158,760 154,176 148,365 Dilutive effect of stock contracts and awards .................................. 6,264 8,251 8,016 Diluted weighted-average shares outstanding ................................. 165,024 162,427 156,381
Earnings per share of common stock:Basic earnings per share of common stock: .......................................
Continuing operations ................................................................... $ 9.99 $ 7.53 $ 6.42 Discontinued operations ................................................................ $ 0.56 $ 0.32 $ 0.01
Total basic earnings per share of common stock ...................... $ 10.55 $ 7.85 $ 6.43
Diluted earnings per share of common stock:Continuing operations ................................................................... $ 9.62 $ 7.16 $ 6.10 Discontinued operations ................................................................ $ 0.54 $ 0.30 $ 0.01
Total dilutive earnings per share of common stock .................. $ 10.16 $ 7.46 $ 6.11
The following weighted-average stock options were not included in the computation of weighted-average diluted shares outstanding because the effect would be anti-dilutive (in thousands):
2021 2020 2019
Number of stock options .......................................................................... 1,039 2,376 2,151
In November 2019, the Company issued 7,500,000 Equity Units with a total notional value of $750.0 million (“2019 Equity Units”). Each unit has a stated amount of $100 and initially consists of a three-year forward stock purchase contract (“2022 Purchase Contracts”) for the purchase of a variable number of shares of common stock, on November 15, 2022, for a price of $100 and a 10% beneficial ownership interest in one share of 0% Series D Cumulative Perpetual Convertible Preferred Stock, without par, with a liquidation preference of $1,000 per share (“Series D Preferred Stock”). On and after November 15, 2022, the Series D Preferred Stock may be converted into common stock at the option of the holder. At the election of the Company, upon conversion, the Company may deliver cash, common stock, or a combination thereof. The conversion rate was initially 5.2263 shares of common stock per one share of Series D Preferred Stock, which was equivalent to an initial conversion price of approximately $191.34 per share of common stock. As of January 1, 2022, due to customary anti-dilution provisions, the conversion rate was 5.2330, equivalent to a conversion price of approximately $191.10 per share of common stock. The Series D Preferred Stock is excluded from the denominator of the diluted earnings per share calculation on the basis that the Series D Preferred Stock will be settled in cash except to the extent that the conversion value exceeds its liquidation preference. Therefore, before any redemption or conversion, the common shares that would be required to settle the applicable conversion
97
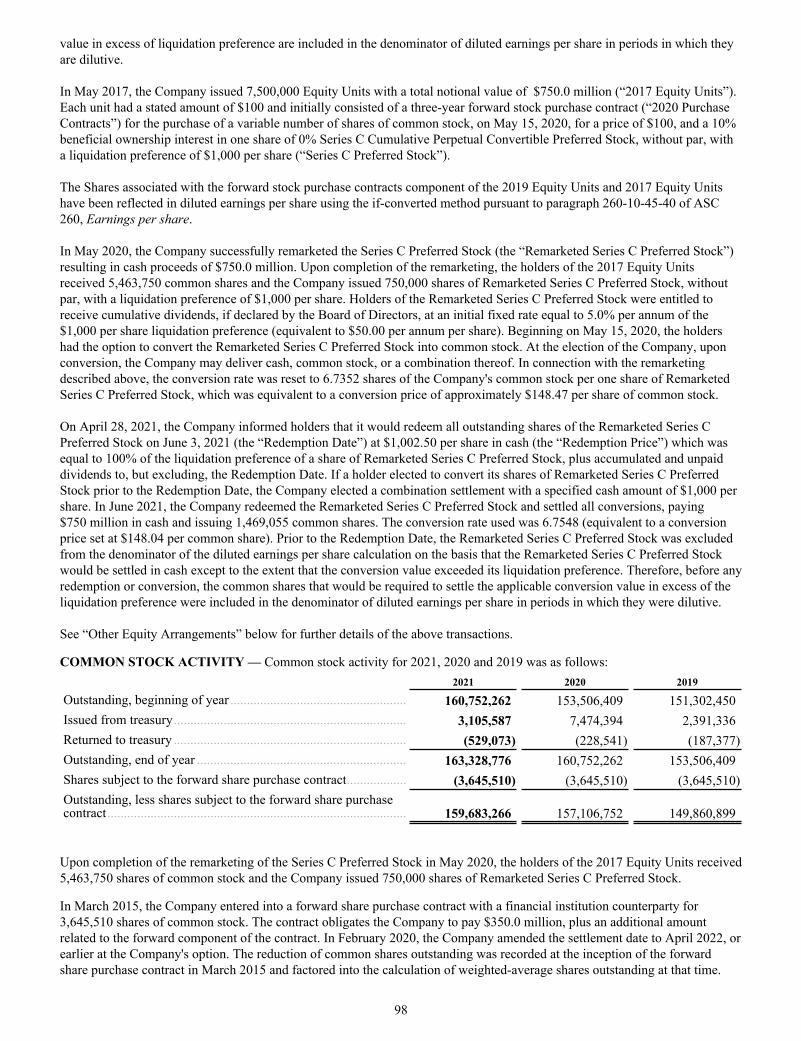
value in excess of liquidation preference are included in the denominator of diluted earnings per share in periods in which they are dilutive.
In May 2017, the Company issued 7,500,000 Equity Units with a total notional value of $750.0 million (“2017 Equity Units”). Each unit had a stated amount of $100 and initially consisted of a three-year forward stock purchase contract (“2020 Purchase Contracts”) for the purchase of a variable number of shares of common stock, on May 15, 2020, for a price of $100, and a 10% beneficial ownership interest in one share of 0% Series C Cumulative Perpetual Convertible Preferred Stock, without par, with a liquidation preference of $1,000 per share (“Series C Preferred Stock”).
The Shares associated with the forward stock purchase contracts component of the 2019 Equity Units and 2017 Equity Units have been reflected in diluted earnings per share using the if-converted method pursuant to paragraph 260-10-45-40 of ASC 260, Earnings per share. In May 2020, the Company successfully remarketed the Series C Preferred Stock (the “Remarketed Series C Preferred Stock”) resulting in cash proceeds of $750.0 million. Upon completion of the remarketing, the holders of the 2017 Equity Units received 5,463,750 common shares and the Company issued 750,000 shares of Remarketed Series C Preferred Stock, without par, with a liquidation preference of $1,000 per share. Holders of the Remarketed Series C Preferred Stock were entitled to receive cumulative dividends, if declared by the Board of Directors, at an initial fixed rate equal to 5.0% per annum of the $1,000 per share liquidation preference (equivalent to $50.00 per annum per share). Beginning on May 15, 2020, the holders had the option to convert the Remarketed Series C Preferred Stock into common stock. At the election of the Company, upon conversion, the Company may deliver cash, common stock, or a combination thereof. In connection with the remarketing described above, the conversion rate was reset to 6.7352 shares of the Company's common stock per one share of Remarketed Series C Preferred Stock, which was equivalent to a conversion price of approximately $148.47 per share of common stock.
On April 28, 2021, the Company informed holders that it would redeem all outstanding shares of the Remarketed Series C Preferred Stock on June 3, 2021 (the “Redemption Date”) at $1,002.50 per share in cash (the “Redemption Price”) which was equal to 100% of the liquidation preference of a share of Remarketed Series C Preferred Stock, plus accumulated and unpaid dividends to, but excluding, the Redemption Date. If a holder elected to convert its shares of Remarketed Series C Preferred Stock prior to the Redemption Date, the Company elected a combination settlement with a specified cash amount of $1,000 per share. In June 2021, the Company redeemed the Remarketed Series C Preferred Stock and settled all conversions, paying $750 million in cash and issuing 1,469,055 common shares. The conversion rate used was 6.7548 (equivalent to a conversion price set at $148.04 per common share). Prior to the Redemption Date, the Remarketed Series C Preferred Stock was excluded from the denominator of the diluted earnings per share calculation on the basis that the Remarketed Series C Preferred Stock would be settled in cash except to the extent that the conversion value exceeded its liquidation preference. Therefore, before any redemption or conversion, the common shares that would be required to settle the applicable conversion value in excess of the liquidation preference were included in the denominator of diluted earnings per share in periods in which they were dilutive.
See “Other Equity Arrangements” below for further details of the above transactions.
COMMON STOCK ACTIVITY — Common stock activity for 2021, 2020 and 2019 was as follows:2021 2020 2019
Outstanding, beginning of year ..................................................... 160,752,262 153,506,409 151,302,450 Issued from treasury ...................................................................... 3,105,587 7,474,394 2,391,336 Returned to treasury ...................................................................... (529,073) (228,541) (187,377) Outstanding, end of year ............................................................... 163,328,776 160,752,262 153,506,409 Shares subject to the forward share purchase contract .................. (3,645,510) (3,645,510) (3,645,510) Outstanding, less shares subject to the forward share purchase contract .......................................................................................... 159,683,266 157,106,752 149,860,899
Upon completion of the remarketing of the Series C Preferred Stock in May 2020, the holders of the 2017 Equity Units received 5,463,750 shares of common stock and the Company issued 750,000 shares of Remarketed Series C Preferred Stock.
In March 2015, the Company entered into a forward share purchase contract with a financial institution counterparty for 3,645,510 shares of common stock. The contract obligates the Company to pay $350.0 million, plus an additional amount related to the forward component of the contract. In February 2020, the Company amended the settlement date to April 2022, or earlier at the Company's option. The reduction of common shares outstanding was recorded at the inception of the forward share purchase contract in March 2015 and factored into the calculation of weighted-average shares outstanding at that time.
98
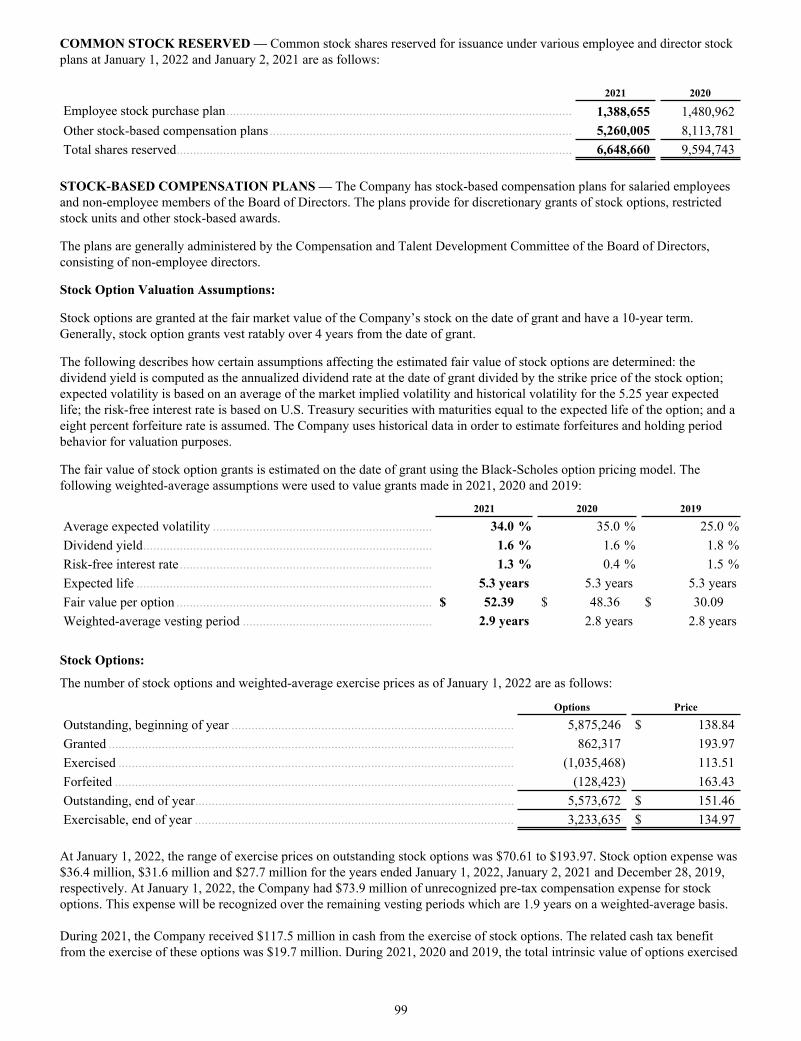
COMMON STOCK RESERVED — Common stock shares reserved for issuance under various employee and director stock plans at January 1, 2022 and January 2, 2021 are as follows:
2021 2020
Employee stock purchase plan ........................................................................................................ 1,388,655 1,480,962 Other stock-based compensation plans ........................................................................................... 5,260,005 8,113,781 Total shares reserved ....................................................................................................................... 6,648,660 9,594,743
STOCK-BASED COMPENSATION PLANS — The Company has stock-based compensation plans for salaried employees and non-employee members of the Board of Directors. The plans provide for discretionary grants of stock options, restricted stock units and other stock-based awards.
The plans are generally administered by the Compensation and Talent Development Committee of the Board of Directors, consisting of non-employee directors.
Stock Option Valuation Assumptions:
Stock options are granted at the fair market value of the Company’s stock on the date of grant and have a 10-year term. Generally, stock option grants vest ratably over 4 years from the date of grant.
The following describes how certain assumptions affecting the estimated fair value of stock options are determined: the dividend yield is computed as the annualized dividend rate at the date of grant divided by the strike price of the stock option; expected volatility is based on an average of the market implied volatility and historical volatility for the 5.25 year expected life; the risk-free interest rate is based on U.S. Treasury securities with maturities equal to the expected life of the option; and a eight percent forfeiture rate is assumed. The Company uses historical data in order to estimate forfeitures and holding period behavior for valuation purposes.
The fair value of stock option grants is estimated on the date of grant using the Black-Scholes option pricing model. The following weighted-average assumptions were used to value grants made in 2021, 2020 and 2019:
2021 2020 2019
Average expected volatility .................................................................. 34.0 % 35.0 % 25.0 %Dividend yield ....................................................................................... 1.6 % 1.6 % 1.8 %Risk-free interest rate ............................................................................ 1.3 % 0.4 % 1.5 %Expected life ......................................................................................... 5.3 years 5.3 years 5.3 yearsFair value per option ............................................................................. $ 52.39 $ 48.36 $ 30.09 Weighted-average vesting period ......................................................... 2.9 years 2.8 years 2.8 years
Stock Options:
The number of stock options and weighted-average exercise prices as of January 1, 2022 are as follows:
Options Price
Outstanding, beginning of year ..................................................................................... 5,875,246 $ 138.84 Granted .......................................................................................................................... 862,317 193.97 Exercised ....................................................................................................................... (1,035,468) 113.51 Forfeited ........................................................................................................................ (128,423) 163.43 Outstanding, end of year ................................................................................................ 5,573,672 $ 151.46 Exercisable, end of year ................................................................................................ 3,233,635 $ 134.97
At January 1, 2022, the range of exercise prices on outstanding stock options was $70.61 to $193.97. Stock option expense was $36.4 million, $31.6 million and $27.7 million for the years ended January 1, 2022, January 2, 2021 and December 28, 2019, respectively. At January 1, 2022, the Company had $73.9 million of unrecognized pre-tax compensation expense for stock options. This expense will be recognized over the remaining vesting periods which are 1.9 years on a weighted-average basis.
During 2021, the Company received $117.5 million in cash from the exercise of stock options. The related cash tax benefit from the exercise of these options was $19.7 million. During 2021, 2020 and 2019, the total intrinsic value of options exercised
99
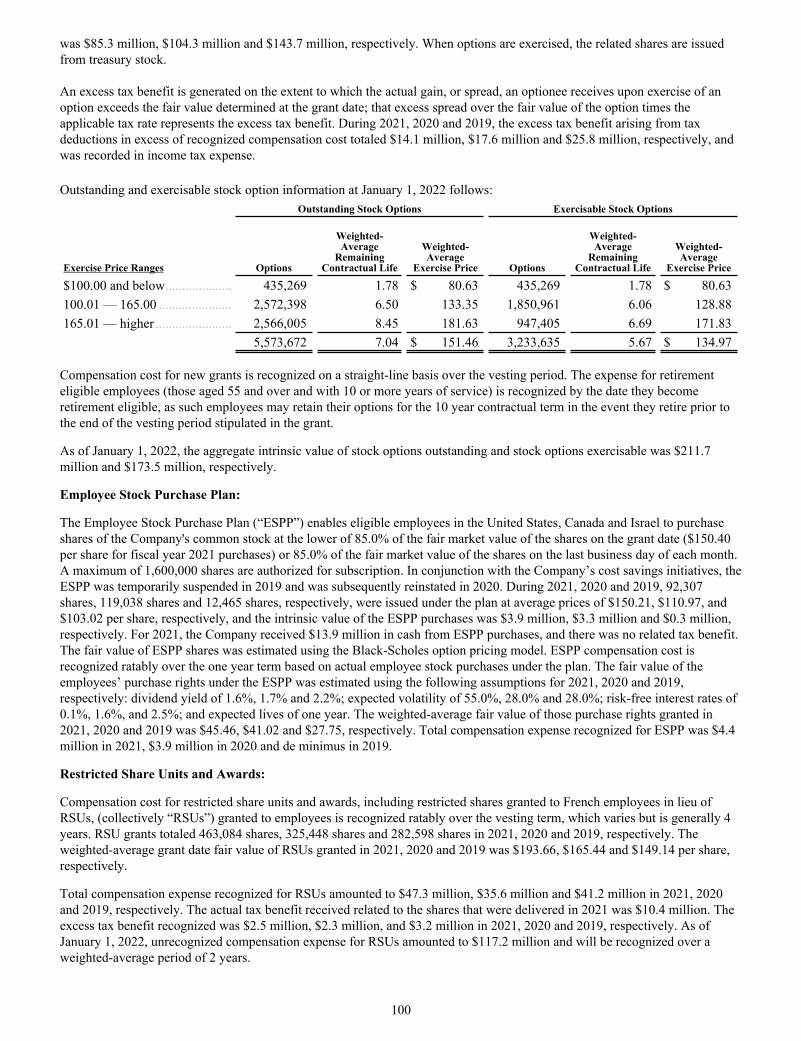
was $85.3 million, $104.3 million and $143.7 million, respectively. When options are exercised, the related shares are issued from treasury stock.
An excess tax benefit is generated on the extent to which the actual gain, or spread, an optionee receives upon exercise of an option exceeds the fair value determined at the grant date; that excess spread over the fair value of the option times the applicable tax rate represents the excess tax benefit. During 2021, 2020 and 2019, the excess tax benefit arising from tax deductions in excess of recognized compensation cost totaled $14.1 million, $17.6 million and $25.8 million, respectively, and was recorded in income tax expense.
Outstanding and exercisable stock option information at January 1, 2022 follows: Outstanding Stock Options Exercisable Stock Options
Exercise Price Ranges Options
Weighted-Average
RemainingContractual Life
Weighted-Average
Exercise Price Options
Weighted-Average
RemainingContractual Life
Weighted-Average
Exercise Price
$100.00 and below .................... 435,269 1.78 $ 80.63 435,269 1.78 $ 80.63 100.01 — 165.00 ...................... 2,572,398 6.50 133.35 1,850,961 6.06 128.88 165.01 — higher ....................... 2,566,005 8.45 181.63 947,405 6.69 171.83
5,573,672 7.04 $ 151.46 3,233,635 5.67 $ 134.97
Compensation cost for new grants is recognized on a straight-line basis over the vesting period. The expense for retirement eligible employees (those aged 55 and over and with 10 or more years of service) is recognized by the date they become retirement eligible, as such employees may retain their options for the 10 year contractual term in the event they retire prior to the end of the vesting period stipulated in the grant.
As of January 1, 2022, the aggregate intrinsic value of stock options outstanding and stock options exercisable was $211.7 million and $173.5 million, respectively.
Employee Stock Purchase Plan:
The Employee Stock Purchase Plan (“ESPP”) enables eligible employees in the United States, Canada and Israel to purchase shares of the Company's common stock at the lower of 85.0% of the fair market value of the shares on the grant date ($150.40 per share for fiscal year 2021 purchases) or 85.0% of the fair market value of the shares on the last business day of each month. A maximum of 1,600,000 shares are authorized for subscription. In conjunction with the Company’s cost savings initiatives, the ESPP was temporarily suspended in 2019 and was subsequently reinstated in 2020. During 2021, 2020 and 2019, 92,307 shares, 119,038 shares and 12,465 shares, respectively, were issued under the plan at average prices of $150.21, $110.97, and $103.02 per share, respectively, and the intrinsic value of the ESPP purchases was $3.9 million, $3.3 million and $0.3 million, respectively. For 2021, the Company received $13.9 million in cash from ESPP purchases, and there was no related tax benefit. The fair value of ESPP shares was estimated using the Black-Scholes option pricing model. ESPP compensation cost is recognized ratably over the one year term based on actual employee stock purchases under the plan. The fair value of the employees’ purchase rights under the ESPP was estimated using the following assumptions for 2021, 2020 and 2019, respectively: dividend yield of 1.6%, 1.7% and 2.2%; expected volatility of 55.0%, 28.0% and 28.0%; risk-free interest rates of 0.1%, 1.6%, and 2.5%; and expected lives of one year. The weighted-average fair value of those purchase rights granted in 2021, 2020 and 2019 was $45.46, $41.02 and $27.75, respectively. Total compensation expense recognized for ESPP was $4.4 million in 2021, $3.9 million in 2020 and de minimus in 2019.
Restricted Share Units and Awards:
Compensation cost for restricted share units and awards, including restricted shares granted to French employees in lieu of RSUs, (collectively “RSUs”) granted to employees is recognized ratably over the vesting term, which varies but is generally 4 years. RSU grants totaled 463,084 shares, 325,448 shares and 282,598 shares in 2021, 2020 and 2019, respectively. The weighted-average grant date fair value of RSUs granted in 2021, 2020 and 2019 was $193.66, $165.44 and $149.14 per share, respectively.
Total compensation expense recognized for RSUs amounted to $47.3 million, $35.6 million and $41.2 million in 2021, 2020 and 2019, respectively. The actual tax benefit received related to the shares that were delivered in 2021 was $10.4 million. The excess tax benefit recognized was $2.5 million, $2.3 million, and $3.2 million in 2021, 2020 and 2019, respectively. As of January 1, 2022, unrecognized compensation expense for RSUs amounted to $117.2 million and will be recognized over a weighted-average period of 2 years.
100
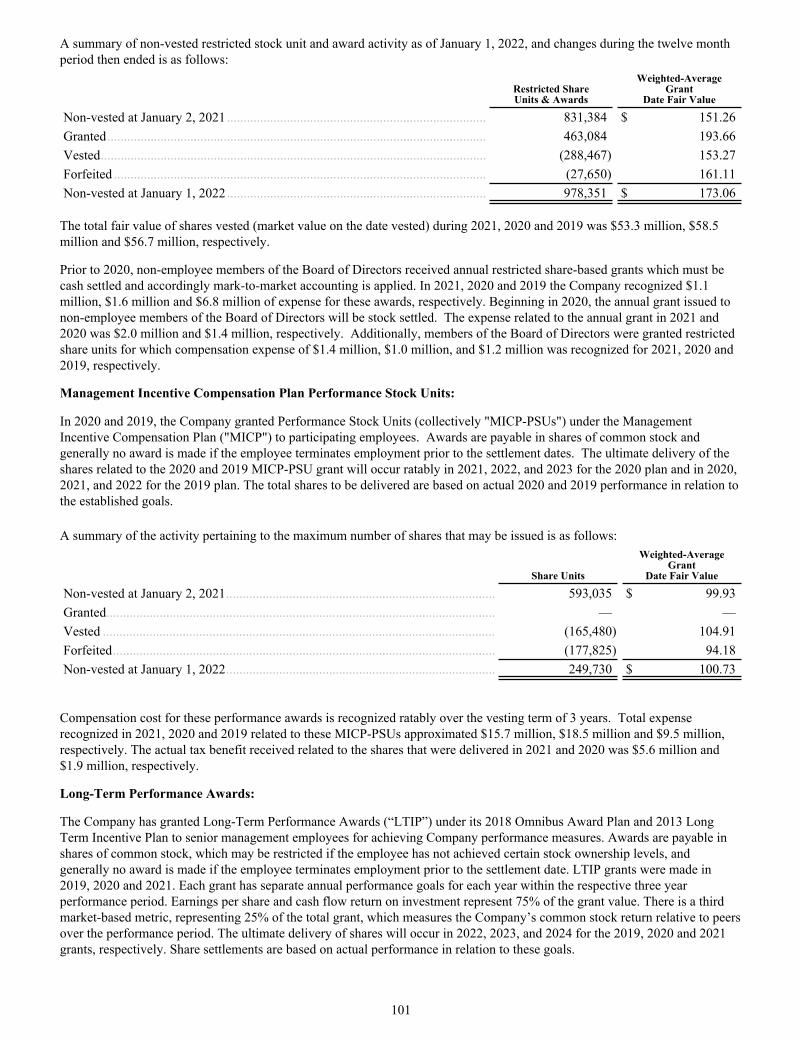
A summary of non-vested restricted stock unit and award activity as of January 1, 2022, and changes during the twelve month period then ended is as follows:
Restricted ShareUnits & Awards
Weighted-AverageGrant
Date Fair Value
Non-vested at January 2, 2021 .............................................................................. 831,384 $ 151.26 Granted .................................................................................................................. 463,084 193.66 Vested .................................................................................................................... (288,467) 153.27 Forfeited ................................................................................................................ (27,650) 161.11 Non-vested at January 1, 2022 .............................................................................. 978,351 $ 173.06
The total fair value of shares vested (market value on the date vested) during 2021, 2020 and 2019 was $53.3 million, $58.5 million and $56.7 million, respectively.
Prior to 2020, non-employee members of the Board of Directors received annual restricted share-based grants which must be cash settled and accordingly mark-to-market accounting is applied. In 2021, 2020 and 2019 the Company recognized $1.1 million, $1.6 million and $6.8 million of expense for these awards, respectively. Beginning in 2020, the annual grant issued to non-employee members of the Board of Directors will be stock settled. The expense related to the annual grant in 2021 and 2020 was $2.0 million and $1.4 million, respectively. Additionally, members of the Board of Directors were granted restricted share units for which compensation expense of $1.4 million, $1.0 million, and $1.2 million was recognized for 2021, 2020 and 2019, respectively.
Management Incentive Compensation Plan Performance Stock Units:
In 2020 and 2019, the Company granted Performance Stock Units (collectively "MICP-PSUs") under the Management Incentive Compensation Plan ("MICP") to participating employees. Awards are payable in shares of common stock and generally no award is made if the employee terminates employment prior to the settlement dates. The ultimate delivery of the shares related to the 2020 and 2019 MICP-PSU grant will occur ratably in 2021, 2022, and 2023 for the 2020 plan and in 2020, 2021, and 2022 for the 2019 plan. The total shares to be delivered are based on actual 2020 and 2019 performance in relation to the established goals.
A summary of the activity pertaining to the maximum number of shares that may be issued is as follows:
Share Units
Weighted-AverageGrant
Date Fair Value
Non-vested at January 2, 2021 ................................................................................. 593,035 $ 99.93 Granted ..................................................................................................................... — — Vested ...................................................................................................................... (165,480) 104.91 Forfeited ................................................................................................................... (177,825) 94.18 Non-vested at January 1, 2022 ................................................................................. 249,730 $ 100.73
Compensation cost for these performance awards is recognized ratably over the vesting term of 3 years. Total expense recognized in 2021, 2020 and 2019 related to these MICP-PSUs approximated $15.7 million, $18.5 million and $9.5 million, respectively. The actual tax benefit received related to the shares that were delivered in 2021 and 2020 was $5.6 million and $1.9 million, respectively.
Long-Term Performance Awards:
The Company has granted Long-Term Performance Awards (“LTIP”) under its 2018 Omnibus Award Plan and 2013 Long Term Incentive Plan to senior management employees for achieving Company performance measures. Awards are payable in shares of common stock, which may be restricted if the employee has not achieved certain stock ownership levels, and generally no award is made if the employee terminates employment prior to the settlement date. LTIP grants were made in 2019, 2020 and 2021. Each grant has separate annual performance goals for each year within the respective three year performance period. Earnings per share and cash flow return on investment represent 75% of the grant value. There is a third market-based metric, representing 25% of the total grant, which measures the Company’s common stock return relative to peers over the performance period. The ultimate delivery of shares will occur in 2022, 2023, and 2024 for the 2019, 2020 and 2021 grants, respectively. Share settlements are based on actual performance in relation to these goals.
101
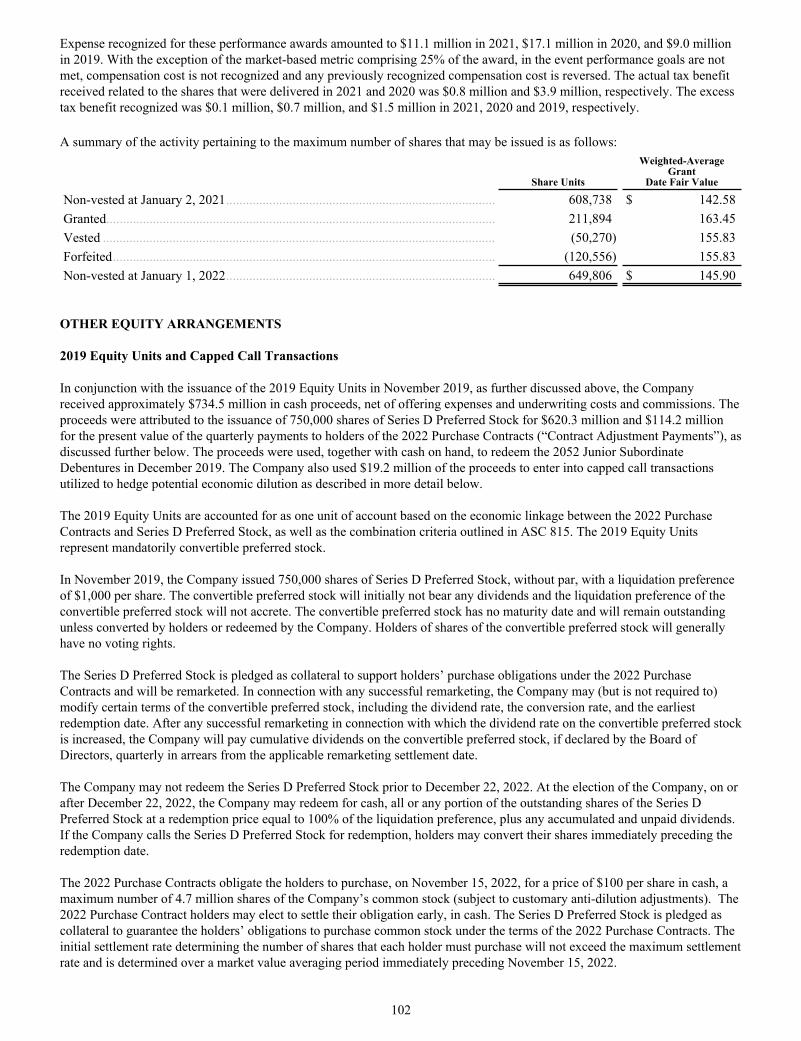
Expense recognized for these performance awards amounted to $11.1 million in 2021, $17.1 million in 2020, and $9.0 million in 2019. With the exception of the market-based metric comprising 25% of the award, in the event performance goals are not met, compensation cost is not recognized and any previously recognized compensation cost is reversed. The actual tax benefit received related to the shares that were delivered in 2021 and 2020 was $0.8 million and $3.9 million, respectively. The excess tax benefit recognized was $0.1 million, $0.7 million, and $1.5 million in 2021, 2020 and 2019, respectively.
A summary of the activity pertaining to the maximum number of shares that may be issued is as follows:
Share Units
Weighted-AverageGrant
Date Fair Value
Non-vested at January 2, 2021 ................................................................................. 608,738 $ 142.58 Granted ..................................................................................................................... 211,894 163.45 Vested ...................................................................................................................... (50,270) 155.83 Forfeited ................................................................................................................... (120,556) 155.83 Non-vested at January 1, 2022 ................................................................................. 649,806 $ 145.90
OTHER EQUITY ARRANGEMENTS
2019 Equity Units and Capped Call Transactions
In conjunction with the issuance of the 2019 Equity Units in November 2019, as further discussed above, the Company received approximately $734.5 million in cash proceeds, net of offering expenses and underwriting costs and commissions. The proceeds were attributed to the issuance of 750,000 shares of Series D Preferred Stock for $620.3 million and $114.2 million for the present value of the quarterly payments to holders of the 2022 Purchase Contracts (“Contract Adjustment Payments”), as discussed further below. The proceeds were used, together with cash on hand, to redeem the 2052 Junior Subordinate Debentures in December 2019. The Company also used $19.2 million of the proceeds to enter into capped call transactions utilized to hedge potential economic dilution as described in more detail below.
The 2019 Equity Units are accounted for as one unit of account based on the economic linkage between the 2022 Purchase Contracts and Series D Preferred Stock, as well as the combination criteria outlined in ASC 815. The 2019 Equity Units represent mandatorily convertible preferred stock.
In November 2019, the Company issued 750,000 shares of Series D Preferred Stock, without par, with a liquidation preference of $1,000 per share. The convertible preferred stock will initially not bear any dividends and the liquidation preference of the convertible preferred stock will not accrete. The convertible preferred stock has no maturity date and will remain outstanding unless converted by holders or redeemed by the Company. Holders of shares of the convertible preferred stock will generally have no voting rights.
The Series D Preferred Stock is pledged as collateral to support holders’ purchase obligations under the 2022 Purchase Contracts and will be remarketed. In connection with any successful remarketing, the Company may (but is not required to) modify certain terms of the convertible preferred stock, including the dividend rate, the conversion rate, and the earliest redemption date. After any successful remarketing in connection with which the dividend rate on the convertible preferred stock is increased, the Company will pay cumulative dividends on the convertible preferred stock, if declared by the Board of Directors, quarterly in arrears from the applicable remarketing settlement date.
The Company may not redeem the Series D Preferred Stock prior to December 22, 2022. At the election of the Company, on or after December 22, 2022, the Company may redeem for cash, all or any portion of the outstanding shares of the Series D Preferred Stock at a redemption price equal to 100% of the liquidation preference, plus any accumulated and unpaid dividends. If the Company calls the Series D Preferred Stock for redemption, holders may convert their shares immediately preceding the redemption date.
The 2022 Purchase Contracts obligate the holders to purchase, on November 15, 2022, for a price of $100 per share in cash, a maximum number of 4.7 million shares of the Company’s common stock (subject to customary anti-dilution adjustments). The 2022 Purchase Contract holders may elect to settle their obligation early, in cash. The Series D Preferred Stock is pledged as collateral to guarantee the holders’ obligations to purchase common stock under the terms of the 2022 Purchase Contracts. The initial settlement rate determining the number of shares that each holder must purchase will not exceed the maximum settlement rate and is determined over a market value averaging period immediately preceding November 15, 2022.
102
The initial maximum settlement rate of 0.6272 was calculated using an initial reference price of $159.45, equal to the last reported sale price of the Company's common stock on November 7, 2019. As of January 1, 2022, due to the customary anti-dilution provisions, the maximum settlement rate was 0.6280, equivalent to a reference price of $159.23. If the applicable market value of the Company's common stock is less than or equal to the reference price, the settlement rate will be the maximum settlement rate; and if the applicable market value of the Company's common stock is greater than the reference price, the settlement rate will be a number of shares of the Company's common stock equal to $100 per share divided by the applicable market value. Upon a successful remarketing of the Series D Preferred Stock (the "Remarketed Series D Preferred Stock"), the Company will receive additional cash proceeds of $750 million and issue shares of Remarketed Series D Preferred Stock.
The Company pays Contract Adjustment Payments to holders of the 2022 Purchase Contracts at a rate of 5.25% per annum, payable quarterly in arrears on February 15, May 15, August 15 and November 15, which commenced on February 15, 2020. The $114.2 million present value of the Contract Adjustment Payments reduced the Series D Preferred Stock at inception. As each quarterly Contract Adjustment Payment is made, the related liability is reduced and the difference between the cash payment and the present value will accrete to interest expense, approximately $1.3 million per year over the three-year term. As of January 1, 2022, the present value of the Contract Adjustment Payments was $38.3 million.
The holders can settle the purchase contracts early, for cash, subject to certain exceptions and conditions in the prospectus supplement. Upon early settlement of any purchase contracts, the Company will deliver the number of shares of its common stock equal to 85% of the number of shares of common stock that would have otherwise been deliverable.
Capped Call Transactions
In order to offset the potential economic dilution associated with the common shares issuable upon conversion of the Series D Preferred Stock, to the extent that the conversion value of the convertible preferred stock exceeds its liquidation preference, the Company entered into capped call transactions with three major financial institutions.
The capped call transactions have a term of approximately three years and are intended to cover the number of shares issuable upon conversion of the Series D Preferred Stock. Subject to customary anti-dilution adjustments, the capped call had an initial lower strike price of $191.34, which corresponded to the minimum 5.2263 settlement rate of the Series D Preferred Stock, and an upper strike price of $207.29, which was approximately 30% higher than the closing price of the Company’s common stock on November 7, 2019. As of January 1, 2022, due to the customary anti-dilution provisions, the capped call transactions were at an adjusted lower strike price of $191.10 and an adjusted upper strike price of $207.02.
The capped call transactions may be settled by net share settlement (the default settlement method) or, at the Company’s option and subject to certain conditions, cash settlement, physical settlement or modified physical settlement. The number of shares the Company will receive will be determined by the terms of the contracts using a volume-weighted average price calculation for the market value of the Company's common stock, over an averaging period. The market value determined will then be measured against the applicable strike price of the capped call transactions. The Company expects the capped call transactions to offset the potential dilution upon conversion of the Series D Preferred Stock if the calculated market value is greater than the lower strike price but less than or equal to the upper strike price of the capped call transactions. Should the calculated market value exceed the upper strike price of the capped call transactions, the dilution mitigation will be limited based on such capped value as determined under the terms of the contracts.
With respect to the impact on the Company, the capped call transactions and 2019 Equity Units, when taken together, result in the economic equivalent of having the conversion price on the 2019 Equity Units at $207.02, the upper strike price of the capped call as of January 1, 2022.
The Company paid $19.2 million, or an average of $4.90 per option, to enter into capped call transactions on 3.9 million shares of common stock. The $19.2 million premium paid was recorded as a reduction of Shareowners’ Equity. The aggregate fair value of the options at January 1, 2022 was $26.0 million.
2017 Equity Units and Capped Call Transactions
In conjunction with the issuance of the 2017 Equity Units in May 2017, as further discussed above, the Company received approximately $727.5 million in cash proceeds, net of offering expenses and underwriting costs and commissions. The proceeds were attributed to the issuance of 750,000 shares of Series C Preferred Stock for $605.0 million, $117.1 million for the present value of the Contract Adjustment Payments, and a beneficial conversion feature of $5.4 million. The proceeds were used for
103

general corporate purposes, including repayment of short-term borrowings. The Company also used $25.1 million of the proceeds to enter into capped call transactions utilized to hedge potential economic dilution as described in more detail below.
The 2017 Equity Units are accounted for as one unit of account based on the economic linkage between the 2020 Purchase Contracts and the Series C Preferred Stock, as well as the combination criteria outlined in ASC 815. The 2017 Equity Units represent mandatorily convertible preferred stock.
In May 2017, the Company issued 750,000 shares of Series C Preferred Stock, without par, with a liquidation preference of $1,000 per share. The convertible preferred stock initially did not bear any dividends and the liquidation preference of the convertible preferred stock did not accrete. The convertible preferred stock had no maturity date and remained outstanding unless converted by holders or redeemed by the Company. Holders of shares of the convertible preferred stock generally had no voting rights. The Series C Preferred Stock was pledged as collateral to support holders’ purchase obligations under the 2020 Purchase Contracts.
As discussed further above, the Company successfully remarketed the Series C Preferred Stock in May 2020. Subsequent to the remarketing, holders of the Remarketed Series C Preferred Stock were entitled to receive, if declared by the Board of Directors, cumulative dividends (i) from, and including May 15, 2020 to, but excluding, May 15, 2023 (the "dividend step-up date”) at a fixed rate equal to 5.0% per annum of the $1,000 per share liquidation preference (equivalent to $50.00 per annum per share) and (ii) from, and including, the dividend step-up date at a fixed rate equal to 10.0% per annum of the $1,000 per share liquidation preference (equivalent to $100.00 per annum per share). Dividends were cumulative on the $1,000 liquidation preference per share and will be payable, if declared by the Board of Directors, quarterly in arrears on February 15, May 15, August 15 and November 15 of each year, beginning on August 15, 2020. Dividends accrued on the Remarketed Series C Preferred Stock reduced net earnings for purposes of calculating earnings per share.
The Company did not have the right to redeem the Remarketed Series C Preferred Stock prior to May 15, 2021. On April 28, 2021, the Company informed holders that it would redeem all outstanding shares of the Remarketed Series C Preferred Stock on June 3, 2021 (the “Redemption Date”) at $1,002.50 per share in cash (the “Redemption Price”), which was equal to 100% of the liquidation preference of a share of Remarketed Series C Preferred Stock, plus accumulated and unpaid dividends to, but excluding, the Redemption Date. If a holder elected to convert its shares of Remarketed Series C Preferred Stock prior to the Redemption Date, the Company elected a combination settlement with a specified cash amount of $1,000 per share. In June 2021, the Company redeemed the Remarketed Series C Preferred Stock and settled all conversions, paying $750 million in cash and issuing 1,469,055 common shares. The conversion rate used was 6.7548 (equivalent to a conversion price set at $148.04 per common share).
The Company generated cash proceeds of $750.0 million from the successful remarketing of the Series C Preferred Stock. Upon completion of the remarketing in May 2020, the holders of the 2017 Equity Units received 5,463,750 common shares using the maximum settlement rate of 0.7285 (equivalent to a reference price of $137.26 per common share), and the Company issued 750,000 shares of Remarketed Series C Preferred Stock.
The Company paid Contract Adjustment Payments to the holders of the 2020 Purchase Contracts at a rate of 5.375% per annum, payable quarterly in arrears on February 15, May 15, August 15 and November 15, which commenced August 15, 2017. The $117.1 million initial present value of these Contract Adjustment Payments reduced the Series C Preferred Stock at inception. As each quarterly Contract Adjustment Payment was made, the related liability was reduced and the difference between the cash payments and the present value accreted to interest expense, approximately $1.3 million per year over the three-year term. On May 15, 2020, the Company paid the final contract adjustment payment related to the 2020 Purchase Contracts.
Capped Call Transactions
In May 2017, the Company entered into capped call transactions with three major financial institutions (the “counterparties”) in order to offset the potential economic dilution associated with the common shares issuable upon conversion of the Series C Preferred Stock, to the extent that the conversion value of the convertible preferred stock exceeds its liquidation preference. The Company paid $25.1 million, or an average of $5.43 per option, to enter into capped call transactions on 4.6 million shares of common stock. The $25.1 million premium paid was recorded as a reduction of Shareowners' Equity.
The capped call transactions had a term of approximately three years and were intended to cover the number of shares issuable upon conversion of the Series C Preferred Stock. Subject to customary anti-dilution adjustments, the capped call had an initial lower strike price of $162.27, which corresponded to the minimum 6.1627 settlement rate of the Series C Preferred Stock at inception, and an upper strike price of $179.53, which was approximately 30% higher than the closing price of the Company’s common stock on May 11, 2017. In June 2020, the capped call options expired out of the money.
104
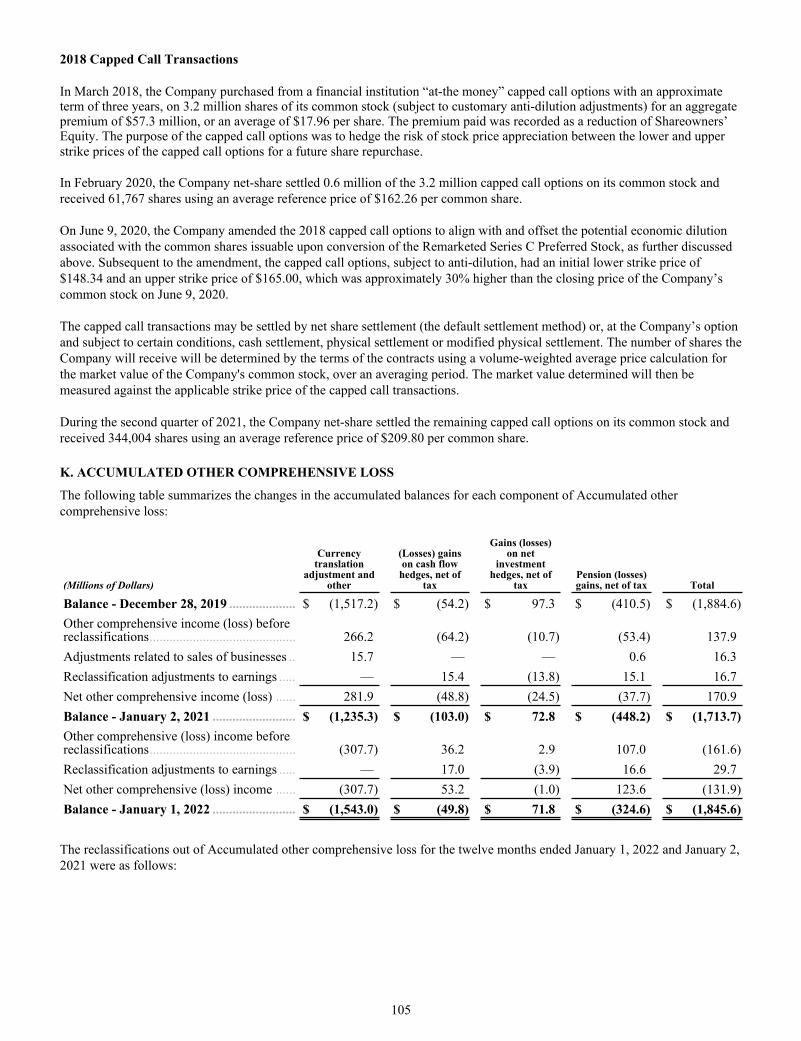
2018 Capped Call Transactions
In March 2018, the Company purchased from a financial institution “at-the money” capped call options with an approximate term of three years, on 3.2 million shares of its common stock (subject to customary anti-dilution adjustments) for an aggregate premium of $57.3 million, or an average of $17.96 per share. The premium paid was recorded as a reduction of Shareowners’Equity. The purpose of the capped call options was to hedge the risk of stock price appreciation between the lower and upper strike prices of the capped call options for a future share repurchase.
In February 2020, the Company net-share settled 0.6 million of the 3.2 million capped call options on its common stock and received 61,767 shares using an average reference price of $162.26 per common share.
On June 9, 2020, the Company amended the 2018 capped call options to align with and offset the potential economic dilution associated with the common shares issuable upon conversion of the Remarketed Series C Preferred Stock, as further discussed above. Subsequent to the amendment, the capped call options, subject to anti-dilution, had an initial lower strike price of $148.34 and an upper strike price of $165.00, which was approximately 30% higher than the closing price of the Company’s common stock on June 9, 2020.
The capped call transactions may be settled by net share settlement (the default settlement method) or, at the Company’s option and subject to certain conditions, cash settlement, physical settlement or modified physical settlement. The number of shares the Company will receive will be determined by the terms of the contracts using a volume-weighted average price calculation for the market value of the Company's common stock, over an averaging period. The market value determined will then be measured against the applicable strike price of the capped call transactions.
During the second quarter of 2021, the Company net-share settled the remaining capped call options on its common stock and received 344,004 shares using an average reference price of $209.80 per common share.
K. ACCUMULATED OTHER COMPREHENSIVE LOSS
The following table summarizes the changes in the accumulated balances for each component of Accumulated other comprehensive loss:
(Millions of Dollars)
Currency translation
adjustment and other
(Losses) gains on cash flow
hedges, net of tax
Gains (losses) on net
investment hedges, net of
taxPension (losses) gains, net of tax Total
Balance - December 28, 2019 .................... $ (1,517.2) $ (54.2) $ 97.3 $ (410.5) $ (1,884.6) Other comprehensive income (loss) before reclassifications ............................................ 266.2 (64.2) (10.7) (53.4) 137.9 Adjustments related to sales of businesses .. 15.7 — — 0.6 16.3 Reclassification adjustments to earnings ..... — 15.4 (13.8) 15.1 16.7 Net other comprehensive income (loss) ...... 281.9 (48.8) (24.5) (37.7) 170.9 Balance - January 2, 2021 ......................... $ (1,235.3) $ (103.0) $ 72.8 $ (448.2) $ (1,713.7) Other comprehensive (loss) income before reclassifications ............................................ (307.7) 36.2 2.9 107.0 (161.6) Reclassification adjustments to earnings ..... — 17.0 (3.9) 16.6 29.7 Net other comprehensive (loss) income ...... (307.7) 53.2 (1.0) 123.6 (131.9) Balance - January 1, 2022 ......................... $ (1,543.0) $ (49.8) $ 71.8 $ (324.6) $ (1,845.6)
The reclassifications out of Accumulated other comprehensive loss for the twelve months ended January 1, 2022 and January 2, 2021 were as follows:
105
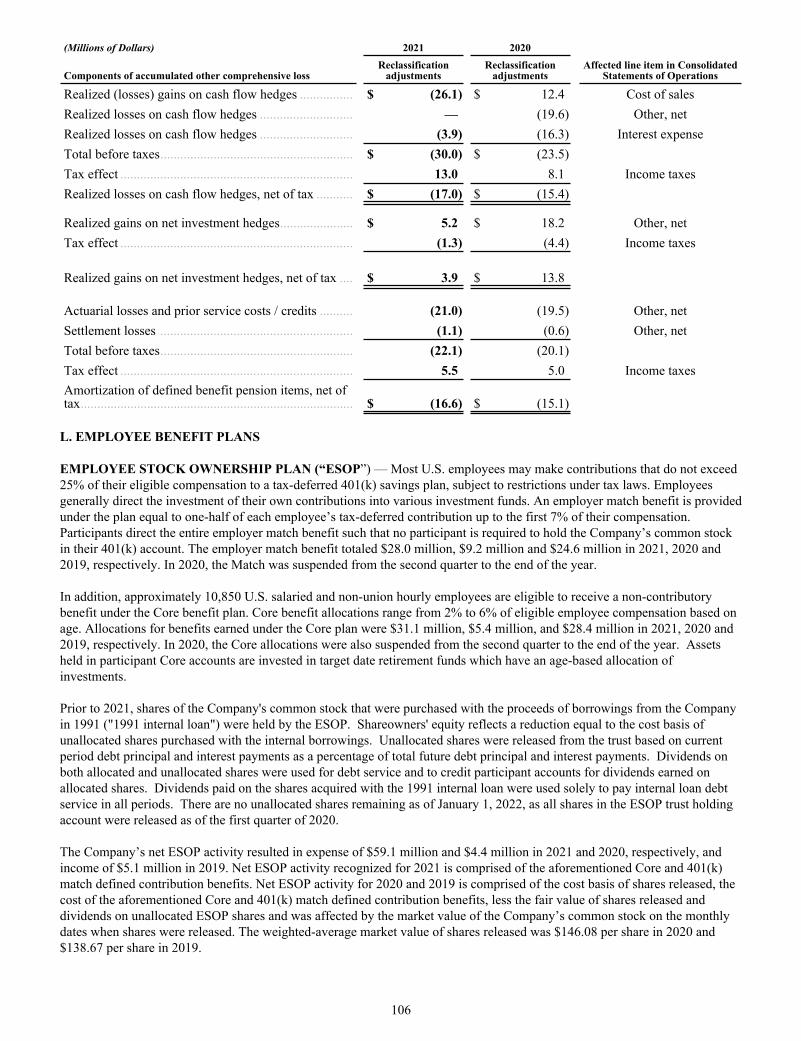
(Millions of Dollars) 2021 2020
Components of accumulated other comprehensive lossReclassification
adjustmentsReclassification
adjustmentsAffected line item in Consolidated
Statements of Operations
Realized (losses) gains on cash flow hedges ................ $ (26.1) $ 12.4 Cost of salesRealized losses on cash flow hedges ............................ — (19.6) Other, netRealized losses on cash flow hedges ............................ (3.9) (16.3) Interest expenseTotal before taxes .......................................................... $ (30.0) $ (23.5) Tax effect ...................................................................... 13.0 8.1 Income taxesRealized losses on cash flow hedges, net of tax ........... $ (17.0) $ (15.4)
Realized gains on net investment hedges ...................... $ 5.2 $ 18.2 Other, netTax effect ...................................................................... (1.3) (4.4) Income taxes
Realized gains on net investment hedges, net of tax .... $ 3.9 $ 13.8
Actuarial losses and prior service costs / credits .......... (21.0) (19.5) Other, netSettlement losses
.......................................................... (1.1) (0.6) Other, netTotal before taxes .......................................................... (22.1) (20.1) Tax effect ...................................................................... 5.5 5.0 Income taxesAmortization of defined benefit pension items, net of tax .................................................................................. $ (16.6) $ (15.1)
L. EMPLOYEE BENEFIT PLANS
EMPLOYEE STOCK OWNERSHIP PLAN (“ESOP”) — Most U.S. employees may make contributions that do not exceed 25% of their eligible compensation to a tax-deferred 401(k) savings plan, subject to restrictions under tax laws. Employees generally direct the investment of their own contributions into various investment funds. An employer match benefit is provided under the plan equal to one-half of each employee’s tax-deferred contribution up to the first 7% of their compensation. Participants direct the entire employer match benefit such that no participant is required to hold the Company’s common stock in their 401(k) account. The employer match benefit totaled $28.0 million, $9.2 million and $24.6 million in 2021, 2020 and 2019, respectively. In 2020, the Match was suspended from the second quarter to the end of the year. In addition, approximately 10,850 U.S. salaried and non-union hourly employees are eligible to receive a non-contributory benefit under the Core benefit plan. Core benefit allocations range from 2% to 6% of eligible employee compensation based on age. Allocations for benefits earned under the Core plan were $31.1 million, $5.4 million, and $28.4 million in 2021, 2020 and 2019, respectively. In 2020, the Core allocations were also suspended from the second quarter to the end of the year. Assets held in participant Core accounts are invested in target date retirement funds which have an age-based allocation of investments.
Prior to 2021, shares of the Company's common stock that were purchased with the proceeds of borrowings from the Company in 1991 ("1991 internal loan") were held by the ESOP. Shareowners' equity reflects a reduction equal to the cost basis of unallocated shares purchased with the internal borrowings. Unallocated shares were released from the trust based on current period debt principal and interest payments as a percentage of total future debt principal and interest payments. Dividends on both allocated and unallocated shares were used for debt service and to credit participant accounts for dividends earned on allocated shares. Dividends paid on the shares acquired with the 1991 internal loan were used solely to pay internal loan debt service in all periods. There are no unallocated shares remaining as of January 1, 2022, as all shares in the ESOP trust holding account were released as of the first quarter of 2020.
The Company’s net ESOP activity resulted in expense of $59.1 million and $4.4 million in 2021 and 2020, respectively, and income of $5.1 million in 2019. Net ESOP activity recognized for 2021 is comprised of the aforementioned Core and 401(k) match defined contribution benefits. Net ESOP activity for 2020 and 2019 is comprised of the cost basis of shares released, the cost of the aforementioned Core and 401(k) match defined contribution benefits, less the fair value of shares released and dividends on unallocated ESOP shares and was affected by the market value of the Company’s common stock on the monthly dates when shares were released. The weighted-average market value of shares released was $146.08 per share in 2020 and $138.67 per share in 2019.
106
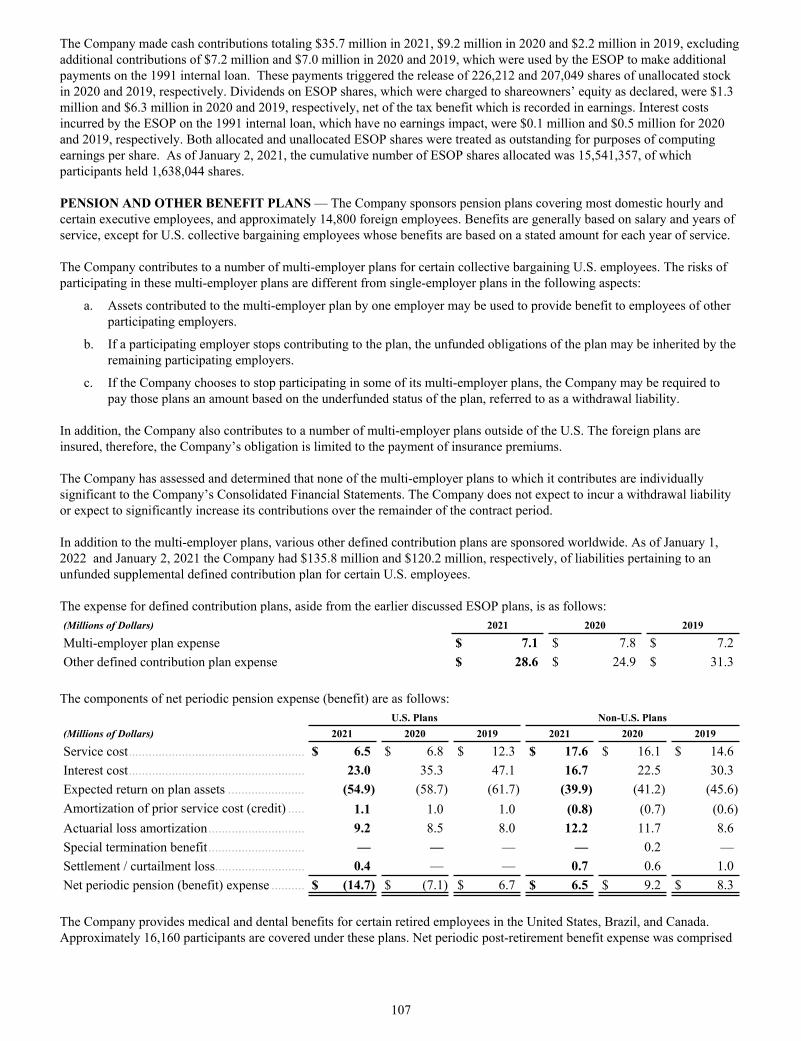
The Company made cash contributions totaling $35.7 million in 2021, $9.2 million in 2020 and $2.2 million in 2019, excluding additional contributions of $7.2 million and $7.0 million in 2020 and 2019, which were used by the ESOP to make additional payments on the 1991 internal loan. These payments triggered the release of 226,212 and 207,049 shares of unallocated stock in 2020 and 2019, respectively. Dividends on ESOP shares, which were charged to shareowners’ equity as declared, were $1.3 million and $6.3 million in 2020 and 2019, respectively, net of the tax benefit which is recorded in earnings. Interest costs incurred by the ESOP on the 1991 internal loan, which have no earnings impact, were $0.1 million and $0.5 million for 2020 and 2019, respectively. Both allocated and unallocated ESOP shares were treated as outstanding for purposes of computing earnings per share. As of January 2, 2021, the cumulative number of ESOP shares allocated was 15,541,357, of which participants held 1,638,044 shares.
PENSION AND OTHER BENEFIT PLANS — The Company sponsors pension plans covering most domestic hourly and certain executive employees, and approximately 14,800 foreign employees. Benefits are generally based on salary and years of service, except for U.S. collective bargaining employees whose benefits are based on a stated amount for each year of service.
The Company contributes to a number of multi-employer plans for certain collective bargaining U.S. employees. The risks of participating in these multi-employer plans are different from single-employer plans in the following aspects:
a. Assets contributed to the multi-employer plan by one employer may be used to provide benefit to employees of other participating employers.
b. If a participating employer stops contributing to the plan, the unfunded obligations of the plan may be inherited by the remaining participating employers.
c. If the Company chooses to stop participating in some of its multi-employer plans, the Company may be required to pay those plans an amount based on the underfunded status of the plan, referred to as a withdrawal liability.
In addition, the Company also contributes to a number of multi-employer plans outside of the U.S. The foreign plans are insured, therefore, the Company’s obligation is limited to the payment of insurance premiums.
The Company has assessed and determined that none of the multi-employer plans to which it contributes are individually significant to the Company’s Consolidated Financial Statements. The Company does not expect to incur a withdrawal liability or expect to significantly increase its contributions over the remainder of the contract period.
In addition to the multi-employer plans, various other defined contribution plans are sponsored worldwide. As of January 1, 2022 and January 2, 2021 the Company had $135.8 million and $120.2 million, respectively, of liabilities pertaining to an unfunded supplemental defined contribution plan for certain U.S. employees.
The expense for defined contribution plans, aside from the earlier discussed ESOP plans, is as follows: (Millions of Dollars) 2021 2020 2019
Multi-employer plan expense $ 7.1 $ 7.8 $ 7.2 Other defined contribution plan expense $ 28.6 $ 24.9 $ 31.3
The components of net periodic pension expense (benefit) are as follows: U.S. Plans Non-U.S. Plans(Millions of Dollars) 2021 2020 2019 2021 2020 2019
Service cost ..................................................... $ 6.5 $ 6.8 $ 12.3 $ 17.6 $ 16.1 $ 14.6 Interest cost ..................................................... 23.0 35.3 47.1 16.7 22.5 30.3 Expected return on plan assets ....................... (54.9) (58.7) (61.7) (39.9) (41.2) (45.6) Amortization of prior service cost (credit) ..... 1.1 1.0 1.0 (0.8) (0.7) (0.6) Actuarial loss amortization ............................. 9.2 8.5 8.0 12.2 11.7 8.6 Special termination benefit ............................. — — — — 0.2 — Settlement / curtailment loss........................... 0.4 — — 0.7 0.6 1.0 Net periodic pension (benefit) expense .......... $ (14.7) $ (7.1) $ 6.7 $ 6.5 $ 9.2 $ 8.3
The Company provides medical and dental benefits for certain retired employees in the United States, Brazil, and Canada. Approximately 16,160 participants are covered under these plans. Net periodic post-retirement benefit expense was comprised
107
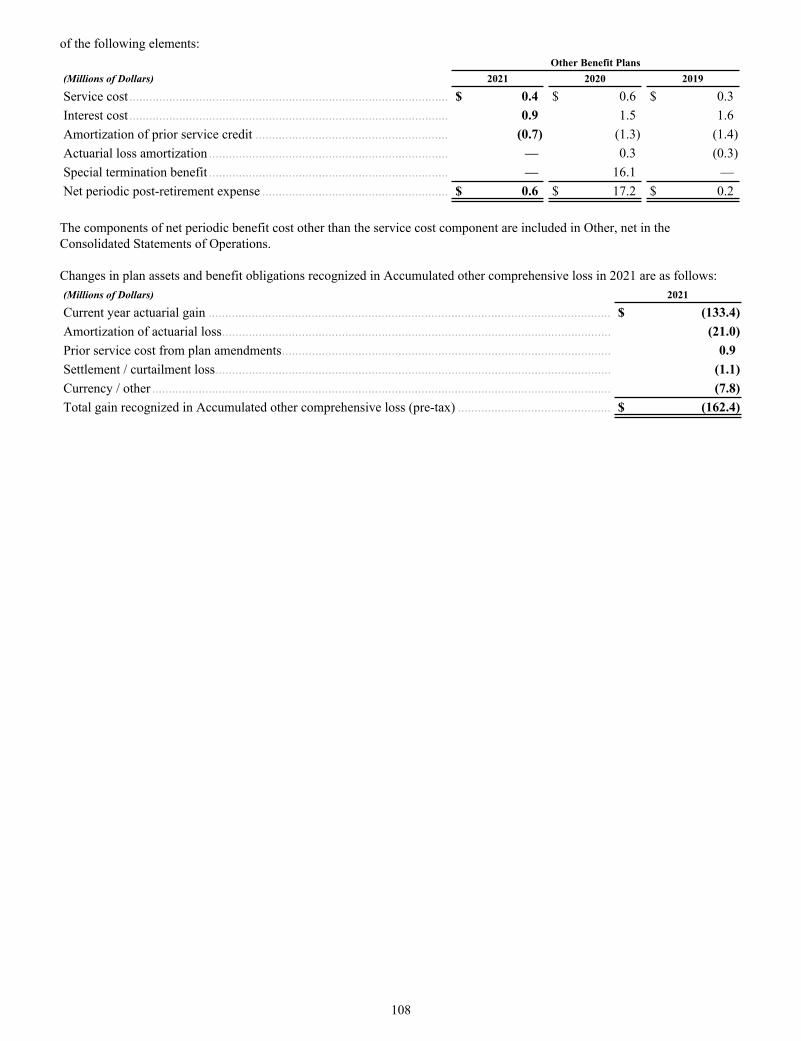
of the following elements: Other Benefit Plans(Millions of Dollars) 2021 2020 2019
Service cost ................................................................................................ $ 0.4 $ 0.6 $ 0.3 Interest cost ................................................................................................ 0.9 1.5 1.6 Amortization of prior service credit .......................................................... (0.7) (1.3) (1.4) Actuarial loss amortization ........................................................................ — 0.3 (0.3) Special termination benefit ........................................................................ — 16.1 — Net periodic post-retirement expense ........................................................ $ 0.6 $ 17.2 $ 0.2
The components of net periodic benefit cost other than the service cost component are included in Other, net in the Consolidated Statements of Operations.
Changes in plan assets and benefit obligations recognized in Accumulated other comprehensive loss in 2021 are as follows:(Millions of Dollars) 2021
Current year actuarial gain ......................................................................................................................... $ (133.4) Amortization of actuarial loss ..................................................................................................................... (21.0) Prior service cost from plan amendments ................................................................................................... 0.9 Settlement / curtailment loss ....................................................................................................................... (1.1) Currency / other .......................................................................................................................................... (7.8) Total gain recognized in Accumulated other comprehensive loss (pre-tax) .............................................. $ (162.4)
108
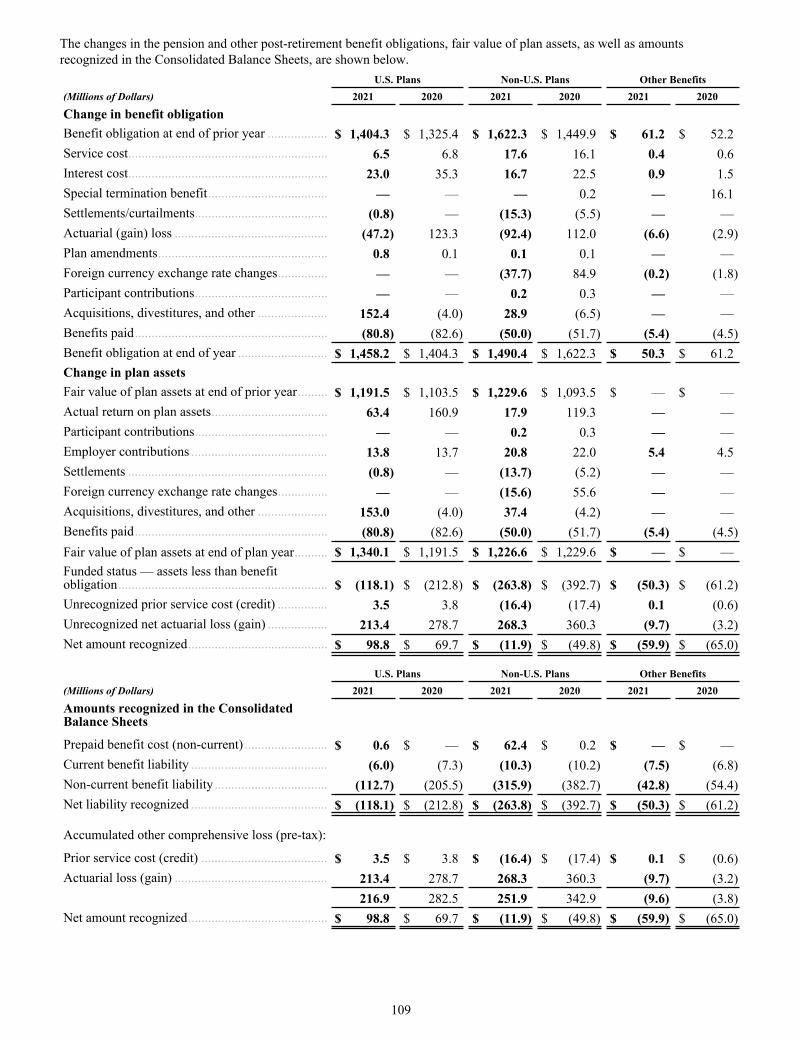
The changes in the pension and other post-retirement benefit obligations, fair value of plan assets, as well as amounts recognized in the Consolidated Balance Sheets, are shown below. U.S. Plans Non-U.S. Plans Other Benefits(Millions of Dollars) 2021 2020 2021 2020 2021 2020
Change in benefit obligationBenefit obligation at end of prior year .................. $ 1,404.3 $ 1,325.4 $ 1,622.3 $ 1,449.9 $ 61.2 $ 52.2 Service cost ............................................................ 6.5 6.8 17.6 16.1 0.4 0.6 Interest cost ............................................................ 23.0 35.3 16.7 22.5 0.9 1.5 Special termination benefit .................................... — — — 0.2 — 16.1 Settlements/curtailments ........................................ (0.8) — (15.3) (5.5) — — Actuarial (gain) loss .............................................. (47.2) 123.3 (92.4) 112.0 (6.6) (2.9) Plan amendments ................................................... 0.8 0.1 0.1 0.1 — — Foreign currency exchange rate changes ............... — — (37.7) 84.9 (0.2) (1.8) Participant contributions ........................................ — — 0.2 0.3 — — Acquisitions, divestitures, and other ..................... 152.4 (4.0) 28.9 (6.5) — — Benefits paid .......................................................... (80.8) (82.6) (50.0) (51.7) (5.4) (4.5) Benefit obligation at end of year ........................... $ 1,458.2 $ 1,404.3 $ 1,490.4 $ 1,622.3 $ 50.3 $ 61.2 Change in plan assetsFair value of plan assets at end of prior year ......... $ 1,191.5 $ 1,103.5 $ 1,229.6 $ 1,093.5 $ — $ — Actual return on plan assets ................................... 63.4 160.9 17.9 119.3 — — Participant contributions ........................................ — — 0.2 0.3 — — Employer contributions ......................................... 13.8 13.7 20.8 22.0 5.4 4.5 Settlements ............................................................ (0.8) — (13.7) (5.2) — — Foreign currency exchange rate changes ............... — — (15.6) 55.6 — — Acquisitions, divestitures, and other ..................... 153.0 (4.0) 37.4 (4.2) — — Benefits paid .......................................................... (80.8) (82.6) (50.0) (51.7) (5.4) (4.5) Fair value of plan assets at end of plan year .......... $ 1,340.1 $ 1,191.5 $ 1,226.6 $ 1,229.6 $ — $ — Funded status — assets less than benefit obligation ............................................................... $ (118.1) $ (212.8) $ (263.8) $ (392.7) $ (50.3) $ (61.2) Unrecognized prior service cost (credit) ............... 3.5 3.8 (16.4) (17.4) 0.1 (0.6) Unrecognized net actuarial loss (gain) .................. 213.4 278.7 268.3 360.3 (9.7) (3.2) Net amount recognized .......................................... $ 98.8 $ 69.7 $ (11.9) $ (49.8) $ (59.9) $ (65.0)
U.S. Plans Non-U.S. Plans Other Benefits(Millions of Dollars) 2021 2020 2021 2020 2021 2020
Amounts recognized in the Consolidated Balance Sheets
Prepaid benefit cost (non-current) ......................... $ 0.6 $ — $ 62.4 $ 0.2 $ — $ — Current benefit liability ......................................... (6.0) (7.3) (10.3) (10.2) (7.5) (6.8) Non-current benefit liability .................................. (112.7) (205.5) (315.9) (382.7) (42.8) (54.4) Net liability recognized ......................................... $ (118.1) $ (212.8) $ (263.8) $ (392.7) $ (50.3) $ (61.2)
Accumulated other comprehensive loss (pre-tax):
Prior service cost (credit) ...................................... $ 3.5 $ 3.8 $ (16.4) $ (17.4) $ 0.1 $ (0.6) Actuarial loss (gain) .............................................. 213.4 278.7 268.3 360.3 (9.7) (3.2)
216.9 282.5 251.9 342.9 (9.6) (3.8) Net amount recognized .......................................... $ 98.8 $ 69.7 $ (11.9) $ (49.8) $ (59.9) $ (65.0)
109
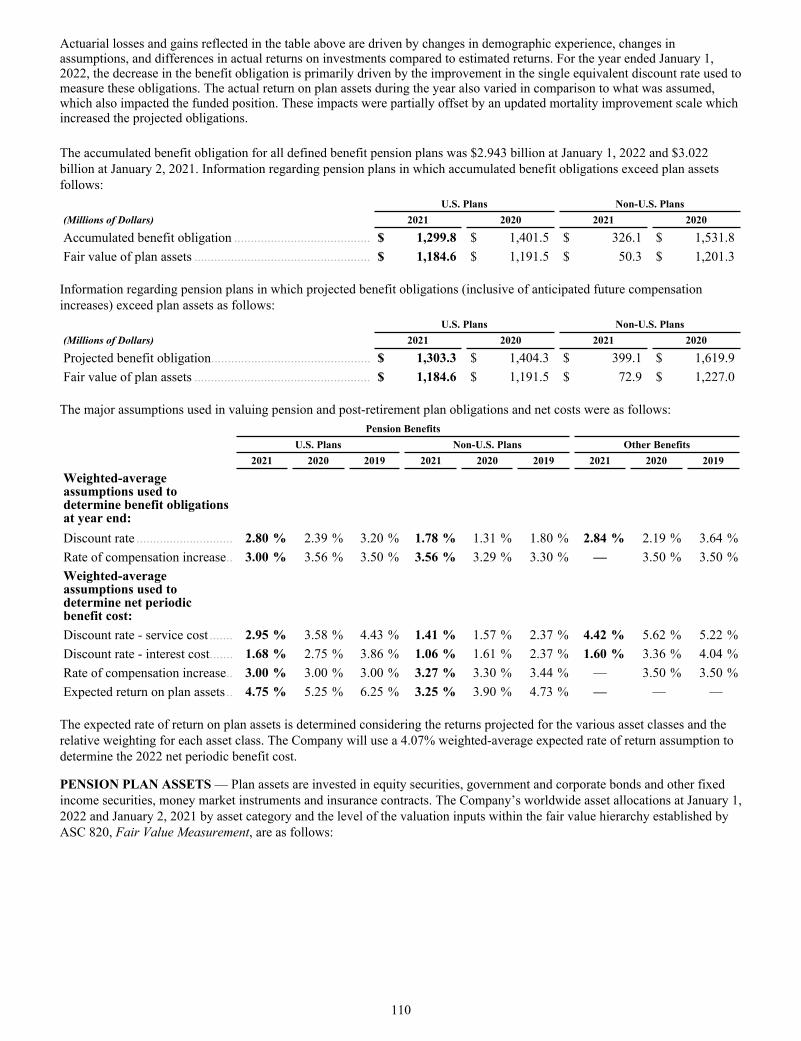
Actuarial losses and gains reflected in the table above are driven by changes in demographic experience, changes in assumptions, and differences in actual returns on investments compared to estimated returns. For the year ended January 1, 2022, the decrease in the benefit obligation is primarily driven by the improvement in the single equivalent discount rate used to measure these obligations. The actual return on plan assets during the year also varied in comparison to what was assumed, which also impacted the funded position. These impacts were partially offset by an updated mortality improvement scale which increased the projected obligations.
The accumulated benefit obligation for all defined benefit pension plans was $2.943 billion at January 1, 2022 and $3.022 billion at January 2, 2021. Information regarding pension plans in which accumulated benefit obligations exceed plan assets follows: U.S. Plans Non-U.S. Plans(Millions of Dollars) 2021 2020 2021 2020
Accumulated benefit obligation ......................................... $ 1,299.8 $ 1,401.5 $ 326.1 $ 1,531.8 Fair value of plan assets ..................................................... $ 1,184.6 $ 1,191.5 $ 50.3 $ 1,201.3
Information regarding pension plans in which projected benefit obligations (inclusive of anticipated future compensation increases) exceed plan assets as follows: U.S. Plans Non-U.S. Plans(Millions of Dollars) 2021 2020 2021 2020
Projected benefit obligation ................................................ $ 1,303.3 $ 1,404.3 $ 399.1 $ 1,619.9 Fair value of plan assets ..................................................... $ 1,184.6 $ 1,191.5 $ 72.9 $ 1,227.0
The major assumptions used in valuing pension and post-retirement plan obligations and net costs were as follows: Pension Benefits U.S. Plans Non-U.S. Plans Other Benefits 2021 2020 2019 2021 2020 2019 2021 2020 2019
Weighted-average assumptions used to determine benefit obligations at year end:Discount rate ............................. 2.80 % 2.39 % 3.20 % 1.78 % 1.31 % 1.80 % 2.84 % 2.19 % 3.64 %Rate of compensation increase .. 3.00 % 3.56 % 3.50 % 3.56 % 3.29 % 3.30 % — 3.50 % 3.50 %Weighted-average assumptions used to determine net periodic benefit cost:Discount rate - service cost ....... 2.95 % 3.58 % 4.43 % 1.41 % 1.57 % 2.37 % 4.42 % 5.62 % 5.22 %Discount rate - interest cost ....... 1.68 % 2.75 % 3.86 % 1.06 % 1.61 % 2.37 % 1.60 % 3.36 % 4.04 %Rate of compensation increase .. 3.00 % 3.00 % 3.00 % 3.27 % 3.30 % 3.44 % — 3.50 % 3.50 %Expected return on plan assets .. 4.75 % 5.25 % 6.25 % 3.25 % 3.90 % 4.73 % — — —
The expected rate of return on plan assets is determined considering the returns projected for the various asset classes and the relative weighting for each asset class. The Company will use a 4.07% weighted-average expected rate of return assumption to determine the 2022 net periodic benefit cost.
PENSION PLAN ASSETS — Plan assets are invested in equity securities, government and corporate bonds and other fixed income securities, money market instruments and insurance contracts. The Company’s worldwide asset allocations at January 1, 2022 and January 2, 2021 by asset category and the level of the valuation inputs within the fair value hierarchy established by ASC 820, Fair Value Measurement, are as follows:
110
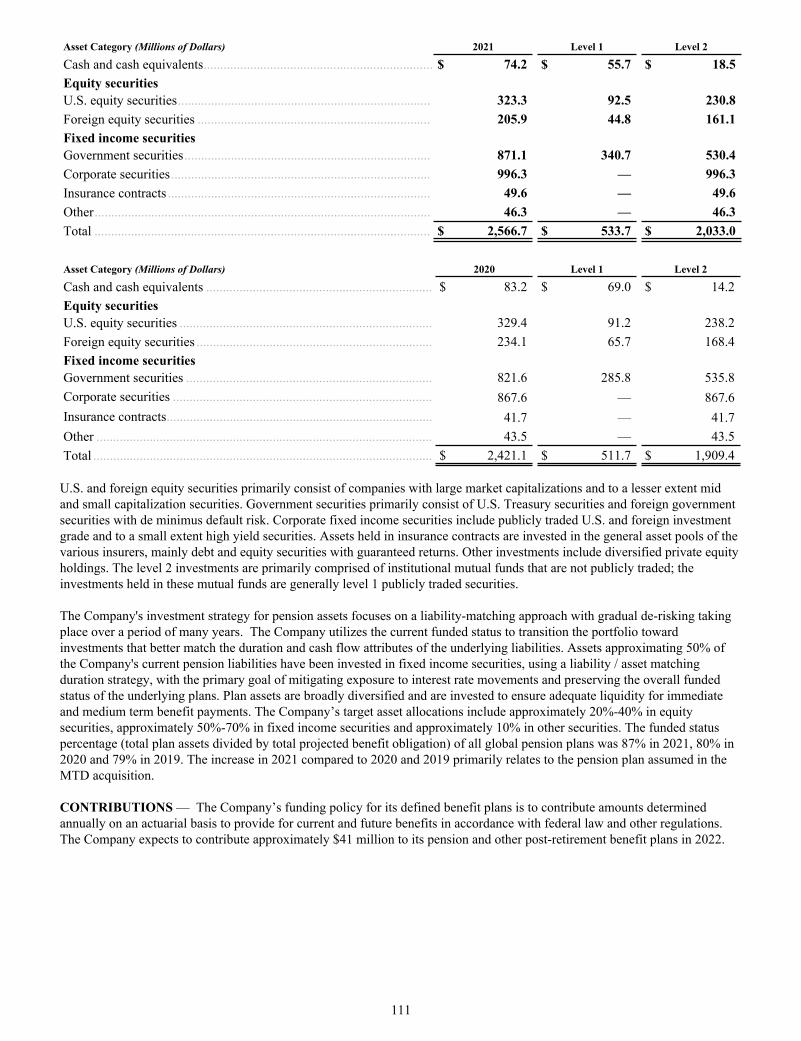
Asset Category (Millions of Dollars) 2021 Level 1 Level 2
Cash and cash equivalents ..................................................................... $ 74.2 $ 55.7 $ 18.5 Equity securitiesU.S. equity securities ............................................................................ 323.3 92.5 230.8 Foreign equity securities ...................................................................... 205.9 44.8 161.1 Fixed income securitiesGovernment securities .......................................................................... 871.1 340.7 530.4 Corporate securities .............................................................................. 996.3 — 996.3 Insurance contracts ............................................................................... 49.6 — 49.6 Other ..................................................................................................... 46.3 — 46.3 Total ..................................................................................................... $ 2,566.7 $ 533.7 $ 2,033.0
Asset Category (Millions of Dollars) 2020 Level 1 Level 2
Cash and cash equivalents .................................................................... $ 83.2 $ 69.0 $ 14.2 Equity securitiesU.S. equity securities ............................................................................ 329.4 91.2 238.2 Foreign equity securities ....................................................................... 234.1 65.7 168.4 Fixed income securitiesGovernment securities .......................................................................... 821.6 285.8 535.8 Corporate securities .............................................................................. 867.6 — 867.6 Insurance contracts ................................................................................ 41.7 — 41.7 Other ..................................................................................................... 43.5 — 43.5 Total ...................................................................................................... $ 2,421.1 $ 511.7 $ 1,909.4
U.S. and foreign equity securities primarily consist of companies with large market capitalizations and to a lesser extent mid and small capitalization securities. Government securities primarily consist of U.S. Treasury securities and foreign government securities with de minimus default risk. Corporate fixed income securities include publicly traded U.S. and foreign investment grade and to a small extent high yield securities. Assets held in insurance contracts are invested in the general asset pools of the various insurers, mainly debt and equity securities with guaranteed returns. Other investments include diversified private equity holdings. The level 2 investments are primarily comprised of institutional mutual funds that are not publicly traded; the investments held in these mutual funds are generally level 1 publicly traded securities.
The Company's investment strategy for pension assets focuses on a liability-matching approach with gradual de-risking taking place over a period of many years. The Company utilizes the current funded status to transition the portfolio toward investments that better match the duration and cash flow attributes of the underlying liabilities. Assets approximating 50% of the Company's current pension liabilities have been invested in fixed income securities, using a liability / asset matching duration strategy, with the primary goal of mitigating exposure to interest rate movements and preserving the overall funded status of the underlying plans. Plan assets are broadly diversified and are invested to ensure adequate liquidity for immediate and medium term benefit payments. The Company’s target asset allocations include approximately 20%-40% in equity securities, approximately 50%-70% in fixed income securities and approximately 10% in other securities. The funded status percentage (total plan assets divided by total projected benefit obligation) of all global pension plans was 87% in 2021, 80% in 2020 and 79% in 2019. The increase in 2021 compared to 2020 and 2019 primarily relates to the pension plan assumed in the MTD acquisition.
CONTRIBUTIONS — The Company’s funding policy for its defined benefit plans is to contribute amounts determined annually on an actuarial basis to provide for current and future benefits in accordance with federal law and other regulations. The Company expects to contribute approximately $41 million to its pension and other post-retirement benefit plans in 2022.
111
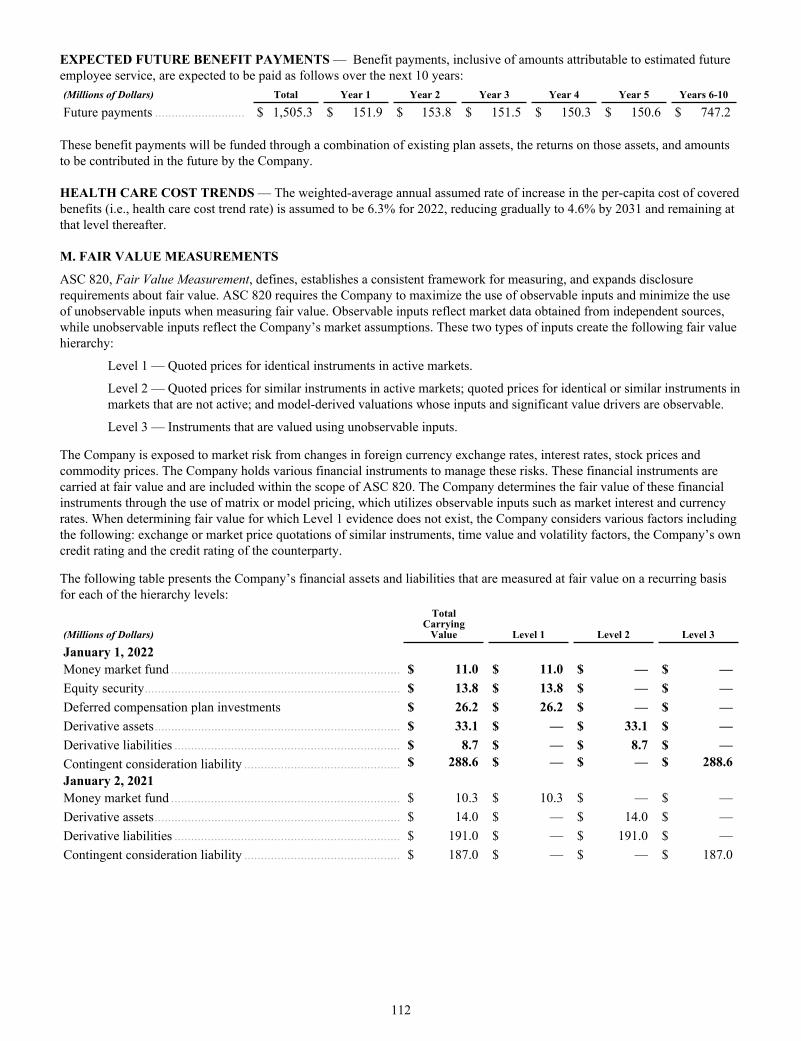
EXPECTED FUTURE BENEFIT PAYMENTS — Benefit payments, inclusive of amounts attributable to estimated future employee service, are expected to be paid as follows over the next 10 years:(Millions of Dollars) Total Year 1 Year 2 Year 3 Year 4 Year 5 Years 6-10
Future payments ........................... $ 1,505.3 $ 151.9 $ 153.8 $ 151.5 $ 150.3 $ 150.6 $ 747.2
These benefit payments will be funded through a combination of existing plan assets, the returns on those assets, and amounts to be contributed in the future by the Company.
HEALTH CARE COST TRENDS — The weighted-average annual assumed rate of increase in the per-capita cost of covered benefits (i.e., health care cost trend rate) is assumed to be 6.3% for 2022, reducing gradually to 4.6% by 2031 and remaining at that level thereafter.
M. FAIR VALUE MEASUREMENTS
ASC 820, Fair Value Measurement, defines, establishes a consistent framework for measuring, and expands disclosure requirements about fair value. ASC 820 requires the Company to maximize the use of observable inputs and minimize the use of unobservable inputs when measuring fair value. Observable inputs reflect market data obtained from independent sources, while unobservable inputs reflect the Company’s market assumptions. These two types of inputs create the following fair value hierarchy:
Level 1 — Quoted prices for identical instruments in active markets.
Level 2 — Quoted prices for similar instruments in active markets; quoted prices for identical or similar instruments in markets that are not active; and model-derived valuations whose inputs and significant value drivers are observable.
Level 3 — Instruments that are valued using unobservable inputs.
The Company is exposed to market risk from changes in foreign currency exchange rates, interest rates, stock prices and commodity prices. The Company holds various financial instruments to manage these risks. These financial instruments are carried at fair value and are included within the scope of ASC 820. The Company determines the fair value of these financial instruments through the use of matrix or model pricing, which utilizes observable inputs such as market interest and currency rates. When determining fair value for which Level 1 evidence does not exist, the Company considers various factors including the following: exchange or market price quotations of similar instruments, time value and volatility factors, the Company’s own credit rating and the credit rating of the counterparty.
The following table presents the Company’s financial assets and liabilities that are measured at fair value on a recurring basis for each of the hierarchy levels:
(Millions of Dollars)
TotalCarrying
Value Level 1 Level 2 Level 3
January 1, 2022Money market fund ..................................................................... $ 11.0 $ 11.0 $ — $ — Equity security ............................................................................. $ 13.8 $ 13.8 $ — $ — Deferred compensation plan investments $ 26.2 $ 26.2 $ — $ — Derivative assets .......................................................................... $ 33.1 $ — $ 33.1 $ — Derivative liabilities .................................................................... $ 8.7 $ — $ 8.7 $ — Contingent consideration liability ............................................... $ 288.6 $ — $ — $ 288.6 January 2, 2021Money market fund ..................................................................... $ 10.3 $ 10.3 $ — $ — Derivative assets .......................................................................... $ 14.0 $ — $ 14.0 $ — Derivative liabilities .................................................................... $ 191.0 $ — $ 191.0 $ — Contingent consideration liability ............................................... $ 187.0 $ — $ — $ 187.0
112
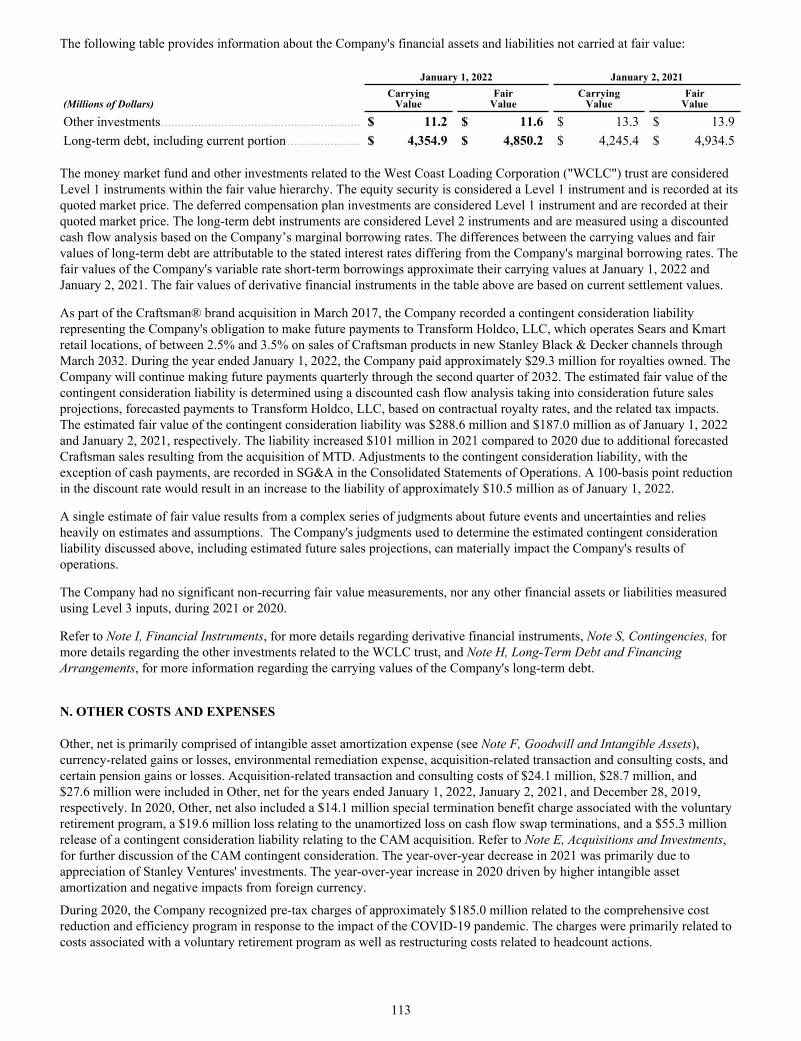
The following table provides information about the Company's financial assets and liabilities not carried at fair value: January 1, 2022 January 2, 2021
(Millions of Dollars)Carrying
ValueFair
ValueCarrying
ValueFair
Value
Other investments ............................................................ $ 11.2 $ 11.6 $ 13.3 $ 13.9 Long-term debt, including current portion ...................... $ 4,354.9 $ 4,850.2 $ 4,245.4 $ 4,934.5
The money market fund and other investments related to the West Coast Loading Corporation ("WCLC") trust are considered Level 1 instruments within the fair value hierarchy. The equity security is considered a Level 1 instrument and is recorded at its quoted market price. The deferred compensation plan investments are considered Level 1 instrument and are recorded at their quoted market price. The long-term debt instruments are considered Level 2 instruments and are measured using a discounted cash flow analysis based on the Company’s marginal borrowing rates. The differences between the carrying values and fair values of long-term debt are attributable to the stated interest rates differing from the Company's marginal borrowing rates. The fair values of the Company's variable rate short-term borrowings approximate their carrying values at January 1, 2022 and January 2, 2021. The fair values of derivative financial instruments in the table above are based on current settlement values.
As part of the Craftsman® brand acquisition in March 2017, the Company recorded a contingent consideration liability representing the Company's obligation to make future payments to Transform Holdco, LLC, which operates Sears and Kmart retail locations, of between 2.5% and 3.5% on sales of Craftsman products in new Stanley Black & Decker channels through March 2032. During the year ended January 1, 2022, the Company paid approximately $29.3 million for royalties owned. The Company will continue making future payments quarterly through the second quarter of 2032. The estimated fair value of the contingent consideration liability is determined using a discounted cash flow analysis taking into consideration future sales projections, forecasted payments to Transform Holdco, LLC, based on contractual royalty rates, and the related tax impacts. The estimated fair value of the contingent consideration liability was $288.6 million and $187.0 million as of January 1, 2022 and January 2, 2021, respectively. The liability increased $101 million in 2021 compared to 2020 due to additional forecasted Craftsman sales resulting from the acquisition of MTD. Adjustments to the contingent consideration liability, with the exception of cash payments, are recorded in SG&A in the Consolidated Statements of Operations. A 100-basis point reduction in the discount rate would result in an increase to the liability of approximately $10.5 million as of January 1, 2022.
A single estimate of fair value results from a complex series of judgments about future events and uncertainties and relies heavily on estimates and assumptions. The Company's judgments used to determine the estimated contingent consideration liability discussed above, including estimated future sales projections, can materially impact the Company's results of operations.
The Company had no significant non-recurring fair value measurements, nor any other financial assets or liabilities measured using Level 3 inputs, during 2021 or 2020.
Refer to Note I, Financial Instruments, for more details regarding derivative financial instruments, Note S, Contingencies, for more details regarding the other investments related to the WCLC trust, and Note H, Long-Term Debt and Financing Arrangements, for more information regarding the carrying values of the Company's long-term debt.
N. OTHER COSTS AND EXPENSES
Other, net is primarily comprised of intangible asset amortization expense (see Note F, Goodwill and Intangible Assets), currency-related gains or losses, environmental remediation expense, acquisition-related transaction and consulting costs, and certain pension gains or losses. Acquisition-related transaction and consulting costs of $24.1 million, $28.7 million, and $27.6 million were included in Other, net for the years ended January 1, 2022, January 2, 2021, and December 28, 2019, respectively. In 2020, Other, net also included a $14.1 million special termination benefit charge associated with the voluntary retirement program, a $19.6 million loss relating to the unamortized loss on cash flow swap terminations, and a $55.3 million release of a contingent consideration liability relating to the CAM acquisition. Refer to Note E, Acquisitions and Investments, for further discussion of the CAM contingent consideration. The year-over-year decrease in 2021 was primarily due to appreciation of Stanley Ventures' investments. The year-over-year increase in 2020 driven by higher intangible asset amortization and negative impacts from foreign currency.
During 2020, the Company recognized pre-tax charges of approximately $185.0 million related to the comprehensive cost reduction and efficiency program in response to the impact of the COVID-19 pandemic. The charges were primarily related to costs associated with a voluntary retirement program as well as restructuring costs related to headcount actions.
113
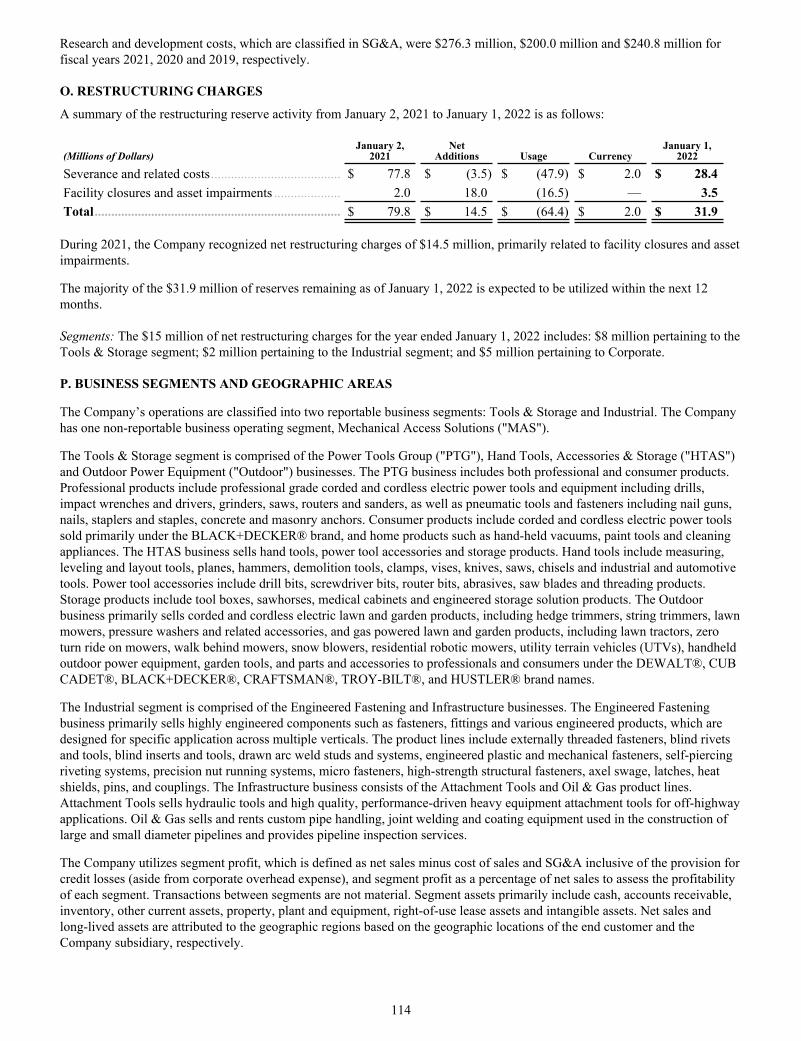
Research and development costs, which are classified in SG&A, were $276.3 million, $200.0 million and $240.8 million for fiscal years 2021, 2020 and 2019, respectively.
O. RESTRUCTURING CHARGES
A summary of the restructuring reserve activity from January 2, 2021 to January 1, 2022 is as follows:
(Millions of Dollars)January 2,
2021Net
Additions Usage CurrencyJanuary 1,
2022
Severance and related costs ....................................... $ 77.8 $ (3.5) $ (47.9) $ 2.0 $ 28.4 Facility closures and asset impairments .................... 2.0 18.0 (16.5) — 3.5 Total .......................................................................... $ 79.8 $ 14.5 $ (64.4) $ 2.0 $ 31.9
During 2021, the Company recognized net restructuring charges of $14.5 million, primarily related to facility closures and asset impairments.
The majority of the $31.9 million of reserves remaining as of January 1, 2022 is expected to be utilized within the next 12 months.
Segments: The $15 million of net restructuring charges for the year ended January 1, 2022 includes: $8 million pertaining to the Tools & Storage segment; $2 million pertaining to the Industrial segment; and $5 million pertaining to Corporate.
P. BUSINESS SEGMENTS AND GEOGRAPHIC AREAS
The Company’s operations are classified into two reportable business segments: Tools & Storage and Industrial. The Company has one non-reportable business operating segment, Mechanical Access Solutions ("MAS").
The Tools & Storage segment is comprised of the Power Tools Group ("PTG"), Hand Tools, Accessories & Storage ("HTAS") and Outdoor Power Equipment ("Outdoor") businesses. The PTG business includes both professional and consumer products. Professional products include professional grade corded and cordless electric power tools and equipment including drills, impact wrenches and drivers, grinders, saws, routers and sanders, as well as pneumatic tools and fasteners including nail guns, nails, staplers and staples, concrete and masonry anchors. Consumer products include corded and cordless electric power tools sold primarily under the BLACK+DECKER® brand, and home products such as hand-held vacuums, paint tools and cleaning appliances. The HTAS business sells hand tools, power tool accessories and storage products. Hand tools include measuring, leveling and layout tools, planes, hammers, demolition tools, clamps, vises, knives, saws, chisels and industrial and automotive tools. Power tool accessories include drill bits, screwdriver bits, router bits, abrasives, saw blades and threading products. Storage products include tool boxes, sawhorses, medical cabinets and engineered storage solution products. The Outdoor business primarily sells corded and cordless electric lawn and garden products, including hedge trimmers, string trimmers, lawn mowers, pressure washers and related accessories, and gas powered lawn and garden products, including lawn tractors, zero turn ride on mowers, walk behind mowers, snow blowers, residential robotic mowers, utility terrain vehicles (UTVs), handheld outdoor power equipment, garden tools, and parts and accessories to professionals and consumers under the DEWALT®, CUB CADET®, BLACK+DECKER®, CRAFTSMAN®, TROY-BILT®, and HUSTLER® brand names.
The Industrial segment is comprised of the Engineered Fastening and Infrastructure businesses. The Engineered Fastening business primarily sells highly engineered components such as fasteners, fittings and various engineered products, which are designed for specific application across multiple verticals. The product lines include externally threaded fasteners, blind rivets and tools, blind inserts and tools, drawn arc weld studs and systems, engineered plastic and mechanical fasteners, self-piercing riveting systems, precision nut running systems, micro fasteners, high-strength structural fasteners, axel swage, latches, heat shields, pins, and couplings. The Infrastructure business consists of the Attachment Tools and Oil & Gas product lines. Attachment Tools sells hydraulic tools and high quality, performance-driven heavy equipment attachment tools for off-highway applications. Oil & Gas sells and rents custom pipe handling, joint welding and coating equipment used in the construction of large and small diameter pipelines and provides pipeline inspection services.
The Company utilizes segment profit, which is defined as net sales minus cost of sales and SG&A inclusive of the provision for credit losses (aside from corporate overhead expense), and segment profit as a percentage of net sales to assess the profitability of each segment. Transactions between segments are not material. Segment assets primarily include cash, accounts receivable, inventory, other current assets, property, plant and equipment, right-of-use lease assets and intangible assets. Net sales and long-lived assets are attributed to the geographic regions based on the geographic locations of the end customer and the Company subsidiary, respectively.
114
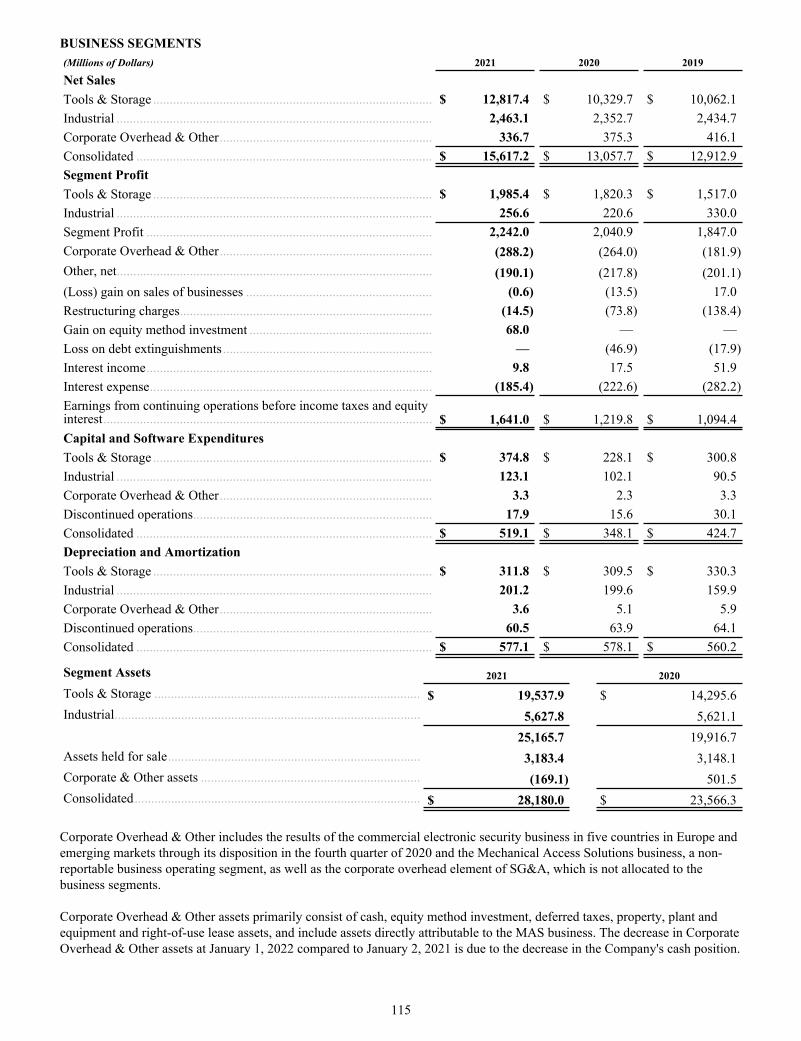
BUSINESS SEGMENTS(Millions of Dollars) 2021 2020 2019
Net SalesTools & Storage .................................................................................... $ 12,817.4 $ 10,329.7 $ 10,062.1 Industrial ............................................................................................... 2,463.1 2,352.7 2,434.7 Corporate Overhead & Other ................................................................ 336.7 375.3 416.1 Consolidated ......................................................................................... $ 15,617.2 $ 13,057.7 $ 12,912.9 Segment ProfitTools & Storage .................................................................................... $ 1,985.4 $ 1,820.3 $ 1,517.0 Industrial ............................................................................................... 256.6 220.6 330.0 Segment Profit ...................................................................................... 2,242.0 2,040.9 1,847.0 Corporate Overhead & Other ................................................................ (288.2) (264.0) (181.9) Other, net ............................................................................................... (190.1) (217.8) (201.1) (Loss) gain on sales of businesses ........................................................ (0.6) (13.5) 17.0 Restructuring charges ............................................................................ (14.5) (73.8) (138.4) Gain on equity method investment ....................................................... 68.0 — — Loss on debt extinguishments ............................................................... — (46.9) (17.9) Interest income ...................................................................................... 9.8 17.5 51.9 Interest expense ..................................................................................... (185.4) (222.6) (282.2) Earnings from continuing operations before income taxes and equity interest ................................................................................................... $ 1,641.0 $ 1,219.8 $ 1,094.4 Capital and Software ExpendituresTools & Storage .................................................................................... $ 374.8 $ 228.1 $ 300.8 Industrial ............................................................................................... 123.1 102.1 90.5 Corporate Overhead & Other ................................................................ 3.3 2.3 3.3 Discontinued operations ........................................................................ 17.9 15.6 30.1 Consolidated ......................................................................................... $ 519.1 $ 348.1 $ 424.7 Depreciation and AmortizationTools & Storage .................................................................................... $ 311.8 $ 309.5 $ 330.3 Industrial ............................................................................................... 201.2 199.6 159.9 Corporate Overhead & Other ................................................................ 3.6 5.1 5.9 Discontinued operations ........................................................................ 60.5 63.9 64.1 Consolidated ......................................................................................... $ 577.1 $ 578.1 $ 560.2
Segment Assets 2021 2020
Tools & Storage ................................................................................ $ 19,537.9 $ 14,295.6 Industrial ............................................................................................ 5,627.8 5,621.1
25,165.7 19,916.7 Assets held for sale ............................................................................ 3,183.4 3,148.1 Corporate & Other assets .................................................................. (169.1) 501.5 Consolidated ...................................................................................... $ 28,180.0 $ 23,566.3
Corporate Overhead & Other includes the results of the commercial electronic security business in five countries in Europe and emerging markets through its disposition in the fourth quarter of 2020 and the Mechanical Access Solutions business, a non-reportable business operating segment, as well as the corporate overhead element of SG&A, which is not allocated to the business segments.
Corporate Overhead & Other assets primarily consist of cash, equity method investment, deferred taxes, property, plant and equipment and right-of-use lease assets, and include assets directly attributable to the MAS business. The decrease in Corporate Overhead & Other assets at January 1, 2022 compared to January 2, 2021 is due to the decrease in the Company's cash position.
115
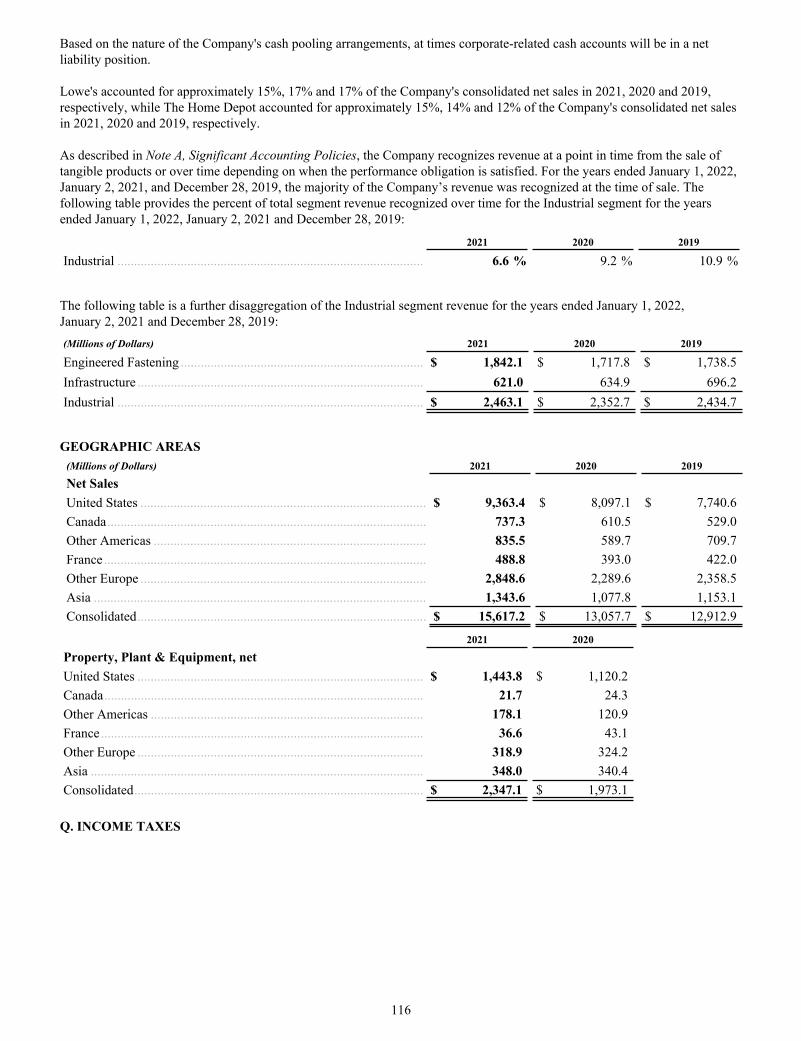
Based on the nature of the Company's cash pooling arrangements, at times corporate-related cash accounts will be in a net liability position.
Lowe's accounted for approximately 15%, 17% and 17% of the Company's consolidated net sales in 2021, 2020 and 2019, respectively, while The Home Depot accounted for approximately 15%, 14% and 12% of the Company's consolidated net sales in 2021, 2020 and 2019, respectively.
As described in Note A, Significant Accounting Policies, the Company recognizes revenue at a point in time from the sale of tangible products or over time depending on when the performance obligation is satisfied. For the years ended January 1, 2022, January 2, 2021, and December 28, 2019, the majority of the Company’s revenue was recognized at the time of sale. The following table provides the percent of total segment revenue recognized over time for the Industrial segment for the years ended January 1, 2022, January 2, 2021 and December 28, 2019:
2021 2020 2019
Industrial ............................................................................................ 6.6 % 9.2 % 10.9 %
The following table is a further disaggregation of the Industrial segment revenue for the years ended January 1, 2022, January 2, 2021 and December 28, 2019:(Millions of Dollars) 2021 2020 2019
Engineered Fastening ......................................................................... $ 1,842.1 $ 1,717.8 $ 1,738.5 Infrastructure ...................................................................................... 621.0 634.9 696.2 Industrial ............................................................................................ $ 2,463.1 $ 2,352.7 $ 2,434.7
GEOGRAPHIC AREAS
(Millions of Dollars) 2021 2020 2019
Net SalesUnited States ...................................................................................... $ 9,363.4 $ 8,097.1 $ 7,740.6 Canada ................................................................................................ 737.3 610.5 529.0 Other Americas .................................................................................. 835.5 589.7 709.7 France ................................................................................................. 488.8 393.0 422.0 Other Europe ...................................................................................... 2,848.6 2,289.6 2,358.5 Asia .................................................................................................... 1,343.6 1,077.8 1,153.1 Consolidated ....................................................................................... $ 15,617.2 $ 13,057.7 $ 12,912.9
2021 2020
Property, Plant & Equipment, netUnited States ...................................................................................... $ 1,443.8 $ 1,120.2 Canada ................................................................................................ 21.7 24.3 Other Americas .................................................................................. 178.1 120.9 France ................................................................................................. 36.6 43.1 Other Europe ...................................................................................... 318.9 324.2 Asia .................................................................................................... 348.0 340.4 Consolidated ....................................................................................... $ 2,347.1 $ 1,973.1
Q. INCOME TAXES
116
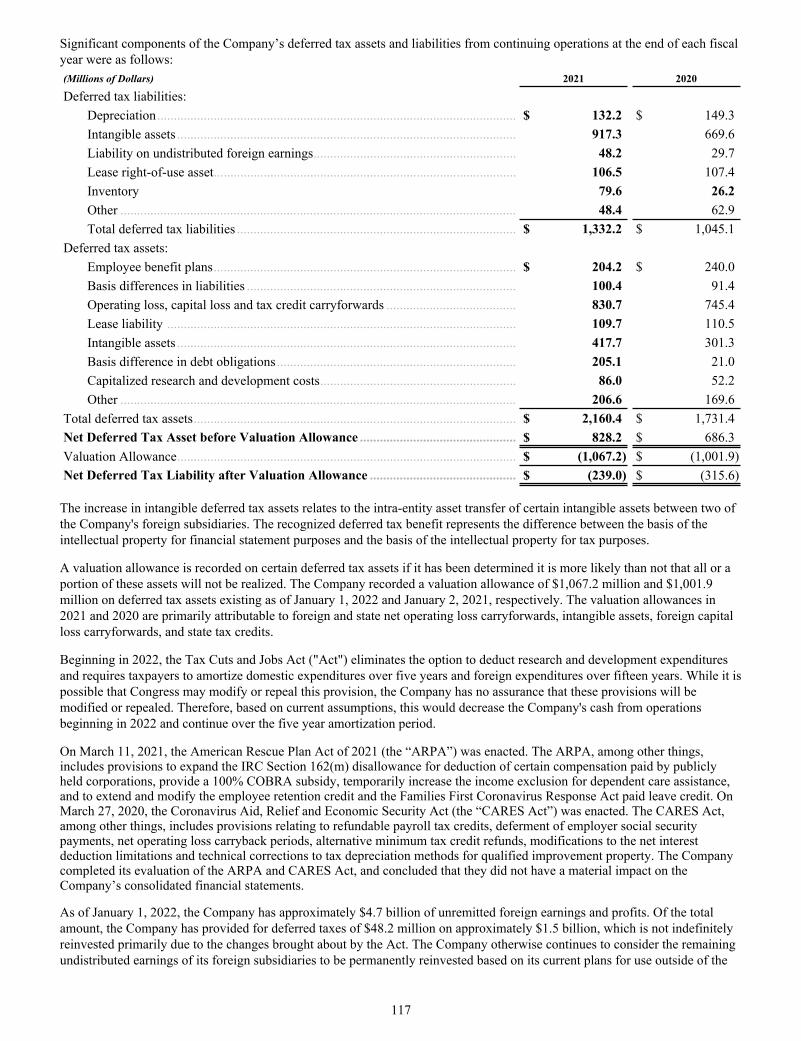
Significant components of the Company’s deferred tax assets and liabilities from continuing operations at the end of each fiscal year were as follows:(Millions of Dollars) 2021 2020
Deferred tax liabilities:Depreciation ............................................................................................................ $ 132.2 $ 149.3 Intangible assets ...................................................................................................... 917.3 669.6 Liability on undistributed foreign earnings ............................................................. 48.2 29.7 Lease right-of-use asset ........................................................................................... 106.5 107.4 Inventory 79.6 26.2 Other ....................................................................................................................... 48.4 62.9 Total deferred tax liabilities .................................................................................... $ 1,332.2 $ 1,045.1
Deferred tax assets:Employee benefit plans ........................................................................................... $ 204.2 $ 240.0 Basis differences in liabilities ................................................................................. 100.4 91.4 Operating loss, capital loss and tax credit carryforwards ....................................... 830.7 745.4 Lease liability ......................................................................................................... 109.7 110.5 Intangible assets ...................................................................................................... 417.7 301.3 Basis difference in debt obligations ........................................................................ 205.1 21.0 Capitalized research and development costs ........................................................... 86.0 52.2 Other ....................................................................................................................... 206.6 169.6
Total deferred tax assets ................................................................................................. $ 2,160.4 $ 1,731.4 Net Deferred Tax Asset before Valuation Allowance ............................................... $ 828.2 $ 686.3 Valuation Allowance ...................................................................................................... $ (1,067.2) $ (1,001.9) Net Deferred Tax Liability after Valuation Allowance ............................................ $ (239.0) $ (315.6)
The increase in intangible deferred tax assets relates to the intra-entity asset transfer of certain intangible assets between two of the Company's foreign subsidiaries. The recognized deferred tax benefit represents the difference between the basis of the intellectual property for financial statement purposes and the basis of the intellectual property for tax purposes.
A valuation allowance is recorded on certain deferred tax assets if it has been determined it is more likely than not that all or a portion of these assets will not be realized. The Company recorded a valuation allowance of $1,067.2 million and $1,001.9 million on deferred tax assets existing as of January 1, 2022 and January 2, 2021, respectively. The valuation allowances in 2021 and 2020 are primarily attributable to foreign and state net operating loss carryforwards, intangible assets, foreign capital loss carryforwards, and state tax credits.
Beginning in 2022, the Tax Cuts and Jobs Act ("Act") eliminates the option to deduct research and development expenditures and requires taxpayers to amortize domestic expenditures over five years and foreign expenditures over fifteen years. While it is possible that Congress may modify or repeal this provision, the Company has no assurance that these provisions will be modified or repealed. Therefore, based on current assumptions, this would decrease the Company's cash from operations beginning in 2022 and continue over the five year amortization period.
On March 11, 2021, the American Rescue Plan Act of 2021 (the “ARPA”) was enacted. The ARPA, among other things, includes provisions to expand the IRC Section 162(m) disallowance for deduction of certain compensation paid by publicly held corporations, provide a 100% COBRA subsidy, temporarily increase the income exclusion for dependent care assistance, and to extend and modify the employee retention credit and the Families First Coronavirus Response Act paid leave credit. On March 27, 2020, the Coronavirus Aid, Relief and Economic Security Act (the “CARES Act”) was enacted. The CARES Act, among other things, includes provisions relating to refundable payroll tax credits, deferment of employer social security payments, net operating loss carryback periods, alternative minimum tax credit refunds, modifications to the net interest deduction limitations and technical corrections to tax depreciation methods for qualified improvement property. The Company completed its evaluation of the ARPA and CARES Act, and concluded that they did not have a material impact on the Company’s consolidated financial statements.
As of January 1, 2022, the Company has approximately $4.7 billion of unremitted foreign earnings and profits. Of the total amount, the Company has provided for deferred taxes of $48.2 million on approximately $1.5 billion, which is not indefinitely reinvested primarily due to the changes brought about by the Act. The Company otherwise continues to consider the remaining undistributed earnings of its foreign subsidiaries to be permanently reinvested based on its current plans for use outside of the
117
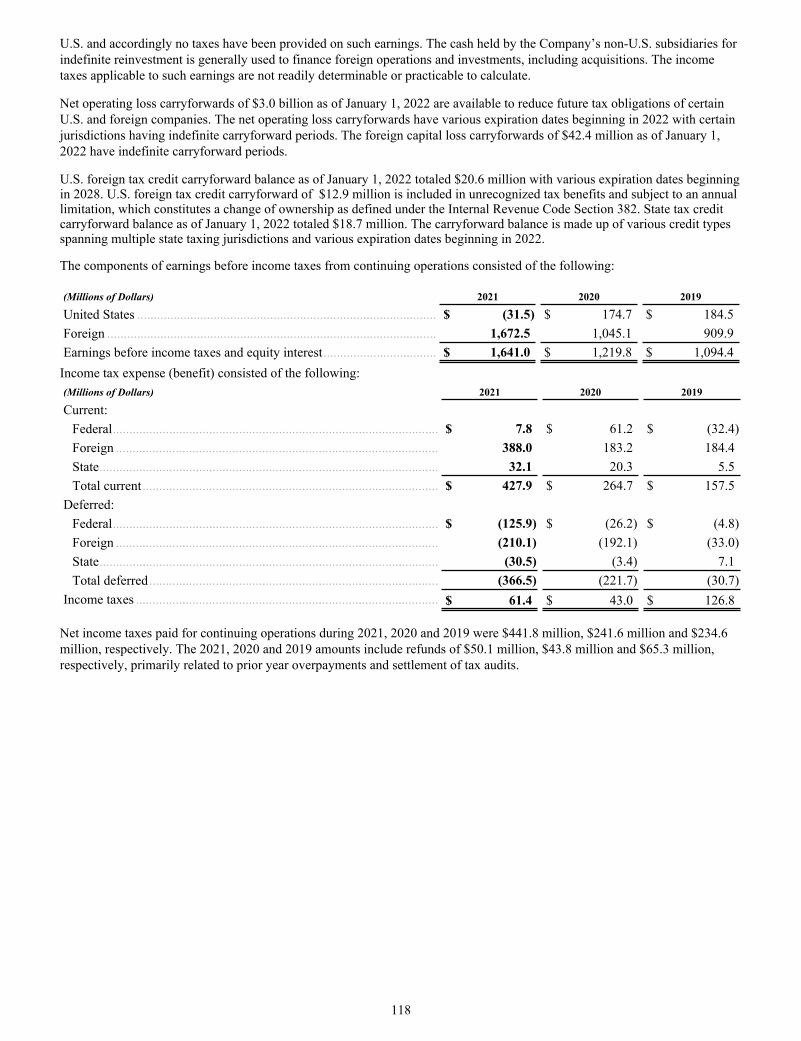
U.S. and accordingly no taxes have been provided on such earnings. The cash held by the Company’s non-U.S. subsidiaries for indefinite reinvestment is generally used to finance foreign operations and investments, including acquisitions. The income taxes applicable to such earnings are not readily determinable or practicable to calculate.
Net operating loss carryforwards of $3.0 billion as of January 1, 2022 are available to reduce future tax obligations of certain U.S. and foreign companies. The net operating loss carryforwards have various expiration dates beginning in 2022 with certain jurisdictions having indefinite carryforward periods. The foreign capital loss carryforwards of $42.4 million as of January 1, 2022 have indefinite carryforward periods.
U.S. foreign tax credit carryforward balance as of January 1, 2022 totaled $20.6 million with various expiration dates beginning in 2028. U.S. foreign tax credit carryforward of $12.9 million is included in unrecognized tax benefits and subject to an annual limitation, which constitutes a change of ownership as defined under the Internal Revenue Code Section 382. State tax credit carryforward balance as of January 1, 2022 totaled $18.7 million. The carryforward balance is made up of various credit types spanning multiple state taxing jurisdictions and various expiration dates beginning in 2022.
The components of earnings before income taxes from continuing operations consisted of the following:
(Millions of Dollars) 2021 2020 2019
United States .......................................................................................... $ (31.5) $ 174.7 $ 184.5 Foreign ................................................................................................... 1,672.5 1,045.1 909.9 Earnings before income taxes and equity interest .................................. $ 1,641.0 $ 1,219.8 $ 1,094.4
Income tax expense (benefit) consisted of the following:(Millions of Dollars) 2021 2020 2019
Current:Federal .................................................................................................. $ 7.8 $ 61.2 $ (32.4) Foreign ................................................................................................. 388.0 183.2 184.4 State ...................................................................................................... 32.1 20.3 5.5 Total current ......................................................................................... $ 427.9 $ 264.7 $ 157.5
Deferred:Federal .................................................................................................. $ (125.9) $ (26.2) $ (4.8) Foreign ................................................................................................. (210.1) (192.1) (33.0) State ...................................................................................................... (30.5) (3.4) 7.1 Total deferred ....................................................................................... (366.5) (221.7) (30.7)
Income taxes ........................................................................................... $ 61.4 $ 43.0 $ 126.8
Net income taxes paid for continuing operations during 2021, 2020 and 2019 were $441.8 million, $241.6 million and $234.6 million, respectively. The 2021, 2020 and 2019 amounts include refunds of $50.1 million, $43.8 million and $65.3 million, respectively, primarily related to prior year overpayments and settlement of tax audits.
118
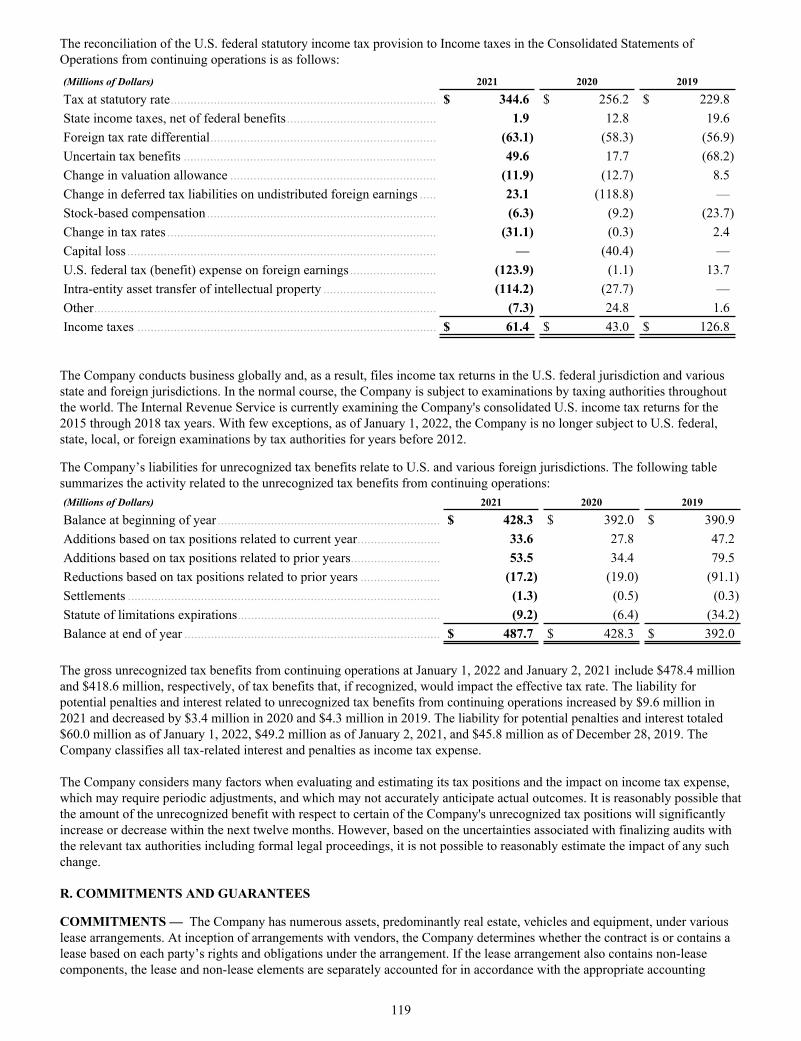
The reconciliation of the U.S. federal statutory income tax provision to Income taxes in the Consolidated Statements of Operations from continuing operations is as follows:(Millions of Dollars) 2021 2020 2019
Tax at statutory rate ................................................................................ $ 344.6 $ 256.2 $ 229.8 State income taxes, net of federal benefits ............................................. 1.9 12.8 19.6 Foreign tax rate differential .................................................................... (63.1) (58.3) (56.9) Uncertain tax benefits ............................................................................ 49.6 17.7 (68.2) Change in valuation allowance .............................................................. (11.9) (12.7) 8.5 Change in deferred tax liabilities on undistributed foreign earnings ..... 23.1 (118.8) — Stock-based compensation ..................................................................... (6.3) (9.2) (23.7) Change in tax rates ................................................................................. (31.1) (0.3) 2.4 Capital loss ............................................................................................. — (40.4) — U.S. federal tax (benefit) expense on foreign earnings .......................... (123.9) (1.1) 13.7 Intra-entity asset transfer of intellectual property .................................. (114.2) (27.7) — Other ....................................................................................................... (7.3) 24.8 1.6 Income taxes .......................................................................................... $ 61.4 $ 43.0 $ 126.8
The Company conducts business globally and, as a result, files income tax returns in the U.S. federal jurisdiction and various state and foreign jurisdictions. In the normal course, the Company is subject to examinations by taxing authorities throughout the world. The Internal Revenue Service is currently examining the Company's consolidated U.S. income tax returns for the 2015 through 2018 tax years. With few exceptions, as of January 1, 2022, the Company is no longer subject to U.S. federal, state, local, or foreign examinations by tax authorities for years before 2012.
The Company’s liabilities for unrecognized tax benefits relate to U.S. and various foreign jurisdictions. The following table summarizes the activity related to the unrecognized tax benefits from continuing operations:(Millions of Dollars) 2021 2020 2019
Balance at beginning of year ................................................................... $ 428.3 $ 392.0 $ 390.9 Additions based on tax positions related to current year ......................... 33.6 27.8 47.2 Additions based on tax positions related to prior years ........................... 53.5 34.4 79.5 Reductions based on tax positions related to prior years ........................ (17.2) (19.0) (91.1) Settlements .............................................................................................. (1.3) (0.5) (0.3) Statute of limitations expirations ............................................................. (9.2) (6.4) (34.2) Balance at end of year ............................................................................. $ 487.7 $ 428.3 $ 392.0
The gross unrecognized tax benefits from continuing operations at January 1, 2022 and January 2, 2021 include $478.4 million and $418.6 million, respectively, of tax benefits that, if recognized, would impact the effective tax rate. The liability for potential penalties and interest related to unrecognized tax benefits from continuing operations increased by $9.6 million in 2021 and decreased by $3.4 million in 2020 and $4.3 million in 2019. The liability for potential penalties and interest totaled $60.0 million as of January 1, 2022, $49.2 million as of January 2, 2021, and $45.8 million as of December 28, 2019. The Company classifies all tax-related interest and penalties as income tax expense.
The Company considers many factors when evaluating and estimating its tax positions and the impact on income tax expense, which may require periodic adjustments, and which may not accurately anticipate actual outcomes. It is reasonably possible that the amount of the unrecognized benefit with respect to certain of the Company's unrecognized tax positions will significantly increase or decrease within the next twelve months. However, based on the uncertainties associated with finalizing audits with the relevant tax authorities including formal legal proceedings, it is not possible to reasonably estimate the impact of any such change.
R. COMMITMENTS AND GUARANTEES
COMMITMENTS — The Company has numerous assets, predominantly real estate, vehicles and equipment, under various lease arrangements. At inception of arrangements with vendors, the Company determines whether the contract is or contains a lease based on each party’s rights and obligations under the arrangement. If the lease arrangement also contains non-lease components, the lease and non-lease elements are separately accounted for in accordance with the appropriate accounting
119
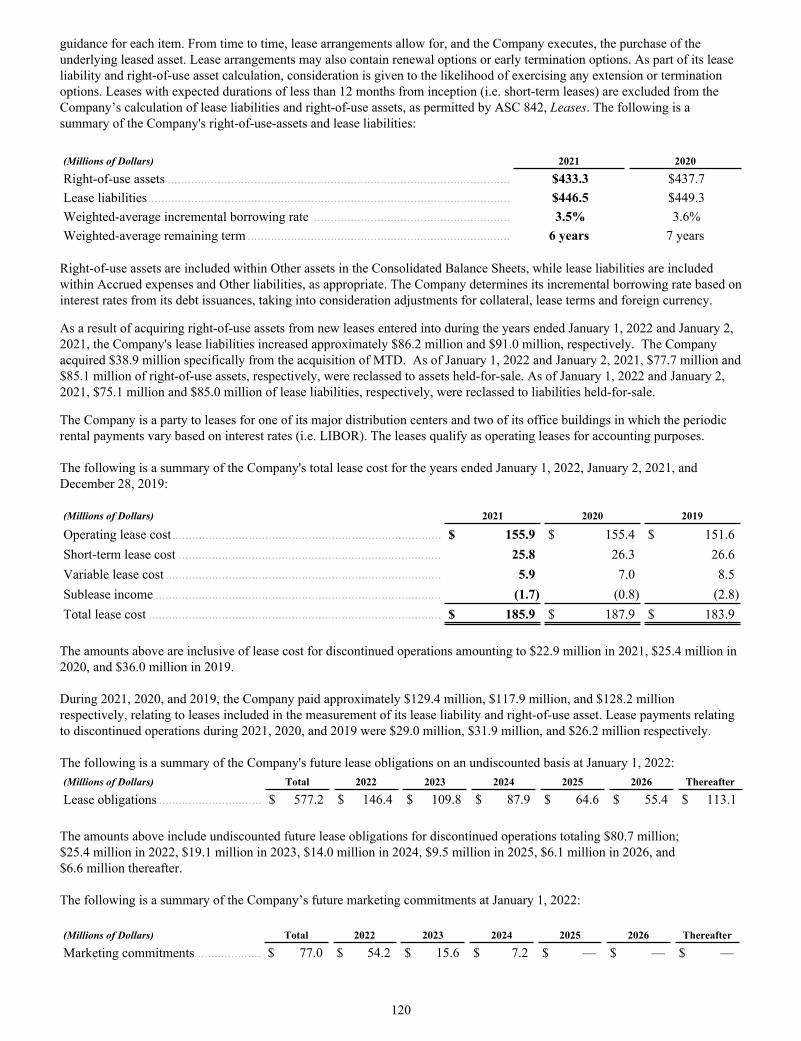
guidance for each item. From time to time, lease arrangements allow for, and the Company executes, the purchase of the underlying leased asset. Lease arrangements may also contain renewal options or early termination options. As part of its lease liability and right-of-use asset calculation, consideration is given to the likelihood of exercising any extension or termination options. Leases with expected durations of less than 12 months from inception (i.e. short-term leases) are excluded from the Company’s calculation of lease liabilities and right-of-use assets, as permitted by ASC 842, Leases. The following is a summary of the Company's right-of-use-assets and lease liabilities:
(Millions of Dollars) 2021 2020
Right-of-use assets ....................................................................................................... $433.3 $437.7Lease liabilities ............................................................................................................. $446.5 $449.3Weighted-average incremental borrowing rate ........................................................... 3.5% 3.6%Weighted-average remaining term ............................................................................... 6 years 7 years
Right-of-use assets are included within Other assets in the Consolidated Balance Sheets, while lease liabilities are included within Accrued expenses and Other liabilities, as appropriate. The Company determines its incremental borrowing rate based on interest rates from its debt issuances, taking into consideration adjustments for collateral, lease terms and foreign currency.
As a result of acquiring right-of-use assets from new leases entered into during the years ended January 1, 2022 and January 2, 2021, the Company's lease liabilities increased approximately $86.2 million and $91.0 million, respectively. The Company acquired $38.9 million specifically from the acquisition of MTD. As of January 1, 2022 and January 2, 2021, $77.7 million and $85.1 million of right-of-use assets, respectively, were reclassed to assets held-for-sale. As of January 1, 2022 and January 2, 2021, $75.1 million and $85.0 million of lease liabilities, respectively, were reclassed to liabilities held-for-sale.
The Company is a party to leases for one of its major distribution centers and two of its office buildings in which the periodic rental payments vary based on interest rates (i.e. LIBOR). The leases qualify as operating leases for accounting purposes.
The following is a summary of the Company's total lease cost for the years ended January 1, 2022, January 2, 2021, and December 28, 2019:
(Millions of Dollars) 2021 2020 2019
Operating lease cost ................................................................................. $ 155.9 $ 155.4 $ 151.6 Short-term lease cost ............................................................................... 25.8 26.3 26.6 Variable lease cost ................................................................................... 5.9 7.0 8.5 Sublease income ...................................................................................... (1.7) (0.8) (2.8) Total lease cost ........................................................................................ $ 185.9 $ 187.9 $ 183.9
The amounts above are inclusive of lease cost for discontinued operations amounting to $22.9 million in 2021, $25.4 million in 2020, and $36.0 million in 2019.
During 2021, 2020, and 2019, the Company paid approximately $129.4 million, $117.9 million, and $128.2 million respectively, relating to leases included in the measurement of its lease liability and right-of-use asset. Lease payments relating to discontinued operations during 2021, 2020, and 2019 were $29.0 million, $31.9 million, and $26.2 million respectively.
The following is a summary of the Company's future lease obligations on an undiscounted basis at January 1, 2022:(Millions of Dollars) Total 2022 2023 2024 2025 2026 Thereafter
Lease obligations ............................... $ 577.2 $ 146.4 $ 109.8 $ 87.9 $ 64.6 $ 55.4 $ 113.1
The amounts above include undiscounted future lease obligations for discontinued operations totaling $80.7 million; $25.4 million in 2022, $19.1 million in 2023, $14.0 million in 2024, $9.5 million in 2025, $6.1 million in 2026, and $6.6 million thereafter.
The following is a summary of the Company’s future marketing commitments at January 1, 2022:
(Millions of Dollars) Total 2022 2023 2024 2025 2026 Thereafter
Marketing commitments.................... $ 77.0 $ 54.2 $ 15.6 $ 7.2 $ — $ — $ —
120
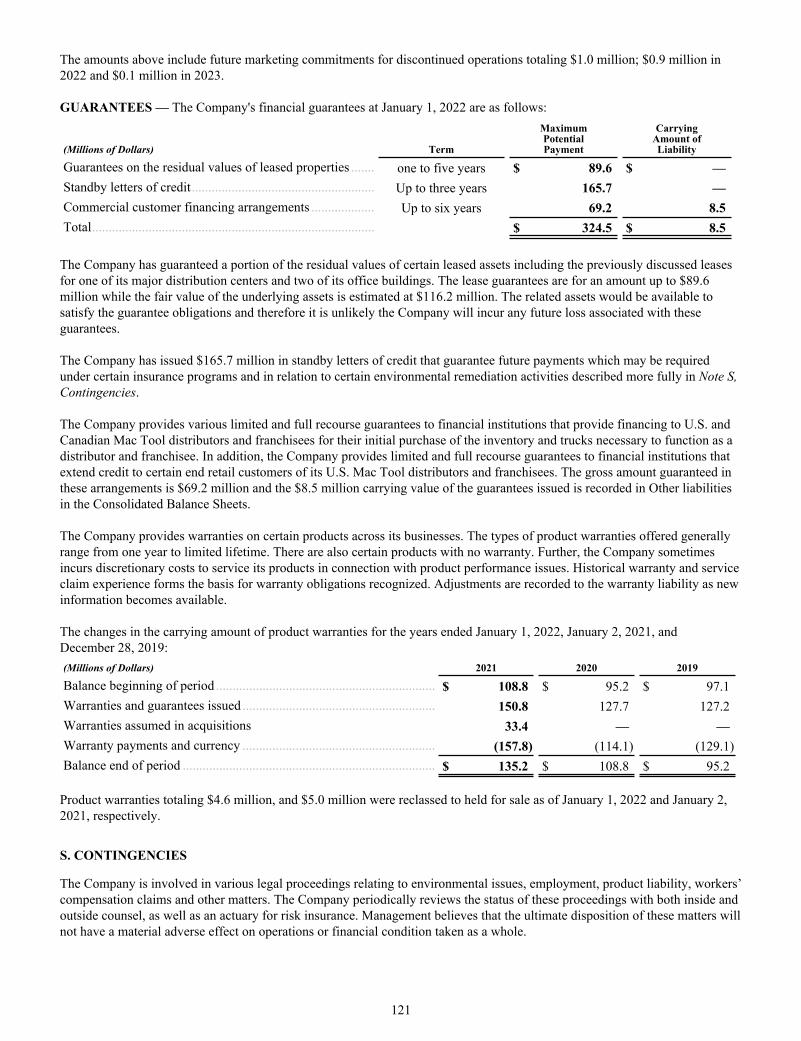
The amounts above include future marketing commitments for discontinued operations totaling $1.0 million; $0.9 million in 2022 and $0.1 million in 2023.
GUARANTEES — The Company's financial guarantees at January 1, 2022 are as follows:
(Millions of Dollars) Term
MaximumPotentialPayment
CarryingAmount ofLiability
Guarantees on the residual values of leased properties ....... one to five years $ 89.6 $ — Standby letters of credit ....................................................... Up to three years 165.7 — Commercial customer financing arrangements ................... Up to six years 69.2 8.5 Total ..................................................................................... $ 324.5 $ 8.5
The Company has guaranteed a portion of the residual values of certain leased assets including the previously discussed leases for one of its major distribution centers and two of its office buildings. The lease guarantees are for an amount up to $89.6 million while the fair value of the underlying assets is estimated at $116.2 million. The related assets would be available to satisfy the guarantee obligations and therefore it is unlikely the Company will incur any future loss associated with these guarantees.
The Company has issued $165.7 million in standby letters of credit that guarantee future payments which may be required under certain insurance programs and in relation to certain environmental remediation activities described more fully in Note S, Contingencies.
The Company provides various limited and full recourse guarantees to financial institutions that provide financing to U.S. and Canadian Mac Tool distributors and franchisees for their initial purchase of the inventory and trucks necessary to function as a distributor and franchisee. In addition, the Company provides limited and full recourse guarantees to financial institutions that extend credit to certain end retail customers of its U.S. Mac Tool distributors and franchisees. The gross amount guaranteed in these arrangements is $69.2 million and the $8.5 million carrying value of the guarantees issued is recorded in Other liabilities in the Consolidated Balance Sheets.
The Company provides warranties on certain products across its businesses. The types of product warranties offered generally range from one year to limited lifetime. There are also certain products with no warranty. Further, the Company sometimes incurs discretionary costs to service its products in connection with product performance issues. Historical warranty and service claim experience forms the basis for warranty obligations recognized. Adjustments are recorded to the warranty liability as new information becomes available.
The changes in the carrying amount of product warranties for the years ended January 1, 2022, January 2, 2021, and December 28, 2019:(Millions of Dollars) 2021 2020 2019
Balance beginning of period .................................................................. $ 108.8 $ 95.2 $ 97.1 Warranties and guarantees issued .......................................................... 150.8 127.7 127.2 Warranties assumed in acquisitions 33.4 — — Warranty payments and currency .......................................................... (157.8) (114.1) (129.1) Balance end of period ............................................................................ $ 135.2 $ 108.8 $ 95.2
Product warranties totaling $4.6 million, and $5.0 million were reclassed to held for sale as of January 1, 2022 and January 2, 2021, respectively.
S. CONTINGENCIES
The Company is involved in various legal proceedings relating to environmental issues, employment, product liability, workers’ compensation claims and other matters. The Company periodically reviews the status of these proceedings with both inside and outside counsel, as well as an actuary for risk insurance. Management believes that the ultimate disposition of these matters will not have a material adverse effect on operations or financial condition taken as a whole.
121
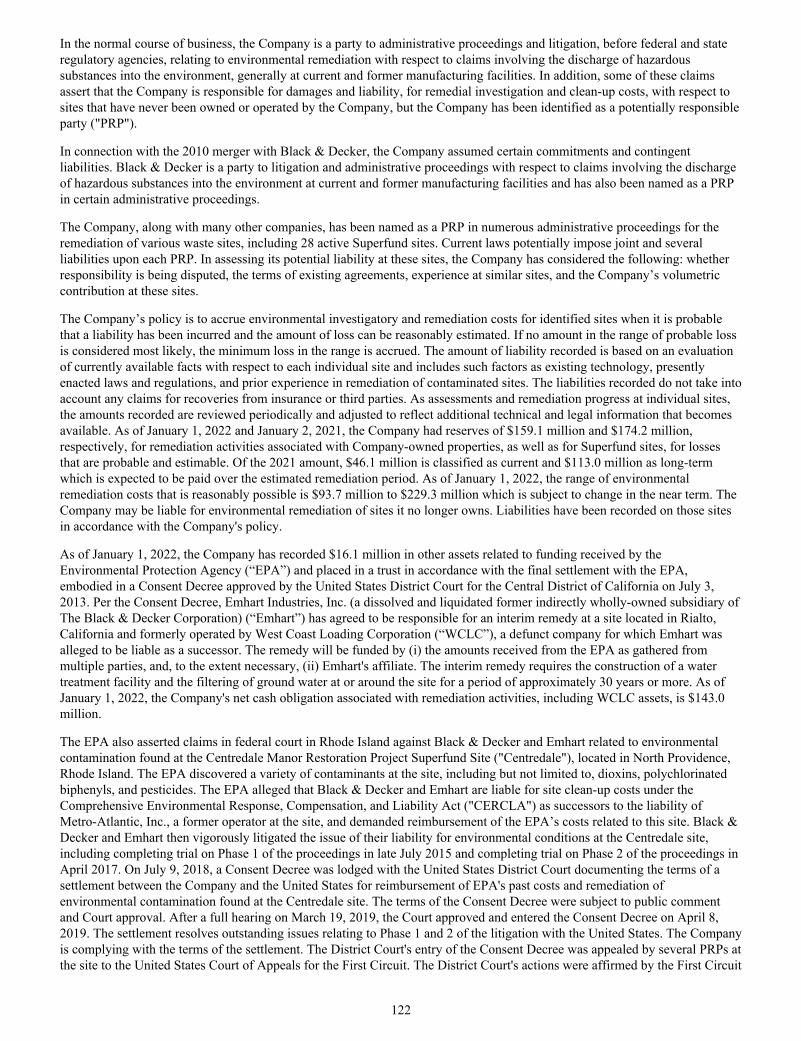
In the normal course of business, the Company is a party to administrative proceedings and litigation, before federal and state regulatory agencies, relating to environmental remediation with respect to claims involving the discharge of hazardous substances into the environment, generally at current and former manufacturing facilities. In addition, some of these claims assert that the Company is responsible for damages and liability, for remedial investigation and clean-up costs, with respect to sites that have never been owned or operated by the Company, but the Company has been identified as a potentially responsible party ("PRP").
In connection with the 2010 merger with Black & Decker, the Company assumed certain commitments and contingent liabilities. Black & Decker is a party to litigation and administrative proceedings with respect to claims involving the discharge of hazardous substances into the environment at current and former manufacturing facilities and has also been named as a PRP in certain administrative proceedings.
The Company, along with many other companies, has been named as a PRP in numerous administrative proceedings for the remediation of various waste sites, including 28 active Superfund sites. Current laws potentially impose joint and several liabilities upon each PRP. In assessing its potential liability at these sites, the Company has considered the following: whether responsibility is being disputed, the terms of existing agreements, experience at similar sites, and the Company’s volumetric contribution at these sites.
The Company’s policy is to accrue environmental investigatory and remediation costs for identified sites when it is probable that a liability has been incurred and the amount of loss can be reasonably estimated. If no amount in the range of probable loss is considered most likely, the minimum loss in the range is accrued. The amount of liability recorded is based on an evaluation of currently available facts with respect to each individual site and includes such factors as existing technology, presently enacted laws and regulations, and prior experience in remediation of contaminated sites. The liabilities recorded do not take into account any claims for recoveries from insurance or third parties. As assessments and remediation progress at individual sites, the amounts recorded are reviewed periodically and adjusted to reflect additional technical and legal information that becomes available. As of January 1, 2022 and January 2, 2021, the Company had reserves of $159.1 million and $174.2 million, respectively, for remediation activities associated with Company-owned properties, as well as for Superfund sites, for losses that are probable and estimable. Of the 2021 amount, $46.1 million is classified as current and $113.0 million as long-term which is expected to be paid over the estimated remediation period. As of January 1, 2022, the range of environmental remediation costs that is reasonably possible is $93.7 million to $229.3 million which is subject to change in the near term. The Company may be liable for environmental remediation of sites it no longer owns. Liabilities have been recorded on those sites in accordance with the Company's policy.
As of January 1, 2022, the Company has recorded $16.1 million in other assets related to funding received by the Environmental Protection Agency (“EPA”) and placed in a trust in accordance with the final settlement with the EPA, embodied in a Consent Decree approved by the United States District Court for the Central District of California on July 3, 2013. Per the Consent Decree, Emhart Industries, Inc. (a dissolved and liquidated former indirectly wholly-owned subsidiary of The Black & Decker Corporation) (“Emhart”) has agreed to be responsible for an interim remedy at a site located in Rialto, California and formerly operated by West Coast Loading Corporation (“WCLC”), a defunct company for which Emhart was alleged to be liable as a successor. The remedy will be funded by (i) the amounts received from the EPA as gathered from multiple parties, and, to the extent necessary, (ii) Emhart's affiliate. The interim remedy requires the construction of a water treatment facility and the filtering of ground water at or around the site for a period of approximately 30 years or more. As of January 1, 2022, the Company's net cash obligation associated with remediation activities, including WCLC assets, is $143.0 million.
The EPA also asserted claims in federal court in Rhode Island against Black & Decker and Emhart related to environmental contamination found at the Centredale Manor Restoration Project Superfund Site ("Centredale"), located in North Providence, Rhode Island. The EPA discovered a variety of contaminants at the site, including but not limited to, dioxins, polychlorinated biphenyls, and pesticides. The EPA alleged that Black & Decker and Emhart are liable for site clean-up costs under the Comprehensive Environmental Response, Compensation, and Liability Act ("CERCLA") as successors to the liability of Metro-Atlantic, Inc., a former operator at the site, and demanded reimbursement of the EPA’s costs related to this site. Black & Decker and Emhart then vigorously litigated the issue of their liability for environmental conditions at the Centredale site, including completing trial on Phase 1 of the proceedings in late July 2015 and completing trial on Phase 2 of the proceedings in April 2017. On July 9, 2018, a Consent Decree was lodged with the United States District Court documenting the terms of a settlement between the Company and the United States for reimbursement of EPA's past costs and remediation of environmental contamination found at the Centredale site. The terms of the Consent Decree were subject to public comment and Court approval. After a full hearing on March 19, 2019, the Court approved and entered the Consent Decree on April 8, 2019. The settlement resolves outstanding issues relating to Phase 1 and 2 of the litigation with the United States. The Company is complying with the terms of the settlement. The District Court's entry of the Consent Decree was appealed by several PRPs at the site to the United States Court of Appeals for the First Circuit. The District Court's actions were affirmed by the First Circuit
122
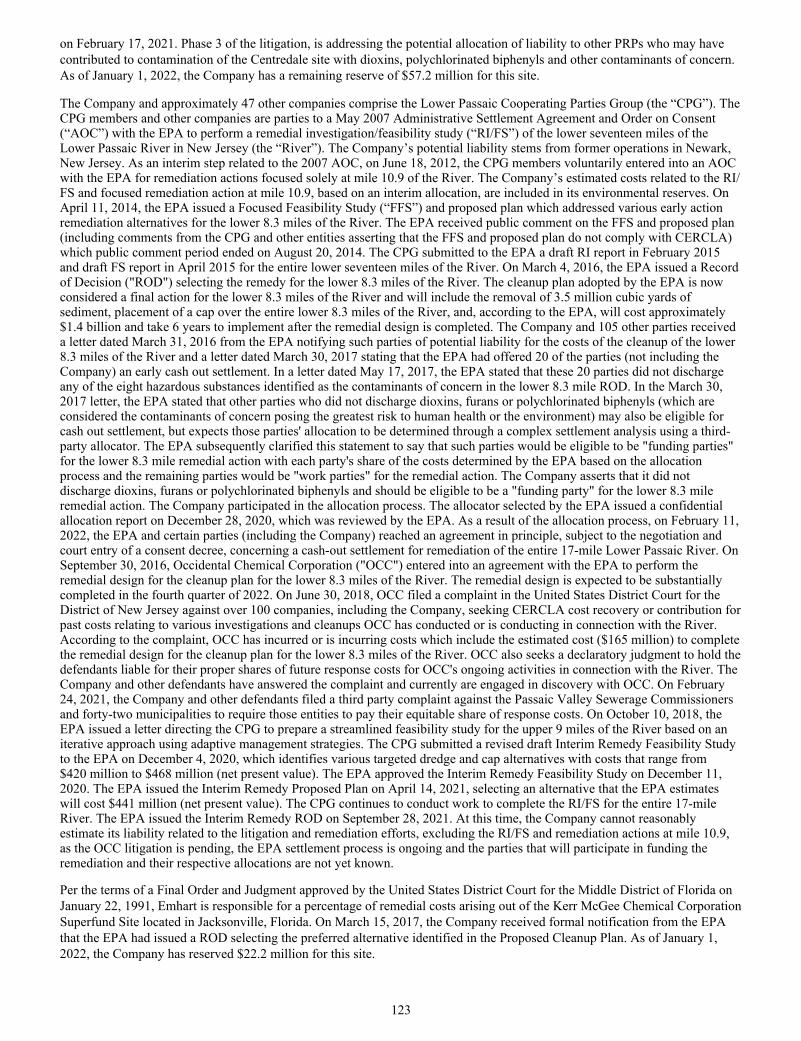
on February 17, 2021. Phase 3 of the litigation, is addressing the potential allocation of liability to other PRPs who may have contributed to contamination of the Centredale site with dioxins, polychlorinated biphenyls and other contaminants of concern. As of January 1, 2022, the Company has a remaining reserve of $57.2 million for this site.
The Company and approximately 47 other companies comprise the Lower Passaic Cooperating Parties Group (the “CPG”). The CPG members and other companies are parties to a May 2007 Administrative Settlement Agreement and Order on Consent (“AOC”) with the EPA to perform a remedial investigation/feasibility study (“RI/FS”) of the lower seventeen miles of the Lower Passaic River in New Jersey (the “River”). The Company’s potential liability stems from former operations in Newark, New Jersey. As an interim step related to the 2007 AOC, on June 18, 2012, the CPG members voluntarily entered into an AOC with the EPA for remediation actions focused solely at mile 10.9 of the River. The Company’s estimated costs related to the RI/FS and focused remediation action at mile 10.9, based on an interim allocation, are included in its environmental reserves. On April 11, 2014, the EPA issued a Focused Feasibility Study (“FFS”) and proposed plan which addressed various early action remediation alternatives for the lower 8.3 miles of the River. The EPA received public comment on the FFS and proposed plan (including comments from the CPG and other entities asserting that the FFS and proposed plan do not comply with CERCLA) which public comment period ended on August 20, 2014. The CPG submitted to the EPA a draft RI report in February 2015 and draft FS report in April 2015 for the entire lower seventeen miles of the River. On March 4, 2016, the EPA issued a Record of Decision ("ROD") selecting the remedy for the lower 8.3 miles of the River. The cleanup plan adopted by the EPA is now considered a final action for the lower 8.3 miles of the River and will include the removal of 3.5 million cubic yards of sediment, placement of a cap over the entire lower 8.3 miles of the River, and, according to the EPA, will cost approximately $1.4 billion and take 6 years to implement after the remedial design is completed. The Company and 105 other parties received a letter dated March 31, 2016 from the EPA notifying such parties of potential liability for the costs of the cleanup of the lower 8.3 miles of the River and a letter dated March 30, 2017 stating that the EPA had offered 20 of the parties (not including the Company) an early cash out settlement. In a letter dated May 17, 2017, the EPA stated that these 20 parties did not discharge any of the eight hazardous substances identified as the contaminants of concern in the lower 8.3 mile ROD. In the March 30, 2017 letter, the EPA stated that other parties who did not discharge dioxins, furans or polychlorinated biphenyls (which are considered the contaminants of concern posing the greatest risk to human health or the environment) may also be eligible for cash out settlement, but expects those parties' allocation to be determined through a complex settlement analysis using a third-party allocator. The EPA subsequently clarified this statement to say that such parties would be eligible to be "funding parties" for the lower 8.3 mile remedial action with each party's share of the costs determined by the EPA based on the allocation process and the remaining parties would be "work parties" for the remedial action. The Company asserts that it did not discharge dioxins, furans or polychlorinated biphenyls and should be eligible to be a "funding party" for the lower 8.3 mile remedial action. The Company participated in the allocation process. The allocator selected by the EPA issued a confidential allocation report on December 28, 2020, which was reviewed by the EPA. As a result of the allocation process, on February 11, 2022, the EPA and certain parties (including the Company) reached an agreement in principle, subject to the negotiation and court entry of a consent decree, concerning a cash-out settlement for remediation of the entire 17-mile Lower Passaic River. On September 30, 2016, Occidental Chemical Corporation ("OCC") entered into an agreement with the EPA to perform the remedial design for the cleanup plan for the lower 8.3 miles of the River. The remedial design is expected to be substantially completed in the fourth quarter of 2022. On June 30, 2018, OCC filed a complaint in the United States District Court for the District of New Jersey against over 100 companies, including the Company, seeking CERCLA cost recovery or contribution for past costs relating to various investigations and cleanups OCC has conducted or is conducting in connection with the River. According to the complaint, OCC has incurred or is incurring costs which include the estimated cost ($165 million) to complete the remedial design for the cleanup plan for the lower 8.3 miles of the River. OCC also seeks a declaratory judgment to hold the defendants liable for their proper shares of future response costs for OCC's ongoing activities in connection with the River. The Company and other defendants have answered the complaint and currently are engaged in discovery with OCC. On February 24, 2021, the Company and other defendants filed a third party complaint against the Passaic Valley Sewerage Commissioners and forty-two municipalities to require those entities to pay their equitable share of response costs. On October 10, 2018, the EPA issued a letter directing the CPG to prepare a streamlined feasibility study for the upper 9 miles of the River based on an iterative approach using adaptive management strategies. The CPG submitted a revised draft Interim Remedy Feasibility Study to the EPA on December 4, 2020, which identifies various targeted dredge and cap alternatives with costs that range from $420 million to $468 million (net present value). The EPA approved the Interim Remedy Feasibility Study on December 11, 2020. The EPA issued the Interim Remedy Proposed Plan on April 14, 2021, selecting an alternative that the EPA estimates will cost $441 million (net present value). The CPG continues to conduct work to complete the RI/FS for the entire 17-mile River. The EPA issued the Interim Remedy ROD on September 28, 2021. At this time, the Company cannot reasonably estimate its liability related to the litigation and remediation efforts, excluding the RI/FS and remediation actions at mile 10.9, as the OCC litigation is pending, the EPA settlement process is ongoing and the parties that will participate in funding the remediation and their respective allocations are not yet known.
Per the terms of a Final Order and Judgment approved by the United States District Court for the Middle District of Florida on January 22, 1991, Emhart is responsible for a percentage of remedial costs arising out of the Kerr McGee Chemical Corporation Superfund Site located in Jacksonville, Florida. On March 15, 2017, the Company received formal notification from the EPA that the EPA had issued a ROD selecting the preferred alternative identified in the Proposed Cleanup Plan. As of January 1, 2022, the Company has reserved $22.2 million for this site.
123

The environmental liability for certain sites that have cash payments beyond the current year that are fixed or reliably determinable have been discounted using a rate of 0.1% to 2.0%, depending on the expected timing of disbursements. The discounted and undiscounted amount of the liability relative to these sites is $40.9 million and $44.7 million, respectively. The payments relative to these sites are expected to be $2.7 million in 2022, $3.1 million in 2023, $3.1 million in 2024, $2.8 million in 2025, $2.9 million in 2026, and $30.1 million thereafter.
The amount recorded for identified contingent liabilities is based on estimates. Amounts recorded are reviewed periodically and adjusted to reflect additional technical and legal information that becomes available. Actual costs to be incurred in future periods may vary from the estimates, given the inherent uncertainties in evaluating certain exposures. Subject to the imprecision in estimating future contingent liability costs, the Company does not expect that any sum it may have to pay in connection with these matters in excess of the amounts recorded will have a materially adverse effect on its financial position, results of operations or liquidity.
T. DIVESTITURES
PENDING DIVESTITURE
Commercial Electronic Security and Healthcare businesses
In December 2021, the Company announced that it had reached a definitive agreement for the sale of most of its Security assets to Securitas AB ("Purchaser") for approximately $3.2 billion in cash. The proposed transaction includes the Company's Convergent Security Solutions ("CSS") business comprising of commercial electronic security and healthcare businesses. The transaction does not include the Company's automatic doors business. The sale is subject to regulatory approvals and other customary closing conditions, and is expected to close in the first half of 2022.
As part of the purchase and sale agreement, the Company will perform transition services relating to certain administrative functions for Purchaser primarily for a period of one year or less, pending Purchaser's integration of these functions into their pre-existing business processes. A portion of the $3.2 billion received at closing reimburses the Company for transition service costs expected to be incurred.
In December 2021, upon announcing it reached a definitive agreement for the sale of most of its Security assets, the assets and liabilities related to CSS were classified as held for sale on the Company's Consolidated Balance Sheets as of January 1, 2022 and January 2, 2021. In addition, the sale of CSS represents a strategic shift and has a major effect on the Company's operations and financial results. As such, the operating results of the CSS are reported as discontinued operations, in accordance with ASC 205. Amounts previously reported have been reclassified to conform to this presentation to allow for meaningful comparison of continuing operations.
Summarized operating results of discontinued operations are presented in the following table for each fiscal year ended:
(Millions of Dollars) 2021 2020 2019
Net Sales ..................................................................................... $ 1,635.5 $ 1,476.9 $ 1,529.3 Cost of sales ................................................................................ 1,024.8 914.3 957.2 Selling, general, and administrative(1)
......................................... 481.8 461.1 472.7 Other, net and restructuring charges ........................................... 58.7 54.3 63.8 Earnings from discontinued operations before income taxes ..... $ 70.2 $ 47.2 $ 35.6 Income taxes on discontinued operations ................................... (18.7) (1.6) 34.0 Net earnings from discontinued operations ................................ $ 88.9 $ 48.8 $ 1.6
(1) Includes provision for credit losses.
The following table presents the significant non-cash items and capital expenditures for the discontinued operations with respect to CSS that are included in the Consolidated Statements of Cash Flows (in millions) for each fiscal year ended:
(Millions of Dollars) 2021 2020 2019
Depreciation and amortization $ 60.5 $ 63.9 $ 64.1 Capital expenditures $ 17.9 $ 15.6 $ 30.1 Stock-based compensation $ 6.0 $ 5.3 $ 3.2
124
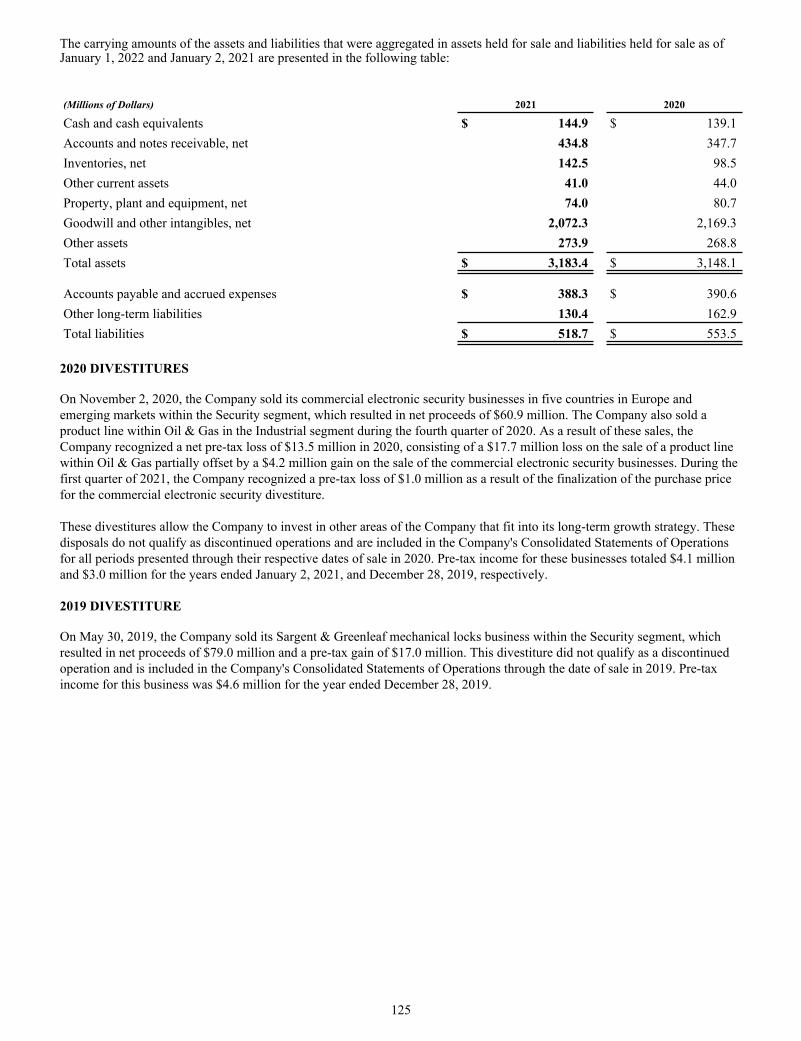
The carrying amounts of the assets and liabilities that were aggregated in assets held for sale and liabilities held for sale as of January 1, 2022 and January 2, 2021 are presented in the following table:
(Millions of Dollars) 2021 2020
Cash and cash equivalents $ 144.9 $ 139.1 Accounts and notes receivable, net 434.8 347.7 Inventories, net 142.5 98.5 Other current assets 41.0 44.0 Property, plant and equipment, net 74.0 80.7 Goodwill and other intangibles, net 2,072.3 2,169.3 Other assets 273.9 268.8 Total assets $ 3,183.4 $ 3,148.1
Accounts payable and accrued expenses $ 388.3 $ 390.6 Other long-term liabilities 130.4 162.9 Total liabilities $ 518.7 $ 553.5
2020 DIVESTITURES
On November 2, 2020, the Company sold its commercial electronic security businesses in five countries in Europe and emerging markets within the Security segment, which resulted in net proceeds of $60.9 million. The Company also sold a product line within Oil & Gas in the Industrial segment during the fourth quarter of 2020. As a result of these sales, the Company recognized a net pre-tax loss of $13.5 million in 2020, consisting of a $17.7 million loss on the sale of a product line within Oil & Gas partially offset by a $4.2 million gain on the sale of the commercial electronic security businesses. During the first quarter of 2021, the Company recognized a pre-tax loss of $1.0 million as a result of the finalization of the purchase price for the commercial electronic security divestiture.
These divestitures allow the Company to invest in other areas of the Company that fit into its long-term growth strategy. These disposals do not qualify as discontinued operations and are included in the Company's Consolidated Statements of Operations for all periods presented through their respective dates of sale in 2020. Pre-tax income for these businesses totaled $4.1 million and $3.0 million for the years ended January 2, 2021, and December 28, 2019, respectively.
2019 DIVESTITURE
On May 30, 2019, the Company sold its Sargent & Greenleaf mechanical locks business within the Security segment, which resulted in net proceeds of $79.0 million and a pre-tax gain of $17.0 million. This divestiture did not qualify as a discontinued operation and is included in the Company's Consolidated Statements of Operations through the date of sale in 2019. Pre-tax income for this business was $4.6 million for the year ended December 28, 2019.
125
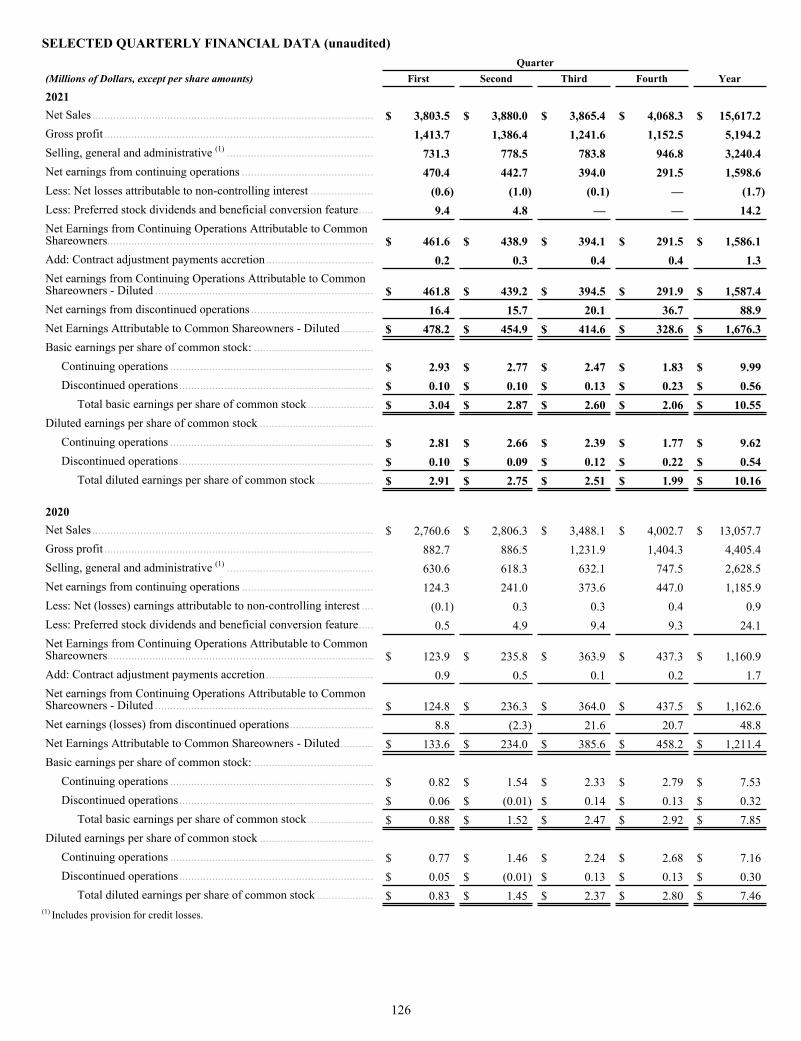
SELECTED QUARTERLY FINANCIAL DATA (unaudited) Quarter (Millions of Dollars, except per share amounts) First Second Third Fourth Year
2021Net Sales .............................................................................................. $ 3,803.5 $ 3,880.0 $ 3,865.4 $ 4,068.3 $ 15,617.2 Gross profit .......................................................................................... 1,413.7 1,386.4 1,241.6 1,152.5 5,194.2 Selling, general and administrative (1)
................................................. 731.3 778.5 783.8 946.8 3,240.4 Net earnings from continuing operations ............................................ 470.4 442.7 394.0 291.5 1,598.6 Less: Net losses attributable to non-controlling interest ..................... (0.6) (1.0) (0.1) — (1.7) Less: Preferred stock dividends and beneficial conversion feature ..... 9.4 4.8 — — 14.2 Net Earnings from Continuing Operations Attributable to Common Shareowners ......................................................................................... $ 461.6 $ 438.9 $ 394.1 $ 291.5 $ 1,586.1 Add: Contract adjustment payments accretion .................................... 0.2 0.3 0.4 0.4 1.3 Net earnings from Continuing Operations Attributable to Common Shareowners - Diluted ......................................................................... $ 461.8 $ 439.2 $ 394.5 $ 291.9 $ 1,587.4 Net earnings from discontinued operations ......................................... 16.4 15.7 20.1 36.7 88.9 Net Earnings Attributable to Common Shareowners - Diluted ........... $ 478.2 $ 454.9 $ 414.6 $ 328.6 $ 1,676.3 Basic earnings per share of common stock: ........................................
Continuing operations .................................................................... $ 2.93 $ 2.77 $ 2.47 $ 1.83 $ 9.99 Discontinued operations ................................................................. $ 0.10 $ 0.10 $ 0.13 $ 0.23 $ 0.56
Total basic earnings per share of common stock ...................... $ 3.04 $ 2.87 $ 2.60 $ 2.06 $ 10.55 Diluted earnings per share of common stock ......................................
Continuing operations .................................................................... $ 2.81 $ 2.66 $ 2.39 $ 1.77 $ 9.62 Discontinued operations ................................................................. $ 0.10 $ 0.09 $ 0.12 $ 0.22 $ 0.54
Total diluted earnings per share of common stock ................... $ 2.91 $ 2.75 $ 2.51 $ 1.99 $ 10.16
2020Net Sales .............................................................................................. $ 2,760.6 $ 2,806.3 $ 3,488.1 $ 4,002.7 $ 13,057.7 Gross profit .......................................................................................... 882.7 886.5 1,231.9 1,404.3 4,405.4 Selling, general and administrative (1)
................................................. 630.6 618.3 632.1 747.5 2,628.5 Net earnings from continuing operations ............................................ 124.3 241.0 373.6 447.0 1,185.9 Less: Net (losses) earnings attributable to non-controlling interest .... (0.1) 0.3 0.3 0.4 0.9 Less: Preferred stock dividends and beneficial conversion feature ..... 0.5 4.9 9.4 9.3 24.1 Net Earnings from Continuing Operations Attributable to Common Shareowners ......................................................................................... $ 123.9 $ 235.8 $ 363.9 $ 437.3 $ 1,160.9 Add: Contract adjustment payments accretion .................................... 0.9 0.5 0.1 0.2 1.7 Net earnings from Continuing Operations Attributable to Common Shareowners - Diluted ......................................................................... $ 124.8 $ 236.3 $ 364.0 $ 437.5 $ 1,162.6 Net earnings (losses) from discontinued operations ............................ 8.8 (2.3) 21.6 20.7 48.8 Net Earnings Attributable to Common Shareowners - Diluted ........... $ 133.6 $ 234.0 $ 385.6 $ 458.2 $ 1,211.4 Basic earnings per share of common stock: ........................................
Continuing operations .................................................................... $ 0.82 $ 1.54 $ 2.33 $ 2.79 $ 7.53 Discontinued operations ................................................................. $ 0.06 $ (0.01) $ 0.14 $ 0.13 $ 0.32
Total basic earnings per share of common stock ...................... $ 0.88 $ 1.52 $ 2.47 $ 2.92 $ 7.85 Diluted earnings per share of common stock ......................................
Continuing operations .................................................................... $ 0.77 $ 1.46 $ 2.24 $ 2.68 $ 7.16 Discontinued operations ................................................................. $ 0.05 $ (0.01) $ 0.13 $ 0.13 $ 0.30
Total diluted earnings per share of common stock ................... $ 0.83 $ 1.45 $ 2.37 $ 2.80 $ 7.46 (1) Includes provision for credit losses.
126
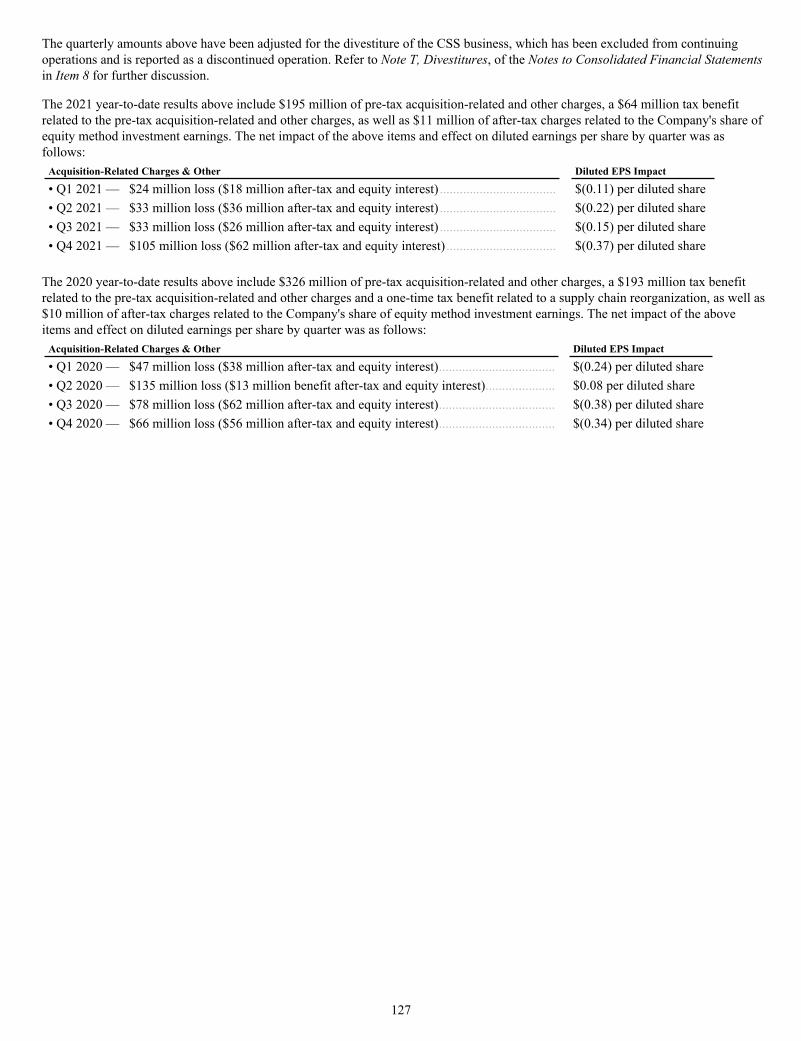
The quarterly amounts above have been adjusted for the divestiture of the CSS business, which has been excluded from continuing operations and is reported as a discontinued operation. Refer to Note T, Divestitures, of the Notes to Consolidated Financial Statements in Item 8 for further discussion.
The 2021 year-to-date results above include $195 million of pre-tax acquisition-related and other charges, a $64 million tax benefit related to the pre-tax acquisition-related and other charges, as well as $11 million of after-tax charges related to the Company's share of equity method investment earnings. The net impact of the above items and effect on diluted earnings per share by quarter was as follows:
Acquisition-Related Charges & Other Diluted EPS Impact
• Q1 2021 — $24 million loss ($18 million after-tax and equity interest) ................................... $(0.11) per diluted share
• Q2 2021 — $33 million loss ($36 million after-tax and equity interest) ................................... $(0.22) per diluted share
• Q3 2021 — $33 million loss ($26 million after-tax and equity interest) ................................... $(0.15) per diluted share
• Q4 2021 — $105 million loss ($62 million after-tax and equity interest) ................................. $(0.37) per diluted share
The 2020 year-to-date results above include $326 million of pre-tax acquisition-related and other charges, a $193 million tax benefit related to the pre-tax acquisition-related and other charges and a one-time tax benefit related to a supply chain reorganization, as well as $10 million of after-tax charges related to the Company's share of equity method investment earnings. The net impact of the above items and effect on diluted earnings per share by quarter was as follows:
Acquisition-Related Charges & Other Diluted EPS Impact
• Q1 2020 — $47 million loss ($38 million after-tax and equity interest) ................................... $(0.24) per diluted share• Q2 2020 — $135 million loss ($13 million benefit after-tax and equity interest) ..................... $0.08 per diluted share• Q3 2020 — $78 million loss ($62 million after-tax and equity interest) ................................... $(0.38) per diluted share• Q4 2020 — $66 million loss ($56 million after-tax and equity interest) ................................... $(0.34) per diluted share
127
EXHIBIT INDEXSTANLEY BLACK & DECKER, INC.
EXHIBIT LIST
Some of the agreements included as exhibits to this Annual Report on Form 10-K (whether incorporated by reference to earlier filings or otherwise) may contain representations and warranties, recitals or other statements that appear to be statements of fact. These agreements are included solely to provide investors with information regarding their terms and are not intended to provide any other factual or disclosure information about the Company or the other parties to the agreements. Representations and warranties, recitals, and other common disclosure provisions have been included in the agreements solely for the benefit of the other parties to the applicable agreements and often are used as a means of allocating risk among the parties. Accordingly, such statements (i) should not be treated as categorical statements of fact; (ii) may be qualified by disclosures that were made to the other parties in connection with the negotiation of the applicable agreements, which disclosures are not necessarily reflected in the agreement or included as exhibits hereto; (iii) may apply standards of materiality in a way that is different from what may be viewed as material by or to investors in or lenders to the Company; and (iv) were made only as of the date of the applicable agreement or such other date or dates as may be specified in the agreement and are subject to more recent developments.
Accordingly, representations and warranties, recitals or other disclosures contained in agreements may not describe the actual state of affairs as of the date they were made or at any other time and should not be relied on by any person other than the parties thereto in accordance with their terms. Additional information about the Company may be found in this Annual Report on Form 10-K and the Company’s other public filings, which are available without charge through the SEC’s website at http://www.sec.gov. 2.1 Acquisition Agreement by and between Stanley Black & Decker, Inc. and Securitas AB, dated as of December
8, 2021 (incorporated by reference to Exhibit 2.1 to the Company’s Current Report on Form 8-K filed on December 8, 2021).#
3.1 (a) Restated Certificate of Incorporation dated September 15, 1998 (incorporated by reference to Exhibit 3(i) to the Company’s Quarterly Report on Form 10-Q for the period ended April 3, 2010 filed on May 13, 2010).
(b) Certificate of Amendment to the Restated Certificate of Incorporation dated December 21, 2009 (incorporated by reference to Exhibit 3(ii) to the Company’s Quarterly Report on Form 10-Q for the period ended April 3, 2010 filed on May 13, 2010).
(c) Certificate of Amendment to the Restated Certificate of Incorporation dated March 12, 2010 (incorporated by reference to Exhibit 3(iii) to the Company’s Quarterly Report on Form 10-Q for the period ended April 3, 2010 filed on May 13, 2010).
(d) Certificate of Amendment to the Restated Certificate of Incorporation dated November 5, 2010 (incorporated by reference to Exhibit 3.1 to the Company’s Current Report on Form 8-K filed on November 9, 2010).
(e) Certificate of Amendment to the Restated Certificate of Incorporation dated April 17, 2012 (incorporated by reference to Exhibit 3(i) to the Company’s Quarterly Report on Form 10-Q for the period ended March 31, 2012 filed on May 2, 2012).
(f) Certificate of Amendment to the Restated Certificate of Incorporation dated May 17, 2017 (incorporated by reference to Exhibit 3.1 to the Company’s Current Report on Form 8-K filed on May 17, 2017).
(g) Certificate of Amendment to the Restated Certificate of Incorporation dated November 13, 2019 (incorporated by reference to Exhibit 3.1 to the Company's Current Report on Form 8-K filed on November 13, 2019).
(h) Certificate of Amendment to the Restated Certificate of Incorporation dated May 15, 2020 (incorporated by reference to Exhibit 3.2 to the Company's Current Report on Form 8-K filed on May 15, 2020).
(i) Certificate of Amendment to the Restated Certificate of Incorporation, dated May 12, 2021 (incorporated by reference to Exhibit 3.1 to the Company’s Current Report on Form 8-K filed on May 13, 2021).
3.2 Amended and Restated Bylaws, effective May 12, 2021 (incorporated by reference to Exhibit 3.2 to the Company’s Current Report on Form 8-K filed on May 13, 2021).
4.1 (a) Indenture, dated as of June 26, 1998, by and among Black & Decker Holdings Inc., as Issuer, The Black & Decker Corporation, as Guarantor, and The First National Bank of Chicago, as Trustee (incorporated by reference to Exhibit 4.9 to the Company’s Current Report on Form 8-K filed on March 12, 2010).
128
4.2 (a) Indenture, dated as of November 1, 2002 between The Stanley Works and The Bank of New York Mellon Trust Company, N.A., as successor trustee to JPMorgan Chase Bank (incorporated by reference to Exhibit 4(vi) to the Company’s Annual Report on Form 10-K for the period ended December 28, 2002 filed on February 28, 2003).
(b) Third Supplemental Indenture dated as of September 3, 2010, to the Indenture dated as of November 1, 2002, among Stanley Black & Decker, Inc., The Black & Decker Corporation and The Bank of New York Mellon Trust Company, N.A., as successor trustee to JPMorgan Chase Bank, N.A. (formerly known as JPMorgan Chase Bank), as Trustee, relating to the 5.20% Notes due 2040 (incorporated by reference to Exhibit 4.1 to the Company’s Current Report on Form 8-K filed on September 7, 2010).
(c) Sixth Supplemental Indenture, dated as of November 6, 2018, between the Company and the Bank of New York Mellon Trust Company, N.A., as trustee, relating to the 4.250% Notes due 2028 and the 4.850% Notes due 2048 (incorporated by reference to Exhibit 4.2 to the Company’s Form 8-K dated November 6, 2018).
(d) Seventh Supplemental Indenture, dated as of March 1, 2019, between the Company and the Bank of New York Mellon Trust Company, N.A., as trustee, relating to the 3.400% Notes due 2026 (incorporated by reference to Exhibit 4.2 to the Company's Form 8-K dated March 1, 2019).
(e) Eight Supplemental Indenture, dated as of February 10, 2020, between Stanley Black & Decker, Inc. and The Bank of New York Mellon Trust Company, N.A., as trustee, relating to the 2.300% Notes due 2030 (incorporated by reference to Exhibit 4.2 to the Company's Form 8-K dated February 10, 2020).
(f) Ninth Supplemental Indenture, dated as of November 2, 2020, between Stanley Black & Decker, Inc. and The Bank of New York Mellon Trust Company, N.A., as trustee, relating to the 2.750% Notes due 2050 (incorporated by reference to Exhibit 4.2 to the Company's Form 8-K dated November 2, 2020).
4.3 (a) Indenture, dated November 22, 2005, between The Stanley Works and HSBC Bank USA, National Association, as indenture trustee (incorporated by reference to Exhibit 4.5 to the Company’s Current Report on Form 8-K dated November 29, 2005).
4.4 (a) Sixth Supplemental Indenture, dated February 10, 2020, between Stanley Black & Decker, Inc. and HSBC Bank USA, National Association, as trustee, relating to the 4.000% Fixed-to-Fixed Reset Rate Junior Subordinated Debentures due 2060 (incorporated by reference to Exhibit 4.5 to the Company’s Form 8-K dated February 10, 2020).
4.5 0% Series C Cumulative Perpetual Preferred Stock Certificate (incorporated by reference to Exhibit 4.5 to the Company’s Current Report on Form 8-K filed May 17, 2017).
4.6 Purchase Contract and Pledge Agreement, dated November 13, 2019, among the Company, The Bank of New York Mellon Trust Company, National Association, as Purchase Contract Agent, and HSBC Bank USA, National Association, as Collateral Agent, Custodial Agent and Securities Intermediary (incorporated by reference to Exhibit 4.1 to the Company's Current Report on Form 8-K filed November 13, 2019).
4.7 Form of Corporate Unit (incorporated by reference as part of Exhibit 4.1 to the Company's Current Report on Form 8-K filed November 13, 2019).
4.8 Form of Treasury Unit (incorporated by reference as part of Exhibit 4.1 to the Company's Current Report on Form 8-K filed November 13, 2019).
4.9 Form of Cash Settled Unit (incorporated by reference as part of Exhibit 4.1 to the Company's Current Report on Form 8-K filed November 13, 2019).
4.10 0% Series D Cumulative Perpetual Preferred Stock Certificate (incorporated by reference to Exhibit 4.5 to the Company's Current Report on Form 8-K filed November 13, 2019).
4.11 Description of the Company's Securities Registered Pursuant to Section 12 of the Securities Exchange Act of 1934 (incorporated by reference to Exhibit 4.11 to the Company’s Annual Report on Form 10-K for the period ended January 2, 2021 filed on February 18, 2021).
10.1 Amended and Restated Five Year Credit Agreement, made as of September 12, 2018 among Stanley Black & Decker, Inc., the initial lenders named therein and Citibank, N.A. as administrative agent for the Lenders (incorporated by reference to Exhibit 10.2 to the Company’s Current Report on Form 8-K filed on September 14, 2018).
129
10.2 (a) Amended and Restated Five Year Credit Agreement, made as of September 8, 2021 among Stanley Black & Decker, Inc., the initial lenders named therein and Citibank, N.A. as administrative agent for the lenders (incorporated by reference to Exhibit 10.2 to the Company’s Current Report on Form 8-K filed on September 14, 2021).#
(b) 364-Day Credit Agreement, made as of September 8, 2021 among Stanley Black & Decker, Inc., the initial lenders named therein and Citibank, N.A. as administrative agent for the lenders (incorporated by reference to Exhibit 10.1 to the Company’s Current Report on Form 8-K filed on September 14, 2021).#
10.3 364-Day Credit Agreement, made as of January 26, 2022 among Stanley Black & Decker, Inc., the initial lenders named therein and Citibank, N.A. as administrative agent for the lenders (incorporated by reference to Exhibit 10.1 to the Company’s Current Report on Form 8-K filed on January 28, 2022).#
10.4 (a) Letter Agreement, dated July 21, 2016, between Stanley Black & Decker, Inc. and James M. Loree (incorporated by reference to Exhibit 10.1 to the Company’s Current Report on Form 8-K filed on July 25, 2016).*
(b) Second Amended and Restated Change in Control Severance Agreement dated July 21, 2016, between Stanley Black & Decker, Inc. and James M. Loree (incorporated by reference to Exhibit 10.2 to the Company’s Current Report on Form 8-K filed on July 25, 2016).*
10.5 Letter Agreement between Stanley Black & Decker, Inc. and John H. Wyatt effective December 22, 2014, as amended February 17, 2016 (incorporated by reference to Exhibit 10.4 to the Company’s Annual Report on Form 10-K for the period ended January 2, 2016 filed on February 19, 2016).*
10.6 (a) Change in Control Severance Agreement, dated December 4, 2018 between Stanley Black & Decker, Inc. and Jeffery D. Ansell (incorporated by reference to Exhibit 10.4 to the Company's Annual Report on Form 10-K for the period ended December 29, 2018 filed on February 26, 2019).*
(b) Letter Agreement, dated January 23, 2020, between Stanley Black & Decker, Inc. and Jeffery D. Ansell (incorporated by reference to Exhibit 10.1 to the Company’s Current Report on From 8-K, filed January 29, 2020).*
(c) Agreement and General Release, by and between Jeffery D. Ansell and Stanley Black & Decker, Inc., dated as of February 4, 2022 (incorporated by reference to Exhibit 10.1 to the Company’s Current Report on Form 8-K filed on February 4. 2022).
10.7 Change in Control Severance Agreement, dated December 4, 2018 between Stanley Black & Decker, Inc. and Donald Allan Jr. (incorporated by reference to Exhibit 10.5 to the Company's Annual Report on Form 10-K for the period ended December 29, 2018 filed on February 26, 2019).*
10.8 Form of Change in Control Severance Agreement (John H. Wyatt and Jamie A. Ramirez) (incorporated by reference to Exhibit 10.6 to the Company’s Annual Report on Form 10-K for the period ended January 2, 2021 filed on February 18, 2021).*
10.9 Deferred Compensation Plan for Non-Employee Directors, as amended through October 1, 2020 (incorporated by reference to Exhibit 10.7 to the Company’s Annual Report on Form 10-K for the period ended January 2, 2021 filed on February 18, 2021).*
10.10 Deferred Compensation Plan for Participants in Stanley’s Management Incentive Plan amended and restated as of December 11, 2007 (incorporated by reference to Exhibit 10(ix) to the Company’s Annual Report on Form 10-K for the period ended December 29, 2007 filed on February 25, 2008).*
10.11 (a) Stanley Black & Decker Supplemental Retirement Account Plan (as in effect, January 1, 2011, except as otherwise provided therein) (incorporated by reference to Exhibit 10.12(a) to the Company’s Annual Report on Form 10-K for the period ended January 1, 2011 filed on February 18, 2011).*
(b) Stanley Black & Decker Supplemental Retirement Plan (effective, January 1, 2011, except as otherwise provided therein) (incorporated by reference to Exhibit 10.12(b) to the Company’s Annual Report on Form 10-K for the period ended January 1, 2011 filed on February 18, 2011).*
10.12 Stanley Black & Decker, Inc. Supplemental Executive Retirement Program as amended and restated effective October 15, 2015 (incorporated by reference to Exhibit 10.1 to the Company’s Current Report on Form 8-K filed on October 16, 2015).*
130
10.13 New 1991 Loan Agreement, dated June 30, 1998, between The Stanley Works, as lender, and Citibank, N.A. as trustee under the trust agreement for the Stanley Account Value Plan, to refinance the 1991 Salaried Employee ESOP Loan and the 1991 Hourly ESOP Loan and their related promissory notes (incorporated by reference to Exhibit 10(ii) to the Company’s Quarterly Report on Form 10-Q for the period ended July 4, 1998 filed on August 18, 1998).
10.14 The Stanley Works Non-Employee Directors’ Benefit Trust Agreement dated December 27, 1989 and amended as of January 1, 1991 by and between The Stanley Works and Fleet National Bank, as successor trustee (incorporated by reference to Exhibit (10)(xvii)(a) to the Company’s Annual Report on Form 10-K for the period ended December 29, 1990). P
10.15 (a) The Stanley Works 2009 Long-Term Incentive Plan (as amended March 12, 2010) (incorporated by reference Exhibit 4.7 to the Company’s Registration Statement on Form S-8 Reg. No. 333-165454 filed on March 12, 2010).*
(b) Form of award letter for restricted stock unit grants to executive officers pursuant to the Company’s 2009 Long Term Incentive Plan (as amended March 12, 2010) (incorporated by reference to Exhibit 10(vi)(b) to the Company’s Quarterly Report on Form 10-Q for the period ended April 3, 2010 filed on May 13, 2010).*
(c) Form of stock option certificate for executive officers pursuant to the Company’s 2009 Long Term Incentive Plan (as amended March 12, 2010) (incorporated by reference to Exhibit 10(vi)(c) to the Company’s Quarterly Report on Form 10-Q for the period ended April 3, 2010 filed on May 13, 2010).*
10.16 (a) The Stanley Black & Decker 2013 Long Term Incentive Plan (incorporated by reference to Exhibit 10.1 to the Company’s Quarterly Report on Form 10-Q for the period ended March 30, 2013 filed on April 26, 2013).*
(b) Form of Award Document for Performance Awards granted to Executive Officers under 2013 Long Term Incentive Plan, updated 2018 (incorporated by reference to Exhibit 10.16(b) to the Company's Annual Report on Form 10-K for the period ended December 30, 2017 filed on February 27, 2018).*
(c) Form of stock option certificate for grants to executive officers pursuant to the Company’s 2013 Long Term Incentive Plan (incorporated by reference to Exhibit 10.18(c) to the Company’s Annual Report on Form 10-K for the period ended December 28, 2013 filed on February 21, 2014).*
(d) Form of restricted stock unit award certificate for grants of restricted stock units to executive officers pursuant to the Company’s 2013 Long Term Incentive Plan (incorporated by reference to Exhibit 10.18(d) to the Company’s Annual Report on Form 10-K for the period ended December 28, 2013 filed on February 21, 2014).*
(e) Form of restricted stock unit retention award certificate for grants of restricted stock units to executive officers pursuant to the Company’s 2013 Long Term Incentive Plan (incorporated by reference to Exhibit 10.18(e) to the Company’s Annual Report on Form 10-K for the period ended December 31, 2016 filed on February 15, 2017).*
10.17 (a) The Stanley Black & Decker 2018 Omnibus Award Plan (incorporated by reference to Exhibit 10.1 to the Company’s Quarterly Report on Form 10-Q for the period ended June 30, 2018 filed on July 20, 2018).*
(b) Form of stock option certificate for grants to executive officers pursuant to the Company’s 2018 Omnibus Award Plan (incorporated by reference to Exhibit 10.16(b) on the Company's Annual Report on Form 10-K for the period ended December 28, 2019 filed on February 21, 2020).*
(c) Form of restricted stock unit award certificate for grants to executive officers pursuant to the Company’s 2018 Omnibus Award Plan (incorporated by reference to Exhibit 10.16(c) on the Company's Annual Report on Form 10-K for the period ended December 28, 2019 filed on February 21, 2020).*
(d) Form of restricted stock unit retention award certificate for grants to executive officers pursuant to the Company’s 2018 Omnibus Award Plan (incorporated by reference to Exhibit 10.16(d) on the Company's Annual Report on Form 10-K for the period ended December 28, 2019 filed on February 21, 2020).*
(e) Form of Award Document for Performance Award granted to Executive Officers under the 2018 Omnibus Award (filed herewith).*
(f) Form of Award Document granted to Executive Officers under the 2019 and 2020 Management Incentive Compensation Plan (incorporated by reference to Exhibit 10.16(f) to the Company's Annual Report on Form 10-K for the period ended December 29, 2018 filed on February 26, 2019).*
131
10.18 The Stanley Black & Decker, Inc. Deferred Compensation Plan Relating to Long-Term Performance Awards (incorporated by reference to Exhibit 10.17 to the Company's Annual Report on Form 10-K for the period ended December 29, 2018 filed on February 26, 2019). *
10.19 The Stanley Black & Decker, Inc. Restricted Stock Unit Plan for Non-Employee Directors, as amended and restated through October 1, 2020 (incorporated by reference to Exhibit 10.17 to the Company’s Annual Report on Form 10-K for the period ended January 2, 2021 filed on February 18, 2021).*
10.20 The Stanley Black & Decker, Inc. 2020 Restricted Stock Unit Deferral Plan For Non-Employee Directors (incorporated by reference to Exhibit 10.19 on the Company's Annual Report on Form 10-K for the period ended December 28, 2019 filed on February 21, 2020).*
10.21 The Stanley Black & Decker, Inc. 2017 Management Incentive Compensation Plan (incorporated by reference to Exhibit 10.2 to the Company’s Quarterly Report on Form 10-Q for the period ended April 1, 2017 filed on April 25, 2017).*
10.22 Special Severance Policy for Management Incentive Compensation Plan Participants Levels 1-5 as amended effective October 17, 2008 (incorporated by reference to Exhibit 10(xxi) to the Company’s Annual Report on Form 10-K for the period ended January 3, 2009 filed on February 26, 2009).*
10.23 Global Omnibus Employee Stock Purchase Plan approved by shareholders of the Company on April 17, 2019 (incorporated by reference to Exhibit 99.1(a) to the Company’s Registration Statement on Form S-8 filed on November 13, 2019).*
10.24 The Black & Decker 2003 Stock Option Plan, as amended (incorporated by reference to Exhibit 10.7 to the Company’s Current Report on Form 8-K filed on March 12, 2010).*
10.25 Form of Nonqualified Stock Option Agreement relating to The Black & Decker Corporation’s stock option plans (incorporated by reference to Exhibit 10(xix) to the Company’s Quarterly Report on Form 10-Q for the period ended April 3, 2010 filed on May 13, 2010).*
10.26 (a) The Black & Decker Supplemental Pension Plan, as amended and restated (incorporated by reference to Exhibit 10(xx) to the Company’s Quarterly Report on Form 10-Q for the period ended April 3, 2010 filed on May 13, 2010).*
(b) First Amendment to The Black & Decker Supplemental Pension Plan (incorporated by reference to Exhibit 10(xxi) to the Company’s Quarterly Report on Form 10-Q for the period ended April 3, 2010 filed on May 13, 2010).*
10.27 The Black & Decker Supplemental Executive Retirement Plan, as amended and restated (incorporated by reference to Exhibit 10(xxii) to the Company’s Quarterly Report on Form 10-Q for the period ended April 3, 2010 filed on May 13, 2010).*
10.28 Employment Offer Letter, dated June 12, 2017, between Stanley Black & Decker, Inc. and Janet M. Link (incorporated by reference to Exhibit 10.25 to the Company’s Annual Report on Form 10-K for the period ended December 30, 2017 filed on February 27, 2018).*
10.29 Employment Offer Letter, dated February 24, 2020, between Stanley Black & Decker, Inc. and Graham Robinson (incorporated by reference to Exhibit 10.28 to the Company’s Annual Report on Form 10-K for the period ended January 2, 2021 filed on February 18, 2021).*
10.30 Change in Control Severance Agreement (all other executive officers) (incorporated by reference to Exhibit 10.29 to the Company’s Annual Report on Form 10-K for the period ended January 2, 2021 filed on February 18. 2021).*
21 Subsidiaries of Registrant.
23 Consent of Independent Registered Public Accounting Firm.
24 Power of Attorney.
31.1 (a) Certification by Chief Executive Officer pursuant to Rule 13a-14(a).
31.1 (b) Certification by President and Chief Financial Officer pursuant to Rule 13a-14(a).
32.1 Certification by Chief Executive Officer pursuant to 18 U.S.C. Section 1350, as adopted pursuant to Section 906 of the Sarbanes-Oxley Act of 2002.
132
32.2 Certification by President and Chief Financial Officer pursuant to 18 U.S.C. Section 1350, as adopted pursuant to Section 906 of the Sarbanes-Oxley Act of 2002.
99.1 Policy on Confidential Proxy Voting and Independent Tabulation and Inspection of Elections as adopted by The Board of Directors October 23, 1991 (incorporated by reference to Exhibit (28)(i) to the Quarterly Report on Form 10-Q for the quarter ended September 28, 1991). P
101 The following materials from Stanley Black & Decker Inc.'s Annual Report on Form 10-K for the year ended January 1, 2022, formatted in iXBRL (Inline eXtensible Business Reporting Language): (i) Consolidated Statements of Operations for the fiscal years ended January 1, 2022, January 2, 2021, and December 28, 2019; (ii) Consolidated Statements of Comprehensive Income for the fiscal years ended January 1, 2022, January 2, 2021, and December 28, 2019; (iii) Consolidated Balance Sheets at January 1, 2022 and January 2, 2021; (iv) Consolidated Statements of Cash Flows for the fiscal years ended January 1, 2022, January 2, 2021, and December 28, 2019; (v) Consolidated Statements of Changes in Shareowners' Equity for the fiscal years ended January 1, 2022, January 2, 2021, and December 28, 2019; and (v) Notes to Consolidated Financial Statements.**
104 The cover page of Stanley Black & Decker Inc.'s Annual Report on Form 10-K for the year ended January 1, 2022, formatted in iXBRL (included within Exhibit 101).
# Certain schedules and exhibits have been omitted pursuant to Item 601(a)(5) of Regulation S-K and the Company agrees to furnish supplementally to the SEC a copy of any omitted schedules or exhibits upon request.
* Management contract or compensation plan or arrangement.P Paper Filing
** Pursuant to Rule 406T of Regulation S-T, the Interactive Data Files on Exhibit 101 hereto are deemed not filed or partof a registration statement or prospectus for purposes of Sections 11 or 12 of the Securities Act of 1933, as amended,are deemed not filed for purposes of Section 18 of the Securities and Exchange Act of 1934, as amended, andotherwise are not subject to liability under those sections.
133

This page intentionally left blank.

This page intentionally left blank.

This page intentionally left blank.

Design: Ideas On Purpose | Printing: DG3 | This book was printed using only recycled paper. ©2022 Stanley Black & Decker. All Rights Reserved.
FINANCIAL AND INVESTOR COMMUNICATIONS
The Stanley Black & Decker investor relations department provides information to shareowners and the financial community. We encourage inquiries and will provide services that include:
• Fulfilling requests for annual reports, proxy statements, forms 10-Q and 10-K, copies of press releases and other Company information
• Meetings with securities analysts and fund managers
Contact the investor relations department at our corporate offices by calling Dennis Lange, VP, Investor Relations at (860) 827-3833 or by mail at 1000 Stanley Drive, New Britain, CT 06053. We make earnings releases available online on the day that results are released to the news media. Stanley Black & Decker releases and a variety of shareowner information can be found at the Company’s website: www.stanleyblackanddecker.com.
CAUTIONARY STATEMENTS UNDER THE PRIVATE SECURITIES LITIGATION REFORM ACT OF 1995
Statements in this Annual Report that are not historical, including, but not limited to, those that often contain words such as “expect,” “anticipate,” “intend,” “plan,” “believe,” “seek,” “see,” or “will,” are “forward-looking statements” and subject to risk and uncertainty. The results that are expressed or implied in such statements involve inherent risks and uncertainty that could cause actual outcomes and results to differ materially from those expectations, including, but not limited to, the risks, uncertainties and other factors set forth or referred to under Risk Factors and the cautionary statements in the MD&A of the Company’s Annual Report on Form 10-K that is part of this Annual Report, and any material changes thereto set forth in any subsequent Quarterly Reports on Form 10-Q, as well as those contained in the Company’s other filings with the Securities and Exchange Commission. The Company undertakes no obligation to publicly update or revise any forward-looking statements to reflect events or circumstances that may arise after the date hereof.
CRAFTSMAN Outdoor (front cover top): Providing solutions for every yard, CRAFTSMAN delivers the high performance battery-operated outdoor tools and equipment people need to keep their lawns and gardens shipshape.
Stanley Black & Decker Maker Month (front cover bottom left): Our fourth annual Maker Month celebrated the makers and creators shaping the world around us with a “Thank a Maker” theme.
DEWALT POWERSTACK™ (front cover bottom right): The next dimension in power,™ DeWALT POWERSTACK™ Compact Battery uses breakthrough pouch battery cell technology to transform the cordless jobsite.
BLACK + DECKER reviva™ (inside back cover left): This new line of sustainability-led power tools features 50% certified recycled content in the enclosures using Eastman’s advanced molecular recycling.
DEWALT Tools (inside back cover right): Guaranteed tough,® DeWALT hand and power tools deliver the jobsite performance professionals and those who like to work like them count on, day in, day out.
Cub Cadet Electric Powered Riding Lawn Mower (back cover top): The full acquisition of MTD, completed in 2021, positions Stanley Black & Decker to lead in the electrification of outdoor power equipment.
STANLEY Engineered Fastening (back cover bottom): A welder from a bridge construction crew uses the Nelson heavy duty weld gun and 3/4” shear connectors as part of the steel girder to slab construction process.

STANLEY BLACK & DECKER 1000 STANLEY DRIVE NEW BRITAIN, CT 06053