performance report: a timeline for the synchrotron calibration of axaf
TRANSCRIPT
SAO-AXAF-DR-94-090
Data Type: 3
Rev "A"
June 1994
Advanced X-Ray Astrophysics Facility (AXAF)
Mission Support
NAS8-36123
Performance Report:
A Timeline for the Synchrotron Calibration of AXAF
Prepared in accordance with DRD# 784MA-002
Principal Investigator
Dr. H. D. Tananbaum
Prepared for:
George C. Marshall Space Flight Center
National Aeronautics and Space Administration
Marshall Space Flight Center, AL 35812
Smithsonian Astrophysical Observatory
60 Garden Street
Cambridge, MA 02138
The Smithsonian Astrophysical Observatory
is a member of the
Harvard-Smithsonian Center for Astrophysics
Smithsonian InstitutionAstrophysical Observatory
Title: Performance Report:A Timeline for the SynchrotronCalibration of AXAF
Document No.: SAO-AXAF-DR-94-090
Prepared by: D.Graessle
Filename: (c:784ma002.090)
Date: 9 Jun 1994
DRD No.: 784MA-002
Data Type: 3
Revision: "A"
APPROVAL SIGNATURES
Program ManagerP -
" _" !'</
Date
ii
Smithsonian InstitutionAstrophysical Observatory
REVISION HISTORY
Title: Performance Report:
A Timeline for the SynchrotronCalibration of AXAF
Document No.: SAO-AXAF-DR-94-090
Prepared by: D.Graessle
Filename: (c:784ma002.090)
Date: 9 Jun 1994
DR No.: 784MA-002
Data Type: 3
Revision: "A"
Revision Record
Revision Date
"A" 9 June 94
DCO No. Affected Paqes
Initial Release
iii
1.0 Introduction
In order to establish plans for the completion of the AXAF synchrotron calibration, we have
developed a timeline for specific measurements to be made at the synchrotron. We have approached thistask by developing a plan for full-detailed calibration of a single fiat, and calculated from an estimate of
the available beam time and operational overheads the number of such fiats which may be calibrated tothis degree of detail. This number of fiats is slightly less than an independent estimate of the minimum
number which must be calibrated, but is not significantly different compared to the accuracy of the timeestimate.
Presented herein are the known elements of the timeline for synchrotron reflectance calibrations of
HRMA witness samples (Section 2). In Section 3, lists of measurements to be done on each witness fiat
are developed. The elements are then arranged into timelines for the three beamlines we expect toemploy in covering the full 50-12,000 eV energy range (Section 4). (Although the required AXAF
operational range is only 0.1-10 keV, we must calibrate the extent to which radiation just outside this
band may contaminate our in-band response.) In Section 5, we describe the working relationships whichexist with each of the beamlines, and estimate the time available for AXAF measurements on each. From
the timelines and the available time, we calculate the number of fiats which could be measured in full
detail over the duration of the program for each beamline. A suggestion is made regarding a minimumrequired baseline of witness fiats from each element coating run or qualification run to be used in the
calibration. We intend that this suggestion open discussion of the issue of witness flat deployment.
As presented in the Feasibility Study (SAO-AXAF-90-032), the synchrotron calibration will require
three beamlines to allow full coverage of the 50-12000 eV energy range. This is because no single or pairof beamlines could be found which would be available to AXAF for this calibration, and which could
cover that energy range. Hence, each flat for which a full-range calibration is needed must be measuredon each of the three beamlines, implying that it must be cycled through the reflectometer at least three
times on three separate beamline runs.Furthermore, data runs are no more than three to six weeks in duration. As we shall show, numerous
data runs on each beamline will be required to measure even a simple majority of the synchrotron-
designated witness fiats to be produced in the coating process. Therefore, the calibration will proceed
over the entire period between coating completion and the Launch Date.The beamlines to be used are located at the National Synchrotron Light Source, Brookhaven National
Laboratory, Upton, NY. They are Beamline X8C (5000-20000 eV), Beamline X8A (2030-6200 eV), and
Beamline U3A (40 - 2100 eV). The procedures for the three beamlines are different, and so a different
specific timeline for a single mirror calibration will be developed for each beamline, and a separate
calculation of the number of fiats to be completely measured will be made.
2.0 Timeline Elements
We proceed by specifying the elements which compose the timelines. Each element or set of
elements includes a sample flow diagram whence estimates of the duration of the element are derived.
Written procedures will be derived from these flow diagrams. For some of these elements, actual run-
time experience has confirmed the durations. For others, so indicated, only preliminary estimates exist.
Some elements vary from one beamline to another. No run-time confirmations exist for elements specific
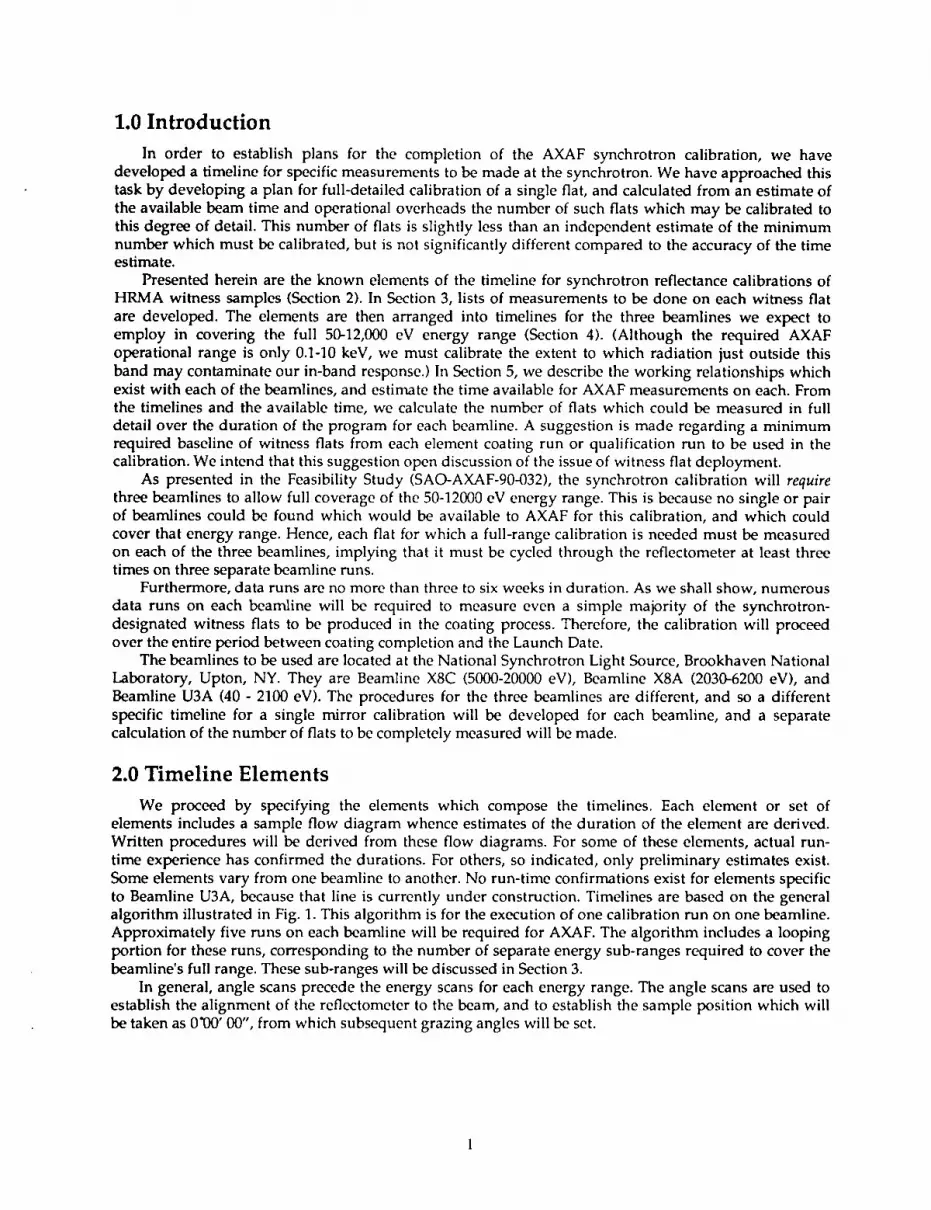
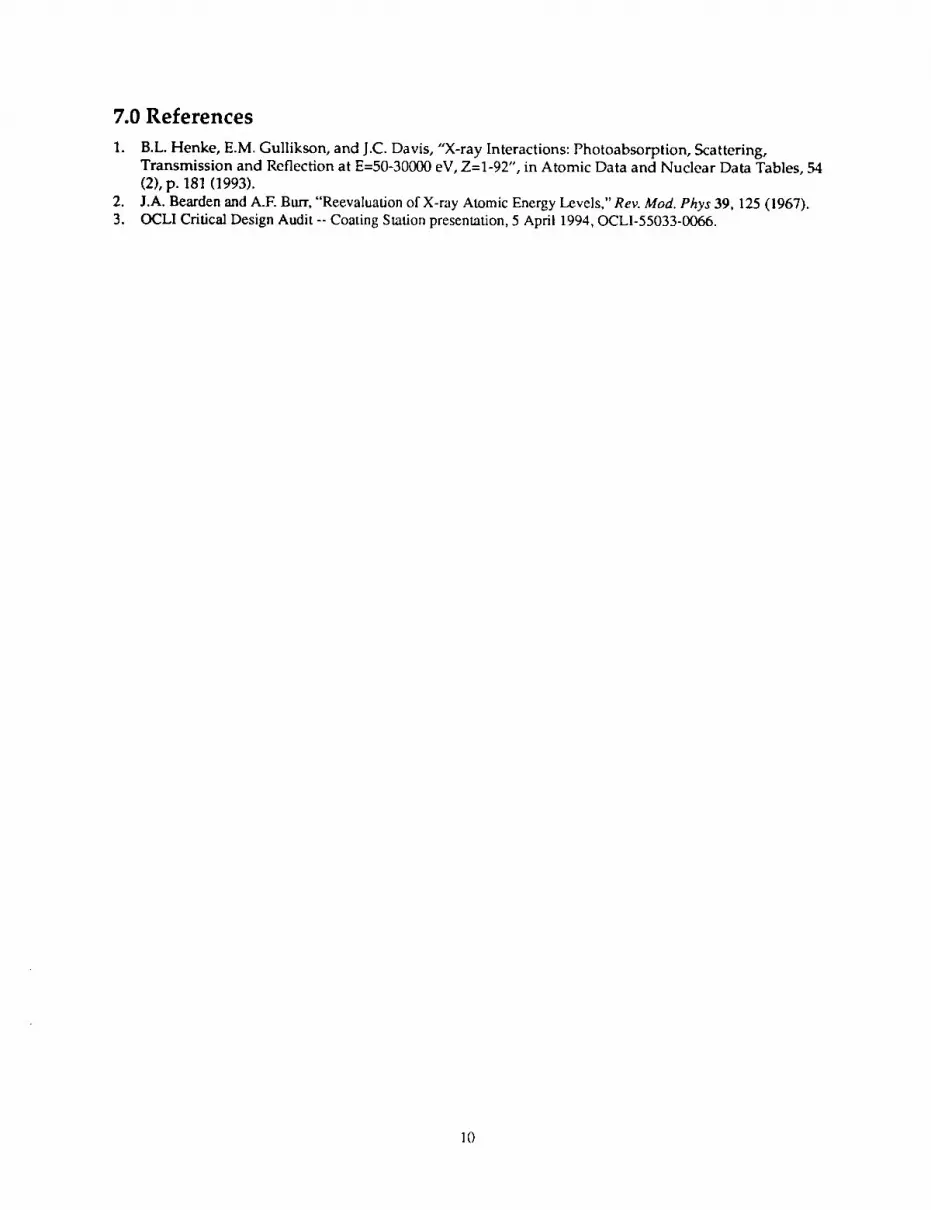
to Beamline U3A, because that line is currently under construction. Timelines are based on the generalalgorithm illustrated in Fig. 1. This algorithm is for the execution of one calibration run on one beamline.
Approximately five runs on each beamline will be required for AXAF. The algorithm includes a looping
portion for these runs, corresponding to the number of separate energy sub-ranges required to cover the
beamline's full range. These sub-ranges will be discussed in Section 3.
In general, angle scans precede the energy scans for each energy range. The angle scans are used to
establish the alignment of the reflectometer to the beam, and to establish the sample position which will
be taken as 0"00' 00", from which subsequent grazing angles will be set.
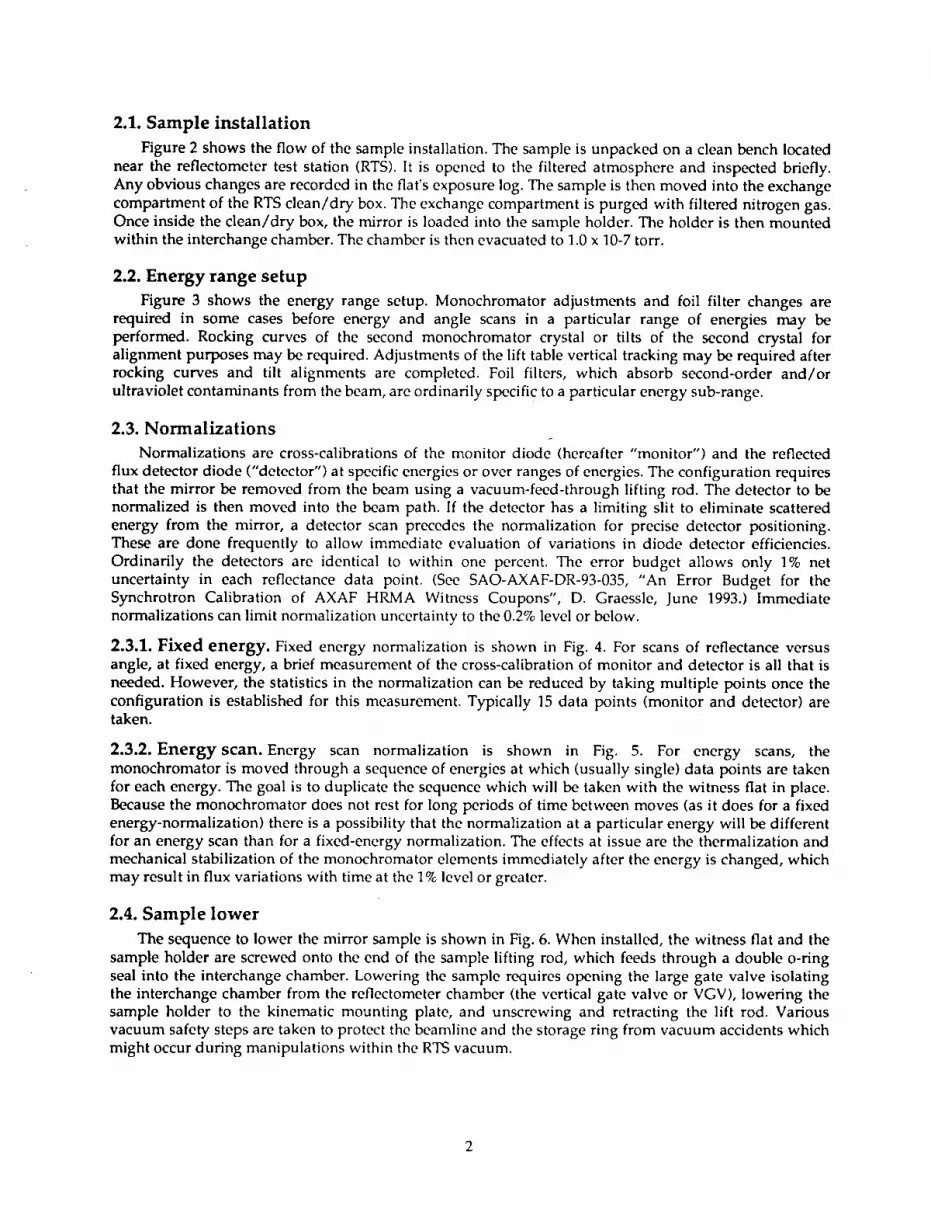
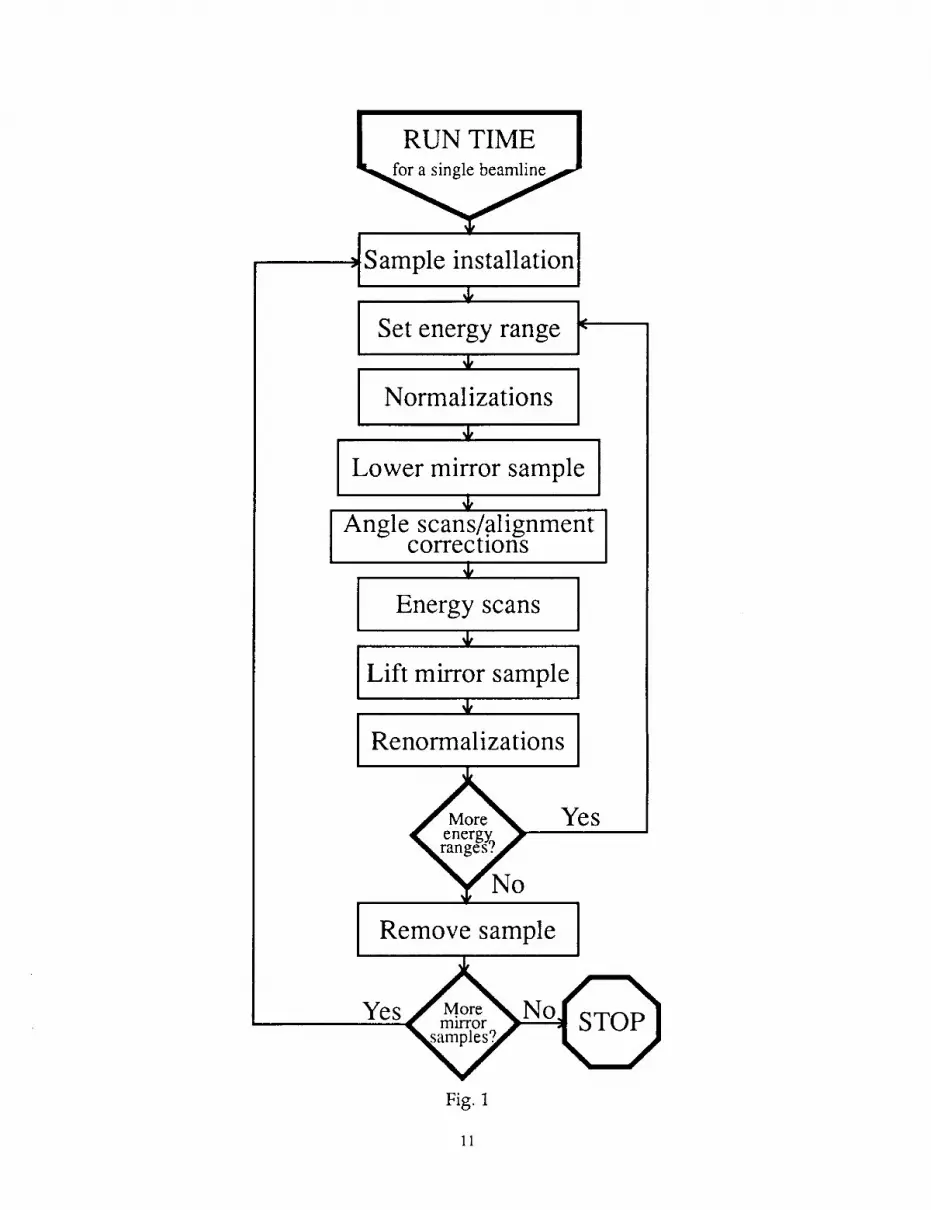
2.1. Sample installation
Figure 2 shows the flow of the sample installation. The sample is unpacked on a clean bench located
near the reflectometer test station (RTS). It is opened to the filtered atmosphere and inspected briefly.
Any obvious changes are recorded in the fiat's exposure log. The sample is then moved into the exchange
compartment of the RTS clean/dry box. The exchange compartment is purged with filtered nitrogen gas.Once inside the dean/dry box, the mirror is loaded into the sample holder. The holder is then mounted
within the interchange chamber. The chamber is then evacuated to 1.0 x 10⁻⁷ torr.
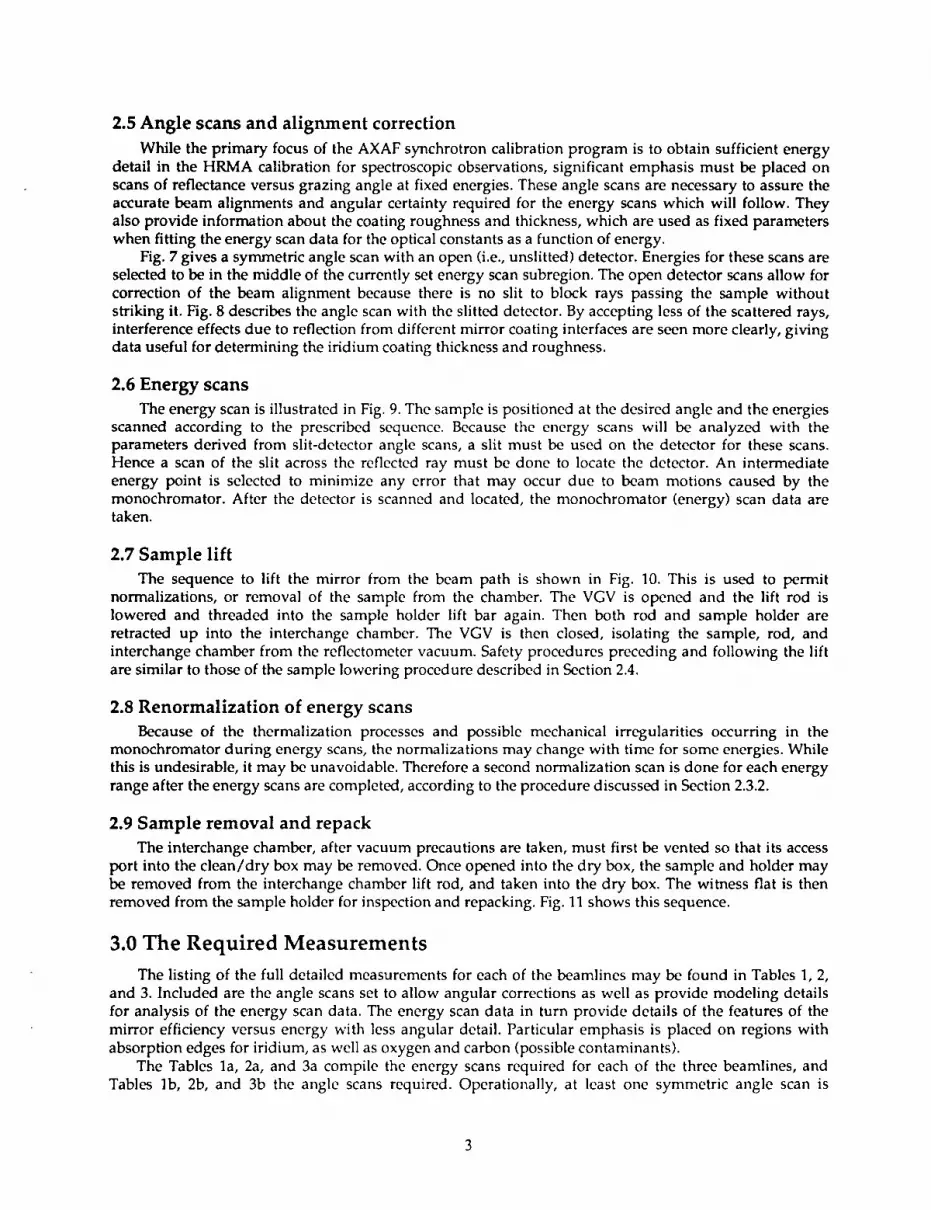
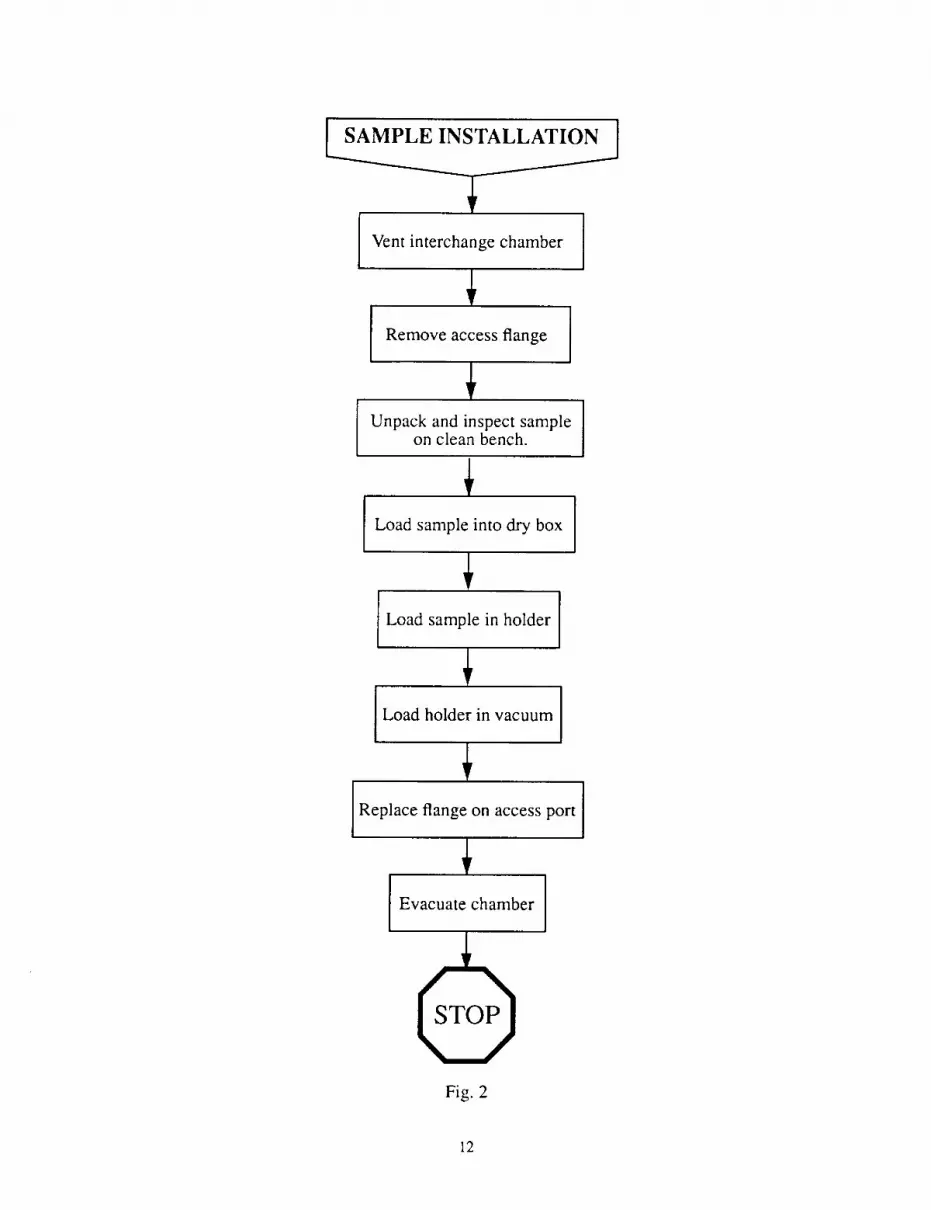
2.2. Energy range setup
Figure 3 shows the energy range setup. Monochromator adjustments and foil filter changes are
required in some cases before energy and angle scans in a particular range of energies may be
performed. Rocking curves of the second monochromator crystal or tilts of the second crystal for
alignment purposes may be required. Adjustments of the lift table vertical tracking may be required afterrocking curves and tilt alignments are completed. Foil filters, which absorb second-order and/or
ultraviolet contaminants from the beam, are ordinarily specific to a particular energy sub-range.
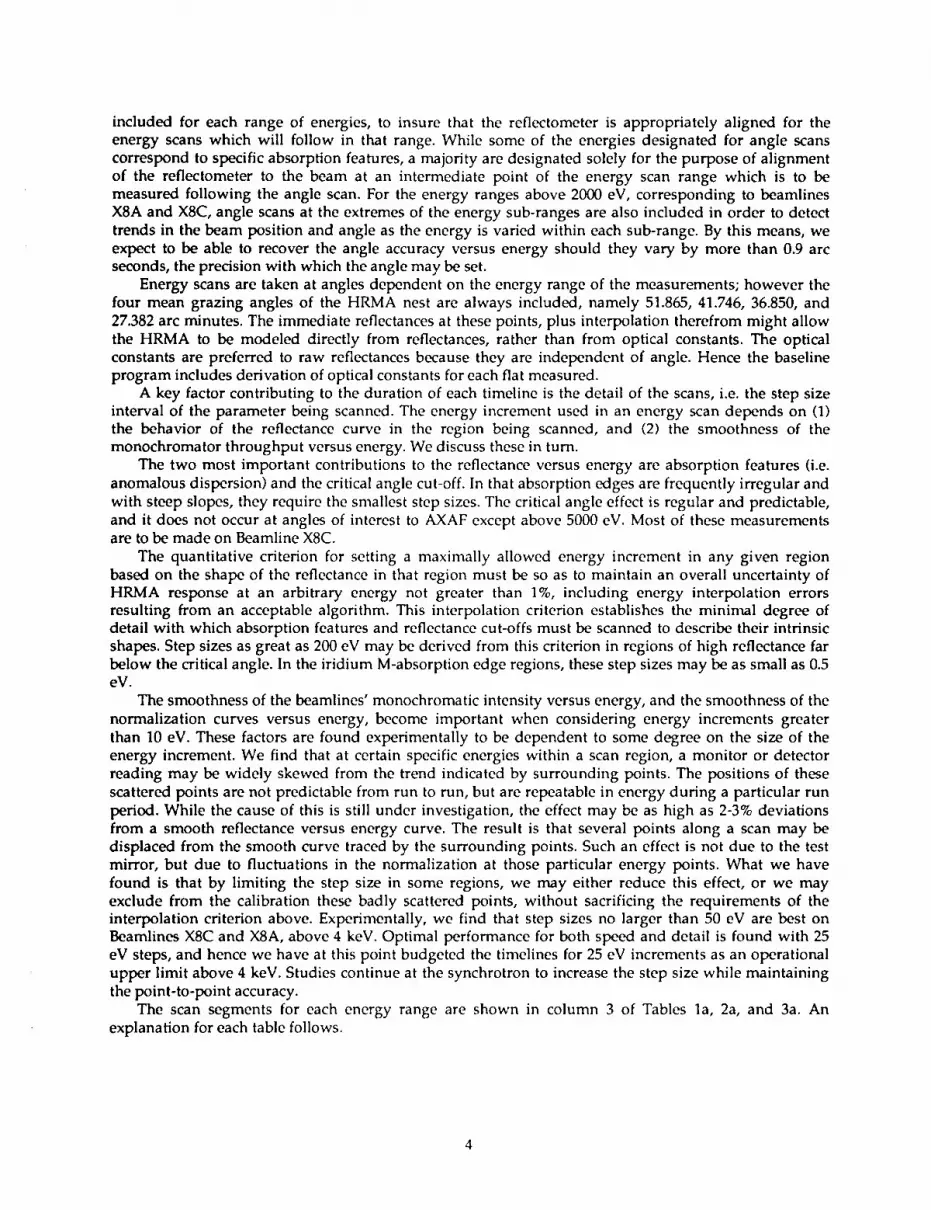
2.3. Normalizations
Normalizations are cross-calibrations of the monitor diode (hereafter "monitor") and the reflected
flux detector diode ("detector") at specific energies or over ranges of energies. The configuration requiresthat the mirror be removed from the beam using a vacuum-feed-through lifting rod. The detector to be
normalized is then moved into the beam path. If the detector has a limiting slit to eliminate scattered
energy from the mirror, a detector scan precedes the normalization for precise detector positioning.
These are done frequently to allow immediate evaluation of variations in diode detector efficiencies.
Ordinarily the detectors are identical to within one percent. The error budget allows only 1% net
uncertainty in each reflectance data point. (See SAO-AXAF-DR-93-035, "An Error Budget for theSynchrotron Calibration of AXAF HRMA Witness Coupons", D. Graessle, June 1993.) Immediate
normalizations can limit normalization uncertainty to the 0.2% level or below.
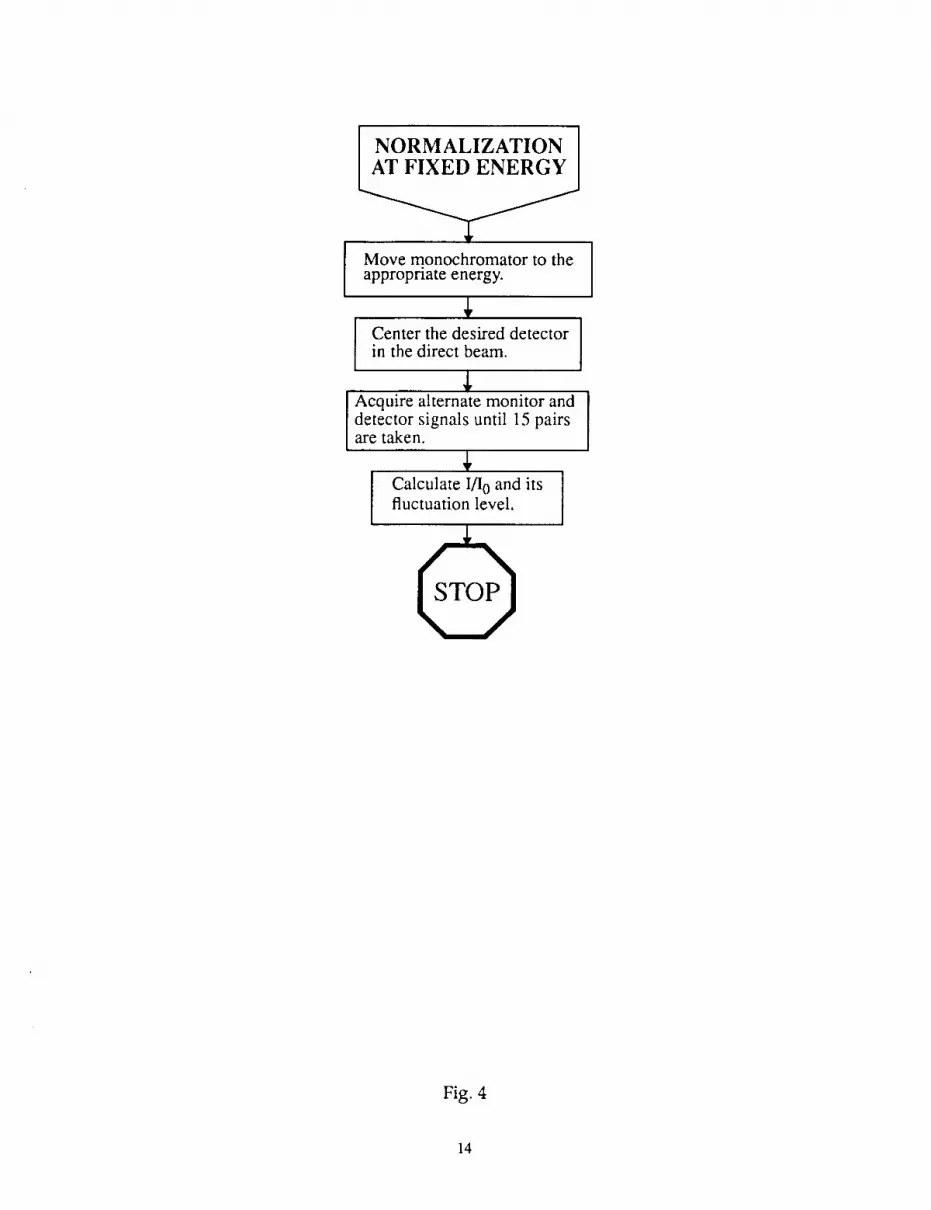
2.3.1. Fixed energy. Fixed energy normalization is shown in Fig. 4. For scans of reflectance versus
angle, at fixed energy, a brief measurement of the cross-calibration of monitor and detector is all that is
needed. However, the statistics in the normalization can be reduced by taking multiple points once the
configuration is established for this measurement. Typically 15 data points (monitor and detector) aretaken.
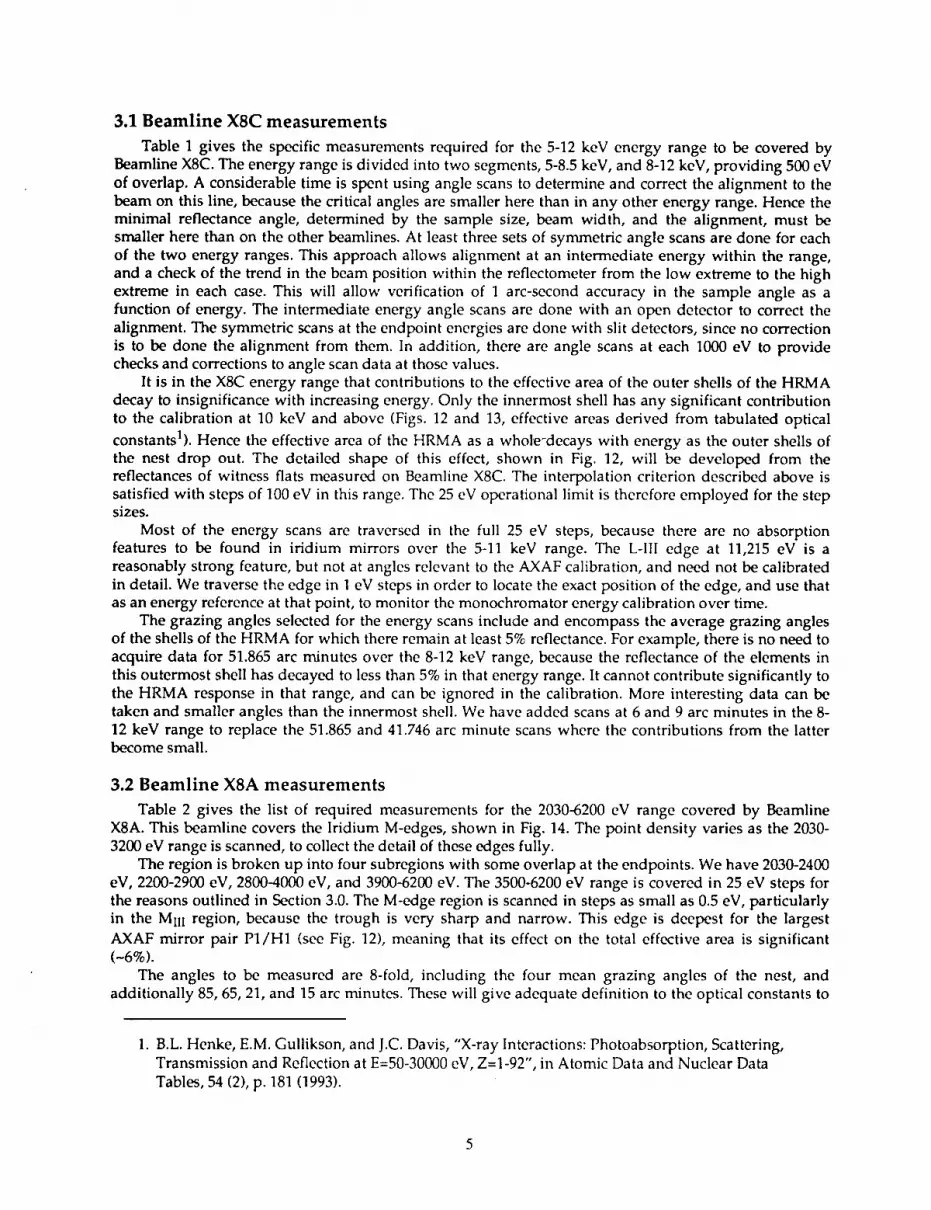
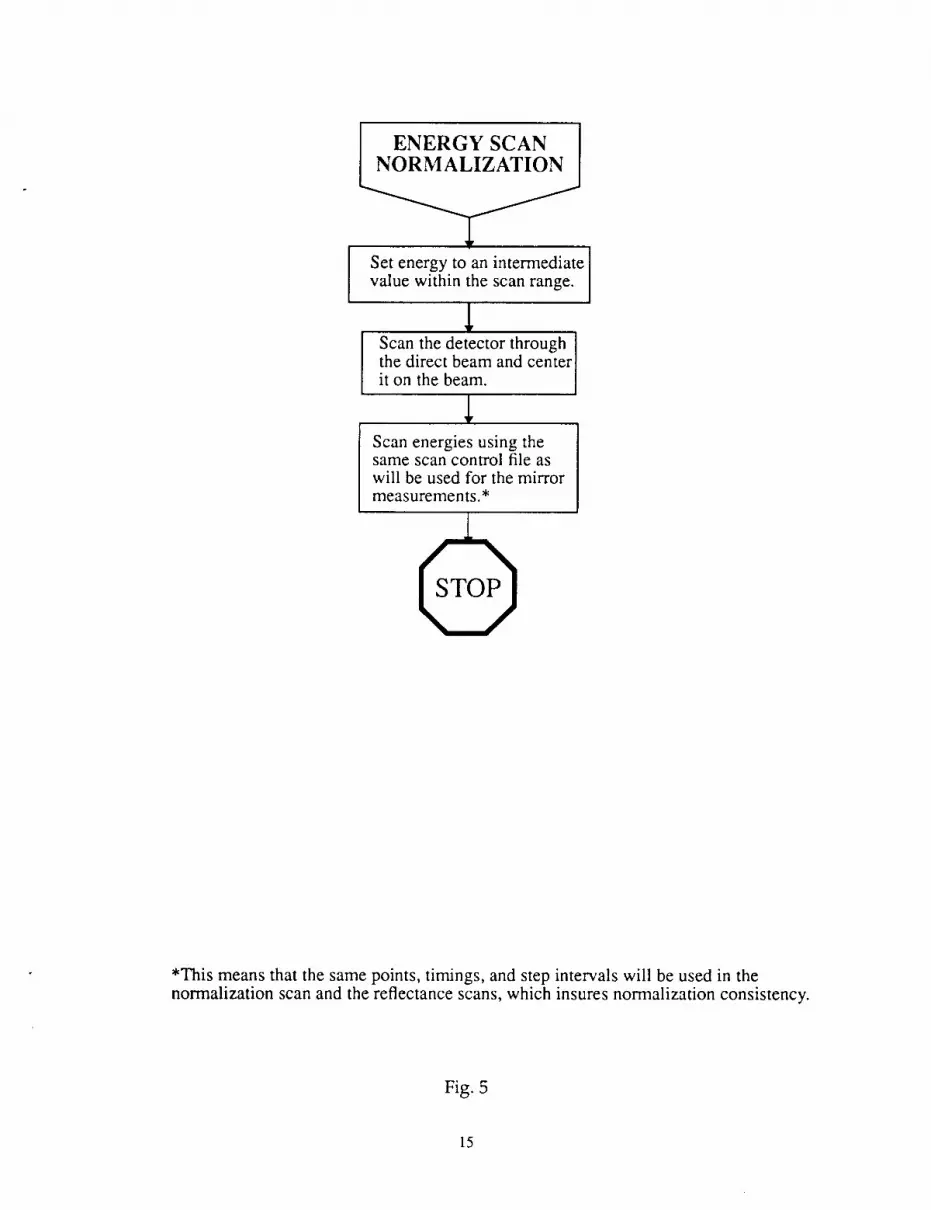
2.3.2. Energy scan. Energy scan normalization is shown in Fig. 5. For energy scans, the
monochromator is moved through a sequence of energies at which (usually single) data points are taken
for each energy. The goal is to duplicate the sequence which will be taken with the witness fiat in place.
Because the monochromator does not rest for long periods of time between moves (as it does for a fixed
energy-normalization) there is a possibility that the normalization at a particular energy will be differentfor an energy scan than for a fixed-energy normalization. The effects at issue are the thermalization and
mechanical stabilization of the monochromator elements immediately after the energy is changed, whichmay result in flux variations with time at the 1% level or greater.
2.4. Sample lower
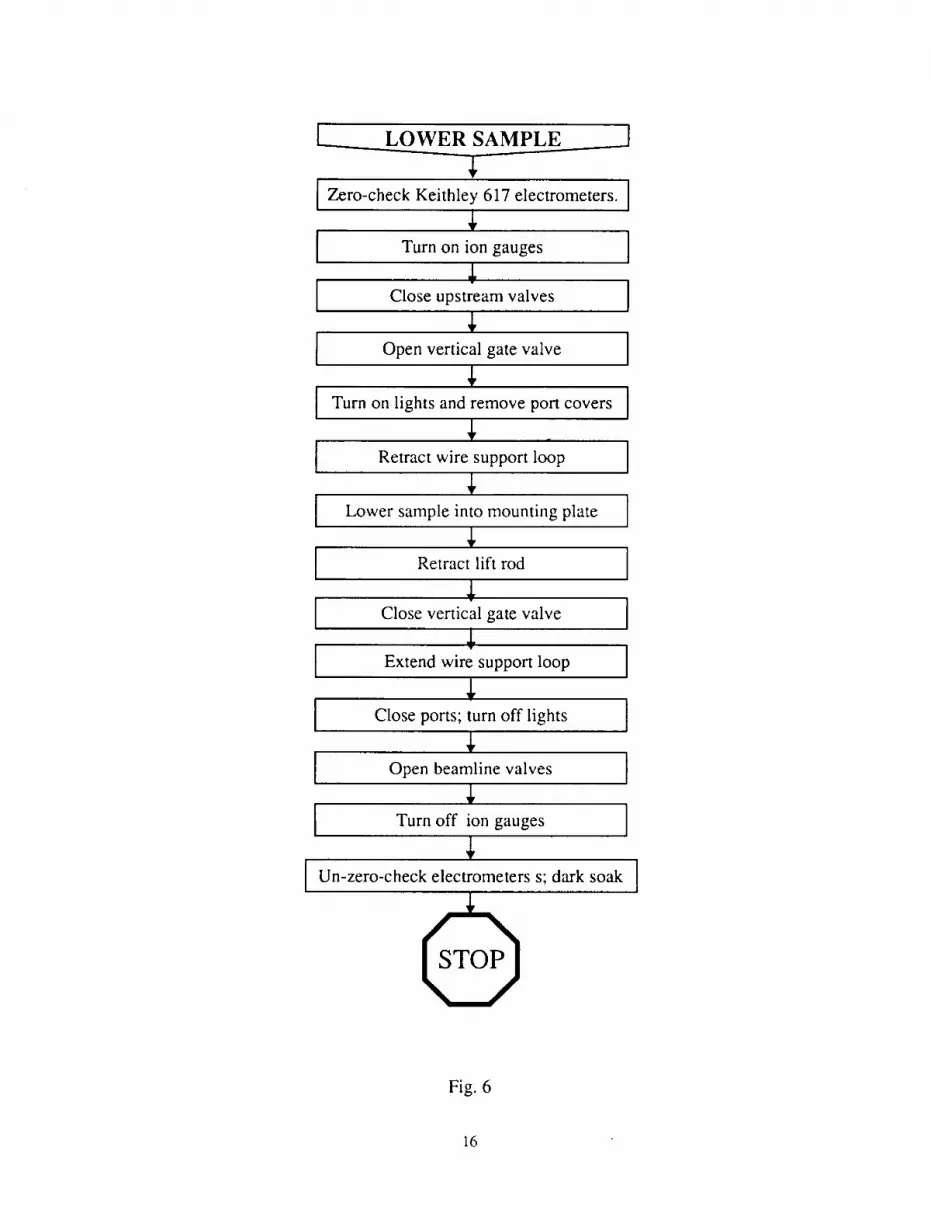
The sequence to lower the mirror sample is shown in Fig. 6. When installed, the witness fiat and the
sample holder are screwed onto the end of the sample lifting rod, which feeds through a double o-ring
seal into the interchange chamber. Lowering the sample requires opening the large gate valve isolating
the interchange chamber from the reflectometer chamber (the vertical gate valve or VGV), lowering thesample holder to the kinematic mounting plate, and unscrewing and retracting the lift rod. Various
vacuum safety steps are taken to protect the beamline and the storage ring from vacuum accidents which
might occur during manipulations within the RTS vacuum.
2.5 Angle scans and alignment correction
While the primary focus of the AXAF synchrotron calibration program is to obtain sufficient energy
detail in the HRMA calibration for spectroscopic observations, significant emphasis must be placed onscans of reflectance versus grazing angle at fixed energies. These angle scans are necessary to assure the
accurate beam alignments and angular certainty required for the energy scans which will follow. They
also provide information about the coating roughness and thickness, which are used as fixed parameters
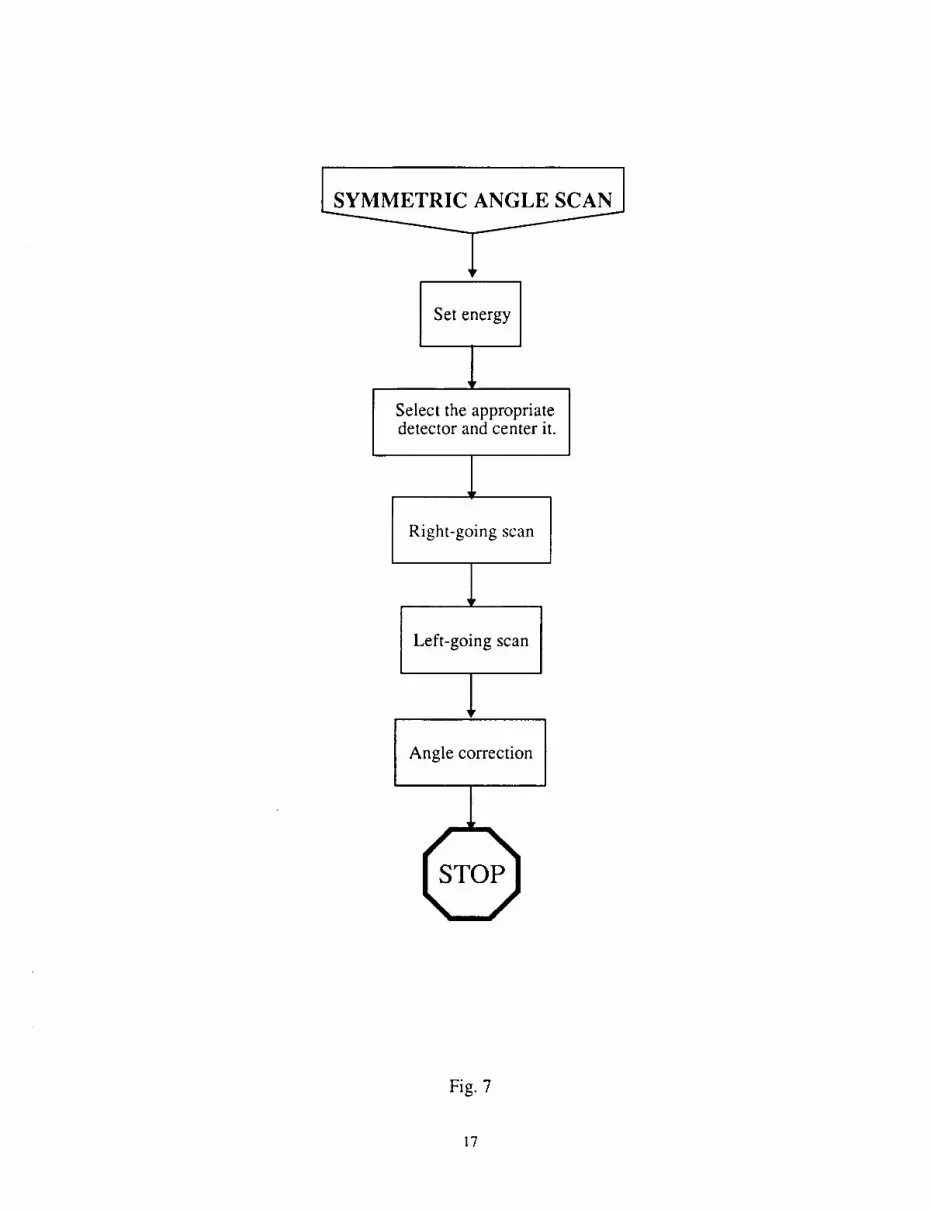
when fitting the energy scan data for the optical constants as a function of energy.Fig. 7 gives a symmetric angle scan with an open (i.e., unslitted) detector. Energies for these scans are
selected to be in the middle of the currently set energy scan subregion. The open detector scans allow for
correction of the beam alignment because there is no slit to block rays passing the sample without
striking it. Fig. 8 describes the angle scan with the slitted detector. By accepting less of the scattered rays,
interference effects due to reflection from different mirror coating interfaces are seen more clearly, givingdata useful for determining the iridium coating thickness and roughness.
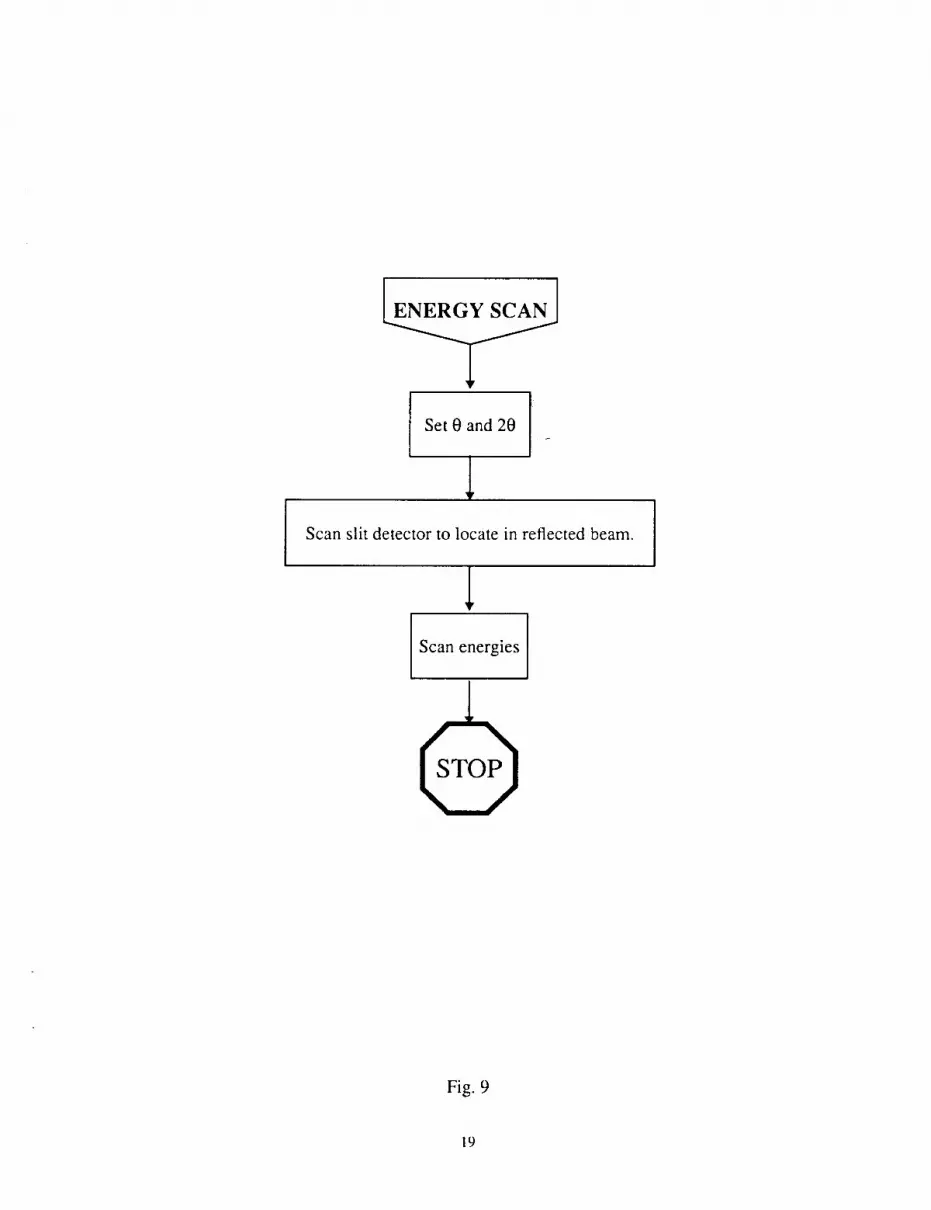
2.6 Energy scans
The energy scan is illustrated in Fig. 9. The sample is positioned at the desired angle and the energies
scanned according to the prescribed sequence. Because the energy scans will be analyzed with theparameters derived from slit-detector angle scans, a slit must be used on the detector for these scans.
Hence a scan of the slit across the reflected ray must be done to locate the detector. An intermediate
energy point is selected to minimize any error that may occur due to beam motions caused by the
monochromator. After the detector is scanned and located, the monochromator (energy) scan data aretaken.
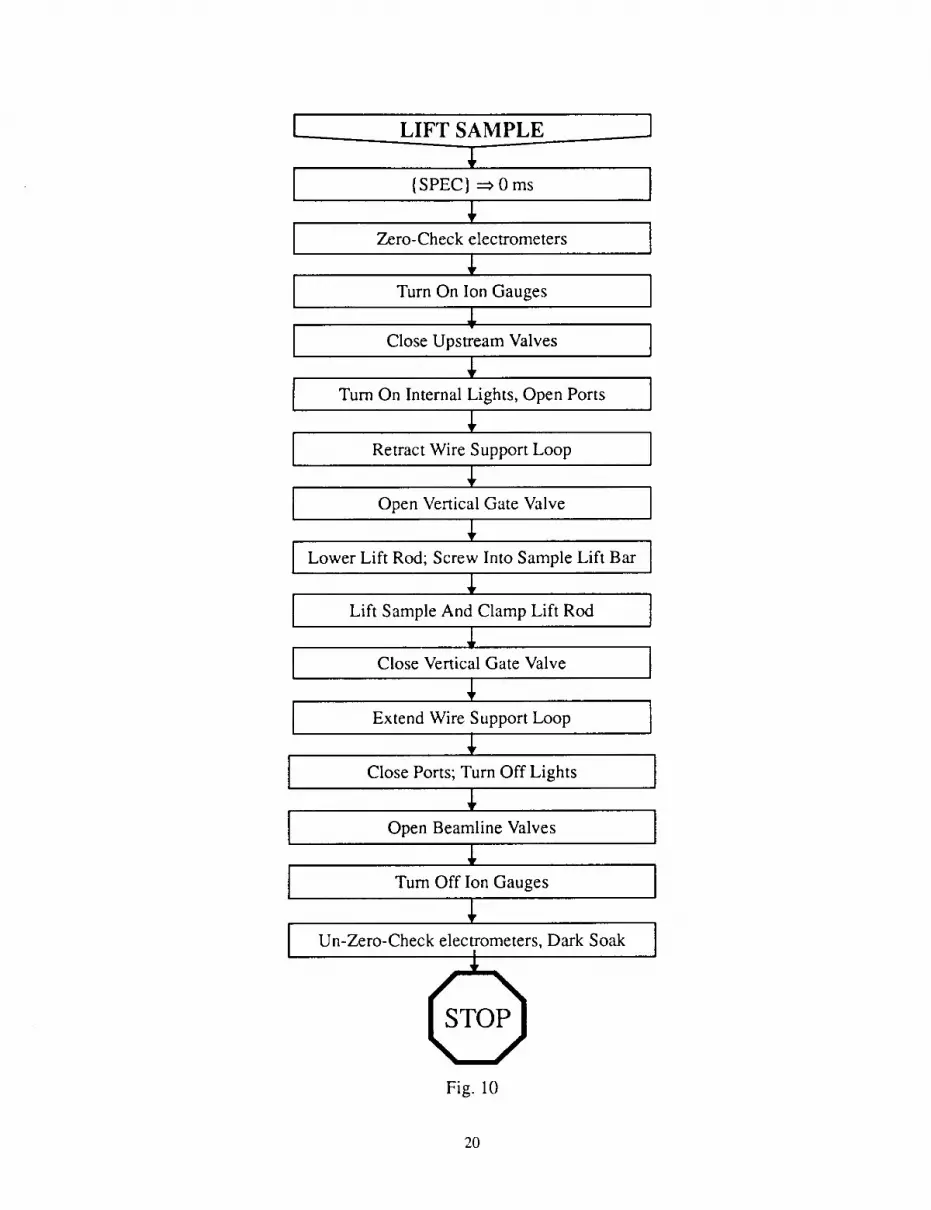
2.7 Sample lift
The sequence to lift the mirror from the beam path is shown in Fig. |0. This is used to permit
normalizations, or removal of the sample from the chamber. The VGV is opened and the lift rod is
lowered and threaded into the sample holder lift bar again. Then both rod and sample holder are
retracted up into the interchange chamber. The VGV is then closed, isolating the sample, rod, and
interchange chamber from the reflectometer vacuum. Safety procedures preceding and following the lift
are similar to those of the sample lowering procedure described in Section 2.4.
2.8 Renormalization of energy scans
Because of the thermalization processes and possible mechanical irregularities occurring in themonochromator during energy scans, the normalizations may change with time for some energies. While
this is undesirable, it may be unavoidable. Therefore a second normalization scan is done for each energy
range after the energy scans are completed, according to the procedure discussed in Section 2.3.2.
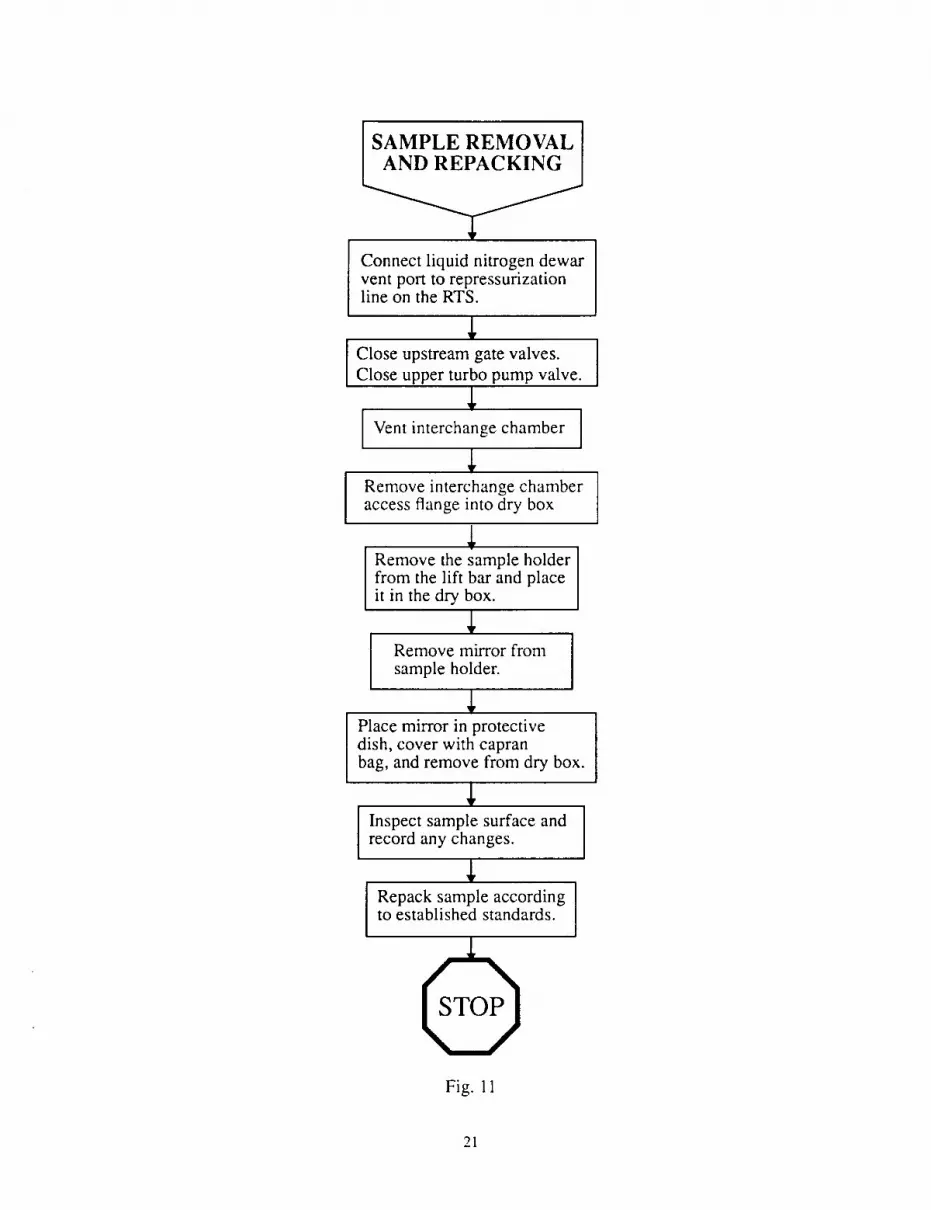
2.9 Sample removal and repack
The interchange chamber, after vacuum precautions are taken, must first be vented so that its access
port into the clean/dry box may be removed. Once opened into the dry box, the sample and holder maybe removed from the interchange chamber lift rod, and taken into the dry box. The witness fiat is then
removed from the sample holder for inspection and repacking. Fig. 11 shows this sequence.
3.0 The Required Measurements
The listing of the full detailed measurements for each of the beamlines may be found in Tables 1, 2,
and 3. Included are the angle scans set to allow angular corrections as well as provide modeling details
for analysis of the energy scan data. The energy scan data in turn provide details of the features of the
mirror efficiency versus energy with less angular detail. Particular emphasis is placed on regions with
absorption edges for iridium, as well as oxygen and carbon (possible contaminants).
The Tables la, 2a, and 3a compile the energy scans required for each of the three beamlines, and
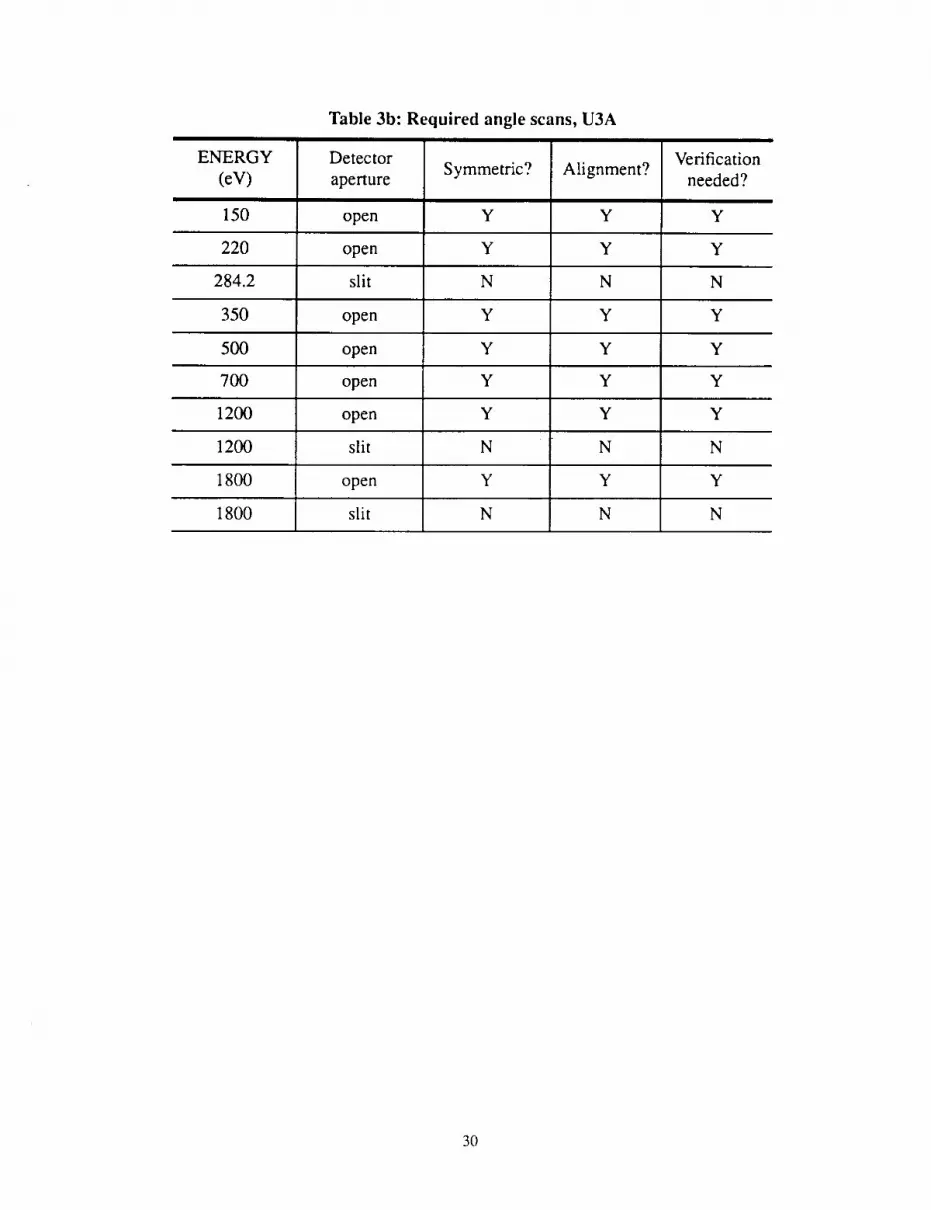
Tables lb, 2b, and 3b the angle scans required. Operationally, at least one symmetric angle scan is
included for each range of energies, to insure that the reflectometer is appropriately aligned for the
energy scans which will follow in that range. While some of the energies designated for angle scans
correspond to specific absorption features, a majority are designated solely for the purpose of alignment
of the reflectometer to the beam at an intermediate point of the energy scan range which is to bemeasured following the angle scan. For the energy ranges above 2000 eV, corresponding to beamlines
X8A and X8C, angle scans at the extremes of the energy sub-ranges are also included in order to detect
trends in the beam position and angle as the energy is varied within each sub-range. By this means, we
expect to be able to recover the angle accuracy versus energy should they vary by more than 0.9 arcseconds, the precision with which the angle may be set.
Energy scans are taken at angles dependent on the energy range of the measurements; however the
four mean grazing angles of the HRMA nest are always included, namely 51.865, 41.746, 36.850, and
27.382 arc minutes. The immediate reflectances at these points, plus interpolation therefrom might allow
the HRMA to be modeled directly from reflectances, rather than from optical constants. The optical
constants are preferred to raw reflectances because they are independent of angle. Hence the baseline
program includes derivation of optical constants for each flat measured.
A key factor contributing to the duration of each timeline is the detail of the scans, i.e. the step sizeinterval of the parameter being scanned. The energy increment used in an energy scan depends on (1)
the behavior of the reflectance curve in the region being scanned, and (2) the smoothness of themonochromator throughput versus energy. We discuss these in turn.
The two most important contributions to the reflectance versus energy are absorption features (i.e.
anomalous dispersion) and the critical angle cut-off. In that absorption edges are frequently irregular and
with steep slopes, they require the smallest step sizes. The critical angle effect is regular and predictable,and it does not occur at angles of interest to AXAF except above 5000 eV. Most of these measurementsare to be made on Beamline X8C.
The quantitative criterion for setting a maximally allowed energy increment in any given region
based on the shape of the reflectance in that region must be so as to maintain an overall uncertainty of
HRMA response at an arbitrary energy not greater than 1%, including energy interpolation errorsresulting from an acceptable algorithm. This interpolation criterion establishes the minimal degree of
detail with which absorption features and reflectance cut-offs must be scanned to describe their intrinsic
shapes. Step sizes as great as 200 eV may be derived from this criterion in regions of high reflectance far
below the critical angle. In the iridium M-absorption edge regions, these step sizes may be as small as 0.5eV.
The smoothness of the beamlines' monochromatic intensity versus energy, and the smoothness of the
normalization curves versus energy, become important when considering energy increments greater
than 10 eV. These factors are found experimentally to be dependent to some degree on the size of theenergy increment. We find that at certain specific energies within a scan region, a monitor or detector
reading may be widely skewed from the trend indicated by surrounding points. The positions of these
scattered points are not predictable from run to run, but are repeatable in energy during a particular run
period. While the cause of this is still under investigation, the effect may be as high as 2-3% deviations
from a smooth reflectance versus energy curve. The result is that several points along a scan may be
displaced from the smooth curve traced by the surrounding points. Such an effect is not due to the test
mirror, but due to fluctuations in the normalization at those particular energy points. What we have
found is that by limiting the step size in some regions, we may either reduce this effect, or we may
exclude from the calibration these badly scattered points, without sacrificing the requirements of the
interpolation criterion above. Experimentally, we find that step sizes no larger than 50 eV are best onBeamlines X8C and X8A, above 4 keV. Optimal performance for both speed and detail is found with 25
eV steps, and hence we have at this point budgeted the timelines for 25 eV increments as an operational
upper limit above 4 keV. Studies continue at the synchrotron to increase the step size while maintaining
the point-to-point accuracy.
The scan segments for each energy range are shown in column 3 of Tables la, 2a, and 3a. An
explanation for each table follows.
4
3.1 Beamline X8C measurements
Table 1 gives the specific measurements required for the 5-12 keV energy range to be covered byBeamline X8C. The energy range is divided into two segments, 5-8.5 keV, and 8-12 keV, providing 500 eV
of overlap. A considerable time is spent using angle scans to determine and correct the alignment to the
beam on this line, because the critical angles are smaller here than in any other energy range. Hence the
minimal reflectance angle, determined by the sample size, beam width, and the alignment, must besmaller here than on the other beamlines. At least three sets of symmetric angle scans are done for each
of the two energy ranges. This approach allows alignment at an intermediate energy within the range,
and a check of the trend in the beam position within the reflectometer from the low extreme to the highextreme in each case. This will allow verification of 1 arc-second accuracy in the sample angle as a
function of energy. The intermediate energy angle scans are done with an open detector to correct the
alignment. The symmetric scans at the endpoint energies are done with slit detectors, since no correction
is to be done the alignment from them. In addition, there are angle scans at each 1000 eV to providechecks and corrections to angle scan data at those values.
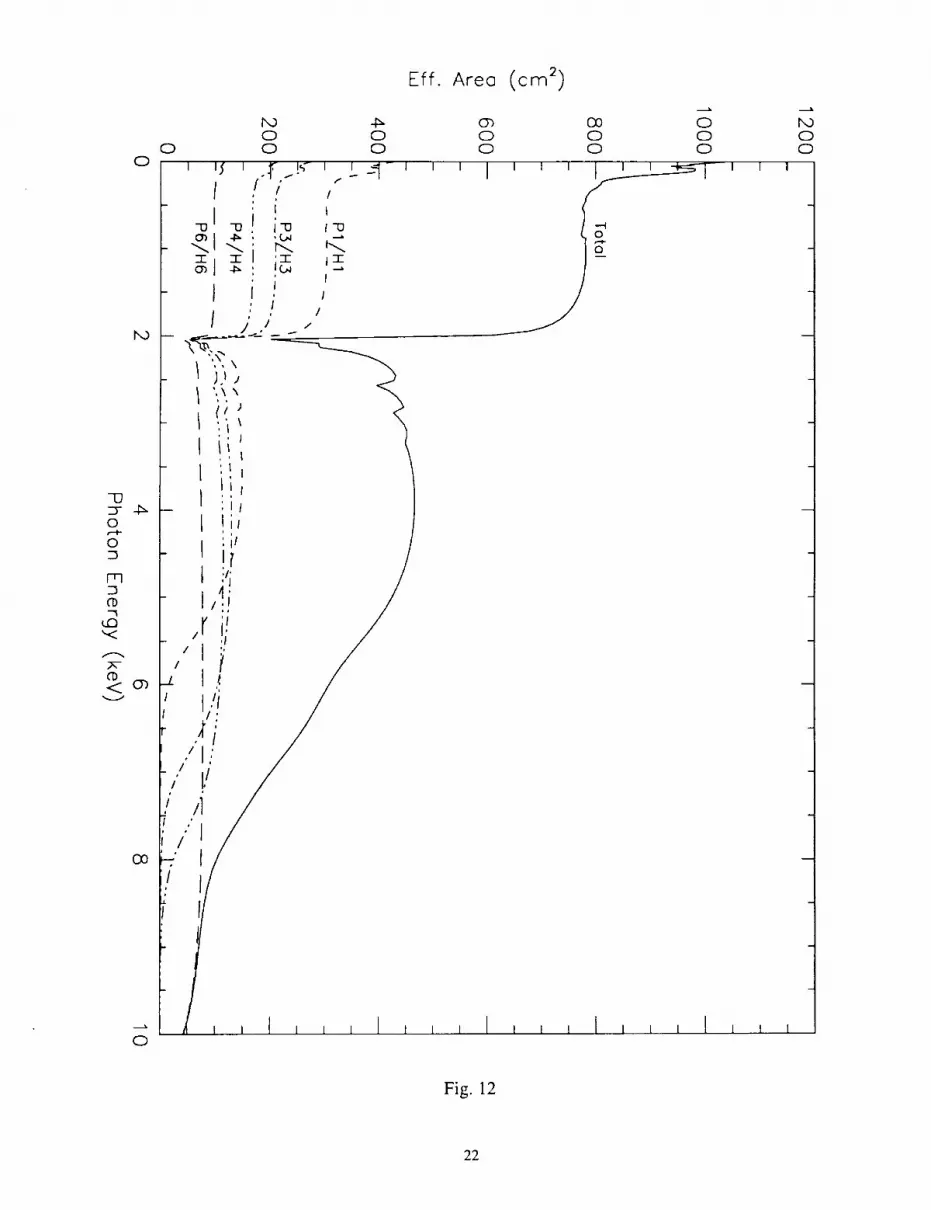
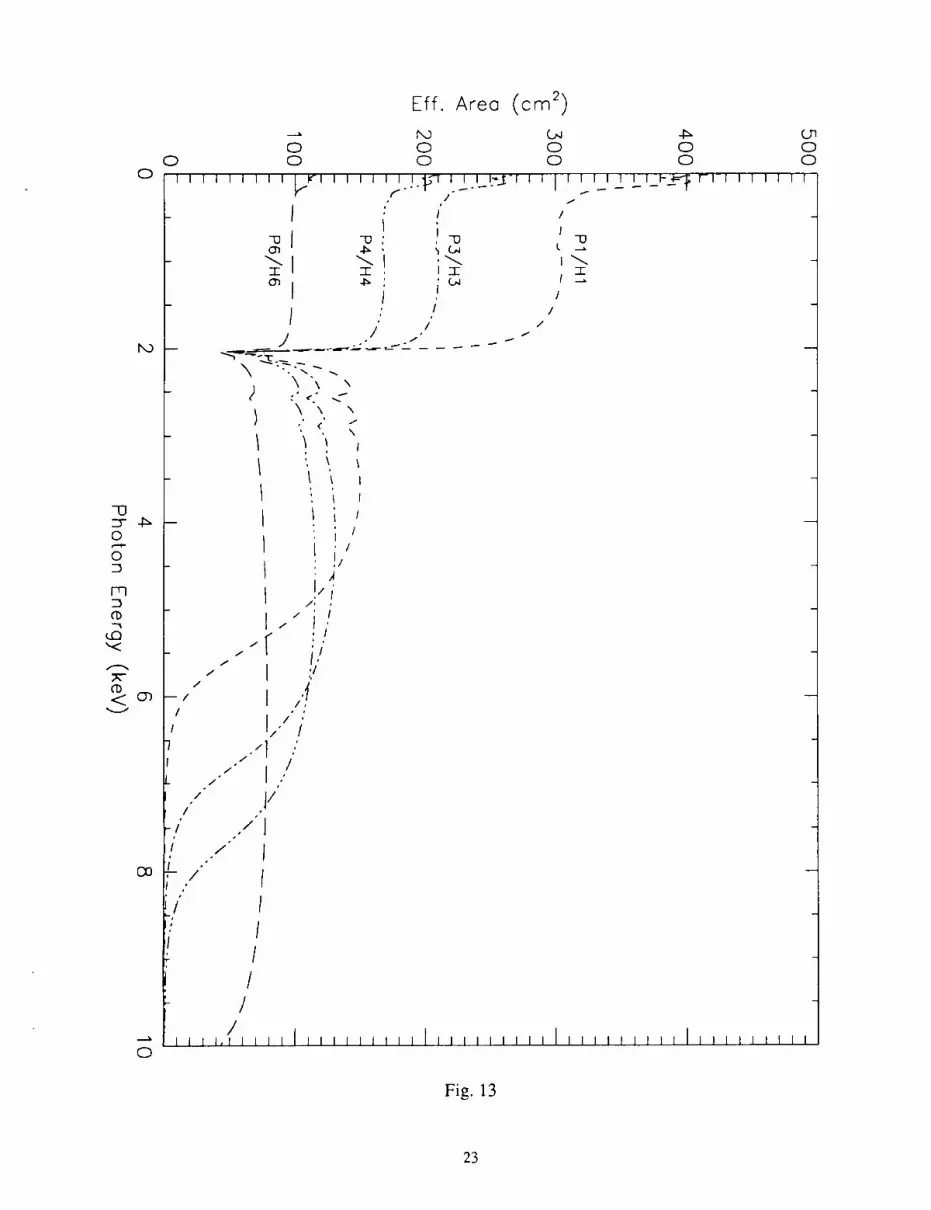
It is in the X8C energy range that contributions to the effective area of the outer shells of the HRMA
decay to insignificance with increasing energy. Only the innermost shell has any significant contribution
to the calibration at 10 keV and above (Figs. 12 and 13, effective areas derived from tabulated optical
constants1). Hence the effective area of the HRMA as a whole-decays with energy as the outer shells of
the nest drop out. The detailed shape of this effect, shown in Fig. 12, will be developed from the
reflectances of witness flats measured on Beamline X8C. The interpolation criterion described above is
satisfied with steps of 100 eV in this range. The 25 eV operational limit is therefore employed for the stepsizes.
Most of the energy scans are traversed in the full 25 eV steps, because there are no absorptionfeatures to be found in iridium mirrors over the 5-11 keV range. The L-III edge at 11,215 eV is a
reasonably strong feature, but not at angles relevant to the AXAF calibration, and need not be calibrated
in detail. We traverse the edge in 1 eV steps in order to locate the exact position of the edge, and use that
as an energy reference at that point, to monitor the monochromator energy calibration over time.
The grazing angles selected for the energy scans include and encompass the average grazing anglesof the shells of the HRMA for which there remain at least 5% reflectance. For example, there is no need to
acquire data for 51.865 arc minutes over the 8-12 keV range, because the reflectance of the elements in
this outermost shell has decayed to less than 5% in that energy range. It cannot contribute significantly to
the HRMA response in that range, and can be ignored in the calibration. More interesting data can be
taken and smaller angles than the innermost shell. We have added scans at 6 and 9 arc minutes in the 8-
12 keV range to replace the 51.865 and 41.746 arc minute scans where the contributions from the latterbecome small.
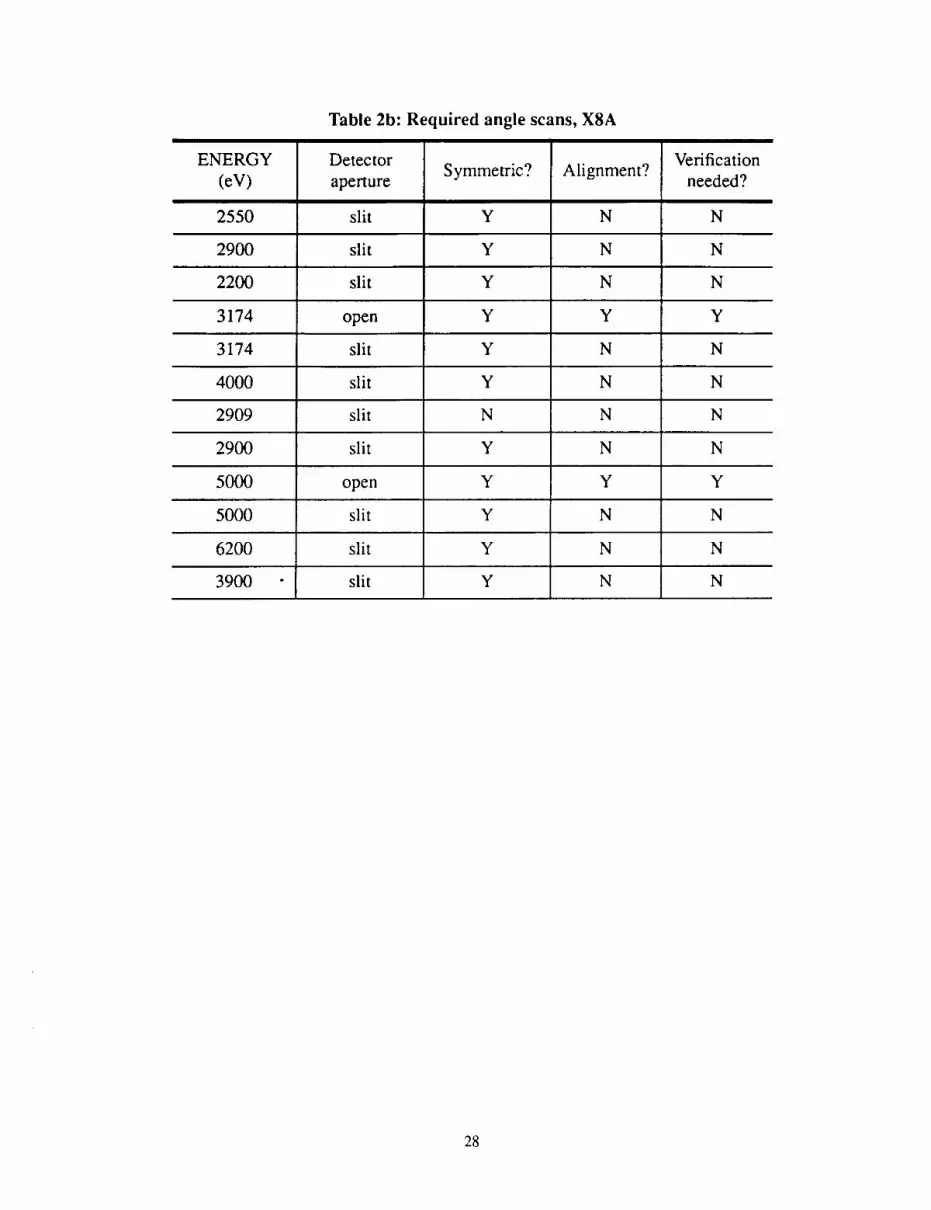
3.2 Beamline X8A measurements
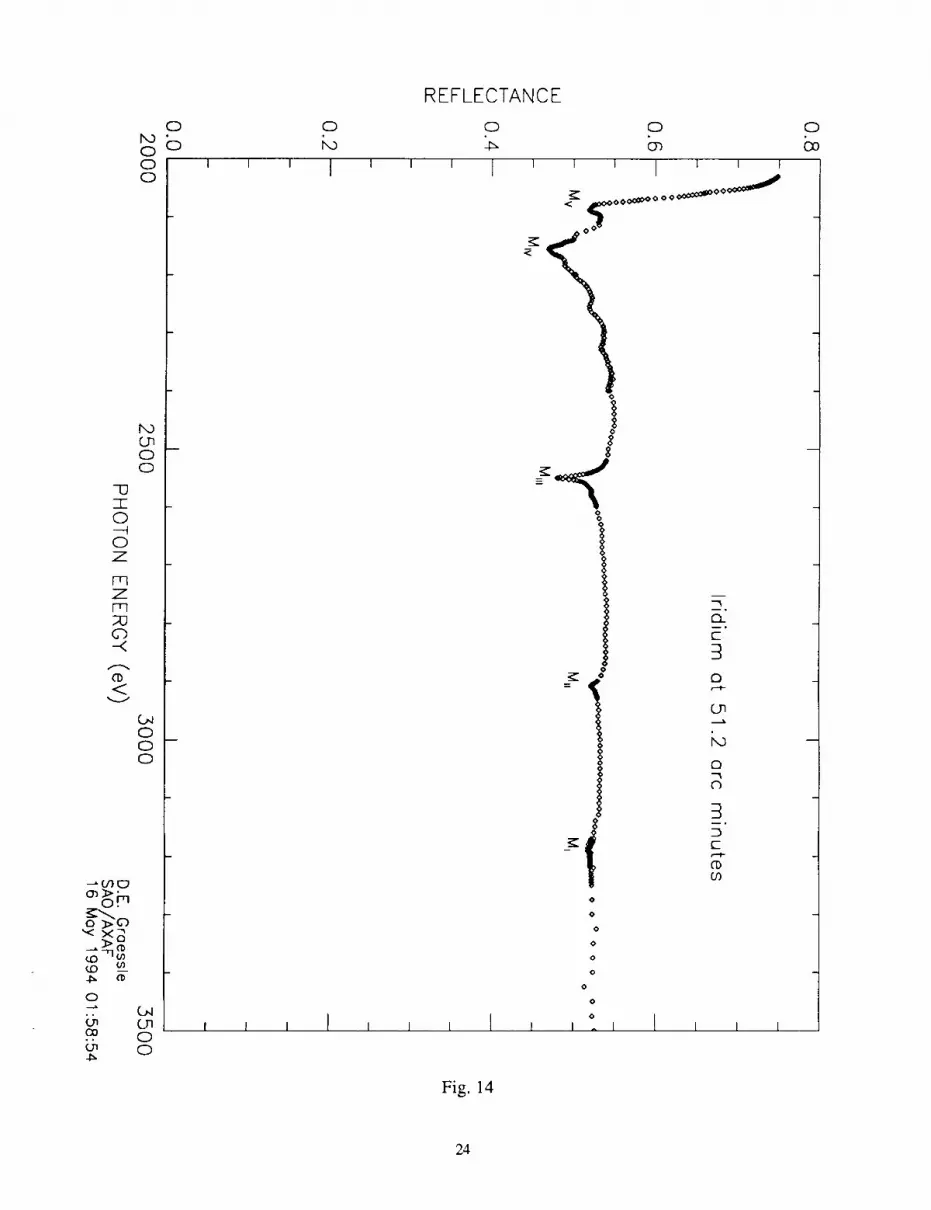
Table 2 gives the list of required measurements for the 2030-6200 eV range covered by Beamline
X8A. This beamline covers the Iridium M-edges, shown in Fig. 14. The point density varies as the 2030-
3200 eV range is scanned, to collect the detail of these edges fully.
The region is broken up into four subregions with some overlap at the endpoints. We have 2030-2400
eV, 2200-2900 eV, 2800-4000 eV, and 3900-6200 eV. The 3500-6200 eV range is covered in 25 eV steps for
the reasons outlined in Section 3.0. The M-edge region is scanned in steps as small as 0.5 eV, particularlyin the Mil I region, because the trough is very sharp and narrow. This edge is deepest for the largest
AXAF mirror pair P1/H1 (see Fig. 12), meaning that its effect on the total effective area is significant(-6%).
The angles to be measured are 8-fold, including the four mean grazing angles of the nest, andadditionally 85, 65, 21, and 15 arc minutes. These will give adequate definition to the optical constants to
1. B.L. Henke, E.M. Guilikson, and J.C. Davis, "X-ray Interactions: Photoabsorption, Scattering,Transmission and Reflection at E=50-30000 eV, Z=1-92", in Atomic Data and Nuclear Data
Tables, 54 (2), p. 181 (1993).
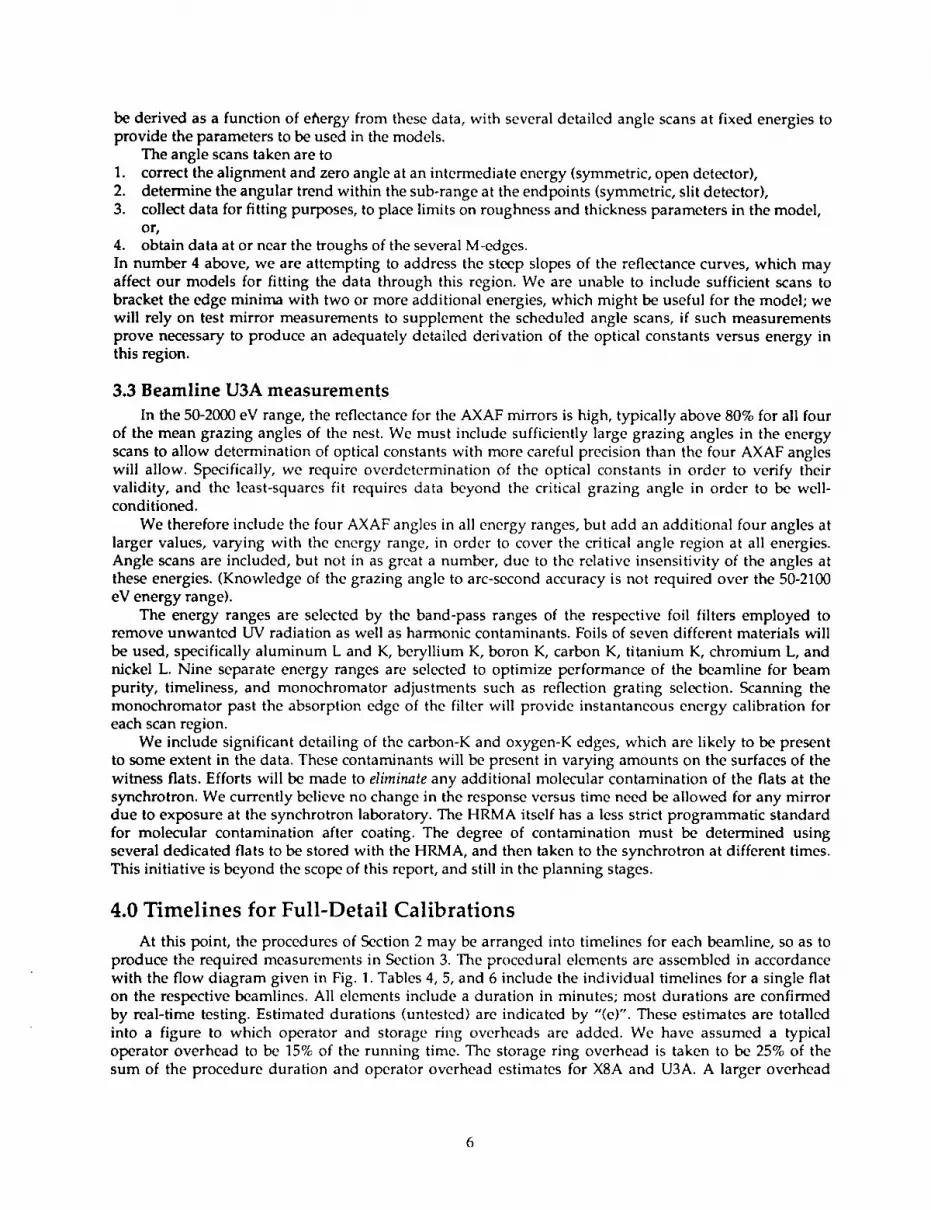
bederived as a function of et_ergy from these data, with several detailed angle scans at fixed energies toprovide the parameters to be used in the models.
The angle scans taken are to
1. correct the alignment and zero angle at an intermediate energy (symmetric, open detector),2. determine the angular trend within the sub-range at the endpoints (symmetric, slit detector),
3. collect data for fitting purposes, to place limits on roughness and thickness parameters in the model,or,
4. obtain data at or near the troughs of the several M-edges.
In number 4 above, we are attempting to address the steep slopes of the reflectance curves, which mayaffect our models for fitting the data through this region. We are unable to include sufficient scans to
bracket the edge minima with two or more additional energies, which might be useful for the model; we
will rely on test mirror measurements to supplement the scheduled angle scans, if such measurements
prove necessary to produce an adequately detailed derivation of the optical constants versus energy inthis region.
3.3 Beamline U3A measurements
In the 50-2000 eV range, the reflectance for the AXAF mirrors is high, typically above 80% for all four
of the mean grazing angles of the nest. We must include sufficiently large grazing angles in the energy
scans to allow determination of optical constants with more careful precision than the four AXAF angles
will allow. Specifically, we require overdetermination of the optical constants in order to verify their
validity, and the least-squares fit requires data beyond the critical grazing angle in order to be well-conditioned.
We therefore include the four AXAF angles in all energy ranges, but add an additional four angles atlarger values, varying with the energy range, in order to cover the critical angle region at all energies.
Angle scans are included, but not in as great a number, due to the relative insensitivity of the angles at
these energies. (Knowledge of the grazing angle to arc-second accuracy is not required over the 50-2100
eV energy range).
The energy ranges are selected by the band-pass ranges of the respective foil filters employed toremove unwanted UV radiation as well as harmonic contaminants. Foils of seven different materials will
be used, specifically aluminum L and K, beryllium K, boron K, carbon K, titanium K, chromium L, and
nickel L. Nine separate energy ranges are selected to optimize performance of the beamline for beam
purity, timeliness, and monochromator adjustments such as reflection grating selection. Scanning the
monochromator past the absorption edge of the filter will provide instantaneous energy calibration for
each scan region.
We include significant detailing of the carbon-K and oxygen-K edges, which are likely to be present
to some extent in the data. These contaminants will be present in varying amounts on the surfaces of the
witness fiats. Efforts will be made to eliminate any additional molecular contamination of the fiats at the
synchrotron. We currently believe no change in the response versus time need be allowed for any mirror
due to exposure at the synchrotron laboratory. The HRMA itself has a less strict programmatic standardfor molecular contamination after coating. The degree of contamination must be determined using
several dedicated fiats to be stored with the HRMA, and then taken to the synchrotron at different times.
This initiative is beyond the scope of this report, and still in the planning stages.
4.0 Timelines for Full-Detail Calibrations
At this point, the procedures of Section 2 may be arranged into timelines for each beamline, so as to
produce the required measurements in Section 3. The procedural elements are assembled in accordance
with the flow diagram given in Fig. 1. Tables 4, 5, and 6 include the individual timelines for a single flat
on the respective beamlines. All elements include a duration in minutes; most durations are confirmed
by real-time testing. Estimated durations (untested) are indicated by "(e)'. These estimates are totalled
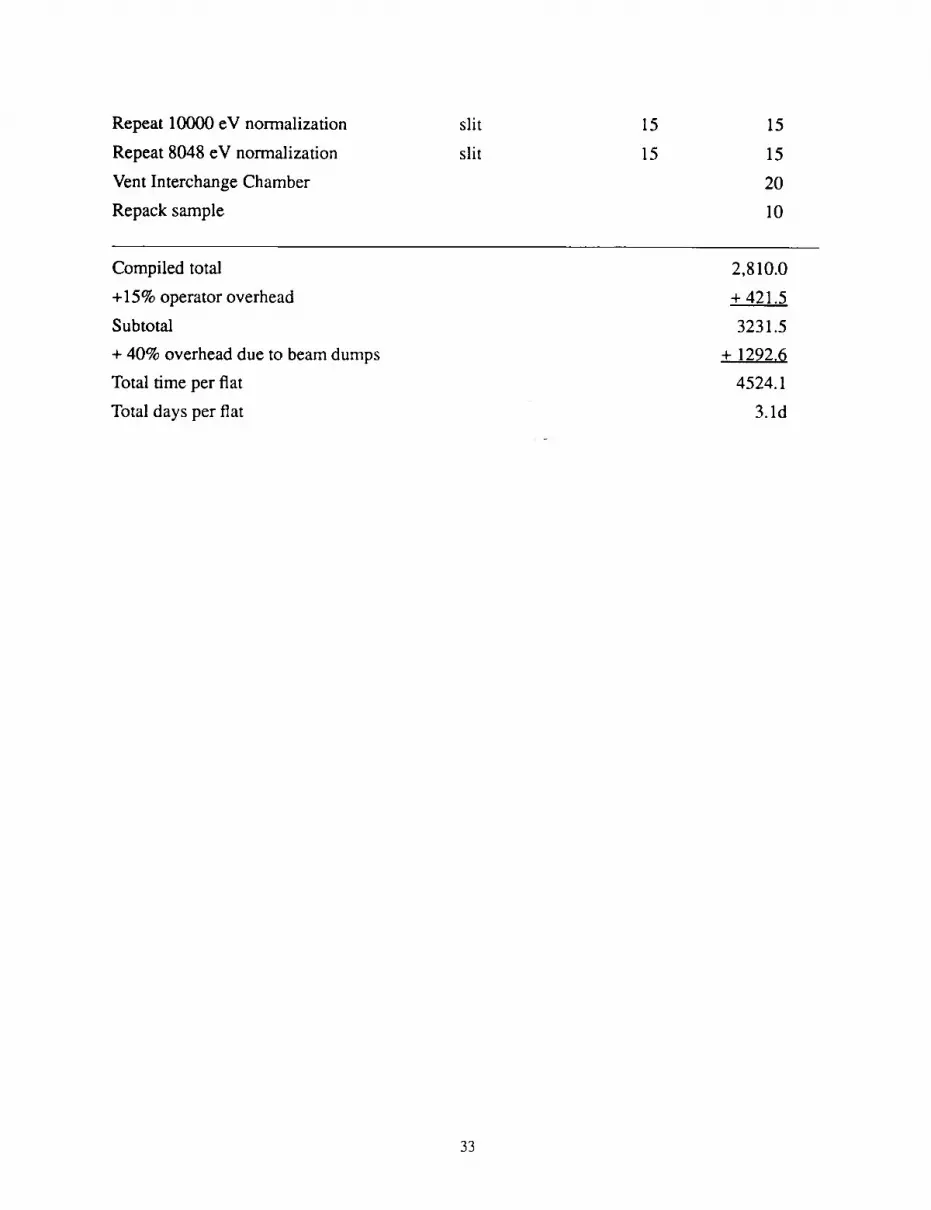
into a figure to which operator and storage ring overheads are added. We have assumed a typical
operator overhead to be 15% of the running time. The storage ring overhead is taken to be 25% of the
sum of the procedure duration and operator overhead estimates for X8A and U3A. A larger overhead
(40%)is chosen for X8C, because of the need to realign more frequently after new injections to the
storage ring. These figures are derived from experience at the synchrotron laboratory, where we have
found that about 75% (60% for X8C) of the wall time is useful for data acquisition during a typical run.
The results are combined into a "total days per flat" figure at the conclusion of each table, where 1 day
equals 24 hours.
All three timelines include some estimated durations, and no timeline has been executed fully or
repeatedly to confirm the days-per-fiat estimates. The total days-per-fiat for each beamline represents anestimate of the average amount of time required to take the maximal amount of data that will be
required from any single witness fiat on that beamline. As presented, each timeline may be used as a
procedure stacking list for calibration of a fiat. A series of such procedure stacks would constitute a full
procedure for a data run.
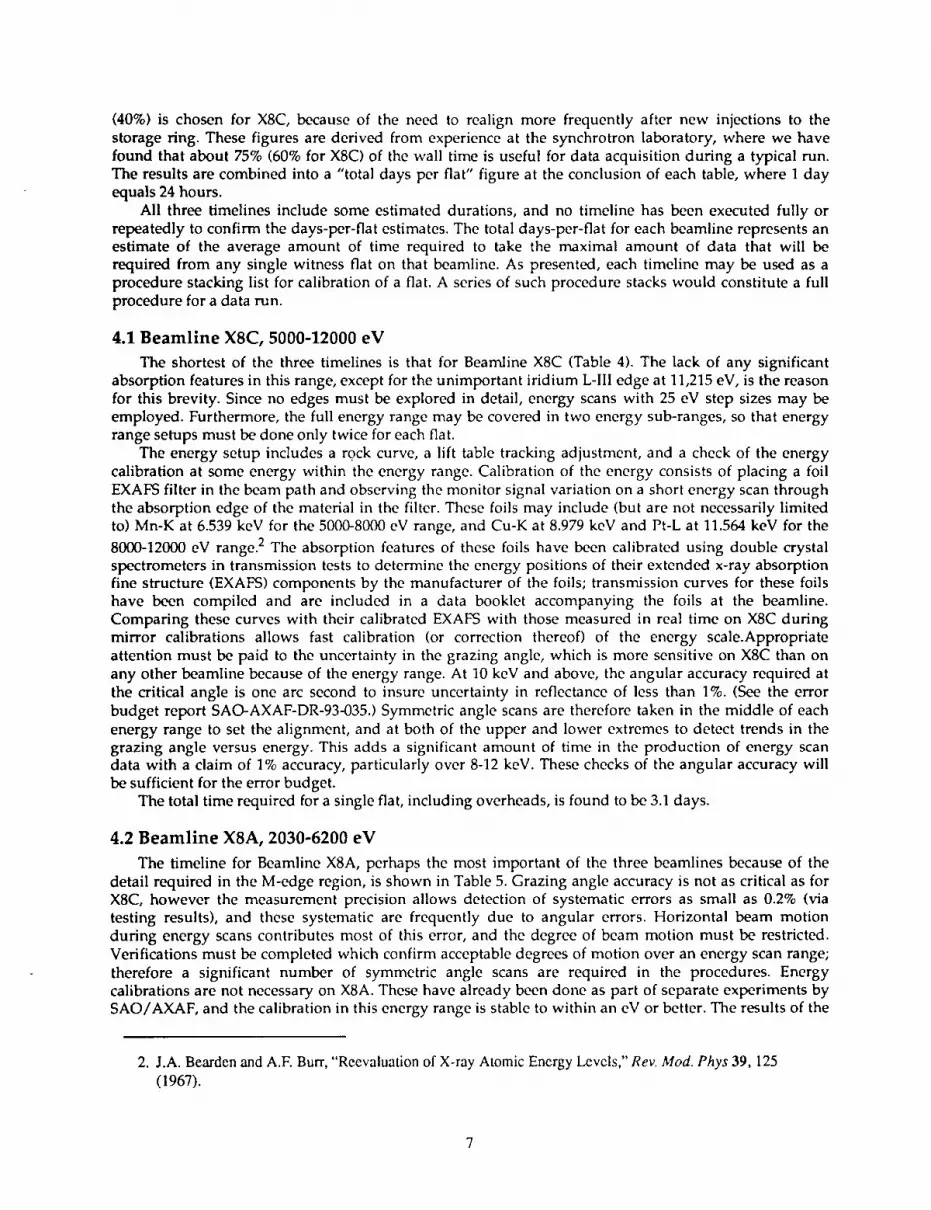
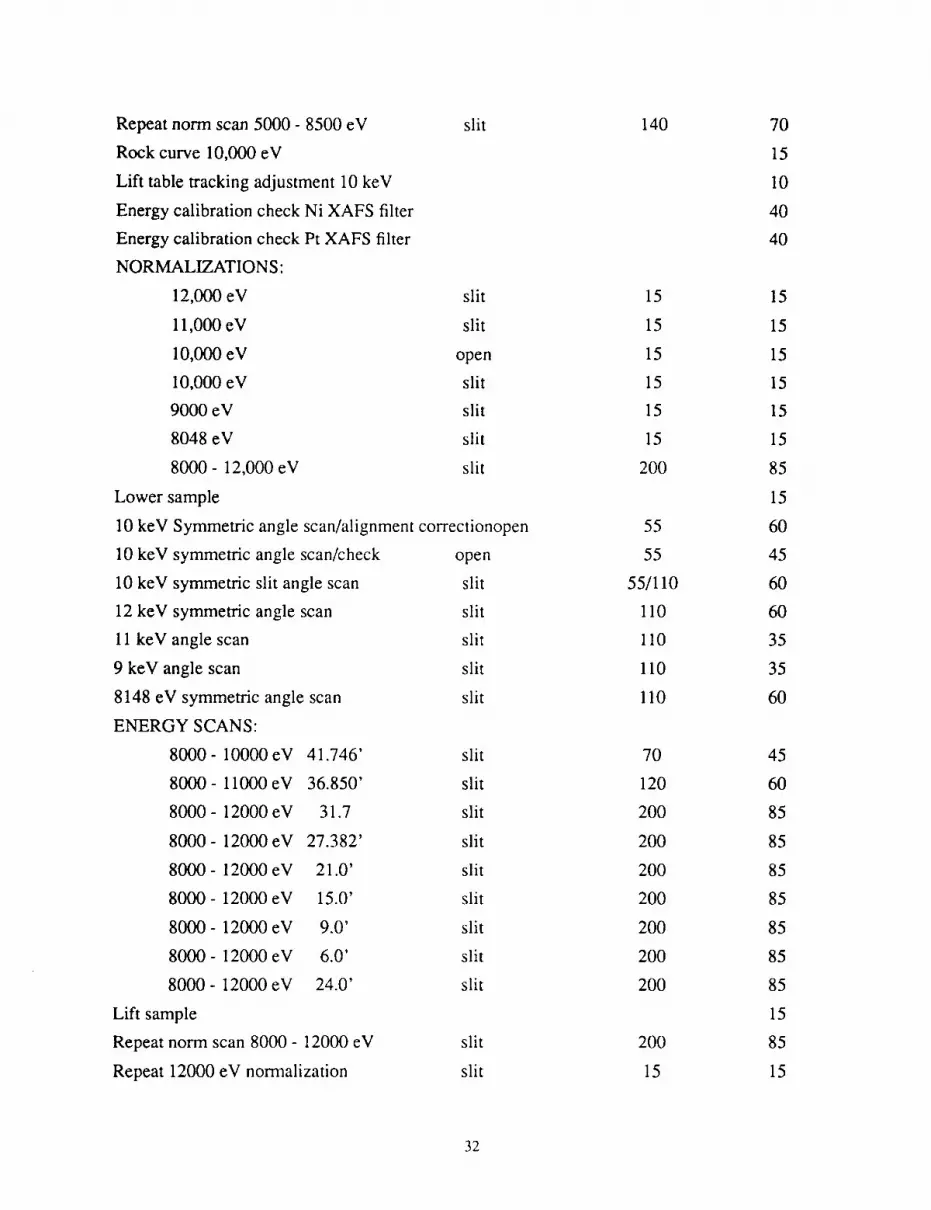
4.1 Beamline X8C, 5000-12000 eV
The shortest of the three timelines is that for Beamline X8C (Table 4). The lack of any significant
absorption features in this range, except for the unimportant iridium L-Ill edge at 11,215 eV, is the reason
for this brevity. Since no edges must be explored in detail, energy scans with 25 eV step sizes may be
employed. Furthermore, the full energy range may be covered in two energy sub-ranges, so that energy
range setups must be done only twice for each fiat.The energy setup includes a rock curve, a lift table tracking adjustment, and a check of the energy
calibration at some energy within the energy range. Calibration of the energy consists of placing a foil
EXAFS filter in the beam path and observing the monitor signal variation on a short energy scan throughthe absorption edge of the material in the filter. These foils may include (but are not necessarily limited
to) Mn-K at 6.539 keV for the 5000-8000 eV range, and Cu-K at 8.979 keV and Pt-L at 11.564 keV for the
8000-12000 eV range. 2 The absorption features of these foils have been calibrated using double crystal
spectrometers in transmission tests to determine the energy positions of their extended x-ray absorption
fine structure (EXAFS) components by the manufacturer of the foils; transmission curves for these foilshave been compiled and are included in a data booklet accompanying the foils at the beamline.
Comparing these curves with their calibrated EXAFS with those measured in real time on X8C during
mirror calibrations allows fast calibration (or correction thereof) of the energy scale.Appropriate
attention must be paid to the uncertainty in the grazing angle, which is more sensitive on X8C than on
any other beamline because of the energy range. At 10 keV and above, the angular accuracy required at
the critical angle is one arc second to insure uncertainty in reflectance of less than 1%. (See the error
budget report SAO-AXAF-DR-93-035.) Symmetric angle scans are therefore taken in the middle of each
energy range to set the alignment, and at both of the upper and lower extremes to detect trends in the
grazing angle versus energy. This adds a significant amount of time in the production of energy scandata with a claim of 1% accuracy, particularly over 8-12 keV. These checks of the angular accuracy will
be sufficient for the error budget.
The total time required for a single fiat, including overheads, is found to be 3.1 days.
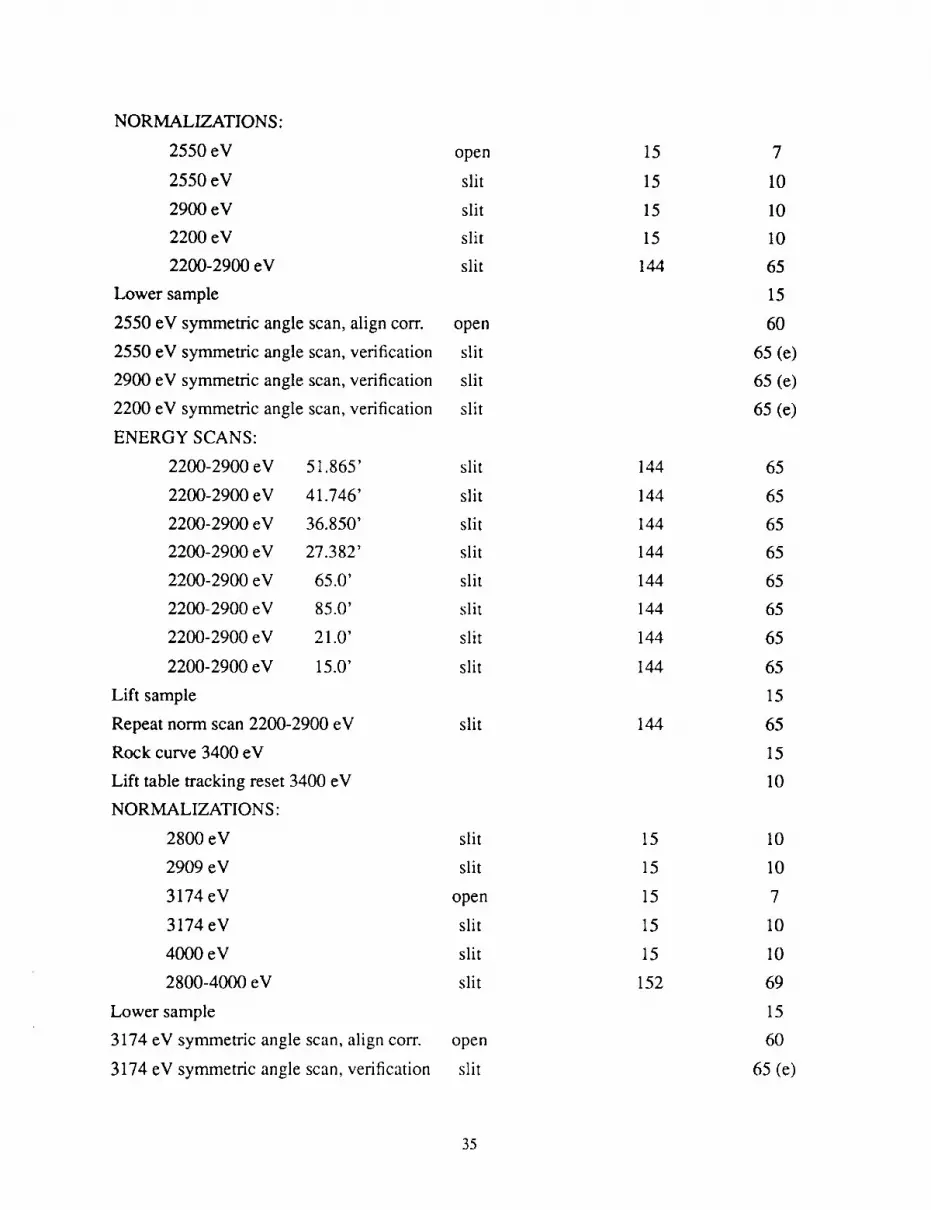
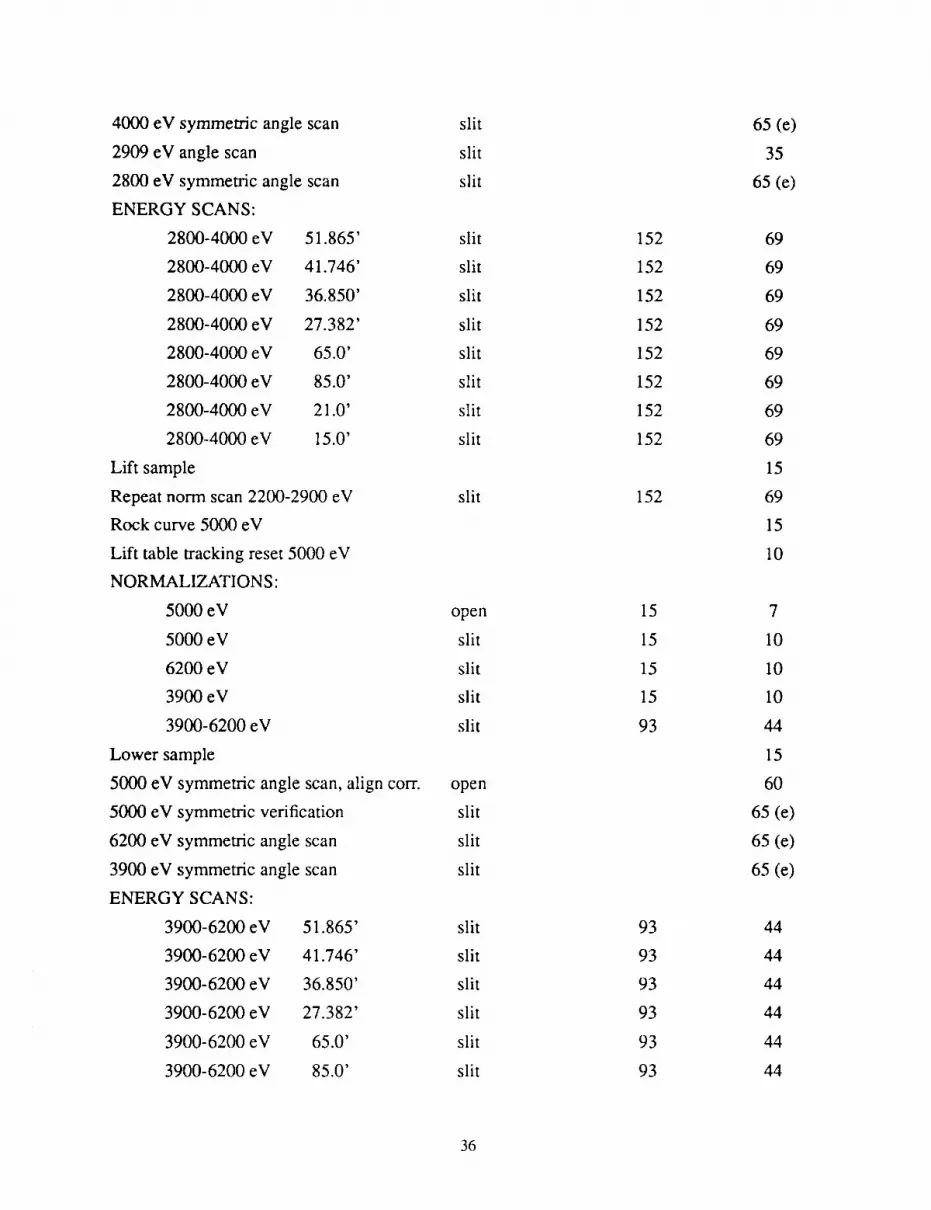
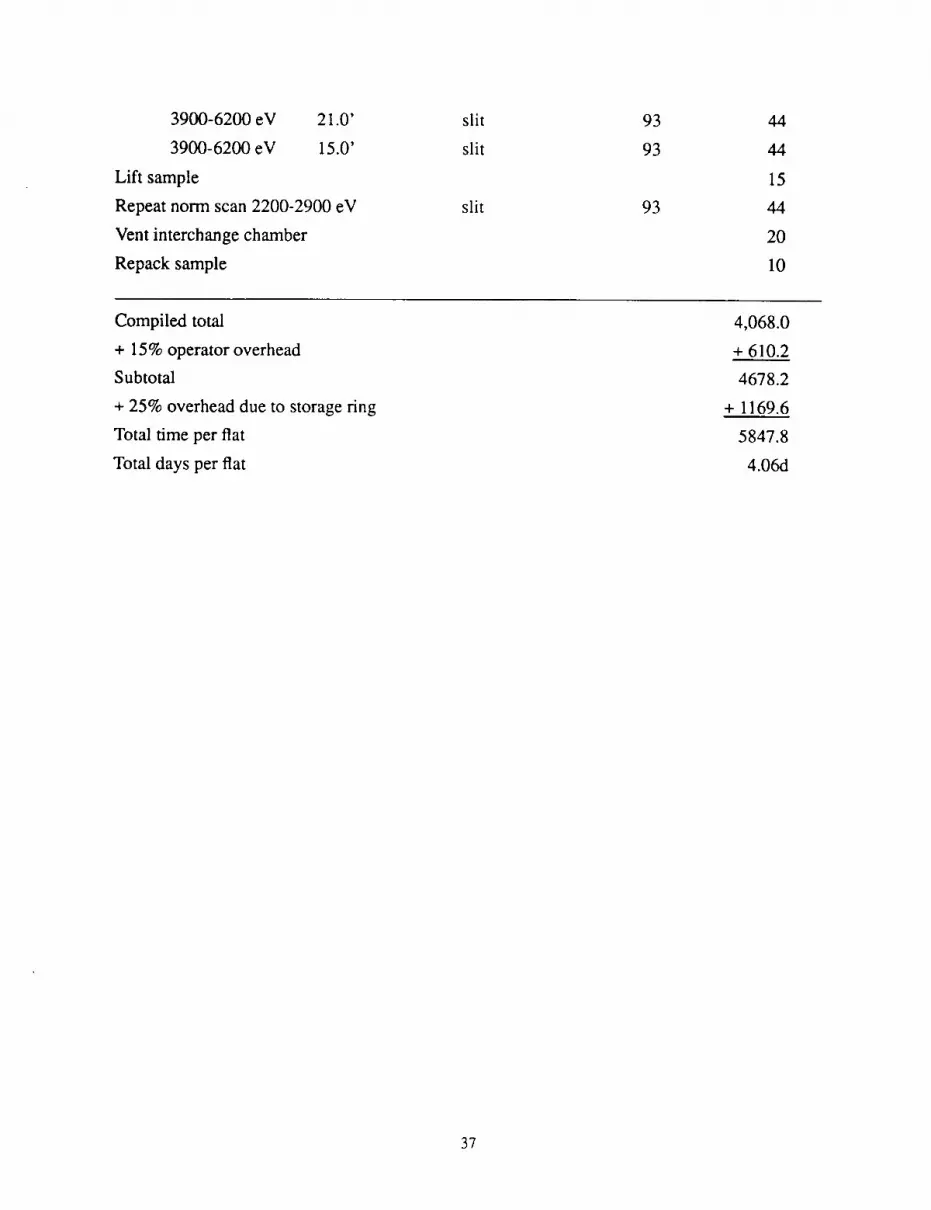
4.2 Beamline X8A, 2030-6200 eV
The timeline for Beamline X8A, perhaps the most important of the three beamlines because of the
detail required in the M-edge region, is shown in Table 5. Grazing angle accuracy is not as critical as for
X8C, however the measurement precision allows detection of systematic errors as small as 0.2% (viatesting results), and these systematic are frequently due to angular errors. Horizontal beam motion
during energy scans contributes most of this error, and the degree of beam motion must be restricted.Verifications must be completed which confirm acceptable degrees of motion over an energy scan range;
therefore a significant number of symmetric angle scans are required in the procedures. Energycalibrations are not necessary on X8A. These have already been done as part of separate experiments by
SAO/AXAF, and the calibration in this energy range is stable to within an eV or better. The results of the
2. J.A. Bearden and A.F. Burr, "Reevaluation of X-ray Atomic Energy Levels," Rev. Mod. Phys 39, 125
(1967).
X8A energy scale calibrations will be reported in separate documents currently in preparation.For the necessary measurements from Table 2, the total time required per fiat on X8A is 4.06 days.
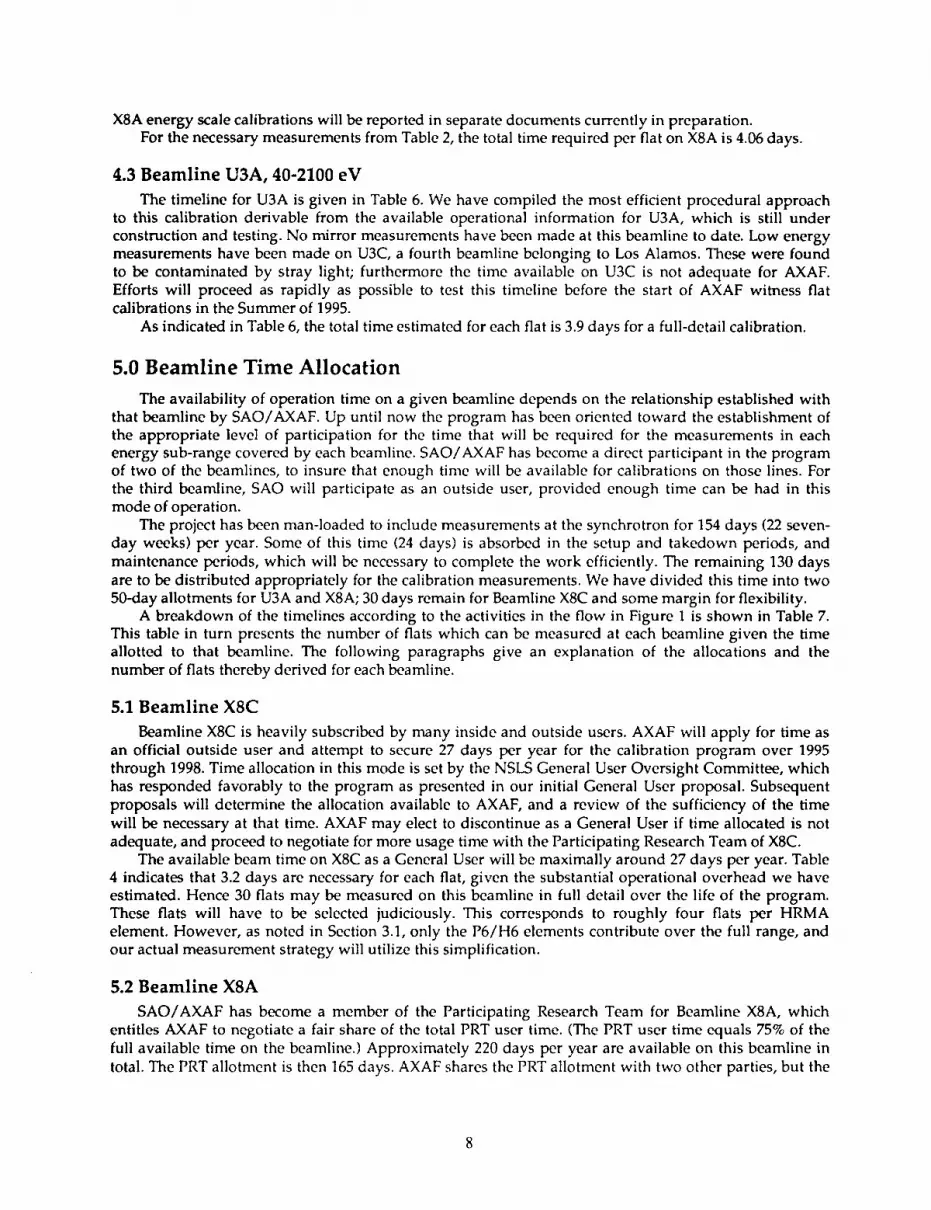
4.3 Beamline U3A, 40-2100 eV
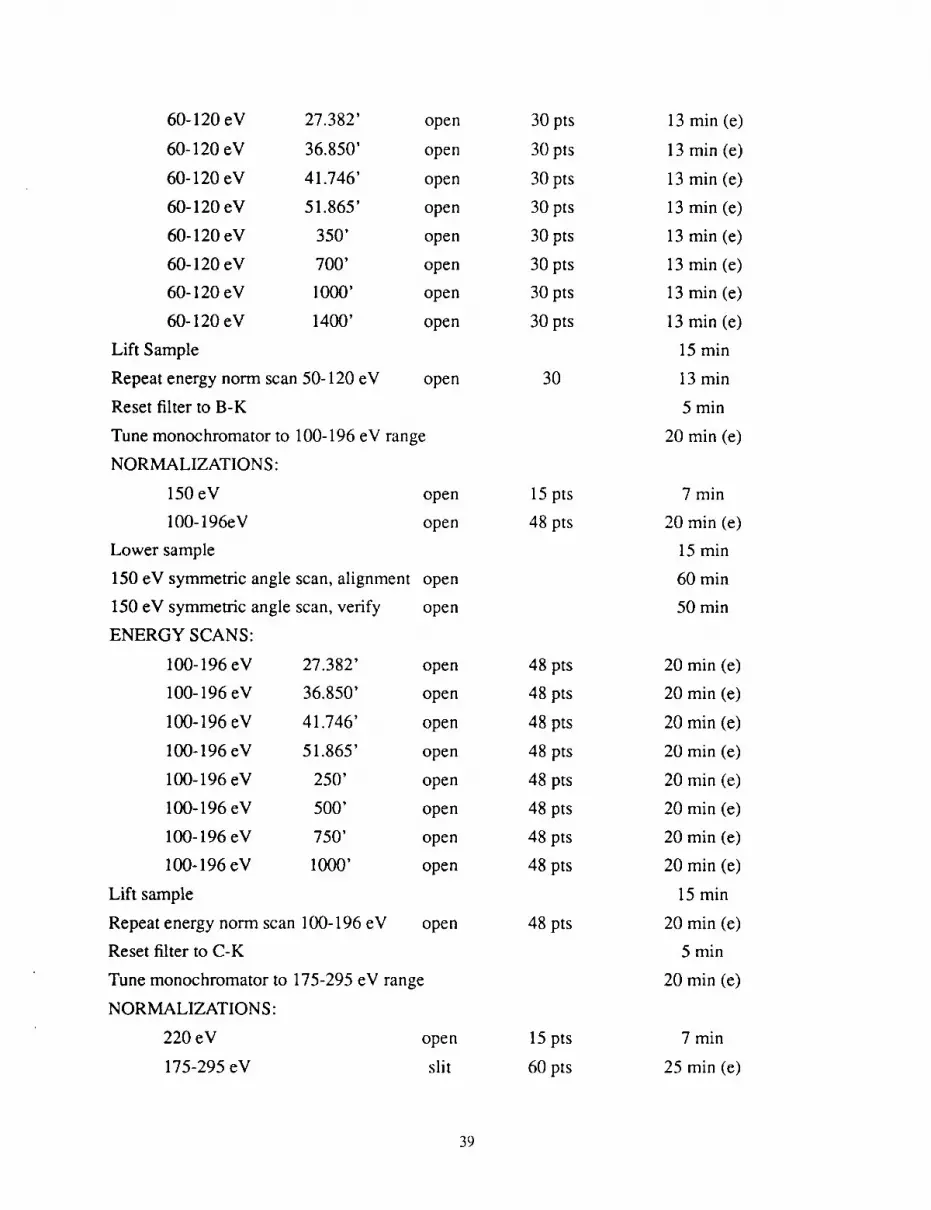
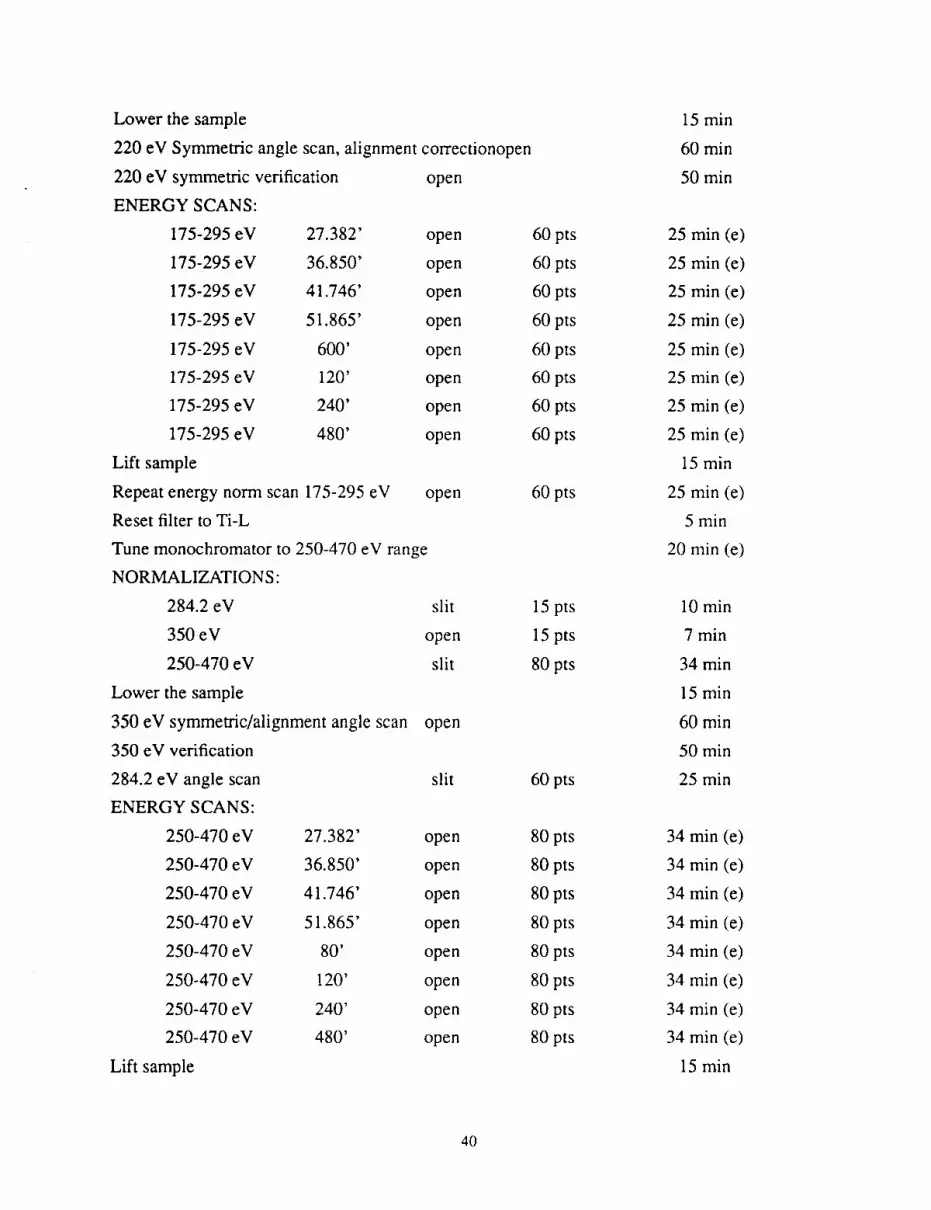
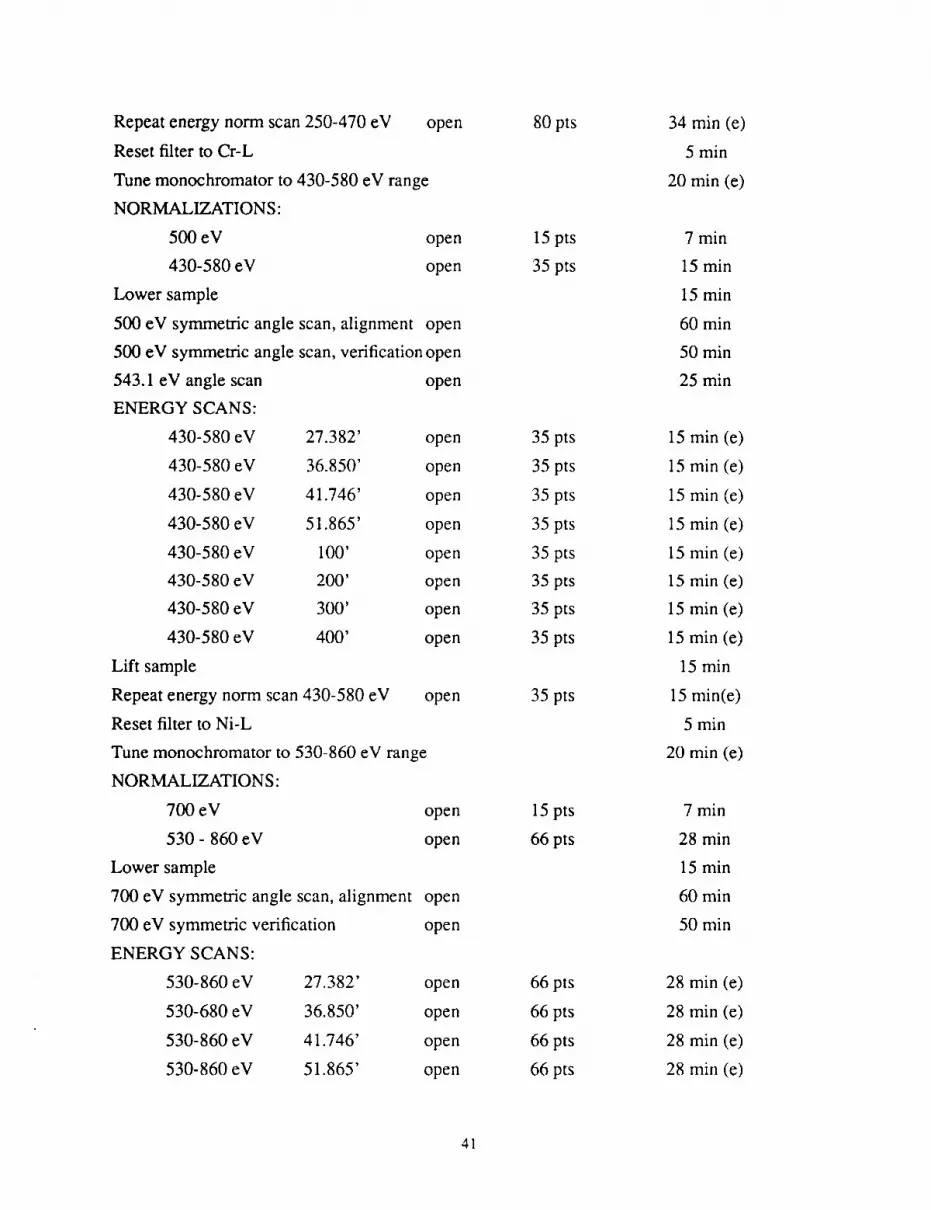
The timeline for U3A is given in Table 6. We have compiled the most efficient procedural approach
to this calibration derivable from the available operational information for U3A, which is still under
construction and testing. No mirror measurements have been made at this beamline to date. Low energymeasurements have been made on U3C, a fourth beamline belonging to Los Alamos. These were found
to be contaminated by stray light; furthermore the time available on U3C is not adequate for AXAF.
Efforts will proceed as rapidly as possible to test this timeline before the start of AXAF witness fiatcalibrations in the Summer of 1995.
As indicated in Table 6, the total time estimated for each fiat is 3.9 days for a full-detail calibration.
5.0 Beamline Time Allocation
The availability of operation time on a given beamline depends on the relationship established with
that beamline by SAO/AXAF. Up until now the program has been oriented toward the establishment of
the appropriate level of participation for the time that will be required for the measurements in eachenergy sub-range covered by each beamline. SAO/AXAF has become a direct participant in the program
of two of the beamlines, to insure that enough time will be available for calibrations on those lines. For
the third beamline, SAO will participate as an outside user, provided enough time can be had in this
mode of operation.
The project has been man-loaded to include measurements at the synchrotron for 154 days (22 seven-
day weeks) per year. Some of this time (24 days) is absorbed in the setup and takedown periods, and
maintenance periods, which will be necessary to complete the work efficiently. The remaining 130 days
are to be distributed appropriately for the calibration measurements. We have divided this time into two
50-day allotments for U3A and X8A; 30 days remain for Beamline X8C and some margin for flexibility.A breakdown of the timelines according to the activities in the flow in Figure 1 is shown in Table 7.
This table in turn presents the number of flats which can be measured at each beamline given the time
allotted to that beamline. The following paragraphs give an explanation of the allocations and the
number of fiats thereby derived for each beamline.
5.1 Beamline X8C
Beamline X8C is heavily subscribed by many inside and outside users. AXAF will apply for time as
an official outside user and attempt to secure 27 days per year for the calibration program over 1995
through 1998. Time allocation in this mode is set by the NSLS General User Oversight Committee, which
has responded favorably to the program as presented in our initial General User proposal. Subsequent
proposals will determine the allocation available to AXAF, and a review of the sufficiency of the time
will be necessary at that time. AXAF may elect to discontinue as a General User if time allocated is not
adequate, and proceed to negotiate for more usage time with the Participating Research Team of X8C.
The available beam time on X8C as a General User will be maximally around 27 days per year. Table4 indicates that 3.2 days are necessary for each fiat, given the substantial operational overhead we have
estimated. Hence 30 fiats may be measured on this beamline in full detail over the life of the program.
These fiats will have to be selected judiciously. This corresponds to roughly four fiats per HRMA
element. However, as noted in Section 3.1, only the P6/H6 elements contribute over the full range, and
our actual measurement strategy will utilize this simplification.
5.2 Beamline X8A
SAO/AXAF has become a member of the Participating Research Team for Beamline X8A, which
entitles AXAF to negotiate a fair share of the total PRT user time. (The PRT user time equals 75% of the
full available time on the beamline.) Approximately 220 days per year are available on this beamline in
total. The PRT allotment is then 165 days. AXAF shares the PRT allotment with two other parties, but the
divisionisnotnecessarilyequal.RecentlyAXAFhasbeenableto acquiresignificantlymorethan25%ofthese 165 days for testing purposes. However, even if AXAF were confined to one-third of the total, we
would then have at least 55 days per year. SAO/AXAF has proposed to use 50 days per year during the
calibration period. Hence we expect to be able to calibrate 43 mirrors on this beamline, as derived inTable 5. This corresponds to five fiats per HRMA element.
5.3 Beamline U3A
SAO/AXAF has secured permission from Los Alamos National Laboratory to assemble, implement,and test U3A for use in the AXAF synchrotron calibration. SAO/AXAF is a PRT member on this
beamline, as with X8A. The assembly is under way, and hence the duration of some of the timelineelements is uncertain. We have agreed to use no more than 16 weeks per year on this beamline for AXAF
and AXAF-related purposes. In Table 6, we have budgeted 50 days per year to work on AXAF witness
fiats, as on Beamline X8A. We therefore estimate that 44 fiats may be calibrated in full on U3A over the
life of the program. Again, this is five fiats per HRMA element.
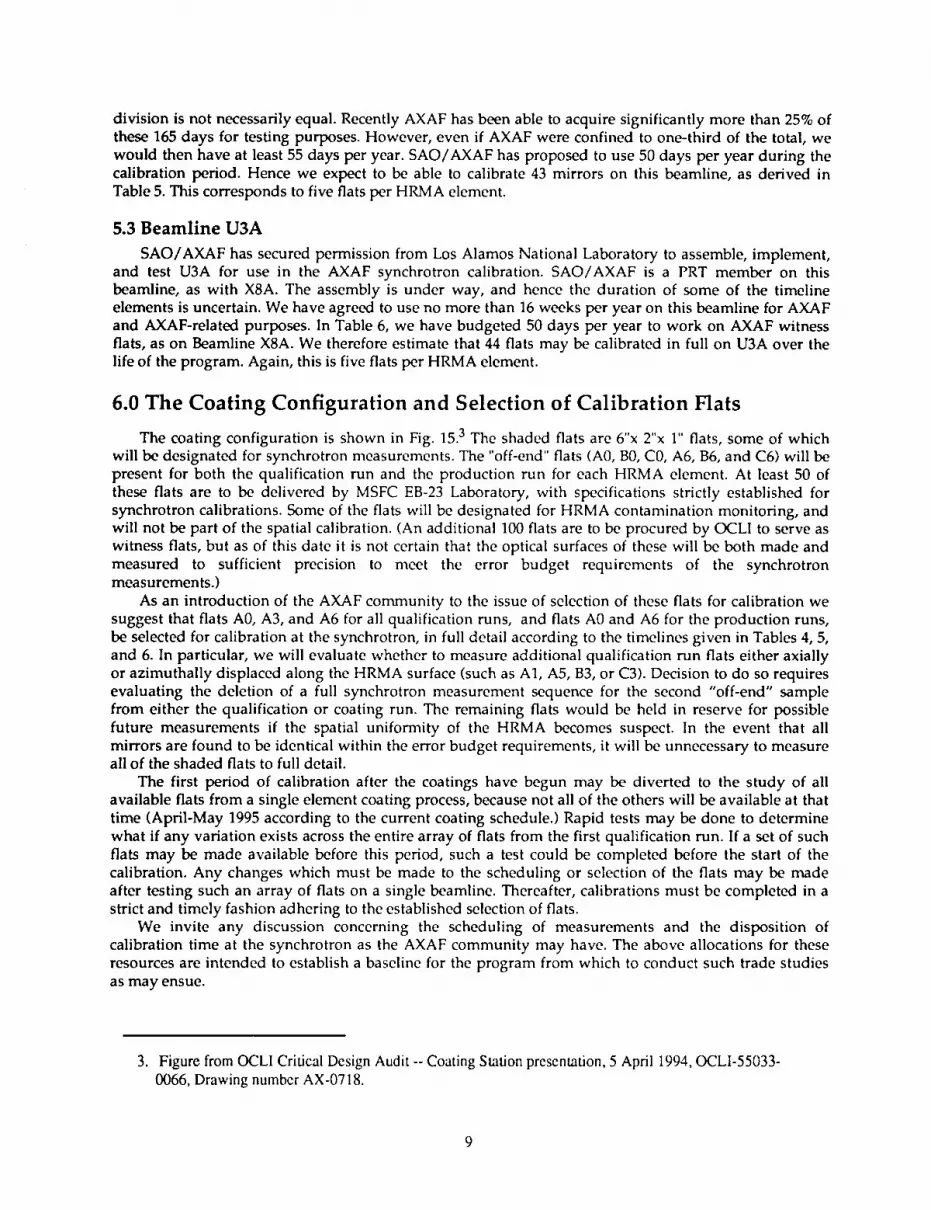
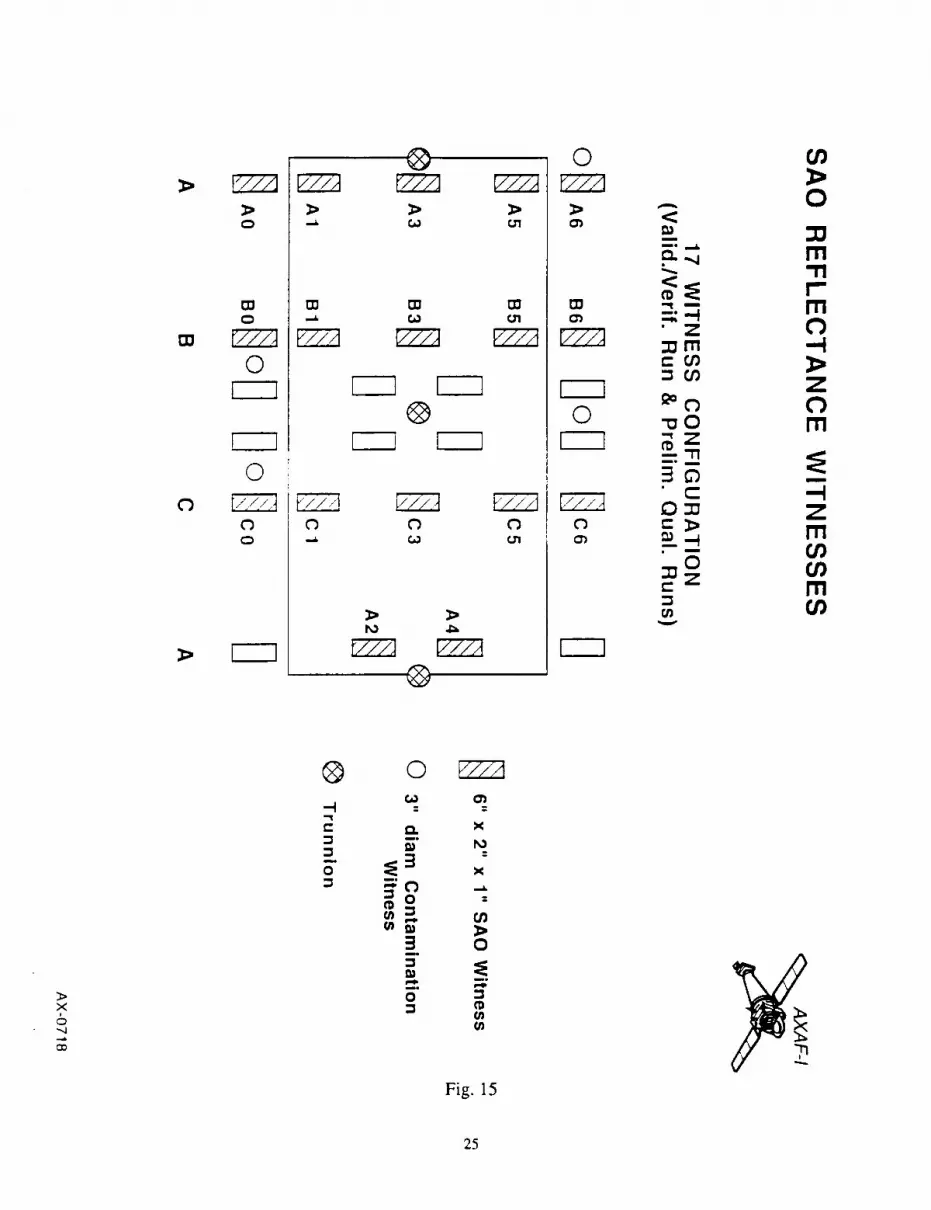
6.0 The Coating Configuration and Selection of Calibration Flats
The coating configuration is shown in Fig. 15.3 The shaded fiats are 6"x 2"x 1" fiats, some of which
will be designated for synchrotron measurements. The "off-end" fiats (A0, B0, CO, A6, B6, and C6) will be
present for both the qualification run and the production run for each HRMA element. At least 50 of
these fiats are to be delivered by MSFC EB-23 Laboratory, with specifications strictly established for
synchrotron calibrations. Some of the fiats will be designated for HRMA contamination monitoring, and
will not be part of the spatial calibration. (An additional 100 fiats are to be procured by OCLI to serve aswitness flats, but as of this date it is not certain that the optical surfaces of these will be both made and
measured to sufficient precision to meet the error budget requirements of the synchrotronmeasurements.)
As an introduction of the AXAF community to the issue of selection of these flats for calibration we
suggest that flats A0, A3, and A6 for all qualification runs, and flats A0 and A6 for the production runs,
be selected for calibration at the synchrotron, in full detail according to the timelines given in Tables 4, 5,
and 6. In particular, we will evaluate whether to measure additional qualification run flats either axially
or azimuthally displaced along the HRMA surface (such as A1, A5, B3, or C3). Decision to do so requires
evaluating the deletion of a full synchrotron measurement sequence for the second "off-end" samplefrom either the qualification or coating run. The remaining flats would be held in reserve for possible
future measurements if the spatial uniformity of the HRMA becomes suspect. In the event that all
mirrors are found to be identical within the error budget requirements, it will be unnecessary to measureall of the shaded flats to full detail.
The first period of calibration after the coatings have begun may be diverted to the study of all
available flats from a single element coating process, because not all of the others will be available at that
time (April-May 1995 according to the current coating schedule.) Rapid tests may be done to determine
what if any variation exists across the entire array of flats from the first qualification run. If a set of suchflats may be made available before this period, such a test could be completed before the start of the
calibration. Any changes which must be made to the scheduling or selection of the flats may be made
after testing such an array of flats on a single beamline. Thereafter, calibrations must be completed in a
strict and timely fashion adhering to the established selection of flats.
We invite any discussion concerning the scheduling of measurements and the disposition of
calibration time at the synchrotron as the AXAF community may have. The above allocations for these
resources are intended to establish a baseline for the program from which to conduct such trade studies
as may ensue.
3. Figure from OCLI Critical Design Audit -- Coating Station presentation, 5 April 1994, OCLI-55033-
0066, Drawing number AX-0718.
7.0 References
1. B.L. Henke, E.M. Gullikson, and J.C. Davis, "X-ray Interactions: Photoabsorption, Scattering,Transmission and Reflection at E=50-30000 eV, Z=1-92", in Atomic Data and Nuclear Data Tables, 54(2), p. 181 (1993).
2. J.A. Bearden and A.F. Burr, "Reevaluation of X-ray Atomic Energy Levels," Rev. Mod. Phys 39,125 (1967).
3. OCLI Critical Design Audit -- Coating Station presentation, 5 April 1994, OCLI-55033-0066.
10
RUN TIME /
tSample installation[4,
energy rangeSet
,i,
Normalizations
4,!
Lower mirror sample [I
4,
Angle scans/.alignmentcorrections ]4,
Energy scans
Lift mirror sample,1,
Renormalizations
Yes[ Remove sample ]
Yes@@
Fig. 1
11
SAMPLE INSTALLATION ]
Vent interchange chamber
i emovea c s angeI
Unpack and inspect sample ]on clean bench.
Load sample into dry box
Load sample in holder [
Load holder in vacuum
Replace flange on access port ]
Evacuate chamber ]
Fig. 2
12
SETUPX8C I
Move monochromator to theappropriate energy.
Scan the rocking curve,and select 2nd crystalsetting.
Scan positioning tablevertically to optimize intensity;reset vertical tracking.
Calibrate energy scale usingthe appropriate EXAFS filter.
SETUP X8A I
Move monochromator to theappropriate energy.
I Set second crystal to the ]peak of its rocking curve.
I SETUP U3A I
Select the appropriate diffractionoptic, and position it inthe monochromator.
lMovemo o rom torto1appropriate energy.
I set upstream and downstream [filters as required for this range.
i e rock n c eorse,e tIgrating order.
Reposition lift table foroptimal intensity.
Fig. 3
13
I NORMALIZATION ]
Move monochromator to theappropriate energy.
Center the desired detectorin the direct beam.
Acquire alternate monitor anddetector signals until 15 pairsare taken.
[ Calculate I/Io and its [fluctuation level.
@
Fig. 4
14
I ENERGY SCAN ]
Set energy to an intermediatevalue within the scan range.
Scan the detector through I
the direct beam and center I
it on the beam. ]
Scan energies using thesame scan control file aswill be used for the mirrormeasurements.*
*This means that the same points, timings, and step intervals will be used in the
normalization scan and the reflectance scans, which insures normalization consistency.
Fig. 5
15
[ LOWER SAMPLE ]
Zero-check Keithley 617 electrometers. ]
Turn on ion gauges
I Close upstream valves
I Open vertical gate valve [
I on lights remove port coversTurn and
I Retract wire support loop I
,l] Lower sample into mounting plate I
Retract lift rod
I Close vertical gate valve ]
I Extend wire support loop ]
Close ports; turn off lights ]I
!
Open beamline valves [
Turn off ion gauges Ii
I
Un-zero-check electrometers s; dark soak
Fig. 6
16
LSYMMETRIC ANGLE SCAN_
ISet energy
Select the appropriatedetector and center it.
Right-going scan
Left-going scan
1Angle correction
Fig. 7
17
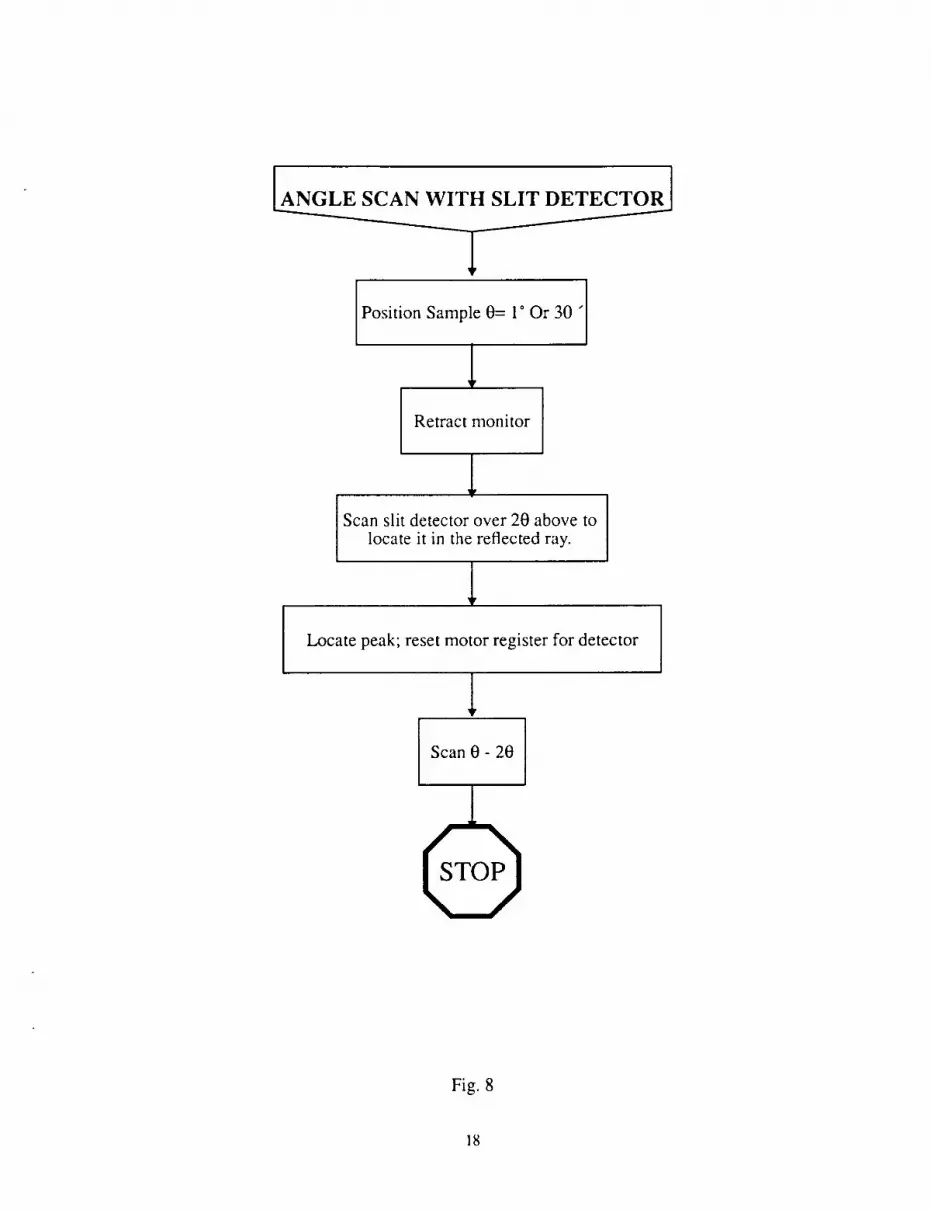
ANGLE SCAN WITH SLIT DETECTORJ
IPosition Sample 0= 1° Or 30 "
1Retract monitor
1Scan slit detector over 2t? above to
locate it in the reflected ray.
1Locate peak; reset motor register for detector
1Scan e - 2e
Fig. 8
18
Set0 and20
Scanslit detectorto locatein reflectedbeam.
Scanenergies
Fig. 9
19
LIFT SAMPLE
{SPEC } _ 0 ms [
!
|
Zero-Check electrometers I
Turn On Ion Gauges ]
Close Upstream Valves ]
Turn On Internal Lights, Open Ports [
Retract Wire Support Loop
Open Vertical Gate Valve
Lower Lift Rod; Screw Into Sample Lift Bar ]
Lift Sample And Clamp Lift Rod [I
!
,LClose Vertical Gate Valve I
Extend Wire Support Loop I
Close Ports; Turn Off Lights [I
!
Open Beamline Valves [!
!
Turn Off Ion Gauges ]I
!
Un-Zero-Check electrometers, Dark Soak ]I
@I
Fig. 10
2O
SAMPLE REMOVALAND REPACKING
Connect liquid nitrogen dewarvent port to repressurizationline on the RTS.
Close upstream gate valves.
Close upper turbo pump valve.
Vent interchange chamber
Remove interchange chamberaccess flange into dry box
Remove the sample holderfrom the lift bar and placeit in the dry box.
Remove mirror from
sample holder.
Place mirror in protectivedish, cover with capranbag, and remove from dry box.
Inspect sample surface andrecord any changes.
l Repack sample accordingto established standards.
Fig. 11
21
0
r,o
-13:3- -_o
o
r-q
¢b
_c3
A
¢b
0
Eff. Are0 (cm 2)
I
II
"0 q3
_.1 _-
I
IxO .._0 00 0
i_" _ .f'..!< _ L-'I- i, f
/ t /,
il3 1-13
II
i 'I j ,/' _ 1 1
Ob00
i i I i
00 00 0
ii
I I
00
0I L t L Llllll 1 L I
Fig. 12
22
0
t',O
"0
0
0
I-q
dl)
,.<
(I)
OO
0
0
J/
!
!
/
Eff. Area (cm2)
I',,9 Cq -Ix OlO O O O OO O O O O
\ "\ \• o
\ \ \I
N
I
I
I
I
II
Fig. 13
23
_1_0
0Z
FrlZI'-'q
0-<
_ cfJ I:_
x3
¢.o -'rl ,__o
0
,Do
0_b000
t',00"1
h
00
C_000
Q_Ol00
0k_
REFLECTANCE
0
' I
0
ob
I I I I I I II
oo_,° °oo_,_°°J
o
0
¢,0
o
0
0
o
o
o
o
o
o
o
--°
n__°
c-
3o
U1
½O
C_
3Dc-
U?
I I I I
Fig. 14
0
b0
24
Q
W
O
©
7777
W_...t.
®
O3
@
Q
W
u'l
O
w
O
A
O..,4:....
Z_rn
"_0
0_
m
0_Z
0
I*T'I"11l--l*n
-I
Z
m
m
-IZl=n
m
x
®-I
0
©
Q,m=
n,
0
3
0
01
x
=
x
0
-I
Fig. 15
25
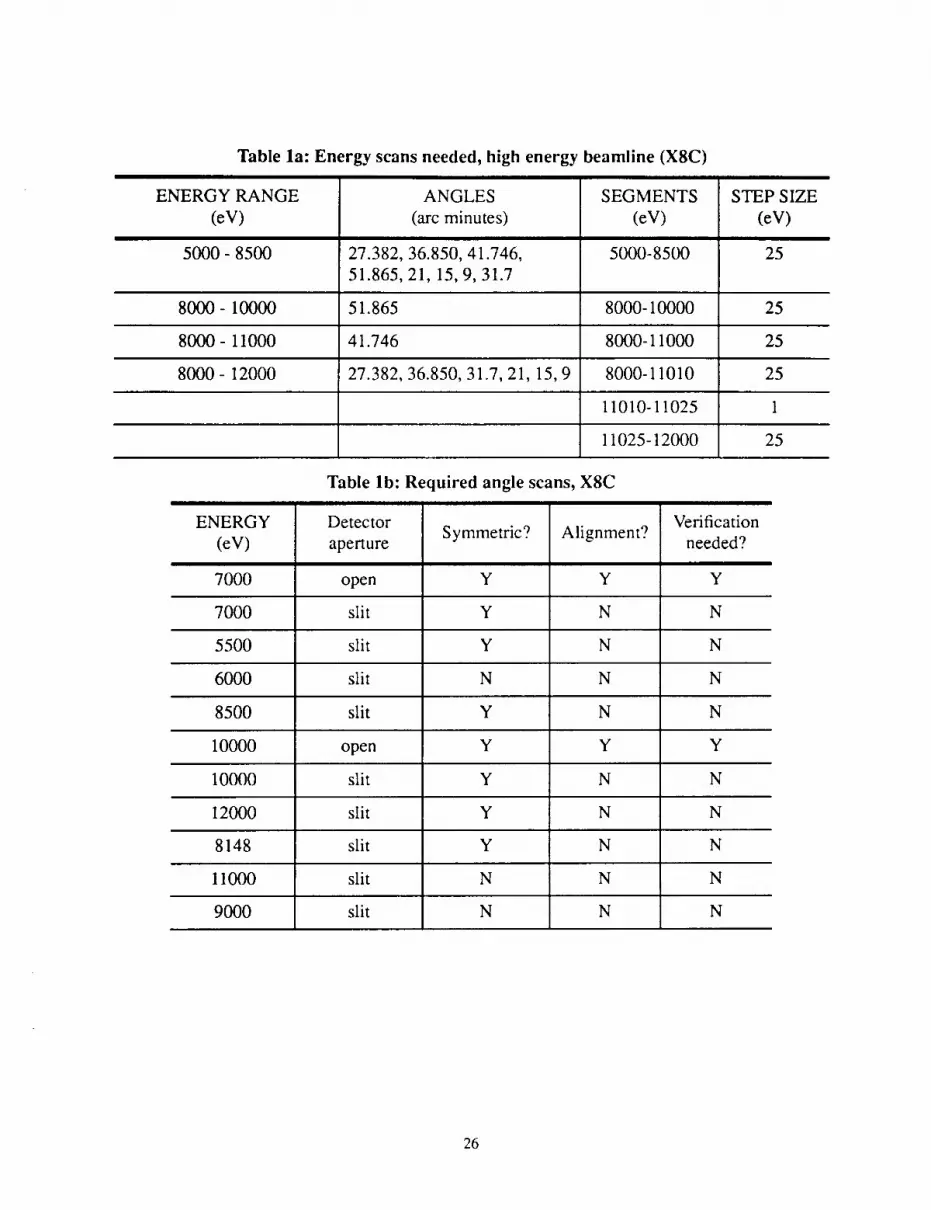
Table la: Energy scans needed, high energy beamline (X8C)
ENERGY RANGE
(eV)
5000- 8500
ANGLES
(arc minutes)
27.382,36.850,41.746,
51.865, 21, 15, 9, 31.7
SEGMENTS
(eV)
5000-8500
STEP SIZE
(eV)
25
8000-10000 51.865 8000-10000 25
8000-11000 41.746 80O0-11000 25
8000- 12000 27.382,36.850,31.7,21,15,9 8000-11010 25
11010-11025 1
11025-12000 25
ENERGY
(eV)
7O00
Table lb: Required angle scans, X8C
Detector
apertureSymmetric?
Y
Alignment?
Y
Verification
needed?
Yopen
7000 slit Y N N
5500 slit Y N N
6000 slit N N N
8500 slit Y N N
10000 open Y Y Y
10000 slit Y N N
12000 slit Y N N
8148 slit Y N N
11000 slit N N N
9000 slit N N N
26
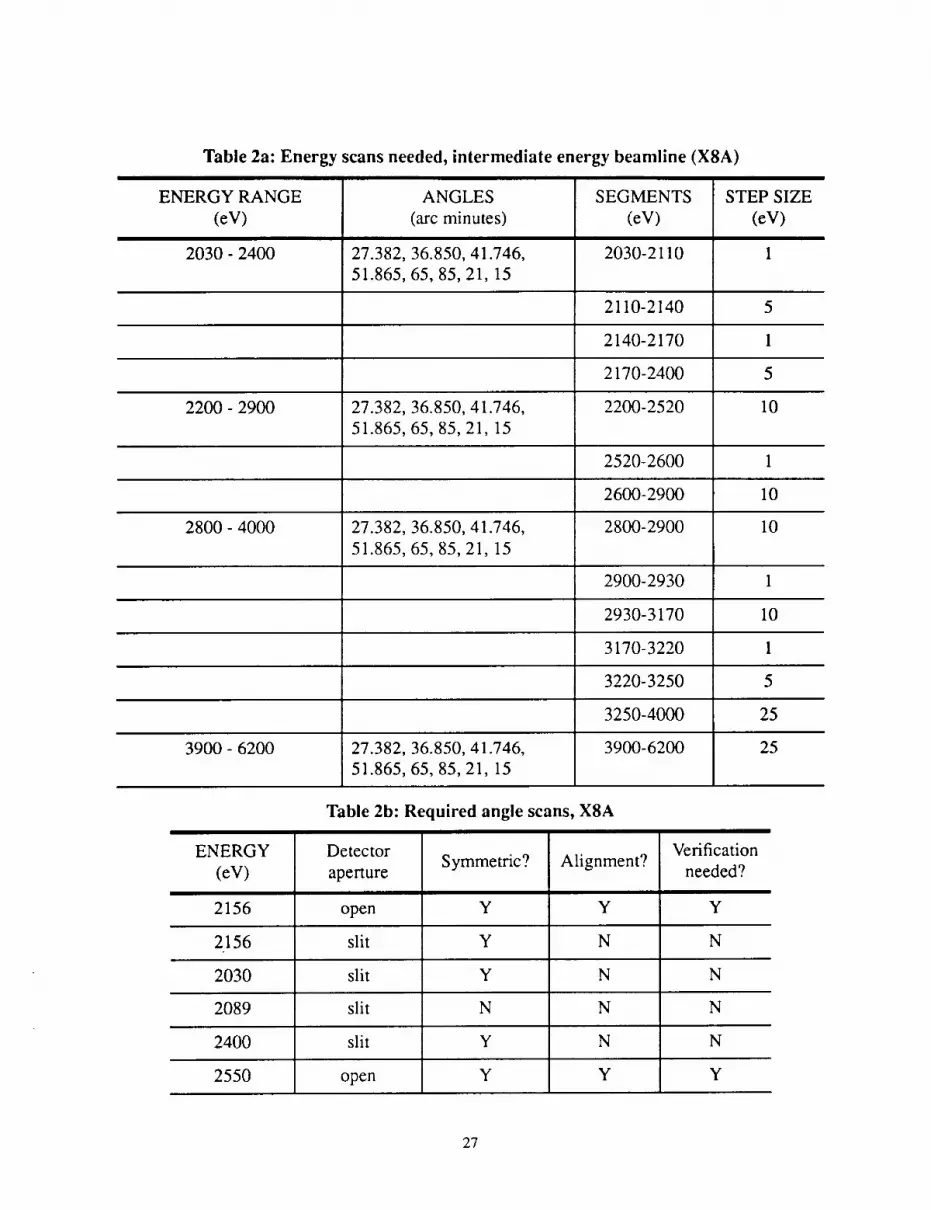
Table 2a: Energy scans needed, intermediate energy beamline (X8A)
ENERGY RANGE
(eV)
2030 - 2400
ANGLES
(arc minutes)
27.382, 36.850, 41.746,
51.865, 65, 85, 21, 15
SEGMENTS
(eV)
2030-2110
STEP SIZE
(eV)
2110-2140 5
2140-2170 1
2170-2400 5
2200 - 2900 27.382, 36.850, 41.746, 2200-2520 10
51.865, 65, 85, 21,15
252O-26O0 1
260O-290O 10
2800 - 4000 27.382, 36.850,41.746, 2800-2900 10
51.865,65,85,21,15
2900-2930 1
2930-3170 10
3170-3220 1
3220-3250 5
3250-4000 25
3900- 6200 27.382, 36.850,41.746, 3900-6200 25
51.865,65,85,21,15
ENERGY
(eV)
Table 2b: Required angle scans, X8A
Detector
apertureSymmetric?
Y
Alignment?
Y
Verification
needed?
Y2156 open
2156 slit Y N N
2030 slit Y N N
2089 slit N N N
2400 slit Y N N
2550 open Y Y Y
27
ENERGY(eV)
2550
Table 2b: Required angle scans, X8A
Detector
aperture
slit
Symmetric?
Y
Alignment?
N
Verification
needed?
N
2900 slit Y N N
2200 slit Y N N
3174 open Y Y Y
3174 slit Y N N
4000 slit Y N N
2909 slit N N N
2900 slit Y N N
5000 open Y Y Y
5000 slit Y N N
6200 slit Y N N
3900 slit Y N N
28
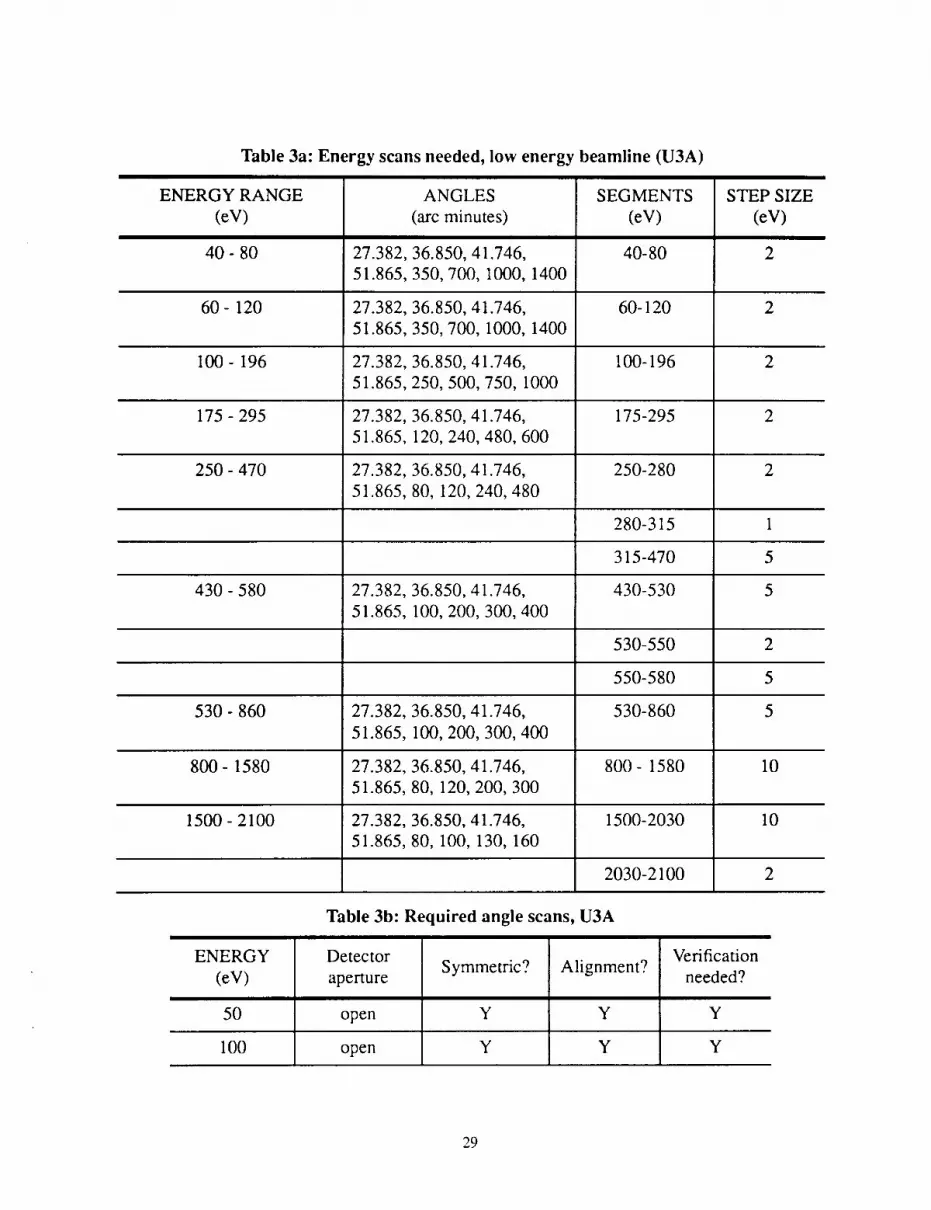
Table 3a: Energy scans needed, low energy beamline (U3A)
ENERGY RANGE
(eV)
40- 80 27.382,
51.865,
ANGLES
(arc minutes)
36.850, 41.746,
350,700,1000,1400
SEGMENTS
(eV)
40-80
STEP SIZE
(eV)
2
60- 120 27.382, 36.850, 41.746, 60-120 2
51.865,350,700,1000, 1400
100- 196 27.382,36.850, 41.746, 100-196 2
51.865,250,500,750,1000
175 - 295 27.382, 36.850, 41.746, 175-295 2
51.865,120,240,480,600
250- 470 27.382, 36.850,41.746, 250-280 2
51.865, 80,120,240,480
280-315 1
315-470 5
430 -580 27.382, 36.850, 41.746, 430-530 5
51.865, 100,200, 300, 400
530-550 2
550-580 5
530- 860 27.382,36.850,41.746, 530-860 5
51.865,100,200,300,400
800- 1580 27.382,36.850,41.746, 800- 1580 10
51.865,80,120,200,300
1500- 2100 27.382,36.850, 41.746, 1500-2030 10
51.865,80,100,130,160
2030-2100 2
ENERGY
(eV)
Table 3b: Required angle scans, U3A
Detector
apertureSymmetric?
Y
Alignment?
Y
Verification
needed?
50 open Y
100 open Y Y Y
29
ENERGY(eV)
150
Table 3b: Required angle scans, U3A
Detector
apertureSymmetric?
Y
Alignment?
Y
Verification
needed?
open Y
220 open Y Y Y
284.2 slit N N N
350 open Y Y Y
500 open Y Y Y
700 open Y Y Y
1200 open Y Y Y
1200 slit N N N
1800 open Y Y Y
1800 slit N N N
3O
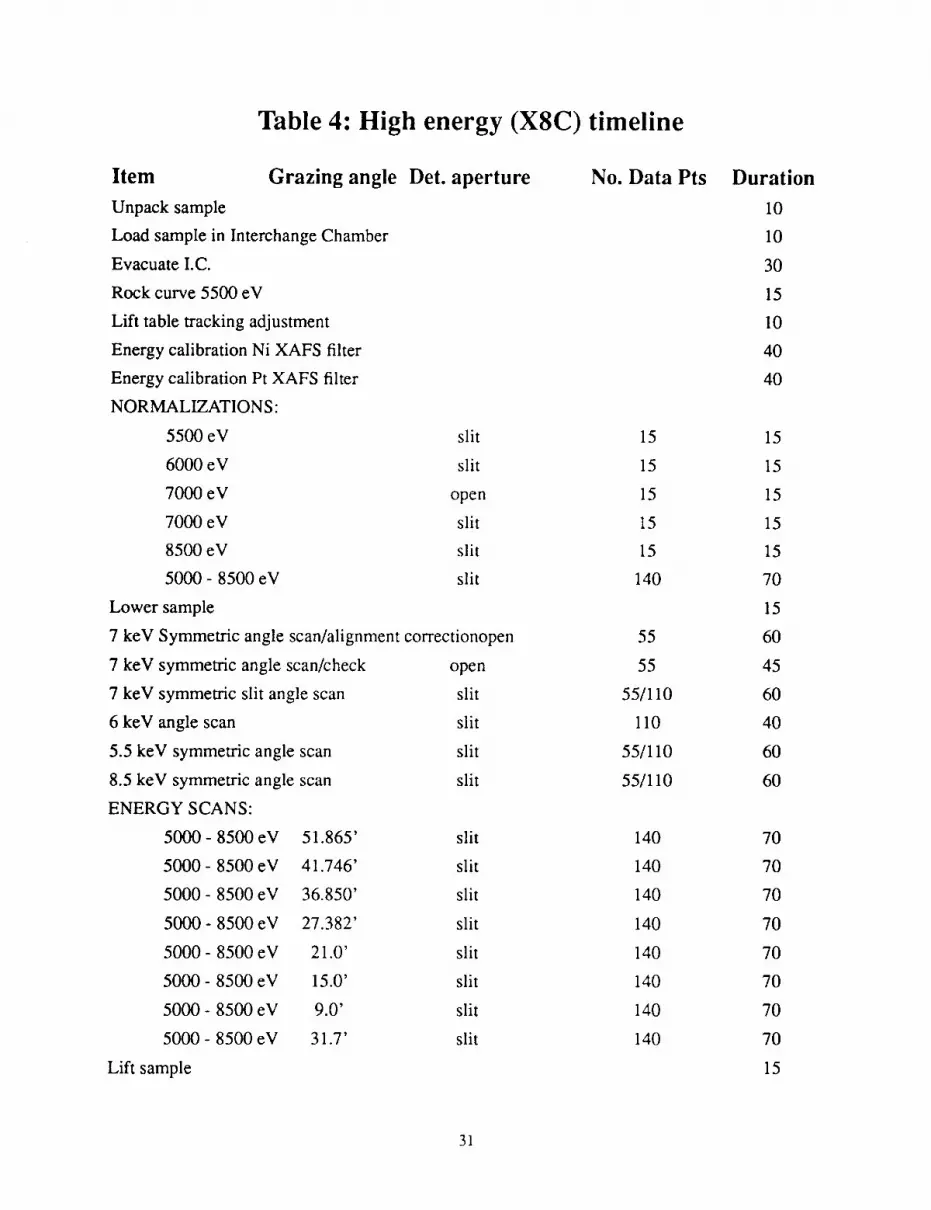
Table 4: High energy (X8C) timeline
Item Grazing angle
Unpack sample
Load sample in Interchange Chamber
Evacuate I.C.
Rock curve 5500 eV
Lift table tracking adjustment
Energy calibration Ni XAFS filter
Energy calibration Pt XAFS filter
NORMALIZATIONS:
5500 eV slit
6000 eV slit
7000 eV open
7000 eV slit
8500 eV slit
5000 - 8500 eV slit
Lower sample
7 keV Symmetric angle scan/alignment correctionopen
7 keV symmetric angle scan/check open
7 keV symmetric slit angle scan
6 keV angle scan
5.5 keV symmetric angle scan
8.5 keV symmetric angle scan
ENERGY SCANS:
5000- 8500 eV 51.865'
5000- 8500 eV 41.746'
5000- 8500eV 36.850'
5000- 8500eV 27.382'
5000 - 8500 eV 21.0'
5000 - 8500 eV 15.0'
5000 - 8500 eV 9.0'
5000 - 8500 eV 31.7'
Lift sample
Det. aperture
slit
slit
slit
slit
slit
slit
slit
slit
slit
slit
slit
slit
No. Data Pts
15
15
15
15
15
140
55
55
55/110
110
55/110
55/110
140
140
140
140
140
140
140
140
Duration
10
10
3O
15
10
40
40
15
15
15
15
15
70
15
60
45
60
40
60
60
70
70
70
70
70
70
70
70
15
31
Repeatnormscan5000- 8500eV
Rockcurve 10,000eV
Lift tabletracking adjustment10keV
EnergycalibrationcheckNi XAFS filter
EnergycalibrationcheckPtXAFS filterNORMALIZATIONS:
12,000eV
11,000eV
10,000eV
10,000eV
9000eV
8048eV
8000- 12,000eV
Lower sample10keV
10keV
10keV
12keV symmetricanglescan
11keV anglescan
9 keV anglescan
8148eV symmetricanglescanENERGY SCANS:
8000- 10000eV 41.746'
8000- ll000eV 36.850'
8000- 12000eV 31.7
8000- 12000eV 27.382'
8000- 12000eV 21.0'
8000- 12000eV 15.0'
8000- 12000eV 9.0'
8000- 12000eV 6.0'
8000- 12000eV 24.0'
Lift sample
Repeatnormscan8000- 12000eV
Repeat12000eV normalization
slit
slit
slit
openslit
slit
slit
slit
Symmetricanglescan/alignmentcorrectionopen
symmetricanglescan/check open
symmetricslit anglescan slitslit
slit
slit
slit
slit
slit
slit
slit
slit
slit
slit
slit
slit
slit
slit
140
15
15
15
15
15
15
200
55
55
55/110
110
110
110
110
70
120
200
200
200
200
200
200
200
200
15
70
15
10
40
40
15
15
15
15
15
15
85
15
60
45
60
60
35
35
60
45
60
85
85
85
85
85
85
85
15
85
15
32
Repeat10000eV normalization
Repeat8048eV normalization
VentInterchangeChamber
Repacksample
slit
slit
15
15
15
15
20
10
Compiledtotal
+15%operatoroverhead
Subtotal
+ 40%overheaddueto beamdumps
Total timeper flat
Totaldaysperflat
2,810.0
+ 421.5
3231.5
+ 1292,6
4524.1
3.1d
33
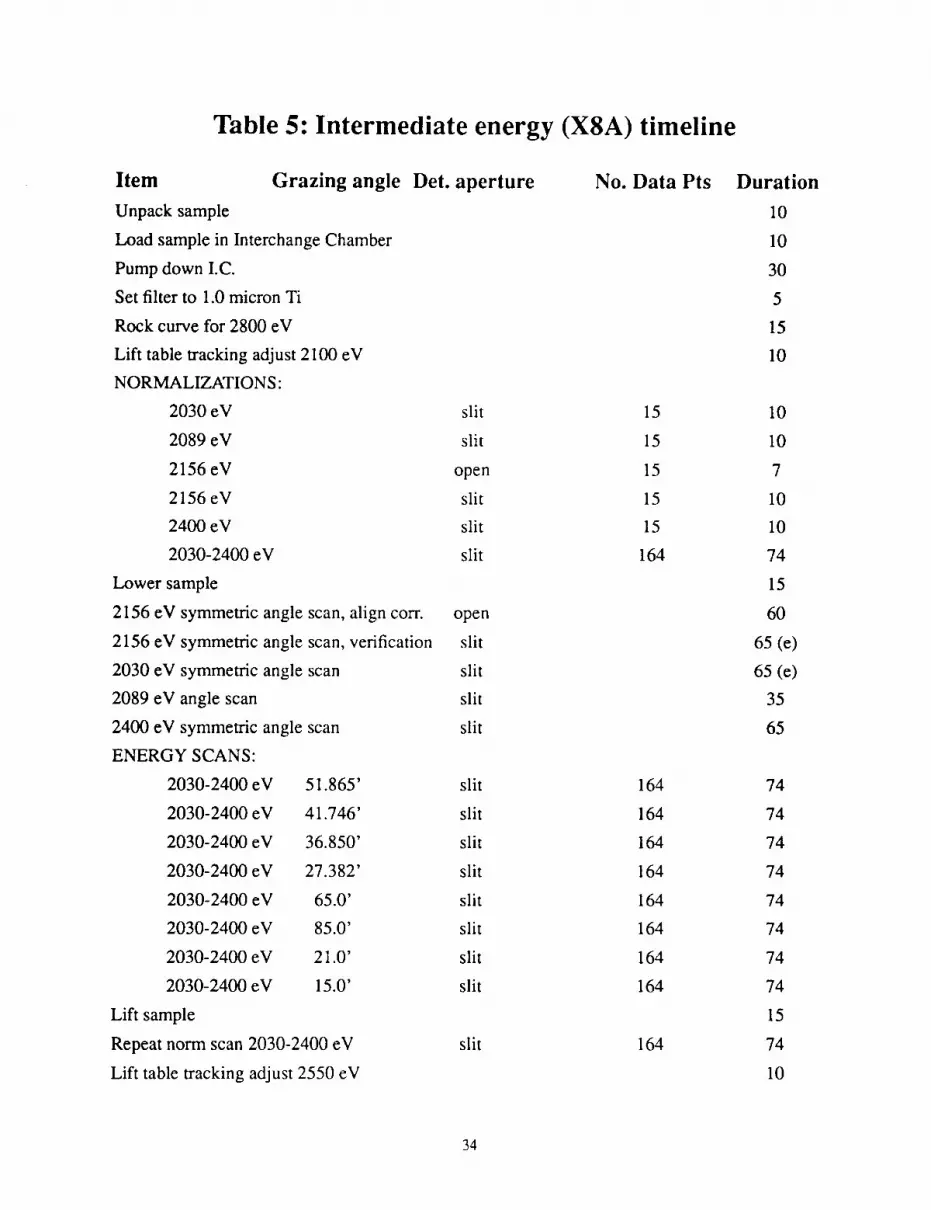
Table 5: Intermediate energy (X8A) timeline
Item Grazing angle
Unpack sample
Load sample in Interchange Chamber
Pump down I.C.
Set filter to 1.0 micron Ti
Rock curve for 2800 eV
Lift table tracking adjust 2100 eV
NORMALIZATION S:
2030 eV slit
2089 eV slit
2156 eV open
2156 eV slit
2400 eV slit
2030-2400 eV slit
Lower sample
2156 eV symmetric angle scan, align corr. open
2156 eV symmetric angle scan, verification slit
2030 eV symmetric angle scan slit
2089 eV angle scan slit
2400 eV symmetric angle scan slit
ENERGY SCANS:
2030-2400 eV 51.865' slit
2030-2400 eV 41.746' slit
2030-2400 eV 36.850' slit
2030-2400 eV 27.382' slit
2030-2400 eV 65.0' slit
2030-2400 eV 85.0' slit
2030-2400 eV 21.0' slit
2030-2400 eV 15.0' slit
Lift sample
Repeat norm scan 2030-2400 eV slit
Lift table tracking adjust 2550 eV
Det. aperture No. Data Pts
15
15
15
15
15
164
164
164
164
164
164
164
164
164
164
Duration
10
10
30
5
15
10
10
10
7
10
10
74
15
60
65 (e)
65 (e)
35
65
74
74
74
74
74
74
74
74
15
74
10
34
NORMALIZATIONS:
2550eV open
2550eV slit
2900eV slit
2200eV slit
2200-2900eV slit
Lower sample
2550eV symmetricanglescan,aligncorr. open
2550eV symmetricanglescan,verification slit
2900eV symmetricanglescan,verification slit
2200eV symmetricanglescan,verification slitENERGYSCANS:
2200-2900eV 51.865' slit
2200-2900eV 41.746' slit
2200-2900eV 36.850' slit
2200-2900eV 27.382' slit
2200-2900eV 65.0' slit
2200-2900eV 85.0' slit
2200-2900eV 21.0' slit
2200-2900eV 15.0' slit
Lift sample
Repeatnormscan2200-2900eV slitRockcurve3400eV
Lift tabletrackingreset3400eVNORMALIZATIONS:
2800eV slit
2909eV slit
3174eV open3174eV slit
4000eV slit
2800-4000eV slit
Lower sample
3174eV symmetricanglescan,aligncorr. open
3174eV symmetricanglescan,verification slit
15
15
15
15
144
144
144
144
144
144
144
144
144
144
15
15
15
15
15
152
7
10
10
10
65
15
60
65 (e)
65 (e)
65 (e)
65
65
65
65
65
65
65
65
15
65
15
10
10
10
7
10
10
69
15
60
65 (e)
35
4000eV symmetricanglescan
2909eV anglescan
2800eV symmetricanglescanENERGY SCANS:
2800-4000eV 51.865'
2800-4000eV 41.746'
2800-4000eV 36.850'
2800-4000eV 27.382'
2800-4000eV 65.0'
2800-4000eV 85.0'
2800-4000eV 21.0'
2800-4000eV 15.0'
Lift sample
Repeatnormscan2200-2900eVRockcurve5000eV
Lift tabletrackingreset5000eVNORMALIZATIONS:
5000eV
5000eV
6200eV
3900eV
3900-6200eV
Lower sample
5000eV symmetricanglescan,aligncorr.
5000eV symmetricverification
6200eV symmetricanglescan
3900eV symmetricanglescanENERGYSCANS:
3900-6200eV 51.865'
3900-6200eV 41.746'
3900-6200eV 36.850'
3900-6200eV 27.382'
3900-6200eV 65.0'
3900-6200eV 85.0'
slit
slit
slit
slit
slit
slit
slit
slit
slit
slit
slit
slit
openslit
slit
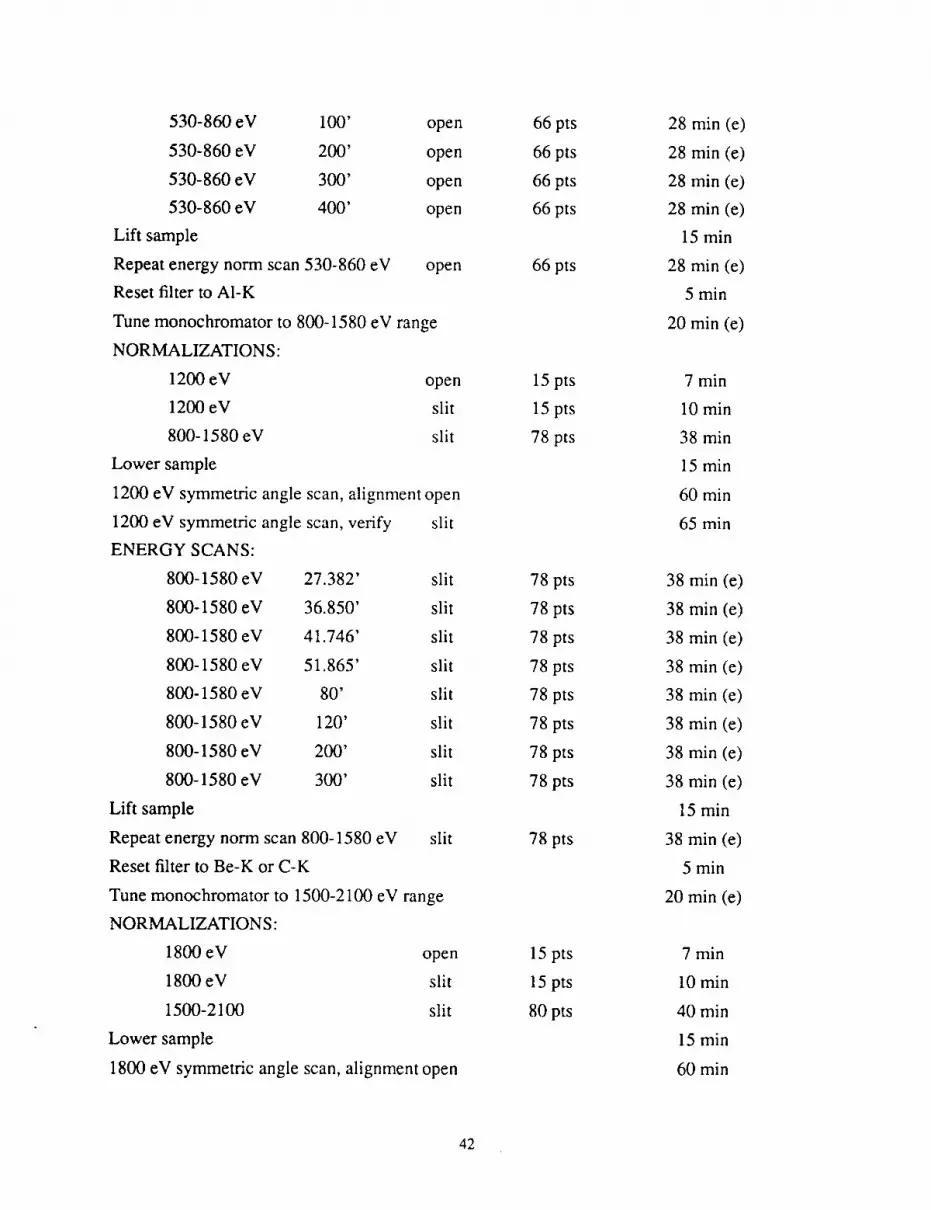
slit
slit
openslit
slit
slit
slit
slit
slit
slit
slit
slit
152
152
152
152
152
152
152
152
152
15
15
15
15
93
93
93
93
93
93
93
65 (e)
35
65 (e)
69
69
69
69
69
69
69
69
15
69
15
10
7
10
10
10
44
15
60
65 (e)
65 (e)
65 (e)
44
44
44
44
44
44
36
3900-6200 eV 21.0'
3900- 6200 eV 15.0'
Lift sample
Repeat norm scan 2200-2900 eV
Vent interchange chamber
Repack sample
slit
slit
slit
93
93
93
44
44
15
44
20
10
Compiled total
+ 15% operator overhead
Subtotal
+ 25% overhead due to storage ring
Total time per fiat
Total days per flat
4,068.0
+ 610.2
4678.2
+ 1169.6
5847.8
4.06d
37
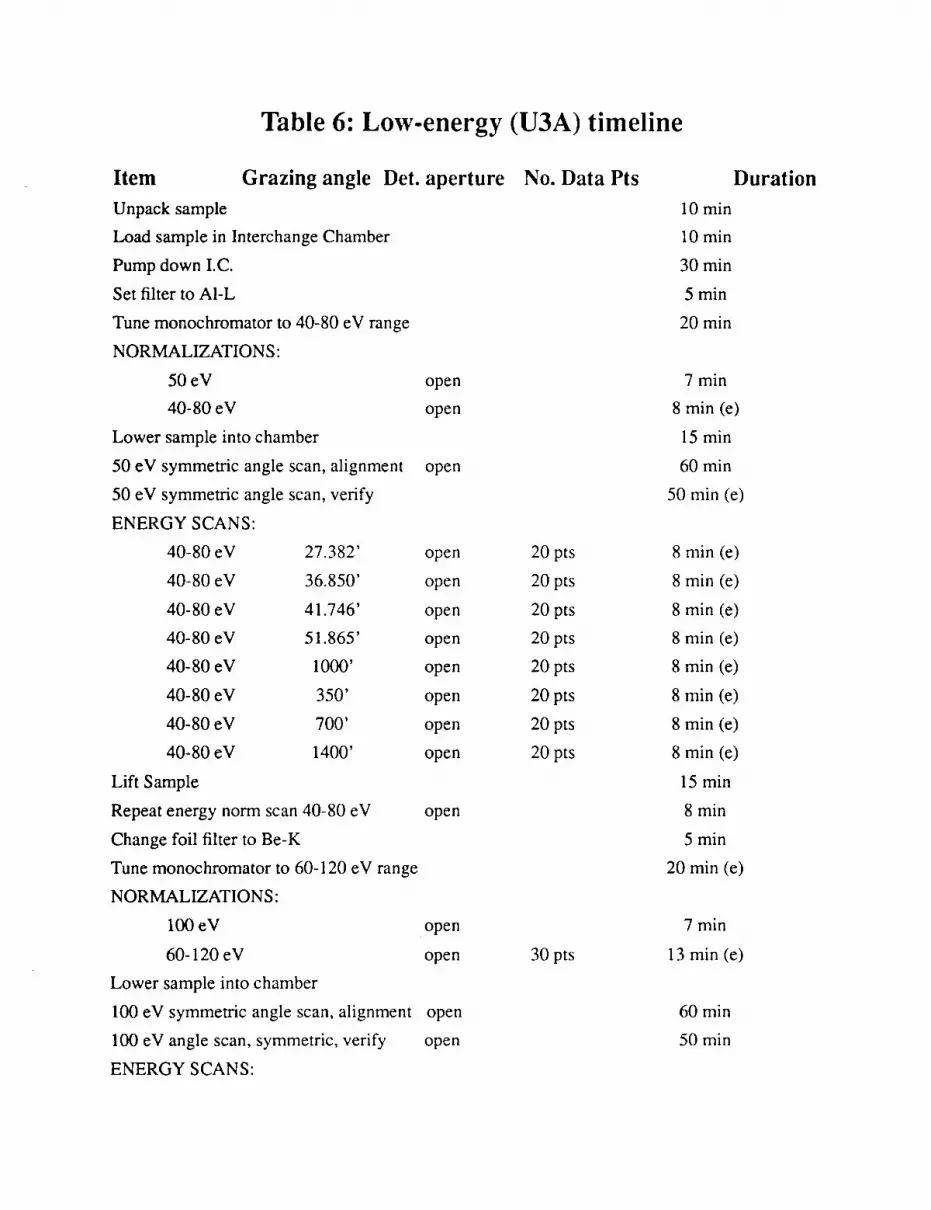
Table 6: Low-energy (U3A) timeline
Item
Unpack sample
Load sample in Interchange Chamber
Pump down I.C.
Set filter to AI-L
Tune monochromator to 40-80 eV range
NORMALIZATIONS:
50 eV
40-80 eV
Lower sample into chamber
50 eV symmetric angle scan, alignment
50 eV symmetric angle scan, verify
Grazing angle Det. aperture
open
open
open
No. Data Pts
7 min
8 min (e)
15 min
60 min
50 min (e)
Duration
10 min
10 min
30 min
5 min
20 min
ENERGY SCANS:
40-80 eV 27.382' open 20 pts 8 min (e)
40-80 eV 36.850' open 20 pts 8 min (e)
40-80 eV 41.746' open 20 pts 8 min (e)
40-80 eV 51.865' open 20 pts 8 min (e)
40-80 eV 1000' open 20 pts 8 min (e)
40-80 eV 350' open 20 pts 8 min (e)
40-80 eV 700' open 20 pts 8 min (e)
40-80 eV 1400' open 20 pts 8 min (e)
Lift Sample 15 min
Repeat energy norm scan 40-80 eV open 8 min
Change foil filter to Be-K 5 min
Tune monochromator to 60-120 eV range 20 min (e)
NORMALIZATIONS:
100 eV open 7 min
60-120 eV open 30 pts 13 min (e)
Lower sample into chamber
100 eV symmetric angle scan, alignment open 60 rain
100 eV angle scan, symmetric, verify open 50 min
ENERGY SCANS:
60-120eV 27.382' open 30pts
60-120eV 36.850' open 30pts
60-120eV 41.746' open 30pts
60-120eV 51.865' open 30pts
60-120eV 350' open 30pts
60-120eV 700' open 30pts
60-120eV 1000' open 30pts
60-120eV 1400' open 30pts
Lift Sample
Repeatenergynormscan50-120eV open 30Resetfilter to B-K
Tunemonochromatorto 100-196eVrangeNORMALIZATIONS:
150eV open 15pts
100-196eV open 48pts
Lower sample
150eV symmetricanglescan,alignment open
150eV symmetricanglescan,verify openENERGYSCANS:
100-196eV 27.382' open 48pts
100-196eV 36.850' open 48pts
100-196eV 41.746' open 48pts
100-196eV 51.865' open 48pts
100-196eV 250' open 48pts
100-196eV 500' open 48pts
100-196eV 750' open 48pts
100-196eV 1000' open 48pts
Lift sample
Repeatenergynormscan100-196eV open 48ptsResetfilter to C-K
Tunemonochromatorto 175-295eV range
NORMALIZATION S:
220eV open 15pts
175-295eV slit 60pts
13min (e)
13min (e)
13min (e)
13min (e)
13min (e)
13min (e)
13min (e)
13min (e)
15min
13min
5 min
20min (e)
7 min
20min (e)15min
60min
50min
20 min (e)
20 min (e)
20min (e)
20 min (e)
20min (e)
20 min (e)
20min (e)
20 min (e)
15min
20min (e)5 min
20min (e)
7 min
25 min (e)
39
Lower thesample
220 eV Symmetric
220eV symmetricverificationENERGY SCANS:
anglescan,alignmentcorrectionopen
open
175-295eV 27.382' open 60pts
175-295eV 36.850' open 60pts
175-295eV 41.746' open 60pts
175-295eV 51.865' open 60pts
175-295eV 600' open 60pts
175-295eV 120' open 60pts
175-295eV 240' open 60pts
175-295eV 480' open 60pts
Lift sample
Repeatenergynormscan175-295eV open 60ptsResetfilter to Ti-L
Tunemonochromatorto 250-470eV rangeNORMALIZATIONS:
284.2eV slit 15pts
350eV open 15pts
250-470eV slit 80pts
Lower thesample
350eV symmetric/alignmentanglescan open350eV verification
284.2eV anglescan slit 60ptsENERGY SCANS:
250-470eV 27.382' open 80pts
250-470eV 36.850' open 80pts
250-470eV 41.746' open 80pts
250-470eV 51.865' open 80pts
250-470eV 80' open 80pts
250-470eV 120' open 80pts
250-470eV 240' open 80pts
250-470eV 480' open 80pts
Lift sample
15min
60 min
50 min
25min (e)
25min (e)
25min (e)
25min (e)
25min (e)
25min (e)
25min (e)
25min (e)
15min
25min (e)5 min
20 rain (e)
10 mill
7 mm
34 mm
15 mm
60 mm
50 mm
25 mm
34 min (e)
34 min (e)
34 min (e)
34 min (e)
34 min (e)
34 min (e)
34 min (e)
34 min (e)
15 min
4O
Repeatenergynormscan250-470eV openResetfilter to Cr-L
Tunemonochromatorto 430-580eVrangeNORMALIZATIONS:
500eV open
430-580eV open
Lower sample
500eV symmetricanglescan,alignment open
500eV symmetricanglescan,verificationopen
80pts
15pts
35pts
543.1eV anglescan openENERGYSCANS:
430-580eV 27.382' open 35pts
430-580eV 36.850' open 35pts
430-580eV 41.746' open 35pts
430-580eV 51.865' open 35pts
430-580eV 100' open 35pts
430-580eV 200' open 35pts
430-580eV 300' open 35pts
430-580eV 400' open 35pts
Lift sample
Repeatenergynormscan430-580eV open 35ptsResetfilter to Ni-L
Tunemonochromatorto 530-860eV rangeNORMALIZATIONS:
700eV open 15pts
530- 860eV open 66pts
Lower sample
700 eV symmetricanglescan,alignment open
700 eV symmetricverification openENERGY SCANS:
530-860eV 27.382' open
530-680eV 36.850' open
530-860eV 41.746' open
530-860eV 51.865' open
66pts
66pts
66pts
66pts
34 min (e)
5min
20min (e)
7 min
15min
15min
60min
50min
25 min
15min (e)
15min (e)
15rain (e)
15min (e)
15min (e)
15min (e)
15min (e)
15min (e)
15min
15min(e)
5 min
20min (e)
7 min
28min
15min
60min
50min
28min (e)
28min (e)
28min (e)
28min (e)
41
530-860 eV 100' open
530-860 eV 200' open
530-860 eV 300' open
530-860 eV 400' open
Lift sample
Repeat energy norm scan 530-860 eV open
Reset filter to A1-K
Tune monochromator to 800-1580 eV range
NORMALIZATIONS:
1200 eV open
1200 eV slit
800-1580 eV slit
Lower sample
1200 eV symmetric angle scan, alignment open
1200 eV symmetric angle scan, verify slit
66 pts
66 pts
66 pts
66 pts
66 pts
15 pts
15 pts
78 pts
ENERGY SCANS:
800-1580 eV 27.382' slit 78 pts
800-1580 eV 36.850' slit 78 pts
800-1580 eV 41.746' slit 78 pts
800-1580 eV 51.865' slit 78 pts
800-1580 eV 80' slit 78 pts
800-1580 eV 120' slit 78 pts
800-1580 eV 200' slit 78 pts
800-1580 eV 300' slit 78 pts
Lift sample
Repeat energy norm scan 800-1580 eV slit 78 pts
Reset filter to Be-K or C-K
Tune monochromator to 1500-2100 eV range
NORMALIZATION S:
1800 eV open 15 pts
1800 eV slit 15 pts
1500-2100 slit 80 pts
Lower sample
1800 eV symmetric angle scan, alignment open
28 min (e)
28 min (e)
28 min (e)
28 min (e)
15 min
28 min (e)
5 min
20 min (e)
7 mln
10 mm
38 mln
15 mm
60 mm
65 mm
38 min (e)
38 min (e)
38 min (e)
38 rain (e)
38 min (e)
38 min (e)
38 min (e)
38 min (e)
15 min
38 min (e)
5 min
20 min (e)
7 min
10 min
40 min
15 min
60 min
42
1800eV symmetricanglescan,verify
ENERGYSCANS:
1500-2100eV 27.382'
1500-2100eV 36.850'
1500-2100eV 41.746'
1500-2100eV 51.865'
1500-2100eV 80'
1500-2100eV 100'
1500-2100eV 130'
1500-2100eV 160'
Lift sample
Repeatenergynormscan1500-2100eV
Ventinterchangechamber
Repacksample
slit 65min
slit 80pts 40min (e)
slit 80pts 40min (e)
slit 80pts 40min (e)
slit 80pts 40min (e)
slit 80pts 40min (e)
slit 80pts 40min (e)
slit 80pts 40min (e)
slit 80pts 40min (e)15min
slit 80pts 40min (e)20min
10min
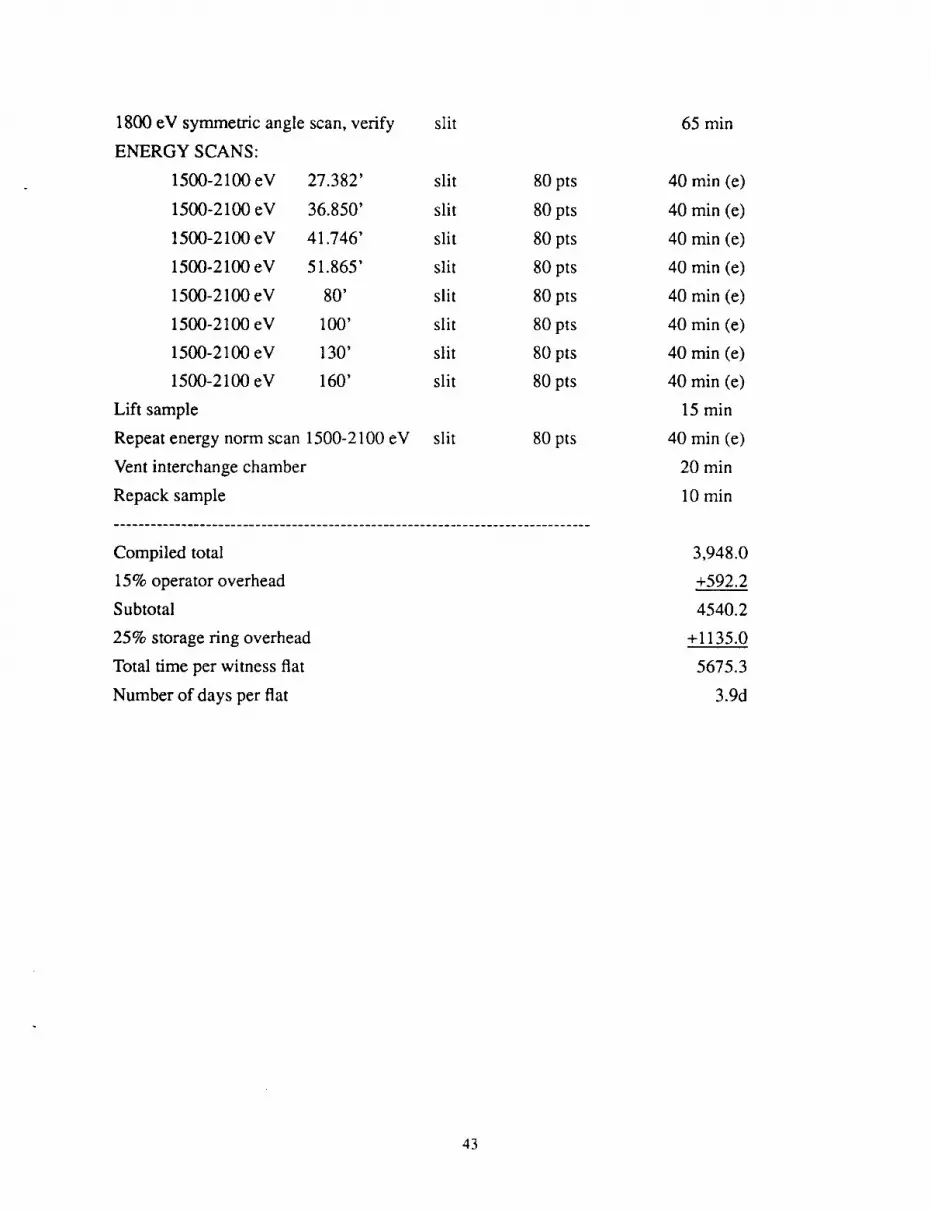
Compiledtotal
15%operatoroverheadSubtotal
25%storagering overhead
Total timeperwitnessfiat
Numberof daysper flat
3,948.0
+592.2
4540.2
+1135.0
5675.3
3.9d
43
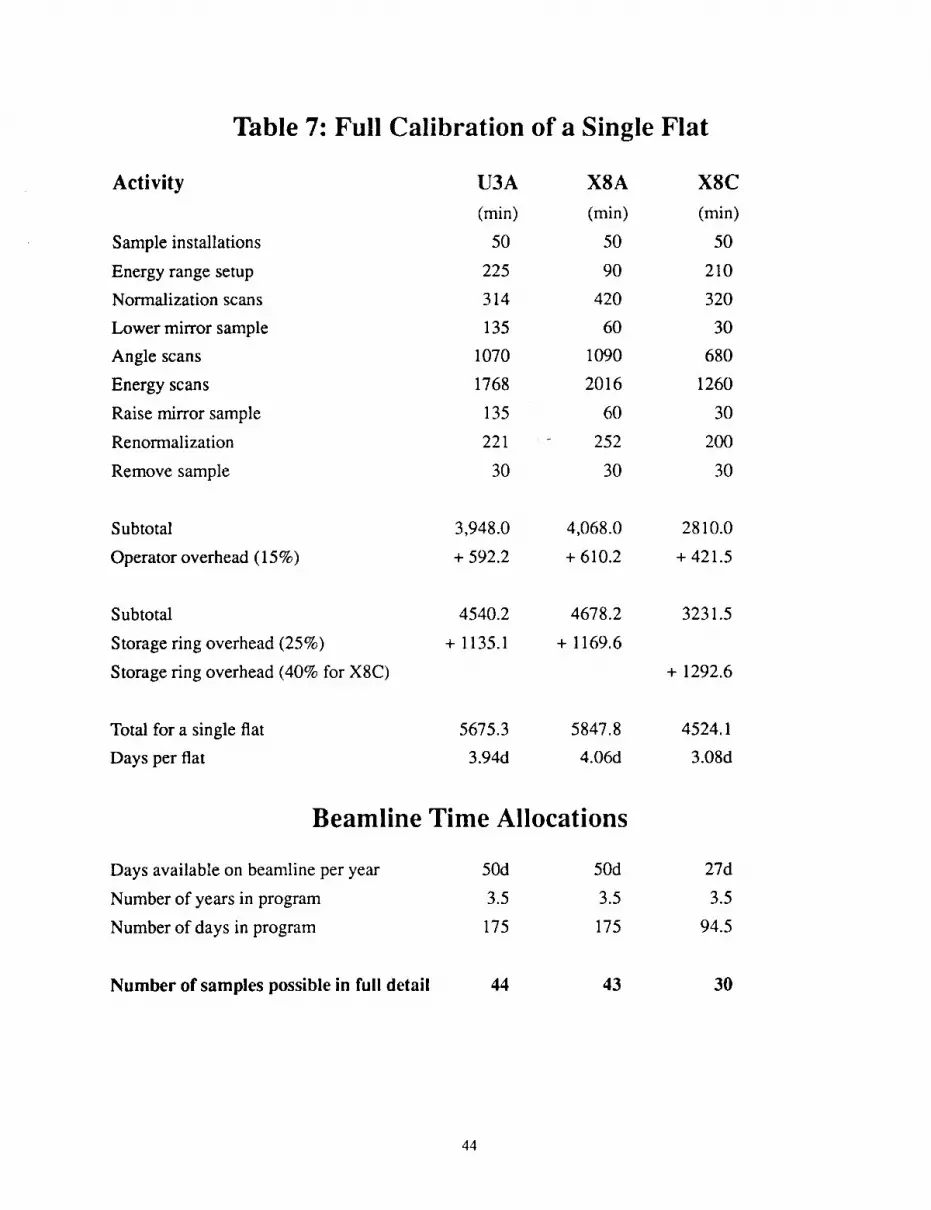
Table 7: Full Calibration of a Single Flat
Activity
Sample installations
Energy range setup
Normalization scans
Lower mirror sample
Angle scans
Energy scans
Raise mirror sample
Renormalization
Remove sample
U3A X8A X8C
(min) (min) (min)
50 50 50
225 90 210
314 420 320
135 60 30
1070 1090 680
1768 2016 1260
135 60 30
221 - 252 200
30 30 30
Subtotal
Operator overhead (15%)
3,948.0 4,068.0 2810.0
+ 592.2 + 610.2 + 421.5
Subtotal
Storage ring overhead (25%)
Storage ring overhead (40% for X8C)
4540.2 4678.2
+ 1135.1 + 1169.6
3231.5
+ 1292.6
Total for a single flat
Days per flat
5675.3 5847.8 4524.1
3.94d 4.06d 3.08d
Beamline Time Allocations
Days available on beamline per year
Number of years in program
Number of days in program
50d 50d 27d
3.5 3.5 3.5
175 175 94.5
Number of samples possible in full detail 44 43 30
44