performance of wick irrigation system using self-compensating benches with substrates for lettuce...
TRANSCRIPT

Performance of wick irrigation system using self-compensating troughs with substrates
for lettuce production
Rhuanito Soranz Ferrarezi* and Roberto Testezlaf
School of Agricultural Engineering, University of Campinas, Campinas, São Paulo, Brazil.
We thank Dr. Flávio Bussmeyer Arruda, Antonio Carlos Ferreira Filho, Maurício Madoglio
Sultani, Renato Traldi Salgado and Vicente Dias Martarello for technical collaboration, Dr.
Marc van Iersel for review of the manuscript and constructive criticism, the School of
Agricultural Engineering for donating the material for the assembly of the experimental plots,
the Hidrogood Horticultura Moderna Company for donating the self-compensating troughs,
and the National Council of Technological and Scientific Development (Ministry of Science
and Technology, Brazil) for a PhD scholarship to the first author. Funding for this research
was provided through the PRP/FAEPEX/UNICAMP (award no 261/10).
The authors declare that the mention of a trademark, proprietary product, or vendor does not
constitute a guarantee or warranty of the product and does not imply its approval to the
exclusion of other products or vendors that might also be suitable.
* Address correspondence to: 501 Cândido Rondon Avenue, 13083-875, Campinas, São
Paulo, Brazil. Email address: [email protected]
Performance of wick irrigation system using self-compensating troughs with substrates 1
for lettuce production 2
3
Abstract 4
Subirrigation systems in which water and nutrients are supplied to the substrate through wick 5
strips for upward nutrient solution (NS) movement can be a feasible alternative to improve 6
lettuce quality with low environmental pollution, enabling production with reduced labor and 7
electricity or in regions with high air temperature. The objective of this study was to compare 8
the performance of two wick irrigation system using self-compensating troughs filled with 9
either pine bark (WPB) or coconut coir (WCC) with nutrient film technique (NFT) 10
hydroponic system for greenhouse lettuce production. The daily monitoring of electrical 11
conductivity (EC) and pH allowed the management according to the recommended values for 12
optimal lettuce growth. The EC showed variation among troughs and salt accumulation in 13
substrates, with WPB exhibiting two-fold greater EC than WCC (ranging from 0.95 to 7.57 14
and from 0.68 to 3.67 dS∙m-1, respectively), while the pH values were stable over time. WCC 15
promoted greater root length and shoot diameter, while WPB produced shorter plants 16
compared to the other two treatments. NFT resulted in an 83% lower leaf area and 44% lower 17
root volume than WPB and WCC. The fresh and dry shoot masses with NFT were 58% and 18
24% lower than with WPB and WCC, respectively. The fresh root mass was also reduced in 19
NFT plants, which was 67% smaller than WCC and 59% smaller than WPB. Root dry mass 20
of NFT was 35% lower than the average of WPB and WCC. NO3-N, NH4-N, P, K, Ca, Mg, 21
S, B, Cu, Fe, Mn and Zn concentration in plant shoot and root at the end of the experiment as 22
well as the same nutrients, chloride, sodium and bicarbonate concentrations in substrate and 23
NS determined weekly differed among the treatments (P < 0.01). The EC and nutrient 24
concentration in the substrates increased over time. The wick irrigation system had higher 25
Page 2 of 24
productivity with both substrates than NFT, with higher yield and plant quality in WCC, 26
indicating its feasibility as an alternative greenhouse lettuce production system. However, 27
due to the salinity buildup, water and nutrition management needs to be optimized for self-28
compensating troughs to avoid an increase in substrate EC over time. 29
Keywords. Subirrigation, Hydroponics, Nutrient concentration, Lactuca sativa L. ‘Vanda’, 30
Greenhouse, NFT. 31
32
Introduction 33
Lettuce (Lactuca sativa L.) is the most consumed salad vegetable in Brazil (Santos et 34
al., 2010), representing 50% of all leafy vegetables commercialized in the food supply 35
distribution centers in the country (Moretti and Mattos, 2008). Currently, lettuce is grown 36
both in soil and hydroponic systems. In soil, the cultivation occurs in raised beds, where 37
plants are subjected to weather changes, which can result in plant yield and quality reduction 38
(Feltrim et al., 2009). Furthermore, consecutive years of crop production promotes the 39
contamination of soil and groundwater with nutrients and pesticides. The most used 40
hydroponics system in lettuce production is the nutrient film technique or NFT (Cometti et 41
al., 2008 and Feltrim et al., 2009). 42
NFT hydroponics promotes higher efficient use of greenhouse area and higher yield 43
(Santos et al., 2010), with better crop quality (Lopes et al., 2007 and Santos et al., 2010) and 44
shortened crop cycles due to better environmental control (Martins et al., 2009 and Santos et 45
al., 2010), allowing year-round cultivation and harvesting (Helbel Junior et al., 2008). The 46
advantages also include higher water and fertilizer use efficiency, with the possibility of NS 47
reuse, resulting in environmental preservation by reducing fertilizer and pesticide deposits in 48
soils and groundwater contamination (Martins et al., 2009 and Santos et al., 2010), and 49
reduced labor during crop production (Martins et al., 2009). However, hydroponics presents 50
Page 3 of 24
challenges for growers, as dependence on electric power for NS circulation and aeration, with 51
the risk of losing the entire production if a prolonged power outage occurs (Silva et al., 52
2005), and difficulty of adoption in regions with high air temperature due to high temperature 53
of the NS, which complicates plant establishment and management (Alberoni, 1998). The 54
requirement of technical knowledge and permanent technical support and the possibility of 55
pathogen dissemination due to NS recirculation are also major concerns (Resh, 2002). 56
To improve crop quality and reduce environmental pollution, new production systems 57
are being developed to enable lettuce cultivation with limited manpower and electricity, or in 58
regions with high air temperature. Subirrigation systems, in which water and nutrients are 59
supplied to the substrate through capillary action (Caron et al., 2005) and hydraulic 60
redistribution (Prieto et al., 2012) can be viable alternatives. 61
A wick irrigation system operates in a closed cycle, without runoff, permitting 62
appropriate plant nutrition and creating alternatives to improve production uniformity. These 63
systems show major advantages: 1) independence of electricity for operation (Andriolo et al., 64
2004); 2) high water and nutrient use efficiency (Son et al., 2006); 3) less need for 65
manpower, as the management is simplified compared with conventional cultivation, 66
providing cost reduction (Andriolo et al., 2004); 4) increase in the uniformity and quality of 67
production (Oh and Son, 2008); 5) water use savings (Laviola et al., 2007); and 6) 68
temperature control of the root system (Laviola et al., 2007). Wick irrigation systems can be 69
used for the cultivation of ornamental plants, such as chrysanthemums and poinsettias (Kang 70
et al., 2009), kalanchoe (Lee et al., 2010) and cyclamen (Oh and Son, 2008). Ferrarezi et al. 71
(2012) suggested that wick irrigation systems might be used in the production of vegetables 72
or condiment and aromatic plants. 73
Several studies using the wick irrigation system were performed with different 74
equipment for many crops and environmental conditions. The results from these studies 75
Page 4 of 24
revealed the optimum wick width and suitable water depth for wick contact (Kang et al., 76
2009), the wick length to improve water distribution (Lee et al., 2010 and Son et al., 2001), 77
the possibility of covering the substrate surface to reduce evaporation (Son et al., 2006), the 78
suitable size of the growing container (Lee et al., 2010), the substrate composition for 79
satisfactory root wetting and moisture maintenance (Lee et al., 2010 and Oh et al., 2007), the 80
possibility of disease incidence and spread (Lee et al., 2010 and Oh and Son, 2008), and 81
efficiency equipment use (Laviola et al., 2007). 82
At the present time, the Brazilian market only has one commercial wick system 83
available, called self-compensating troughs. This wick irrigation system was evaluated by 84
Ferrarezi et al. (2012), showing that the equipment had some imperfections in the lower 85
reservoir for NS storage, determining significant differences among the water depth, time and 86
filling volume, and uniformity of water distribution (UWD) in two commercial substrate 87
(pine bark and coconut coir, same systems used at this experiment). They found higher 88
moisture and UWD in pine bark. According to Andriolo et al. (2004), the use of substrates 89
allowed the reduction of approximately 92.4% of pump operation time compared with NFT, 90
simplifying both fertigation management and NS control. However, studies evaluating the 91
performance of the wick irrigation system for lettuce production using different substrates for 92
cultivation in Brazil remain scarce. The hypothesis of this research is that wick irrigation 93
system promotes higher lettuce production compared to NFT in greenhouses. 94
Thus, the objective of this study was to compare the performance of two wick 95
irrigation system using self-compensating troughs filled with either pine bark or coconut coir 96
with NFT for lettuce production in a greenhouse. This technical information can support 97
decision-making situations when wick or NFT systems are appropriate. 98
99
Material and Methods 100
Page 5 of 24
Location. The experiment was performed at the School of Agricultural Engineering 101
(FEAGRI), University of Campinas (UNICAMP), in Campinas, SP, Brazil, from June 22 to 102
July 20, 2010. Experimental plots were assembled in a Venlo-type greenhouse, covered with 103
150 μm-thick agricultural polyethylene film, with 18.2 x 6.4 x 3 m (length x wide x ceiling), 104
without roof vents, with a frontal and side 0.87 x 0.30 mm anti-aphid screen and a 40-cm 105
masonry bottom. 106
107
Plant material. Seedlings of lettuce ‘Vanda’ (Sakata Seeds, Bragança Paulista, SP, Brazil) 108
grown in Styrofoam trays with coconut coir substrate for 28 days were purchased from a 109
nursery (Selma Mudas, Bragança Paulista, SP, Brazil), and transplanted into the experimental 110
plots on June 18, 2010, and irrigated daily to ensure proper plant rooting. 111
112
Water and NS. Water was from the municipal system and had the following chemical 113
characteristics: pH = 7.1, EC = 0.2 dS∙m-1 and nutrients (mg∙L-1): NO3-N = 2.3, NH4-N = 0.4, 114
P = 1.5, K = 14.8, Ca = 13, Mg = 2.1, S = 1.7, B = 0.1, Cu = <0.01, Fe = 0.1, Mn = 0.02, Zn 115
= 0.01, chloride = 23.4, sodium = 12.3 and bicarbonate = 100.4. 116
The NS used throughout the experimental period was prepared using 3 mL∙L-1 of 117
FloriSol Veg (Conplant Ferti, Campinas, SP, Brazil) and 0.3 g∙L-1 of magnesium sulfate 118
(Produquímica, Suzano, SP, Brazil), with pH = 4.24, EC = 1.8 dS∙m-1 and the nutrient 119
concentrations (mg∙L-1): total-N = 198 (NO3-N = 174 and NH4-N = 24), P = 31, K = 187, Ca 120
= 143, Mg = 60, S = 36, B = 0.5, Cu = 0.5, Fe = 1.8, Mn = 0.5, Mo = 0.1, Ni = 0.1 and Zn = 121
0.2. The pH was kept between 5.5 to 6.5 using H3PO4 or KOH 1 N solution to maintain the 122
chelates in a stable form (Ferrarezi et al., 2007), with the daily replenishment criteria of 123
Furlani et al. (1999) and weekly replacement to avoid nutrient concentration fluctuations. 124
125
Page 6 of 24
Treatments and substrates. We evaluated three treatments: a wick irrigation system with 126
coconut coir substrate (WCC), a wick irrigation system with pine bark substrate (WPB), and 127
a nutrient film technique hydroponics system (NFT). The substrates used were coconut coir 128
Golden Grain Mix (Amafibra, Ananindeua, PA, Brazil) and pine bark Citrus 9 (Mec Plant, 129
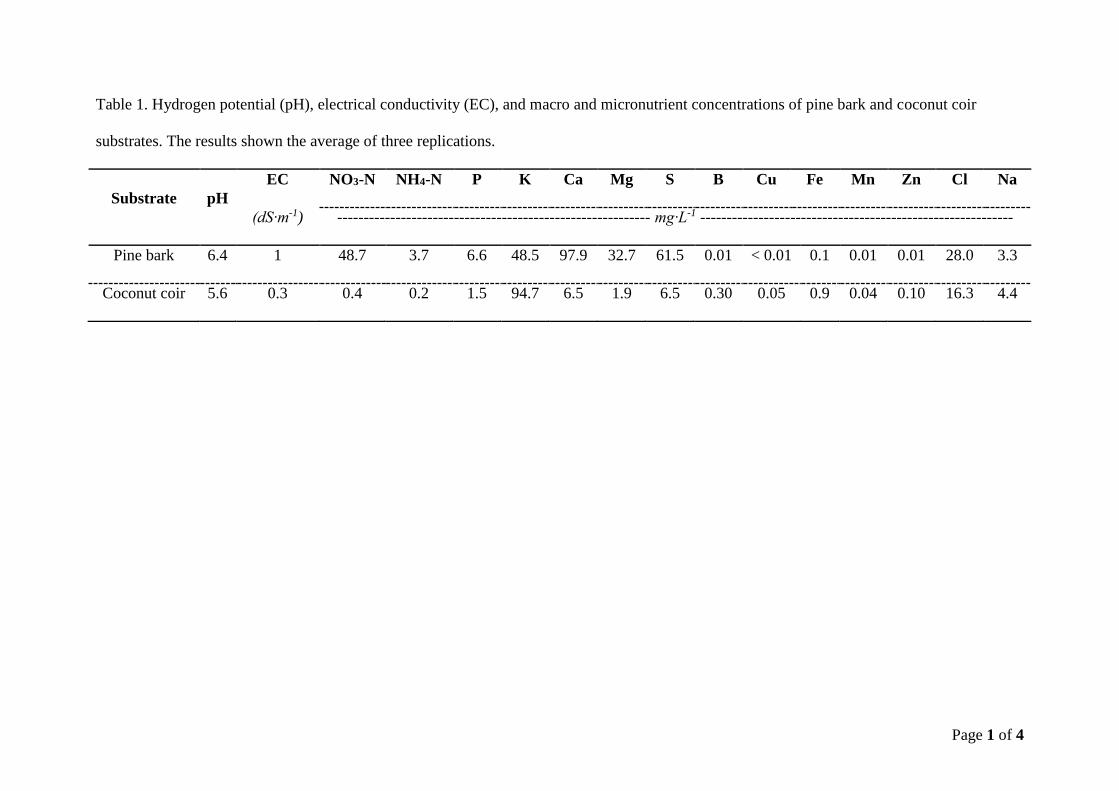
Telêmaco Borba, PR, Brazil). Both substrates were analyzed prior to transplanting for macro 130
and micronutrient determination at the Substrate Analysis Laboratory (Instituto Agronômico 131
de Campinas, Campinas, SP, Brazil) using Sonneveld and van Elderen (1994) extraction 132
method (Table 1). 133
134
Wick irrigation system. The troughs for wick irrigation were made out of polypropylene and 135
were resistant to chemical action. The equipment consisted of two compartments: a lower 136
reservoir for NS storage (bottom) and a substrate deposition chamber (top), which were 137
interconnected by a wick strip of synthetic non-woven mat (SNWM) (Figure 1). This wick 138
conducted NS from the bottom to the top compartment, moistening the substrate and 139
supplying water and minerals to plants (Ferrarezi et al., 2012). 140
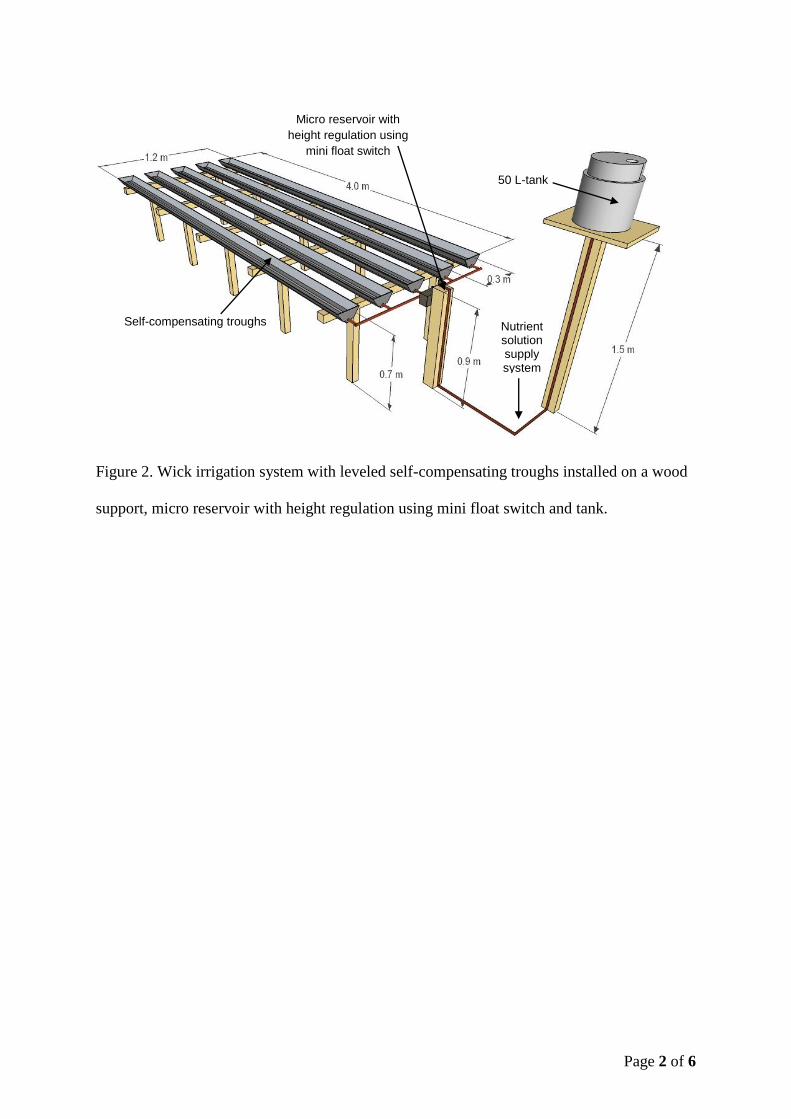
The complete wick irrigation system consisted of a 50 L-tank (Puma Tambores, 141
Piracicaba, SP, Brazil), 32 mm water supply hose (Tramontina, Recife, PE, Brazil), 2 L-142
micro reservoir and five self-compensating troughs (Hidrogood Horticultura Moderna, 143
Taboão da Serra, SP, Brazil) per experimental plot (Figure 2). These 0.175 x 4.0 x 0.7 m 144
(width x length x height) troughs were recommended for leafy vegetables production and had 145
a 26-L capacity in the substrate deposition chamber and 9-L in the lower reservoir for NS 146
storage. The micro reservoir had a mini float that regulated the solution flow from the tank 147
connected to the lower reservoir through polyvinyl chloride (PVC) pipes. The system supply 148
with NS was mediated by gravity, requiring leveled installation of troughs and micro 149
reservoir. As the plant absorbed water and nutrients from the substrate, the wick 150
Page 7 of 24
automatically replenished the solution. Thus, the plant regulated the solution flow to the 151
substrate by the difference in total potential and capillary action, without requiring automated 152
controls, pumps, emitters, etc (Ferrarezi et al., 2012). One plot with five troughs was 153
assembled for each wick treatment tested (one with coconut coir and another with pine bark 154
substrate). The countertop was 1.2 x 4.0 m (width x length) and completely leveled. The 155
seedlings were spaced every 0.25 m, totaling 15-16 plants per trough. 156
157
NFT hydroponic system. The NFT system was composed of an underground 250 L-tank 158
(Acqualimp, Valinhos, SP, Brazil), an 0.85 HP irrigation pump (Hydrobloc C800T, KSB, 159
Várzea Paulista, SP, Brazil), timer (MT-2001, Didziel, São Paulo, SP, Brazil), 32 mm-water 160
supply pipe (Tigre, Joinville, SC, Brazil), five 90 mm x 4 m (width x length) trapezoidal 161
hydroponic channels (Hidrogood Horticultura Moderna, Taboão da Serra, SP, Brazil) and 75 162
mm-drain pipe (Tigre, Joinville, SC, Brazil). The countertop was 1.2 x 4.0 m (width x 163
length), with a 6% slope to allow NS return to the tank and a 1 L∙min-1 flow rate per channel, 164
both recommended by Furlani et al. (1999) for Brazilian conditions. The seedlings were 165
spaced every 0.25 m, totaling 15-16 plants per channel. During the first 10 days of the 166
experiment, a timer activated the pump for 5 min at 15-min intervals from 7 am to 5 pm due 167
to the small plant size. From day after transplant (DAT) 11 until the end of the experiment, 168
the pump was turned on continuously from 7 am until 5 pm because lettuce grown in high 169
temperature regions require a continuous supply of NS (Graves, 1983 and Graves and Hurd, 170
1983) or intervals of up to 5 min to promote adequate plant watering and nutrition (Zanella et 171
al., 2008). From 5 pm to 7 am, the system was irrigated for 5 min every 2 h. 172
173
Parameters evaluated. The temperature and relative humidity inside the greenhouse were 174
monitored every 5 min using a digital thermo-hygrometer (HT-4000, ICEL, Manaus, AM, 175

Page 8 of 24
Brazil) mounted at the same height as the self-compensating troughs (0.7 m above the soil 176
surface). All recordings throughout the experimental period were stored in a data logger. 177
The EC and pH in the substrates and in the NS from NFT and wick tanks were daily 178
monitored. For the substrates, we used an adaptation of the 1:1.5 Dutch extraction method 179
from Sonneveld and van Elderen (1994): removal of 100 mL sample from each substrate, 180
addition of 150 mL of tap water, stirring for 30 minutes and standing for 30 minutes. For the 181
tanks NS analyses, a sample from the NFT treatment was withdrawn from each channel, and 182
a sample from each wick irrigation system was directly collected from each tank. The 183
solutions were then transferred to individual test tubes, and EC and pH readings were taken 184
(DM-31 conductivity meter and a DM-21 pH meter, Digimed, São Paulo, SP, Brazil). When 185
the substrate EC reached values higher than double recommended for lettuce production, 186
equals to 4 dS∙m-1 in the average of the three troughs, we added only tap water in the WPB 187
and WCC tanks or leached all the substrate in the troughs with tap water, to avoid plant 188
damage caused by salt excess. Tap water applications to replace NS occurred on DAT 7, 10 189
and 14 in WPB and day 14 in WCC. Substrate leaching was performed on DAT 9 and 12 190
only in WPB. 191
The biometric parameters – root length, shoot diameter and height, root volume 192
(determined through water volume displacement in a graduated cylinder, according to 193
Sant’ana et al., 2003), number of leaves, and leaf area of all experimental plants (determined 194
using a Li-Cor 3100 leaf area meter, from Li-Cor, Lincoln, Nebraska, USA) – were taken at 195
DAT 28. The plants were then separated into shoots (leaves + stems) and roots for shoot 196
(SFM) and root (RFM) fresh mass determination. This material was dried in an 85 °C oven 197
with forced circulation (MA 037, Marconi Equipamentos de Laboratório Ltda, Piracicaba, 198
SP, Brazil) to obtain shoot (SDM) and root (RDM) dry mass. The plant yield based on fresh 199
Page 9 of 24
and dry mass was expressed per unit area. The leaf water content was calculated as [(SFM - 200
SDM) / SFM] x 100%. 201
Chemical analysis of N, P, K, Ca, Mg, S, B, Cu, Fe, Mn and Zn were performed at 202
harvest in shoot and root, substrate and NS samples at the Soil, Plant and Substrate Analysis 203
Laboratory (Instituto Agronômico de Campinas, Campinas, SP, Brazil). For shoot and root 204
we used the method described by Bataglia et al. (1983) in three plants per replication from 205
the same samples used for the fresh and dry mass determination. For substrate we used the N 206
steam distillation method indicated by Cantarella and Trivelin (2001) and inductively coupled 207
plasma optical emission spectrometry (ICP-OES) for the other nutrients. Three substrate 208
samples per replication were collected weekly, with solution extraction being performed 209
according to the 1:1.5 Dutch method (Sonneveld and van Elderen, 1994). We used the same 210
method for NS, plus chloride determination by ion-selective electrode, sodium using 211
photometry, and bicarbonate through potentiometric titration, in samples collected weekly 212
after water replenishment and before the weekly replacement. 213
214
Experimental design and statistical analysis. The experimental design was a completely 215
randomized block, with three treatments and three replications. Twelve plants were harvested 216
from the center three troughs/channels for the biometric analysis, totaling 36 plants per 217
treatment. All results were tested using the Shapiro-Wilk normality test and transformed 218
adequately when necessary. The biometric parameters, plant yield, shoot:root ratio, leaf water 219
content and tissue nutrient concentration data (shoot and root) were subjected to analysis of 220
variance and Tukey’s mean separation (SAS 9.2, SAS Institute, Cary, NC). Over time 221
changes in nutrient concentration in the NS and substrates were analyzed by regression 222
models (Sigma Plot 11, Jandel Scientific, Corte Madera, CA). The results were considered 223
significant when P < 0.05. 224
Page 10 of 24
225
Results and Discussion 226
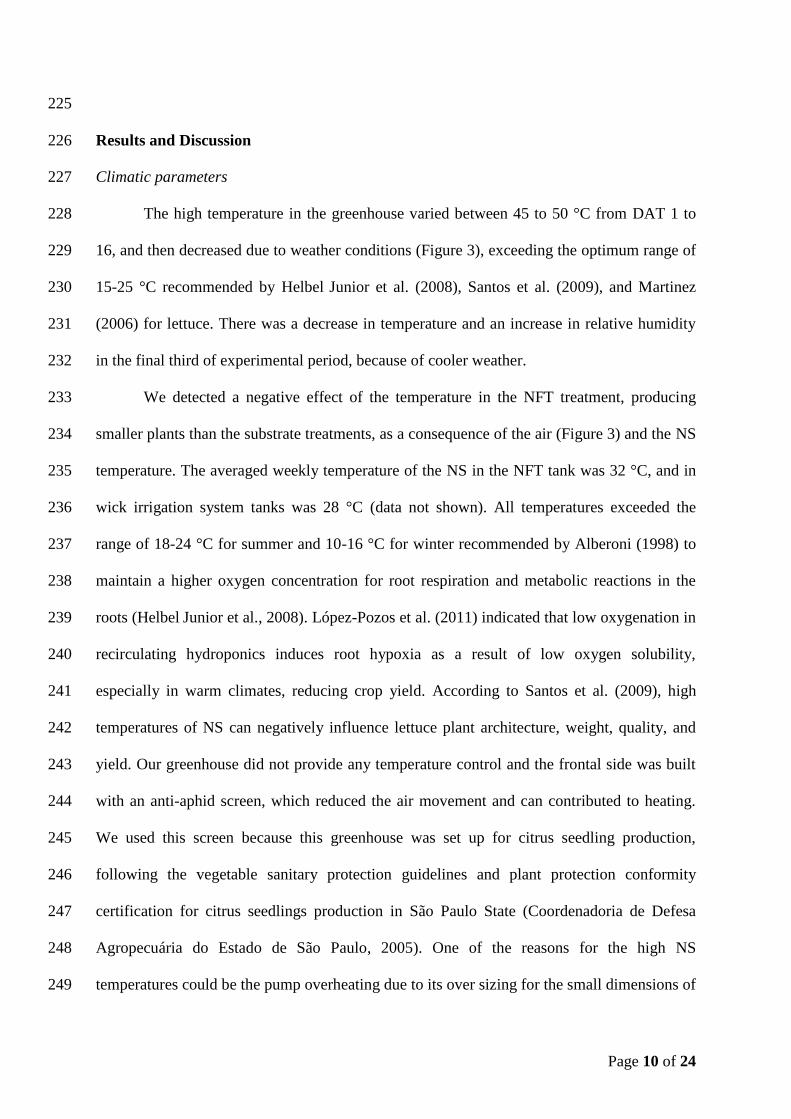
Climatic parameters 227
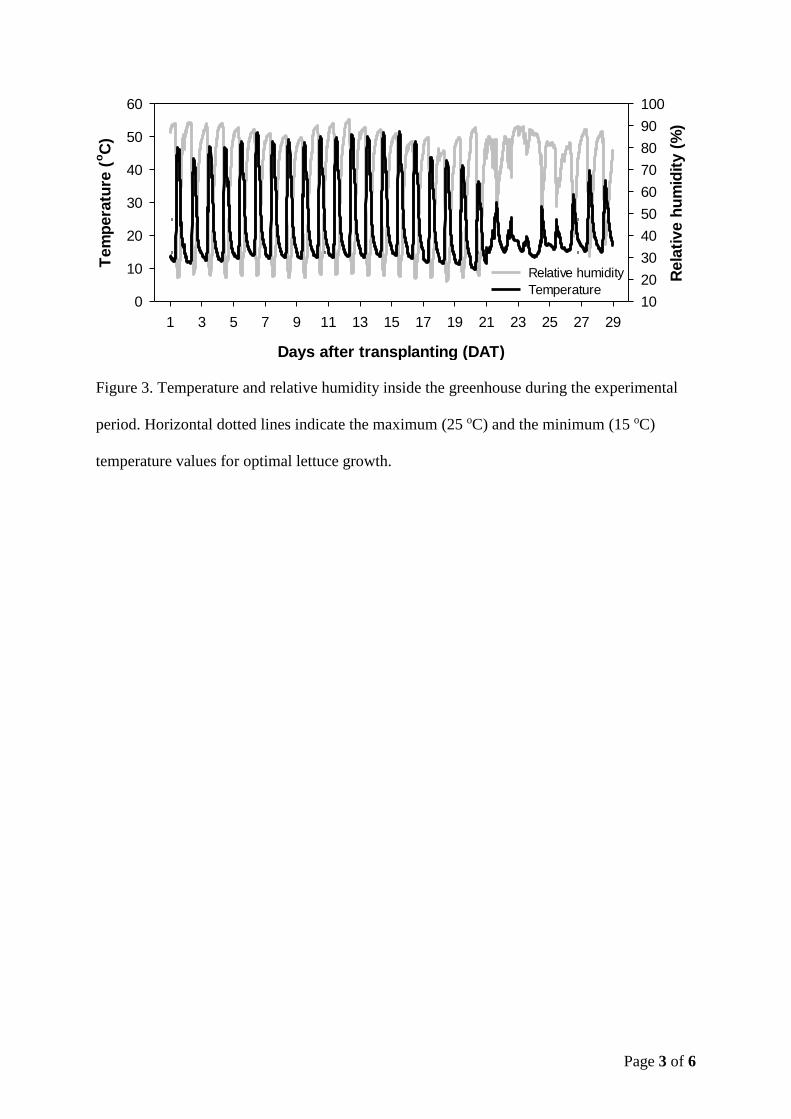
The high temperature in the greenhouse varied between 45 to 50 °C from DAT 1 to 228
16, and then decreased due to weather conditions (Figure 3), exceeding the optimum range of 229
15-25 °C recommended by Helbel Junior et al. (2008), Santos et al. (2009), and Martinez 230
(2006) for lettuce. There was a decrease in temperature and an increase in relative humidity 231
in the final third of experimental period, because of cooler weather. 232
We detected a negative effect of the temperature in the NFT treatment, producing 233
smaller plants than the substrate treatments, as a consequence of the air (Figure 3) and the NS 234
temperature. The averaged weekly temperature of the NS in the NFT tank was 32 °C, and in 235
wick irrigation system tanks was 28 °C (data not shown). All temperatures exceeded the 236
range of 18-24 °C for summer and 10-16 °C for winter recommended by Alberoni (1998) to 237
maintain a higher oxygen concentration for root respiration and metabolic reactions in the 238
roots (Helbel Junior et al., 2008). López-Pozos et al. (2011) indicated that low oxygenation in 239
recirculating hydroponics induces root hypoxia as a result of low oxygen solubility, 240
especially in warm climates, reducing crop yield. According to Santos et al. (2009), high 241
temperatures of NS can negatively influence lettuce plant architecture, weight, quality, and 242
yield. Our greenhouse did not provide any temperature control and the frontal side was built 243
with an anti-aphid screen, which reduced the air movement and can contributed to heating. 244
We used this screen because this greenhouse was set up for citrus seedling production, 245
following the vegetable sanitary protection guidelines and plant protection conformity 246
certification for citrus seedlings production in São Paulo State (Coordenadoria de Defesa 247
Agropecuária do Estado de São Paulo, 2005). One of the reasons for the high NS 248
temperatures could be the pump overheating due to its over sizing for the small dimensions of 249

Page 11 of 24
the experimental plot and the metal pump casing which warmed the solution during 250
continuous pumping. 251
252
Daily monitoring of the EC and pH 253
The EC varied among the troughs throughout the experimental period as a result of 254
salt accumulation in the WPB and WCC substrates (Figure 4). In WPB, EC was more than 255
twice than that in WCC (ranged from 0.95 to 7.57 and from 0.68 to 3.67 dS∙m-1, 256
respectively), perhaps due to the increased evaporation from the growing media as compared 257
with WCC (Lopes et al., 2007). These EC values were higher than recommended for lettuce 258
by Furlani et al. (1999) (1.6 to 1.8 dS∙m-1) and Castellane and Araújo (1995) (up to 2.5 dS∙ 259
m-1). This increase in EC was faster at the beginning of the experiment (DAT 7) because the 260
plants did not fully cover the substrate surface, thus increasing evaporation. However, EC 261
also increased in the middle of the experiment in WCC (DAT 13). The salt accumulation in 262
WPB induced typical edge-burn symptoms in older leaves due to salt excess. 263
When plants are subirrigated, an increase in the EC at the upper substrate layer is 264
frequently observed due to the evaporation and salt concentration (Dole et al., 1994; Argo 265
and Biernbaum, 1995; Rouphael and Colla, 2005; and Rouphael et al., 2006). Santos et al. 266
(2010) showed that high EC can reduce the number of lettuce leaves, stem diameter, shoot 267
fresh and dry mass, and water content. 268
The most common management strategies used to reduce EC include the use of NS 269
with lower EC, periodic substrate leaching, or addition of tap water to the tanks. We used the 270
last two strategies to reduce the EC of the substrate when it increased over the recommended. 271
We leached the substrates on DAT 8 and 11, and used tap water instead of NS on DAT 7, 11, 272
and 14, effectively reducing the concentration of all nutrients in WPB, with a consequent 273
reduction in pH and EC (Figure 4). Therefore, the EC of the NS was close to zero twice in 274

Page 12 of 24
WPB and once in WCC (Figure 4), allowing the EC reduction in the substrate and plant 275
growth recovery. However, this substrate EC subsequently increased again, which could be a 276
challenge to growers due to the constant requirement of monitoring and management of EC 277
to avoid plant damage (Figure 4). Furthermore, this procedure was time consuming, resulting 278
in significant volumes of water wasted to the environment due to disposal of the NS in the 279
greenhouse soil, which can be the major limitation of the wick irrigation system. In addition, 280
the use of tap water in substrate-grown crops may introduces bicarbonates at high 281
concentrations depending also on the bicarbonate concentration in the irrigation water which 282
in most cases is excessively high, thereby resulting in too high pH levels in the root zone, 283
being an undesired impact. In the present study, the bicarbonate concentration in the 284
irrigation water was not very high. 285
The pH of the NS showed spikes in the WPB treatment due to the use of tap water in 286
the tank for substrate leaching to reduce EC in the self-compensating troughs (Figure 4, 287
WPB). In addition, the pH of the NS in the WCC treatment was higher than WPB during the 288
entire production cycle, and spiked when tap water was added to the tanks (Figure 4, WCC). 289
Measurements in the NFT treatments were relatively consistent throughout the experimental 290
period, as a result of using the same NS in all channels (Figure 4, NFT). 291
292
Biometric parameters 293
At harvest, the WCC treatment resulted in 13% longer roots than WPB and 61% 294
longer than NFT (Table 2, P < 0.0001). Those were similar to the results of Silva et al. 295
(2005). But NFT was approximately one-third lower than the other two substrates. A similar 296
effect was observed with shoot diameter in WCC, which was 6% larger than WPB and 27% 297
larger than with NFT (Table 2, P < 0.0001). The shoot diameter responses for WPB and 298
WCC were similar to those observed by Santos et al. (2010), and higher than reported by 299
Page 13 of 24
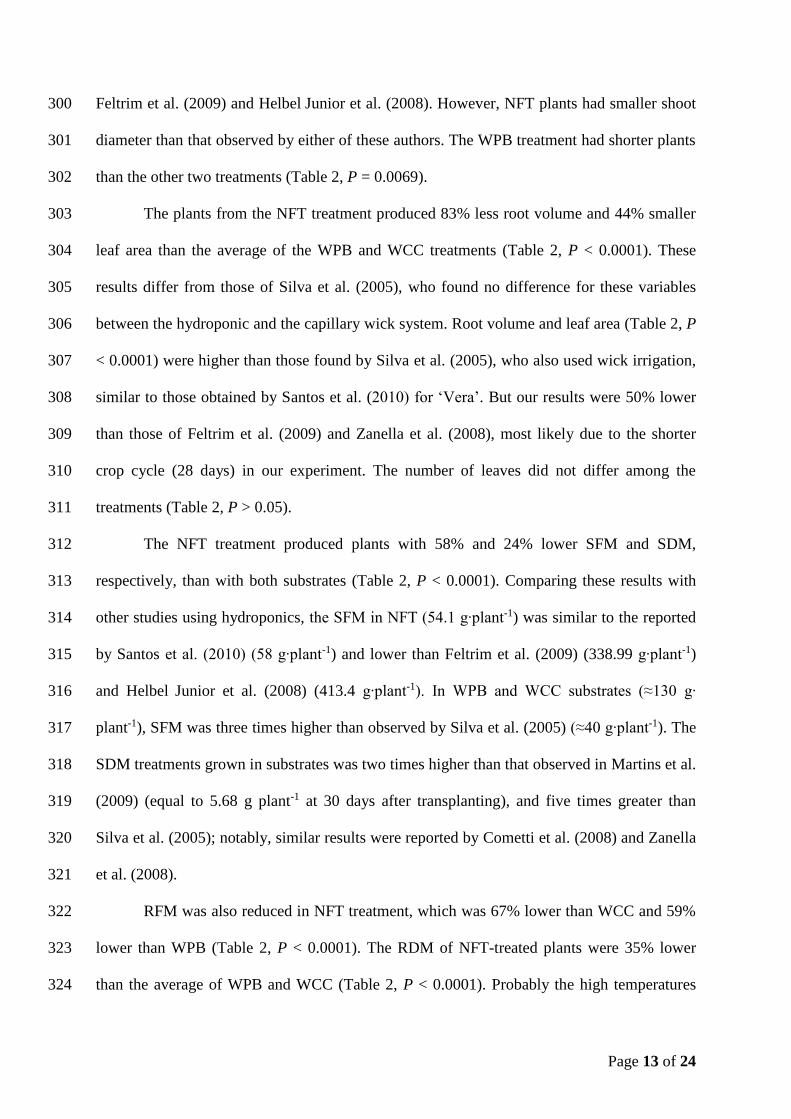
Feltrim et al. (2009) and Helbel Junior et al. (2008). However, NFT plants had smaller shoot 300
diameter than that observed by either of these authors. The WPB treatment had shorter plants 301
than the other two treatments (Table 2, P = 0.0069). 302
The plants from the NFT treatment produced 83% less root volume and 44% smaller 303
leaf area than the average of the WPB and WCC treatments (Table 2, P < 0.0001). These 304
results differ from those of Silva et al. (2005), who found no difference for these variables 305
between the hydroponic and the capillary wick system. Root volume and leaf area (Table 2, P 306
< 0.0001) were higher than those found by Silva et al. (2005), who also used wick irrigation, 307
similar to those obtained by Santos et al. (2010) for ‘Vera’. But our results were 50% lower 308
than those of Feltrim et al. (2009) and Zanella et al. (2008), most likely due to the shorter 309
crop cycle (28 days) in our experiment. The number of leaves did not differ among the 310
treatments (Table 2, P > 0.05). 311
The NFT treatment produced plants with 58% and 24% lower SFM and SDM, 312
respectively, than with both substrates (Table 2, P < 0.0001). Comparing these results with 313
other studies using hydroponics, the SFM in NFT (54.1 g∙plant-1) was similar to the reported 314
by Santos et al. (2010) (58 g∙plant-1) and lower than Feltrim et al. (2009) (338.99 g∙plant-1) 315
and Helbel Junior et al. (2008) (413.4 g∙plant-1). In WPB and WCC substrates (≈130 g∙ 316
plant-1), SFM was three times higher than observed by Silva et al. (2005) (≈40 g∙plant-1). The 317
SDM treatments grown in substrates was two times higher than that observed in Martins et al. 318
(2009) (equal to 5.68 g plant-1 at 30 days after transplanting), and five times greater than 319
Silva et al. (2005); notably, similar results were reported by Cometti et al. (2008) and Zanella 320
et al. (2008). 321
RFM was also reduced in NFT treatment, which was 67% lower than WCC and 59% 322
lower than WPB (Table 2, P < 0.0001). The RDM of NFT-treated plants were 35% lower 323
than the average of WPB and WCC (Table 2, P < 0.0001). Probably the high temperatures 324
Page 14 of 24
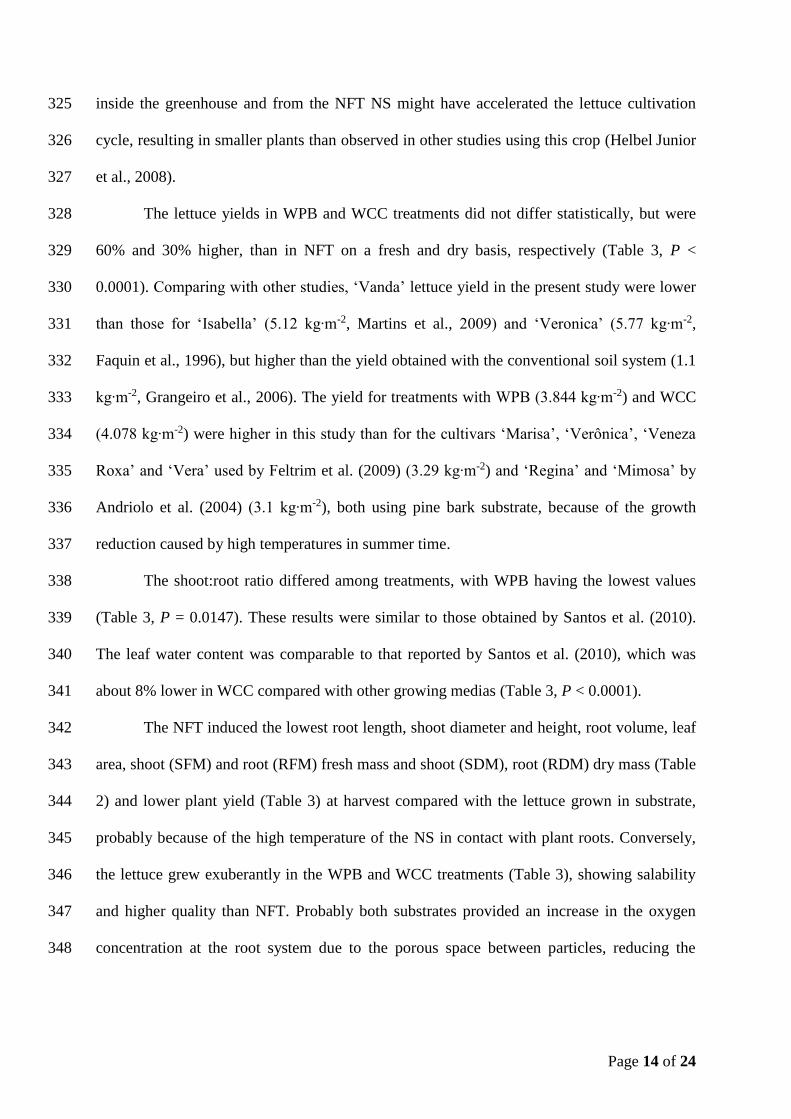
inside the greenhouse and from the NFT NS might have accelerated the lettuce cultivation 325
cycle, resulting in smaller plants than observed in other studies using this crop (Helbel Junior 326
et al., 2008). 327
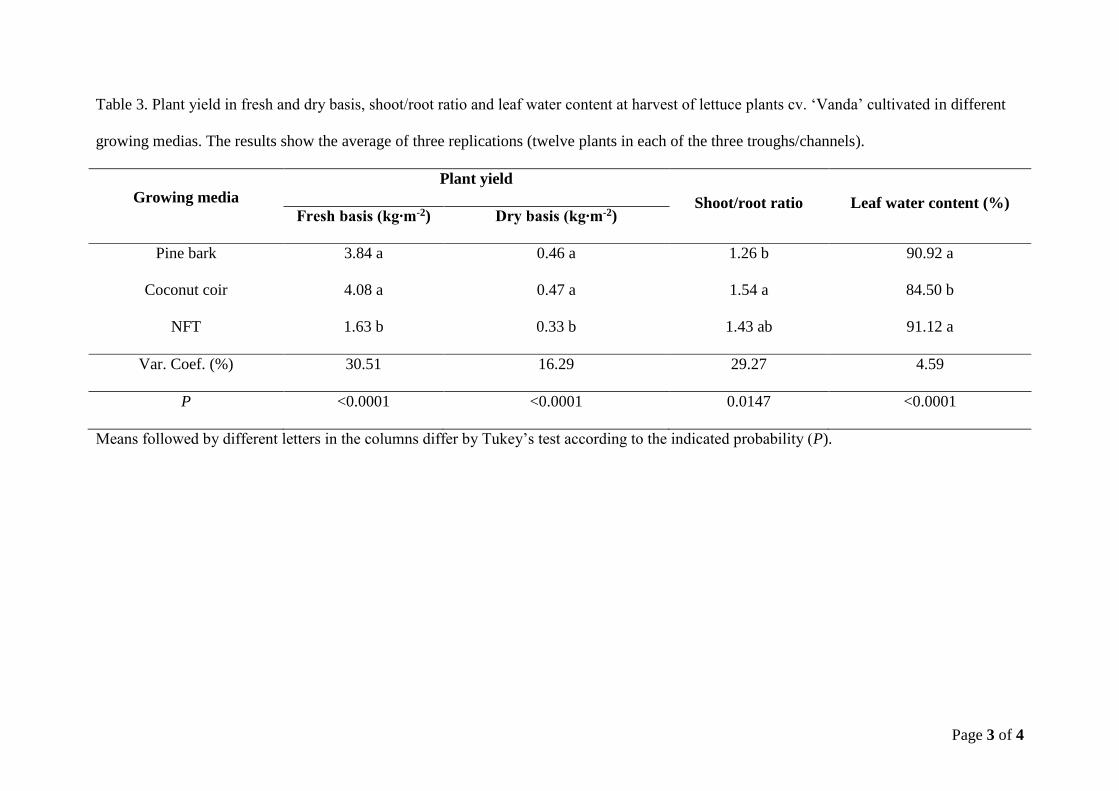
The lettuce yields in WPB and WCC treatments did not differ statistically, but were 328
60% and 30% higher, than in NFT on a fresh and dry basis, respectively (Table 3, P < 329
0.0001). Comparing with other studies, ‘Vanda’ lettuce yield in the present study were lower 330
than those for ‘Isabella’ (5.12 kg∙m-2, Martins et al., 2009) and ‘Veronica’ (5.77 kg∙m-2, 331
Faquin et al., 1996), but higher than the yield obtained with the conventional soil system (1.1 332
kg∙m-2, Grangeiro et al., 2006). The yield for treatments with WPB (3.844 kg∙m-2) and WCC 333
(4.078 kg∙m-2) were higher in this study than for the cultivars ‘Marisa’, ‘Verônica’, ‘Veneza 334
Roxa’ and ‘Vera’ used by Feltrim et al. (2009) (3.29 kg∙m-2) and ‘Regina’ and ‘Mimosa’ by 335
Andriolo et al. (2004) (3.1 kg∙m-2), both using pine bark substrate, because of the growth 336
reduction caused by high temperatures in summer time. 337
The shoot:root ratio differed among treatments, with WPB having the lowest values 338
(Table 3, P = 0.0147). These results were similar to those obtained by Santos et al. (2010). 339
The leaf water content was comparable to that reported by Santos et al. (2010), which was 340
about 8% lower in WCC compared with other growing medias (Table 3, P < 0.0001). 341
The NFT induced the lowest root length, shoot diameter and height, root volume, leaf 342
area, shoot (SFM) and root (RFM) fresh mass and shoot (SDM), root (RDM) dry mass (Table 343
2) and lower plant yield (Table 3) at harvest compared with the lettuce grown in substrate, 344
probably because of the high temperature of the NS in contact with plant roots. Conversely, 345
the lettuce grew exuberantly in the WPB and WCC treatments (Table 3), showing salability 346
and higher quality than NFT. Probably both substrates provided an increase in the oxygen 347
concentration at the root system due to the porous space between particles, reducing the 348

Page 15 of 24
negative effects of the high NS temperatures. Unfortunately this study measured neither the 349
temperature nor the oxygen content in the NS. 350
351
Shoot and root macro and micronutrient concentrations 352
There were no visual symptoms of nutrient toxicity or deficiency in plants throughout 353
the experimental period, except for the salt accumulation in WPB, which induced typical 354
edge-burn symptoms in older leaves, probably caused by high EC in this substrate at the 355
beginning of experiment. 356
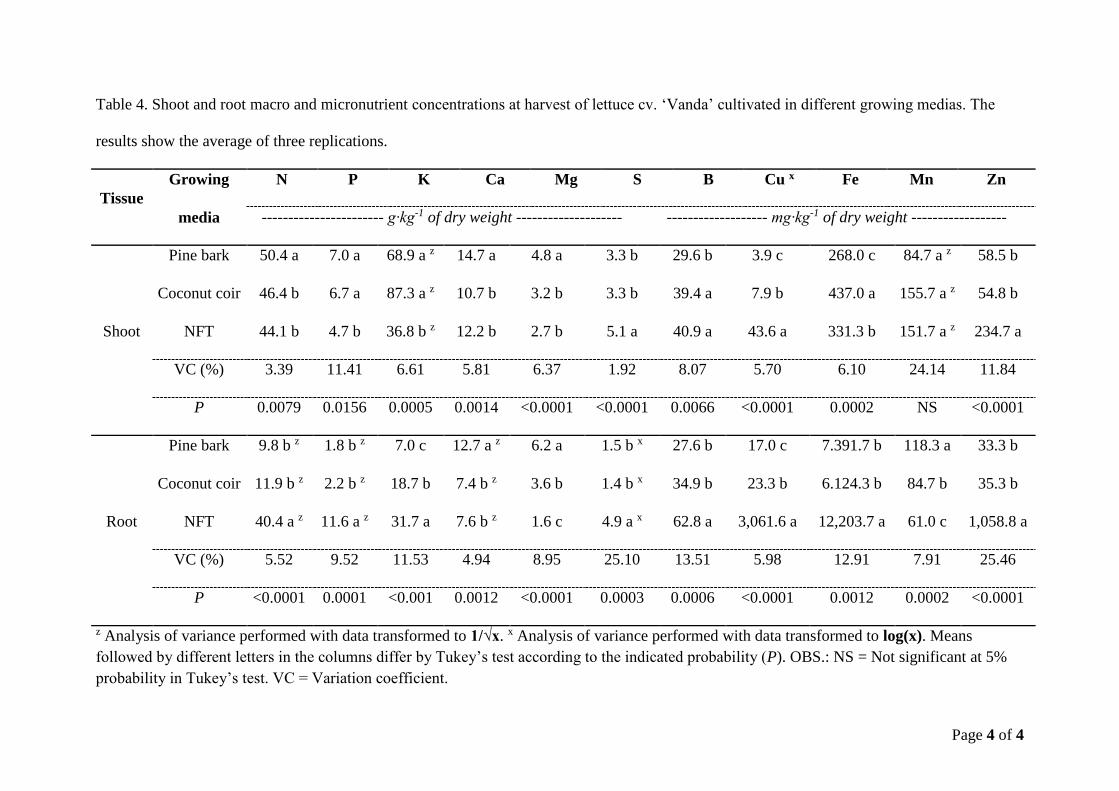
The shoot macronutrient analysis indicated that N, Ca and Mg concentrations were 357
higher in the WPB treatment and that P and K concentrations were lower in NFT compared 358
with other substrates (Table 4). The S concentration was 35% higher in NFT compared with 359
WPB and WCC. These values were similar to those observed by Martins et al. (2009) and 360
Lopes et al. (2007) and were consistent with the values recommended by Silva (1999) and 361
Trani and Raij (1997), with the exception of Ca, which was slightly below the recommended 362
range (15 to 25 g∙kg-1). The shoot macronutrient concentrations were lower in NFT compared 363
with the plants grown in wick substrates, probably due to the lower growth caused by the 364
temperature of the NS (Table 4). Helbel Junior et al. (2008) cited that high NS temperatures 365
can induce plant root damage, causing reduction in the nutrients uptake and consequently in 366
the growth because of feed deficiency. 367
An analysis of the shoot micronutrient concentrations in lettuce revealed that WPB 368
resulted in a B concentration that was 29% lower than in the other treatments (Table 4). The 369
Cu concentration in the NFT treatment was 11.2 times greater than WPB and 5.5 times 370
greater than WCC, and the Zn concentration was 4.2 times higher in the NFT than the other 371
substrates. The WCC treatment showed the highest values for Fe, which was 39% higher than 372
WPB and 24% than NFT (Table 4). There was no significant difference among substrates for 373

Page 16 of 24
the shoot Mn concentration. The results were consistent with those indicated by Silva (1999) 374
and Trani and Raij (1997). However, the Cu and Zn values were higher than the optimal level 375
indicated by these authors. 376
The root macronutrient concentrations were 73% higher for N, 82% for P, 60% for K 377
and 70% for S in NFT compared with substrates (Table 4). However, the Ca and Mg 378
concentrations were 41% and 58% higher, respectively, in WPB than in other treatments 379
(Table 4). 380
The root micronutrient concentrations with NFT were higher for B (2 times higher), 381
Cu (153 times higher), Fe (2 times higher) and Zn (31 times higher) than with the other 382
substrates (Table 4). This result was most likely due to the incomplete removal of these 383
elements during the substrate washing procedures in the lab, accumulating more nutrients in 384
the roots due to the direct contact with NS. In contrast, lettuce roots grown with NFT had the 385
lowest Mn concentration, with 28% higher values in WCC and 48% higher in WPB (Table 386
4). 387
The results on nutrient concentrations in the plant tissues were not only associated 388
with technical characteristics of the tested wick systems and concomitant plant physiological 389
implications, but also rather to differences in the nutrient supplied in each treatment. We 390
applied tap irrigation water several times in the wick irrigation system, which had a quite 391
different composition than the NS, in order to leach out salts as recommended by the 392
manufacturer, while in the NFT system we only applied NS. Thus, the performance of the 393
wick irrigation treatments could have been biased by operations that were not inherent to the 394
system, but had to be performed to reduce substrate EC. The frequency of tap water 395
application still unknown by growers. 396
397
Substrate macro and micronutrient concentrations 398

Page 17 of 24
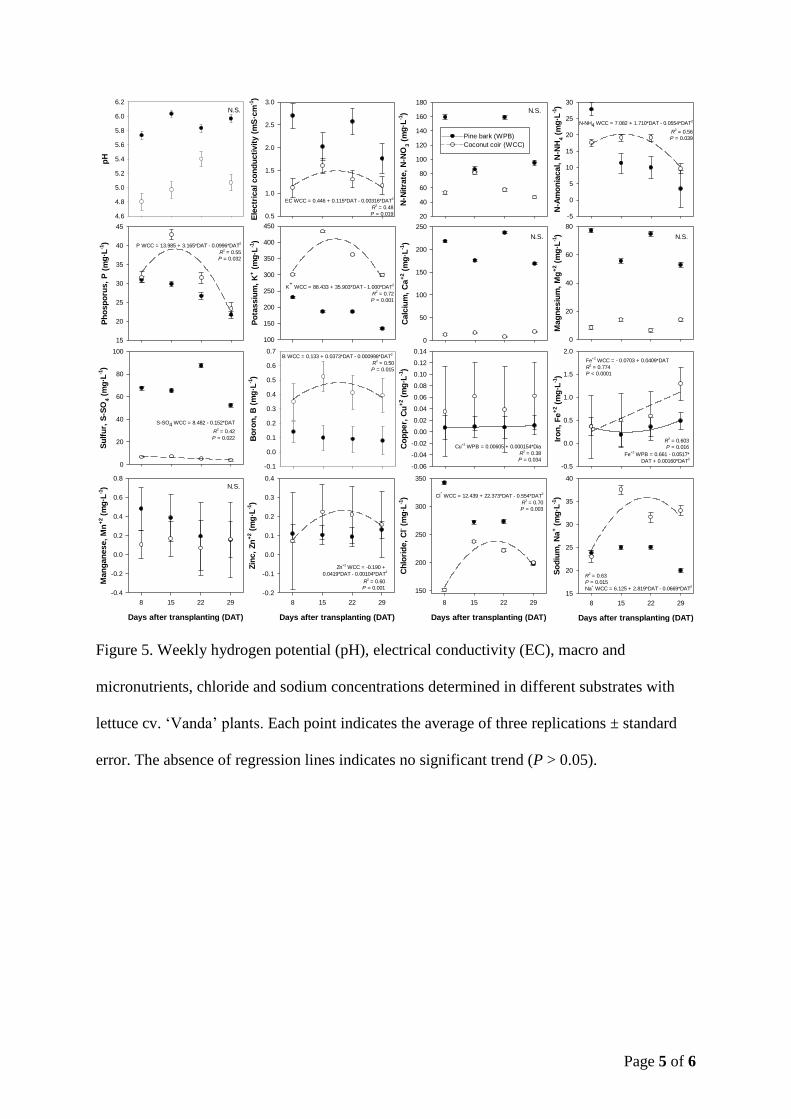
The macronutrient concentrations differed between the two substrates (Figure 5). 399
Compared to the initial nutrient levels in the substrates (Table 1), all nutrients increased with 400
nutrient solution supply, while pH decreased due to the acidifying characteristic of the used 401
NS. In general, pH, EC, NO3-N, Ca, Mg, and S were higher in WPB, while NH4-N, P, and K 402
were higher in WCC (Figure 5). 403
Substrate concentrations of Mn and chloride were higher in WPB, while B, Cu, Fe, Zn 404
and sodium were higher in WCC (Figure 5). There was a quadratic pattern of B, Fe and Zn 405
concentrations, with a reduction of concentrations in the final growth period probably by the 406
increasing use by plants in this phase. Consistently, there was an increase in the Fe 407
concentration in the substrate over the experimental period, but concentrations were lower 408
than recommended by Furlani (1998) and Furlani et al. (1999). High concentrations of 409
chloride and sodium were observed with both substrates, which were reduced by leaching and 410
tap water use instead of NS (Figure 5). 411
The increase in EC caused by the evaporation and salt accumulation increased the 412
substrate macro and micronutrient concentrations (Figure 5). This phenomenon is well 413
described in the literature, especially in the upper substrate layer (already cited in the pH and 414
EC discussion section). Unfortunately, we did not measure the EC or the nutrient 415
concentrations in layers, since the substrate thickness was less than 6 cm, what made the 416
layered measurements difficult. A decrease in EC and macronutrient concentrations on the 417
last growing day (DAT 29) was observed by the increased NS consumption from high plant 418
growth during this period (Figure 4), without reducing plant growth at the harvest. Both 419
substrate leaching and tap water application in the tank instead of NS did not significantly 420
reduce the substrate micronutrient concentrations (Figure 5). Another possible way to reduce 421
the substrate macro and micronutrient concentrations to avoid plant damages would be the 422
Page 18 of 24
use of less concentrated NS with a lower EC, as the evaporation concentrates the nutrients 423
and increases the EC. 424
425
NS macro and micronutrients concentration 426
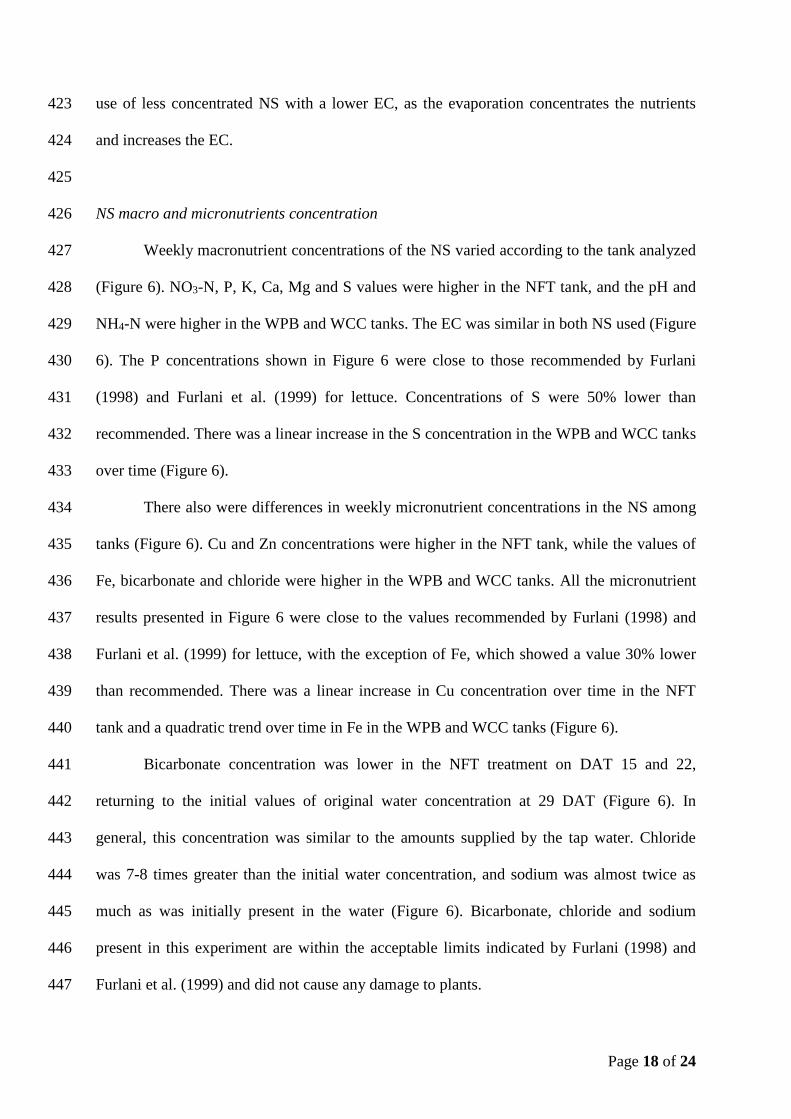
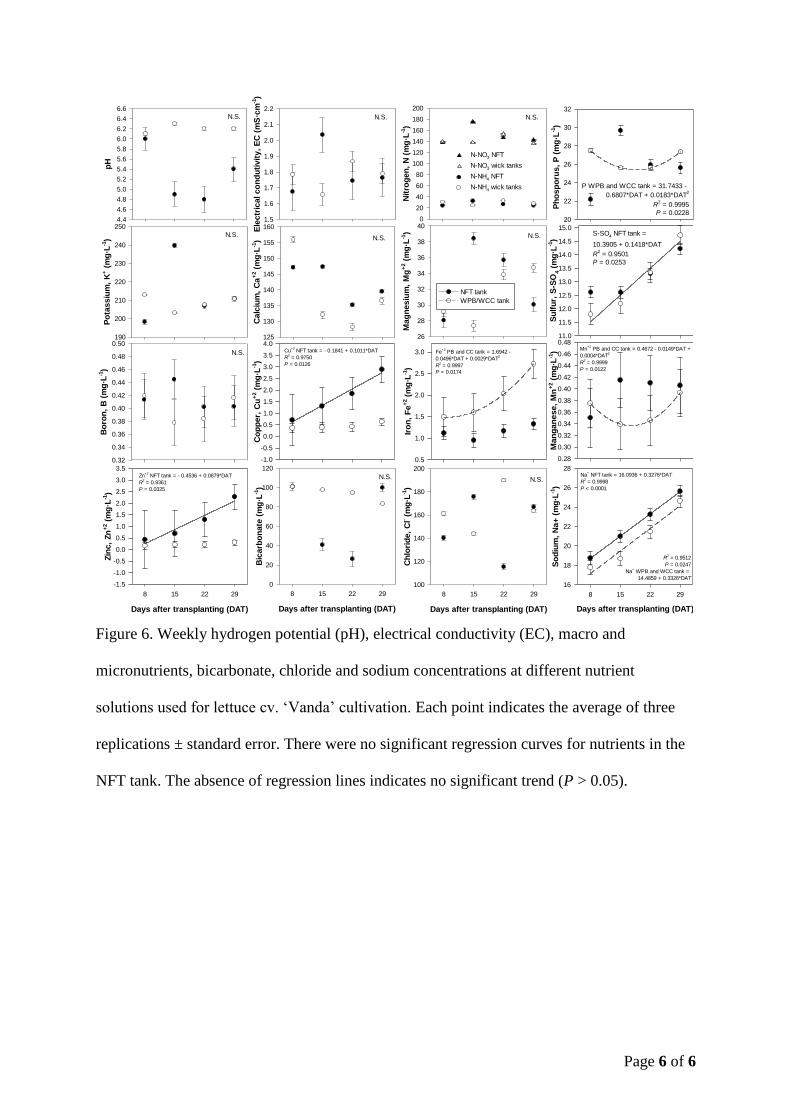
Weekly macronutrient concentrations of the NS varied according to the tank analyzed 427
(Figure 6). NO3-N, P, K, Ca, Mg and S values were higher in the NFT tank, and the pH and 428
NH4-N were higher in the WPB and WCC tanks. The EC was similar in both NS used (Figure 429
6). The P concentrations shown in Figure 6 were close to those recommended by Furlani 430
(1998) and Furlani et al. (1999) for lettuce. Concentrations of S were 50% lower than 431
recommended. There was a linear increase in the S concentration in the WPB and WCC tanks 432
over time (Figure 6). 433
There also were differences in weekly micronutrient concentrations in the NS among 434
tanks (Figure 6). Cu and Zn concentrations were higher in the NFT tank, while the values of 435
Fe, bicarbonate and chloride were higher in the WPB and WCC tanks. All the micronutrient 436
results presented in Figure 6 were close to the values recommended by Furlani (1998) and 437
Furlani et al. (1999) for lettuce, with the exception of Fe, which showed a value 30% lower 438
than recommended. There was a linear increase in Cu concentration over time in the NFT 439
tank and a quadratic trend over time in Fe in the WPB and WCC tanks (Figure 6). 440
Bicarbonate concentration was lower in the NFT treatment on DAT 15 and 22, 441
returning to the initial values of original water concentration at 29 DAT (Figure 6). In 442
general, this concentration was similar to the amounts supplied by the tap water. Chloride 443
was 7-8 times greater than the initial water concentration, and sodium was almost twice as 444
much as was initially present in the water (Figure 6). Bicarbonate, chloride and sodium 445
present in this experiment are within the acceptable limits indicated by Furlani (1998) and 446
Furlani et al. (1999) and did not cause any damage to plants. 447
Page 19 of 24
The NS macro and micronutrients concentration were determined prior to the 448
replacement, and showed a significant increase in S, Cu, Fe, Mn, Zn and Na over time, 449
probably caused by the reduction of plant uptake as an effect of the higher temperature of NS 450
in NFT or yet by a higher supply than needed (Figure 6). 451
452
Conclusions 453
The wick irrigation system with self-compensating troughs, irrespective of substrate, 454
showed higher lettuce yield than the NFT system. However, the EC in WCC was more stable 455
than in WPB, facilitating nutritional management during the crop cycle without causing 456
salinity damage to the plants. Wick irrigation systems resulted in lettuce salable plants, being 457
an alternative for regions with high temperatures because of the substrate cooling effect, 458
limited manpower and electrical power. But the obtained biometric results did not prove a 459
standard technical superiority of the wick irrigation system over NFT but merely indicated 460
that, under the specific conditions applied in this experiment, the NFT system performed 461
poorly. Further investigations should be conducted in different seasons and with other 462
cultivars, trying to establish the water and nutrient management guidelines suitable for 463
different substrates to improve the utilization of this technology. 464
465
References 466
Alberoni, R.B. 1998. Hidroponia. Nobel, São Paulo, SP. 467
Andriolo, J.L., G.L. Luz, C. Giraldi, R.S. Godoi, and G.T. Barros. 2004. Growing lettuce 468
plants in hydroponics using substrates: an alternative for the NFT? Horticultura Brasileira 469
22:794–798. 470
Argo, W.R. and J.A. Biernbaum. 1995. The effect of irrigation method, water-soluble 471
fertilization, preplant nutrient charge, and surface evaporation on early vegetative and root 472

Page 20 of 24
growth of poinsettia. Journal of the American Society for Horticultural Science 120:163–473
169. 474
Bataglia, O.C., A.M.C. Furlani, J.P.F. Teixeira, P.R. Furlani, and J.R. Gallo. 1983. Métodos 475
de análise química de plantas. Instituto Agronômico de Campinas, Campinas, SP. 476
Cantarella, H. and P.C.O. Trivelin. 2001. Determinação de nitrogênio inorgânico em solo 477
pelo método da destilação a vapor, p.270–276. In: Raij, B.V., J.C. Andrade, H. Cantarella, 478
and J.A. Quaggio (eds.). Análise química para avaliação da fertilidade de solos tropicais. 479
Instituto Agronômico de Campinas, Campinas, SP. 480
Caron, J., D.E. Elrick, R. Beeson, and J. Boudreau. 2005. Defining critical capillary rise 481
properties for growing media in nurseries. Soil Science Society American Journal 69:794–482
806. 483
Castellane, P.D. and J.A. de Araújo. 1995. Cultivo sem solo: hidroponia. Funep, Jaboticabal, 484
SP. 485
Cometti, N.N., G.C.S. Matias, E. Zonta, W. Mary, and M.S. Fernandes. 2008. Effects of the 486
concentration of nutrient solution on lettuce growth in hydroponics-NFT system. 487
Horticultura Brasileira 26:252–257. 488
Coordenadoria de Defesa Agropecuária do Estado de São Paulo. 2005. Vegetable sanitary 489
protection rules and plant protection conformity certification for citrus seedlings 490
production in São Paulo State. Accessed in 03/08/2013. Available at 491
http://www.defesaagropecuaria.sp.gov.br/www/legislacoes/popup.php?action=view&idleg492
=642. 493
Dole, J.M., J.C. Cole, and S.L. Von Broembsen. 1994. Growth of poinsettias, nutrient 494
leaching, and water-use efficiency respond to irrigation methods. HortScience 29:858–495
864. 496
Page 21 of 24
Faquin, V., A.E. Furtini Neto, and L.A.A. Vilela. 1996. Produção de alface em hidroponia. 497
Universidade Federal de Lavras, Lavras, MG. 498
Feltrim, A.L., A.B. Cecílio Filho, B.L.A. Rezende, and R.B.F. Branco. 2009. Yield of crispy 499
lettuce cultivated in soil and in hydroponic system during winter and summer seasons, in 500
Jaboticabal, SP, Brazil. Científica 37:9–15. 501
Ferrarezi, R.S., O.C. Bataglia, P.R. Furlani, and E. Schammass. 2007. Iron sources for citrus 502
rootstock development grown on pine bark/vermiculite mixed substrate. Scientia Agricola 503
64:520–531. 504
Ferrarezi, R.S., L.N.S. dos Santos, A.C.M. de Sousa, F.F.S. Pereira, M.L.C. Elaiuy, U. 505
Torrel, and E.E. Matsura. 2012. Water depth, filling time and volume of wick irrigation 506
equipment and determination of water distribution uniformity in substrates. Bragantia 507
71:273–281. 508
Furlani, P.R. 1998. Instruções para o cultivo de hortaliças de folhas pela técnica de 509
Hidroponia NFT (Boletim Técnico 168). Instituto Agronômico, Campinas, SP. 510
Furlani, P.R., L.C.P. Silveira, D. Bolonhezi, and V. Faquim. 1999. Cultivo hidropônico de 511
plantas (Boletim Técnico 180). 1st ed. Instituto Agronômico, Campinas, SP. 512
Grangeiro, L.C., K.R. Costa, M.A. Medeiros, M.Z. Salviano, F. Bezerra Neto, and S.L. 513
Oliveira. 2006. Accumulation of nutrients by three lettuce cultivars grown under Semi-arid 514
conditions. Horticultura Brasileira 24:190–194. 515
Graves, C.J. 1983. The nutrient film technique. Horticultural Review 5, 1-44. 516
Graves, C.J. and Hurd, R.G. 1983. Intermittent solution circulation in the nutrient film 517
technique. Acta Horticulturae 133: 47–52. 518
Helbel Junior, C., R. Rezende, P.S.L. de Freitas, A.C.A. Gonçalves, and J.A. Frizzone. 2008. 519
Effect of electric conductivity, ionic concentration and flow of nutrient solutions in the 520
production of hydroponic lettuce. Ciência Agrotécnica 32:1142–1147. 521
Page 22 of 24
Kang, S.W., S.G. Seo, and C.H. Pak. 2009. Capillary wick width and water level in channel 522
affects water absorption properties of growing media and growth of chrysanthemum and 523
poinsettia cultured in C-channel subirrigation system. Korean Journal of Horticultural 524
Science & Technology 27(1): 86–92. 525
Laviola, B.G., H.E. Martinez, and A.L. Mauri. 2007. Influence of the level of fertilization of 526
the matrix plants in the formation of seedlings of coffee plants in hydroponic systems. 527
Ciência e Agrotecnologia 31:1043–1047. 528
Lee, C.W., I.S. So, S.W. Jeong, and M.R. Huh. 2010. Application of subirrigation using 529
capillary wick system to pot production. Journal of Agriculture & Life Science 44:7–14. 530
Lopes, J.L.W., C.S.F. Boaro, M.R. Peres, and V.F. Guimarães. 2007. Growth of lettuce 531
seedlings in different substrates. Revista Biotemas 20:19–25. 532
López-Pozos, R., G.A. Martínez-Gutiérrez, R. Pérez-Pacheco, M. Urrestarazu. 2011. The 533
effects of slope and channel nutrient solution gap number on the yield of tomato crops by 534
a nutrient film technique system under a warm climate. HortScience 46:727–729. 535
Martinez, H.E.P. 2006. Manual prático de hidroponia. Aprenda Fácil, Viçosa, MG. 536
Martins, C., J.F. de Medeiros, W.A.R. Lopes, D.F. Braga, and L.B. de Amorim. 2009. Curve 537
of absorption of nutrients in hydroponic lettuce. Revista Caatinga 22:123–128. 538
Moretti, C.L. and L.M. Mattos. 2008. Processamento mínimo de alface crespa (Comunicado 539
Técnico 25). Embrapa Hortaliças, Brasília, DF. 540
Oh, M.M., Y.Y. Cho, K.S. Kim, and J.E. Son. 2007. Comparisons of water content of 541
growing media and growth of potted kalanchoe among nutrient-flow wick culture and 542
other irrigation systems. HortTechnology 17:62–66. 543
Oh, M.M. and J.E. Son. 2008. Phytophthora nicotianae transmission and growth of potted 544
kalanchoe in two recirculating subirrigation systems. Scientia Horticulturae 119:75–78. 545
Page 23 of 24
Prieto, I., C. Armas, and F.I. Pugnaire. 2012. Water release through plant roots: new insights 546
into its consequences at the plant and ecosystem level. New Phytologist 193:830–841. 547
Resh, H.M. 2002. Hydroponic food production. A definitive guidebook of soilless food-548
growing methods: For the professional and commercial grower and the advanced home 549
hydroponics gardener. Lawrence Erlbaum Assoc Inc, Routledge. 550
Rouphael, Y., M. Cardarelli, E. Rea, A. Battistelli, and G. Colla. 2006. Comparison of the 551
subirrigation and drip-irrigation systems for greenhouse zucchini squash production using 552
saline and non-saline nutrient solutions. Agricultural Water Management 82:99–117. 553
Rouphael, Y. and G. Colla. 2005. Growth, yield, fruit quality and nutrient uptake of 554
hydroponically cultivated zucchini squash as affected by irrigation systems and growing 555
seasons. Scientia Horticulturae 105:177–195. 556
Sant’ana, E.P., E.V.P. Sant’ana, N.K. Fageria, and A. de .B. Freire. 2003. Phosphorus 557
utilization and characteristics of root and top of rice plant. Ciência e Agrotecnologia 558
27:370–381. 559
Santos, A.N., T.M. Soares, E.F.F. Silva, D.J.R. Silva, and A.A.A. Montenegro. 2010. 560
Hydroponic lettuce production with brackish groundwater and desalination waste in 561
Ibimirim, PE, Brazil. Revista Brasileira de Engenharia Agrícola e Ambiental 14:961–969. 562
Santos, C.L. dos, S. Seabra Junior, J.G. de Lalla, V.C. de A. Theodoro, and A. Nespoli. 2009. 563
Performance of crispy lettuce cultivars under high temperatures in Cáceres, MT, Brazil. 564
Agrarian 2:87–98. 565
Silva, F.C. 1999. Manual de análises químicas de solos, plantas e fertilizantes. Embrapa 566
Comunicação para Transferência de Tecnologia, Brasília, DF. 567
Silva, J.O. da., P.A. de Souza, J. Gomes Júnior, P.R.G. Pereira, and F.A. Rocha. 2005. 568
Growth and mineral composition of lettuce on capillary hydroponic system. Irriga 569
10:146–154. 570

Page 24 of 24
Son, J.E., D.H. Jung, and Y.J. Lui. 2001. Analysis of root zone environment in pot plant 571
production system with subirrigation method using wick. Proceedings of the International 572
Symposium on Design and Environmental Control of Tropical and Subtropical 573
Greenhouses. Acta Horticulturae 578:389–393. 574
Son, J.E., M.M. Oh, Y.J. Lu, K.S. Kim, and G.A. Giacomelli. 2006. Nutrient-flow wick 575
culture system for potted plant production: System characteristics and plant growth. 576
Scientia Horticulturae 107:392–398. 577
Sonneveld, C. and C.W. van Elderen. 1994. Chemical analysis of peaty growing media by 578
means of water extraction. Communications in Soil Science and Plant Analysis 25:3199–579
3208. 580
Trani, P.E. and B.V. Raij. 1997. Hortaliças, p.157–188. In: Raij, B.V., H. Cantarella, J.A. 581
Quaggio, and A.M.C. Furlani (eds.). Recomendações de adubação e calagem para o 582
Estado de São Paulo (Boletim Técnico 100). 2nd ed. Instituto Agronômico/Fundação IAC, 583
Campinas, SP. 584
Zanella, F., A.L.S. Lima, F.F. Silva Júnior, and S.P.A. Maciel. 2008. Hydroponic lettuce 585
growth under different irrigation intervals. Ciência e Agrotecnologia 32:366–370. 586
Page 1 of 4
Table 1. Hydrogen potential (pH), electrical conductivity (EC), and macro and micronutrient concentrations of pine bark and coconut coir
substrates. The results shown the average of three replications.
Substrate pH
EC NO3-N NH4-N P K Ca Mg S B Cu Fe Mn Zn Cl Na
(dS∙m-1) ----------------------------------------------------------- mg∙L-1 -----------------------------------------------------------
Pine bark 6.4 1 48.7 3.7 6.6 48.5 97.9 32.7 61.5 0.01 < 0.01 0.1 0.01 0.01 28.0 3.3
Coconut coir 5.6 0.3 0.4 0.2 1.5 94.7 6.5 1.9 6.5 0.30 0.05 0.9 0.04 0.10 16.3 4.4

Page 2 of 4
Table 2. Root length, shoot diameter and height, root volume, leaf area, number of leaves, shoot (SFM) and root (RFM) fresh mass and shoot
(SDM) and root (RDM) dry mass at harvest of lettuce cv. ‘Vanda’ cultivated in different growing medias. The results shown the average of three
replications (twelve plants in each of the three troughs/channels).
Growing
media
Root
length
Shoot
diameter
Shoot
height
Root
volume Number of
leaves
Leaf area SFM SDM RFM RDM
(cm) (cm) (cm) z (mL) (cm2) --------------------- g∙plant-1 ---------------------
Pine bark 28.3 b 34.2 b 16.4 b 35.4 a 19.4 a 2.1 a 128.3 a 10.1 a 25.5 b 8.4 a
Coconut coir 32.4 a 36.4 a 17.9 a 38.8 a 20.6 a 2.2 a 131.3 a 11.1 a 31.8 a 8.0 a
NFT 12.5 c 26.5 c 17.6 a 6.1 b 19.6 a 1.2 b 54.9 b 8.1 b 10.5 c 5.3 b
Var. Coef. (%) 23.93 7.95 6.17 35.76 19.10 28.43 32.95 23.97 29.59 18.75
P <0.0001 <0.0001 0.069 <0.0001 NS <0.0001 <0.0001 <0.0001 <0.0001 <0.0001
z Analysis of variance performed with data transformed to √x. Means followed by different letters in the columns differ by Tukey’s test
according to the indicated probability (P). OBS.: NS = Not significant at 5% probability in Tukey’s test.
Page 3 of 4
Table 3. Plant yield in fresh and dry basis, shoot/root ratio and leaf water content at harvest of lettuce plants cv. ‘Vanda’ cultivated in different
growing medias. The results show the average of three replications (twelve plants in each of the three troughs/channels).
Growing media
Plant yield
Shoot/root ratio Leaf water content (%) Fresh basis (kg∙m-2) Dry basis (kg∙m-2)
Pine bark 3.84 a 0.46 a 1.26 b 90.92 a
Coconut coir 4.08 a 0.47 a 1.54 a 84.50 b
NFT 1.63 b 0.33 b 1.43 ab 91.12 a
Var. Coef. (%) 30.51 16.29 29.27 4.59
P <0.0001 <0.0001 0.0147 <0.0001
Means followed by different letters in the columns differ by Tukey’s test according to the indicated probability (P).
Page 4 of 4
Table 4. Shoot and root macro and micronutrient concentrations at harvest of lettuce cv. ‘Vanda’ cultivated in different growing medias. The
results show the average of three replications.
Tissue
Growing N P K Ca Mg S B Cu x Fe Mn Zn
media ----------------------- g∙kg-1 of dry weight -------------------- ------------------- mg∙kg-1 of dry weight ------------------
Shoot
Pine bark 50.4 a 7.0 a 68.9 a z 14.7 a 4.8 a 3.3 b 29.6 b 3.9 c 268.0 c 84.7 a z 58.5 b
Coconut coir 46.4 b 6.7 a 87.3 a z 10.7 b 3.2 b 3.3 b 39.4 a 7.9 b 437.0 a 155.7 a z 54.8 b
NFT 44.1 b 4.7 b 36.8 b z 12.2 b 2.7 b 5.1 a 40.9 a 43.6 a 331.3 b 151.7 a z 234.7 a
VC (%) 3.39 11.41 6.61 5.81 6.37 1.92 8.07 5.70 6.10 24.14 11.84
P 0.0079 0.0156 0.0005 0.0014 <0.0001 <0.0001 0.0066 <0.0001 0.0002 NS <0.0001
Root
Pine bark 9.8 b z 1.8 b z 7.0 c 12.7 a z 6.2 a 1.5 b x 27.6 b 17.0 c 7.391.7 b 118.3 a 33.3 b
Coconut coir 11.9 b z 2.2 b z 18.7 b 7.4 b z 3.6 b 1.4 b x 34.9 b 23.3 b 6.124.3 b 84.7 b 35.3 b
NFT 40.4 a z 11.6 a z 31.7 a 7.6 b z 1.6 c 4.9 a x 62.8 a 3,061.6 a 12,203.7 a 61.0 c 1,058.8 a
VC (%) 5.52 9.52 11.53 4.94 8.95 25.10 13.51 5.98 12.91 7.91 25.46
P <0.0001 0.0001 <0.001 0.0012 <0.0001 0.0003 0.0006 <0.0001 0.0012 0.0002 <0.0001
z Analysis of variance performed with data transformed to 1/√x. x Analysis of variance performed with data transformed to log(x). Means
followed by different letters in the columns differ by Tukey’s test according to the indicated probability (P). OBS.: NS = Not significant at 5%
probability in Tukey’s test. VC = Variation coefficient.

Page 1 of 6
Figure 1. Schematic of the self-compensating trough, showing (A) the front view, (B) cross-
section (section C-C’), and (C) sectional side view. Dimensions in mm. The compartments
are also indicated: (1) substrate deposition chamber, (2) wick strips of synthetic non-woven
mat (SNWM), (3) orifice for SNWM insertion spaced every 0.4 m, (4) lower reservoir for
nutrient solution storage, and (5) drainage orifice.
3 1
4 2
Section c-c’
4
2
c 3
c’ 1
3
2
4
5
1
A
B
C
Page 2 of 6
Figure 2. Wick irrigation system with leveled self-compensating troughs installed on a wood
support, micro reservoir with height regulation using mini float switch and tank.
Self-compensating troughs
Micro reservoir with
height regulation using
mini float switch
50 L-tank
Nutrient solution supply system
Page 3 of 6
Days after transplanting (DAT)
1 3 5 7 9 11 13 15 17 19 21 23 25 27 29
Rela
tive h
um
idit
y (
%)
10
20
30
40
50
60
70
80
90
100T
em
pera
ture
(oC
)
0
10
20
30
40
50
60
Relative humidity
Temperature
Figure 3. Temperature and relative humidity inside the greenhouse during the experimental
period. Horizontal dotted lines indicate the maximum (25 oC) and the minimum (15 oC)
temperature values for optimal lettuce growth.

Page 4 of 6
1 3 5 7 911
13
15
17
19
21
23
25
27
29
4
5
6
7
8
9
2D Graph 2
pH
4
5
6
7
8
9
4
5
6
7
8
9Pine bark/
WPB
Hydroponics/
NFT
Coconut coir/
WCC
0
2
4
6
8Pine bark/
WPB
Ele
ctr
ica
l c
on
du
cti
vit
y,
EC
(m
S. c
m-1
)
0
2
4
6
8
Days after transplanting (DAT)
1 3 5 7 911
13
15
17
19
21
23
25
27
290
2
4
6
8NS
Rep. 1
Rep. 2
Rep. 3
Hydroponics/
NFT
Coconut coir/
WCC
Figure 4. Variation of the hydrogen potential (pH) and electrical conductivity (EC) values of
pine bark (WPB) and coconut coir (WCC) substrates and hydroponics (NFT) nutrient
solution (NS). The black arrows indicate the addition of tap water to the tanks. The gray
arrows indicate substrate leaching with water to reduce the EC. The white arrows indicate
weekly replacement of NS to avoid nutrient concentration fluctuations.
Page 5 of 6
N-N
itra
te,
N-N
O3 (
mg
. L-1)
20
40
60
80
100
120
140
160
180
Pine bark (WPB)
Coconut coir (WCC)
pH
4.6
4.8
5.0
5.2
5.4
5.6
5.8
6.0
6.2
N.S.
Ele
ctr
ical co
nd
ucti
vit
y (
mS
. cm
-1)
0.5
1.0
1.5
2.0
2.5
3.0
EC WCC = 0.446 + 0.115*DAT - 0.00316*DAT2
R2 = 0.48
P = 0.019
N-A
mo
nia
cal, N
-NH
4 (
mg
. L-1)
-5
0
5
10
15
20
25
30
N-NH4 WCC = 7.082 + 1.710*DAT - 0.0554*DAT2
R2 = 0.56
P = 0.039
Ph
osp
oru
s,
P (
mg
. L-1)
15
20
25
30
35
40
45
P WCC = 13.985 + 3.165*DAT - 0.0996*DAT2
R2 = 0.55
P = 0.032P
ota
ssiu
m,
K+ (
mg
. L-1)
100
150
200
250
300
350
400
450
K+
WCC = 88.433 + 35.903*DAT - 1.000*DAT2
R2 = 0.72
P = 0.001
N.S.
Calc
ium
, C
a+
2 (
mg
. L-1)
0
50
100
150
200
250
N.S.
Mag
nesiu
m,
Mg
+2 (
mg
. L-1)
0
20
40
60
80
N.S.
Su
lfu
r, S
-SO
4 (
mg
. L-1)
0
20
40
60
80
100
S-SO4 WCC = 8.482 - 0.152*DAT
R2 = 0.42
P = 0.022 Bo
ron
, B
(m
g. L
-1)
-0.1
0.0
0.1
0.2
0.3
0.4
0.5
0.6
0.7B WCC = 0.133 + 0.0373*DAT - 0.000998*DAT
2
R2 = 0.50
P = 0.015
Co
pp
er,
Cu
+2 (
mg
. L-1)
-0.06
-0.04
-0.02
0.00
0.02
0.04
0.06
0.08
0.10
0.12
0.14
Iro
n,
Fe
+2 (
mg
. L-1)
-0.5
0.0
0.5
1.0
1.5
2.0
Fe+2
WPB = 0.661 - 0.0517*
DAT + 0.00160*DAT2
Fe+2
WCC = - 0.0703 + 0.0409*DAT
R2 = 0.774
P < 0.0001
R2 = 0.603
P = 0.016
Days after transplanting (DAT)
8 15 22 29
Man
gan
ese,
Mn
+2 (
mg
. L-1)
-0.4
-0.2
0.0
0.2
0.4
0.6
0.8
N.S.
Days after transplanting (DAT)
8 15 22 29
Zin
c,
Zn
+2 (
mg
. L-1)
-0.2
-0.1
0.0
0.1
0.2
0.3
0.4
Zn+2
WCC = -0.190 +
0.0419*DAT - 0.00104*DAT2
R2 = 0.60
P = 0.001
Days after transplanting (DAT)
8 15 22 29
Ch
lori
de,
Cl- (
mg
. L-1)
150
200
250
300
350
Cl- WCC = 12.439 + 22.373*DAT - 0.554*DAT
2
R2 = 0.70
P = 0.003
Days after transplanting (DAT)
8 15 22 29
So
diu
m,
Na
+ (
mg
. L-1)
15
20
25
30
35
40
Na+ WCC = 6.125 + 2.819*DAT - 0.0669*DAT
2
R2 = 0.63
P = 0.015
Cu+2
WPB = 0.00605 + 0.000154*Dia
R2 = 0.38
P = 0.034
Figure 5. Weekly hydrogen potential (pH), electrical conductivity (EC), macro and
micronutrients, chloride and sodium concentrations determined in different substrates with
lettuce cv. ‘Vanda’ plants. Each point indicates the average of three replications ± standard
error. The absence of regression lines indicates no significant trend (P > 0.05).
Page 6 of 6
Mag
nesiu
m,
Mg
+2 (
mg
. L-1)
26
28
30
32
34
36
38
40
Su
lfu
r, S
-SO
4 (
mg
. L-1)
11.0
11.5
12.0
12.5
13.0
13.5
14.0
14.5
15.0
NFT tank
WPB/WCC tank
Ph
osp
oru
s,
P (
mg
. L-1)
20
22
24
26
28
30
32
P WPB and WCC tank = 31.7433 -
0.6807*DAT + 0.0183*DAT2
R2 = 0.9995
P = 0.0228
S-SO4 NFT tank =
10.3905 + 0.1418*DAT
R2 = 0.9501
P = 0.0253
pH
4.4
4.6
4.8
5.0
5.2
5.4
5.6
5.8
6.0
6.2
6.4
6.6
Ele
ctr
ical co
nd
uti
vit
y,
EC
(m
S. c
m-1)
1.5
1.6
1.7
1.8
1.9
2.0
2.1
2.2
Nit
rog
en
, N
(m
g. L
-1)
0
20
40
60
80
100
120
140
160
180
200
N-NO3 NFT
N-NO3 wick tanks
N-NH4 NFT
N-NH4 wick tanks
Po
tassiu
m,
K+ (
mg
. L-1)
190
200
210
220
230
240
250
Calc
ium
, C
a+
2 (
mg
. L-1)
125
130
135
140
145
150
155
160
N.S. N.S. N.S.
N.S. N.S.N.S.
Co
pp
er,
Cu
+2 (
mg
. L-1)
-1.0
-0.5
0.0
0.5
1.0
1.5
2.0
2.5
3.0
3.5
4.0
Iro
n,
Fe
+2 (
mg
. L-1)
0.5
1.0
1.5
2.0
2.5
3.0 Fe+2
PB and CC tank = 1.6942 -
0.0496*DAT + 0.0029*DAT2
R2 = 0.9997
P = 0.0174
Man
gan
ese,
Mn
+2 (
mg
. L-1)
0.28
0.30
0.32
0.34
0.36
0.38
0.40
0.42
0.44
0.46
0.48Mn
+2 PB and CC tank = 0.4672 - 0.0149*DAT +
0.0004*DAT2
R2 = 0.9999
P = 0.0122
Cu+2
NFT tank = - 0.1841 + 0.1011*DAT
R2 = 0.9750
P = 0.0126
Bo
ron
, B
(m
g. L
-1)
0.32
0.34
0.36
0.38
0.40
0.42
0.44
0.46
0.48
0.50
N.S.
Days after transplanting (DAT)
8 15 22 29
Zin
c,
Zn
+2 (
mg
. L-1)
-1.5
-1.0
-0.5
0.0
0.5
1.0
1.5
2.0
2.5
3.0
3.5Zn
+2 NFT tank = - 0.4536 + 0.0879*DAT
R2 = 0.9361
P = 0.0325
Days after transplanting (DAT)
8 15 22 29
Bic
arb
on
ate
(m
g. L
-1)
0
20
40
60
80
100
120
N.S.
Days after transplanting (DAT)
8 15 22 29
So
diu
m,
Na
+ (
mg
. L-1)
16
18
20
22
24
26
28Na
+ NFT tank = 16.0936 + 0.3276*DAT
R2 = 0.9998
P < 0.0001
R2 = 0.9512
P = 0.0247
Na+ WPB and WCC tank =
14.4859 + 0.3326*DAT
Days after transplanting (DAT)
8 15 22 29
Ch
lori
de,
Cl- (
mg
. L-1)
100
120
140
160
180
200
N.S.
Figure 6. Weekly hydrogen potential (pH), electrical conductivity (EC), macro and
micronutrients, bicarbonate, chloride and sodium concentrations at different nutrient
solutions used for lettuce cv. ‘Vanda’ cultivation. Each point indicates the average of three
replications ± standard error. There were no significant regression curves for nutrients in the
NFT tank. The absence of regression lines indicates no significant trend (P > 0.05).