performance of farmer-preferred maize varieties intercropped
TRANSCRIPT

PERFORMANCE OF FARMER-PREFERRED MAIZE VARIETIES
INTERCROPPED WITH BEANS IN THE SEMI-ARID REGIONS OF
KENYA
Kitonyo, Onesmus Musembi
(B.Sc. Agriculture, UoN)
A THESIS SUBMITTED IN PARTIAL FULFILMENT OF THE REQUIREMENTS
FOR THE AWARD OF THE DEGREE OF MASTER OF SCIENCE
IN AGRONOMY
University ol NAIROBI Libraiy
0416583 3
DEPARTMENT OF PLANT SCIENCE AND CROP PROTECTION
FACULTY OF AGRICULTURE
UNIVERSITY OF NAIROBI
2010

DECLARATION
This thesis is my original work and has not been presented for a degree in any other
university.
Kitonyo, Onesmus Musembi
Signature....... .............................. Date...
This thesis has been submitted for examination with our approval as university supervisors.
Dr. George N. Chemining’wa
Department of Plant Science and Crop Protection
University of Nairobi
Signature.................... DateL . . 2 4 -aoio
Dr. James W. Muthomi
Department of Plant Science and Crop Protection
University o f Nairobi
Signature Dat
ii

DEDICATION
I wish to dedicate this piece of work to my family.
iii

ACKNOWLEDGEMENTS
I would like to thank the Almighty God for the gift o f life, good health and enabling me go
through the programme.
This work was made possible with funds provided by the project: “Mitigating Mycotoxin
Hazards in Maize and Maize Products in Kenya” under the auspices of the Kenya Agricultural
Productivity Programme (KAPP). Special thanks go to Dr. George Chemining'wa and Dr.
James Muthomi for their invitation to take up the project, their supervision, constructive
criticisms and guidance throughout the study. My thanks are extended to colleague students
Rose and Florence, the project research assistant, Ng’eno and the field assistant, Godfrey for
their assistance in data collection and monitoring of the crop.
My gratitude also goes to my parents, Mr and Mrs Kitonyo, sister Juliet and cousin Mecko for
their effort and moral support. Special appreciation to my loving family for standing by me
and their encouraging me throughout the entire period of my study.
iv

TABLE OF CONTENTSPage
DECLARATION............................................................................................................................ii
DEDICATION............................................................................................ iii
LIST OF TABLES..................................................................................................................... viii
LIST OF APPENDICES.............................................................................................................xi
ABSTRACT................................................................................................................................. xvi
CHAPTER ONE: INTRODUCTION.........................................................................................1
1.1 Background Information........................................................................................................... 1
1.2 Problem Statement and Justification........................................................................................ 4
1.3 Objectives.................................................................................................................................. 6
1.4 Hypotheses................................................................................................................................. 6
CHAPTER TWO: LITERATURE REVIEW ...........................................................................7
2.1 Importance of maize in food security...................................................................................... 7
2.2 Constraints to maize production in semi-arid areas................................................................ 8
2.3 Effects of drought stress on maize production..................................................................... 11
2.3.1 The magnitude o f maize grain loss attributed to drought................................................ 13
2.3.2 Maize phenological stages susceptible to drought............................................................. 14
2.3.3 Maize physiological traits affected by drought stress........................................................ 15
2.3.4 Maize traits associated with tolerance to drought...............................................................16
2.3.5 Traits of maize varieties bred for semi-arid areas.............................................................17
2.4 Effect of intercropping on performance of maize-bean intercrops.......................................18
2.5 Resource use in intercropping systems.................................................................................. 21
2.6 Indices for evaluating the performance of intercropping systems......................................25
CHAPTER THREE: MATERIALS AND M ETHODS........................................................28
3.1 Experimental sites....................................................................................................................28
3.2 Experimental design and treatments...................................................................................... 29
3.3 Data collection..........................................................................................................................^
v

3.4 Determination of maize and bean plant height....................................................................31
3.5 Determination of bean nodulation and dry matter accumulation....................................... 31
3.6 Determination of maize grain yield, yield components, shelling percentage and total stover
weight......................................................................................................................................31
3.7 Determination of bean seed yield and yield components...................................................32
3.8 Determination of maize harvest indices.................................................................................32
3.9 Assessment of intercropping productivity and monetary value........................................... 33
3.10 Data analysis..........................................................................................................................33
CHAPTER FOUR: RESULTS................................................................................................. 34
4.1 Effect o f maize variety and intercropping on plant height, plant stand, lodging and
biomass accumulation.............................................................................................................34
4.2 Effect of maize variety and intercropping on time to anthesis, silking and physiological
maturity....................................................................................................................................38
4.3 Effect of maize variety and intercropping on yield and yield components.......................42
4.4 Relationship among maize plant maturity, yield and yield components.............................55
4.5 Effect of intercropping on bean plant height and root nodulation......................................58
4.6 Effect o f intercropping on bean yield and yield components............................................. 62
4.7 Productivity and monetary value of intercropping...............................................................68
CHAPTER FIVE: DISCUSSION............................................................................................. 70
5.1 Effect of maize variety, intercropping and site on maize growth, flowering and maturity 70
5.2 Effect o f maize variety, intercropping and site on maize yield and yield components.....71
5.3 Effect of maize variety, intercropping and site on bean growth, yield and yield
components.............................................................................................................................. 73
5.4 Ecological and economic productivity of intercropping.......................................................75
CHAPTER SIX: CONCLUSIONS AND RECOMMENDATIONS...................................77
6.1 Conclusions.............................................................................................................................. 77
VI

6.2 Recommendations....................................................................................................................78
REFRENCES............................................................................................................................... 79
APPENDICES.............................................................................................................................102
vii

LIST OF TABLES
Table 1: Description o f maize and bean varieties used in the study....................................... 30
Table 2: Mean plant height (cm) at 57 DAE of sixteen maize varieties intercropped with
beans Mwea, Waruhiu and Machakos during 2008 short rains and 2009 long
rains............................................................................................................................... 35
Table 3: Mean plant stand count of sixteen maize varieties intercropped with beans in Mwea,
Waruhiu and Machakos during 2008 short rains and 2009 long rains...................... 36
Table 4: Mean lodging percentage of sixteen maize varieties grown in Mwea and Waruhiu
during 2007 short rains and 2009 long rains................................................................37
Table 5: Mean plant shoot biomass (t/ha) of sixteen maize varieties intercropped with beans
in Mwea, Waruhiu and Machakos during 2008 short rains and 2009 long rains...... 39
Table 6: Mean days after emergence (DAE) to 50% anthesis of sixteen maize varieties grown
in Mwea and Waruhiu during 2008 Short rains and 2009 Long rains.......................40
Table 7: Mean days after emergence (DAE) to 50% silking of sixteen maize varieties grown
in Mwea and Waruhiu during 2008 Short Rains and 2009 Long rains......................41
Table 8: Mean days after emergence (DAE) to 50% physiological maturity of sixteen maize
varieties grown in Mwea and Waruhiu during 2008 short rains and 2009 long
rains................................................................................................................................ 43
Table 9: Mean grain yield (t/ha) of sixteen maize varieties grown in Mwea and Waruhiu
during 2008 short rains and 2009 long rains............................................................... 44
Tabic 10: Mean number of ears per plant of sixteen maize varieties grown in Mwea and
Waruhiu during 2008 short rains and 2009 long rains.............................................45
Table 11: Mean cob length (cm) of sixteen maize varieties grown in Mwea and Waruhiu
during 2008 short and 2009 long rains......................................................................47
Table 12: Mean number of kernel-rows per cob of sixteen maize varieties grown in Mwea
and Waruhiu during 2008 short rains and 2009 long rains..................................... 48
VII!

and Waruhiu during 2008 short rains and 2009 long rains.....................................50
Table 14: Mean 100 kernel weight of sixteen maize varieties grown in Mwea and Waruhiu
during 2008 short rains and 2009 long rains............................................................51
Table 15: Mean shelling % of sixteen maize varieties grown in Mwea and Waruhiu during
2008 short rains and 2009 long rains........................................................................53
Table 16: Mean harvest index (HI) of sixteen maize varieties grown in Mwea and Waruhiu
during 2008 short rains and 2009 long rains............................................................54
Table 17: Pearson correlation coefficients relating maize grain yield, crop development and
yield components in Mwea, 2008 short rains.......................................................... 55
Table 18: Pearson correlation coefficients relating maize grain yield, crop development and
yield components in Mwea, 2009 long rains........................................................... 56
Table 19: Pearson correlation coefficients relating maize grain yield, crop development and
yield components in Waruhui 2008 short rains.......................................................57
Table 20: Pearson correlation coefficients relating grain yield, development and yield
components in Waruhiu, 2009 long rains.................................................................59
Table 21: Mean plant height at 43 (cm) days after emergence (DAE) of KB 1 bean
intercropped with sixteen maize varieties grown in Mwea, Waruhiu and Machakos
during 2009 long rains...............................................................................................60
Table 22: Mean nodule count at 21 days after emergence (DAE) and at 50% flowering of KB
1 bean intercropped with sixteen maize varieties in Machakos, Mwea and
Waruhiu during 2009 long rains...............................................................................61
Table 23: Mean shoot biomass (g/M2) at 21 days after emergence (DAE) and at 50%
flowering of KB 1 bean intercropped with sixteen maize varieties grown in Mwea,
Waruhiu and Machakos during 2009 long rains......................................................63
Table 13: Mean number of kernels per cob-row o f sixteen maize varieties grown in Mwea
IX

Table 24: Mean grain yield (kg/ha) and percent yield decline of KB 1 bean intercropped with
sixteen maize varieties grown in Mwea, Waruhiu and Machakos during 2009 long
rains..............................................................................................................................64
Table 25: Mean number of pods per plant and seeds per pod of KB 1 bean intercropped with
sixteen maize varieties grown in Mwea, Waruhiu and Machakos during 2009 long
rains..............................................................................................................................66
Table 26: Mean 100 seed weight of KB 1 bean intercropped with sixteen maize varieties
grown in Mwea, Machakos and Waruhiu during 2009 long rains..........................67
Table 27: Mean Land Equivalent Ratio (LER) and Monetary Advantage Index (MAI) of
intercropping KB 1 bean with sixteen maize varieties in Mwea and Waruhiu
during 2009 long rains............................................................................................... 69
x

LIST OF APPENDICES
Appendix 1: Soil characteristics of Mwea, Waruhiu and Machakos experimental sites in 2008
short rains and 2009 long rains...................................................................................... 102
Appendix 2: Weather data of Kenya Agricultural Research Institute-Mwea, Waruhiu
Agricultural Training Centre and Machakos Agricultural Training Centre for 2008 short rains
and 2009 long rains......................................................................................................................102
Appendix 3 a: Analysis of variance (ANOVA) table for plant height at 57 DAE for sixteen
maize varieties intercropped with beans in Mwea and Waruhiu during 2008 short
rains.................................................................................................................................. 103
Appendix 3 b: Analysis of variance (ANOVA) table for plant height at 57 DAE for sixteen
maize varieties intercropped with beans in Mwea, Waruhiu and Mwea during 2009
long rains..........................................................................................................................103
Appendix 4 a: Analysis of variance (ANOVA) table for plant stand count at 57 DAE for
sixteen maize varieties intercropped with beans in Mwea and Waruhiu during 2008
short rains........................................................................................................................104
Appendix 4 b: Analysis of variance (ANOVA) table for plant stand count at 57 DAE for
sixteen maize varieties intercropped with beans in Mwea, Waruhiu and Machakos
during 2008 short rains.................................................................................................. 104
Appendix 5 a: Analysis of variance (ANOVA) table for lodging % of sixteen maize varieties
intercropped with beans in Mwea and Waruhiu during 2008 rains rains...................105
Appendix 5 b: Analysis of variance (ANOVA) table for lodging % of sixteen maize varieties
intercropped with beans in Mwea and Waruhiu during 2009 long rains....................105
Appendix 6 a: Analysis of variance (ANOVA) table for shoot biomass (t/ha) sixteen maize
varieties intercropped with beans in Mwea and Waruhiu during 2008 short rains... 106
xi

2009 long rains...............................................................................................................106
Appendix 7 a: Analysis of variance (ANOVA) table for days to 50% anthesis of sixteen
maize varieties intercropped with beans in Mwea and Waruhiu during 2008 short
rains.................................................................................................................................107
Appendix 7 b: Analysis of variance (ANOVA) table for days to 50% anthesis of sixteen
maize varieties intercropped with beans in Mwea and Waruhiu during 2009 long rains
rains.................................................................................................................................. 107
Appendix 8 a: Analysis of variance (ANOVA) table for days to 50% silking of sixteen maize
varieties intercropped with beans in Mwea and Waruhiu during 2008 short rains.... 108
Appendix 8 b: Analysis of variance (ANOVA) table for days to 50% silking of sixteen maize
varieties intercropped with beans in Mwea and Waruhiu during 2009 long rains..... 108
Appendix 9 a: Analysis of variance (ANOVA) table for days to 50% physiological maturity
o f sixteen maize varieties intercropped with beans in Mwea and Waruhiu during 2008
short rains......................................................................................................................... 108
Appendix 9 b: Analysis of variance (ANOVA) table for days to 50% physiological maturity
of sixteen maize varieties intercropped with beans in Mwea and Waruhiu during 2009
long rains.......................................................................................................................... 109
Appendix 10 a: Analysis of variance (ANOVA) table for grain yield (t/ha) of sixteen maize
varieties intercropped with beans in Mwea and Waruhiu during 2008 short rains....109
Appendix 10 b: Analysis of variance (ANOVA) table for grain yield (t/ha) of sixteen maize
varieties intercropped with beans in Mwea and Waruhiu during 2009 long rains..... 109
Appendix 11 a: Analysis o f variance (ANOVA) table for ears per plant of sixteen maize
varieties intercropped with beans in Mwea and Waruhiu during 2008 short rains— 110
Appendix 6 b: Analysis o f variance (ANOVA)table for shoot biomass (t/ha) for sixteen
maize varieties intercropped with beans in Mwea, Waruhiu and Machakos during
xn

varieties intercropped with beans in Mwea and Waruhiu during 2009 long rains..... 110
Appendix 12 a: Analysis o f variance (ANOVA) table for cob length of sixteen maize
varieties intercropped with beans in Mwea and Waruhiu during 2008 short rains.... 110
Appendix 12 b: Analysis of variance (ANOVA) table for cob length of sixteen maize
varieties intercropped withbeans in Mwea and Waruhiu during 2009 long rains.....111
Appendix 13 a: Analysis of variance (ANOVA) table for kernel rows per cob of sixteen
maize varieties intercropped with beans in Mwea and Waruhiu during 2008 short
rains.................................................................................................................................. 111
Appendix 13 b: Analysis of variance (ANOVA) table for kernel rows per cob of sixteen
maize varieties intercropped with beans in Mwea and Waruhiu during 2009 long
rains.................................................................................................................................. 111
Appendix 14 a: Analysis of variance (ANOVA) table for 100 kernel weight of sixteen maize
varieties intercropped with beans in Mwea and Waruhiu during 2008 short rains.... 112
Appendix 14 b: Analysis of variance (ANOVA) table for 100 kernel weight of sixteen maize
varieties intercropped with beans in Mwea and Waruhiu during 2009 long rains.....112
Appendix 15 a: Analysis of variance (ANOVA) table for shelling % of sixteen maize
varieties intercropped with beans in Mwea and Waruhiu during 2008 short rains.... 112
Appendix 15 b: Analysis of variance (ANOVA) table for shelling % of sixteen maize
varieties intercropped with beans in Mwea and Waruhiu during 2009 long rains.....113
Appendix 16 a: Analysis of variance (ANOVA) table for harvest index of sixteen maize
varieties intercropped with beans in Mwea and Waruhiu during 2008 short rains.... 113
Appendix 16 b: Analysis of variance (ANOVA) table for harvest index ot sixteen maize
varieties intercropped with beans in Mwea and Waruhiu during 2009 long rains.....113
Appendix 17: Analysis of variance (ANOVA) table for plant height ol KB1 bean at 43 DAE
intercropped with sixteen maize varieties during 2009 long rains
Appendix l i b : Analysis o f variance (ANOVA) table for ears per plant o f sixteen maize
xiii
114

sole crop and intercropped with sixteen maize varieties during 2009 long rains...... 114
Appendix 18b: Analysis of variance (ANOVA) table for nodule count per plant at 50%
flowering of KB 1 bean variety grown in Mwea, Waruhiu and Machakos under sole
crop and intercropped with sixteen maize varieties during 2009 long rains.............. 114
Appendix 19: Analysis of variance (ANOVA) table for shoot biomass (g/m2) at 50%
flowering of KB 1 bean variety grown in Mwea, Waruhiu and Machakos under sole
crop and intercropped with sixteen maize varieties during 2009 long rains.............. 114
Appendix 20: Analysis of variance (ANOVA) table for seed yield (kg/ha) of KB 1 bean
intercropped with sixteen maize varieties in Mwea, Waruhiu and Machakos during
2009 long rains.................................................................................................................115
Appendix 21: Analysis of variance (ANOVA) table for percent yield decline of KB 1 bean
intercropped with sixteen maize varieties in Mwea, Waruhiu and Machakos during
2009 long rains.................................................................................................................115
Appendix 22: Analysis of variance (ANOVA) table for pods per plant of KB 1 bean
intercropped witfi sixteen maize varieties in Mwea, Waruhiu and Machakos during
2009 long rains.................................................................................................................115
Appendix 23: Analysis of variance (ANOVA) table for seeds per pod of KB 1 bean
intercropped with sixteen maize varieties in Mwea, Waruhiu and Machakos during
2009 long rains.................................................................................................................115
Appendix 24: Analysis of variance (ANOVA) table for 100 seed weight (gms) of KB 1 bean
intercropped with sixteen maize varieties in Mwea, Waruhiu and Machakos during
2009 long rains.................................................................................................................116
Appendix 18 a: Analysis of variance (ANOVA) table for nodule count per plant at 21 days
after emergence of KB 1 bean variety grown in Mwea, Waruhiu and Machakos under
xiv

Appendix 25: Analysis of variance (ANOVA) table for Land Equivalent Ratios of KB 1 bean
intercropped with sixteen maize varieties in Mwea, Waruhiu and Machakos during
2009 long rains................................................................................................................116
Appendix 26: Analysis of variance (ANOVA) table for Monetary Advantage Index (MAI) in
Kshs of KB 1 bean intercropped with sixteen maize varieties in Mwea, Waruhiu and
Machakos during 2009 long rains.................................................................................116
xv

ABSTRACT
Recurrent droughts are often associated with maize crop failures and therefore food insecurity
especially in semi-arid areas o f Kenya. To cope with drought, farmers are advised to adopt
drought tolerant maize varieties and maize-legume intercropping as a diversification strategy.
As such, a study was conducted in Machakos, Mwea and Waruhiu in 2008 short rains and
2009 long rains to determine the performance of maize varieties currently grown in the semi-
arid regions and their compatibility with a commonly grown bean variety Katumani bean 1,
KB 1. Sixteen maize varieties sold by seed stockists in the semi-arid regions were evaluated.
The maize varieties comprised two composites, Katumani and KCB, and fourteen hybrids
which included the DHO series (DHO 1, DHO 2, DHO 4), the Five series (H513, H515,
H516), H614D, Duma 43, DK 8031, the Pannar series (Pannar 4M, Pannar 67, Panner 77 and
Pannar 7M) and pioneer hybrid (PHB 3253). The maize varieties were grown either as sole
crops or as intercrops with KB 1. The experiments were laid out in a randomized complete
block design with a split plot arrangement and replicated three times. Maize variety was
assigned to the main plot while the maize-bean intercrop system was assigned to the sub plot.
Data collected included maize plant height at 57 days after emergence (DAE), bean plant
height at 43 DAE, bean nodulation, plant shoot biomass, plant stand count, lodging
percentage, DAE to 50% flowering and maturity o f maize, maize and bean yield and yield
components. Land equivalent ratio (LER) and Monetary Advantage (MA) indices were
calculated to evaluate ecological and economic productivity of intercropping.
In 2008 short rains the component crops were severely affected by drought at Machakos
before any data could be obtained while the beans component dried up at seedling stage at
Mwea and Waruhiu. During 2009 short rains in Machakos. the maize component dried at the
flowering stage but its shoot biomass data was collected. Results showed that performance of
’ maize was not significantly affected by the bean component in a maize/bean intercrop system.
xvi

Maize flowered and matured significantly earlier in Mwea (60.3 and 108.1 DAE respectively)
than in Waruhiu (75.3 and 118.5 DAE respectively). KCB and Katumani composites took
significantly shorter time (88 DAE) to mature than the rest of the varieties. Among the DHO
series, DHO 1 and DHO 2 took significantly shorter time to mature (average 101.6 DAE) than
DHO 4 which took 122 DAE. The Five series took an average of 120.9 DAE to mature while
the Pannar series took an average of 117.2 DAE to mature. DK 8031, Duma 43 and PHB
3253 took 112, 114.4 and 117.2 DAE respectively to mature. H614D took significantly the
longest duration of 131.5 DAE to mature. Maize varieties differed significantly in grain yield
and yield components. Significant differences in grain yield were noted in 2009 long rains
with Duma 43 giving the highest grain yield of 2.9 t ha 1 while H614D gave the least grain
yield of 1.33 t ha'1. Variety PHB 3253 which was among the high yielding varieties had
significantly more number of kernel-rows per cob. Harvest index was inversely related to time
taken to physiological maturity. Thus, the early maturing varieties were more efficient in
growth resource allocation to the grain. The late maturing varieties had low harvest indices.
Varieties KCB, Katumani, DHO 1 and DHO 2, which had high harvest indices, manifested
high lodging percentages.
Performance of beans was significantly affected by the maize component in the intercrop
system and bean yields were depressed by 51.5% to 58.9%. The declined bean seed yields are
also associated with reduced pods per plant and number of seeds per pod by the intercrop
beans as opposed to the sole crop beans. However, according to LER and monetary advantage
indices, intercropping was ecologically and economically superior to sole cropping.
The results indicate that varieties KCB, Katumani, DHO 1 and DHO 2 may be suitable tor the
semi-arid regions because they flower significantly early. Since several researchers have cited
X V I 1

early withdrawals of rainfall especially at flowering stage, these early maturing varieties can
therefore escape drought if planted early in the growing season.
xvi 11

CHAPTER ONE: INTRODUCTION
1.1 Background Information
The world’s human population is estimated to have reached 8 billion and growing at 2.2
percent yearly (U.S Census Bureau, 2008). The Kenya population estimated at 38 million is
growing at the rate of 2.8% per annum (Kenya National Bureau of Statistics, 2008). How to
feed these growing ranks is a formidable challenge of all mankind.
Globally, maize (Zea mays L.) is essential for food security after rice and wheat (Campos et
al., 2004). The current global acreage of maize is over 142 million hectares and production
records are over 637 million metric tonnes (MT) with USA taking the lead at an average yield
of 3.41 MT per hectare (FAO, 2003). However, demand for maize in the developing world is
expected to surpass both wheat and rice by 2020 meaning that maize supplies need to double
to meet the demand (IFPRI, 2000). Maize is the most widely grown staple crop in Africa, and
is the main food source for more than 300 million Africans. Maize requirements will increase
from 282 million tonnes in 1995 to 504 million tonnes in 2020, posing a challenge to the
developing countries (IFPRI, 2000; Pingali, 2001). Kenya’s national maize production for
year 2008 was 2.43 million MT or 27 million 90 kg bags against a national consumption of
3.15 million MT or 35 million 90 kg bags (Ministry of Agriculture, 2009a). The national
maize output for the 2009 production season was projected to be about 2.16 million Ml
(Ministry of Agriculture, 2009a), thus a deficit of 190,000 MT was anticipated.
Grain legumes are important in the developing countries for dietary requirements. The bulk ot
protein intake in these countries comes from legumes with the common beans (Phaseolus
vulgaris L.) taking the largest proportion (Mauyo et al., 2003). Its importance in nutrition
security in Africa is evident by multiple research work to improve its productivity per unit
area and expand its productivity in marginal areas. Recently, development and utilization of
1
biofortified bean varieties is an effective and sustainable strategy for reducing micronutrient
deficiencies in Africa (Pan-African Bean Research Alliance, 2007). In the year 2008, total
production o f beans in Kenya was approximated to be 2.9 million 90 kg bags against an
estimated consumption level o f 6.6 million 90 kg bags (Ministry of Agriculture, 2009b).
These growing deficits are a challenge to Kenya’s food security, the chief millennium
development goal (Mabesa, 2008). These deficits are compounded by increasing population
hence the urgency to expand food production.
Production of maize and beans in Kenya is rainfed with small acreages under irrigation,
especially for seed maize and export beans. Kenya is divided into seven agro-climatic zones
governed by moisture regimes for growing major food and cash crops. Based on the agro-
climatic zonation, 18% of Kenya’s land mass is potentially arable with over 80% falling under
arid and semi-arid lands. Agroecological zone///, the transitional zone, is the maize basket
for Kenya. Further, over 80% o f the cultivated land in ASALs is under maize and beans hence
the need to improve productivity of these crops in these areas. Many maize and beans
varieties have been released for cultivation in the various agro-climatic zones. Maize and
beans are grown in a wide range of soils incluiding andosols. vertisols, phaeozomes,
cambisols, luvisols, nitisols, acrisols and ferralsols (Muchene at al., 1988).
Maize research in Kenya is organized to serve broadly defined adaptation zones. There arc six
maize growing agro-climatic zones in Kenya, which are defined by altitude, total rainfall per
annnum, length of growing season and maturity period of adapted maize varieties (Hassan et
al., 1998; FAO, 2000). Since the early 1960s the objective of maize improvement research in
Kenya was to develop maize germplasm to suit four environments: late maturing varieties for
the highland tropics (HT). medium maturing varieties for non-moisture-stressed mid-altitudes
(MAT), early maturing varieties for moisture-stressed MAP (semi-arid), and lowland varieties
?

for the humid low tropics (LT) which covers the coastal belt. These environments were
defined on the basis of altitude and moisture availability and arc consistent with the
CIMMYT’s categories for maize mega environments (Hassan and Njoroge, 1996). Farmers
use a variety of seed maize including local landraces, composites and hybrids. Many maize
farmers may be growing maize varieties that are not really recommended for their regions.
Since maize is the main staple food for over 90% of the Kenya population, maize crop
occupies a number of agro- ecological zones in the country compared to other crops (KARI,
2006; Ngesa, 1993; James, 2003) with the bulk o f production coming from small holder
farmers (Muui, 2007). In most areas, maize is intercropped or rotated with other crops such as
common bean, pigeon pea, soybean, groundnut, dolicho beans, sweet potato, Irish potato or
cowpea (Almelikinders and Louwtfars, 1999). In the semi-arid areas maize is commonly
intercropped or rotated with the common beans (Muthamia et al., 2001). When intercropped
with beans, maize is usually the primary component while the bean is the secondary
component.
The major constraints to maize and bean production in the semi-arid regions are water stress
and declining soil fertility (Diallo, 2004). These problems are compounded by increased
frequencies of drought and continuous cultivation of the fragile ASALs (Gachimbi et al.,
2002; Mafongoya et al., 2006; Nyariki, 2007). Rainfall variability from season to season has
been shown to reduce maize yields in semi-arid eastern Kenya (Kinama et al., 2007). These
constraints have led to a corresponding decline in crop yields, hence food insecurity,
dependence on food aid and environmental degradation. As a result, maize and bean yields
have considerably declined to less than 1 t ha'1 and 0.5 t ha"1, respectively (Jagtap and Abamu,
2003). However, there exists potential to boost maize and bean yields to 6 t/ha and 5t/ha
respectively through deploying genes of drought tolerance and use appropriate agronomic

practices. In 2006, average maize grain yield in Kenya ranged from 1.35 t/ha to 1.75 t/ha
(Economic Review of Agriculture, 2006). A lot o f research has been done in an effort to
counter these problems. Breeding programmes have released drought tolerant maize and bean
varieties o f short cycle and inherent adaptability as a priority for addressing food deficit
problems in the ASALs. Maize-bean intercropping has been promoted to increase
productivity per unit area and to diversify risks in times of poor weather. In their study,
Mafongoya et al. (2006) suggested that legumes can be used to diversify farm system
productivity. Thus, during harsh conditions, farmers who practice intercropping can at least
get a portion of either crop (Trenbath, 1999).
1.2 Problem Statement and Justification
Maize is widely grown and a highly valued staple food crop in Kenya. Despite its importance,
its yield is very low, thus creating food deficits. Households in the semi-arid areas are net
importers o f maize staple (Kinama et al., 1997). Droughts which are associated with late
arrival and early withdrawal of rains culminating to inadequacy and poor distribution are cited
as the major constraints to maize production and productivity in the semi arid areas
(Gachimbi et al., 2002; Diallo, 2004). This phenomenon adversely affects maize crops which
account for more than 80% of the total cultivated land in the semi arid areas. Rainfall in these
regions is bimodal with the October-December short rains season being more reliable than the
March-June long rains season. Average rainfall in the ASALs of 250 - 300 mm is below the
optimal 600 - 800 mm required for a good maize crop in the tropics (Kinama et al., 1990).
The frequent droughts are associated with expansive crop failure thus heightened food
insecurity (Mwikya, 2009). However, to cope with the vagaries of droughts farmers have
adopted drought tolerant maize varieties and maize-bean intercropping as a risk
diversification strategy (Muthamia et al., 2001). Farmers who intercrop maize with beans are
4

assured o f some yield per unit area. Breeding activities by the Kenya Agricultural Research
Institute, Kenya Seed Company and private companies have produced what are considered to
be drought tolerant maize varieties. Varieties Katumani and Katumani composite B (KB 1)
were developed for drought escape and avoidance via early maturity (Mugo et al., 1998). The
Kenya Seed Company released the dryland hybrids, DUO 1 and DHO 2, in 1995. These
maize varieties alongside other varieties have been adopted for cultivation. The National
Drylands Research Centre-Katumani developed a drought tolerant bean variety KB 1 whieh is
widely adopted for intercrop and sole crop systems in the region. Various researchers have
emphasized the development o f drought tolerant crop varieties of short cycle as a priority in
addressing the food deficit problems in the ASALs (Hometz et a l, 2000; Shisanya, 2002).
Despite these efforts to deploy drought tolerance in maize and in addition tailored cropping
systems, crop failures due to drought'persist. Intercropping of maize with legumes such as
common bean, pigeon pea and cowpea has been widely practiced in pursuit of improved
productivity per unit area and resource use efficiency. The liberalization of the seed industry
in 1993 has led to many players that trade in seed (Nyoro, 2003; Waiyaki et al., 2006). As a
result, farmers have access to a wide range of seed maize comprising composites, hybrids and
even local materials hence the risk of growing what may not be recommended for these
regions.
A significant knowledge gap exists in the adaptability of the currently grown varieties and the
extent of drought tolerance of the so called drought tolerant maize varieties recommended for
the semi arid regions. Farmers may not be growing what is really recommended tor these
regions. Further, maize plus bean intercrops, which are most prevalent in these areas, may not
necessarily give the best returns in terms of yield or cash because tanners do not necessarily
select the most compatible maize varieties for intercropping. Little has been published on the
compatibility of these maize varieties with the most commonly grown bean varieties.
5

Moreover, studies on maize-bean intercropping have highlighted contrasting results on the
effect of intercropping on maize and bean yields.
Clear demonstration o f the performance of the currently grown varieties may influence
decision making of fanners, government (ministry of agriculture), maize seed stockists, Non
governmental organizations (NGOs) and other agricultural sector stakeholders in terms of
which maize varieties and cropping system are most suitable in the semi arid areas of Kenya.
Therefore, this study was designed to evaluate the agronomic performance of farmer-
preferred maize varieties and the performance of these varieties under sole and bean-intercrop
systems in the semi-arid areas o f Kenya.
1.3 Objectives
This study was conceived with the following specific objectives:
1. To determine the agronomic performance of maize varieties that are currently grown
in the semi-arid areas.
2. To determine the compatibility of maize varieties that are currently grown in semi-arid
areas with KB 1 bean variety under an intercrop system.
1.4 Hypotheses
1. All maize varieties grown in the semi-arid areas of Kenya are drought tolerant.
2. All maize varieties grown in semi-arid areas are compatible with KB 1 bean variety
under an intercrop system.
6

CHAPTER TWO: LITERATURE REVIEW
2.1 Importance of maize in food security
Maize (Zea mays L.) is the most important staple crop in Kenya for over 90% of the
population with the small holder farming systems accounting for about 75-80% of the total
production (Muui et al., 2007). Maize provides more than a third o f the calories and proteins
consumed in the country (Jayne et al., 2001; Wekesa et al., 2003; CIMMYT, 2009). The per
capita consumption of maize in Kenya is approximately 125 kg per year (Pingali, 2001). Its
key importance in food security is evidenced by the total area under maize crop. Virtually
every farmer in the country grows maize even in the harshest environments. The main food
crop consumption levels in the year 2008 were estimated to be: maize - 36 million 90 kg bags,
wheat - 10 million 90 kg bags, rice - 0.3 million 90 kg bags, beans - 6.5 million 90 kg bags
and Irish potatoes - 3.4 metric tonnes (Ministry of Agriculture, 2009).
When the national food production levels are constrained, maize grain importation takes the
greatest share of the government expenditure on food importation. Further, food security in
the country is pegged on the number of maize grain bags harvested or the projected maize
grain harvest. The strategic grain reserve in the country which is majorly maize grain reserve
has been proposed to be raised from 4 million to 6 million 90 kg bags by the end of
2010/2011 financial year (Ministry of Agriculture, 2009). These statistics show the
importance of maize in food security in the country. The initiation of a comprehensive maize
research program in 1955, which developed and released more than twenty varieties in the
ensuing five decades (Hassan and Karanja, 1990) clearly shows the importance of maize in
the country. Correspondingly, the adoption of maize varieties post-1965 was taster than the
spread o f hybrid maize among U.S. Com Belt fanners in the 1930's and 1940 s (McCann,
2005). Projecting to the future, maize, with its versatile production systems, high yield
7

potential and ease of processing, marketing and storage for consumers has considerable
potential in reversing the downward vicious cycle of food production in Africa. Since maize is
the principal staple food crop produced and consumed by most households in Kenya, it is
viewed to be a socially, economically and politically important crop (Brooks et al., 2009).
2.2 Constraints to maize production in semi-arid areas
Maize yields have been on the decline as indicated by the yield gap between experimental
research station plots and average yields that farmers typically realize on their farms.
Generally, declining per capita food production is attributed to biotic and abiotic stresses
(Muchena, 2000; DeVries and Toenniessen, 2001). The biotic constraints include insect pests,
diseases and weeds while the abiotic constraints comprise water stress, high temperatures and
low soil fertility. Other constraints include lack of certified seed, high prices of farm inputs
and high cost and unavailability of farm labour (Almelikinders and Louwaars, 1999; Pingalis,
2001; Vanlauwe et al., 2008). The significance of these factors varies across Kenya's agro-
ccological zones (Mwangi et a l, 2004). However, drought and declining soil fertility are
frequently cited as the most limiting factors to maize production and productivity in the semi-
arid tropics (Diallo et al., 2004). Low and poorly distributed rainfall constrains production at
flowering and tasseling stages (Kinama et al., 1990).
Attack by insect pests especially the stem borers is consistently cited as a major constraint to
maize production everywhere in the country (Hassan et al., 1998; De Groote, 2002).
Stemborers, including Chilo partellus, C. orichalcociliellus, Busseola fusca, Elciana
saccharina and Sesamia calamistis, are estimated by Kenyan farmers to cause losses of
around 15 per cent and in some areas are recognized as the most severe pest problem facing
maize production (De Groote, 2002; Mugo et al., 2002) by contributing up to 80% grain yield
losses (Kfir et al., 2002). The spotted stem borer (Chilo pertellus) and the African stem borer
8

(Busseola fused) are of greater economic importance in Kenya (Songa et al., 2001 and Songa
et al., 2002a). Stem borers are most destructive at the larval stage when they tunnel inside the
stalk after hatching thus making them very difficult to control. Once inside, their feeding may
lead to dead heart, reductions in the number of ears, or structural damage which predisposes
the plant to lodging (Nderitu, 1999; Mugo et al., 2001). In some cases, the pests also attack
maize ears making the cobs vulnerable to cob rots, such as Aspergillus Jlavus, which produce
harmful aflatoxins. Other maize insect pests include field pests such as African armywomi,
African boll worm, maize aphids, cutworms, leafhoppers, white grabs, termites and storage
pests which include angoumois grain moth, the larger grain borer, the lesser grain borer,
maize weevil and the red flour beetle. Diseases of economic importance include grey leaf
spot, head and ear smut, northern leaf com blight, maize streak virus and ear rots. Weeds of
high economic impotance include purple witch weed (Striga spp.), cotich grass (Cynodon
dactylon) and Cyperus rotundas.
Soils in the semi-arid regions have been over-cultivated, eroded and thus highly depleted of
nutrients. Several decades of nutrient depletion have transformed originally fertile soils that
yielded 2 to 4 tonnes/ha of cereal grain into infertile ones where cereal crop yields of less than
1 ton/ha are common (Qureshi, 1991; Swift et al., 1994; Kapkiyai, 1996; Bekunda et al.,
1997). Besides, the semi-arid areas are experiencing a profound change due to rapid
population growth partially caused by increased migration from densely populated high
potential areas to these marginal rainfall areas in search of new farmland (Gachimbi et al.,
2002). When they move, farmers continue to use the production technologies common in their
place of origin, but which are inappropriate to the conditions in the new area and sometimes
have disastrous consequences to the natural resource base of the semi-arid lands. This
migratory trend has increased the population density in semi-arid areas, intensifying pressure
9

on land and heightening the risk of farther degrading soils in these zones (Kinama, 1997 and
Gachimbi et al., 2002).
Land degradation is becoming a significant problem in the semi arid regions (Stoorvogel et
al., 1993 and Smaling, 1998). Enormous quantities of nutrients are mined from the soils or
lost from the system during cultivation resulting in reduced quantities of organic matter and
low levels o f N and P. Semi-arid land soils vary in depth depending on parent material and
slope. They are generally low in organic matter and deficient in nitrogen and phosphorus but
with adequate levels of Potassium (Kwabiah et al., 2003). Low infiltration rates and
susceptibility to surface sealing make the soils prone to erosion as heavy rains fall mainly at
the beginning of growing seasons when the land is bare (Jaetzold and Schimidt, 1983; Kilewe
and Mbuvi, 1987; Gachimbi, 1996). Signs of declining soil fertility in semi-arid regions are
characterized by weak and stunted crops, low yields, failure of crops to flower, appearance of
weeds characterizing poor soil fertility, hard and compacted soils which are easily eroded
(Gachimbi et al., 2002).
Drought is prioritized as the major constraint to maize production and productivity in the
semi-arid regions of Kenya. The arid and semi-arid lands that cover approximately 80 per cent
of Kenya have long experienced water shortages and drought due to unreliable and poorly
distributed rains. Maize and other food crop yields in these regions have been seriously
depressed putting lives and livelihoods at greater risk (Hassan et al., 1998). The problem of
recurrent droughts is being compounded by climate change whose effects are damaging to
livelihoods in the ASALs. The phenomenon of droughts is the main reason why this region is
a net importer of food maize during most years (Hassan et al., 1993).
10

Other major constraints to small scale farmers include lack of seed, low use o f fertilizers, poor
storage facilities and lack of farm labour. Seed maize is expensive thus many farmers usually
recycle their seed including the hybrids. Recycling of seed is associated with compromised
maize grain yield. The informal seed sector and unscrupulous seed traders have increased use
of uncertified seed maize hence contributing to reduced yields (Waiyaki et al., 2006). Low
and inefficient use o f fertilizer and manures is compounding the problem of declining
productivity per unit area. Lack of good storage facilities is a constraint which has led to fatal
aflatoxin contamination. Deaths have been reported in southeastern Kenya following
consumption of aflatoxin contaminated maize. Land preparation in these areas relies on oxen
draught or tractor power. Due to the mechanization dilemma associated with semi-arid areas,
land preparation is always late, seasons are prolonged and the crops do not get sufficient
water requirements for growth. Every day planting is delayed may lead to about 1-2% maize
grain yield loss (AIC, 2002).
2.3 Effects of drought stress on maize production
By definition drought stress is a water deficit factor that limits resource capture and utilization
(Karteji et al., 2003). Rainfall is the single most important factor affecting agriculture in
Africa, largely determining the agricultural potential, the crops grown, the farming systems
followed and the sequence and timing of growing operations. Farmer and Wigley (1985)
conceived three categories of drought. One, meteorological drought, when precipitation is
significantly below expectation for a given time of year and location. Two, hydrological
drought, when the water resources used for agriculture, human and animal consumption and
industry become depleted. This is usually manifest in low levels ot rivers, lakes, reservoirs
and ground water. Three, agricultural drought, when water supplies used directly for

agriculture are scarce and there is a constantly high soil moisture deficit over the growing
season.
Semi-arid areas depend solely on rain-fed agriculture, thus, this study will confine the
definition o f drought to meteorological drought. Meteorological drought leads to depletion of
soil moisture and this almost always has an impact on crop production. Drought may be
prolonged due to a total failure o f rains, but it is more likely to be sporadic, and to result from
rains which start late and/or finish early. Entirely, the erratic nature of drought impedes
breeding for drought tolerance.
Drought stress of short duration is common during the life cycle of maize in rainfed
production areas. Substantial reductions in grain yield can be attributed to unfavorable
production environments, of which water stress is a major limiting factor (Boyer, 1982).
Drought decreases water availability hence changing the plant water status, which in turn
affects the gaseous exchange in the short term and carbon balance in the long term (Katcrji et
al., 2003). Drought affects maize yields by restricting season length and through
unpredictable stress that can occur at anytime during the cropping cycle (Edmeades et al.,
1994). Drought occurring at flowering leads to greater yield losses than when it occurs at
other developmental stages (Grant et al., 1989; Cakir, 2004; Zaidi et al., 2004). In addition,
by flowering time farmers can no longer adjust management practices, such as fertilizer
application, weed control and replanting (Myers, 1985). Water deficit lasting only one or two
days during tasselling or pollination may cause as much as 22% reduction in yield (Hall et al.,
1981; Moser et al., 2006). Deployment of drought tolerance and provision of yield stability is
thus an inevitable part of the solution to cut yield losses (Aslam, 2007). However, agronomic
interventions also have their role, since genetic solutions are unlikely to close more than 30%
of the gap between potential and realized yield under water stress (Edmeades et al.. 2004).
12

Droughts have been associated with significant maize grain losses throughout Kenya with the
vulnerable semi-arid areas being the most hit. Depending on the severity of drought, yield
losses can go up to 100%. For example, a 60% production decline was reported during severe
drought of 1991/ 1992 in southern Africa (Rosen and Scott, 1992). Most areas of Southeastern
Kenya experienced a 100% crop failure from drought during 2008/09 cropping seasons.
Moreover, during the last three years, rainfall has been deficient leading to crop failure in the
drought vulnerable areas, thus famine and death of humans, livestock and wildlife have been
reported (Mwikya, 2009). This led to the Government of Kenya’s declaration of the famine a
national disaster and formation o f a Special Programmes Ministry to handle food relief and
drought recovery activities (Mwikya, 2009).
Maize yield losses due to drought are expected to increase with global climate change as
temperatures rise and rainfall amounts and distribution change in key traditional production
areas (Campos et al., 2004). Nyariki (2007) indicated that drought cycles seem to have
shortened to every two to three years instead of the five to seven years in the past. These
trends, coupled with an expansion of cropping into the fragile marginal areas, are generating
increasingly drought-prone maize production environments. This poses a great challenge
because the current varieties which are considered drought tolerant are succumbing to
droughts. Hence the need to determine the performance of existing varieties recommended for
the semi-arid regions. Overwhelming reliance on maize instead of the more drought tolerant
sorghum, millets, cowpeas, and cassava often exaggerate crop losses, particularly during
mediocre and poor seasons. In 2009, food prices were at record levels: maize prices were 40-
110 percent higher than normal, while bean prices were 40-55 percent above normal,
underlining the pressure on purchasing capacities already compromised by a series of poor
harvests (Kenya Food Security Update, 2009).
2.3.1 The magnitude of mai/e grain loss attributed to drought
13

Maize is highly drought-sensitive despite the fact that its C4 metabolism confers a high
photosynthetic rate combined with a relatively low transpiration rate. The degree of damage is
usually dependent on the developmental stage in which water deficit is experienced. Since
every phenological stage of maize has some susceptibility to drought, three stages: early
growth stage when plant stands are established, flowering and mid-to-late grain filling stage,
are considered critical (Mugo et al., 1998). In the early growth stages, leaf growth is one of
the most sensitive processes to drought (Tardieu et al., 2000; Neves-Piestun and Bernstein,
2005). However, drought is reported to be devastating when it occurs at flowering and
pollination (Shaw, 1977; Otegui, 1995; Cakir, 2004; Zaidi et al., 2004) causing marked
reductions in grain number.
Most droughts are occasioned by early withdrawal of rains when maize is just about to flower.
However, when it affects plant stand at beginning of a season, drought can strongly curtail
yield. Campos et al. (2006) quantified a 45-60% yield loss when drought stress coincided
with flowering period. Yield reduction as high as 90% and an incidence of barreness reaching
77% were recorded by NeSmith and Retchie (1992) when plants were stressed in the interval
from just prior to tassel emergence to the beginning of grain filling. Water stress slows ear
growth, and consequently silk emergence, more than tassel growth or anthesis, resulting in a
widening interval between anthesis and silking (Shaw, 1977; Grant et al., 1989). In a
classical study, Diallo et al. (2004), evaluated maize inbred lines in both stress and non-stress
environments. The workers reported significant differences among the lines for grain yield,
clays to silking and ears per plant in both environments. They observed that, under drought
stress, there was a delay in days to silking hence greater anthesis to silking interval (ASI) and
a reduction in ears per plant. Probability of drought in maize growing environments in the
tropics is highest at the start and end of the rainy season and therefore the crop is prone to
2.3.2 Maize phenological stages susceptible to drought
14

facing water deficit at establishment and flowedng/grain filling stage (Banziger and Diallo,
2001).
2.3.3 Maize physiological traits affected by drought stress
The key physiological traits affected by drought can be expressed at cellular and whole plant
levels. At the cellular level, abscisic acid (ABA) accumulation is important. ABA is
generated mainly in the roots, where it stimulates growth. It moves to the leaves where it
causes leaf rolling, stomatal closure and accelerates leaf senescence (Cramer and Quarrie,
2002). This happens even before hydraulic mechanisms reduce leaf turgor (Zhang et al.,
1987). It seems likely that it is this "root signal" that causes the plant to reduce water loss.
Thus, ABA is a plant growth regulator that helps the plant to survive drought stress but does
not seem to contribute to production under drought. Abundant evidence shows that ABA is
involved in turning on many stress-responsive genes and that it plays a key role in cell growth
regulation, especially during flowering (Landi et al., 2001). When ABA passes to the grain, it
contributes to the abortion of tip grains during grain filling. Under mild to moderate drought
stress, cell expansion is inhibited. This manifests itself in reduced leaf area expansion,
followed by reduced silk growth, then reduced stem elongation, and finally reduced root
growth, as stress intensifies (Liu et al., 2005). Under severe drought stress, cell division is
inhibited, so even if the stress is alleviated the affected organs may lack the cells for full
expansion.
At whole plant level, drought can affect maize production by decreasing plant stand during
the seedling stage, by decreasing leaf area development and photosynthesis rate during the
pre-flowering period, by decreasing ear and kernel set during the two weeks bracketing
flowering, and by decreasing photosynthesis and inducing early leaf senescence during grain-
filling (Liu et al., 2005). Additional reductions in production may come from an increased
15

energy and nutrient consumption of drought adaptive responses, such as increased root growth
under drought.
2.3.4 Maize tra its associated with tolerance to drought
Maize in the developing world is almost exclusively grown under rainfed conditions with
minimal input and management by the small scale farmers that grow it. Although drought can
strike at any time, the plants are most prone to damage due to limited water during
establishment and flowering time (Cakir 2004; Zaidi et al., 2004). Seedling survival, biomass
production, unrolled leaves and ability to recover after water potentials are favourable are the
morphological traits commonly used as main selection criteria for seedling drought tolerance
(Banziger et al., 1997). Mugo et al., (1998) indicated that, water status traits like leaf abscisic
acid concentration, osmotic adjustment, water uptake, and leaf waxiness among others could
potentially be useful in selection for seedling stage drought tolerance.
At flowering and pollination stages, synchrony between male and female flowering time is
particularly important (Edmeades et al., 1999). This synchrony is called the Anthesis Silking
Interval (ASI). When drought stress occurs a few days before and during flowering period, a
delay in silking is observed resulting in an increase in the silking anthesis interval (Shaw,
1977; Hall et al., 1982; Grant et al., 1989; Westgate and Bassetti, 1990; Bolanos and
Edmeades, 1993) thus decreased grain yield. The ASI has been considered as a precise
secondary trait, which has high heritability and is correlated with grain yield under drought
stress (Hall et al., 1981, Westgate and Boyer, 1986, Bolanos and Edmeades 1993). Selection
for short ASI can contribute to a high ratio of ear setting to grain yield (Bolanos et al., 1993,
1996; Ribaut et al., 1997; Edmeades et al., 1999).
16

Regulation of carbohydrates is also o f interest to researchers working on drought tolerance.
Diminished supply of carbohydrates to the developing floral and seed organs that may occur
due to drought reduces seed set (Koch, 1996). Stress at early kernel development has a much
greater negative effect on final yield than stress at a later stage of kernel filling. Abundant
evidence shows that absissic acid (ABA) is involved in turning on many stress-responsive
genes (Finkelstein and Gibson, 2001), and that it plays a key role in cell growth regulation,
especially during flowering. Therefore, genes involved in ASI, genes in the carbohydrate
production pathway, and genes in the ABA production pathway or genes affected by ABA
itself, can be very important for the development of drought resistant maize. However, due to
the complexity o f the genetic mechanism of drought tolerance in maize, the yield trait is
strongly influenced by both genotype and environment thus, genotype-by-environment
interaction is remarkable (Gutf et al., 2008)
2.3.5 Traits of maize varieties bred for semi-arid areas
Plants can achieve drought tolerance through different approaches, involving combinations of
escape, avoidance and tolerance of the effects of water deficit on the growth and development
processes that impact yield (Mugo et al., 1998). Many different traits have been proposed as
selection targets to improve levels of drought tolerance and yield under water deficit
conditions. Many of these putative drought tolerance traits have been recommended lor
indirect selection and used as targets for genetic analysis (Ludlow and Muchow, 1990;
Edmeades et al. 2000). In maize, drought tolerance at seedling and flowering stages is key
(Mugo et al., 1998).
Traits for maize adaptability in the semi-arid areas can be grouped into three major eategories.
drought escape, drought tolerance (Blum, 1988) and water use efficiency. Under drought
escape, the plant completes critical physiological processes before drought sets in. while
17

drought tolerance implies the presence of physiological mechanisms that allow the plant a
reasonable level of production despite the presence of drought (Blum, 1988). In their attempts
to expand maize production in semi-arid and marginal areas, breeders have developed quick
maturing maize varieties by selecting for early maturity to escape drought (Dowker, 1981;
Mugo and Njoroge, 1997). Concequently, varieties katumani composite and KCB were
developed and improved for early maturity and drought escape (Mugo et ai, 1998). Features
of drought tolerant maize varieties include early silking in synchrony with pollen shedding,
reduced ASI, reduced tassel size, longer shedding periods for the tassels, increased ears per
plant, delayed senescence and relatively high leaf chlorophyll during late grain filling
(Njoroge, 1982; Ashley et ai, 1992; Zaidi et ai, 2002). Earliness is usually as important as
yield in breeding varieties for cultivation in semi arid areas (Njoroge, 1992). Tolerance to
water stress is a desirable attribute built iff such varieties if yields are to be stabilized under
erratic rainfall conditions.
Harvest index (HI) which reflects the partitioning of photosynthate between the grain and the
vegetative plant is an important trait for drought tolerance. Improvements in harvest index
emphasize the importance of carbon allocation to grain production. I he harvest index is the
proportion of grain dry matter to total shoot dry matter. Tropical maize varieties usually have
higher harvest indices than temperate maize (Costa et ai, 2002; Earl and Davis, 2003).
However, HI of tropical maize varies considerably and seems to depend on variety, crop
management, growing season, among other factors (Hay and Gilbert, 2001).Ihc HI can be
very low on soils with decreasing water supply (Bolanos and Edmeades, 1993).
2.4 Effect of intercropping on performance of maize-bean intercrops
Intercropping is the growing of two or more crop species simultaneously on the same piece of
land. Intercropping cereals with legumes is a common practice that dominates most of tropical
18

subsistence agriculture (Wiley, 1979; Hauggaard-Nielsen et al., 2001; Tsubo et al., 2005).
Intercropping maize and common bean was commonly practised in the higher rainfall areas of
Kenya and, as population pressure increased, the practice has spread to the semi-arid regions
(Pilbeam et al., 1994). Intercropping has been adopted by the majority of smallholder fanners
mainly for dietary reasons. Maize is normally grown as the principal crop while the legume is
a secondary crop (Walker and Ogindo, 2003).
Intercropping systems are regularly reported to be more productive than sole crops grown on
the same area of land (Davis et al., 1981; Francis et al., 1982; Harris et al., 1987; Carlson,
2008). The usual explanation given for this advantage is that the species make partially
complementary use of resources, in either time or space, and thus use resources more
efficiently (Pilbeam et al., 1994). Intercropping studies by Willey and Osiru (1972), indicated
that growing cereals with beans gives higher yields than when each crop is grown in sole
culture. In their study, maize-bean mixtures yielded 38% more than pure stands. Dawo et al.
(2008) indicated that maize can profit from the presence of the companion legume by utilizing
nitrogen fixed by rhizobia-legume symbiosis. However, working in a semi-arid environment
Southeastern Kenya, Mwangi et al., (2001) concluded that intercropping common beans and
maize considerably suppresses the yield of the former.
The merits of intercropping have been well documented. It is viewed as a production strategy
by most small holder farmers towards increased efficiency in use of environmental resources
by plants of different heights, rooting systems, nutrient requirements (Andrews, 1972; Baker
and Yusuf, 1976; Willey 1979; Willey and Osiru 1972), checking soil erosion by beating
action of rain and direct sunshine. Further intercropping is viewed as an insurance against
crop failure (Okigbo, 1987), reduces the spread of diseases and pests (Kayumbo. 1976;
Mukiibi, 1976) and where legumes are grown with grasses, the grasses may benefit from
19

nitrogen fixed by the companion legume (Agboola and Fayemi 1971; Trenbath, 1972).
Intercrops smother weeds in cereal crops (Odhiambo and Ariga, 2001). Once the crops are
established increased leaf cover helps reduce weeds by cutting light transmission to the weeds
below (Beets, 1990).
When two or more crops are grown on the same field, the risk for crop failure is minimized
because the crops vary in periods and patterns of growth and exploit resources at different
depths and are affected by different diseases. If one of the crops fails, either due to drought,
pests or diseases, there still is a harvest from the other crop (Helenius and Jokinen, 1994).
This increases food security upon diversification of crop risks. In good years, the yield of two
crops grown on the same field as an intercrop is often higher than the yield of the same crops
grown separately.
Reduction of disease spread and pest infestation in intercrops is consistently reported.
Working in Uganda, Sekamatte et al. (2003), reported that intercropping maize with various
legumes caused a significant reduction in termite attack, reduced loss in grain yield of maize
and increased the nesting of predatory ants in maize fields. Further, they indicated that maize-
soybean and maize-groundnut intercrops had significantly lower termite attack than maize-
common bean intercrops. Termites can cause yield losses ot between 10% to 30% by their
feeding damage on roots, stem bases and leaves resulting to plant lodging and damage ot cobs
(Sekamatte et al., 2003). Integrating Phaseolus beans into push-pull technology developed for
stem-borer and striga control in maize-based cropping systems reported significantly lower
Striga hermonthica counts and stem-borer damage (Khan et al., 2009). Similarly, significantly
higher maize grain yields were recorded in bean integration plots.
2 0

Increased plant diversity in intercropped fields may reduce the impact of pest and disease
outbreaks by providing more habitat for predatory insects and increasing the distance between
plants of the same crop. Other ecological benefits of intercropping include less land needed
for crop production, reduction of pesticide and herbicide use, and a reduction in soil erosion.
In intercrop systems, insect pests and weeds are reduced (Szumigalski el al., 2005; Poggio,
2005; Banik et al., 2006). The distance between plants of the same species is increased when
crops of different species are planted in between them (ICIPE, 2000). Species differ in
competitive ability with weeds. The differences in competitive abilities are due to variations
in plant characteristics, environment and relative emergence dates (Songa et al., 2007).
Shading of the soil and competition for nutrients will suppress weed germination and growth.
Intercropping studies by Odhiambo and Ariga (2001) and Oswald et al., (2002) showed that
intercropping maize with beans suppresses striga infestations.
2.5 Resource use in intercropping systems
Maize plus bean intercropping, widely practiced in small scale subsistence agriculture
involves little or no inputs at all (Walker and Ogindo, 2003), thus full dependency on the
natural resource base. Adoption of intercropping systems by subsistence farmers may not only
be explained by socio-economic reasons, but also by a more efficient use of natural resources
(Sinoquet and Cruz, 1995; Hauggaard-Nielsen et al., 2001; Tsubo et al., 2005). Greater
resource use efficiency by the component crops in the intercropping is the primary cause of
obtaining intercropping advantages (Willey, 1979; Chowdhury and Rosario, 1994). Canopy
structures and rooting systems of cereal crops are generally different from those of legume
crops and in most cereal—legume intercropping, cereal crops form higher canopy structures
than legume crops, and the roots of cereal crops grow to a greater depth than those ot legume
crops. This suggests that the component crops probably have differing spatial and temporal
use of environmental resources. Consequently, yield is a valid indicator ot the
21

competitiveness o f that component for the scarce growth resources under any given set of
conditions. It was indicated by Francis (1987) that, over centuries, farmers selected mixtures
of species to make better use of rainfall and native soil fertility and the choices o f patterns
were made among the best performing combination observed through experience.
Combination of crops is determined by the length of growing season and the adaptation of
crops to particular environments.
Productivity of a cropping system comprising intercrops of two or more species depends upon
the degree of complementarity between them. Enhancing productivity of maize and bean
intercrops requires improving the interspecies complementarity or reducing competition
effects (Rezende and Ramalho, 1994). This might be achieved through manipulation of plant
arrangements, plant densities mid planting compatible cultivars (Rao and Mittra, 1990). Ofori
and Stem (1987) proposed that the growth and yield of the legume component is reduced
markedly when intercropped with high densities of the cereal component. In a maize-bean
intercrop system, increasing maize density three-fold, from 18, 000 to 55, 000 plants ha'1,
reduced bean leaf area by 24% and seed yield by 70% (Gardiner and Craker, 1981).
Spatial arrangement o f component crops is one of the most important agronomic factors that
determine whether an intercrop system will be advantageous or not with regard to yield gains
(Natarajan and Shumba, 1990). Distinct row arrangements, in contrast to arrangements of
component crops within the same row or hill, improves the amount of light transmitted to the
lower legume. Such arrangements can enhance legume yields and efficiency in cereal-legume
intercrop systems (Mohta and De, 1980). Productivity of the intercrop systems can be
enhanced through selection of maize cultivars suitable for intercropping as they have different
growth habits, which may result in different interactions with beans in the intercrop. In semi-
arid Kenya, farmers tend to mostly grow one specific bean cultivar. KB 1. which was
22
specifically bred for these regions. Working in Zimbabwe, Davis and Garcia (1983) pointed
out that, maize cultivars with short intemodes and broad leaves shade beans relatively more
than cultivars of a similar height with long intemodes and narrow leaves. Tall cultivars
generally give more shadding to understorey crops.
Solar energy can not be captured and stored for later use in the way other natural resources are
managed. Light is instantaneously available and needs to be instantaneously intercepted and
used if the resource is going to be useful to produce photosynthate and plant dry matter
(Tsubo et al., 2001). If water and nutrients are not limiting, then light is frequently the most
limiting resource (Willey, 1979; Tsubo et al., 2003). Competition for light occurs between
leaves rather than between the plants, hence plants grow taller to position their leaves above
the others to intercept solar radiation. Pfcmts that are favoured in an intercrop mixture are
those whose leaves are positioned to intercept solar radiation. Leaves that receive below
compensation point will soon perish (Tsubo et al., 2001). Comparing radiation use efficiency
of sole crop/intercrop systems, Tsubo et al. (2001) observed that intercrops intercepted more
radiation while sole maize presented higher radiation use efficiency than the other cropping
systems. Further, in a modeling study to understand radiation interception and use by a maize-
bean intercrop canopy, Tsubo and Walker (2002) reported that intercropping was equivalent
in growth efficiency to the sole cropping whereas beans showed greater radiation use
efficiency in intercropping than in solecropping. Erect growing crops may provide support for
intercropped climbing species. The support allows the climbing species to achieve greater
vertical separation of the leaves which may improve the photosynthetic effectiveness ol the
leaves of the climbers. Climbing bean varieties are usually intercropped with maize and many
researchers have studied the compatibility of climbing bean varieties in maize intercrops
(Geleta et al., 2004; Gebeyehu et al., 2006) and cited the importance of the maize compocnent
in offering support to the beans.
23

Long-term advantages in soil nutrient use of intercropping systems over sole cropping may be
related: to more complete soil cover which leads to reduced nutrient losses through runoff,
erosion and leaching and to more favourable micro-climate (Anil et al., 1998); more biomass
production which leads to higher nutrient uptake and less leaching; more crop residues with
their positive effects on physical and biological soil properties, better synchronization of
nutrient release from organic matter and uptake by crops which leads to less leaching
(Whitmore and Schroder, 2007); higher biological nitrogen fixation; and more efficient
mobilization of soil nutrients such as exudation, root growth and mycorrhizae by one or more
transfer to the other component crop (Sinoquet and Cruz, 1995; Ibcawuchi, 2007).
Maize can profit from the presence of intercropped legumes by utilizing nitrogen fixed by
rhizobia in root nodules, although in some 'Cases competition between the two plant species
can also decrease cereal grain yields. Increased N uptake could come about either through
lowered inter-plant competition for soil N because of the use of atmospheric N by the legumes
or because of direct transfer of fixed N from the legume to the nonlegume. Such transfer
could occur through decomposition and mineralization of legume root exudates or through
inter-plant hyphal connections of mycorrhizas (Dawo et al., 2008). Systems that intercrop
maize with a legume are able to reduce the amount of nutrients taken from the soil as
compared to a maize monocrop. When nitrogen fertilizer is added to the field, intercropped
legumes use the inorganic nitrogen instead of fixing nitrogen from the air and thus compete
with maize for nitrogen. However, when nitrogen fertilizer is not applied, intercropped
legumes will fix most of their nitrogen from the atmosphere and not compete with maize for
nitrogen resources (Adu-Gyamfi et al, 2007).
Water is often the most limiting factor for growth in the semi-arid areas ot Kenya. Lack ot
water during vegetative and/or reproductive growth stages is one ot the most limiting factors
24

for bean growth (Boutraa and Sanders, 2001). The ability of plant roots to explore a large soil
volume and extract water is very critical. The use of water in an intercrop provides a condition
in which competition for a limited resource might occur. If the component crops have
different rooting habits, intercrops may be more efficient in exploring a larger soil volume for
water and nutrients. In analyzing the intercooperative interaction between intercrops,
Ibeuwuchi (2007) suggested that intercropping enhances water use efficiency.
2.6 Indices for evaluating the performance of intercropping systems
Various indices have been proposed for examining intercropping yield advantages over sole
cropping (Willey, 1979; Mead and Willy, 1980; Banik et al., 2000; Ghosh 2004; Ageguebu et
al., 2006; Banik et al 2006; Dhima et al., 2007). Broadly they fall into two categories, either
they describe the overall advantage of the'intercrop relative to the sole crop (Mead and Willey
1980; Azam-Ali et al., 1990; Dhima, 2007), or they assess the relative performance of the
components of the mixture in relation to their performances as sole crops (McGilchrist and
Trenbath 1971). These indices include land equivalent ratio, relative crowding coefficient,
competitive ratio, actual yield loss, monetary advantage and intercropping advantage.
The practical objective of evaluating intercrops embraces the aims and the constraints that
determine the amounts of crops to be grown. It was suggested by Willey (1979) that, three
criteria can be used when considering practical assessments of intercropping advantages.
First, where intercropping must give full yield of a main crop and some yield of the secondary
crop. It involves a situation where the primary requirement is for a full yield of the staple food
or a commercial crop. The yield advantage occurs when there is a yield of the second crop
and the second crop does not significantly affect the yield of the main crop. Second, where the
combined intercrop yield must exceed the higher sole crop yield. I his advantage criterion is
based on the assumption that, unit yield of each component crop is equally acceptable and
25

therefore the requirement is simply for maximum yield regardless of the crop from which it
comes and thirdly where the combined intercrop yield must exceed the combined sole crop
yield. A criterion of this kind considers factors which influence farmer decision making. It
assumes that the farmer needs to grow more than one crop in order to guard against
environmental risks, market risks, to satisfy dietary needs and to spread labour peaks. In this
situation yield advantage occurs when intercropping results in higher yields than sole crops.
This is the commonest situation in practice in the semi-arid regions of Kenya.
The land equivalent ratio (LER) is the most commonly used method as suggested by Willey
(1979). The LER compares the yields from growing two or more crops together with yields
from growing the same crops in monocultures or pure stands. The idea behind intercropping is
to capitalize on the beneficial interactions between crops while avoiding negative interactions:
Essentially, the LER measures the effect of both beneficial and negative interactions between
crops. LER is defined as the relative land area under sole crops that is required to produce the
yields achieved in intercropping. When LER is equal to unity, there is no intercropping
advantage in comparison to sole cropping. On the other hand, LER greater than unity implies
that a larger area of land is required to produce the same yield of sole crop of each component
grown separately than an intercropped mixture.
Willey’s LER was challenged by Hiebach and McCollum (1987) arguing that LER was not an
accurate technique for comparing relative production potentials of intercropping and
solecropping systems. They suggested the use of the area time equivalent ratio (A I ER) by
redefining yield to be quantity per unit area per unit time. It takes into account the duration of
the crop from time of planting to harvesting.

Economic performance of intercropping systems can be evaluated to determine whether maize
yield and additional bean yield are sufficient to justify fanners to adopt intercropping. This
can be reliably computed using the monetary advantage index (MAI).
According to Willey (1979), MAI can be computed as follows:
MAI = Value of combined intercrop yield x {(LER - 1) LER}
The higher the MAI value, the more profitable is intercropping system (Ghosh, 2004). The
calculations should be based on the prevailing mean producer prices of maize and beans in the
region. Occassionally, higher LER values are associated with increased MAI (Ghosh, 2004;
Dhima et cil., 2007).
Generally, in the evaluation of intercropping systems, several factors are included. The factors
include competitive effects, relative production potential, labour requirements, water and
nutrient use efficiency and socio economic impacts. Therefore a fair evaluation would require
a team effort involving agronomists, crop physiologists, soil scientists and agricultural
economists. Additionally, as suggested by Hildebrad (1976) and Weigett and Jolliffe (2003)
the criteria for the choice of an evaluation index should be: common to all products and
inputs, relatively easy to measure, capable of reflecting quality differences between the
products, meaningful to the fanner in such a way that it helps in allocation of resources
between competing uses and meaningful to the researcher so that new technologies can be
compared with existing ones.
27

CHAPTER THREE: MATERIALS AND METHODS
3.1 Experimental sites
The study was earned out in Machakos Agricultural Training Centre (ATC), Waruhiu
Agricultural Training Centre and Kenya Agricultural Research Institute, Mwea. Machakos
ATC is located 5 km west of Machakos town and about 70 km east of Nairobi with centre
coordinates o f 01° 32' S and 37° 14' E and at an altitude of 1575 metres above sea level
(m.a.s.l). The centre is located in agroecological zone LM 5 and receives an annual rainfall of
400 mm to 700 mm with annual temperatures of 19.2 °C. The soils are well drained, dark
reddish brown and sandy clay. Waruhiu ATC is in Githunguri in Kiambu district, about 50 km
north west o f Nairobi town with centre coordinates of 0° 56’ S 37° 05’ E and at an altitude of
2200 m a.s.l. It is located in agroecological zone UM 2 and receives mean annual rainfall of
1200-1400 mm with mean temperatures o f 18.4 °C to 19.5 °C. The soils are well drained,
extremely deep, dusky red to dark reddish brown, friable clay nitisols. The KARI-Mwea is in
Krrinyaga south district, Central Province and is located at an altitude of 1140 m, latitude 0°,
and longitude 37° 27’E about 160 km south east of Nairobi. The KARI-Mwea farm is 6 km
east of the research station in agroecological zone LM 4 with annual rainfall of 450 - 900 mm
and mean temperatures o f 21° C. In all sites rainfall is bimodal with two rainy seasons called
short rains (November to January) and the long rains (March and June). The first experiment
was performed during the short rains (November 2008 to March 2009) while the second
experiment was run during the long rains (April 2009 to September 2009). Soils were sampled
before planting at 30 cm depth and analyzed for pH, carbon, CEC, macronutrients and
micronutrients (Appendix 1).
28

3.2 Experimental design and treatments
The materials comprised sixteen maize varieties grown in the semi-arid regions. The varieties
were bought from seed stockists in Machakos and Wote towns while the bean variety was
obtained from Kenya Agricultural Research Centre, Katumani seed unit. They comprised the
Five series hybrids, namely, H513, H515, H516; hybrids H614D, Duma 43, DK 8031, pioneer
3253; the dryland hybrids namely DHOl, DH02, DH04; the Pannar series namely Pannar 77,
Pannar 7M, Pannar 4M, Pannar 67; and composites Katumani Composite B (KCB) and
Katumani (Table 1). The test bean variety was Katumani Bean 1 (KB 1), a determinate bean
variety developed by the National Dryland Research Centre-Katumani.
The treatments included maize varieties grown as sole crops, maize varieties intercropped
with beans and sole KB 1 bean variety. These treatments were laid out in a randomized
complete block design with a split plot arrangement and replicated three times. The maize
varieties were assigned to the main plots while the cropping systems were assigned to the
subplots. The experimental plot sizes were 5 m by 6.75 m. Maize was planted at hill spacing
of 75 cm by 30 cm. In the intercrop treatments, one row of beans was grown between two
rows of maize with intra-row spacing of 25 cm while sole beans were sown at hill spacing of
25 cm. The companion crops were sown at the same time at the onset of the rains.
The land was ploughed and harrowed to a moderate seedbed tilth. Planting was done at the
onset of rains in October 2008 and March 2009 for the short rains season and the long rains
season respectively. Two seeds were planted per hill at the recommended spacing. After
emergence plants were thinned to one plant per hill. Fertilizer NPK 20-20-0 was applied at
planting in each hole at the rate of 25 kg N/ha and 25 kg P20.<>/ha. DAP was not used as a
source of N and P due to the high acidity associated with the soils of Waruhiu. At flowering
maize was top dressed with 25 kg/ha N. The fields were kept weed free by hand weeding
29

using hoes. Bean fly was controlled using Sumithion super® with active ingredients: 250 g/L
tenitrothion and 12.5 g/L esfenvalerate.
Table 1: Description of maize and bean varieties used in the study
Variety Year of
release
Owner Maintaincr
and
seed source
Optimal
production
altitude
(m.a.s.l)
Months
to
maturity
grain
yield
( th a 1)
H513 1995 Kenya Seed Co. Kenya Seed Co. 1200-1600 4-5 6-8
H515 2000 Kenya Seed Co. Kenya Seed Co. 1200-1500 4-5 6-8
H516 2001 Kenya Seed Co. Kenya Seed Co. 1200-1500 4-5 7-9
H614D 1986 Kenya Seed Co/
KARI
Kenya SeedCo.
Ltd /K.A.R.I
1500-2100 6-9 8-10
Duma 43 2004 AgriSeedCo Ltd SEEDCO Zambia 800-1800 4-5 6-7
DK 8031 2003 Monsanto Monsanto 900-1700 4-4 .7 6-8
DHOl 1995 Kenya Seed Co. Kenya Seed Co. 900-1400 3-4 4-6
DH02 1995 Kenya Seed Co. Kenya Seed Co. 900-1400 3-4 4-6
DH04 2001 Kenya Seed Co. Kenya Seed Co. 900- 1500 3-4 5-6
Pannar77 2008 Pannar seed (PTY)
Ltd
Pannar Seed (K)
Ltd SA
8 0 0 - 1600 3-4 4-6
Pannar7M 2008 Pannar Seed (PTY)
Ltd
Pannar Seed (K)
Ltd SA
900-1500 3-4 4-6
Pannar4M 2008 Pannar Seed (PTY)
Ltd
Pannar Seed (K)
Ltd SA
900-1500 3-4 4-6
Pannar 67 2001 Pannar Seed
Company
Pannar Seed (K)
Ltd SA
800- 1600 4-5 5-6
PHB 3253 1995 Pioneer Hybrid Pioneer Hybrid,
Zimbabwe
800-1800 4-5 7-9
KCB
Katumani
1967 Kenya Seed Co/
KARI
Kenya Seed
Co/KARl.
900-1350 3-4 3-5
KB 1
(Kathika)
1987 KARI- Katumani KARI-Katumani 1000-1800 2.5 1.2-1.5
Research Institute; SA: South Africa; Co; Company
30

3.3 Data collection
Data collected comprised growth parameters of both crops such as bean nodulation and
biomass, plant stand count, phenological development, stand count, lodging, yield and yield
components, harvest indices and assessment o f intercropping advantage using land equivalent
ratio and monetary advantage indices. As a result of severe weather conditions during 2008
short rains in Mwea and Waruhiu, the bean component dried up at seedling stage before any
data could be collected. On the other hand, no data could be collected in Machakos during
2008 short rains but bean yield and maize shoot biomass data were obtained before the crop
dried up during 2009 long rains.
3.4 Determination of maize and bean plant height
Nine maize plants were sampled in each plot and measurements forheight taken at 2, 4, 6, 8
and 10 weeks after emergence (WAE). Nine bean plants were sampled and measurements
taken for height at 2, 4, 6 WAE. Plant height was measured as the distance from the soil
surface to the tip of the plant.
3.5 Determination o f bean nodufation and dry matter accumulation
Three bean plants were randomly selected for nodule count and biomass accumulation at 21
days after emergence and at 50% flowering. The bean plants were dug up gently, washed with
water and the nodules recorded for each plant. The roots were discarded and shoot biomass
was determined after oven drying at 70°C to a constant weight.
3.6 Determination of maize grain yield, yield components, shelling percentage and total
stover weight
At physiological maturity in both seasons, maize was hand harvested from four rows of each
plot equivalent to 13.16 m2. The outer rows were regarded as guard rows and therefore were
not harvested. Grain and stover were separated. Eighteen randomly selected cobs per plot
31

were used for determination of maize yield components. Cob length was determined by
measuring the full length of the cob using a 30 cm ruler. Number o f kernel rows per cob and
number of kernels per cob-row were determined by physical counting. Shelling was done by
hand and four randomly selected cobs per plot were used to determine maize shelling
percentage. After drying the shelled grain and the four unshelled cobs to 12.5% grain
moisture content, 100 kernel weight, shelling percentage and grain yield were obtained. Four
sets of 100 randomly selected maize kernels were weighed to determine 100 kernel weight per
plot. Shelling percentage was obtained by expressing the weight of shelled grain per cob as a
percentage of the total cob weight. Grain yield per plot was converted to tonnes per hectare.
Total stover weight per plot was determined after the stover had dried to a constant weight.
3.7 Determination of bean seed yield and yield components
At physiological maturity, nine bean plants were randomly selected in each plot and all rows
and number of pods per plant determined. The pods were shelled and number of seeds per pod
determined. The beans were hand harvested in each plot in an area equivalent to 10.5 m .
Bean seed yield and 100-seed weight were obtained after drying the beans to 15% seed
moisture content. Four sets of 100 randomly selected seeds were weighed and 100 seed
weight determined per plot.
3.8 Determination of maize harvest indices
The yields of maize grain per plot in t ha"1 and stover yield per plot in t ha were used to
calculate maize harvest indices. Crop harvest index (HI) is the ratio of grain weight to total
plant weight (Costa et a l, 2002). Maize harvest index was used to reflect the partitioning of
photosynthate between the grain and the vegetative plant thus the higher HI the greater
efficiency of carbon allocation to grain production.
32

3.9 Assessment of intercropping productivity and monetary value
The yields of maize and beans were used to calculate Land Equivalent Ratios (LERs) and
Monetary Advantage Indices (MAI) to evaluate the productivity of the intercrop system. LER
was calculated as below (Mead and Willey, 1980):
Yield of intercrop maize I + [Yield of intercrop beansl LER = 1 Yield of solecrop maize \ [Yield of solecrop beansj
If LER =1, then there is no advantage of intercropping. If LER < 1 then intercropping reduces
total yield and therefore not advantageous. If LER > 1, intercropping increases total yield thus
advantageous. MAI was calculated as follows:
MAI = Value of combined intercrop yield x {(LER -1) LER}
The higher the MAI value, the profitable is the intercropping system. Average larm gate
producer prices of Kshs. 20 per kg of maize and Kshs. 45 per kg of beans were used to
calculate the value of maize and beans (Kenya Agricultural Commodity Exchange, 2009).
3.10 Data analysis
All data were subjected to analysis of variance (ANOVA) using Genstat statistical package
(Lawes Agricultual Trust, Rothamsted Experimental Station, 2006, version 9). Differences
among treatment means were compared and separated where appropriate using Fisher s Least
Significant Difference (LSD) test at 5% probability level (Gomez and Gomez, 1984).
Correlation analysis was done using SPSS 12.0 for windows. Maize varietal attributes that
were subjected to correlation analysis include grain yield, DAE to 50% anthesis, DAL to 50 /o
silking, DAE to 50% physiological maturity, number of cars per plant, cob length, number of
rows per cob, 100 kernel weight and shelling percentage.
33

CHAPTER FOUR: RESULTS
4.1 Effect of maize variety and intercropping on plant height, plant stand, lodging and
biomass accumulation
Significant (P<0.05) varietal differences in maize plant height at 57 DAE were noted in all
sites and seasons (Table 2). Significant differences in maize plant height were also noted for
site and its interaction with variety. Cropping system and its interaction with variety and site
had no significant effects on plant height (Appendix 3). Over the short rains, maize in
Machakos was severely affected by drought at seedling stage and data could not be taken.
However, maize grown in Mwea was significantly taller than maize grown in Waruhiu.
Variety DK 8031 was significantly taller than all varieties except DHO 1, DUO 2, DHO 4,
Duma 43, H513, Katumani, Pannar 67 and PHB 3253 while H516 was significantly the
shortest. Over the long rains, all varieties were significantly (P<0.05jf shorter in Machakos
than in the rest of the sites. All varieties except H614D and Pannar 67 were significantly taller
in Mwea than in Waruhiu in both seasons. DHO 2 was significantly taller than all varieties
except DHO 1, Duma 43, H513, H516, Katumani, KCB, and Pannar 4M. Pannar 77 was
significantly shorter than all varieties except DHO 4, DK 8031, H515, H614D, Pannar 67,
Pannar 7M and PHB 3253.
No significant (P<0.05) varietal differences in maize stand count were noted across the sites
and seasons. Variety and its interaction with site had no significant effects on maize stand
count (Table 3). Intercropping and its interaction with variety and site had no significant
effects on maize stand establishment (Appendix 4). Over the short rains, maize grown in
Mwea had better stand establishment than maize grown in Waruhiu. During the long rains,
significantly (P<0.05) higher maize stand counts were established in Machakos than in Mwea
and Waruhiu. Maize stand counts in the latter two sites were not significantly ditlerent.
34

Table 2: Mean plant height (cm) at 57 DAE o f sixteen maize varieties intercropped with
beans in Mwea, Waruhiu and Machakos during 2008 short rains and 2009 long rains
2008 short rains 2009 long rains
Variety (V) Mwea Waruhiu Mean Mwea Waruhiu Machakos Mean
DHO 1 192.3 70.4 131.3 218.0 156.0 97.0 157.0
DHO 2 182.8 76.7 129.7 226.4 176.6 107.8 170.2
DHO 4 183.1 64.8 123.9 220.6 133.1 86.3 146.6
DK 8031 190.4 81.8 136.1 207.6 150.8 95.4 151.2
DUMA 43 168.4 79.6 124.0 210.0 159.0 99.9 156.3
H513 182.9 66.3 124.6 238.5 164.4 86.0 162.9
H515 161.7 64.6 113.1 205.4 149.0 84.0 146.1
H516 156.6 57.6 107.1 214.0 163.2 100.8 159.3
H614D 160.5 64.8 112.6 177.3 183.4 92.3 151.0
KATUMANI 175.9 77.7 126.8 229.6 166.2 105.5 167.1
KCB 170.0 66.4 118.2 223.9 141.1 104.2 156.4
PANNAR 4M 156.2 61.8 109.0 220.5 150.1 97.2 155.9
PANNAR 67 168.3 68.0 118.1 182.4 155.8 95.0 144.4
PANNAR 77 156.1 72.4 114.2 199.8 128.6 83.2 137.2
PANNAR 7M ' 176.0 47.9 111.9 192.0 157.6 94.1 147.9
PHB 3253 165.4 68.3 116.8 246.1 125.4 75.2 148.9
Mean 171.6 68.1 119.8 213.2 153.7 93.9 153.6
LSD (p<o.o5) V 21.0 17.0
LSD (p<o.o5) Site 4.3 7.8
LSD (P<o.o5) V*Sitc 24.1 30.5
c v % 12.7 30.5
CV: coefficient of variation; LSD: least significant difference
No significant (P<0.05) varietal and site effects on maize lodging were noted over the short
rains. However, variety and its interaction with site significantly affected plant lodging in both
sites (Table 4). Intercropping and its interaction with variety had no significant cttccts on
maize plant lodging (Appendix 5). In the short rains, DHO 2 had significantly higher lodging
35

Table 3: Mean plant stand count of sixteen maize varieties intercropped with beans in Mwea,
Waruhiu and Machakos during 2008 short rains and 2009 long rains
Variety (V)
2008 short rains 2009 long rains
Mwea Waruhiu Mean Mwea Waruhiu Machakos Mean
DHO 1 82.6 42.5 62.5 73.5 78.0 77.6 76.3
DHO 2 76.9 46.5 61.7 74.0 75.5 75.6 75.0
DHO 4 83.1 49.8 66.4 74.5 77.5 79.0 77.0
DK 8031 81.6 55.5 68.5 74.8 75.5 79.6 76.6
DUMA 43 81.6 56.6 69.1 68.5 67.0 72.0 69.1
H513 82.6 44.6 63.6 73.8 75.0 78.6 75.8
H515 82.4 50.6 66.5 70.8 71.6 75.0 72.5
H516 80.9 52.0 66.4 69.5 70.6 73.5 71.2
H614D 82.9 58.8 70.9 68.8 74.5 76.8 73.3
KATUMANI 78.6 42.6 60.6 72.6 77.0 76.8 75.5
KCB 85.4 54.5 69.9 75.0 73.0 76.8. 74.9
PANNAR 4M 80.4 52.1 66.3 66.3 69.6 71.6 69.2
PANNAR 67 81.8 55.1 68.4 70.8 76.5 74.8 74.0
PANNAR 77 82.9 55.8 69.4 70.1 70.1 76.3 72.2
PANNAR 7M 8 1 ! 53.1 67.1 77.1 76.3 80.1 77.8
PHB 3253 79.8 49.0 64.4 78.3 68.5 82.0 76.2
Mean 81.5 51.2 66.4 72.4 73.5 76.6 74.2
LSD (p<o.o5) V NS NS
LSD (p<o.o5) Site 1.9 1.3
LSD (p<o.o5) V*Site NS NS
CV% 10.4 6.3
NS: not significant at 5% probability level; CV: coefficient of variation; LSD: least
significant difference
percentage in Waruhiu than in Mwea while the converse was the case with respect to H515
and H614D. Over the long rains, DHO 1, DHO 2, Katumani and Pannar 4M lodged
significantly more in Mwea than in Waruhiu. In contrast, KCB lodged significantly more in
Waruhiu than in Mwea. Duma 43 and Pannar 7M did not lodge. Overall, maize grown in
36

Mwea lodged significantly more than maize grown in Waruhiu while KCB lodged
significantly more than the rest of the varieties.
Table 4: Mean lodging percentage of sixteen maize varieties grown in Mwea and Waruhiu
during 2007 short rains and 2009 long rains
Variety (V)
2008 short rains 2009 long rains
Mwea Waruhiu Mean Mwea Waruhiu Mean
DHO 1 8.0 8.6 8.3 3.4 0.4 1.9
DHO 2 3.9 10.3 7.1 10.0 3.3 6.7
DHO 4 5.4 3.6 4.5 0.0 0.6 0.3
DK 8031 3.4 3.0 3.2 0.0 0.2 0.1
DUMA 43 10.5 7.3 8.9 0.0 0.0 0.0
H513 3.6 6.1 4.8 0.0 0.5 0.2
H515 6.8 1.5 4.2 0.0 0.7 0.3
H516 4.3 2.8 3.6 - 0.0 1.4 0.7
H614D 7.0 1.9 4.5 0.0 0.2 0.1
KATUMAN! 8.4 7.3 7.8 12.0 5.4 8.7
K.CB 6.2 6.6 6.4 9.2 14.1 11.6
PANNAR 4M 7.0 4.2 5.6 3.8 1.2 2.5
PANNAR 67 4.6 2.4 3.5 0.0 0.8 0.4
PANNAR 77 5.0 5.2 5.1 0.0 0.7 0.3
PANNAR 7M 3.1 1.5 2.3 0.0 0.0 0.0
PHB 3253 2.5 3.5 3.0 0.0 1.2 0.6
Mean 5.6 4.7 5.2 2.4 1.9 2.1
LSD (p<o.o5) V NS 1.3
LSD (p<o.o5> Site (S) NS 0.3
LSD (pjo.os, V*Sitc 4.9 1.7
c v % 67.3 61.1
NS: not significant at 5% probability level; CV: oetficient ot variation, LSD. east
significant difference
37

Variety, site and varietyxsite interaction had significant (P<0.05) effects on maize shoot
biomass (Table 5). Intercropping and its interaction with variety and site had no significant
effects in this parameter (Appendix 6). Over the short rains, DHO 2, H513, H515, H516,
Katumani, Pannar 67, Pannar 77 and Pannar 7M had significantly higher shoot biomass in
Mwea than in Waruhiu. Variety DK 8031 had significantly higher shoot biomass than all
varieties except DHO 4, H513, H515, H614D, Pannar 67, Pannar 77 and Pannar 7M. KCB
had significantly lower shoot biomass than all varieties except Katumani, DHO 1, DHO 2,
Duma 43, Pannar 4M and PHB 3253. Over the long rains, DHO 4 and Pannar 77 had
significantly higher shoot biomass in Mwea than in Waruhiu while the converse was the case
with respect to DK 8031, H516, Pannar 67 and Pannar 7M. Maize grown in Machakos had
significantly the least shoot biomass. Variety H614D had significantly the highest shoot
biomass while KCB had less shoot biomass than'all varieties except DHO 1, DHO 2 and
Katumani.
4.2 Effect of maize variety and intercropping on time to anthesis, silking and
physiological maturity
Variety, site and varietyxsite interaction significantly (P<0.05) affected time taken by maize
to reach 50% anthesis, 50% silking and 50% physiological maturity (1 ables 6, 7 and 8).
Intercropping and its interaction with variety and site had no significant (P<0.05) etfects on
time taken by the maize varieties to flower and mature (Appendices 7, 8 and 9). In the short
rains, all varieties recorded significantly shorter time to reach 50% anthesis in Mwea than in
Waruhiu except varieties DHO 1, DHO 2, Duma 43, KCB and Pannar 7M. Variety KCB took
significantly (P<0.05) shorter time to reach 50% anthesis than all varieties except Katumani,
DHO 1, DHO 2 and PHB 3253 while variety H614D took a significantly longer time. DHO 4
was significantly the latest to reach 50% anthesis among the DHO series while no significant
38

differences were noted among the Five and the Pannar series. Over the long rains, all the
varieties attained 50% anthesis significantly (P<0.05) earlier in Mwea than in Waruhiu.
Table 5: Mean plant shoot biomass (t ha'1) of sixteen maize varieties intercropped with beans in
Mwea, Waruhiu and Machakos during 2008 short rains and 2009 long rains
2008 short rains 2009 long rains
Variety (V) Mwea Waruhiu Mean Mwea Waruhiu Machakos Mean
DHO 1 14.1 9.8 11.9 12.2 13.4 3.9 9.8
DHO 2 16.3 9.2 12.8 11.0 9.7 4.5 8.4
DHO 4 28.4 22.5 25.5 30.9 20.2 3.6 18.2
DK 8031 27.7 25.6 26.7 25.4 32.9 6.0 21.4
DUMA 43 19.9 13.6 16.8 19.6 16.2 5.0 13.6
H513 30.7 17.3 24.0 24.5 27.1 3.6 18.4
H515 27.0 17.6 22.3 25.8 23.6 5.7 18.4
H516 22.2 13.0 17.6 17.5 33.3 6.3 19.0
H614D 30.0 17.5 23.8 42.8 40.6 3.5 29.0
KATUMANI 16.6 10.2 13.4 9.8 10.3 4.7 8.2
K.CB 13.5 8.5 11.0 12.4 6.7 3.5 7.5
PANNAR 4M 19.8 12.2 16.0 20.0 16.6 4.2 13.6
PANNAR 67 26.5 15.9 21.2 19.1 30.2 5.6 18.3
PANNAR 77 28.0 16.5 22.2 38.9 22.0 5.3 22.1
PANNAR 7M 24.2 16.3 20.2 20.5 31.4 4.9 18.9
PHB 3253 16.3 10.1 13.2 25.3 26.6 3.0 18.3
Mean 22.6 14.7 18.7 22.2 22.6 4.6 16.5
LSD (p<o.o5) V 6.2 2.8
LSD (p<o.o5) Site 0.5 1.5
LSD (p<o.o5) V*Site 6.2 5.6
cv% 10.9 32.3-
CV: coefficient of variation; LSD: least significant difference
39

Table 6: Mean days after emergence (DAE) to 50% anthesis of sixteen maize varieties
grown in Mwea and Waruhiu during 2008 short rains and 2009 long rains
Variety (V)
2008 short rains 2009 long rains
Mwea Waruhiu Mean Mwea Waruhiu Mean
DHO 1 58.3 64.6 61.5 43.6 60.6 52.1
DHO 2 59.0 66.6 62.8 42.6 56.0 49.3
DHO 4 63.0 78.6 70.8 51.6 74.6 63.1
DK 8031 65.0 79.0 72.0 49.3 65.0 57.1
DUMA 43 63.6 69.6 66.6 50.6 67.6 59.1
H513 61.0 78.6 69.8 53.0 75.3 64.1
H515 65.6 81.0 73.3 52.3 69.3 60.8
H516 67.0 78.6 72.8 55.3 72.6 64.0
H614D 69.8 82.3 76.0 63.0 81.6 72.3
KATUMANI 53.0 66.0 59.5 35.6 53.0 44.3
KCB 55.3 62.6 59.0 32.0 51.6 41.8
PANNAR4M 65.0 81.6 73.3 53.3 67.6 60.5
PANNAR 67 64.6 77.0 70.8 54.3 68.6 61.5
PANNAR 77 65.0 77.6 71.3 54.6 73.3 64.0
PANNAR 7M 65.6 73.3 69.5 54.0 76.6 65.3
PHB 3253 56.6 69.6 63.1 53.6 72.3 63.0
Mean 62.3 74.2 68.2 49.9 67.9 58.9
LSD (p<o.o5) V 7.5 1.1
LSD (p<o.o5) Site 1.0 0.2
LSD (p<o.o5> V*Site 7.9 1.3
c v % 5.1 1.5
CV: coefficient of variation; LSD: least significant difference
In the short rains, all varieties took significantly (P<0.05) shorter time to reach 50% silking in
Mwea except varieties DHO 1, Duma 43 and KCB which were not significantly different in
both sites. In both sites, KCB generally took significantly shorter time to reach 50% silking
than all varieties except Katumani, PHB 3253, DHO 1 and DHO 2. Variety H614D took
significantly longer time to attain 50% silking than most varieties especially in 2009 long
40

rains. Variety DHO 2 and H515 silked significantly earlier among the DHO series and the
Five series respectively while Pannar 4M and Pannar 67 silked earlier among the Pannar
series. The maize varieties attained 50% silking significantly (P<0.05) earlier in Mwea than in
Waruhiu.
Table 7: Mean days after emergence (DAE) to 50% silking of sixteen maize varieties grown
in Mwea and Waruhiu during 2008 short rains and 2009 long rains
Variety (V)
2008 short rains 2009 long rains
Mwea Waruhiu Mean Mwea Waruhiu Mean
DHO 1 61.3 68.0 64.6 49.0 65.0 57.0
DHO 2 62.0 70.6 66.3 47.6 60.3 54.0
DHO 4 66.0 83.3 74.6 57.3 80.3 68.8
DK 8031 68.0 83.6 75.8 55.0 69.6 62.3
DUMA 43 66.6 73.0 - 69.8 55.0' 73.0 64.0
H513 64.0 83.0 73.5 59.0 80.3 69.6
H515 69.0 85.6 77.3 59.0 74.0 66.5
H516 70.0 80.0 75.0 61.3 77.3 69.3
H614D 73.0 88.0 80.5 68.3 86.0 77.1
KATUMANI 56.0 69.6 62.8 40.0 57.3 48.6
K.CB 58.1 65.0 61.5 37.0 56.6 46.8
PANNAR 4M 68.0 86.6 77.3 57.6 73.0 65.3
PANNAR 67 67.6 81.0 74.3 59.0 73.0 66.0
PANNAR 77 68.0 81.3 74.6 60.6 77.6 69.1
PANNAR 7M 68.6 77.3 73.0 60.0 80.3 70.1
PHB 3253 59.6 74.0 66.8 58.6 76.6 67.6
Mean 65.3 78.1 71.7 55.2 72.5 63.9
LSD (p<o.o5) V 7.4 1.1
LSD (p<o.o5) Site 0.9 0.2
LSD (p<o.o5) V*Site 7.9 1.3
c v % 4.8 1.5
CV: coefficient of variation; LSD: least significant difference
41

Over the short rains, all varieties except Duma 43 and PHB 3253 took significantly (P<0.05)
shorter time to reach 50% physiological maturity in Mwea than in Waruhiu. In both seasons,
variety KCB took significantly shorter time to reach 50% maturity than all varieties except
DHO 1 while H614D took longer time to reach 50% maturity. No significant differences in
time to maturity were noted among the Five series and the Pannar series while DHO 4 took
longer time to mature among the DHO series. During the long rains, all varieties took
significantly (P<0.05) shorter time to mature in Mwea than in Waruhiu. Among the Pannar
series, Pannar 67 and Pannar 7M took significantly shorter and longer time respectively to
reach 50% maturity.
4.3 Effect of maize variety and intercropping on yield and yield components
Variety had no significant (P<0.05) effects on'grain yield over the short rains but significant
effects were noted in this parameter during the long rains (Table 9). Significant site effects on
grain yield were noted during the short rains only. However, significant differences were
noted in both seasons for variety-site interaction. Intercropping and its interaction with variety
and site had no significant effects on maize grain yield (Appendix 10). Within the sites, Duma
43 was significantly out-performed by DHO 4, DK 8031 and H513 in Mwea while Pannar 67
significantly out-yielded DK 8031 and H515. Over the short rains, varieties DHO 4, DK
8031, H513, H614D and Pannar 7M had significantly higher grain yield in Mwea than in
Waruhiu. During the long rains, DK 8031, Duma 43 and PHB 3253 gave significantly
(P<0.05) higher grain yield in Mwea than in Waruhiu while Pannar 67 yielded significantly
higher in Waruhiu. In Mwea, variety Duma 43 had significantly higher grain yield than all
varieties except DHO 1, DHO 4 and H513 while variety H614D had significantly lower grain
yield than most varieties. Variety DHO 2 significantly out-yielded more than half of the
varieties. No significant differences in grain yield were noted among the DHO series, the I*i\e
series and the Pannar series.
42

rable 8: Mean days after emergence (DAE) to 50% physiological maturity of sixteen maize
varieties grown in Mwea and Waruhiu during 2008 short rains and 2009 long rains
Variety (V)
2008 short rains 2009 long rains
Mwea Waruhiu Mean Mwea Waruhiu Mean
DHO 1 86.0 94.0 90.0 102.0 121.6 111.8
DHO 2 88.6 100.3 94.5 99.6 120.6 110.1
DHO 4 104.6 114.0 109.3 129.3 142.6 136.0
DK 8031 96.6 114.0 105.3 113.0 124.3 118.6
DUMA 43 100.3 105.6 103.0 123.0 128.3 125.6
H513 103.6 113.3 108.5 125.3 140.0 132.6
H515 102.3 118.0 110.1 127.6 136.0 131.8
H516 108.3 116.0 112.1 124.0 136.6 130.3
H614D 116.3 122.0 119.1 136.3 151.3 143.8
KATUMANI 82.3 100.0 91.1 96.0 116.6 106.3
KCB 80.0 90.0 85.0 93.3 . 114.3 103.8
PANNAR 4M 102.1 115.0 108.5 120.6 127.0 123.8
PANNAR 67 102.0 113.0 107.5 115.6 128.0 121.8
PANNAR 77 104.6 116.0 110.3 124.3 129.0 126.6
PANNAR 7M 104.6 114.6 109.6 120.0 138.0 129.0
PHB3253 102.0 106.6 104.3 123.3 136.6 130.0
Mean 99.0 109.5 104.3 117.1 130.7 123.9
LSD (p<o.o5> V 5.0 1.1
LSD (p<o.o5) Site 1.1 0.2
LSD (p<o.os) V*Site 5.9 1.3
c v % 3.9 0.7
CV: coefficient of variation; LSD: least significant difference
43

Table 9: Mean grain yield (t h a 1) o f sixteen maize varieties grown in Mwea and Waruhiu
during 2008 short rains and 2009 long rains
Variety (V)
2008 short rains 2009 long rains
Mwea Waruhiu Mean Mwea Waruhiu Mean
DHO 1 1.4 1.4 1.4 2.4 2.8 2.6
DHO 2 1.6 1.3 1.4 2.3 2.1 2.2
DHO 4 2.4 1.7 2.1 2.6 2.2 2.4
DK 8031 2.4 1.2 1.8 2.4 1.6 2.0
DUMA 43 1.6 1.5 1.6 3.2 2.5 2.9
H513 2.3 1.4 1.8 2.2 2.5 2.4
H515 1.8 1.2 1.5 2.0 1.9 2.0
H516 2.0 1.5 1.7 2.0 1.8 1.9
H614D 2.0 1.4 1.7 1.2 1.4 1.3
KATUMANI 1.7 1.3 1.5 1.8 2.4 2.1
KCB 1.8 1.4 1.6 2.0 1.7 1.8
PANNAR 4M 2.1 1.5 1.8 2.4 1.8 2.1
PANNAR 67 2.1 1.9 2.0 1.7 2.4 2.0
PANNAR 77 2.1 1.6 1.8 2.0 1.8 1.9
PANNAR 7M 2.1 1.3 1.7 1.9 2.5 2.2
PHB 3253 1.8 1.6 1.7 2.8 1.8 2.3
Mean 1.9 1.5 1.7 2.2 2.1 2.1
LSD (p<o.o5) V NS 0.5
LSD (p<o.o5) Site 0.1 NS
LSD (p<o.o5) V*Site 0.6 0.7
c v % 14.6 12.9
NS: not significant at 5% probability level; CV: coefficient of variation
LSD: least significant difference
Variety did not significantly (P<0.05) affect number of ears per plant in both seasons ( I able
10). Over the short rains no significant differences in this parameter were noted between sites
but significant differences were noted for variety-site interaction. Number of cars per plant
were not significantly affected by intercropping (Appendix 11). Varieties had no significant
44

differences in number o f ears per plant between the sites except DHO 4 and DK 8031 which
pad significantly higher number of ears per plant in Mwea and Waruhiu, respectively. Site
significantly (P<0.05) affected number of ears per plant over the long rains. However, site-
variety interaction was not significant. Maize grown in Waruhiu had significantly more ears
per plant than in Mwea.
Table 10: Mean number of ears per plant of sixteen maize varieties grown in Mwea and
Waruhiu during 2008 short rains and 2009 long rains
Variety (V)
2008 short rains 2009 long rains
Mwea Waruhiu Mean Mwea Waruhiu Mean
DHO 1 1.0 1.1 1.1 1.0 1.2 1.1
DHO 2 1.2 1.1 1.2 1.0 1.2 1.1
DHO 4 0.8 1.3 1.1 1.1 1.0 1.0
DK 8031 - 1.5 1.1 1.3 1.0 1.0 1.0
DUMA 43 1.2 1.3 1.3 1.0 1.1 1.1
H513 1.2 1.0 1.1 1.1 1.1 1.1
H515 1.2 1.0 1.1 1.0 1.1 1.1
H516 1.2 1.0 1.1 1.1 1.1 1.1
H614D 1.2 1.0 1.1 1.1 1.0 1.0
KATUMANl 1.2 1.0 1.1 1.0 1.1 1.1
KCB 1.2 1.1 1.2 1.0 1.0 1.0
PANNAR 4M 1.3 1.1 1.3 1.1 1.1 1.1
PANNAR 67 1.1 1.2 1.2 1.0 1.0 1.0
PANNAR 77 1.1 1.0 1.1 1.0 1.0 1.0
PANNAR 7M 1.1 1.1 1.1 1.0 1.1 1.1
PHB 3253 1.1 1.1 1.1 1.1 1.0 1.0
Mean 1.2 1.1 1.1 1.0 1.1 1.1
LSD (p-o.05) V NS NS
LSI) (p<o.os) Site NS 0.02
LSD (p<o.o5) V*Site 0.2 NS
CV o/o 15.9 8.6-------------
NS: not significant at 5% probability level; CV: coefficient of variation,
LSD: least significant difference
45

Significant (P<0.05) varietal differences in cob length were noted in all seasons. Significant
differences in cob length were also noted for site and its interaction with variety over the
seasons (Table 11). This parameter was not significantly affected by intercropping (Appendix
12). Over the short rains, varieties H516 and Pannar 67 had significantly longer cobs in
Waruhiu than in Mwea while no significant differences were noted among the rest of the
varieties between the two sites. Variety H614D had significantly longer cobs than DHO 1,
Katumani, KCB, Pannar 77, Pannar 7M and PHB 3253. Variety KCB had significantly
shorter cobs than all varieties except DHO 1, DHO 2, Duma 43, Katumani, Pannar 77, Pannar
7M and PHB 3253. Over the long rains, varieties H516, H614D, Pannar 67 and Pannar 7M
had significantly longer cobs in Waruhiu than in Mwea. No significant differences in cob
length were noted for the rest of the varieties between the two sites. Variety H516 had
significantly longer cobs than all varieties except H614D, Duma 43, H513, H515, Pannar 4M,
Pannar 7M and PHB 3253. Variety KCB had significantly shorter cobs than all varieties
except Katumani, DHO 1, DHO 2 and Pannar 67. No significant differences in cob length
were noted among the DHO series, the Five series and the Pannar series. Overall, maize
grown in Waruhiu had longer cobs over the seasons.
Variety had no significant (P<0.05) effects on number of kernel-rows per cob over the short
rains but significant differences were noted over the long rains (Table 12). Site and its
interaction with variety significantly (P<0.05) affected number of kernel-rows per cob in both
seasons. Intercropping and its interaction with variety and site had no significant effects on
this parameter (Appendix 13). Varieties DK 8031, Duma 43, Katumani, KCB, Pannar 77 and
PHB 3253 had significantly higher number of kernel-rows per cob in Mwea than in Waruhiu
over the short rains. Over the long rains, varieties DHO 4, KCB and PHB 3253 had
significantly higher number of kernel-rows per cob in Mwea than in Waruhiu. PHB 3253 had
significantly higher number of kernel-rows per cob than all varieties while K( B had
46

significantly lower number o f kernel-rows per cob than all varieties except Katumani, DHO 2,
PK 8031 and the five series. Among the Pannar series, Pannar 7M had significantly more
kernel-rows per cob while no significant differences were noted among the DHO series and
the Pannar series.
Table 11: Mean cob length (cm) of sixteen maize varieties grown in Mwea and Waruhiu
during 2008 short and 2009 long rains
Variety (V)
2008 short rains 2009 long rains
Mwea Waruhiu Mean Mwea Waruhiu Mean
DHO 1 12.4 12.9 12.7 12.3 13.8 13.1
DHO 2 15.8 13.1 14.5 12.7 14.2 13.4
DHO 4 14.0 13.9 14.0 14.4 13.7 14.1
DK 8031 15.3 15.8 15.5 14.5 14.1 14.3
DUMA 43 .14.2 14.2 ' 14.2 15.5 15.8 15.6
H5I3 14.1 14.6 14.3 14.9 16.2 15.6
H515 15.3 15.4 15.4 15.5 16.2 15.9
H516 13.0 16.5 14.7 15.3 17.6 16.4
H614D 15.3 17.0 16.2 14.7 16.0 15.3
k a t u m a n i 12.8 13.5 13.2 11.7 13.6 12.6
KCB 11.5 12.3 11.9 12.8 12.2 12.5
PANNAR 4M 14.3 14.4 14.3 15.0 16.4 15.7
PANNAR 67 13.2 17.7 15.4 12.1 15.1 13.6
PANNAR 77 13.0 13.1 13.1 13.8 15.1 14.4
PANNAR 7M 11.6 13.9 12.8 13.3 17.7 15.5
PHB 3253 12.6 13.1 12.8 15.8 15.3 15.6
Mean 13.7 14.5 14.1 14.0 15.2 14.6
LSD (p<o.o5) V 2.3 1.3
LSD (p<o.os) Site 0.6 0.4
LSD (p<o.o5) V*Site 2.8 1.9
CV% 14.0 11.5—
( V: coefficient of variation; LSD: least significant difference
47

fab le 12: Mean number of kernel-rows per cob o f sixteen maize varieties grown in Mwea and
V/aruhiu during 2008 short rains and 2009 long rains
Variety (V)
2008 short rains 2009 long rains
Mwea Waruhiu Mean Mwea Waruhiu Mean
DHO 1 13.5 11.9 12.7 12.3 12.3 12.3
DHO 2 13.4 12.0 12.7 12.5 12.0 12.2
DHO 4 14.0 12.8 13.4 13.3 12.4 12.8
DK 8031 13.6 12.0 12.8 12.2 12.2 12.2
DUMA 43 13.4 11.4 12.4 12.6 12.2 12.4
H513 12.8 12.8 12.8 12.2 12.1 12.2
H515 13.2 12.0 12.6 12.1 12.2 12.2
H516 12.9 11.8 12.3 12.4 12.1 12.3
H614D 12.7 12.5 12.6 12.7 13.0 12.9
KATUMANI 14.2 11.7 13.0 12.1 11.8 11.9
KCB 12.6 11.2 11.9 . 12.3 11.1 11.7
PANNAR4M 13.1 12.2 12.7 12.7 12.7 12.7
PANNAR 67 13.1 12.5 12.8 12.1 11.6 11.8
PANNAR 77 13.9 11.8 12.9 13.4 13.0 13.2
PANNAR 7M 13.7 12.8 13.2 14.1 13.8 14.0
PHB 3253 14.6 13.0 13.8 15.4 13.7 14.61 O A
Mean 13.4 12.1 12.8 12.8 12.4 12.0
LSD (p<o.os) V NS 0.6
LSD (p<o.o5) Site 0.1 0.1
LSD (p<o.o5) V*Site 1.5 O.o
CV% 4.9 5.0
NS: not significant at 5% probability level; CV: coefficient ot variation, LSD: least
significant difference
Number of kernels per cob-row differed signif.cantly among the varieties over the long rains,
with no significant differences noted over the short rams (Table 13). Site and variety site
interaction effects in this parameter were noted during the short rains and the long rams,
respectively. Intercropping and its interaction with variety and site did not significantly allcc.
48

number of kernels per cob-row (Appendix 14). Significantly (P<0.05) higher number of
kernels per cob-row were noted in Mwea than in Waruhiu over the short rains. Over the long
rains, DHO 4, DK 8031, and PHB 3253 had significantly higher number of kernels per cob
row in Mwea than in Waruhiu while Panner 7M had significantly higher kernels per cob-row
in Waruhiu. Variety Duma 43 had significantly higher number of kernels per cob-row than all
varieties except DHO 4, DK 8031, H516, Pannar 4M, Pannar 77 and PHB 3253. Variety KCB
had significantly lower number of kernels per cob-row than all varieties except Katumani,
H614D and Pannar 7M.
Over the short rains, variety did not significantly (P<0.05) affect 100 kernel weight (Appendix
15). However site and its interaction with variety had significant (P<0.05) effects on 100
kernel weight (Table 14). Cropping system and its interaction with variety and site had no
significant effects on 100 maize kernel weight. Varieties DHO 4, DK 8031, H513, H515,
H614D, KCB, Pannar 4M, Pannar 7M and PHB 3253 had significantly higher 100 kernel
weight in Mwea than in Waruhiu. No significant differences in kernel weight were noted
among DHO 1, DHO 2, H516, Katumani, Pannar 67 and Pannar 77 between the two sites.
Significant (P<0.05) varietal and site effects were noted for 100 kernel weight during the long
rains. However, variety and its interaction with site, cropping system and its interaction with
variety and site had no significant effects on kernel weight. Variety H513 had significantly
higher kernel weight than all varieties except DK 8031, Duma 43, H614D, Katumani, KCB,
Pannar 67 and PHB 3253. Maize grown in Mwea had significantly heavier kernels than maize
grown in Waruhiu.
4<>

-fable 13: Mean number o f kernels per cob-row o f sixteen maize varieties grown in Mwea and
\Varuhiu during 2008 short rains and 2009 long rains
Variety (V)
2008 short rains 2009 long rains
Mwea Waruhiu Mean Mwea Waruhiu Mean
pH O 1 26.9 24.1 25.5 24.7 28.0 26.3
0 H O 2 26.6 25.0 25.8 25.8 27.1 26.5
0 H O 4 31.7 26.6 29.1 32.3 26.2 29.2
DK. 8031 33.7 27.6 30.6 31.4 26.4 28.9
DUMA 43 30.6 26.2 28.4 30.3 29.9 30.1
H513 28.7 26.9 27.8 27.7 26.6 27.2
H515 29.8 26.2 28.0 25.2 27.6 26.4
H516 26.7 28.5 27.6 27.0 30.6 28.8
H614D 29.7 25.5 27.6 24.7 24.8 24.7
KATUMANI 26.6 22.5 24.5 22.6 24.6 23.6
KCB 24.0 22.7 23.4 23.9 22.3 23.1
PANNAR 4M 30.0 22.4 26.2 28.9 27.8 28.3
PANNAR 67 28.3 27.1 27.7 24.6 27.4 26.0
PANNAR 77 28.5 26.4 27.5 30.0 27.6 28.8
PANNAR 7M 22.3 24.5 23.4 23.0 27.4 25.2
PHB 3253 25.6 23.9 24.8 32.0 22.8 27.4
Mean 28.1 25.4 26.7 27.1 26.7 26.9
LSD (p<o.o5) V NS 2.8- NS
L S D (p<o.05) bite 1.14.3
LSD (p<o.05) V*Site NS
C V % 14.7 15.4
NS: not significant at 5% probability level; CV: coefficient of vanation; LSD • lCiiSi
significant difference
50

fable 14: Mean 100 kernel weight (g) of sixteen maize varieties grown in Mwea and
a amhiu during 2008 short rains and 2009 long rains
2008 short rains 2009 long rainsVariety (V) Mwea Waruhiu Mean Mwea Waruhiu Mean
DHO 1 23.9 22.6 23.2 23.3 24.6 23.9
DHO 2 23.9 24.2 24.1 23.2 22.9 23.0
DHO 4 25.4 22.5 24.0 25.7 23.1 24.4
DK 8031 29.4 21.1 25.3 25.5 24.7 25.1
DUMA 43 26.8 23.4 25.1 26.6 24.0 25.3
H513 27.7 22.2 25.0 29.3 24.5 26.9
H515 26.7 22.4 24.6 25.7 23.4 24.5
H516 23.7 21.0 22.4 25.1 24.0 24.6
H614D 24.5 20.7 22.6 26.6 24.7 25.6
ICATUMANI 25.9 25.6 25.8 24.9 27.0 26.0
KCB 24.5 21.1 22.8 26.8 23.9 _ 25.4
PANNAR4M 25.9 21.3 23.6 26.1 22.9 24.5
PANNAR 67 26.5 24.1 25.3 26.4 25.9 26.2
PANNAR 77 23.8 23.8 23.8 21.6 21.1 21.4
PANNAR 7M 25.5 21.7 23.6 23.2 24.6 23.9
PHB 3253 26.3 22.3 24.3 27.8 24.6 26.2
Mean 25.7 22.5 24.1 25.5 24.1 24.8
LSD (p<o.o5) V NS 2.1
LSD (p<o.o5) Site 0.4 0.8
LSD (p<o.o5) V*Site 2.5 NS
CV % 5.8 12.3
NS: not significant at 5% probability level; CV: coefficient of variation; LSD: least
significant difference
Variety, site and varietyxsite interaction had significant (P<0.05) ettects on shelling 'o ot
maize (Table 15). However, shelling % of the maize varieties were not significantly (P<0.()5)
affected by intercropping and its interaction with variety and site (Appendix 16). Over the
short rains, varieties DHO 2, DHO 4, H516, Katumani, Pannar 77 and Pannar 7M had
51

significantly higher shelling % in Mwea than in Waruhiu. In Mwea, Pannar 7M had a higher
shelling % than all varieties except PHB 3253, Panner 77, Pannar 67, KCB, Katumani, H516,
H513, DK 8031 and DHO 2 while H614D had a lower shelling % than all varieties except
DHO 1, DHO 4, Duma 43, H513, H515, KCB, Pannar 4M and Pannar 77. In Waruhiu variety
PHB 3253 had higher shelling % than all varieties except Pannar 67, Pannar 4m, KCB, H515,
H513, DK 8031, Duma 43 and DHO 1 while H516 had a significantly lower shelling %. Over
the long rains, DHO 2, DHO 4, DK 8031, H516, Pannar 4M and Pannar 7M had significantly
higher shelling % in Mwea than in Waruhiu. In Mwea, H516 a higher shelling % than all
varieties except DHO 1, DHO 2, DHO 4, Duma 43, Katumani, KCB, Pannar 67, Pannar 7M
and PHB 3253 while H614D had a lower shelling % than all varieties except Pannar 4M and
Pannar 77. In Waruhiu, Pannar 67 had a higher shelling % than all varieties except Duma 43,
Katumani and PHB 3253 while Pannar 4M a lower shelling %"than all varieties except DHO
2. Overall, maize grown in Mwea had significantly higher shelling % than maize grown in
Waruhiu.
Variety had significant effects (P<0.05) effects on harvest index in both seasons ( I able 16).
Harvest index was significantly affected by site and its interaction with variety over the short
rains only. Intercropping and its interaction with variety and site had no significant effects in
harvest indices of the maize varieties (Appendix 17). Over the short rains, harvest index for
all maize varieties did not differ significantly between the sites except for K( B and PHB
3253 which had significantly higher harvest indices in Waruhiu. Variety KCB had
significantly higher harvest index than all varieties except Katumani, Pannar 4M, PHB 3253,
DHO 1 and DHO 2 in Mwea and PHB 3253 in Waruhiu. Varieties DK 8031 and H515 had
significantly lower harvest indices than most of the other varieties. During the long rains,
variety KCB had significantly higher harvest index than all varieties except Katumani while
52

H614D had significantly lower harvest index than all varieties except Pannar 67 and Pannar
77. Overall, maize grown in Waruhiu had higher harvest indices than maize grown in Mwea.
Table 15: Mean shelling % of sixteen maize varieties grown in Mwea and Waruhiu during
2008 short rains and 2009 long rains
Variety (V)
2008 short rains 2009 long rains
Mwea Waruhiu Mean Mwea Waruhiu Mean
DHO 1 82.4 80.9 81.6 83.5 80.2 81.9
DHO 2 86.3 78.0 82.2 83.7 77.1 80.4
DHO 4 82.6 74.9 78.8 83.4 78.7 81.1
DK. 8031 84.9 83.3 84.1 81.7 78.7 80.2
DUMA 43 82.6 81.3 82.0 84.5 83.9 84.2
H513 83.9 80.4 82.1 81.9 79.9 80.9
H515 81.9 81.3 81.6 80.7 77.9 79.3
H516 84.4 66.2 75.3 86.5 79.2 82.6
H614D 80.3 79.1 79.7 77.8 80.7 79.2
KATUMANI 86.1 79.0 82.6 85.0 81.9 83.4
KCB . 83.0 80.7 81.9 84.4 81.6 83.0
PANNAR 4M 82.8 80.0 81.4 79.8 74.9 77.4
PANNAR 67 84.8 80.7 82.8 84.9 84.7 84.8
PANNAR 77 83.7 79.2 81.5 79.8 78.4 79.1
PANNAR 7M 86.5 79.9 83.2 83.9 79.0 81.4
PHB 3253 84.6 83.6 84.1 84.9 82.0 83.4
Mean 83.8 79.3 81.5 82.9 79.9 81.4
LSD (p<o.os) V 3.6 2.8
LSD (p<o.o5) Site 0.8 0.8
LSD (p<o.o5) V*Site 4.2 3.7
CV% 3.5 3.8_____
CV: coefficient o f variation; LSD: least significant ditference
53

Table 16: Mean harvest index (HI) of sixteen maize varieties grown in Mwea and Waruhiu
during 2008 short rains and 2009 long rains
Variety (V)
2008 short rains 2009 long rains
Mwea Waruhiu Mean Mwea Waruhiu Mean
DHO 1 0.10 0.15 0.13 0.20 0.23 0.22
DH0 2 0.10 0.15 0.12 0.21 0.23 0.22
DHO 4 0.09 0.08 0.08 0.09 0.12 0.10
DK 8031 0.09 0.05 0.07 0.12 0.05 0.09
DUMA 43 0.08 0.11 0.10 0.17 0.16 0.17
H513 0.08 0.09 0.08 0.10 0.10 0.10
H515 0.07 0.07 0.07 0.08 0.09 0.09
H516 0.09 0.14 0.11 0.12 0.06 0.09
H614D 0.07 0.08 0.08 0.03 0.03 0.03
KATUMANI 0.11 0.13 0.12 0.23 0.24 0.23
KCB 0.14 0.21 0.17 0.20 0.36 0.28
PANNAR 4M 0.11 0.13 0.12 0.12 0.12 0.12
PANNAR 67 0.09 0.12 0.10 0.09 0.08 0.08
PANNAR 77 0.07 0.10 0.09 0.06 0.09 0.08
PANNAR 7M 0.09 0.08 0.09 0.10 0.08 0.09
PHB 3253 0.12 0.18 0.15 0.11 0.07 0.09
Mean 0.09 0.12 0.10 0.13 0.13 0.13
LSD (p<o.o5) V 0.05 0.05
LSD (p<o.o5) Site 0.01 NS
LSD (p<o.o5) V*Site 0.05 NS
c v % 23.60 52.80
CV: coefficient o f variation; LSD: least significant difference
54

4.4 Relationship among maize plant maturity, yield and yield components
There were significant positive correlations in Mwea over the short rains between grain yield
3nd tim e to 50% anthesis (r = 0.51, P< 0.05), time to 50% silking (r = 0.50, P< 0.05) and 100-
kemel weight (r = 0.56, P< 0.05) (Table 17). Time taken to 50% anthesis correlated positively
with time to 50% silking (r = 0.99, P< 0.01) and time to maturity (r = 0.76, P< 0.01) while
time to 50% silking correlated positively with time to 50% maturity (r = 0.76, P< 0.01). Cob
length and ears per plant were positively correlated with 50% maturity (r 0.49, P< 0.05) and
100-kemel weight (r = 0.54, P< 0.05) respectively. Harvest index correlated negatively with
time to 50% anthesis (r = 0.61, P< 0.05), time to 50% silking (r = 0.62, P< 0.05), time to 50%
maturity (r = 0.61, P< 0.05).
Table 17: Pearson correlation coefficients relating itlaize grain yield, crop development and
yield components in Mwea, 2008 short rains ________ _____
Grain 100
yield 50% 50% 50% Ears/ cob rows/ Kernel Shellin
t/ha Anthesis Silking Maturity plant length cob weight g%
50%.51*
Anthesis-
50%
Silking
50%
.50* 99**
.76**.49 .76**Maturity
Ears/plant .25 .22 .22 -.01
cob length .21 .42 .43 .49* .34
rows/cob .33 -.03 -.03 .01 -.26 .09
100 Kernel.56* .18 .17 .14 .55* .26 .09
weight
Shelling % .06 -.19 -.20 -.13 -.28 -.29 .16 .04
Harvest-.05 -.62* -.62* -.62* .09 -.59* -.02 -.09 .19

In Mwea over the long rains, there were significant positive correlations between time to 50%
anthesis and time to 50% silking (r = 0.99, P< 0.01), time to 50% physiological maturity (r -
0.93, P< 0.01), ears per plant (r = 0.53, P< 0.01), cob length (r = 0.60, P< 0.05) (Table 18).
Time to 50% silking positively correlated with time to 50% physiological maturity (r - 0.93,
P< 0.05), number of ears per plant (r = 0.59, P< 0.05) and cob length (r = 0.76, P< 0.01).
Number of ears per plant positively correlated with cob length (r = 0.58, P< 0.05). However,
significant negative correlations were noted between harvest index and time to 50 /o anthesis
(r = 0.88, P< 0.01), time to 50% silking (r = 0.89, P< 0.01), time to 50% physiological
maturity (r = 0.89, P< 0.01).
Table 18: Pearson correlation coefficients relating maize grain yield, crop development and
yield components in Mwea, 2009 long rains ________
Grain
yield
t/ha
---------------------------------------- 100
50% 50% 50% Bars/ cob rows/ Kernel Shellin
Anthesis Silking Maturity plant length cob weight g/o
50%
Anthesis
50%
Silking
50%
Maturity
-.14
-.16 .99**
-.02 .93 .93 **
Ears/plant -.01 .53* .54* .59*
cob length .39 .60* .610* .76** .58*
rows/cob .31 .32 .31 .32 .13 .32
100 Kernel.13 .13 .11 .26 .55* .47 -.03
weight
Shelling % .32 -.46 -.47 -.47 -.26 -.29 .08 .043
Harvest.30 -.88** -.89** -.89** -.42 -.52*' -.29 -.15
index
* Correlation is significant at 0.01 level; *Correlation is significant at 0.05 level U-taneaj
.58s
56

in W aruhiu over the short rains (Table 19), significant positive correlations were noted
between time to 50% anthesis and time to 50% silking (r = 0.99, P< 0.01), time to 50%
anthesis and time to 50% physiological maturity (r = 0.85, P< 0.01), time to 50% silking and
time to 50% physiological maturity (r = 0.88, P< 0.01), time to 50% silking and cob length (r
= 0.72, P< 0.01), time to 50% rows per cob (r = 0.59, P< 0.05). However, there were
significant negative correlations between time to 50% anthesis and ears per plant (r = 0.52, P<
0.01), time to 50% anthesis and harvest index (r = 0.71, P< 0.01), time to 50% silking and
ears per plant (r = 0.589, P< 0.05), time to 50% anthesis and harvest index (r = 0.74, P< 0.01),
time to 50% physiological maturity and ears per plant (r = 0.66, P< 0.01), time to
physiological maturity and harvest index (r = 0.69, P< 0.01).
Table 19: Pearson correlation coefficients relating maize grain yield, crop development and
yield components in Waruhui 2008 short rains
Grain 100 Shel-
yield 50% 50% 50% Ears/ cob rows/ Kernel ling
t/ha Anthesis Silking Maturity plant length cob weight %
50%
anthesis.32
50%
Silking.31 .99**
50%
Maturity.29 .86** .88**
Ears/plant -.05 -.53* -.59* -.67**
cob length .38 .70** .72** .76** -.45
rows/cob .43 .46 .48 .59* -.28 .41
100 Kernel
weight.20 -.29 -.29 -.30 .22 -.31 -.30
Shelling % -.13 -.27 -.23 -.27 .02 -.14 -.08 .47
Harvest
index.19 - 72** -.75** -.69** .44 -.41 -.43 .32 -.01
♦♦Correlation is significant at 0.01 level: ^Correlation is significant at 0.05 level (2-tailed)
57

In Waruhiu over the long rains season, there were significant positive correlations between
time to 50% anthesis and time to 50% silking (r = 0.99, P< 0.01), time to 50% physiological
maturity (r = 0.93, P< 0.01), cob length (r = 0.71, P< 0.01), number of rows per cob (r = 0.66,
P< 0.01) (Table 20). Time to 50% silking correlated positively with time to 50%
physiological maturity (r = 0.93, P< 0.01), cob length (r = 0.70, P< 0.01), number of rows per
cob (r = 0.64, P< 0.01). Time to 50% physiological maturity correlated positively with cob
length (r = 0.62, P< 0.01) and number of rows per cob (r = 0.57, P< 0.05). Cob length
positively correlated with number of rows per cob (r = 0.54, P< 0.05) while 100-kemel weight
positively correlated with shelling % (r = 0.61, P< 0.05). However, there were significant
negative correlations between harvest index and time taken to 50/o anthesis (r 0.86, P_
0.01), time to 50% silking (r = 0.85, P< 0.01), 50% physiological maturity (r = 0.76, P< 0.01),
cob length (r = 0.71, P< 0.01) and rows per c'Ob (r = 0.60, P< 0.01).
4.5 Effect of intercropping on bean plant height and root nodulation
The maize variety and its interaction with site did not significantly (P<0.05) affect beans plant
height at 43 DAE (Appendix 18). However, significant site effects in this parameter were
noted (Table 21). Beans grown in Waruhiu were significantly taller than beans grown in
Mwea and Machakos. Plant height in the later two sites was not significantly difter *
Intercropping had a significant (P<0.05) effect on number of nodules per plant at 2 y
emergence (DAE) in all the sites but had no significant effects on this parameter at 50%
flowering (Table 22, Appendix 19). A significantly higher number of nodules per plant was
noted in Waruhiu than in Mwea which in turn had significantly higher number of nodules per
plant than Machakos. At 21 DAE, nine of sixteen maize varieties intercropped with beans
significantly increased bean nodulation relative to sole beans. Only varieties D
H516, H614D, Pannar 4M and Pannar 7M had no effect on bean nodulation. Beans
58

intercropped with H614D had significantly fewer noduless than beans intercropped with most
o f the other varieties. No significant differences in bean nodulation were noted within
intercrop systems involving the DHO series, the five series and the Pannar series. Significant•
differences in bean nodulation among the sites were noted at both 21 DAE and 50%
flowering.
T able 20: Pearson correlation coefficients relating grain yield, crop development and yield
components in Waruhiu, 2009 long rains
Grain 100 Shel-
yield 50% 50% 50% Ears/ cob rows/ Kernel ling
t/ha Anthesis Silking Maturity plant length cob weight %
50%
Anthesis-.15
50%
Silking-.15 99**
50%
Maturity-.19 94** .94**
Ears/pla
nt.48 -.31 -.31 -.31
cob
length.01 .72** .70** .62** .23
rows/cob -.14 .66** .64** .58* -.19 .54*
100
Kernel .31 -.21 -.23 -.11 -.03 -.10 -.19
weight
Shelling
%.28 -.09 -.10 -.09 -.35 -.21 -.23 .62*
Harvest
index.25 -.86** -.85** -.76** .27 -.71** -.60* .074 .14
"Correlation is significant at 0.01 level; ‘ Correlation is significant at 0.05 level (2-tailed)
59

fa b le 21: Mean plant height (cm) at 43 days after emergence (DAE) of KB 1 bean
intercropped with sixteen maize varieties grown in Mwea, Waruhiu and Machakos during
2009 long rains.
A Plant height 43 DAE
Cropping System (CS) Mwea Waruhiu Machakos Mean
DHO 1 + beans 47.2 56.7 41.8 48.6
DHO 2 + beans 47.6 50.6 44.9 47.7
DHO 4 + beans 47.4 49.9 39.9 45.8
DK 8031 + beans 48.1 59.5 44.7 50.8
DUMA 43 + beans 48.0 54.7 45.2 49.3
H513 + beans 47.7 56.0 41.9 48.5
H 5 15 + beans 47.3 53.2 45.8 48.8
H516 + beans 47.4 43.8 45.1 45.4
H614D + beans 48.2 57.9 43.3 49.8
Katumani + beans . 51.5 66.2 49.1 55.6
KCB + beans 47.2 57.3 55.3 53.3
PANNAR 4M + beans 47.9 56.0 46.4 50.1
PANNAR 67 + beans 46.9 58.4 50.3 51.8
PANNAR 77 + beans 48.0 47.8 51.0 48.9
PANNAR 7M + beans 47.4 55.0 51.6 51.4
PHB 3253 + beans 47.6 62.2 42.9 50.9
KB 1 sole beans 47.6 55.1 41.3 48.0
M ean 47.8 55.3 45.9 49.7
LSD (p<o.o5) CS NS
LSD (p<o.o5) Site 3.8
LSD (p<o.os) CS*Site NS
c v % 19.6
NS: not significantly different at 5% probability level; LSD: least significant difference; CV
coefficient of variation
6 0

fab le 22: Mean nodule count at 21 days after emergence (DAE) and at 50% flowering of KB 1 bean
Intercropped with sixteen maize varieties in Machakos, Mwea and Waruhiu during 2009 long rains
21 DAE 50% Flowering
Cropping System
(CS) Mwea Waruhiu Machakos Mean Mwea Waruhiu Machakos Mean
DHO 1 + beans 8.3 17.5 5.5 10.5 17.7 33.4 10.2 20.5
DHO 2 + beans 7.5 16.7 3.7 9.3 17.1 34.3 9.0 20.1
DHO 4 + beans 8.3 17.5 5.5 10.4 17.1 30.7 10.8 19.6
DK 8031 + beans 7.9 17.3 5.6 10.3 17.3 31.3 11.5 20.1
DUMA 43 + beans 8.5 17.8 6.0 10.7 17.6 33.8 11.1 20.9
H513 + beans 7.7 17.3 5.3 10.1 16.9 33.3 9.8 20.1
H515 + beans 6.6 14.9 3.9 8.5 15.2 31.9 9.3 18.8
H516 + beans 7.1 14.1 3.7 8.3 16.1 31.8 10.4 19.4
H.614D + beans 6.5 13.9 3.6 8.0 15.5 30.8 8.7 18.7
Katumani + beans 7.7 16.8 4.8 9.8 16.0 34.2 9.4 19.9
KCB + beans 8.4 19.7 5.2 11.1 18.5 35.4 9.4 21.1
PAN 4M + beans 7.2 15.9 4.7 9.2 17.0 33.7 10.1 20.3
PAN 67 + beans 9.4 17.2 6.1 10.9 18.1 35.4 10.1 21.2
PAN 77 + beans 7.5 17.7 4.8 10.0 17.3 33.5 9.1 19.9
PAN 7M + beans 7.6 15.8 4.2 9.2 16.6 31.6 9.8 19.3
PHB 3253 + beans 8.1 18.5 5.6 10.7 17.5 34.6 9.7 20.6
K.B 1 sole beans 6.1 16.4 4.6 9.1 16.9 34.0 7.8 19.6 on n
Mean t7 T 16.8 4.9 9.8 17.0 33.2 9.8 ZvTT/
LSD (p<o.o5) CS
LSD (p<o.o5)Site
LSD (p<o.o5) CS*Site
CV %
1.6
0.6
NS
17.8
0.8
NS
10.3
NS: not significantly different at 5% probability level; CS: cropping system, LSD. least
significant difference; CV: coefficient of variation, PAN. Pannar
I61

intercropping had no significant (P<0.05) effects on bean shoot biomass at 21 DAE
(Appendix 20). However, significant differences in this parameter were noted at 50%
flowering (Table 23). Significant differences in shoot biomass were also noted among the
sites. Intercropping and its interaction with site did not significantly affect this parameter at
the respective sampling stages. At 50% flowering, significantly higher bean shoot biomass
w as noted for KCB/bean than for all other intercrop systems. H516/bean intercrop system had
significantly lower bean shoot biomass than all bean intercrop systems of DHO 1, Katumani,
KCB, Pannar 4M. At both sampling stages, beans grown in Waruhiu had significantly higher
shoot biomass. At 21 DAE, beans grown in Mwea had significantly lower shoot biomass than
beans grown in Waruhiu and Machakos. However, bean shoot biomass in Mwea and
Machakos was not significantly different at 50% flowering.
4.6 Effect of intercropping on bean yield and yield components
Intercropping, site and intercropping*site interaction had significant (P<0.05) effects on bean
seed yield and bean yield decline (Table 24). Significantly (P<0.05) higher bean yields were
obtained for all cropping systems in Waruhiu than the rest of the sites except H513/bean
intercrop system whose yields were not significantly different among the sites (Appendix 22).
Higher bean yield of 924 kg ha"1 was obtained when KB 1 was grown as a sole crop, while a
lower yield of 335 kg h a 1 was obtained when KB 1 was intercropped with H515.
Significantly lower bean yields were obtained in Machakos than in the rest of the sites.
Intercropping significantly (P<0.05) depressed bean seed yields (Table 24). Average yield
declines taking sole crop yield as 100% were 58.92%, 56.01% and 51.46% in Mwea,
Machakos and Waruhiu respectively. Significantly high yield declines of 75.2% and 77.9 o
were noted when KB 1 was intercropped with H513 in Waruhiu and Pannar 7M in Machakos
respectively. Yield declines ranged from 33.8% (H513) to 69.9% (DHO 1) in Mwea, 32.3 b
62

(K CB) to 75.2% (H513) in Wanihiu and 16.8% (Katumani) to 77.9% (Pannar 7M) in
M achakos. Across the sites, intercropping beans with Pannar 7M caused the greatest decline
in bean seed yields (68.8%). Bean seed yield declines in Waruhiu and Machakos were
significantly lower than yield declines in Mwea.
T a b le 23: Mean shoot biomass (g m 2) at 21 days after emergence (DAE) and at 50% flowering of
KB 1 bean intercropped with sixteen maize varieties grown in Mwea, Waruhiu and Machakos during
2009 long rains
Cropping System
(CS)
21 DAE 50% Flowering
Mwea Waruhiu Machakos Mean Mwea Waruhiu Machakos MearT
D H O 1 + beans 106.2 158.1 143.5 132.2 195.0 254.5 220.0 224.8
D H O 2 + beans 113.8 153.4 99.2 133.6 191.4 270.1 175.7 230.8
D H O 4 + beans 79.7 120.9 102.8 100.3 163.4 233.9 179.3 198.7
DK 8031 + beans 109.0 175.3 129.9 142.2 186.1 240.9 198.4 213.5
DUMA 43 + beans 100.0 166.1 132.5 133.1 167.5 241.7 201.0 204.6
H513 + beans 91.1 173.3 95.9 132.2 174.8 300.4 164.4 237.6
H 515 + beans 91.1 107.2 111.2 99.2 166.8 193.8 212.7 180.3
H516 + beans 54.8 131.1 102.3 93.0 164.4 177.1 174.8 170.8
H614D + beans 108.8 136.2 128.0 122.5 176.2 268.9 192.5 222.6
Katumani + beans 102.6 177.2 120.0 139.9 167.2 275.4 196.5 221.3
KCB + beans 154.9 175.7 98.1 165.3 336.7 303.7 209.2 320.2
PAN 4M + beans 99.5 156.0 168.6 127.8 177.1 231.6 231.5 204.4
PAN 67 + beans 103.5 153.3 118.2 128.4 166.8 228.9 185.1 197.9
PAN 77 + beans 97.4 142.9 157.9 120.2 173.1 218.5 220.7 195.8
PAN 7M + beans 83.5 193.4 116.2 138.5 159.2 232.1 206.5 195.7
PHB 3253 + beans 96.3 168.3 103.5 132.3 173.9 264.7 176.0 219.3
KB 1 sole beans 74.2 152.6 109.0 113.4 164.8 228.2 177.5 196.5
Mean 98.0 155.4 119.8 126.7 182.6 245.0 195.4 213.8
LSD (p<o.o5) CS NS 40.7
LSD (p<o.o5) Site 16.2 17.1
LSD (p<o.05)CS*Site NS NS
c v % 33.1 20.9
NS: not significantly different at 5% probability level: PAN: Pannar
63

T able 24: Mean seed yield (kg ha ') and percent yield decline of KB 1 bean intercropped with
six teen maize varieties grown in Mwea, Waruhiu and Machakos during 2009 long rains
C ropping System Grain yield (kg ha'1) Percent yield decline
(CS) Mwea Waruhiu Machakos Mean Mwea Waruhiu Machakos Mean
D H O 1 + beans 204.0 752.0 117.0 478.0 69.9 53.6 72.4 61.8
D H O 2 + beans 273.0 877.0 183.0 575.0 59.5 46.1 57.2 52.8
D H O 4 + beans 338.0 905.0 229.0 621.5 50.0 44.9 46.1 47.5
D K 8031 + beans 268.0 737.0 164.0 502.5 60.4 53.7 61.2 58.4
D U M A 43 + beans 219.0 649.0 247.0 434.0 67.5 60.3 41.5 56.4
H 513 + beans 447.0 405.0 214.0 426.0 33.8 75.2 49.7 52.9
H 515 + beans 225.0 647.0 134.0 436.0 66.7 60.8 68.0 65.2
H 516 + beans 261.0 693.0 175.0 477.0 61.4 57.8 59.8 59.6
H614D + beans 288.0 1037.0 186.0 662.5 57.3 35.0 55.2 49.1
Katumani + beans 290.0 643.0 361.0 466.5 57.1 62.0 16.8 45.3
K C B + beans 256.0 1102.0 167,0 679.0 62.2 32.3 60.2 51.5
PAN 4M + beans 347.0 1023.0 196.0 685.0 48.6 39.7 52.4 46.9
PAN 67 + beans 248.0 794.0 270.0 521.0 63.5 53.5 50.1 55.7
PAN 77 + beans 221.0 592.0 109.0 406.5 67.4 65.5 73.7 68.8
PAN 7M + beans 307.0 887.0 93.0 597.0 54.3 45.4 77.9 59.2
PHB 3253 + beans 249.0 1026.0 196.0 637.5 63.1 37.6 54.0 51.5
KB 1 sole beans 676.0 1661.0 437.0 1168.5
Mean 301.0 848.8 204.6 574.9 58.9 51.5 56.0 55.4
L S D (p<o.o5) C S 144.6 11.8
L S D (p<o.o5) S ite 60.7 5.1
L S D (p<o.o5) C S * S ite 250.4 20.4
C V % 34.2 22.7
LSD: least significant difference; CV: coefficient of variation; PAN: Pannar
64

som ber o f pods per plant were significantly (P<0.05) affected by intercrop system (Table 25).
however, no significant (P<0.05) differences in number of seeds per pod were noted
^Appendix 23). Across the sites, significant differences in number of pods per plant and
number o f seeds per pod were noted. Intercropping and its interaction with site did not
significantly affect these two parameters. Sole crop system of KB 1 had significantly (P<0.05)
higher number of pods per plant than the KB 1/maize intercrop systems. DK 8031/KB 1 and
panner 4M/KB 1 intercrop system gave the highest and the least pods per plant respectively.
Intercropping reduced the number of pods per plant by 56.2% to 42.1% in Mwea, 45.6% to
16.6% in Waruhiu and 29.0% to 37.7% in Machakos. Significantly higher number of pods per
jlant and seeds per pod were noted in Mwea and Waruhiu than in Machakos.
Intercropping and its interaction with site had no significant (P<0.05) etfects on 100 seed
weight (Appendix 24) but significant differences in this parameter were noted among the sites
(Table 26). Significantly higher 100 seed weights were obtained in Waruhiu than in Mwea
and Machakos.
65

-fable 25: Mean number o f pods per plant and seeds per pod of KB 1 bean intercropped with sixteen
^aize varieties grown in Mwea, Waruhiu and Machakos during 2009 long rains
Cropping System Pods per plant Seeds per pod
(CS) Mwea Waruhiu Machakos Mean Mwea Waruhiu Machakos Mean
13HO 1 + beans 6.9 7.7 3.5 7.3 4.1 4.4 3.1 4.2
DHO 2 + beans 7.9 6.7 4.6 7.3 4.1 4.1 3.2 4.1
DHO 4 + beans 8.7 7.8 4.7 8.2 4.5 4.0 3.3 4.2
DK 8031 + beans 6.5 6.5 3.7 6.5 4.3 4.0 3.0 4.1
DUMA 43 + beans 6.8 6.6 4.1 6.7 4.4 3.9 3.4 4.2
H513 + beans 9.0 7.3 3.8 8.1 4.6 4.2 2.8 4.4
H515 + beans 8.9 6.6 3.8 7.7 4.5 3.8 3.2 4.1
H516 + beans 7.9 7.2 3.6 7.6 4.6 3.8 3.0 4.2
H614D + beans 6.7 7.3 4.4 7.0 4.2 4.1 3.1 4.1
Katumani + beans 8.3 9.0 4.3 8.7 4.6 4.1 3.4 4.4
KCB + beans 7.5 10.0 3.7 8.7 4.5 4.2 a.o 4.3
PAN 4M + beans 9.3 8.7 4.3 9.0 4.1 4.1 3.3 4.1
PAN 67 + beans 8.2 8.0 4.5 8.1 4.5 3.9 3.1 4.2
PAN 77 + beans 6.6 6.6 3.8 6.6 3.8 4.0 3.4 3.9
PAN 7M + beans 8.6 8.4 4.3 8.5 4.3 4.4 3.0 4.3
PHB 3253 + beans 8.9 8.1 3.8 8.5 4.7 4.0 3.0 4.4
KB 1 sole beans 11.0 10.5 8.1 10.8 4.5 4.5 4.8 4.5
Mean 8.1 7.8 4.3 8.0 4.4 4.1 3.3 4.2
LSD (p<o.o5) CS 1 .4 NS
LSD (p<o.o5 ) Site 0 .60 .2
L S D (p<o.o5)C S * S ite NS NS
CV % 2 3 .4 11 .5
NS: not significant at 5% probability level; LSD. least significant difference,
CV: coefficient o f variation; PAN: Pannar;

Table 26: Mean 100 seed weight (g) of KB 1 bean intercropped with sixteen maize varieties
grown in Mwea, Machakos and Waruhiu during 2009 long rains
100 seed weight
Cropping System (CS) Mwea Waruhiu Machakos Mean
DHO 1 + beans 33.3 46.1 26.2 39.7
DHO 2 + beans 37.0 42.4 30.1 39.7
DHO 4 + beans 38.4 44.0 28.7 41.2
DK 8031 + beans 35.2 44.4 29.2 39.8
DUMA 43 + beans 37.7 43.3 31.0 40.5
H513 + beans 36.8 42.6 28.0 39.7
H515 + beans 37.0 42.8 28.2 39.9
H516 + beans 35.9 43.6 30.1 39.8
H614D + beans 35.0 44.7 29.7 39.9
Katumani + beans 35.2 41.6 30.7 38.4
KCB + beans 36.4 42.5 28.0 39.5
P ANNAR 4M + beans 37.8 43.8 29.5 40.8
PANNAR 67 + beans 34.9 43.3 29.9 39.1
PANNAR 77 + beans 33.2 40.9 27.7 37.0
PANNAR 7M + beans 38.4 44.2 28.9 41.3
PHB 3253 + beans 36.7 44.0 30.9 40.3
KB 1 sole beans 36.4 38.4 27.5 37.4
Mean 36.2 43.1 29.1 39.6
LSI> (p<o.os) CS NS
LSD (p<o.o5) Site 0.9
LSD (p<o.o5) CS*Site NS
c v % 6.7
NS: not significantly different at 5% probability level; LSD: least significant difference; CV:
coefficient of variation

r -----------------------------------------------------------------------------------------------------------------
4.7 Productivity and monetary value of intercropping
The maize varieties had no significant effect on LER of maize/bcan intercrop (Appendix 25).
Site significantly affected LER but its interaction with cropping system did not significantly
affect this parameter (Table 27). However, data presented in this table indicates that
intercropping KB 1 with the maize varieties increases food production per unit area. Yield
advantages ranged from 16% for H515/KB 1 intercrop to 84% for H513/KB 1 intercrop in
Mwea. In Waruhiu yield advantage ranged from 41% for H513/KB 1 intercrop to 92% for
Pannar 67/KB 1 intercrop. Significantly higher yield advantages were obtained in Waruhiu
than in Mwea. In Mwea the LER revealed that it would require 1.16 to 1.84 more units land
with farmers who practice sole cropping of maize and beans to produce comparable yield to
intercropping KB 1 bean variety with maize. Similarly in Waruhiu, it would require on
average 1.57 more units of land of maize and bean monocultures to produce comparable yield
in maize/bean intercrop system.
According to MAI, monetary advantage for intercropping was not significantly (P<0.05)
affected by maize variety in maize/bean intercrop (Table 27) (Appendix 26). Numerically
higher returns of Kshs. 23, 771 for DHO 4/KB 1 intercrop and Kshs. 43, 326 for Pannar
67/KB 1 intercrop system were obtained in Mwea and Waruhiu respectively. Significantly
higher intercropping returns were realized in Waruhiu than in Mwea.
68

Table 27: Mean Land Equivalent Ratio (LER) and Monetary Advantage Index (MAI) of
intercropping KB 1 bean with sixteen maize varieties in Mwea and Waruhiu during 2009
long rains
LER MAI (KShs)
Cropping System (CS) Mwea Waruhiu Mean Mwea Waruhiu Mean
DHO 1 + Beans 1.2 1.5 1.4 9861.0 28374.0 19117.5
DHO 2 + Beans 1.4 1.7 1.6 17712.0 33192.0 25452.0
DHO 4 + Beans 1.4 1.5 1.5 23771.0 26585.0 25178.0
DK 8031 + Beans 1.3 1.3 1.3 20923.0 21227.0 21075.0
DUMA 43 + Beans 1.5 1.3 1.4 18667.0 17290.0 17978.5
H513 + Beans 1.8 1.4 1.6 27950.0 21664.0 24807.0
H515 + Beans 1.1 1.5 1.4 5745.0 25094.0 15419.5
H516 + Beans 1.3 1.5 1.5 15065.0 25901.0 20483.0
H614D + Beans 1.3 1.7 1.5 12677.0 31035.0 21856.0
Katumani + Beans 1.4 1.2 1.3 .13234.0 23699.0 18466.5
KCB + Beans 1.5 1.5 1.5 15540.0 28789.0 22164.5
PANNAR 4M + Beans 1.4 1.8 1.6 17461.0 36701.0 27081.0
PANNAR 67 + Beans 1.4 1.9 1.6 15892.0 43326.0 29609.0
PANNAR 77 + Beans 1.3 1.5 1.4 12794.0 22659.0 17726.5
PANNAR 7M + Beans 1.5 1.5 1.5 15467.0 36912.0 26189.5
PHB 3253 + Beans 1.4 1.9 1.6 19994.0 38173.0 29083.5
Mean 1.4 1.5 1.5 16422.0 28788.8 22605.4
LSD (p<o.o5) CS NS NS
LSD (p<o.os) Site 0.1 5047.1
LSD (p<o.o5) CS*Site NS NS
C V % 22.5 54.7tr r_____n\r
NS: not significantly different at 5% probability level; LSD: least significant difference; CV
coefficient of variation
69

CHAPTER FIVE: DISCUSSION
5.1 E ffect of maize variety, intercropping and site on maize growth, flowering and
maturity
there w ere significant varietal differences and site effects in maize plant height at 57 DAE.
The bean component did not significantly affect maize plant height. This finding agrees with
observations of Harwood et al. (2000) and Tamado et al. (2007) who noted that beans had no
significant effects on maize plant height. Maize grown in Mwea had significantly higher mean
plant height values probably due to high temperatures in the region which led to higher
thermal degree days thus faster crop growth. High lodging percentages were presented by
varieties Katumani, KCB, DHO 1 and DHO 2 with 8.3%, 9.0%, 5.1% and 6.9% respectively.
These varieties had thin stalks which predisposed them to lodging. Their thin and weak stalks
can also be explained by their high harvest indices meaning that they had more carbohydrate
translocation to the grain.
Maize shoot biomass varied significantly among the varieties and in the different sites. I he
composites, DHO 1 and DHO 2 had significantly the least shoot biomass. Most ot the late
I maturing hybrids such as H614D, DK 8031, the Five series and Pannar series had high shoot
biomass. The negative correlation between number of days taken to reach physiolc gi
maturity and harvest index is a clear indication that biomass accumulation is directly related
to maturity period. The early maturing composites, DHO 1 and DHO 2 accumulated less
shoot biomass while the late maturing hybrids accumulated more biomass. This
explained by shorter and prolonged photosynthesis of the early and late maturing varieties
respectively. The early maturing varieties had less time for photosynthetically active radiation
(PAR) and biomass accumulation relative to later maturing varieties. Biomass accumulation
in cereals is positively correlated to days to maturity (Araus ct al., 2008).
70

Mgnificant varietal differences in time to reach 50% anthesis, 50% silking and 50%
physiological maturity were noted. Varieties Katumani and KCB took the shortest time to
nver and mature followed by DHO and DHO 2. The five series, Pannar series, DHO 4
luma 43 , DK 8031 and PHB 3253 took relatively longer time to flower and mature. Further,
variety H614D took the longest time to flower and mature. Maize phenological development
was not significantly affected by intercropping. In their study Mugo et al. (1998), observed
earliness in Katumani composite reaching anthesis in 66 days. In this study the longest time
taken by Katumani to flower was 61 days in Waruhiu. The difference of 5 days could be
attributed to weather conditions during the two studies. However, this study considers the
difference negligible. In their intercropping studies, Moser et al. (2006) reported that bean
component had no significant effects on time taken by maize to flower and mature. Lack of
marked effects of bean component in a maize/bean intercrop system has been reported
elsewhere (Muraya et al., 2006).
5.2 Effect of maize variety, intercropping and site on maize yield and yield components
Varietal differences in grain yield were noted in the 2009 long rains only. Grain yield of DHO
1, DHO 2, Katumani, KCB, H515 and H516 remained relatively stable between the sites in
the two seasons. The least grain yield was obtained from H614D. Stability in grain yield of
DHO 1, DHO 2, KCB and Katumani may be due to their inherent adaptability in semi-arid
areas. These varieties were specifically bred for cultivation in the semi-arid regions.
Consistency in shelling % of these varieties was also a trait associated with their yield
stability.
Following little rainfall in Machakos over the two seasons, performance of maize was highly
constrained. Death of maize crop at seedling stage in 2008 short rains and at tasseling stage
during 2009 long rains in Machakos is clear evidence that Machakos is not an ideal maize
71

^w ing zone. To cope with the vagaries of climate change, farmers in the semi-arid regions
. ed to diversify crop production by growing drought tolerant crops species such as sorghum,
^llet an d cassava.
flie resu lts revealed that the bean component did not significantly affect maize grain yield
and y ie ld components in the intercrop system. Muraya et al. (2006) made similar obscrvations
indicating that maize performance in pure stands and in intercrop systems does not differ
markedly. Further, modeling studies of radiation interception and use in a mai/c bean
intercrop system, showed that growth efficiency of intercrop maize was equivalent tc
maize (Tsubo et a l, 2001; Tsubo and Walker, 2002). However, earlier contradictory
observations by Francis et al. (1982) and Fininsa (1997) indicated significant maize
reductions in maize-bean intercrop systems. Lack of significant effects of the bean c( n p
in th e intercrop system can be explained by the fact that the bean is less competitive. The
maize component derives its competitive ability from its more resource use efficient tour-
carbon dicarboxylic (C4) pathway than the bean s C3 pathway (Gitonga
Number of ears per plant did not vary significantly among the varieties in all seasons. In
Waruhiu maize yield components such as kernel-rows per cob, kernels per cob-row, 100
kernel weight and shelling % were significantly higher than in Mwea. This could be attributed
to sufficiently higher moisture levels in this site. Variety PHB 3253 had consistently the
highest number rows per cob, a trait which may explain why farmers have adopted it in the
semi-and regions. The composites and the dryland hybnds had the most efficient resource
allocation to the grain. Their efficiency in photosynthate partitioning is indicated by their high
harvest indices. However, harvest index of maize is known to vary considerably and seems to
depend on variety, crop management, growing season, and other factors (Hay and Gilbert,
72

$1). M oser et al. (2006) concluded that drought, especially pre-anthesis drought can
jrease the harvest index of tropical maize to 0.56.
Effect of maize variety, intercropping and site on bean grow th, yield and \ icld
components
3ean plant height was not significantly affected by the maize component. However, beans
were significantly taller in Waruhiu, probably due to high rainfall in this site. Sigmhcant
intercropping effects on bean nodulation were noted at 21 DAE with no significant effects at
>0% flowering. At 21 DAE KCB/bean and H614D/bean intercrop systems had significantly
le highest and least number of nodules per plant respectively. Bean nodule count per plant
were significantly higher in Waruhiu than in Mwea and Machakos. Bean nodulation
significantly the lowest in Machakos which had the least rainfall. These results
agreement with findings of many researchers who cited decreased bean nodulation in semi-
arid regions (Hometz el al., 2001; Shisanya, 2002 and Mnasri el al., 2007). A probable reason
to decreased bean nodulation in Machakos and Mwea could be due to water stress and/or high
temperatures in these sites in relation to Waruhiu. In addition, these two factors could have
constrained establishment o f rhizobia legume symbiosis. High bean nodulation in
intercrop system as opposed to depressed nodulation in H614D/bean intercrop system could
be due to decreased competition from the composite KCB. In H614D/bean intercrop system,
the beans could have faced increased competition for growth resources such as soil water
hence decreased nodulation. High bean nodulation in Waruhiu could have also been
influenced by potentially high populations of indigenous rhizobia. However, indigenous
rhizobia populations in soils of the various sites were not quantified.
Significant differences were noted in bean shoo, biomass a. 50% flowering with significantly
higher shoot biomass accumulation in Waruhiu than in Mwea and Machakos. Soil water and
73

ogen w ere higher in Waruhiu hence higher biomass accumulation. In their study, Mnasiri
./• (2007) also reported decreased bean shoot biomass accumulation under water limiting
editions. The maize varieties had mixed effects on bean shoot biomass accumulation. Bean
i.rcrop systems involving KCB, DHO 1 and Katumani had significantly higher bean shoot
inass accumulation but shoot biomass was significantly reduced by intercrop systems
\o lv ing H516 and most hybrids. Varieties KCB, DHO 1 and Katumani had a less dense
nopy than canopies of H516 and most of the hybrids, thus the differences in shoot biomass
of th e understory beans. It may be inferred that KCB, Katumani and DHO were less
competitive for growth resources, especially light and water.
digher bean yields were obtained in Waruhiu site (848.8 kg/ha) which had better growth
conditions in terms of high soil moisture and lower temperatures thus favouring beans
productivity. However, bean seed yields were significantly depressed by the maize component
with yield declines ranging from 33.8% to 69.9% in Mwea, 32.3% to 75.2% in Waruhiu and
16.8% to 77.9% in Machakos. The yield reduction was related to reduced number of pods per
plant and number o f seeds per pod in the intercrop systems. Similar findings were reported by
Tamado et al. (2007) and Gebeyehu et al. (2006) in Ethiopia. Working in Southeastern
Kenya, Maingi et al. (2001) and Shisanya (2003) noted that intercropping maize and beans
suppresses the yield of the later under semi-arid conditions. Santalla et al. (2001) reported
55% and 44% bean yield decline under field maize intercropping and sweet maize
intercropping, respectively. Muraya et al. (2006) obtained bean yield declines ot between
48.3% and 77.2% in maize-common bean intercropping. Working in Zimbabwe, Mutungamiri
er al. (2001) noted bean yield reductions of 11% to 18% in maize-bean intercrops. Such
significant reductions in bean yield from maize-bean intercropping have also been reported
before (Santalla et al., 2001; Niringiye et al., 2005; Tsubo et al., 2005).
74

Jier b e a n yield declines were noted in intercrop systems involving H513 and Pannar 77
iule th e least declines were obtained in Katumani and KCB intercrop systems. It can be
erred that, these maize varieties were more competitive than the beans. Varieties Katumani
KCB had less canopy thus the bean component received lesser competition for growth
sources. Hybrids H513 and Pannar 77 had dense canopy cover, thus more competitive than
e beans. Competition for light is considered one of the major factors contributing towards
. juction in yield and growth of plants in intercrops. Since bean yield tends to decrease with
crease in light transmission, it can be inferred that the yield of beans were reduced because
shading. Kinama et al., 2007, showed that indeed intercropping cowpea in semi-arid Kenya
.Juced cowpea yield from shading effects. Yield reduction of the beans in intercropping,
bough specifically not determined, could also have been due to interspesific competition
Zhang and Li, 2003) for resources such as nutrients and water. The finding of this study
suggest that, to maximize ecological productivity of maize-bean intercrops, varietal selection
based on growth characteristics is important. Muraya et al. (2006) noted that, in order to to
breed maize varieties suitable for common beans intercropping, maize variety growth
chacteristies, especially reduced canopy density would be paramount.
5.4 Ecological and economic productivity of intercropping
This study showed that intercropping is ecologically and economically superior to sole
cropping. Ecological productivity of maize-bean intercrops is indicated in this study by land
equivalent values which were greater than one, thus showing the advantage ot intercropping
over sole cropping. However, similar to studies by Tamado et al. (2007), no significant
differences in LERs were noted among the intercrop systems. The high LER values of 1.8 in
Mwea and 1.8 in Waruhiu and their corresponding means of 1.41 and 1.6 in Mwea and
^ aruhiu respectively are within LER values of up to 1.8 reported by Mbah et al. (2007) and
Tamado et al. (2007). Similar results of intercropping advantage were reported by Ogindo
75

003) in a semi-arid region, Yilmaz et al. (2007) in the East Mediterranean region, Mbah et
(2 0 0 7 ) in Southeastern Nigeria and Tsubo et al. (2003) in a semi-arid region ot South
drica. T h e se results are also supported by the findings of Rahman et al. (2009) in
justard/lentil intercrops. The yield advantages from such intercropping can be attributed to
• tter u tiliz a tio n of both above ground and below ground growth resources. Better utilization
of so lar radiation, soil water and nutrients leads to higher yields in intercrops ( Isubo et al.,
:o o 4 ).
76

CH A PTER SIX: CONCLUSIONS AND RECOMMENDATIONS
jd C onclusions
is study found that in a maize/bean intercrop system, the bean component does not
^nificantly affect maize grain yield and yield components. However, the maize component
gnificantly affects beans performance. The choice of a compatible maize variety is thus
-Sential maximize bean productivity. The nature of growing season, especially rainfall
;iher than the agro-ecological zone per se significantly affects the performance of the
. irrently grown varieties in the semi-arid regions. Maize plant height and plant stand count
did not vary among the varieties but significant differences in the two sites were noted during
he short rains. This is an indication that stand establishment of these varieties is entirely
dependent on growth conditions. Fluctuations in grain yield were noted in the varieties in the
different sites and seasons.
Performance of the currently grown varieties in the semi-arids depends on the amount of
rainfall received during the growing season. Composites Katumani and KCB, DHO 1 and
DHO 2 showed consistency in early maturity. These varieties can be adopted in the semi-arid
regions if they are planted early in the growing season to optimize use of available resources
especially soil moisture. Among the dryland hybrids (DHO series), variety DHO 4 may not be
recommended for the semi-arid regions due its significantly long maturity duration. Variety
H614D which is a late maturing variety may not be recommended for cultivation in semi-arid
regions. Though varieties Katumani and KCB can tolerate drought, their unpopularity among
the farmers may be attributed to their susceptibility to logding. This could be a reason why
farmers have gone to other varieties that do not lodge as much but are not bred for these
regions. Variety PHB 3253 may be adopted in these regions due to its high yield potential, a
trait shown by its significantly higher number of kernel-rows per cob. However, this variety
77

,3y be w idely grown incases where the growing season has been predicted to meet the
pti0ial grow th conditions for maize.
fo optim ize the ecological and economic benefits of maize/bean intercrop in terms of >ield.
flection o f compatible varieties of the component crops should be made using established
3gronomic management practices involving the two crops. Suitable maize varieties
maize/bean intercrop systems should have less dense canopies to ensure less shading cite
the understorey beans. Further, spatial arrangement of the component crops
essential to avoid significant negative effects especially to the less competitive cre p.
improve maize grain food security and enhance productivity of maize-bean intercrops in
semi-arid regions, varieties Katumani, KCB, DHO 1 and DHO 2 maybe adopted. Earliness of
t e e varieties is a key trait for drought tolerance. Additionally, their high harvest indices is an
indication o f their efficiency in translocating carbohydrates to the grain.
6.2 Recom m endations
Thus, as a result o f the findings of this study, it is recommended th
1. A similar study be conducted to test the compatibility of the same maize varieties with
various bean varieties.
2. A similar study be done to determine the effect of intercropping beans with local maize
varieties and newly released drought tolerant CIMMYT inbred lines.
3. Since the factors which led to bean yield reduction under intercropping could not be
should be performed to establish the interactve factors leading
food security in the semi-arid areas,
established, a similar study
to bean yield decline.
4. To cope with vagaries o f climate change and improve
f t ™ , sh.„,d diversify crop p r o d - - by ' * " » “ * “
sorghum, millet and cassava.
78

REFERENCES
\du G yam fi, J. J., Myaka, F. A., Sakala, W. D., Odgaard, R., Vesterager, J. M. and
H ogh-Jensen, J. 2007. Biological nitrogen fixation and nitrogen and phosphorus
budgets in farmer-managed intercrops of maizc-pigeonpea in semi-arid Southern and
Eastern Africa. Plant and Soil 295: 127-136.
^boola, A . A. and Fayemi, A. A. 1971. Preliminary trials on the intercropping of maize
w ith different tropical legumes in Western Nigeria. Journal of Agricultural Science 77:
2 1 9 -2 2 5 .
Agegnehu, G, Ghizam A. and Sinebo, W. 2006. Yield performance and land use efficiency
o f barley and faba bean mixed cropping in Ethiopian highlands. European Journal of
Agronomy 25: 249-456.
Agricultural Information Resource Centre (AIC), Kenya. 2002. Field Crops Technical
Handbook
Andrews, D. J. 1992. Intercropping with sorghum in Nigeria. Experimental Agriculture 8:
1 3 9 - 150.
Anil, L., Park, J., Phipps, R. H., and Miller, F. A. 1998. Temperate intercropping of cereals
for forage: a review o f the potential for growth and utilization with particular reference
to the UK. Grass Forage Science 53: 301-317.
Araus, J. L., Slafer, G. A., Royo, C. and Serret, M. D. 2008. Breeding for yield potential
and stress adaptation in cereals. Critical Reviews in Plant Science 2: 377- 412.
Aslam, M. 2007. Assessment of physio-genetic traits for drought tolerance in maize. PHD
thesis, University of Agriculture, Faisalabad, Pakistan.
Ashley, J. 1992. Drought and crop adaptation. In: Rowland, J. R. (Eds), Dryland farming in
Africa. Macmillan, London. 46 - 67.
79

11, S . N., Matthews, R. B., Williams, J. H and Peacock, J. M. 1990. Light use,
w a te r uptake and performance of individual components of a sorghum/groundnut
intercrop. Experimental Agriculture 26: 413-427.
jnik, P . K. Midya, A., Sarkar, B. K. and Chose, S. S. 2006. Wheat and chickpea
intercropping systems in an additive series experiment: advantages and weed
smoothing. European Journal of Agronomy 24: 325-332.
Banik, P., Sasmal T., Ghosal, P. K. and Bagchi, D. K. 2000. Evaluation of Mustard
(Brassica compestris var. toria) and legume intercropping under 1:1 and 2:1 row-
replacement series systems. Journal of Agronomy 185: 9-14
Banziger, M. and Diallo, A. O. 2001. Stress tolerant maize for fanners in sub-Saharan
Africa. In: CIMMYT Maize Research Highlights 1999-2000. CIMMYT, Mexico.
D .F., 1-8.
Banzinger, M., and Diallo A. O. 2004. Progress in developing drought and nitrogen stress
tolerant maize cultivars for Eastern and Southern Africa. In Friesen D.K. and Palmar
A.F.E. (eds). Intergrated approaches to higher maize productivity in the new
millenium. Proceedings of the 7th Eastern and Southern Africa regional maize
conference, 5 - 1 1 February, 2002: CIMMYT/KARI, Nairobi, kenya. 189- 193.
Banziger, M., Betran, F. J. and Lafitte, H. R. 1997. Efficiency of high-nitrogen selection
environments for improving maize for low-nitrogen target environments. Crop Science
37:1103-1109.
Beets, W. C. 1990. Raising and sustaining productivity of smallholder farming systems in the
tropics. Alkmaar, Holland: AgBe Publishing.
Bekunda, M. A., Bationo A. and Ssali, H. 1997. Soil fertility management in Africa: A
review of selected research trials. Sub-Saharan Africa special publication. Madison,
WI 51: 63 - 80.
8 0

P J . , Beck, D., Banziger, M. and Edmeades G. O. 2003. Secondary traits in
p a re n ta l inbreds and hybrids under stress and non-stress environments in tropical
m a iz e . Field Crops.Research 83: 51 - 65.
jiiii A . 1988. Genetic and environmental considerations in the improvement of drought
s t r e s s in sorghum. In food grains production in semi-arid Africa. Eds. Menyonga, J.
M . Bezuneh, T. and Youdeowei, A. OAU/STRCSAFGRAD publications 9 1 -9 9 .
3olanos, J . and Edmeades, G. O. 1993. 8 cycles of selection for drought tolerance in
lo w lan d tropical maize. 1: Responses in grain yield, biomass, and radiation utilization.
F ie ld Crops Research 31: 233-252.
Solanos, J . and Edmeades, G. O. 1993. Eight cycles of selection for drought tolerance in
low land tropical maize. Responses in reproductive behavior. Field Crops Research
31: 253-268.
Bolanos, J . , Edmeades, G. O. 1996. The importance of the anthesis-silking interval in
breeding for drought tolerance in tropical maize. Field Crops Research 48: 65-80.
Boutraa, T . and Sanders, F. E. 2001. Influence of water stress on grain yield and vegetative
growth of two cultivars of bean (Phaseolus vulgaries L.). Journal of Agronomy and
C rop Science 187: 251 -2 5 7 .
Boyer, J . S. 1982. Plant productivity and environment. Science. Science 218: 443 — 448.
Brooks, S., Thompson, J., Odanie, H., Kibaara, B., Nderitu, S., Karin, F. and Millstone,
K. 2009. Environmental change and maize innovation in Kenya: Exploring pathways
in and out of maize. STEPS, www.steps-centre.org.
Bruce, W.B., Edmeades, G. O. and Barker, T. C. 2001. Molecular and physiological
approaches to maize improvement for drought tolerance. Journal Experimental Botany
53:13-20.
C akir, R. 2004. Effect o f water stress at different development stages on vegetative and
reproductive growth o f com. Field Crops Research 89: 1-6.
81

Campos, H., Cooper, M., Edmeades, G. O., Loffer, C., Schussler, J. R. and Ibanez, M.
2006. Changes in drought tolerance in maize associated with fifty years of breeding
for yield in the US corn-belt. Maydica 51:369—381
Campos, H. Cooper, M., Habben, J. E., Edmeades, G. O. and Schussler, J. R. 2004.
Improving drought tolerance in maize: a view from industry. Field Crops Research
90:19-34.
Campos, H., Cooper, M., Habben, J. E., Edmeades, G. O. and Schussler, J. R. 2004.
Improving drought tolerance in maize: A view from industry. Field Crops Research
90:19-34.
Carlson, J. D. 2008. Intercropping with Maize in Sub-arid Regions. Community planning
and analysis technical brief. April, 16.
C hem eda, F. 1997. Effects of planting pattern, relative planting date and intra-row spacing on
a haricot bean/maize intercrop. African Crop Science Journal. 5. 1: 15-22 .
C hem in ing’wa, G. N.1992. Effects of increased intimacy between maize and beans in an
intercrop system on growth o f maize under varying nitrogen levels. MSc Thesis,
University of Nairobi.
C hem ining’wa, G. N. and Nyabundi, J. O. 1994. Effect of proximity between intercropped
maize and beans on growth and yield o f maize under varying nitrogen levels. East
African Agricultural and Forestry Journal 59: 269- 279.
Chowdhury, M. K. and Rosario, E. L. 1994. Comparison of nitrogen, phosphorus and
potassium utilization efficiency in maize/mungbean intercropping. Journal of
Agricultural Science 122: 193-199.
Costa, C., Dwyer, L. M., Stewart, D. \V. and Smith, D. L. 2002. Nitrogen effects on grain
yield and yield components of leafy and non-leafy maize genotypes. Crop Science
Journal 42: 1556-1563.
8 2

Cramer, G. R. and Quarrie, S. A. 2002. Abscisic acid is correlated with the leaf growth
inhibition o f four genotypes o f maize differing in their response to salinity. Functional
Plant Biology 29:111-115. .
Davis, J.H.C. and Garcia, S. 1983. Competitive ability and growth habit of indeterminate
beans and maize for intercropping. Field Crops Research 6:59-75.
Dawo, I. M., Wilkinsona J. M. and Pilbeam, J. D. 2008. Interactions between plants in
intercropped maize and common bean. Journal of Science, Food and Agriculture 89:
41-48.
De Groote, H. 2002. Maize yield losses from stem borer in Kenya. Insect Science and its
Application 22:89-96.
De Vries, J. and Toenniessen, G. 2001. Securing the harvest: Biotechnology, breeding and
seed systems for African crops. CABI publishing, New York, USA 99 - 108.
Dhima, K. V., Lithourgidis, A. A., Vasilokoglou I. B. and Dordas, C. A., 2007.
Competition indices of common vetch and cereal intercrops in two seeding ratio. Field
Crops Research 100: 249-256.
Diallo, A. O., Kikafundi, L., Wolde, O., Odongo, Z. O., M durum a, W. S., Chivasti, D. K.,
Friesen and Banzinger, M. 2004. Drought tolerant and low nitrogen tolerant hybrids
for the mid-altitude ecology of Eastern Africa. In Friesen D.K. and Palmar A.F.E.
(eds). Intergrated approaches to higher maize productivity in the new millenium.
Proceedings of the 7th Eastern and Southern Africa regional maize conference, 5 - 1 1
February, 2002: CIMMYT/KARI, Nairobi, kenya. 206-212 .
DuPlessis, I). P. and Dijkhuis, F. J. 1967. The influence of time lag between pollen
shedding and silking on the yield o f maize. South African Journal of Agricultural
Sciences 10: 667-674.
Earl, H. J. and Davis, R. F. 2003. Effect of drought stress on leaf and whole canopy
radiation use efficiency and yield of maize. Agronomy Journal 95: 688-696.
83

Economic Review of Agriculture. 2008. Ministry of Agriculture report, pg 17 - 20.
Edmeades, G. O., Bolanos, J., Chapman, S. C., Lafitte, H. R. and Banziger, M., 1999.
Selection improves drought tolerance in tropical maize populations. Direct and
correlated responses among secondary traits. Crop Science 39: 1315-1324.
Edmeades, G. O., Banziger, M., Campos, If. and Schussler, J. 2004. Improving tolerance
to abiotic stresses in staple crops: A random or planned process? In K. Lamkey and M.
Lee (ed.) Proceedings Amel R. Hallauer International Symposium on Plant Breeding,
Mexico City, Mexico. 17-22.
Edmeades, G. O., Bolanos, J., Elings, A., Ribaut, J. M., Banziger, M. and Westgate, M.
E., 2000. The role and regulation o f the anthesis-silking interval in maize. In:
Westgate, M. E., Boote, K. J. (Eds.), Physiology and Modeling Kernel Set in Maize.
CSSA, Madison, WI, CSSA Special Publication 29: 43-73.
Edm eades, G. O., Lafitte, H. R., Bolanos, J., Chapman, S. C., Banziger, M. and Deutsch,
J . A. 1994. Developing maize that tolerates drought or low nitrogen conditions. In:
Stress Tolerance Breeding: Maize that Resists Insects, Drought, Low Nitrogen, and
Acid Soils. Edmeades, G. O. and Deutsch J. A (Eds.). 21 - 84.
FAO. 2000. Global Agroecological zones (GAEZ). http://www. iisa.ac.at/Research/ LUC/
GAEZ/index.htm.
FAO. 2003. World wheat, corn , rice production, http://www.nuekstate.edu/.
FAO. 2008. Crop Prospects and Food Situation, http://www.fao.org
FAOSTAT. 2003. Statistical Database of the Food and Agriculture Organization of the
United Nations, http://www.fao.org
Farm er, G. and Wigley, T. M. L. 1985. Climatic trends for tropical Africa. Climatic
Research Unit, School of Environmental Sciences, University of East Anglia,
Norwich, UK.
84

eil? B., Thiraporn, R. and Lafitte, H. R., 1993. Accumulation of nitrogen and phosphorus
in the grain o f tropical maize cultivars. Maydica 38: 291-300.
pjninsa, C. 1997. Effects o f planting pattern, relative planting date and intrarow spacing on a
haricot bean/maize intercrop. African Crop Science Journal 5: 15-22.
F in k e l s te in , R. R. and Gibson, S. I., 2001. Absissic acid and sugar interactions regulating
development: Cross-talk or voices in a crowd. Plant Biology 5: 26-32.
Francis, C. A. 1987. Multiple cropping systems. Macmillan Publishing Company, New York.
Francis, C.A., Prager, M. and Tejada, G. 1982. Effects of relative planting dates in bean
(Phaseolus vulgaris L.) and maize (Zea mays L.) intercropping patterns. Field Crops
Research 5:45-54.
Gachimbi, L. N. 1996. A comparison of three methods of reducing soil erosion in Machakos
District, Kenya. East African Agricultural and Forestry Journal 61: 283 - 287.
Gachimbi, L. N., De Jager, A., Van Keulen, H., Thuranira, E. G. and Nandwa, S. M.
2002. Participatory diagnosis of soil nutrient depletion in semi-arid areas ot Kenya.
Managing Africa’s Soils. 26
Gardiner, T. R. and Craker, L. E. 1981. Bean growth and light interception in a bean/maize
intercrop. Field Crops Research 4:313-320.
Gebeyehu, S., Siniana B. and Kirkby R. 2006. Genotype x cropping system interaction in
climbing beans (Phaseolus vulgaries L.) grown as sole crop and in association with
maize (Zea mays L.) European Journal of Agronomy 24: 396 - 403.
Geleta, N., Daba, C. and Gebeyehu, S. 2004. Determination of plant proportion and planting
time in maize climbing bean intercropping system. In: Proceedings ot the 10th annual
conference of the crop science society of Ethiopia. 10: 176-182.
Gethi, J. G., Smith, M. E., Mitchell, S. E. and Kresovich, S. 2005. Genetic diversity of
Striga hermonthica and Striga asiatica populations in Kenya. Weed Research 45: 64-
73.
85

(,osh, P. K. 2004. Growth, yield, competition and economics of groundnut/cereal fodder
intercropping systems in the semi-arid tropics of India. Field Crops Research 88:227-
. 237
jitonga, N. M., Shisanya, C. A., Hornetz, B. and Maingi, J. M. 1999. Nitrogen fixation by
Vigna radiata L. in pure and mixed stands in SE-Kenya. Symbiosis 27: 239- 250.
Gomez, A. A., and Gomez, K. A. 1983. Multiple cropping in humid tropics of Asia. 1DRC.
Ottawa. IDRC-176e. 249. [Online]. Available: www.ottawa.co. Date accessed:
12/10/09
Gomez, K. A. and Gomez, A. A. 1984. Statistical procedures for agricultural research. Wiley-
Interscience publication. 1 - 657.
Grant, R. F., Jackson, B. S., Kiniry, J. R. and Arkin, G. F. 1989. Water deficit timing
effects on yield components in maize. Agronomy Journal 81: 61-65.
. Harris, D., Natarajan M. and Willey R. W. 1987. Physiological basis for yield advantage in
a sorghum/groundnut intercrop exposed to drought. Dry-matter production, yield and
light interception. Field Crops Research 37: 85 - 94.
Hart, R.D. 1994. The design and evaluation o f beans, com and manioc polyculture cropping
systems for the humid tropics. PhD dissertation, University of Florida, Gainesville
Florida, 175.
Hart, R. D and Pinchinat, A. M., 1982. Intergrative agricultural systems research. In
Caribbean seminar on Farming systems Research methodology. IICA. San Jose, Costa
Rica, 555-565.
Harwood, R. R. Jeranyania, P., Hesternian, O. B. and Waddington, S. R. 2000. Relay
intercropping o f sun hemp and cowpea to a smallholder maize system in Zambia.
Agronomy Journal 92: 109- 124.
86

Hassan, R. M. and Karanja, D. D. 1997. Increasing maize production in Kenya.
Technology, Institutions and Policy. In: Byerlee, D. and Eicher, C. K. Africa’s
emerging maize revolution. Boulder London. Lynne Reinner Publishers. 81 - 93.
Hassan, R. M. and Njoroge, K. 1996. Integrating farmers information with geographic
information systems for targeting of maize research in Kenya. African Crop Science
Journal 4:1-9.
Hassan, R. M., Nyango, R. and Rutto, J. K. 1998. Relevance of maize research in Kenya to
maize production problems perceived by farmers. In: Maize technology Development
and transfer: a GIS Application for research in Kenya. Hassan, R.M. (Ed.), pp.71-88.
CAB International, Wallingford, UK.
Hauggard-Nielson, H., Ambus, P. and Jensen, E. S. 2001. Evaluating pea and barley
cultivars for complementarity in intercropping at different levels of soil N availability.
Field Crops Research 72: 185-196.
Hay, R. K. M. and Gilbert, R. A. 2001. Variation in the harvest index of tropical maize:
evaluation of recent evidence from Mexico to Malawi. Annals of Applied Biology
138: 103-109.
Hall, A. J., Lenicoff, J. 11. and Trapani, N. 1981. Water stress before and during flowering
in maize and its effects on yield, its components, and their determinants. Maydica 26:
19-38.
Hall, A. J., Vilclla, F., Trapani, N. and Chimenti, C. 1982. The effects of water stress and
genotype on the dynamics of pollen-shedding and silking in maize. Field Crops
Research 5: 349-363.
Hassan R. M., Murithi, F. and Kamau, G. 1998. Determinants of fertilizer use and the gap
between farmers' maize yields and potential yields in Kenya. In: Hassan R. M.
(ed.).Maize technology development and transfer. A GIS application tor research
planning in Kenya. Oxon. UK: CAB International 137-162.
87

Helen ins, J. and Jokinen, K. 1994. Yield advantage and competition in intercropped oats
(Avena sativa L.) and faba bean (Vicia faba L.)\ application of the hyperbolic yield
density model. Field Crops Research 37: 85-94.
Hiebach, C. K. and McCollum, R. E. 1987. Area x time equivalency ratio. A method of
evaluating the productivity of intercrops. Agronomy Journal 79: 15-22.
Hildebrand, P.E. 1976. Multiple cropping systems are dollars and sense agronomy. In:
Multiple Cropping, Stelly, M. S., Krai, D. M., Elsele, L. C. and Nanseef J. H. (Eds.).
American Society o f Agronomy 27: 347 - 371.
Hornetz, B., Shisanya, C. A. and Gitonga, N. M. 2001. Crop water relationships and
thermal adaptation of ksthika beans (Phaseolus vulgaries L.) and green grams (Vigna
radiata L. Wilczek) with special reference to temporal patterns of potential growth in
the dryland ofSE-Kenya. Journal of Arid Environments 48: 591 -601 .
Ibeavvuchi, I. I. 2007. Intercropping - A Food Production Strategy for the Resource Poor
farmers. Nature and Science 5:1
IC IP E . 2002. ICIPE scientific report. International Centre of Insect Physiology and Ecology,
Nairobi, Kenya.
IF P R I. 2000. Annual report, http://www.ifpn.org.publication/2000.
C I M M Y T ( I n t e r n a t i o n a l M a i z e a n d W h e a t I m p r o v e m e n t C e n t r e ) . 2 0 0 9 . CIMMYT’s
ElectronicNewsletter.6:3.http7/www.Cimrnyt.org/english/wps/news/2009 /may/
maizeKenya.htm.
I R M A ( I n s e c t R e s i s t a n t M a i z e f o r A f r i c a ) 2 0 0 1 . IRMA Updates, December 2001, Vol.
2, Issue.4. www.cimmyt.org/ABC/Investln-InsectResist/htm/Investln-InsectResist.htm.
Jaetzold, R. and Schmidt, II. 1983. Farm management Handbook of Kenya. Vol. II/C, East
Kenya. Natural Conditions and Fann Management Information. Ministry ot
Agriculture and German Agricultural Team (GTZ).
88

Jag tap , S. S. and Abamu, F. J. 2003. Matching improved maize production technologies to
the resource base o f farmers in a moist savanna. Agricultural Systems 76: 1067-1084.
Jam es, C. 2003. Global review of commercialised transgenic crops: 2002 Feature: Bt Maize.
ISAAA Briefs No. 29: Ithaca, NY.
Jayne, T. S., Yamano, T., Nyoro, J. and Awour, T. 2001. Do farmers really benefit from
high food prices balance rural interests in Kenya’s maize pricing and marketing policy.
Working paper 2b, Tegemeo Institute, Nairobi, Kenya.
K ananipiu , F., Friesen, D. and Gressel, J. 2002. CIMMYT unveils herbicide-coated maize
seed technology for Striga control. Haustorium 42: 1-3.
K aterji, N., van Hoorn, J. W., llamdy, A. and Mastrorilli, M. 2004. Comparison of com
yield response to plant water stress caused by salinity and by drought. Agricultural
Water Management 65: 95-101.
K aterji, N., van Hoorn, J. W., llamdy, A. and Mastrorilli, M. 2003. Salinity effect on crop
development and yield, analysis of salt tolerance according to several classification
methods. Agricultural Water Management 62: 37-66.
Kay umbo, H. Y. 1976. Crop protection in mixed ecosystems. Paper presented at the
symposium of intercropping in semi-arid areas, Morogoro, Tanzania.
Keating, B. A. and C arberry, P. S. 1993. Resource capture and use in intercropping: solar
radiation. Field Crops Research 34: 273 - 301.
Kenya Agricultural Commodity Exchange. 2009. Commodity exchange portal in Kenya.
www.kacekcnva.com.
Kenya Agricultural Research Institute (2006). KAR1, Annual report. Acquiring and
contributing knowledge for innovative solutions. KARI, Nairobi, Kenya.
Kenya Food Security Update. 2009. http://www. Kenyafoodsecurity.org/monthly bulletins
/2009/feb.pdf.
Kenya National Bureau of Statistics. 2008. www.knbs.or.ke
89

Khan, Z. R., Midega, C. A. O., Amudavi, D. M., Njuguna, E. M., Wanyania, J. \V. and
Pickett, J. A. 2009. Integration of edible beans (Phaseolus vulgaries L.) into the
push-pull technology for stemborer and striga control in maize-based cropping
systems. Crop Protection 38: 997 - 1006.
Kilewe, A. M. and Mbuvi, J. P. 1987. Evaluation of soil erodibility factors using natural
runoff plots. East African Agricultural and Forestry Journal. 53:57-63.
Kinania, J. M. 1990. Actual versus potential soil degradation hazard assessment in a semi-
arid Kenya environment. Msc. Thesis, University of East Anglia (U.K).
Kinania, J. M., Stigter, C. J., Ong, C., Ng’ang’a, J. K. and Gichuki, F. N. 2007. Alley
cropping (contour hedgerow intercropping) maize or cowpea/senna for increased
drymatter production in the semi-arid areas of Eastern Kenya. Proceedings of African
Crop Science Society (ACSS) in Melkia - Egypt, November, 2007.
K in an ia , J. M. 1997. The effects of alley cropping on Microclimate, soil and water
conservation and competition on the sloping lands for sustainable land use in
Machakos District, Kenya. PhD. Thesis, University of Nairobi.
K ipkiyai, J. N. 1996. Dynamics of soil soil organic carbon, nitrogen and microbial biomass
in a long-term experiment as affected by inorganic ferlilizers. MSc. Thesis, University
of Nairobi, Department of soil science, Kenya.
Kfir, R. 1998. Maize and grain sorghum: Southern Africa. In: Polaszek, A. (Ed.). African
cereal stemborers: Economic importance, taxonomy, natural enemies and control.
CAB International, Wallington, Oxon, United Kingdom. 29-37.
Kfir, R., Overholt, W. A., Khan, Z. R. and Polaszek, A. 2002. Biology and management of
economically important lepidopteran cereal stemborers in Africa. Annual review of
Entomology 47: 701-731.
Koch, K. 1996. Carbohydrate-modulated gene expression in plants. Annual Review Plant
Physiology. Plant Molecular Biology 47: 509-540.
90

Kwabiah, A. B, Stoskopf, N. C., Palm, C. A., Voroney, R. P., Rao, M. R. and Gachcru, E.
2003. Phosphorus availability and maize response to organic and inorganic fertilizer
inputs in a short term study in Western Kenya. Agriculture Ecosystem and
Environment 95: 49-59.
Landi, P., Sanguineti, M. C., Conti, S. and Tuberosa, R. 2001. Direct and correlated
responses to divergent selection for leaf abscisic acid concentration in two maize
populations. Crop Science 41: 335-344.
L iu, F., Andersen, M. N. and Jensen, C. R. 2003. Loss of pod set caused by drought stress
is associated with water status and ABA content of reproductive structures in soybean.
Functional Plant Biology 30: 271-280.
L iu , F., Jensen, C. R. and Andersen, M. N. 2005. A review of drought adaptation in crop
plants: changes in vegetative and reproductive physiology induced by ABA-based
chemical signals. Australian Journal of Agricultural Research 56: 1245-1252.
L udlow , M.M. and Muchow, R.C., 1990. A critical evaluation of traits for improving crop
yields in water-limited environments. Advances in Agronomy 43: 107-153.
M ab esa R. 2008. Footsteps. Improving food security, Tearfund, UK: 1-5.
M afongoya, P. L., Bationo, E. A., Kihara, E. and Waswa, B.S. 2006. Appropriate
technologies to replenish soil fertility in southern Africa. Nutr Cycl Agroecosyst
76:137- 151.
Magorokosho, C., Pixley K. V. and Tongoona, P. 2003. Selection for drought tolerance in
two tropical maize populations. African Crop Science Journal 3: 151-161.
Maingi, J. M., Shisanya, C. A., Gitonga, N. M. and Hornet/, B. 2000. Nitrogen fixation by
common bean (Phaseolus vulgaris L.) in pure and mixed stands in semi-arid south
east Kenya. European Journal of Agronomy 14: 1-12.
91

Mansouri-Far, C., Sanavy, S. A. M. M. and Saberali, S. F. 2009. Maize yield response to
deficit irrigation during low-sensitive growth stages and nitrogen rate under semi-arid
climatic conditions. Agricultural Water Management 97: 12 - 22. .
M uthamia, J. G. N., Musembi, F., Maina, J. M., Okuro, J. O., Amboga, S., Muriithi, F.,
Micheni, A. N., Terry, J., Overfield, D., Kibata, G. and Muthura, J. 2001.
Participatory on-farm trials on weed control in smallholder farms in maize-based
cropping systems. Proceedings of Seventh Eastern and South Africa Regional Maize
Conference. 468-473.
M auyo, L. W., Maritim, II. K., Okalebo, J. R., Kimani, P. M., Kirkby, R. A. and Ugen,
M. A. 2003. Structure and conduct of cross-border bean marketing in East Africa: The
case of Western Kenya and Eastern Uganda. Presented at the African Crop Science
Conference, 12-17 October 2003, Nairobi, Kenya.
M b a h , E. U., Muoneke, C. O. and Okpara, I). A. 2007. Effect of compound fertilizer on the
yield and productivity of soybean and maize in soybean/maizze intercrop in
Southeastern Nigeria. Tropical and Subtropical Agroecosystems 7: 87 - 95.
M cC iilchrist, C. A. a n d T r e n b a t h , B . R. 1 9 7 1 . A revised analysis of plant competition
experiments. Biometrics 27: 659-671.
M ea d , R. and Willey, R. W. 1980. The concept of ‘land equivalent ratio' and advantages in
yield from intercropping. Experimental Agricuture 16: 217-228.
M in is try of Agriculture. 2009b. Economic review of Agriculture, www. kilimo.go.ke.
M in istry of Agriculture. 2009a. Food security report, www.kilimo.go.ke.
M nasri, B., Aouani, M. E. and Mhamdi, R. 2007. Nodulation and growth of common bean
(Phaseolus vulgaris L.) under water deficiency. Soil Biology and Biochemistry 39:
1744- 1750.
92

M orgado, L. B, Wiley, R. W. 2003. Effects o f plant population and nitrogen fertililizer on
yield and efficiency of maize/bean intercropping. Field Crops Research 38: 1257-
1264.
-Moser, S. B., Feil, B., Jampatong S. and Stamp, P. 2006. Effects of pre-anthesis drought,
nitrogen fertilizer rate, and variety on grain yield, yield components, and harvest index
o f tropical maize. Agricultural Water Management 81: 41-58.
M ugo, S. N. and Njoroge, K. 1997. Alleviating the effects of drought on maize production in
the moisture stress areas of Kenya through escape and tolerance. In: Developing
Drought and Low-N Tolerant Maize. Edmeades, G.O., Banziger, M., Mickelson, H.R.
and Pena-Valdivia C.B. (Eds.), 475-480. CIMMYT, El Batan, Mexico.
M ugo, S. N., De Groote, II., Songa, J., Mulaa M., Odhiambo, B., Taracha, C.,
Bergvinson, D., Hoisington, D. and Gethi, M. 2001. A dvances in developing insect
resistant maize varieties for Kenya within the insect resistant maize for Africa (IRMA)
project. Seventh Eastern and Southern Africa Maize Regional Conference. 31-37.
M u go S. N., Smith, M. E., Banziger, M., Setter, T. L., Edmeades, G. O. and Elings, A.
1998. Performance of early maturing katumani and kito maize composites under
drought at the seedling and flowering stages. African Crop Science Journal 6: 329-
344.
M ugo, S. N., Songa, J. M., De Groote, H. and Hoisington, I). 2002. Insect Resistant Maize
for Africa (IRMA) Project: An overview, Paper presented to the Syngenta
Symposium, Washington, DC, 25 June, 2002, the Syngenta staff in Greensboro, North
Carolina, 26 June, 2002, and to the Syngenta staff in Bassel, Switzerland, 27 June,
2002.
Mukiibi J. K. 1976. Possible relationships between intercropping and plant disease problems
in Uganda (abstract). In: Intercropping in Semi-Arid Areas (Ed. by J. H. Monyo, A. D.
R. Ker & M. Campbell), p. 45. IDRC. Ottawa, Ontario.
93

IVfuraya, M. M., Omolo, E. O. and Ndirangu, C. M. 2006. Development of high yielding
synthetic maize (Zea mays L.) varieties suitable for intercropping with common bean
(Phaseolus vulgaris L.). Asian Journal of Plant Sciences 5: 163 - 169.
M utungamiri, A., Mariga, I. K. and Chivinge, A. O. 2001. Evaluation of maize {Zea mays
L.) cultivars and density for dryland maize-bean intercropping. Tropical Agriculture
78: 8-12.
M uui, C. W., Muasya, R.M., Rao, N. and Anjichi V. E. 2007. Pollen longevity in
ecologically different zones of western Kenya. African Crop Science Journal 15: 43-
49.
M w ikya, J. 2009. Impacts of drought on maize crop in Kenya. Kenya Meteorological
Department. http://wamis.oru/agm/meetinKs/anadia 06/.
M y e rs , O. 1985. Breeding for drought tolerance in maize. In: To Feed Ourselves. A
Proceedings of the First Eastern, Central and Southern Africa Regional Maize
Workshop. Lusaka, Zambia. March, 10-17.
N a t a r a j a n , M . a n d S h u m b a , E . M . 1990. Intercropping research in Zimbabwe: Current
status and outlook for the future. In: Research Methods for Cereal/Legume
Intercropping. Proceedings of a Workshop on Research Methods for Cereal/Legume
Intercropping in Eastern and Southern Africa. Waddington, S.R., Palmer, A.F.E. and
Edje, O.T. (Eds.), pp. 190-193. CIMMYT, Harare, Zimbabwe.
N d e r i t u , C. G. 1999. Biotechnology in Africa. Why the controversy?. In: Persely, G. N. and
Lantin, M. M. (Eds.). Agricultural Biotechnology and the poor: Proceedings of an
international conference, Washington D.C., 21 -22, October 1999. Consultative Group
on International Agricultural Research, Washington, D. C. 109-114.
N e S m i t h D. S . a n d R i t c h i e J . T . 1992. Effects of soil water deficit during tassel emergence
on development and yield components of maize. Field Crops Research 28: 251-256.
94

Neves-Piestun, B. G. and Bernstein, N. 2005. Salinity-induced changes in the nutritional
status of expanding cells may impact leaf growth inhibition in maize. Functutional
Plant Biology 32: 141-152.
Niringiye, C. S., Kyamanywa, S. and Ssekabembe, C. S. 2006. Effect o f plant population
on yield of maize and climbing bean grown in an intercropping system. African Crop
Science Journal 24: 109- 121.
Njoroge, K. 1987. Earliness and yield in maize: An evaluation of some Katumani maize
varieties. East African Agricultural and Forestry Journal 48:40-50.
Njoroge, K. 1992. Improve and sustain maize production through adoption of known
techniques. Kenya Agricultural Research Institute, KARI.
N y a rik i, D. M. 2007. Kenya position paper on the Horn of Africa initiative on tackling food
insecurity: 2- 9.
N y o ro , J . K. 2003. Impact of market reform on seed development, multiplication and
distribution. Working paper, Tegemeo Institute, Egerton University.
O d h ian ib o , G. D. and Ariga, F>. S. 2001. Effect of intercropping maize and beans on striga
incidence and grain yield. Seventh Eastern and southern African regional maize
conference. February 1 1 - 15. 183-186.
O fo r i , F. and Stern, \V. R. 1987. Cereal-legume intercropping systems. Advanced
Agronomy 41:41 - 90.
O gindo , H. O. 2003. Comparing precipitation efficiency of maize bean intercropping with
sole cropping in semi-arid Ecotase. Ph.D. dissertation. University of the Free State,
Republic of South Africa.
Okigbo, B. N. 1979. Evaluation of plant interactions and productivity in complex mixtures as
a basis for improved cropping systems design. In: Willey, R. W. (Ed.). Proceedings ot
the International Workshop on Intercropping. International Crops Research Institute
for the Semi-Arid Tropics (1CR1SAT), Hyderabad, India, 10-13 Jan. 1979.
95

Oswald, A., Ransom, J. K., Kroschel, J. and Sauerborn, J. 2002. Intercropping controls
striga in maize based fanning systems. Crop Protection 5: 367 - 374.
O tegui, M. E., 1995. Prolificacy and grain yield components in modem Argentinean maize
hybrids. Crop Science 40: 371-376.
Pan-Africa Bean Research Alliance. 2007. http://www.webapp.ciat.org/Africa/pdf/pabra-
outlook07/.
Park, S. C., Benjamin, R. L. and Watkinson, A. R. 2000. Comparing biological
productivity in cropping systems: a competition appproach. Journal of Applied
Ecology 39: 416-426.
Pilbeam , C. J., Okalebo, J. R., Simnionds, P. and Gathua K. W. 1994. Analysis of maize-
common bean intercrops in semi-arid Kenya. Journal of Agricultural Science 123:
191-198.
P in gali, P. L. (Ed.). 2001. CIMMYT. 1999- 2000. World maize facts and trends. Meeting
world maize needs: Technological opportunities and priorities for the public sector.
Mexico DF.: CIMMYT. 1 - 57.
P o g g io , S. L. 2005. Structure of weed communities occurring in monoculture and
intercropping of field pea and barley. Agricultural Ecosystem and Environment 109:
48-58.
Q u re sh i, J. N. 1991. The cummulative effects o f of N-P fertilizers, manure and crop residues
on maize and bean yields and some soil chemical properties at Kabete. In: Recent
advances in KARI’s research programmes - proceedings of the 2nd Annual KARI
scientific conference. Kenya Agricultural Research Institute - KARI, Nairobi 160-167.
Rahman, M. M., Awal, M. A., Amin, A. and Parvej, M. R. 2009. Compatatibility, growth
and production potentials of mustard/lentil intercrops. International Journal of Botany
5: 100- 106.
96

RAo, M . R. and Mathuva, M. D. 2000. Legumes for improving maize yields and income in
semi-arid Kenya. Agriculture, Ecosystems and Environment 78: 123-137.
Rao, L .J . and Mittra, B. N. 1990. Evaluation o f groundnut (Arachis hypogea) genotypes for
intercropping with two types of pigeon pea (Cajanus cajan). Journal of Agricultural
Science 115:337-342.
R eddy, N. M. and Chetty, R. C. K. 1984. Staple land equivalent ratio for assessing yield
advantage from intercropping. Experimental Agriculture 20: 202-207.
R ezen d e , G. D. S. P. and Ramalho, M. A. P. 1994. Competitive ability of maize and
common bean (Phaseolus vulgaris L.) cultivars intercropped in different
environments. Journal of Agricultural Science 123:185-190.
R ib a u t , J. M., Jiang C., Gonzalez-de-leon D., Edmeades, G. O. and Hosington, D. 1997.
Identification of quantitative trait loci under drought conditions in tropical maize. 2.
Yield components and marker-assisted selection strategies. Crop Science 94:887-896.
R o s e n , S. and Scott, L. 1992. Famine grips sub-Saharan Africa. Agriculture Outlook.
191:20-24.
S a n ta l la , M., Rodino, A.P., Casquero, P.A. and de Ron, A.M. 2001. Interactions of bush
bean intercropped with field and sweet maize. European Journal of Agronomy 15: 185
- 196.
S ek am atte , B. M., Ogenga-Latigo, M. and Russcll-Sniith, A. 2003. Effects of maize-
legume intercrops on termite damage to maize, activityof predatory ants and maize
yields in Uganda. Crop Protection 22: 87-93.
Shaw , R. H., 1977. Water use and requirements of maize-a review. Agrometeorology of the
Maize (Corn) Crop. World Meteorologicaal Organization Publication 480: 119 - 134.
Shisanya, C. A. 2002. Improvement of drought adapted tepary bean (Phaseolus acutifo lius A.
G ray var. la tifo liu s) yield through biological nitrogen fixation in semi-arid SE-Kenya.
European Journal of Agronomy 16: 13-24.
97

S h isan y a , C. A. 2003. Yield and nitrogen fixation response by drought tolerant tepary bean
(Phaseolus acutifolius A. Gray Var. Latifolius) in sole and maize intercrop systems in
semi-arid Kenya. Pakistan Journal of Agronomy 2: 126 - 137.
S in o q u e t, H. and Cruz, P. 1995. Ecophysiology o f tropical intercropping. INRA., Paris.
S m alin g , E. M. A. 1998. Nutrient balances as indicators of productivity and sustainability in
Sub-African Agriculture. Agriculture Ecosystem and Environment 71:3-12
S on ga J. M., Jiang N., Schulthess F., Omwega C. 2007. The role of intercropping different
cereal species in controlling lepidopteran stemborers on maize in Kenya. Journal of
Applied Entomology 131:40-49
S o n g a J. M., Zhou, G. and Overholt, VV. A. 2001. Relationships of stem borer damage and
plant physical conditions to maize yield in a semi-arid zone of eastern Kenya. Insect
Science and its Application 21: 243 -249 .
S o n g a , J. M., Overholt, R. O., Okello and Mueke, J. M. 2002a. Regional distributon of
lepidopteran stem borers and their parasitoids among wild grasses in the semi arid
eastrem kenya. African Crop Science Journal 10: 183 - 194.
S toorvogel, J. J., Smaling, E. M. A. and Janssen, B. 11. 1993. Calculating soil nutrient
balances at different scale. I. Supra-national scale. Fertilization Research 35: 227- 235.
S w ift, M. J., Seward, P. D., Frost, P. G. II., Qureshi, J. N. and Muchena, F. N. 1994.
Long term experiments in Africa: developing a database for sustainable land use under
global change. In Leigh R. A., Johnson, A. E. (eds). Long term Experiments in
Agricultural and Ecological Sciences: 229-251.
Szuniigalski, A. R. and Van Acker, R. C. 2008. Land equivalent ratios, light interception,
and water use in annual intercrops in the presence or absence of in-crop herbicides.
Agronomy Journal 100: 1145- 1154.
98

Taniado, T., Fininsa, C. and Worku, VV. 2007. Agronomic performance and productivity of
common bean (Phaseolus vulgaries L.) varieties in double intercropping with maize
{Zea mays L.) in eastern Ethiopia. Asian Journal of Plant Sciences 6: 749 - 756.
T ardleu , F., Reymond, M., Hainan!, P., Granier, C. and Muller, B. 2000. Spatial
distributions of expansion rate, cell division rate and cell size in maize leaves: a
synthesis of the effects of soil water status, evaporative demand and temperature.
Journal of Experimental Botany 51:1505-1514.
Thiraporn, R., Feil, B. and Stamp, P. 1992. Effect of nitrogen fertilization on grain yield
and accumulation of nitrogen, phosphorus and potassium in the grains of tropical
maize. Journal of Agronomy 169: 9-16.
1 'ren b a th , B . R . 1974. Biomass productivity of mixtures. Advanced Agronomy 26: 177 -
210.
T re n b a th , B. R. 1999. Multispecies cropping systems in India— predictions o f their
productivity, stability, resilience and ecological sustainability. Agroforestry Systems
45: 81-107.
T s u b o , M ., M u k h a l a , E . , O g i n d o , II . O . a n d W a l k e r , S. 2 0 0 3 . Productivity of maize bean
intercropping in a semi-arid region of South Africa. Water South Afriaca 29: 381 -
388.
T s u b o , M ., O g i n d o , I I . O . a n d W a l k e r , S . 20 0 4 . Yield evaluation of maize-bean
intercropping in a semi-arid region of South Africa. African Crop Science Journal 12:
351-358.
T su b o , M. a n d W a l k e r , S. 2 0 0 2 . A model of radiation interception and use by a maize-bean
intercrop canopy. Agricultural and Forest Meteorology 110: 203-215.
T subo , M . a n d W a l k e r , S . 2 0 0 5 . Shade effects on Phaseolus vulgaris L. intercropped with
Zea mays L. under well-watered conditions. Journal of Agronomy 190: 168-176.
99

Tsubo, M ., Walker, S. and Mukhala, E. 2001. Comparisons of radiation use efficiency of
mono-inter-cropping systems with different row orientations. Field Crops Research
71: 17-29.
T subo, M ., Walker, S. and Ogindo, H. O. 2005. A simulation model of cereal-legume
intercropping systems for semi-arid regions. II. Model application. Field Crops
Research 93: 23-33.
U- S . C ensus Bureau. 2008. http://www. prb.org/presentations/
V anlauw e, B., Kanampiu, F., Odhiamho, G. D., De Groote, II., Wadhams, L. J. and
K han, Z. R. 2008. Integrated management of Striga hermonthica, stemborers, and
declining soil fertility in western Kenya. Field Crops Research 107:102-115.
W aiyaki, N., Mwakubo, S., Odhiambo, W., Nzuma, J., Murithi, F., Gamba, P.,
IMiihanimcd. L., Nyongesa, D., Nambiro, E., King’ori, B. and Obunde, P. 2006.
Determinants of seed maize pricing in Kenya. The Kenya Institute of Public Policy
Research and Analysis (KIPPRA). Discussion paper 61.
W a lk e r , S and Ogindo, II. O. 2003. The water budget of rain-fed maize and bean intercrop.
Physics and chemistry of the Earth 28: 919 - 926.
W eig c lt, A. and Jolliffe, P. 2003. Indices of plant competition. Journal of Ecology 91: 707 -
720.
W ek e sa , E., Mwangi, W., Verkuijl, H., Danda, K. and De Groote, II. 2003. Adoption of
maize production technologies in the coastal lowlands of Kenya. Mexico, D.F.:
CIMMYT.
W e s t g a t e , M. E and Bassetti, P. 1990. Heat and drought stress in com: what really
happens\to the com plant at pollination? In: Wilkinson, D. (Ed.). Proceedings of the
45th annual com and sorghum research conference, Chicago, 5-6 December, 1990.
AS I A. Wishington DC. 12-28.
100

W estgate, M. E., Boyer, J. S.1986. Water status o f the developing grain o f maize. Agronomy
Journal 78: 714-719.
W h itm o re , A. A. and Schroder, J. J. 2007. Intercropping reduces nitrate leaching from
under field crops without loss of yield: A modelling study. European Journal of
Agronomy 27:81-88.
W illey, R. W. 1979. Intercropping-its importance and research needs. Part 1. Competition
and yield advantages. Field Crops Abstracts 32: 1-10.
W illey , R. W. and Osiru, D. S. O. 1972. Studies on mixtures of maize and beans (Phaseolus
vulgaris) with particular reference to plant population. Journal of Agricultural Science
79:5 17-529
W illey , R. W. and Rao, M. R. 1980. A competitive ratio for quantifying competition
between intercrops. Experimental Agriculture 16: 117-125.
W ille y , R. W. and Rao, M. R. 1981. A systematic design to examine effects of plant
population and spatial arrangement in intercropping, illustrated by an experiment on
chickpea/safflower. Experimental Agriculture 17: 63-73
Y ilrnaz, S., Atak, M. and Erayman, M. 2007. Identification of advantages of maize-legume
intercropping over solitary cropping through competition indices in the East
Mediterranean region. Turkey Journal of Agriculture 32: 111-119.
Z aid i, P. H., Srinivasan G., Cordova, Il.S. and Sanchez, C. 2004. Gains from improvement
for mid season drought tolerance in tropical maize (Zea mays L.) Field Crops Research
89:135-152.
Zhang, F. S. and Li, L. 2003. Using competitive and facilitative interactions in intercropping
systems enhances crop productivity and nutrient-use efficiency. Plant and soil 248:
305 -312
Zhang, J., Schurr, U. and Davies, W. J. 1987. Control of stomatal behaviour by abscisic acid
which apparently originates in the roots. Journal of Experimental Botany 38: 1174-1181.
101

APPENDICES
appendix 1: Soil characteristics o f Mwea, Waruhiu and Machakos experimental sites in2008 short rains and 2009 long rains ____________________
Mwea Waruhiu Machakos
^Chemical Property 2008 SR 2009 LR 2008 SR 2009 LR 2009 LR
Soil pH 6.03 5.78 5.41 5.45 6.24
Total Nitrogen (%) 0.14 0.14 0.26 0.24 0.08
Organic Carbon (%) 2.26 2.05 2.68 2.77 0.99
Phosphorus (ppm) 175.00 173.00 5.00 2.00 49.00
Potassium (me %) 1.92 1.34 0.36 0.12 0.86
Calcium (me %) 6.00 4.60 2.00 1.40 3.80
Magnesium (me %) 4.69 4.93 1.69 1.61 1.59
Manganese (me %) 0.46 0.50 0.48 0.62 0.57
Copper (ppm) 3.60 3.40 1.70 1.50 3.60
Iron (ppm) 95.10 104.00 .. 27.70 27.50 24.90
Zinc (ppm) 8.90 3.70 11.60 11.50 4.10
Sodium (ppm) 0.14 0.14 0.12 0.10 0.20
SR: short rain; LR: long rain; ppm: parts per million; me: milli equivalent
Appendix 2: Rainfall and temperature data at the Kenya Agricultural Research Institute- Mwea, Waruhiu Agricultural Training Centre and Machakos Agricultural Training C cntre for2008 short rains and 2009 long rains
Mwea
MonthRainfall
(mm) MDT (°C)October 210.5 23.6November 70.3 23.2December 0.0 22.3January 98.0 22.3February 0.0 21.0March 96.7 22.5April 205.1 24.2May 87.9 23.0June 0.0 22.0July 0.0 21.1August 0.0 22.0Mean 69.9 22.5
WaruhiuRainfall(mm)____ MPT (°C)230.4 19.2197.4 18.80.0 18.4
45.3 18.841.8 19.187.2 19.4182.4 19.3144.6 18.738.4 17.711.0 17.06.4 18.289.5 18.6
_____ MachakosRainfall
(mm) MPT (°C)25.0 25.417.0 25.110.0 25.20.0 24.50.0 25.378.7 26.7183.5 25.635.0 24.70.0 22.90.0 21.10.0 22.031.7 24.4
MDT: Mean Daily Temperature
102

Vppendix 3 a: Analysis o f variance (ANOVA) table for plant height at 57 DAE for sixteenjnaize varieties intercropped with beans in Mwea and Waruhiu during 2008 short rains
Source of variation d.f. s.s. m.s. v.r. Fpr.
block stratum 2 8957.0 4478.5 7.06
variety 15 13016.6 867.8 1.37 0.226
Residual 30 19035.2 634.5 9.19
CS 1 454.7 454.7 6.59 0.015
variety.CS 15 275.2 18.3 0.27 0.996
Residual 32 2208.3 69.0 0.30
site 1 515063.3 515063.3 2238.21 <.001
variety.site 15 6769.9 451.3 1.96 0.033
CS.site 1 452.5 452.5 1.97 0.166
variety.CS.site 15 286.1 19.1 0.08 1.000
Residual 64 14727.9 230.1
Total 191 581246.7
Appendix 3 b: Analysis of variance (ANOVA) table for plant height at 57 DAE for sixteen maize varieties intercropped with beans in Mwea, Waruhiu and Mwea during 2009 long rains
Source o f variation d.f. s.s. m.s. v.r. F pr.
block stratum 2 2236.4 1118.2 1.78
variety 15 20478.8 1365.3 2.17 0.035
Residual 30 18871.0 629.0 4.01
CS 1 379.6 379.6 2.42 0.130
variety.CS 15 3375.1 225.0 1.43 0.191
Residual 32 5023.4 157.0 0.21
site 2 682661.5 341330.8 449.81 <.001
variety.site 30 42429.2 1414.3 1.86 0.009
CS.site 2 52.0 26.0 0.03 0.966
variety.CS.site 30 3425.1 114.2 0.15 1.000
Residual 128 97130.3 758.8
Total 287 876062.5
103

appendix 4 a: Analysis o f variance (ANOVA) table for plant stand count at 57 DAE forixteen maize varieties intercropped with beans in Mwea and Waruhiu during 2008 short rains
Source of variation d.f. s.s. m.s. v.r. F pr.
block stratum 2 620.78 310.39 3.19
variety 15 1683.62 112.24 1.15 0.356
Residual 30 2918.22 97.27 212.20
c s 1 1.14 1.14 2.49 0.124
variety.CS 15 2.80 0.19 0.41 0.966
Residual 32 14.67 0.46 0.01
site 1 44242.87 44242.87 932.08 <.001
variety.site 15 954.15 63.61 1.34 0.206
CS.site 1 2.71 2.71 0.06 0.812
variety.CS.site 15 3.73 0.25 0.01 1.000
Residual 64 3037.88 47.47
Total 191 ~ 53482.55
Appendix 4 b: Analysis of variance (ANOVA) table for plant stand count at 57 DAE for sixteen maize varieties intercropped with beans in Mwea, Waruhiu and Machakos during2008 short rains
Source o f variation d.f. s.s. m.s. v.r. F pr.block stratum 2 624.81 312.41 4.38variety 15 1957.39 130.49 1.83 0.078Residual 30 2141.97 71.40 2.11CS 1 100.35 100.35 2.97 0.094
variety.CS 15 388.88 25.93 0.77 0.701
Residual 32 1080.78 33.77 1.53site 2 928.77 464.39 21.06 <.001
variety.site 30 860.67 28.69 1.30 0.159
CS.site 2 116.26 58.13 2.64 0.076variety. CS.site 30 666.52 22.22 1.01 0.466
Residual 128 2823.11 22.06Total 287 11689.50
104

appendix 5 a: Analysis of variance (ANOVA) table for lodging % of sixteen maize varietiesintercropped with beans in Mwea and Waruhiu during 2008 rains rains_________________
Source of variation d.f. s.s. m.s. v.r. F pr.block stratum 2 530.63 265.31 6.79variety 15 752.02 50.13 1.28 0.271Residual 30 1171.90 39.06 348.69c s 1 0.08 0.08 0.76 0.390variety.CS 15 0.27 0.02 0.16 1.000Residual 32 3.58 0.11 0.01site 1 354.50 354.50 22.88 <.001variety.site 15 301.07 20.07 1.30 0.231CS.site 1 0.00 0.00 0.00 0.990variety.CS.site 15 0.18 0.01 0.00 1.000Residual 64 991.49 15.49Total 191 4105.73
Appendix 5 b: Analysis of variance (ANOVA) table for lodging % of sixteen maize varietiesintercropped with beans in Mwea and Waruhiu during 2009 long rains
Source o f variation d.f. s.s. m.s. v.r. F pr.block stratum 2 5.946 2.973 1.11variety 15 2314.956 154.330 57.38 <.001Residual 30 80.691 2.690 4.13CS 1 1.259 1.259 1.94 0.174
variety.CS 15 38.206 2.547 3.92 <.001
Residual 32 20.818 0.651 0.37site 1 10.766 10.766 6.08 0.016
variety.site 15 397.578 26.505 14.96 <.001
CS.site 1 0.696 0.696 0.39 0.533
variety.CS.site 15 36.514 2.434 1.37 0.188
Residual 64 113.379 1.772Total 191 3020.809
105

Appendix 6 a i Analysis o f variance (ANOVA) table for shoot biomass (t/ha) sixteen maizevarieties intercropped with beans in Mwea and Waruhiu during 2008 short rains__________
Source of variation d.f. s.s. m.s. v.r. F pr.
block stratum 2 4.448 2.224 0.04
variety 15 4897.266 326.484 5.81 <.001
Residual 30 1686.812 56.227 239.30
CS 1 0.017 0.017 0.07 0.791
variety.CS 15 3.205 0.214 0.91 0.562
Residual 32 7.519 0.235 0.06
site 1 2945.560 2945.560 709.49 <.001
variety.site 15 432.115 28.808 6.94 <.001
CS.site 1 0.002 0.002 0.00 0.984
variety.CS.site 15 2.959 0.197 0.05 1.000
Residual 64 * 265.705 4.152
Total 191 10245.607
Appendix 6 b: Analysis of variance (ANOVA) table for shoot biomass (t/ha) for sixteen maize varieties intercropped with beans in Mwea, Waruhiu and Machakos during 2009 longrains
Source o f variation d.f. s.s. m.s. v.r. F pr.
block stratum 2 68.23 34.12 1.93
variety 15 9274.14 618.28 34.92 <.001
Residual 30 531.16 17.71 3.97
CS 1 4.27 4.27 0.96 0.336
variety.CS 15 52.45 3.50 0.78 0.686
Residual 32 142.84 4.46 0.16
site 2 20287.81 10143.91 357.63 <.001
variety.site 30 7592.85 253.09 8.92 <.001
CS.site 2 8.22 4.11 0.14 0.865
variety.CS.site 30 194.32 6.48 0.23 1.000
Residual 128 3630.65 28.36
Total 287 41786.95
1 0 6

appendix 7 a: Analysis o f variance (ANOVA) table for days to 50% anthesis o f sixteenmaize varieties intercropped with beans in Mwea and Waruhiu during 2008 short rains
Source of variation d.f. s.s. m.s. v.r. F pr.
block stratum 2 61.89 30.94 0.38
variety 15 5284.66 352.31 4.35 <.001
Residual 30 2431.95 81.06 15564.47
CS 1 0.01 0.01 1.00 0.325
variety.CS 15 0.08 0.01 1.00 0.479
Residual 32 0.17 0.01 0.00
site 1 6733.17 6733.17 553.89 <.001
variety.site 15 637.24 42.48 3.49 <.001
CS.site 1 0.01 0.01 0.00 0.984
variety.CS.site 15 0.08 0.01 0.00 1.000
Residual 64 778.00 12.16
Total 191 15927.24
Appendix 7 b: Analysis of variance (ANOVA) table for days to 50% anthesis of sixteen maize varieties intercropped with beans in Mwea and Waruhiu during 2009 long rains rains
Source o f variation d.f. s.s. m.s. v.r. F pr.
block stratum 2 4.2917 2.1458 1.21
variety 15 11916.6458 794.4431 449.33 <.001
Residual 30 53.0417 1.7681
CS 1 0.0000 0.0000
variety.CS 15 0.0000 0.0000
Residual 32 0.0000 0.0000 0.00
site 1 15444.1875 15444.1875 19008.23 <.001
variety.site 15 382.8125 25.5208 31.41 <.001
CS.site 1 0.0000 0.0000 0.00 1.000
variety.CS.site 15 0.0000 0.0000 0.00 1.000
Residual 64 52.0000 0.8125
Total 191 27852.9792
107

Appendix 8 a: Analysis o f variance (ANOVA) table for days to 50% silking o f sixteen maizevarieties intercropped with beans in Mwea and Waruhiu during 2008 short rains________
Source of variation d.f. s.s. m.s. v.r. F pr.block stratum 2 86.16 43.08 0.53variety 15 5816.20 387.75 4.80 <.001Residual 30 2422.34 80.74 1722.56c s 1 0.05 0.05 1.00 0.325variety.CS 15 0.70 0.05 1.00 0.479Residual 32 1.50 0.05 0.00site 1 7815.76 7815.76 659.33 <.001variety, site 15 846.33 56.42 4.76 <.001CS.site 1 0.05 0.05 0.00 0.950variety.CS. site 15 0.70 0.05 0.00 1.000Residual 64 758.67 11.85Total 191 17748.45
Appendix 8 b: Analysis of variance (ANOVA) table for days to 50% silking of sixteen maizevarieties intercropped with beans in Mwea and Waruhiu during 2009 long rains
Source of variation d.f. s.s. m.s. v.r. F pr.block stratum 2 4.2917 2.1458 1.13variety 15 12347.3333 823.1556 432.92 <.001Residual 30 57.0417 1.9014CS 1 0.0000 0.0000variety.CS 15 0.0000 0.0000Residual 32 0.0000 0.0000 0.00site 1 14283.0000 14283.0000 15943.81 <.001variety.site 15 349.6667 23.3111 26.02 <.001CS.site 1 0.0000 0.0000 0.00 1.000variety.CS.site 15 0.0000 0.0000 0.00 1.000Residual 64 57.3333 0.8958Total 191 27098.6667
Appendix 9 a: Analysis of variance (ANOVA) table for days to 50% physiological maturity of sixteen maize varieties intercropped with beans in Mwea anti Waruhiu during 2008 short rains _____ ___________________________________________
Source of variation d.f. s.s. m.s. v.r. F pr.block stratum 2 19.91 9.95 0.27variety 15 15628.16 1041.88 28.64 <.001Residual 30 1091.26 36.38 6984.07CS 1 0.01 0.01 1.00 0.325variety.CS 15 0.08 0.01 1.00 0.479Residual 32 0.17 0.01 0.00site 1 5281.51 5281.51 312.79 <.001variety.site 15 700.24 46.68 2.76 0.002CS.site 1 0.01 0.01 0.00 0.986variety.CS.site 15 0.08 0.01 0.00 1.000Residual 64 1080.67 16.89Total 191 23802.08
108

appendix 9 b: Analysis ofvariance (ANOVA) table for days to 50% physiological maturityof sixteen maize varieties intercropped with beans in Mwea and Waruhiu during 2009 longIan * '* . -
Source of variation d.f. s.s. m.s. v.r. F pr.block stratum 2 2.3750 1.1875 0.63variety 15 22512.6458 1500.8431 799.86 <.001Residual 30 56.2917 1.8764CS 1 0.0000 0.0000variety.CS 15 0.0000 0.0000Residual 32 0.0000 0.0000 0.00site 1 8883.5208 8883.5208 10933.56 <.001variety.site 15 1365.4792 91.0319 112.04 <.001CS.site 1 0.0000 0.0000 0.00 1.000variety.CS.site 15 0.0000 0.0000 0.00 1.000Residual 64 52.0000 0.8125Total 191 32872.3125
Appendix 10 a: Analysis of variance (ANOVA) table for grain yield (t/ha) of sixteen maizevarieties intercropped with beans in Mwea and Waruhiu during 2008 short rains
Source of variation d.f. s.s. m.s. v.r. F pr.block stratum 2 0.50624 0.25312 0.55variety 15 6.63081 0.44205 0.97 0.511Residual 30 13.74064 0.45802 1697.73CS 1 0.00000 0.00000 0.01 0.914variety.CS 15 0.00302 0.00020 0.75 0.722Residual 32 0.00863 0.00027 0.00site 1 11.33411 11.33411 176.23 <.001
variety.site 15 4.41052 0.29403 4.57 <.001CS.site 1 0.00007 0.00007 0.00 0.974
variety.CS.site 15 0.00397 0.00026 0.00 1.000
Residual 64 4.11603 0.06431Total 191 40.75404
Appendix 10 b: Analysis of variance (ANOVA) table for grain yield (t/ha) of sixteen maizevarieties intercronoed with beans in Mwea and Waruhiu during *.0 )l long rains
Source o f variation d.f. s.s. m.s. v.r. F pr.
block stratum 2 0.9900 0.4950 1.36
variety 15 21.8838 1.4589 4.02 <.001
Residual 30 10.8965 0.3632 2.29
CS 1 0.0000 0.0000 0.00 1.000
variety.CS 15 1.9019 0.1268 0.80 0.670
Residual 32 5.0779 0.1587 0.42site 1 0.5901 0.5901 1.58 0.213variety.site 15 12.4924 0.8328 2.23 0.014
CS.site 1 0.0391 0.0391 0.10 0.747variety.CS.site 15 1.6265 0.1084 0.29 0.995
Residual 64 23.9147 0.3737Total 191 79.4129
109
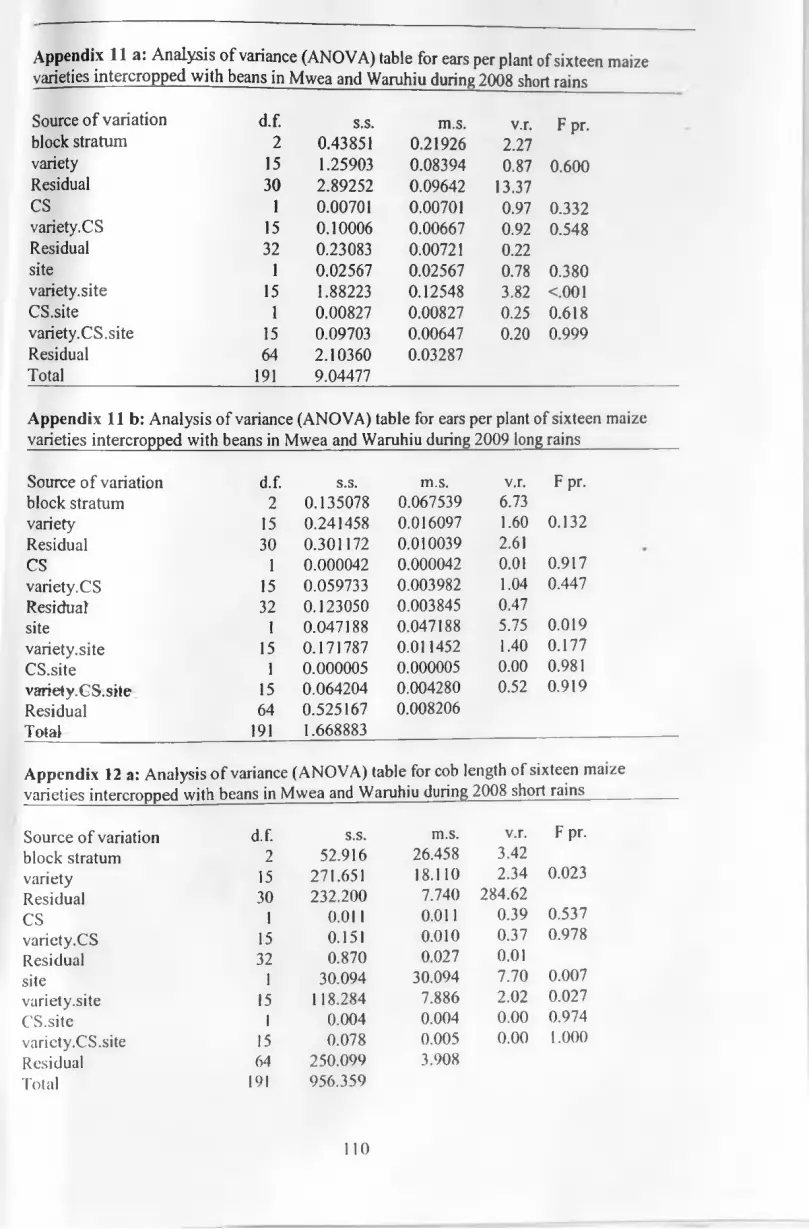
Appendix 11 a: Analysis o f variance (ANOVA) table for ears per plant of sixteen maizevarieties intercropped with beans in Mwea and Waruhiu during 2008 short rains_______
Source of variation d.f. s.s. m.s. v.r. F pr.block stratum 2 0.43851 0.21926 2.27variety 15 1.25903 0.08394 0.87 0.600Residual 30 2.89252 0.09642 13.37CS 1 0.00701 0.00701 0.97 0.332variety.CS 15 0.10006 0.00667 0.92 0.548Residual 32 0.23083 0.00721 0.22site 1 0.02567 0.02567 0.78 0.380variety.site 15 1.88223 0.12548 3.82 <.001CS.site 1 0.00827 0.00827 0.25 0.618variety.CS.site 15 0.09703 0.00647 0.20 0.999Residual 64 2.10360 0.03287Total 191 9.04477
Appendix l i b : Analysis of variance (ANOVA) table for ears per plant of sixteen maizevarieties intercropped with beans in Mwea and Waruhiu during 2009 long rains
Source of variation d.f. s.s. m.s. v.r. F pr.block stratum 2 0.135078 0.067539 6.73variety 15 0.241458 0.016097 1.60 0.132Residual 30 0.301172 0.010039 2.61CS 1 0.000042 0.000042 0.01 0.917variety.CS 15 0.059733 0.003982 1.04 0.447Residua! 32 0.123050 0.003845 0.47site 1 0.047188 0.047188 5.75 0.019variety.site 15 0.171787 0.011452 1.40 0.177CS.site 1 0.000005 0.000005 0.00 0.981variety.CS.site 15 0.064204 0.004280 0.52 0.919Residual 64 0.525167 0.008206Total 191 1.668883
Appendix 12 a: Analysis o f variance (ANOVA) table for cob length of sixteen maize varieties intercropped with beans in Mwea and Waruhiu during 2008 short rains_____
Source of variation d.f. s.s. m.s. v.r. F pr.block stratum 2 52.916 26.458 3.42variety 15 271.651 18.110 2.34 0.023Residual 30 232.200 7.740 284.62CS 1 0.011 0.011 0.39 0.537variety.CS 15 0.151 0.010 0.37 0.978Residual 32 0.870 0.027 0.01site 1 30.094 30.094 7.70 0.007variety.site 15 118.284 7.886 2.02 0.027CS.site 1 0.004 0.004 0.00 0.974variety.CS.site 15 0.078 0.005 0.00 1.000Residual 64 250.099 3.908Total 191 956.359
110

Appendix 12 b: Analysis o f variance (ANOVA) table for cob length o f sixteen maizevarieties intercropped withbeans in Mwea and Waruhiu during 2009 long rains____________
Source of variation d.f. s.s. m.s. v.r. - F pr.block stratum 2 0.408 0.204 0.08variety 15 284.994 19.000 7.00 <.001Residual 30 81.452 2.715 1.44CS 1 2.741 2.741 1.45 0.238variety.CS 15 23.129 1.542 0.82 0.654Residual 32 60.533 1.892 0.66site 1 65.824 65.824 23.06 <.001variety.site 15 86.100 5.740 2.01 0.028CS.site 1 3.101 3.101 1.09 0.301variety.CS.site 15 11.412 0.761 0.27 0.997Residual 64 182.707 2.855Total 191 802.401
Appendix 13 a: Analysis o f variance (ANOVA) table for kernel rows per cob of sixteenmaize varieties intercropped with beans in Mwea and Waruhiu during 2008 short rains
Source of variation d.f. s.s. m.s. v.r. F pr.block stratum 2 9.2317 4.6159 1.50variety 15 33.5964 2.2398 0.73 0.737Residual 30 92.1168 3.0706 99.. 11CS 1 0.0006 0.0006 0.02 0.886variety.CS 15 0.3160 0.0211 0.68 0.784Residual 32 0.9914 0.0310 0.08site 1 78.2530 78.2530 197.83 <.001variety.site 15 19.1766 1.2784 3.23 <.001CS.site 1 0.0296 0.0296 0.07 0.785variety.CS.site 15 0.2143 0.0143 0.04 1.000Residual 64 25.3153 0.3956Total 191 259.2419
Appendix 13 b: Analysis of variance (ANOVA) table for kernel rows per cob of sixteenmaize varieties intercropped with beans in Mwea and Waruhiu during 2009 long rains
Source of variation d.f. s.s. m.s. v.r. F pr.block stratum 2 0.3888 0.1944 0.28variety 15 107.5355 7.1690 10.51 <.001Residual 30 20.4675 0.6823 2.93CS 1 0.3024 0.3024 1.30 0.263variety.CS 15 3.5821 0.2388 1.03 0.456Residual 32 7.4511 0.2328 0.59site 1 7.9300 7.9300 20.02 <.001variety.site 15 11.5521 0.7701 1.94 0.035CS.site 1 0.0032 0.0032 0.01 0.929variety.CS.site 15 3.7143 0.2476 0.62 0.844Residual 64 25.3563 0.3962Total 191 188.2833

Appendix 14 a: Analysis o f variance (ANOVA) table for 100 kernel weight o f sixteen maizevarieties intercropped with beans in Mwea and Waruhiu during 2008 short rains___________
Source of variation d.f. s.s. m.s. - v.r. F pr.block stratum 2 6.912 3.456 0.44variety 15 191.721 12.781 1.62 0.128Residual 30 237.078 7.903 94.90CS 1 0.010 0.010 0.12 0.727variety.CS 15 0.470 0.031 0.38 0.976Residual 32 2.665 0.083 0.04site 1 477.654 477.654 240.10 <.001variety.site 15 215.437 14.362 7.22 <.001CS.site 1 0.033 0.033 0.02 0.898variety.CS.site 15 0.243 0.016 0.01 1.000Residual 64 127.322 1.989Total 191 1259.544
Appendix 14 b: Analysis of variance (ANOVA) table for 100 kernel weight of sixteen maizevarieties intercropped with beans in Mwea and Waruhiu during 2009 long rains
Source of variation d.f. s.s. m.s. v.r. F pr.block stratum 2 12.876 6.438 0.96variety 15 333.896 22.260 3.33 0.002Residual 30 200.334 6.678 1.49CS 1 0.070 0.070 0.02 0.902variety.CS 15 71.613 4.774 1.06 0.425Residual 32 143.814 4.494 0.48site 1 88.477 88.477 9.49 0.003variety.site 15 165.379 11.025 1.18 0.308CS.site 1 7.112 7.112 0.76 0.386variety.CS.site 15 28.883 1.926 0.21 0.999Residual 64 596.430 9.319Total 191 1648.884
Appendix 15 a: Analysis of variance (ANOVA) table for shelling % of sixteen maize varieties intercropped with beans in Mwea and Waruhiu during 2008 short rains
Source of variation d.f. s.s. m.s. v.r. F pr.block stratum 2 193.265 96.633 5.19variety 15 831.743 55.450 2.98 0.005Residual 30 558.809 18.627 17.36CS 1 0.001 0.001 0.00 0.972variety.CS 15 10.732 0.715 0.67 0.796Residual 32 34.342 1.073 0.13site 1 983.141 983.141 117.24 <.001variety.site 15 887.802 59.187 7.06 <.001CS.site 1 0.004 0.004 0.00 0.983variety.CS.site 15 10.482 0.699 0.08 1.000Residual 64 536.690 8.386Total 191 4047.011
112

Appendix 15 b: Analysis o f variance (ANOVA) table for shelling % o f sixteen maizevarieties intercropped with beans in Mwea and Waruhiu during 2009 long rains______
Source of variation d.f. s.s. m.s. -v.r. F pr.block stratum 2 5.898 2.949 0.26variety 15 782.895 52.193 4.59 <.001Residual 30 341.331 11.378 1.42CS 1 2.571 2.571 0.32 0.575variety.CS 15 182.620 12.175 1.52 0.156Residual 32 256.121 8.004 0.83site 1 413.787 413.787 43.05 <.001variety.site 15 269.895 17.993 1.87 0.043CS.site 1 25.040 25.040 2.61 0.111variety.CS.site 15 118.505 7.900 0.82 0.650Residual 64 615.114 9.611Total 191 3013.776
Appendix 16 a: Analysis of variance (ANOVA) table for harvest index of sixteen maizevarieties intercropped with beans in Mwea and Waruhiu during 2008 shorlt rains
Source of variation d.f. s.s. m.s. v.r. F pr.block stratum 2 0.0000132 0.0000066 0.00variety 15 0.1578285 0.0105219. 3.12 0.004Residual 30 0.1011788 0.0033726 588.14CS 1 0.0000022 0.0000022 0.38 0.542variety.CS 15 0.0000528 0.0000035 0.61 0.842Residual 32 0.0001835 0.0000057 0.01site 1 0.0235512 0.0235512 38.50 <.001variety.site 15 0.0354011 0.0023601 3.86 <.001CS.site 1 0.0000025 0.0000025 0.00 0.949variety.CS.site 15 0.0000506 0.0000034 0.01 1.000Residual 64 0.0391450 0.0006116Total 191 0.3574094
Appendix 16 b: Analysis of variance (ANOVA) table for harvest index of sixteen maizevarieties intercropped with beans in Mwea and Waruhiu during 2009 long rains
Source of variation d.f. s.s. m.s. v.r. F pr.block stratum 2 0.012479 0.006240 1.54variety 15 0.906621 0.060441 14.95 <.001Residual 30 0.121316 0.004044 4.38CS 1 0.000189 0.000189 0.21 0.653variety.CS 15 0.009039 0.000603 0.65 0.808Residual 32 0.029515 0.000922 0.20site 1 0.001554 0.001554 0.34 0.565variety.site 15 0.121422 0.008095 1.75 0.064CS.site 1 0.002434 0.002434 0.53 0.471variety.CS.site 15 0.014073 0.000938 0.20 0.999Residual 64 0.296620 0.004635Total 191 1.515263
113

Appendix 17: Analysis of variance (ANOVA) table for plant height o f KB1 bean at 43 DAEintercropped with sixteen maize varieties during 2009 long rains.________________________
Source o f variation . d.f. s.s. m.s. v.r. F pr.block stratum 2 451.78 225.89 2.39variety 16 924.19 57.76 0.61 0.869site 2 2515.98 1257.99 13.29 <.001variety.site 32 1342.77 41.96 0.44 0.995Residual 100 9464.84 94.65Total 152 14699.57
Appendix 18 a: Analysis of variance (ANOVA) table for nodule count per plant at 21 days after emergence of KB 1 bean variety grown in Mwea, Waruhiu and Machakos under sole crop and intercropped with sixteen maize varieties during 2009 long rains.
Source o f variation d.f. s.s. m.s. v.r. F pr.block stratum 2 8.345 4.172 1.37variety 16 129.551 8.097 2.65 0.002site 2 3946.481 1973.241 646.11 <.001variety.site 32 41.490 1.297 0.42 0.996Residual 100 305.402 3.054Total 152 4431.268
Appendix 18 b: Analysis of variance (ANOVA) table for nodule count per plant at 50% flowering o f KB 1 bean variety grown in Mwea, Waruhiu and Machakos under sole crop and intercropped with sixteen maize varieties during 2009 long rains.______________________
Source of variation d.f. s.s. m.s. v.r. F pr.block stratum 2 42.942 21.471 5.09 •variety 16 84.668 5.292 1.25 0.242site 2 14626.976 7313.488 1733.40 <.001variety.site 32 104.741 3.273 0.78 0.791Residual 100 421.915 4.219Total 152 15281.242
2Appendix 19: Analysis of variance (ANOVA) table for shoot biomass (g/m ) at 50% flowering of KB 1 bean variety grown in Mwea, Waruhiu and Machakos under sole crop and intercropped with sixteen maize varieties during 2009 long rains._______________ _
Source o f variation d.f.block stratum 2variety 16site 2variety.site 32Residual 100Total 152
s.s. m.s. v.r. F pr.62984. 31492. 16.6576244. 4765. 2.52 0.003
110659. 55330. 29.26 <.00176575. 2393. 1.27 0.189
189118. 1891.515580.
114

Appendix 20: Analysis of variance (ANOVA) table for seed yield (kg/ha) of KB 1 bean intercropped with sixteen maize varieties in Mwea, Waruhiu and Machakos during 2009 long rains.
Source o f variation d.f. s.s. m.s. v.r. F pr.block stratum 2 12234. 6117. 0.26variety 16 2767583. 172974. 7.24 <.001site 2 12313072. 6156536. 257.62 <.001variety.site 32 2008537. 62767. 2.63 <.001Residual 100 2389810. 23898.Total 152 19491236.
Appendix 21: Analysis of variance (ANOVA) table for percent yield decline of KB 1 bean intercropped with sixteen maize varieties in Mwea, Waruhiu and Machakos during 2009 longrains.
Source of variation d.f. s.s. m.s. v.r. F pr.block stratum 2 1224.8 612.4 3.86variety 15 6649.4 443.3 2.80 0.001site 2 1354.1 677.1 4.27 0.017variety.site 30 13166.0 438.9 2.77 <.001Residual 94 14896.6 158.5Total 143 37290.9
Appendix 22: Analysis of variance (ANOVA) table for pods per plant of KB 1 bean intercropped with sixteen maize varieties in Mwea, Waruhiu and Machakos during 2009 longrains.
Source of variation d.f. s.s. m.s. v.r. F pr.block stratum 2 4.835 2.418 0.96variety 16 140.805 8.800 3.49 <.001site 2 455.686 227.843 90.48 <.001variety.site 32 50.570 1.580 0.63 0.933Residual 100 251.821 2.518Total 152 903.716
Appendix 23: Analysis of variance (ANOVA) table for seeds per pod of KB 1 bean intercropped with sixteen maize varieties in Mwea, Waruhiu and Machakos during 2009 longrains. ______________ _ _ _ _ _ _ _
Source of variation d.f.block stratum 2variety 16site 2variety.site 32Residual 100Total 152
s.s. m.s. v.r. F pr.0.0753 0.0377 0.185.4333 0.3396 1.64 0.072
35.6084 17.8042 85.91 <.0018.9570 0.2799 1.35 0.132
20.7236 0.207270.7976
115

Appendix 24: Analysis of variance (ANOVA) table for 100 seed weight (gms) of KB 1 bean intercropped with sixteen maize varieties in Mwea, Waruhiu and Machakos during 2009 long rains. _________________________ ____ _
Source o f variation d.f. s.s. m.s. v.r. F pr.block stratum 2 19.321 9.660 1.66variety 16 142.111 8.882 1.53 0.105site 2 5006.096 2503.048 430.33 <.001variety.site 32 199.059 6.221 1.07 0.388Residual 100 581.658 5.817Total 152 5948.244 •
Appendix 25: Analysis of variance (ANOVA) table for Land Equivalent Ratios ot KB 1 bean intercropped with sixteen maize varieties in Mwea, Waruhiu and Machakos during 200) longrains.
Source of variation block stratum variety sitevariety.siteResidualTotal
d.f. s.s. m.s. v.r. F pr.2 0.6932 0.3466 3.09
15 1.1357 0.0757 0.67 0.7991 0.6054 0.6054 5.39 0.024
15 1.6003 0.1067 0.95 0.51662 6.9616 0.112395 10.9962
Appendix 26: Analysis of variance (ANOVA) table for Monetary Advantage Index (MAI) in Kshs o f KB 1 bean intercropped with sixteen maize varieties in Mwea, Waruhiu and
Source of variation block stratum varietysitevariety.siteResidualTotal ____
d.f. s.s. • m.s. v.r. F pr.2 4.637E+08 2.318E+08 1.52
15 1.663E+09 1.109E+08 0.72 0.7501 3.670E+09 3.670E+09 23.99 <.001
15 1.964E+09 1.309E+08 0.86 0.61462 9.486E+09 1.530E+0895 1.725E+10
116