performance and design of expansive soils as road subgrade
TRANSCRIPT
PERFORMANCE AND DESIGN OF EXPANSIVE SOILS
AS ROAD SUBGRADE
BY
MAGDI MOHAMED ELTAYEB ZUMRAWI
A thesis submitted for the degree of
Doctor of Philosophy
Highway Engineering Institute
Chang'an University
Xi'an
August 2000
1
ABSTRACT
The construction of roads on naturally occurring
expansive soils has been generally avoided due to their
high potential to swell that will produce significant
volume changes and uplift forces on the pavement layers
and have relatively low strength values. The prediction
of volume changes, uplift forces and strength of these
soils is also complicated by the fact that, these soils
are affected by the boundary conditions.
The aim of this research was to investigate the swelling
behaviour and strength characteristics of expansive soils
by means of various laboratory tests such as an oedometer
cell test, CBR test and triaxial compression test.
Three types of soils with different plasticity have been
compacted at a wide range of placement conditions (i.e.
water content and dry density) then using laboratory
equipment to enable the measurement of the swell percent
and swelling pressure as well as CBR and shear strength
of these soils.
The results show that the swelling behaviour of these
soils is controlled by the surcharge pressure imposed on
the soil as well as the initial state of the soil as
described by the dry density and water content. On the
other hand, the strength of these soils is greatly
influenced by the initial dry density and water content
of the soil as well as the testing conditions.
Analysis of the experimental data indicated that it is
possible to combine the initial dry density and water
content in a way reflecting the influence of each of them
on the swell percent and swelling pressure as well as CBR
and shear strength. Therefore a new concept was
developed; this is called the placement condition factor.
On basis of this concept, a chart of swell percent and
swelling pressure – placement conditions behaviour as
well as CBR and shear strength – placement conditions
behaviour was developed. The use of these charts in
conjunction with conventional methods for pavement

2
design, pavement evaluation and compaction control on
expansive areas was demonstrated.
16
CHAPTER ONE
INTRODUCTION
1.1 INTRODUCTION
Expansive or swelling soil is a kind of high plasticity clay
that contains mainly clay minerals of kaolinite, illite and
montmorillonite. This soil has clay content (i.e. soil
fraction less than 2m) of more than 30% and known to have high liquid limit and low plastic limit, therefore the
plasticity index is high. Expansive soil has considerable
ability of swelling and shrinking deformation; swelling when
absorbs water and shrinking when losing its water. As the
moisture content of this soil increases, the volume will
expand producing uplift forces. On the other hand,
decreasing in moisture content, the volume shrinks and
cracks will appear. A dry mass of this soil is stiff, has
high strength and wide cracks that appear in the vertical
and horizontal directions of the soil mass, all these
changes will reduce in wetting state.
Expansive soils are widely distributed all over the world in
more than forty countries in the six continents. In these
areas expansive soils are known by different names such as
"black cotton soils" of central and eastern Africa and
India, "black earth" of Australia and northern Africa,
"swell-shrinking soils or cracking soils" of China, "problem
soils" of Japan, "London clay" of England and "hidden hazard
and grumusols" of USA.
Expansive soils occur extensively in tropical climates and
known locally as black cotton soils. In many areas where
expansive soils occur, there are no suitable natural gravels
or aggregates. Most of the tropical black clay deposits are
formed residually by weathering of the basic rock basalt and
rivers alluvial deposits which cover such large areas that
avoiding or by-passing them is not feasible.
Recently there is a wide interest in studying expansive
soils; this is due to the problems caused by these soils in
many countries. Expansive soils when used as a foundation
17
material for engineering structures such as roads, railways,
airfields, light buildings and others will suffer damages
due to excessive volume changes caused by variation of water
content. According to records, the economic losses caused by
expansive soils as a foundation material exceed five
billions dollars annually in the world.
In road construction, specifications and standards normally
do not permit expansive soils to be used in embankments or
fill below formation level, moreover excavation below the
embankment of expansive soil and replacing it by better
quality materials may also be required. This is because of
the large volume changes that can occur as a result of
wetting and drying with seasonal changes of climate. Few
roads constructed through these areas have proved
satisfactory, but the majority especially in Africa and
southern Asia has failed completely.
In Sudan black cotton soils cover a wide strip along the
river Nile and its tributaries (see map 1.1), in these areas
are located most of the main economical and agricultural
schemes and production factories. Most of our express
highways are constructed on black cotton clays. These major
engineering structures consequently suffer from series
distresses and damages. This due to the fact that expansive
soils exist as road subgrade when absorb water will expand
producing high uplift forces on the above road layers, on
the other hand when losing water expansive soils will shrink
and crack, as a result cracks usually appear on road
surface. These severe cracks subsequently permit water to
enter the road’s structure and create a weakness, which eventually causes road failure. In Sudan, according to
records, the annual estimated economical losses caused by
expansive soils exceed a million-dollar.
1.2 OBJECTIVES OF RESEARCH
Construction of roads often requires the use of granular
soil materials as road subgrade. It is a common practice to
remove away expansive soils and replace them by granular
materials of high strength and low potential to swelling or
using technical methods developed by researchers such as
18
soil stabilization method to reduce the swelling potential
of expansive soils. However, the practice of removing
expansive soils or using technical methods is becoming more
costly especially in undeveloped countries. When considering
expansive soils as road subgrade, one of the main concerns
of the design engineer should be concentrated on the
behaviour of the subgrade soil during both the construction
and design life of the road. Expansive soils have high
potential to swelling that will produce significant volume
changes and up lift forces. Therefore it is of great
important in design of roads on expansive soils to consider
both the strength and swelling behaviour of this soil as
main factors of design.
The main objectives of the research were the followings:-
To study the swelling potential including the swell
percent and the swelling pressure of expansive soils and
the main influence factors such as the soil composition,
initial state parameters (i.e. water content, dry density
and void ratio) and the applied surcharge pressure. Among
these factors, the soil initial state factor is the most
important one and is the main objective of the study.
To study the strength characteristics (i.e. CBR and
shear stress) of soils and the main influencing factors
including the soil composition and plasticity factor, the
initial state factor and the soaking state factor. The
initial and soaking state factors and the are the most
important factors and are considered as the main
objective of the study.
To develop the soil states factors considering both the
initial state and soaking state. These factors are formed
mainly by a combination of water content and dry density
in the different states, depending on the study analysis
results.
To relate both the swelling potential and strength
characteristics of compacted expansive soils to the soil
states factors.
19
To investigate the dependence of the swelling potential
and strength characteristics on the soil composition and
plasticity index of the soil as well as the testing
conditions such as applied surcharge pressure, cell
pressure and soaking conditions.
To develop on basis of the above relationships,
empirical chart that can be used in design, evaluation
and field compaction control of expansive soil subgrade.
The experiments have been conducted on a high plasticity
expansive soil of Southern Shaanxi clay in the north west of
China. The apparatus used for the experiments were:-
An oedometer cell: In this apparatus, the sample was
restrained laterally by the confining ring and allowed to
swell and compressed vertically by a weight on the hanger
system. This instrument was used for measuring the swell
percent at three different surcharge loads as well as
measuring the swelling pressure of the soil tested. After
swelling completed, loads were gradually placed. The
final pressure that retained the sample to its original
volume was taken as the swelling pressure.
A conventional triaxial cell: In this project the
unconsolidated undrained compression tests of compacted
expansive samples were performed. The test was relatively
easy to perform and used to give some indication of the
soil tested shear stress.
A standard CBR: This is a well known test in road
engineering and is used for measuring the CBR as soaked
or unsoaked. The soil samples were compacted at a variety
of water contents and dry densities and tested at
different boundary conditions.
1.3 STRUCTURE OF THESIS
The first part of this thesis considers those topics, which
are relevant to the study and form the theory review of the
research project. In the second part the experimental work
performed is described with an emphasis on the procedures
20
adopted in the sample preparation and testing methods. The
presentation of the results, analysis and discussion
critically examine the validity of the developed soil states
factors and the empirical chart that can be utilised in
design of expansive soils as road subgrade were clearly
demonstrated.
The following is a brief preview of the topics considered in
the various chapters of the thesis: -
Chapter 2 provides the theory review of the thesis. The
topic of swelling potential is introduced and the major
factors influencing it are described. This chapter is also
described the soil strength and the factors influencing it.
Finally a brief review of some technical methods adopted in
design of roads on expansive soils and the conventional
flexible pavement design methods are considered.
Chapter 3 covers the experimental work performed in the
laboratory both in terms of laboratory apparatus and testing
procedures; in order to measure the swelling potential
including the swell percent and swelling pressure as well as
measuring the soil strength such as the CBR and shear
stress.
Chapter 4 contains the results and analysis of the swelling
and strength data obtained from the laboratory experiments
of the soil samples studied and those reported by previous
researchers. These analysed data are used to develop new
factors, which are called the soil states factors, then
using the previous researchers’ data to verify the validity of these developed factors. Finally this chapter presents
the analysis results obtained.
Chapter 5 presents the design chart developed on basis of
the soil state factor concept. The validity of this chart is
examined by the experimental results obtained. The final
section of this chapter describes the practical applications
of the developed chart in design and construction of road
subgrade on expansive soils.

21
Chapter 6 presents the conclusions drawn from the whole
research and a summery of the study findings. Presented
Proposes recommendations for the current specifications used
for construction and design of roads are given. Also
recommendations for the future researches works are given.
22
CHAPTER TWO
THEORY REVIEW
2.1 INTRODUCTION
The research undertaken uses expansive soils as compacted
and investigates the influence of the soil initial state
parameters such as water content and dry density on the
swelling and strength properties of the soil. Several topics
of geotechnical and highway engineering, which are relevant
to the objectives of this project, will be reviewed in this
chapter. The following is a brief description of these
topics:
Mineral composition of expansive clays, i.e. the
different clay mineral compositions and the related basic
engineering properties.
Compaction, i.e. the different aspects of soil compaction
and their influence on the mechanical behaviour of the
soil mass formed.
The swelling potential, i.e. the definitions of the main
swelling components "swell percent" and "swelling
pressure" and the factors influence them.
California Bearing Ratio (CBR), i.e. the development and
applications of CBR on road design and the main influence
factors.
The shear stress, i.e. the definition of the soil shear
stress and the affecting factors.
Road design on expansive soils, i.e. the conventional
methods of pavement design as well as the various
technical methods developed by researchers to be used as
practical solutions for the problem of expansive clays as
road subgrade.
23
2.2 THE COMPOSION OF EXPANSIVE CLAY
The clay minerals in general are very small (less than 2m) and very electrochemical active particles which can be seen
using electron microscope only with difficulty. Clay
particles consist of platelets whose surfaces are negatively
charged. To maintain chemical equilibrium cations in the
soil water such as sodium (Na+), calcium (Ca2+) or magnesium
(Mg2+) are attracted to the surface of the platelets. The
concentration of these cations is higher near the surface of
the platelet than in the body of the pore fluid. Any
diffusion of the cations is prevented by the electrostatic
attraction of the clay surface. The surface of the platelet
where the positively charged cations are held is called the
diffuse double layer. The outer surface of the diffuse
double layer has a positive charge and maintains an
electrical equilibrium by attracting water molecules (which
are electro-statically polarised). As more water molecules
are attracted to the diffuse double layer, the clay
platelets are forced further apart until a new state of
equilibrium is reached with the ambient stress levels. This
increased distance between the clay platelets is observed on
a macroscopic scale as an increase in the volume occupied by
the soil.
The same process is reversible so that if water leaves the
pore fluid by, for example, evaporation an unbalance in the
electrostatic equilibrium is created. Water molecules that
were once attracted to the diffuse double layer become free
and leave in the form of vapour. Reduction in the water
molecules attracted to the diffuse double layer allows the
platelets to move closer together resulting in a decrease in
volume. The diffuse double layer then remains with a
positive charge (due to the cations) until other water
molecules (or anions) are attracted to it.
The various clay mineral types have different degrees of
expansion, which are dependent on the constituent atoms in
the clay crystal lattice. The kaolinite group of minerals
generally have low expansive properties, illites show some
expansion characteristics and montmorillonites (smectites)
are highly expansive. Figure 2.1 shows a comparative study
of the expansive properties of montmorillonite and kaolinite
24
(Grim (1962)). All of the samples were restrained laterally
and allowed to expand vertically under a constant stress of
7kpa (1 psi). It can be seen that different proportions of
the mineral can effect the amount of volume change that the
soil undergoes on inundation.
The pore water chemistry itself can also have a large effect
on the magnitude of volume change and swelling behaviour of
a soil. The type and concentration of the cations present in
the soil water affects the adsorption of water and
consequent swelling. For example the presence of calcium or
magnesium ions in the pore water produces less swelling of
the soil than sodium ions when present.
2.3 CLAY MINERALOGY RELATED TO ENGINEERING PROPERTIES
The engineering properties of soils are dependent upon the
particle size, shape, surface area, stress history as well
as the mineral composition. It is not possible to classify
all soils or clays in such a way that their mechanical
behaviour can be predicted solely on the basis of the clay
mineral composition. However the knowledge of the clay
minerals and their effects will become more important as
soils with higher clay contents are used more widely in
engineering.
2.3.1 Index tests
The index tests as proposed by Atterberg were adapted for
use in soil mechanics by Casagrande (1947) and are still
used as a convenient way of expressing the properties of
soils containing clay minerals. The test provides a
measurement of the water content of the soil at two
arbitrary strengths. The definitions and methods used for
the determination of the index properties are fully defined
in the current specification (BS 1377 part 4).
The plastic limit (PL) is defined as the minimum water
content at which the soil can be deformed plastically by
rolling into a 3 mm thick thread. The definition of the
liquid limit (LL) is the water content of the soil at which
a standard 80 gm 30 cone will penetrate a sample of soil
25
for a displacement of 20 mm when dropped under its own
weight. Plasticity index (PI) is the difference between the
liquid limit (LL) and plastic limit (PL) and is the range of
moisture contents over which the soil remains in a plastic
state.
1.2PLLLPI
The liquidity index (LI) of a soil is defined as the ratio
of the water content (w) minus the plastic limit (PL) all
divided by the plastic index (PI). The expression for
liquidity index is:
2.2PI
PLwLI
It is a way of expressing the natural water content of a
soil or clay in relation to its plastic and liquid limit.
The plasticity characteristics of a soil are related to the
amount of clay sized particles present. A relevant parameter
that reflects the amount of clay minerals present in the
soil is known as Activity (A) (Skempton (1953)). In general,
a soil with a high activity number has relatively high water
holding capacity and a low permeability; the converse is
true for a soil with a low activity.
3.22%
)(mclayofweightby
IndexPlasticityAActivity
It is possible to interpret empirically the Atterberg limits
in terms of the interaction of the water molecules with the
clay particles. At low moisture contents water molecules are
adsorbed to the surface of the clay particles and held in a
tight, well-orientated pattern. Insufficient water is
available and the molecules are not sufficiently free to
lubricate the soil particles. As the water content of the
soil increases the layers of water adsorbed to the diffuse
double layer increase. The outermost layers are less
attracted and are able to move more freely and lubricate the
movement of the clay particles under the application of a
small load. In this case the plastic limit can be
26
interpreted as the water content at which the surface of the
particles can adsorb just slightly more water than can be
held in a rigid condition. In a similar way the addition of
further water to obtain the liquid limit can be interpreted
as the water content at which the clay particles are still
able to retain a sufficiently strong attraction to the water
molecules. This prevents the soil from loosing rigidity and
becoming dispersed within the water.
Holtz and Gibbs (1956) used index tests for classifying
expansive soils as shown in table (2.1). Most expansive
soils are known by their high liquid limit, plasticity
index, shrinkage ratio and clay content.
Although the liquid and plastic limit values are based on
empirical tests they may be related to more fundamental
properties such as shear stress (Skempton and Northey
(1953)), angle of internal friction (Mitchell (1976)) and
compressibility (Wroth and Wood (1978)). For example, Figure
2.2 shows the relationship between liquidity index and shear
stress for several remoulded clays (Skempton and Northey
(1953)). As the water content of the soil moves from the
Plastic Limit to the Liquid Limit the strength and stiffness
of the soil decreases.
2.4 COMPACTION: DEFINITIONS AND INFLUENCES
A definition of compaction was introduced by the Road
Research laboratory in a widely used reference book on soil
mechanics for road engineers (Road Research Laboratory
(1952)):
"Soil compaction is the process whereby soil particles
are constrained to pack more closely together through a
reduction in air voids, generally by mechanical means."
The compaction of soil produces a material which has greater
shear stress and at the same time it reduces the propensity
for settlement and deformation as well as its permeability
to water. To use soil as an engineering material it is
necessary to understand the factors which can effect its
27
integrity both in the short and long term. The factors that
are of the greatest influence in the compaction of soil are:
The soil characteristics – grading, plasticity etc. The moisture content of the soil
The volume of the soil compacted
The amount of energy used to compact the soil.
2.4.1 Definitions
The measurements used to define quantitatively the
compaction of soil are: bulk density (), dry density (d), saturated density (sat), void ratio (e) and degree of
saturation (Sr). The relationships define the proportions of
solid, water and air within the soil. Useful definitions are
as follows:
Bulk density ()- is the ratio of the mass of a given volume of soil to the volume that the soil
occupies. Units are Mg/m3.
Dry density (d)- is the ratio of the mass of solid
particles in the given volume of soil to
the volume that the soil occupies. Units
are Mg/m3.
Saturated density (sat)- is the ratio of the mass of a given volume of saturated soil to the volume
that the soil occupies. Units are Mg/m3.
Void ratio (e) - is the ratio of the volume of voids in the
sample (water and air) to the volume of
solids. This term is dimensionless.
Degree of Saturation (Sr)- is the percentage of the volume
of water in the soil to that occupied by
the total voids.
28
2.4.2 Influence of soil type
For the input of a standard compactive effort the highest
dry densities are achieved by soils having low or no
plasticity, for example, sands and gravels. For these types
of soil greater densities are achievable when the soil is
well graded, rather than poorly graded. The soils which
exhibit plasticity due to the presence of silt and clay
particles are able to retain more water the lower the
achievable dry density for the same compactive effort.
Figure 2.3 shows the compaction curves (using the standard
2.5 kg rammer test) for a wide variety of soils ranging from
crushed limestone to high plasticity clay. It can be seen
that different soils subjected to the same amount and type
of compactive effort achieve quite different degrees of
compaction.
2.4.3 Influence of moisture content
The presence of water in soils has a large effect on the
strength of the soil. As water is added to a sand soil the
achievable dry density for a standard compaction will
increase until an optimum water content is reached after
which the achievable dry density reduces (Figure 2.4). This
peak in the dry density results from the way in which the
water forms menisci between the particles of sand creating a
negative pore water pressure (suction). At water contents
drier than the optimum the higher suctions result in an
increased effective stress within the soil, making its shear
stress greater and compaction harder. As more water is added
the suction within the soil decreases and higher densities
are achieved. At water contents greater than the optimum the
high suctions are reduced and during compaction the pore
water develops positive pore water pressures which, unless
they dissipate quickly, prevent the soil from becoming
denser. The same effects are observed in soils containing
silt or clay, however because the particles are smaller
(with larger surface areas) the suctions are much higher so
for the same water content these soils will have lower dry
densities following compaction. Increasing the water content
above the optimum produces a reduction in the dry density.
This reduction is due to the generation of excess water
29
pressures in the soil water which are unable to dissipate
sufficiently fast to allow further compaction.
2.4.4 Influence of volume compacted
As the thickness of the layer which is being compacted
increases there is a variation of shear stresses exerted by
the compactor throughout the layer this results in a
variation of the density of the soil with depth. In order to
achieve a more uniform distribution of dry density the soil
mass can be compacted in smaller layers (Figure 2.5). The
effect of layer thickness was demonstrated by Parsons (1992)
who interpreted results from a previous study, where it was
shown that an increase in the depth of fill produced a lower
dry density for the same compactive effort (Figure 2.6). The
soil used in this experiment was high plasticity clay
compacted in a standard way by an 8 tone roller.
2.4.5 Influences of compactive energy
The energy used in compacting a soil is directly related to
the achievable dry density. Generally as the compaction
energy input into a soil mass increases there will be a
greater reduction in the air voids of the soil and a higher
dry density will be achieved. The required amount of energy
can be applied by successive applications of a load such as
a weight dropping from a fixed distance or a roller passing
over the surface of the soil. After each application of the
load the dry density of the soil mass increases. During the
compaction process the stresses imposed by the roller can be
seen to increase as the successive passes reduce the
thickness of the top layer of soil and reducing the area of
contact that the roller has with the soil (Figure 2.7). At
the surface of the compacted layer the shear stress applied
can exceed the maximum shear stress of the soil and over
stressing can occur resulting in a decrease in density.
Figure 2.8 shows the change in the density observed when
compacting a granular soil with standard weight machine and
an excessively heavy machine for the same granular soil.
30
2.4.6 Effects of fabric in compacted soils
Lambe (1958) put forward a theory that the fabric of a
compacted clay changed with moisture content. When soil was
compacted at water content dry of the optimum the clay
particles would form a "flocculated" fabric (without
orientation of the particles), whereas if the clay was
compacted wetter than the optimum moisture content a
"dispersed" fabric (particles having an orientation) would
result. The idea, illustrated in Figure 2.9, formed the
basis of a thorough investigation into the fabric and
strength characteristics of compacted clays performed by
Seed and Chan (1959). A simplified model proposed by
Brackley (1975) considered unsaturated clay soils existing
as packets of soil particles, with each packet being
completely saturated and the inter-packet voids being filled
with air (Figure 2.10). This meant that the soil mass was
unsaturated whereas the individual soil packets were
saturated. By assuming that the packets were saturated,
Brackley (1975) developed the idea that the total volume
change of the soil mass would be due to the summation of the
effects of swelling or compression of the packets and their
shear behaviour.
From observations of electron micrographs of natural soils
McGowan and Collins (1975) proposed a classification system
for identifying the different types of collapsible and
expansive soils. They observed that soil microfabric could
be classified using three basic forms: "elementary particle
arrangements" – where groups of clay platelets are joined together to form elementary particles, "particle
assemblages" – where the elementary particles are arranged in aggregations or matrices with other larger sand or silt
grains and finally "pore spaces". The arrangement and
proportions of these three forms were indicative of the type
of behaviour of the soil. Figure 2.11 illustrates the types
of microfabric observed.
31
2.5 SWELLING POTENTIAL
The swelling potential of a given expansive soil can be
considered in terms of two main components "swell percent"
and "swelling pressure".
The swell percent can be defined as the ratio of the linear
(or volumetric) increase in the soil sample dimensions
relative to the initial dimensions, due to increase in water
content. The swell percent is usually measured under a small
vertical surcharge pressure (1 to 20 kPa).
The swelling pressure is equivalent to the pressure, which
must be applied to prevent swelling (or volume change) of
the soil sample when water is fed into it.
The factors that have the greatest influence in the swell
percent and swelling pressure of a given expansive soil are
summarized in the followings:-
The soil physical properties
The applied surcharge pressure
The soil initial state
2.5.1 Swell percent
The swell percent or volume change has been defined by many
researchers in different ways, such as:
Holtz (1959) defined the swell percent as the percentage of
total volume change of a soil when tested in an oedometer
such that its moisture content varies from the air-dry to
the saturated condition under a vertical surcharge pressure
of 1 psi (≈7kpa).
Seed et al (1962) stated that swell percent could be defined
as the percentage of volume change of laterally defined
sample compacted at optimum moisture content in the standard
AASHTO compaction test and a surcharge pressure of 1psi.
Snethen (1984) defined the swell percent as the equilibrium
vertical volume change or deformation from an oedometer-type
32
test, expressed as a percent of original height of an
undisturbed sample from its natural moisture content and dry
density to a state of saturation under an applied load
equivalent to the in-situ overburden pressure.
The swelling of a given expansive soil can be measured in
three different ways such as free swell, swelling under a
small load and swelling without loading the soil sample.
Among these methods the swelling under a load seems to be
the most popular used method for measuring the swell percent
of the soil.
2.5.2 Swelling Pressure
The term swelling pressure has been used by many researchers
in many different ways, and the definition is often
dependent in some way on the test method. Brackley (1973)
stated that swelling pressure could be defined as the
pressure required to hold the soil at constant volume when
water was added. He gave three different methods for
determining the swelling pressure but they produced
considerably different values.
The three methods are the consolidation test, the
equilibrium of void ratios and the constant volume test.
Each method will be described briefly:
Method 1: consolidation test – The specimen with a known initial thickness and dry density is placed in a
consolidometer and allowed under a seating pressure to swell
on the addition of water until equilibrium is reached.
Subsequently incremental loads are added and the specimen is
allowed to consolidate. The percentage volume change is
plotted against the log of the pressure on the specimen. The
point at which the curve intersects the zero volume change
line is the swelling pressure. This test results in an upper
bound for the swelling pressure.
Method 2: equilibrium of void ratios – Four to five samples with identical thickness, initial moisture content and dry
density are placed in oedometers under the same seating
pressure. The loads on the different specimens are increased
33
to different values and allowed to equilibrate. Water is
then added to the samples which are allowed to swell or
compress until equilibrium is again established. These
equilibrium positions are used to obtain (by interpolation)
the load under which the sample does not undergo volume
change on saturation. Brackley (1975) suggested that this
method followed the probable stress path that the soil may
undergo in the field where after construction the clay may
not be exposed to water for several months and after wetting
a long time may elapse before equilibrium is reached. This
test gives a lower bound to the swelling pressure.
Method 3: constant volume method – After placing in the
consolidometer and adding water, the swelling of the
specimen was controlled by the addition or subtraction of
loads so that there was neither swelling or compression
whilst maintaining a constant volume. The manual control of
this test proved difficult; the loading path was such that
there was always some swelling and small variations in
volume that could not be avoided. At near equilibrium the
addition of a small weight made the sample compress and
cross the zero volume change line. This intersection
represents the swelling pressure and gave a median value
compared to the other two methods.
Figure 2.12 shows the results from tests performed on black
cotton soil (PL = 60 %, LL = 98 %) by Sridharan et al (1986)
using the three methods discussed by Brackley (1975). The
three methods produced very different results. Method 1 was
allowed to swell fully prior to consolidation and provided
an upper bound for the swelling pressure of the soil. Method
2 had the merit of following the probable stress path that
the soil may undergo in the field, as discussed above. The
method produced the lowest value of swelling pressure but
three separate samples were requied. The last method (method
3) produced an intermediate swelling pressure value by
maintaining a small volume change during the inundation.
Johnson (1989) observed that the magnitude of the swelling
pressure depended on the degree of confinement of the soil
with the greater degree of confinement leading to increased
34
swelling pressure. Table 2.2 shows the various definitions
of swelling pressure in decreasing order of confinement.
2.5.3 Influence of soil physical properties
The soil physical properties include the mineralogical
composition of clay which has a great influence on the
swelling potential as explained by Li Bing et al (1992) and
shown in Figure 2.13. The various clay minerals types have
different degree of expansion (expansiveness) such as the
montmorillonite group of minerals have high degree of
expansion, illities are of moderate expansion and kaolinites
show low expansion. Expansive soils can be identified by the
determination of the constituent clay minerals in the soil
as indicated in table 2.1.
2.5.4 Influence of soil initial state
The initial state or the placement condition of a given
expansive soil as defined by dry density, water content and
void ratio has a great influence on the swell percent and
swelling pressure.
Influence of dry density
The initial dry density of a soil is strongly influencing
the swell percent and swelling pressure. The data of Chen
(1975) and Kassif et al (1965) as shown in Figures 2.14
and 2.15 indicated that, the higher the dry density the
higher the swell percent.
The swelling pressure is also affected by the variation
of dry density. As reported by Seed and Chan (1959) and
shown in Figure 2.16, the swelling pressure increases
with increasing in dry density.
Influence of moisture content
The presence of water in expansive soils has a large
effect on the swell percent and swelling pressure. Chen
(1975) reported that, the increase in the moisture
35
content of a soil produces a reduction in the swell
percent as shown in Figure 2.18.
The swell percent versus initial moisture content is
approximately linear if the initial dry density is fixed,
as done by Zein (1985) Figure 2.17.
O’Connor (1994) Figure 2.19 shows a higher plasticity soil with low water content produces a higher value of
swelling pressure.
Influence of void ratio
Soil is an aggregate of mineral grains in which the void
spaces are filled with water and/or air. A state of
equilibrium between the water and air phase exists which
governs the amount of air that can be dissolved in water.
The general mechanical properties of any particular
sample of soil are dependent on the proportions of the
soil, water and air present as well as the soil itself.
Figure 2.20 shows how the percentage of the three phases
in a soil change, as a sample that is saturated with air
(dry) becomes a sample saturated with water. The soil
that exists between these two extremes of saturation is
known as unsaturated.
The swelling is strongly influenced by the void ratio of
a given expansive soil sample. As reported by Brackley
(1975) and shown in Figure 2.21 that at a constant water
content the swell percent increases with decreasing in
void ratio, as can be seen the soil sample will have high
swelling at low water content and low void ratio values.
O’Connor (1994) Figure 2.19 shows the influence of three types of clay at different void ratios on the swelling
pressure. It is clear that, at a certain moisture content
value as the void ratio increases the swelling pressure
decreases.
36
2.5.5 Influence of applied surcharge pressure
The surcharge pressure under which the soil is tested
affects the measured swell percent value. Results reported
by Brackley (1975) as shown in Figure 2.22 and Rengmark and
Eriksson (1953) Figure 2.23 indicated that, other conditions
being the same, increasing surcharge pressure reduces the
measured swell percent value. In practice, the amount of
swell is reduced by the overburden pressure, the higher the
foundation pressure the smaller the swell percent due to
wetting up of the supporting soil as reported by Kassif and
Zeitlen (1960) Figure 2.24. When the overburden pressure is
just sufficient to prevent swelling, this pressure is termed
the swelling pressure.
2.6 SOIL STRENGTH
The strength of a soil as defined by Atkinson (1993) is the
largest stress that the soil can sustain and it is this
which governs the stability or collapse of structures. The
term strength usually refers to shear stress.
Yoder (1975) reported that, many tests have been devised for
measuring the strength properties of soils such as
California Bearing Ratio (CBR) test, triaxial compression
test and plate loading tests. The test results can be
correlated with field performance. As a result, many of the
procedures for testing have been standardized, which must be
strictly followed in order to obtain more reasonable
results.
In the present study the tests performed in the laboratory
to measure the soil strength are the CBR test and the
triaxial compression test. Therefore the soil strength will
be considered in terms of CBR and shear stress.
2.6.1 California Bearing Ratio
The California Bearing Ratio (CBR) test was originated by
Porter (1938) of the California State Highway Department,
since then has been modified and revised by various states
and federal agencies. The CBR test is the most widespread
37
method of determining the bearing strength of the pavement
materials and is fundamental to pavement design practice in
most countries. To use the CBR method in designing a
pavement, it is necessary to carry out a standard CBR test
and then, using values obtained from the test, an empirical
design chart is entered and the pavement layer thickness
required is read off the proper curve. The original test
procedure and design curves developed by the California
investigators have since been modified by various agencies
for their own purposes.
The CBR test is relatively simple and can be performed both
in the laboratory and field. It is essential that the
standard test procedure should be strictly followed (BS 1377
[110]). The CBR test may be conducted on remoulded or
undisturbed soil samples or on the soil in place. The
samples may be tested at their natural or as moulded
moisture content (unsoaked CBR), or they may be soaked by
immersing in water or flood for a specified period of time
(four days) in order to simulate highly unfavorable moisture
conditions of the soil type.
The CBR value of a soil tested is a ratio between the load
required to force a piston of 5 cm diameter into the soil
sample 2.50 mm penetration depth, and that required to force
the piston the same depth into a standard sample of crushed
stone (13.24 KN/m2). Therefore, the CBR may be considered as
the strength of the soil relative to that of crushed stone.
Yoder (1975) reported that, the CBR value in general
corresponding to 2.50 mm penetration is greater than at 5.00
mm penetration, i.e. the CBR will decrease as the
penetration value increases. In some cases, however, the
value at 5.00 mm penetration may be higher than at 2.50 mm
penetration if this happens the value at 5.00 mm penetration
is used.
The CBR test is probably the most widely used test to
provide the relative bearing value of subgrade, subbase and
base materials. The specifications and standards of pavement
design recommend CBR values of greater than 30% for subbase
and greater than 80% for road-base are generally specified.
38
The main factors affecting the CBR value of a soil as
reported by Murphy (1966), Yoder (1975) and Glanville (1951)
are grouped as follows:
The soil composition and Atterberg limits
The soil initial state
The soaking condition.
2.6.1.1 Influence of soil composition and Atterberg limits
The soil composition affects the CBR value. A soil contains
crushed stones or gravels has higher CBR while that contains
large quantities of clay minerals (i.e. expansive soil) has
very low CBR, Yoder (1975).
The basic engineering soil indices such as Atterburg limits
(i.e. liquid limit, plastic limit and plasticity index) much
affect the CBR value. Soils have relatively high liquid
limits and plasticity indices such as expansive soils have
very low CBR values, while those have relatively low liquid
limits and plasticity indices such as crushed stones or
gravels have high CBR values.
2.6.1.2 Influence of soil initial state
The soil initial state as indicted by moisture content, dry
density and void ratio have great influence on unsoaked CBR
value. The available data of the previous researchers
suggests the followings:
The unsoaked CBR is strongly influenced by initial
moisture content; the higher the moisture content the
lower the CBR. This was proved by Glanville (1951) and
TRL team (1981) and indicated in Figures 2.25 and 2.26.
The CBR and moisture content relationship is
approximately linear, if the dry density is fixed as
shown in Figures 2.25 and 2.26.
The unsoaked CBR is greatly affected by the initial dry
density; the unsoaked CBR value increases as the dry
density is increased, the moisture content being kept
constant (TRL team (1981) Figure 2.26 and the US Corps of
39
Engineers (1945) Figure 2.27). As shown in Figure 2.27,
the unsoaked CBR – dry density relationship is close to linear, if the moisture content is fixed.
As reported by Yoder (1975) and TRL team (1981) that, the
void ratio affected the unsoaked CBR value; the CBR value
is reduced with increasing in initial void ratio and
increased with decreasing in void ratio. In general,
dense soils (i.e. soils with low void ratios) have high
unsoaked CBR, whereas loose soils (i.e. soils with high
void ratios) have low unsoaked CBR.
2.6.1.3 Influence of soaking condition
It has been found that soaking for 4 days leads to realistic
design of roads constructed on expansive clay soils in
regions where the climate is almost wet throughout the year.
The effect of soaking on the CBR value of expansive clay
soils was found to reduce the CBR value. The considerable
drop of CBR value in a soaked clay sample was attributed to
excessive moisture absorption accompanied by considerable
swell, and reduced density after soaking. In contrast,
granular soils, which are not affected by swelling, the CBR
values have no significant changes after the soaking period.
As reported by Bissada (1970) and shown in Figure (2.28)
that, the soaking of compacted expansive soil samples for 4
days will influence the CBR values. For soaked samples
compacted at moisture contents dry of optimum moisture
content tend to give the lowest CBR values. The drop of CBR
values as the moisture content decreased is due to water
absorption and swelling during the soaking period as
indicated in Figure 2.29. Expansive soils compacted at
relatively low moisture contents will swell more than those
compacted at higher moisture contents. Swell decreases as
moisture content increases to about the optimum value and
then becomes relatively constant for moisture contents
greater than optimum (Yoder (1975)). Whereas soil samples
compacted at moisture contents wet of optimum moisture
content, the unsoaked CBR is slightly greater than that of
the soaked CBR values due to swelling of soil, and the
difference become greater as the swelling increases with
40
decrease in moisture content up to the optimum moisture
content as explained by Yoder (1975) and shown in Figure
2.29.
As previously explained, it is clear that saturation due to
soaking has great influence on the CBR values of expansive
soils. In this case the soil final state such as water
content and dry density will be saturated. The saturated dry
density (satd ) and the saturated water content ( sat ) can be
calculated using the following equations:
4.201.01 w
sat
dsat
5.2r
satS
w
Where:
sat is the saturated density of soil(Mg/m3)
w is the water content(%)
rS is the degree of saturation(%).
The influence of the saturated dry density and saturated
water content as well as the swelling occurs during the
soaking period on the soaked CBR value will be explained in
the following paragraphs.
The saturated dry density as determined by equation 2.4
is mainly affected by the saturated density and water
content. As explained by Bissada (1970) and Yoder (1975)
that at water contents less than the optimum water
content (i.e. dry of optimum side) there is a reduction
of density due to excessive moisture absorption during
the soaking period. In this case, as the water content
decreases the reduction in density will increase which
reduces the value of saturated dry density. Therefore
decreasing in water content from optimum decreases the
saturated dry density that leading to reduced the soaked
41
CBR value as shown in Figures 2.28 and 2.29. On the other
hand, at high water contents (wet of optimum side) where
the soil is almost saturated, the soaking has less effect
on the density, accordingly the saturated dry density to
some extent is similar to the initial dry density. As
indicated in Figures 2.28 and 2.29 and discussed in
Section (2.6.1.2), it is clear in that increasing in
saturated dry density will increase the soaked CBR value.
The saturated water content value depends on the initial
water content and degree of saturation as indicated by
equation 2.5. On the wet of optimum moisture contents
side where the soil is almost saturated (i.e the degree
of saturation is approximately equal hundred percent),
the saturated water content value seems to be equal to
the water content value. As explained by Bissada (1970)
and Yoder (1975) and indicted in Figures 2.28 and 2.29
that, the soaked CBR is much affected by the saturated
water content (i.e. water content). It is clear that the
soaked CBR values are decreased with increasing in the
saturated water contents. Whereas on the dry of optimum
moisture contents side, the saturated water content value
is much affected by the degree of saturation. As water
content decreases from optimum water content, the degree
of saturation value becoming very low that will increase
the saturated water content value as indicated by
equation 2.5. The drop of the soaked CBR value at low
water contents as shown in Figures 2.28 and 2.29, is due
to decreasing in degree of saturation that will give high
saturated water content values. Therefore the soaked CBR
decreases with increasing in saturated water content.
It was found that the swelling of expansive soil during
the soaking period has much effect on reducing the CBR
value (Yoder, 1975). As can be seen in figure 2.29 that
increasing in the amount of swelling reduces the soaked
CBR value. Whereas in granular soils, swelling has no
influence on the soaked CBR values.
42
2.6.2 Shear stress
A load placed on a soil mass will always produce stresses of
varying intensity in a bulb shaped zone beneath the load.
The shear stress applied to a soil must be carried by inter-
particle forces in the soil skeleton, but in general only a
proportion of the normal stresses will be carried by the
soil skeleton.
The behaviour of a soil mass is controlled by the external
total stresses applied to a soil element, and also by the
water and air pressures developed in the pores of the soil.
Terzaghi (1925) was the first to recognize that the
controlling feature was the resultant inter-particle forces,
and expressed this fact for a saturated soil by what he
termed the effective stress law. He postulated that the
strength of a soil depended on the difference of the total
stress and pore water pressure (termed the effective stress)
not on the absolute values. It followed that there would be
strains induced by a change in total stresses only if the
effective stress also change, that is, if the total stress
and the pore water pressure increments differ. Another
fundamental concept is that of the "state" of drainage. Two
"limiting" conditions are recognized as the undrained state
in which the pore water (and air, if present) is prevented
from draining, which would otherwise occur as a result of
the pressure induced in the pore water; and the drained
state in which the pore pressures are controlled to specific
values, commonly atmospheric pressure. These states model
the conditions of rapid loading and long term loading.
The soil failure is defined as the inability of the soil
element to withstand the applied stress state. Failure is
associated with large strains and a rapid decrease in the
stress state which can be resisted by the soil. The Mohr-
Coulomb failure theory considers a sample of soil which is
just about to fail when the normal and shear stresses ( and ) reach some limiting values on a failure plane. It is
found that the combinations of and which cause failure on the plane can usually be represented by the linear
equation
6.2tan c
43
The soil constants c and are termed the cohesion and the angle of internal friction, respectively. The values of c
and will be different for different soil types, while
different values of c and will be relevant, depending on whether the normal stress is taken as the total or effective
stress. In case of undrained triaxial test when no
measurement of pore water pressure is taken, the above
equation can be written in terms of total stresses for
undrained loading as follows:
7.2tan uuc
The degree of importance of either the cohesion or the angle
of internal friction depends on the type of soil. In fine
grained soils such as clay, the cohesion component is the
major contributor to the shear stress. In fact, it is
usually assumed that the angle of internal friction of
saturated clays is equal zero, cohesion C.
The failure criteria of equations (2.6 and 2.7) are known as
the Mohr-Coulomb failure criteria. The Mohr-Coulomb
relationship says that neither shear stress () nor normal stress () by themselves cause failure, but a critical
combination is required. To determine whether a particular
, combination indicates failure, that stress state has
merely to be plotted; stresses on the failure envelope imply
failure. If 1 and 3 are the major and minor principal
stresses at which failure has occurred, and the
corresponding Mohr’s circle is constructed, then one of the points on the circle must satisfy the failure criterion
equation (2.7). Furthermore the failure envelope must be a
tangent to the circle at that point, with the angle of the
failure plane equal to /4 + /2.
In actual fact the shear resistance of a soil is a function
of more than the parameters indicated in equations (2.6 and
2.7). It is also likely to influence by the followings:
Type and shape of soil particles
Drainage conditions
Soil initial states
44
2.6.2.1 Influence of soil particles type and shape
In coarse grained soils such as sand and gravel, the shear
stress is achieved mainly through the internal resistance to
sliding as the particles roll over each other. The angle of
internal friction is therefore an important shear stress
parameter. The value of the angle of internal friction
depends on the shape of the individual soil particles and
the surface texture. Thus Soils with rough particles such as
angular sand grains will have higher shear stress (larger
angle of internal friction) than rounded particles of
crushed gravel and bank run gravel. On the other hand, soils
with fine grained particles (clay soils) will have a low
angle of internal friction and a high cohesion.
2.6.2.2 Influence of Drainage conditions
The shear stress of a soil may be obtained in the laboratory
by conducting the triaxial test, the unconfined compression
test, or the direct shear test. There are three main types
of test conditions are employed in the laboratory. These
briefly described thus:-
A. Undrained, or "quick" test, in which no drainage is
allowed as testing proceeds to failure. Normally pore
water pressures are measured during the test, which
enables the results to be expressed in terms of either
total or effective stress, when the samples are not fully
saturated.
B. Consolidated – undrained or "Consolidated – quick" test, in which the test sample is loaded and allowed to
consolidate under a system of applied lateral stresses.
During this period drainage is allowed until the pore
water pressure is reduced to zero. Once this
consolidation is complete, a normal stress is increased
rapidly without allowing drainage, until shear failure
results. Providing pore water pressure measurements are
taken during the shearing phase, the resulting can be
expressed in terms of total or effective stress.
C. Drained or "slow" test in which the sample is loaded and
consolidated as in (B) above. When consolidation is
45
complete under these conditions, drainage continues to be
allowed while a normal stress is increased at a rate such
that no pore water pressure can develop. The resulting
shear stress is expressed in terms of effective stress
only.
2.6.2.3 influence of soil initial state
The shear stress value of a given expansive clay soil is
influenced by the soil initial state as described by the dry
density, moisture content and void ratio.
The shear stress is greatly influenced by the initial
moisture content; increasing moisture content will reduce
the shear stress as explained by Lewis (1959) and
O’Connor (1994) in Figures 2.30 and 2.31. It is clear
that, as shown in Figure 2.30, the shear stress and water
content relationship is approximately linear, if the
initial dry density is fixed.
The initial dry density is strongly influencing the shear
stress. When the initial dry density is high, the shear
stress will have a high value. This is verified by
O’Connor (1994) and Lewis (1959) and shown in Figures 2.30 and 2.32, as it can be seen this relationship is
almost linear.
Mitchell (1976) reported that, the initial void ratio has
much influence on the internal angle of friction;
increasing in the soil initial void ratio decreases the
internal angle of friction as indicated in Figure 2.33.
It is known in practice, soils with low void ratios (i.e.
dense soils) have high shear stress than those with high
void ratios (i.e. loose soils).
2.7 CONVENTIONAL METHODS OF PAVEMENT DESIGN
Methods of pavement design can be subdivided into two main
groups namely:

46
(a) Methods derived from empirical studies of pavement
performance
(b) Methods which either use or are derived from
theoretical studies of the mechanical behaviour of the
pavement.
Methods which are based on empirical studies of pavement
performance usually include field and laboratory testing of
materials for identification and classification. In the more
sophisticated methods materials are required to satisfy
quite stringent specifications. These usually include
strength tests giving quantitative information about the
mechanical properties of the materials. Empirically based
methods have proved to be satisfactory provided the
materials, environment and conditions of loading do not
differ significantly from those which applied during the
original empirical studies on which the design methods were
based.
The essential features of an analytical or mechanistic
structural design system for flexible pavements are:-
1) The stresses and strains in the system have to be
expressed in terms of load stresses and the mechanical
properties of the materials.
2) The characterisation of the mechanical properties of the
materials in the layers under the appropriate climatic
and loading conditions.
3) The solution of the equations for the stresses, strains
and displacements in the model.
4) The definition of criteria for design and the selection
of limiting values of stress, strain and deformation.
5) The presentation of the design system in a form that is
convenient to use.
In this project the main conventional methods of design are
briefly reviewed such as the CBR, AASHTO and SHELL method.
2.7.1 CBR Design Method
The California Bearing Ratio (CBR) method is one of the most
important design methods developed by the California State
Highway Department during the 1930’s. An example of this is
47
shown in Figure 2.34. It can be seen that the depth of
pavement construction is related to the wheel load and to
the soaked CBR value of the subgrade; in this, chart it is
not related to the volume of traffic, the environmental
conditions or the properties of the pavement materials
themselves except in as far as the pavement materials are
required to satisfy some minimum specifications. The CBR
method was initially adopted by the US Corps of Engineers
for the design of airfield pavements but has subsequently
been refined and used by many highway authorities. It is the
basis for United Kingdom method of pavement design as
described by Transport and Road Laboratory (TRL) in Road
Note No.29 and also the design method for tropical and sub-
tropical countries written by the TRL and described in Road
Note No.31.
In the United Kingdom method, the thickness of the subbase
depends on the traffic loading expressed in terms of
equivalent standard axles and on the CBR of the subgrade
measured at the equilibrium moisture content and density
expected under the road after construction. Figure 2.35
shows the Iso-CBR chart which provides the strength of the
subgrade soil at different moisture contents and densities.
The thickness of the base course also depends on the traffic
loading in addition, also depends on the type of material.
Even such a simple design method as the CBR method is open
to misuse. In the original formulation of the method the CBR
of the subgrade material is obtained after four days of
soaking – a condition which is very unlikely to apply under a properly build road. Thus the measured CBR is merely used
as an index of strength to classify the material. On the
other hand the pavement performance data on which the design
thicknesses are based were obtained from in-service
pavements. Under such pavements the in-situ CBR of the
subgrade (which is related to the actual supporting value of
the subgrade) would have been much higher than the soaked
CBR value. The result of using a soaked CBR value for design
purposes will be a thicker pavement than necessary.
2.7.2 AASHTO Design Method
48
The AASHTO design method (or modifications of it) is
probably the most widely used method in tropical countries.
This method was developed from the results of the AASHO Road
Test conducted during 1959 and 1960. In the AASHO road test,
Four large loops of road approximately two miles long were
constructed together with two smaller loops. Each loop
comprised a two lane highway. Within each loop test sections
of pavement with a minimum length of 100ft were constructed.
A total of 468 test sections of flexible pavement were
included together with test sections of rigid pavement. Each
lane of each loop was trafficked almost continuously for two
years by specially selected and loaded vehicles with
particular axle loads and wheel configurations. Each lane of
each loop always carried the same type of vehicle with the
same axle load throughout the two year study period but no
two lanes carried vehicle of the same type and axle load.
The Road Test was clearly a massive undertaking and has
provided an enormous amount of data, some of which are still
being analysed or reanalysed in the light of theoretical
advances.
AASHTO initially published an interim guide for the design
of pavement structures in 1961, which was revised in 1972. A
further revision was published in 1986, incorporating new
developments and specifically address-ing pavement
rehabilitation.
2.7.2.1 The Pavement Design Factors
The factors considered in the AASHTO procedure for the
design of flexible pavement as presented in the 1986 guide
are pavement performance, traffic, subgrade strength,
materials properties, drainage and reliability.
Pavement Performance: The primary factors considered
under pavement performance are the structural and
functional performance of the pavement. Structural
performance is related to the physical condition of the
pavement with respect to factors that have a negative
impact on the capability of the pavement to carry the
traffic load. These factors include cracking, faulting,
raveling, and so forth. Functional performance is an
49
indication of how effectively the pavement serves the
user. The main factor considered under functional per-
formance is riding comfort.
To quantify pavement performance, a concept known as the
serviceability performance was developed. Under this
concept, a procedure was developed to determine the
present serviceability index (PSI) of the pavement, based
on its roughness and distress, which were measured in
terms of extend of cracking, patching and rut depth for
flexible pavements. The mean of the ratings was used to
relate the PSI with the factors considered. The scale
ranges for 0 to 5, where 0 is the lowest PSI and 5 is the
highest.
The serviceability indices are used in the design
procedure include the initial serviceability index (Pi),
which is the serviceability index immediately after the
construction of the pavement, and the terminal
serviceability index (Pt), which is the minimum acceptable
value before resurfacing or reconstruction is necessary.
In the AASHTO road test, a value of 4.2 was used for Pi
for flexible pavements. Recommended values for Pt are 2.5
or 3.0 for major highways and 2.0 for highways with a
lower classification.
Traffic: The traffic load application is given in terms
of the number of repetitions of an 18000 lb (80 KN)
single axle loads, tandem axle is treated as two single
axles. This is usually referred to as the Equivalent
Single Axle Load (ESAL). The procedure used to determine
the design ESAL is fully described in the AASHTO manual.
Subgrade strength: The AASHTO uses the resilient modulus
(Mr) of the soil to define the subgrade material strength.
However, the method allows for the conversion of the CBR
or R value of the soil to an equivalent Mr value using the
following conversion factors.
8.2)/(15002
inlbCBRM r
9.2)/(55510002
inlbvalueRM r
50
The AASHTO recommended that the above two equations to be
used for fine grain soils with soaked CBR of 10% or less
and R value 20.
Material properties: unlike most empirically based design
methods the AASHTO method takes account of variations in
material properties and allows the overall thickness to
be reduced as the strength of the materials increase
above the minimum values required by the specifications.
The Layers coefficients are related to the standard
strength tests for the materials in question, such as for
crushed stone the relationship has been derived between
a2, the layer coefficient for crushed stone base course,
and the CBR value.
Drainage: The effect of drainage on the performance of
flexible pavements is in the 1986 guide with respect to
the effect of water has on the strength of the base
material and subgrade soil. The approach used is to
provide for the rapid drainage of the free water from the
pavement structure by providing a suitable drainage layer
and by modifying the structural layer coefficient. The
modification is carried out by incorporating a factor mi
for the base and subbase layer coefficients (a2 and a3).
The mi factors are based on the percentage of time during
which the pavement structure will be nearly saturated,
and the quality of drainage, which is dependent on the
time it takes to drain the base layer to 50 percent of
saturation.
Reliability: The AASHTO proposes the use of a reliability
factor that considers the possible uncertainties in
traffic prediction and performance. Reliability design
levels (R%), which determine assurance levels that the
pavement section designed using the procedure will
survive for its design period, have been developed for
different types of highways.
2.7.2.2 The Structural Design
The objective of the design using the AASHTO method is to
determine a flexible pavement SN adequate to carry the
51
projected design Equivalent Single Axile Load (ESAL) by
using the chart in figure 2.36. The AASHTO gives the
expression for SN as:
10.233322211 mDamDaDaSN
Where
mi: drainage coefficient for layer i.
a1,a2,a3: layer coefficients representative of surface,
base, and subbase course, respectively.
D1,D2,D3: actual thickness of surface, base, and subbase
courses, respectively.
2.7.3 Shell Method
The Shell method of pavement design is possibly the most
widley known semi-theoretical procedure. With this design
process, which was originally published in 1963, the
pavement is regarded as a three layer system in which the
lowest of the layers (assumed infinite in the vertical
direction) represents the subgrade; the middle layer
represents the combined unbound roadbase and subbase, whilst
the uppermost layer includes all bituminous bound materials
above the roadbase. A "full-depth" bituminous bound pavement
resting directly on the subgrade is dealt with by assuming
zero thickness for the unbound layers.
The Shell design approach involves estimating the bituminous
bound and unbound layer thickness required to satisfy
governing strain criteria. These criteria are:
1. The compressive strain in the surface of the subgrade,
i.e. if this is excessive, permanent deformation will
occur at the top of the subgrade and this will cause
deformation at the pavement surface.
2. The horizontal tensile strain in the bituminous bound
layer, generally at its bottom, i.e. if this is
excessive, cracking of the layer will occur.
The permissible value for compressive subgrade strain was
derived from the analysis of data from AASHO Road Test
pavements which conformed to CBR design. The permissible
52
strain in the bituminous layer was determined from extensive
laboratory measurements for various bituminous mix types at
different stiffness moduli.
Other criteria taken into account include the permissi-ble
tensile stress or strain in any cementitious base in the
middle layer and the integrated permanent deformation at the
pavement surface due to deformations in the individual
layers.
A complex computer program BISAR has been developed by Shell
which enables all stresses, strains and displacements at any
point in the pavement system to be determined under any
number of vertical and/or horizontal surface loads. However,
as it may be difficult to run this sophisticated computer
program, a series of 296 design charts has been prepared for
the Shell Manual; these charts obviate the need to carry out
complex calculations. Instead, the design engineer is able
to enter these charts with input data reflecting the
subgrade modulus, bituminous mix design, traffic volume, and
mean annual air temperature, and derive various combinations
of pavement structures which satisfy the critical strain
criteria, i.e. pavements that will not crack and will not
result in excessive strain in the subgrade which could lead
to excessive surface deformation.
However, bituminous layers, being partially viscous
materials, will deform in themselves under traffic. Thus,
when some alternative structural designs have been selected,
the next stage in the design process involves determining
the magnitude of the permanent deformation, i.e. rut depth,
anticipated in the surface layer in each candidate cross
section during its design life. The amount of permanent
deformation directly attributable to the bituminous layer is
estimated from the product of the thickness of that layer,
the average stress in the layer, the reciprocal of the
stiffness of the layer, and a correction factor for dynamic
effects. Permanent deformation in the unbound road base and
subbase layers can also contribute to the ultimate surface
deformation, so an estimate of this deformation is also made
and added to the estimated bituminous layer deformation. To
determine the ultimate surface deformation, the bituminous

53
layer is subdivided into a number of sub-layers. Then for
each sub-layer, calculation the effective viscosity of the
bitumen, determination of the mix stiffness and the average
stress is to done.
The estimated total surface deformation in each candidate
pavement design is next compared with the allowable depth of
rut, and either judged acceptable or not acceptable. The
final choice of pavement design is then made from the
acceptable candidates, normally on the basis of economics.
2.8 DESIGN OF ROADS ON EXPANSIVE SOILS
Many methods are used as practical solutions for the problem
of expansive soils when exist as road subgrade. These can be
subdivided into two categories:
Technical design methods: These are the methods that
recommended by the previous researchers and still under
study.
African specifications of pavement design: certain
African countries which have Code of Practice for design
and construction of roads on expansive soil.
2.8.1 Technical Design Methods
A wide range of design methods which recommended by previous
researchers for minimizing the damaging effects of moisture
changes and related volume changes in expansive soils
beneath roads. Many of these methods are embodied in the
specifications of certain African countries. This section
will briefly describe the methods and their intended effect
as well as the experimental works done by previous
researchers.
2.8.1.1 Soil stabilization
It is any process by which a soil may be improved and made
more stable i.e. increase strength. This may increase or
decrease the permeability, reduce compressibility, improve
stability or decrease heave due to swelling. The various
54
forms of soil stabilization include mechanical
stabilization, chemical stabilization and thermal method.
Mechanical stabilization rearranges, adds, or removes soil
particles. The objective is to modify density, water
content, or gradation. If a soil cannot be made stable
simply by compaction or consolidation, then additional soil
or other aggregate materials may be admixed to produce a
mixture having the required stability characteristics.
The properties of the soil related to the interaction with
water can be altered by chemical means to reduce the
expansiveness of the soil. Addition of lime or cement is
often used in road construction to increase the strength of
the compacted soil. It is also effective in reducing the
expansiveness of a soil. The change in the soil is most
apparent in the reduction in the liquid limit, although the
plastic limit may be raised to a lesser extent.
In lime stabilization there is a physical and a chemical
component to the reaction of lime with clay. The physical
reaction is one of cation absorption, calcium first
replacing any other ion present as a base exchange ion. This
is followed by the flocculation into groups of coarse
particles which produce an immediate increase in strength.
The addition of lime to a soil causes an immediate increase
in the pH of the molding water, due to the partial
dissociation of the calcium hydroxide. The calcium ions in
turn combine with the reactive silica or alumina or both,
present at soil surfaces to form insoluble calcium silicates
or aluminates or both, which harden on curing to stabilize
the soil. This process continues for some months.
Lime treatment levels of two to eight percent by weight of
dry soil are typical. The unconfined compressive strength
increases with increasing lime content to an upper limit
generally proportional to the clay content (Herzog and
Croft (1964) Figure 2.37). Hoskins et al (1972) found a
reduction in swell percent under a surcharge pressure of 2
psi (13 kPa) from 4.9% to 0.4% on the addition of 5% lime.
The samples were compacted to 95% Proctor maximum density at
optimum moisture content. Mukhtabant and Bunng (1973) found
55
a reduction in swell under 1 psi (6.7 kPa) from 7% to 0.5%
and 0.3% for the addition of 2 and 5% lime respectively at
93% of Proctor maximum dry density. Samples compacted to
100% of maximum density showed a smaller improvement,
reducing from 13.5% swell to 9.5% and 3% for the same lime
contents. There is a significant decrease in the swelling
pressure of active clays by the addition of lime (Mitchell
(1976) Figure 2.38). Gray et al (1980) found an increase in
CBR to the range 20 to 60% using 3% lime. A typical CBR for
untreated black clay would fall in the range 1 to 5%.
Logavinayagam (1980) measured an increase from 1 to 4% for
untreated soil to 20 to 54% for the addition of 3% lime and
15% fly ash.
Cement stabilization is one of the commonest methods of soil
stabilization. Cement hydrates when water is added,
producing cementitious compounds independently of the soil.
These products are calcium silicate hydrates, calcium
aluminate hydrates and hydrated lime. The first two products
constitute the major cementitious components, whereas the
lime is deposited as a separate crystalline solid phase. The
increase in strength is due to the development of
cementitious linkages between these hydration products and
soil particles. The lime released during the hydration of
the cement may react with any pozzolanic material, for
example clay, present in the soil to form a secondary
cementitious materials which also contributes to inter-
particle bonding.
Addition of cement generally increases the strength of most
soils. The major problem is to achieve adequate mixing.
Indeed the percentages of cement required for adequate
stabilization of the lateritic soils vary from 3% to about
7%. Unconfined compressive strength increases approximately
linearly with cement content (Ingles and Metcalf (1972)
Figure 2.39). The use of cement appears to be more effective
than the use of lime in increasing the strength of an
expansive soil. Quigley and di Nardo (1978) compared the
effect of equal amounts of lime and cement and found a
greater unconfined compressive strength using cement. The
strengths found using cement were about three times the
strength using lime. They note that cement is more effective
56
in stabilizing the whole soil, while lime is more effective
on the clay fraction. A soil with a high clay content could
thus show a higher strength when lime stabilized than when
cement stabilized.
Heating will alter the clay minerals, ultimately to ceramics
such as china, but at lower temperatures to earthenware.
This has been evaluated in the past and found to be too
expensive and slow. The heating methods have been crude and
inefficient, and it may be that modern techniques could
develop a more effective treatment. Temperatures of 400 to
600 C are typically required for permanent alteration of montmorillonites to non-swelling material.
2.8.1.2 Impermeable Membranes or Barriers
Impermeable membranes have seen widespread testing in
Southern Africa, Australia and the USA. The membranes may
either be used to minimize moisture content change by
preventing moisture movement through the soil or be used to
move the zone of moisture movement away from the road
pavement. Vertical barriers fall in the first category.
These may be effective where lateral movements of water
either causes edge heave or where evaporation at the edge
defines the lateral extent of a center heave profile. To be
fully effective, the barrier should penetrate through the
zone of moisture movement, but may be effective at a
shallower depth in reducing moisture transfer to an adequate
rate. They may be used either to keep the soil at a low
moisture content where moisture would otherwise penetrate
from the edge, or to maintain a high but uniform moisture
content where moisture movement is from the center toward
the edge. The barrier is generally formed using a plastic
sheet unrolled into a narrow trench, but could also be
formed using a bituminous material poured into a narrow
trench or sprayed onto a vertical face. Care must be taken
to ensure that the trench does not act as a water trap
supplying moisture to expansive soil at the toe of the
membrane. The membranes are usually placed at the edge of
and tied into the road pavement, thus forming a three-sided
box.
57
Vertical moisture barriers have been used for both roads and
houses. Lee and Kocherhaus (1973) used 1 to 1.5 m vertical
plastic membranes or concrete barriers together with paved
sidewalks around houses as remedial works to damaged houses
in California. The area is subjected to 2 m of potential
evaporation but only receives 0.75 m of annual rainfall.
Edge heave was being caused by watering of gardens. Further
damage was prevented after installation of the barriers.
Sterinberg (1980 and 1981) used a 2.4 m deep vertical
membrane beneath the edges of a road in Texas and
successfully reduced the variations in moisture content
within the protected zone compared with the soil outside the
protected zone. The soil outside the protected zone
experienced significant drying, while the soil within the
protected zone maintained a high moisture content. This
experiment might have been less successful had the soil
initially been dry as the membrane trench was backfilled
with sand which would have acted as a water source at the
toe of the barrier. Similar results were obtained by
Picornell et al (1983 and 1984) on another road project
which was also in San Antonio, Texas. The suction range
expected in this project was in the range 0 to 1 bar, which
corresponds to a high moisture content.
Horizontal membranes, such as the sealed shoulder, fall in
the second category. These could be used for both of the
moisture movements for which vertical barriers may be
effective. However, where a vertical barrier will tend to
minimize soil movements, the horizontal membrane will tend
to increase the soil movements by concentrating runoff from
a greater area at the edge of the sealed area or by reducing
moisture content losses by evaporation. The lateral extent
of the barrier must be sufficient to reduce differential
movement of the road pavement to an acceptable amount.
Horizontal membranes have been placed at various positions
beneath roads. Strongman (1963) and Gordon and Waters (1984)
describe cases where the membranes were placed immediately
beneath the road shoulder. The former case also used a
blanket of compacted weathered phonolite lava of low
permeability on the embankment slopes with expansive soil
forming the core of the embankment. He reported no
58
significant change in moisture content over 4 years, and the
road was reported to have performed well for many years
thereafter (Jones 1985). The latter case was coupled with
the use of dry compaction, and was not as effective in
preventing damage. They found that the sealed shoulders were
only effective in delaying the deformation of the roads and
longitudinal cracking was not prevented. Merlen and Brakey
(1968) used a horizontal membrane placed 0.6 m below ground
level to prevent penetration of water due to hydrogenesis
(Brakey 1968) into the underlying expansive soil subgrade.
They found an accumulation of water in the fine sand fill
above the membrane and no increase in the moisture content
of the expansive soil beneath the membrane. Where the
membrane was omitted there was an increase in the moisture
content of the expansive soil.
Inclined barriers are a compromise between the two extremes,
but are also of benefit in that any drainage ditch that is
required may be lined with the membrane. They are generally
of greatest value on embankments, where the membrane will
also reduce erosion. Luttrel and Reeves (1984) has used an
inclined membrane in Australia. The membrane extended from
beneath the pavement, across the shoulder, down the
embankment and 30 cm below natural ground level. No distress
was noted to the road over a period of 5 years where erosion
was expected to occur, a reinforced concrete cover was
placed over the membrane on the embankment slope and
penetrating below the ground surface.
2.8.1.3 Injected Lime Barriers
In this technique a lime slurry is injected under high
pressure along the edge of the road. The depth to which
injection is performed may be estimated as for the vertical
membranes. The lime slurry penetrates into the soil by
hydraulic fracture or along existing fissures. The soil
between the sheets of lime placed in this way is virtually
unaffected by the lime. Reduction of movements is therefore
by inhibiting moisture movement due to the horizontal sheets
of impermeable lime.
59
This method is extensively used in North Texas. Wright
(1973) describes the lime injection performed at Dallas–Fort Worth Airport where it was used as a pre-construction
treatment for most of buildings. Injection was to 2.1 m
below ground at 1.5 m centers to form an overlapping network
of horizontal sheets. Apart from reducing moisture movement
because of the horizontal sheets of lime, the injection
process also caused pre-swelling of the soil. Post-
construction injection was used by Saragunam (1983) on 22
buildings in Madras. Injection was most effective when
performed in spring as the damage was caused by soil
shrinkage during the summer. Twelve millimeter diameter
perforated steel pipes were used at 45 cm spacing around the
buildings. The 1.5 meter depth of treatment was effective in
preventing further damage in 90 percent of cases. Injection
pressures range from 200 to 600 kPa. Sand and silt lenses
were present in the soil profile and would have facilitated
the lateral penetration of the lime. Remedial work to a road
was reported by Cothren (1984). Failure of the road had been
by longitudinal cracking and it was resurfaced after the
lime injection treatment. Injection points were at 1.2 meter
centers along both sides of the pavement. Up to 220 liters
of slurry was injected at 0.75, 1.5 and 2 m depth at
pressures up to 1380 kPa. The slurry comprised 0.3 kg of
lime per liter of water, and a wetting agent was used to aid
penetration of the slurry into the soil. After two wet and
dry seasonal cycles there was no indication of movement and
no cracking of the asphalt surface.
2.8.1.4 Granular Blankets
Seasonal or cyclic heave in particular is dependent on loss
of moisture by evapotranspiration adjacent to the covered
area. Removal of vegetation will reduce the rate of moisture
loss, but where the clayey soil extends to the surface,
moisture will be moved to the zone of maximum suction at the
ground surface and will evaporate from there. The maximum
capillary rise of moisture through a sand is very much less
than the potential rise due to soil suction in clays. A
clean sand or gravel blanket of 150 to 250 mm thickness will
be effective in preventing almost all evaporation from the
ground surface.
60
The effectiveness of a granular surface cover in preventing
evaporation and maintaining high and stable moisture
contents has been demonstrated by the early work of de
Bruijn and Donaldson (1965). They measured moisture changes
using both psychrometers and nuclear meters and found less
variation beneath the sand blanket than was observed in the
open field.
Gogoll (1970) used 0.6 and 1.8 m thick blankets over a
prewet clay to minimize heave. The foundations were placed
several months after the blanket had been placed, and no
movements were observed during a six month period. A control
peg outside of the blanketed area indicated a subsidence of
60 mm, indicating that the blanket was effective in
minimizing moisture changes.
2.8.1.5 Prewetting and Ponding
These methods attempt to cause the majority of heave to
occur before construction is commenced. Water is supplied by
irrigation or by forming a pond covering at least the area
of subsequent construction. Rainfall may be utilized
together with removal of vegetation and a sand blanket to
prevent evaporation, but the rate of heave is likely to be
much slower using rainfall than using artificially provided
water. Difficulty may be experienced in obtaining adequate
penetration through relatively impermeable soils,
particularly where the potential heaving layer is thick.
This may be alleviated by drilling a series of boreholes
through the potential heaving layer and supplying water by
filling the boreholes.
This method will only be effective where the equilibrium
moisture content is high. If prewetting is used in areas
where the equilibrium moisture content is low, then drying
and shrinkage will occur over a period of years and may
cause severe damage. Similar effects may occur at the edge
of a road if the heave profile caused by the prewetting does
not reasonably match the long term moisture distribution
beneath the road.
61
Artificially increasing the moisture content of a desiccated
soil before construction has employed for many years.
Steinberg (1977 and 1980) has used ponding on road projects
in the USA. The depth of wetting varies, in one project
being less than 1.4 m in one month, in the other being 3 m.
In the former case the ponding caused about half the final
total heave to occur, and the remainder which took place
after construction, occurred at depths greater than 1.4 m.
Movement of the control sections which were not prewet did
not commence for 2 years but were similar in final magnitude
to the total movement in the ponded sections. In both cases
damage to the road was less in the ponded sections than in
the control sections.
Weston (1980) and Netterberg and Bam (1984) compared
prewetting with other movement control techniques. The
observed movements were inadequate to reach firm
conclusions, but the latter authors suggest that prewetting
with an irrigation layer of sand would have been adequate.
The road was constructed with prewetting and membranes as
standard measures for a 25 km section over an expansive soil
subgrade.
2.8.1.6 Placement at Equilibrium Moisture Conditions
This technique also attempts to obtain the equilibrium
moisture conditions in the soil during construction. Where
the above method is primarily applicable to in situ soils,
this technique is applicable to compacted soils. The
standard practice for compaction of soils is to use a
moisture content close to optimum in order to minimise the
effort required to obtain the desired density. Where the
equilibrium conditions are significantly drier than the
compaction moisture content drying will take place and may
cause severe damage. If the compaction moisture content is
near to the equilibrium moisture content then volume change
due to moisture content change will be minimised.
Although this technique could be of great value under
appropriate ground and climatic conditions, very little
effort has been directed toward its evaluation in practice.
Ellis (1980) has employed dry compaction in Sudan. This was
62
intended to evaluate the use of soil expansive, at its
natural moisture content in order to avoid the use of
additional water. The moisture content at compaction ranged
from 7 to 14%, compared with the optimum moisture content 20
to 30%. In the 18 months following construction, the
moisture contents increased slightly toward the 24% moisture
content measured at about 2 m depth at the site before
construction. It appears that the compaction moisture
contents, which reflect the natural moisture content at
shallow depth may be lower than the equilibrium conditions,
and further wetting up is to be expected. No damage had been
observed after two wet seasons, and it is suggested by Ellis
(1980) that the uniform wetting up is the reason.
In the above case the moisture condition was governed by
climatic conditions during construction. Very careful
control of the moisture content will be required to maintain
the desired conditions during construction. However, it
appears that wetting up from dry conditions is less damaging
than drying after construction which is held to be
responsible for some cases of longitudinal cracking (Gordon
and Water (1984)).
2.8.2 African Specifications for Pavement Design
Certain African countries have manuals or reports for design
and construction of roads on naturally occurring expansive
soils. In this section a brief description of the
recommendations given by these specifications design manuals
or reports.
Kenya Road Design Manual (MOTC, 1981) considers soil
stabilization, using 4 to 6% of lime will reduce the
swelling and increase the soaked CBR of expansive soils. In
order to control the moisture content of expansive soils,
the manual recommends that soil should be placed at the
Equilibrium Moisture Content (EMC) which is usually the
optimum moisture content for standard compaction, except in
arid areas or where the water table is near to the surface.
Extended sealed shoulders using impermeable materials are
required by the manual where removal or stabilization are
not employed, in order to minimize the effect of seasonal
63
changes on the pavement. The manual recommends that side
drains should be kept as far from the road as possible, or
avoided entirely, as they have acted as water sources and
promoted swelling (Mitchell and Mckechnie, 1972). In order
to minimize the swelling due to moisture changes, the manual
recommends surcharging the natural expansive soil using 1 to
3 m of non-expansive fill. Also compaction to a lower dry
density than is normally required to minimize swelling due
to wetting.
Zimbabwe Rural Road Report (Mitchel et al, 1975) recommends
removal of 60 cm of the naturally occurring expansive soil.
In Zimbabwe the equilibrium moisture content is close to
optimum moisture content and that construction should not
take place where the soil is excessively wet or dry. Side
drains should be kept as far from the road as possible or
avoided entirely, as they have acted as water sources and
promoted swelling.
TRH9 from South Africa (NITRR, 1978) considers soil
stabilization. Using 4 to 6% of lime will reduce swell to
negligible values and increasing the soaked CBR of the soil,
and suggested that two or three partial applications of the
lime will be required to obtain uniform mix. The mount of
volume change that occurs on wetting may be reduced by
surcharging the expansive soil (see section 2.5.5). This is
utilized by the NITRR in recommending that using 3 m
embankment of non-expansive soil placed on it to reduce the
amount of swelling that occur on wetting.
Botswana Road Design Manual (MOWC, 1982) recommends
prewetting of the natural soil as was done by Netterberg and
Bam (1984). Extended sealed shoulders are required using
embankment slopes where removal or stabilization is not
employed.
2.9 DISCUSSION
The technical methods of design and construction of roads on
expansive soils which recommended by the previous
researchers and adopted by certain African countries as
practical solutions of swelling problems, as described in
64
the previous section, have some disadvantages and may be
unsuitable options. This due to the reasons will be
discussed in the following paragraphs.
Soil stabilization using chemicals such as lime or cement is
an expensive option in undeveloped countries. The mixing of
lime or cement with expansive soils was found to be one of
the problems met by the engineers working in expansive soil
areas (e.g. TRL teams and Howard Humphreys working in East
Africa, 1980~1990).
Impermeable membranes which are used to control moisture
content of the expansive soil, may crack due to the soil
movements. Where the membrane crack, water may penetrate
through the cracks and cause a progressive inward
penetration of the zone of soil movement leading to soil
expansion and ultimately failure of the pavement. Using
plastic sheets, bituminous or concrete materials as vertical
barriers in road construction on expansive soils as well as
using injected lime barriers, these will be very expensive
techniques especially in undeveloped countries.
The granular surface cover technique is not often effective.
Shiming (1984) used a 1.5 m thick sand blanket beneath an
industrial building. Differential heave and damage resulted
from leakage of water from pipes serving the building.
The prewetting and ponding methods of naturally occurring
expansive soils will not be effective for arid climates,
where the equilibrium moisture content is low. This is due
to the fact that, these soils have low permeability, also
drying and shrinkage could occur where Equilibrium Moisture
Content (EMC) is less than that achieved by prewetting and
may cause sever damage (Blight and de Wet, 1965). Similar
effects may occur at the edge of a road if the heave profile
caused by the prewetting does not reasonably match the long
term moisture distribution beneath the road. The Botswana
manual recommends pre-wetting of the natural soil. This may
be unsuitable option for arid climates.
In most arid regions where Equilibrium Moisture Content
(EMC) is less than the compaction optimum moisture content,
65
drying will take place and may cause deformation and
longitudinal cracking appear on road’s surface. With the
climatic and geological conditions so careful control of the
moisture content is recommended to maintain the desired
conditions during construction.
Some manuals consider the removal of expansive soil and
replacement with non-expansive soils to be the most
effective option where avoidance of expansive soil is not
feasible. But this option is only possible in areas where
suitable non-expansive fill material is available, and where
the depth of expansive soil is small.
Jones (1985) found that the sealed shoulders were only
effective in delaying the deformation of the roads and
longitudinal cracking was not prevented. The extended sealed
shoulders which are recommended by the Kenya manual where
removal or stabilization are not employed, in order to
minimize the effect of seasonal changes on the pavement.
This will not prevent seasonal movements, but such movements
will initially occur beneath the shoulders and only
penetrate toward the pavement if longitudinal cracking
permits water entry through the shoulders.
The conventional methods of pavement design which included
analytical design methods and empirically based design
methods (see section 2.7) are often criticized because of
the deficiencies that will be pointed out in the following
paragraphs.
Analytical design methods require a considerable amount of
material testing and computational effort before they can be
properly used. It is therefore unlikely that in the
immediate future the full technique will be used for the
design of individual roads in most countries. It is more
likely that the analytical technique will be used in the
preparation of simplified design manuals.
Recently, traffic volumes and traffic loadings have
increased quite dramatically and it is unlikely that
existing empirical methods can be simply extrapolated to
accommodate these changes. Further more, the use of new or

66
unusual materials may be inhibited if it is not possible to
determine the thicknesses and conditions under which they
should be used. The extension of empirical methods to
different loadings, different materials and different
environmental conditions can be achieved only by carrying
out expensive and time consuming full-scale pavement
experiments. The extension of empirical design methods is a
serious problem and difficult even for most developing
countries. Indeed many developing countries do not yet have
a satisfactory design method of their own based on empirical
studies. In such countries pavement design relies on methods
borrowed from elsewhere with results that are often far from
satisfactory.
Finally, it is to be noted that all the technical design
methods previously reviewed (in Section 2.8) do not consider
the strength characteristics of the subgrade material,
although it is the main factor of pavement design. On the
other hand, conventional methods of flexible pavement design
consider the strength (CBR and shear stress) alone and not
swelling. The work in this thesis hopefully considers both
the swelling behaviour and the strength characteristics of
the soil.
67
CHAPTER THREE
LABORATORY TESTS AND PROCEDURES
3.1 INTRODUCTION
The laboratory tests were carried out in this research
project for number of purposes, the most important being:
For description and classification of the soil used.
To investigate the swelling and strength behaviour of
soil samples prepared at a wide range of water contents
and compacted to different dry densities and subjected to
different testing conditions in order to develop a new
factor concept for the different soil states.
To determine design parameters (i.e. numerical values for
swelling, CBR and shear stress) for later analysis.
The tests were performed using different types of apparatus.
In this chapter a detailed description of the tests and the
fundamental components of the apparatus used will be given,
followed by the procedures adopted during the tests.
The main piece of apparatus used was a conventional
oedometer cell which was used to measure the swell percent
of compacted soil samples tested under different surcharge
loads. The oedometer cell was also used for measuring the
swelling pressure of compacted samples. The second piece of
apparatus used was a standard 38 mm triaxial cell in which
different stresses could be applied to samples of 38 mm in
diameter and 76 mm in height. This apparatus was used to
measure the shear stress of the sample in a quick triaxial
test. Finally a standard CBR equipment was used to measure
the CBR of compacted samples. Some of these samples were
tested as remoulded in order to measure their unsoaked CBR,
whereas others were subjected to soaking before testing so
as to measure the soaked CBR.
The samples which were prepared and compacted at different
water contents and dry densities, were then used to perform
standard soil tests such as swelling tests, undrained
triaxial test, CBR tests as well as index tests were also
68
carried out to classify the soil used. The measurements from
these tests were able to give a useful indication of the
relationship between the combination of soil initial state
parameters (water content, dry density and void ratio) and
the swelling or strength properties. Since the aim of these
tests was to investigate this relationship it was possible
to perform the tests with one type of soil. The existence of
a relationship would then support the possibility of testing
other soils. This helped with the analysis of the results
reported by previous researchers.
3.2 SOIL USED
The experiments of this study had been conducted on
expansive soil which was brought from Ankang City in
Southern Shaanxi province located in the western part of
china. In Shaanxi province expansive soils are widely spread
in Hanzhong basin, Xixiang basin and Ankang basin of Han
River basin to the south of Qinling Mountains. This area is
known to have the most potentially expansive soil in China.
Ankang clay soil which was selected for this study is famous
for being harmful to roads, railways and light structures.
Serious damages, landslides and cracks are clearly visible
in this area and they reflect the seasonal variations and
changes in moisture content causing upheaval of soil.
Expansive soils appear to be one of the main problems to
agricultural and industrial development in this area and
cause enormous economic losses to the Shaanxi province and
its people. Therefore, the study soil samples were taken
from this area.
Disturbed soils were collected from excavated bore pits at
depths 0.5 to 3 m. The samples were packed in big bags and
the send to Chang’An university laboratory for study.
3.3 SAMPLE PREPARATION
Sample preparation was a very important part of the testing
procedure. It was critical that the method of soil
preparation and compaction method chosen would result in
consistent, uniform samples. In practice clayey backfill
69
material is excavated from a borrow pit and recompacted in
location at a water content similar to its natural in situ
water content. The study of the compaction of soil contained
in chapter two highlighted the large influence that the
compaction process has on the behaviour of the final mass of
soil. For the experiments performed in this thesis the soil
preparation and compaction method chosen to simulate similar
techniques used in the field. The process was a well
controlled standardized procedure that could produce
consistent samples on a small scale. The general method of
preparation was to produce small lumps of soil at a known
and controlled moisture content and to remould these into a
container by applying a load. For this project, soil samples
were prepared with different initial water contents ranging
from 7% to about 35%. To ensure the repeatability of the
samples a careful study of each process in the preparation
was made.
Soil was initially air dried and crushed using a jack
hammer. This was then sieved and the fraction passed 5 mm
sieve was kept. It was possible to produce samples of
different water contents by controlling the ratio of water
to dry soil grains. To achieve the desired moisture content,
a desired quantity of water was sprayed onto a known amount
of dried soil and they were thoroughly mixed for about five
minutes. Then the wet soil was put in plastic bags and
stored for two days to allow a uniform moisture distribution
throughout the sample. After two days of storage, the moist
soil sample was remixed and then compacted into a U8O tube,
120 mm in length with a ring of 20 x 76 mm diameter
positioned inside the tube from which samples could be
prepared for the swelling tests. On the other hand, The
samples prepared for the triaxial test were compacted into a
U38 tube of 76 mm length, while those tested for CBR were
compacted into a standard CBR mould of 2177 cm3 volume.
The compactive effort for remoulding the soil samples in the
CBR mould was provided manually by a rammer of mass 2.5 Kg
(in low compaction) or 4.5 Kg (in heavy compaction). The
rammer was dropped free from a height of 30 cm (or 45 cm)
above the elevation of the soil. The sample was compacted in
three (or five) layers. By adding to the mould a known mass
70
of soil and applying 59 (or 98) uniformly distributed blows
from the rammer it was possible to achieve a consistent
layer thickness. The samples remoulded in the U38 tube were
compressed in eight layers to avoid the presence of a large
density gradient in the sample (Section 2.4.4), whereas
those remoulded in the U80 tube were compressed in one
layer. The compactive effort for compressing the soils in
the preparation tubes was provided by a hydraulic jack.
Once the soil samples had been compacted in the tubes it
could be extruded and the following samples prepared:
20 x 76 mm diameter samples for the swelling tests in the
oedometer cell.
76 x 38 mm diameter samples for the shear stress test in
the triaxial cell.
The prepared compacted soil samples were then weighed for
determining the bulk density and the moisture content of
each sample was also determined. The samples were then ready
for swelling or shear stress tests.
The samples compacted in the CBR mould, after compaction was
completed, the extension collar was removed and the
compacted soil was carefully trimmed with the top of the
mould using a straightedge. Then for each prepared sample
the density and moisture content were determined. The
prepared compacted samples were ready for unsoaked CBR test.
The samples prepared for soaked CBR test were subjected to
soaking process before testing. The compacted sample with
the mould were immersed in a water tank for about four days
to obtain a saturation condition similar to what may occur
in the field. During the soaking period, the sample was
loaded with a 5 kg surcharge load placed on top of it and
the expansion of the soil due to saturation was measured
using a dial gauge positioned over the sample. After the
four days of soaking, the sample was removed from the water
tank and allowed to drain for about 15 minutes. The soaked
sample was then ready for performing the CBR test.
71
3.4 PRELIMINARY TESTS
The engineering properties of soils are controlled by a
number of factors such as soil mineral composition, organic
material, particle size distribution and geological history.
However for the majority of soils the mechanical properties
of soils are largely determined by the finest 20 % of the
constituent grains for the soils used, that is the clay and
fine silt fractions. The preliminary tests aimed to classify
and described the soils within the existing standard methods
and quantify their properties.
The preliminary tests or the routine soil tests performed in
this project were including the index tests, clay content,
specific gravity determination and compaction tests. These
tests are very carefully and precisely specified in a number
of national standards and codes of practice. The tests
provided standard data for the soil which could be used in
subsequent analysis. The tests also provided an opportunity
to ensure that methods of mixing and drying employed in the
sample preparation did not affect the properties of the
soil.
3.4.1 Index tests
The properties of fine grained clay soils depend largely on
the type of clay. The basic behaviour of plastic clay soils
can be assessed from the index tests (i.e. liquid limit and
plastic limit). The liquid and plastic limits are the water
contents at which the soil changes its mechanical behaviour.
The definitions and methods of testing used are fully
defined in the standard specifications.
In this research the Liquid Limit was determined using a
cone penetrometer apparatus. The penetration of a standard
cone into a soil sample was measured at a variety of
moisture contents and the moisture content corresponding to
a penetration of 20 mm was taken as the liquid limit of the
soil tested.
The Plastic Limit test was performed on the soil used in
accordance with BS 1377 part 4. The Plastic Limit was
72
measured as the water content at which the sample deformed
plastically when rolled into a 3 mm thick thread.
3.4.2 Compaction tests
The soil used was subjected to both standard and heavy
compaction tests. These tests aimed to achieve the optimum
moisture content and the maximum dry density (i.e the
compaction characteristics) of the study soil. The
compaction tests were carried out in accordance with the
standard specifications.
In the standard compaction tests the sample was compacted in
three layers, each layer was subjected to 27 uniformly
distributed blows from a standard rammer of 2.5 kg mass,
dropped from a height 30 cm. The mould was then trimmed and
weighed, from which the bulk density of the sample was
determined. A small soil sample was taken from the mould to
determine the moisture content of the compacted soil sample.
Seven soil samples with different moisture contents were
tested.
The procedure followed in the heavy compaction test was the
same as that used for the standard compaction test except in
that the soil was placed in five layers, each of which was
subjected to 56 blows from a 4.5 kg rammer having a free
fall of 45 cm. The moisture content and density were
determined in the manner described above. Seven soil samples
with different moisture contents were also tested.
3.5 SWELLING TESTS
These tests were carried out using an oedometer cell to
measure both the swell percent and swelling pressure. The
swell percent of compacted samples was measured at different
surcharge loads. In this research the oedometer cell was
also used to provide a simple measure of swelling pressure
of compacted soil samples by adopting the pre-swell method
of testing.
73
3.5.1 General arrangement
These swelling tests were performed in a conventional
oedometer apparatus. This piece of apparatus is a standard
equipment in soil testing laboratories. The frame consists
of two steel rods each 10 mm diameter and 300 mm long. The
rods are separated a distance of 200 mm by another steel bar
of 10 mm thick. The bars are arranged in a triangular
pattern, sufficiently spaced to allow easy access for the
oedometer cell. The base plate of the frame has a spigot
fixed so that the oedometer cell can always be located in
the same position. A load hanger system is attached through
the top plate by a reverse screw threaded shaft which allows
it to be raised or lowered on to the sample. At the front
edge of the shaft hanged a weight hanger and at the back
edge fixed a counter balance weight. The surcharge weight
under which the sample was tested positioned on a weight
hanger.
The oedometer cell as shown in Figure 3.1 consists of a
stiff ring, two porous discs, the soil sample and the top
and bottom platens. Normally the dimension of the ring is 76
mm inner diameter by 20 mm height and 1 mm thick. The top
and bottom platens consist of porous discs which are placed
in contact with the sample faces and used saturated by
boiling in de-aired water. It is important that the two
surfaces of the soil sample which in contact with the porous
stones should be plane.
The vertical displacement (axial strain) of the sample was
measured by observing the vertical movement of the top
platen using a dial gauge positioned on top of it. The test
was performed to provide a simple measure of the swell
percent and swelling pressure of the soil tested.
3.5.2 Testing procedure
Each sample was prepared and then placed in a standard
oedometer cell. Two types of experiment were under taken.
The first series of experiments measured the swell percent
at different surcharge loads. A number of samples with
different moisture contents were compacted to different dry
densities. These samples were tested under three different
74
surcharge pressures 7, 25 and 50 Kpa. This series of
experiments investigated the effects of different surcharge
pressures on the volumetric changes of the sample. A
detailed description of the procedure adopted in testing
will be given in the following section.
The second series of experiments used soil samples that were
compacted, again at a wide range of moisture content and
different dry densities. These samples were initially
allowed to swell under a seated pressure of 1 psi (7 kpa) and then consolidated until retained back to its initial
volume. This series of experiments measured the swelling
pressure.
3.5.2.1 Swelling under loading
In this project the swell percent was measured as defined by
Holtz (1959) and described in section 2.5.1. The soil
samples were prepared and compacted at a variety of water
contents and dry densities and were tested under three
different surcharge pressures of 7, 25 and 50 KPa.
For each test a standard oedometer sample was trimmed, the
trimmed part of the sample was used for determining the
sample moisture content. The lower saturated porous stone
was placed on the base of the unit. The prepared sample
weighed and then positioned on the lower porous stone, the
saturated upper stone and loading platen were then added.
The whole unit was placed on the pedestal in the loading
arrangement, the lever arm was supported and the dial gauge
which seated on the ball bearing was securely fastened and
checked for sufficient vertical travel. After placing the
oedometer cell in the frame a surcharge load was applied on
the sample by placing a certain weight on the weight hanger
and the level of the liver arm was adjusted by a water bulb
tube. Then the dial gauge that used for measuring the
swelling was set to zero or any starting reading. After 5
minutes distilled water was added to the cell until the
sample was covered. The sample was let to swell to a period
of two to three days until the swelling value was stable.
During the testing period, water was added to ensure that
the sample was in direct contact with water. The final dial
75
gauge reading was recorded when no further changes in the
reading. The sample was quickly removed from the oemdometer
cell.
3.5.2.2 Swelling pressure
The swelling pressure of a compacted soil sample was
measured using a pre-swelled method which is also called a
consolidation method (see section 2.5.2). The swelling
pressure in this method is defined as the external pressure
required to consolidate a pre-swelled sample until it goes
back to its initial volume. In this study a compacted soil
sample was first allowed to swell under a light pressure
equal to 1 psi (7 kpa) until reaching the peak swelling, then it was consolidated by the increase of applied
surcharge loads until the sample retained back to its
initial volume. The pressure required for this is the
swelling pressure. The procedure adopted for measuring the
swelling pressure of a sample will be described in the
following paragraphs.
The compacted soil sample after prepared was then placed in
the oedometer cell with dry porous discs above and below.
The oedometer cell positioned in the frame and then the
loading hanger system was lowered until the sample was under
a small seating pressure 1 psi( 7 Kpa). The seating
pressure was used to ensure that the soil, porous stone and
load system were in full contact prior to wetting. This also
removed any looseness in the fit of the threaded ring
system. Distilled water was then added to the cell. The
sample was allowed under the seating pressure to swell on
the addition of water until when there was no changes in the
dial gauge readings (i.e. reaching the peak swelling).
After swelling under 1 psi surcharge pressure had been
completed, the sample was then subjected to consolidation
stages in order to retain back the sample to its initial
volume by subsequently increment of loads. The surcharge
load was increased each day by an amount approximately equal
to the load under which the sample had consolidated. The
sample was allowed to consolidate until the sample retained
to its original volume. The final pressure was taken to be
76
the swelling pressure of the sample tested. After
consolidation was completed, the sample was unloaded and the
cell was dismantled from the frame.
3.6 CBR TESTS
The California Bearing Ratio (CBR) penetration test, as
described earlier (Section 2.6.1) is a widely used test in
highway engineering for measuring the strength of the road
subgrade material. The tests performed on compacted samples
for measuring both the soaked and unsoaked CBR. Some of the
samples were tested directly as remoulded while others were
subjected to a soaking process prior to the penetration
test. The boundary conditions of testing were chosen to
simulate the boundary conditions that a subgrade soil would
experience below a road pavement.
The CBR measurements from these tests were able to give a
useful indication of the soil strength at different
conditions of testing as well as allowed an investigation of
the relationship between the combination of the soil initial
state parameters (or soaking state parameters) and the
unsoaked (or soaked) CBR.
3.6.1 General arrangement
The fundamental equipment of a standard testing machine is
the penetration piston, which consists of a cylindrical
plunger having an end diameter of exactly 49.6 mm. The load
transmitted to the sample via the plunger fitted into the
upper part of the loading machine where a proving ring is
fixed. The application of the load was performed manually at
a constant rate of 1 mm per minute to force the plunger to
penetrate the soil sample. A sensitive dial gauge fixed into
a proving ring of the loading frame measures the applied
load. The penetration of the plunger in the sample is
measured externally using two resistive displacement dial
gauges with a nominal stroke of 25 mm. As the plunger
penetrates axially into the soil sample the dial gauge
measures this penetration depth. Figure 3.2 shows the
arrangement of a standard CBR machine.
77
The compacted samples and those subjected to soaking process
after completion of compaction were then transferred to the
penetration machine for measuring the CBR. For soaked or
remoulded (unsoaked) sample the testing procedure adopted
was the same in measuring the CBR value.
3.6.2 Testing procedure
The soil samples were prepared to water contents between 7%
and 35% and were allowed to equilibrate as described in
Section 3.3. For these water contents samples were compacted
to different dry densities using the same method as in
Section 3.3. The procedure adopted in testing the samples
can be subdivided into two stages namely the soaking stage
and the penetration testing stage. In the soaked CBR test
the samples were subjected to a soaking process prior to the
penetration test. On the other hand, the unsoaked CBR tests
were performed on samples not subjected to soaking but
directly tested as remoulded.
3.6.2.1 Soaking process
This process was performed on compacted sample before the
penetration testing stage. A coarse filter paper was placed
on a perforated base plate and then the mould contained
compacted sample was inverted and placed on the filter paper
so that the compacted sample was in contact with it. A swell
plate with adjustable stem was placed over the sample and a
5 kg surcharge weight was imposed upon it. The complete
assembly was then immersed in a tank filled with water. A
tripod and a dial indicator attached to the stem for
measuring the sample expansion and an initial dial reading
was set to zero or a starting reading. The assembly was left
immersed in water for 96 hours and during this period the
dial indicator reading was recorded at the ends of 1, 2, 4,
8, 24, 48, 72 and 96 hours. At the end of the soaking
period, the mould was removed from the water tank, the water
poured off the top and the surcharge weights were removed.
The sample was ready for penetration test.
78
3.6.2.2 Penetration test
For each prepared sample a surcharge weight of 5 kg was
placed on top of it and then the combination was seated
under the penetration piston of the loading machine. The
penetration piston was placed in contact with the center of
the sample. The initial reading of the proving ring (the
load indicator) was recorded or might set to zero. The
penetration dial gauges were mounted on the top of the mould
and were set to zero. The vertical load, which was applied
manually, was increased gradually to force the plunger to
penetrate the sample at a constant rate of penetration 1 mm
per minute. The applied load was recorded at intervals of
penetration of 0.5 mm to a total penetration not exceeding
12.5 mm. The test stopped at 12.5 mm penetration or when the
load indicated a peak before 12.5 mm penetration arrived.
After recording the final reading, the surcharge weight was
removed from the top of the sample and then the mould was
removed from the penetration mechanism. The soil was then
removed from the mould by an extruder and soil pieces were
taken for determining the moisture content. For unsoaked
samples, soil pieces taken from top, middle and bottom part
of the mould for determining the moisture content, whereas
the soaked samples moisture contents were determined before
the soaking process by taken trimmed soil pieces from the
compacted soil.
3.7 TRIAXIAL COMPRESSION TEST
The triaxial test is by far the most common and versatile
test for measuring the shear stress of fine grained soils.
The tests performed using a standard triaxial apparatus were
conventional undrained triaxial compression tests and were
used to determine the value of shear stress of the samples
tested. This type of triaxial test is known to be quick and
simple test. The tests were performed at three different
cell pressures of 50, 100 and 200 kPa.
The samples were compacted at different moisture contents
and dry densities. A cylindrical sample of soil was prepared
and then enclosed in a pressurized chamber which subjected
the sample to compressive stresses in three mutually
79
perpendicular directions. The vertical compressive stress
was then increased in excess of the horizontal stresses
until eventually the sample failed in shear or strained to
such a point that excessive deformation could result.
3.7.1 General arrangement
The triaxial apparatus used in this project was manufactured
by Nanjin Company Ltd in China and is frequently found in
most commercial soil testing laboratories. The conventional
triaxial apparatus has been described in detail by Bishop
and Henkel (1962) in their standard text on triaxial testing
of soils.
The basic features of the conventional triaxial tests are
shown in Figure 3.3. The soil sample is a cylinder with
height about twice the diameter; the size used in this study
is 38 mm diameter. The sample is enclosed in a thin rubber
sleeve sealed to the top platen and to the base pedestal by
rubber O-rings. The sample sits on a pedestal at the central
axis of the apparatus. The cell was formed from a Perspex
cylinder surround by six tension bars, which spaced at an
angle of 60. Their purpose is to connect the base of the main pressure vessel to a top plate to which a load cell is
mounted. The pedestal sits on a column that passes through
the base of the pressure vessel into a rubber rolling
bellofram which seals the cell. Linear bearings placed
around the column allow free, low friction, vertical
movement whilst maintaining the centrality of the pedestal.
The base of the column passes through another bellofram seal
into a lower sealed pressure chamber. By controlling the
pressure in the lower axial pressure chamber it is possible
to control the stress transmitted to the sample in the upper
chamber. The internal load cell is fixed onto a metal rod
that passes through two O-ring seals. The rod then screws
internally into a thread ring which allows the internal load
cell to be raised or lowered. A ball seated at the upper
face of the top Perspex platen to allow the axial load to be
in contact with the sample by means of a plunger fitted in a
rotating bush in the top plate of the cell.
80
The apparatus is provided with two pressure control units
that vary the pressure in the cell and the pressure in the
axial ram applied to the sample. The input air pressure is
supplied by a centralized air compressor that can deliver a
maximum air pressure of 1000 kPa. The air/water interfaces
consist of sealed cylinders in which water is pressurized by
the air. Air pressure enters at the top of the cylinder
which then forces water out through a pipe at the base of
the cylinder.
In the base plate of the cell there are three different
valves. From the base pedestal a connection via a valve
connected the pore water pressure of the sample to a pore
water pressure measuring device, from the top Perspex platen
is a connection via a valve to a burette system to allow
drainage and volume change observations. A further valve is
connected to the base plate of the cell, allowing water in
the cell and surrounding the externally sealed sample to be
pressurized.
3.7.2 Instrumentation
The axial load is measured using a dial gauge fixed into a
proving ring supplied by Nanjin Company Limited in China.
Because the load indicator is mounted inside the cell the
deviator force measurements are not affected by the
frictional errors that external load indicators suffer. The
pressure of the cell water is measured by means of a Master
pressure gauge inserted directly into the base of the cell.
This Master gauge works in a pressure range from 0 to 1000
kPa. The axial strain is measured externally using a
resistive displacement dial gauge with a nominal stroke of
10 mm. As the sample deforms axially the dial gauge measures
the relative displacement between the top of the cell that
is firmly connected to the top of the sample and the axial
ram which acts at the base of the sample. The compliance of
the triaxial cell and measuring devices (displacement and
load) may cause significant errors in the measurements
taken.
81
3.7.3 Testing procedure
After compaction a sample tube of 38 mm in diameter and 76
mm in length was taken from the preparation tube. The
prepared sample was then accurately weighed to determine the
bulk density. Three small soil samples were used to measure
the sample moisture content. The sample was enclosed in a
thin rubber membrane in order to be effectively sealed from
interaction with water. The main function of the surrounding
membrane was to prevent moisture movement across it and any
potential moisture seepage between the membrane and the
upper platen and base pedestal was prevented by the champing
effect of two O-ring seals. The sample was then placed
inside a Perspex cell and seated on the base pedestal. The
top drainage leads were connected to the top cap and then
the outside of the cell was bolted into position. After
readings from the load cell and strain dial gauge indicators
were zeroed and the cell filled with water and a cell
pressure applied by pressurizing water the test started.
The sample was loaded axially through the reaction with a
ram bearing on the top cap as the cell was driven upwards by
a motor and gear box. The axial load applied on the sample
was shown by a proving ring fitted externally to the
pressurized cell. This load was recorded at predetermined
strain intervals and since this apparatus was not
instrumented so the measurements of the axial load and axial
strain were recorded manually. The test stopped when shear
failure of the sample occurred which indicated by a rapid
increasing in strain without any change in axial load or
when the recorded strain reached the probable failure strain
which is normally around twenty percent rate of strain.
This quick undrained compression test was performed at three
different cell pressures. No pore pressure measurements were
taken since the samples were unsaturated. This simple fairly
rapid compression test provided an easy and quick method for
determining a value of shear stress for the remoulded
samples.
82
3.8 ERRORS AND ACCURACY
The function of a measuring device is to sense change in its
physical environment such as load or displacement. The
measuring device must be capable of faithfully and
accurately detecting any changes that occur in the measured
quantity. To obtain the best performance from any instrument
it is very important to understand the principles by which
the instrument functions, its basic characteristics and the
errors which influence the measurement of the reading.
Without an understanding or appreciation of these factors
the reliability of the data obtained using such instruments
should be questioned. It is also important to understand the
relative magnitudes and hence importance of the various
factors influencing the behaviour of the measurement system.
3.8.1 Error
The algebraic difference between the measured value and the
true value is termed the error of the measurement. The error
of a measurement results from the combination of a number of
individual errors. By understanding how the individual
errors arise, corrections to the final data may be made
there by increasing the overall accuracy of the measurement.
The major causes of errors in the measurements are:
Interference (noise) – electrical, electromagnetic and
electrostatic pick-up in the measuring system which can
superimpose large variations in the output signal. It is
important to isolate the measuring system from any
external influences such as generators and shield the
components from interfering with each other.
Zero Drift – this represents a variation in the output with time under constant conditions input. It is caused
by changes in the ambient conditions of pressure and
temperature or aging of the electrical components. The
zero drift of the load or displacement indicators can be
assessed by comparing the variation between the readings
corresponding to the zero conditions at the beginning and
end of the test.
83
3.8.2 Accuracy and Precision
The accuracy of a measurement can be defined as the
closeness with which the reading approaches an accepted
standard value. Accuracy is a relative term influenced by
static error, drift, reproducibility and non-linearity. In
any experiment the accuracy is numerically equal to the
referred error value, i.e. the degree of error in the final
result. The accuracy is determined by calibrating under
certain operation conditions and is expressed as a
percentage at a certain point of the scale. For a complete
system the accuracy is dependent upon the individual
accuracy of the sensing element and the manipulating device.
The overall accuracy can be determined by summing up the
accuracy limits of the individual components i.e. if a1, a2 and a3 are the accuracy limits then overall accuracy (A) is expressed as A = (a1 + a2 + a3). In practice it is not probable that all the elements of the system will have the
greatest static error at the same time so to account for
this the root mean square accuracy is often specified, this
is express as A = (a12 + a22 + a32).
The precision of an instrument is the closeness with which
individual measurements are distributed about their mean
value. It is a measure of the scatter of the set of readings
among themselves. It includes the uncertainty in the reading
due to random errors, however it gives no information
relating to accuracy. The precision of an instrument is
found by calculating the mean value of the scatter of the
individual measurements.
3.8.3 Linearity
To enable more accurate data gathering and reduction most
measuring devices are designed to produce a linear
relationship between the input and output. The closeness of
a calibration curve to a specified straight line is known as
the linearity of the measuring device. The linearity of the
instrument is expressed as the maximum deviation of the
output curve from the best-fit straight line; the value of
linearity is given as a percentage of the full scale. In
order to avoid misleading statements the range to which the
linearity refers to should be stated.
84
CHAPTER FOUR
RESULTS AND ANALYSIS
4.1 INTRODUCTION
Presented in this chapter is the results and analysis of the
experimental work. The results of the tests carried out
during the research project are analysed. Some data reported
by previous investigators which related to the objective of
the research will also be analysed.
In the first section, The results of the preliminary tests
such as index testing and compaction tests are described.
The main results are then presented as follows: for each
type of testing, the results and their analysis are shown.
Summaries of the experimental results are given in Tables
4.1 to 4.9.
The analysis of results will be carried out and presented in
this chapter. As the main objective of this project is to
study the swelling behaviour and strength characteristics of
compacted soils in order to develop a new factor concept.
Therefore the results from the experimental work and those
reported by previous researchers are analysed and used to
develop this concept.
4.2 PRELIMINARY TESTS RESULTS
The preliminary tests performed in this project were index
tests, clay content, specific gravity determination and
compaction. These tests provided standard data for the soil
which could be used in subsequent analysis. The preliminary
tests were aimed to classify the soils within the existing
standard methods and quantify their properties. The clay
content and specific gravity were determined as presented in
Table 4.1.
85
4.2.1 Index tests
These tests provide a measurement of the liquid limit and
plastic limit. The methods used for testing are the British
standard specifications for the determination of the Liquid
Limit and Plastic Limit. As discussed in Section 2.3.1 the
index tests, although based on simple empirical tests, can
be correlated with more fundamental properties such as shear
stress (Skempton and Northey (1953)) and compressibility
(Wroth and Wood (1978)). Previous research in to the use of
index tests (Sherwood (1970)) has shown that these tests are
subjected to variability. Sherwood (1970) sent samples of
the same soil to different laboratories for the
determination of the liquid limit. The imprecision in the
results were attributed to defects in the apparatus such as
damaged cones as well as operator induced errors. Since in
this research later analysis would use the index tests to
develop empirical equations, the liquid limit and plastic
limit were performed using carefully checked apparatus and
different but experienced operators.
The liquid limit determined the water content at which the
soil had weakened so much that it started to flow like a
liquid. On the other hand, the plastic limit determined the
water content at which the soil had became so brittle that
it crumbled. The index tests results are given in Table 4.1.
4.2.2 Compaction tests
These tests were performed to study the moisture content/dry
density behaviour of samples compacted at two different
compactive efforts. The experimental results of compaction
tests are listed in Table 4.2 and indicated in Figure 4.1.
The curves produced give a measure of the variation of the
achievable dry density for the light and heavy compactive
efforts as the moisture content of the soil changes. Studies
into the compaction of soils using different compactive
efforts (Parsons (1992)) indicate that the maximum
achievable dry density as determined by the heavy (modified)
compaction test is higher than that determined by the
standard compaction test, this is demonstrated by the
compaction curves of the soil used in the experiments.
86
The method of compaction used in the preparation of the
samples for the swelling and triaxial tests differed from
the Standard Proctor compaction method (Section 3.3). These
samples were prepared by static compaction methods which can
easily be compacted and may have higher densities than
similar samples which have been compacted by dynamic
compaction.
4.3 MAIN TESTS RESULTS
The main laboratory tests of this research project include
the swelling, CBR and triaxial tests. These tests were
carried out using in a variety of apparatus. In excess of
104 individual tests were performed under different
conditions of initial water content and dry density. The
results of different types of tests are fully described in
the following sections.
4.3.1 Swelling tests
The experiments performed in a conventional oedometer cell
were to measure the swell percent and the swelling pressure
of compacted samples. Radial movement was prevented by the
presence of the stiff oedometer ring and axial movement was
allowed against a surcharge load positioned on a weight
hanger.
Thirty nine tests were performed for measuring the swell
percent of samples compacted at a wider range of water
content and various dry densities and tested under three
different surcharge pressures (7kPa, 25kPa and 50kPa). When
the oedometer cell was flooded with water there was a rapid
increase in the dial gauge reading as the soil absorbed
water and started to expand against the top platen of the
cell. Because the sample was prevented by a stiff proving
ring from expanding radially, only axial strains were
allowed. During the testing period, it was observed that
most of the swelling took place within the first day hours,
but in some tests the swelling increased to a peak value
after two days of testing. This is probably due to the fact
that, the rate of water absorption in dense soils being
slower than that in loose soils. The measured swell percent
87
of the soil observed to be influenced by the initial dry
density and water content as well as the surcharge load
under which the sample was tested. As the surcharge load was
increased the resulting amount of swell percent was reduced.
The highest swelling values were observed in samples that
compacted at lower water contents and higher dry densities
and tested under light surcharge loads. The experimental
results of the swell percent measured at different pressures
and the initial state of the tested samples (i.e. water
content, dry density, void ratio and swell percent) are
given in Tables 4.3 to 4.5.
The oedometer cell was also used to measure the swelling
pressure of the compacted soil samples. The test samples
were compacted at different initial water contents and dry
densities. The sample was initially allowed to swell under a
seating pressure of 1 psi and after reaching a peak swelling
value, it was then compressed by adding weights. The weights
were added each day by a certain amount as described in
Section 3.5.2.2. By increasing the weights sufficiently it
was possible to retain back to the started dial gauge
reading. The pressure compressed the expanded sample to its
original volume was considered as the swelling pressure. It
was observed that both the initial water content and dry
density of the soil sample influenced the amount of swelling
pressure: low initial water contents and high dry densities
have greater swelling pressure values than drier denser
soils. The test results of these experiments are presented
in Table 4.6.
4.3.2 CBR tests
These tests were aimed to give a useful indication of the
soil strength at different testing conditions. The tests in
this project were performed on remoulded as well as soaked
samples in accordance with BS 1377 part 110. In the first
series of tests samples which prepared at different water
contents and dry densities were directly subjected to CBR
penetration test. The soil was compressed by axial load
which applied at a constant rate to penetrate the plunger
into the soil. The measured penetration force found to be
influenced by the soil initial state (water content and dry
88
density). For all samples tested the highest penetration
forces were measured in samples prepared at high dry
densities and low water contents. As the dry density was
decreased and water content increased the resulting amount
of force was reduced. This demonstrate that samples with
lower water contents and compacted to higher densities have
high CBR values (Section 2.6.1). The results from these
tests are listed in Table 4.7.
The second series of experiments were performed on samples
which prepared at different water contents and dry densities
but subjected to soaking prior to penetration testing. The
measured soaked CBR values of the samples as shown in Table
4.8 were clearly seen to be much less than those measured
unsoaked CBR. The reduction in the CBR value can be
attributed to the softening of the soil in the soaking
process. That is, as the soil became wetter a general
softening of the sample occurred and the ability of the
sample to resist the penetration of the plunger tended to be
very low.
4.3.3 Triaxial compression test
This test was used to measure the shear stress of compacted
samples. The sample was compressed to vertical stress
increased at a constant rate while maintaining the side cell
pressure constant. The test results for soil samples when
subjected to undrained compression are given in Tables 4.9
to 4.11. It was seen that after approximately 20% axial
strain the peak shear stress was reached and a rupture plane
formed in the sample. An analysis of the failure plane
revealed that its surface was not smooth but had some
undulations, possibly a remnant of the clods of soil that
had not been totally remolded during compaction.
4.4 ANALYSIS OF SWELLING RESULTS
In this section analysis of swelling results is presented.
It will cover the analysis of swell percent and swelling
pressure data which obtained from the experiments carried
out in this project and others reported by investigators.
Based on the empirical results a factor, which is formed by
89
a combination of easy measured soil parameters, will be
developed. A linear relationship of this factor with the
swell percent as well as the swelling pressure is
investigated. By the analysis of the experimental swelling
data this relationship will be verified.
4.4.1 Development of the initial state factor
When performing laboratory experiments on compacted
expansive soils it is difficult to control and measure the
swell percent and swelling pressure without using sensitive
and well-controlled apparatus and following restrictedly the
standard procedures of testing. So in order to by-pass this
problem, an alternative indirect method to assist in
measuring the swelling was considered. The basic idea
consisted of trying to relate both the swell percent and
swelling pressure of compacted soils to a factor which is
formed by a combination of easy measured soil parameters
such as dry density, water content and void ratio and is
termed the soil initial state factor. The soil parameters
are combined in such a way to reflect the influence of each
of them in the measured swelling (swell percent and swelling
pressure). The factor can be applied for soils tested as
compacted or undisturbed and is formed of initial state soil
parameters such as water content, dry density and void ratio
and is termed as the initial state factor.
4.4.1.1 Definition of the factor
The initial state factor of compacted expansive soil is
defined as a combination of the soil initial state
parameters such as dry density, water content and void ratio
and can be expressed thus:
1.41
eF d
i
Where:
d is the initial dry density of soil
is the density of water
90
is the initial water content
e is the initial void ratio.
In fact, among these variables e is supernumerary since it
dependents on dry density according to the following
relationship:
2.41d
sGe
Where sG is the specific gravity of soil.
4.4.1.2 Derivation of the factor
This factor was empirically formulated on the basis of the
following reasons:
The results of swell percent data reported by Chen (1975)
Figure 2.14 and Kassif et al (1965) Figure 2.15 clearly
indicate that a linear relationship can be drawn between
the swell percent and the initial dry density of the
samples of the same soil, having the same moisture
content and subjected to the same surcharge pressure.
Hence, the swell percent (S) can be assumed to be
directly proportional to the dry density (d) i.e.
3.4tan; tconsisS d
The results of swell percent data reported by Zein (1985)
Figure 2.17 and Chen (1975) Figure 2.18 suggest that an
inverse linear relationship exists between the swell
percent and the moisture content of the samples of the
same soil, having the same dry density and subjected to
the same surcharge pressure. Empirical examination of
these results, however, suggests that an equally good fit
can be obtained by assuming a hyperbolic relationship
instead of an inverse linear one. Hence, it can be
assumed that the swell percent (S) is inversely
proportional to the initial moisture content() i.e.
4.4tan;1
tconsisS d
91
As reported by Brackley (1975) and shown in Figure 2.21
that at a constant water content the swell percent
increases with decreasing in void ratio. As can be seen
from Figure 2.21, an inverse linear relationship exists
between the swell percent and the void ratio of the
samples of the same moisture content. So it can be
assumed that the swell percent (S) is inversely
proportional to the void ratio (e) i.e.
5.4tan;1
tconsiswe
S
Hence from the above equations and using
d instead of d
to make the term dimensionless results in:
6.41
eS d
From the above equation it can be concluded that the swell
percent (S) is directly proportional to the initial state
factor (Fi). This relationship can be expressed as:
7.4iFS
4.4.2 Swell percent and factor Fi relationship
This section analyses the swell percent results in order to
investigate its relationship with the developed initial
state factor. The dependence of the swell percent on
surcharge pressure, soil plasticity and clay content will be
studied to develop an empirical equation.
As previously verified that a direct linear proportional
relationship exists between the swell percent (S) and the
developed initial state factor (Fi) as indicated by equation
4.7. Hence, this relationship can be assumed as a linear
relationship and expressed thus:
8.4bFaS i
Where a and b are constants of the linear equation.
92
To investigate the validity of this linear relationship
between the swell percent and the developed factor Fi, the
results obtained in this study and others reported by
previous investigators were analysed. These results were for
undisturbed and compacted soils of different origins.
Different methods of compaction, testing procedures and
applied surcharge pressures had been used by the
investigators are listed in Table 4.12(a).
The plots of swell percent versus initial state factor for
these soils are shown in Figures 4.2 to 4.15. The straight
line shown in each of the plots is the linear regression of
the swell percent to the factor. In each of Figures 4.2 to
4.15, the data from which the values of the swell percent
(S) and the factor (Fi) were obtained are given on the right
hand side of the figure. For each of the data analysed the
magnitude of the correlation coefficient (R) which indicates
the degree of closeness of the linear relationship between
the swell percent and the factor is given in Table 4.12(a).
The plots in Figures 4.2 to 4.15 have clearly demonstrated
that a direct linear relationship exists between the swell
percent and the factor for all the data analysed. The
magnitude of the correlation coefficient (R) as presented in
Table 4.12(a) is in the range 0.80 to 0.99 which indicates a
very strong linear relationship between swell percent and
initial state factor. This linear relationship can be
expressed as:
9.4)( 0FFMS i
Where:
S is the swell percent
iF is the initial state factor
0F is the value of F at which no swelling occurs
M is the gradient of the straight line.
93
The values of the constants Fo and M for each of the plots
in Figures 4.2 to 4.15 are listed in Table 4.12(a) and
collectively illustrated in Figures 4.16 to 4.19. As can be
seen, differences in soils’ composition, surcharge pressures and methods of testing result in different Fo and M values.
The results of the studied samples as shown in Figure 4.17
and Table 4.12(a) suggest that, as the surcharge pressure
increases from 7 to 50 kPa, the value of M decreases from
0.90 to 0.53 and the value of Fo increases from 1.72 to
3.73. This confirms with the results of Yevnin and Zaslavsky
(1970) as shown in Figure 4.18 and listed in Table 4.12(a).
From Figure 4.19 and Table 4.12(a), it can be noticed that,
although the soils were tested under similar surcharge
pressures, the differences in soil types (i.e. different
composition or expansiveness) and methods of testing seem to
result in different Fo and M values. It can, however, be
noticed from Figure 4.19, the soils have relatively high
clay contents, liquid limits and plastic limit (such as
soils(5)&(12)) seem to have higher M and lower Fo values
than soils have relatively low clay contents, liquid limits
and plastic limits (such as soil(13)). For expansive soils,
as indicated in Section (2.3.1), the higher the clay
content, liquid limit and plastic limit the higher the
expansiveness of the soil. It can be said from Figure 4.19
that the increase in soil expansiveness increases the value
of M and decreases the value of Fo.
The values of Fo and M as listed in Table 4.12(a) and the
plasticity index (PI) and clay content (C) were normalised
with respect to the surcharge pressure (P). The results of
this are shown in Figures 4.20 and 4.21. A power regression
has been used to provide best fit lines. When normalising
the Fo values as plotted in Figure 4.20, the equations of
the best fit lines are given by:
10.4165.0100
58.00
P
PILog
P
FLog
11.4063.0100
56.00
P
CLog
P
FLog
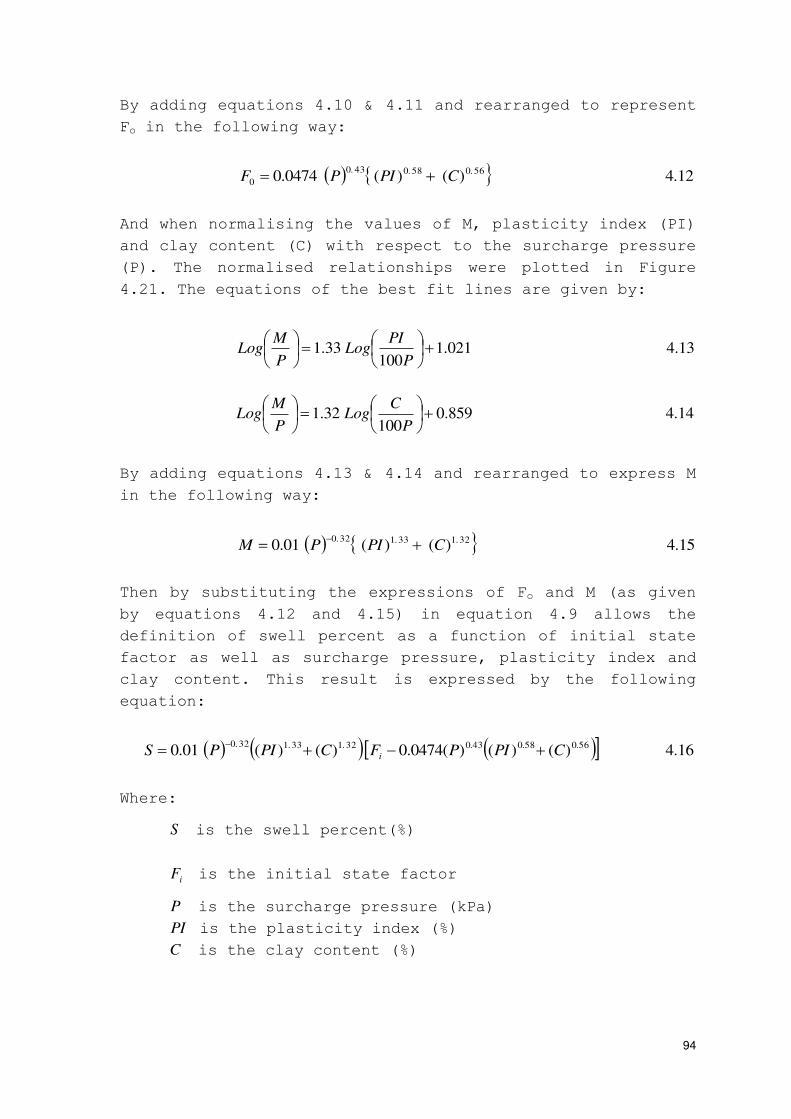
94
By adding equations 4.10 & 4.11 and rearranged to represent
Fo in the following way:
12.4)()(0474.056.058.043.0
0 CPIPF
And when normalising the values of M, plasticity index (PI)
and clay content (C) with respect to the surcharge pressure
(P). The normalised relationships were plotted in Figure
4.21. The equations of the best fit lines are given by:
13.4021.1100
33.1
P
PILog
P
MLog
14.4859.0100
32.1
P
CLog
P
MLog
By adding equations 4.13 & 4.14 and rearranged to express M
in the following way:
15.4)()(01.032.133.132.0
CPIPM
Then by substituting the expressions of Fo and M (as given
by equations 4.12 and 4.15) in equation 4.9 allows the
definition of swell percent as a function of initial state
factor as well as surcharge pressure, plasticity index and
clay content. This result is expressed by the following
equation:
16.4)()()(0474.0)()(01.056.058.043.032.133.132.0
CPIPFCPIPS i
Where:
S is the swell percent(%)
iF is the initial state factor
P is the surcharge pressure (kPa)
PI is the plasticity index (%)
C is the clay content (%)
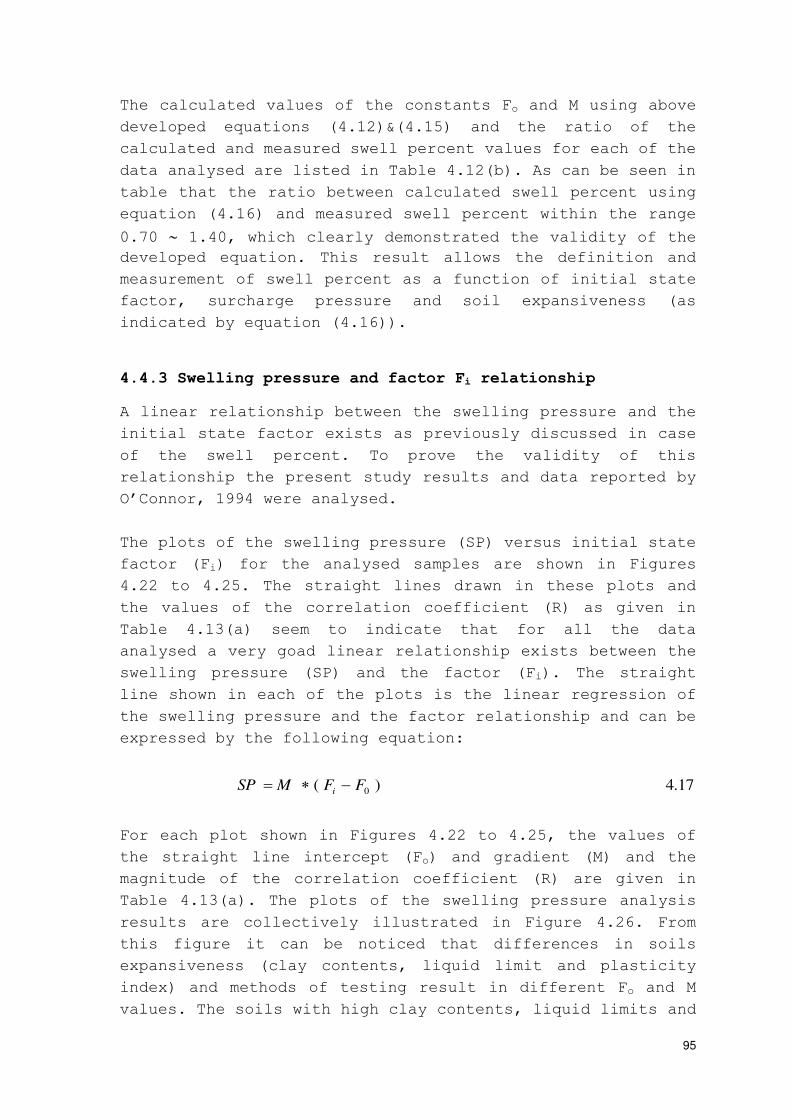
95
The calculated values of the constants Fo and M using above
developed equations (4.12)&(4.15) and the ratio of the
calculated and measured swell percent values for each of the
data analysed are listed in Table 4.12(b). As can be seen in
table that the ratio between calculated swell percent using
equation (4.16) and measured swell percent within the range
0.70 1.40, which clearly demonstrated the validity of the developed equation. This result allows the definition and
measurement of swell percent as a function of initial state
factor, surcharge pressure and soil expansiveness (as
indicated by equation (4.16)).
4.4.3 Swelling pressure and factor Fi relationship
A linear relationship between the swelling pressure and the
initial state factor exists as previously discussed in case
of the swell percent. To prove the validity of this
relationship the present study results and data reported by
O’Connor, 1994 were analysed.
The plots of the swelling pressure (SP) versus initial state
factor (Fi) for the analysed samples are shown in Figures
4.22 to 4.25. The straight lines drawn in these plots and
the values of the correlation coefficient (R) as given in
Table 4.13(a) seem to indicate that for all the data
analysed a very goad linear relationship exists between the
swelling pressure (SP) and the factor (Fi). The straight
line shown in each of the plots is the linear regression of
the swelling pressure and the factor relationship and can be
expressed by the following equation:
17.4)( 0FFMSP i
For each plot shown in Figures 4.22 to 4.25, the values of
the straight line intercept (Fo) and gradient (M) and the
magnitude of the correlation coefficient (R) are given in
Table 4.13(a). The plots of the swelling pressure analysis
results are collectively illustrated in Figure 4.26. From
this figure it can be noticed that differences in soils
expansiveness (clay contents, liquid limit and plasticity
index) and methods of testing result in different Fo and M
values. The soils with high clay contents, liquid limits and
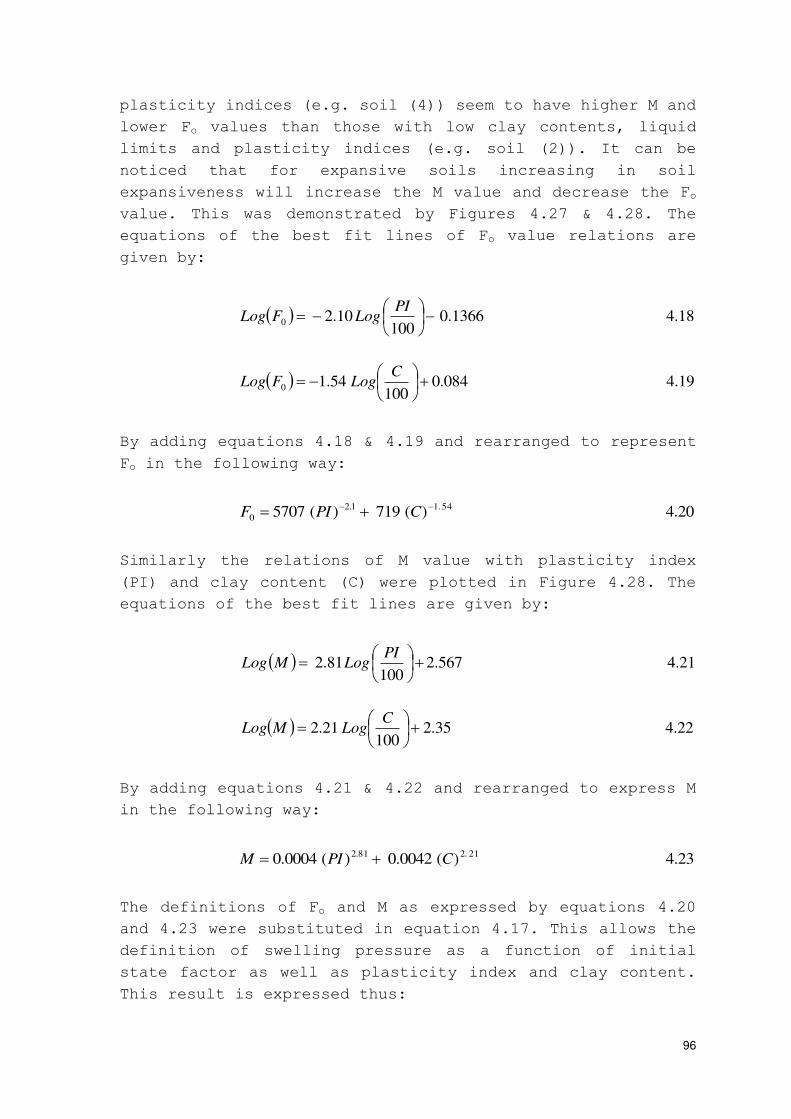
96
plasticity indices (e.g. soil (4)) seem to have higher M and
lower Fo values than those with low clay contents, liquid
limits and plasticity indices (e.g. soil (2)). It can be
noticed that for expansive soils increasing in soil
expansiveness will increase the M value and decrease the Fo
value. This was demonstrated by Figures 4.27 & 4.28. The
equations of the best fit lines of Fo value relations are
given by:
18.41366.0100
10.20
PILogFLog
19.4084.0100
54.10
CLogFLog
By adding equations 4.18 & 4.19 and rearranged to represent
Fo in the following way:
20.4)(719)(570754.11.2
0
CPIF
Similarly the relations of M value with plasticity index
(PI) and clay content (C) were plotted in Figure 4.28. The
equations of the best fit lines are given by:
21.4567.2100
81.2
PILogMLog
22.435.2100
21.2
CLogMLog
By adding equations 4.21 & 4.22 and rearranged to express M
in the following way:
23.4)(0042.0)(0004.021.281.2
CPIM
The definitions of Fo and M as expressed by equations 4.20
and 4.23 were substituted in equation 4.17. This allows the
definition of swelling pressure as a function of initial
state factor as well as plasticity index and clay content.
This result is expressed thus:
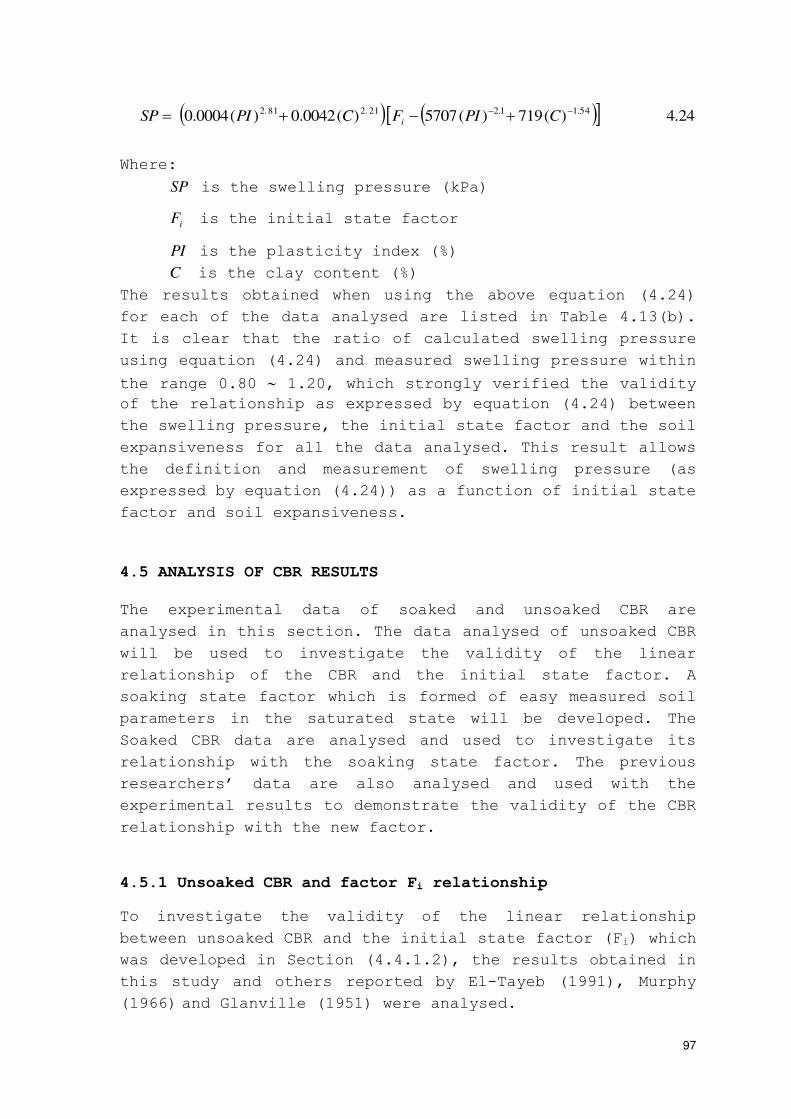
97
24.4)(719)(5707)(0042.0)(0004.054.11.221.281.2 CPIFCPISP i
Where:
SP is the swelling pressure (kPa)
iF is the initial state factor
PI is the plasticity index (%)
C is the clay content (%)
The results obtained when using the above equation (4.24)
for each of the data analysed are listed in Table 4.13(b).
It is clear that the ratio of calculated swelling pressure
using equation (4.24) and measured swelling pressure within
the range 0.80 1.20, which strongly verified the validity of the relationship as expressed by equation (4.24) between
the swelling pressure, the initial state factor and the soil
expansiveness for all the data analysed. This result allows
the definition and measurement of swelling pressure (as
expressed by equation (4.24)) as a function of initial state
factor and soil expansiveness.
4.5 ANALYSIS OF CBR RESULTS
The experimental data of soaked and unsoaked CBR are
analysed in this section. The data analysed of unsoaked CBR
will be used to investigate the validity of the linear
relationship of the CBR and the initial state factor. A
soaking state factor which is formed of easy measured soil
parameters in the saturated state will be developed. The
Soaked CBR data are analysed and used to investigate its
relationship with the soaking state factor. The previous
researchers’ data are also analysed and used with the experimental results to demonstrate the validity of the CBR
relationship with the new factor.
4.5.1 Unsoaked CBR and factor Fi relationship
To investigate the validity of the linear relationship
between unsoaked CBR and the initial state factor (Fi) which
was developed in Section (4.4.1.2), the results obtained in
this study and others reported by El-Tayeb (1991), Murphy
(1966) and Glanville (1951) were analysed.
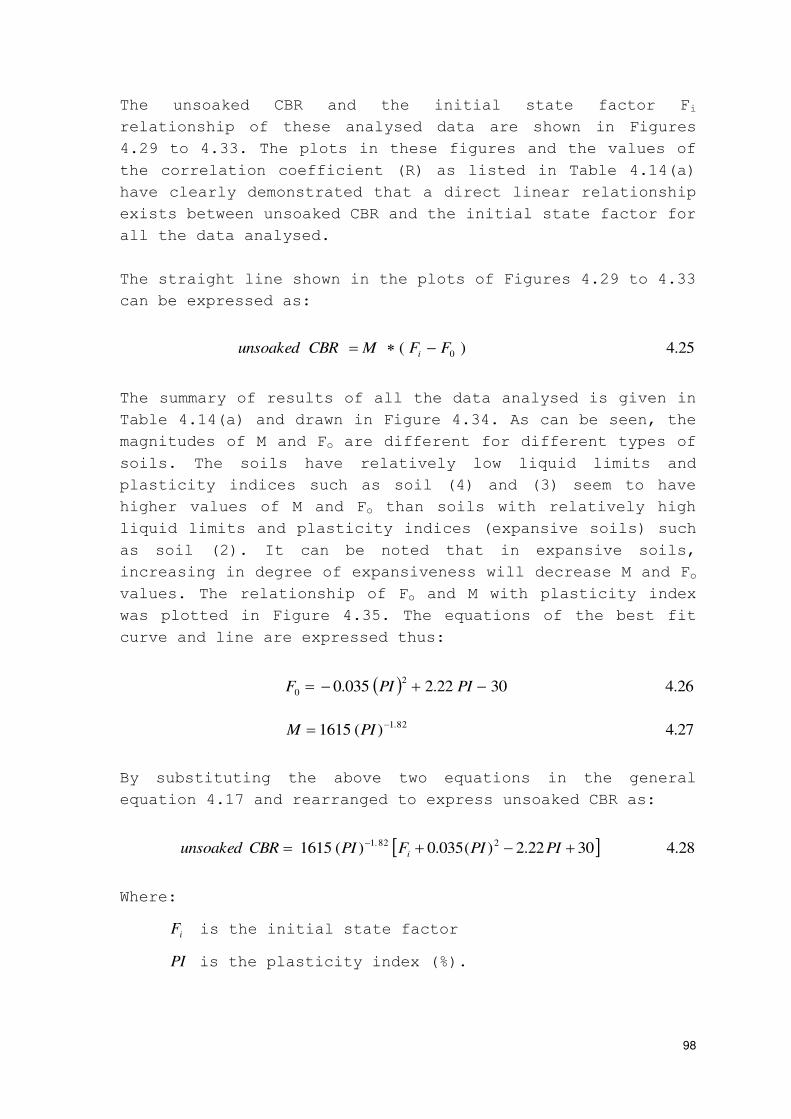
98
The unsoaked CBR and the initial state factor Fi
relationship of these analysed data are shown in Figures
4.29 to 4.33. The plots in these figures and the values of
the correlation coefficient (R) as listed in Table 4.14(a)
have clearly demonstrated that a direct linear relationship
exists between unsoaked CBR and the initial state factor for
all the data analysed.
The straight line shown in the plots of Figures 4.29 to 4.33
can be expressed as:
25.4)( 0FFMCBRunsoaked i
The summary of results of all the data analysed is given in
Table 4.14(a) and drawn in Figure 4.34. As can be seen, the
magnitudes of M and Fo are different for different types of
soils. The soils have relatively low liquid limits and
plasticity indices such as soil (4) and (3) seem to have
higher values of M and Fo than soils with relatively high
liquid limits and plasticity indices (expansive soils) such
as soil (2). It can be noted that in expansive soils,
increasing in degree of expansiveness will decrease M and Fo
values. The relationship of Fo and M with plasticity index
was plotted in Figure 4.35. The equations of the best fit
curve and line are expressed thus:
26.43022.2035.02
0 PIPIF
27.4)(161582.1 PIM
By substituting the above two equations in the general
equation 4.17 and rearranged to express unsoaked CBR as:
28.43022.2)(035.0)(1615282.1
PIPIFPICBRunsoaked i
Where:
iF is the initial state factor
PI is the plasticity index (%).
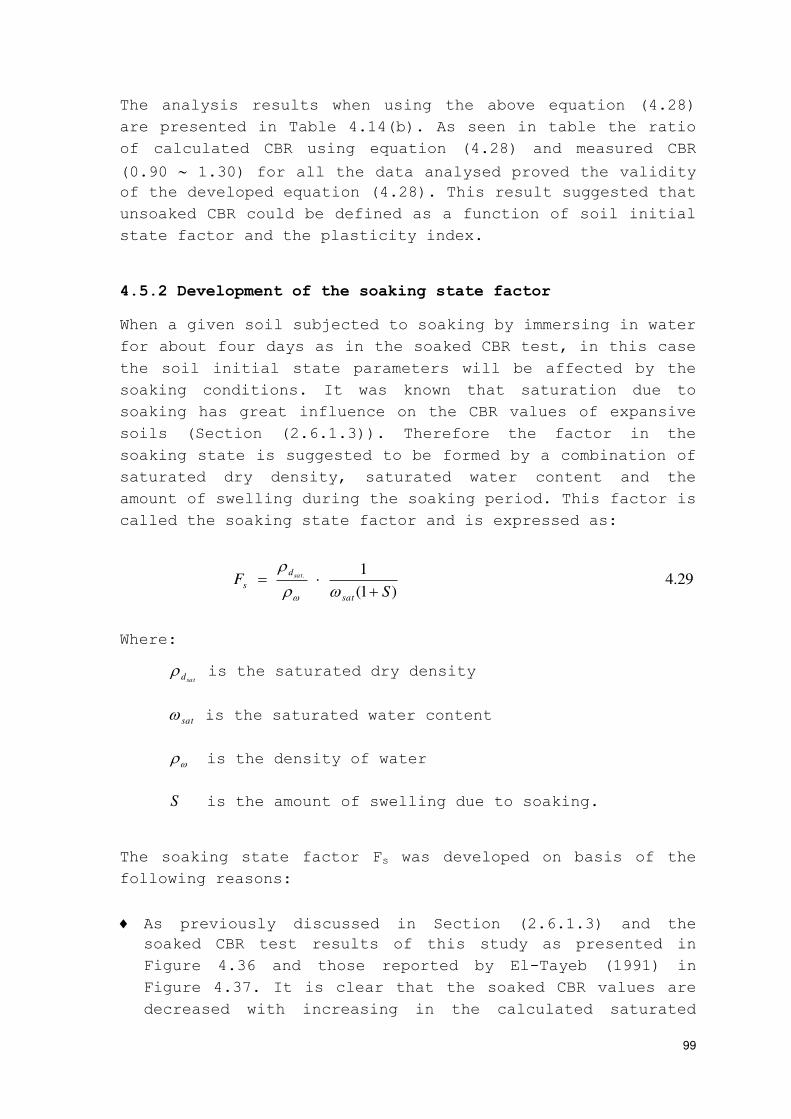
99
The analysis results when using the above equation (4.28)
are presented in Table 4.14(b). As seen in table the ratio
of calculated CBR using equation (4.28) and measured CBR
(0.90 1.30) for all the data analysed proved the validity of the developed equation (4.28). This result suggested that
unsoaked CBR could be defined as a function of soil initial
state factor and the plasticity index.
4.5.2 Development of the soaking state factor
When a given soil subjected to soaking by immersing in water
for about four days as in the soaked CBR test, in this case
the soil initial state parameters will be affected by the
soaking conditions. It was known that saturation due to
soaking has great influence on the CBR values of expansive
soils (Section (2.6.1.3)). Therefore the factor in the
soaking state is suggested to be formed by a combination of
saturated dry density, saturated water content and the
amount of swelling during the soaking period. This factor is
called the soaking state factor and is expressed as:
29.4)1(
1.
SF
sat
d
s
sat
Where:
satd is the saturated dry density
sat is the saturated water content
is the density of water
S is the amount of swelling due to soaking.
The soaking state factor Fs was developed on basis of the
following reasons:
As previously discussed in Section (2.6.1.3) and the
soaked CBR test results of this study as presented in
Figure 4.36 and those reported by El-Tayeb (1991) in
Figure 4.37. It is clear that the soaked CBR values are
decreased with increasing in the calculated saturated
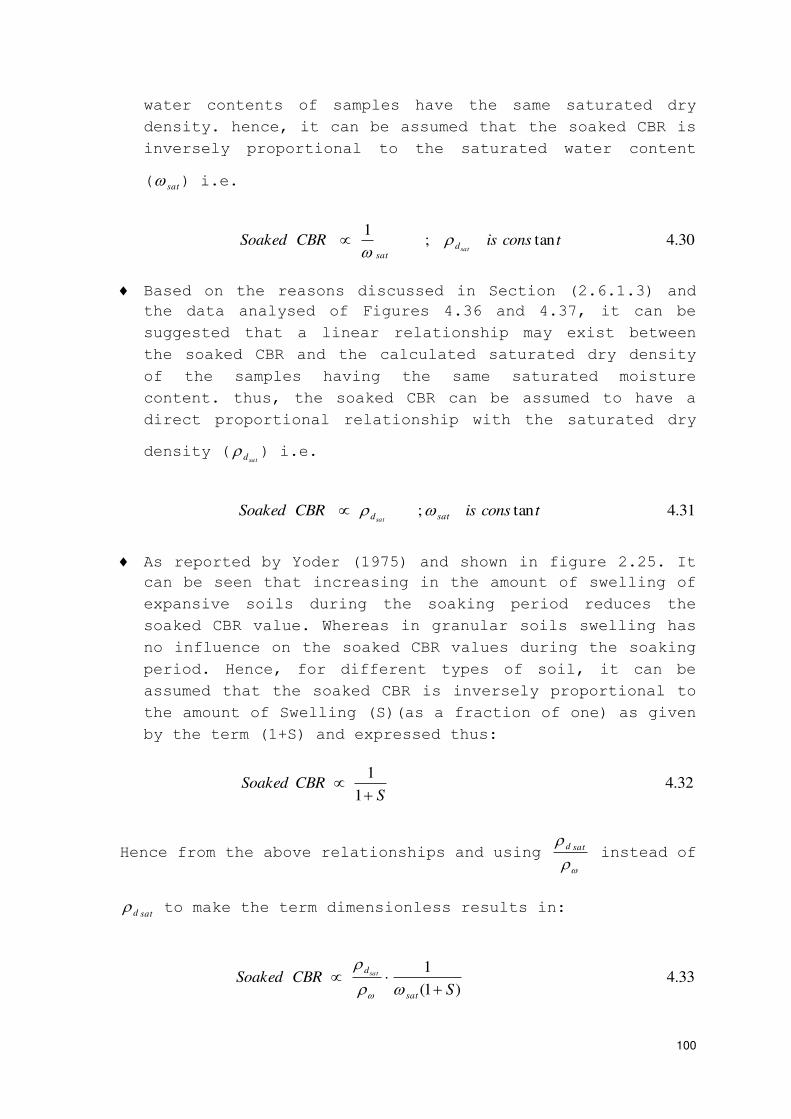
100
water contents of samples have the same saturated dry
density. hence, it can be assumed that the soaked CBR is
inversely proportional to the saturated water content
( sat ) i.e.
30.4tan;1
tconsisCBRSoakedsatd
sat
Based on the reasons discussed in Section (2.6.1.3) and
the data analysed of Figures 4.36 and 4.37, it can be
suggested that a linear relationship may exist between
the soaked CBR and the calculated saturated dry density
of the samples having the same saturated moisture
content. thus, the soaked CBR can be assumed to have a
direct proportional relationship with the saturated dry
density (satd ) i.e.
31.4tan; tconsisCBRSoaked satdsat
As reported by Yoder (1975) and shown in figure 2.25. It
can be seen that increasing in the amount of swelling of
expansive soils during the soaking period reduces the
soaked CBR value. Whereas in granular soils swelling has
no influence on the soaked CBR values during the soaking
period. Hence, for different types of soil, it can be
assumed that the soaked CBR is inversely proportional to
the amount of Swelling (S)(as a fraction of one) as given
by the term (1+S) and expressed thus:
32.41
1
SCBRSoaked
Hence from the above relationships and using
satd instead of
satd to make the term dimensionless results in:
33.4)1(
1
SCBRSoaked
sat
dsat
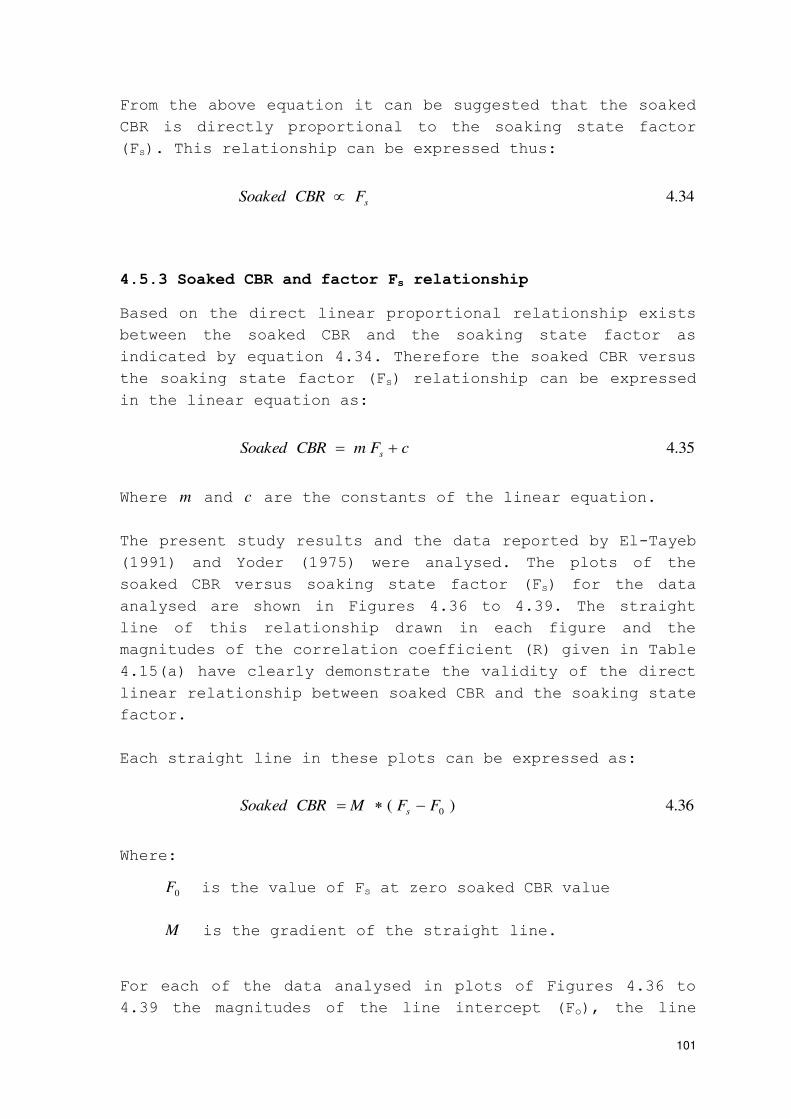
101
From the above equation it can be suggested that the soaked
CBR is directly proportional to the soaking state factor
(Fs). This relationship can be expressed thus:
34.4sFCBRSoaked
4.5.3 Soaked CBR and factor Fs relationship
Based on the direct linear proportional relationship exists
between the soaked CBR and the soaking state factor as
indicated by equation 4.34. Therefore the soaked CBR versus
the soaking state factor (Fs) relationship can be expressed
in the linear equation as:
35.4cFmCBRSoaked s
Where m and c are the constants of the linear equation.
The present study results and the data reported by El-Tayeb
(1991) and Yoder (1975) were analysed. The plots of the
soaked CBR versus soaking state factor (Fs) for the data
analysed are shown in Figures 4.36 to 4.39. The straight
line of this relationship drawn in each figure and the
magnitudes of the correlation coefficient (R) given in Table
4.15(a) have clearly demonstrate the validity of the direct
linear relationship between soaked CBR and the soaking state
factor.
Each straight line in these plots can be expressed as:
36.4)( 0FFMCBRSoaked s
Where:
0F is the value of Fs at zero soaked CBR value
M is the gradient of the straight line.
For each of the data analysed in plots of Figures 4.36 to
4.39 the magnitudes of the line intercept (Fo), the line
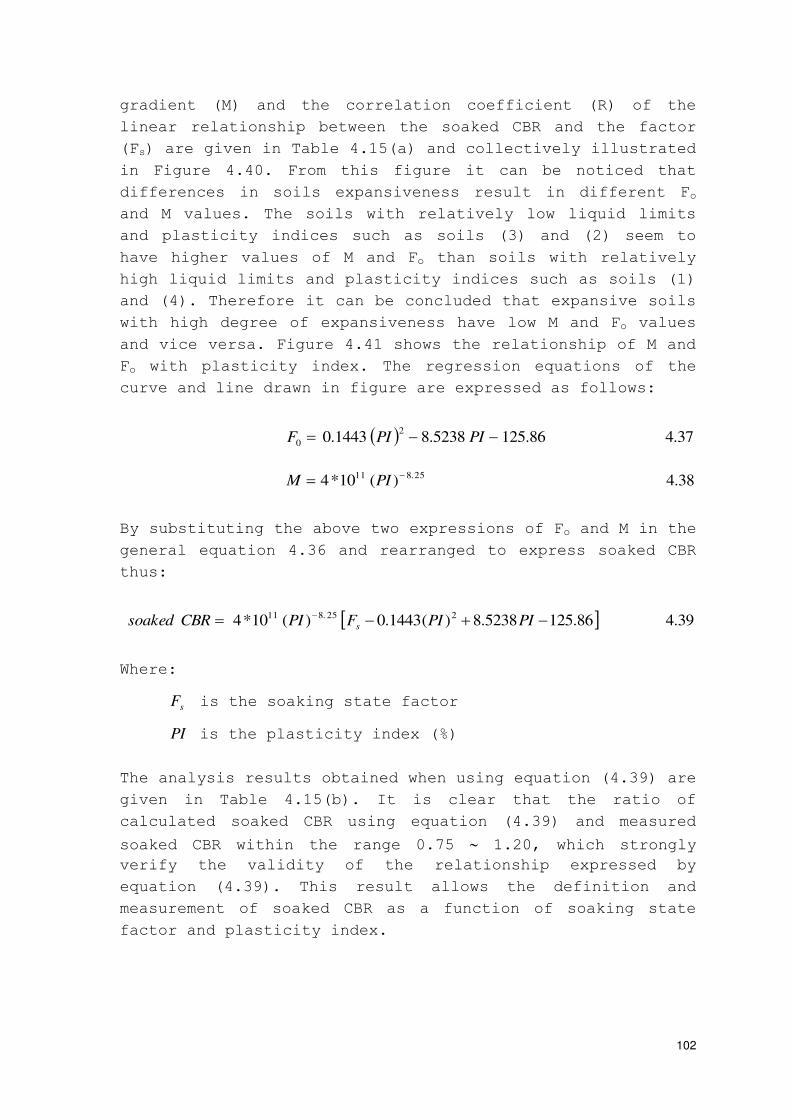
102
gradient (M) and the correlation coefficient (R) of the
linear relationship between the soaked CBR and the factor
(Fs) are given in Table 4.15(a) and collectively illustrated
in Figure 4.40. From this figure it can be noticed that
differences in soils expansiveness result in different Fo
and M values. The soils with relatively low liquid limits
and plasticity indices such as soils (3) and (2) seem to
have higher values of M and Fo than soils with relatively
high liquid limits and plasticity indices such as soils (1)
and (4). Therefore it can be concluded that expansive soils
with high degree of expansiveness have low M and Fo values
and vice versa. Figure 4.41 shows the relationship of M and
Fo with plasticity index. The regression equations of the
curve and line drawn in figure are expressed as follows:
37.486.1255238.81443.02
0 PIPIF
38.4)(10*425.811 PIM
By substituting the above two expressions of Fo and M in the
general equation 4.36 and rearranged to express soaked CBR
thus:
39.486.1255238.8)(1443.0)(10*4225.811
PIPIFPICBRsoaked s
Where:
sF is the soaking state factor
PI is the plasticity index (%)
The analysis results obtained when using equation (4.39) are
given in Table 4.15(b). It is clear that the ratio of
calculated soaked CBR using equation (4.39) and measured
soaked CBR within the range 0.75 1.20, which strongly
verify the validity of the relationship expressed by
equation (4.39). This result allows the definition and
measurement of soaked CBR as a function of soaking state
factor and plasticity index.
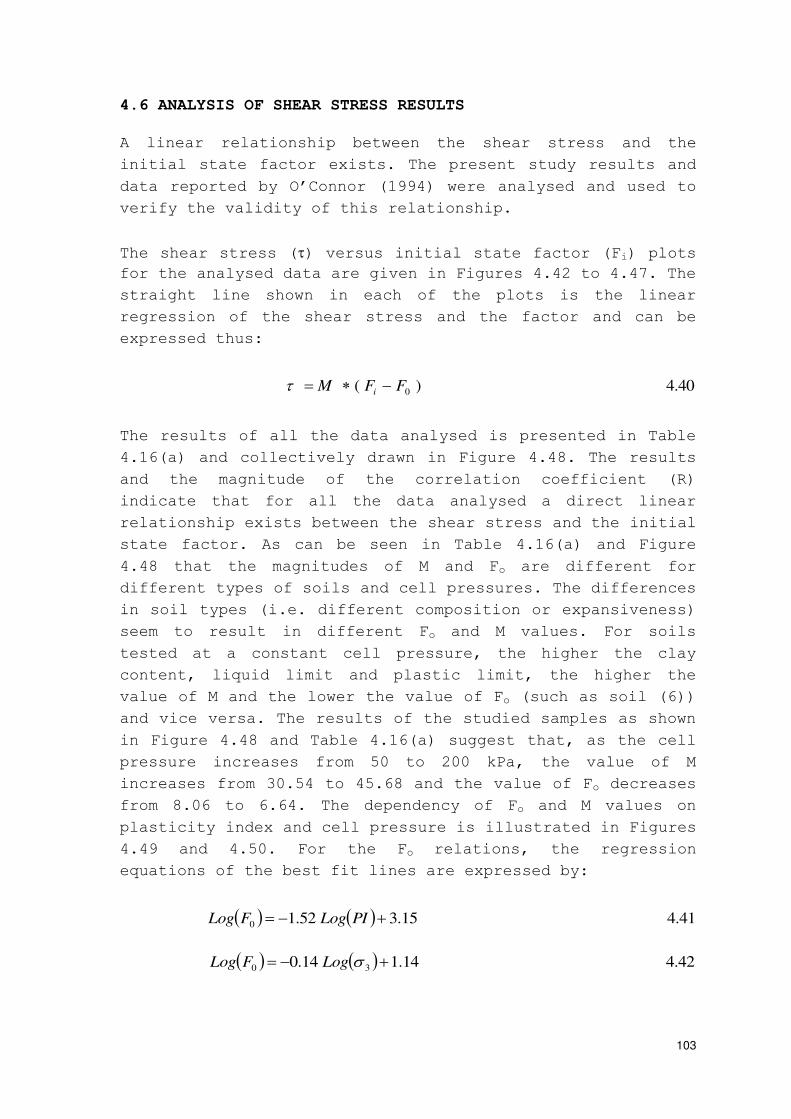
103
4.6 ANALYSIS OF SHEAR STRESS RESULTS
A linear relationship between the shear stress and the
initial state factor exists. The present study results and
data reported by O’Connor (1994) were analysed and used to verify the validity of this relationship.
The shear stress () versus initial state factor (Fi) plots for the analysed data are given in Figures 4.42 to 4.47. The
straight line shown in each of the plots is the linear
regression of the shear stress and the factor and can be
expressed thus:
40.4)( 0FFM i
The results of all the data analysed is presented in Table
4.16(a) and collectively drawn in Figure 4.48. The results
and the magnitude of the correlation coefficient (R)
indicate that for all the data analysed a direct linear
relationship exists between the shear stress and the initial
state factor. As can be seen in Table 4.16(a) and Figure
4.48 that the magnitudes of M and Fo are different for
different types of soils and cell pressures. The differences
in soil types (i.e. different composition or expansiveness)
seem to result in different Fo and M values. For soils
tested at a constant cell pressure, the higher the clay
content, liquid limit and plastic limit, the higher the
value of M and the lower the value of Fo (such as soil (6))
and vice versa. The results of the studied samples as shown
in Figure 4.48 and Table 4.16(a) suggest that, as the cell
pressure increases from 50 to 200 kPa, the value of M
increases from 30.54 to 45.68 and the value of Fo decreases
from 8.06 to 6.64. The dependency of Fo and M values on
plasticity index and cell pressure is illustrated in Figures
4.49 and 4.50. For the Fo relations, the regression
equations of the best fit lines are expressed by:
41.415.352.10 PILogFLog
42.414.114.0 30 LogFLog
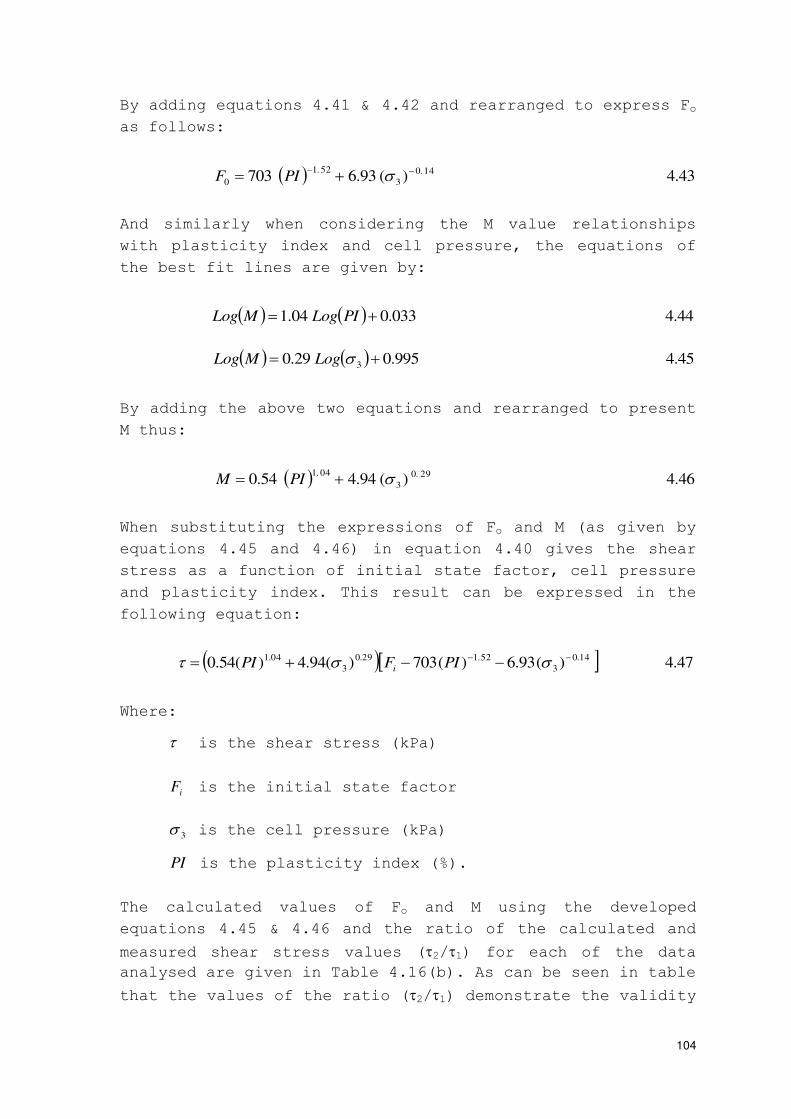
104
By adding equations 4.41 & 4.42 and rearranged to express Fo
as follows:
43.4)(93.670314.0
3
52.1
0
PIF
And similarly when considering the M value relationships
with plasticity index and cell pressure, the equations of
the best fit lines are given by:
44.4033.004.1 PILogMLog
45.4995.029.0 3 LogMLog
By adding the above two equations and rearranged to present
M thus:
46.4)(94.454.029.0
3
04.1 PIM
When substituting the expressions of Fo and M (as given by
equations 4.45 and 4.46) in equation 4.40 gives the shear
stress as a function of initial state factor, cell pressure
and plasticity index. This result can be expressed in the
following equation:
47.4)(93.6)(703)(94.4)(54.014.0
3
52.129.0
3
04.1 PIFPI i
Where:
is the shear stress (kPa)
iF is the initial state factor
3 is the cell pressure (kPa)
PI is the plasticity index (%).
The calculated values of Fo and M using the developed
equations 4.45 & 4.46 and the ratio of the calculated and
measured shear stress values (2/1) for each of the data analysed are given in Table 4.16(b). As can be seen in table
that the values of the ratio (2/1) demonstrate the validity

105
of the developed equation 4.47. This result suggests the
definition and measurement of shear stress as a function of
initial state factor, cell pressure and plasticity index.
106
CHAPTER FIVE
DESIGN CHART
5.1 INTRODUCTION
Presented in this chapter the development and applications
of new design chart for expansive soils as road subgrade. As
the aim of this research was to investigate the possibility
of characterising the swelling behaviour and strength of
expansive clay soil at different initial states, a new chart
that contains isolines of both swelling and strength will be
developed. Detailed descriptions of characterising swelling
and strength of a given expansive soil by producing isolines
charts of swelling, CBR and shear stress will be given in
this chapter. The developed chart can be of great use in
pavement design, field compaction control and pavement
evaluation of roads constructed on expansive clay soils. The
chart may be useful also in prediction of swelling and
strength properties of a given soil at certain initial state
parameters.
5.2 CHARACTERISATION OF SWELLING AND STRENGTH
The study of swelling behaviour and strength of fine grained
soils requires the development of isolines of swell percent
and swelling pressure to characterise the swelling behaviour
of a given expansive soil at different initial states (water
content and dry density). On the other hand, the study of
the strength variation with soil initial state parameters
will be characterised as well by using isolines of CBR and
shear stress. The linear relationship exists between swell
percent, swelling pressure, CBR or shear stress and initial
state factor Fi (or soaking state factor Fs)(as described in
chapter 4) can be of great use in the characterisation of
the swelling and strength variation with water content and
dry density of a given expansive soil.
5.2.1 Iso-swelling lines
The isolines for the swelling and initial state behaviour of
a given soil can be produced by two different methods; these
107
methods can be classified into a direct method and indirect
method. The isolines of swelling can be produced directly if
a limited number of swell percent tests (three to five) at a
certain surcharge pressure, and swelling pressure tests can
be performed, then the values of Fo and M can be determined.
By using these values and equations 4.9 & 4.17, and by
selecting various values of Fi (Fi1, Fi2, Fi3, …………… , Fin), the lines of swell percent and swelling pressure can be
produced. Then a plot of swelling relationship with initial
state variations can simply be drawn.
The indirect method of producing iso-swelling lines is
simply by substituting the measured basic properties of a
given soil such as plasticity index, clay content and
surcharge pressure, in equations 4.16 & 4.24, and by
selecting various values of Fi, the isolines of swell
percent and swelling pressure can be drawn.
To investigate the validity of this iso-swelling lines
concept, the results obtained in this project and shown in
Figures 4.2 to 4.4 and Figure 4.22 were analysed and plotted
in Figures 5.1 and 5.2. In these plots iso-swelling lines
were obtained for selected values of Fi. For each value of
Fi the corresponding swell percent at different surcharge
pressures (S1, S2, S3) and the swelling pressure (SP) were
calculated using equations 4.16 & 4.24. The calculated
values of swell percent and swelling pressure are indicated
on the lines. The data points shown in Figures 5.1 and 5.2
are the measured initial state (water content and dry
density) of the samples. The measured swell percent and
swelling pressure values of these samples are given
alongside. The comparison of the measured and calculated
swell percent and swelling pressure values in these figures
clearly demonstrates the validity of the iso-swelling lines
concept.
5.2.2 Iso-CBR lines
The isolines for the CBR (soaked and unsoaked) variation
with the soil state factors (initial state factor Fi and
soaking state factor Fs) for a given soil can be produced.
As previously mentioned these isolines can be produced by
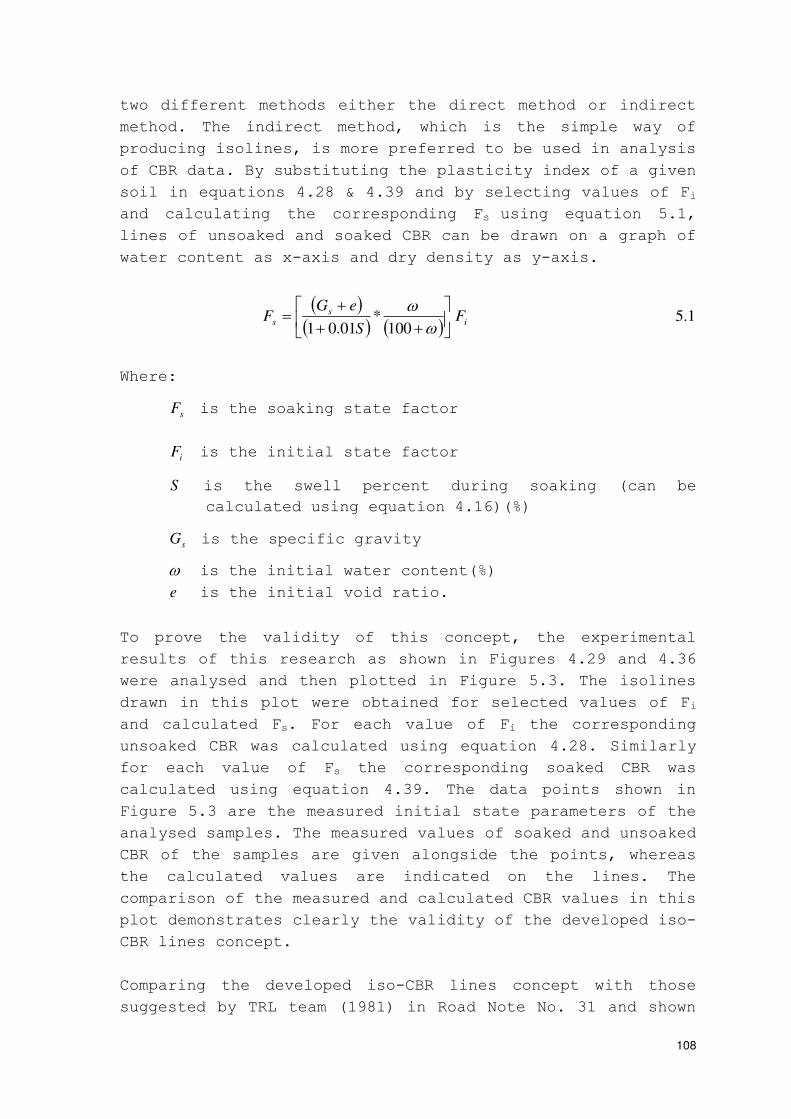
108
two different methods either the direct method or indirect
method. The indirect method, which is the simple way of
producing isolines, is more preferred to be used in analysis
of CBR data. By substituting the plasticity index of a given
soil in equations 4.28 & 4.39 and by selecting values of Fi
and calculating the corresponding Fs using equation 5.1,
lines of unsoaked and soaked CBR can be drawn on a graph of
water content as x-axis and dry density as y-axis.
1.5
100*
01.01i
s
sF
S
eGF
Where:
sF is the soaking state factor
iF is the initial state factor
S is the swell percent during soaking (can be
calculated using equation 4.16)(%)
sG is the specific gravity
is the initial water content(%)
e is the initial void ratio.
To prove the validity of this concept, the experimental
results of this research as shown in Figures 4.29 and 4.36
were analysed and then plotted in Figure 5.3. The isolines
drawn in this plot were obtained for selected values of Fi
and calculated Fs. For each value of Fi the corresponding
unsoaked CBR was calculated using equation 4.28. Similarly
for each value of Fs the corresponding soaked CBR was
calculated using equation 4.39. The data points shown in
Figure 5.3 are the measured initial state parameters of the
analysed samples. The measured values of soaked and unsoaked
CBR of the samples are given alongside the points, whereas
the calculated values are indicated on the lines. The
comparison of the measured and calculated CBR values in this
plot demonstrates clearly the validity of the developed iso-
CBR lines concept.
Comparing the developed iso-CBR lines concept with those
suggested by TRL team (1981) in Road Note No. 31 and shown
109
in Figure 2.35. It appears that the two concepts are
conflict with one another. A close examination, however, of
the TRL team concept reveals that the parts of the 40%, 60%
and 70% curves which are upwards are erroneous, because they
suggest that increasing the dry density for the same
moisture content has no influence on the unsoaked CBR, this
is not correct as it contradicts the results obtained in
this project (Section 4.3.2) and those reported in the
theory (Section 2.6.1).
5.2.3 Iso-shear stress lines
The developed linear relationship of shear stress and
initial state factor Fi can be used to investigate the iso-
shear stress lines variation with initial state parameters
of a given soil. These isolines of shear stress can be
produced directly if a limited number of triaxial tests at a
certain cell pressure can be performed and then the values
of Fo and M can be determined. By substituting these values
in equation 4.40, and by selecting different values of Fi,
the shear stress lines can be drawn. Another way of
producing iso-shear stress lines of a given soil simply can
be done by applying the plasticity index and cell pressure
values in equation 4.47, and by selecting various values of
Fi, lines of shear stress can be obtained. Then a chart to
show the relationship of shear stress characterisation lines
with water content and dry density variations can be drawn.
The validity of iso-shear stress lines concept can be
verified by analysing the results of present study shown in
Figures 4.42 to 4.44. The analysis result is illustrated in
Figure 5.4. In this plot iso-shear stress lines were drawn
as described above. The data points shown in the plot are
the measured initial water contents and dry densities of the
analysed samples. When comparing the calculated shear stress
values that indicated on the lines and the measured values
located alongside the data points, their values seem to be
equal. This result verifies the validity of the iso-shear
lines produced.
110
5.3 DEVELOPMENT OF DESIGN CHART
The main objective of this project is to investigate the
swelling behaviour and strength characteristics at various
initial states in order to develop new design chart. Based
on the linear relationship between swell percent and
swelling pressure as well as CBR and shear stress versus the
soil states factors (Fi and Fs). This chart can be developed
as outlined hereunder.
An important feature of the type of characterisation lines
approach developed in the previous section is the
possibility that the data regarding soil strength (i.e. CBR
and shear stress) and swelling behaviour (i.e. swell percent
and swelling pressure) of expansive soils can be
superimposed in one characterisation line. Thus
characterisation lines (isolines) of CBR, shear stress,
swelling pressure and swell percent at different surcharge
pressures (P1, P2, P3, etc.) - Initial state (water content
and dry density) behaviour of a given expansive soil could
be produced. By substituting the basic properties of the
soil, surcharge pressure and cell pressure in equations
(4.16), (4.24), (4.28), (4.39) and (4.47) and selecting
different values of Fi and calculating the corresponding Fs
values using equation 5.1, characterisation lines indicate
swell percent, swelling pressure, CBR (as soaked or
unsoaked) and shear stress values can be produced. Then a
chart of characterisation lines indicating swelling, CBR and
shear stress relationship with soil initial water content
and dry density variations can be plotted.
The experimental results of this project were analysed and
used to demonstrate the validity of the developed design
chart. The result of analysis was plotted in Figure 5.5, in
which lines indicated swelling and strength parameters were
obtained for selected values of Fi. For each value of Fi the
corresponding swell percent, swelling pressure, unsoaked CBR
and shear stress were calculated using equations 4.16, 4.24,
4.28 and 4.47. The calculated values of swelling and
strength parameters are indicated on the lines. The data
points shown in Figure 5.5 are the measured initial water
contents and dry densities of the samples. The measured
values of swell percent, swelling pressure, CBR and shear
111
stress are shown alongside the points. The comparison of the
measured and calculated values in this figure clearly
demonstrates the validity of the design chart produced.
5.4 PRACTICAL APPLICATIONS OF THE DEVELOPED CHART
The design chart developed in the previous section can be of
great use when applied for roads constructed on expansive
soils. The chart can be used in the following aspects:-
Pavement design
Field compaction control
Pavement evaluation.
These three main practical applications of the developed
design chart will be described in some length hereunder.
5.4.1 Pavement design
Pavement thickness is almost universally determined by
subgrade CBR strength. The fundamental difference between
the common practical codes of design lies in the
determination of the subgrade CBR, where the subgrade is
defined as the upper 15 cm layer immediately beneath the
subbase. These design methods consider the moisture content
as the main factor of subgrade strength. In the Kenya Road
Design Manual it is stated that subgrade of expansive soil
should be compacted at the Equilibrium Moisture Content
(EMC) so as to control the moisture content of this soil.
But the EMC is not the only factor that controls strength
and swelling of expansive soils. The soil state factor that
relates moisture content and dry density, is the main
control of the strength and swelling.
The TRL Road Note No. 31 suggests that the strength of the
subgrade to be taken as that of the subgrade soil at a
moisture content equal to the wettest moisture condition
likely to occur in the subgrade after the road is open to
traffic. It recommends three cases of estimating the
subgrade moisture content as described below.
112
The first case where water table exists to the ground
surface, the ultimate subgrade moisture content can be
determined by measuring the moisture content in the subgrade
below existing pavement. The second case when the water
table is not near the ground surface and where the average
annual rainfall is greater than 250 mm a year, the ultimate
moisture content for design purposes can be taken as the
optimum moisture content. The third case in regions where
the climate is arid throughout most of the year (annual
rainfall 250 mm or less), the ultimate moisture content of
the subgrade will be virtually the same as that of the
uncovered soil at the same depth. This is the moisture
content that should be used for design purposes.
Having estimated the ultimate subgrade moisture content it
is then possible to determine the design subgrade CBR at
different densities and thus indicates the value of
achieving the specified density in the subgrade at which the
soil can be compacted without subjected to objectionable
volume change. This value of CBR is then used to determine
the required subgrade thickness from the design charts.
The TRL Road Note No. 31 uses a chart of iso-CBR curves
Figure 2.35 in pavement design. This chart can be used to
get a suitable moisture content and density of the soil that
give a certain design strength but not indicates swelling
behaviour so it can only be used for nonexpansive soils.
Also the iso-CBR curves are not correct as discussed
previously in Section 5.2.2.
In stead of all above defects of the iso-CBR curves
suggested by the TRL (1981), however it seems to be the best
of the conventional methods that used in pavement design.As
discussed in Section (2.8) that all the technical design
methods used for expansive soils only consider the swelling
behaviour of the soil but not consider the strength although
it is the main factor of pavement design. On the other hand,
the conventional methods of flexible pavement design
consider the subgrade strength using the CBR or shear stress
alone and not swelling.
113
For all the above reasons, it seems that there is a great
need for a new approach of design to take care of both the
swelling behaviour and strength characteristics of expansive
soils as road subgrade. The method developed in this
research will be described in the following design steps:-
1) The road to be designed is subdivided into certain
sections according to the variations in the subgrade
soils properties.
2) For each section samples of the subgrade soil should be
taken to a soil laboratory in order to measure the basic
engineering soil properties mainly index tests, clay
contents and specific gravity. A surcharge pressure
equivalent to an anticipated overburden pressure (i.e.
the pressure exerted by the pavement layers above the
subgrade) can be estimated.
3) By using the information obtained in step (2), then
design chart of characterisation lines of swelling and
strength for the subgrade expansive soil can be produced
as described previously in Section (5.3).
4) As specified by the Highway Authorities, the
permissible swell percent of the subgrade soil is in the
range 1% to 2% depending on the class of the road.
5) From the design chart as produced in step (3) the
design strength (using soaked or unsoaked CBR and shear
stress) of the subgrade can be determined as the strength
at water content and dry density (soil initial state)
around which the swell percent is 50% less than the
permissible swell percent.
6) As the thickness of pavement on expansive soils depends
on the subgrade strength and swelling measured at
suitable moisture content and dry density and on the
traffic loading expressed in terms of equivalent standard
axles expected under the road after construction. Thus it
is recommended to continue the pavement design stages
using the suitable conventional pavement design methods
such as the AASHTO and CBR design method. Adopt the
114
procedure described in Section 2.7.1 or 2.7.2 and the
design chart developed by the TRL or AASHTO shown in
Figures 2.34(b) and 2.36 to determine the pavement
thickness and proceed to do the other design steps.
5.4.2 Field compaction control
This method is used for the material quality control of
compacted embankment and/or subgrade. The conventional
pavement compaction control specifications are generally
given in terms of strength determined in the laboratory and
the field control density expressed in terms of relative
compaction. The field compaction control method presently
used in pavement engineering practice is briefly outlines
below:-
1. The compaction characteristics of the soil are studied
according to the standard specifications, compaction
curve is plotted and the maximum dry density and optimum
moisture content are determined.
2. After field compaction of embankment and/or subgrade,
the field density and the moisture content of the
material are measured.
3. The values of the densities and moisture contents in the
above two steps (1&2) are compared. For the densities,
the field density (measured in (2)) should not be less
than 90% sometimes 95% of the maximum dry density
measured in (1). No standard method is used for the limit
of acceptability for moisture content.
This method as described above has some defects and is not
acceptable especially in expansive soils embankment and/or
subgrade for the following reasons: -
The method set a lower limit for the dry density but
not set an upper limit. As previously discussed in
Section (2.5.4) the higher the dry density the higher the
swell percent, in other words a soil compacted to very
high dry density is very sustainable to swell leading to
damages than another compacted to a lower density.
115
The field compaction specification in terms of maximum
dry density alone may be misleading. The moisture content
at which the desired relative compaction to be achieved
must also be specified. As previously discussed in
Sections (2.5.4) and (2.6.1.2) that both CBR and swelling
are much affected by the moisture content.
It appears that a new method of field compaction control
must be developed for expansive soils embankment and/or
subgrade. This method is briefly described below: -
(1) Soil samples are taken from the field to perform some
basic tests such as compaction tests, index tests and
clay contents. From tests results the soil compaction
characteristics (optimum moisture content and max dry
density) can be determined and the design chart is
formed as described in Section (5.3).
(2) After field compaction of embankment and/or subgrade,
the field density and moisture content of the material
are measured.
(3) A point to indicate the measured field density and
moisture content is drawn in the produced chart.
(4) The point indicated in the chart as described by the
above step, if it is located within the range of design
CBR and permissible swelling then the compaction is to
accepted otherwise will be rejected.
5.4.3 Pavement Evaluation
The evaluation of embankment and/or subgrade material is to
check the performance and the strength of the road. The
methods normally used are the Benklman Beam and the Dynamic
Cone Penetrometer (DCP) test.
116
The DCP method of pavement evaluation suffers from the
following limitations: -
The CBR obtained from the correlation or chart is for
the field as compacted only and this may not give a
realistic CBR value.
This DCP test need to be done for many sections of a
highway and this is very expensive and not economical
especially in undeveloped countries.
The charts used to get the layer thickness for a
certain design CBR do not indicate the swelling so it is
unsuitable to be used for expansive soils.
The Benklman method of evaluation is very expensive to be
used in undeveloped countries and does not give the exact
strength components.
For all these reasons, it seems that a new method needed to
be developed as outlined below: -
1) The road is subdivided into different sections
depending on expansive soil properties. By taking soil
samples from each section, the basic soil properties can
be measured and the chart formed in the way described in
Section (5.3).
2) The field density and moisture content of the subgrade
soil along each section are measured. From these data the
field dry density can be calculated.
3) The field measured data of dry density and moisture
content obtained in the above step (2) are used to
determine the swelling (i.e. swell percent and swelling
pressure) and the strength (i.e. soaked or unsoaked CBR)
from the chart.
4) By comparing the determined values of swelling and CBR
with the design values of swelling and CBR values of this
road, then sections with excessive swelling and lower CBR

117
will be excluded out (i.e. sections or subsections in
areas of weak subgrades or subgrade sustainable to
swelling will be located).
118
CHAPTER SIX
CONCLUSIONS
6.1 EXPERIMENTAL WORK
The study of the swelling behaviour and strength of
compacted expansive clay soil has performed on standard
equipment to provide data at different initial state and
testing conditions. All the experiments were performed in a
way to represent the boundary conditions of a road subgrade
of swelling soil. Samples of expansive soil prepared at a
wide range of water content and were compacted to different
dry densities.
In the conventional oedometer cell both the swell percent
and swelling pressure were measured. In order to simulate
the field conditions of the subgrade soil, the swell percent
of compacted soil was measured at three different surcharge
pressures. The swelling pressure was measured as the
pressure required to consolidate a pre-swelled sample until
it retains back to its initial volume. The experimental
results obtained indicated that both the swell percent and
swelling pressure are much influenced by water content and
dry density.
The CBR tests were performed on expansive soil to measure
the soil strength at different testing conditions. The tests
performed on compacted samples for measuring both the soaked
and unsoaked CBR. Some of the samples were tested directly
as remoulded to measure unsoaked CBR while others were
subjected to soaking process prior to the penetration test
for measuring the soaked CBR.
The triaxial tests provided values of the shear stress for
an element of soil tested at a constant cell pressure. The
tests were performed on compacted samples at three different
cell pressures. The results showed that the shear stress
values depend on the sample moisture content and dry density
as well as the cell pressure used in testing.
119
6.2 DEPENDENCE OF THE SWELLING AND STRENGTH ON THE INITIAL
STATE AND SOIL BASIC PROPERTIES
The experimental work has been carried out to study the
swelling behaviour and strength characteristics of expansive
clay soil. Several tests to measure the swell percent,
swelling pressure, CBR and shear stress were performed on
samples having different initial water contents and dry
densities.
A study of the swelling behaviour of expansive soil samples
compacted over a wide range of water contents was conducted.
It was found that for the expansive soil studied, initial
water content, dry density and void ratio greatly influenced
the swell percent and swelling pressure. On the other hand
the strength of expansive soil as indicated by the CBR and
shear stress measurements was studied. The samples were
prepared over a full range of water contents and compacted
to different dry densities. The results of the experiments
confirmed that; initial water content, dry density and void
ratio greatly influenced the unsoaked CBR and shear stress.
It was found that for the soaked (saturated) soil studied;
saturated moisture content, saturated dry density and amount
of swelling during the soaking period greatly influenced the
soaked CBR.
Initial water content, dry density and void ratio were
combined in a way reflecting the influence of each of them
on swell percent, swelling pressure, unsoaked CBR and shear
stress. This combination was termed the initial state Factor
(Fi). On the other hand the combination of the saturated
water content, saturated dry density and amount of swelling
was termed the soaking state Factor (Fs).
Analysis of the experimental results and data reported by
previous researchers demonstrate very clearly that a direct
linear relationship exists between swell percent, swelling
pressure, unsoaked CBR or shear stress and the initial state
Factor (Fi). Similarly the relationship between soaked CBR
and the soaking state Factor (Fs) is linear as well. The
coefficients of this linear relationship (i.e. constant and
slope) were found to depend on plasticity index and clay
contents (i.e. basic properties) of soil, applied surcharge
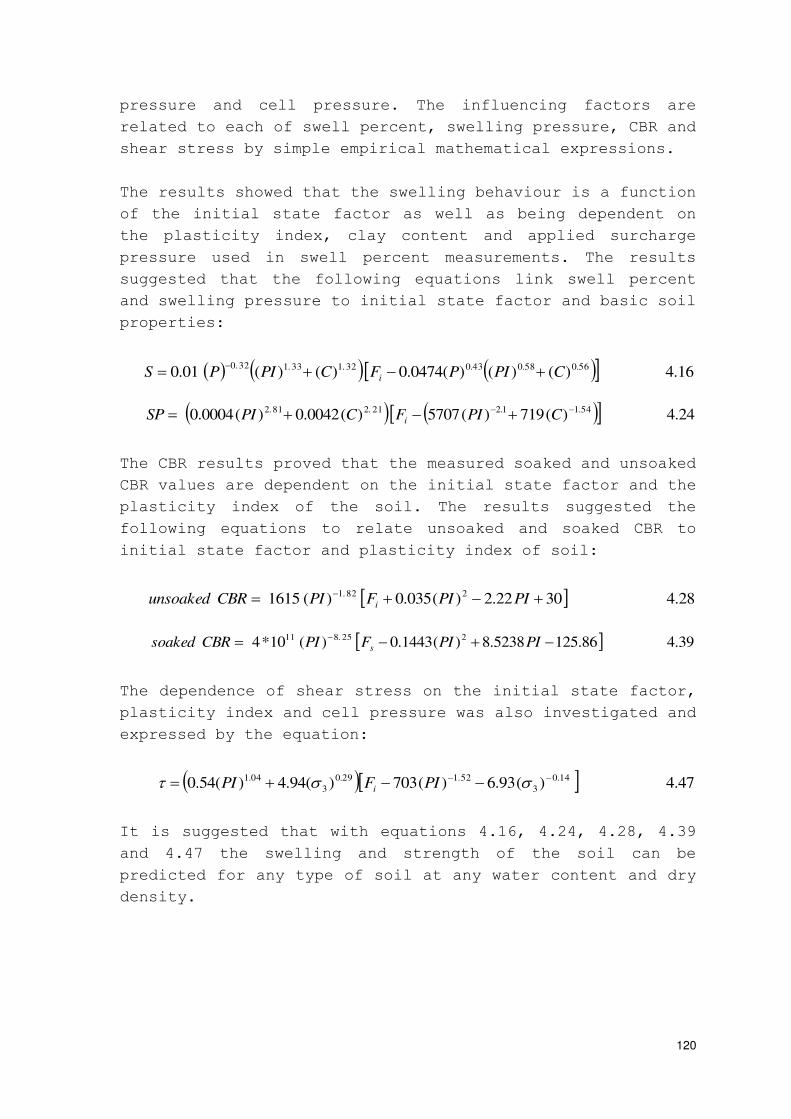
120
pressure and cell pressure. The influencing factors are
related to each of swell percent, swelling pressure, CBR and
shear stress by simple empirical mathematical expressions.
The results showed that the swelling behaviour is a function
of the initial state factor as well as being dependent on
the plasticity index, clay content and applied surcharge
pressure used in swell percent measurements. The results
suggested that the following equations link swell percent
and swelling pressure to initial state factor and basic soil
properties:
16.4)()()(0474.0)()(01.056.058.043.032.133.132.0
CPIPFCPIPSi
24.4)(719)(5707)(0042.0)(0004.054.11.221.281.2 CPIFCPISP
i
The CBR results proved that the measured soaked and unsoaked
CBR values are dependent on the initial state factor and the
plasticity index of the soil. The results suggested the
following equations to relate unsoaked and soaked CBR to
initial state factor and plasticity index of soil:
28.43022.2)(035.0)(1615282.1
PIPIFPICBRunsoakedi
39.486.1255238.8)(1443.0)(10*4225.811
PIPIFPICBRsoakeds
The dependence of shear stress on the initial state factor,
plasticity index and cell pressure was also investigated and
expressed by the equation:
47.4)(93.6)(703)(94.4)(54.014.0
3
52.129.0
3
04.1 PIFPIi
It is suggested that with equations 4.16, 4.24, 4.28, 4.39
and 4.47 the swelling and strength of the soil can be
predicted for any type of soil at any water content and dry
density.
121
6.3 PRACTICAL IMPLICATIIONS OF THE RESEARCH
The use of expansive clay soils as road subgrade is
beneficial. The costs of removing this type of soil and
importing expensive granular fill are greatly reduced if
naturally occurring expansive soil is used. The aim of this
research was to improve the current specifications used in
pavement design, evaluation and field compaction control of
roads on expansive soils. The method suggested takes care of
both the swelling behaviour and strength characteristics of
road subgrade of expansive soils.
The results of this research suggested that the developed
linear relationship between swelling as well as strength and
initial state factor Fi (as described in chapter 4) can be
used in the characterisation of the swelling and/or strength
variation with initial state parameters of a given expansive
soil. The analysis results verified the possibility of
superimpose all the data regarding soil swelling and
strength in one design chart. This chart can be utilised in
design and evaluation of pavement as well as in compaction
control in the field.
6.4 LIMITATIONS AND FUTURE WORK
The experimental work has been focused on the soil initial
state changes in saturated and unsaturated state and has
provided useful information regarding the swelling behaviour
and strength of compacted expansive clay soils. However, as
discussed in Chapter two, the testing method and measuring
devices used influence the swelling pressure and shear
stress of soil. A useful extension of this work would be to
examine the effects that testing methods and equipment used
have on measuring the swelling pressure and shear stress.
For the measurements of swelling, CBR and shear stress it is
important that the relationships shown in equations 4.16,
4.24, 4.28, 4.39 and 4.47 be tested further by performing a
wider series of swelling and strength testing measurements
on a variety of soils. These tests should be undertaken at
different water contents, dry densities and different
testing conditions.
122
It is recommended for the future researches to apply the
developed design chart in the field and any other road
engineering aspects.
6.5 SUMMARY
It has been demonstrated that the swelling behaviour of
expansive soil compacted over a wide range of water
content different dry densities is depended on: the soil
initial state (water content, dry density and void
ratio), soil expansiveness (plasticity index and clay
content) and applied surcharge pressure.
A study of the strength by the CBR and shear stress
measurements of compacted expansive soil at different
water contents and dry densities was conducted. It was
found that the soil initial state, plasticity index and
testing conditions greatly influenced the unsoaked CBR
and shear stress. The results of the soaked (saturated)
soil samples suggested that the soil soaking state
(saturated moisture content, saturated dry density and
amount of swelling during the soaking period) and soil
plasticity index greatly influenced the soaked CBR
value.
Initial water content, dry density and void ratio were
combined in a way reflecting the influence of each of
them on swell percent, swelling pressure, unsoaked CBR
and shear stress. This combination was termed the
initial state Factor (Fi). On the other hand the
combination of the saturated water content, saturated
dry density and amount of swelling during the soaking
period was termed the soaking state Factor (Fs).
It has been proved that a direct linear relationship
between swell percent, swelling pressure, unsoaked CBR
or shear stress and the initial state Factor (Fi).
Similarly the relationship between soaked CBR and the
soaking state Factor (Fs) was verified to be linear
relationship as well. Based on this relationship and
simple mathematical expressions developed for the

123
swelling and strength, design chart of swelling and
strength variations with initial water content and dry
density were developed. This chart can be applied in
design and evaluation of pavement as well as in
compaction control in the field.
The work demonstrates that it is possible to improve the
current specifications and to include expansive clay
soils as road subgrade provided that the placement water
content and dry density are carefully controlled.
109
REFERENCE
1. American Association of State Highway Officials
(AASHO) (1972): AASHO interim guide for the design of
flexible pavement structures. Washington.
2. Atkinson, J.H., Evans, J.S. and Scott, C.R. (1985):
Developments in micro computer controlled stress path
testing equipment for the measurement of soil parameter.
Ground Engineering, Vol. 18, No. 1, pp. 15-22.
3. Blight, G.E. and De Wet, J.A. (1965): The
acceleration of heave by flooding. A symposium in print.
Moisture Equilibria Moisture Changes in Soils Beneath
Covered Areas. Butterworths, Australia. pp. 89-92.
4. Brackley, I.J.A. (1973): Swell pressure and free
swell in a compacted clay. Proc. 3rd International
Conference on Expansive Soils, Haifa.
5. Brackley, I.J.A (1975): A model of unsaturated clay
structure and its application to swell behaviour. 6th
Regional Conference for Africa on Soil Mechanics and
Foundation Engineering, Durban, South Africa.
6. British Standards Institution (1975): Methods of
testing soils for civil engineering purposes. BS 1377,
London.
7. Casagrande, A. (1948): Classification and
identification of soils. Proceedings of the American
Society of Civil Engineers (A.S.C.E.), Vol. 113, pp.
901-991.
8. Chen, F.H. (1975): Foundation on Expansive Soils.
Developments in Geotechnical Eng. Elsevier Publg. Co.
9. Ellis, C.I. (1980): Soil compaction at low moisture
contents, field trials in Sudan. Proc. 7th Regional Conf.
for Africa on Soil Mech. and Found. Eng., Accra, Ghana.
10. El-Tayeb, M.M. (1991): Characterisation of expansive
soils as road subgrade. M.Sc. thesis, Building and Road
Research Institute, University of Khartoum.
11. Glanville, W.H. (1951): Soil Mechanics for Road
Engineers. Her Majesty’s Stationery Office, London. 12. Grim, R.E. (1962): Applied clay mineralogy. London,
McGraw-Hill.
13. Herzong A. and Brock R. (1964): Some factors
influencing the strength of soil-lime-flashing mixtures.
Proc. 2nd Conf. of Australian Road Research Board,
Melboune, Vol. 2.
110
14. Holtz, W.G. and Gibbs, H.J. (1956): Engineering
properties of expansive clays. Trans. American Society
of Civil Engineers (A.S.C.E.), Vol. 121.
15. Holtz, W.G. (1959): Expansive soils, properties and
problems. Quart. Colorado School of Mines, Vol.54, No.4.
16. Ingles, O.G. and Metcalf, J.B. (1972): Soil
Stabilization, Butterworths, Sydney.
17. Kassif, G., Komornik, A., Wiseman, G. and Zeitlen,
J.G. (1965): Studies and design criteria for structures
on expansive clays. Proc. 1st Res. Conf. on Exp. Soils,
Texas.
18. Kassiff, G., Livneh, M., and Wiseman, G. (1969):
Pavements on Expansive Clays. Jerusalem Academic Press,
Jerusalem, Israel.
19. Lewis, W.A. (1959): Investigation of the performance
of pneumatic-tyred rollers in the compaction of soil.
Road Research Laboratory. Technical Paper No. 45. HMSO.
20. Ministry of Transportation and Communication (MOTC)
(1981): Botswana Road Design Manual.
21. Ministry of Works and Construction (MOWC) (1982):
Kenya Road Design Manual.
22. Mitchell, J.K. (1976): Fundamentals of soil
behaviour. New York. J. Wiley and sons.
23. Murphy, C.P. (1966): Problems of road design and
construction on the clay soils of the Fitzroy Basin.
Australian Road Research Board Proc. Vol. 3, No. 2.
24. Mustafa, A.E. (1982): Cement stabilization of black
cotton soil. M.Sc. Thesis, Building and Road Research
Institute, University of Khartoum.
25. National Institute for Transport and Road Research
(NITRR) (1978): Construction of road embankments. Draft
Technical Recommendations for Highways (TRH9), Pretoria,
CSIR.
26. Nicholas J. Garber and Lester A. Hoel (1988): Traffic
and highway engineering.
27. O’Connor, K. (1994): Swelling behaviour of unsaturated fine grained soils. Ph.D. thesis, City
Univ., London.
28. O’Flaherty, C. A. (1988): Highway engineering. Volume 2, third edition.
29. Porter, O. J. (1942): Foundations for Flexible
Pavements, Highway Research Board Proceedings of the
Twenty second Annual Meeting.
30. Rengmark, F. and Eriksson, R. (1953): Apparatus for
111
investigation of swelling, compression and elastic
properties of soils. Proc. 3rd Int. Conf. of Soil
Mechanics and Foundation Engineering Zurich.
31. Seed, H.B. and Chan, C.K. (1959): Structure and
strength characteristics of compacted clays. Proc.
American Society of Civil Engineers (A.S.C.E.), No. SM5,
pp. 87-127.
32. Seed,H.B., Woodward,R.J. and Lundgren,R.(1962):
Prediction of swelling potential for compacted clays.
Proc. American Society of Civil Engineer. Journal of
Soil Mechanics and Foundation Engineering. Vol. 88.
33. Shell International Petroleum Company Limited (1978):
Shell pavement design manual. London.
34. Skempton, A.W. (1953): The colloidal Activity of
clay. Proc. 3rd Int. Conf. on Soil Mechanics, Vol. 1, pp.
33-62.
35. Skempton, A.W. and Northey, R.D.(1953): The
sensitivity of clays. Geotechnique, Vol. 3, pp. 30-53.
36. Snethen, D.R. (1984): Evaluation of expedient methods
for identification and classification of potentially
expansive soils. Proc. 5th Int. Conf. on Expansive Soils,
Adelaide, South Australia.
37. Sridharan,A., Sreepada, R. and Sivapullaiah,
P.V.(1986): Swelling pressure of clays. Geotechnical
Testing Journal, Vol. 9, No. 1, pp. 24-33.
38. Terzaghi, K. (1936): The shearing resistance of
saturated soil and the angle between the planes of
shear. Proc.1st Int. Conf. Soil Mechanics and Foundation
Eng., Vol. 1, pp. 54-56.
39. Transport and Road Laboratory (TRL)(1981): A guide to
the structural design of bitumen surface roads in
tropical and subtropical countries. Road Note 31,
London.
40. U.S.A. Army Corps of Engineers (1945): The California
Bearing Ratio Test as applied to the Design of Flexible
Pavements for Airports. U.S. Army, Engineer Waterways
Experiment station.
41. Worth, C.P. and Wood, D.M. (1978): The correlation of
index properties with some basic engineering properties
of soils. Canadian Geotechnical Journal, Vol. 15, No. 2,
pp. 137-145.
42. Yevnin A. and Zaslavasky D. (1970): Some factors
affecting compacted clay swelling. Canada Geotechnical
Journal, Vol 7.
112
43. Yoder, E.J. and Witezak, M.W. (1975): Principal of
Pavement Design. 2nd edition. John Wiley and Sons, New
York.
44. Zein, A.K.M. (1985): Swelling characteristics and
microfabric of compacted black cotton soils. Ph.D.
thesis, University of Strathclyde, Glasgow.
45. 中华人民 和国行业标准,公路土工试验规程 JTJ051-
93 ,人民交通出版社,1993年。
46. 王学武等著, 丹膨胀土工程地质特性及基础设计处理,中国石油天然
气华东探矿设计研究院,CNPC,胶洲市,1997年。
47. 李生林等著,中国膨胀土工程地质研究,江 科学技术出版社,1992年
。
48. 肖荣久等著,陕南膨胀土及其灾害地质研究,陕西科学技术出版社,199
4年。
49. [美] J.K.
Mitchell著高国瑞等译 岩土工程土性分析原理 南京工学院出版社,1987年
。
50. 张咸恭,工程地质学, 州大学地质理系,地质出版社,1979年。
51. 李文武,特殊地区公路膨胀土地区,人民交通出版社1992年。
52. 同济大学土力学与基础工程研究室等编,土质学及土力学,人民交通出版
社,1980年。
53. 朱照宏,许志鸿编著,柔性路面设计理论和方法,同济大学出版社,198
5年。
54. 林绣贤,柔性路面结构设计方法,人民交通出版社,1988年。
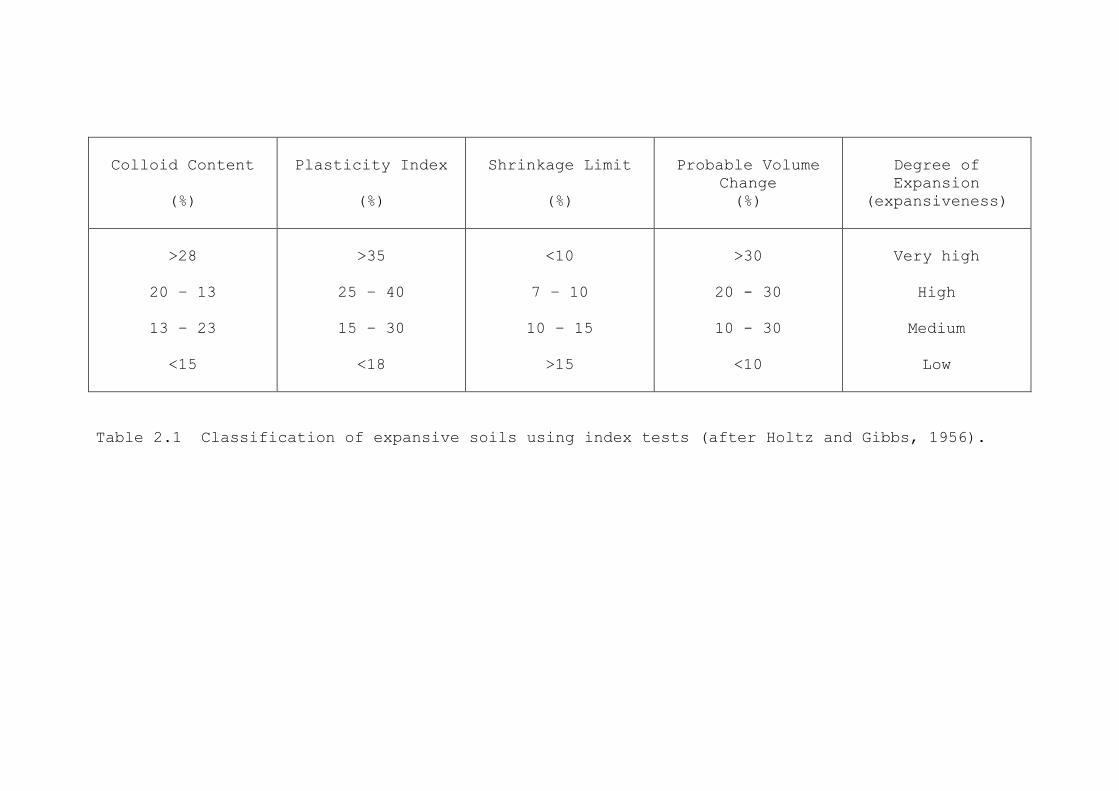
Colloid Content
(%)
Plasticity Index
(%)
Shrinkage Limit
(%)
Probable Volume
Change
(%)
Degree of
Expansion
(expansiveness)
>28
20 – 13
13 – 23
<15
>35
25 – 40
15 – 30
<18
<10
7 – 10
10 – 15
>15
>30
20 - 30
10 - 30
<10
Very high
High
Medium
Low
Table 2.1 Classification of expansive soils using index tests (after Holtz and Gibbs, 1956).
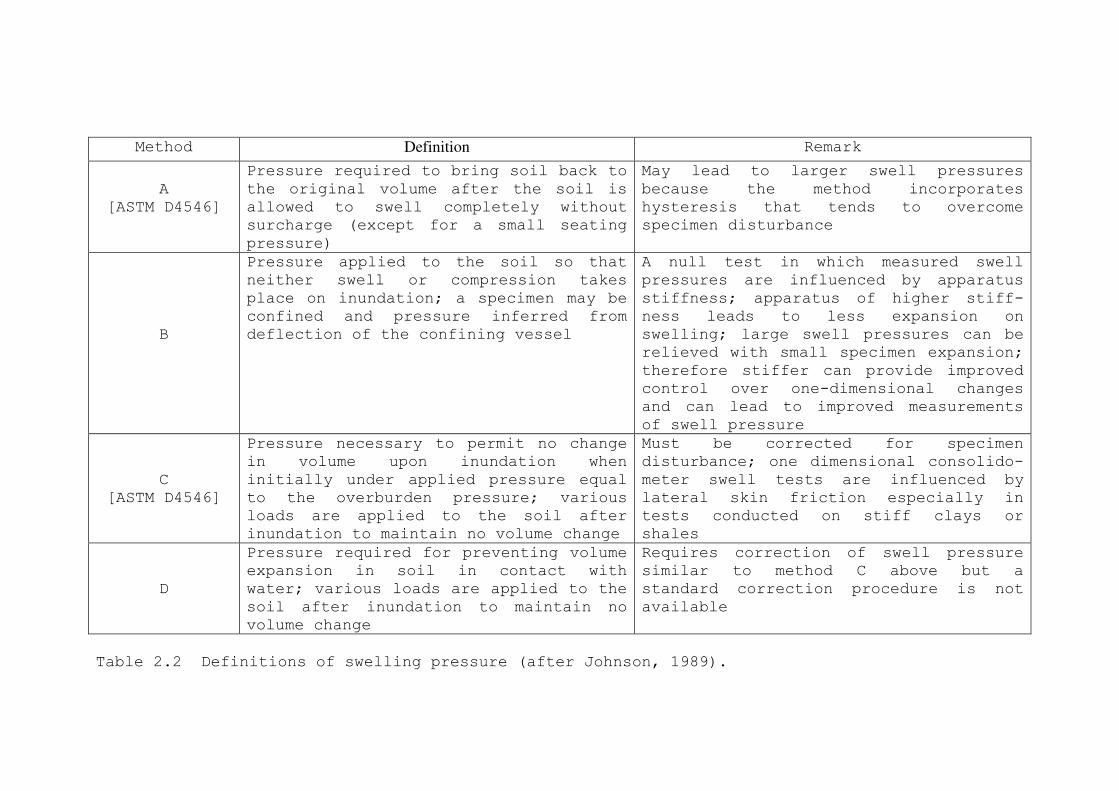
Method Definition Remark
A
[ASTM D4546]
Pressure required to bring soil back to
the original volume after the soil is
allowed to swell completely without
surcharge (except for a small seating
pressure)
May lead to larger swell pressures
because the method incorporates
hysteresis that tends to overcome
specimen disturbance
B
Pressure applied to the soil so that
neither swell or compression takes
place on inundation; a specimen may be
confined and pressure inferred from
deflection of the confining vessel
A null test in which measured swell
pressures are influenced by apparatus
stiffness; apparatus of higher stiff-
ness leads to less expansion on
swelling; large swell pressures can be
relieved with small specimen expansion;
therefore stiffer can provide improved
control over one-dimensional changes
and can lead to improved measurements
of swell pressure
C
[ASTM D4546]
Pressure necessary to permit no change
in volume upon inundation when
initially under applied pressure equal
to the overburden pressure; various
loads are applied to the soil after
inundation to maintain no volume change
Must be corrected for specimen
disturbance; one dimensional consolido-
meter swell tests are influenced by
lateral skin friction especially in
tests conducted on stiff clays or
shales
D
Pressure required for preventing volume
expansion in soil in contact with
water; various loads are applied to the
soil after inundation to maintain no
volume change
Requires correction of swell pressure
similar to method C above but a
standard correction procedure is not
available
Table 2.2 Definitions of swelling pressure (after Johnson, 1989).
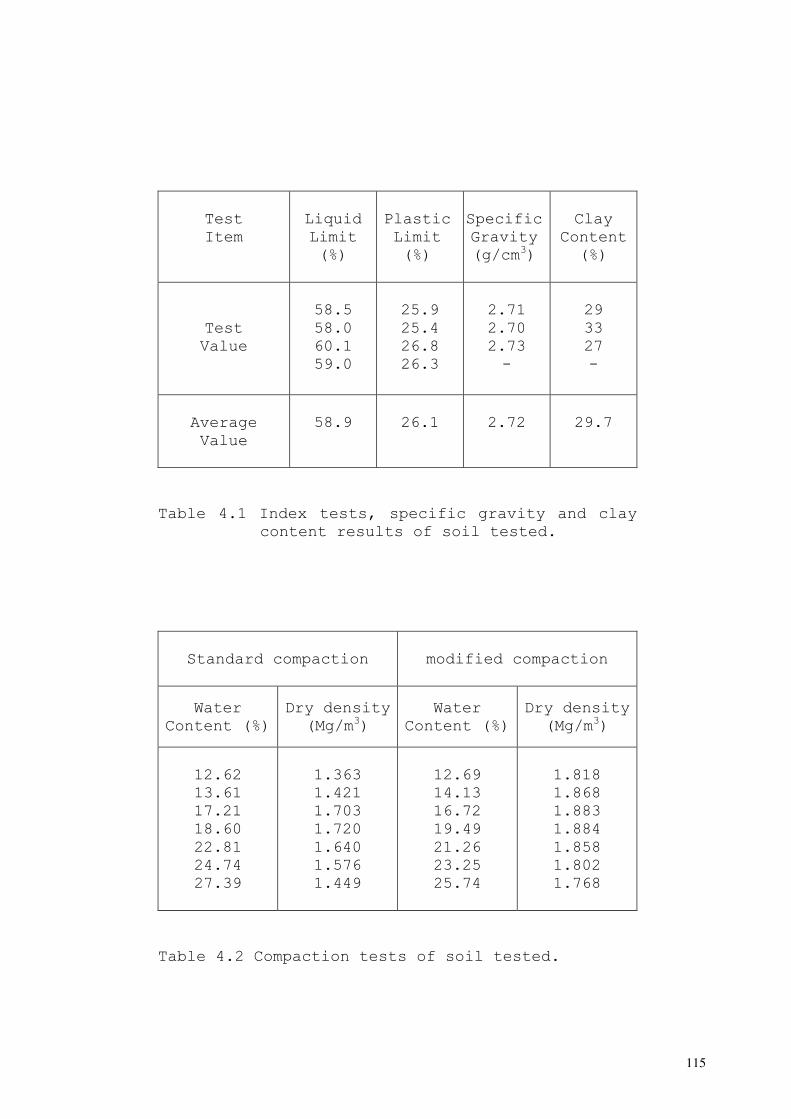
115
Test
Item
Liquid
Limit
(%)
Plastic
Limit
(%)
Specific
Gravity
(g/cm3)
Clay
Content
(%)
Test
Value
58.5
58.0
60.1
59.0
25.9
25.4
26.8
26.3
2.71
2.70
2.73
-
29
33
27
-
Average
Value
58.9
26.1
2.72
29.7
Table 4.1 Index tests, specific gravity and clay
content results of soil tested.
Standard compaction
modified compaction
Water
Content (%)
Dry density
(Mg/m3)
Water
Content (%)
Dry density
(Mg/m3)
12.62
13.61
17.21
18.60
22.81
24.74
27.39
1.363
1.421
1.703
1.720
1.640
1.576
1.449
12.69
14.13
16.72
19.49
21.26
23.25
25.74
1.818
1.868
1.883
1.884
1.858
1.802
1.768
Table 4.2 Compaction tests of soil tested.
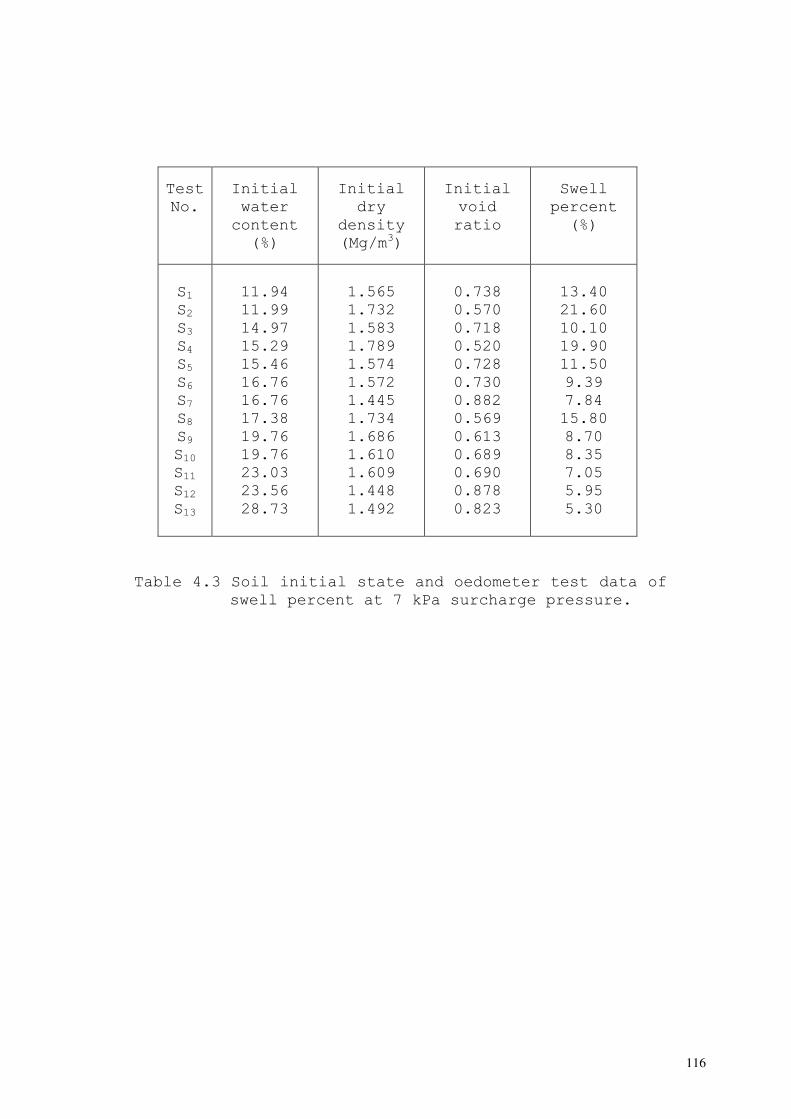
116
Test
No.
Initial
water
content
(%)
Initial
dry
density
(Mg/m3)
Initial
void
ratio
Swell
percent
(%)
S1
S2
S3
S4 S5 S6
S7
S8
S9
S10
S11
S12
S13
11.94
11.99
14.97
15.29
15.46
16.76
16.76
17.38
19.76
19.76
23.03
23.56
28.73
1.565
1.732
1.583
1.789
1.574
1.572
1.445
1.734
1.686
1.610
1.609
1.448
1.492
0.738
0.570
0.718
0.520
0.728
0.730
0.882
0.569
0.613
0.689
0.690
0.878
0.823
13.40
21.60
10.10
19.90
11.50
9.39
7.84
15.80
8.70
8.35
7.05
5.95
5.30
Table 4.3 Soil initial state and oedometer test data of
swell percent at 7 kPa surcharge pressure.
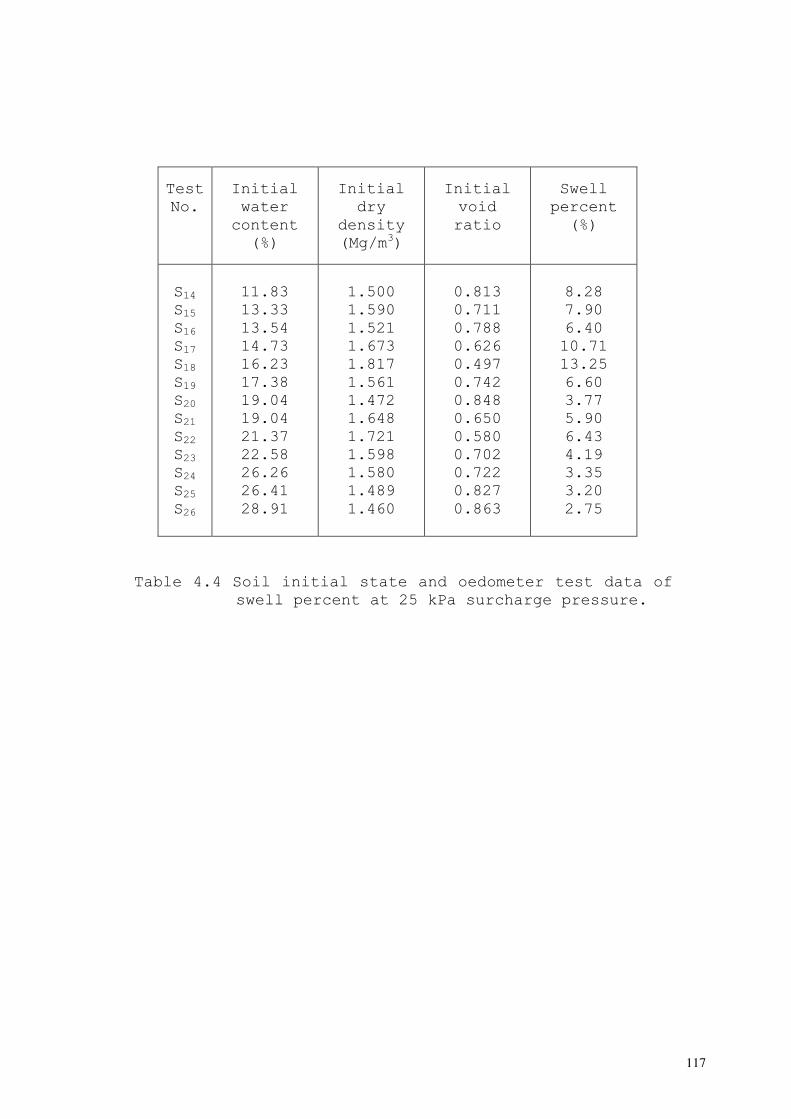
117
Test
No.
Initial
water
content
(%)
Initial
dry
density
(Mg/m3)
Initial
void
ratio
Swell
percent
(%)
S14
S15
S16
S17 S18 S19
S20
S21
S22
S23
S24
S25
S26
11.83
13.33
13.54
14.73
16.23
17.38
19.04
19.04
21.37
22.58
26.26
26.41
28.91
1.500
1.590
1.521
1.673
1.817
1.561
1.472
1.648
1.721
1.598
1.580
1.489
1.460
0.813
0.711
0.788
0.626
0.497
0.742
0.848
0.650
0.580
0.702
0.722
0.827
0.863
8.28
7.90
6.40
10.71
13.25
6.60
3.77
5.90
6.43
4.19
3.35
3.20
2.75
Table 4.4 Soil initial state and oedometer test data of
swell percent at 25 kPa surcharge pressure.
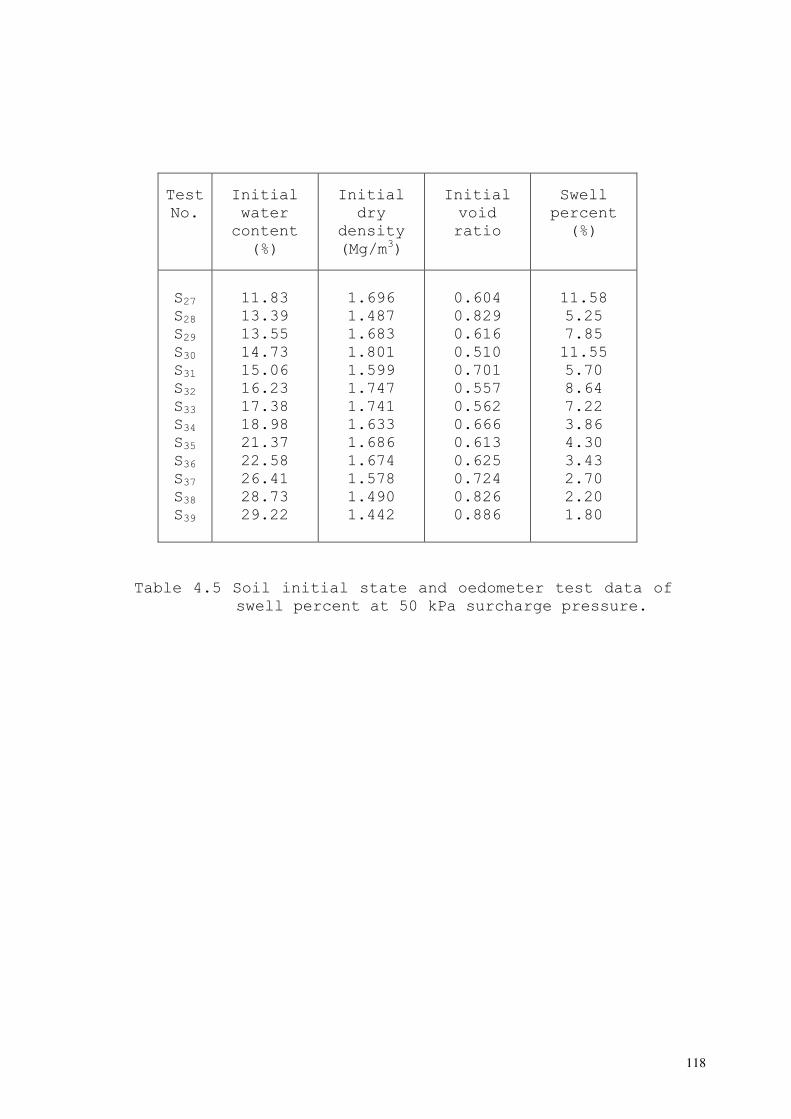
118
Test
No.
Initial
water
content
(%)
Initial
dry
density
(Mg/m3)
Initial
void
ratio
Swell
percent
(%)
S27
S28
S29
S30
S31
S32
S33
S34
S35
S36
S37
S38
S39
11.83
13.39
13.55
14.73
15.06
16.23
17.38
18.98
21.37
22.58
26.41
28.73
29.22
1.696
1.487
1.683
1.801
1.599
1.747
1.741
1.633
1.686
1.674
1.578
1.490
1.442
0.604
0.829
0.616
0.510
0.701
0.557
0.562
0.666
0.613
0.625
0.724
0.826
0.886
11.58
5.25
7.85
11.55
5.70
8.64
7.22
3.86
4.30
3.43
2.70
2.20
1.80
Table 4.5 Soil initial state and oedometer test data of
swell percent at 50 kPa surcharge pressure.
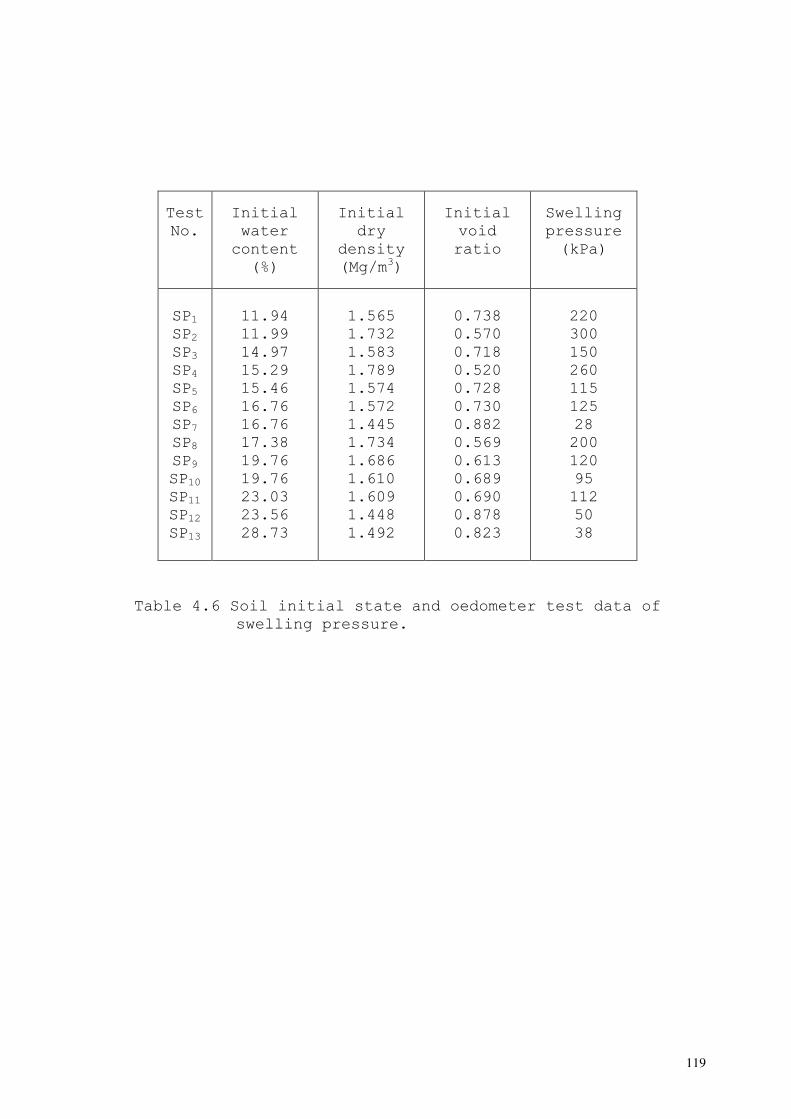
119
Test
No.
Initial
water
content
(%)
Initial
dry
density
(Mg/m3)
Initial
void
ratio
Swelling
pressure
(kPa)
SP1
SP2
SP3
SP4 SP5 SP6
SP7
SP8
SP9
SP10
SP11
SP12
SP13
11.94
11.99
14.97
15.29
15.46
16.76
16.76
17.38
19.76
19.76
23.03
23.56
28.73
1.565
1.732
1.583
1.789
1.574
1.572
1.445
1.734
1.686
1.610
1.609
1.448
1.492
0.738
0.570
0.718
0.520
0.728
0.730
0.882
0.569
0.613
0.689
0.690
0.878
0.823
220
300
150
260
115
125
28
200
120
95
112
50
38
Table 4.6 Soil initial state and oedometer test data of
swelling pressure.
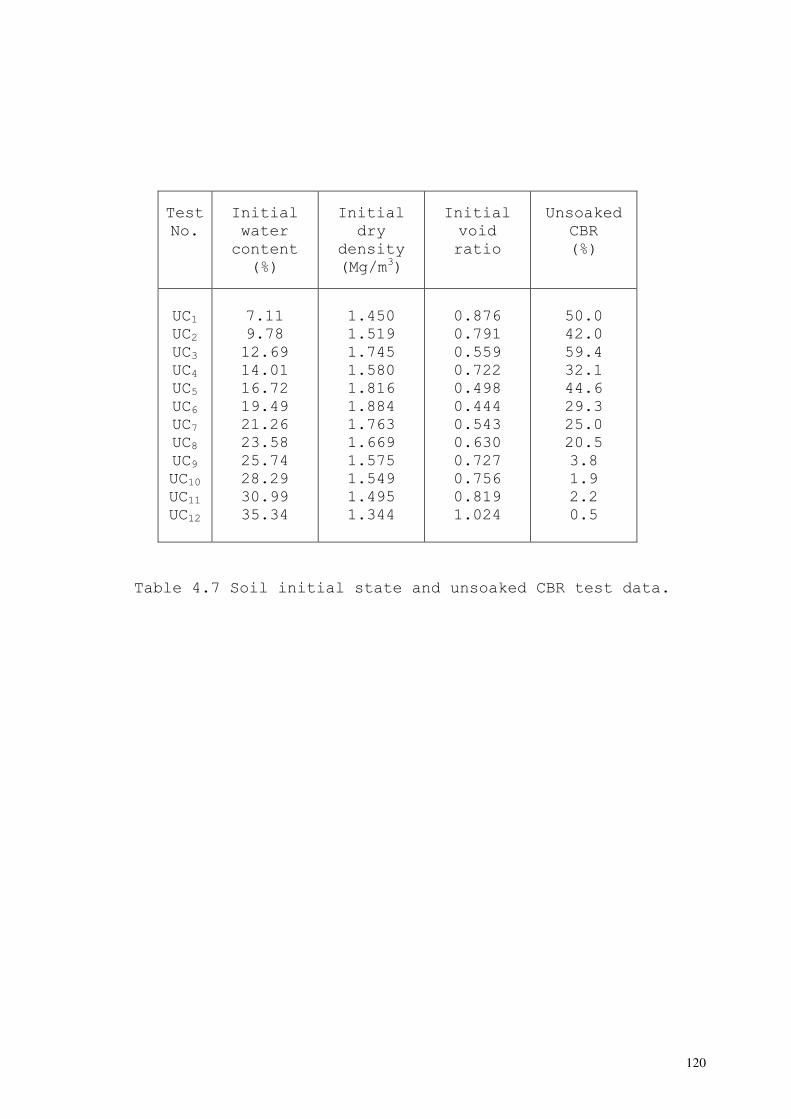
120
Test
No.
Initial
water
content
(%)
Initial
dry
density
(Mg/m3)
Initial
void
ratio
Unsoaked
CBR
(%)
UC1
UC2
UC3
UC4 UC5 UC6
UC7
UC8
UC9
UC10
UC11
UC12
7.11
9.78
12.69
14.01
16.72
19.49
21.26
23.58
25.74
28.29
30.99
35.34
1.450
1.519
1.745
1.580
1.816
1.884
1.763
1.669
1.575
1.549
1.495
1.344
0.876
0.791
0.559
0.722
0.498
0.444
0.543
0.630
0.727
0.756
0.819
1.024
50.0
42.0
59.4
32.1
44.6
29.3
25.0
20.5
3.8
1.9
2.2
0.5
Table 4.7 Soil initial state and unsoaked CBR test data.
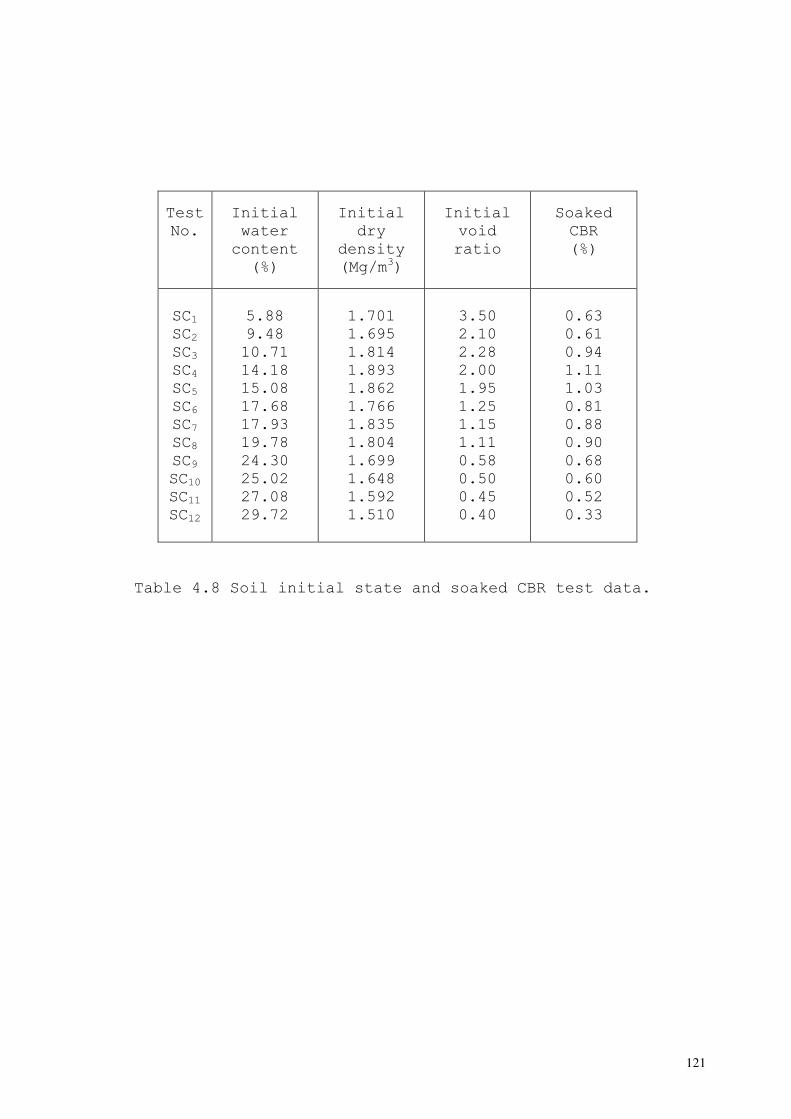
121
Test
No.
Initial
water
content
(%)
Initial
dry
density
(Mg/m3)
Initial
void
ratio
Soaked
CBR
(%)
SC1
SC2
SC3
SC4 SC5 SC6
SC7
SC8
SC9
SC10
SC11
SC12
5.88
9.48
10.71
14.18
15.08
17.68
17.93
19.78
24.30
25.02
27.08
29.72
1.701
1.695
1.814
1.893
1.862
1.766
1.835
1.804
1.699
1.648
1.592
1.510
3.50
2.10
2.28
2.00
1.95
1.25
1.15
1.11
0.58
0.50
0.45
0.40
0.63
0.61
0.94
1.11
1.03
0.81
0.88
0.90
0.68
0.60
0.52
0.33
Table 4.8 Soil initial state and soaked CBR test data.
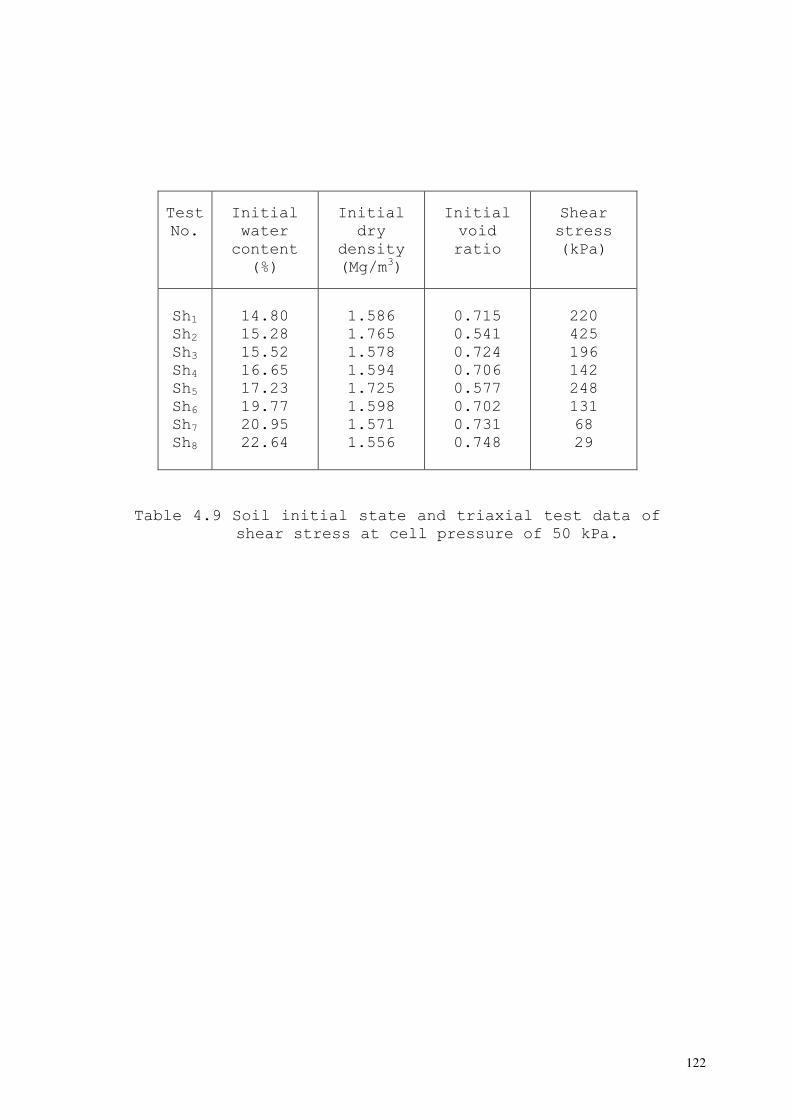
122
Test
No.
Initial
water
content
(%)
Initial
dry
density
(Mg/m3)
Initial
void
ratio
Shear
stress
(kPa)
Sh1
Sh2
Sh3
Sh4 Sh5 Sh6
Sh7
Sh8
14.80
15.28
15.52
16.65
17.23
19.77
20.95
22.64
1.586
1.765
1.578
1.594
1.725
1.598
1.571
1.556
0.715
0.541
0.724
0.706
0.577
0.702
0.731
0.748
220
425
196
142
248
131
68
29
Table 4.9 Soil initial state and triaxial test data of
shear stress at cell pressure of 50 kPa.
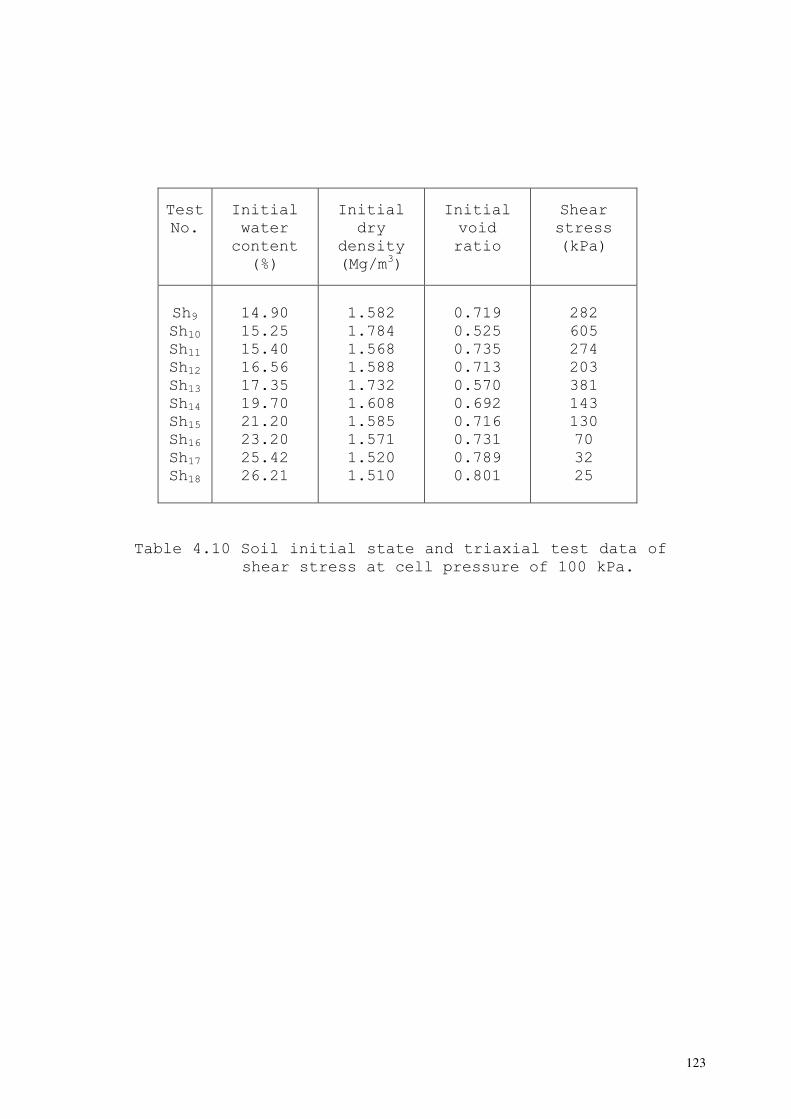
123
Test
No.
Initial
water
content
(%)
Initial
dry
density
(Mg/m3)
Initial
void
ratio
Shear
stress
(kPa)
Sh9
Sh10
Sh11
Sh12 Sh13 Sh14
Sh15
Sh16
Sh17
Sh18
14.90
15.25
15.40
16.56
17.35
19.70
21.20
23.20
25.42
26.21
1.582
1.784
1.568
1.588
1.732
1.608
1.585
1.571
1.520
1.510
0.719
0.525
0.735
0.713
0.570
0.692
0.716
0.731
0.789
0.801
282
605
274
203
381
143
130
70
32
25
Table 4.10 Soil initial state and triaxial test data of
shear stress at cell pressure of 100 kPa.
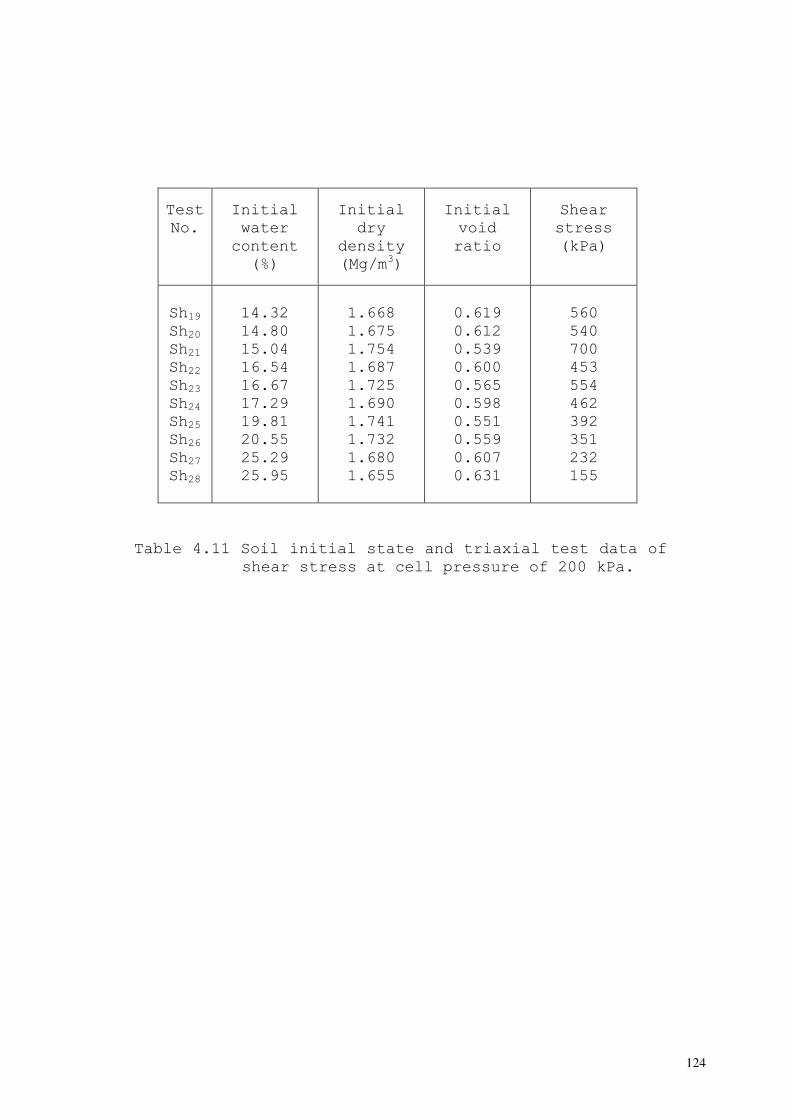
124
Test
No.
Initial
water
content
(%)
Initial
dry
density
(Mg/m3)
Initial
void
ratio
Shear
stress
(kPa)
Sh19
Sh20
Sh21
Sh22 Sh23 Sh24
Sh25
Sh26
Sh27
Sh28
14.32
14.80
15.04
16.54
16.67
17.29
19.81
20.55
25.29
25.95
1.668
1.675
1.754
1.687
1.725
1.690
1.741
1.732
1.680
1.655
0.619
0.612
0.539
0.600
0.565
0.598
0.551
0.559
0.607
0.631
560
540
700
453
554
462
392
351
232
155
Table 4.11 Soil initial state and triaxial test data of
shear stress at cell pressure of 200 kPa.
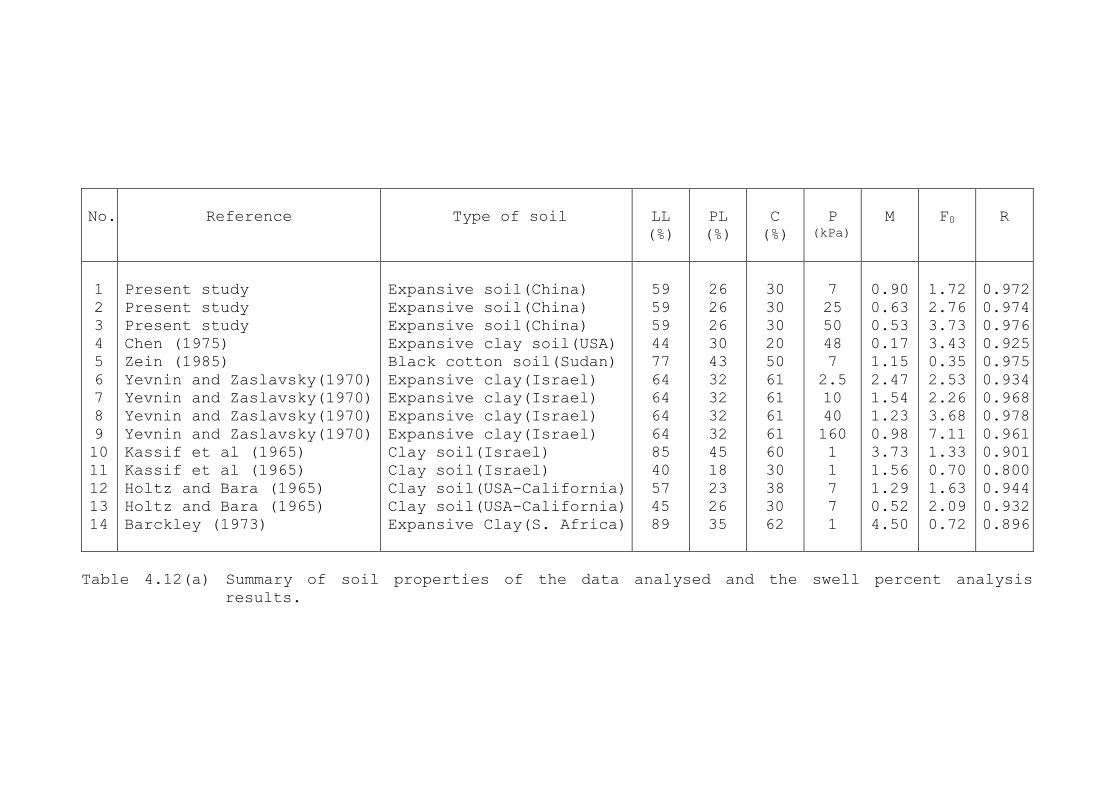
No.
Reference
Type of soil
LL
(%)
PL
(%)
C
(%)
P (kPa)
M
F0
R
1
2
3
4
5
6
7
8
9
10
11
12
13
14
Present study
Present study
Present study
Chen (1975)
Zein (1985)
Yevnin and Zaslavsky(1970)
Yevnin and Zaslavsky(1970)
Yevnin and Zaslavsky(1970)
Yevnin and Zaslavsky(1970)
Kassif et al (1965)
Kassif et al (1965)
Holtz and Bara (1965)
Holtz and Bara (1965)
Barckley (1973)
Expansive soil(China)
Expansive soil(China)
Expansive soil(China)
Expansive clay soil(USA)
Black cotton soil(Sudan)
Expansive clay(Israel)
Expansive clay(Israel)
Expansive clay(Israel)
Expansive clay(Israel)
Clay soil(Israel)
Clay soil(Israel)
Clay soil(USA-California)
Clay soil(USA-California)
Expansive Clay(S. Africa)
59
59
59
44
77
64
64
64
64
85
40
57
45
89
26
26
26
30
43
32
32
32
32
45
18
23
26
35
30
30
30
20
50
61
61
61
61
60
30
38
30
62
7
25
50
48
7
2.5
10
40
160
1
1
7
7
1
0.90
0.63
0.53
0.17
1.15
2.47
1.54
1.23
0.98
3.73
1.56
1.29
0.52
4.50
1.72
2.76
3.73
3.43
0.35
2.53
2.26
3.68
7.11
1.33
0.70
1.63
2.09
0.72
0.972
0.974
0.976
0.925
0.975
0.934
0.968
0.978
0.961
0.901
0.800
0.944
0.932
0.896
Table 4.12(a) Summary of soil properties of the data analysed and the swell percent analysis
results.
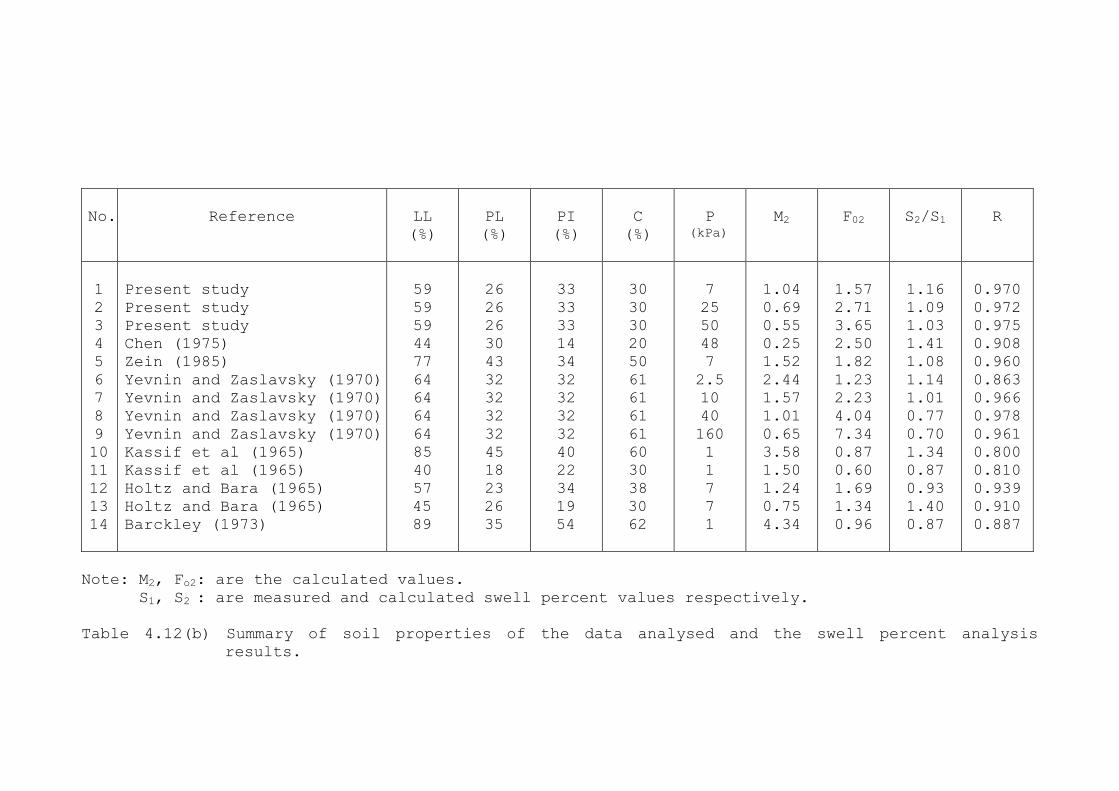
No.
Reference
LL
(%)
PL
(%)
PI
(%)
C
(%)
P (kPa)
M2
F02
S2/S1
R
1
2
3
4
5
6
7
8
9
10
11
12
13
14
Present study
Present study
Present study
Chen (1975)
Zein (1985)
Yevnin and Zaslavsky (1970)
Yevnin and Zaslavsky (1970)
Yevnin and Zaslavsky (1970)
Yevnin and Zaslavsky (1970)
Kassif et al (1965)
Kassif et al (1965)
Holtz and Bara (1965)
Holtz and Bara (1965)
Barckley (1973)
59
59
59
44
77
64
64
64
64
85
40
57
45
89
26
26
26
30
43
32
32
32
32
45
18
23
26
35
33
33
33
14
34
32
32
32
32
40
22
34
19
54
30
30
30
20
50
61
61
61
61
60
30
38
30
62
7
25
50
48
7
2.5
10
40
160
1
1
7
7
1
1.04
0.69
0.55
0.25
1.52
2.44
1.57
1.01
0.65
3.58
1.50
1.24
0.75
4.34
1.57
2.71
3.65
2.50
1.82
1.23
2.23
4.04
7.34
0.87
0.60
1.69
1.34
0.96
1.16
1.09
1.03
1.41
1.08
1.14
1.01
0.77
0.70
1.34
0.87
0.93
1.40
0.87
0.970
0.972
0.975
0.908
0.960
0.863
0.966
0.978
0.961
0.800
0.810
0.939
0.910
0.887
Note: M2, Fo2: are the calculated values.
S1, S2 : are measured and calculated swell percent values respectively.
Table 4.12(b) Summary of soil properties of the data analysed and the swell percent analysis
results.
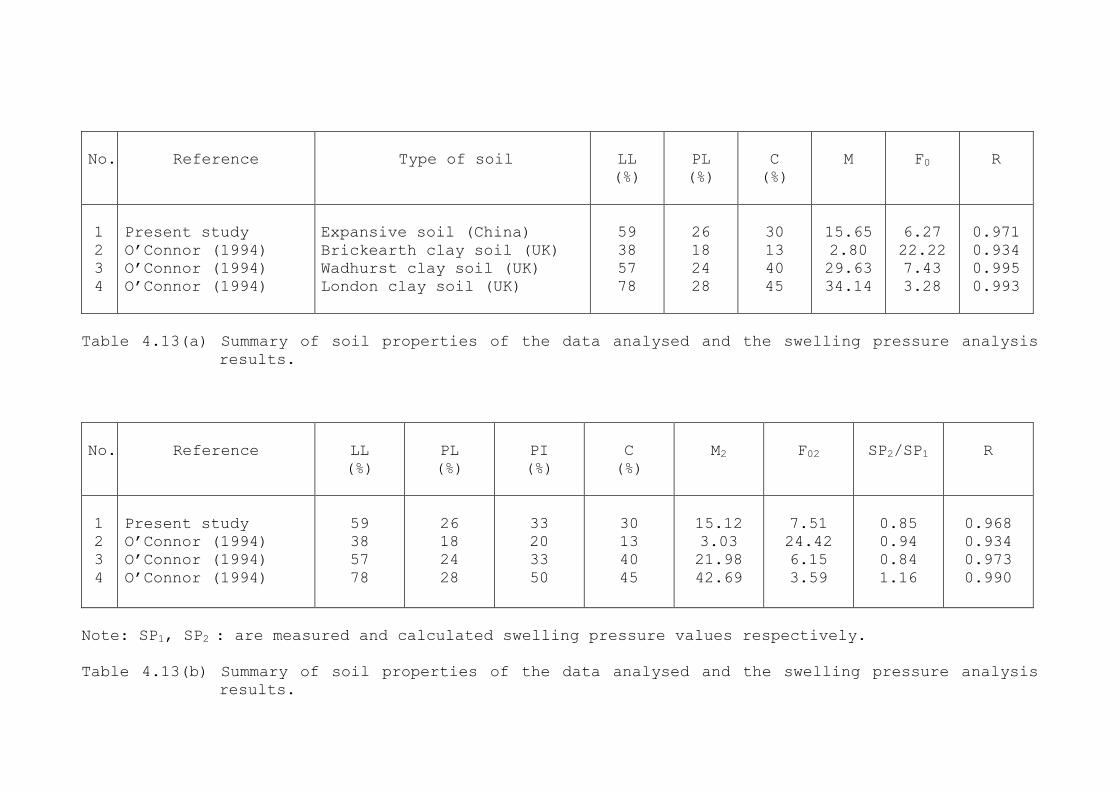
No.
Reference
Type of soil
LL
(%)
PL
(%)
C
(%)
M
F0
R
1
2
3
4
Present study
O’Connor (1994) O’Connor (1994) O’Connor (1994)
Expansive soil (China)
Brickearth clay soil (UK)
Wadhurst clay soil (UK)
London clay soil (UK)
59
38
57
78
26
18
24
28
30
13
40
45
15.65
2.80
29.63
34.14
6.27
22.22
7.43
3.28
0.971
0.934
0.995
0.993
Table 4.13(a) Summary of soil properties of the data analysed and the swelling pressure analysis
results.
No.
Reference
LL
(%)
PL
(%)
PI
(%)
C
(%)
M2
F02
SP2/SP1
R
1
2
3
4
Present study
O’Connor (1994) O’Connor (1994) O’Connor (1994)
59
38
57
78
26
18
24
28
33
20
33
50
30
13
40
45
15.12
3.03
21.98
42.69
7.51
24.42
6.15
3.59
0.85
0.94
0.84
1.16
0.968
0.934
0.973
0.990
Note: SP1, SP2 : are measured and calculated swelling pressure values respectively.
Table 4.13(b) Summary of soil properties of the data analysed and the swelling pressure analysis
results.

No.
Reference
Type of soil
LL
(%)
PL
(%)
C
(%)
M
F0
R
1
2
3
4
5
Present study
El-Tayeb (1991)
El-Tayeb (1991)
Murphy (1966)
Glanville (1951)
Expansive soil(China)
Khartoum black cotton soil(Sudan)
Gezira black cotton soil(Sudan)
Black earth(Australia)
Expansive clay soil(USA)
59
70
65
57
67
26
28
40
35
28
30
61
55
--
--
2.66
1.83
4.55
6.06
2.12
5.13
0.67
2.79
2.43
3.25
0.957
0.978
0.973
0.987
0.982
Table 4.14(a) Summary of soil properties of the data analysed and the unsoaked CBR analysis
results.
No.
Reference
LL
(%)
PL
(%)
PI
(%)
C
(%)
M2
F02
CBR2/CBR1
R
1
2
3
4
5
Present study
El-Tayeb (1991)
El-Tayeb (1991)
Murphy (1966)
Glanville (1951)
59
70
65
57
67
26
28
40
35
28
33
42
25
22
39
30
61
55
--
--
2.78
1.79
4.61
5.82
2.05
5.15
1.50
3.63
1.90
3.35
1.01
0.91
0.90
1.30
0.94
0.911
0.978
0.969
0.897
0.982
Note: CBR1, CBR2 : are measured and calculated unsoaked CBR values respectively.
Table 4.14(b) Summary of soil properties of the data analysed and the unsoaked CBR analysis results.
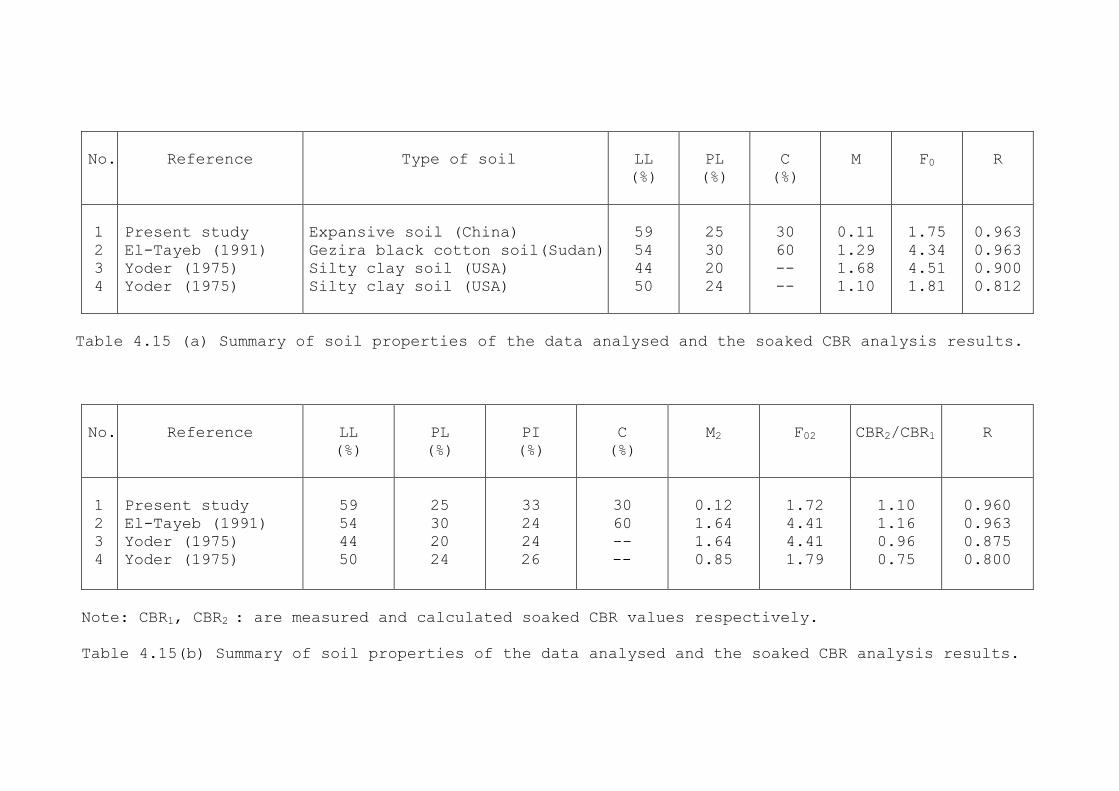
No.
Reference
Type of soil
LL
(%)
PL
(%)
C
(%)
M
F0
R
1
2
3
4
Present study
El-Tayeb (1991)
Yoder (1975)
Yoder (1975)
Expansive soil (China)
Gezira black cotton soil(Sudan)
Silty clay soil (USA)
Silty clay soil (USA)
59
54
44
50
25
30
20
24
30
60
--
--
0.11
1.29
1.68
1.10
1.75
4.34
4.51
1.81
0.963
0.963
0.900
0.812
Table 4.15 (a) Summary of soil properties of the data analysed and the soaked CBR analysis results.
No.
Reference
LL
(%)
PL
(%)
PI
(%)
C
(%)
M2
F02
CBR2/CBR1
R
1
2
3
4
Present study
El-Tayeb (1991)
Yoder (1975)
Yoder (1975)
59
54
44
50
25
30
20
24
33
24
24
26
30
60
--
--
0.12
1.64
1.64
0.85
1.72
4.41
4.41
1.79
1.10
1.16
0.96
0.75
0.960
0.963
0.875
0.800
Note: CBR1, CBR2 : are measured and calculated soaked CBR values respectively.
Table 4.15(b) Summary of soil properties of the data analysed and the soaked CBR analysis results.
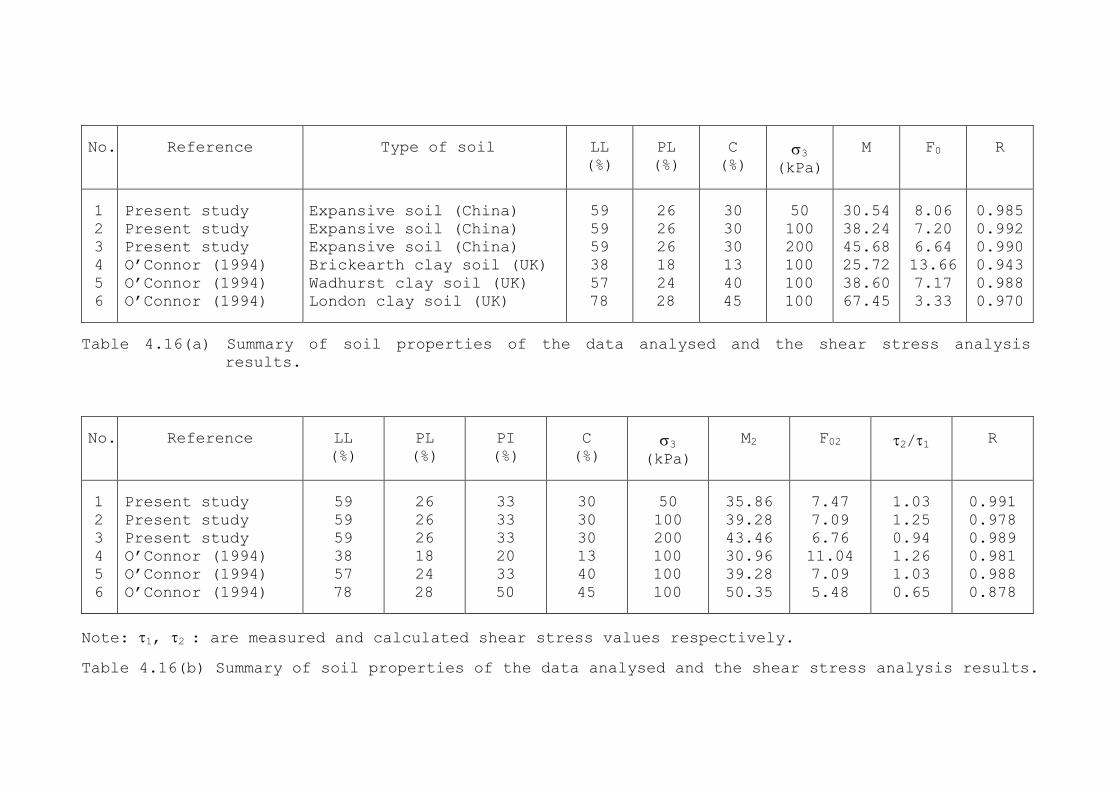
No.
Reference
Type of soil
LL
(%)
PL
(%)
C
(%)
3 (kPa)
M
F0
R
1
2
3
4
5
6
Present study
Present study
Present study
O’Connor (1994) O’Connor (1994) O’Connor (1994)
Expansive soil (China)
Expansive soil (China)
Expansive soil (China)
Brickearth clay soil (UK)
Wadhurst clay soil (UK)
London clay soil (UK)
59
59
59
38
57
78
26
26
26
18
24
28
30
30
30
13
40
45
50
100
200
100
100
100
30.54
38.24
45.68
25.72
38.60
67.45
8.06
7.20
6.64
13.66
7.17
3.33
0.985
0.992
0.990
0.943
0.988
0.970
Table 4.16(a) Summary of soil properties of the data analysed and the shear stress analysis
results.
No.
Reference
LL
(%)
PL
(%)
PI
(%)
C
(%)
3 (kPa)
M2
F02
2/1
R
1
2
3
4
5
6
Present study
Present study
Present study
O’Connor (1994) O’Connor (1994) O’Connor (1994)
59
59
59
38
57
78
26
26
26
18
24
28
33
33
33
20
33
50
30
30
30
13
40
45
50
100
200
100
100
100
35.86
39.28
43.46
30.96
39.28
50.35
7.47
7.09
6.76
11.04
7.09
5.48
1.03
1.25
0.94
1.26
1.03
0.65
0.991
0.978
0.989
0.981
0.988
0.878
Note: 1, 2 : are measured and calculated shear stress values respectively.
Table 4.16(b) Summary of soil properties of the data analysed and the shear stress analysis results.
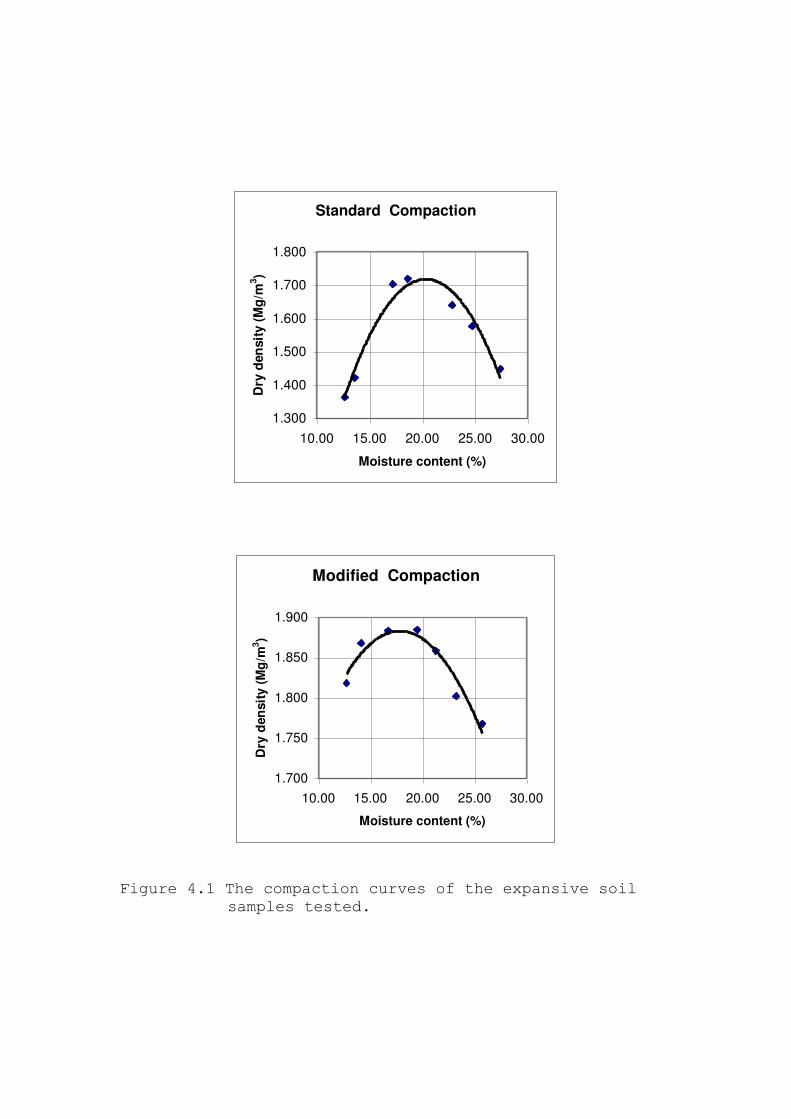
Standard Compaction
1.300
1.400
1.500
1.600
1.700
1.800
10.00 15.00 20.00 25.00 30.00
Moisture content (%)
Dry
den
sit
y (
Mg
/m3)
Modified Compaction
1.700
1.750
1.800
1.850
1.900
10.00 15.00 20.00 25.00 30.00
Moisture content (%)
Dry
den
sit
y (
Mg
/m3)
Figure 4.1 The compaction curves of the expansive soil
samples tested.
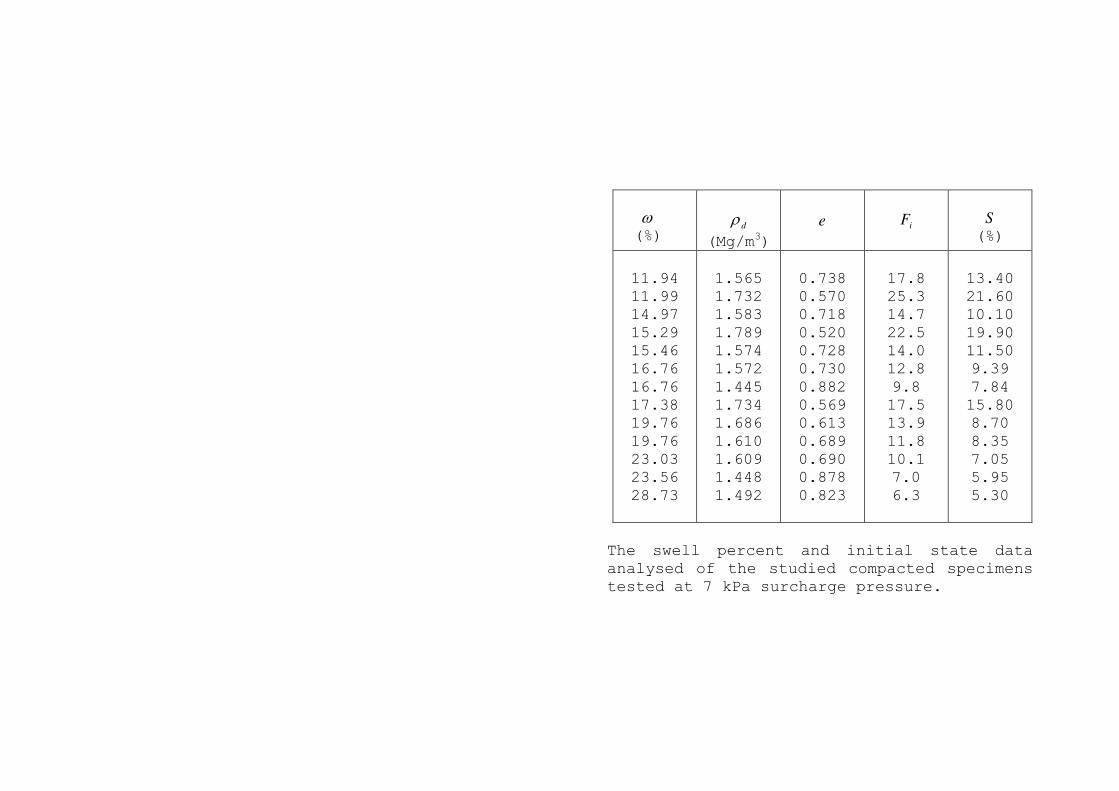
(%)
d
(Mg/m3)
e
iF
S
(%)
11.94
11.99
14.97
15.29
15.46
16.76
16.76
17.38
19.76
19.76
23.03
23.56
28.73
1.565
1.732
1.583
1.789
1.574
1.572
1.445
1.734
1.686
1.610
1.609
1.448
1.492
0.738
0.570
0.718
0.520
0.728
0.730
0.882
0.569
0.613
0.689
0.690
0.878
0.823
17.8
25.3
14.7
22.5
14.0
12.8
9.8
17.5
13.9
11.8
10.1
7.0
6.3
13.40
21.60
10.10
19.90
11.50
9.39
7.84
15.80
8.70
8.35
7.05
5.95
5.30
The swell percent and initial state data
analysed of the studied compacted specimens
tested at 7 kPa surcharge pressure.
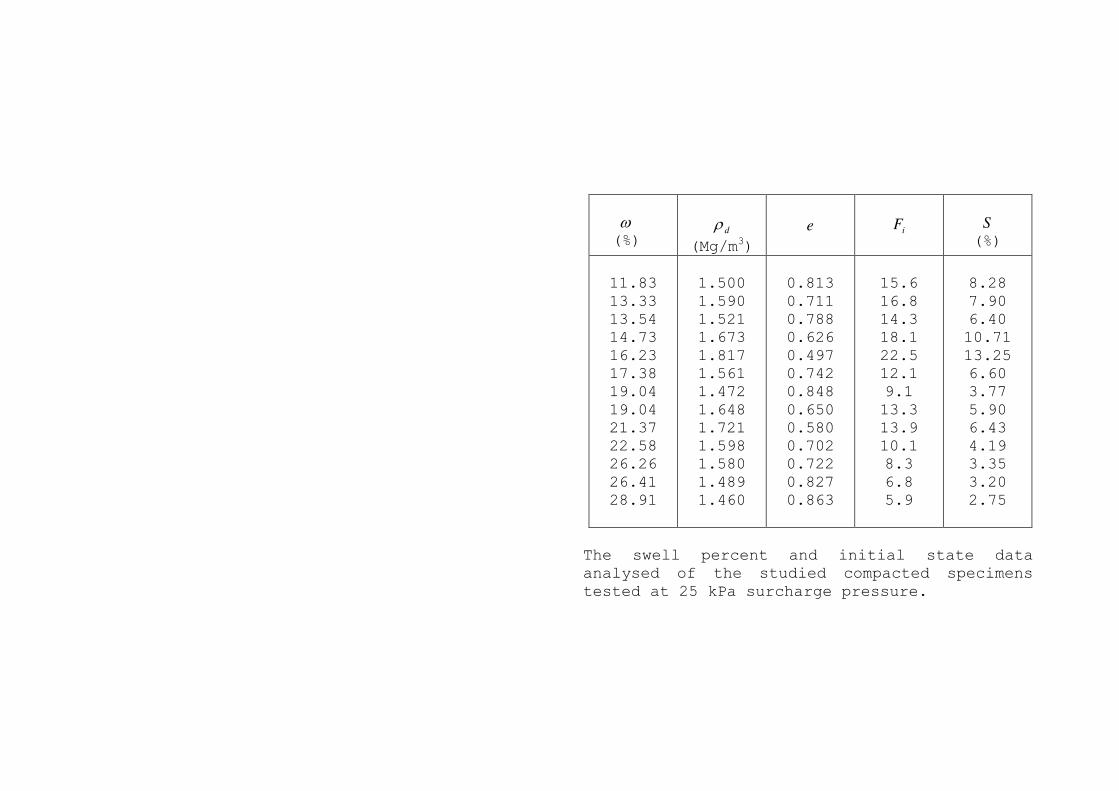
(%)
d
(Mg/m3)
e
iF
S
(%)
11.83
13.33
13.54
14.73
16.23
17.38
19.04
19.04
21.37
22.58
26.26
26.41
28.91
1.500
1.590
1.521
1.673
1.817
1.561
1.472
1.648
1.721
1.598
1.580
1.489
1.460
0.813
0.711
0.788
0.626
0.497
0.742
0.848
0.650
0.580
0.702
0.722
0.827
0.863
15.6
16.8
14.3
18.1
22.5
12.1
9.1
13.3
13.9
10.1
8.3
6.8
5.9
8.28
7.90
6.40
10.71
13.25
6.60
3.77
5.90
6.43
4.19
3.35
3.20
2.75
The swell percent and initial state data
analysed of the studied compacted specimens
tested at 25 kPa surcharge pressure.
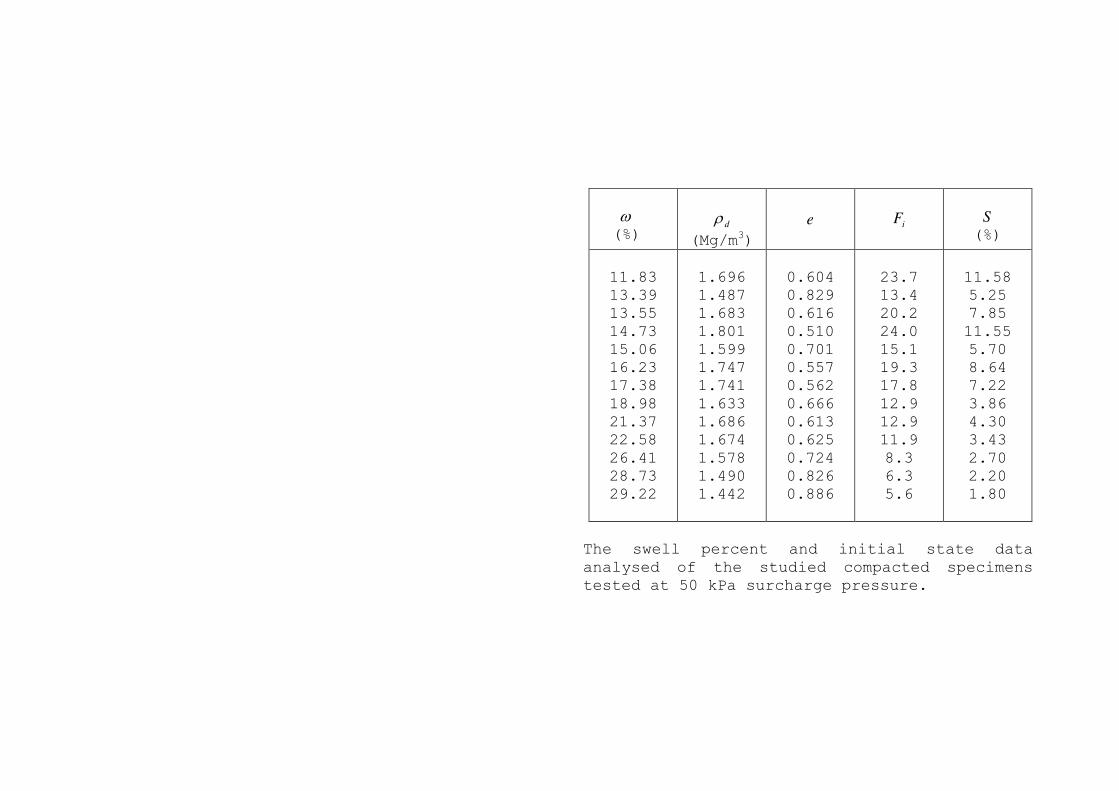
(%)
d
(Mg/m3)
e
iF
S
(%)
11.83
13.39
13.55
14.73
15.06
16.23
17.38
18.98
21.37
22.58
26.41
28.73
29.22
1.696
1.487
1.683
1.801
1.599
1.747
1.741
1.633
1.686
1.674
1.578
1.490
1.442
0.604
0.829
0.616
0.510
0.701
0.557
0.562
0.666
0.613
0.625
0.724
0.826
0.886
23.7
13.4
20.2
24.0
15.1
19.3
17.8
12.9
12.9
11.9
8.3
6.3
5.6
11.58
5.25
7.85
11.55
5.70
8.64
7.22
3.86
4.30
3.43
2.70
2.20
1.80
The swell percent and initial state data
analysed of the studied compacted specimens
tested at 50 kPa surcharge pressure.
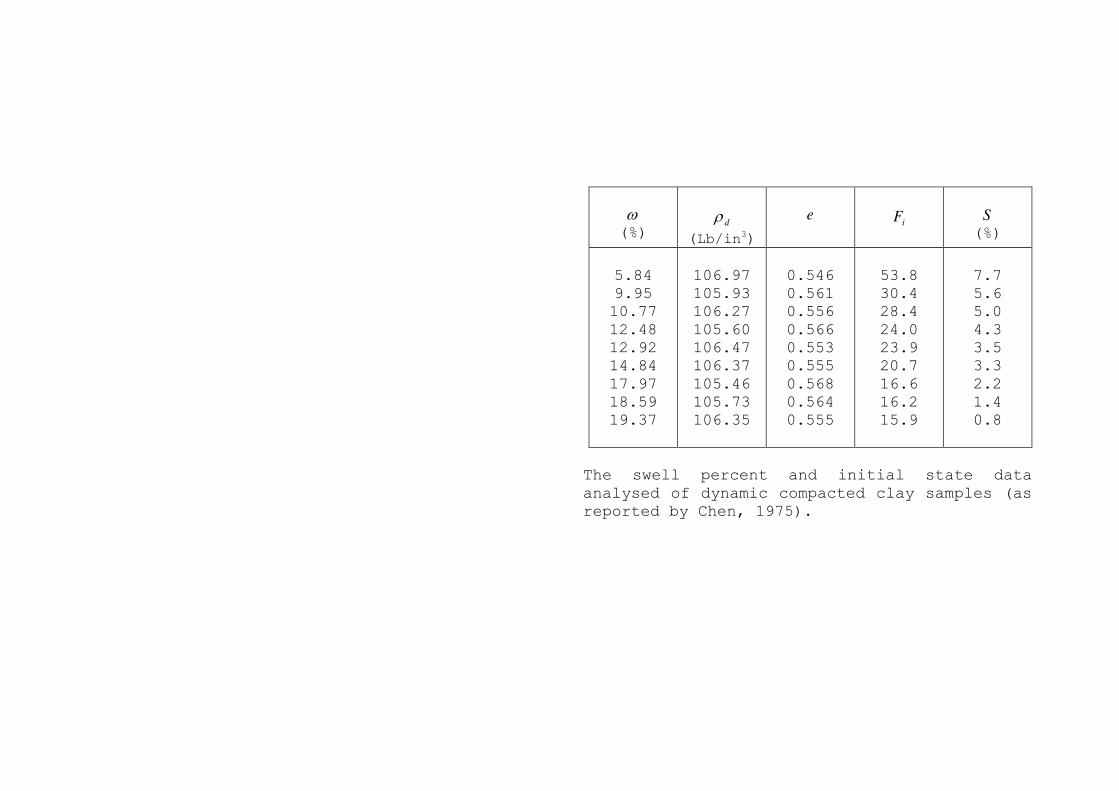
(%)
d
(Lb/in3)
e
iF
S
(%)
5.84
9.95
10.77
12.48
12.92
14.84
17.97
18.59
19.37
106.97
105.93
106.27
105.60
106.47
106.37
105.46
105.73
106.35
0.546
0.561
0.556
0.566
0.553
0.555
0.568
0.564
0.555
53.8
30.4
28.4
24.0
23.9
20.7
16.6
16.2
15.9
7.7
5.6
5.0
4.3
3.5
3.3
2.2
1.4
0.8
The swell percent and initial state data
analysed of dynamic compacted clay samples (as
reported by Chen, 1975).
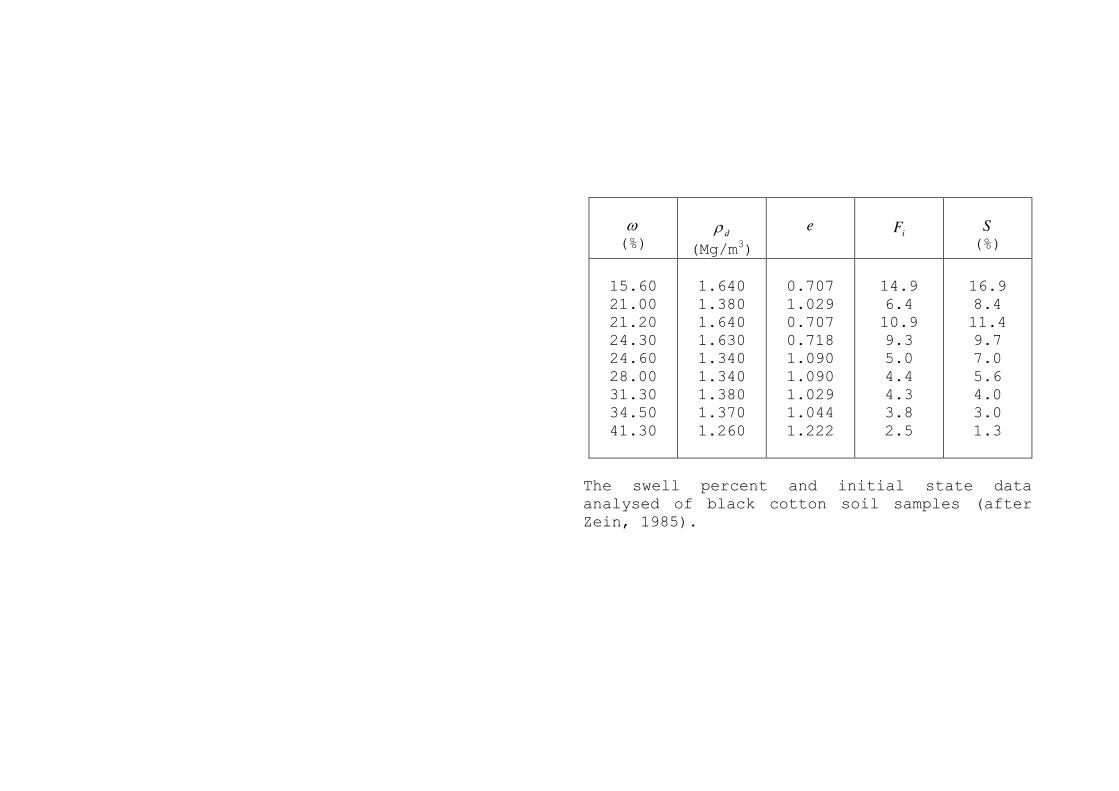
(%)
d
(Mg/m3)
e
iF
S
(%)
15.60
21.00
21.20
24.30
24.60
28.00
31.30
34.50
41.30
1.640
1.380
1.640
1.630
1.340
1.340
1.380
1.370
1.260
0.707
1.029
0.707
0.718
1.090
1.090
1.029
1.044
1.222
14.9
6.4
10.9
9.3
5.0
4.4
4.3
3.8
2.5
16.9
8.4
11.4
9.7
7.0
5.6
4.0
3.0
1.3
The swell percent and initial state data
analysed of black cotton soil samples (after
Zein, 1985).
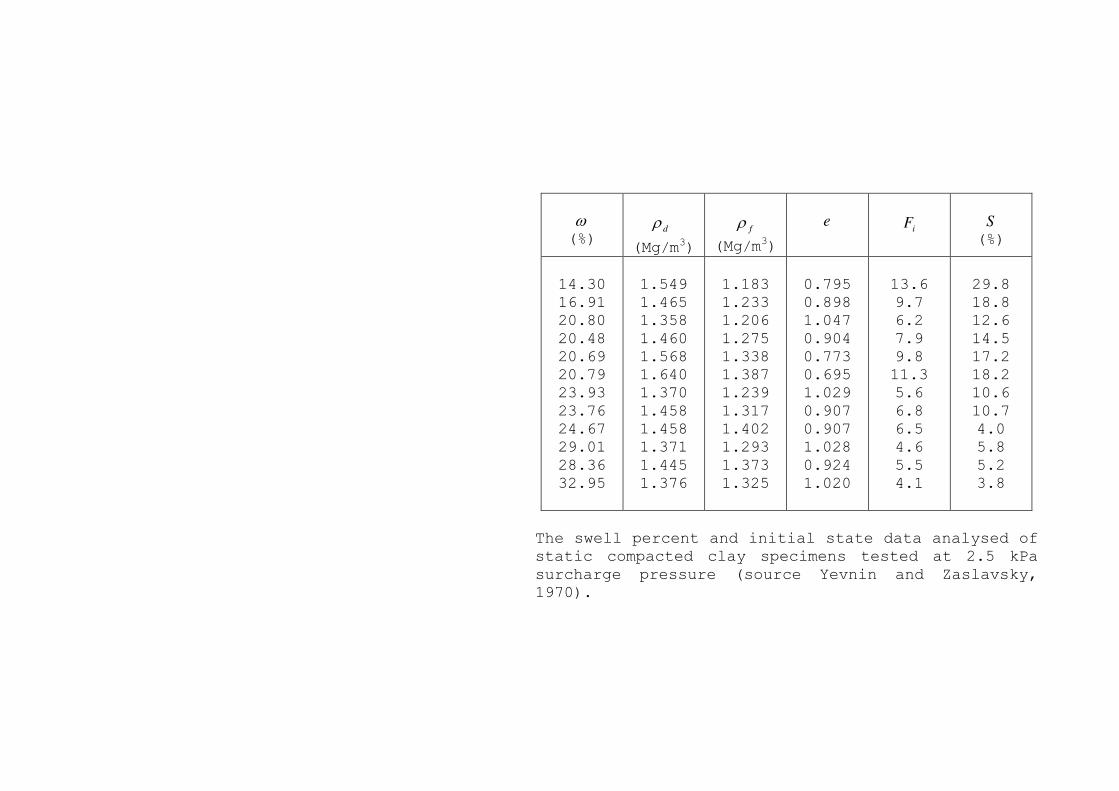
(%)
d
(Mg/m3)
f
(Mg/m3)
e
iF
S
(%)
14.30
16.91
20.80
20.48
20.69
20.79
23.93
23.76
24.67
29.01
28.36
32.95
1.549
1.465
1.358
1.460
1.568
1.640
1.370
1.458
1.458
1.371
1.445
1.376
1.183
1.233
1.206
1.275
1.338
1.387
1.239
1.317
1.402
1.293
1.373
1.325
0.795
0.898
1.047
0.904
0.773
0.695
1.029
0.907
0.907
1.028
0.924
1.020
13.6
9.7
6.2
7.9
9.8
11.3
5.6
6.8
6.5
4.6
5.5
4.1
29.8
18.8
12.6
14.5
17.2
18.2
10.6
10.7
4.0
5.8
5.2
3.8
The swell percent and initial state data analysed of
static compacted clay specimens tested at 2.5 kPa
surcharge pressure (source Yevnin and Zaslavsky,
1970).
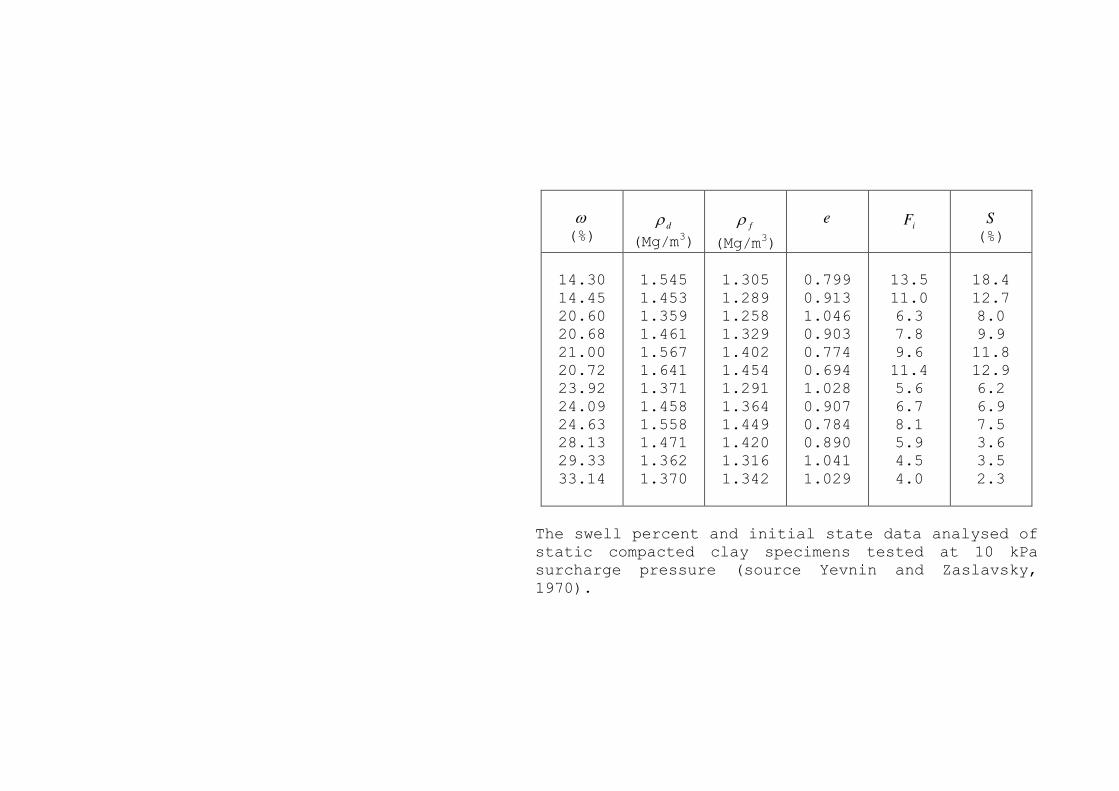
(%)
d
(Mg/m3)
f
(Mg/m3)
e
iF
S
(%)
14.30
14.45
20.60
20.68
21.00
20.72
23.92
24.09
24.63
28.13
29.33
33.14
1.545
1.453
1.359
1.461
1.567
1.641
1.371
1.458
1.558
1.471
1.362
1.370
1.305
1.289
1.258
1.329
1.402
1.454
1.291
1.364
1.449
1.420
1.316
1.342
0.799
0.913
1.046
0.903
0.774
0.694
1.028
0.907
0.784
0.890
1.041
1.029
13.5
11.0
6.3
7.8
9.6
11.4
5.6
6.7
8.1
5.9
4.5
4.0
18.4
12.7
8.0
9.9
11.8
12.9
6.2
6.9
7.5
3.6
3.5
2.3
The swell percent and initial state data analysed of
static compacted clay specimens tested at 10 kPa
surcharge pressure (source Yevnin and Zaslavsky,
1970).

(%)
d
(Mg/m3)
f
(Mg/m3)
e
iF
S
(%)
13.64
14.78
16.97
20.70
20.72
20.65
20.47
23.41
23.94
24.47
29.23
28.27
1.553
1.520
1.457
1.362
1.453
1.558
1.645
1.369
1.452
1.550
1.352
1.457
1.373
1.360
1.347
1.313
1.379
1.457
1.517
1.332
1.399
1.485
1.338
1.438
0.790
0.829
0.908
1.041
0.913
0.784
0.690
1.031
0.915
0.794
1.056
0.908
14.4
12.4
9.5
6.3
7.7
9.6
11.6
5.7
6.6
8.0
4.4
5.7
13.1
11.8
8.2
3.7
5.4
6.9
8.4
2.8
3.8
4.4
1.1
1.3
The swell percent and initial state data analysed of
static compacted clay specimens tested at 40 kPa
surcharge pressure (source Yevnin and Zaslavsky,
1970).
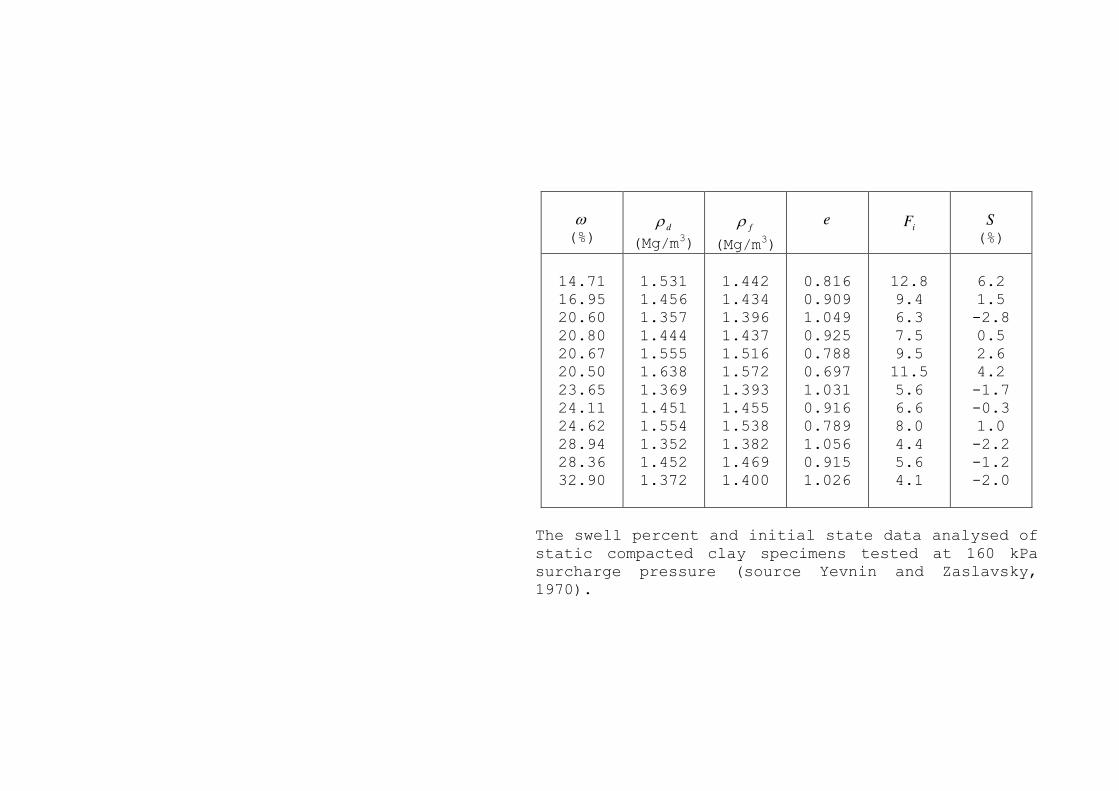
(%)
d
(Mg/m3)
f
(Mg/m3)
e
iF
S
(%)
14.71
16.95
20.60
20.80
20.67
20.50
23.65
24.11
24.62
28.94
28.36
32.90
1.531
1.456
1.357
1.444
1.555
1.638
1.369
1.451
1.554
1.352
1.452
1.372
1.442
1.434
1.396
1.437
1.516
1.572
1.393
1.455
1.538
1.382
1.469
1.400
0.816
0.909
1.049
0.925
0.788
0.697
1.031
0.916
0.789
1.056
0.915
1.026
12.8
9.4
6.3
7.5
9.5
11.5
5.6
6.6
8.0
4.4
5.6
4.1
6.2
1.5
-2.8
0.5
2.6
4.2
-1.7
-0.3
1.0
-2.2
-1.2
-2.0
The swell percent and initial state data analysed of
static compacted clay specimens tested at 160 kPa
surcharge pressure (source Yevnin and Zaslavsky,
1970).
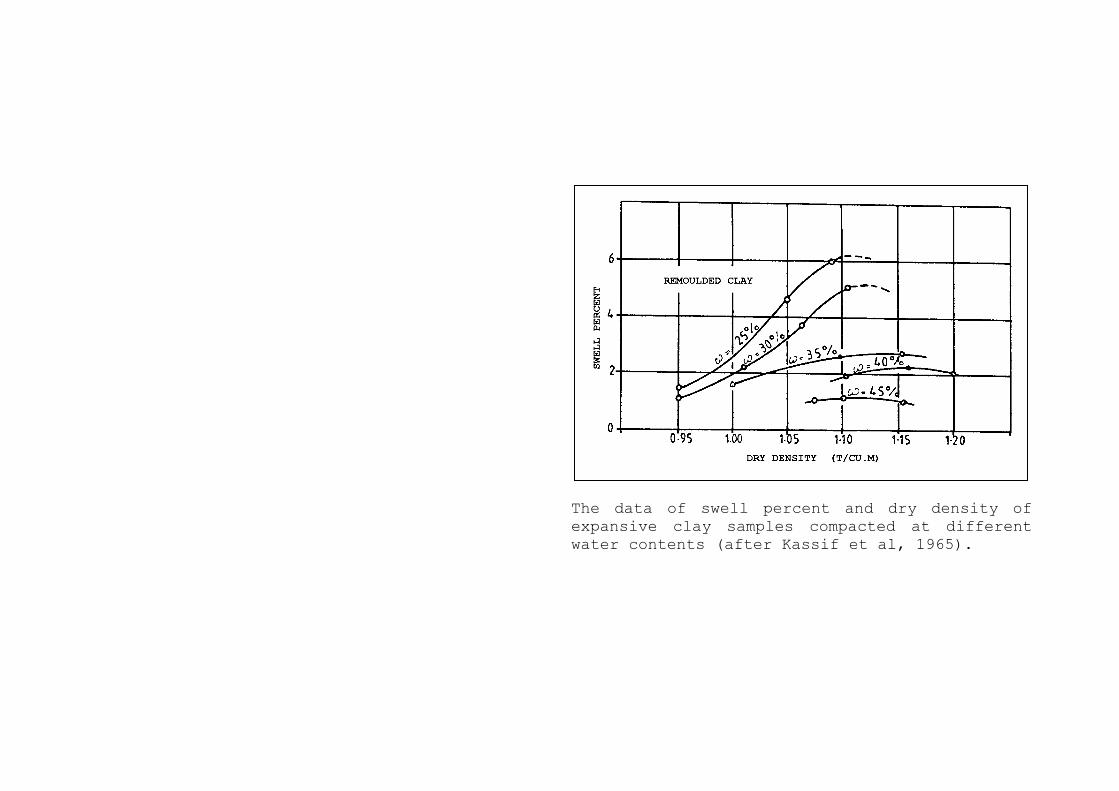
The data of swell percent and dry density of
expansive clay samples compacted at different
water contents (after Kassif et al, 1965).
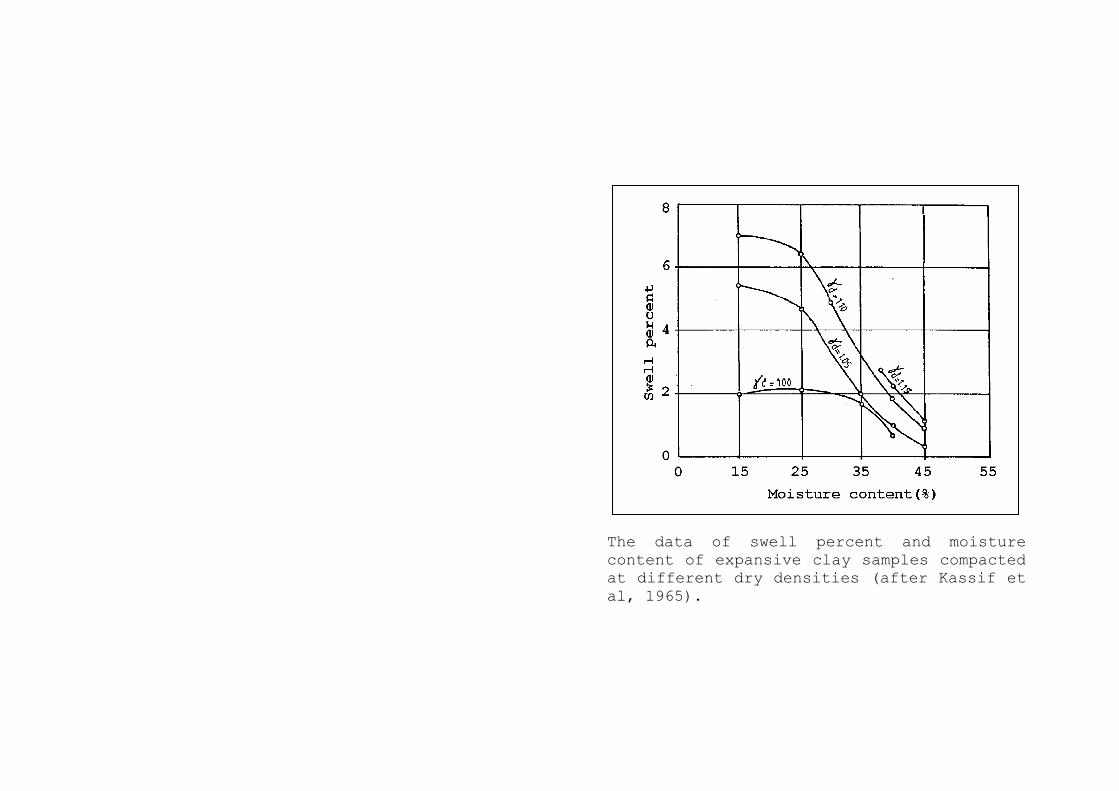
The data of swell percent and moisture
content of expansive clay samples compacted
at different dry densities (after Kassif et
al, 1965).
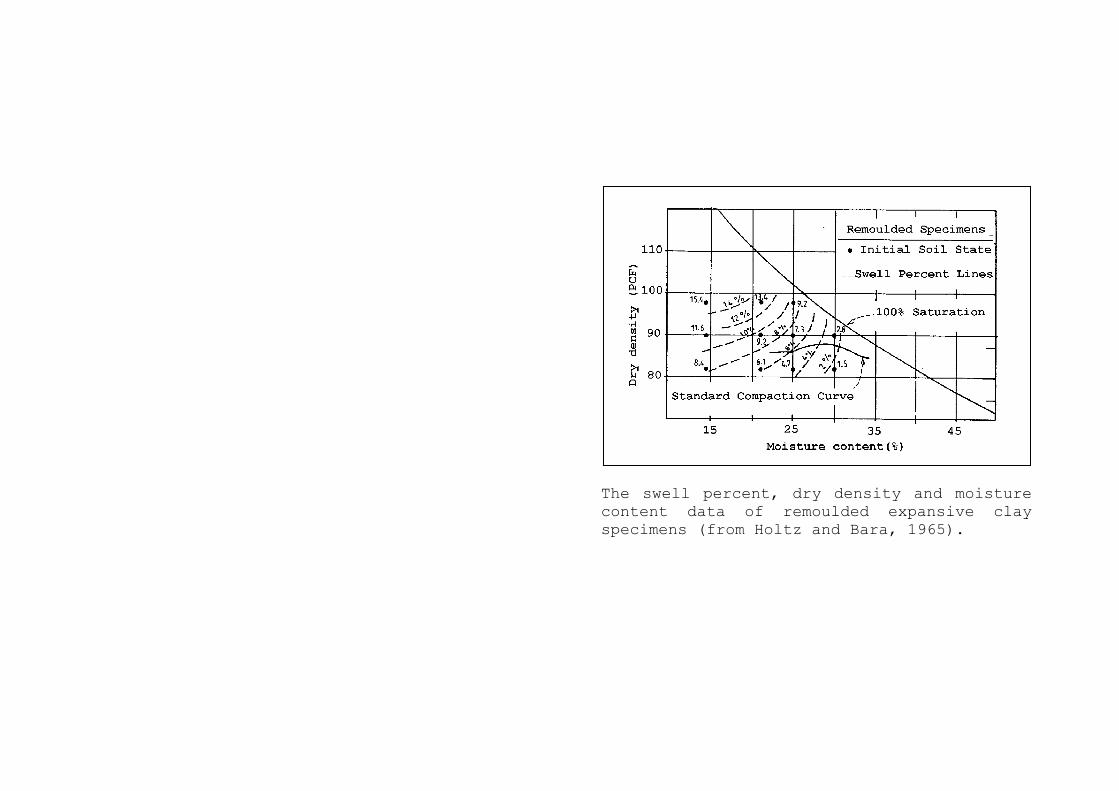
The swell percent, dry density and moisture
content data of remoulded expansive clay
specimens (from Holtz and Bara, 1965).
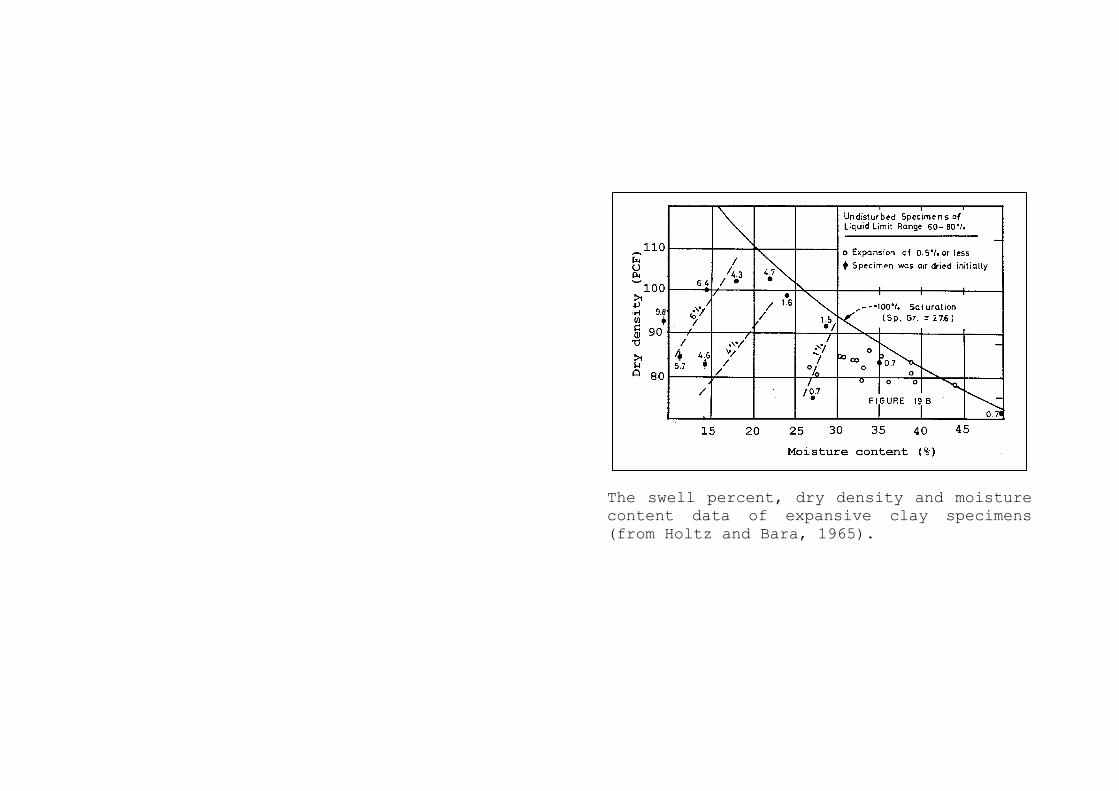
The swell percent, dry density and moisture
content data of expansive clay specimens
(from Holtz and Bara, 1965).
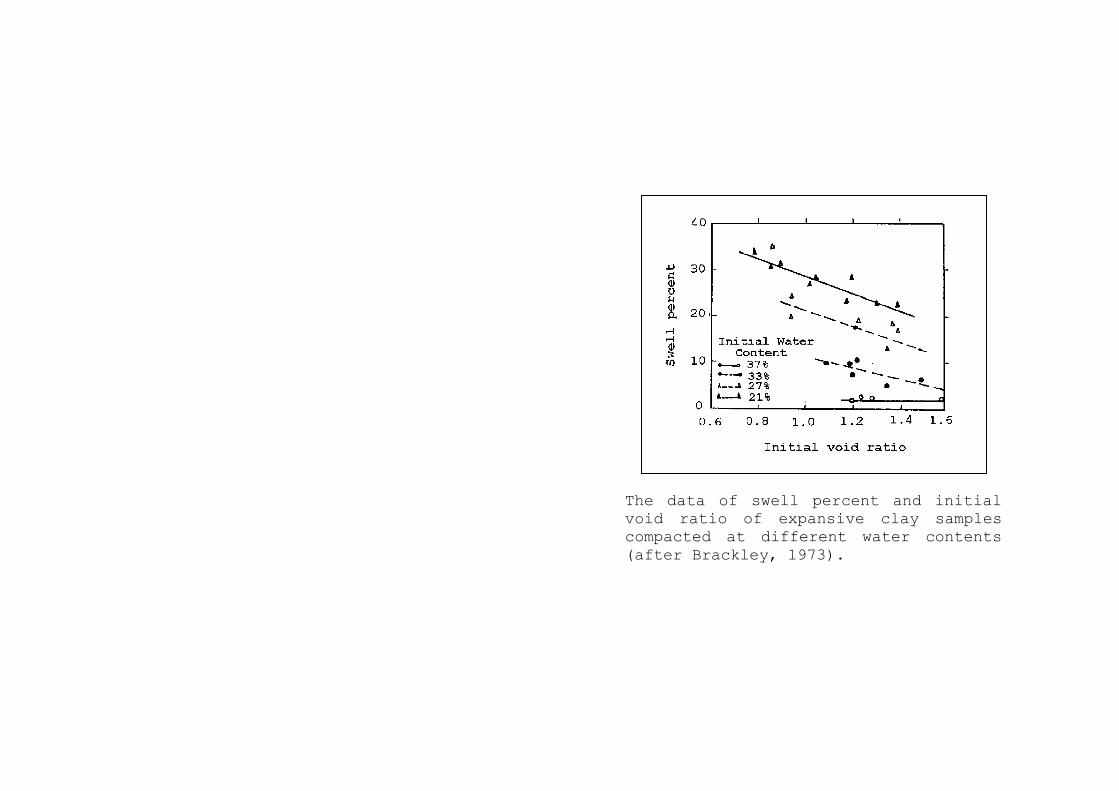
The data of swell percent and initial
void ratio of expansive clay samples
compacted at different water contents
(after Brackley, 1973).
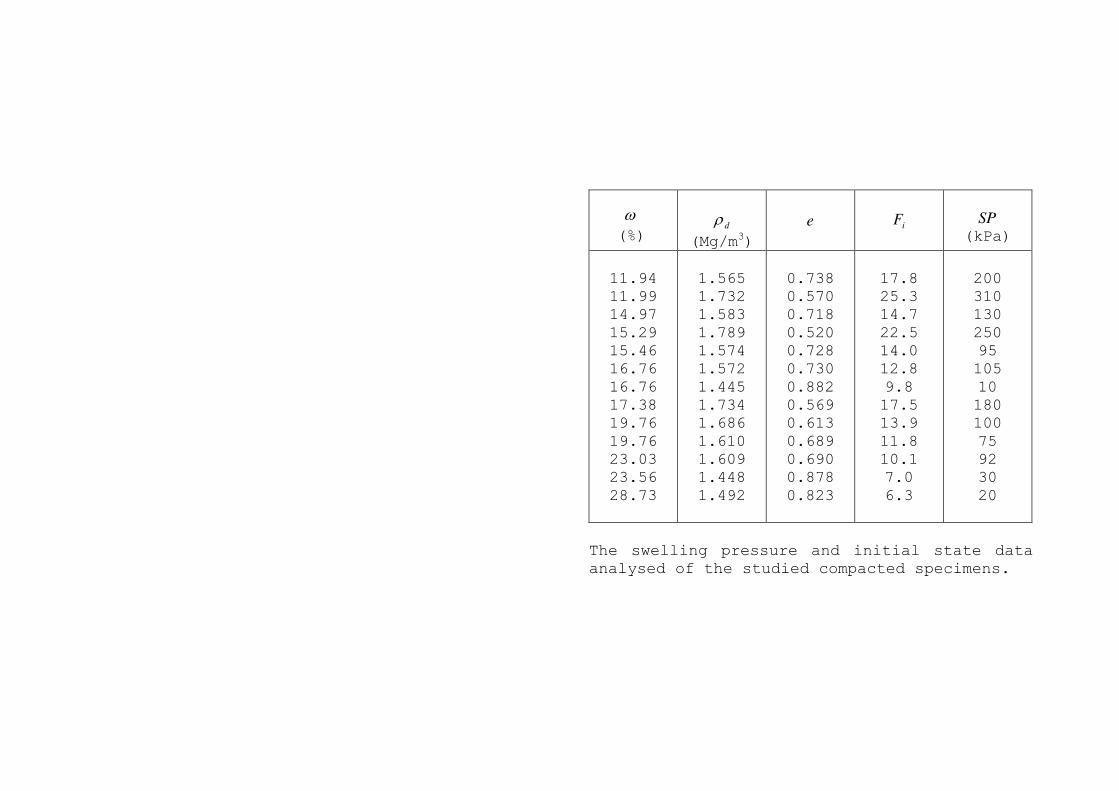
(%)
d
(Mg/m3)
e
iF
SP
(kPa)
11.94
11.99
14.97
15.29
15.46
16.76
16.76
17.38
19.76
19.76
23.03
23.56
28.73
1.565
1.732
1.583
1.789
1.574
1.572
1.445
1.734
1.686
1.610
1.609
1.448
1.492
0.738
0.570
0.718
0.520
0.728
0.730
0.882
0.569
0.613
0.689
0.690
0.878
0.823
17.8
25.3
14.7
22.5
14.0
12.8
9.8
17.5
13.9
11.8
10.1
7.0
6.3
200
310
130
250
95
105
10
180
100
75
92
30
20
The swelling pressure and initial state data
analysed of the studied compacted specimens.
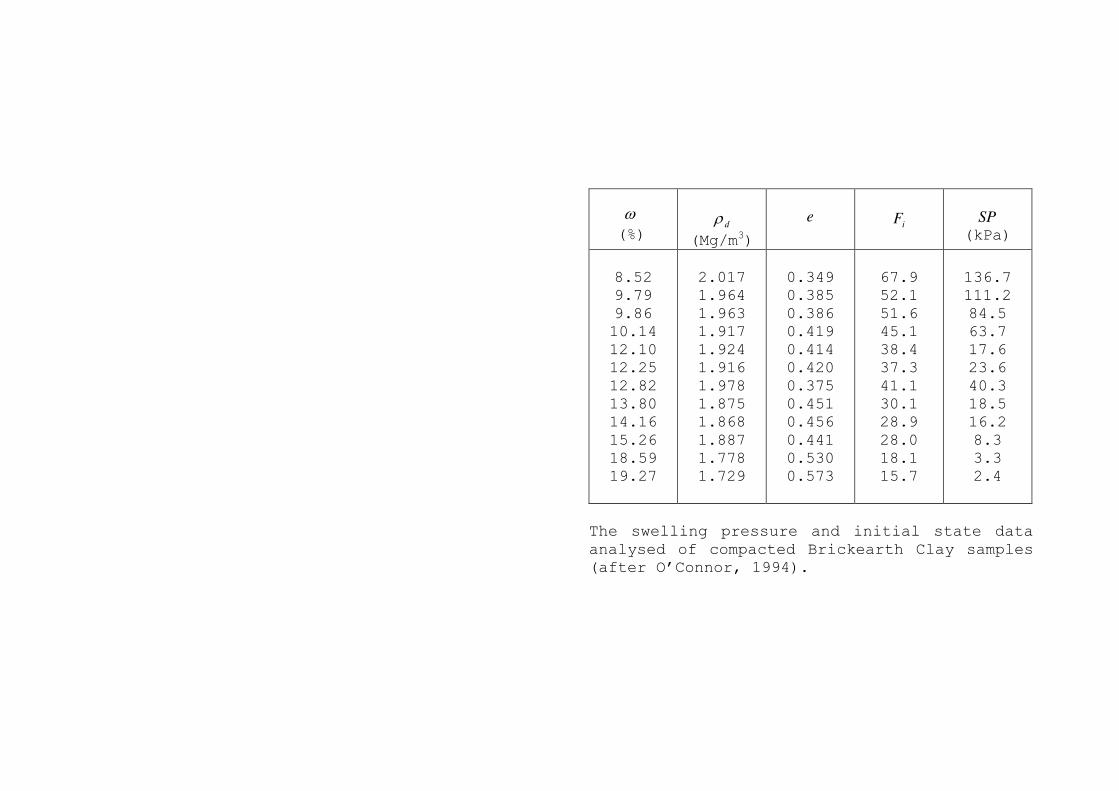
(%)
d
(Mg/m3)
e
iF
SP
(kPa)
8.52
9.79
9.86
10.14
12.10
12.25
12.82
13.80
14.16
15.26
18.59
19.27
2.017
1.964
1.963
1.917
1.924
1.916
1.978
1.875
1.868
1.887
1.778
1.729
0.349
0.385
0.386
0.419
0.414
0.420
0.375
0.451
0.456
0.441
0.530
0.573
67.9
52.1
51.6
45.1
38.4
37.3
41.1
30.1
28.9
28.0
18.1
15.7
136.7
111.2
84.5
63.7
17.6
23.6
40.3
18.5
16.2
8.3
3.3
2.4
The swelling pressure and initial state data
analysed of compacted Brickearth Clay samples
(after O’Connor, 1994).
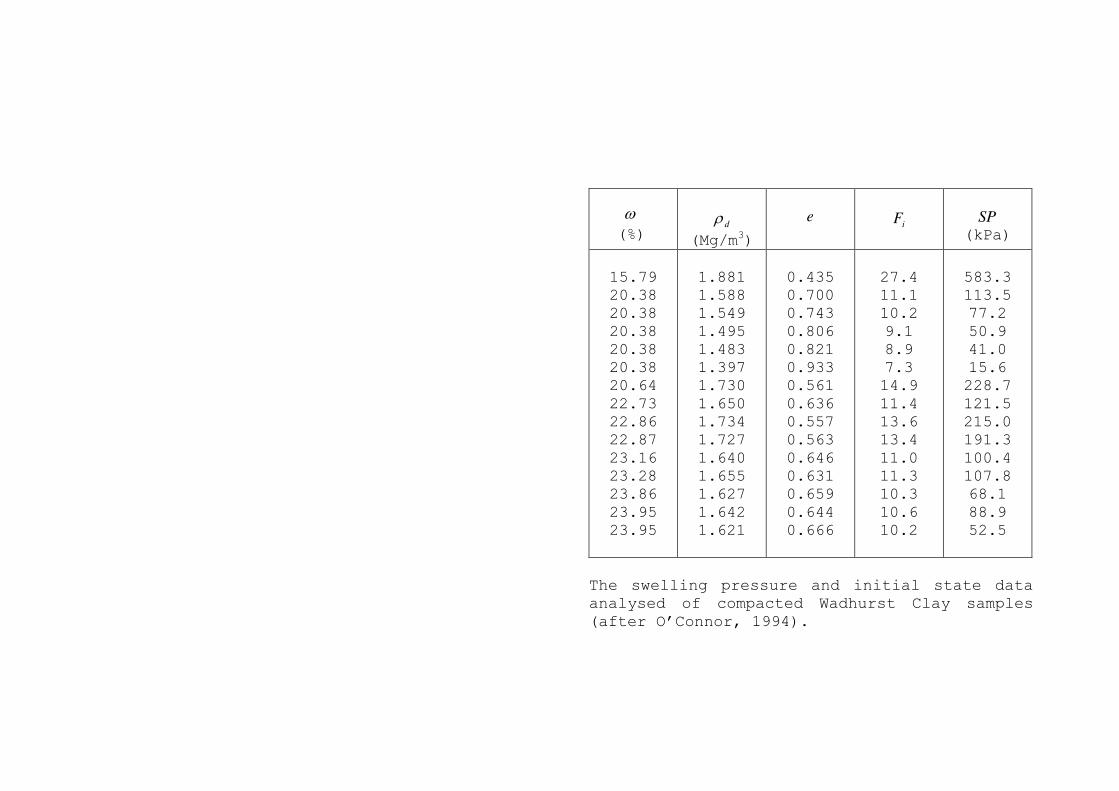
(%)
d
(Mg/m3)
e
iF
SP
(kPa)
15.79
20.38
20.38
20.38
20.38
20.38
20.64
22.73
22.86
22.87
23.16
23.28
23.86
23.95
23.95
1.881
1.588
1.549
1.495
1.483
1.397
1.730
1.650
1.734
1.727
1.640
1.655
1.627
1.642
1.621
0.435
0.700
0.743
0.806
0.821
0.933
0.561
0.636
0.557
0.563
0.646
0.631
0.659
0.644
0.666
27.4
11.1
10.2
9.1
8.9
7.3
14.9
11.4
13.6
13.4
11.0
11.3
10.3
10.6
10.2
583.3
113.5
77.2
50.9
41.0
15.6
228.7
121.5
215.0
191.3
100.4
107.8
68.1
88.9
52.5
The swelling pressure and initial state data
analysed of compacted Wadhurst Clay samples
(after O’Connor, 1994).
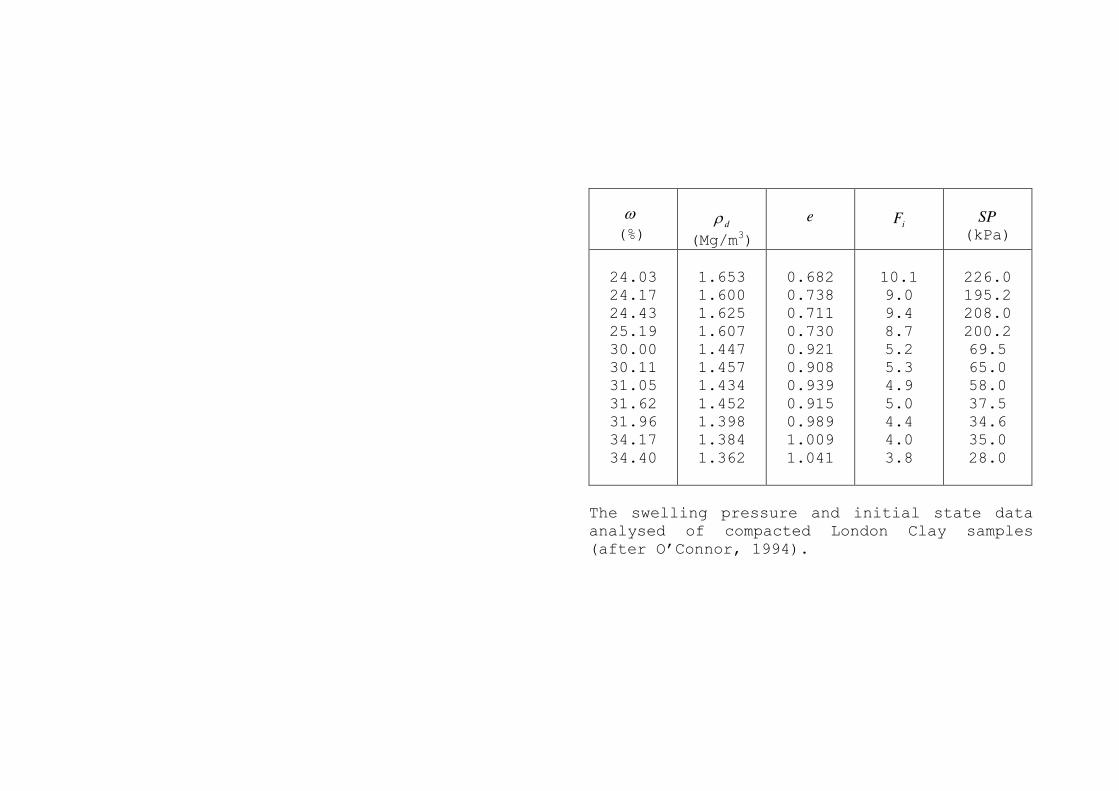
(%)
d
(Mg/m3)
e
iF
SP
(kPa)
24.03
24.17
24.43
25.19
30.00
30.11
31.05
31.62
31.96
34.17
34.40
1.653
1.600
1.625
1.607
1.447
1.457
1.434
1.452
1.398
1.384
1.362
0.682
0.738
0.711
0.730
0.921
0.908
0.939
0.915
0.989
1.009
1.041
10.1
9.0
9.4
8.7
5.2
5.3
4.9
5.0
4.4
4.0
3.8
226.0
195.2
208.0
200.2
69.5
65.0
58.0
37.5
34.6
35.0
28.0
The swelling pressure and initial state data
analysed of compacted London Clay samples
(after O’Connor, 1994).
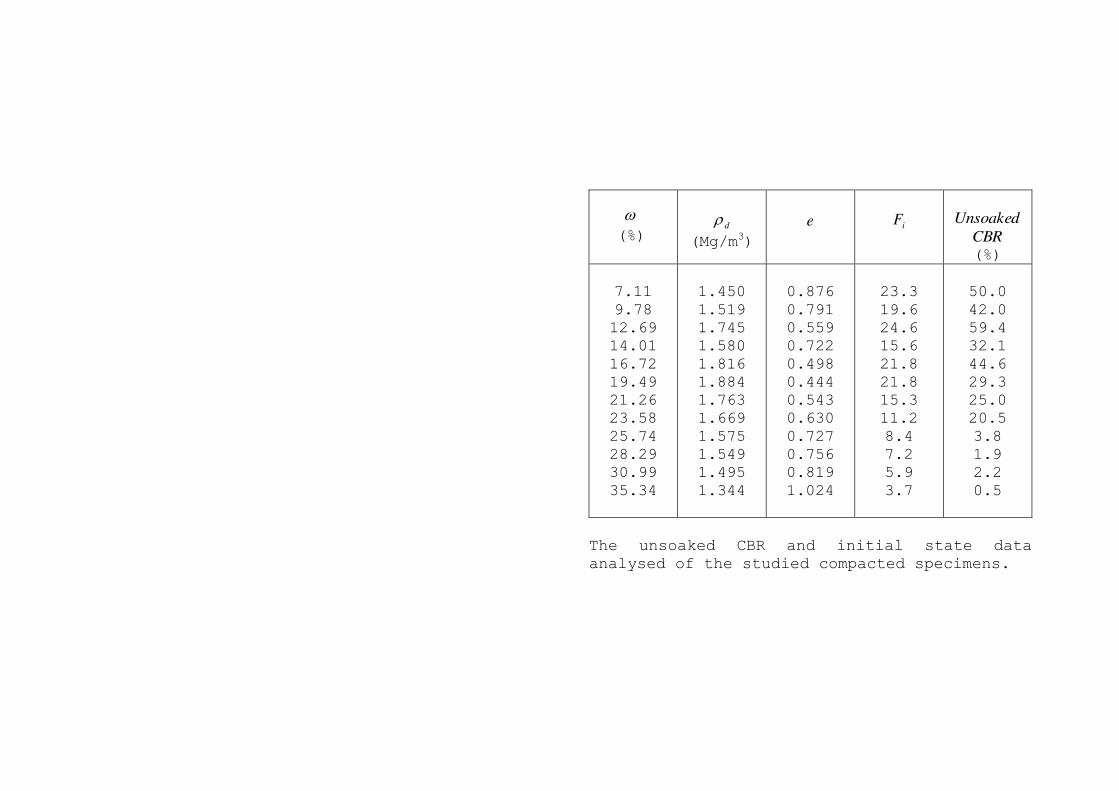
(%)
d
(Mg/m3)
e
iF
Unsoaked
CBR
(%)
7.11
9.78
12.69
14.01
16.72
19.49
21.26
23.58
25.74
28.29
30.99
35.34
1.450
1.519
1.745
1.580
1.816
1.884
1.763
1.669
1.575
1.549
1.495
1.344
0.876
0.791
0.559
0.722
0.498
0.444
0.543
0.630
0.727
0.756
0.819
1.024
23.3
19.6
24.6
15.6
21.8
21.8
15.3
11.2
8.4
7.2
5.9
3.7
50.0
42.0
59.4
32.1
44.6
29.3
25.0
20.5
3.8
1.9
2.2
0.5
The unsoaked CBR and initial state data
analysed of the studied compacted specimens.
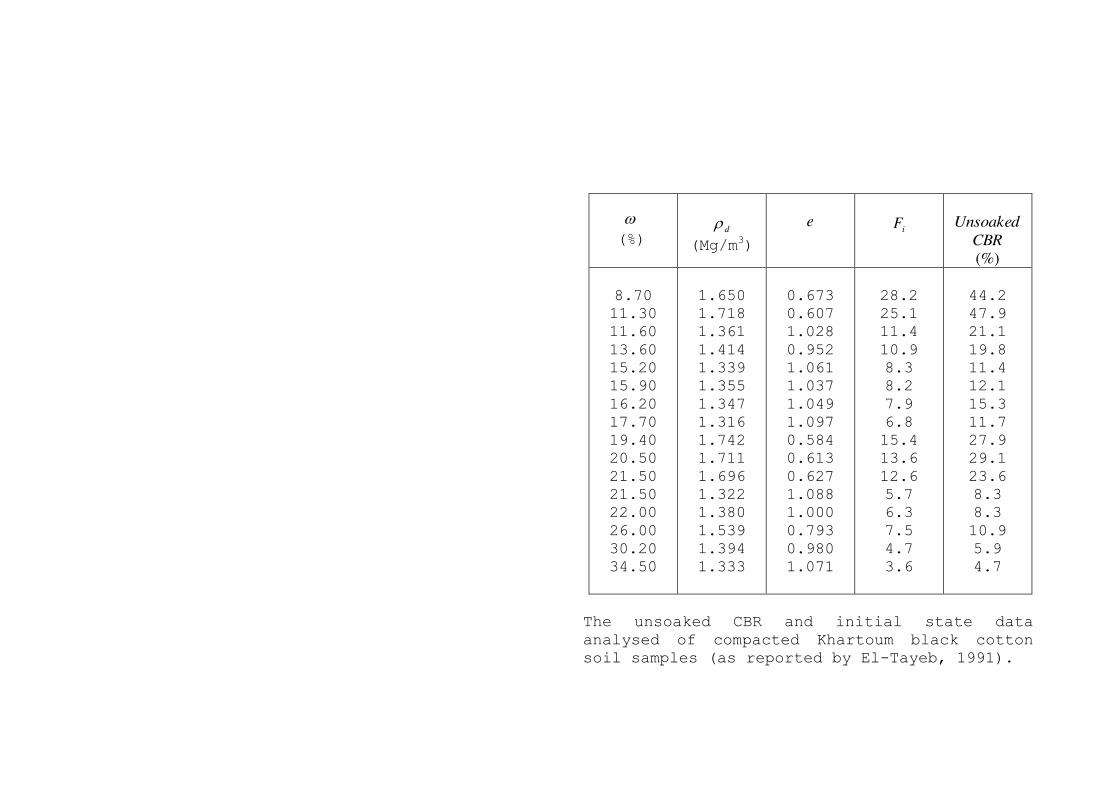
(%)
d
(Mg/m3)
e
iF
Unsoaked
CBR
(%)
8.70
11.30
11.60
13.60
15.20
15.90
16.20
17.70
19.40
20.50
21.50
21.50
22.00
26.00
30.20
34.50
1.650
1.718
1.361
1.414
1.339
1.355
1.347
1.316
1.742
1.711
1.696
1.322
1.380
1.539
1.394
1.333
0.673
0.607
1.028
0.952
1.061
1.037
1.049
1.097
0.584
0.613
0.627
1.088
1.000
0.793
0.980
1.071
28.2
25.1
11.4
10.9
8.3
8.2
7.9
6.8
15.4
13.6
12.6
5.7
6.3
7.5
4.7
3.6
44.2
47.9
21.1
19.8
11.4
12.1
15.3
11.7
27.9
29.1
23.6
8.3
8.3
10.9
5.9
4.7
The unsoaked CBR and initial state data
analysed of compacted Khartoum black cotton
soil samples (as reported by El-Tayeb, 1991).
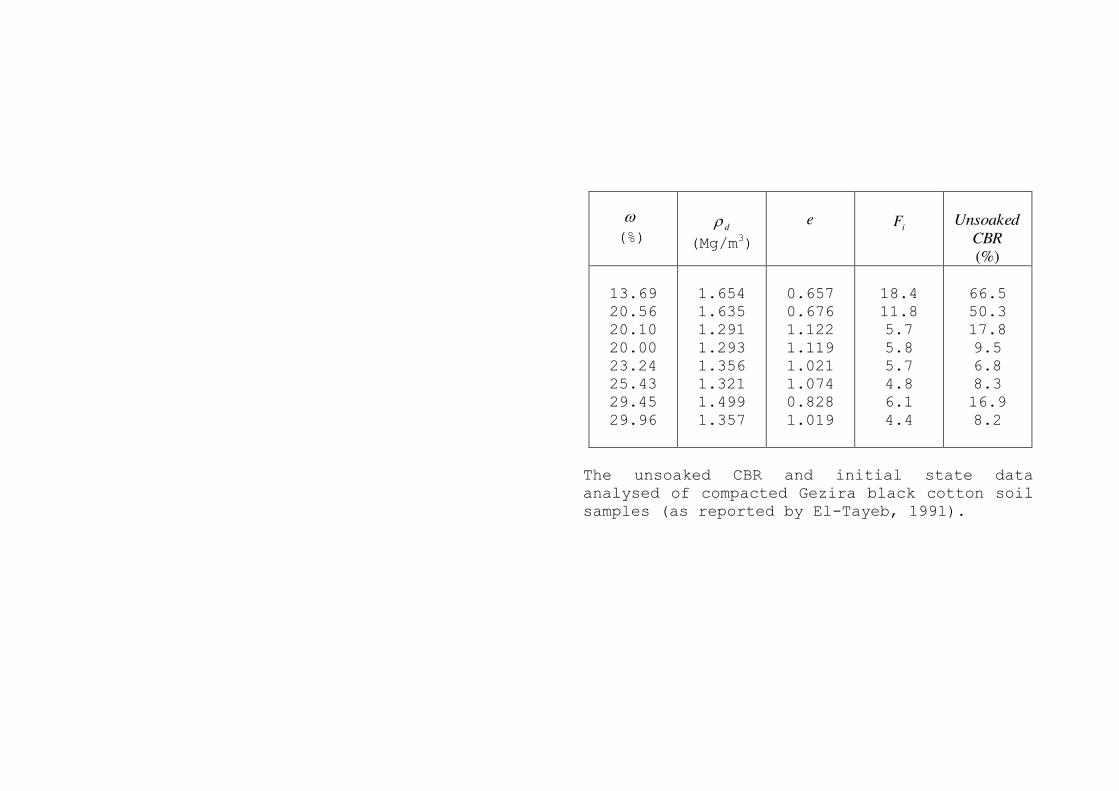
(%)
d
(Mg/m3)
e
iF
Unsoaked
CBR
(%)
13.69
20.56
20.10
20.00
23.24
25.43
29.45
29.96
1.654
1.635
1.291
1.293
1.356
1.321
1.499
1.357
0.657
0.676
1.122
1.119
1.021
1.074
0.828
1.019
18.4
11.8
5.7
5.8
5.7
4.8
6.1
4.4
66.5
50.3
17.8
9.5
6.8
8.3
16.9
8.2
The unsoaked CBR and initial state data
analysed of compacted Gezira black cotton soil
samples (as reported by El-Tayeb, 1991).
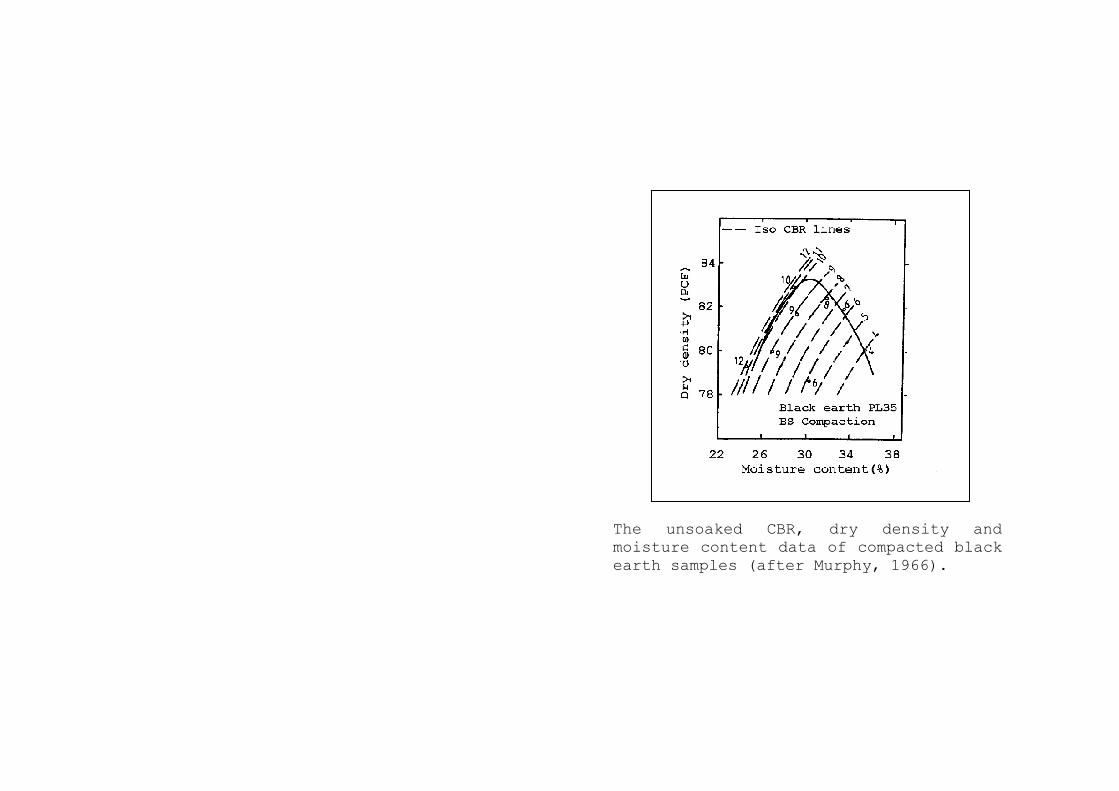
The unsoaked CBR, dry density and
moisture content data of compacted black
earth samples (after Murphy, 1966).
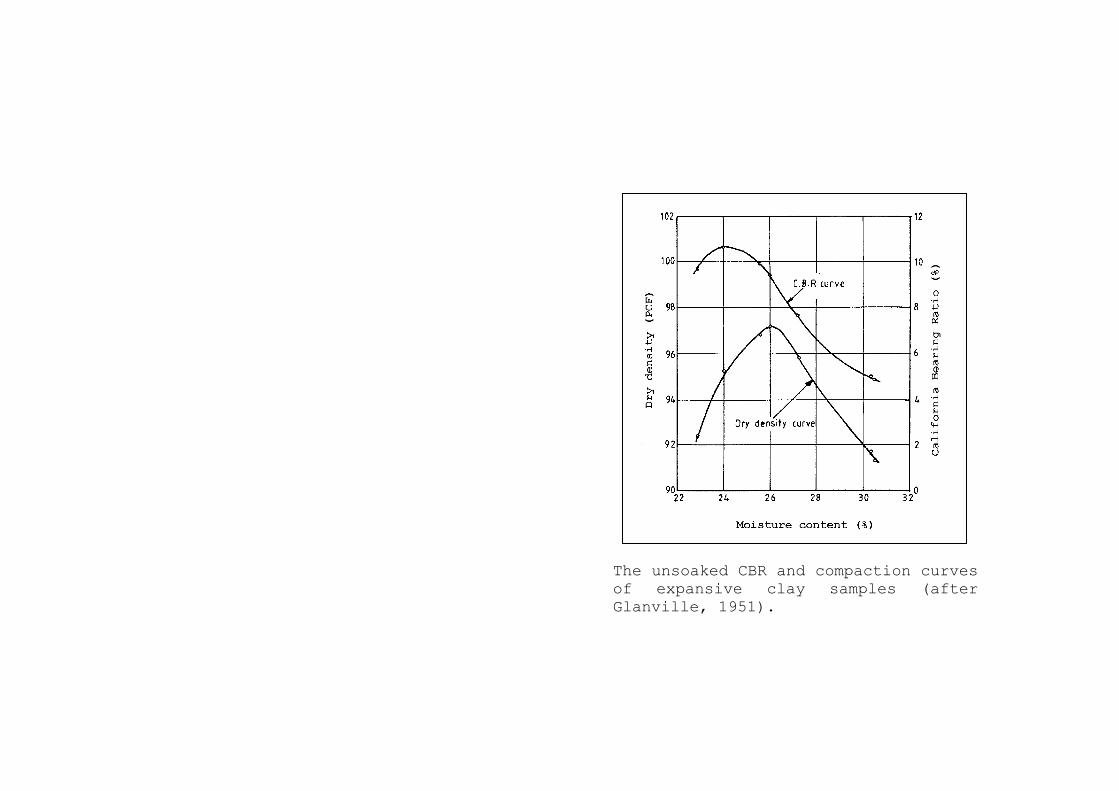
The unsoaked CBR and compaction curves
of expansive clay samples (after
Glanville, 1951).