peaking crucial reserves and their economic ramifications
TRANSCRIPT
DEPARTMENT OF ECONOMICS
Econ 400 Term Project:
“Peaking Crucial Reserves and Their Economic Ramifications”
Submitted by:
SHAHRIYAR GARALOGHLU 1700673
2014 June

ABSTRACT
This paper aims to contribute to the analysis of peak oil in economic theory and its applications. The subject has got poor attention from economists so far while it possesses a very real threat to both economies in all over the world and the current way of life as we know it. Analysis shows that peaking of oil production is real and it is near as well. Contribution from unconventional reserves to delay the effects seems very unlikely. Further upward rise in oil prices seems likely and consistent with World Oil Outlook report provided by OPEC. The problem should be tackled by economist before it is too late.
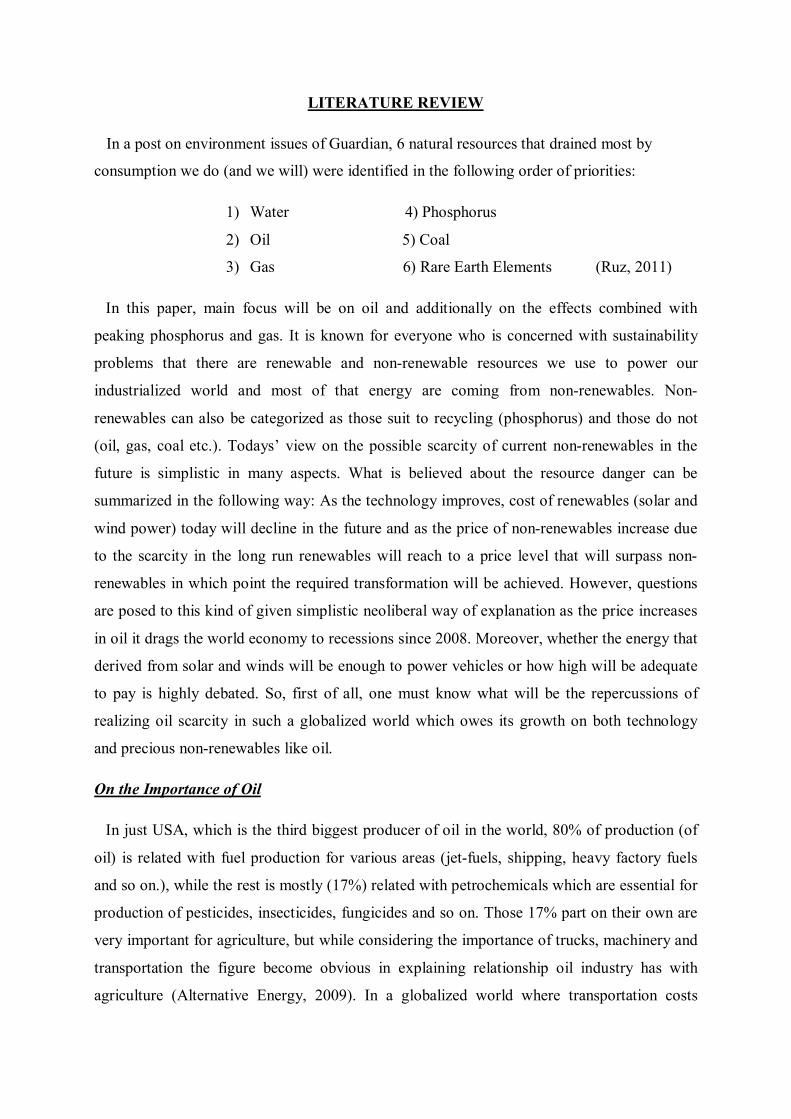
INTRODUCTION
In 1956, a geoscientist M. King Hubbert predicted that US oil production would see its peak
in 1970’s and will decrease from then on. He was right (Deffeyes, n.d.). 1970s witnessed 2 oil
crisis (1973 and 1979) which were some of the results originating from this process that only
Hubbert predicted earlier. Together with the collapse of Bretton-Woods system, those oil
crises had enormous economic and political ramifications not only in US but also in all over
the world. As a result, current neoliberal way of thinking started to dominate economic
policies in most of the capitalist world.
The point Hubbert made was simple: It is easy to extract the oil that is near to the surface
but it gets harder and harder when you drill deeper, eventually costs start rising and
production decrease after it hits its peak. What Hubbert said was that it is not really important
how much oil has left, what actually important is when you will hit the production peak. Over
the recent decades Human race become increasingly dependent on the oil. To make the
situation even worse we had a continuous population growth which itself triggers the further
demand for oil. Population itself has increased due to the improvements in agriculture through
the use of petrochemicals for making pesticides, insecticides, fungicides and fertilizers. The
so called Green Revolution has been made by the means of oil and gas. Population started to
increase from 3 billion to 7 billion from 1950s to 2012 (Dery & Anderson, 2007). The
situation we inherited today is obvious - our very own lives depend on crucial non-renewables
like oil and gas.
Question is how we are doing on these crucial reserves today. Since the Peak hypothesis
never debunked, when the inevitable Peak in global oil production will occur is the question
that needed to be answered. Literature on the prediction of global peak oil mostly agrees on
the very near years range. During the last decade, world witnessed the highest prices of oil in
the history of capitalism and it seems that it won’t stop rising for the next decades according
to the World Oil Outlook provided by OPEC (WOO 2011). Insiders and some important
scholars on the topic warn about the capabilities of Saudis to increase production after 2012
and the reserves they have announced (Vidal, 2011; Petroleum Review 2014). This paper
aims to determine the effects of remaining conventional oil reserves on the level of oil prices
and production. Together with the literature and the provided results from data analysis paper
will try answer where the world economy can head into in the near future.
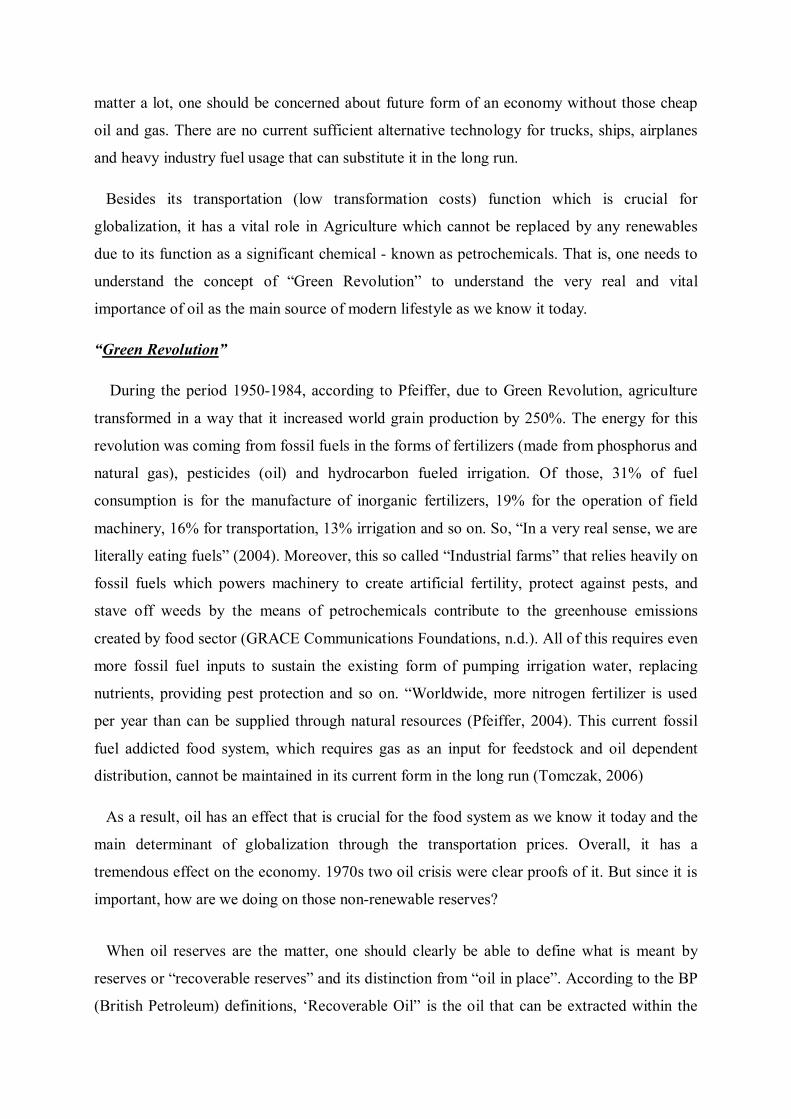
LITERATURE REVIEW
In a post on environment issues of Guardian, 6 natural resources that drained most by
consumption we do (and we will) were identified in the following order of priorities:
1) Water 4) Phosphorus
2) Oil 5) Coal
3) Gas 6) Rare Earth Elements (Ruz, 2011)
In this paper, main focus will be on oil and additionally on the effects combined with
peaking phosphorus and gas. It is known for everyone who is concerned with sustainability
problems that there are renewable and non-renewable resources we use to power our
industrialized world and most of that energy are coming from non-renewables. Non-
renewables can also be categorized as those suit to recycling (phosphorus) and those do not
(oil, gas, coal etc.). Todays’ view on the possible scarcity of current non-renewables in the
future is simplistic in many aspects. What is believed about the resource danger can be
summarized in the following way: As the technology improves, cost of renewables (solar and
wind power) today will decline in the future and as the price of non-renewables increase due
to the scarcity in the long run renewables will reach to a price level that will surpass non-
renewables in which point the required transformation will be achieved. However, questions
are posed to this kind of given simplistic neoliberal way of explanation as the price increases
in oil it drags the world economy to recessions since 2008. Moreover, whether the energy that
derived from solar and winds will be enough to power vehicles or how high will be adequate
to pay is highly debated. So, first of all, one must know what will be the repercussions of
realizing oil scarcity in such a globalized world which owes its growth on both technology
and precious non-renewables like oil.
On the Importance of Oil
In just USA, which is the third biggest producer of oil in the world, 80% of production (of
oil) is related with fuel production for various areas (jet-fuels, shipping, heavy factory fuels
and so on.), while the rest is mostly (17%) related with petrochemicals which are essential for
production of pesticides, insecticides, fungicides and so on. Those 17% part on their own are
very important for agriculture, but while considering the importance of trucks, machinery and
transportation the figure become obvious in explaining relationship oil industry has with
agriculture (Alternative Energy, 2009). In a globalized world where transportation costs
matter a lot, one should be concerned about future form of an economy without those cheap
oil and gas. There are no current sufficient alternative technology for trucks, ships, airplanes
and heavy industry fuel usage that can substitute it in the long run.
Besides its transportation (low transformation costs) function which is crucial for
globalization, it has a vital role in Agriculture which cannot be replaced by any renewables
due to its function as a significant chemical - known as petrochemicals. That is, one needs to
understand the concept of “Green Revolution” to understand the very real and vital
importance of oil as the main source of modern lifestyle as we know it today.
“Green Revolution”
During the period 1950-1984, according to Pfeiffer, due to Green Revolution, agriculture
transformed in a way that it increased world grain production by 250%. The energy for this
revolution was coming from fossil fuels in the forms of fertilizers (made from phosphorus and
natural gas), pesticides (oil) and hydrocarbon fueled irrigation. Of those, 31% of fuel
consumption is for the manufacture of inorganic fertilizers, 19% for the operation of field
machinery, 16% for transportation, 13% irrigation and so on. So, “In a very real sense, we are
literally eating fuels” (2004). Moreover, this so called “Industrial farms” that relies heavily on
fossil fuels which powers machinery to create artificial fertility, protect against pests, and
stave off weeds by the means of petrochemicals contribute to the greenhouse emissions
created by food sector (GRACE Communications Foundations, n.d.). All of this requires even
more fossil fuel inputs to sustain the existing form of pumping irrigation water, replacing
nutrients, providing pest protection and so on. “Worldwide, more nitrogen fertilizer is used
per year than can be supplied through natural resources (Pfeiffer, 2004). This current fossil
fuel addicted food system, which requires gas as an input for feedstock and oil dependent
distribution, cannot be maintained in its current form in the long run (Tomczak, 2006)
As a result, oil has an effect that is crucial for the food system as we know it today and the
main determinant of globalization through the transportation prices. Overall, it has a
tremendous effect on the economy. 1970s two oil crisis were clear proofs of it. But since it is
important, how are we doing on those non-renewable reserves?
When oil reserves are the matter, one should clearly be able to define what is meant by
reserves or “recoverable reserves” and its distinction from “oil in place”. According to the BP
(British Petroleum) definitions, ‘Recoverable Oil” is the oil that can be extracted within the

constrained of technology and economic conditions (n.d.). In other words, this is something
that can change with a change oil prices without any necessary changes in actual oil in place
or in technology. “Oil in Place” means the overall oil the world ultimately has, but some of it
is not feasible to obtain within the constraints of technology and economic costs. However, as
mentioned in BP’s webpage, “Nobody knows or can know how much oil exists under the
earth's surface or how much it will be possible to produce in the future” (n.d.). When we
analyze the data for determining the effects of remaining recoverable reserves on the oil
prices, one should keep these measures (definitions) in its mind. Next what we need to do is to
understand the differences between “Conventional” and “Unconventional” oil reserves.
Conventional versus Unconventional oil reserves
As its name suggest, in IEA’s (composed of mostly OECD countries) definition,
conventional stands for what is common at the time it is considered which in the case of oil it
includes crude oil and natural gas liquids and condensate liquids. What is left can be
considered as unconventional reserves like oil sands, extra heavy oil, gas to liquids and other
liquids. However, those terms are not fixed and can be changed as economic and
technological conditions evolve (and has been modified) which will be analyzed broadly
within following pages (2014). Moreover, what is meant in IEA’s own definition about “crude
oil” is defined in following words: “Crude oil is a mineral oil consisting of a mixture of
hydrocarbons of natural origin and associated impurities, such as sulphur. It exists in liquid
form under normal surface temperatures and pressure. Its physical characteristics (for
example, density) are highly variable”(2014).
Unconventional oil reserves are not as easy as conventional oil reserves to extract. There are
additional costs that incurred compared to conventional alternatives. The indicator for
determining the worthiness of that extraction process is called Energy Return on Investment
(EROI), and calculated in the following way (Poisson and Hall, 2013):
EROI=퐄퐧퐞퐫퐠퐲 퐑퐞퐭퐮퐫퐧
퐄퐧퐞퐫퐠퐲 퐈퐧퐯퐞퐬퐭퐞퐝
EROI of conventional oil resources declines due to the depletion in them as stated by Gupta
and Hall (2011): “The EROI for producing oil and gas was roughly 30:1 in the 1950s which
declined irregularly to 20:1 in the 1970s and 11–18:1 in the mid 2000’s.” In the case of
Canadian tar sands (the main unconventional source of oil produced) there are some figures
that mostly agree on the levels of EROI. In one of the latest research on the levels of EROI for
tar sands Poisson and Hall concluded that the level is around 4:1 in comparison to the
previous results fluctuating between 2.5:1 and 4:1 (2013). It is obvious that even the best
unconventional oil reserve - Tar Sands (oil sands in Canada), is very inefficient compared to
the conventional reserves despite the fact EROI for conventional reserves are in continuous
decline during the last century. This is the exact problem with the unconventional sources
today. Also the reason for these oil sands reserves started to have feasible EROI’s is due to
the higher prices and technological improvements as mentioned before. It starts to get worse
when we move to the other alternative unconventional reserves. In 2013 WOO (World Oil
Outlook) OPEC expects after 2020 a permanent decline in the production of Tight Oil -
another unconventional which was once promising (pg.12). When it comes to Shale Oil and
Gas, the EIA used followings words to describe them: "These shale oil and shale gas resource
estimates are highly uncertain and will remain so until they are extensively tested with
production wells." Moreover, the EIA admits that "the extent to which global technically
recoverable shale resources will prove to be economically recoverable is not yet clear."
(Ahmed N., 2013). Some believe there is a bubble created within the industry (see
Appendices).
However, Shale Gas is promising according to some financial circles and even scholars.
Those people believe that as the price of gas rises, technology evolves and demand for gas
grows with help created from increased federal subsidies which is considered by Congress,
shale gas will be very attractive to investors. However, the latest figures concerning cost side
of those investments are not as promising as optimists thought it would be and insiders in the
sector warn about a possible bubble that is being created in the sector with the false
impressions about the actual figures created by the investors (Urbina I., 2011).
When analyzed according to their Net Energy or EROI figures, most of the solutions
(ethanol, tight oil, shale oil) that is proposed against conventional reserves are not as
promising as they were believed would be. The renewable alternatives, however, like solar
and wind power, although can have big difference, they will not be enough to create energy
substitute for high usage industry purposes, trucks fuel, airplanes fuel and so on. What we are
left with is the oil sands. Although, it has very low EROI compared to conventional liquid oil,
we have plenty of them in Venezuela (Orinoco Belt) and Canada (Tar sands) which both are
almost as big todays Saudi Arabia in terms reserves. So, oil sands source needs more detailed
analyses in economic terms, which will be done in the descriptive statistics and data analyses

part. Intuition will be the neoclassical view which holds for the surface mining topics
considering that it is the main technique employed for extracting oil from those sands. Those
activities are subjected to diminishing marginal returns which are also reflected in the low
EROI figures. In 2011-2013 WOO forecasts, OPEC expects price levels around $133/b per
day in 2030s and 110mb/d demand for the same period which itself implicitly means that oil
sands and other unconventional reserves will not be enough to decrease or even stabilize the
price of oil. In the following parts, the reason for that will be analyzed in a neoclassical
framework.
The largest oil field today is considered to be Venezuela’s Orinoco oil belt which is similar
to tar sands of Canada. However, whether the country will be able to implement the latest
technology is a serious question. Political environment is not very suitable for the goals
government set to achieve in near future. Talwani in his paper concluded that “Thus even with
the investment of more than $12 billion, only a small fraction of the total recoverable oil is
going to be recovered over the length of these projects…” and will only satisfy 6% of US oil
import (2002, pg.22). What about the status of total oil and what are the forecasts?
Peak Oil
In 1956, a great geoscientist M. King Hubbert predicted that US oil production would see its
peak in 1970’s and will decrease from then on and he was absolutely right (Deffeyes, n.d.).
This phenomenon is called “Peak Oil”. Every non-renewable resource is subject to that
peaking. The reason is (as explained in detail before) it is easy to get resources that is nearest
to the surface and as the easiest part gone, the leftover are hard and very expensive so that it
first hits a peak (or plateau) then declines. This peak happens when roughly the half of that
resource is gone. The peak oil hypothesis has never been debunked but ignored greatly
especially among economists. To understand its importance one just needs to have a look at
the repercussions of 2 oil crisis during 1970s. When it comes to give the time for it, things
start to get complicated. The exact timing of the peak oil for the whole world is highly
debated. But it is going to happen for sure sooner or later. To know the timing one need to
know how much oil has been produced and how much left as reserves. The definition of
reserves (particularly recoverable reserves), however, is very problematic since it changes
when the technology improves and when economics changes (prices increase or decrease).
So, as it put beautifully by BP (in its webpage), problem is nobody actually knows how much
oil used and how much is yet to be produced (n.d.). There have been some attempts like The
Oil Depletion Analysis Centre (ODAC) in London in a study they did in 2005 came up with a
figure of almost 1 trillion barrels of crude oil (944 billion barrels) since commercial drilling
began (which they consider it to be 1870) (Inderscience, 2009).
There are also other doubts concerning the conventional oil reserves in OPEC countries.
Those countries were believed to exaggerate their remaining oil reserves greatly. The reason
for that are the sudden revisions done by all members of OPEC during 1982-1988 periods
which can easily be found in BP statistics. Moreover, those figures stayed at the same level
for a long time at the end of each period which is contrary to the notion of drilling since the
reserves should decline by the amount you have produced that year. For instance, Saudi
Arabia stayed at the levels of 260-262 during 1989-2003 periods which means for the
production in each year (roughly 9 million barrel per day) Saudis have found the exact
amount of reserves each year which is highly suspicious. Some believe that the upward
revisions were the outcome of old underestimates and some wishful thinking (Petroleum
Review, 2004, p. 27).
As mentioned before, price and technology changes had made some unconventional
reserves to be counted as conventional ones and the most important of those reserves is oil
sands. Starting from 1999, BP made adjustments to recoverable oil reserves of Canada and
later others and included tar sands among these reserves. As a result, highest recoverable
reserves is considered to be in Venezuela (297,5 billion barrels), second Saudi Arabia (265,9
billion barrels) and the third is Canada (173,9 billion barrels). Two of these countries are top
due to old unconventional reserves known as oil sands. Let us assume that the high prices
today decline to its early 2000s level (32 dollars), then probably these two reserves will be
worthless compared to Saudis reserves in terms of contribution and production.
In the recent literature, the issue has been taken seriously among many scholars (mostly
geologists). In their study of the phenomenon, Owen et all. predicted that between 2010 and
2015 the peak will occur and their results are consistent with many other published works
(Alekkett, 2007; Campbell and Laherrere, 1998; IEA, 2008; Laherrére, 2009a; Robelius,
2007; Sperling and Gordon, 2007; USGAO, 2007) and Hirsch Report in 2005 (2010, p. 4748).
Hirsch report (prepared due to official request from US Department of energy) had alarming
conclusions and describes it as a matter of Risk Management in a global level. The report also
mentions the need for government intervention, the inevitability of economic damages and the
desperate need for at least 20 years of planning to avoid any shortfall before the peak hits

(2005). If we are close to the point of hit, then it means it is already too late according to the
report.
Other Important Peaking Reserves
Though, in this paper, the reserves like coal and natural gas will not be paid as much
attention as it is paid for oil, these reserves both deserve a careful analysis too. The aim of
paper, as already mentioned, is to provide a naïve structure for further developments of the
phenomenon in economic theory and its application. Coal currently has reserve-to-production
ratio of 110 years which means with current levels of production, we will run out of coal
within 110 years. However, data shows that the amount of production itself grows throughout
the recent decades and it is likely to continue to do so. Moreover, as peaking of oil and gas
occur, then demand for coal will increase in order to offset the negative effects from oil and
gas production decreases. On the riming of peak gas, however, in literature the numbers are in
the same range with oil. Laherere believes it (peak gas) will happen somewhere around 2030s
even given the widespread believes among financial circles over the shale gas (2013).
Together with oil, this combo peak is likely to derive demand upward dramatically and it will
then decrease the reserve-to-production ratio as well as speed up the exhaustion of remaining
coal reserves. Thus, even coal reserves might not save people of earth from what is coming in
near future.
Another important finite but recyclable resource that we need to discuss is phosphorus. Its
importance is directly coming from its indispensable significance in fertilizer production - a
vital engine of “Green Revolution” that is far more important than oil and gas. Though it is
recyclable, Hubbert Peak still holds due to the fact that the rate of increase in production
exceeds the rate of speed of recycling of the resource which at some point is believed to
reveal its adverse effects (decline in the production). Timing of the peak for the resource
again varies in different studies but few hold hopes on continuous growth for ever-increasing
demand for it (Lewis, 2008). In their research on this subject Cordell et al. (2008) stated that
world has 50-100 years of reserve of phosphorus and it is expected to peak in 2030s.
Schumpeterian view (Optimists) versus Jevan’s Paradox
Optimists mainly believe that technology will find solutions (by increasing efficiency) and
price mechanisms will save us without a serious decline in the current way of life. This is a
Schumpeterian interpretation of the case. However, Jevan’s Paradox (a paradox that points
out the fact that coal consumption always increased despite the efficiency rises made
throughout Industrial Revolution in England) states that with the rise in efficiency, fuel usage
also rises as opposed to decline and it is what we observed so far in oil. This is mainly due to
the decrease in the cost of, for example car, related to the efficiency increase in the use
(consumption) of oil, makes it cheaper for consumer so that it increases the demand for car
and indirectly increases the consumption of oil which is not obvious from the initial point of
view. Thus, increase in efficiency can create and have created adverse effects as opposed to
solve high demand side of oil. Moreover, oil does not suit to the neoclassical assumptions that
are made for most of commodity goods. First of all, law of supply does not work as it was
proved in 1970s 2 oil crises. In other words, we did not see increase in the supply of oil as the
price increases. Secondly, law of demand also does not seem to work due to the inelastic
demand curve observed in this crucial reserve. Thus, laws of demand and supply do not hold
at all in the case of this kind of important reserve. Moreover, first stagflation phenomenon
started in USA due to effects of changes in oil prices. In brief, oil is not a commodity that can
be analyzed in terms of common economic measures applied to other commodities, it needs
special attention and special models to deal with too.

DESCRIPTIVE STATISTICS AND DATA ANALYSES
Following terms are important when analyses the data that is going to be presented:
Reserves-to-Production ratio - is a ratio that shows how many years of a non-renewable reserve got left.
Proved Reserves - which in case of oil also called as “recoverable oil” - is the non-renewable resource (oil or gas) that can be extracted within the constrained of technology and economic conditions. It is important to know that, as the prices of resources change; the proven reserves will change automatically without a need for a real technological change.
Oil in Place is the actual existed reserves within physical boundaries of earth and not all of them are available extract (so economics is not included in here). As BP mentioned in its website, no one actually knows how much oil in place really exist in the world and one need to keep it in its mind while making any analysis about future of oil (n.d.).
Conventional and Unconventional Oil Resources: As its name suggest, in IEA’s (composed of mostly OECD countries) definition, conventional stands for what is common for that time it is considered which in the case of oil it includes crude oil and natural gas liquids and condensate liquids. What is left can be considered as unconventional reserves like oil sands, extra heavy oil, gas to liquids and other liquids. However, those terms are not fixed and can be changed as economic and technological conditions evolve.
Oil discoveries: Oil discoveries have been declining since 1960s. The following graph is taken from ASPO (The Association for the Study of Peak Oil) from its annual report of 2007.
GRAPH 1
Source: “ASPO” Newletter No. 79, July 2007: http://aspoireland.files.wordpress.com/2009/12/newsletter79_200707.pdf
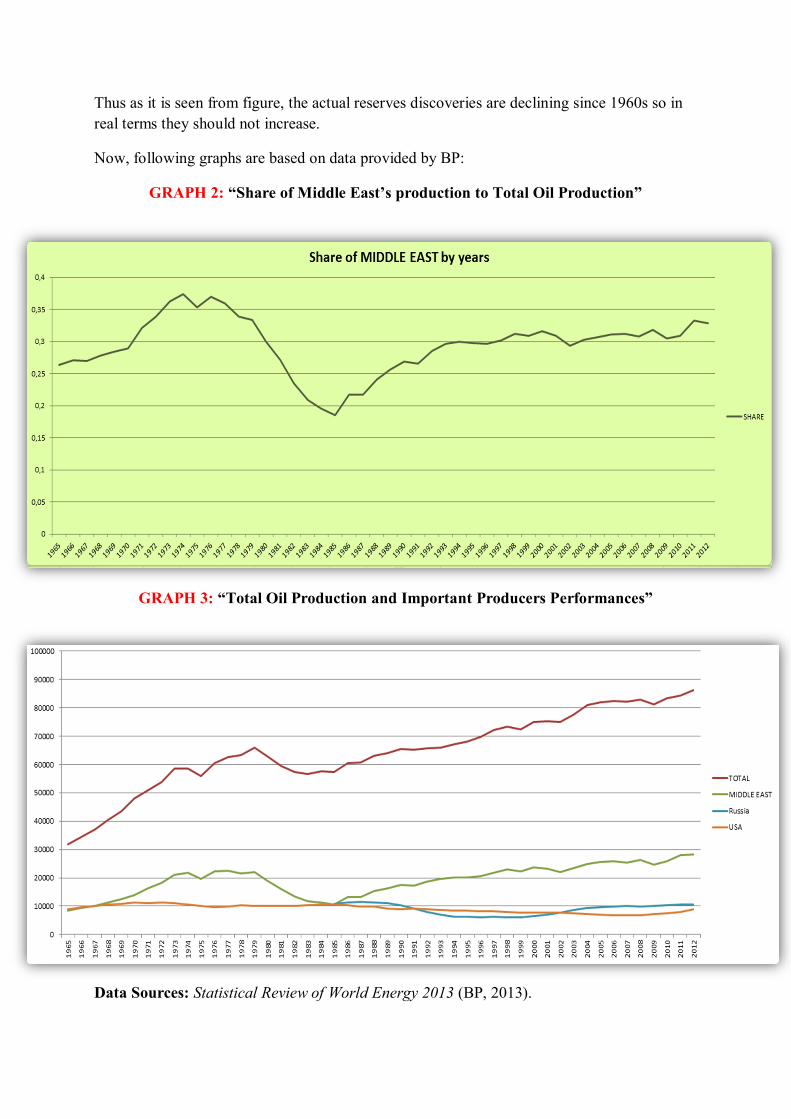
Thus as it is seen from figure, the actual reserves discoveries are declining since 1960s so in real terms they should not increase.
Now, following graphs are based on data provided by BP:
GRAPH 2: “Share of Middle East’s production to Total Oil Production”
GRAPH 3: “Total Oil Production and Important Producers Performances”
Data Sources: Statistical Review of World Energy 2013 (BP, 2013).
As presented in the above figures, there is no need to say or show that production is triggered by consumption levels since overproduction would cost producer dearly.
Today, we reached levels of over 30 billion barrel consumption of oil annually and the forecasts (WOO - World Oil Outlook) expect the number to grow over 40 billion for 2030s. According to Exxon Mobil, the one of the largest oil discovery was in Mexico Gulf and it was 700 million barrel which is less than 1/40 of annual consumption today. All of these show how we are doing (bad) at discovering new oil fields during the recent decades.
Despite these poor performances in discoveries, the proven reserves increased dramatically during the recent decades. Where did all of this oil come from? - Nowhere. It was always there, but it become profitable to extract some other unconventional resources as the oil prices increased and it became profitable for companies to go and drill deeper (and costly). Following part will analyze specifically this phenomenon.
Regressions and Models
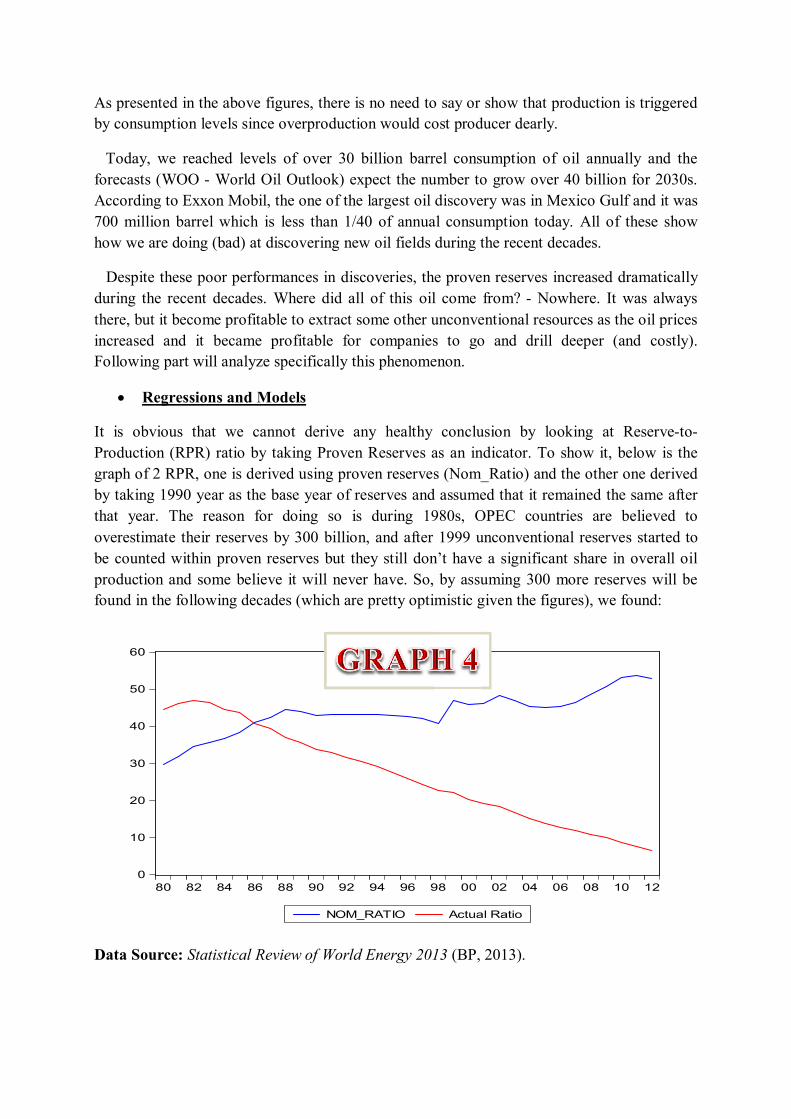
It is obvious that we cannot derive any healthy conclusion by looking at Reserve-to-Production (RPR) ratio by taking Proven Reserves as an indicator. To show it, below is the graph of 2 RPR, one is derived using proven reserves (Nom_Ratio) and the other one derived by taking 1990 year as the base year of reserves and assumed that it remained the same after that year. The reason for doing so is during 1980s, OPEC countries are believed to overestimate their reserves by 300 billion, and after 1999 unconventional reserves started to be counted within proven reserves but they still don’t have a significant share in overall oil production and some believe it will never have. So, by assuming 300 more reserves will be found in the following decades (which are pretty optimistic given the figures), we found:
Data Source: Statistical Review of World Energy 2013 (BP, 2013).
0
10
20
30
40
50
60
80 82 84 86 88 90 92 94 96 98 00 02 04 06 08 10 12
NOM_RATIO Actual Ratio
If the figure above is right and no significant conventional oil discoveries made during last 2 decades then we will have a great problem in all over the world. This is actually what is written down in WOO 2011-2013 report about the future further increases of oil prices.
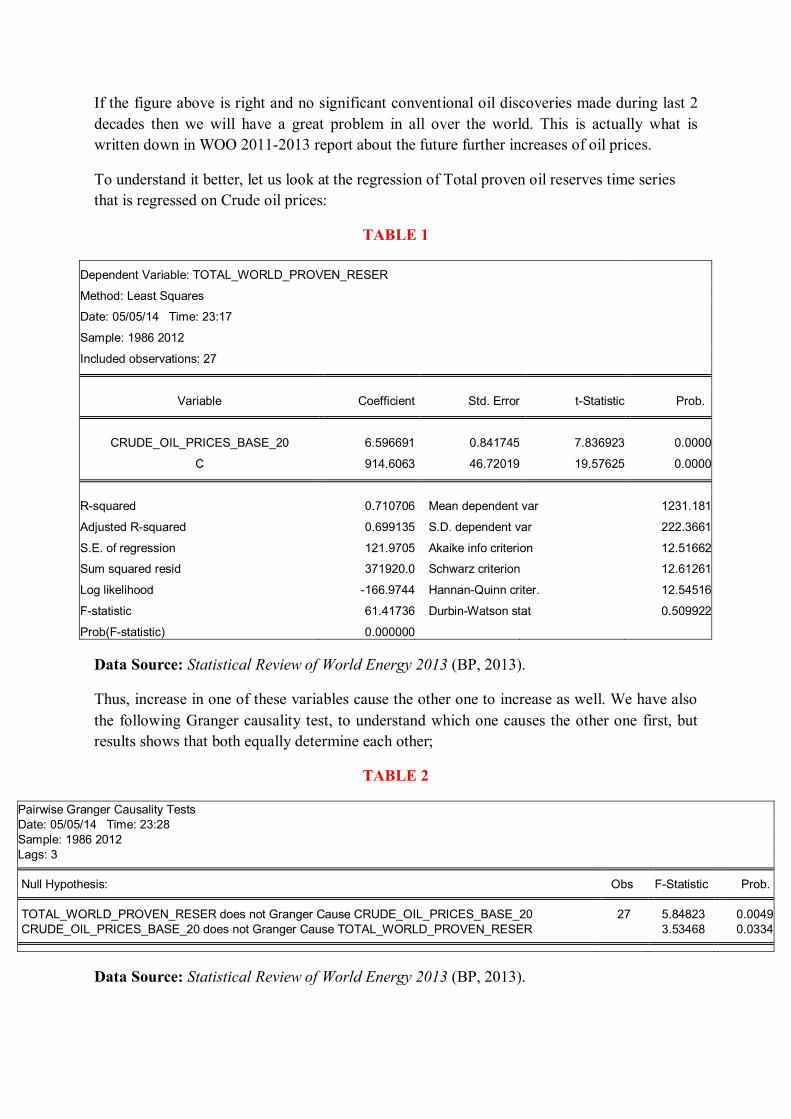
To understand it better, let us look at the regression of Total proven oil reserves time series that is regressed on Crude oil prices:
TABLE 1
Dependent Variable: TOTAL_WORLD_PROVEN_RESER
Method: Least Squares
Date: 05/05/14 Time: 23:17
Sample: 1986 2012
Included observations: 27
Variable Coefficient Std. Error t-Statistic Prob.
CRUDE_OIL_PRICES_BASE_20 6.596691 0.841745 7.836923 0.0000
C 914.6063 46.72019 19.57625 0.0000
R-squared 0.710706 Mean dependent var 1231.181
Adjusted R-squared 0.699135 S.D. dependent var 222.3661
S.E. of regression 121.9705 Akaike info criterion 12.51662
Sum squared resid 371920.0 Schwarz criterion 12.61261
Log likelihood -166.9744 Hannan-Quinn criter. 12.54516
F-statistic 61.41736 Durbin-Watson stat 0.509922
Prob(F-statistic) 0.000000 Data Source: Statistical Review of World Energy 2013 (BP, 2013).
Thus, increase in one of these variables cause the other one to increase as well. We have also the following Granger causality test, to understand which one causes the other one first, but results shows that both equally determine each other;
TABLE 2
Pairwise Granger Causality Tests Date: 05/05/14 Time: 23:28 Sample: 1986 2012 Lags: 3
Null Hypothesis: Obs F-Statistic Prob. TOTAL_WORLD_PROVEN_RESER does not Granger Cause CRUDE_OIL_PRICES_BASE_20 27 5.84823 0.0049
CRUDE_OIL_PRICES_BASE_20 does not Granger Cause TOTAL_WORLD_PROVEN_RESER 3.53468 0.0334
Data Source: Statistical Review of World Energy 2013 (BP, 2013).
Even with the given difficulty of knowing which one causes the other, from definition of recoverable reserves, as the prices increases then some of oil in place become economically viable and data does not contradict the notion of Recoverable Reserves. Thus, “Proven Reverse” is not a healthy variable one can use to predict the overall effect of it on economies. Common sense tells that when reserves as we know it increase, then you should not worry about prices as prices are expected to decline (opposite of what model shows). However, looking at the recent prices, it is completely the opposite. And, anyway, to get positive relationship as opposed to negative relationship in the model is completely contrary to common sense.
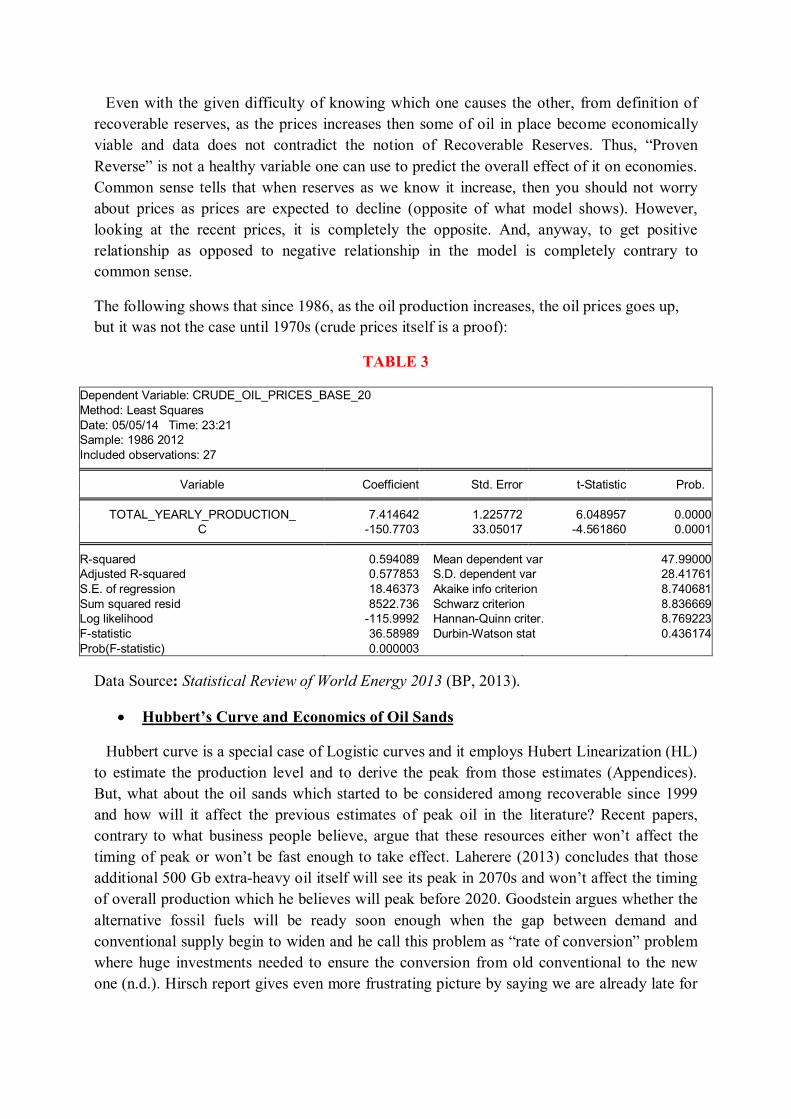
The following shows that since 1986, as the oil production increases, the oil prices goes up, but it was not the case until 1970s (crude prices itself is a proof):
TABLE 3
Dependent Variable: CRUDE_OIL_PRICES_BASE_20 Method: Least Squares Date: 05/05/14 Time: 23:21 Sample: 1986 2012 Included observations: 27
Variable Coefficient Std. Error t-Statistic Prob. TOTAL_YEARLY_PRODUCTION_ 7.414642 1.225772 6.048957 0.0000
C -150.7703 33.05017 -4.561860 0.0001 R-squared 0.594089 Mean dependent var 47.99000
Adjusted R-squared 0.577853 S.D. dependent var 28.41761 S.E. of regression 18.46373 Akaike info criterion 8.740681 Sum squared resid 8522.736 Schwarz criterion 8.836669 Log likelihood -115.9992 Hannan-Quinn criter. 8.769223 F-statistic 36.58989 Durbin-Watson stat 0.436174 Prob(F-statistic) 0.000003
Data Source: Statistical Review of World Energy 2013 (BP, 2013).
Hubbert’s Curve and Economics of Oil Sands
Hubbert curve is a special case of Logistic curves and it employs Hubert Linearization (HL) to estimate the production level and to derive the peak from those estimates (Appendices). But, what about the oil sands which started to be considered among recoverable since 1999 and how will it affect the previous estimates of peak oil in the literature? Recent papers, contrary to what business people believe, argue that these resources either won’t affect the timing of peak or won’t be fast enough to take effect. Laherere (2013) concludes that those additional 500 Gb extra-heavy oil itself will see its peak in 2070s and won’t affect the timing of overall production which he believes will peak before 2020. Goodstein argues whether the alternative fossil fuels will be ready soon enough when the gap between demand and conventional supply begin to widen and he call this problem as “rate of conversion” problem where huge investments needed to ensure the conversion from old conventional to the new one (n.d.). Hirsch report gives even more frustrating picture by saying we are already late for
the transition and we should have begun 20 years early (written in 2005) to invest huge amounts of capital to ensure a harmless transition (2005).
Now, there is going to be presented a simple economic structure to understand the underlying theory of pricing of oil sands. In 1999, after technological advances and price increase in oil, oil sands begun to be considered as recoverable. The oil that is derived from those extra-heavy oil sources are subjected to process which involves another fossil fuel - natural gas (a reason that decreases its EROI), water (create enormous amounts of polluted water) and most importantly it involves the process of “surface mining” to get the sands from there to the place the oil going to be processed. It is well-known in economics since Alfred Marshall that agriculture and mining (surface mining during those old periods) are subjected to diminishing returns and follows the principles of neoclassical economics (Arthur, 1989, p.4):
푷풓풐풅풖풄풕풊풐풏 = 푨 ∗ 풇(푴풊), 풘풉풆풓풆 풇 (푴풊) > ퟎ, 풂풏풅 풇 (푴풊) < ퟎ. Here, at a given technology, “A” is constant, 푀 is a given mine production facility that subjected to surface mining and f(x) is the production function. It is clear that, the formula is given to show its nature of decreasing rate of returns (Barkai, 1965, p. 17).
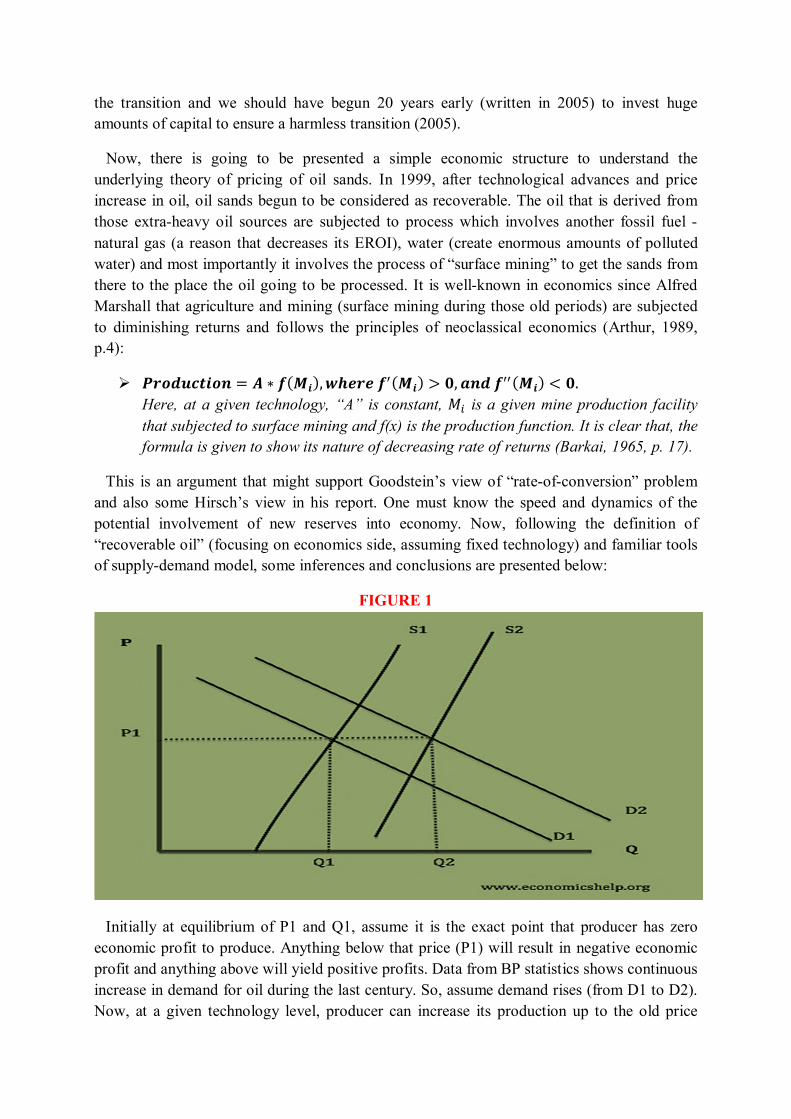
This is an argument that might support Goodstein’s view of “rate-of-conversion” problem and also some Hirsch’s view in his report. One must know the speed and dynamics of the potential involvement of new reserves into economy. Now, following the definition of “recoverable oil” (focusing on economics side, assuming fixed technology) and familiar tools of supply-demand model, some inferences and conclusions are presented below:
FIGURE 1
Initially at equilibrium of P1 and Q1, assume it is the exact point that producer has zero economic profit to produce. Anything below that price (P1) will result in negative economic profit and anything above will yield positive profits. Data from BP statistics shows continuous increase in demand for oil during the last century. So, assume demand rises (from D1 to D2). Now, at a given technology level, producer can increase its production up to the old price
level P1 by increasing amount from Q1 to Q2 (from S1 to S2). It cannot increase its quantity further Q2 since it will decrease its price and the result would be negative profits. What it tells us basically is the EROI of this reserve will decline even further until it hits become unprofitable. What it also tells is including unconventional oil reserves won’t decrease prices as long there is not significant technological change. However, oil industry has always been subjected to one of most intense technology based investments among the other sectors and the best we can hope is to get better results in near future that we failed to do for the last decades. Moreover, one of the most important reasons for the giant oil corporations to be interested in the sector is the high prices in the last decades. Thus, most important result of this basic analysis is you cannot decrease oil prices by including the old previously unconventional reserves which become recoverable after the increase in prices and the best we can get after including those unconventional reserves is stabilizing the price at that level. However, for that, one also needs those new reserves to be ready for the market as soon as possible to prevent prices to rise even further. If Goodstein’s rate-of-conversion problem is serious as Hirsch report suggests as it is, then contribution of unconventional reserves to solve the high price problems seems unlikely.
A Naïve Estimate of Peak Oil
Now, my final analysis is to guess where we are on the timeline of peak oil. Are we near? Or did we pass it? If we take ODAC results found in 2005, we must have produced at most 1200 billion barrels since 1870 (Inderscience, 2009). However, from BP data, during 1965-2012, there has been 1131.8 billion barrel oil produced. So, to do it myself, I made couple of optimistic (rational) assumptions, applied some linearization (based on those optimistic assumptions) to predict overall production done so far. It is important because we need to understand if we have used the half of the resources or not so far. Cause peak happens when we hit the half of what was there at the beginning. Following production figures are made up for the period before 1965, based on the figures after 1965:
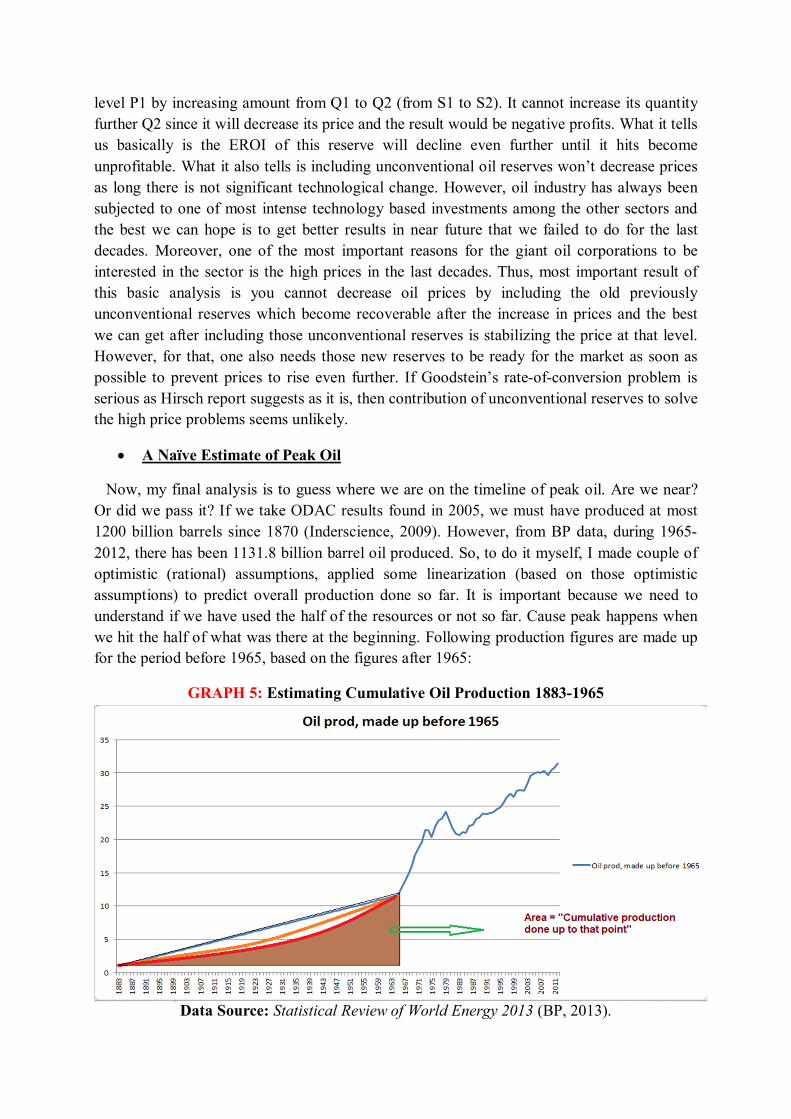
GRAPH 5: Estimating Cumulative Oil Production 1883-1965
Data Source: Statistical Review of World Energy 2013 (BP, 2013).
As you can see, the above estimate of oil production before 1965 is made by highly optimistic measures. Here we assume the oil production will always have an “increasing trend” starting from 1880s due to the well-known fact that the increase in production for oil was always triggered by increase in technology and technological demand for it. Some call this era the “Second Industrial Revolution” which is due to the innovation and use of petrochemicals started from this period. Now, given this assumption (which is fair in many sense) what is the highest cumulative that could be possible for the period 1883-1965 is the most important question. It is obvious that a straight line will give the highest amount of cumulative since the area under the straight line for the given curve will be the highest (mathematically speaking). However, common sense always suggests the convex shaped increasing line (function) since the rest of the data shows this trend and this will give lower cumulative than straight line. Straight line gives us 511,9 billion barrel for the period. Current reserves are believed to be
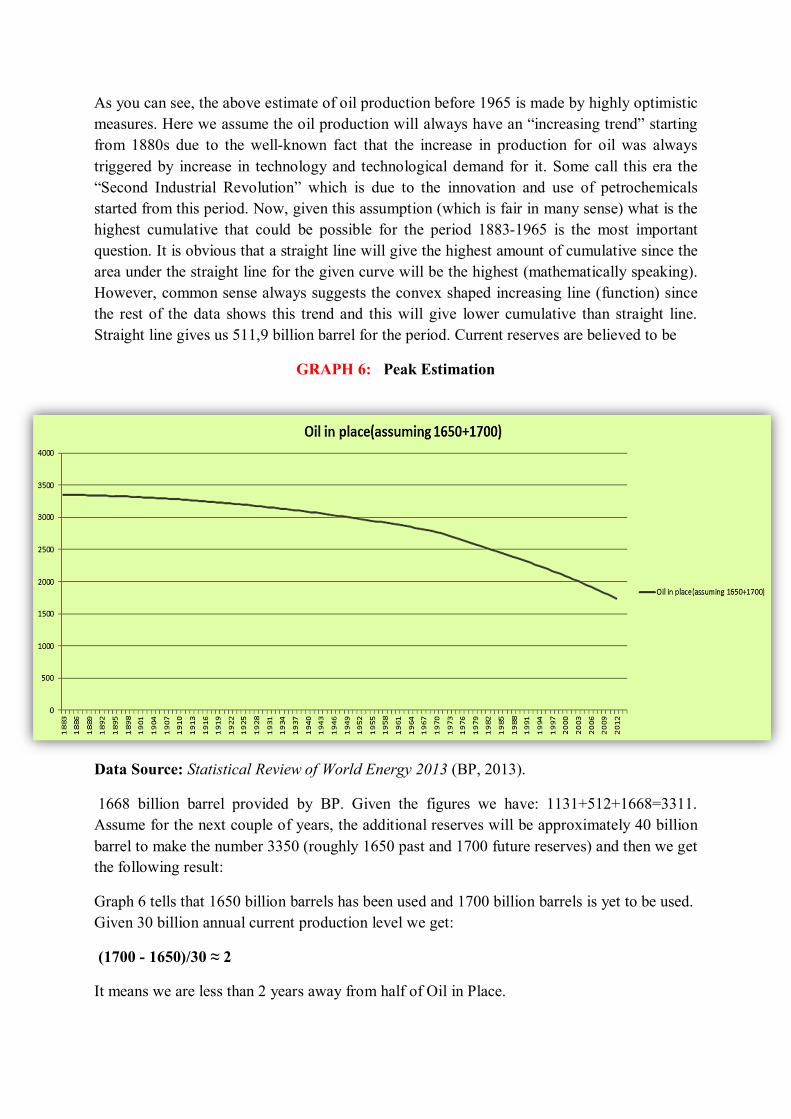
GRAPH 6: Peak Estimation
Data Source: Statistical Review of World Energy 2013 (BP, 2013).
1668 billion barrel provided by BP. Given the figures we have: 1131+512+1668=3311. Assume for the next couple of years, the additional reserves will be approximately 40 billion barrel to make the number 3350 (roughly 1650 past and 1700 future reserves) and then we get the following result:
Graph 6 tells that 1650 billion barrels has been used and 1700 billion barrels is yet to be used. Given 30 billion annual current production level we get:
(1700 - 1650)/30 ≈ 2
It means we are less than 2 years away from half of Oil in Place.
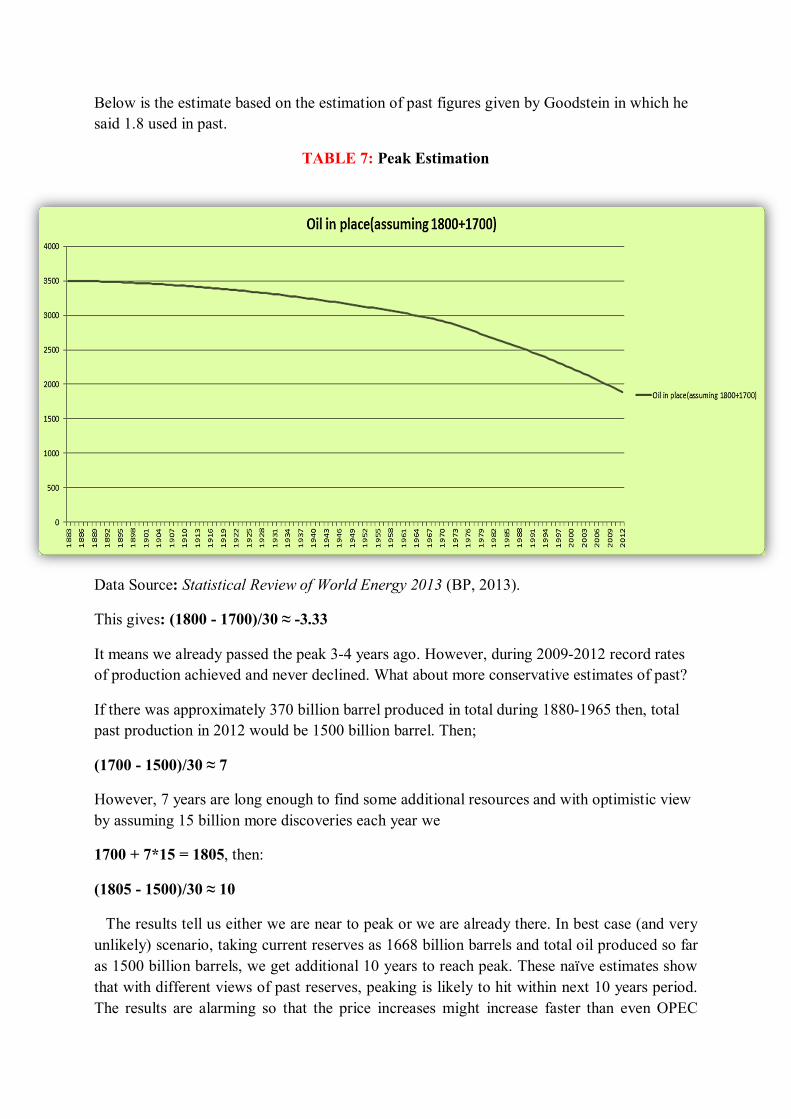
Below is the estimate based on the estimation of past figures given by Goodstein in which he said 1.8 used in past.
TABLE 7: Peak Estimation
Data Source: Statistical Review of World Energy 2013 (BP, 2013).
This gives: (1800 - 1700)/30 ≈ -3.33
It means we already passed the peak 3-4 years ago. However, during 2009-2012 record rates of production achieved and never declined. What about more conservative estimates of past?
If there was approximately 370 billion barrel produced in total during 1880-1965 then, total past production in 2012 would be 1500 billion barrel. Then;
(1700 - 1500)/30 ≈ 7
However, 7 years are long enough to find some additional resources and with optimistic view by assuming 15 billion more discoveries each year we
1700 + 7*15 = 1805, then:
(1805 - 1500)/30 ≈ 10
The results tell us either we are near to peak or we are already there. In best case (and very unlikely) scenario, taking current reserves as 1668 billion barrels and total oil produced so far as 1500 billion barrels, we get additional 10 years to reach peak. These naïve estimates show that with different views of past reserves, peaking is likely to hit within next 10 years period. The results are alarming so that the price increases might increase faster than even OPEC

expects and it might send all economies all over the world to a downturn. However, even in the 10 year scenario, suspicious declared reserves issues and readiness of fresh recoverable unconventional reserves to market are all ignored and very optimistic measure has been taken.
CONCLUSION
This paper aimed to contribute to analysis of peak oil in economic theory and its
applications. The peaking of crucial reserves is very important matter that needed to be
analyzed carefully by economists. Both theoretical and econometric models have been built to
analyze the phenomenon. The results are alarming. The recent literature on the issue of
peaking important reserves gives a very pessimistic view about the future of those reserves.
The results in this paper support most of those literatures. A simple neoclassical analysis on
possible effects of unconventional reserves (given surface mining as a main process) shows
the inclusion of these reserves will not decrease the current high prices in theoretical
framework. The same analysis also concluded that the EROI for the reserve is expected to
decline even further. Difficulty on working with the term “Recoverable Reserves” has pointed
out and supported by a simple econometric model. A naïve estimation of peak oil (given the
definition of term by M. King Hubbert) has been made by making very optimistic
assumptions about the past production figures. Prediction based on those figures points out a
peak within 10 years. Following the peak of gas after oil, this combo peaks will accelerate
both consumption and production of coal and as a result depletion of coal will happen sooner
than most people believe. Given these figures, economic models that take important non-
renewable reserves into account might give better understanding of what is going on and what
is going to happen for policy makers.

REFERENCES
Ahmed N. (2013, June 21). Shale gas won't stop peak oil, but could create an economic crisis. The Guardian, pp. Page 1. Retrieved April 21 from
http://www.theguardian.com/environment/earth-insight/2013/jun/21/shale-gas-peak-oil-economic-crisis
Alternative Energy (2009, March 8). How the US uses Oil. ProCon. Retrieved April 21 from
http://alternativeenergy.procon.org/view.resource.php?resourceID=001797. Barkai H.(1965, February) Ricardo’s Static Equilibrium, Economica, New Series, Vol. 32,
No. 125 (Feb., 1965), pp. 15-31. Available from http://www.jstor.org/stable/2552443 British Petroleum (n.d.) Oil Reserve Definitions, About BP. Retrieved May 17 from
http://www.bp.com/en/global/corporate/about-bp/energy-economics/statistical-review-of-world-energy-2013/review-by-energy-type/oil/oil-reserves/oil-reserve-definitions.html
British Petroleum (2013). Statistical Review of World Energy 2013, May 2013 [Data File]. Retrieved
from BP website, http://www.bp.com/en/global/corporate/about-bp/energy-economics/statistical-review-of-world-energy-2013.html
Cordell D., Drangert J., White S. (2008, October 30) The story of phosphorus: Global food
security and food for thought. Global Environmental Change. Pages 292-305. Available from http://www.agci.org/dB/PDFs/09S2_TCrews_StoryofP.pdf
Deffeyes S. K. (n.d.). Hubbert's Peak in the 21st Century.Princeton, pp.1-4 Page1. Retrieved
April 21 from https://www.princeton.edu/hubbert/the-peak.html. Dery P and Anderson B. (2007, August 13). Peak Phosphorus. Energy Bulletin, Available from
http://www2.energybulletin.net/node/33164 Future (2012, June 18). Global resources stock check. BBC, Retrieved April 21 from
http://www.bbc.com/future/story/20120618-global-resources-stock-check. Goodstein D. (n.d.) Energy, Technology and Climate: Running Out of Gas. New Dimensions in
Bioethics, pages 233-245. Available May 17 from http://www.its.caltech.edu/~dg/Essay2.pdf
Goodstein D. (2006, November 30) Out of Gas: The end of the age of oil. Air Resources Board, pages
233-245. Retrieved May 17 from http://www.arb.ca.gov/research/seminars/goodstein2/goodstein2.pdf
GRACE Communications Foundations (n.d.). Agriculture, Energy & Climate Change. Sustainable Table,
Retrieved April 21 from http://www.sustainabletable.org/982/agriculture-energy-climate-change.
Gupta A. K. and Hall G. A. S. (2011, October 10). A Review of the Past and Current State of EROI Data,
Sustainability 2011, 3, 1796-1809; doi:10.3390/su3101796 Hirsch R. L. (2005, February). PEAKING OF WORLD OIL PRODUCTION: IMPACTS, MITIGATION, & RISK
MANAGEMENT, Science Applications International Corporation (SAIC). Retrieved May 17 from http://www.netl.doe.gov/publications/others/pdf/oil_peaking_netl.pdf
Inderscience. (2009, May 8). How Much Oil Have We Used? ScienceDaily. Retrieved April 21, 2014
from www.sciencedaily.com/releases/2009/05/090507072830.htm Laherrere J.(2013, February 4). Oil & gas production forecasts 1900-2100, CLARMIX. Retrieved May
17 from http://tribune-pic-petrolier.org/wp-content/uploads/2013/03/oilgasprodforecasts-JL-1.pdf
Lewis L. (2008, June 23). Scientists warn of lack of vital phosphorus as biofuels raise demand. The
Times, Page1. Retrieved April 21 from http://www.thetimes.co.uk/tto/business/industries/naturalresources/article2181558.ece.
Owen A. N., Inderwildi R. O. and King A. D.(2010, August). The status of conventional world oil
reserves—Hype or cause for concern? Science Direct, vol 38 (8), page 4743-4749. http://dx.doi.org/10.1016/j.enpol.2010.02.026
Petroleum Review (2004 August) How realistic are Opec’s proven oil reserves?, OPEC Reserves. Page.
Retrieved April 21 from http://www.aspo-australia.org.au/References/OPEC%20reserves%20Petroleum%20Review%20Aug-04%20SALAMEH.pdf.
Pfeiffer A. D. (2004). Eating Fossil Fuels. OCA. Retrieved 21 April from
http://www.organicconsumers.org/corp/fossil-fuels.cfm. Poisson A. and Hall S. A. C. (2013)Time Series EROI for Canadian Oil and Gas. Energies, vol 6(11),
pages 5940-5959. doi:10.3390/en6115940 Randerson J. (2009, February 12). David King: Iraq was the first 'resource war' of the century. The
Guardian, pp. Page 1. Retrieved April 21 from http://www.theguardian.com/environment/2009/feb/12/king-iraq-resources-war.
Ruz, C. (2011, October 31). The six natural resources most drained by our 7 billion people. The
Guardian, Retrieved April 21 from http://www.theguardian.com/environment/blog/2011/oct/31/six-natural-resources-population.
Talwani M. (2002, September). THE ORINOCO HEAVY OIL BELT IN VENEZUELA. THE JAMES A. BAKERIII
INSTITUTE FOR PUBLICPOLICY OF RICE UNIVERSITY, Page(s). Retrieved April 21 from http://large.stanford.edu/publications/coal/references/baker/work/docs/Talwani_OrinocoHeavyOilBeltVenezuela.pdf.
Tomczak J. (2006, June 11). Implications of Fossil Fuel Dependence for the Food System. Resilience.
Retrieved April 21 from http://www.resilience.org/stories/2006-06-11/implications-fossil-fuel-dependence-food-system.
Urbina I. (2011, June 25). Insiders Sound an Alarm Amid a Natural Gas Rush. The New York Time,
pp.6-13 Page 1. Retrieved April 21 from http://www.nytimes.com/2011/06/26/us/26gas.html?pagewanted=1&sq=marcellus&st=cse&scp=12&_r=2&.

APPENDICES
A) Logistic Functions are used to describe certain kinds of growth. It is like exponential
functions that grows quickly in the beginnig, but due to restrictions that place limits on
the size of the underlying variable (e.g. population), eventually grow more slowly and
then level off.
The formula for the logistic function is given in the following way:
푦 = 퐶
1 + 퐴푒
Where C - is the limiting value of the output. (information so far is taken from
www.cs.xu.edu/math/math120/01f/logistic.pdf)
Another way of expressing the function and the logistic curve is:
Source:http://stat.ubc.ca/~rollin/teach/643w04/lec/node46.html
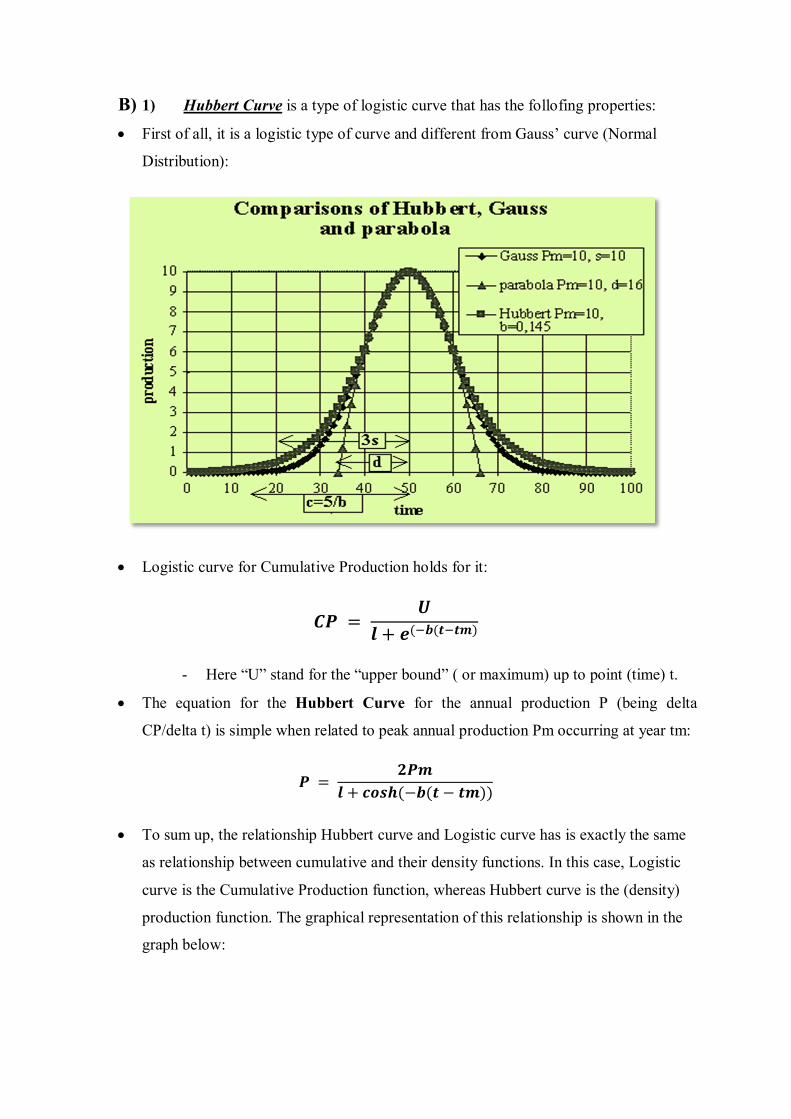
B) 1) Hubbert Curve is a type of logistic curve that has the follofing properties:
First of all, it is a logistic type of curve and different from Gauss’ curve (Normal
Distribution):
Logistic curve for Cumulative Production holds for it:
푪푷 = 푼
풍 + 풆( 풃(풕 풕풎)
- Here “U” stand for the “upper bound” ( or maximum) up to point (time) t.
The equation for the Hubbert Curve for the annual production P (being delta
CP/delta t) is simple when related to peak annual production Pm occurring at year tm:
푷 = ퟐ푷풎
풍 + 풄풐풔풉(−풃(풕 − 풕풎))
To sum up, the relationship Hubbert curve and Logistic curve has is exactly the same
as relationship between cumulative and their density functions. In this case, Logistic
curve is the Cumulative Production function, whereas Hubbert curve is the (density)
production function. The graphical representation of this relationship is shown in the
graph below:
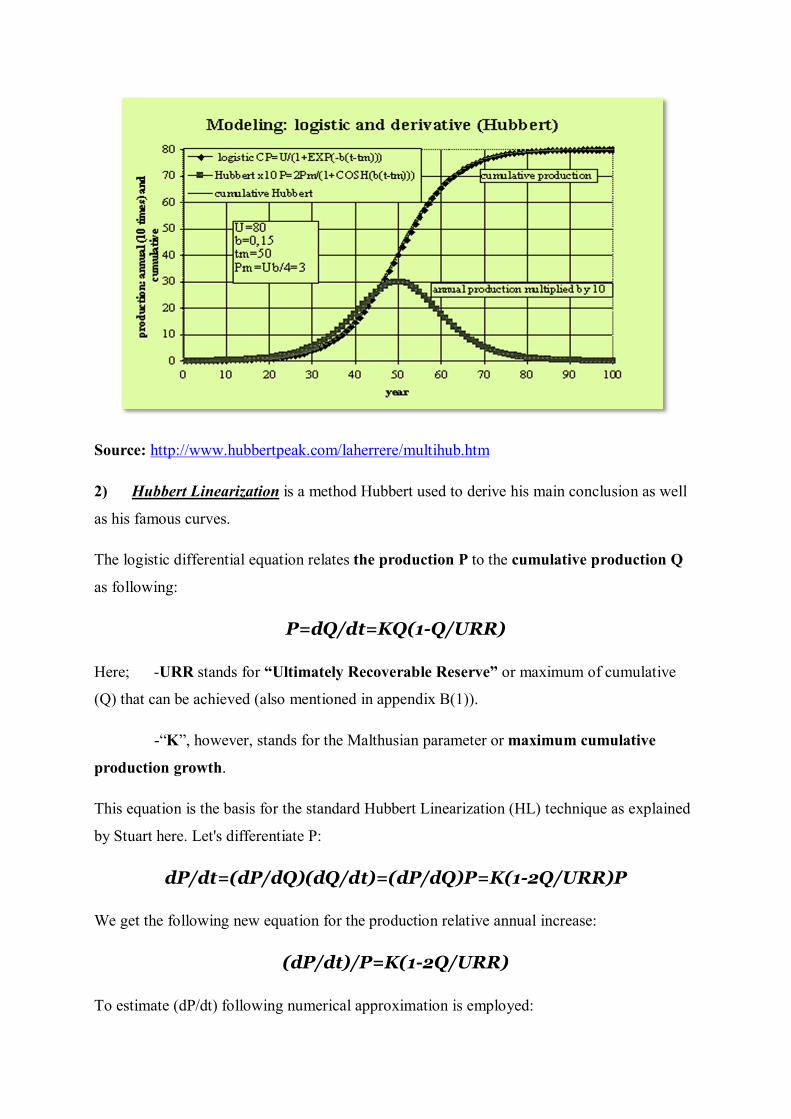
Source: http://www.hubbertpeak.com/laherrere/multihub.htm
2) Hubbert Linearization is a method Hubbert used to derive his main conclusion as well
as his famous curves.
The logistic differential equation relates the production P to the cumulative production Q
as following:
P=dQ/dt=KQ(1-Q/URR)
Here; -URR stands for “Ultimately Recoverable Reserve” or maximum of cumulative
(Q) that can be achieved (also mentioned in appendix B(1)).
-“K”, however, stands for the Malthusian parameter or maximum cumulative
production growth.
This equation is the basis for the standard Hubbert Linearization (HL) technique as explained
by Stuart here. Let's differentiate P:
dP/dt=(dP/dQ)(dQ/dt)=(dP/dQ)P=K(1-2Q/URR)P
We get the following new equation for the production relative annual increase:
(dP/dt)/P=K(1-2Q/URR)
To estimate (dP/dt) following numerical approximation is employed:
dP/dt=(P(t+1)-P(t-1))/2
To estimate (dQ/dt), another apprimation can be employed, like:
(Q(t)-Q(t-1))/(t-(t-1))= Q(t)-Q(t-1)
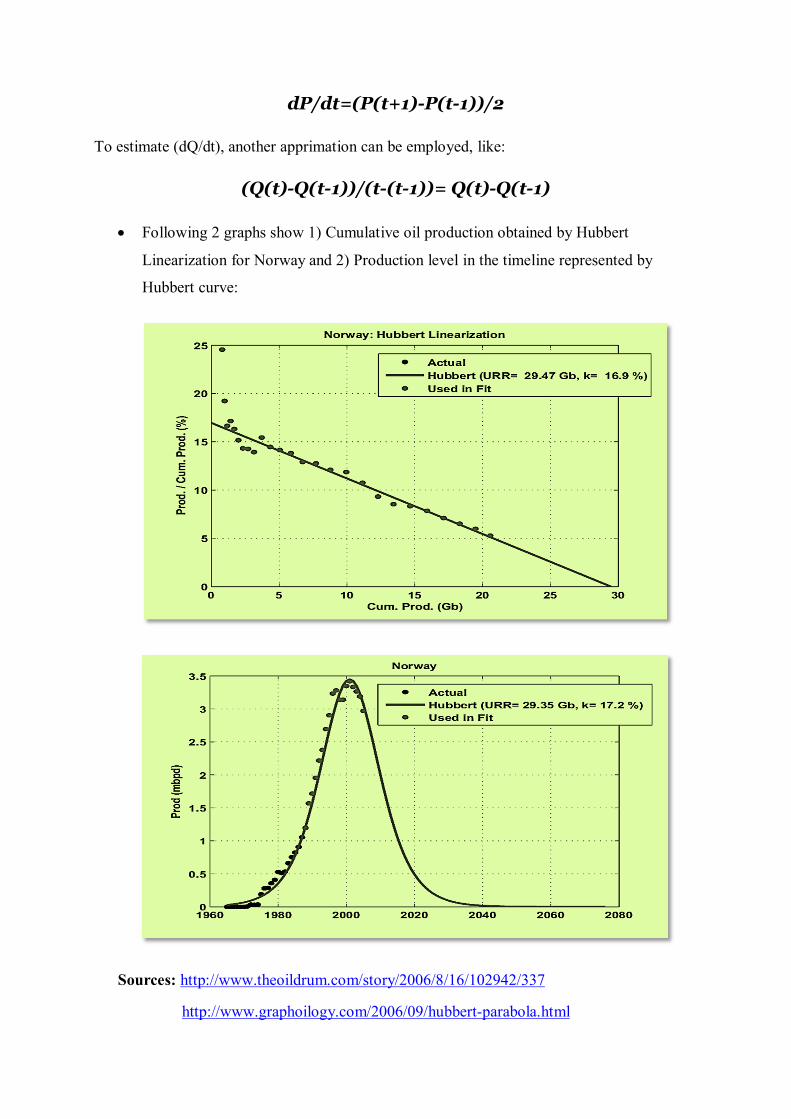
Following 2 graphs show 1) Cumulative oil production obtained by Hubbert
Linearization for Norway and 2) Production level in the timeline represented by
Hubbert curve:
Sources: http://www.theoildrum.com/story/2006/8/16/102942/337
http://www.graphoilogy.com/2006/09/hubbert-parabola.html

A more simplified version of Hubbert Linearization is given by his college Deffeyes:
Source: http://www.youtube.com/watch?v=_2aE2gdvM0U
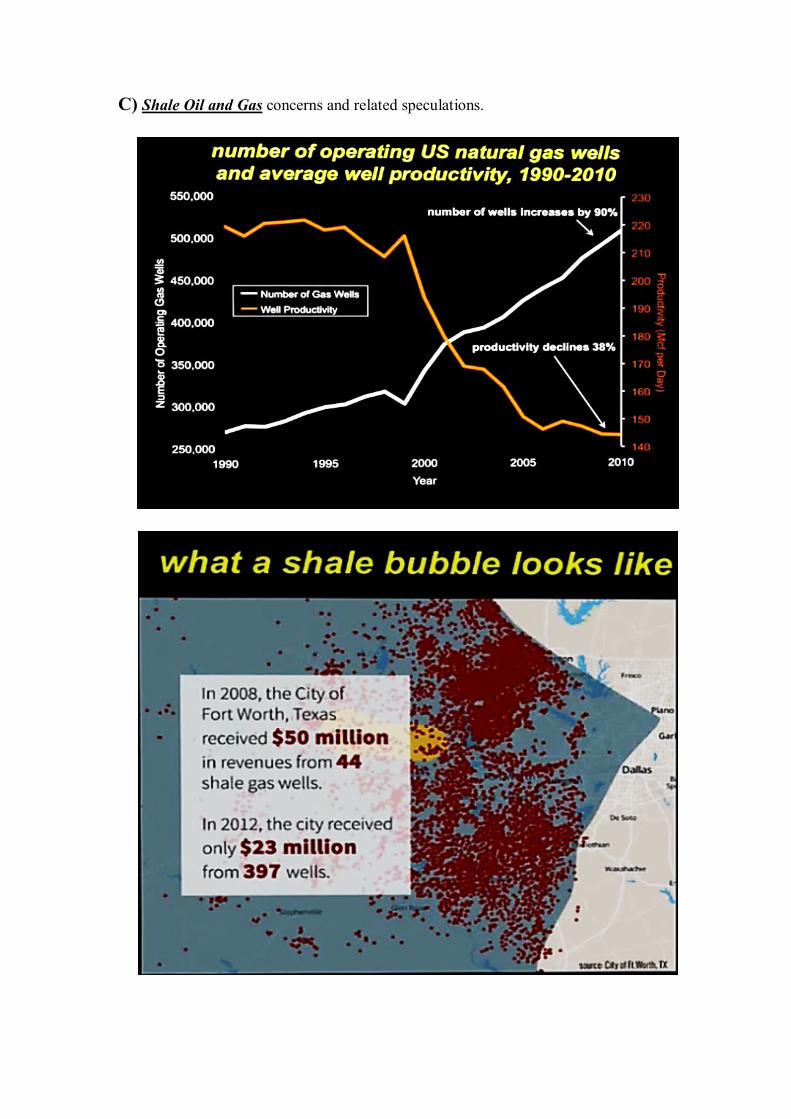
C) Shale Oil and Gas concerns and related speculations.
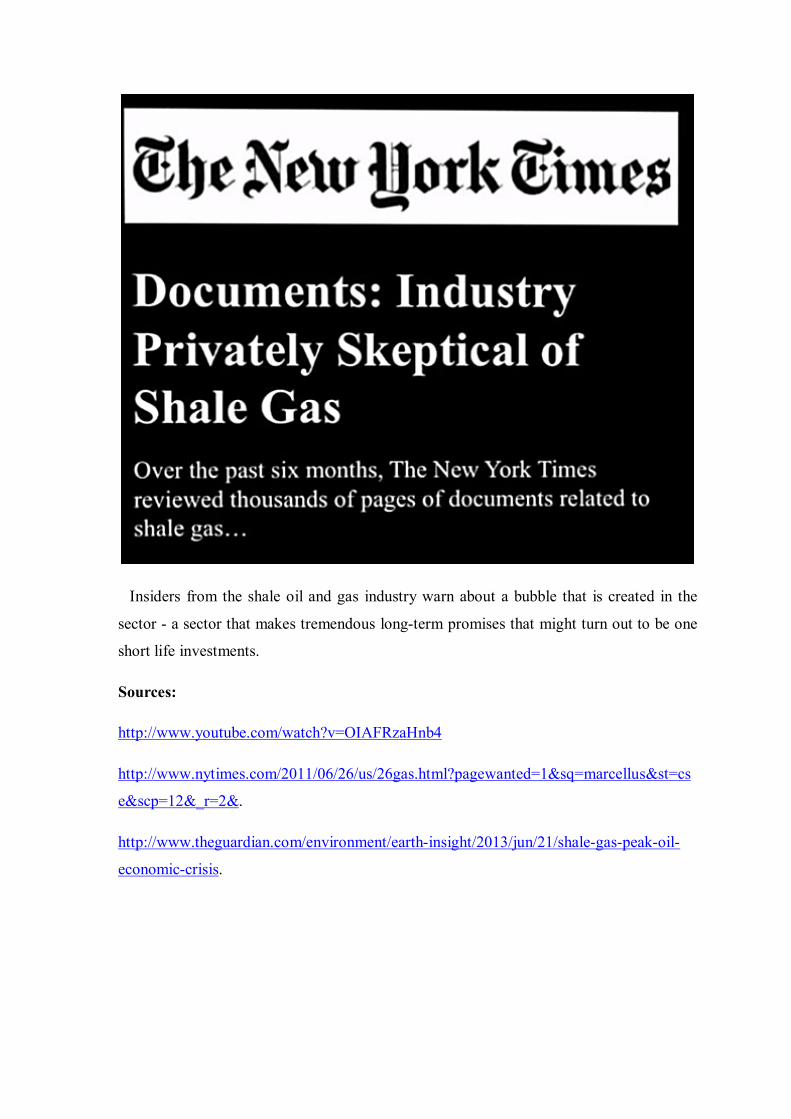
Insiders from the shale oil and gas industry warn about a bubble that is created in the
sector - a sector that makes tremendous long-term promises that might turn out to be one
short life investments.
Sources:
http://www.youtube.com/watch?v=OIAFRzaHnb4
http://www.nytimes.com/2011/06/26/us/26gas.html?pagewanted=1&sq=marcellus&st=cs
e&scp=12&_r=2&.
http://www.theguardian.com/environment/earth-insight/2013/jun/21/shale-gas-peak-oil-
economic-crisis.