passive microwave remote sensing of soil moisture
TRANSCRIPT

Cloud Publications
International Journal of Advanced Remote Sensing and GIS 2015, Volume 4, Issue 1, pp. 1045-1063, Article ID Tech-408 ISSN 2320 - 0243 ______________________________________________________________________________________________________
Passive Microwave Remote Sensing of Soil Moisture: A Step-By-
Step Detailed Methodology using AMSR-E Data over Indian Sub-
Continent
Gagandeep Singh¹, Hari Shanker Srivastava², Shashi Mesapam
1 and Parul Patel
3
¹Department of Civil Engineering, National Institute of Technology (NIT), Warangal, Telangana, India
²Indian Institute of Remote Sensing (IIRS), Indian Space Research Organization (ISRO), Dehradun,
Uttarakhand, India 3Space Application Centre (SAC), Indian Space Research Organization (ISRO), Ahmedabad, Gujarat, India
Correspondence should be addressed to Gagandeep Singh, [email protected]
Publication Date: 3 June 2015
Article Link: http://technical.cloud-journals.com/index.php/IJARSG/article/view/Tech-408
Copyright © 2015 Gagandeep Singh, Hari Shanker Srivastava, Shashi Mesapam and Parul Patel. This is an open
access article distributed under the Creative Commons Attribution License, which permits unrestricted use,
distribution, and reproduction in any medium, provided the original work is properly cited.
Abstract This paper presents a detailed methodology to process AMSR-E soil moisture data to
generate average soil moisture maps of desired durations be it weekly, monthly or yearly over a large
geographical area like a continent or a sub-continent. The paper also explores utility of AMSR-E soil
moisture product (AE_Land 3 product) to understand the soil moisture variations over Indian
subcontinent by analysing daily soil moisture data for entire calendar year of 2009. In order to
demonstrate the developed methodology the year 2009 was selected wherein a total of 730 AMSR-E
daily scenes (365 each for ascending as well as descending passes) were processed and analysed.
Although the absolute values of soil moisture derived from AMSR-E are not showing good agreement
with soil moisture status on ground which is due to large variability in soil moisture within the coarse-
resolution cell offered by passive sensors [1] but in general AMSR-E derived soil moisture values are
well explained on the basis of rainfall data and agricultural practices adopted in different states of
Indian sub-continent. The soundness of the detailed methodology proposed in this paper has been
well supported by studying the variations in AMSR-E derived soil moisture with seasonal variations
and rainfall data. It has been observed that the soil moisture variations are in line with the seasonal
changes as well as the rainfall variations.
Keywords AMSR-E; Passive Microwave Remote Sensing; Soil Moisture; Rainfall; Temporal
Variations of Soil Moisture
1. Introduction
Soil moisture is the water held in pores in the soil in liquid and vapour phases [2-3]. It can be defined
as the temporary storage of water within a shallow layer of earth’s upper surface. It plays a significant
role in land surface-atmosphere interaction, as it directly influences the heat exchange between these
Open Access Methodology Article
IJARSG– An Open Access Journal (ISSN 2320 – 0243)
International Journal of Advanced Remote Sensing and GIS 1046
two mediums through evaporation and transpiration [4-6]. The amount of water stored in the soil is
fundamentally important to agriculture and is an influence on the rate of actual evaporation,
groundwater recharge, and generation of runoff [7].
Soil moisture is of utmost importance in agricultural domain, for agriculture yield, crop growth
forecasting, irrigation scheduling. Apart from this it is a very well-known fact that variation in soil
moisture is directly associated with rainfall, and surface runoff is a phenomenon which is attributed to
the fact that it occurs when rainfall rate is more than the infiltration rate. Furthermore the infiltration rate
depends on factors like soil type, texture and soil moisture. Therefore soil moisture proves to be a
contributing factor in case of surface runoff and hence, it is important for monitoring hazards like floods
and droughts. It also plays an equally important role in meteorological applications in the sense that
soil moisture is used in weather predication models and global circulation models to identify weather
patterns.
Surface soil moisture information through remote sensing is very important in the field of agriculture,
hydrology and meteorology [8-10]. Satellite remotely sensed data products particularly those that are
derived from instruments operating in the microwave region of electromagnetic spectrum are being
exploited and explored by researchers all over the world in the recent past [11-14]. The remotely
sensed soil moisture microwave data products have immense potential to be used for above
mentioned applications, for this each data product available should be understood to devise a
methodology to generate maps and extract meaningful information. Passive microwave remote
sensing data product like AMSR-E data has been studied in this paper and a detailed methodology to
process it and generate average soil moisture maps for various time intervals at continent/ sub-
continent level has been proposed in this paper.
2. Challenges of Soil Moisture Estimation over Large Areas
The conventional methods of measuring soil moisture are point specific and labour intensive, in the
sense that soil moisture measurement probes are taken to the point of observation and the moisture
content is sensed. In contrast to conventional methods, remote sensing techniques can play a major
role in soil moisture estimation on routine basis. Different portions of electromagnetic spectrum like
Optical, Thermal and Microwave can be used for soil moisture retrieval using remote sensing
techniques [15-16]. Out of optical, thermal and microwave bands, microwave remote sensing is the
best option for soil moisture retrieval due to its penetration capability and high dielectric constant of
water i.e. 80 at microwave frequency [17]. Estimation of soil moisture using microwave remote sensing
has been well established.
In a broader sense the advantage of remote sensing techniques over the in-situ methods is that the
former allows the acquisition of global and synoptic view. The in-situ methods are very accurate in
terms of point based estimating of soil moisture but the limitation is just that the information is localized
[18]. Remote sensing methods offer rapid data collection of soil moisture over large areas with a high
temporal resolution with a fact that the penetration depth changes with the wavelength [19-21]. To
further add on, microwave sensors have advantages and unique capabilities over the optical sensors
[22, 23]. These are:
a) All weather penetration capability through clouds.
b) Day and night capability (independent of intensity and angle of sun illumination).
c) Penetration through vegetation and soil to a certain extent.
d) Direct Sensing of moisture content of earth materials.
Both active as well as passive microwave remote sensing are being used very effectively to retrieve
soil moisture. Active Microwave remote sensing techniques have an upper edge as far as the spatial

IJARSG– An Open Access Journal (ISSN 2320 – 0243)
International Journal of Advanced Remote Sensing and GIS 1047
resolution is concerned. Also the concept of soil moisture retrieval in active microwave remote sensing
forms its basis on sensing the backscatter coefficient using radars. Many researchers have explored
multi-incidence angle, multi-polarized, multi-frequency and temporal Synthetic Aperture Radar (SAR)
data to retrieve soil moisture under variety of agricultural heterogeneity [24-27]. However, along with
its strong sensitivity towards soil moisture, SAR signals are also sensitive towards other target
properties like surface roughness, vegetation cover and soil texture [28-32]. Therefore, due to its
sensitivity towards other target proper-ties soil moisture sensitivity decreases significantly due to
presence of these noise parameters in a resolution cell.
On the other hand Passive Microwave remote sensing which forms its basis on sensing the brightness
temperatures using radiometers is also being used extensively to retrieve soil moisture. A particular
advantage of passive microwave sensors is that in the absence of significant vegetation cover soil
moisture is the dominant effect on the received signal. However, soil moisture is highly variable both
spatially and temporally [2] and passive microwave remote sensing is capable of estimating soil
moisture with better temporal resolution at a larger scale as far as the area of observation is
concerned.
Microwave observations, in particular, are sensitive to soil moisture since the presence of water
strongly affects the dielectric constant and, consequently, the emissivity of land surfaces. Surface
roughness and vegetation cover reduce the sensitivity of microwave emission to soil moisture, and
their effects become more pronounced as the observation frequency increases.
The Advanced Microwave Scanning Radiometer for the Earth Observing System (AMSR-E) launched
on board Aqua satellite observed several parameters related to water cycle and global energy. The
most important parameter is surface soil moisture which can be retrieved from AMSR-E brightness
temperature data [33]. Various algorithms have been developed for the retrieval of soil moisture from
AMSR-E data. Several researchers have used these data products provided by AMSR-E and have
validated these algorithms [34-37]. In the case of AMSR-E data, nonlinear iterative algorithm [38] has
been used for the generation of soil moisture products and the final data product is being distributed
worldwide by the National Snow and Ice Data Centre (NSIDC).
3. Scientific Rationale behind Soil Moisture Retrieval using Passive Microwave Sensors
The basic principle behind soil moisture estimation using passive microwave remote sensing is the
measurement thermal energy emitted by the soil at low frequency microwave wavelengths. Microwave
remote sensing dispenses a very distinctive capability for direct observation of soil moisture. Soil
moisture is estimated by measuring either the reflected electromagnetic energy or the emitted
electromagnetic energy. Active microwave measures the radar backscatter coefficient while the
passive microwave measures emission or brightness temperature.
The dielectric properties and temperature of the soil, or combination of both are the governing factors
for observed variations in intensity of microwave radiation. Theoretically there exist a large contrast
between the dielectric properties of liquid water and dry soil and this forms the basis of soil moisture
measurement using microwave remote sensing as it records the microwave emissivity [22]. The
dielectric constant of water is as high as 80 in comparisons to that of dry soil which varies between 3
and 4. This drastic noticeable variation is because of the fact that water molecules are free to rotate at
microwave frequencies [39]. Thus, as the soil moisture increases, the dielectric constant can increase
to a value of 20 or more [40]. This variation directly reflects on emissivity changes from 0.95 for dry
soils to 0.6 or less for wet soils. Thus it can be observed that there exists a direct relationship between
soil moisture and brightness temperature.

IJARSG– An Open Access Journal (ISSN 2320 – 0243)
International Journal of Advanced Remote Sensing and GIS 1048
The passive sensors, referred to as radiometers, detect the radiated energy in the microwave
spectrum. Radiometers are used to measure the raw counts as the noise equivalent temperatures
which are converted into the brightness temperature. The basic principle that works behind the
process of detection by the radiometers is the Rayleigh Jeans approximation of Planck’s law. The
behaviour is guided by the electromagnetic emission from a blackbody at a given temperature T °K as
governed by Planck’s law.
The Planck’s law when it is approximated for f/T <<< 2 × , is known as Rayleigh Jeans
approximation for blackbody, which is given by
In natural situations, the ability to absorb or emit is related by Kirchoff’s law which is given as
Where, emissivity ε ( ) is the ratio of the emission between the object and the blackbody maintained at
the same temperature. The emissivity depends upon a number of parameters such as temperature,
polarization, frequency, angle of incidence, and the physical properties of the surface.
For radiometers working in shorter wavelength ranges, atmospheric attenuation and emission of the
signal can be expressed as [41, 42]
Where, is the microwave brightness temperature, is the atmospheric transmission, is the
surface reflectivity and , and are the temperatures of the sky, soil and atmosphere,
respectively. For typical soil moisture applications using longer microwave wavelengths, atmosphere is
transparent in most atmospheric conditions ( ~1K) and is much less (~3.5K); hence these
terms can be neglected. Therefore,
Where is the emissivity, which depends upon the dielectric constant of the medium [41].
4. Study Area
To demonstrate the potential of developed methodology during the course of this work, the study area
has been selected as entire Indian sub-continent. The fundamental reason behind this selection is that
it offers a complete range of soil moisture values due to availability of very dry as well as highly moist
areas. The geographical extent of the area in concern is Upper left latitude- 40, Upper left longitude-
55, Lower right latitude- 5, and Lower left longitude- 100. Due to the presence of all types of
meteorological conditions and variety in agricultural practices the selected study area is expected to
provide a fantastic opportunity to test the developed methodology.

IJARSG– An Open Access Journal (ISSN 2320 – 0243)
International Journal of Advanced Remote Sensing and GIS 1049
5. Dataset
The data set used is called AMSR-E/Aqua Daily L3 Surface Soil Moisture, Interpretive Parameters, &
QC EASE-Grids, Version 2. Gridded Level-3 land surface product (AE_Land3). It measures the
surface soil moisture and vegetation/roughness water content interpretive information, as well as
brightness temperatures and quality control variables on daily basis. The product is available in
hierarchical data format i.e. HDF-EOS. The spatial coverage is global but, here Indian sub-continent is
taken as the area in concern. The temporal coverage is from 19 June 2002 to 3 October 2011. Data
are provided in the Equal Area Scalable Earth (EASE)-Grid global cylindrical projection. The projection
used for AMSR-E Level-3 land products is a generalized form of the EASE-Grid called Cylindrical
Equal-Area (CEA), which is user-defined projection number 97 in the General Cartographic
Transformation Package (GCTP).
Surface Soil Moisture in the top 1cm of soil is averaged over the retrieval footprint. Measurements of
soil moisture are most accurate in areas of low vegetation. Attenuation from vegetation increases the
retrieval error in soil moisture [43]. Surface type classifications are assigned to indicate low and
moderate vegetation, and retrievals are not performed in dense vegetation. The retrieval algorithm
does not explicitly model effects of topography, snow cover, clouds, and precipitation. Other potential
error sources include anomalous inputs from bad radiometric data and low level processing errors.
The processing algorithm includes checks to identify these and other anomalies and assign
appropriate flags [42].
The 6.9 GHz channel in the AMSR-E sensor is shared with mobile communication services as a result
of which retrieval of brightness temperatures and consequently soil moisture content using this
frequency are subject to Radio Frequency Interference (RFI), especially at places near large urban
land areas. To eliminate this problem, soil moisture algorithm uses the 10.7 GHz channel for data
retrieval.
5.1. AMSR-E Sensor Description
AMSR-E is passive microwave radiometer, modified from the Advanced Earth Observing Satellite-II
(ADEOS-II) AMSR, designed and provided by JAXA. It is multi-frequency, dual-polarized microwave
radiometer that detects faint microwave emissions from the Earth's surface and atmosphere. This
sensor provides the opportunity to retrieve geophysical parameters like, sea surface wind speed,
precipitation, water vapour, cloud liquid water, snow water equivalent, sea surface temperature and
soil moisture. The AMSR-E instrument operates in polar, sun-synchronous orbits, with equator
crossings at 1:30 A.M. (descending) and 1:30 P.M. (ascending) local solar time. The AMSR-E is a
modified technology to the Scanning Multichannel Microwave Radiometer (SMMR) and Special
Sensor Microwave Imager (SSM/I) instruments, first launched in 1978 and 1987 respectively.
It provides observations of variables describing the Earth’s atmosphere, ocean, cryosphere, and land
surface. The AMSR-E is a passive microwave instrument and is designed to measure brightness
temperature at six frequencies, 6.925, 10.65, 18.7, 23.8, 36.5, and 89.0 GHz, with vertical and
horizontal polarizations at each frequency for a total of twelve channels. For AMSR-E, global swath
coverage is achieved every two days or less, separately for ascending and descending passes, except
for a small region near the poles. Full daily coverage is obtained above approximately 550 latitudes.
Spatial resolution of the individual measurements varies from 5.4 km at 89.0 GHz to 56 km at 6.9 GHz
as given in Table 1.
The AMSR-E brightness temperatures are first resampled (for a given swath) to an Earth fixed grid.
The gridded brightness temperature is then classified to determine feasible points for retrieval. In this
paper, the L-3 products have been used. Table 1, describes the AMSR-E system characteristics.

IJARSG– An Open Access Journal (ISSN 2320 – 0243)
International Journal of Advanced Remote Sensing and GIS 1050
AMSR-E sensor description has been referred to from the NSIDC official website http://nsidc.org
Table 1: AMSR-E Performance Characteristics
Polarization Horizontal and Vertical
Incidence angle 55°
Cross polarization Less than -20 dB
Swath (km) 1445
Precision 1 K
Centre frequency (GHz) 6.93 10.65 18.7 23.8 36.5 89
Mean
spatial
resolution (km)
56 38 21 24 12 5.4
IFOV (km) 74×43 51×30 27×16 31×18 14×8 6x4
http://nsidc.org/data/docs/daac/amsre_instrument.gd.html
6. Methodology
6.1. Data Downloading
The satellite data product was freely downloaded from the following link http://reverb.echo.nasa.gov
which is distributed by National Snow and Ice Data Center. The data sets were obtained for entire
Indian sub-continent using AMSR-E passive microwave sensor. Gridded AMSR-E Level-3 soil
moisture data product (AE_Land3) was freely downloaded from National Snow & Ice Data Center,
NSIDC official website. The data product corresponds to a 56 km mean spatial resolution, which has
been further resampled to a global cylindrical 25 km Equal-Area Scalable Earth Grid (EASE-Grid) cell
spacing. It was required to input the latitudes and longitudes of the area in order to subset it, in this
case the downloaded data extent were as follows, Upper left latitude- 40, Upper left longitude- 55,
Lower right latitude- 5, Lower left longitude- 100. As a result all downloaded files were in .hdf format
and size of the image being 173 pixels by 135 lines. This is a daily product and for each day there
were 2 files, one for the ascending pass and the other for descending pass. So for 365 days of the
year, a total of 730 hdf files were downloaded.
6.2. Soil Moisture Map Generation
For generating daily weekly and monthly average soil moisture maps batch file programming and
coding in C was performed and two executable files were developed. There were certain logics and
concepts followed to develop these files in the codes. There are 135 rows and 173 columns in each
downloaded soil moisture dataset. Therefore each file has a total of 23355 pixels; in the soil moisture
data product each pixel contains a 16 bit signed integer value which is a measure of soil moisture. In
the downloaded datasets, for pixels that are void of any retrieval where no data is recorded due to
inherent gaps between available swaths a fill value of 9999 is allotted and for no retrieval due to bad
brightness temperature data or screening by land surface classification, or unsuccessful retrieval due
to retrieval values outside the physical range, a fill value of -9999 is allotted. Both Ascending and
descending soil moisture data sets give the soil moisture at 10.7 GHz resolution (g /cm³) and the data
in the pixels ranges between 0 and 500. Therefore to obtain soil moisture in g /cm³ the data values
were multiplied by 0.001. In the code, each row is processed and 173 column elements in each row
are checked for the data range which should be between 0 and 500. And finally the data is multiplied
by 0.001 and then by 100 to generate % soil moisture raster.
The first step was to extract the required channel data from the downloaded HDF file. To accomplish
this task batch file programming scripts were written to extract ascending and descending soil moisture
channel data. As a result for each day 2 files were extracted one for the ascending pass and the other

IJARSG– An Open Access Journal (ISSN 2320 – 0243)
International Journal of Advanced Remote Sensing and GIS 1051
for the descending pass. Consequently for a week a total of 14 files, for a month a total of 58 to 62 files
and for a year a total of 730 files.
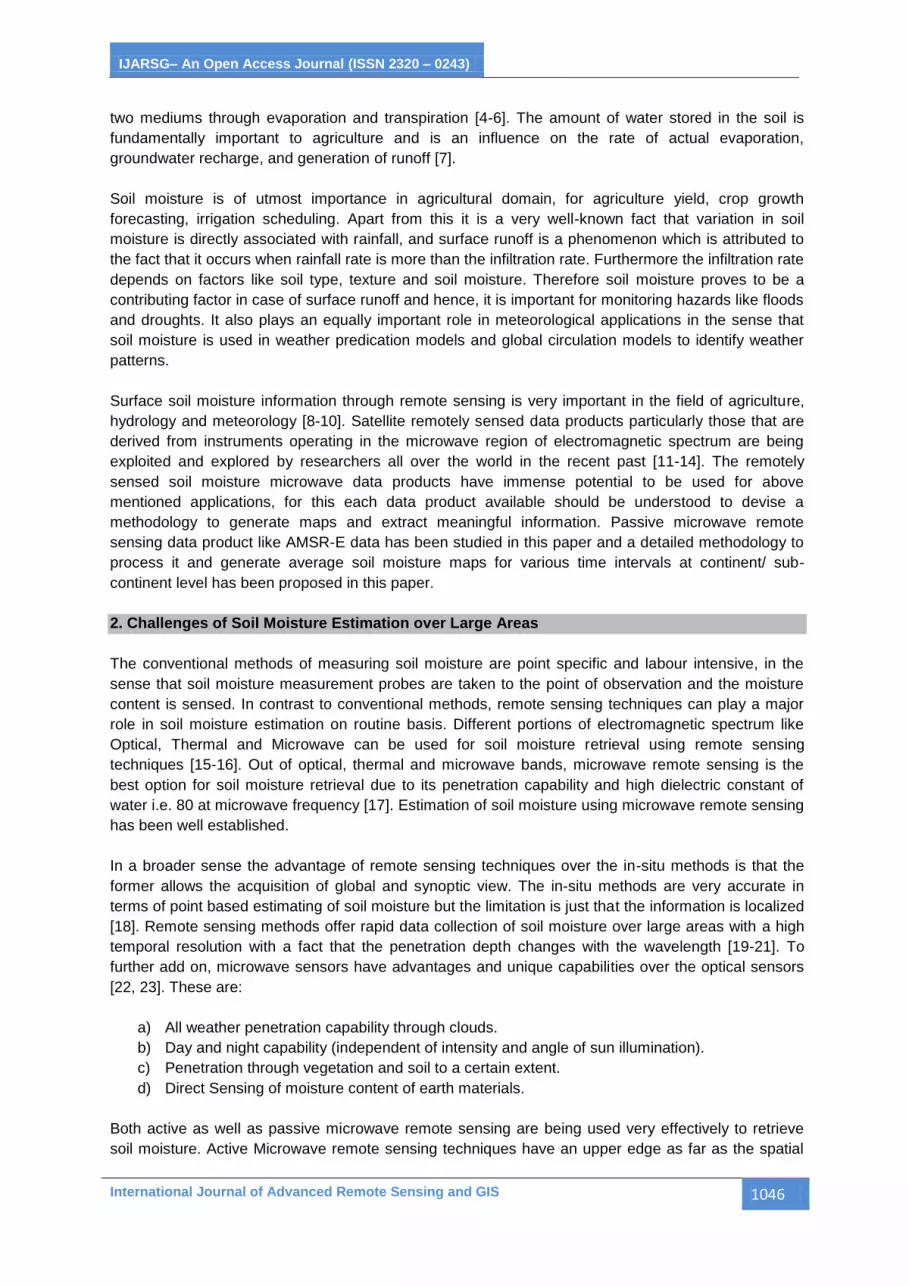
Figure 1 and 2 show extracted soil moisture data sets for the ascending passes from JULY 1, 2009 to
JULY 7, 2009. The 7 ascending pass files and 7 descending pass files from 1st July 2009 to 7th July
2009 clearly show that entire Indian subcontinent is not covered in a single pass.
Figure 1: Ascending Pass Scenes Depicting Swaths on Which Soil Moisture Data was recorded from 1st July
2009 to 7th July 2009
IJARSG– An Open Access Journal (ISSN 2320 – 0243)
International Journal of Advanced Remote Sensing and GIS 1052
Figure 2: Descending Pass Scenes Depicting Swaths on Which Soil Moisture Data was recorded from 1st July
2009 to 7th July 2009
6.3. Deriving Average Soil Moisture Maps using Daily Soil Moisture Rasters
Once the ascending and descending files were extracted, the weekly and monthly average of these
data sets was taken independently. For this, codes in C programming were developed and an
executable file was created which, when given all extracted files of a week or a month as input,
generated a weekly or monthly average soil moisture output file each for ascending and descending
pass. As a result 2 output files were generated in .BIN format for each week or month.
After average binary soil moisture files for ascending and descending passes are generated they were
averaged again to using another code written in C in which the two files, namely ascending and
descending were supplied as input and the final average soil moisture file is obtained as an output.
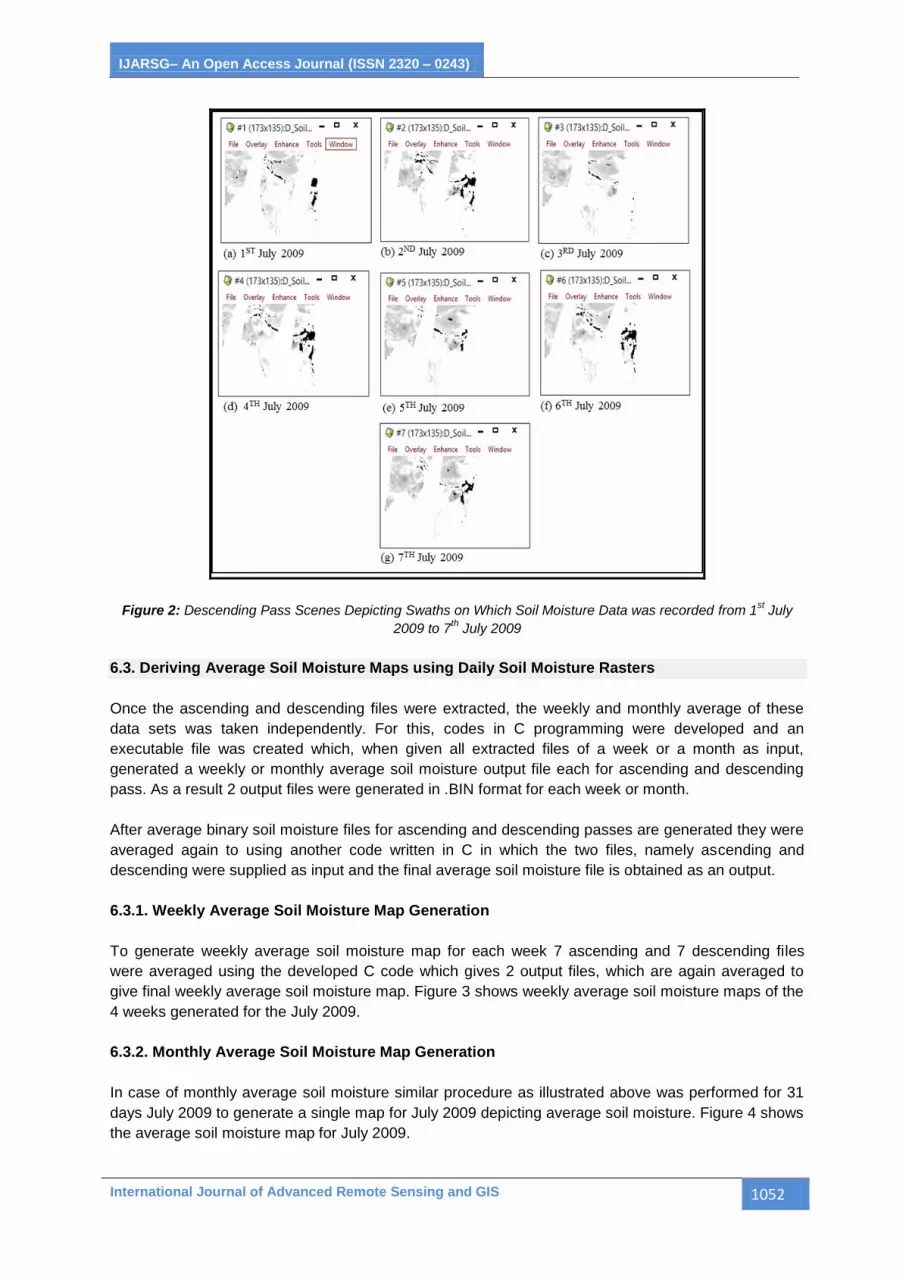
6.3.1. Weekly Average Soil Moisture Map Generation
To generate weekly average soil moisture map for each week 7 ascending and 7 descending files
were averaged using the developed C code which gives 2 output files, which are again averaged to
give final weekly average soil moisture map. Figure 3 shows weekly average soil moisture maps of the
4 weeks generated for the July 2009.
6.3.2. Monthly Average Soil Moisture Map Generation
In case of monthly average soil moisture similar procedure as illustrated above was performed for 31
days July 2009 to generate a single map for July 2009 depicting average soil moisture. Figure 4 shows
the average soil moisture map for July 2009.
IJARSG– An Open Access Journal (ISSN 2320 – 0243)
International Journal of Advanced Remote Sensing and GIS 1053
6.3.3. Annual Average Soil Moisture Map Generation
To generate annual average soil moisture map for 2009, 12 monthly soil moisture files were averaged
using the same codes. Figure 5 shows the 12 average monthly soil moisture maps for the year 2009
which were averaged to generate final annual average soil moisture map for year 2009.
Figure 3: Average Weekly Soil Moisture Maps July 2009
WEEK 1: July, 1 to 7
WEEK 2: July, 8 to 14
WEEK 3: July, 15 to 21
WEEK 4: July, 22 to 28
Figure 4: Average Monthly Soil Moisture Map July 2009 (July 1 to 31)

IJARSG– An Open Access Journal (ISSN 2320 – 0243)
International Journal of Advanced Remote Sensing and GIS 1054
Figure 5: Average Monthly Soil Moisture Maps January 2009 to December 2009
6.4. Batch Geo-Referencing
It is to be noted that all the generated average soil moisture raster files were in binary file format and
using ENVI software all these files were converted to TIFF format. The TIFF format can be easily used
in ArcGIS software.
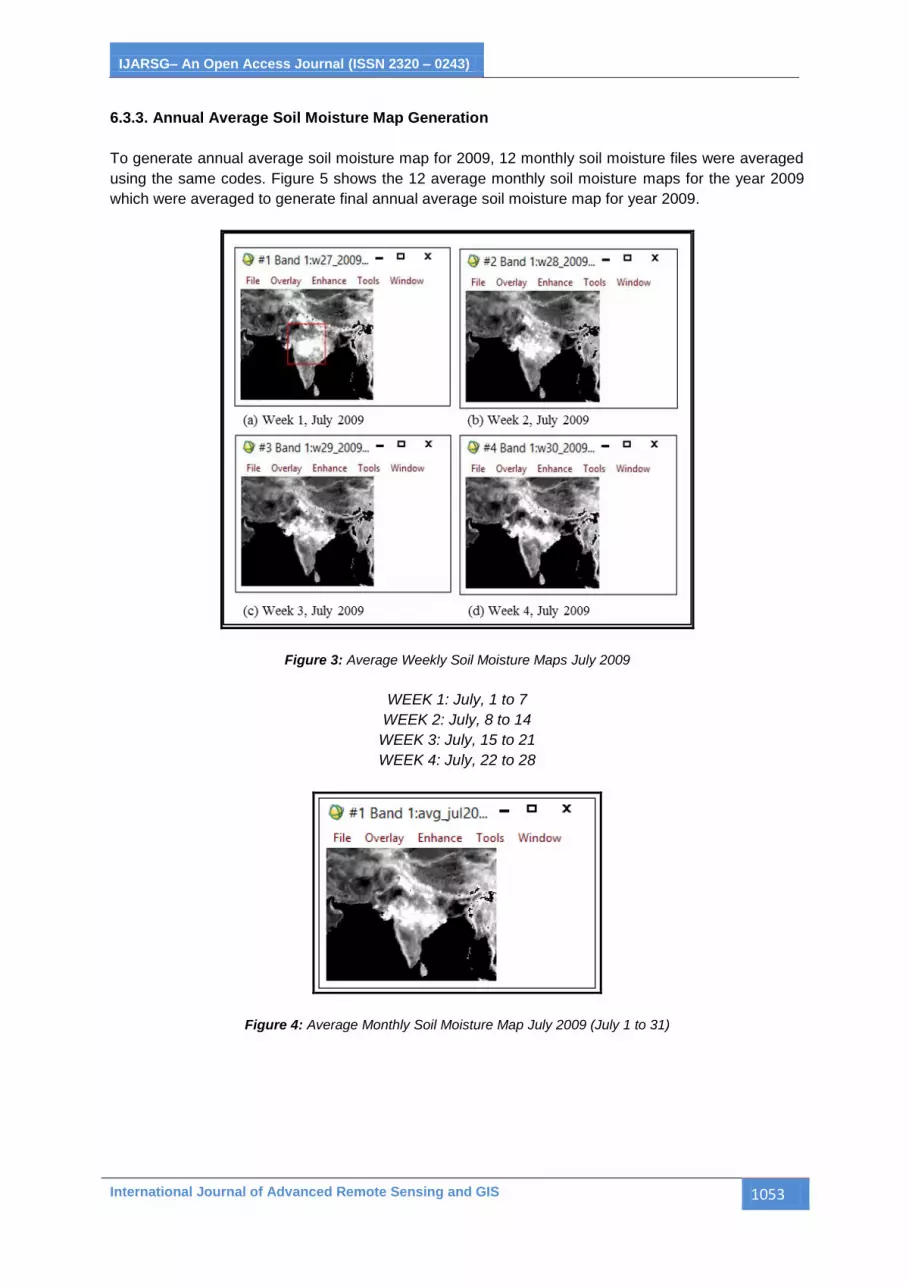
Once the average soil moisture raster maps were generated they were geo-referenced. And the geo-
referenced files were overlayed with shape file of Indian sub-continent. For this purpose a model was
developed in ArcGIS for batch geo-referencing shown in Figure 6.
IJARSG– An Open Access Journal (ISSN 2320 – 0243)
International Journal of Advanced Remote Sensing and GIS 1055
Figure 6: Model for Batch Geo-Referencing
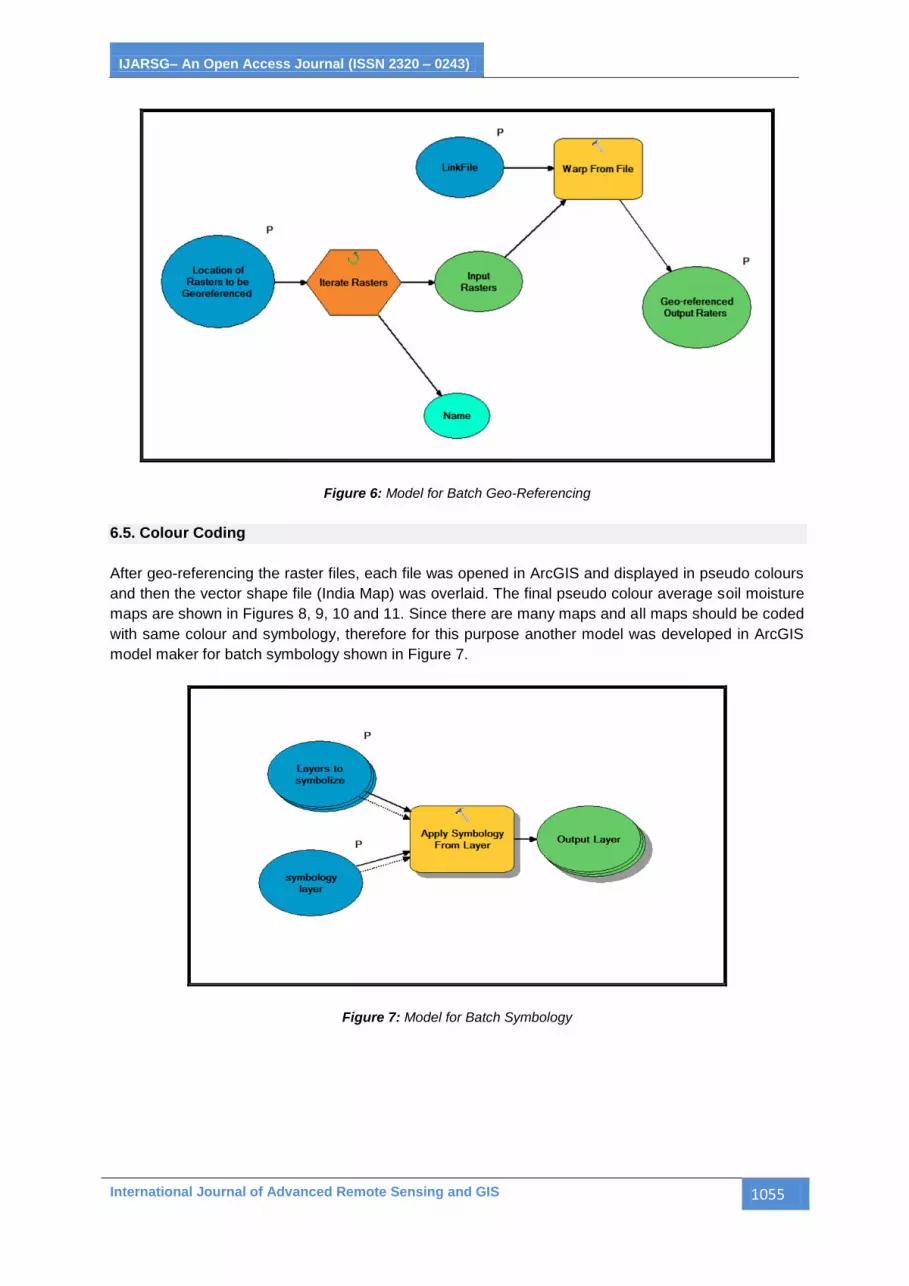
6.5. Colour Coding
After geo-referencing the raster files, each file was opened in ArcGIS and displayed in pseudo colours
and then the vector shape file (India Map) was overlaid. The final pseudo colour average soil moisture
maps are shown in Figures 8, 9, 10 and 11. Since there are many maps and all maps should be coded
with same colour and symbology, therefore for this purpose another model was developed in ArcGIS
model maker for batch symbology shown in Figure 7.
Figure 7: Model for Batch Symbology
IJARSG– An Open Access Journal (ISSN 2320 – 0243)
International Journal of Advanced Remote Sensing and GIS 1056
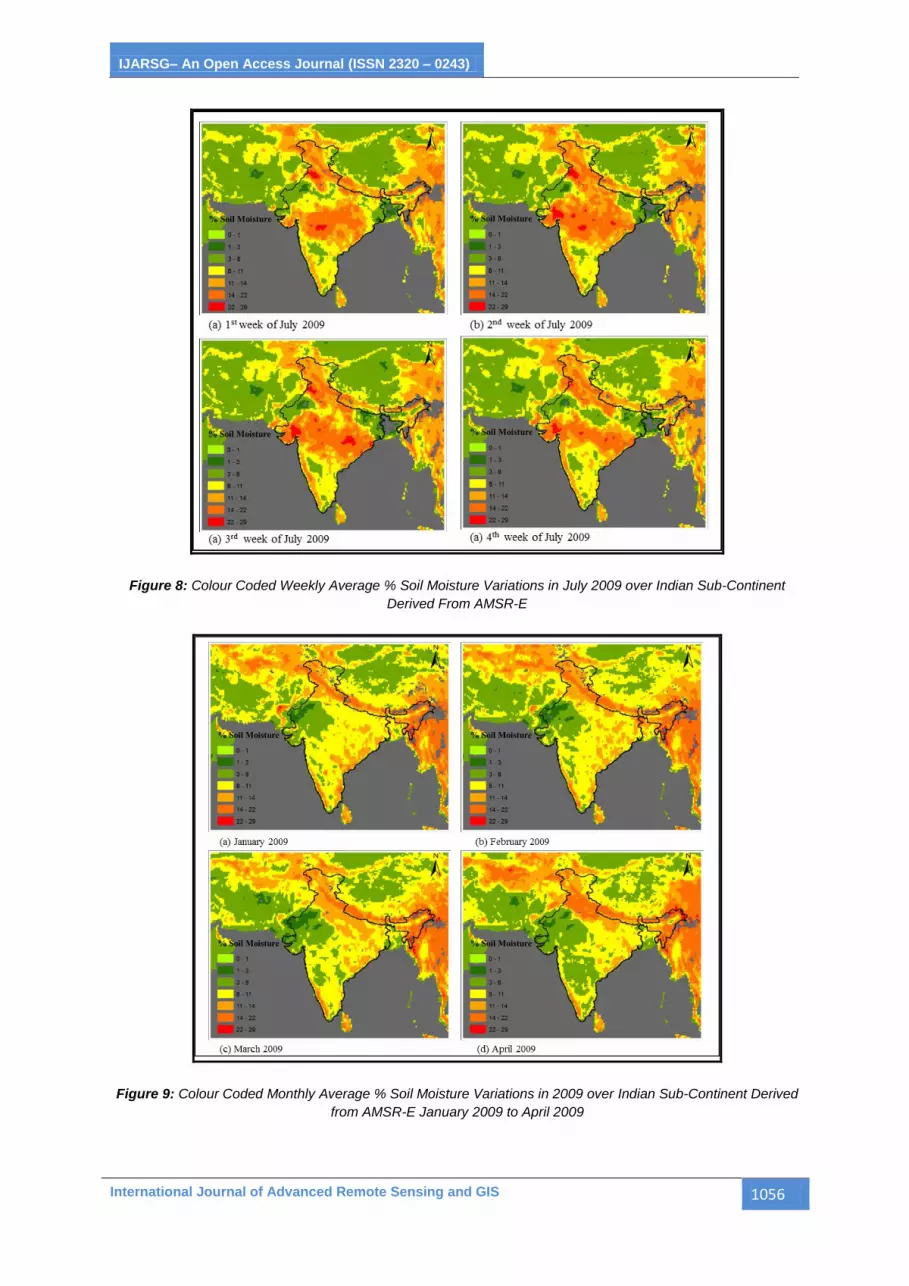
Figure 8: Colour Coded Weekly Average % Soil Moisture Variations in July 2009 over Indian Sub-Continent
Derived From AMSR-E
Figure 9: Colour Coded Monthly Average % Soil Moisture Variations in 2009 over Indian Sub-Continent Derived
from AMSR-E January 2009 to April 2009

IJARSG– An Open Access Journal (ISSN 2320 – 0243)
International Journal of Advanced Remote Sensing and GIS 1057
Figure 10: Colour Coded Monthly Average % Soil Moisture Variations in 2009 over Indian Sub-Continent Derived
from AMSR-E May 2009 to December 2009
IJARSG– An Open Access Journal (ISSN 2320 – 0243)
International Journal of Advanced Remote Sensing and GIS 1058
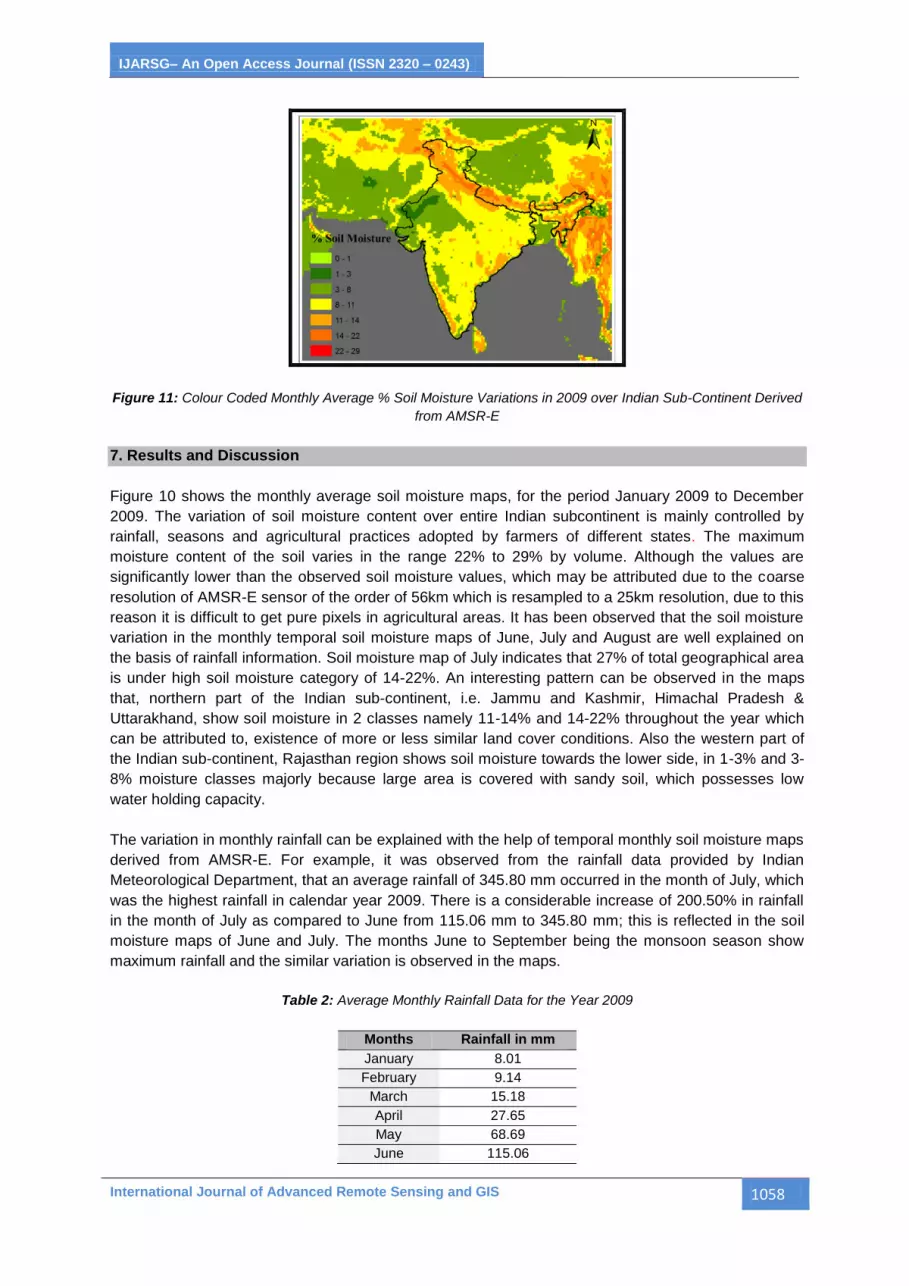
Figure 11: Colour Coded Monthly Average % Soil Moisture Variations in 2009 over Indian Sub-Continent Derived
from AMSR-E
7. Results and Discussion
Figure 10 shows the monthly average soil moisture maps, for the period January 2009 to December
2009. The variation of soil moisture content over entire Indian subcontinent is mainly controlled by
rainfall, seasons and agricultural practices adopted by farmers of different states. The maximum
moisture content of the soil varies in the range 22% to 29% by volume. Although the values are
significantly lower than the observed soil moisture values, which may be attributed due to the coarse
resolution of AMSR-E sensor of the order of 56km which is resampled to a 25km resolution, due to this
reason it is difficult to get pure pixels in agricultural areas. It has been observed that the soil moisture
variation in the monthly temporal soil moisture maps of June, July and August are well explained on
the basis of rainfall information. Soil moisture map of July indicates that 27% of total geographical area
is under high soil moisture category of 14-22%. An interesting pattern can be observed in the maps
that, northern part of the Indian sub-continent, i.e. Jammu and Kashmir, Himachal Pradesh &
Uttarakhand, show soil moisture in 2 classes namely 11-14% and 14-22% throughout the year which
can be attributed to, existence of more or less similar land cover conditions. Also the western part of
the Indian sub-continent, Rajasthan region shows soil moisture towards the lower side, in 1-3% and 3-
8% moisture classes majorly because large area is covered with sandy soil, which possesses low
water holding capacity.
The variation in monthly rainfall can be explained with the help of temporal monthly soil moisture maps
derived from AMSR-E. For example, it was observed from the rainfall data provided by Indian
Meteorological Department, that an average rainfall of 345.80 mm occurred in the month of July, which
was the highest rainfall in calendar year 2009. There is a considerable increase of 200.50% in rainfall
in the month of July as compared to June from 115.06 mm to 345.80 mm; this is reflected in the soil
moisture maps of June and July. The months June to September being the monsoon season show
maximum rainfall and the similar variation is observed in the maps.
Table 2: Average Monthly Rainfall Data for the Year 2009
Months Rainfall in mm
January 8.01
February 9.14
March 15.18
April 27.65
May 68.69
June 115.06

IJARSG– An Open Access Journal (ISSN 2320 – 0243)
International Journal of Advanced Remote Sensing and GIS 1059
July 345.80
August 218.33
September 170.76
October 90.50
November 58.01
December 10.80
The average monthly rainfall data from Indian Meteorological Department (IMD) has been compiled in
Table-II. An important aspect which must be considered here is that it is not possible to justify the
monthly soil moisture variations highlighted in the soil moisture maps, blindly on the basis of seasons
and rainfall. The reason being that even if the rainfall was less for example in the months of January to
March, majority of irrigated area shows soil moisture in the range 8-11% and 11-14%, which are
moderate soil moisture classes. This pattern can be attributed to the fact that irrespective of rainfall
conditions, farmers of most of the irrigated areas used to irrigate their fields either through canal
irrigation or by tube-wells. Another observation that AMSR-E derived soil moisture at places is not
exactly matching with rainfall information, is supported by the fact that due to coarse-resolution cell of
passive microwave sensor the large variation in the soil moisture on the ground is unable to be
assessed [1]. In addition, mixed pixels due to large pixel size of AMSR-E also introduce error in soil
moisture retrieval but research has verified the validity of AMSR-E data at 25 km resolution [1] which
provides a platform for using AMSR-E data to understand spatial variability of soil moisture for large
areas. However researchers have shown that accuracy of AMSR-E soil moisture data can be
improved by incorporating vegetation/roughness parameter, g.
Data analysis revealed that for the entire year, approximately 2% of the total geographical area shows
soil moisture less than 3%. Average soil moisture maps derived from AMSR-E indicate that for the
months of January to June and September to December, geographical area ranging between 39% and
48% fall in the soil moisture category of 8% to 11%, which means majority portion of the Indian sub-
continent shows moderate soil moisture except in the months of July and August which experienced
highest rainfall in the year. Furthermore, 26.44% and 34.87% of geographical area in the months of
July and August fall in the same soil moisture category as mentioned above. With the average rainfall
of 8.01 mm, 9.14 mm and 15.18 mm in the months of January, February and March, 20.80%, 23.30%
and 25.49% area respectively fall in soil moisture category of 11% to 14%. In the monsoon months of
July to October, percentage of geographical area falling in the same soil moisture category increased
considerably to 27.22%, 27.87%, 23.20%, & 23.66%, which can be justified by higher rainfall
conditions. The category of 14% to 22% soil moisture, which is considered to be under high soil
moisture category, is in close agreement with the occurred rainfall. Moreover since the rainfall in the
months of January, February and March were very less, consequently only 7.80%, 8.07% and 6.9% of
the total area during these months fall under 14% to 22% soil moisture category. A sudden increment
in the percentage geographical area from approximately 6.90% to 11.76% in April can be attributed to
the fact that there is a sudden jump in the rainfall from March to April. Similarly due to maximum
rainfall in the month of July, 26.91% geographical area (i.e. highest area in this category of soil
moisture) went to 14% to 22% soil moisture category. Likewise the gradual decrease in rainfall after
July is well reflected as a decrease in percentage geographical area for the same soil moisture
category.
8. Conclusion
During the course of this study efforts have been made to develop a detailed methodology for
generation of average soil moisture maps of desired intervals (e.g. weekly/ monthly/ yearly etc.) over a
very large geographical area like a continent or sub-continent. The proposed methodology is based
upon the analysis of 730 AMSR-E scenes (365 scenes for the ascending pass and the same number
of scenes for the descending pass) and has been well tested over Indian sub-continent for all the 365
days of the year 2009.

IJARSG– An Open Access Journal (ISSN 2320 – 0243)
International Journal of Advanced Remote Sensing and GIS 1060
The main advantage of all the passive microwave sensors is their fine temporal resolution. This is in
contrast with SAR sensors, which provide fine spatial resolution at the cost of temporal resolution.
Therefore passive microwave sensors must be tested over a huge geographical area to fully exploit
and demonstrate their capability of providing large coverage. Therefore in this study an attempt has
been made to popularize the passive microwave data and its derived soil moisture products by
selecting space-borne passive microwave radiometer (AMSR-E) over a large study area covering
entire Indian sub-continent.
One of the major advantages of the proposed methodology is that a user can generate average soil
moisture maps at desired intervals (e.g. weekly/ monthly /yearly etc.); this can significantly reduce the
time and efforts of managers and decision makers. Monthly soil moisture maps generated by
exploiting the developed methodology successfully explain the seasonal variation in soil moisture and
confirm the soundness of the detailed methodology reported in this paper.
Acknowledgements
Authors are extremely thankful to Dr. A. Senthil Kumar, Director, IIRS/ISRO, Dehradun and Shri T.
Misra, Director, SAC/ISRO, Ahmedabad for encouragement and support. Authors are also thankful to
Dr. S.P.S Kushwaha, Group Director, ERSS/IIRS & Dean (A), IIRS, Dr. Suresh Kumar, Head,
ASD/IIRS and Dr. Deva Pratap, Head, Department of Civil Engineering, NIT, Warangal for useful
discussions and support.
References
[1] Patel, P. and Srivastava, H.S. An Approach to Validate Soil Moisture Derived from Passive
Microwave Sensors using SAR as an Interface. International Journal of Remote Sensing. 2015. 36
(9) 2353-2374.
[2] Martinez, C., Hancock, G.R., Kalma, J.D. and Wells T. Spatio-Temporal Distribution of Near-
Surface and Root Zone Soil Moisture at the Catchment Scale. Hydrological Processes. 2007. 22
(4) 2699-2714.
[3] Mohan, S., Mehta, R.L., Patel, P. and Srivastava, H.S. Feasibility Study for Operational Monitoring
of Soil Moisture. Scientific Note: SAC/RSA/RSAG/ERS 1/SN/09/97. 1997. 01-40.
[4] Shukla, J. and Mintz, Y. Influence of Land Surface Evapotranspiration on the Earth’s Climate.
Science. 1982. 215; 1498-1501.
[5] Delworth, T. and Manabe, S. The Influence of Soil Wetness on Near Surface Atmospheric
Variability. Journal of Climate. 1989. 2; 1447-1462.
[6] Fennessy, M.J. and Shukla, J. Impact of Initial Soil Wetness on Seasonal Atmospheric Prediction.
Journal of Climate. 1999. 12; 3167-3180.
[7] Houghton, J.T., Ding, Y., Griggs, D.J., Noguer, M., van der Linden, P.J. Dai, X., Maskell, K. and
Johnson, C.A. IPCC Report on Climate Change 2001: The Scientific Basis. Cambridge University
Press, Cambridge, United Kingdom and New York, NY, USA. 2001. 881.
[8] Mohan, S., Mehta, N.S., Mehta, R.L., Patel, P., Rajak, Srivastava, H.S., Das, D.K., Sharma, S.,
Saxena, C.M. and Sutrodhar, A.K. Assessment of ERS-1 SAR Data for Soil Moisture Estimation.
Proc., 1st ERS-1 Symposium on Space at the Service of our Environment. 1993. 2.

IJARSG– An Open Access Journal (ISSN 2320 – 0243)
International Journal of Advanced Remote Sensing and GIS 1061
[9] Srivastava, H.S., Patel, P., Manchada, M.L. and Adiga, S. Application Potential of SAR Derived
Soil Moisture Information for Disaster Management. Proc. International Symposium on National
Hazards (INTROMET-2004). 2004.
[10] Srivastava, H.S., Patel, P. and Navalgund, R.R. How far SAR has Fulfilled Its Expectation for Soil
Moisture Retrieval. Proc. of Asia-Pacific Remote Sensing Symposium, International Society for
Optics and Photonics. 2006. 641001-64100; 1-12.
[11] Srivastava, H.S. SAR Applications in Soil Moisture Retrieval. NASA-ISRO Synthetic Aperture
Radar (NISAR) Science Workshop, Ahmedabad, India. 2014. 17-18.
[12] Srivastava, H.S., Sharma, P.K., Kumar, D., Sivasankar, T., Mishra, R.S., Mishra, M. and Patel, P.
Soil Moisture Variation Over Parts of Saharanpur and Haridwar Districts (India) During November-
2006 to June-2007 as observed by Multi-Polarized (VV/HH & VV/VH) ENVISAT-1 temporal ASAR
data. International Journal of Advanced Engineering Research and Science. 2015. 2 (1) 31-39.
[13] Shukla, A., Srivastava, H.S., Patel, P.R., Mishra, M., Patel, P., Shukla, A.K. and Ajai. Soil Moisture
Estimation using SAR: Indian Scenario. 100th Indian Science Congress, Kolkata, India. 03-07 Jan.
2013.
[14] Patel, P. and Srivastava, H.S. RADARSAT-2 Announcement of Opportunity Project on Soil
Moisture, Surface Roughness and Vegetation Parameter Retrieval Using SAR Polarimetry.
Scientific Report SAC/EPSA/MPSG/CVD/TDP-R&D/01/13, Space Applications Centre (ISRO)
Ahmedabad–380 015. January 2013.
[15] Srivastava, H.S., Patel, P., Prasad, S.N., Sharma, Y., Khan, B.A., Praveen, B., Arun Prasad, K.
C.A., Sharma, S., Vijayan, L. and Vijayan, V.S. Potential Applications on Multi-Parametric
Synthetic Aperture Radar (SAR) Data in Wetland Inventory: A Case Study of Keoladeo National
Park (A World Heritage and Ramsar Site), Bharatpur, India. Proc. of Taal 2007: The 12th World
Lake Conference. 2008. 1826-1879.
[16] Srivastava, H.S., Patel, P. and Navalgund, R.R. Towards Operational Monitoring of Soil Moisture:
Incorporating the Effects of Surface Roughness, Crop Cover and Soil Texture in the Soil Moisture
Retrieval Model. National symposium organized by Indian Society of Remote Sensing on
‘Emergence of Geoinformatics for Development: Trends and Opportunities’. ISRS-2005, Ranchi
during 6-9 December 2005. 6-9.
[17] Srivastava, H.S. Monitoring of Soil Moisture using Multi-parameteric Synthetic Aperture Radar
(SAR) data. Ph.D. Thesis in Physics; Chhatrapati Shahu Ji Maharaj University, Kanpur, India.
2010. 01-212.
[18] Shukla, A., Panchal, H., Mishra, M., Patel, P.R., Srivastava, H.S., Patel, P. and Shukla, A.K. Soil
Moisture Estimation using Gravimetric Technique and FRD Probe Technique: A Comparative
Analysis. American International Journal of Research in Formal, Applied & Natural Sciences.
2014. 8 (1) 89-92.
[19] Srivastava, H.S. and Patel, P. Potential Applications of Multi-Frequency SAR Data in the Field of
Soil Moisture Estimation: A Case Study with L, C and X Band SIR-C/X-SAR Data. ICMARS-2006.
Organized by International Centre for Radio Science, Jodhpur. December 2006. 20-22.
[20] Patel, P. and Srivastava, H.S. Polarimetric SAR Classification Using Physical Based Scattering
Mechanism: Comparative Evaluation of L and P Bands. JEP-MW Conference. 2007.

IJARSG– An Open Access Journal (ISSN 2320 – 0243)
International Journal of Advanced Remote Sensing and GIS 1062
[21] Srivastava, H.S. Interaction of Multi-Frequency Multi-Polarized DLR ESAR Data with Various
Targets: A Case Study with C, L and P Bands Acquired at All the Four Linear (VV, VH, HH & HV)
Polarizations. JEP-MW Conference. SAC, Ahmedabad. 15-16 May 2007. 2; 12-23.
[22] Calla, O.P.N., Bohra, D., Vyas, R., Purohit, D.S., Prasher, R., Loomba, A. and Kumar, N.
Measurement of Soil Moisture Using Microwave Radiometer. Proceedings of International
Conference on Microwave. 2008. 621-624.
[23] Schmugge, T. and Jakson, T.J. Passive Microwave Remote Sensing of Soil Moisture. EARSeL
Advances in Remote Sensing. 1993. 2 (2-VI).
[24] Srivastava, H.S., Patel, P., Sharma, Y. and Navalgund, R.R. Large-Area Soil Moisture Estimation
Using Multi-Incidence Angle RADARSAT-1 SAR data. IEEE Transactions on Geoscience and
Remote Sensing. 2009. 47 (8) 2528-2535.
[25] Srivastava, H.S., Patel, P., Manchanda, M.L. and Adiga, S. Use of Multi-Incidence Angle
RADARSAT-1 SAR Data to Incorporate the Effect of Surface Roughness in Soil Moisture
Estimation. IEEE Transactions on Geoscience and Remote Sensing. 2003. 41 (7) 1638-1640.
[26] Srivastava, H.S., Patel, P., Praveen, B. and Manchanda, M.L. Radar Remote Sensing Applications
in Wetland Habitat: III. A Case Study of Keoladeo National Park Using Multi-Polarized SAR Data
from RADARSAT-1 and ERS-2. Proceedings of ISPRS VIII Commission Symposium, Hyderabad,
India. 2002. 34 part 07 17-21.
[27] Srivastava, H.S., Patel, P., Sharma, Y., Singh, M. and Singh, S.S. An Attempt To Estimate Deeper
Layer Soil Moisture from Surface Soil Moisture Derived From Multi-Incidence Angle Radarsat-1
Sar Data. Proceedings In CMARS-2005; Organized by International Centre for Radio Science,
Jodhpur, India, December 2005. 01-06; 20-22.
[28] Srivastava, H.S., Patel, P., Manchanda, M.L. and Adiga, S. An Attempt to Incorporate the Effect of
Crop Cover in Soil Moisture Estimation using Multiincidence Angle RADARSAT-1 SAR Data.
Asian Journal of Geoinformatics. March 2002. 2 (3) 33-40.
[29] Srivastava, H.S., Patel, P. and Navalgund, R.R. Incorporating Soil Texture in Soil Moisture
Estimation from Extended Low-1 Beam Mode RADARSAT-1 SAR Data. International Journal of
Remote Sensing. 2006. 27 (12) 2587-2598.
[30] Patel, P., Srivastava, H.S. and Navalgund, R.R. Use of Synthetic Aperture Radar Polarimetry to
Characterize Wetland Targets of Keoladeo National Park, Bharatpur, India. Current Science. 2009.
97 (4) 529-537.
[31] Srivastava, H.S., Patel, P., Navalgund, R.R. and Sharma, Y. Retrieval of Surface Roughness
Using Multi-Polarized Envisat-1 ASAR data. Geocarto Int. 2008. 23 (1) 67-77.
[32] Srivastava, H.S., Patel, P., Sharma, K.P. and Krishnamurthy, Y.V.N. Explored and Demonstrated
Potential Applications of Multi-Parametric Synthetic Aperture Radar in Wetland Studies in Context
of Keoladeo National Park, Bharatpur, India. 2nd Annual Research Seminar on Keoladeo National
Park (2ndARS-KNP) jointly organized by KNP, Forest Department of State of Rajasthan and WWF
at Bharatpur on March 15, 2009. 1-30.

IJARSG– An Open Access Journal (ISSN 2320 – 0243)
International Journal of Advanced Remote Sensing and GIS 1063
[33] Singh, G., Srivastava, H.S., Mesapam, S. and Patel, P. Analysis of Monthly Soil Moisture
Variations Derived From AMSR-E for the Year 2010 Over Indian Subcontinent. Proc. of
International Conference on Sustainable Energy and Built Environment, Vellore, Indian. 12-13
March 2015. 539-545.
[34] Wen, J., Zhang, T., Zhao, Y., Tian, H., Shi, X., Wang, X., Liu, R., Zhang, J., and Lu, S. Surface
Soil Moisture Estimates from AMSR-E Observations over an Arid Area, Northwest China.
Hydrology and Earth System Sciences Discussions. 2009. 6; 1055-1087.
[35] Paloscia, S., Macelloni, G. and Santi, E. Soil Moisture Estimates From AMSR-E Brightness
Temperatures by Using a Dual-Frequency, IEEE Transactions on Geoscience and Remote
Sensing. 2006. 44 (11) 3135-3144.
[36] Paloscia, S., Macelloni, G., Santi, E. and T. Koike. A Multifrequency Algorithm for the Retrieval of
Soil Moisture on a Large Scale using Microwave Data from SMMR and SSM/I Satellites. IEEE
Transactions on Geoscience and Remote Sensing. 2001. 39: 1655-1661.
[37] Chen, C.F., Lin, Y.J., Chang, L.Y., Son, N.T. Retrieving Surface Soil Moisture from MODIS and
AMSR-E Data: A Case Study in Taiwan. International Archives of the Photogrammetry, Remote
Sensing and Spatial Information Sciences. 2012. 39 (B3) 379-383.
[38] Njoku, E.G., Jackson, T.J., Lakshmi, V., Chan, T.K., and Nghiem, S.V. Soil Moisture Retrieval from
AMSR-E. IEEE Trans. Geosci. And Remote Sensing. 2003. 41; 215-228.
[39] Ulaby, F.T., Moore, R.K. and Fung, A.K. 1982b: Microwave Remote Sensing: Active and Passive.
Vol. 2. Radar Remote Sensing and Surface Scattering and Emission Theory. Norwood, MA:
Artech House.
[40] Wang, J.R. and Schmugge, T. An Empirical Model for the Complex Dielectric Permittivity of Soils
as a Function of Water Content. IEEE Transactions on Geoscience and Remote Sensing. 1991.
18; 288-295.
[41] Engman, E.T. Application of Microwave Remote Sensing of Soil Moisture for Water Resources
and Agriculture. Remote Sensing of Environment. 1991. 35; 213-226.
[42] Njoku, E.G., Jackson, T.J., Lakshmi, V., Chan, T.K. and Nghiem, S.V. Soil Moisture Retrieval from
AMSR-E. IEEE Trans. Geosci. and Remote Sensing. 2003. 41 215-228.
[43] Njoku, E.G. AMSR-E/Aqua Daily L3 Surface Soil Moisture, Interpretive Parameters, & QC EASE-
Grids. Version 2. [AE_Land 3]. Boulder, Colorado USA: NASA National Snow and Ice Data Center
Distributed Active Archive Center. 2004.