paradigm funds annual 2020 draft.qxd
TRANSCRIPT
Paradigm FundsParadigm Value FundParadigm Select FundParadigm Micro-Cap FundFor Investors Seeking Long-Term Capital Appreciation
ANNUAL REPORTDecember 31, 2020
IMPORTANT NOTE: Beginning on January 1, 2021, as permitted by regulations adopted by the Securitiesand Exchange Commission, paper copies of the Funds' shareholder reports will no longer be sent by mail,unless you specifically request paper copies of the reports from the Funds or from your financial intermedi-ary, such as a broker-dealer or bank. Instead, the reports will be made available on a website, and you willbe notified by mail each time a report is posted and provided with a website link to access the report. If youalready elected to receive shareholder reports electronically, you will not be affected by this change and youneed not take any action. You may elect to receive shareholder reports and other communications from theFunds or your financial intermediary electronically by calling or sending an email request. You may elect toreceive all future reports in paper free of charge. You can inform the Funds or your financial intermediarythat you wish to continue receiving paper copies of your shareholder reports by calling or sending an emailrequest. Your election to receive reports in paper will apply to all funds held with the fund complex/yourfinancial intermediary.
Table of Contents
PARADIGM FUNDS
Letter to Shareholders . . . . . . . . . . . . . . . . . . . . . . . . . . . . . . . . . . . . . . . . . . . . . .2Sector Allocation . . . . . . . . . . . . . . . . . . . . . . . . . . . . . . . . . . . . . . . . . . . . . . . . . 5Performance Information . . . . . . . . . . . . . . . . . . . . . . . . . . . . . . . . . . . . . . . . . . .7Schedules of Investments . . . . . . . . . . . . . . . . . . . . . . . . . . . . . . . . . . . . . . . . .10Statements of Assets and Liabilities . . . . . . . . . . . . . . . . . . . . . . . . . . . . . . . . . .18Statements of Operations . . . . . . . . . . . . . . . . . . . . . . . . . . . . . . . . . . . . . . . . . .18Statements of Changes in Net Assets . . . . . . . . . . . . . . . . . . . . . . . . . . . . . . . .20Financial Highlights . . . . . . . . . . . . . . . . . . . . . . . . . . . . . . . . . . . . . . . . . . . . . .22
NOTES TO FINANCIAL STATEMENTS . . . . . . . . . . . . . . . . . . . . . . . . . . . . . . .24
REPORT OF INDEPENDENT REGISTERED PUBLIC ACCOUNTING FIRM . .30
DISCLOSURE OF EXPENSES . . . . . . . . . . . . . . . . . . . . . . . . . . . . . . . . . . . . .31
ADDITIONAL INFORMATION . . . . . . . . . . . . . . . . . . . . . . . . . . . . . . . . . . . . . .33
TRUSTEES & OFFICERS . . . . . . . . . . . . . . . . . . . . . . . . . . . . . . . . . . . . . . . . .34
2020 Annual Report 1
Letter to Shareholders
Dear Fellow Shareholders:
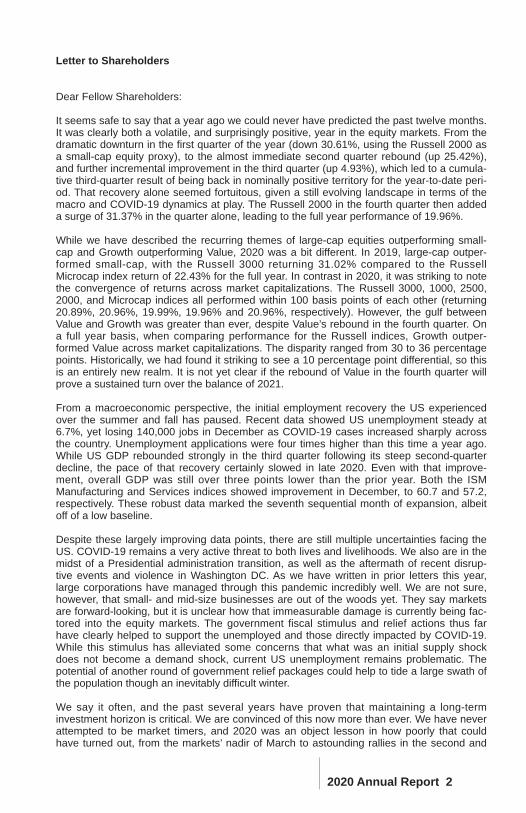
It seems safe to say that a year ago we could never have predicted the past twelve months.It was clearly both a volatile, and surprisingly positive, year in the equity markets. From thedramatic downturn in the first quarter of the year (down 30.61%, using the Russell 2000 asa small-cap equity proxy), to the almost immediate second quarter rebound (up 25.42%),and further incremental improvement in the third quarter (up 4.93%), which led to a cumula-tive third-quarter result of being back in nominally positive territory for the year-to-date peri-od. That recovery alone seemed fortuitous, given a still evolving landscape in terms of themacro and COVID-19 dynamics at play. The Russell 2000 in the fourth quarter then addeda surge of 31.37% in the quarter alone, leading to the full year performance of 19.96%.
While we have described the recurring themes of large-cap equities outperforming small-cap and Growth outperforming Value, 2020 was a bit different. In 2019, large-cap outper-formed small-cap, with the Russell 3000 returning 31.02% compared to the RussellMicrocap index return of 22.43% for the full year. In contrast in 2020, it was striking to notethe convergence of returns across market capitalizations. The Russell 3000, 1000, 2500,2000, and Microcap indices all performed within 100 basis points of each other (returning20.89%, 20.96%, 19.99%, 19.96% and 20.96%, respectively). However, the gulf betweenValue and Growth was greater than ever, despite Value’s rebound in the fourth quarter. Ona full year basis, when comparing performance for the Russell indices, Growth outper-formed Value across market capitalizations. The disparity ranged from 30 to 36 percentagepoints. Historically, we had found it striking to see a 10 percentage point differential, so thisis an entirely new realm. It is not yet clear if the rebound of Value in the fourth quarter willprove a sustained turn over the balance of 2021.
From a macroeconomic perspective, the initial employment recovery the US experiencedover the summer and fall has paused. Recent data showed US unemployment steady at6.7%, yet losing 140,000 jobs in December as COVID-19 cases increased sharply acrossthe country. Unemployment applications were four times higher than this time a year ago.While US GDP rebounded strongly in the third quarter following its steep second-quarterdecline, the pace of that recovery certainly slowed in late 2020. Even with that improve-ment, overall GDP was still over three points lower than the prior year. Both the ISMManufacturing and Services indices showed improvement in December, to 60.7 and 57.2,respectively. These robust data marked the seventh sequential month of expansion, albeitoff of a low baseline.
Despite these largely improving data points, there are still multiple uncertainties facing theUS. COVID-19 remains a very active threat to both lives and livelihoods. We also are in themidst of a Presidential administration transition, as well as the aftermath of recent disrup-tive events and violence in Washington DC. As we have written in prior letters this year,large corporations have managed through this pandemic incredibly well. We are not sure,however, that small- and mid-size businesses are out of the woods yet. They say marketsare forward-looking, but it is unclear how that immeasurable damage is currently being fac-tored into the equity markets. The government fiscal stimulus and relief actions thus farhave clearly helped to support the unemployed and those directly impacted by COVID-19.While this stimulus has alleviated some concerns that what was an initial supply shockdoes not become a demand shock, current US unemployment remains problematic. Thepotential of another round of government relief packages could help to tide a large swath ofthe population though an inevitably difficult winter.
We say it often, and the past several years have proven that maintaining a long-terminvestment horizon is critical. We are convinced of this now more than ever. We have neverattempted to be market timers, and 2020 was an object lesson in how poorly that couldhave turned out, from the markets’ nadir of March to astounding rallies in the second and
2020 Annual Report 2
fourth quarters. Thus whatever 2021 may bring, we believe that our consistent investmentprocess and discipline remain paramount to Paradigm’s long-term vision and outperfor-mance. We believe that owning quality companies with excellent management teams iswhat allows us to invest with conviction. Having confidence in our due diligence and ongo-ing research process means that in the inevitable rocky market periods, we can sit tight andnot capitulate amidst uncertainty and panic. It may not feel easy at the time—as little of2020 did—but it does enable us to prevail and hold our investment vision intact.
Paradigm Value Fund
The Paradigm Value Fund increased 17.78% for the calendar year 2020, compared to a4.63% gain for its benchmark, the Russell 2000 Value Index. Since inception (January 1,2003) on an average annual basis, the Fund has returned 12.91%, compared to 9.47% forthe benchmark.
Information Technology stocks were the largest contributor for the year, due to both anoverweight position and stock selection. A sudden transition to remote working and remotelearning drove increased demand for IT consumer hardware. Communications and net-working equipment demand also increased to support changes in network usage.
The Consumer Discretionary sector proved to be one of the most challenging in 2020 asthe global pandemic adversely impacted retailers. Brick and mortar businesses relyingupon foot traffic faced significant headwinds through the year, while apparel companiesfaced headwinds from decreased consumer mobility.
Paradigm Select Fund
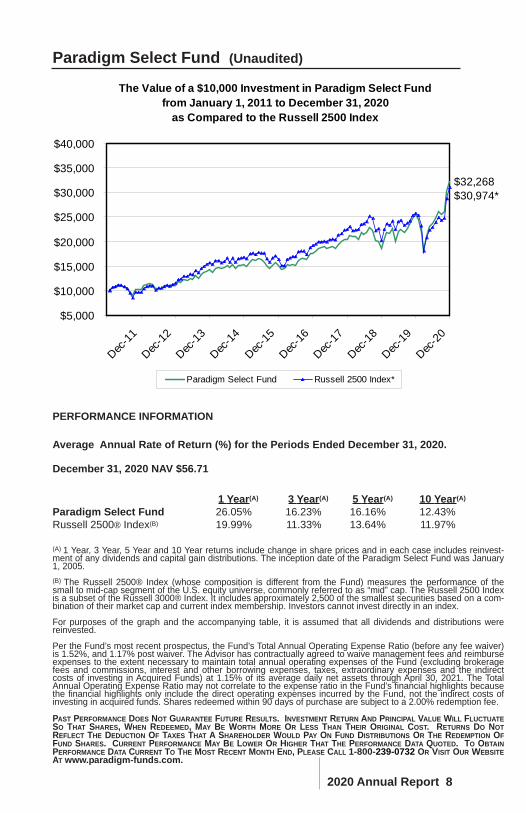
The Paradigm Select Fund increased 26.05% for the calendar year 2020, compared to anincrease of 19.99% for its benchmark, the Russell 2500 Index. Since inception (January 1,2005) on an average annual basis, the Fund has returned 10.55% compared to 9.46% forthe benchmark.
The Information Technology sector was the top contributor to performance for the year dueto a larger allocation relative to its benchmark. Software and Services companies benefittedfrom an increased need for programs and cloud storage to enable the remote working andlearning ecosystem. The Healthcare sector also performed well as many Equipment &Supplies companies contributed to enabling pandemic response efforts.
The Materials sector underperformed in 2020 primarily due to exposure to Metals & Mining.Specialty Materials companies with exposure to commercial aerospace underperformed asair travel declined 65% in 2020 year-over-year.
Paradigm Micro-Cap Fund
The Paradigm Micro-Cap Fund gained 46.85% for the calendar year 2020, compared to anincrease of 20.96% for its benchmark, the Russell Microcap Index. Since inception(January 1, 2008) on an average annual basis, the Fund has returned 10.37%, comparedto 7.93% for the benchmark.
Strong stock selection and overweight positions made the Information Technology andHealth Care sectors the top contributors to performance in 2020. Smaller softwareproviders were flexible enough to address the changing needs of customers in a remote
2020 Annual Report 3
work environment. Communications and networking equipment demand also increased tosupport changes in network usage. The Healthcare sector also performed well as manyEquipment & Supplies companies contributed to enabling pandemic response efforts.
The Consumer Discretionary sector proved to be one of the most challenging in 2020 asthe global pandemic adversely impacted retailers. Brick and mortar businesses relyingupon foot traffic faced significant headwinds through the year, while apparel companiesfaced headwinds from decreased consumer mobility.
Sincerely,
Candace King Weir Amelia F. WeirPresident and Chief Investment Officer Senior Vice PresidentParadigm Funds Advisor LLC Paradigm Funds Advisor LLC
Past performance does not guarantee future results. Investment return and principal valuewill fluctuate so that shares, when redeemed, may be worth more or less than their originalcost. Returns assume that all dividends and distributions were reinvested and do not reflectthe deduction of taxes that a shareholder would pay on fund distributions or the redemptionof fund shares. Current performance may be lower or higher that the performance dataquoted. Statements concerning financial market trends are based on current market condi-tions, which will fluctuate. Any statements of opinion constitute only current opinions ofParadigm Funds Advisor LLC which are subject to change. Investment in the Fundsinvolve a risk of loss. The Russell 2000 Value Index, Russell 2500 Index and RussellMicrocap Index are U.S. equity indices. Investors cannot invest directly in an index. Theseindices are included for informational purposes only and may not be representative of thetype of investments made by the Funds. References made to these indices are for compar-ative purposes only. To obtain performance data current to the most recent month end,please call 1-800-239-0732 or visit our website at www.paradigm-funds.com. The prospec-tus should be read carefully before investing.
2020 Annual Report 4
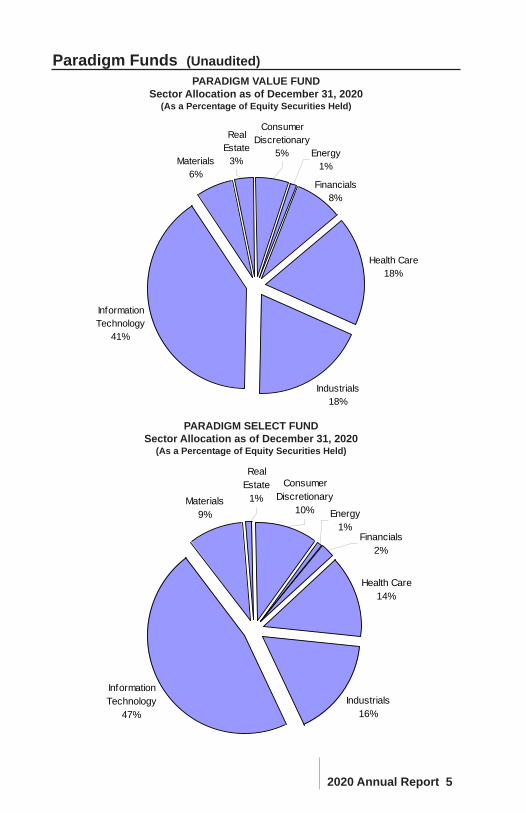
Paradigm Funds (Unaudited)PARADIGM VALUE FUND
Sector Allocation as of December 31, 2020(As a Percentage of Equity Securities Held)
Health Care18%
Information Technology
41%
Financials8%
Consumer Discretionary
5% Energy1%
Industrials18%
Materials6%
Real Estate
3%
Health Care14%
Industrials16%
Information Technology
47%
Consumer Discretionary
10% Energy1%
Financials2%
Materials9%
Real Estate
1%
PARADIGM SELECT FUNDSector Allocation as of December 31, 2020
(As a Percentage of Equity Securities Held)
2020 Annual Report 5
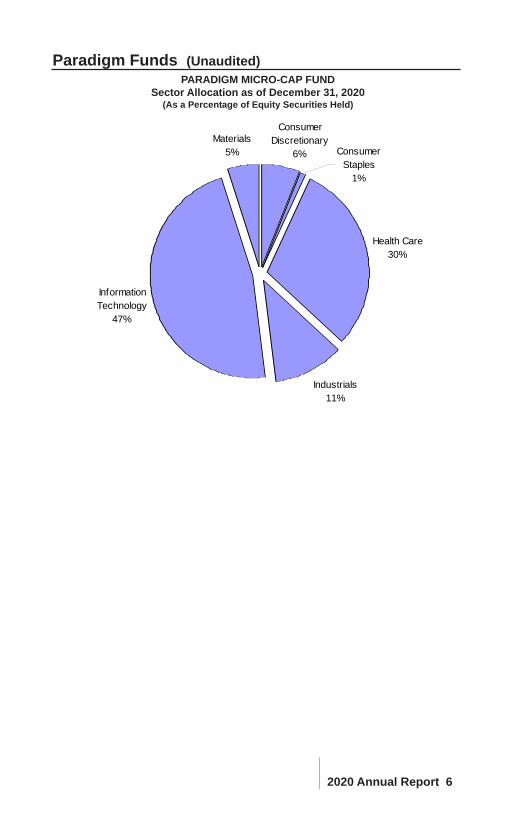
Paradigm Funds (Unaudited)
Consumer Discretionary
6%
Industrials11%
Information Technology
47%
Materials5% Consumer
Staples1%
Health Care30%
PARADIGM MICRO-CAP FUNDSector Allocation as of December 31, 2020
(As a Percentage of Equity Securities Held)
2020 Annual Report 6
2020 Annual Report 7
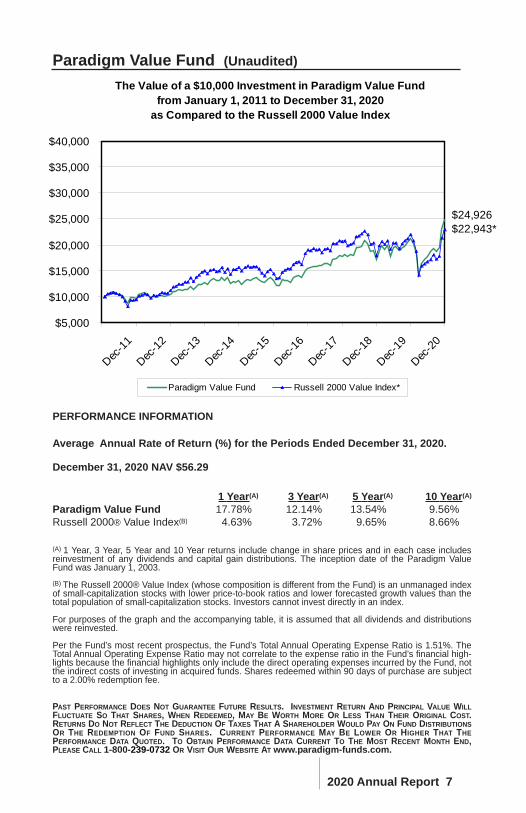
(A) 1 Year, 3 Year, 5 Year and 10 Year returns include change in share prices and in each case includesreinvestment of any dividends and capital gain distributions. The inception date of the Paradigm ValueFund was January 1, 2003. (B) The Russell 2000® Value Index (whose composition is different from the Fund) is an unmanaged indexof small-capitalization stocks with lower price-to-book ratios and lower forecasted growth values than thetotal population of small-capitalization stocks. Investors cannot invest directly in an index.
For purposes of the graph and the accompanying table, it is assumed that all dividends and distributionswere reinvested.
Per the Fund’s most recent prospectus, the Fund’s Total Annual Operating Expense Ratio is 1.51%. TheTotal Annual Operating Expense Ratio may not correlate to the expense ratio in the Fund’s financial high-lights because the financial highlights only include the direct operating expenses incurred by the Fund, notthe indirect costs of investing in acquired funds. Shares redeemed within 90 days of purchase are subjectto a 2.00% redemption fee.
PAST PERFORMANCE DOES NOT GUARANTEE FUTURE RESULTS. INVESTMENT RETURN AND PRINCIPAL VALUE WILLFLUCTUATE SO THAT SHARES, WHEN REDEEMED, MAY BE WORTH MORE OR LESS THAN THEIR ORIGINAL COST.RETURNS DO NOT REFLECT THE DEDUCTION OF TAXES THAT A SHAREHOLDER WOULD PAY ON FUND DISTRIBUTIONSOR THE REDEMPTION OF FUND SHARES. CURRENT PERFORMANCE MAY BE LOWER OR HIGHER THAT THEPERFORMANCE DATA QUOTED. TO OBTAIN PERFORMANCE DATA CURRENT TO THE MOST RECENT MONTH END,PLEASE CALL 1-800-239-0732 OR VISIT OUR WEBSITE AT www.paradigm-funds.com.
December 31, 2020 NAV $56.29
Average Annual Rate of Return (%) for the Periods Ended December 31, 2020.
Paradigm Value Fund (Unaudited)
1 Year(A) 3 Year(A) 5 Year(A) 10 Year(A)
Paradigm Value Fund 17.78% 12.14% 13.54% 9.56%Russell 2000® Value Index(B) 4.63% 3.72% 9.65% 8.66%
PERFORMANCE INFORMATION
The Value of a $10,000 Investment in Paradigm Value Fundfrom January 1, 2011 to December 31, 2020
as Compared to the Russell 2000 Value Index
$5,000
$10,000
$15,000
$20,000
$25,000
$30,000
$35,000
$40,000
Dec-10
Dec-11
Dec-12
Dec-13
Dec-14
Dec-15
Dec-16
Dec-17
Dec-18
Dec-19
Dec-20
Paradigm Value Fund Russell 2000 Value Index*
$24,926$22,943*
2020 Annual Report 8
(A) 1 Year, 3 Year, 5 Year and 10 Year returns include change in share prices and in each case includes reinvest-ment of any dividends and capital gain distributions. The inception date of the Paradigm Select Fund was January1, 2005.(B) The Russell 2500® Index (whose composition is different from the Fund) measures the performance of thesmall to mid-cap segment of the U.S. equity universe, commonly referred to as “mid” cap. The Russell 2500 Indexis a subset of the Russell 3000® Index. It includes approximately 2,500 of the smallest securities based on a com-bination of their market cap and current index membership. Investors cannot invest directly in an index.
For purposes of the graph and the accompanying table, it is assumed that all dividends and distributions werereinvested.
Per the Fund’s most recent prospectus, the Fund’s Total Annual Operating Expense Ratio (before any fee waiver)is 1.52%, and 1.17% post waiver. The Advisor has contractually agreed to waive management fees and reimburseexpenses to the extent necessary to maintain total annual operating expenses of the Fund (excluding brokeragefees and commissions, interest and other borrowing expenses, taxes, extraordinary expenses and the indirectcosts of investing in Acquired Funds) at 1.15% of its average daily net assets through April 30, 2021. The TotalAnnual Operating Expense Ratio may not correlate to the expense ratio in the Fund’s financial highlights becausethe financial highlights only include the direct operating expenses incurred by the Fund, not the indirect costs ofinvesting in acquired funds. Shares redeemed within 90 days of purchase are subject to a 2.00% redemption fee.
PAST PERFORMANCE DOES NOT GUARANTEE FUTURE RESULTS. INVESTMENT RETURN AND PRINCIPAL VALUE WILL FLUCTUATESO THAT SHARES, WHEN REDEEMED, MAY BE WORTH MORE OR LESS THAN THEIR ORIGINAL COST. RETURNS DO NOTREFLECT THE DEDUCTION OF TAXES THAT A SHAREHOLDER WOULD PAY ON FUND DISTRIBUTIONS OR THE REDEMPTION OFFUND SHARES. CURRENT PERFORMANCE MAY BE LOWER OR HIGHER THAT THE PERFORMANCE DATA QUOTED. TO OBTAINPERFORMANCE DATA CURRENT TO THE MOST RECENT MONTH END, PLEASE CALL 1-800-239-0732 OR VISIT OUR WEBSITEAT www.paradigm-funds.com.
December 31, 2020 NAV $56.71
Average Annual Rate of Return (%) for the Periods Ended December 31, 2020.
Paradigm Select Fund (Unaudited)
PERFORMANCE INFORMATION
The Value of a $10,000 Investment in Paradigm Select Fundfrom January 1, 2011 to December 31, 2020
as Compared to the Russell 2500 Index
$5,000
$10,000
$15,000
$20,000
$25,000
$30,000
$35,000
$40,000
Dec-10
Dec-11
Dec-12
Dec-13
Dec-14
Dec-15
Dec-16
Dec-17
Dec-18
Dec-19
Dec-20
Paradigm Select Fund Russell 2500 Index*
$32,268$30,974*
1 Year(A) 3 Year(A) 5 Year(A) 10 Year(A)
Paradigm Select Fund 26.05% 16.23% 16.16% 12.43%Russell 2500® Index(B) 19.99% 11.33% 13.64% 11.97%
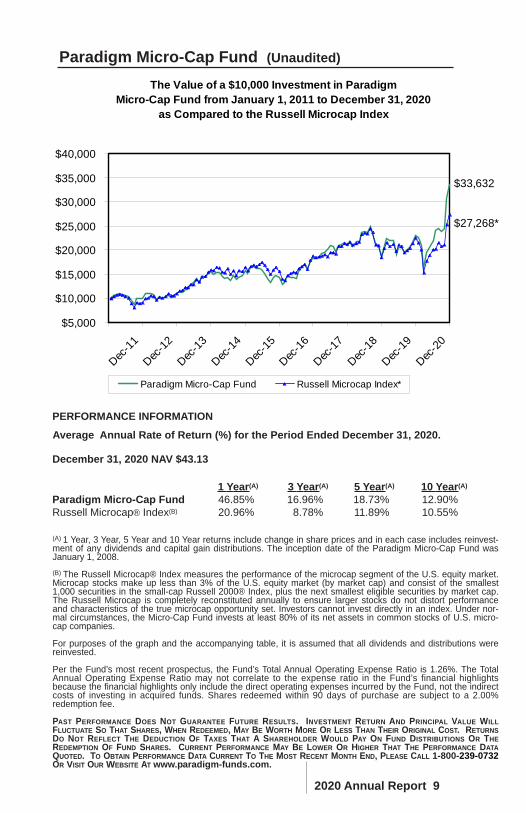
The Value of a $10,000 Investment in Paradigm Micro-Cap Fund from January 1, 2011 to December 31, 2020
as Compared to the Russell Microcap Index
$5,000
$10,000
$15,000
$20,000
$25,000
$30,000
$35,000
$40,000
Dec-10
Dec-11
Dec-12
Dec-13
Dec-14
Dec-15
Dec-16
Dec-17
Dec-18
Dec-19
Dec-20
Paradigm Micro-Cap Fund Russell Microcap Index*
$33,632
$27,268*
2020 Annual Report 9
(A) 1 Year, 3 Year, 5 Year and 10 Year returns include change in share prices and in each case includes reinvest-ment of any dividends and capital gain distributions. The inception date of the Paradigm Micro-Cap Fund wasJanuary 1, 2008. (B) The Russell Microcap® Index measures the performance of the microcap segment of the U.S. equity market.Microcap stocks make up less than 3% of the U.S. equity market (by market cap) and consist of the smallest1,000 securities in the small-cap Russell 2000® Index, plus the next smallest eligible securities by market cap.The Russell Microcap is completely reconstituted annually to ensure larger stocks do not distort performanceand characteristics of the true microcap opportunity set. Investors cannot invest directly in an index. Under nor-mal circumstances, the Micro-Cap Fund invests at least 80% of its net assets in common stocks of U.S. micro-cap companies.
For purposes of the graph and the accompanying table, it is assumed that all dividends and distributions werereinvested.
Per the Fund’s most recent prospectus, the Fund’s Total Annual Operating Expense Ratio is 1.26%. The TotalAnnual Operating Expense Ratio may not correlate to the expense ratio in the Fund’s financial highlightsbecause the financial highlights only include the direct operating expenses incurred by the Fund, not the indirectcosts of investing in acquired funds. Shares redeemed within 90 days of purchase are subject to a 2.00%redemption fee.
PAST PERFORMANCE DOES NOT GUARANTEE FUTURE RESULTS. INVESTMENT RETURN AND PRINCIPAL VALUE WILLFLUCTUATE SO THAT SHARES, WHEN REDEEMED, MAY BE WORTH MORE OR LESS THAN THEIR ORIGINAL COST. RETURNSDO NOT REFLECT THE DEDUCTION OF TAXES THAT A SHAREHOLDER WOULD PAY ON FUND DISTRIBUTIONS OR THEREDEMPTION OF FUND SHARES. CURRENT PERFORMANCE MAY BE LOWER OR HIGHER THAT THE PERFORMANCE DATAQUOTED. TO OBTAIN PERFORMANCE DATA CURRENT TO THE MOST RECENT MONTH END, PLEASE CALL 1-800-239-0732OR VISIT OUR WEBSITE AT www.paradigm-funds.com.
December 31, 2020 NAV $43.13
Average Annual Rate of Return (%) for the Period Ended December 31, 2020.
Paradigm Micro-Cap Fund (Unaudited)
PERFORMANCE INFORMATION
1 Year(A) 3 Year(A) 5 Year(A) 10 Year(A)
Paradigm Micro-Cap Fund 46.85% 16.96% 18.73% 12.90%Russell Microcap® Index(B) 20.96% 8.78% 11.89% 10.55%
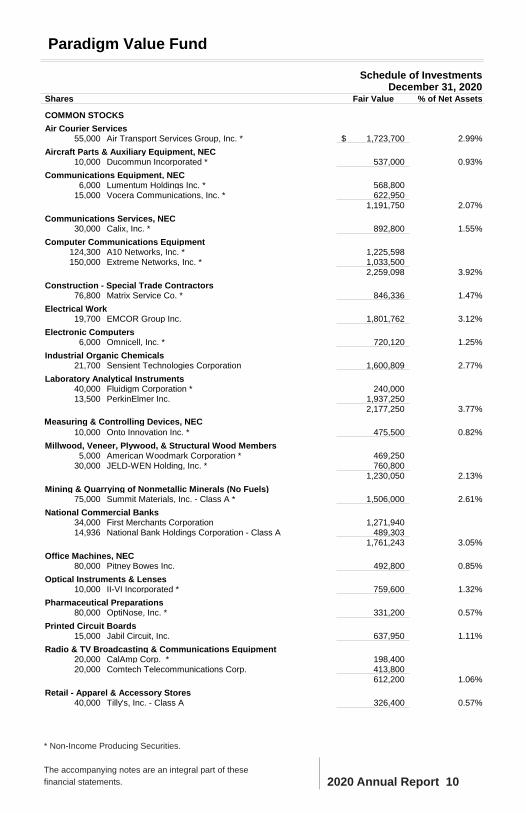
Shares Fair Value % of Net Assets
COMMON STOCKSAir Courier Services
55,000 Air Transport Services Group, Inc. * 1,723,700$ 2.99%Aircraft Parts & Auxiliary Equipment, NEC
10,000 Ducommun Incorporated * 537,000 0.93%Communications Equipment, NEC
6,000 Lumentum Holdings Inc. * 568,800 15,000 Vocera Communications, Inc. * 622,950
1,191,750 2.07%Communications Services, NEC
30,000 Calix, Inc. * 892,800 1.55%Computer Communications Equipment
124,300 A10 Networks, Inc. * 1,225,598 150,000 Extreme Networks, Inc. * 1,033,500
2,259,098 3.92%Construction - Special Trade Contractors
76,800 Matrix Service Co. * 846,336 1.47%Electrical Work
19,700 EMCOR Group Inc. 1,801,762 3.12%Electronic Computers
6,000 Omnicell, Inc. * 720,120 1.25%Industrial Organic Chemicals
21,700 Sensient Technologies Corporation 1,600,809 2.77%Laboratory Analytical Instruments
40,000 Fluidigm Corporation * 240,000 13,500 PerkinElmer Inc. 1,937,250
2,177,250 3.77% Measuring & Controlling Devices, NEC
10,000 Onto Innovation Inc. * 475,500 0.82%Millwood, Veneer, Plywood, & Structural Wood Members
5,000 American Woodmark Corporation * 469,250 30,000 JELD-WEN Holding, Inc. * 760,800
1,230,050 2.13%Mining & Quarrying of Nonmetallic Minerals (No Fuels)
75,000 Summit Materials, Inc. - Class A * 1,506,000 2.61%National Commercial Banks
34,000 First Merchants Corporation 1,271,940 14,936 National Bank Holdings Corporation - Class A 489,303
1,761,243 3.05%Office Machines, NEC
80,000 Pitney Bowes Inc. 492,800 0.85%Optical Instruments & Lenses
10,000 II-VI Incorporated * 759,600 1.32%Pharmaceutical Preparations
80,000 OptiNose, Inc. * 331,200 0.57%Printed Circuit Boards
15,000 Jabil Circuit, Inc. 637,950 1.11%Radio & TV Broadcasting & Communications Equipment
20,000 CalAmp Corp. * 198,400 20,000 Comtech Telecommunications Corp. 413,800
612,200 1.06%Retail - Apparel & Accessory Stores
40,000 Tilly's, Inc. - Class A 326,400 0.57%
Paradigm Value Fund
December 31, 2020 Schedule of Investments
* Non-Income Producing Securities.
The accompanying notes are an integral part of these financial statements. 2020 Annual Report 10
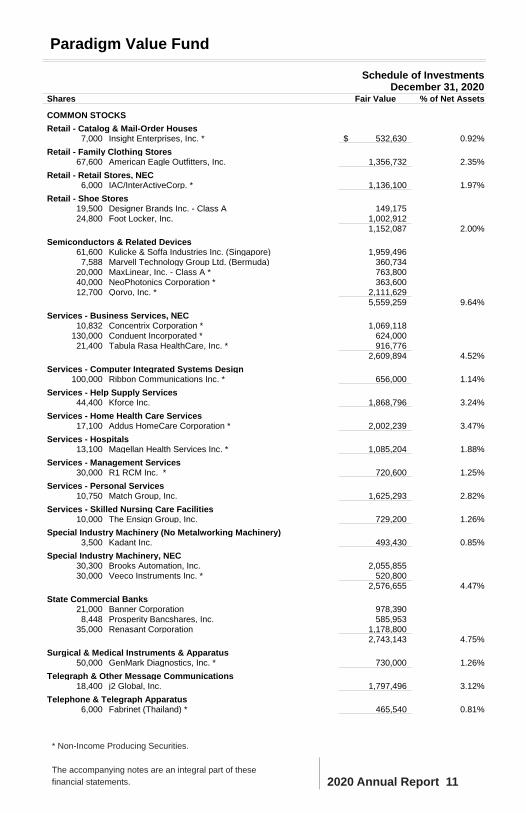
Shares Fair Value % of Net Assets
COMMON STOCKSRetail - Catalog & Mail-Order Houses
7,000 Insight Enterprises, Inc. * 532,630$ 0.92%Retail - Family Clothing Stores
67,600 American Eagle Outfitters, Inc. 1,356,732 2.35%Retail - Retail Stores, NEC
6,000 IAC/InterActiveCorp. * 1,136,100 1.97%Retail - Shoe Stores
19,500 Designer Brands Inc. - Class A 149,175 24,800 Foot Locker, Inc. 1,002,912
1,152,087 2.00%Semiconductors & Related Devices
61,600 Kulicke & Soffa Industries Inc. (Singapore) 1,959,496 7,588 Marvell Technology Group Ltd. (Bermuda) 360,734
20,000 MaxLinear, Inc. - Class A * 763,800 40,000 NeoPhotonics Corporation * 363,600 12,700 Qorvo, Inc. * 2,111,629
5,559,259 9.64%Services - Business Services, NEC
10,832 Concentrix Corporation * 1,069,118 130,000 Conduent Incorporated * 624,000 21,400 Tabula Rasa HealthCare, Inc. * 916,776
2,609,894 4.52%Services - Computer Integrated Systems Design
100,000 Ribbon Communications Inc. * 656,000 1.14%Services - Help Supply Services
44,400 Kforce Inc. 1,868,796 3.24%Services - Home Health Care Services
17,100 Addus HomeCare Corporation * 2,002,239 3.47%Services - Hospitals
13,100 Magellan Health Services Inc. * 1,085,204 1.88%Services - Management Services
30,000 R1 RCM Inc. * 720,600 1.25%Services - Personal Services
10,750 Match Group, Inc. 1,625,293 2.82%Services - Skilled Nursing Care Facilities
10,000 The Ensign Group, Inc. 729,200 1.26%Special Industry Machinery (No Metalworking Machinery)
3,500 Kadant Inc. 493,430 0.85%Special Industry Machinery, NEC
30,300 Brooks Automation, Inc. 2,055,855 30,000 Veeco Instruments Inc. * 520,800
2,576,655 4.47%State Commercial Banks
21,000 Banner Corporation 978,390 8,448 Prosperity Bancshares, Inc. 585,953
35,000 Renasant Corporation 1,178,800 2,743,143 4.75%
Surgical & Medical Instruments & Apparatus50,000 GenMark Diagnostics, Inc. * 730,000 1.26%
Telegraph & Other Message Communications18,400 j2 Global, Inc. 1,797,496 3.12%
Telephone & Telegraph Apparatus6,000 Fabrinet (Thailand) * 465,540 0.81%
Paradigm Value Fund
December 31, 2020 Schedule of Investments
2020 Annual Report 11
* Non-Income Producing Securities.
The accompanying notes are an integral part of these financial statements.
2020 Annual Report 12
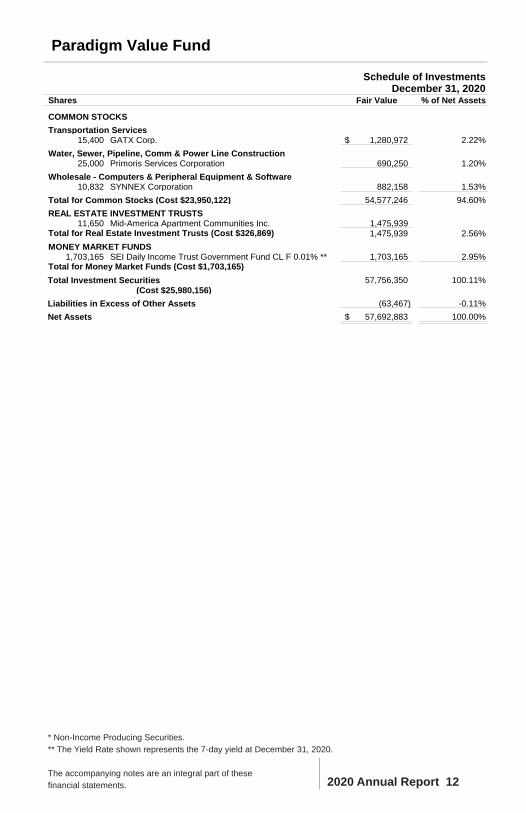
Shares Fair Value % of Net Assets
COMMON STOCKSTransportation Services
15,400 GATX Corp. 1,280,972$ 2.22%Water, Sewer, Pipeline, Comm & Power Line Construction
25,000 Primoris Services Corporation 690,250 1.20%Wholesale - Computers & Peripheral Equipment & Software
10,832 SYNNEX Corporation 882,158 1.53%Total for Common Stocks (Cost $23,950,122) 54,577,246 94.60%REAL ESTATE INVESTMENT TRUSTS
11,650 Mid-America Apartment Communities Inc. 1,475,939 1,475,939 2.56%
MONEY MARKET FUNDS1,703,165 SEI Daily Income Trust Government Fund CL F 0.01% ** 1,703,165 2.95%
Total Investment Securities 57,756,350 100.11% (Cost $25,980,156)
Liabilities in Excess of Other Assets (63,467) -0.11% Net Assets 57,692,883$ 100.00%
Paradigm Value Fund
Total for Real Estate Investment Trusts (Cost $326,869)
Total for Money Market Funds (Cost $1,703,165)
December 31, 2020 Schedule of Investments
* Non-Income Producing Securities.** The Yield Rate shown represents the 7-day yield at December 31, 2020.
The accompanying notes are an integral part of these financial statements.
2020 Annual Report 13
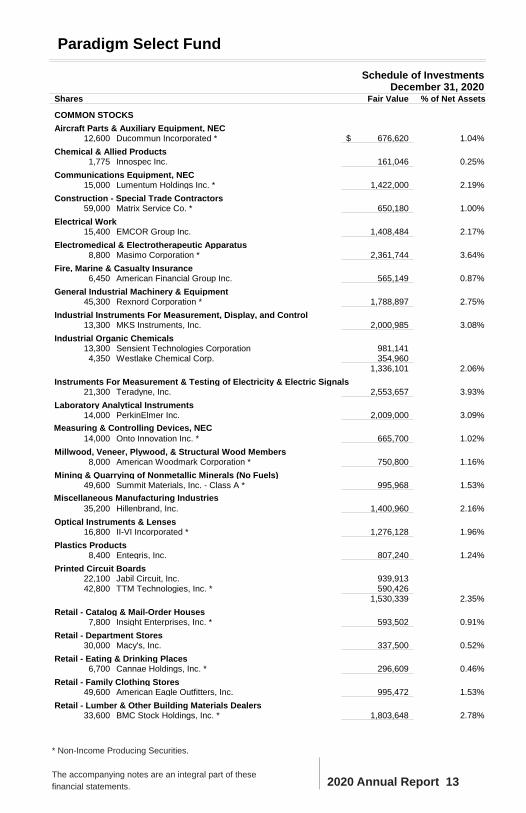
Shares Fair Value % of Net Assets
COMMON STOCKSAircraft Parts & Auxiliary Equipment, NEC
12,600 Ducommun Incorporated * 676,620$ 1.04%Chemical & Allied Products
1,775 Innospec Inc. 161,046 0.25%Communications Equipment, NEC
15,000 Lumentum Holdings Inc. * 1,422,000 2.19%Construction - Special Trade Contractors
59,000 Matrix Service Co. * 650,180 1.00%Electrical Work
15,400 EMCOR Group Inc. 1,408,484 2.17%Electromedical & Electrotherapeutic Apparatus
8,800 Masimo Corporation * 2,361,744 3.64%Fire, Marine & Casualty Insurance
6,450 American Financial Group Inc. 565,149 0.87%General Industrial Machinery & Equipment
45,300 Rexnord Corporation * 1,788,897 2.75%Industrial Instruments For Measurement, Display, and Control
13,300 MKS Instruments, Inc. 2,000,985 3.08%Industrial Organic Chemicals
13,300 Sensient Technologies Corporation 981,141 4,350 Westlake Chemical Corp. 354,960
1,336,101 2.06%Instruments For Measurement & Testing of Electricity & Electric Signals
21,300 Teradyne, Inc. 2,553,657 3.93%Laboratory Analytical Instruments
14,000 PerkinElmer Inc. 2,009,000 3.09% Measuring & Controlling Devices, NEC
14,000 Onto Innovation Inc. * 665,700 1.02%Millwood, Veneer, Plywood, & Structural Wood Members
8,000 American Woodmark Corporation * 750,800 1.16%Mining & Quarrying of Nonmetallic Minerals (No Fuels)
49,600 Summit Materials, Inc. - Class A * 995,968 1.53% Miscellaneous Manufacturing Industries
35,200 Hillenbrand, Inc. 1,400,960 2.16%Optical Instruments & Lenses
16,800 II-VI Incorporated * 1,276,128 1.96%Plastics Products
8,400 Entegris, Inc. 807,240 1.24%Printed Circuit Boards
22,100 Jabil Circuit, Inc. 939,913 42,800 TTM Technologies, Inc. * 590,426
1,530,339 2.35%Retail - Catalog & Mail-Order Houses
7,800 Insight Enterprises, Inc. * 593,502 0.91%Retail - Department Stores
30,000 Macy's, Inc. 337,500 0.52%Retail - Eating & Drinking Places
6,700 Cannae Holdings, Inc. * 296,609 0.46%Retail - Family Clothing Stores
49,600 American Eagle Outfitters, Inc. 995,472 1.53%Retail - Lumber & Other Building Materials Dealers
33,600 BMC Stock Holdings, Inc. * 1,803,648 2.78%
Paradigm Select Fund
December 31, 2020 Schedule of Investments
* Non-Income Producing Securities.
The accompanying notes are an integral part of these financial statements.
2020 Annual Report 14
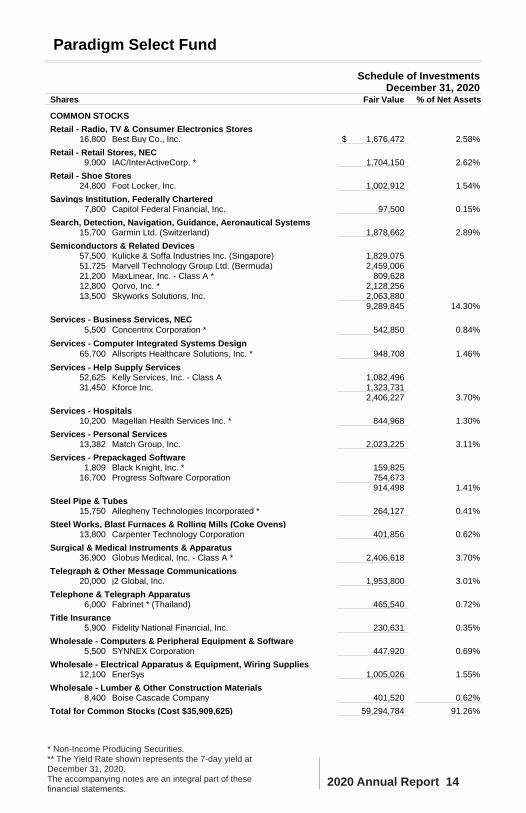
Shares Fair Value % of Net Assets
COMMON STOCKSRetail - Radio, TV & Consumer Electronics Stores
16,800 Best Buy Co., Inc. 1,676,472$ 2.58%Retail - Retail Stores, NEC
9,000 IAC/InterActiveCorp. * 1,704,150 2.62%Retail - Shoe Stores
24,800 Foot Locker, Inc. 1,002,912 1.54%Savings Institution, Federally Chartered
7,800 Capitol Federal Financial, Inc. 97,500 0.15%Search, Detection, Navigation, Guidance, Aeronautical Systems
15,700 Garmin Ltd. (Switzerland) 1,878,662 2.89%Semiconductors & Related Devices
57,500 Kulicke & Soffa Industries Inc. (Singapore) 1,829,075 51,725 Marvell Technology Group Ltd. (Bermuda) 2,459,006 21,200 MaxLinear, Inc. - Class A * 809,628 12,800 Qorvo, Inc. * 2,128,256 13,500 Skyworks Solutions, Inc. 2,063,880
9,289,845 14.30%Services - Business Services, NEC
5,500 Concentrix Corporation * 542,850 0.84%Services - Computer Integrated Systems Design
65,700 Allscripts Healthcare Solutions, Inc. * 948,708 1.46%Services - Help Supply Services
52,625 Kelly Services, Inc. - Class A 1,082,496 31,450 Kforce Inc. 1,323,731
2,406,227 3.70%Services - Hospitals
10,200 Magellan Health Services Inc. * 844,968 1.30%Services - Personal Services
13,382 Match Group, Inc. 2,023,225 3.11%Services - Prepackaged Software
1,809 Black Knight, Inc. * 159,825 16,700 Progress Software Corporation 754,673
914,498 1.41%Steel Pipe & Tubes
15,750 Allegheny Technologies Incorporated * 264,127 0.41%Steel Works, Blast Furnaces & Rolling Mills (Coke Ovens)
13,800 Carpenter Technology Corporation 401,856 0.62%Surgical & Medical Instruments & Apparatus
36,900 Globus Medical, Inc. - Class A * 2,406,618 3.70%Telegraph & Other Message Communications
20,000 j2 Global, Inc. 1,953,800 3.01%Telephone & Telegraph Apparatus
6,000 Fabrinet * (Thailand) 465,540 0.72%Title Insurance
5,900 Fidelity National Financial, Inc. 230,631 0.35%Wholesale - Computers & Peripheral Equipment & Software
5,500 SYNNEX Corporation 447,920 0.69%Wholesale - Electrical Apparatus & Equipment, Wiring Supplies
12,100 EnerSys 1,005,026 1.55%Wholesale - Lumber & Other Construction Materials
8,400 Boise Cascade Company 401,520 0.62%Total for Common Stocks (Cost $35,909,625) 59,294,784 91.26%
Paradigm Select Fund
December 31, 2020 Schedule of Investments
* Non-Income Producing Securities.** The Yield Rate shown represents the 7-day yield at December 31, 2020.The accompanying notes are an integral part of these financial statements.
* Non-Income Producing Securities.** The Yield Rate shown represents the 7-day yield at December 31, 2020.The accompanying notes are an integral part of these financial statements.
2020 Annual Report 15
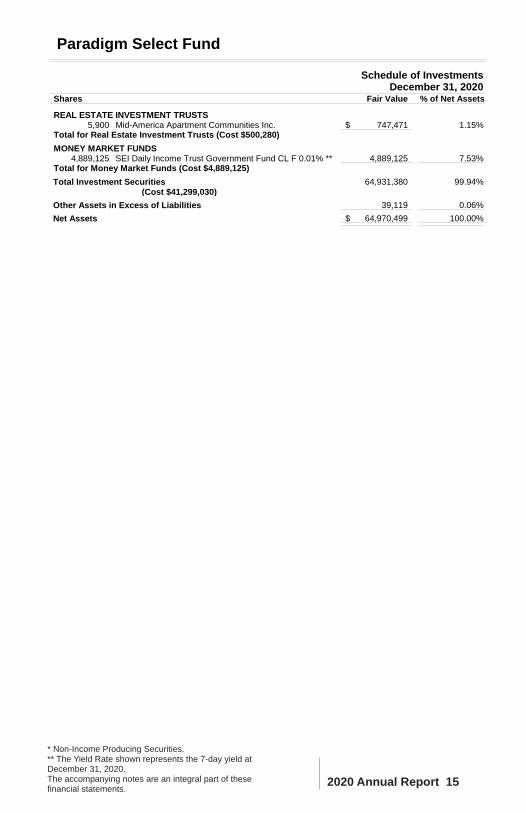
Shares Fair Value % of Net Assets
REAL ESTATE INVESTMENT TRUSTS5,900 Mid-America Apartment Communities Inc. 747,471$ 1.15%
MONEY MARKET FUNDS4,889,125 SEI Daily Income Trust Government Fund CL F 0.01% ** 4,889,125 7.53%
Total Investment Securities 64,931,380 99.94% (Cost $41,299,030)
Other Assets in Excess of Liabilities 39,119 0.06% Net Assets 64,970,499$ 100.00%
Paradigm Select Fund
Total for Real Estate Investment Trusts (Cost $500,280)
Total for Money Market Funds (Cost $4,889,125)
December 31, 2020 Schedule of Investments
2020 Annual Report 16
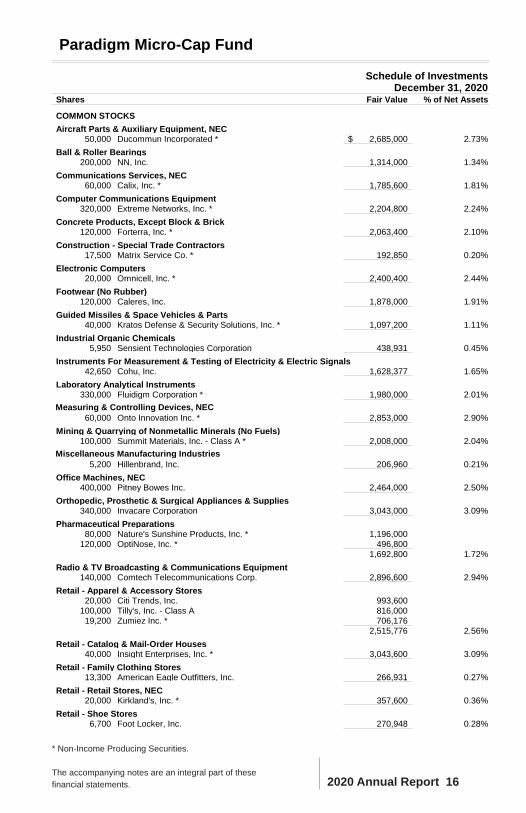
Shares Fair Value % of Net Assets
COMMON STOCKS Aircraft Parts & Auxiliary Equipment, NEC
50,000 Ducommun Incorporated * 2,685,000$ 2.73%Ball & Roller Bearings
200,000 NN, Inc. 1,314,000 1.34%Communications Services, NEC
60,000 Calix, Inc. * 1,785,600 1.81%Computer Communications Equipment
320,000 Extreme Networks, Inc. * 2,204,800 2.24%Concrete Products, Except Block & Brick
120,000 Forterra, Inc. * 2,063,400 2.10%Construction - Special Trade Contractors
17,500 Matrix Service Co. * 192,850 0.20%Electronic Computers
20,000 Omnicell, Inc. * 2,400,400 2.44%Footwear (No Rubber)
120,000 Caleres, Inc. 1,878,000 1.91%Guided Missiles & Space Vehicles & Parts
40,000 Kratos Defense & Security Solutions, Inc. * 1,097,200 1.11%Industrial Organic Chemicals
5,950 Sensient Technologies Corporation 438,931 0.45%Instruments For Measurement & Testing of Electricity & Electric Signals
42,650 Cohu, Inc. 1,628,377 1.65%Laboratory Analytical Instruments
330,000 Fluidigm Corporation * 1,980,000 2.01% Measuring & Controlling Devices, NEC
60,000 Onto Innovation Inc. * 2,853,000 2.90%Mining & Quarrying of Nonmetallic Minerals (No Fuels)
100,000 Summit Materials, Inc. - Class A * 2,008,000 2.04% Miscellaneous Manufacturing Industries
5,200 Hillenbrand, Inc. 206,960 0.21%Office Machines, NEC
400,000 Pitney Bowes Inc. 2,464,000 2.50%Orthopedic, Prosthetic & Surgical Appliances & Supplies
340,000 Invacare Corporation 3,043,000 3.09%Pharmaceutical Preparations
80,000 Nature's Sunshine Products, Inc. * 1,196,000 120,000 OptiNose, Inc. * 496,800
1,692,800 1.72%Radio & TV Broadcasting & Communications Equipment
140,000 Comtech Telecommunications Corp. 2,896,600 2.94%Retail - Apparel & Accessory Stores
20,000 Citi Trends, Inc. 993,600 100,000 Tilly's, Inc. - Class A 816,000 19,200 Zumiez Inc. * 706,176
2,515,776 2.56%Retail - Catalog & Mail-Order Houses
40,000 Insight Enterprises, Inc. * 3,043,600 3.09%Retail - Family Clothing Stores
13,300 American Eagle Outfitters, Inc. 266,931 0.27%Retail - Retail Stores, NEC
20,000 Kirkland's, Inc. * 357,600 0.36%Retail - Shoe Stores
6,700 Foot Locker, Inc. 270,948 0.28%
Paradigm Micro-Cap Fund
December 31, 2020 Schedule of Investments
* Non-Income Producing Securities.
The accompanying notes are an integral part of these financial statements.
2020 Annual Report 17
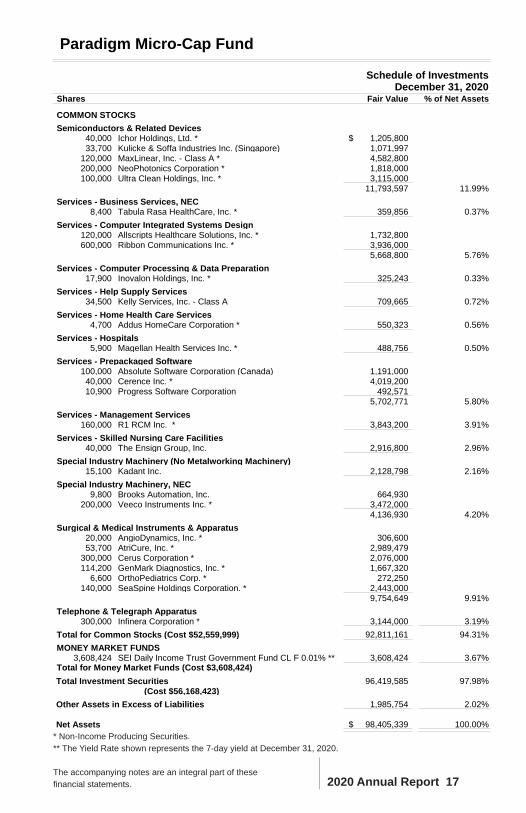
Shares Fair Value % of Net Assets
COMMON STOCKS Semiconductors & Related Devices
40,000 Ichor Holdings, Ltd. * 1,205,800$ 33,700 Kulicke & Soffa Industries Inc. (Singapore) 1,071,997
120,000 MaxLinear, Inc. - Class A * 4,582,800 200,000 NeoPhotonics Corporation * 1,818,000 100,000 Ultra Clean Holdings, Inc. * 3,115,000
11,793,597 11.99%Services - Business Services, NEC
8,400 Tabula Rasa HealthCare, Inc. * 359,856 0.37%Services - Computer Integrated Systems Design
120,000 Allscripts Healthcare Solutions, Inc. * 1,732,800 600,000 Ribbon Communications Inc. * 3,936,000
5,668,800 5.76%Services - Computer Processing & Data Preparation
17,900 Inovalon Holdings, Inc. * 325,243 0.33%Services - Help Supply Services
34,500 Kelly Services, Inc. - Class A 709,665 0.72%Services - Home Health Care Services
4,700 Addus HomeCare Corporation * 550,323 0.56%Services - Hospitals
5,900 Magellan Health Services Inc. * 488,756 0.50%Services - Prepackaged Software
100,000 Absolute Software Corporation (Canada) 1,191,000 40,000 Cerence Inc. * 4,019,200 10,900 Progress Software Corporation 492,571
5,702,771 5.80%Services - Management Services
160,000 R1 RCM Inc. * 3,843,200 3.91%Services - Skilled Nursing Care Facilities
40,000 The Ensign Group, Inc. 2,916,800 2.96%Special Industry Machinery (No Metalworking Machinery)
15,100 Kadant Inc. 2,128,798 2.16%Special Industry Machinery, NEC
9,800 Brooks Automation, Inc. 664,930 200,000 Veeco Instruments Inc. * 3,472,000
4,136,930 4.20%Surgical & Medical Instruments & Apparatus
20,000 AngioDynamics, Inc. * 306,600 53,700 AtriCure, Inc. * 2,989,479
300,000 Cerus Corporation * 2,076,000 114,200 GenMark Diagnostics, Inc. * 1,667,320
6,600 OrthoPediatrics Corp. * 272,250 140,000 SeaSpine Holdings Corporation. * 2,443,000
9,754,649 9.91%Telephone & Telegraph Apparatus
300,000 Infinera Corporation * 3,144,000 3.19%Total for Common Stocks (Cost $52,559,999) 92,811,161 94.31%MONEY MARKET FUNDS
3,608,424 SEI Daily Income Trust Government Fund CL F 0.01% ** 3,608,424 3.67%
Total Investment Securities 96,419,585 97.98% (Cost $56,168,423)
Other Assets in Excess of Liabilities 1,985,754 2.02%
Net Assets 98,405,339$ 100.00%
Paradigm Micro-Cap Fund
Total for Money Market Funds (Cost $3,608,424)
December 31, 2020 Schedule of Investments
* Non-Income Producing Securities.** The Yield Rate shown represents the 7-day yield at December 31, 2020.
The accompanying notes are an integral part of these financial statements.
Paradigm Funds
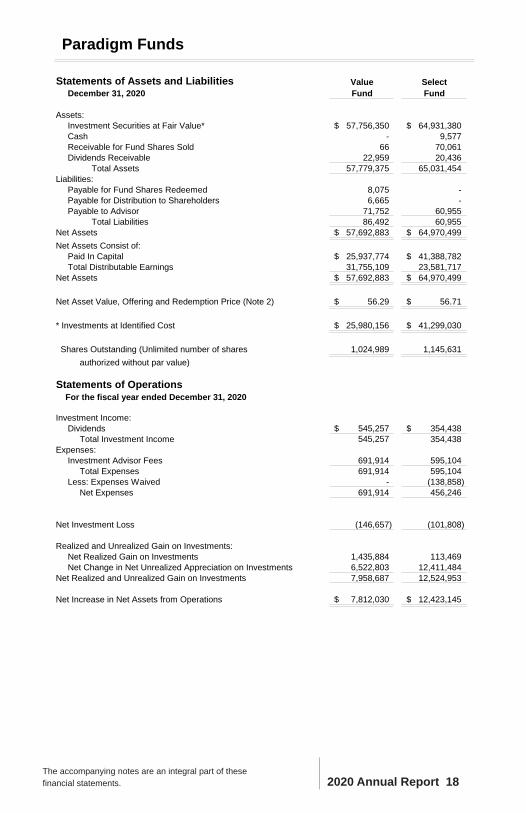
Statements of Assets and Liabilities Value Select December 31, 2020 Fund Fund
Assets: Investment Securities at Fair Value* 57,756,350$ 64,931,380$ Cash - 9,577 Receivable for Fund Shares Sold 66 70,061 Dividends Receivable 22,959 20,436 Total Assets 57,779,375 65,031,454 Liabilities: Payable for Fund Shares Redeemed 8,075 - Payable for Distribution to Shareholders 6,665 - Payable to Advisor 71,752 60,955 Total Liabilities 86,492 60,955Net Assets 57,692,883$ 64,970,499$ Net Assets Consist of: Paid In Capital 25,937,774$ 41,388,782$ Total Distributable Earnings 31,755,109 23,581,717 Net Assets 57,692,883$ 64,970,499$
Net Asset Value, Offering and Redemption Price (Note 2) 56.29$ 56.71$
* Investments at Identified Cost 25,980,156$ 41,299,030$
Shares Outstanding (Unlimited number of shares 1,024,989 1,145,631 authorized without par value)
Statements of Operations For the fiscal year ended December 31, 2020
Investment Income: Dividends 545,257$ 354,438$ Total Investment Income 545,257 354,438 Expenses: Investment Advisor Fees 691,914 595,104 Total Expenses 691,914 595,104 Less: Expenses Waived - (138,858) Net Expenses 691,914 456,246
Net Investment Loss (146,657) (101,808)
Realized and Unrealized Gain on Investments: Net Realized Gain on Investments 1,435,884 113,469 Net Change in Net Unrealized Appreciation on Investments 6,522,803 12,411,484 Net Realized and Unrealized Gain on Investments 7,958,687 12,524,953
Net Increase in Net Assets from Operations 7,812,030$ 12,423,145$
2020 Annual Report 18The accompanying notes are an integral part of these financial statements.
Paradigm Funds
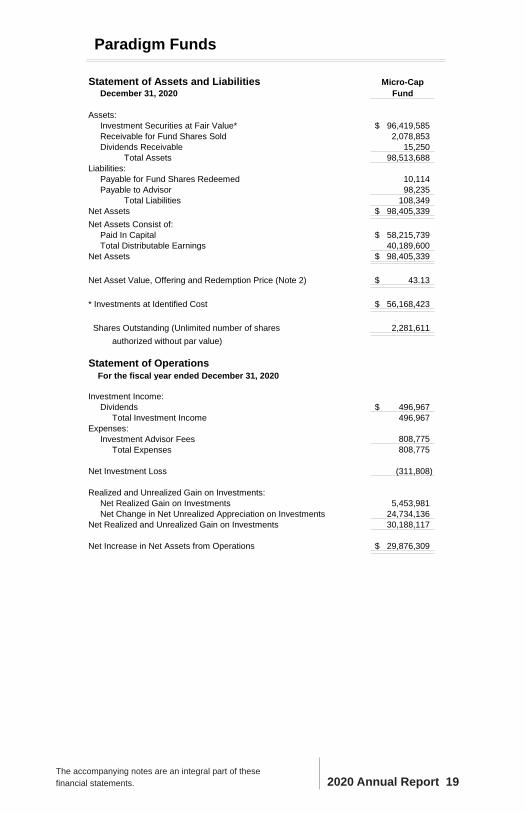
Statement of Assets and Liabilities Micro-Cap December 31, 2020 Fund
Assets: Investment Securities at Fair Value* 96,419,585$ Receivable for Fund Shares Sold 2,078,853 Dividends Receivable 15,250 Total Assets 98,513,688 Liabilities: Payable for Fund Shares Redeemed 10,114 Payable to Advisor 98,235 Total Liabilities 108,349Net Assets 98,405,339$ Net Assets Consist of: Paid In Capital 58,215,739$ Total Distributable Earnings 40,189,600 Net Assets 98,405,339$
Net Asset Value, Offering and Redemption Price (Note 2) 43.13$
* Investments at Identified Cost 56,168,423$
Shares Outstanding (Unlimited number of shares 2,281,611 authorized without par value)
Statement of Operations For the fiscal year ended December 31, 2020
Investment Income: Dividends 496,967$ Total Investment Income 496,967 Expenses: Investment Advisor Fees 808,775 Total Expenses 808,775
Net Investment Loss (311,808)
Realized and Unrealized Gain on Investments: Net Realized Gain on Investments 5,453,981 Net Change in Net Unrealized Appreciation on Investments 24,734,136 Net Realized and Unrealized Gain on Investments 30,188,117
Net Increase in Net Assets from Operations 29,876,309$
2020 Annual Report 19The accompanying notes are an integral part of these financial statements.
2020 Annual Report 20
Paradigm Funds
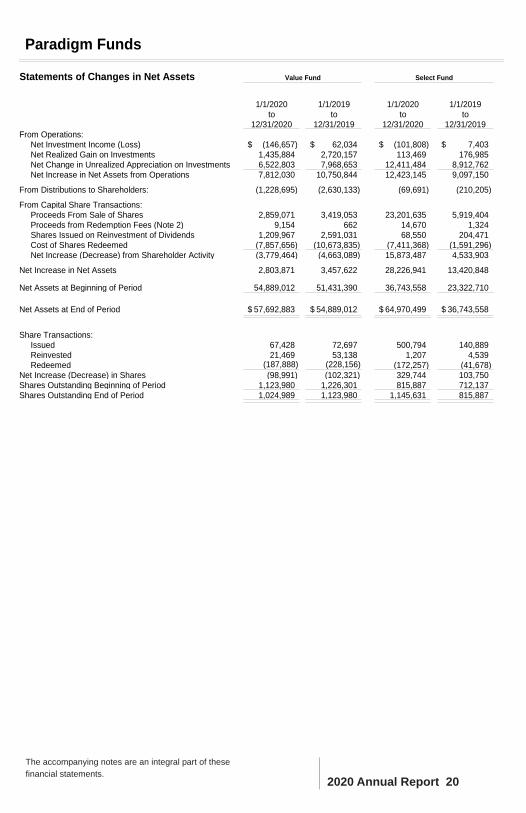
Statements of Changes in Net Assets
1/1/2020 1/1/2019 1/1/2020 1/1/2019to to to to
12/31/2020 12/31/2019 12/31/2020 12/31/2019From Operations: Net Investment Income (Loss) (146,657)$ 62,034$ (101,808)$ 7,403$ Net Realized Gain on Investments 1,435,884 2,720,157 113,469 176,985 Net Change in Unrealized Appreciation on Investments 6,522,803 7,968,653 12,411,484 8,912,762 Net Increase in Net Assets from Operations 7,812,030 10,750,844 12,423,145 9,097,150
From Distributions to Shareholders: (1,228,695) (2,630,133) (69,691) (210,205)
From Capital Share Transactions: Proceeds From Sale of Shares 2,859,071 3,419,053 23,201,635 5,919,404 Proceeds from Redemption Fees (Note 2) 9,154 662 14,670 1,324 Shares Issued on Reinvestment of Dividends 1,209,967 2,591,031 68,550 204,471 Cost of Shares Redeemed (7,857,656) (10,673,835) (7,411,368) (1,591,296) Net Increase (Decrease) from Shareholder Activity (3,779,464) (4,663,089) 15,873,487 4,533,903
Net Increase in Net Assets 2,803,871 3,457,622 28,226,941 13,420,848
Net Assets at Beginning of Period 54,889,012 51,431,390 36,743,558 23,322,710
Net Assets at End of Period 57,692,883$ 54,889,012$ 64,970,499$ 36,743,558$
Share Transactions: Issued 67,428 72,697 500,794 140,889 Reinvested 21,469 53,138 1,207 4,539 Redeemed (187,888) (228,156) (172,257) (41,678) Net Increase (Decrease) in Shares (98,991) (102,321) 329,744 103,750 Shares Outstanding Beginning of Period 1,123,980 1,226,301 815,887 712,137 Shares Outstanding End of Period 1,024,989 1,123,980 1,145,631 815,887
Value Fund Select Fund
The accompanying notes are an integral part of these financial statements.
Paradigm Funds
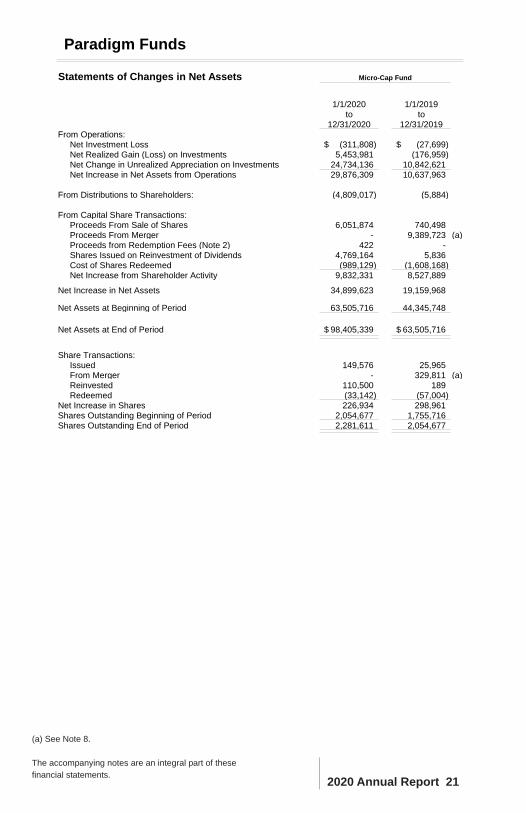
Statements of Changes in Net Assets
1/1/2020 1/1/2019to to
12/31/2020 12/31/2019From Operations: Net Investment Loss (311,808)$ (27,699)$ Net Realized Gain (Loss) on Investments 5,453,981 (176,959) Net Change in Unrealized Appreciation on Investments 24,734,136 10,842,621 Net Increase in Net Assets from Operations 29,876,309 10,637,963
From Distributions to Shareholders: (4,809,017) (5,884)
From Capital Share Transactions: Proceeds From Sale of Shares 6,051,874 740,498 Proceeds From Merger - 9,389,723 (a) Proceeds from Redemption Fees (Note 2) 422 - Shares Issued on Reinvestment of Dividends 4,769,164 5,836 Cost of Shares Redeemed (989,129) (1,608,168) Net Increase from Shareholder Activity 9,832,331 8,527,889
Net Increase in Net Assets 34,899,623 19,159,968
Net Assets at Beginning of Period 63,505,716 44,345,748
Net Assets at End of Period 98,405,339$ 63,505,716$
Share Transactions: Issued 149,576 25,965 From Merger - 329,811 (a) Reinvested 110,500 189 Redeemed (33,142) (57,004) Net Increase in Shares 226,934 298,961 Shares Outstanding Beginning of Period 2,054,677 1,755,716 Shares Outstanding End of Period 2,281,611 2,054,677
Micro-Cap Fund
2020 Annual Report 21
(a) See Note 8.
The accompanying notes are an integral part of these financial statements.
Paradigm Value Fund
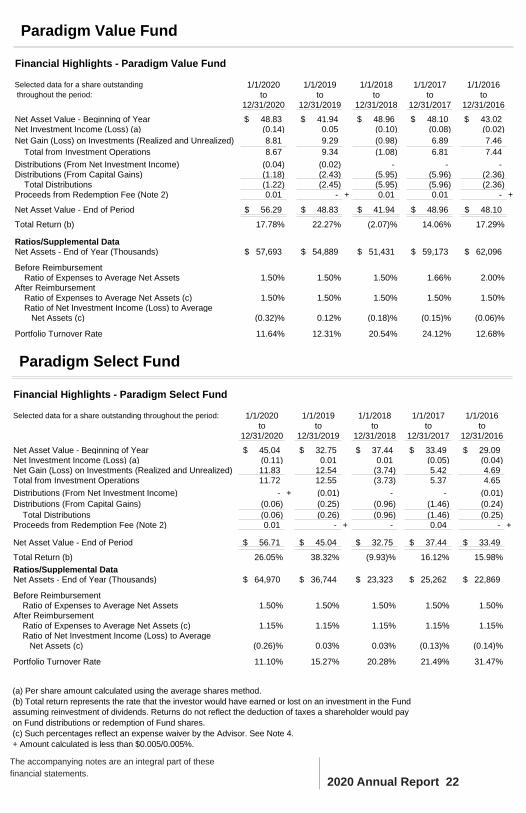
Financial Highlights - Paradigm Value Fund
Selected data for a share outstanding 1/1/2020 1/1/2019 1/1/2018 1/1/2017 1/1/2016 throughout the period: to to to to to
12/31/2020 12/31/2019 12/31/2018 12/31/2017 12/31/2016
Net Asset Value - Beginning of Year 48.83$ 41.94$ 48.96$ 48.10$ 43.02$ Net Investment Income (Loss) (a) (0.14) 0.05 (0.10) (0.08) (0.02) Net Gain (Loss) on Investments (Realized and Unrealized) 8.81 9.29 (0.98) 6.89 7.46 Total from Investment Operations 8.67 9.34 (1.08) 6.81 7.44Distributions (From Net Investment Income) (0.04) (0.02) - - - Distributions (From Capital Gains) (1.18) (2.43) (5.95) (5.96) (2.36) Total Distributions (1.22) (2.45) (5.95) (5.96) (2.36) Proceeds from Redemption Fee (Note 2) 0.01 - + 0.01 0.01 - +
Net Asset Value - End of Period 56.29$ 48.83$ 41.94$ 48.96$ 48.10$
Total Return (b) 17.78% 22.27% (2.07)% 14.06% 17.29%
Ratios/Supplemental DataNet Assets - End of Year (Thousands) 57,693$ 54,889$ 51,431$ 59,173$ 62,096$
Before Reimbursement Ratio of Expenses to Average Net Assets 1.50% 1.50% 1.50% 1.66% 2.00%After Reimbursement Ratio of Expenses to Average Net Assets (c) 1.50% 1.50% 1.50% 1.50% 1.50% Ratio of Net Investment Income (Loss) to Average Net Assets (c) (0.32)% 0.12% (0.18)% (0.15)% (0.06)%
Portfolio Turnover Rate 11.64% 12.31% 20.54% 24.12% 12.68%
2020 Annual Report 22
The accompanying notes are an integral part of these financial statements.
Paradigm Select Fund
Financial Highlights - Paradigm Select Fund
Selected data for a share outstanding throughout the period: 1/1/2020 1/1/2019 1/1/2018 1/1/2017 1/1/2016to to to to to
12/31/2020 12/31/2019 12/31/2018 12/31/2017 12/31/2016
Net Asset Value - Beginning of Year 45.04$ 32.75$ 37.44$ 33.49$ 29.09$ Net Investment Income (Loss) (a) (0.11) 0.01 0.01 (0.05) (0.04) Net Gain (Loss) on Investments (Realized and Unrealized) 11.83 12.54 (3.74) 5.42 4.69Total from Investment Operations 11.72 12.55 (3.73) 5.37 4.65Distributions (From Net Investment Income) - + (0.01) - - (0.01) Distributions (From Capital Gains) (0.06) (0.25) (0.96) (1.46) (0.24) Total Distributions (0.06) (0.26) (0.96) (1.46) (0.25) Proceeds from Redemption Fee (Note 2) 0.01 - + - 0.04 - +
Net Asset Value - End of Period 56.71$ 45.04$ 32.75$ 37.44$ 33.49$
Total Return (b) 26.05% 38.32% (9.93)% 16.12% 15.98%Ratios/Supplemental DataNet Assets - End of Year (Thousands) 64,970$ 36,744$ 23,323$ 25,262$ 22,869$
Before Reimbursement Ratio of Expenses to Average Net Assets 1.50% 1.50% 1.50% 1.50% 1.50%After Reimbursement Ratio of Expenses to Average Net Assets (c) 1.15% 1.15% 1.15% 1.15% 1.15% Ratio of Net Investment Income (Loss) to Average Net Assets (c) (0.26)% 0.03% 0.03% (0.13)% (0.14)%
Portfolio Turnover Rate 11.10% 15.27% 20.28% 21.49% 31.47%
(a) Per share amount calculated using the average shares method.(b) Total return represents the rate that the investor would have earned or lost on an investment in the Fund assuming reinvestment of dividends. Returns do not reflect the deduction of taxes a shareholder would pay on Fund distributions or redemption of Fund shares. (c) Such percentages reflect an expense waiver by the Advisor. See Note 4.+ Amount calculated is less than $0.005/0.005%.
Paradigm Micro-Cap Fund
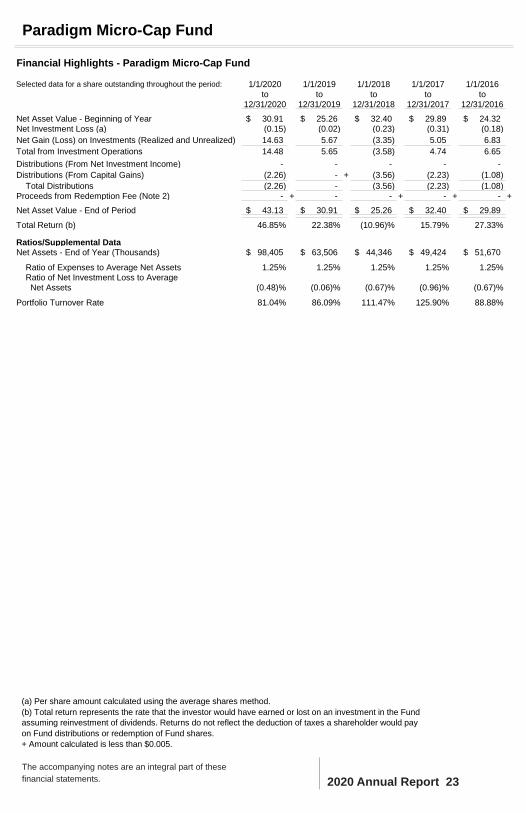
Financial Highlights - Paradigm Micro-Cap Fund
Selected data for a share outstanding throughout the period: 1/1/2020 1/1/2019 1/1/2018 1/1/2017 1/1/2016to to to to to
12/31/2020 12/31/2019 12/31/2018 12/31/2017 12/31/2016
Net Asset Value - Beginning of Year 30.91$ 25.26$ 32.40$ 29.89$ 24.32$ Net Investment Loss (a) (0.15) (0.02) (0.23) (0.31) (0.18)Net Gain (Loss) on Investments (Realized and Unrealized) 14.63 5.67 (3.35) 5.05 6.83Total from Investment Operations 14.48 5.65 (3.58) 4.74 6.65Distributions (From Net Investment Income) - - - - - Distributions (From Capital Gains) (2.26) - + (3.56) (2.23) (1.08) Total Distributions (2.26) - (3.56) (2.23) (1.08) Proceeds from Redemption Fee (Note 2) - + - - + - + - +Net Asset Value - End of Period 43.13$ 30.91$ 25.26$ 32.40$ 29.89$
Total Return (b) 46.85% 22.38% (10.96)% 15.79% 27.33%
Ratios/Supplemental DataNet Assets - End of Year (Thousands) 98,405$ 63,506$ 44,346$ 49,424$ 51,670$
Ratio of Expenses to Average Net Assets 1.25% 1.25% 1.25% 1.25% 1.25% Ratio of Net Investment Loss to Average Net Assets (0.48)% (0.06)% (0.67)% (0.96)% (0.67)%
Portfolio Turnover Rate 81.04% 86.09% 111.47% 125.90% 88.88%
2020 Annual Report 23The accompanying notes are an integral part of these financial statements.
(a) Per share amount calculated using the average shares method.(b) Total return represents the rate that the investor would have earned or lost on an investment in the Fund assuming reinvestment of dividends. Returns do not reflect the deduction of taxes a shareholder would pay on Fund distributions or redemption of Fund shares. + Amount calculated is less than $0.005.
NOTES TO FINANCIAL STATEMENTSPARADIGM FUNDS
December 31, 2020
1.) ORGANIZATIONParadigm Funds (the “Trust”) is an open-end management investment company that was organized in Ohioas a business trust on September 13, 2002 that offers shares of beneficial interest in a number of separateseries, each series representing a distinct fund with its own investment objectives and policies. TheParadigm Value Fund (“Value”) commenced operations on January 1, 2003. Value’s investment objective islong-term capital appreciation. The Paradigm Select Fund (“Select”) commenced operations on January 1,2005. Select’s investment objective is long-term capital appreciation. The Paradigm Micro-Cap Fund(“Micro-Cap”) commenced operations on January 1, 2008. Micro-Cap’s investment objective is long-termcapital appreciation. Under normal circumstances, Micro-Cap invests at least 80% of its net assets in thecommon stocks of U.S. micro-cap companies. Value, Select and Micro-Cap are all diversified funds. Theadvisor to Value, Select and Micro-Cap (each a “Fund” and collectively the “Funds”) is Paradigm FundsAdvisor LLC (the “Advisor”).
2.) SIGNIFICANT ACCOUNTING POLICIESThe Funds are investment companies and accordingly follow the investment company accounting andreporting guidance of the Financial Accounting Standards Board (“FASB”) Accounting Standards CodificationTopic 946 Financial Services - Investment Companies. The financial statements are prepared in conformitywith accounting principles generally accepted in the United States of America (“GAAP”). The Funds followthe significant accounting policies described in this section.
SECURITY VALUATION: All investments in securities are recorded at their estimated fair value, asdescribed in Note 3.
SECURITY TRANSACTIONS AND OTHER: Security transactions are recorded based on the trade date forfinancial statement reporting purposes. Dividend income is recognized on the ex-dividend date. Interestincome, if any, is recognized on an accrual basis. The Funds use the highest cost basis which is a form ofspecific identification in computing gain or loss on sale of investment securities. Withholding taxes on foreigndividends have been provided for in accordance with the Funds’ understanding of the applicable country’stax rules and rates. The Funds may invest in real estate investment trusts (“REITs”) that pay distributions totheir shareholders based on available funds from operations. It is common for these distributions to exceedthe REITs’ taxable earnings and profits resulting in the excess portion of such distribution to be designatedas return of capital. Distributions received from REITs are generally recorded as dividend income and, if nec-essary, are reclassified annually in accordance with tax information provided by the underlying REITs.
SHARE VALUATION: Each Fund’s net asset value (the “NAV”) is calculated as of the close of trading on theNew York Stock Exchange (the “Exchange”) (normally 4:00 p.m. Eastern time) every day the Exchange isopen. The NAV for each Fund is calculated by taking the total value of the Fund’s assets, subtracting its lia-bilities, and then dividing by the total number of shares outstanding, rounded to the nearest cent. The offer-ing price and redemption price per share is equal to the net asset value per share, except that shares ofeach Fund are subject to a redemption fee of 2% if redeemed within 90 days or less of purchase. During thefiscal year ended December 31, 2020 proceeds from redemption fees were $9,154, $14,670 and $422 forValue, Select and Micro-Cap, respectively.
INCOME TAXES: The Funds’ policy is to comply with the requirements of the Internal Revenue Code thatare applicable to regulated investment companies and to distribute all of their taxable income to sharehold-ers. Therefore, no federal income tax provision is required. It is the Funds’ policy to distribute annually, priorto the end of the calendar year, dividends sufficient to satisfy excise tax requirements of the InternalRevenue Code. This Internal Revenue Code requirement may cause an excess of distributions over thebook year-end accumulated income. In addition, it is the Funds’ policy to distribute annually, after the end ofthe fiscal year, any remaining net investment income and net realized capital gains.
The Funds recognize the tax benefits of certain tax positions only where the position is “more likely than not”to be sustained assuming examination by tax authorities. Management has analyzed the Funds’ tax posi-tions, and has concluded that no liability for unrecognized tax benefits should be recorded related to uncer-tain tax positions taken on returns filed for open tax years. The Funds identify their major tax jurisdictions asU.S. federal and New York State tax authorities; the Funds are not aware of any tax positions for which it is
2020 Annual Report 24
reasonably possible that the total amounts of unrecognized tax benefits will change materially in the nexttwelve months. The Funds recognize interest and penalties, if any, related to unrecognized tax benefits asincome tax expense in the Statements of Operations. During the fiscal year ended December 31, 2020, theFunds did not incur any interest or penalties.
ESTIMATES: The financial statements are prepared in accordance with GAAP, which requires managementto make estimates and assumptions that affect the reported amounts of assets and liabilities and disclosureof contingent assets and liabilities at the date of the financial statements and the reported amounts ofincreases and decreases in net assets from operations during the reporting period. Actual results could differfrom those estimates.
DISTRIBUTIONS TO SHAREHOLDERS: Distributions to shareholders, which are determined in accordancewith income tax regulations, are recorded on the ex-dividend date. The Funds may utilize earnings and prof-its distributed to shareholders on redemptions of shares as part of the dividends paid deduction. The treat-ment for financial reporting purposes of distributions made to shareholders during the year from net invest-ment income or net realized capital gains may differ from their ultimate treatment for federal income tax pur-poses. These differences are caused primarily by differences in the timing of recognition of certain compo-nents of income, expense or realized capital gain for federal income tax purposes. Where such differencesare permanent in nature, they are reclassified in the components of the net assets based on their ultimatecharacterization for federal income tax purposes. Any such reclassification will have no effect on net assets,results of operations or net asset values per share of any Fund. These adjustments were primarily attributedto the reclassification of net operating loss and the use of equalization for tax purposes.
ValuePaid In Capital $85,065Total Distributable Earnings ($85,065)
SelectPaid In Capital ($52,339)Total Distributable Earnings $52,339
3.) SECURITIES VALUATIONSThe Funds utilize various methods to measure the fair value of their investments on a recurring basis. GAAPestablishes a hierarchy that prioritizes inputs to valuation methods. The three levels of inputs are:
Level 1 - Unadjusted quoted prices in active markets for identical assets or liabilities.
Level 2 - Observable inputs other than quoted prices included in level 1 that are observable for the asset orliability, either directly or indirectly. These inputs may include quoted prices for the identical instrument on aninactive market, prices for similar instruments, interest rates, prepayment speeds, credit risk, yield curves,default rates and similar data.
Level 3 - Unobservable inputs for the asset or liability, to the extent relevant observable inputs are not avail-able, representing the Funds’ best information about the assumptions a market participant would use in valu-ing the assets or liabilities.
The availability of inputs can vary from security to security and is affected by a wide variety of factors, includ-ing, for example, the type of security, whether the security is new and not yet established in the marketplace,the liquidity of markets, and other characteristics particular to the security. To the extent that valuation isbased on models or inputs that are less observable or unobservable in the market, the determination of fairvalue requires more judgment. Accordingly, the degree of judgment exercised in determining fair value isgreatest for instruments categorized in level 3.
The inputs used to measure fair value may fall into different levels of the fair value hierarchy. In such cases,for disclosure purposes, the level in the fair value hierarchy within which the fair value measurement falls inits entirety, is determined based on the lowest level input that is significant to the fair value measurement inits entirety.
FAIR VALUE MEASUREMENTSA description of the valuation techniques applied to the Funds’ major categories of assets measured at fairvalue on a recurring basis follows.
Notes to Financial Statements - continued
2020 Annual Report 25
2020 Annual Report 26
Equity securities (common stocks and real estate investment trusts) Equity securities that are traded on anyexchange or on the NASDAQ over-the-counter market are valued at the last quoted sale price. Lacking alast sale price, a long security is valued at its last bid price except when, in the Advisor’s opinion, the last bidprice does not accurately reflect the fair value of the long security. To the extent these securities are activelytraded and valuation adjustments are not applied, they are classified in level 1 of the fair value hierarchy,and if an equity security is valued by the pricing service at its last bid, it is generally categorized in level 2 ofthe fair value hierarchy. When market quotations are not readily available, when the Advisor determines thelast bid price does not accurately reflect the fair value or when restricted securities are being valued, suchsecurities are valued as determined in good faith by the Advisor, in conformity with guidelines adopted byand subject to review of the Trust’s Board of Trustees (the “Trustees” or the “Board”) and are categorized inlevel 2 or level 3, when appropriate.
Money market funds. Money market funds are valued at net asset value provided by the underlying fundsand are classified in level 1 of the fair value hierarchy.
In accordance with the Trust’s good faith pricing guidelines, the Advisor is required to consider all appropri-ate factors relevant to the value of securities for which it has determined other pricing sources are not avail-able or reliable as described above. There is no single standard for determining fair value, since fair valuedepends upon the circumstances of each individual case. As a general principle, the current fair value of anissue of securities being valued by the Advisor would appear to be the amount which the owner might rea-sonably expect to receive for them upon their current sale. Methods which are in accordance with this princi-ple may, for example, be based on (i) a multiple of earnings; (ii) a discount from market of a similar freelytraded security (including a derivative security or a basket of securities traded on other markets, exchangesor among dealers); or (iii) yield to maturity with respect to debt issues, or a combination of these and othermethods.
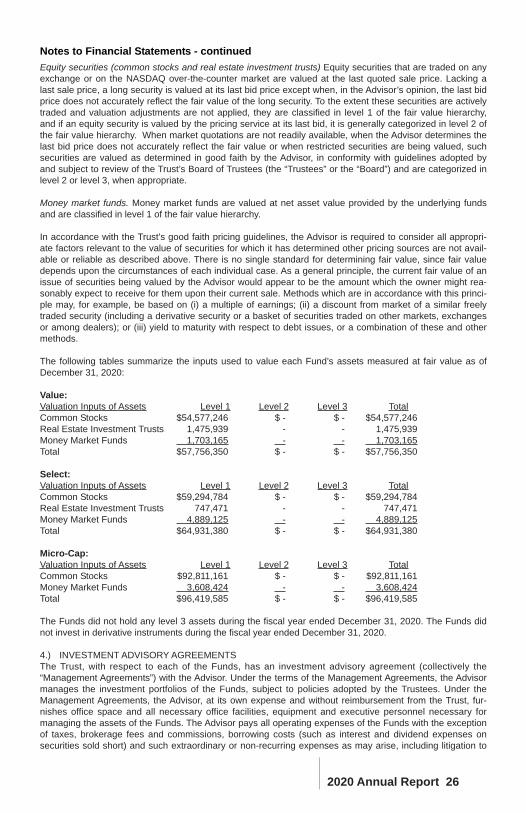
The following tables summarize the inputs used to value each Fund’s assets measured at fair value as ofDecember 31, 2020:
Value:Valuation Inputs of Assets Level 1 Level 2 Level 3 TotalCommon Stocks $54,577,246 $ - $ - $54,577,246Real Estate Investment Trusts 1,475,939 - - 1,475,939Money Market Funds 1,703,165 - - 1,703,165Total $57,756,350 $ - $ - $57,756,350
Select:Valuation Inputs of Assets Level 1 Level 2 Level 3 TotalCommon Stocks $59,294,784 $ - $ - $59,294,784Real Estate Investment Trusts 747,471 - - 747,471Money Market Funds 4,889,125 - - 4,889,125Total $64,931,380 $ - $ - $64,931,380
Micro-Cap:Valuation Inputs of Assets Level 1 Level 2 Level 3 TotalCommon Stocks $92,811,161 $ - $ - $92,811,161Money Market Funds 3,608,424 - - 3,608,424Total $96,419,585 $ - $ - $96,419,585
The Funds did not hold any level 3 assets during the fiscal year ended December 31, 2020. The Funds didnot invest in derivative instruments during the fiscal year ended December 31, 2020.
4.) INVESTMENT ADVISORY AGREEMENTSThe Trust, with respect to each of the Funds, has an investment advisory agreement (collectively the“Management Agreements”) with the Advisor. Under the terms of the Management Agreements, the Advisormanages the investment portfolios of the Funds, subject to policies adopted by the Trustees. Under theManagement Agreements, the Advisor, at its own expense and without reimbursement from the Trust, fur-nishes office space and all necessary office facilities, equipment and executive personnel necessary formanaging the assets of the Funds. The Advisor pays all operating expenses of the Funds with the exceptionof taxes, brokerage fees and commissions, borrowing costs (such as interest and dividend expenses onsecurities sold short) and such extraordinary or non-recurring expenses as may arise, including litigation to
Notes to Financial Statements - continued
which the Fund may be a party and indemnification of the Trustees and Trust officers with respect thereto.The Funds will also pay expenses that they are authorized to pay pursuant to Rule 12b-1 under theInvestment Company Act of 1940, as amended (none are currently authorized). The Advisor also pays thesalaries and fees of all of its officers and employees that serve as Trustees and Trust Officers. For its ser-vices and payment of certain Fund expenses as described below, the Advisor receives an annual investmentmanagement fee of 1.50%, 1.50% and 1.25% of the average daily net assets from Value, Select and Micro-Cap, respectively. The Advisor’s investment management fee is accrued daily and is typically paid monthly.As a result of the above calculations, for the fiscal year ended December 31, 2020, the Advisor earned man-agement fees (before the waivers described below) totaling $691,914, $595,104 and $808,775 for Value,Select and Micro-Cap, respectively. At December 31, 2020, $71,752, $60,955 and $98,235 was due to theAdvisor from Value, Select and Micro-Cap, respectively. The Advisor has contractually agreed to waive man-agement fees and/or reimburse Select to the extent necessary to maintain total annual operating expensesof the Fund (excluding brokerage fees and commissions, interest and other borrowing expenses, taxes,extraordinary expenses and indirect costs of investing in acquired funds) at 1.15% of daily net assetsthrough April 30, 2021. The Advisor waived $138,858 for the fiscal year ended December 31, 2020 forSelect, pursuant to its contractual agreement. There is no recapture provision to this waiver.
5.) RELATED PARTY TRANSACTIONSCertain officers and shareholders of the Advisor are also officers and/or a Trustee of the Trust. These indi-viduals may receive benefits from the Advisor resulting from management fees paid to the Advisor from theFunds.
The Trustees who are not interested persons of the Funds were each paid $8,000, for a total of $32,000, inTrustees fees for the fiscal year ended December 31, 2020 for the Trust. Under the ManagementAgreements, the Advisor pays these fees.
6.) INVESTMENTSFor the fiscal year ended December 31, 2020, purchases and sales of investment securities other than U.S.government obligations and short-term investments were as follows:
Value Select Micro-Cap Purchases $5,218,608 $17,936,933 $50,596,963 Sales $9,530,495 $4,121,730 $50,246,094
There were no purchases or sales of U.S. government obligations.
7.) CONTROL OWNERSHIPThe beneficial ownership, either directly or indirectly, of more than 25% of the voting shares of a fund cre-ates a presumption of control of the fund, under section 2(a)(9) of the Investment Company Act of 1940, asamended. At December 31, 2020, National Financial Services, LLC, located at 200 Liberty Street, NewYork, New York, for the benefit of its customers, held, in aggregate, 29.84% of Value, and therefore also maybe deemed to control Value. Candace King Weir, beneficial owner located at 9 Elk Street, Albany, New York12207, held, in aggregate, 51.08%, of Select, and therefore may be deemed to control Select. Candace KingWeir, beneficial owner located at 9 Elk Street, Albany, New York 12207, held, in aggregate, 83.60% of Micro-Cap, and therefore may be deemed to control Micro-Cap.
8.) MERGER OF PARADIGM OPPORTUNITY FUND WITH PARADIGM MICRO-CAP FUNDEffective as of the close of business December 4, 2019, pursuant to a Plan of Reorganization, Micro-Capreceived all the assets and liabilities (the “Reorganization”) of the Paradigm Opportunity Fund (the “TargetFund”). Shares of the Target Fund were exchanged for shares of Micro-Cap. 210,241 shares of the TargetFund, valued at $44.66 per share, were exchanged for 329,811 shares of Micro-Cap valued at $28.47 pershare. Each share of the Target Fund was exchanged for 1.569 shares of Micro-Cap. The Target Fund’s netassets on the date of the Reorganization of $9,389,723, including $4,017,053 of unrealized appreciation,were combined with those of Micro-Cap. The combined net assets immediately after the Reorganizationamounted to $58,672,090 with 2,060,617 shares outstanding. The Reorganization was treated as a tax-freetransaction for federal income tax purposes and, accordingly, the basis of the assets of Micro-Cap reflectedthe historical basis of the assets of the Target Fund as of the date of the Reorganization. After theReorganization was completed, Micro-Cap was the accounting survivor and obtained and held the entireportfolio holdings previously held by the Target Fund.
Notes to Financial Statements - continued
2020 Annual Report 27
2020 Annual Report 28
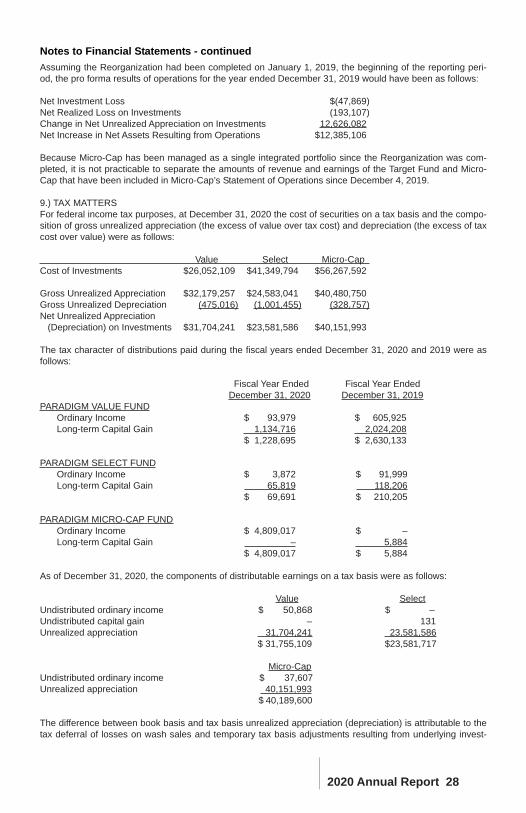
Assuming the Reorganization had been completed on January 1, 2019, the beginning of the reporting peri-od, the pro forma results of operations for the year ended December 31, 2019 would have been as follows:
Net Investment Loss $(47,869)Net Realized Loss on Investments (193,107)Change in Net Unrealized Appreciation on Investments 12,626,082Net Increase in Net Assets Resulting from Operations $12,385,106
Because Micro-Cap has been managed as a single integrated portfolio since the Reorganization was com-pleted, it is not practicable to separate the amounts of revenue and earnings of the Target Fund and Micro-Cap that have been included in Micro-Cap’s Statement of Operations since December 4, 2019.
9.) TAX MATTERSFor federal income tax purposes, at December 31, 2020 the cost of securities on a tax basis and the compo-sition of gross unrealized appreciation (the excess of value over tax cost) and depreciation (the excess of taxcost over value) were as follows:
Value Select Micro-Cap Cost of Investments $26,052,109 $41,349,794 $56,267,592
Gross Unrealized Appreciation $32,179,257 $24,583,041 $40,480,750Gross Unrealized Depreciation (475,016) (1,001,455) (328,757)Net Unrealized Appreciation
(Depreciation) on Investments $31,704,241 $23,581,586 $40,151,993
The tax character of distributions paid during the fiscal years ended December 31, 2020 and 2019 were asfollows:
Fiscal Year Ended Fiscal Year EndedDecember 31, 2020 December 31, 2019
PARADIGM VALUE FUNDOrdinary Income $ 93,979 $ 605,925Long-term Capital Gain 1,134,716 2,024,208
$ 1,228,695 $ 2,630,133
PARADIGM SELECT FUNDOrdinary Income $ 3,872 $ 91,999Long-term Capital Gain 65,819 118,206
$ 69,691 $ 210,205
PARADIGM MICRO-CAP FUNDOrdinary Income $ 4,809,017 $ –Long-term Capital Gain – 5,884
$ 4,809,017 $ 5,884
As of December 31, 2020, the components of distributable earnings on a tax basis were as follows:
Value SelectUndistributed ordinary income $ 50,868 $ –Undistributed capital gain – 131Unrealized appreciation 31,704,241 23,581,586
$ 31,755,109 $23,581,717
Micro-CapUndistributed ordinary income $ 37,607Unrealized appreciation 40,151,993
$ 40,189,600
The difference between book basis and tax basis unrealized appreciation (depreciation) is attributable to thetax deferral of losses on wash sales and temporary tax basis adjustments resulting from underlying invest-
Notes to Financial Statements - continued
2020 Annual Report 29
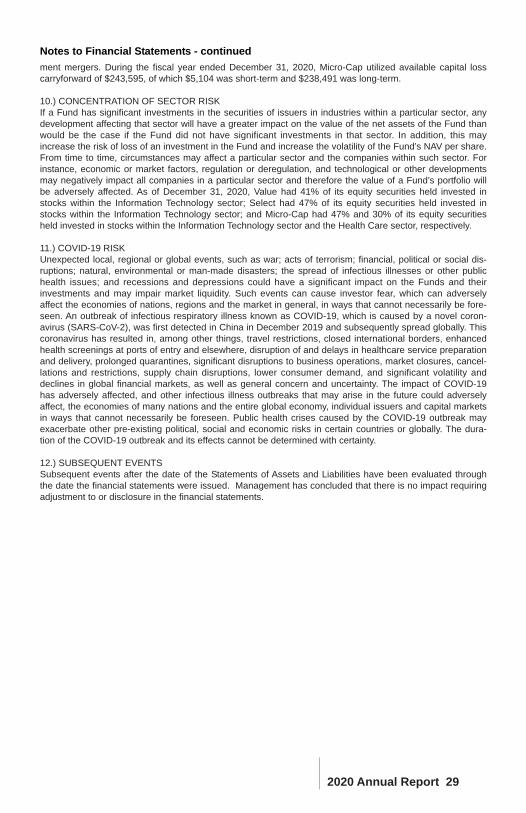
Notes to Financial Statements - continuedment mergers. During the fiscal year ended December 31, 2020, Micro-Cap utilized available capital losscarryforward of $243,595, of which $5,104 was short-term and $238,491 was long-term.
10.) CONCENTRATION OF SECTOR RISKIf a Fund has significant investments in the securities of issuers in industries within a particular sector, anydevelopment affecting that sector will have a greater impact on the value of the net assets of the Fund thanwould be the case if the Fund did not have significant investments in that sector. In addition, this mayincrease the risk of loss of an investment in the Fund and increase the volatility of the Fund’s NAV per share.From time to time, circumstances may affect a particular sector and the companies within such sector. Forinstance, economic or market factors, regulation or deregulation, and technological or other developmentsmay negatively impact all companies in a particular sector and therefore the value of a Fund’s portfolio willbe adversely affected. As of December 31, 2020, Value had 41% of its equity securities held invested instocks within the Information Technology sector; Select had 47% of its equity securities held invested instocks within the Information Technology sector; and Micro-Cap had 47% and 30% of its equity securitiesheld invested in stocks within the Information Technology sector and the Health Care sector, respectively.
11.) COVID-19 RISKUnexpected local, regional or global events, such as war; acts of terrorism; financial, political or social dis-ruptions; natural, environmental or man-made disasters; the spread of infectious illnesses or other publichealth issues; and recessions and depressions could have a significant impact on the Funds and theirinvestments and may impair market liquidity. Such events can cause investor fear, which can adverselyaffect the economies of nations, regions and the market in general, in ways that cannot necessarily be fore-seen. An outbreak of infectious respiratory illness known as COVID-19, which is caused by a novel coron-avirus (SARS-CoV-2), was first detected in China in December 2019 and subsequently spread globally. Thiscoronavirus has resulted in, among other things, travel restrictions, closed international borders, enhancedhealth screenings at ports of entry and elsewhere, disruption of and delays in healthcare service preparationand delivery, prolonged quarantines, significant disruptions to business operations, market closures, cancel-lations and restrictions, supply chain disruptions, lower consumer demand, and significant volatility anddeclines in global financial markets, as well as general concern and uncertainty. The impact of COVID-19has adversely affected, and other infectious illness outbreaks that may arise in the future could adverselyaffect, the economies of many nations and the entire global economy, individual issuers and capital marketsin ways that cannot necessarily be foreseen. Public health crises caused by the COVID-19 outbreak mayexacerbate other pre-existing political, social and economic risks in certain countries or globally. The dura-tion of the COVID-19 outbreak and its effects cannot be determined with certainty.
12.) SUBSEQUENT EVENTSSubsequent events after the date of the Statements of Assets and Liabilities have been evaluated throughthe date the financial statements were issued. Management has concluded that there is no impact requiringadjustment to or disclosure in the financial statements.
REPORT OF INDEPENDENT REGISTERED PUBLIC ACCOUNTING FIRM
To the Shareholders and Board Trustees ofParadigm Funds
Opinion on the Financial Statements
We have audited the accompanying statements of assets and liabilities, including theschedules of investments, of Paradigm Funds, comprising Paradigm Value Fund,Paradigm Select Fund, and Paradigm Micro-Cap Fund (the “Funds”) as of December31, 2020, the related statements of operations for the year then ended, the statementsof changes in net assets for each of the two years in the period then ended, the relatednotes, and the financial highlights for each of the five years in the period then ended(collectively referred to as the “financial statements”). In our opinion, the financial state-ments present fairly, in all material respects, the financial position of each of the Fundsas of December 31, 2020, the results of their operations for the year then ended, thechanges in their net assets for each of the two years in the period then ended, and thefinancial highlights for each of the five years in the period then ended, in conformity withaccounting principles generally accepted in the United States of America.
Basis for Opinion
These financial statements are the responsibility of the Funds’ management. Ourresponsibility is to express an opinion on the Funds’ financial statements based on ouraudits. We are a public accounting firm registered with the Public Company AccountingOversight Board (United States) (“PCAOB”) and are required to be independent withrespect to the Funds in accordance with the U.S. federal securities laws and the applic-able rules and regulations of the Securities and Exchange Commission and thePCAOB.
We conducted our audits in accordance with the standards of the PCAOB. Those stan-dards require that we plan and perform the audit to obtain reasonable assurance aboutwhether the financial statements are free of material misstatement whether due to erroror fraud.
Our audits included performing procedures to assess the risks of material misstatementof the financial statements, whether due to error or fraud, and performing proceduresthat respond to those risks. Such procedures included examining, on a test basis, evi-dence regarding the amounts and disclosures in the financial statements. Our proce-dures included confirmation of securities owned as of December 31, 2020, by corre-spondence with the custodian. Our audits also included evaluating the accounting prin-ciples used and significant estimates made by management, as well as evaluating theoverall presentation of the financial statements. We believe that our audits provide areasonable basis for our opinion.
We have served as the Funds’ auditor since 2004.
COHEN & COMPANY, LTD.Cleveland, Ohio February 19, 2021
2020 Annual Report 30
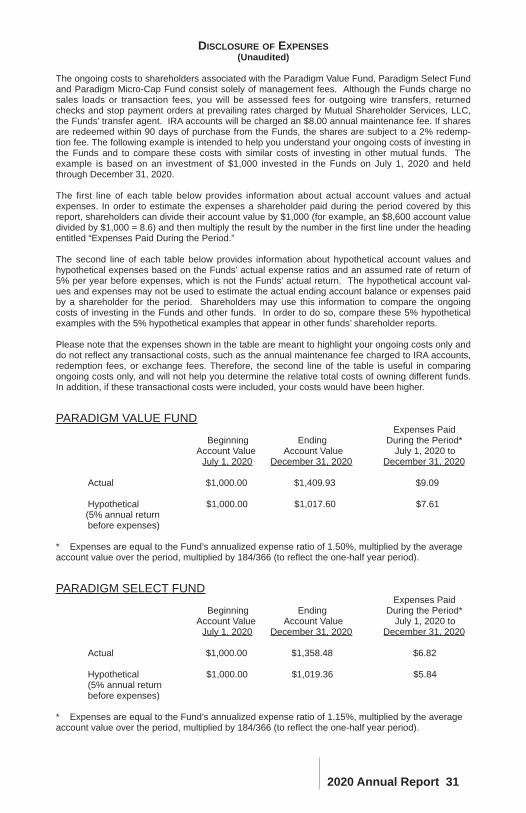
DISCLOSURE OF EXPENSES(Unaudited)
The ongoing costs to shareholders associated with the Paradigm Value Fund, Paradigm Select Fundand Paradigm Micro-Cap Fund consist solely of management fees. Although the Funds charge nosales loads or transaction fees, you will be assessed fees for outgoing wire transfers, returnedchecks and stop payment orders at prevailing rates charged by Mutual Shareholder Services, LLC,the Funds’ transfer agent. IRA accounts will be charged an $8.00 annual maintenance fee. If sharesare redeemed within 90 days of purchase from the Funds, the shares are subject to a 2% redemp-tion fee. The following example is intended to help you understand your ongoing costs of investing inthe Funds and to compare these costs with similar costs of investing in other mutual funds. Theexample is based on an investment of $1,000 invested in the Funds on July 1, 2020 and heldthrough December 31, 2020.
The first line of each table below provides information about actual account values and actualexpenses. In order to estimate the expenses a shareholder paid during the period covered by thisreport, shareholders can divide their account value by $1,000 (for example, an $8,600 account valuedivided by $1,000 = 8.6) and then multiply the result by the number in the first line under the headingentitled “Expenses Paid During the Period.”
The second line of each table below provides information about hypothetical account values andhypothetical expenses based on the Funds’ actual expense ratios and an assumed rate of return of5% per year before expenses, which is not the Funds’ actual return. The hypothetical account val-ues and expenses may not be used to estimate the actual ending account balance or expenses paidby a shareholder for the period. Shareholders may use this information to compare the ongoingcosts of investing in the Funds and other funds. In order to do so, compare these 5% hypotheticalexamples with the 5% hypothetical examples that appear in other funds’ shareholder reports.
Please note that the expenses shown in the table are meant to highlight your ongoing costs only anddo not reflect any transactional costs, such as the annual maintenance fee charged to IRA accounts,redemption fees, or exchange fees. Therefore, the second line of the table is useful in comparingongoing costs only, and will not help you determine the relative total costs of owning different funds.In addition, if these transactional costs were included, your costs would have been higher.
PARADIGM VALUE FUNDExpenses Paid
Beginning Ending During the Period*Account Value Account Value July 1, 2020 to
July 1, 2020 December 31, 2020 December 31, 2020
Actual $1,000.00 $1,409.93 $9.09
Hypothetical $1,000.00 $1,017.60 $7.61(5% annual return before expenses)
* Expenses are equal to the Fund’s annualized expense ratio of 1.50%, multiplied by the averageaccount value over the period, multiplied by 184/366 (to reflect the one-half year period).
PARADIGM SELECT FUNDExpenses Paid
Beginning Ending During the Period*Account Value Account Value July 1, 2020 to
July 1, 2020 December 31, 2020 December 31, 2020
Actual $1,000.00 $1,358.48 $6.82
Hypothetical $1,000.00 $1,019.36 $5.84(5% annual return before expenses)
* Expenses are equal to the Fund’s annualized expense ratio of 1.15%, multiplied by the averageaccount value over the period, multiplied by 184/366 (to reflect the one-half year period).
2020 Annual Report 31
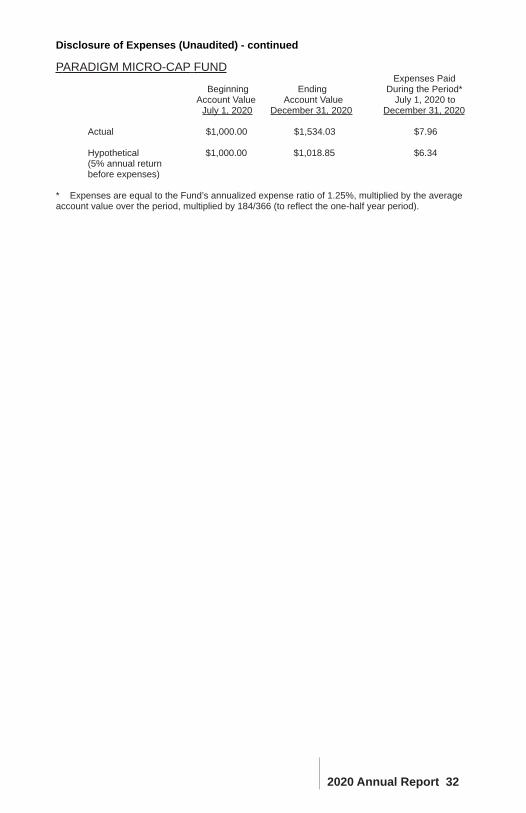
PARADIGM MICRO-CAP FUNDExpenses Paid
Beginning Ending During the Period*Account Value Account Value July 1, 2020 to
July 1, 2020 December 31, 2020 December 31, 2020
Actual $1,000.00 $1,534.03 $7.96
Hypothetical $1,000.00 $1,018.85 $6.34(5% annual return before expenses)
* Expenses are equal to the Fund’s annualized expense ratio of 1.25%, multiplied by the averageaccount value over the period, multiplied by 184/366 (to reflect the one-half year period).
2020 Annual Report 32
Disclosure of Expenses (Unaudited) - continued
ADDITIONAL INFORMATIONDecember 31, 2020
(Unaudited)
AVAILABILITY OF QUARTERLY SCHEDULE OF INVESTMENTS
The Funds publicly file their complete schedules of portfolio holdings with the Securities andExchange Commission (“SEC”) for the first and third quarters of each fiscal year on Form N-PORT.The Funds’ Forms N-PORT are available on the SEC’s website at http://www.sec.gov.
PROXY VOTING GUIDELINES
Paradigm Funds Advisor LLC, the Funds’ Advisor, is responsible for exercising the voting rightsassociated with the securities held by the Funds. A description of the policies and procedures usedby the Advisor in fulfilling this responsibility is available without charge on the Funds’ website atwww.paradigm-funds.com. It is also included in the Funds’ Statement of Additional Information,which is available on the SEC’s website at http://www.sec.gov.
Information regarding how the Funds voted proxies, Form N-PX, relating to portfolio securities duringthe most recent 12-month period ended June 30 is available without charge, upon request, by callingour toll free number(1-800-239-0732). This information is also available on the SEC’s website athttp://www.sec.gov.
ADDITIONAL INFORMATION
You will find more information about the Funds at www.paradigm-funds.com. For shareholderinquiries, please call toll-free in the U.S. at 1-800-239-0732.
LIQUIDITY RISK MANAGEMENT PROGRAM
The Funds have adopted and implemented a written liquidity risk management program as requiredby Rule 22e-4 (the “Liquidity Rule”) under the Investment Company Act. The program is reasonablydesigned to assess and manage the Funds’ liquidity risk, taking into consideration, among other fac-tors, the Funds’ investment strategies and the liquidity of its portfolio investments during normal andreasonably foreseeable stressed conditions; its short and long-term cash flow projections; and itscash holdings and access to other funding sources.
During the fiscal year ended December 31, 2020, the Board and the Trust’s Liquidity ProgramAdministrator reviewed a report from the Liquidity Program Administrator and reviewed the Funds’investments and they determined that the Funds held adequate levels of cash and highly liquidinvestments to meet shareholder redemption activities in accordance with applicable requirements.Accordingly, the Board concluded that (i) the Funds’ liquidity risk management program is reason-ably designed to prevent violations of the Liquidity Rule and (ii) the Funds’ liquidity risk managementprogram has been effectively implemented..
2020 Annual Report 33
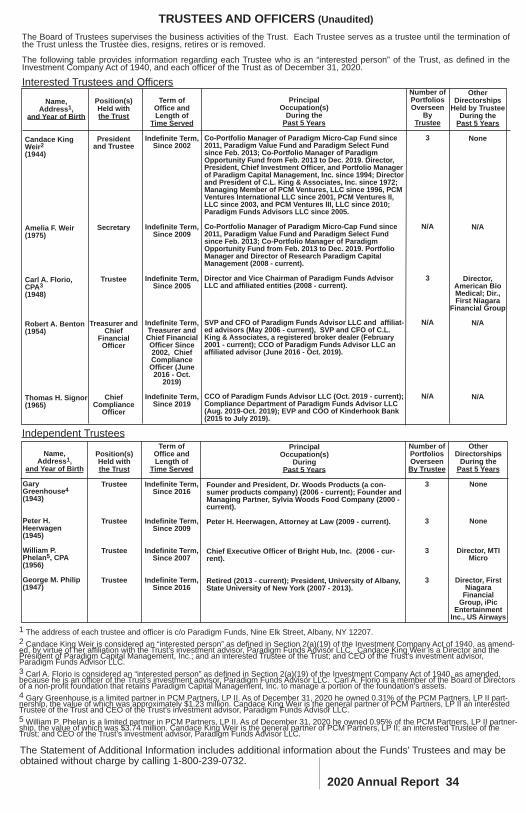
TRUSTEES AND OFFICERS (Unaudited)The Board of Trustees supervises the business activities of the Trust. Each Trustee serves as a trustee until the termination ofthe Trust unless the Trustee dies, resigns, retires or is removed.
The following table provides information regarding each Trustee who is an “interested person” of the Trust, as defined in theInvestment Company Act of 1940, and each officer of the Trust as of December 31, 2020.
Interested Trustees and Officers
Name, Address1,
and Year of Birth
Candace KingWeir2(1944)
Amelia F. Weir(1975)
Carl A. Florio,CPA3(1948)
Robert A. Benton(1954)
Thomas H. Signor(1965)
Position(s) Held with the Trust
President and Trustee
Secretary
Trustee
Treasurer andChief
FinancialOfficer
Chief Compliance
Officer
Term of Office and Length of
Time Served
Indefinite Term,Since 2002
Indefinite Term,Since 2009
Indefinite Term,Since 2005
Indefinite Term,Treasurer andChief FinancialOfficer Since2002, ChiefComplianceOfficer (June2016 - Oct.
2019)
Indefinite Term,Since 2019
PrincipalOccupation(s)
During thePast 5 Years
Co-Portfolio Manager of Paradigm Micro-Cap Fund since2011, Paradigm Value Fund and Paradigm Select Fundsince Feb. 2013; Co-Portfolio Manager of ParadigmOpportunity Fund from Feb. 2013 to Dec. 2019. Director,President, Chief Investment Officer, and Portfolio Managerof Paradigm Capital Management, Inc. since 1994; Directorand President of C.L. King & Associates, Inc. since 1972;Managing Member of PCM Ventures, LLC since 1996, PCMVentures International LLC since 2001, PCM Ventures II,LLC since 2003, and PCM Ventures III, LLC since 2010;Paradigm Funds Advisors LLC since 2005.
Co-Portfolio Manager of Paradigm Micro-Cap Fund since2011, Paradigm Value Fund and Paradigm Select Fundsince Feb. 2013; Co-Portfolio Manager of ParadigmOpportunity Fund from Feb. 2013 to Dec. 2019. PortfolioManager and Director of Research Paradigm CapitalManagement (2008 - current).
Director and Vice Chairman of Paradigm Funds AdvisorLLC and affiliated entities (2008 - current).
SVP and CFO of Paradigm Funds Advisor LLC and affiliat-ed advisors (May 2006 - current), SVP and CFO of C.L.King & Associates, a registered broker dealer (February2001 - current); CCO of Paradigm Funds Advisor LLC anaffiliated advisor (June 2016 - Oct. 2019).
CCO of Paradigm Funds Advisor LLC (Oct. 2019 - current);Compliance Department of Paradigm Funds Advisor LLC(Aug. 2019-Oct. 2019); EVP and COO of Kinderhook Bank(2015 to July 2019).
Number ofPortfoliosOverseen
By Trustee
3
N/A
3
N/A
N/A
OtherDirectorships
Held by TrusteeDuring the
Past 5 Years
None
N/A
Director,American BioMedical; Dir.,First Niagara
Financial Group
N/A
N/A
Independent Trustees
Name, Address1,
and Year of Birth
GaryGreenhouse4(1943)
Peter H.Heerwagen(1945)
William P.Phelan5, CPA(1956)
George M. Philip(1947)
Position(s) Held with the Trust
Trustee
Trustee
Trustee
Trustee
Term of Office andLength of
Time Served
Indefinite Term,Since 2016
Indefinite Term,Since 2009
Indefinite Term,Since 2007
Indefinite Term,Since 2016
PrincipalOccupation(s)
DuringPast 5 Years
Founder and President, Dr. Woods Products (a con-sumer products company) (2006 - current); Founder andManaging Partner, Sylvia Woods Food Company (2000 -current).
Peter H. Heerwagen, Attorney at Law (2009 - current).
Chief Executive Officer of Bright Hub, Inc. (2006 - cur-rent).
Retired (2013 - current); President, University of Albany,State University of New York (2007 - 2013).
Number ofPortfoliosOverseenBy Trustee
3
3
3
3
OtherDirectorships
During thePast 5 Years
None
None
Director, MTIMicro
Director, FirstNiagara
FinancialGroup, iPic
EntertainmentInc., US Airways
1 The address of each trustee and officer is c/o Paradigm Funds, Nine Elk Street, Albany, NY 12207.2 Candace King Weir is considered an “interested person” as defined in Section 2(a)(19) of the Investment Company Act of 1940, as amend-ed, by virtue of her affiliation with the Trust’s investment advisor, Paradigm Funds Advisor LLC. Candace King Weir is a Director and thePresident of Paradigm Capital Management, Inc.; and an interested Trustee of the Trust; and CEO of the Trust’s investment advisor,Paradigm Funds Advisor LLC. 3 Carl A. Florio is considered an “interested person” as defined in Section 2(a)(19) of the Investment Company Act of 1940, as amended,because he is an officer of the Trust’s investment advisor, Paradigm Funds Advisor LLC. Carl A. Florio is a member of the Board of Directorsof a non-profit foundation that retains Paradigm Capital Management, Inc. to manage a portion of the foundation’s assets. 4 Gary Greenhouse is a limited partner in PCM Partners, LP II. As of December 31, 2020 he owned 0.31% of the PCM Partners, LP II part-nership, the value of which was approximately $1.23 million. Candace King Weir is the general partner of PCM Partners, LP II an interestedTrustee of the Trust and CEO of the Trust's investment advisor, Paradigm Funds Advisor LLC.5 William P. Phelan is a limited partner in PCM Partners, LP II. As of December 31, 2020 he owned 0.95% of the PCM Partners, LP II partner-ship, the value of which was $3.74 million. Candace King Weir is the general partner of PCM Partners, LP II; an interested Trustee of theTrust; and CEO of the Trust’s investment advisor, Paradigm Funds Advisor LLC.
The Statement of Additional Information includes additional information about the Funds’ Trustees and may beobtained without charge by calling 1-800-239-0732.
2020 Annual Report 34

Board of TrusteesCarl A. Florio
Gary GreenhousePeter H. HeerwagenCandace King WeirWilliam P. PhelanGeorge M. Philip
Investment Advisor Paradigm Funds Advisor LLC
Nine Elk StreetAlbany, NY 12207-1002
CounselThompson Hine LLP
41 South High Street, Suite 1700Columbus, OH 43215
CustodianU.S. Bank, NA
425 Walnut StreetP.O. Box 1118
Cincinnati, OH 45201
Dividend Paying Agent,Shareholders' Servicing Agent,
Transfer AgentMutual Shareholder Services
8000 Town Centre Dr., Suite 400Broadview Heights, OH 44147
Fund AdministratorPremier Fund Solutions, Inc.
1939 Friendship Drive, Suite CEl Cajon, CA 92020
Independent Registered Public Accounting FirmCohen & Company, Ltd.
1350 Euclid Ave., Suite 800Cleveland, OH 44115
This report is provided for the general information of the shareholders of the ParadigmFunds. This report is not intended for distribution to prospective investors in the Funds,unless preceded or accompanied by an effective prospectus.