paper 12 sg ejic
TRANSCRIPT
FULL PAPER
DOI:10.1002/ejic.201402274
Role of Triplet States of Two Different Ligands in theSensitized Emission of LnIII (EuIII, TbIII) in d–f HybridTetranuclear Heterometal (ZnII
2LnIII2, CdII
2LnIII2)
Complexes
Swarna Kamal Samanta,[a] Sk Md Towsif Abtab,[b]
Pinki Saha Sardar,[a] Sagarika Sanyal,[a] Muktimoy Chaudhury,*[b]
and Sanjib Ghosh*[a]
Keywords: Energy transfer / Sensitizers / Fluorescence / Lanthanides / Bridging ligands
The crystal structures of synthesized d–f hybrid tetranuclearheterometal ZnII
2EuIII2 and CdII
2EuIII2 complexes, involving
a pair of carboxylate ligands in a rare μ4-η2:η2 bridging mode,reveal that the metal centers are arranged alternately in arhombic plane within 4 Å from each other. The ZnII
2EuIII2 and
ZnII2TbIII
2 complexes exhibit efficient sensitization comparedwith the CdII-analogues. Under proper excitation, the lowestππ* triplet states of both ligands N,N�-dimethyl-N,N�-bis(2-hydroxy-3,5-dimethylbenzyl)ethylenediamine (H2L) and
1. Introduction
The design of organic ligands with architectures thatsimultaneously enhance the sensitization efficiency and re-duce the nonradiative deactivation of the LnIII emissivestate is a promising area of research.[1a] The LnIII emissionin the visible and NIR region is characterized by narrowband width, longer lifetime, and large Stokes’ shift from theexcitation band. These spectral features have been profita-bly utilized to develop LEDs, silica-based fiber optic net-works used for telecommunications,[1b–1d] biological im-aging techniques, biomedical assays[1e,2–4,5a] including invivo detection of cellular functions,[5b] and time-resolved lu-minescence microscopy and two photon microscopy.[5c–5e,6a]
The development of lanthanide-based luminescence hybridmaterials has also gained momentum.[6b] Various hosts in-vestigated include sol-gel hybrid, porous hybrid like zeolitesand mesoporous silicates, intercalation compounds, variouspolymer materials, hydrogels, organogels, and nanocompos-ite materials.[6b]
[a] Department of Chemistry, Presidency University,86/1, College Street, Kolkata 700073, IndiaE-mail: [email protected]
[email protected][b] Department of Inorganic Chemistry, Indian Association for the
Cultivation of Science,2, Raja Subodh Mallick Road, Kolkata 700032, IndiaE-mail: [email protected]://www.iacs.res.in/inorg/icmc/Supporting information for this article is available on theWWW under http://dx.doi.org/10.1002/ejic.201402274.
Eur. J. Inorg. Chem. 2014, 3101–3113 © 2014 Wiley-VCH Verlag GmbH & Co. KGaA, Weinheim3101
hexafluoroacetylacetone (Hhfac) act as donors, implying syn-ergistic energy transfer (ET). The ratio of the sensitized effi-ciency for the heterocomplexes in different media at 298 Kand 77 K, based on the observed transients, reveal the roleof ZnII and CdII in the ET process. The ratio of the ET rateconstants obtained from the time-resolved phosphorescenceof the complexes at 77 K and time-dependent DFT calcula-tions on homocomplexes support this contention.
In these systems, energy transfer (ET) from the donorligand to LnIII usually takes place from the lowest π-π* trip-let state of the ligand following Dexter’s exchange mecha-nism.[6c] The key features to derive efficient “antenna effect”for LnIII through this mechanism are (i) the ligand systemcoordinated to LnIII must have a highly absorbing π-π* sin-glet state (S1) to enhance the population of the lowest π-π*triplet (T1) through intersystem crossing; (ii) the corre-sponding lowest π-π* triplet (T1) of the ligand acting as thedonor state must be suitably located compared to the emis-sive state of LnIII to minimize back ET (an energy gap ofat least 2000–3000 cm–1 between T1 and the emissive stateof LnIII has been prescribed[6d]); (iii) the first coordinatingsphere of LnIII should be protected from vibronic couplingwith O–H, C–H, N–H oscillators in the medium, and(iv) the complex must be kinetically stable in the desiredmedium. The presence of a charge transfer (CT) state [aris-ing from metal to ligand (MLCT) or from metal to counteranion] between the S1 and the T1 states of the ligand orbetween the T1 state and the emissive state of LnIII couldfacilitate a nonradiative path and thus diminishing the effi-ciency of energy transfer.[6e,7a–7c]
The choice of two different ligands attached to LnIII putsanother restriction of T1↔T1 ET between the ligands.[7d]
Two different ligands suitably attached to LnIII, however,could enhance the “antenna effect”.[7e] We recently reportedan efficient synergistic antenna effect for TbIII in aqueousmedium in a ternary system consisting of a protein (BSA/
www.eurjic.org FULL PAPER
HSA), a ligand catechin (either +/–), and TbIII using NO3–
as counter anion.[7e] We have shown that the catechin com-plex of TbIII gets attached to a particular site of the proteinsused in the study. The binding of the catechin(+) complexof TbIII with the protein provides an efficient shielding ef-fect to TbIII from the O–H oscillator. This shielding effect,together with the synergistic ET from the lowest π-π* tripletstate of catechin (ca. 23200 cm–1) and the triplet state oftryptophan residue (ca. 24200 cm–1) in proteins, were re-sponsible for efficient synergistic ET to TbIII in aqueousand D2O medium. This situation was suitable for synergisticET as well as minimization of the possibility of back trans-fer from the 5D4 state of TbIII. We have also designed aternary system that shows a remarkable antenna effect inaqueous medium in which a catechin(+) complex of TbIII
has been lodged inside the nanocavity of β-cyclodextrin.[8a]
Protection of TbIII from the O–H oscillator and the mo-tional restriction of the coordinated ligand induced by thenanocavity of β-cyclodextrin were responsible for efficientsensitization of emission. A ternary system of EuIII, inwhich a EuIII-tetracycline (TC) complex exhibits tunableantenna effect through binding with protein, has been dem-onstrated.[8b] Tuning of the antenna effect occurs becauseof different degrees of protection of the EuIII–TC complexfrom coupling with O–H oscillators.[8b]
In recent times, the characterizations of d–f hybrid com-plexes using RuIII, OsIII, IrIII, ReIII and PtII have attractedmany researchers to enhance the energy transfer efficiencyof LnIII by using the MLCT triplet state as the donorstate.[8c–8e,9–11] The position of the MLCT triplet state withrespect to the emissive state of LnIII has been found to becrucial in the ET process.[10b] There are also reports of Ln-Cd cluster[12a,12b] and also Co-doped LnIIICdII organicframeworks[12] exhibiting luminescence tuning and white-light emission.
We recently reported the synthesis, structures, and pre-liminary photophysical properties of tetranuclear homo-(ZnII
4 and CdII4) and heterometal (ZnII
2TbIII2 and CdII
2-TbIII
2) complexes in which the metal centers are connectedby a pair of carboxylate ligands in a rare μ4-η2:η2-bridgingmode.[13a–13c] The intensity and the lifetime of the sensitizedemission (5D4�7F5 of TbIII) in ZnII
2TbIII2 complex were
found to be greater than that in the CdII2TbIII
2 complexin various solvents at room temperature. These results[13a]
prompted us to investigate the corresponding heterometalcomplexes with EuIII to explain the influence of ZnII andCdII in the ET process in detail and also to establish therole of the two triplet states of two different ligands in thesesystems.
The task of enhancing the antenna effect in EuIII is morechallenging because the emissive states 5D0 and 5D1 ofEuIII, which lie lower in energy compared with the 5D4 stateof TbIII, is more susceptible to vibronic coupling with ma-trix oscillators. In the present work, we report the detailedphotophysical properties of d–f hybrid complexes[ZnII
2L2(PhCOO)2ZnII2(hfac)2], [CdII
2L2(PhCOO)2CdII2-
(hfac)2], [Zn2L2(PhCOO)2Eu2(hfac)4], and [Cd2L2-(PhCOO)2Eu2(hfac)4], hereafter referred to as ZnII
4 (1),
Eur. J. Inorg. Chem. 2014, 3101–3113 © 2014 Wiley-VCH Verlag GmbH & Co. KGaA, Weinheim3102
CdII4 (2), ZnII
2EuIII2 (3), and CdII
2EuIII2 (4), respectively
[H2L is a tetradentate N2O2 proligand N,N�-dimethyl-N,N�-bis(2-hydroxy-3,5-dimethylbenzyl)ethylenediamine andHhfac represents hexafluoroacetylacetone, used here as abridging ancillary ligand]. The steady-state and time-re-solved emissions of EuIII in the heterometal systems 3 and4 have been carried out in different solvents CH2Cl2,CD2Cl2, and CH2Cl2/CH3OH [using 1:1 (v/v) ratio] at298 K and also in a glassy matrix (CH2Cl2/CH3OH, 1:1v/v) and in the solid state at 77 K using excitations of boththe ligands hfac– and L–2. We also included the photolumi-nescence studies of the TbIII complexes viz. ZnII
2TbIII2 (3�)
and CdII2TbIII
2 (4�) at 77 K to substantiate our contention.For a control experiment, we also synthesized the dia-magnetic complexes [Zn2L2(PhCOO)2La2(hfac)4] and[Cd2L2(PhCOO)2La2(hfac)4], referred to as ZnII
2LaIII2 (5)
and CdII2LaIII
2 (6), respectively, for their characterizationin solution by 1H NMR spectroscopy to establish whetheror not complexes 1–4 retain their integrity in solutions. Inaddition, compounds 3 and 4 have also been characterizedin the solid state by single-crystal X-ray diffraction analysis.The sensitized EuIII emission is always found to be signifi-cantly greater in 3 than in 4. To find a plausible mechanismfor the differences in sensitization in 3 and 4, we also pres-ent the emissive features of the pure ligands H2L, Hhfac,and all the complexes 1–4 at room temperature and inglassy matrix at 77 K. The transients of 5D0�7F2 in EuIII
in 3 and 4 in different solvents at 298 K as well as the phos-phorescence quenching and the lifetime of the T1 state ofHhfac in 3 and 4 at 77 K have been utilized to investigatethe nature of the donor state in the ET process. Exploitingthe fact that the 5D0�7F1 transition in EuIII is the onlymagnetic dipole allowed, the results have been evaluated bycalculating the radiative lifetime of EuIII, the ratio of thequantum yields of EuIII after energy transfer, and the ratioof the sensitization efficiency in 3 and 4.[13d] Steady-stateand time-resolved emission spectra of 3� and 4� at 77 K inthe glassy matrix (dichloromethane/methanol, 1:1) havebeen also analyzed to investigate the role of Zn and Cd.The ratio of the energy transfer rate constants in 3 and 4and also in 3� and 4� at 77 K in glassy matrix has also beenevaluated from the time-resolved phosphorescence of thecomplexes. The probability of synergistic ET from the close-lying triplet states of H2L and Hhfac under suitable exci-tation has also been envisaged.[7e] Finally, all the results an-alyzed have been exploited to establish the role of ZnII andCdII in the ET process using time-dependent density func-tional theory (TDDFT) calculations. The present d–f hy-brid systems may serve as models to help develop a plaus-ible mechanism of sensitization of LnIII in several nano-composites, nanowires, and polymers having d–f combina-tions.[13e,14]
2. Results and Discussion2.1. Description of Crystal Structures
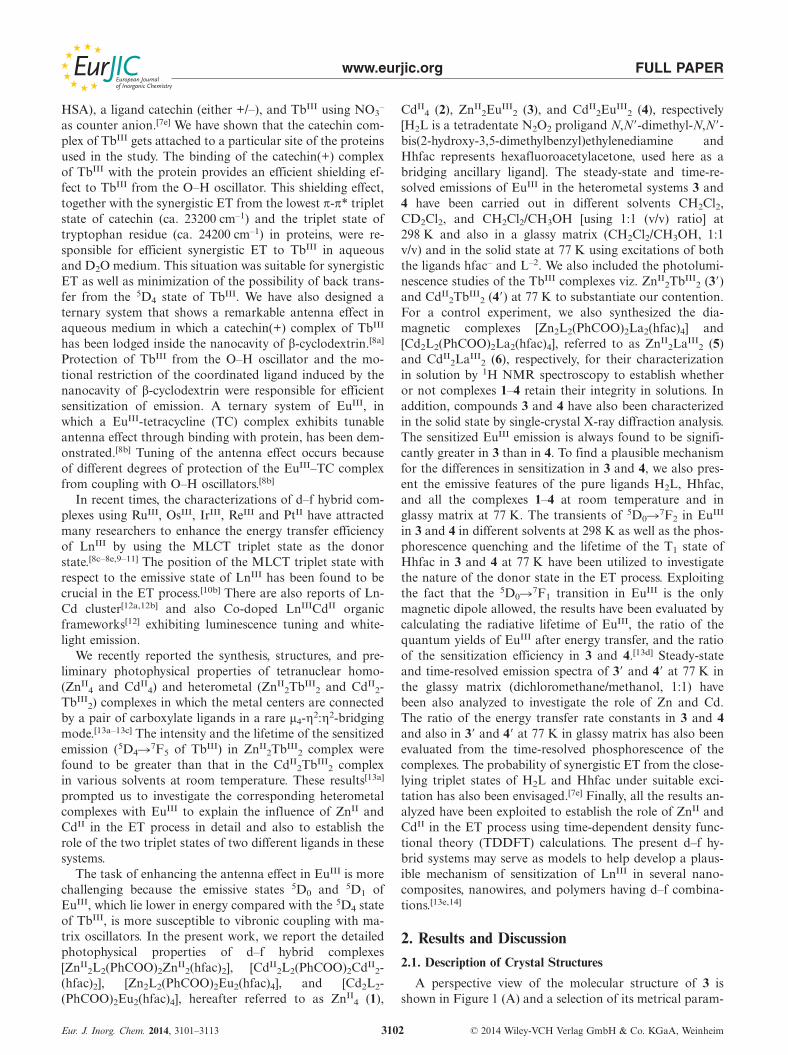
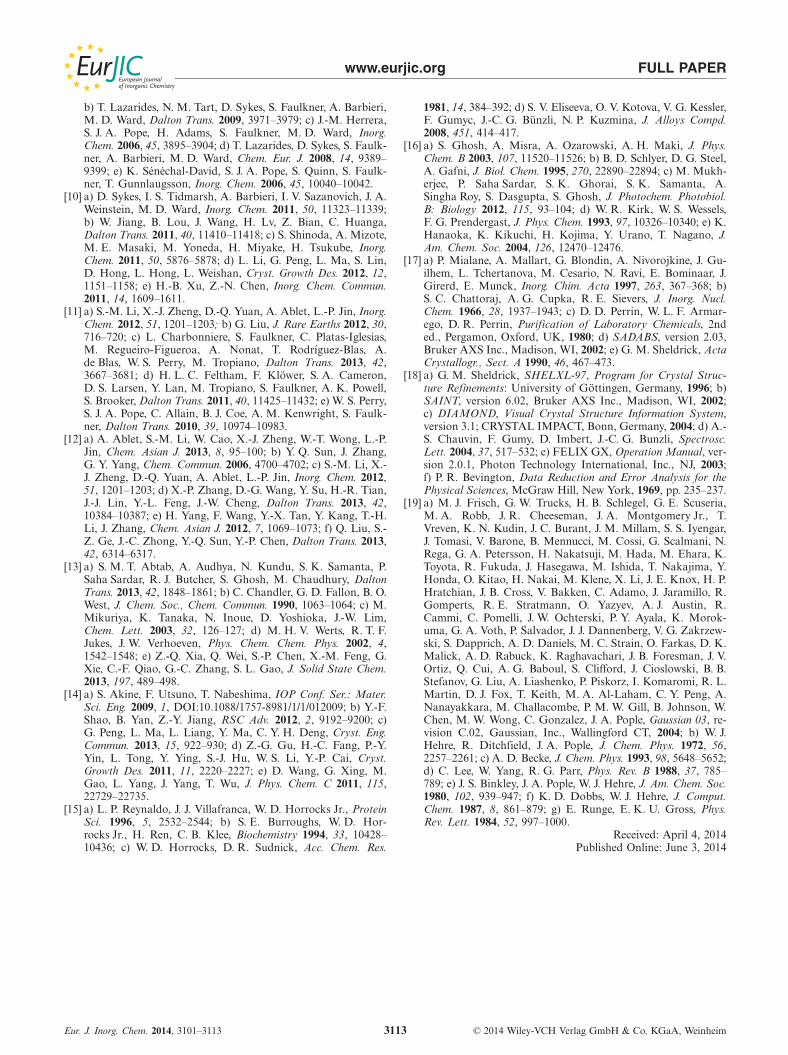
A perspective view of the molecular structure of 3 isshown in Figure 1 (A) and a selection of its metrical param-
www.eurjic.org FULL PAPER
eters are provided in the Supporting Information section asTable S1. The compound crystallizes in a monoclinic spacegroup Cc with four molecular mass units accommodatedper unit cell. The asymmetric unit consists of a neutral tet-ranuclear [ZnII
2L2(PhCOO)2EuIII2(hfac)4] core in which the
metal centers opposite each other have identical coordina-tion environments. The Zn(1) and Zn(2) centers in this corehave a distorted octahedral geometry, completed by O(1),N(1), N(2), and O(2) [O(3), N(3), N(4) and O(4) for Zn(2)]donor atoms, all coming from the tetradentate ligand L–2,together with O(5) and O(8) atoms [O(6) and O(7)] fromthe two bridging carboxyate moieties. The benzoato oxygenatoms O(5) and O(8) [O(6) and O(7)] along with the aminonitrogen atoms N(2) and N(1) [N(3) and N(4)] form theN2O2 basal plane, whereas the axial positions are taken upby the phenoxo oxygen atoms O(1) and O(2) [O(3) andO(4)]. The trans angles N(1)–Zn(1)–O(8) [176.95(19)°]{N(3)–Zn(2)–O(7) [176.9(2)°]} and N(2)–Zn(1)–O(5)[176.55(19)°] {N(4)–Zn(2)–O(6) [176.8(2)°]} are close to lin-earity, whereas the third angle, O(1)–Zn(1)–O(2)[159.84(17)°] {O(3)–Zn(2)–O(4) [159.14(18)°]}, is substan-tially short of the target, because of the constraints imposedby the two bridging phenolate oxygen atoms O(1) and O(2)[O(3) and O(4)]. The coordination spheres of Eu(1) andEu(2) are each completed by oxygen atoms coming fromtwo bridging benzoate O(6) and O(8) [O(5) and O(7) forEu(2)], two bridging phenolate oxygen atoms O(2) and O(3)[O(1) and O(4)], each coming from a L–2 ligand, and fouroxygen atoms O(9), O(10), O(11) and O(12) [O(13), O(14),O(15) and O(16)], coming from a pair of chelating hexa-fluoroacetylacetonate ligands (hfac–), making the lantha-nide ions eight-coordinate with dodecahedral geometries.Interestingly, whereas the phenoxo oxygen atom (O(1)) thatbridges Eu(2) and Zn(1) lies above the metal plane (therhombic plane connecting the four metal centers), the carb-oxylate oxygen O(5) between the same two metal centerslies below the metal plane. The bridging pattern is reversedbetween the next immediate pair of metal centers [Zn(1)and Eu(1)], thus creating an undulatory pattern of an octag-onal crown. The carboxylate oxygen atoms here are con-nected to all the metal centers, thus providing a rare μ4-η2:η2 type bridging mode.[13a]
The crystal structure of complex 4 (Figure 1, B) is quitesimilar to that of 3, with metrical parameters (provided inthe Supporting Information as Table S2) affected margin-ally due to the larger size of the Cd centers. The compoundcrystallizes in a triclinic space group, P1̄, with two formulaunits in the unit cell. The asymmetric unit consists of aneutral tetranuclear [Cd2L2(PhCOO)2Eu2(hfac)4] core. BothCd(1) and Cd(2) have distorted octahedral geometry com-pleted by O(1), N(1), N(2) and O(2) [O(3), N(3), N(4) andO(4) for Cd(2)] donor atoms, all coming from the tetraden-tate ligand L–2, along with O(5) and O(8) atoms [O(6) andO(7)] from the carboxylate. For the remaining two metalcenters Eu(1) and Eu(2), their dodecahedral environmentsare made up of the two bridging phenolate O(2) and O(3)[O(1) and O(4) for Eu(2)] and two bridging carboxylateO(5) and O(7) [O(6) and O(8)] oxygen atoms. These oxygen
Eur. J. Inorg. Chem. 2014, 3101–3113 © 2014 Wiley-VCH Verlag GmbH & Co. KGaA, Weinheim3103
Figure 1. (A) Partially labeled POV-ray (in ball and stick model)diagram showing the atom-labeling scheme for the complexZnII
2EuIII2 (3). (B) Partially labeled POV-ray (in ball and stick
model) diagram showing the atom-labeling scheme for the complexCdII
2EuIII2 (4).
atoms play an important role in fixing the metal centerstogether in a square plane. The remaining four coordinationsites are completed by four oxygen atoms O(9), O(10),O(11) and O(12) [O(13), O(14), O(15) and O(16)], all com-ing from a pair of chelating β-diketonate ligands (hfac–).
2.2 1H NMR Study
The 1H NMR spectra of 5 and 6 in CDCl3 are shownin Figure S1 and Figure S2 (provided in the SupportingInformation), respectively, and the data are summarized inthe Supporting Information. As expected, both complexeshave similar spectral patterns. A description of the NMRspectrum of complex 5 will be made here as a representativeexample. The spectrum of 5 exhibits twelve signals al-together, which indicate a fourfold symmetry of the mole-cule in solution. Five different peaks are observed in thearomatic region with expected integration and splitting pat-terns. Thus, protons of the benzoate ring appear in themaximum downfield region, with C(g) protons (atom label-ings are as shown in Figure S1, inset) appearing as a doub-let at δ = 9.07 ppm (J = 6.8 Hz), whereas the remaining
www.eurjic.org FULL PAPER
protons [C(h) and C(i)] appear as triplets at δ = 7.65 (J =7.60 Hz) and 7.53 ppm (J = 7.60 Hz), respectively. The restof the aromatic protons [C(b) and C(c)] from the tetraden-tate ligands appear as a pair of singlets at δ = 6.57 and6.39 ppm. The only proton [C(k)] of the hfac– ligand ap-pears in the form of a singlet at δ = 5.65 ppm. It is note-worthy that because of the rigidity of the metal bound(L)2– moiety, both benzylic [C(d) and C(di)] and bridgeheadethylenic protons [C(e) and C(ei)] are diastereotopic in thesecomplexes and appear in the form of AB quartets. As con-firmed by 1H-1H 2-D COSY NMR experiments, the benz-ylic protons appear at δA = 4.71 and δB = 2.69 ppm (JAB =12 Hz), and the corresponding values for the bridgeheadprotons are at δ = 1.96 and 1.46 ppm (JAB = 8.4 Hz). Themethyl groups attached to the phenyl rings and the aminenitrogen atoms of the tetradentate ligands appear as strongand sharp singlets at δ = 2.01 and 1.55 ppm, respectively.No signals that are ascribed to free Hhfac (appear at δ =12.58 and 6.42 ppm) or any other dissociation productshave been observed in these 1H NMR spectra, thus con-firming these molecules retain their integrity in solution.
2.3 Photophysical Studies
2.3.1. Absorption Spectra of the Ligands and the Complexes
at 298 K
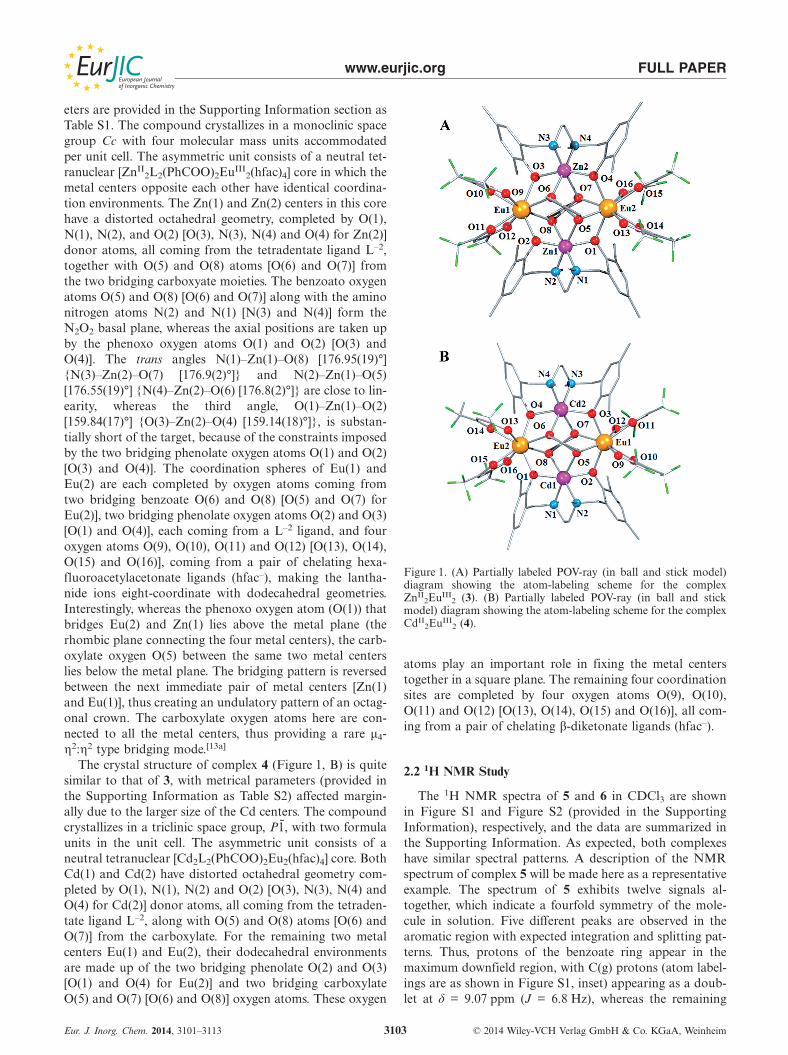
The absorption spectra of the free tetradentate ligandH2L, Hhfac, and those of the complexes 1–4 in dichloro-methane at 298 K are shown in Figure 2; correspondingλmax and εmax values are summarized in Table 1. The ab-sorption spectrum of the ligand H2L exhibits maximumaround 285 nm (Figure 2). The absorption band of Hhfacobserved at 273 nm in dichloromethane is shifted to 305 nmin the mixed solvent containing dichloromethane and meth-anol (1:1 v/v ratio). The (π-π*) nature of the bands of H2Land Hhfac is indicated by the high extinction coefficientvalues and the lifetime of the corresponding emission (seeSection 2.3.2). The band in dichloromethane arises from theketo form of Hhfac, whereas the band at 305 nm in the
Table 1. Absorption and fluorescence data for the ligand H2L, Hhfac, and complexes 1–4 in CH2Cl2 at 298 K.
Absorption maxima [nm], Fluorescence maxima λmax [nm] of Hhfac based Fluorescence quantum yield(ε [m–1 cm–1]) in CH2Cl2 of L–2 and free fluorescence in CH2Cl2 (φD)[a] of Hhfac based emission
Hhfac (λex = 310 nm) relative to 1
Ligand H2L[b] 284 – 336 (λex = 285 nm) – –(5300)
Hhfac[b] 273 – – –(6000)305[c] 363 (λex = 305 nm)[c]
(5300)1[b] 286 313 – 364 1
(17300) (11200)2[b] 290 312 – 364 0.50
(21200) (12500)3 290 311 – 364 0.1
(20180) (22000)4 293 311 – 364 0.07
(24760) (26000)
[a] Error in the measurement �5%. [b] Data from Ref.[13a] [c] In CH2Cl2/MeOH (1:1 v/v).
Eur. J. Inorg. Chem. 2014, 3101–3113 © 2014 Wiley-VCH Verlag GmbH & Co. KGaA, Weinheim3104
mixed solvent represents the enol form of this ligand. Theenol form takes part in the complex formation. The absorp-tion spectra of complexes 1–4 consist of two overlappingintense bands peaking around 285–295 and 310–315 nm(Figure 2, Table 1). The position and the intensity of thebands indicate that both the bands arise from localized π-π* transition of the ligands L–2 and hfac–, respectively.These bands are found to be slightly redshifted in the com-plexes, as summarized in Table 1. The lower energy bandaround 310 nm in the complexes is found to be twice asintense for complexes 3 and 4 than those in complexes 1and 2, because 3 and 4 contain four units of hfac– ligandwhereas 1 and 2 both contain only two hfac– ligands. Com-plexes 3 and 4 exhibit a shoulder around 330 nm. Both theabsorption maxima of the Cd complexes 2 (homo-) and 4(hetero-) are somewhat more intense than those of the cor-responding Zn complexes 1 and 3 (Table 1) as observed inthe corresponding TbIII heterometal complexes.[13a] In or-
Figure 2. Absorption spectra of (a) free ligand H2L, (b) free ligandHhfac, (c) ZnII
4 (1), (d) CdII4 (2), (e) ZnII
2EuIII2 (3), (f) CdII
2EuIII2
(4) complexes in dichloromethane (CH2Cl2) solvent and (b�) repre-sents the absorption spectrum of free Hhfac in CH2Cl2–MeOH (1:1v/v) solvent mixture at 298 K; the concentration of each solutionwas 10 μm. The absorbance values are given in the text. Inset: theexcitation spectra monitoring 5D0 � 7F2 emission of EuIII at619 nm of the complex CdII
2EuIII2 using a solution of optical den-
sity 0.2 in CH2Cl2. Excitation and emission band-passes were10 nm each.
www.eurjic.org FULL PAPER
der to obtain a more detailed picture of the nature of thetransitions, we have applied TDDFT to both homometalliccomplexes 1 and 2. The nature of the transitions with calcu-lated oscillator strength (f) values have been provided inthe Supporting Information (Table S3). The HOMO andLUMO of the optimized CdII
4 complex are provided in theSupporting Information (Figure S3). It is noted that bothcomplexes show absorption near 275 and 315 nm. Whereasfor the CdII
4 complex, six distinct levels HOMO–6,HOMO–7, HOMO–8, HOMO–9, HOMO–10, andHOMO–11 are involved in the transition to the LUMO+2level, only two molecular orbitals, namely, HOMO–5 andHOMO–6, participate in the same transition for the ZnII
4
complex (provided in the Supporting Information, TableS3). The coefficients associated with each of these transi-tions have substantial values, which is indicative of mixingof several states for the CdII
4 complex. Such state-mixing isless in the case of the ZnII
4 complex. From the orbital pic-tures of the HOMO–6, HOMO–7, HOMO–8, andLUMO+2 states of the complexes, it is evident that thesestates bear a typical signature of the Hhfac, whereas theHOMO–8, HOMO–9, HOMO–11, HOMO–5, and LUMOstates are markedly dominated by the characters of the li-gand L–2. The calculated oscillator strengths of the transi-tions match well with the experimental results.
2.3.2 Steady-State and Time-Resolved Emission Spectra of
the Ligands and Complexes in Solvents at 298 K
The ligands L–2 and hfac– exhibit π-π* fluorescencepeaking at 336 and 363 nm, respectively, when excited at theabsorption maxima of the systems[13a] in dichloromethanesolution at 298 K. However, the emission of hfac– is very
Table 2. Luminescence lifetimes of EuIII and TbIII monitoring 619 nm (5D0�7F2 transition) and 547 nm (5D4�7F5 transition), respec-tively, in various solvents and in the solid state at 298 K and at 77 K; λexc = 310 nm.
State/medium Compd. Temp. (K) τ1 [μs] τ2 [μs] �τ� [μs] I3/I4[a] I3�/I4�
[b]
CH2Cl2 3 298 540 – 540 [8.6][c] 5.1 [4.5][d] 2.1[e] [1.9][d]
4 298 380 – 380 [7.2][c]
CD2Cl2 3 298 665 – 665 [8.8][c] 5.3 [5.0][d] 2.0[e] [1.9][d]
4 298 455 – 455 [7.4][c]
CH2Cl2/MeOH 3 298 370 – 370 [12.8][c] 5.3 [4.9][d] 1.9[e] [1.9][d]
(1:1 v/v) 4 298 350 – 350 [11.7][c]
3 77 590 (59%) 155 (41%) 410 4.6 [4.5][d]
4 77 560 (48 %) 130 (52%) 3723� 77 1041 (71%) 174 (29%) 790 1.9 [1.8][d]
4� 77 1010 (57%) 172 (43%) 650
Solid State 3 298 590 (55%) 237 (45%) 432 5.0 [4.7][d]
4 298 440 (73%) 160 (27%) 3663� 298 81 (79%) 346 (21%) 136 2.0 [2.0][d]
4� 298 50 (80 %) 240 (20%) 89
3 77 666 (64%) 244 (36%) 512 4.9 [4.7][d]
4 77 501 (66%) 160 (36%) 3853� 77 780 (70%) 170 (30%) 600 2.1[e] [2.0][d]
4� 77 734 (50%) 120 (50%) 426
[a] I represents area under the 5D0�7F2 band of EuIII emission. Error in the measurement of area under the 5D0�7F2 band �5%. [b] Irepresents area under the 5D4�7F5 band of TbIII emission. Error in the measurement of area under the 5D4�7F5 band �5 %. [c] Valuesin parenthesis represent the rise time. [d] Values in parenthesis represent the data with λexc = 285 nm. [e] Data from ref.[13a] Error in theanalysis of τ = �5 μs (IRF = 3 μs).
Eur. J. Inorg. Chem. 2014, 3101–3113 © 2014 Wiley-VCH Verlag GmbH & Co. KGaA, Weinheim3105
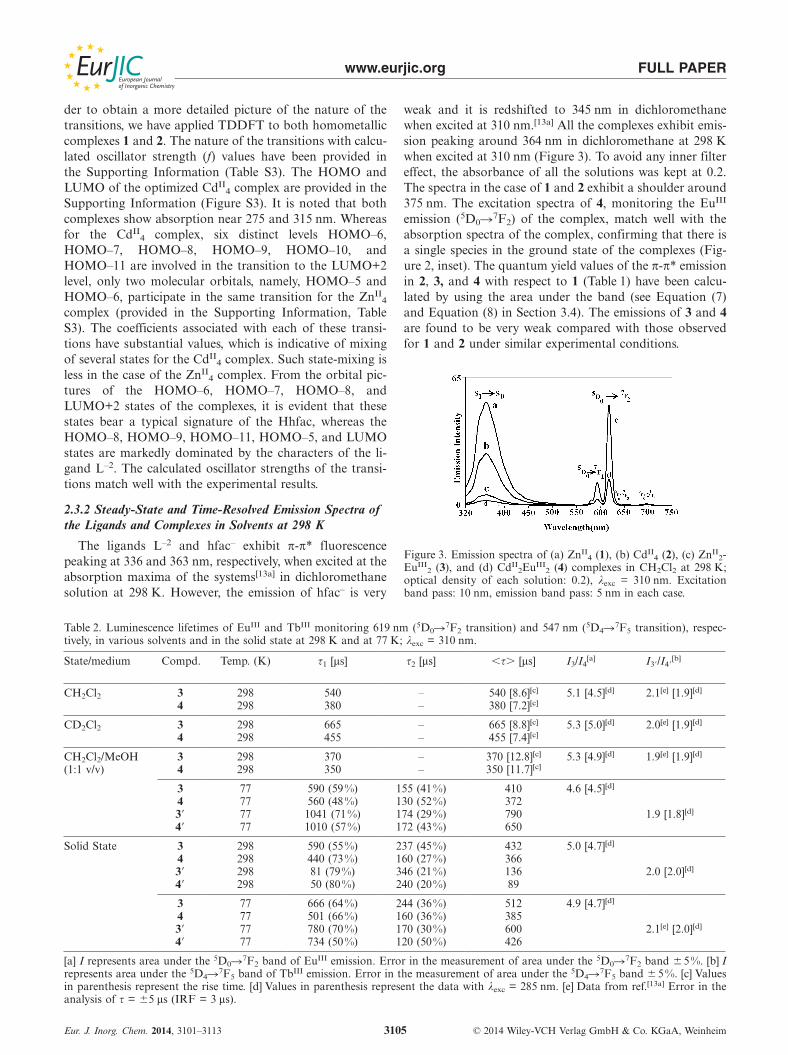
weak and it is redshifted to 345 nm in dichloromethanewhen excited at 310 nm.[13a] All the complexes exhibit emis-sion peaking around 364 nm in dichloromethane at 298 Kwhen excited at 310 nm (Figure 3). To avoid any inner filtereffect, the absorbance of all the solutions was kept at 0.2.The spectra in the case of 1 and 2 exhibit a shoulder around375 nm. The excitation spectra of 4, monitoring the EuIII
emission (5D0�7F2) of the complex, match well with theabsorption spectra of the complex, confirming that there isa single species in the ground state of the complexes (Fig-ure 2, inset). The quantum yield values of the π-π* emissionin 2, 3, and 4 with respect to 1 (Table 1) have been calcu-lated by using the area under the band (see Equation (7)and Equation (8) in Section 3.4). The emissions of 3 and 4are found to be very weak compared with those observedfor 1 and 2 under similar experimental conditions.
Figure 3. Emission spectra of (a) ZnII4 (1), (b) CdII
4 (2), (c) ZnII2-
EuIII2 (3), and (d) CdII
2EuIII2 (4) complexes in CH2Cl2 at 298 K;
optical density of each solution: 0.2), λexc = 310 nm. Excitationband pass: 10 nm, emission band pass: 5 nm in each case.
www.eurjic.org FULL PAPER
The decay of the π-π* emissions of the free ligands ofcomplexes 1 and 2, monitoring the λmax of the emissionin each case in dichloromethane using the correspondingexcitations, were reported in our earlier work.[13a] The life-time values were indicative of the fluorescence from thehfac– based singlet π-π* state in the complexes. Because theemission of complexes 3 and 4 are largely quenched(Table 1), the singlet-state lifetimes are too small to measure(beyond our detection limit with the λexc used for the pur-pose).
In the case of the heterometal complexes 3 and 4, thequenched hfac– based singlet π-π* emission in dichloro-methane is accompanied by the sensitized EuIII emissions(5D0�7Fj; j = 1, 2, 3, 4) (Figure 3). To characterize the sen-sitized EuIII emission in detail, we recorded the emissionspectra in CD2Cl2 and in mixed solvents containing CH2Cl2and CH3OH (1:1 v/v). The EuIII emissions in 3 and 4 areenhanced in CD2Cl2 compared with that in CH2Cl2. How-ever, the EuIII emissions are quenched to some extent in themixed solvents containing CH2Cl2 and methanol (1:1 v/v)compared with that in neat dichloromethane.[15a–15c] It isnoted that the intensity of the 5D0�7F2 transition is en-hanced by almost five times in 3 compared with that in 4in all the solvents (Table 2). This could be due to a differ-ence in the environment of EuIII in 3 and 4, or due to adifference in the ET efficiency in complexes 3 and 4, orpartly for both reasons.
Transients of EuIII Emission in 3 and 4 inSolvents at 298 K
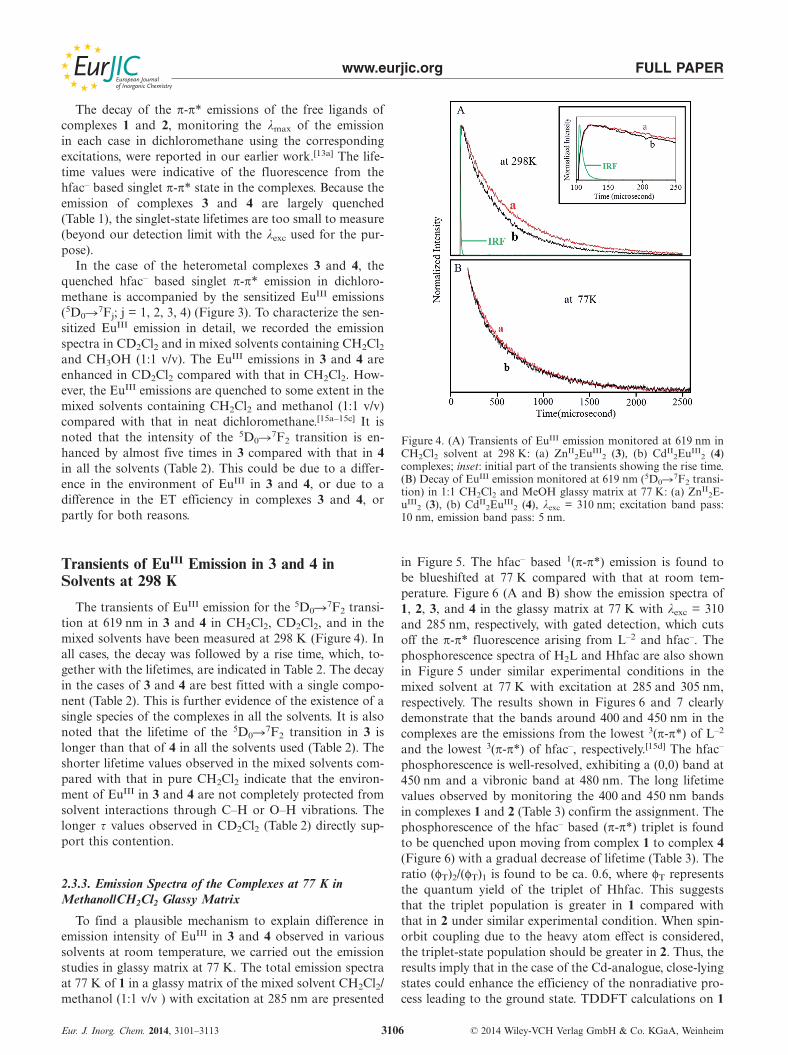
The transients of EuIII emission for the 5D0�7F2 transi-tion at 619 nm in 3 and 4 in CH2Cl2, CD2Cl2, and in themixed solvents have been measured at 298 K (Figure 4). Inall cases, the decay was followed by a rise time, which, to-gether with the lifetimes, are indicated in Table 2. The decayin the cases of 3 and 4 are best fitted with a single compo-nent (Table 2). This is further evidence of the existence of asingle species of the complexes in all the solvents. It is alsonoted that the lifetime of the 5D0�7F2 transition in 3 islonger than that of 4 in all the solvents used (Table 2). Theshorter lifetime values observed in the mixed solvents com-pared with that in pure CH2Cl2 indicate that the environ-ment of EuIII in 3 and 4 are not completely protected fromsolvent interactions through C–H or O–H vibrations. Thelonger τ values observed in CD2Cl2 (Table 2) directly sup-port this contention.
2.3.3. Emission Spectra of the Complexes at 77 K in
Methanol/CH2Cl2 Glassy Matrix
To find a plausible mechanism to explain difference inemission intensity of EuIII in 3 and 4 observed in varioussolvents at room temperature, we carried out the emissionstudies in glassy matrix at 77 K. The total emission spectraat 77 K of 1 in a glassy matrix of the mixed solvent CH2Cl2/methanol (1:1 v/v ) with excitation at 285 nm are presented
Eur. J. Inorg. Chem. 2014, 3101–3113 © 2014 Wiley-VCH Verlag GmbH & Co. KGaA, Weinheim3106
Figure 4. (A) Transients of EuIII emission monitored at 619 nm inCH2Cl2 solvent at 298 K: (a) ZnII
2EuIII2 (3), (b) CdII
2EuIII2 (4)
complexes; inset: initial part of the transients showing the rise time.(B) Decay of EuIII emission monitored at 619 nm (5D0�7F2 transi-tion) in 1:1 CH2Cl2 and MeOH glassy matrix at 77 K: (a) ZnII
2E-uIII
2 (3), (b) CdII2EuIII
2 (4), λexc = 310 nm; excitation band pass:10 nm, emission band pass: 5 nm.
in Figure 5. The hfac– based 1(π-π*) emission is found tobe blueshifted at 77 K compared with that at room tem-perature. Figure 6 (A and B) show the emission spectra of1, 2, 3, and 4 in the glassy matrix at 77 K with λexc = 310and 285 nm, respectively, with gated detection, which cutsoff the π-π* fluorescence arising from L–2 and hfac–. Thephosphorescence spectra of H2L and Hhfac are also shownin Figure 5 under similar experimental conditions in themixed solvent at 77 K with excitation at 285 and 305 nm,respectively. The results shown in Figures 6 and 7 clearlydemonstrate that the bands around 400 and 450 nm in thecomplexes are the emissions from the lowest 3(π-π*) of L–2
and the lowest 3(π-π*) of hfac–, respectively.[15d] The hfac–
phosphorescence is well-resolved, exhibiting a (0,0) band at450 nm and a vibronic band at 480 nm. The long lifetimevalues observed by monitoring the 400 and 450 nm bandsin complexes 1 and 2 (Table 3) confirm the assignment. Thephosphorescence of the hfac– based (π-π*) triplet is foundto be quenched upon moving from complex 1 to complex 4(Figure 6) with a gradual decrease of lifetime (Table 3). Theratio (φT)2/(φT)1 is found to be ca. 0.6, where φT representsthe quantum yield of the triplet of Hhfac. This suggeststhat the triplet population is greater in 1 compared withthat in 2 under similar experimental condition. When spin-orbit coupling due to the heavy atom effect is considered,the triplet-state population should be greater in 2. Thus, theresults imply that in the case of the Cd-analogue, close-lyingstates could enhance the efficiency of the nonradiative pro-cess leading to the ground state. TDDFT calculations on 1
www.eurjic.org FULL PAPER
and 2 support this contention. The process, in turn, leadsto lower population in the triplet state of the donor ligandsin the Cd-analogue.
Figure 5. (a) Low temperature (77 K) total emission spectra ofcomplex 1 in CH2Cl2–MeOH (1:1 v/v) glassy matrix with λexc =285 nm. (b) and (c) represent the low temperature (77 K) phospho-rescence spectra of H2L and Hhfac respectively in 1:1 (v/v)CH2Cl2–MeOH glassy matrix; λexc = 285 nm for H2L and λexc =305 nm for Hhfac. Excitation band pass: 10 nm, emission bandpass: 2.5 nm in each case.
Figure 6. (A) Low temperature (77 K) emission spectra of the com-plexes (a) ZnII
4 (1), (b) CdII4 (2), (c) ZnII
2EuIII2 (3), and (d) CdII
2-EuIII
2 (4) in CH2Cl2 and MeOH (1:1) glassy matrix with λexc =310 nm. Inset: Low temperature (77 K) emission spectra of thecomplexes (c�) ZnII
2TbIII2 (3�) and (d�) CdII
2TbIII2 (4�) in CH2Cl2
and MeOH (1:1) glassy matrix with λexc = 310 nm; (B) low tem-perature (77 K) emission spectra of the complexes (a) ZnII
4 (1), (b)CdII
4 (2), (c) ZnII2EuIII
2 (3), and (d) CdII2EuIII
2 (4) complexes inCH2Cl2 and MeOH (1:1) glassy matrix with λexc = 285 nm. Inset:low temperature (77 K) emission spectra of the complexes (c�)ZnII
2TbIII2 (3�) and (d�) CdII
2TbIII2 (4�) in CH2Cl2 and MeOH (1:1)
glassy matrix with λexc = 285 nm (using gated detection which cutsoff the fluorescence in each case). Excitation band pass: 10 nm,emission band pass: 2.5 nm in each case.
It is also noted that (φT)3/(φT)1 ≈ 0.1 whereas (φT)4/(φT)2
≈ 0.13. This is indicative of efficient transfer from the tripletto the 5D0 state of EuIII in 3 compared with that in 4. The
Eur. J. Inorg. Chem. 2014, 3101–3113 © 2014 Wiley-VCH Verlag GmbH & Co. KGaA, Weinheim3107
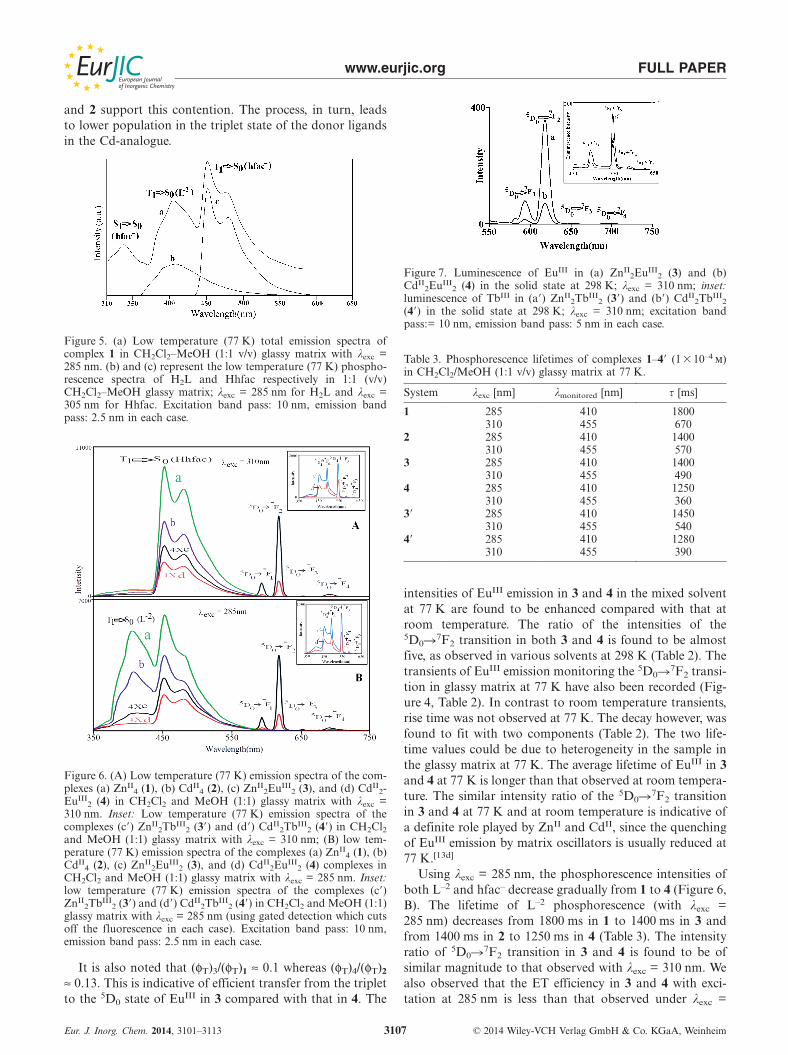
Figure 7. Luminescence of EuIII in (a) ZnII2EuIII
2 (3) and (b)CdII
2EuIII2 (4) in the solid state at 298 K; λexc = 310 nm; inset:
luminescence of TbIII in (a�) ZnII2TbIII
2 (3�) and (b�) CdII2TbIII
2
(4�) in the solid state at 298 K; λexc = 310 nm; excitation bandpass:= 10 nm, emission band pass: 5 nm in each case.
Table 3. Phosphorescence lifetimes of complexes 1–4� (1�10–4 m)in CH2Cl2/MeOH (1:1 v/v) glassy matrix at 77 K.
System λexc [nm] λmonitored [nm] τ [ms]
1 285 410 1800310 455 670
2 285 410 1400310 455 570
3 285 410 1400310 455 490
4 285 410 1250310 455 360
3� 285 410 1450310 455 540
4� 285 410 1280310 455 390
intensities of EuIII emission in 3 and 4 in the mixed solventat 77 K are found to be enhanced compared with that atroom temperature. The ratio of the intensities of the5D0�7F2 transition in both 3 and 4 is found to be almostfive, as observed in various solvents at 298 K (Table 2). Thetransients of EuIII emission monitoring the 5D0�7F2 transi-tion in glassy matrix at 77 K have also been recorded (Fig-ure 4, Table 2). In contrast to room temperature transients,rise time was not observed at 77 K. The decay however, wasfound to fit with two components (Table 2). The two life-time values could be due to heterogeneity in the sample inthe glassy matrix at 77 K. The average lifetime of EuIII in 3and 4 at 77 K is longer than that observed at room tempera-ture. The similar intensity ratio of the 5D0�7F2 transitionin 3 and 4 at 77 K and at room temperature is indicative ofa definite role played by ZnII and CdII, since the quenchingof EuIII emission by matrix oscillators is usually reduced at77 K.[13d]
Using λexc = 285 nm, the phosphorescence intensities ofboth L–2 and hfac– decrease gradually from 1 to 4 (Figure 6,B). The lifetime of L–2 phosphorescence (with λexc =285 nm) decreases from 1800 ms in 1 to 1400 ms in 3 andfrom 1400 ms in 2 to 1250 ms in 4 (Table 3). The intensityratio of 5D0�7F2 transition in 3 and 4 is found to be ofsimilar magnitude to that observed with λexc = 310 nm. Wealso observed that the ET efficiency in 3 and 4 with exci-tation at 285 nm is less than that observed under λexc =

www.eurjic.org FULL PAPER
310 nm, which excites mostly the hfac– ligand (Figure 6, B).It has been found that φ285/φ310 is 0.78 for the Zn complex3 and 0.84 for the Cd complex 4, after proper correctionfor the absorbance at the two different excitations; φ beingcalculated by using the total intensity of EuIII emission atthe respective excitation wavelength.
2.3.4. EuIII Emission in 3 and 4 in the Solid State at 298 K
and at 77 K
The emission spectra and the transients of EuIII in 3 and4 have been also recorded in the solid state at room tem-perature and at 77 K (Figure 7, Table 2). The ratio of theintensities of the 5D0�7F2 band in 3 and 4 is found to beof similar magnitude to that observed in solvents at 298 K(Table 2). This result also indicates that ZnII and CdII havedifferent influence in the sensitization process. The resultsfurther confirm that the solid-state structure of 3 and 4 areretained in the fluid medium. The decay of EuIII monitoringthe 5D0�7F2 transition was found to fit with two compo-nents (Table 2). This is possibly indicative of heterogeneityin the sample, with �τ� being longer than that found invarious solvents at 298 K.
2.3.5. TbIII Emission in 3� and 4� in Various Matrices
Similar steady-state and time-resolved measurements ofTbIII complexes 3� and 4� at 77 K in glassy matrix (insets
Table 4. Radiative lifetime (τR), experimental overall luminescence quantum yield (φtot) ratio, sensitization efficiency (ηsens) ratio of EuIII
and TbIII in different complexes; λexc = 310 nm.[a]
Medium (temp., Compd. τR [μs] τobs [μs] φLn Total quantum Ratio of total quantum SensitizationK) yield (φtot)�103 yield [(φtot)Zn analog/ efficiency ratio
(φtot)Cd analog][b] [(ηsens)3/(ηsens)4]
CH2Cl2 3 2249 [2292] 540 [550] 0.24 [0.24] 0.192 5.2 4.1(298) 4 1988 [2020] 380 [380] 0.19 [0.19] 0.037 [5.2] [4.1]
3� 790 [788] 17[c] [17] 0.022 [0.022] 0.111 2.4 2.14� 650 [646] 12[c] [12] 0.018 [0.019] 0.046 [2.5] [2.2]
CH2Cl2/MeOH 3 3932 [3920] 370 [360] 0.09 [0.09] 0.036 5.3 5.2(1:1 v/v)(298) 4 3820 [3820] 350 [340] 0.09 [0.09] 0.007 [5.3] [5.1]
3� 790 [788] 10[c] [10] 0.013 [0.013] 0.090 2.3 2.04� 650 [646] 7[c] [7] 0.011 [0.011] 0.039 [2.4] [2.0]
CD2Cl2 3 2140 [2135] 665 [662] 0.31 [0.31] 0.365 5.4 4.2(298) 4 1870 [1873] 455 [457] 0.24 [0.24] 0.068 [5.4] [4.2]
3� 790 [788] 31[c] [31] 0.039 [0.039] 0.189 2.4 1.94� 650 [646] 20[c] [20] 0.031 [0.031] 0.079 [2.5] [2.0]
Solid state 3 432 [435] – 4.9 4.3(298) 4 – 366 [380] 1.14[d] [1.09] – [4.9] [4.5]
3� 600 [610] 136 [134] 0.227 [0.220] – 2.3 2.14� 426 [422] 89 [90] 0.209 [0.213] – [2.2] [2.1]
Solid state 3 512 [513] – 4.8 4.2(77) 4 – 385 [394] 1.13[d] [1.10] – [4.8] [4.4]
3� 600 [610] 600 [610] 1.000 [1.000] – 2.4 2.44� 426 [422] 426 [422] 1.000 [1.000] – [2.2] [2.2]
CH2Cl2/MeOH 3 410 [434] – 4.6 4.3(1:1 v/v)(77) 4 – 372 [360] 1.07[d] [1.20] – [4.6] [3.8]
3� 790 [788] 790 [788] 1.000 [1.000] – 2.4 2.44� 650 [646] 650 [646] 1.000 [1.000] – [2.4] [2.4]
[a] Values in the parenthesis represent the same using λexc = 285 nm. [b] Error in the measurement of area under the EuIII emission �5%.[c] Data from ref.[13a] [d] (φLn)3/(φLn)4.
Eur. J. Inorg. Chem. 2014, 3101–3113 © 2014 Wiley-VCH Verlag GmbH & Co. KGaA, Weinheim3108
of Figure 6, Table 2) using λexc = 310 and 285 nm and alsoin solid state at 298 K using λexc = 310 nm (Figure 7 inset)have been carried out. Lifetime values of the triplet statesin 3� and 4� have been measured (Table 3). The total quan-tum yield and the ratio of total quantum yield of 3� and 4�are listed in Table 4. The quantum yield ratio of 3� and 4�is found to be ca. 2.4, compared with a value of 4.6–5.2observed in 3 and 4.
2.3.6. Calculation of Sensitization Efficiency and Radiative
Lifetime of EuIII in 3 and 4
One could visualize the sensitization efficiency (ηsens) ofa rare earth complex upon excitation of the ligand by usingthe Equation (1)[13d]
φtot = ηsens φLn (1)
where φtot is the overall luminescence quantum yield, andφLn is the quantum yield of the lanthanide luminescencestep. The φtot can be readily measured from the steady-stateemission spectra. The overall luminescence quantum yield(φtot) of the complex is calculated by using Equation (2)[13d]
(φtot)u/(φtot)ref = nu2IuAref/nref
2IrefAu (2)
where nu, Iu, and Au are the refractive index, the area underthe corrected emission spectrum, and the absorbance at theexcitation wavelength, respectively, for the measured com-
www.eurjic.org FULL PAPER
plex. The nref, Iref, and Aref are the same observables as thereference sample. If the radiative lifetime, τR, is known, φLn
can be calculated from the observed luminescence lifetime(τobs) by using the following Equation (3)
φLn = kr/(kr+knr) = τobs/τR (3)
where kr and knr are the rate constants of radiative andnonradiative deactivation of EuIII emission, respectively.
In EuIII, the transitions from 5D0�7FJ (J = 0,3,5) are mag-netic dipole as well as induced electric dipole forbidden.Although the transitions 5D0�7FJ (J = 2,4,6) are purely ofinduced electric dipole nature,[13d] the 5D0�7F1 transitionis magnetic dipole allowed, without any contribution fromelectric dipole. Assuming that, both the energy of the5D0�7F1 transition and its dipole strength are constant,Verhoeven and co-workers found that the radiative lifetime(τR) of the complex is given by Equation (4)[13d]
1/τR = AMD,O n3(Itot/IMD) (4)
where n is the refractive index of the medium (solvent),AMD,O is the spontaneous emission probability for the mag-netic dipole (MD) allowed 5D0 �7F1 transition and (Itot/IMD) is the ratio of the total area of the corrected EuIII
emission spectra to the area of the 5D0 �7F1 band. Theo-retical calculation showed that the value of AMD,O is14.65 s–1.[13d] The radiative lifetime (τR) and the quantumyield of lanthanide emission (φLn) of EuIII ion in 3 and 4are calculated in all the solvents used (Table 4). For thesamples in glassy matrix and in the solid state at 77 K, wecalculated the ratio of τR for 3 and 4 by using equation (4),because n (the refractive index) is not known in these matri-ces. The overall quantum yield ratio ((φtot)3/(φtot)4) and sen-sitization efficiency ratio ((ηsens)3/(ηsens)4) in 3 and 4 havebeen presented in Table 4. In the case of TbIII analogues,radiative lifetime can be approximated as the decay timeobserved at 77 K in glassy matrix, because vibronic interac-tion with O–H oscillator is minimized at 77 K. The sensiti-zation efficiency ratio thus calculated for 3� and 4� in dif-ferent media are also listed in Table 4. It is observed that thesensitization efficiency ratio ((ηsens)3/(ηsens)4) is significantlygreater than one in all the media studied (Table 4)
2.3.7 Energy Transfer (ET) Mechanism
It is clear from Figure 6A that ET at 77 K takes placefrom the hfac– based lowest T1 state when excited at 310 nmfollowing Dexter’s Exchange Mechanism.[6c] Although wecould not detect the triplet emission in 3 and 4 at 298 K,the magnitude of the rise time observed in the transients of5D0�7F2 transition of EuIII at 298 K (Table 2) suggests thatET occurs from the triplet state rather than the singletstate.[7e,8a,8b,16a,16b] The absence of a rise time in the tran-sients of EuIII at 77 K is due to several orders of magnitudedifference in the lifetime of the triplet of hfac– (Table 3) andthat of the 5D0 state of EuIII at 77 K[6e,7a–7c,7e,16c] (Table 2).The distance between the transition metal ion center andthe EuIII center in 3 and 4 is about 3.5–3.7 Å. Since ligandL–2 is situated within 5 Å from EuIII in 3 and 4 and is con-nected through phenolic oxygen of L–2, it is possible to pre-
Eur. J. Inorg. Chem. 2014, 3101–3113 © 2014 Wiley-VCH Verlag GmbH & Co. KGaA, Weinheim3109
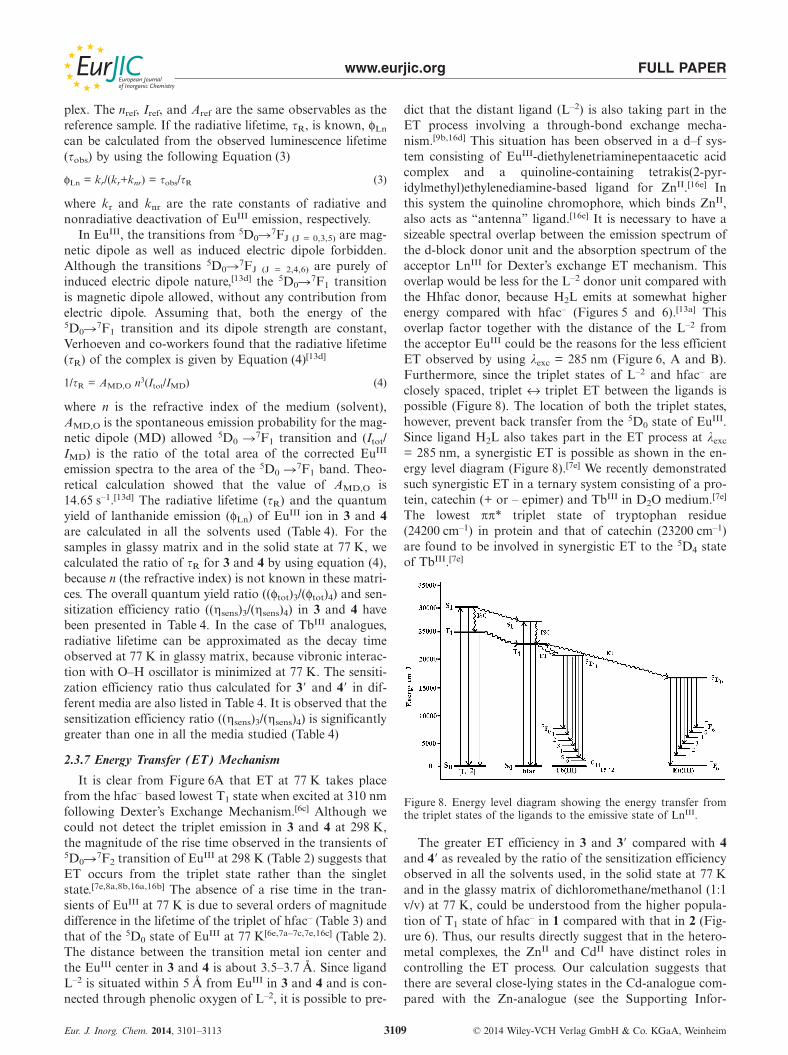
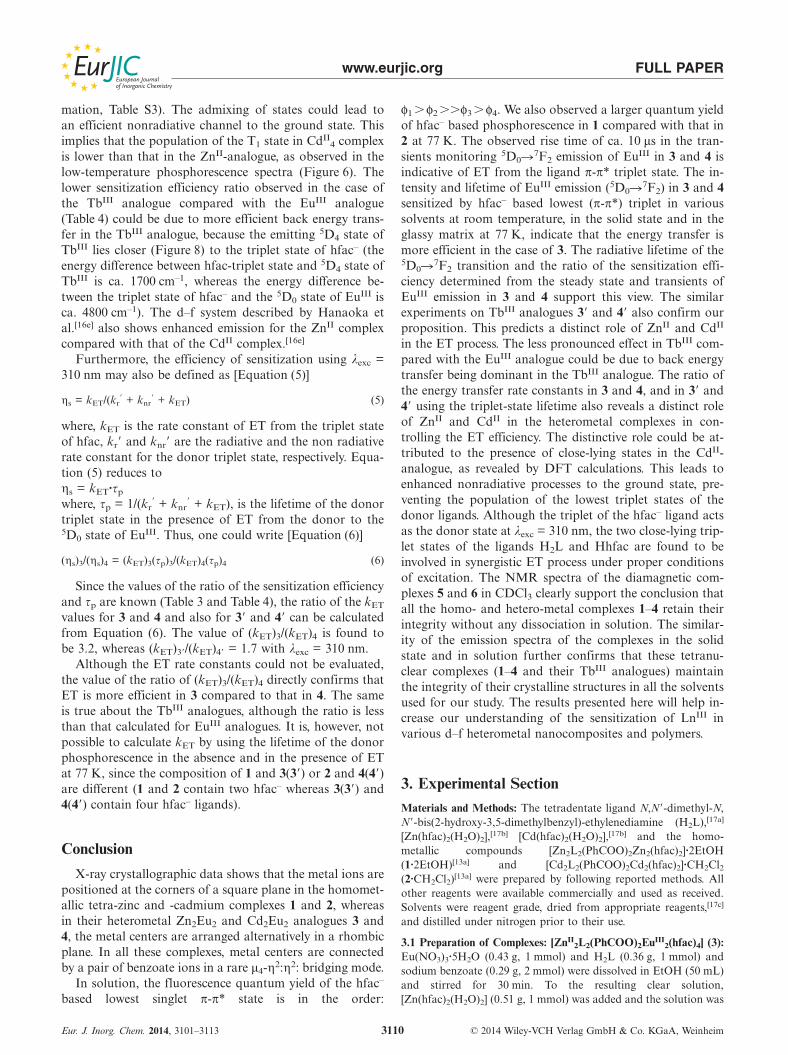
dict that the distant ligand (L–2) is also taking part in theET process involving a through-bond exchange mecha-nism.[9b,16d] This situation has been observed in a d–f sys-tem consisting of EuIII-diethylenetriaminepentaacetic acidcomplex and a quinoline-containing tetrakis(2-pyr-idylmethyl)ethylenediamine-based ligand for ZnII.[16e] Inthis system the quinoline chromophore, which binds ZnII,also acts as “antenna” ligand.[16e] It is necessary to have asizeable spectral overlap between the emission spectrum ofthe d-block donor unit and the absorption spectrum of theacceptor LnIII for Dexter’s exchange ET mechanism. Thisoverlap would be less for the L–2 donor unit compared withthe Hhfac donor, because H2L emits at somewhat higherenergy compared with hfac– (Figures 5 and 6).[13a] Thisoverlap factor together with the distance of the L–2 fromthe acceptor EuIII could be the reasons for the less efficientET observed by using λexc = 285 nm (Figure 6, A and B).Furthermore, since the triplet states of L–2 and hfac– areclosely spaced, triplet ↔ triplet ET between the ligands ispossible (Figure 8). The location of both the triplet states,however, prevent back transfer from the 5D0 state of EuIII.Since ligand H2L also takes part in the ET process at λexc
= 285 nm, a synergistic ET is possible as shown in the en-ergy level diagram (Figure 8).[7e] We recently demonstratedsuch synergistic ET in a ternary system consisting of a pro-tein, catechin (+ or – epimer) and TbIII in D2O medium.[7e]
The lowest ππ* triplet state of tryptophan residue(24200 cm–1) in protein and that of catechin (23200 cm–1)are found to be involved in synergistic ET to the 5D4 stateof TbIII.[7e]
Figure 8. Energy level diagram showing the energy transfer fromthe triplet states of the ligands to the emissive state of LnIII.
The greater ET efficiency in 3 and 3� compared with 4and 4� as revealed by the ratio of the sensitization efficiencyobserved in all the solvents used, in the solid state at 77 Kand in the glassy matrix of dichloromethane/methanol (1:1v/v) at 77 K, could be understood from the higher popula-tion of T1 state of hfac– in 1 compared with that in 2 (Fig-ure 6). Thus, our results directly suggest that in the hetero-metal complexes, the ZnII and CdII have distinct roles incontrolling the ET process. Our calculation suggests thatthere are several close-lying states in the Cd-analogue com-pared with the Zn-analogue (see the Supporting Infor-
www.eurjic.org FULL PAPER
mation, Table S3). The admixing of states could lead toan efficient nonradiative channel to the ground state. Thisimplies that the population of the T1 state in CdII
4 complexis lower than that in the ZnII-analogue, as observed in thelow-temperature phosphorescence spectra (Figure 6). Thelower sensitization efficiency ratio observed in the case ofthe TbIII analogue compared with the EuIII analogue(Table 4) could be due to more efficient back energy trans-fer in the TbIII analogue, because the emitting 5D4 state ofTbIII lies closer (Figure 8) to the triplet state of hfac– (theenergy difference between hfac-triplet state and 5D4 state ofTbIII is ca. 1700 cm–1, whereas the energy difference be-tween the triplet state of hfac– and the 5D0 state of EuIII isca. 4800 cm–1). The d–f system described by Hanaoka etal.[16e] also shows enhanced emission for the ZnII complexcompared with that of the CdII complex.[16e]
Furthermore, the efficiency of sensitization using λexc =310 nm may also be defined as [Equation (5)]
ηs = kET/(kr� + knr
� + kET) (5)
where, kET is the rate constant of ET from the triplet stateof hfac, kr� and knr� are the radiative and the non radiativerate constant for the donor triplet state, respectively. Equa-tion (5) reduces toηs = kET·τp
where, τp = 1/(kr� + knr
� + kET), is the lifetime of the donortriplet state in the presence of ET from the donor to the5D0 state of EuIII. Thus, one could write [Equation (6)]
(ηs)3/(ηs)4 = (kET)3(τp)3/(kET)4(τp)4 (6)
Since the values of the ratio of the sensitization efficiencyand τp are known (Table 3 and Table 4), the ratio of the kET
values for 3 and 4 and also for 3� and 4� can be calculatedfrom Equation (6). The value of (kET)3/(kET)4 is found tobe 3.2, whereas (kET)3�/(kET)4� = 1.7 with λexc = 310 nm.
Although the ET rate constants could not be evaluated,the value of the ratio of (kET)3/(kET)4 directly confirms thatET is more efficient in 3 compared to that in 4. The sameis true about the TbIII analogues, although the ratio is lessthan that calculated for EuIII analogues. It is, however, notpossible to calculate kET by using the lifetime of the donorphosphorescence in the absence and in the presence of ETat 77 K, since the composition of 1 and 3(3�) or 2 and 4(4�)are different (1 and 2 contain two hfac– whereas 3(3�) and4(4�) contain four hfac– ligands).
Conclusion
X-ray crystallographic data shows that the metal ions arepositioned at the corners of a square plane in the homomet-allic tetra-zinc and -cadmium complexes 1 and 2, whereasin their heterometal Zn2Eu2 and Cd2Eu2 analogues 3 and4, the metal centers are arranged alternatively in a rhombicplane. In all these complexes, metal centers are connectedby a pair of benzoate ions in a rare μ4-η2:η2: bridging mode.
In solution, the fluorescence quantum yield of the hfac–
based lowest singlet π-π* state is in the order:
Eur. J. Inorg. Chem. 2014, 3101–3113 © 2014 Wiley-VCH Verlag GmbH & Co. KGaA, Weinheim3110
φ1 �φ2 ��φ3 �φ4. We also observed a larger quantum yieldof hfac– based phosphorescence in 1 compared with that in2 at 77 K. The observed rise time of ca. 10 μs in the tran-sients monitoring 5D0�7F2 emission of EuIII in 3 and 4 isindicative of ET from the ligand π-π* triplet state. The in-tensity and lifetime of EuIII emission (5D0�7F2) in 3 and 4sensitized by hfac– based lowest (π-π*) triplet in varioussolvents at room temperature, in the solid state and in theglassy matrix at 77 K, indicate that the energy transfer ismore efficient in the case of 3. The radiative lifetime of the5D0�7F2 transition and the ratio of the sensitization effi-ciency determined from the steady state and transients ofEuIII emission in 3 and 4 support this view. The similarexperiments on TbIII analogues 3� and 4� also confirm ourproposition. This predicts a distinct role of ZnII and CdII
in the ET process. The less pronounced effect in TbIII com-pared with the EuIII analogue could be due to back energytransfer being dominant in the TbIII analogue. The ratio ofthe energy transfer rate constants in 3 and 4, and in 3� and4� using the triplet-state lifetime also reveals a distinct roleof ZnII and CdII in the heterometal complexes in con-trolling the ET efficiency. The distinctive role could be at-tributed to the presence of close-lying states in the CdII-analogue, as revealed by DFT calculations. This leads toenhanced nonradiative processes to the ground state, pre-venting the population of the lowest triplet states of thedonor ligands. Although the triplet of the hfac– ligand actsas the donor state at λexc = 310 nm, the two close-lying trip-let states of the ligands H2L and Hhfac are found to beinvolved in synergistic ET process under proper conditionsof excitation. The NMR spectra of the diamagnetic com-plexes 5 and 6 in CDCl3 clearly support the conclusion thatall the homo- and hetero-metal complexes 1–4 retain theirintegrity without any dissociation in solution. The similar-ity of the emission spectra of the complexes in the solidstate and in solution further confirms that these tetranu-clear complexes (1–4 and their TbIII analogues) maintainthe integrity of their crystalline structures in all the solventsused for our study. The results presented here will help in-crease our understanding of the sensitization of LnIII invarious d–f heterometal nanocomposites and polymers.
3. Experimental SectionMaterials and Methods: The tetradentate ligand N,N�-dimethyl-N,N�-bis(2-hydroxy-3,5-dimethylbenzyl)-ethylenediamine (H2L),[17a]
[Zn(hfac)2(H2O)2],[17b] [Cd(hfac)2(H2O)2],[17b] and the homo-metallic compounds [Zn2L2(PhCOO)2Zn2(hfac)2]·2EtOH(1·2EtOH)[13a] and [Cd2L2(PhCOO)2Cd2(hfac)2]·CH2Cl2(2·CH2Cl2)[13a] were prepared by following reported methods. Allother reagents were available commercially and used as received.Solvents were reagent grade, dried from appropriate reagents,[17c]
and distilled under nitrogen prior to their use.
3.1 Preparation of Complexes: [ZnII2L2(PhCOO)2EuIII
2(hfac)4] (3):Eu(NO3)3·5H2O (0.43 g, 1 mmol) and H2L (0.36 g, 1 mmol) andsodium benzoate (0.29 g, 2 mmol) were dissolved in EtOH (50 mL)and stirred for 30 min. To the resulting clear solution,[Zn(hfac)2(H2O)2] (0.51 g, 1 mmol) was added and the solution was
www.eurjic.org FULL PAPER
heated to reflux for 6 h during which the color of the solution be-came orange-yellow. Orange-yellow crystals were obtained in ca.4–5 d by slow evaporation of this solution at room temperature,yield 0.68 g (61%). C78H74Eu2F24N4O16Zn2: C, 42.31; H, 3.37; N,2.53; found C, 42.20; H, 3.42; N, 2.47. FTIR (KBr pellet): ν̃ =2925, 2867, 1656 (νC=O), 1596, 1550 (νasymCOO), 1523(νasymCOO), 1479, 1442, 1391 (νsymCOO), 1315, 1259 (νC–O/phe-nolate), 1215 (νC–F), 1146 (νC–F), 1097, 786, 732, 662, 580,490 cm–1.
Methods used for the preparation of other complexes[CdII
2L2(PhCOO)2EuIII2(hfac)4] (4), [ZnII
2L2(PhCOO)2LaIII2-
(hfac)4] (5), and [CdII2L2(PhCOO)2LaIII
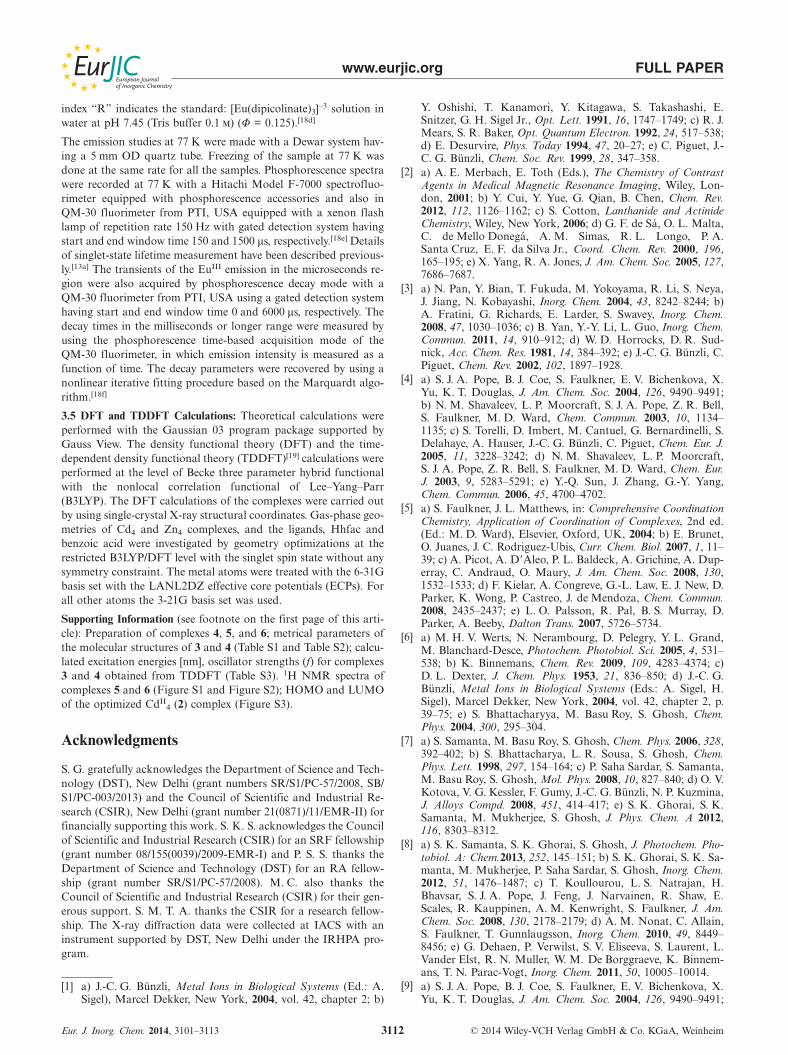
2(hfac)4] (6) are provided inthe Supporting Information. A protocol for these syntheses isshown in Scheme 1.
Scheme 1. Synthesis routes to the tetranuclear complexes 3–6.
3.2 Physical Measurements: The 1H NMR spectra were recordedwith a Bruker model Avance 400 spectrometer using SiMe4 as in-ternal reference. IR spectra of the samples prepared as KBr pelletswere recorded with a Shimadzu model 8400S FTIR spectrometer.Elemental analyses (for C, H, and N) were performed with a Per-kin–Elmer model 2400 Series II CHNS Analyzer at IACS.
3.3 X-ray Crystallography: Suitable crystals of 3 (orange-yellowblock, 0.18 � 0.15 � 0.11 mm3) and 4 (orange-yellow block,0.20 �0.16 � 0.12 mm3) were collected from the respective reactionpots and mounted on glass fibers. Intensity data for the compoundswere measured at 298(2) K with a Bruker SMART APEX II CCDdiffractometer equipped with a monochromatized Mo-Kα (λ =0.71073 Å) radiation source. No crystal decay was observed duringthe data collections. The intensity data were corrected for empiricalabsorption. In all cases, absorption corrections based on multiscansusing the SADABS software[17d] were applied.
The structures were solved by direct methods[17e] and refined onF2 by a full-matrix least-squares procedure[17e] based on all dataminimizing R = Σ||Fo| – |Fc||/Σ|Fo|, wR = {Σ[w(Fo
2 – Fc2)2]/
Σ(Fo2)2}1/2, and S = {Σ[w(Fo
2 – Fc2)2]/(n – p)}1/2. SHELXL-97 was
used for both structure solutions and refinements.[18a] A summaryof the relevant crystallographic data and the final refinement details
Eur. J. Inorg. Chem. 2014, 3101–3113 © 2014 Wiley-VCH Verlag GmbH & Co. KGaA, Weinheim3111
are given in Table 5. All non-hydrogen atoms were refined aniso-tropically. The hydrogen atoms were calculated and isotropicallyfixed in the final refinement [d(C–H) = 0.95 Å, with the isotropicthermal parameter of Uiso(H) = 1.2 Uiso(C)]. The SMART andSAINT software packages[18b] were used for data collection andreduction, respectively. Crystallographic diagrams were drawn withthe DIAMOND software package.[18c]
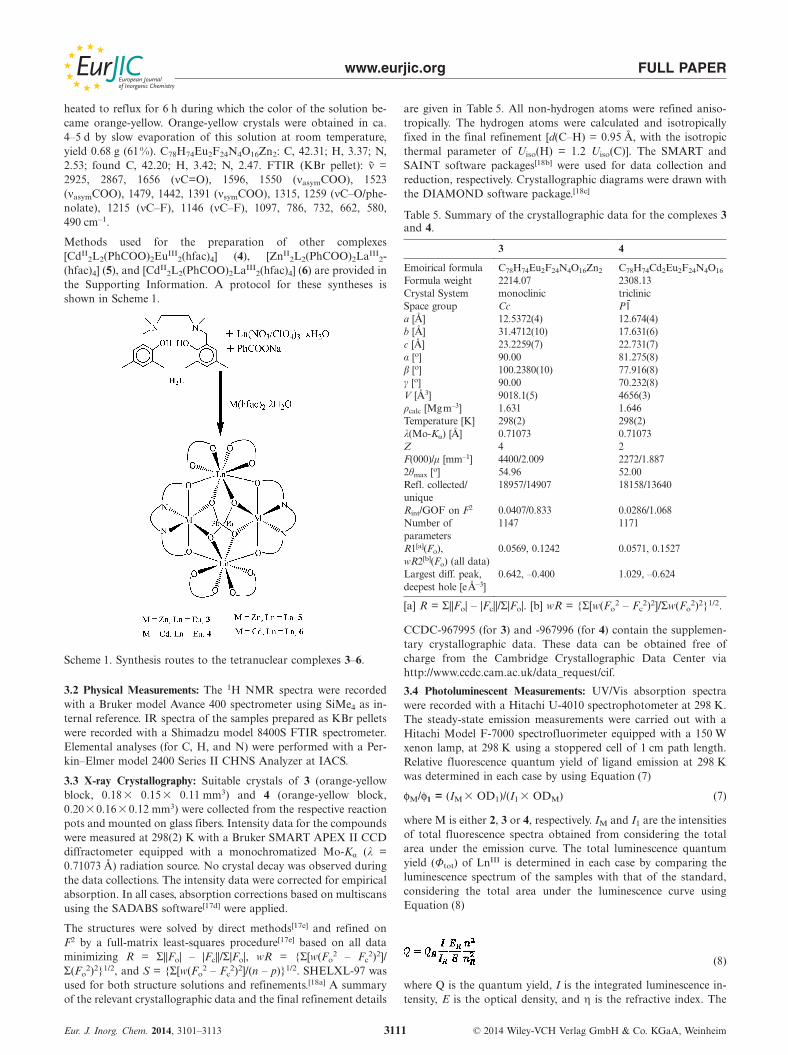
Table 5. Summary of the crystallographic data for the complexes 3and 4.
3 4
Emoirical formula C78H74Eu2F24N4O16Zn2 C78H74Cd2Eu2F24N4O16
Formula weight 2214.07 2308.13Crystal System monoclinic triclinicSpace group Cc P1̄a [Å] 12.5372(4) 12.674(4)b [Å] 31.4712(10) 17.631(6)c [Å] 23.2259(7) 22.731(7)α [ο] 90.00 81.275(8)β [ο] 100.2380(10) 77.916(8)γ [ο] 90.00 70.232(8)V [Å3] 9018.1(5) 4656(3)ρcalc [Mgm–3] 1.631 1.646Temperature [K] 298(2) 298(2)λ(Mo-Kα) [Å] 0.71073 0.71073Z 4 2F(000)/μ [mm–1] 4400/2.009 2272/1.8872θmax [ο] 54.96 52.00Refl. collected/ 18957/14907 18158/13640uniqueRint/GOF on F2 0.0407/0.833 0.0286/1.068Number of 1147 1171parametersR1[a](Fo), 0.0569, 0.1242 0.0571, 0.1527wR2[b](Fo) (all data)Largest diff. peak, 0.642, –0.400 1.029, –0.624deepest hole [eÅ–3]
[a] R = Σ||Fo| – |Fc||/Σ|Fo|. [b] wR = {Σ[w(Fo2 – Fc
2)2]/Σw(Fo2)2}1/2.
CCDC-967995 (for 3) and -967996 (for 4) contain the supplemen-tary crystallographic data. These data can be obtained free ofcharge from the Cambridge Crystallographic Data Center viahttp://www.ccdc.cam.ac.uk/data_request/cif.
3.4 Photoluminescent Measurements: UV/Vis absorption spectrawere recorded with a Hitachi U-4010 spectrophotometer at 298 K.The steady-state emission measurements were carried out with aHitachi Model F-7000 spectrofluorimeter equipped with a 150 Wxenon lamp, at 298 K using a stoppered cell of 1 cm path length.Relative fluorescence quantum yield of ligand emission at 298 Kwas determined in each case by using Equation (7)
φM/φ1 = (IM � OD1)/(I1 � ODM) (7)
where M is either 2, 3 or 4, respectively. IM and I1 are the intensitiesof total fluorescence spectra obtained from considering the totalarea under the emission curve. The total luminescence quantumyield (Φtot) of LnIII is determined in each case by comparing theluminescence spectrum of the samples with that of the standard,considering the total area under the luminescence curve usingEquation (8)
(8)
where Q is the quantum yield, I is the integrated luminescence in-tensity, E is the optical density, and η is the refractive index. The
www.eurjic.org FULL PAPER
index “R” indicates the standard: [Eu(dipicolinate)3]–3 solution inwater at pH 7.45 (Tris buffer 0.1 m) (Φ = 0.125).[18d]
The emission studies at 77 K were made with a Dewar system hav-ing a 5 mm OD quartz tube. Freezing of the sample at 77 K wasdone at the same rate for all the samples. Phosphorescence spectrawere recorded at 77 K with a Hitachi Model F-7000 spectrofluo-rimeter equipped with phosphorescence accessories and also inQM-30 fluorimeter from PTI, USA equipped with a xenon flashlamp of repetition rate 150 Hz with gated detection system havingstart and end window time 150 and 1500 μs, respectively.[18e] Detailsof singlet-state lifetime measurement have been described previous-ly.[13a] The transients of the EuIII emission in the microseconds re-gion were also acquired by phosphorescence decay mode with aQM-30 fluorimeter from PTI, USA using a gated detection systemhaving start and end window time 0 and 6000 μs, respectively. Thedecay times in the milliseconds or longer range were measured byusing the phosphorescence time-based acquisition mode of theQM-30 fluorimeter, in which emission intensity is measured as afunction of time. The decay parameters were recovered by using anonlinear iterative fitting procedure based on the Marquardt algo-rithm.[18f]
3.5 DFT and TDDFT Calculations: Theoretical calculations wereperformed with the Gaussian 03 program package supported byGauss View. The density functional theory (DFT) and the time-dependent density functional theory (TDDFT)[19] calculations wereperformed at the level of Becke three parameter hybrid functionalwith the nonlocal correlation functional of Lee–Yang–Parr(B3LYP). The DFT calculations of the complexes were carried outby using single-crystal X-ray structural coordinates. Gas-phase geo-metries of Cd4 and Zn4 complexes, and the ligands, Hhfac andbenzoic acid were investigated by geometry optimizations at therestricted B3LYP/DFT level with the singlet spin state without anysymmetry constraint. The metal atoms were treated with the 6-31Gbasis set with the LANL2DZ effective core potentials (ECPs). Forall other atoms the 3-21G basis set was used.
Supporting Information (see footnote on the first page of this arti-cle): Preparation of complexes 4, 5, and 6; metrical parameters ofthe molecular structures of 3 and 4 (Table S1 and Table S2); calcu-lated excitation energies [nm], oscillator strengths (f) for complexes3 and 4 obtained from TDDFT (Table S3). 1H NMR spectra ofcomplexes 5 and 6 (Figure S1 and Figure S2); HOMO and LUMOof the optimized CdII
4 (2) complex (Figure S3).
Acknowledgments
S. G. gratefully acknowledges the Department of Science and Tech-nology (DST), New Delhi (grant numbers SR/S1/PC-57/2008, SB/S1/PC-003/2013) and the Council of Scientific and Industrial Re-search (CSIR), New Delhi (grant number 21(0871)/11/EMR-II) forfinancially supporting this work. S. K. S. acknowledges the Councilof Scientific and Industrial Research (CSIR) for an SRF fellowship(grant number 08/155(0039)/2009-EMR-I) and P. S. S. thanks theDepartment of Science and Technology (DST) for an RA fellow-ship (grant number SR/S1/PC-57/2008). M. C. also thanks theCouncil of Scientific and Industrial Research (CSIR) for their gen-erous support. S. M. T. A. thanks the CSIR for a research fellow-ship. The X-ray diffraction data were collected at IACS with aninstrument supported by DST, New Delhi under the IRHPA pro-gram.
[1] a) J.-C. G. Bünzli, Metal Ions in Biological Systems (Ed.: A.Sigel), Marcel Dekker, New York, 2004, vol. 42, chapter 2; b)
Eur. J. Inorg. Chem. 2014, 3101–3113 © 2014 Wiley-VCH Verlag GmbH & Co. KGaA, Weinheim3112
Y. Oshishi, T. Kanamori, Y. Kitagawa, S. Takashashi, E.Snitzer, G. H. Sigel Jr., Opt. Lett. 1991, 16, 1747–1749; c) R. J.Mears, S. R. Baker, Opt. Quantum Electron. 1992, 24, 517–538;d) E. Desurvire, Phys. Today 1994, 47, 20–27; e) C. Piguet, J.-C. G. Bünzli, Chem. Soc. Rev. 1999, 28, 347–358.
[2] a) A. E. Merbach, E. Toth (Eds.), The Chemistry of ContrastAgents in Medical Magnetic Resonance Imaging, Wiley, Lon-don, 2001; b) Y. Cui, Y. Yue, G. Qian, B. Chen, Chem. Rev.2012, 112, 1126–1162; c) S. Cotton, Lanthanide and ActinideChemistry, Wiley, New York, 2006; d) G. F. de Sá, O. L. Malta,C. de Mello Donegá, A. M. Simas, R. L. Longo, P. A.Santa Cruz, E. F. da Silva Jr., Coord. Chem. Rev. 2000, 196,165–195; e) X. Yang, R. A. Jones, J. Am. Chem. Soc. 2005, 127,7686–7687.
[3] a) N. Pan, Y. Bian, T. Fukuda, M. Yokoyama, R. Li, S. Neya,J. Jiang, N. Kobayashi, Inorg. Chem. 2004, 43, 8242–8244; b)A. Fratini, G. Richards, E. Larder, S. Swavey, Inorg. Chem.2008, 47, 1030–1036; c) B. Yan, Y.-Y. Li, L. Guo, Inorg. Chem.Commun. 2011, 14, 910–912; d) W. D. Horrocks, D. R. Sud-nick, Acc. Chem. Res. 1981, 14, 384–392; e) J.-C. G. Bünzli, C.Piguet, Chem. Rev. 2002, 102, 1897–1928.
[4] a) S. J. A. Pope, B. J. Coe, S. Faulkner, E. V. Bichenkova, X.Yu, K. T. Douglas, J. Am. Chem. Soc. 2004, 126, 9490–9491;b) N. M. Shavaleev, L. P. Moorcraft, S. J. A. Pope, Z. R. Bell,S. Faulkner, M. D. Ward, Chem. Commun. 2003, 10, 1134–1135; c) S. Torelli, D. Imbert, M. Cantuel, G. Bernardinelli, S.Delahaye, A. Hauser, J.-C. G. Bünzli, C. Piguet, Chem. Eur. J.2005, 11, 3228–3242; d) N. M. Shavaleev, L. P. Moorcraft,S. J. A. Pope, Z. R. Bell, S. Faulkner, M. D. Ward, Chem. Eur.J. 2003, 9, 5283–5291; e) Y.-Q. Sun, J. Zhang, G.-Y. Yang,Chem. Commun. 2006, 45, 4700–4702.
[5] a) S. Faulkner, J. L. Matthews, in: Comprehensive CoordinationChemistry, Application of Coordination of Complexes, 2nd ed.(Ed.: M. D. Ward), Elsevier, Oxford, UK, 2004; b) E. Brunet,O. Juanes, J. C. Rodriguez-Ubis, Curr. Chem. Biol. 2007, 1, 11–39; c) A. Picot, A. D�Aleo, P. L. Baldeck, A. Grichine, A. Dup-erray, C. Andraud, O. Maury, J. Am. Chem. Soc. 2008, 130,1532–1533; d) F. Kielar, A. Congreve, G.-L. Law, E. J. New, D.Parker, K. Wong, P. Castreo, J. de Mendoza, Chem. Commun.2008, 2435–2437; e) L. O. Palsson, R. Pal, B. S. Murray, D.Parker, A. Beeby, Dalton Trans. 2007, 5726–5734.
[6] a) M. H. V. Werts, N. Nerambourg, D. Pelegry, Y. L. Grand,M. Blanchard-Desce, Photochem. Photobiol. Sci. 2005, 4, 531–538; b) K. Binnemans, Chem. Rev. 2009, 109, 4283–4374; c)D. L. Dexter, J. Chem. Phys. 1953, 21, 836–850; d) J.-C. G.Bünzli, Metal Ions in Biological Systems (Eds.: A. Sigel, H.Sigel), Marcel Dekker, New York, 2004, vol. 42, chapter 2, p.39–75; e) S. Bhattacharyya, M. Basu Roy, S. Ghosh, Chem.Phys. 2004, 300, 295–304.
[7] a) S. Samanta, M. Basu Roy, S. Ghosh, Chem. Phys. 2006, 328,392–402; b) S. Bhattacharya, L. R. Sousa, S. Ghosh, Chem.Phys. Lett. 1998, 297, 154–164; c) P. Saha Sardar, S. Samanta,M. Basu Roy, S. Ghosh, Mol. Phys. 2008, 10, 827–840; d) O. V.Kotova, V. G. Kessler, F. Gumy, J.-C. G. Bünzli, N. P. Kuzmina,J. Alloys Compd. 2008, 451, 414–417; e) S. K. Ghorai, S. K.Samanta, M. Mukherjee, S. Ghosh, J. Phys. Chem. A 2012,116, 8303–8312.
[8] a) S. K. Samanta, S. K. Ghorai, S. Ghosh, J. Photochem. Pho-tobiol. A: Chem.2013, 252, 145–151; b) S. K. Ghorai, S. K. Sa-manta, M. Mukherjee, P. Saha Sardar, S. Ghosh, Inorg. Chem.2012, 51, 1476–1487; c) T. Koullourou, L. S. Natrajan, H.Bhavsar, S. J. A. Pope, J. Feng, J. Narvainen, R. Shaw, E.Scales, R. Kauppinen, A. M. Kenwright, S. Faulkner, J. Am.Chem. Soc. 2008, 130, 2178–2179; d) A. M. Nonat, C. Allain,S. Faulkner, T. Gunnlaugsson, Inorg. Chem. 2010, 49, 8449–8456; e) G. Dehaen, P. Verwilst, S. V. Eliseeva, S. Laurent, L.Vander Elst, R. N. Muller, W. M. De Borggraeve, K. Binnem-ans, T. N. Parac-Vogt, Inorg. Chem. 2011, 50, 10005–10014.
[9] a) S. J. A. Pope, B. J. Coe, S. Faulkner, E. V. Bichenkova, X.Yu, K. T. Douglas, J. Am. Chem. Soc. 2004, 126, 9490–9491;
www.eurjic.org FULL PAPER
b) T. Lazarides, N. M. Tart, D. Sykes, S. Faulkner, A. Barbieri,M. D. Ward, Dalton Trans. 2009, 3971–3979; c) J.-M. Herrera,S. J. A. Pope, H. Adams, S. Faulkner, M. D. Ward, Inorg.Chem. 2006, 45, 3895–3904; d) T. Lazarides, D. Sykes, S. Faulk-ner, A. Barbieri, M. D. Ward, Chem. Eur. J. 2008, 14, 9389–9399; e) K. Sénéchal-David, S. J. A. Pope, S. Quinn, S. Faulk-ner, T. Gunnlaugsson, Inorg. Chem. 2006, 45, 10040–10042.
[10] a) D. Sykes, I. S. Tidmarsh, A. Barbieri, I. V. Sazanovich, J. A.Weinstein, M. D. Ward, Inorg. Chem. 2011, 50, 11323–11339;b) W. Jiang, B. Lou, J. Wang, H. Lv, Z. Bian, C. Huanga,Dalton Trans. 2011, 40, 11410–11418; c) S. Shinoda, A. Mizote,M. E. Masaki, M. Yoneda, H. Miyake, H. Tsukube, Inorg.Chem. 2011, 50, 5876–5878; d) L. Li, G. Peng, L. Ma, S. Lin,D. Hong, L. Hong, L. Weishan, Cryst. Growth Des. 2012, 12,1151–1158; e) H.-B. Xu, Z.-N. Chen, Inorg. Chem. Commun.2011, 14, 1609–1611.
[11] a) S.-M. Li, X.-J. Zheng, D.-Q. Yuan, A. Ablet, L.-P. Jin, Inorg.Chem. 2012, 51, 1201–1203; b) G. Liu, J. Rare Earths 2012, 30,716–720; c) L. Charbonniere, S. Faulkner, C. Platas-Iglesias,M. Regueiro-Figueroa, A. Nonat, T. Rodríguez-Blas, A.de Blas, W. S. Perry, M. Tropiano, Dalton Trans. 2013, 42,3667–3681; d) H. L. C. Feltham, F. Klöwer, S. A. Cameron,D. S. Larsen, Y. Lan, M. Tropiano, S. Faulkner, A. K. Powell,S. Brooker, Dalton Trans. 2011, 40, 11425–11432; e) W. S. Perry,S. J. A. Pope, C. Allain, B. J. Coe, A. M. Kenwright, S. Faulk-ner, Dalton Trans. 2010, 39, 10974–10983.
[12] a) A. Ablet, S.-M. Li, W. Cao, X.-J. Zheng, W.-T. Wong, L.-P.Jin, Chem. Asian J. 2013, 8, 95–100; b) Y. Q. Sun, J. Zhang,G. Y. Yang, Chem. Commun. 2006, 4700–4702; c) S.-M. Li, X.-J. Zheng, D.-Q. Yuan, A. Ablet, L.-P. Jin, Inorg. Chem. 2012,51, 1201–1203; d) X.-P. Zhang, D.-G. Wang, Y. Su, H.-R. Tian,J.-J. Lin, Y.-L. Feng, J.-W. Cheng, Dalton Trans. 2013, 42,10384–10387; e) H. Yang, F. Wang, Y.-X. Tan, Y. Kang, T.-H.Li, J. Zhang, Chem. Asian J. 2012, 7, 1069–1073; f) Q. Liu, S.-Z. Ge, J.-C. Zhong, Y.-Q. Sun, Y.-P. Chen, Dalton Trans. 2013,42, 6314–6317.
[13] a) S. M. T. Abtab, A. Audhya, N. Kundu, S. K. Samanta, P.Saha Sardar, R. J. Butcher, S. Ghosh, M. Chaudhury, DaltonTrans. 2013, 42, 1848–1861; b) C. Chandler, G. D. Fallon, B. O.West, J. Chem. Soc., Chem. Commun. 1990, 1063–1064; c) M.Mikuriya, K. Tanaka, N. Inoue, D. Yoshioka, J.-W. Lim,Chem. Lett. 2003, 32, 126–127; d) M. H. V. Werts, R. T. F.Jukes, J. W. Verhoeven, Phys. Chem. Chem. Phys. 2002, 4,1542–1548; e) Z.-Q. Xia, Q. Wei, S.-P. Chen, X.-M. Feng, G.Xie, C.-F. Qiao, G.-C. Zhang, S. L. Gao, J. Solid State Chem.2013, 197, 489–498.
[14] a) S. Akine, F. Utsuno, T. Nabeshima, IOP Conf. Ser.: Mater.Sci. Eng. 2009, 1, DOI:10.1088/1757-8981/1/1/012009; b) Y.-F.Shao, B. Yan, Z.-Y. Jiang, RSC Adv. 2012, 2, 9192–9200; c)G. Peng, L. Ma, L. Liang, Y. Ma, C. Y. H. Deng, Cryst. Eng.Commun. 2013, 15, 922–930; d) Z.-G. Gu, H.-C. Fang, P.-Y.Yin, L. Tong, Y. Ying, S.-J. Hu, W. S. Li, Y.-P. Cai, Cryst.Growth Des. 2011, 11, 2220–2227; e) D. Wang, G. Xing, M.Gao, L. Yang, J. Yang, T. Wu, J. Phys. Chem. C 2011, 115,22729–22735.
[15] a) L. P. Reynaldo, J. J. Villafranca, W. D. Horrocks Jr., ProteinSci. 1996, 5, 2532–2544; b) S. E. Burroughs, W. D. Hor-rocks Jr., H. Ren, C. B. Klee, Biochemistry 1994, 33, 10428–10436; c) W. D. Horrocks, D. R. Sudnick, Acc. Chem. Res.
Eur. J. Inorg. Chem. 2014, 3101–3113 © 2014 Wiley-VCH Verlag GmbH & Co. KGaA, Weinheim3113
1981, 14, 384–392; d) S. V. Eliseeva, O. V. Kotova, V. G. Kessler,F. Gumyc, J.-C. G. Bünzli, N. P. Kuzmina, J. Alloys Compd.2008, 451, 414–417.
[16] a) S. Ghosh, A. Misra, A. Ozarowski, A. H. Maki, J. Phys.Chem. B 2003, 107, 11520–11526; b) B. D. Schlyer, D. G. Steel,A. Gafni, J. Biol. Chem. 1995, 270, 22890–22894; c) M. Mukh-erjee, P. Saha Sardar, S. K. Ghorai, S. K. Samanta, A.Singha Roy, S. Dasgupta, S. Ghosh, J. Photochem. Photobiol.B: Biology 2012, 115, 93–104; d) W. R. Kirk, W. S. Wessels,F. G. Prendergast, J. Phys. Chem. 1993, 97, 10326–10340; e) K.Hanaoka, K. Kikuchi, H. Kojima, Y. Urano, T. Nagano, J.Am. Chem. Soc. 2004, 126, 12470–12476.
[17] a) P. Mialane, A. Mallart, G. Blondin, A. Nivorojkine, J. Gu-ilhem, L. Tchertanova, M. Cesario, N. Ravi, E. Bominaar, J.Girerd, E. Munck, Inorg. Chim. Acta 1997, 263, 367–368; b)S. C. Chattoraj, A. G. Cupka, R. E. Sievers, J. Inorg. Nucl.Chem. 1966, 28, 1937–1943; c) D. D. Perrin, W. L. F. Armar-ego, D. R. Perrin, Purification of Laboratory Chemicals, 2nded., Pergamon, Oxford, UK, 1980; d) SADABS, version 2.03,Bruker AXS Inc., Madison, WI, 2002; e) G. M. Sheldrick, ActaCrystallogr., Sect. A 1990, 46, 467–473.
[18] a) G. M. Sheldrick, SHELXL-97, Program for Crystal Struc-ture Refinements: University of Göttingen, Germany, 1996; b)SAINT, version 6.02, Bruker AXS Inc., Madison, WI, 2002;c) DIAMOND, Visual Crystal Structure Information System,version 3.1; CRYSTAL IMPACT, Bonn, Germany, 2004; d) A.-S. Chauvin, F. Gumy, D. Imbert, J.-C. G. Bunzli, Spectrosc.Lett. 2004, 37, 517–532; e) FELIX GX, Operation Manual, ver-sion 2.0.1, Photon Technology International, Inc., NJ, 2003;f) P. R. Bevington, Data Reduction and Error Analysis for thePhysical Sciences, McGraw Hill, New York, 1969, pp. 235–237.
[19] a) M. J. Frisch, G. W. Trucks, H. B. Schlegel, G. E. Scuseria,M. A. Robb, J. R. Cheeseman, J. A. Montgomery Jr., T.Vreven, K. N. Kudin, J. C. Burant, J. M. Millam, S. S. Iyengar,J. Tomasi, V. Barone, B. Mennucci, M. Cossi, G. Scalmani, N.Rega, G. A. Petersson, H. Nakatsuji, M. Hada, M. Ehara, K.Toyota, R. Fukuda, J. Hasegawa, M. Ishida, T. Nakajima, Y.Honda, O. Kitao, H. Nakai, M. Klene, X. Li, J. E. Knox, H. P.Hratchian, J. B. Cross, V. Bakken, C. Adamo, J. Jaramillo, R.Gomperts, R. E. Stratmann, O. Yazyev, A. J. Austin, R.Cammi, C. Pomelli, J. W. Ochterski, P. Y. Ayala, K. Morok-uma, G. A. Voth, P. Salvador, J. J. Dannenberg, V. G. Zakrzew-ski, S. Dapprich, A. D. Daniels, M. C. Strain, O. Farkas, D. K.Malick, A. D. Rabuck, K. Raghavachari, J. B. Foresman, J. V.Ortiz, Q. Cui, A. G. Baboul, S. Clifford, J. Cioslowski, B. B.Stefanov, G. Liu, A. Liashenko, P. Piskorz, I. Komaromi, R. L.Martin, D. J. Fox, T. Keith, M. A. Al-Laham, C. Y. Peng, A.Nanayakkara, M. Challacombe, P. M. W. Gill, B. Johnson, W.Chen, M. W. Wong, C. Gonzalez, J. A. Pople, Gaussian 03, re-vision C.02, Gaussian, Inc., Wallingford CT, 2004; b) W. J.Hehre, R. Ditchfield, J. A. Pople, J. Chem. Phys. 1972, 56,2257–2261; c) A. D. Becke, J. Chem. Phys. 1993, 98, 5648–5652;d) C. Lee, W. Yang, R. G. Parr, Phys. Rev. B 1988, 37, 785–789; e) J. S. Binkley, J. A. Pople, W. J. Hehre, J. Am. Chem. Soc.1980, 102, 939–947; f) K. D. Dobbs, W. J. Hehre, J. Comput.Chem. 1987, 8, 861–879; g) E. Runge, E. K. U. Gross, Phys.Rev. Lett. 1984, 52, 997–1000.
Received: April 4, 2014Published Online: June 3, 2014