pacing-induced heterogeneities in intracellular ca2+ signaling, cardiac alternans, and ventricular...
TRANSCRIPT

H. Kadish and J. Andrew WasserstromGary L. Aistrup, James E. Kelly, Sunil Kapur, Michael Kowalczyk, Inbal Sysman-Wolpin, Alan
Ventricular Arrhythmias in Intact Rat Heart Signaling, Cardiac Alternans, and2+Pacing-induced Heterogeneities in Intracellular Ca
Print ISSN: 0009-7330. Online ISSN: 1524-4571 Copyright © 2006 American Heart Association, Inc. All rights reserved.is published by the American Heart Association, 7272 Greenville Avenue, Dallas, TX 75231Circulation Research
doi: 10.1161/01.RES.0000244087.36230.bf2006;99:E65-E73; originally published online September 7, 2006;Circ Res.
http://circres.ahajournals.org/content/99/7/E65World Wide Web at:
The online version of this article, along with updated information and services, is located on the
http://circres.ahajournals.org/content/suppl/2006/09/07/01.RES.0000244087.36230.bf.DC1.htmlData Supplement (unedited) at:
http://circres.ahajournals.org//subscriptions/
is online at: Circulation Research Information about subscribing to Subscriptions:
http://www.lww.com/reprints Information about reprints can be found online at: Reprints:
document. Permissions and Rights Question and Answer about this process is available in the
located, click Request Permissions in the middle column of the Web page under Services. Further informationEditorial Office. Once the online version of the published article for which permission is being requested is
can be obtained via RightsLink, a service of the Copyright Clearance Center, not theCirculation Researchin Requests for permissions to reproduce figures, tables, or portions of articles originally publishedPermissions:
at Galter Health Sciences Library on October 30, 2014http://circres.ahajournals.org/Downloaded from at Galter Health Sciences Library on October 30, 2014http://circres.ahajournals.org/Downloaded from at Galter Health Sciences Library on October 30, 2014http://circres.ahajournals.org/Downloaded from at Galter Health Sciences Library on October 30, 2014http://circres.ahajournals.org/Downloaded from at Galter Health Sciences Library on October 30, 2014http://circres.ahajournals.org/Downloaded from at Galter Health Sciences Library on October 30, 2014http://circres.ahajournals.org/Downloaded from at Galter Health Sciences Library on October 30, 2014http://circres.ahajournals.org/Downloaded from at Galter Health Sciences Library on October 30, 2014http://circres.ahajournals.org/Downloaded from at Galter Health Sciences Library on October 30, 2014http://circres.ahajournals.org/Downloaded from at Galter Health Sciences Library on October 30, 2014http://circres.ahajournals.org/Downloaded from

Pacing-induced Heterogeneities in Intracellular Ca2�
Signaling, Cardiac Alternans, and Ventricular Arrhythmiasin Intact Rat Heart
Gary L. Aistrup, James E. Kelly, Sunil Kapur, Michael Kowalczyk, Inbal Sysman-Wolpin,Alan H. Kadish, J. Andrew Wasserstrom
Abstract—Optical mapping studies have suggested that intracellular Ca2� and T-wave alternans are linked throughunderlying alternations in Ca2� cycling-inducing oscillations in action potential duration through Ca2�-sensitiveconductances. However, these studies cannot measure single-cell behavior; therefore, the Ca2� cycling heterogeneitieswithin microscopic ventricular regions are unknown. The goal of this study was to measure cellular activity in intactmyocardium during rapid pacing and arrhythmias. We used single-photon laser-scanning confocal microscopy tomeasure Ca2� signaling in individual myocytes of intact rat myocardium during rapid pacing and during pacing-inducedventricular arrhythmias. At low rates, all myocytes demonstrate Ca2� alternans that is synchronized but whosemagnitude varies depending on recovery kinetics of Ca2� cycling for each individual myocyte. As rate increases, somecells reverse alternans phase, giving a dyssynchronous activation pattern, even in adjoining myocytes. Increased pacingrate also induces subcellular alternans where Ca2� alternates out of phase with different regions within the same cell.These forms of heterogeneous Ca2� signaling also occurred during pacing-induced ventricular tachycardia. Our resultsdemonstrate highly nonuniform Ca2� signaling among and within individual myocytes in intact heart during rapid pacingand arrhythmias. Thus, certain pathophysiological conditions that alter Ca2� cycling kinetics, such as heart failure, mightpromote ventricular arrhythmias by exaggerating these cellular heterogeneities in Ca2� signaling. (Circ Res.2006;99:e65-e73.)
Key Words: calcium transients � calcium alternans � subcellular alternans � arrhythmias
One of the most important clues to the mechanismsresponsible for repolarization alternans was derived
from the fact that action potential duration (APD) alternansoccurs at the cellular level in intact heart.1–3 It is now widelyaccepted that T-wave alternans (TWA) on the surface ECGreflects tissue repolarization alternans at the level of thewhole heart. In contrast to a purely electrophysiologicalexplanation involving ion channel kinetics,4,5 evidence sug-gests that APD and T-wave alternans are in fact associatedwith changes in intracellular Ca2� dynamics.2,5–7 The linkbetween alternations in intracellular Ca2� dynamics and TWAhas recently been summarized2 as possibly arising fromunderlying alternans in Ca2� cycling. Intracellular Ca2� re-lease enters into an alternating pattern based on the balancebetween the dynamics of Ca2� release, reuptake, and recoveryrates that induce oscillations in APD as a result of Ca2�-sensitive conductances. Theoretically, a large contractionoccurs as the result of a large release of Ca2� from stores inthe sarcoplasmic reticulum (SR), which would in turn cause a
large inward Na/Ca exchange current (INCX) and a long APD.Because the large SR Ca2� release would have the effect oftemporary depletion of SR Ca2� content, the next beat wouldactivate a small Ca2� release with a resulting small contrac-tion and a small inward INCX contributing little to APD, whichwould then be short. Other Ca2�-sensitive currents may alsobe activated that could either prolong or abbreviate APD,depending on transmembrane potential and whether or notthey are present in a given species and tissue type.6
The spatial organization of repolarization alternans hasprimarily been studied using optical mapping of voltage- andCa2�-sensitive dyes.3,8–10 Despite its advantages in allowingsimultaneous study of electrical activation across the entireleft ventricle (LV), the low signal-to-noise ratio of these dyesrequires that each detector element records from hundreds tothousands of cells. The result is that cardiac activity cannot bemeasured at the cellular level, and consequently the hetero-geneities that might exist between cells will be missed. Ifthere are in fact disparities in Ca2� signaling in neighboring
Original received May 5, 2006; resubmission received July 17, 2006; revised resubmission received August 15, 2006; accepted August 24, 2006.From the Departments of Molecular Pharmacology (G.L.A., J.A.W.), Biological Chemistry (G.L.A., J.A.W.), and Medicine (Division of Cardiology)
(J.E.K., S.K., M.K., I.S.-W., A.H.K., J.A.W.) and The Feinberg Cardiovascular Research Institute (A.H.K., J.A.W.), Northwestern University FeinbergSchool of Medicine, Chicago, Ill.
Correspondence to J. Andrew Wasserstrom, Division of Cardiology (S203) Ward 3-105, 303 E Chicago Ave, Chicago, IL 60611. [email protected]
© 2006 American Heart Association, Inc.
Circulation Research is available at http://circres.ahajournals.org DOI: 10.1161/01.RES.0000244087.36230.bf
e65
UltraRapid Communication
at Galter Health Sciences Library on October 30, 2014http://circres.ahajournals.org/Downloaded from

cardiac myocytes, this type of behavior will be of consider-able importance because it is likely to contribute to electricalnonuniformities in small ventricular regions or even singlecells, thus setting the stage for arrhythmias. However, thepatterns of cellular Ca2� release in LV have not beeninvestigated; therefore, the development of Ca2� cyclingheterogeneities within microscopic regions of ventricle arenot yet known. Their existence could provide further evi-dence that the substrate for arrhythmias might be present asan inherent property of the normal cell-to-cell variation inCa2� dynamics that is altered by increased rate. The goal ofthis study was to measure characteristics of Ca2� signaling inindividual myocytes in intact ventricle that could contributeto the development of pacing-induced alternans and resultingarrhythmogenesis.
Materials and MethodsThe methods used in this study involve modifications of Langendorffperfusion of intact rat heart, first loaded with the Ca2�-sensitivefluorescent dye fluo-4/acetoxymethyl ester (fluo-4AM), then para-lyzed with cytochalasin D. Ca2� transients were subsequently mea-sured in individual myocytes on the left ventricular subepicardiumusing single-photon laser-scanning confocal microscopy. Becausethe details of our approach have not been described previously, wehave included an extensive section in the online data supplementdescribing how these experiments were performed and analyzed.
ResultsDevelopment of Synchronous AlternansFigure 1A shows the region of the LV from which recordingswere typically made, a 2D fluorescence intensity image of theleft ventricular surface (Figure 1B) and the corresponding
line-scan image (Figure 1C) from which high-resolutionrecordings of intracellular Ca2� concentration were made.The square in Figure 1A indicates a typical recording site onthe LV. Figure 1B shows an X-Y confocal frame-scan imageof the cardiac surface with myocytes oriented in long bundles.The regions of bright fluorescence indicate the time andposition of SR Ca2� release transients during stimulationduring the nearly 3 seconds required to construct this image.
To measure Ca2� transients simultaneously in a number ofmyocytes with high temporal and spatial resolution, the scanline was placed across 14 cardiac myocytes on the leftventricular epicardial surface (white arrow in Figure 1B). TheX-t line-scan image to the right of the frame-scan (Figure 1C)shows how cytoplasmic Ca2� transients are measured inindividual myocytes. The location of each myocyte is indi-cated by the green horizontal lines (Figure 1B) duringrepetitive scanning along the line shown in Figure 1C. Theaverage fluorescence for each scan from all cells is indicatedin the intensity profile above and shows typical fluorescenceintensity data, with the brightest intensity occurring at peaksystole, followed by a fall in intensity during Ca2� removalfor the cytoplasm.
The normal behavior of cardiac myocytes at basal pacingrates (at BCL [basic cycle length]�500 ms) is shown inFigure 2A. This line-scan image shows 2 responses at thebasal rate followed by a 10-second test train at BCL�260 ms,followed by the first response back at basal pacing. The lastbasal beat is followed by smaller transients in all myocytesand the ensuing test train demonstrates nominally uniformCa2� alternans in a large–small–large–small sequence untilrapid pacing ends. Nearly all cells show some degree ofalternans; however, there is a great degree of heterogeneity inthe responses of individual myocytes. Figure 2B shows anexpanded view of the last 4 rapid pacing beats and the firstafter return to basal rate. The variability in steady-statealternans magnitude from cell to cell is apparent in theprofiles of 4 cells selected, ranging from nearly completealternans (cells 2 and 12) to none at all (cell 5). All cells inalternans are in the same phase, demonstrating behaviortermed “synchronous alternans.” This form of alternansoccurs over a range of BCLs such that the alternans ratio(AR�1�S/L, based on Ca2� transient peak amplitude; whereS indicates short and small transient and L, large and longtransient) increases with decreasing BCL for each cell (Figure2C). However, the BCL at which each cell develops alternansis variable, suggesting that the susceptibility to alternansonset differs between myocytes.
The relationship between BCL and AR for each cell wasfitted to a sigmoid and the threshold cycle length (effectivecycle length at AR�0.20 [ECL20]) and the midpoint (ECL50)were calculated as demonstrated in Figure 3A. To determinewhich characteristics of Ca2� transients might predict sensi-tivity of each cell to alternans development, the values forECL20 and ECL50 were plotted as a function of a number ofproperties of the Ca2� transients at the basal rate of 500 ms(Figure 3B through 3E). The only reliable predictors ofvulnerability to alternans were related to transient duration(Figure 3B) and Ca2� reuptake rate, as indicated by thetransient decay time (Figure 3C). In contrast, there was no
Figure 1. Procedure for recording frame-scan (X-Y) and corre-sponding line-scan (X-t) images on the subepicardial region ofintact rat LV. A, Photograph of rat LV indicating a typical re-cording site. B, X-Y frame-scan of epicardial myocytes 1 to 2cell layers beneath surface of myocardium showing fluo-4 fluo-rescence of Ca2� transients; bright corresponds to systole, darkcorresponds to diastole. C, X-t line-scan image acquired withthe line placed across the 14 cells as indicated by the whitearrow on B. Each myocyte in B is indicated in C with a greenhorizontal line. The blue horizontal line indicates a particularlybright region of a capillary, which provides a landmark for relat-ing line-scan to frame-scan images. The 2 Ca2� transients rec-orded in C show simultaneous activation of all 14 myocytes inthe image (labeled cells 1 to 14) and a typical intensity profilefor average fluorescence (above).
e66 Circulation Research September 29, 2006
at Galter Health Sciences Library on October 30, 2014http://circres.ahajournals.org/Downloaded from
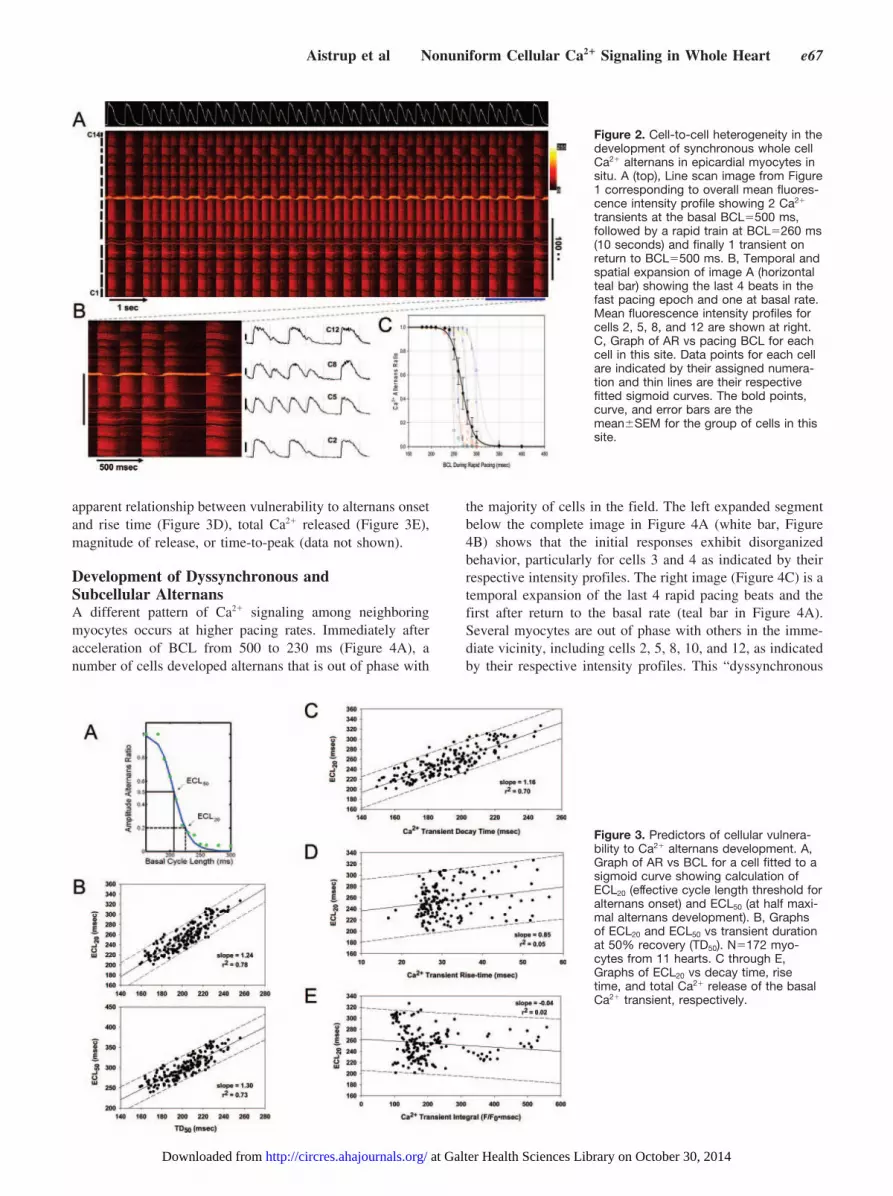
apparent relationship between vulnerability to alternans onsetand rise time (Figure 3D), total Ca2� released (Figure 3E),magnitude of release, or time-to-peak (data not shown).
Development of Dyssynchronous andSubcellular AlternansA different pattern of Ca2� signaling among neighboringmyocytes occurs at higher pacing rates. Immediately afteracceleration of BCL from 500 to 230 ms (Figure 4A), anumber of cells developed alternans that is out of phase with
the majority of cells in the field. The left expanded segmentbelow the complete image in Figure 4A (white bar, Figure4B) shows that the initial responses exhibit disorganizedbehavior, particularly for cells 3 and 4 as indicated by theirrespective intensity profiles. The right image (Figure 4C) is atemporal expansion of the last 4 rapid pacing beats and thefirst after return to the basal rate (teal bar in Figure 4A).Several myocytes are out of phase with others in the imme-diate vicinity, including cells 2, 5, 8, 10, and 12, as indicatedby their respective intensity profiles. This “dyssynchronous
Figure 2. Cell-to-cell heterogeneity in thedevelopment of synchronous whole cellCa2� alternans in epicardial myocytes insitu. A (top), Line scan image from Figure1 corresponding to overall mean fluores-cence intensity profile showing 2 Ca2�
transients at the basal BCL�500 ms,followed by a rapid train at BCL�260 ms(10 seconds) and finally 1 transient onreturn to BCL�500 ms. B, Temporal andspatial expansion of image A (horizontalteal bar) showing the last 4 beats in thefast pacing epoch and one at basal rate.Mean fluorescence intensity profiles forcells 2, 5, 8, and 12 are shown at right.C, Graph of AR vs pacing BCL for eachcell in this site. Data points for each cellare indicated by their assigned numera-tion and thin lines are their respectivefitted sigmoid curves. The bold points,curve, and error bars are themean�SEM for the group of cells in thissite.
Figure 3. Predictors of cellular vulnera-bility to Ca2� alternans development. A,Graph of AR vs BCL for a cell fitted to asigmoid curve showing calculation ofECL20 (effective cycle length threshold foralternans onset) and ECL50 (at half maxi-mal alternans development). B, Graphsof ECL20 and ECL50 vs transient durationat 50% recovery (TD50). N�172 myo-cytes from 11 hearts. C through E,Graphs of ECL20 vs decay time, risetime, and total Ca2� release of the basalCa2� transient, respectively.
Aistrup et al Nonuniform Cellular Ca2� Signaling in Whole Heart e67
at Galter Health Sciences Library on October 30, 2014http://circres.ahajournals.org/Downloaded from

alternans” may remain stable for the duration of the test trainor may last only for several beats and become synchronouswith surrounding myocytes. However, note that myocytesboth distant from one another and immediately adjoining maydemonstrate dyssynchrony.
Dyssynchrony among myocytes on the LV occurred withan overall incidence of 21% (119/575 myocytes in 31 sitesfrom 18 hearts). These results demonstrate the very highdegree of microscopic heterogeneity in Ca2� cycling thatoccurs in a rate-dependent manner.
The recording in Figure 4B is a temporal and spatialexpansion of cells 3 and 4 in the left lower image of Figure4A (teal bar) and demonstrates a third distinct form of Ca2�
signaling that is evident in several cells in this image. Underthese conditions, Ca2� release also varies in different regionswithin both cells 3 and 4 during several cycles of rapidpacing. For example, during the forth cycle of the imageshown in Figure 4D, the top parts of cells 3 and 4 show littleCa2� release, whereas the bottom part shows prominentrelease. The opposite pattern of release then occurs in the fifthcycle. However, the spatial and temporal pattern of hetero-geneous intracellular Ca2� release changes throughout rapidpacing (Figure 4A). This intracellular alternans pattern illus-
trates a phenomenon known as “subcellular alternans.”11–13
This figure demonstrates that the same conditions that pro-mote dyssynchronous Ca2� release between different myo-cytes simultaneously promotes heterogeneities in Ca2� re-lease within individual myocytes.
Subcellular Alternans in Intact EpicardiumTo investigate subcellular alternans within individual myo-cytes of intact LV, we recorded line-scan images along thelongitudinal axis of individual myocytes in the left ventricularepicardium (Figure 5). This approach allowed high spatialand temporal resolution Ca2� imaging along myocyte lengthduring stimulation. In addition, these hearts were stained withdi-8-ANEPPS to outline the cell membranes, so that cell endscould be located during positioning of the line and duringanalysis. Figure 5A shows a 2D image of a single celloutlined by di-8-ANEPPS staining. The fluorescence inten-sity was high in this image because systole occurred duringrecording. The white box shows the cell outline, with thebrightest portions appearing as lines along the cell ends(yellow). The scan line was placed from end to end (blue line,Figure 5B) as indicated by the dashed arrows showing therecording site. The top line-scan image in Figure 5C illus-
Figure 4. Development of dyssynchro-nous Ca2� alternans and subcellular Ca2�
alternans during rapid pacing. A, Line-scan image of same experiment showingthree Ca2� transients at basal rate(BCL�500 ms), followed by a train atBCL�210 ms, then a return to basal. B,Region of early disorganized behaviorextracted (horizontal white bar) from thetop image during rapid pacing epochillustrates only cells 3 and 4 in the imageand their respective intensity profiles tothe immediate right. C, Temporal expan-sion (horizontal teal bar) of the last 4beats of the fast pacing epoch and 1after return to basal pacing from B.Intensity profiles from cells 2, 5, 8, 10,and 12 are shown at right. D, Expansionof cells 3 and 4 during the early behaviorshown in bottom left of B (horizontal tealbar).
Figure 5. Characteristics of subcellularalternans in individual myocytes of di-8-ANEPPS–stained left ventricular epicar-dium. A, X-Y frame-scan image of the cellin situ from which recording was made inpanel B. Intensity is high (yellow) at cellends, allowing visualization of cell lengthfor subsequent line scans. Cell dimensionsare outlined with a white box. B. Blue lineindicates position of scan-line; whitearrows, cell boundaries and location of X-Yframe-scan transposition for the line-scan.C (top), Long-axial line-scan image of asingle myocyte in the intact LV and itsintensity profile showing one Ca2� tran-
sient at basal BCL�500 ms, followed by a train of transients at a fast pacing BCL�220 ms, then a return to basal rate. D, Pacing atBCL�190 ms. E, Pacing at BCL�180 ms.
e68 Circulation Research September 29, 2006
at Galter Health Sciences Library on October 30, 2014http://circres.ahajournals.org/Downloaded from
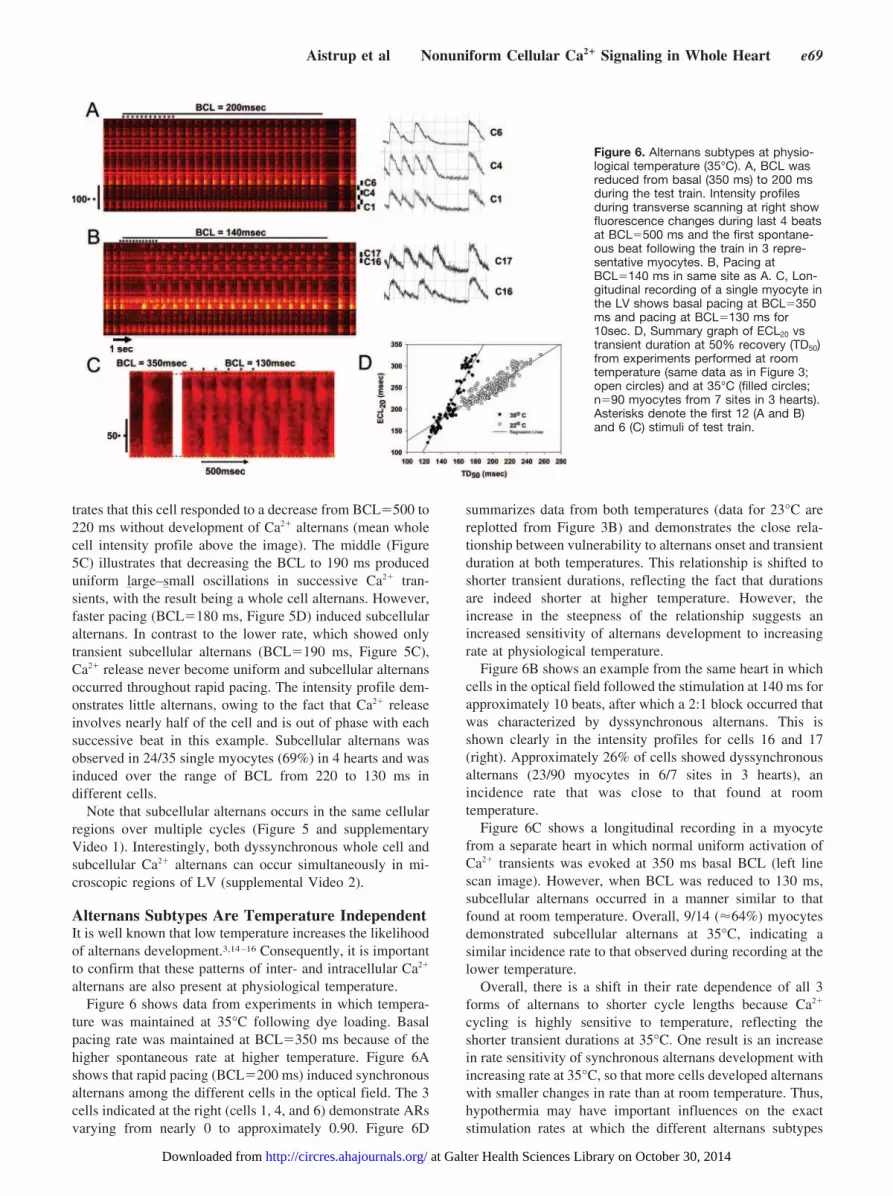
trates that this cell responded to a decrease from BCL�500 to220 ms without development of Ca2� alternans (mean wholecell intensity profile above the image). The middle (Figure5C) illustrates that decreasing the BCL to 190 ms produceduniform large–small oscillations in successive Ca2� tran-sients, with the result being a whole cell alternans. However,faster pacing (BCL�180 ms, Figure 5D) induced subcellularalternans. In contrast to the lower rate, which showed onlytransient subcellular alternans (BCL�190 ms, Figure 5C),Ca2� release never become uniform and subcellular alternansoccurred throughout rapid pacing. The intensity profile dem-onstrates little alternans, owing to the fact that Ca2� releaseinvolves nearly half of the cell and is out of phase with eachsuccessive beat in this example. Subcellular alternans wasobserved in 24/35 single myocytes (69%) in 4 hearts and wasinduced over the range of BCL from 220 to 130 ms indifferent cells.
Note that subcellular alternans occurs in the same cellularregions over multiple cycles (Figure 5 and supplementaryVideo 1). Interestingly, both dyssynchronous whole cell andsubcellular Ca2� alternans can occur simultaneously in mi-croscopic regions of LV (supplemental Video 2).
Alternans Subtypes Are Temperature IndependentIt is well known that low temperature increases the likelihoodof alternans development.3,14–16 Consequently, it is importantto confirm that these patterns of inter- and intracellular Ca2�
alternans are also present at physiological temperature.Figure 6 shows data from experiments in which tempera-
ture was maintained at 35°C following dye loading. Basalpacing rate was maintained at BCL�350 ms because of thehigher spontaneous rate at higher temperature. Figure 6Ashows that rapid pacing (BCL�200 ms) induced synchronousalternans among the different cells in the optical field. The 3cells indicated at the right (cells 1, 4, and 6) demonstrate ARsvarying from nearly 0 to approximately 0.90. Figure 6D
summarizes data from both temperatures (data for 23°C arereplotted from Figure 3B) and demonstrates the close rela-tionship between vulnerability to alternans onset and transientduration at both temperatures. This relationship is shifted toshorter transient durations, reflecting the fact that durationsare indeed shorter at higher temperature. However, theincrease in the steepness of the relationship suggests anincreased sensitivity of alternans development to increasingrate at physiological temperature.
Figure 6B shows an example from the same heart in whichcells in the optical field followed the stimulation at 140 ms forapproximately 10 beats, after which a 2:1 block occurred thatwas characterized by dyssynchronous alternans. This isshown clearly in the intensity profiles for cells 16 and 17(right). Approximately 26% of cells showed dyssynchronousalternans (23/90 myocytes in 6/7 sites in 3 hearts), anincidence rate that was close to that found at roomtemperature.
Figure 6C shows a longitudinal recording in a myocytefrom a separate heart in which normal uniform activation ofCa2� transients was evoked at 350 ms basal BCL (left linescan image). However, when BCL was reduced to 130 ms,subcellular alternans occurred in a manner similar to thatfound at room temperature. Overall, 9/14 (�64%) myocytesdemonstrated subcellular alternans at 35°C, indicating asimilar incidence rate to that observed during recording at thelower temperature.
Overall, there is a shift in their rate dependence of all 3forms of alternans to shorter cycle lengths because Ca2�
cycling is highly sensitive to temperature, reflecting theshorter transient durations at 35°C. One result is an increasein rate sensitivity of synchronous alternans development withincreasing rate at 35°C, so that more cells developed alternanswith smaller changes in rate than at room temperature. Thus,hypothermia may have important influences on the exactstimulation rates at which the different alternans subtypes
Figure 6. Alternans subtypes at physio-logical temperature (35°C). A, BCL wasreduced from basal (350 ms) to 200 msduring the test train. Intensity profilesduring transverse scanning at right showfluorescence changes during last 4 beatsat BCL�500 ms and the first spontane-ous beat following the train in 3 repre-sentative myocytes. B, Pacing atBCL�140 ms in same site as A. C, Lon-gitudinal recording of a single myocyte inthe LV shows basal pacing at BCL�350ms and pacing at BCL�130 ms for10sec. D, Summary graph of ECL20 vstransient duration at 50% recovery (TD50)from experiments performed at roomtemperature (same data as in Figure 3;open circles) and at 35°C (filled circles;n�90 myocytes from 7 sites in 3 hearts).Asterisks denote the first 12 (A and B)and 6 (C) stimuli of test train.
Aistrup et al Nonuniform Cellular Ca2� Signaling in Whole Heart e69
at Galter Health Sciences Library on October 30, 2014http://circres.ahajournals.org/Downloaded from
develop but is not in itself responsible for either incidencerates or the types of alternans that develop during rapidpacing. This observation poses a possible explanation for whyalternans develops at slower pacing rates at lower tempera-tures and why most investigators choose to study alternans atlower temperatures.
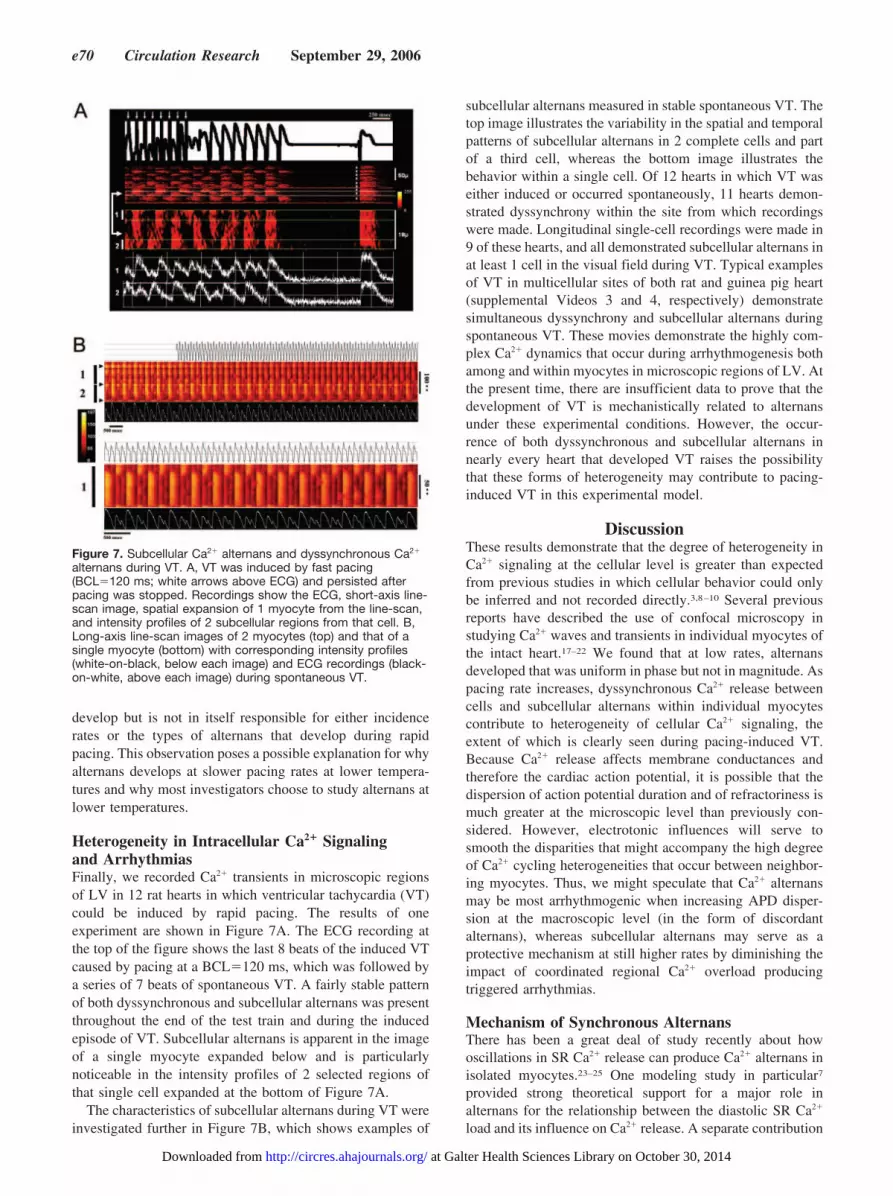
Heterogeneity in Intracellular Ca2� Signalingand ArrhythmiasFinally, we recorded Ca2� transients in microscopic regionsof LV in 12 rat hearts in which ventricular tachycardia (VT)could be induced by rapid pacing. The results of oneexperiment are shown in Figure 7A. The ECG recording atthe top of the figure shows the last 8 beats of the induced VTcaused by pacing at a BCL�120 ms, which was followed bya series of 7 beats of spontaneous VT. A fairly stable patternof both dyssynchronous and subcellular alternans was presentthroughout the end of the test train and during the inducedepisode of VT. Subcellular alternans is apparent in the imageof a single myocyte expanded below and is particularlynoticeable in the intensity profiles of 2 selected regions ofthat single cell expanded at the bottom of Figure 7A.
The characteristics of subcellular alternans during VT wereinvestigated further in Figure 7B, which shows examples of
subcellular alternans measured in stable spontaneous VT. Thetop image illustrates the variability in the spatial and temporalpatterns of subcellular alternans in 2 complete cells and partof a third cell, whereas the bottom image illustrates thebehavior within a single cell. Of 12 hearts in which VT waseither induced or occurred spontaneously, 11 hearts demon-strated dyssynchrony within the site from which recordingswere made. Longitudinal single-cell recordings were made in9 of these hearts, and all demonstrated subcellular alternans inat least 1 cell in the visual field during VT. Typical examplesof VT in multicellular sites of both rat and guinea pig heart(supplemental Videos 3 and 4, respectively) demonstratesimultaneous dyssynchrony and subcellular alternans duringspontaneous VT. These movies demonstrate the highly com-plex Ca2� dynamics that occur during arrhythmogenesis bothamong and within myocytes in microscopic regions of LV. Atthe present time, there are insufficient data to prove that thedevelopment of VT is mechanistically related to alternansunder these experimental conditions. However, the occur-rence of both dyssynchronous and subcellular alternans innearly every heart that developed VT raises the possibilitythat these forms of heterogeneity may contribute to pacing-induced VT in this experimental model.
DiscussionThese results demonstrate that the degree of heterogeneity inCa2� signaling at the cellular level is greater than expectedfrom previous studies in which cellular behavior could onlybe inferred and not recorded directly.3,8–10 Several previousreports have described the use of confocal microscopy instudying Ca2� waves and transients in individual myocytes ofthe intact heart.17–22 We found that at low rates, alternansdeveloped that was uniform in phase but not in magnitude. Aspacing rate increases, dyssynchronous Ca2� release betweencells and subcellular alternans within individual myocytescontribute to heterogeneity of cellular Ca2� signaling, theextent of which is clearly seen during pacing-induced VT.Because Ca2� release affects membrane conductances andtherefore the cardiac action potential, it is possible that thedispersion of action potential duration and of refractoriness ismuch greater at the microscopic level than previously con-sidered. However, electrotonic influences will serve tosmooth the disparities that might accompany the high degreeof Ca2� cycling heterogeneities that occur between neighbor-ing myocytes. Thus, we might speculate that Ca2� alternansmay be most arrhythmogenic when increasing APD disper-sion at the macroscopic level (in the form of discordantalternans), whereas subcellular alternans may serve as aprotective mechanism at still higher rates by diminishing theimpact of coordinated regional Ca2� overload producingtriggered arrhythmias.
Mechanism of Synchronous AlternansThere has been a great deal of study recently about howoscillations in SR Ca2� release can produce Ca2� alternans inisolated myocytes.23–25 One modeling study in particular7
provided strong theoretical support for a major role inalternans for the relationship between the diastolic SR Ca2�
load and its influence on Ca2� release. A separate contribution
Figure 7. Subcellular Ca2� alternans and dyssynchronous Ca2�
alternans during VT. A, VT was induced by fast pacing(BCL�120 ms; white arrows above ECG) and persisted afterpacing was stopped. Recordings show the ECG, short-axis line-scan image, spatial expansion of 1 myocyte from the line-scan,and intensity profiles of 2 subcellular regions from that cell. B,Long-axis line-scan images of 2 myocytes (top) and that of asingle myocyte (bottom) with corresponding intensity profiles(white-on-black, below each image) and ECG recordings (black-on-white, above each image) during spontaneous VT.
e70 Circulation Research September 29, 2006
at Galter Health Sciences Library on October 30, 2014http://circres.ahajournals.org/Downloaded from

to alternans development and magnitude might also arisefrom the degree of Ca2�-induced inactivation of the L-typeCa2� current, which alternates with the level of cytoplasmicCa2� during Ca2� alternans. However, these studies havelargely ignored the role of Ca2� transient duration in regulat-ing the availability of Ca2� for subsequent release with eachcycle. Thus, a large and long (L) transient will be interruptedbefore SR Ca2� content can recover at fast pacing rates,whereas small and short (S) transients will allow morecomplete recovery for the next cycle, which will then belarge. One implication of this observation is that because Ca2�
transients in human heart failure26,27 and in animal mod-els28–30 are prolonged, this effect could potentially increasethe vulnerability to alternans onset.
Our results provide the first direct evidence that differentcells in intact heart have different vulnerabilities to alternansdevelopment based on intrinsic properties of Ca2� signalingwithin individual cells. These results are similar to recentobservations in both dog31 and guinea pig32 and are consistentwith the idea that the rate of Ca2� cycling and, specifically,the duration of the Ca2� transient might determine both themagnitude of and rate sensitivity to alternans. Moreover, thiswas the first demonstration of the variability in Ca2� tran-sients that exists at the microscopic level; previously, it hasalways been largely assumed that Ca2� transients are uniformwithin each left ventricular region (eg, base versus apex)despite the fact that important differences exist betweenregions.1,3,9,10 Our observations demonstrate that this is notthe case, and, furthermore, there is a high degree of hetero-geneity in Ca2� dynamics within microscopic regions of theLV at both low and physiological temperatures.
It is not yet clear how dyssynchrony develops, but theresult is that neighboring groups of cells and, in many cases,immediately adjoining cells are capable of developing alter-nans that is out of phase. The result is a much greatercell-to-cell variability in Ca2� signaling at the microscopiclevel than was previously recognized. It is not yet known howor even if these microscopic heterogeneities in Ca2� signalingmight contribute to regionally discordant electrical alternans.However, dyssynchrony could contribute to the substrate forreentrant arrhythmias, if its influence in the LV is sufficient inmagnitude and distribution to contribute to a dispersion inrefractoriness across the LV.
Subcellular Alternans, Cellular Ca2�
Heterogeneities, and ArrhythmiasIt has only recently been shown that intracellular SR Ca2�
release can also go into oscillation in localized regions withinindividual myocytes.11,33 Part of the cell releases a largeamount of Ca2�, whereas another cellular region released farless; the next activation produced the opposite pattern,causing a regional alternans within atrial cells but rarely inventricular myocytes.12 A nearly identical phenomenon oc-curred during partial inhibition of ryanodine receptors (RyRs)in rat ventricular myocytes using low concentrations oftetracaine or acidosis.13
The mechanism for subcellular alternans is most probablysimilar to that underlying Ca2� alternans in general. Onecellular region with slow Ca2� reuptake is unable to respond
to 2 successive beats during rapid pacing and so requires anadditional cycle to replenish stores for large releases, whereasanother region, the transient of which can recover morequickly, is able to follow each stimulus. We have alsorecorded instances in which different cellular regions simplyoscillate completely out of phase with one another. The resultis regional L/S alternations that are out of phase at differentsites within the cell on a beat-to-beat basis.
When we studied the incidence of rate-dependent subcel-lular alternans development, we found that this is not anunusual phenomenon in the intact heart. In fact, nearly 2/3 ofmyocytes in intact rat LV demonstrated subcellular alternansat rates that produced pacing-induced VT and again duringepisodes of spontaneous VT. These observations raise, for thefirst time, the possibility that nonuniform intracellular Ca2�
release occurs during rapid pacing and arrhythmias.Finally, the presence of both dyssynchronous and subcel-
lular alternans in nearly every heart that developed VT raisesthe possibility that alternans is involved in pacing-inducedVT in this model. Conversely, if we had found that theseforms of heterogeneity in Ca2� signaling were absent duringVT, it would be highly unlikely that they play any role in thearrhythmia. To our knowledge, these are the first directmeasurements of Ca2� signaling in single cells in intact heartduring arrhythmias, and the results demonstrate an extraor-dinary heterogeneity in behavior at the level of individualmyocytes during arrhythmias. Given that the electrical spaceconstant far exceeds the behavior of individual myocytes,pacing-induced heterogeneities in ion channel activation andaction potential in individual cells are unlikely to affectmacroscopic electrical activity of the ventricular syncytium.The smoothing effect of electrical current spread across manycells would, if anything, filter the most drastic cell-to-celldifferences in Ca2� signaling and resulting discrepancies inion channel and action potential activation, thus minimizingtheir influence in arrhythmia development. However, a re-duced space constant such as occurs in disease states, whereintercellular communication is reduced,34,35 would minimizeprotection against nonuniformities in refractoriness, possiblypromoting the development of re-entrant arrhythmias.
In the context of the relationship between transmembranepotential (Vm) and Ca2� signaling heterogeneities at thecellular level, it is important to note that there are severalreports of subcellular changes in Vm that might be relevant tothe intracellular heterogeneities in Ca2� signaling observedhere. Several studies have found that cardiac cells do notdepolarize uniformly during field stimulation, suggesting thata cellular “action potential” is subject to local changes in ionchannel activation kinetics.36–38 The fact that we found Ca2�
signaling heterogeneities within individual myocytes of intactheart raises the possibility that different cellular regionsmight demonstrate local action potential variability depend-ing on activation and recovery kinetics of Ca2� sensitiveconductances (INCX, IClCa, among others). A role for this typeof nonuniform electrical activation has not been identified inarrhythmogenesis as yet. Furthermore, it is not known if theheterogeneities in cellular Vm are also present in intact heartbecause these studies were performed in isolated myocytes.However, it is known that current flow from cell to cell
Aistrup et al Nonuniform Cellular Ca2� Signaling in Whole Heart e71
at Galter Health Sciences Library on October 30, 2014http://circres.ahajournals.org/Downloaded from
depends on the uniformity of impedances during downstreamconduction. Depolarizing ionic current as well as changes inresistance and capacitance between—and possibly within—myocytes can affect the spread and rise of depolarization.39
Thus it is possible that heterogeneities in cellular Ca2� couldalso affect the rise time and shape of the action potential andthe uniformity of propagation both between neighboringmyocytes as well as within individual cells.
Lastly, it is worth mentioning that the observations ofhighly heterogeneous behavior in intact heart leading poten-tially to subcellular alternans have been described in theoret-ical studies published in recent years.40 This intracellularbehavior is mathematically quite similar to that described forspatially discordant APD alternans in theoretical models41
across larger tissue regions. Alternatively, the behavior un-derlying subcellular alternans and possibly dyssynchronousalternans might best be described in terms of Turing-typeinstability within individual cells and between myocytes insmall cardiac regions, respectively.42 It will be important inthe future to analyze the cellular behavior observed here interms of these theoretical considerations which could provideimportant insights into the basis for arrhythmia initiation andstabilization in the whole organ.
Limitations of This StudyOne of the limitations of this study is that the arrhythmiaswere generated in hearts that were hypothermic. Low tem-perature affects ion channel behavior, intracellular Ca2�
cycling, and other factors that might contribute to arrhythmo-genesis at nonphysiological temperatures. Ion channel acti-vation is affected not only by a direct effect of cooling onkinetics but also reduced membrane fluidity, which alterschannel environment in lipid membranes as well as mem-brane transport systems and therefore local transmembraneionic balances. Conduction velocity is slowed because ofreduced rapid Na� current and gap junctional conductance.These factors will all contribute to arrhythmias at roomtemperature, making a definitive relationship between alteredCa2� signaling and arrhythmias speculative at best.
One of the potential complicating factors in our interpre-tation of results is that cytochalasin D is required to preventcontraction. This agent is known to have direct effects ontransients in addition to blocking contraction, raising thepossibility that some of our observations about Ca2� dynam-ics made in the presence of cytochalasin D might be influ-enced by its presence rather than occurring as a result ofintrinsic properties of Ca2� cycling in the heart. CytochalasinD slows rise time and prolongs Ca2� transient duration in ratventricular myocytes43 but has little effect on dog heart (up to80 �mol/L),44.45 Finally, the ability of cytochalasin D to slowCa2� transient kinetics was associated with a tendency toreduce the incidence and duration of reentrant ventriculararrhythmias in mouse heart.46 Overall, these data suggest thatcytochalasin D is not affecting excitation/contraction cou-pling to a sufficient extent to explain the heterogeneities inCa2� signaling observed here.
Sources of FundingA.H.K. was supported by the Fannie Penikoff Trust and is a scholarof the Feinberg Cardiovascular Research Institute.
DisclosuresNone.
References1. Qian YW, Clusin WT, Lin SF, Han J, Sung RJ. Spatial heterogeneity of
calcium transient alternans during the early phase of myocardial ischemiain the blood-perfused rabbit heart. Circulation. 2001;104:2082–2087.
2. Walker ML, Rosenbaum DS. Repolarization alternans: implications forthe mechanism and prevention of sudden cardiac death. Cardiovasc Res.2003;57:599–614.
3. Pastore JM, Girouard SD, Laurita KR, Akar FG, Rosenbaum DS.Mechanism linking T-wave alternans to the genesis of cardiac fibrillation.Circulation. 1999;99:1385–1394.
4. Fox JJ, McHarg JL, Gilmour RF Jr. Ionic mechanism of electricalalternans. Am J Physiol Heart Circ Physiol. 2002;282:H516–H530.
5. Euler DE. Cardiac alternans: mechanisms and pathophysiological signif-icance. Cardiovasc Res. 1999;42:583–590.
6. Sipido KR. Understanding cardiac alternans: the answer lies in the Ca2�store. Circ Res. 2004;94:570–572.
7. Shiferaw Y, Watanabe MA, Garfinkel A, Weiss JN, Karma A. Model ofintracellular calcium cycling in ventricular myocytes. Biophys J. 2003;85:3666–3686.
8. Pruvot EJ, Katra RP, Rosenbaum DS, Laurita KR. Role of calciumcycling versus restitution in the mechanism of repolarization alternans.Circ Res. 2004;94:1083–1090.
9. Katra RP, Pruvot E, Laurita KR. Intracellular calcium handling hetero-geneities in intact guinea pig hearts. Am J Physiol Heart Circ Physiol.2004;286:H648–H656.
10. Choi BR, Salama G. Simultaneous maps of optical action potentials andcalcium transients in guinea-pig hearts: mechanisms underlying con-cordant alternans. J Physiol. 2000;529(pt 1):171–188.
11. Blatter LA, Kockskamper J, Sheehan KA, Zima AV, Huser J, Lipsius SL.Local calcium gradients during excitation-contraction coupling andalternans in atrial myocytes. J Physiol. 2003;546:19–31.
12. Kockskamper J, Blatter LA. Subcellular Ca2� alternans represents anovel mechanism for the generation of arrhythmogenic Ca2� waves incat atrial myocytes. J Physiol. 2002;545:65–79.
13. Diaz ME, Eisner DA, O’Neill SC. Depressed ryanodine receptor activityincreases variability and duration of the systolic Ca2� transient in ratventricular myocytes. Circ Res. 2002;91:585–593.
14. Rubenstein DS, Lipsius SL. Premature beats elicit a phase reversal ofmechanoelectrical alternans in cat ventricular myocytes. A possiblemechanism for reentrant arrhythmias. Circulation. 1995;91:201–214.
15. Smith JM, Clancy EA, Valeri CR, Ruskin JN, Cohen RJ. Electricalalternans and cardiac electrical instability. Circulation. 1988;77:110–121.
16. Spear JF, Moore ENA. comparison of alternation in myocardial actionpotentials and contractility. Am J Physiol. 1971;220:1708–1716.
17. Rubart M, Pasumarthi KB, Nakajima H, Soonpaa MH, Nakajima HO,Field LJ. Physiological coupling of donor and host cardiomyocytes aftercellular transplantation. Circ Res. 2003;92:1217–1224.
18. Minamikawa T, Cody SH, Williams DA. In situ visualization of spon-taneous calcium waves within perfused whole rat heart by confocalimaging. Am J Physiol. 1997;272:H236–H243.
19. Hama T, Takahashi A, Ichihara A, Takamatsu T. Real time in situconfocal imaging of calcium wave in the perfused whole heart of the rat.Cell Signal. 1998;10:331–337.
20. Kaneko T, Tanaka H, Oyamada M, Kawata S, Takamatsu T. Threedistinct types of Ca(2�) waves in Langendorff-perfused rat heartrevealed by real-time confocal microscopy. Circ Res. 2000;86:1093–1099.
21. Hamamoto T, Tanaka H, Mani H, Tanabe T, Fujiwara K, Nakagami T,Horie M, Oyamada M, Takamatsu T. In situ Ca2� dynamics of Purkinjefibers and its interconnection with subjacent ventricular myocytes. J MolCell Cardiol. 2005;38:561–569.
22. Rubart M, Wang E, Dunn KW, Field LJ. Two-photon molecular exci-tation imaging of Ca2� transients in Langendorff-perfused mouse hearts.Am J Physiol Cell Physiol. 2003;284:C1654–C1668.
23. Eisner DA, Choi HS, Diaz ME, O’Neill SC, Trafford AW. Integrativeanalysis of calcium cycling in cardiac muscle. Circ Res. 2000;87:1087–1094.
24. Eisner DA, Diaz ME, Li Y, O’Neill SC, Trafford AW. Stability andinstability of regulation of intracellular calcium. Exp Physiol. 2005;90:3–12.
e72 Circulation Research September 29, 2006
at Galter Health Sciences Library on October 30, 2014http://circres.ahajournals.org/Downloaded from
25. Trafford AW, Diaz ME, Sibbring GC, Eisner DA. Modulation of CICRhas no maintained effect on systolic Ca2�: simultaneous measurementsof sarcoplasmic reticulum and sarcolemmal Ca2� fluxes in rat ventric-ular myocytes. J Physiol. 2000;522(pt 2):259–270.
26. Beuckelmann DJ, Nabauer M, Erdmann E. Intracellular calcium handlingin isolated ventricular myocytes from patients with terminal heart failure.Circulation. 1992;85:1046–1055.
27. Gwathmey JK, Copelas L, MacKinnon R, Schoen FJ, Feldman MD,Grossman W, Morgan JP. Abnormal intracellular calcium handling inmyocardium from patients with end-stage heart failure. Circ Res. 1987;61:70–76.
28. Bailey BA, Dipla K, Li S, Houser SR. Cellular basis of contractilederangements of hypertrophied feline ventricular myocytes. J Mol CellCardiol. 1997;29:1823–1835.
29. Holt E, Tonnessen T, Lunde PK, Semb SO, Wasserstrom JA, SejerstedOM, Christensen G. Mechanisms of cardiomyocyte dysfunction in heartfailure following myocardial infarction in rats. J Mol Cell Cardiol. 1998;30:1581–1593.
30. O’Rourke B, Kass DA, Tomaselli GF, Kaab S, Tunin R, Marban E.Mechanisms of altered excitation-contraction coupling in caninetachycardia-induced heart failure, I. Experimental studies. Circ Res.1999;84:562–570.
31. Laurita KR, Katra R, Wible B, Wan X, Koo MH. Transmural heteroge-neity of calcium handling in canine. Circ Res. 2003;92:668–675.
32. Wan X, Laurita KR, Pruvot EJ, Rosenbaum DS. Molecular correlates ofrepolarization alternans in cardiac myocytes. J Mol Cell Cardiol. 2005;39:419–428.
33. Huser J, Wang YG, Sheehan KA, Cifuentes F, Lipsius SL, Blatter LA.Functional coupling between glycolysis and excitation-contractioncoupling underlies alternans in cat heart cells. J Physiol. 2000;524(pt3):795–806.
34. Poelzing S, Rosenbaum DS. Altered connexin43 expression producesarrhythmia substrate in heart failure. Am J Physiol Heart Circ Physiol.2004;287:H1762–H1770.
35. Levine JH, Moore EN, Weisman HF, Kadish AH, Becker LC, Spear JF.Depression of action potential characteristics and a decreased spaceconstant are present in postischemic, reperfused myocardium. J ClinInvest. 1987;79:107–116.
36. Sharma V, Tung L. Spatial heterogeneity of transmembrane potentialresponses of single guinea-pig cardiac cells during electric field stimu-lation. J Physiol. 2002;542:477–492.
37. Sharma V, Tung L. Transmembrane responses of single guinea pigventricular cell to uniform electric field stimulus. J Cardiovasc Electro-physiol. 1999;10:1296.
38. Windisch H, Ahammer H, Schaffer P, Muller W, Platzer D. Opticalmultisite monitoring of cell excitation phenomena in isolated cardiomyo-cytes. Pflugers Arch. 1995;430:508–518.
39. Kleber AG. The shape of the electrical action-potential upstroke: a newaspect from optical measurements on the surface of the heart. Circ Res.2005;97:204–206.
40. Weiss JN, Karma A, Shiferaw Y, Chen PS, Garfinkel A, Qu Z. Frompulsus to pulseless: the saga of cardiac alternans. Circ Res. 2006;98:1244–1253.
41. Watanabe MA, Fenton FH, Evans SJ, Hastings HM, Karma A. Mech-anisms for discordant alternans. J Cardiovasc Electrophysiol. 2001;12:196–206.
42. Shiferaw Y, Karma A. Turing instability mediated by voltage and calciumdiffusion in paced cardiac cells. Proc Natl Acad Sci U S A. 2006;103:5670–5675.
43. Undrovinas AI, Maltsev VA. Cytochalasin D alters kinetics of Ca2�transient in rat ventricular cardiomyocytes: an effect of altered actincytoskeleton? J Mol Cell Cardiol. 1998;30:1665–1670.
44. Biermann M, Rubart M, Moreno A, Wu J, Josiah-Durant A, Zipes DP.Differential effects of cytochalasin D and 2,3 butanedione monoxime onisometric twitch force and transmembrane action potential in isolatedventricular muscle: implications for optical measurements of cardiacrepolarization. J Cardiovasc Electrophysiol. 1998;9:1348–1357.
45. Wu J, Biermann M, Rubart M, Zipes DP. Cytochalasin D as excitation-contraction uncoupler for optically mapping action potentials in wedgesof ventricular myocardium. J Cardiovasc Electrophysiol. 1998;9:1336–1347.
46. Baker LC, Wolk R, Choi BR, Watkins S, Plan P, Shah A, Salama G.Effects of mechanical uncouplers, diacetyl monoxime, andcytochalasin-D on the electrophysiology of perfused mouse hearts. Am JPhysiol Heart Circ Physiol. 2004;287:H1771–H1779.
Aistrup et al Nonuniform Cellular Ca2� Signaling in Whole Heart e73
at Galter Health Sciences Library on October 30, 2014http://circres.ahajournals.org/Downloaded from
Online Supplement Aistrup et al. Non-uniform Cellular Ca2+ Signaling in Whole Heart
Materials and Methods
Preparation of Whole-heart Perfusion. Rats were anesthetized with ketamine:xylazine
(50 mg/kg : 5 mg/kg) or Na-pentobarbital (35-40mg/kg), i.p. The heart was rapidly
removed, cannulated at the aorta and subjected to Langendorff (retrograde) perfusion at
room temperature (~22°C). Perfusate solution composition was as follows (in mM):
NaCl, 140, KCl, 5.4, CaCl2, 1.8, MgCl2, 0.5, NaH2P04, 0.4; NaHCO3, 22; glucose 10;
equilibrated with blood-gas (95% O2 : 5% CO2); pH 7.35. A peristaltic pump was used
to maintain the perfusate flow rate so that the diastolic pressure was kept at 50-70mm
Hg throughout the experiments as monitored by an in-line high impedance pressure
transducer (Bridge 8 bioamplifier, WPI). During an initial perfusion equilibration period
of about 10 min, the heart was positioned in an experimental chamber on the stage of
an inverted confocal microscope (Zeiss LSM 510 system, Jena, Germany) such that the
LV is directed downward, facing the microscope objectives, and is between two
Ag/AgCl2 wires used to monitor and record pseudo-ECGs.
The heart was immersed in and recirculated with a perfusate containing 15-20 µM
of the non-ratiometric Ca2+ fluorescence dye, fluo-4AM (Molecular Probes) for 20-40
min and washed with normal solution for 10-15 min. In some experiments, membrane
staining was accomplished using di-8-ANNEPPS (1-5 µM) during the last 5 min of dye
loading. The heart was then recirculated with a perfusate containing the paralytic agent
50µM cytochalasin-D (and 50 µM latrunculin-B in some experiments) for the remainder
of the experiment. Experiments were conducted at room temperature (23+1oC) or at
35oC as indicated. Platinum needle stimulating electrodes were inserted into the RV
base and/or LV apex for delivery of rapid stimulation protocols. Hearts were paced at a
basic cycle length (BCL) of 500 msec, unless otherwise stated.
Online Supplement Aistrup et al. Non-uniform Cellular Ca2+ Signaling in Whole Heart
Data acquisition. For fluorescence image acquisition, the heart was lightly pressed
against the glass bottom of the chamber to provide a flat surface for image recording.
Focal sites consisting typically of 15-20 myocytes (~500µ2) at 2-3 cell layers below the
LV epicardial surface were selected based on good electrical coupling and Ca2+
transient fluorescence signal strength. Fluo-4 excitation was achieved with a 25mW
argon laser at 488 nm, and its fluorescence emission > 505 nm was collected using a
lowpass filter. Line-scan recordings of confocal fluorescence images were acquired
using the integrated Zeiss LSM Confocal Microscopy Software (V2.5) and either a 25x
(NA 0.82) or 40x (NA 1.24) water objectives at a typical resolution of 512 pixels/line and
a scan rate of 1.92 msec/line-scan. Photobleaching and phototoxicity by laser light
was minimized by scanning at < 10% output transmission for ≤ 16 sec per image.
Pseudo-ECG signals were digitized at 1 kHz on-line with a 1384 Digidata A-D
converter, and stored to a PC using PClamp8 software (Axon Instruments/Molecular
Devices, Burlingame, CA). Synchronous confocal image and ECG acquisition was
achieved by triggering (via TTL pulse) of ECG recording at the time of initiation of
fluorescence image recording.
Rapid pacing protocol. Cellular Ca2+ alternans was induced by rapid pacing during
abrupt acceleration from a basal BCL (500 msec) to a shorter test BCL for 10 sec, and
then returned to basal BCL or intrinsic rate (no stimulation). This protocol was repeated
until alternans was observed, at which point the test BCL was decreased by 10 msec
until there was no alternating transient 1 and/or arrhythmias occurred.
Data analysis. Figures show absolute fluorescence whereas statistical analyses were
performed after fluorescence normalization to resting levels (F/F0). No attempt was
made to calibrate the fluo-4 fluorescence (F) to absolute [Ca2+], or to correct for
autofluorescence. Using the Zeiss LSM software, each individual myocyte in an X-t

Online Supplement Aistrup et al. Non-uniform Cellular Ca2+ Signaling in Whole Heart
line-scan image field was visually identified in order to distinguish a series of cells joined
laterally in a given recording site, aided by an X-Y frame-scan counterpart of that site.
As shown in Figure 1, the long myocyte bundles of the LV subepicardium were
separated laterally from the neighboring cells either by a brightly stained capillary or by
dark patches of unstained tissue. The figure shows how the cell boundaries can be
transposed to the line-scan image, often with the help of landmarks such as brightly
loaded capillaries whose fluorescence intensity does not vary appreciably during
pacing. This approach made it quite easy to distinguish between myocytes during
transverse (multicellular) recording. Staining with di-8-ANEPPS was not used routinely
in experiments with transverse recordings of multiple cells because of the significant
spectral overlap with fluo-4, which interfered with quantification of basal transient
characteristics and of changes during rapid pacing. Occasionally, it was difficult to
determine if a particularly wide bundle (>20µ) was in fact one or two cells. In this case,
rapid pacing invariably revealed either uniform Ca2+ signaling behavior as characteristic
of a single myocyte or distinct behavior indicative of multiple cells (highly non-uniform
transients or complete block in one but not the other cell). In these rare instances (about
1 cell per 3-4 hearts) where an apparently single myocyte clearly demonstrates the
behavior of two closely adjoined cells, the analysis was repeated for each member of
that cell pair. In contrast, all longitudinal recordings of individual myocytes or cell pairs
during investigation of pacing-induced changes in Ca2+ signaling within each myocyte
were performed in di-8-ANEPPS stained hearts. This approach allowed easy
identification of intercalated discs between myocytes within a cell bundle in order to be
certain that each recording was made within the cytoplasm of 1-2 clearly identifiable
cells.
Each myocyte was analyzed at all test cycle lengths. The corresponding Ca2+
transient fluorescence data were extracted and analyzed separately. Characteristics of
Online Supplement Aistrup et al. Non-uniform Cellular Ca2+ Signaling in Whole Heart
Ca2+ transients at a BCL of 500msec—peak amplitude, amplitude⋅time integral, rise-
time (10-90% peak amplitude), decay-time (90-10% peak amplitude), rate of rise
(+dF/dt) and decay (-dF/dt), transient duration (50% and 90% recovery or TD50 and
TD90)—were determined using Matlab software to assess predictors of cellular Ca2+
alternans susceptibility. Alternans ratios (AR) were calculated as 1 – (Small/Large)
transient magnitude16 at steady-state (end of 10-sec test train). Because Ca2+
transients were measured at the level of individual myocytes, the signal was small
compared to that of voltage-sensitive dye mapping studies. Consequently, an AR of 0.2
was considered to be the threshold for cellular Ca2+ alternans. Sigmoid curves were
fitted to plots of alternans ratio vs. test BCL in order to calculate the Effective Cycle
Lengths at which 20% (ECL20) and 50% (ECL50) alternans were achieved. This
approach allowed the calculation of the cycle lengths at which the threshold and half-
maximal alternans values are achieved, respectively, as measures of susceptibility or
vulnerability of individual myocytes to the development of alternans. Pseudo-ECG
recordings were filtered off-line at 15-100Hz, examined and graphically prepared via
pClamp8 software.
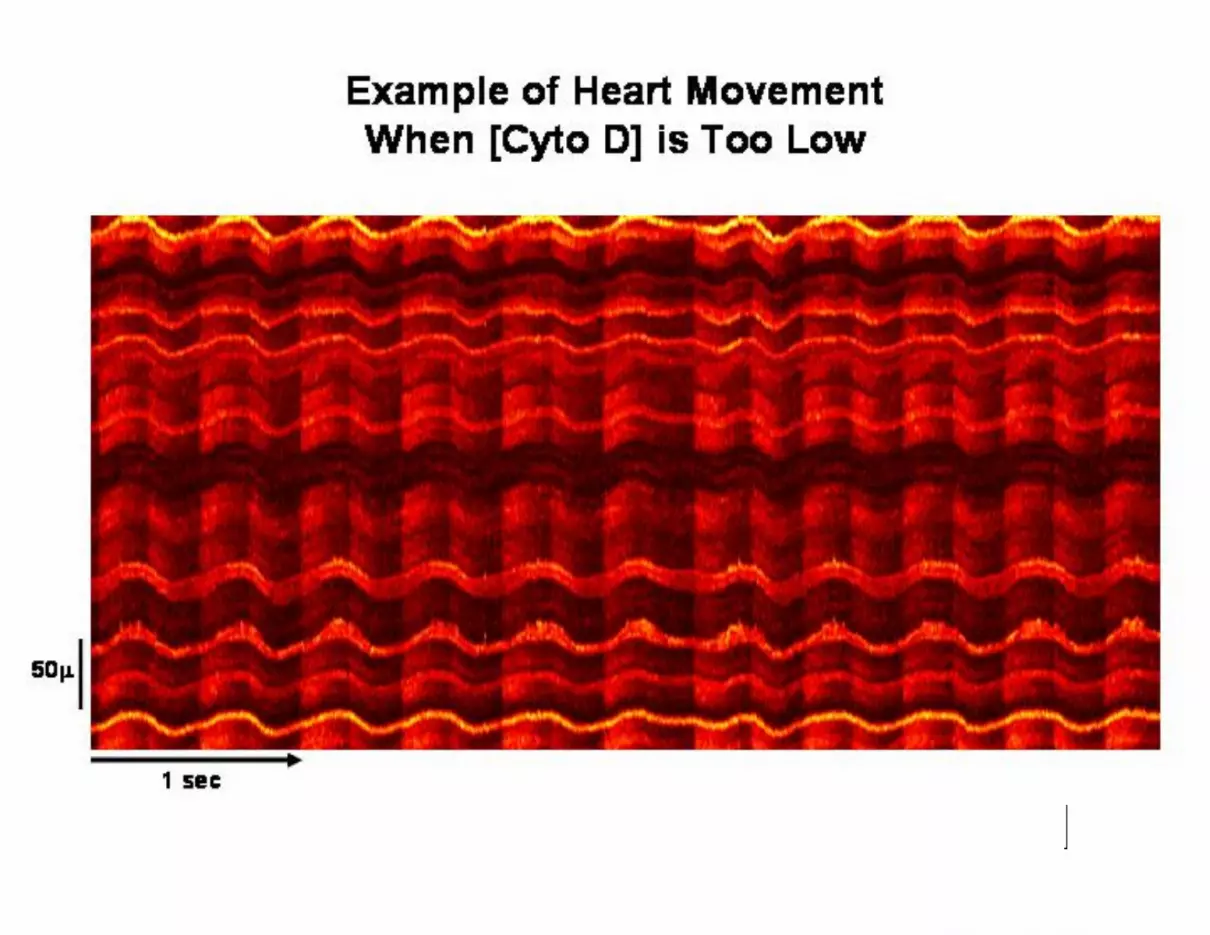
Elimination of motion artifacts. One of the critical limitations of this approach is that the
heart must be immobilized in order to achieve accurate recordings of Ca2+ signaling at
the cellular level. This was accomplished using cytochalasin D which interferes with the
polymerization of actin, thus preventing contraction. Since the tolerance for motion
using this approach is so small (<2µ), it is essential to abolish contraction completely.
This can be done using cytochalasin D but not BDM which, at concentrations necessary
to block contraction (~50mM), had profound effects in pilot studies to slow conduction,
prolong the QRS complex and reduce Ca2+ transient amplitude. None of these changes
occurred with cytochalasin D in intact heart, making it a better agent for this purpose.
Even small amounts of residual contraction were sufficient to preclude reliable
Online Supplement Aistrup et al. Non-uniform Cellular Ca2+ Signaling in Whole Heart
measurement of transients in individual myocytes. Figure S1 shows a site with
approximately 12 myocytes that is moving about 10µ with each stimulus
(BCL=240msec). Since motion changes not only the X-Y position of each cell but also
the focal plane in the Z dimension, it is not possible to be certain that changes in
fluorescence reflect changes in intracellular Ca2+ concentration and not simply
movement of the cell out of focus. Consequently, images such as these were excluded
from analysis. This image was recorded from a heart exposed to 40µM cytochalasin D;
movement was eliminated in nearly all cases during exposure to 50µM. If any motion
remained, an additional 10µM was added to the superfusate, which was always
sufficient to stop motion completely. However, it is important to note that some of the
movies included in the Supplementary Material were recorded in hearts that were not
completely paralyzed. These recordings are included to demonstrate the
heterogeneities in cellular Ca2+ signaling during rapid pacing in a more dramatic fashion
than can be seen in line-scan images. However, none of the images from these movies
was analyzed for single cell behavior, in part because sampling rate is too low and in
part because of these motion artifact issues.
Statistics. All data are presented as mean ± SEM. Comparisons of sample means are
performed using paired and unpaired Student’s t-test. If multiple comparisons are
necessary, statistical significance is determined using an analysis of variance of
repeated measures whenever possible with Bonferroni’s correction for multiple
comparisons and Student-Newman-Keuls secondary tests. If data are unpaired, then a
simple ANOVA is performed using the same post-hoc analyses. Statistical significance
was assigned at p < 0.05.
Online Supplement Aistrup et al. Non-uniform Cellular Ca2+ Signaling in Whole Heart
References
1. Hamamoto T, Tanaka H, Mani H, Tanabe T, Fujiwara K, Nakagami T, Horie M, Oyamada M, Takamatsu T. In situ Ca2+ dynamics of Purkinje fibers and its interconnection with subjacent ventricular myocytes. J Mol Cell Cardiol. 2005; 38:561-569.
Legends for Supplementary Material
Figure S1. Typical Recording of Ca2+ Transients in Multiple Epicardial Cells When
Cardiac Motion is Not Completely Abolished by Cytochalasin D. This image was
acquired during stimulation at BCL=240msec in the presence of 40mM Cytochalasin D,
which was insufficient to block all contraction. Images such as these were not analyzed
because of changes in focal plane during stimulation.
Movie #1. Movie of Subcellular Alternans.
The movie begins with pacing at a BCL=500msec then abruptly decreases BCL
to 240msec for 10sec followed by a return to the basal pacing rate. Stimulation at
BCL=500msec demonstrates uniform spread of activation across all cells in the visual
field. Within several cycles of increased pacing rate, stable subcellular alternans
develop that are maintained throughout the remainder of the test train. Immediately
after the return to 500msec, there are several cycles in which a single myocyte
demonstrates a circular wave radiating from a point source inside the cell (upper left
quadrant). All cells then show normal activation during maintained pacing at the basal
rate. Frame rate was 9/sec for all movies. Scale of the image is 331µ per side.
Online Supplement Aistrup et al. Non-uniform Cellular Ca2+ Signaling in Whole Heart
Movie #2. Movie of Combined Dyssynchronous and Subcellular Alternans.
The move begins with pacing at a BCL=500msec then decreases to BCL=200
msec for 10 sec followed by a return to BCL= 500msec. During rapid pacing, many cells
are completely blocked (AR=1); however several cells around the periphery give full
responses that are out-of-phase with most of the cells in the image (dyssynchronous
alternans). In the middle of the image, numerous myocytes show small regions of Ca2+
release within the cell on alternate cycles (subcellular alternans). All forms of alternans
disappear immediately upon return to the basal pacing rate. Image scale is 353µ per
side.
Movie #3. Movie of Combined Dyssynchronous and Subcellular Alternans
During Spontaneous VT in Rat Heart.
A stable episode of VT was maintained for 2 minutes following rapid pacing. The
VT was characterized by highly complex Ca2+ signaling, including simultaneous
dyssynchronous and subcellular alternans. Image scale is 314µ per side.
Movie #4. Movie of Complex Ca2+ Dynamics During Spontaneous VT in Guinea
Pig Heart.
A stable episode of VT was maintained for 3 minutes following rapid pacing.
Simultaneous dyssynchronous and subcellular alternans were present throughout the
episode of VT. Image scale is 184µ per side.