oxidation of epitaxial y(0 0 0 1) films
TRANSCRIPT

www.elsevier.com/locate/apsusc
Available online at www.sciencedirect.com
Applied Surface Science 254 (2008) 3184–3190
Oxidation of epitaxial Y(0 0 0 1) films
M. Ay a, O. Hellwig b, H.W. Becker c,B. Hjorvarsson d, H. Zabel e,*
a Laboratory for Neutron Scattering ETH & PSI, Paul Scherrer Institut, CH-5232 Villigen PSI, Switzerlandb San Jose Research Center, Hitachi Global Storage Technologies, San Jose, CA 95135, USA
c Ruhr-Universitat Bochum, Fakultat fur Physik und Astronomie, Institut fur Ionenstrahlphysik, 44780 Bochum, Germanyd Department of Physics, Uppsala University, S-751 21 Uppsala, Sweden
e Ruhr-Universitat Bochum, Fakultat fur Physik und Astronomie, Institut fur experimentelle Festkorperphysik, 44780 Bochum, Germany
Received 12 September 2007; received in revised form 28 October 2007; accepted 29 October 2007
Abstract
We have investigated the oxidation behavior of MBE grown epitaxial Y(0 0 0 1)/Nb(1 1 0) films on sapphire ð1 1 2 0Þ substrates at elevated
temperatures under atmospheric conditions with a combination of experimental methods. At room temperature X-ray diffraction (XRD) reveals the
formation of a 25 A thick YOxHx layer at the surface, while simultaneously oxide growth proceeds along defect lines normal to the film plane,
resulting in the formation of a single crystalline cubic Y2O3 (2 2 2) phase. Furthermore, nuclear resonance analysis (NRA) reveals that hydrogen
penetrates into the sample and transforms the entire Y film into the hydride YH2 phase. Additional annealing in air leads to further oxidation
radially out from the already existing oxide channels. Finally material transport during oxidation results in the formation of conically shaped oxide
precipitations at the surface above the oxide channels as observed by atomic force microscopy (AFM).
# 2007 Elsevier B.V. All rights reserved.
Keywords: Oxidation; X-ray scattering; Nuclear resonance analysis
1. Introduction
The oxidation and corrosion behavior of metals on an atomic
scale is of general interest in order to understand and to control
oxidation processes and oxide structures [1,2]. Especially
important is the use of various metal oxides as protective layers
against further oxidation or corrosion [3,4]. For the protection
of metals a variety of capping mechanisms have been
established, such as the chemical vapor deposition of coatings
[5] or thick laser coatings [6]. However, the natural growth of
thin oxide layers on metals, preventing further oxidation due to
its passivating character, such as in the case of Al, Cr, Ni, and
Zn, is the most effective form of protection [7,8]. For magneto-
electronic devices with ultra thin oxide tunneling barriers it is of
utmost importance to control the oxidation process on the
atomic scale [9,10]. Metal oxides are also of great importance
in the area of heterogeneous catalysis [11–13]. Moreover, oxide
* Corresponding author.
E-mail address: [email protected] (H. Zabel).
0169-4332/$ – see front matter # 2007 Elsevier B.V. All rights reserved.
doi:10.1016/j.apsusc.2007.10.093
layers have been used as diffusion barriers in X-ray multilayer
mirrors for very high thermal stability [14–16]. Finally, surface
oxidized yttrium films have been used as an indicator layer for
hydrogen uptake [17].
Yttrium is a metal, which shows rare earth (RE) like
structural properties, although the 4f-shell is empty. Therefore,
Y is non-magnetic, which is the main difference compared to
the rare earth metals. The crystalline growth of Y in hcp-
structure with lattice parameters of a = 3.6474 A and
c = 5.7306 A [18] resembles that of RE metals. Therefore, Y
has often been used as a spacer layer in RE superlattices for the
investigation of long-range interlayer exchange or RKKY
coupling [19–22]. Yttrium is also well known to dissolve
hydrogen in its lattice structure [23]. Usually one observes three
different possible hydrogen phases depending on the surround-
ing hydrogen pressure. Changing the external hydrogen
pressure, a reversible transition in band structure and optical
properties from a reflecting metallic conductor YH2 to a
transparent insulator YH3 is observed. This behavior and its
possible applications are currently subject of intense research
[24–27]. In connection with these research efforts the corrosion

M. Ay et al. / Applied Surface Science 254 (2008) 3184–3190 3185
behavior of Y cannot be ignored. The utilization of these effects
are not possible until the growth of Y layers can be controlled
on an atomic scale and the reaction with atmospheric gases and/
or oxygen is fully understood.
Only few studies have been reported in the literature
exploring the growth of thin Y films [28,29] and their oxidation
behavior [30,31]. Huiberts et al. [30] have investigated the
oxidation of polycrystalline Y films at room temperature (RT)
conditions. Using RBS two different kinds of oxide formation
could be identified. At the surface a continuous oxide layer
(presumably Y2O3) of about 50 A thickness forms and in
addition oxide channels of more than 1750 A deep into the Y
layer were observed.
Van der Molen et al [31] have also studied the oxidation
behavior of polycrystalline Y films at RT, however this time
with Y films that were capped with Pd layers of varying
thickness. For a 200 A thick Pd overlayer no oxygen but only
hydrogen could penetrate through the capping layer and reach
the Y film beneath. For thinner Pd cap layers of less than 50 A
thickness Pd islands are formed on the Y surface, which no
longer protect Y from oxidation. RBS studies indicated an
oxidation depth of up to 1500 A in channels along Y grain
boundaries.
Wildes et al. [32] studied epitaxial Y(0 0 0 1) layers
(thickness 1000 A) at RT, which were capped with a Au layer
of varying thickness between 0 A and 60 A. For the uncovered
Y film the pure Y(0 0 0 1) Bragg peak could be detected with
X-ray diffraction (XRD). In addition, a roughly 50 A thick
oxide layer was determined with RBS methods. However,
preferential diffusion of oxygen along grain boundaries, as
reported for polycrystalline films, was not observed. With
increasing thickness Au-islands form on the Y surface that
promote a thicker oxide layer and an increased hydrogen
concentration in the Y film. Finally at 60 A Au thickness a
coexistence of the dilute lattice gas a-phase YHx and the
hydride phase YH2 was observed by X-ray scattering. RBS
measurements revealed an oxide layer thickness of about 600 A
at the surface. But no oxide related Bragg reflections could be
detected by XRD. The authors have therefore assumed that the
oxide layer is in an amorphous state.
In the present study we report on the oxidation of thin single
crystalline epitaxially Y(0 0 0 1) films grown on Al2O3 ð1 1 2 0Þsubstrates with a Nb(1 1 0) buffer layer. The choice of substrate
and buffer is the same as in the study of Kwo et al. [33]. The
oxidation was carried out in air from RT up to 600 8C. Thus we
report here the first studies of the oxidation kinetics of
Y(0 0 0 1) films at elevated temperatures.
2. Experimental
We deposited Y(0 0 0 1) films via molecular beam epitaxy
(MBE) on epi-polished Al2O3 ð1 1 2 0Þ substrates using
Nb(1 1 0) as a buffer layer. The Al2O3 ð1 1 2 0Þ substrates
have a typical surface roughness of less than 3 A determined by
AFM, a miscut angle below 18, and a mosaicity between 0.0038and 0.0068. The substrates were cleaned ultrasonically in
acetone and ethanol and transferred into the MBE chamber with
a base pressure of 1 � 10�10 mbar. Prior to the deposition the
substrates were annealed at 1100 8C for 20 min. To optimize
the quality of the Y films, a Nb(1 1 0) buffer layer was
deposited at 900 8C with a rate of 0.3–0.5 A/s and annealed for
20 min at 950 8C [34,35]. Subsequently, after cooling the
sample down to 500 8C, the Y film was deposited likewise at a
rate of 0.3–0.5 A/s. In situ reflection high-energy electron
diffraction (E = 30 keV), low-energy electron diffraction, and
ex situ XRD measurements are used to monitor the structure
and crystal quality of the layers. The nominal thicknesses of the
deposited Y films were in the range of 30–2000 A.
After taking the Y-films out of the MBE chamber, an oxide
layer forms at the surface immediately. This condition is
referred to as the initial oxidation state at RT. After that the
samples were heated in ambient air at elevated temperature for
a defined time to reinitiate the oxidation process. Subsequent
studies were carried out at RT, where the oxidation processes is
kinetically limited, thus keeping the sample in a well-defined
state during its characterization.
X-ray reflectivity (XRR), XRD, AFM, and nuclear
resonance analysis (NRa) were performed at RT. XRR
measurements provide information about the film thickness,
the interfacial roughness and the electron density profile
perpendicular to the film plane irrespective of the crystallinity
of the sample via radial (u–2u) scans in the small-angle regime.
High-angle radial scans at a reciprocal-lattice point (Bragg
scans) provide information about the crystal structure and
orientation of the films. Additionally transverse scans through
the Bragg peak (rocking curves) reveal the out-of-plane
mosaicity of the film. In thin film studies it is beneficial to
compare the total thickness by thin film oscillations at low
angle XRR scans (also called Kiessig fringes [36]) with the
coherent film thickness expressed by Laue oscillations around
high angle Bragg peaks. Any difference is due to a loss of
crystallinity in the film structure [37]. If Laue oscillations
cannot be resolved in XRD scans, the structural coherence
length can also be determined from the FWHM using the
Debye-Scherrer formula [38]:
Lcoh ¼�
ln2
p
�1=22l
Dð2uÞ cos u(1)
The X-ray measurements were carried out with the use of
synchrotron radiation at the W1.1 beamline at HASYLAB
(l = 1.3937 A) and with a rotating anode generator at the Ruhr-
University in Bochum (Cu Ka radiation, l = 1.542 A).
For topographic properties AFM images were obtained in
contact mode using an AFM from Park Scientific Instruments.
The depth dependent chemical properties have been studied
via RBS and resonant backscattering (BS) methods. The
principle of recording a depth-profile for hydrogen or oxygen is
based on resonant nuclear reactions. For hydrogen profiling we
used the nuclear resonance reaction (15N + 1H! 12C + a + g)
with a proton resonance energy of E(15N) = 6.385 MeV. For
oxygen the resonant backscattering of alpha particles
(a + 16O + energy! a + 16O + energy) at a resonance energy
of 3.045 MeV is employed. In both cases of NRA the ion beam

Fig. 2. Bragg-scans in the direction normal to the film plane of a virgin 300 A
Y(0 0 0 1)/Nb(1 1 0)/Al2O3ð1 1 2 0Þ sample at RT in air. The entire scan is
shown in panel (b). Panels (a) and (c) focus in on parts of the scan indicated by
the shaded areas in panel (b). The Bragg reflections of Y(0 0 0 2), Y2O3(2 2 2),
a YOxHx phase, Nb(1 1 0), and Al2O3 ð1 1 2 0Þcan be identified as separate
phases.
M. Ay et al. / Applied Surface Science 254 (2008) 3184–31903186
is first tuned to the resonance energy at the surface and scatters
resonantly at surface atoms. By increasing the ion energy, ions
loose surplus energy to match the resonance energy in deeper
regions. The stopping-power is a measure for the loss of energy/
unit length and depends on ion energy, ion mass, and target
material. Thus with increasing energy the ions scatter
resonantly in different regions below the surface with the
reflection intensity being proportional to the corresponding
atom concentration [39].
3. Results and discussion
3.1. Virgin Y(0 0 0 1) film
In Fig. 1 we show a XRR scan of an as-prepared Y(0 0 0 1)/
Nb(1 1 0) film grown on a Al2O3 ð1 1 2 0Þ substrate. Data were
taken at room temperature under normal atmospheric condi-
tions using synchrotron radiation with wavelength
l = 1.3937 A. We find easily separable finite layer thickness
oscillations (Kiessig fringes) due to the 60 A Nb buffer layer as
well as the 300 A Y film. Bragg-scans (Fig. 2b) along the
growth direction show the sapphire substrate ð1 1 2 0Þ and the
Nb (1 1 0) reflection from the buffer layer. In addition, we
observe the Y(0 0 0 2) peak accompanied by Laue oscillations
corresponding to a coherent layer thickness of 300 A, which is
identical to the total Y layer thickness as obtained from the
Kiessig fringes in the XRR scan. Furthermore, we observe a
sharp bcc Y2O3 (2 2 2) Bragg reflection and a broad Y(OH)3
component (see Fig. 2a). The Gaussian fits to the line profiles
confirm two different thicknesses for Y2O3 and Y(OH)3. The
peak positions are in accordance with the published crystal
structures [40]. The broad component is shifted slightly to
higher qz-values, indicating a depletion of the Y(OH)3 lattice.
The Laue oscillations, which can be recognized around the
Y(OH)3 peak, correspond to a layer thickness of 25 A (see
Fig. 2c). Using Eq. (1) the coherence length normal to the Y2O3
(2 2 2) film (sharp component) could be determined to 300 A
(Fig. 2a), revealing that the thicknesses of the Y2O3 and the
Fig. 1. X-ray reflectivity scan of a virgin 300 A thick Y(0 0 0 1)/Nb(1 1 0)/
Al2O3ð1 1 2 0Þ sample at RT in air. Finite layer thickness oscillations from the
60 A Nb and the 300 A Y layers can be easily identified.
Y-films are roughly the same. Because of the depletion in the
Y(OH)3 layer, we will refer to it as YOxHx. From the X-ray
measurements follows that Y-oxide domains locally penetrate
through the entire film thickness (oxide channels), while
additionally a uniform 25 AYOxHx layer develops on top. AFM
measurements on the Y(0 0 0 1) surface reveal a roughness of
about 7 � 3 A in agreement with previous results by Krause
et al. [41]. A simplified structural model for this film is shown
schematically in Fig. 8a. In air and at RT this state is apparently
stable. However, the oxidation rate may be just extremely slow.
Burnham and Jameson described the oxidation kinetics of
yttrium by a direct logarithmic rate law with an initial growth
rate of 2.5 nm/month [42].
3.2. Oxidation of Y(0 0 0 1) at high temperatures
3.2.1. X-ray measurements
To continue the oxidation process, the samples were post-
annealed in air at 300 8C. The subsequent X-ray characteriza-
tion was performed at RT. Fig. 3 shows a sequence of Bragg-
scans taken after successive oxidation steps during time
intervals as indicated in the figure.
Fig. 3a displays the Bragg-scan of the virgin sample after
exposing it to air. This scan is identical to the one shown in

Fig. 3. Out-of-plane Bragg-scans of a 300 A Y(0 0 0 1)/60 A Nb(1 1 0)/
Al2O3ð1 1 2 0Þ sample after different annealing times at 300 8C in air as
indicated in the plot. For clarity the scans are shifted vertically with respect
to each other.
Fig. 4. Bragg scan of a 400 A Y(0 0 0 1)/200 A Nb(1 1 0)/Al2O3 ð1 1 2 0Þ film
oxidized at 400 8C for 6 h (completely oxidized). Due to the hydrogen lattice
gas formation the Y2O3 and Nb lattices are expanded in out-of-plane direction
by about 0.45% and 4%, respectively.
Fig. 5. Hydrogen resonance depth profile of the sample Y(0 0 0 1)/200A
Nb(1 1 0)/Al2O3ð1 1 2 0Þ (completely oxidized, same sample as shown in
Fig. 4).
M. Ay et al. / Applied Surface Science 254 (2008) 3184–3190 3187
Fig. 2a and is here reproduced for better comparison. In the first
oxidation step at 300 8C for 5 min (Fig. 3b) the Y(0 0 0 2) peak
shifts to a position corresponding to the YHx a–phase
(hydrogen lattice gas) and a new peak occurs corresponding
to the YH2 b–phase in fcc (1 1 1) direction. Despite increasing
scattering intensity no well-defined and coherent oxide
thickness can be recognized, which is explained later via ion
scattering. The original Bragg reflections of the two oxides
(Y2O3/YOxHx) are no longer visible. After the second oxidation
step at 300 8C for 0.5 h (Fig. 3c) the YHx a-phase peak has
vanished and the YH2(1 1 1) peak intensity has increased
further indicating that the transformation from Y into YH2 via
the intermediate YHX a-phase is completed. In addition new
YOxHx and Y2O3(2 2 2) reflections appear. Moreover we find
that the hydrogen continues to diffuse into the Nb buffer layer
thus causing a lattice expansion as indicated by the shift of the
Nb(1 1 0) reflection to smaller scattering vectors. The
penetration of hydrogen into Y and Nb is also confirmed by
NRA measurements. The YOxHx compound originates from
H2O, which reacts with the Y at the sample surface. Probably
due to the size, OH�-ions cannot penetrate into the sample.
Therefore, a crystalline YOxHx compound forms at the surface,
and its increasing thickness can be followed by the respective
Bragg reflection. Further annealing (scan d.–f. Fig. 3) triggers
additional oxidation of YH2 and YOxHx into Y2O3. The YH2
peak vanishes and the YOxHx peak decreases, while the
intensity of the Y2O3 reflection increases.
Fig. 4 shows a Bragg scan of a 400 A Y(0 0 0 1)/200 A
Nb(1 1 0)/Al2O3 ð1 1 2 0Þ sample oxidized for 6 h at 400 8C.
Only the Nb and the Y2O3 peak are visible after this procedure.
The Y2O3 peak is shifted to a slightly smaller scattering vector,
i.e. to an higher lattice spacing. As shown by NRA, hydrogen
stays as a lattice-gas in the Y2O3 and the Nb matrix causing a
lattice expansion of 0.45% and 4%, respectively.
3.2.2. Ion scattering
NRA methods were used to confirm the hydrogen diffusion
as the origin of the lattice expansion in the Y2O3 and Nb after
the final oxidation step as seen in Fig. 4. In Fig. 5 we show the
hydrogen-depth-profile obtained from the 15N resonance-
method. Starting from 6.34 MeV the intensity increases over
the total Y2O3 film continuously until point (a) is reached. This
point is equivalent to the Y2O3/Nb interface. Between the
Y2O3/Nb and the Nb/Al2O3 interface (point (b)), the scan shows
a maximum hydrogen concentration in the Nb lattice. At (b) the
M. Ay et al. / Applied Surface Science 254 (2008) 3184–31903188
ion beam starts to penetrate into the substrate but the scattered
hydrogen ion intensity is not instantly absent. Because of
energy straggling, the ion beam reaches an energy distribution
of�0.04 MeVat the Nb/Al2O3 interface (between point (b) and
(c)), which has to be very sharp due to the smooth interface. A
fit to the RBS measurements (not shown here) indicates a
relative proportion of Y:O:H of 2:3:1 and the hydrogen-depth-
profile verifies an increasing hydrogen concentration in the
Y2O3 until the interface to the Nb is reached. In the Nb film the
hydrogen concentration stays constant on a high level. The
proportion of oxygen in Nb measured with RBS is 1:100,
strongly indicating that the shift of the Nb Bragg reflection is
not induced by oxygen but by hydrogen, which confirms earlier
work on the oxidation of Nb [43–45].
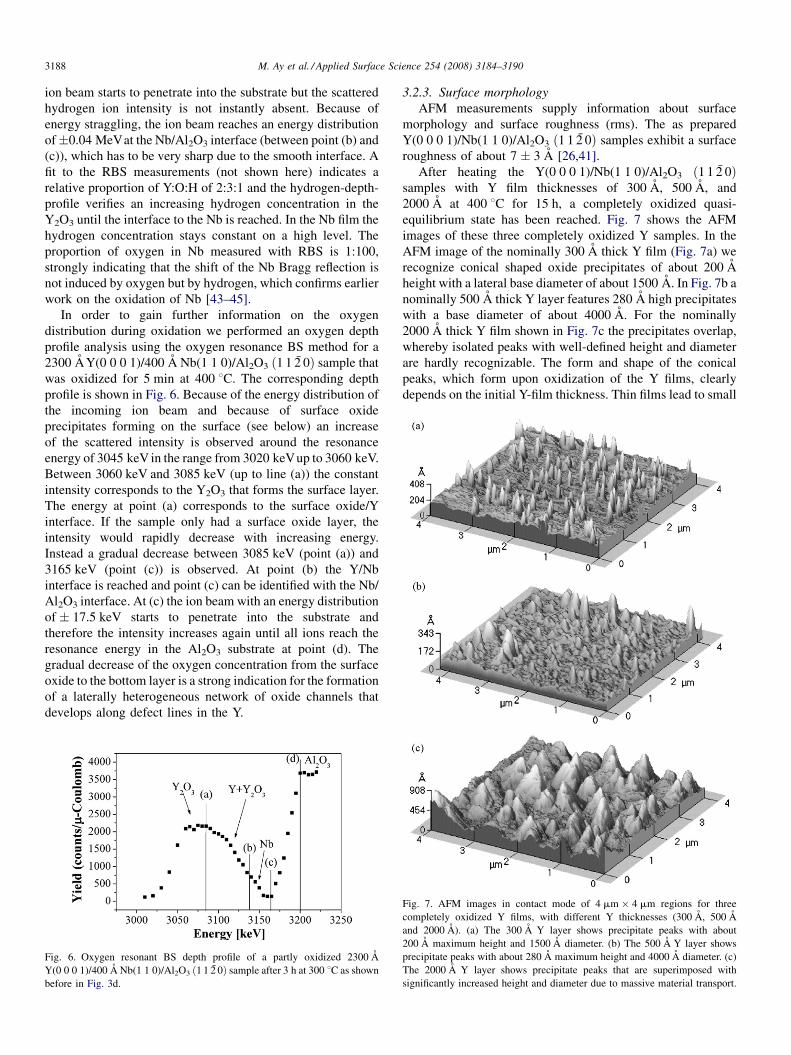
In order to gain further information on the oxygen
distribution during oxidation we performed an oxygen depth
profile analysis using the oxygen resonance BS method for a
2300 AY(0 0 0 1)/400 A Nb(1 1 0)/Al2O3 ð1 1 2 0Þ sample that
was oxidized for 5 min at 400 8C. The corresponding depth
profile is shown in Fig. 6. Because of the energy distribution of
the incoming ion beam and because of surface oxide
precipitates forming on the surface (see below) an increase
of the scattered intensity is observed around the resonance
energy of 3045 keV in the range from 3020 keVup to 3060 keV.
Between 3060 keV and 3085 keV (up to line (a)) the constant
intensity corresponds to the Y2O3 that forms the surface layer.
The energy at point (a) corresponds to the surface oxide/Y
interface. If the sample only had a surface oxide layer, the
intensity would rapidly decrease with increasing energy.
Instead a gradual decrease between 3085 keV (point (a)) and
3165 keV (point (c)) is observed. At point (b) the Y/Nb
interface is reached and point (c) can be identified with the Nb/
Al2O3 interface. At (c) the ion beam with an energy distribution
of � 17.5 keV starts to penetrate into the substrate and
therefore the intensity increases again until all ions reach the
resonance energy in the Al2O3 substrate at point (d). The
gradual decrease of the oxygen concentration from the surface
oxide to the bottom layer is a strong indication for the formation
of a laterally heterogeneous network of oxide channels that
develops along defect lines in the Y.
Fig. 6. Oxygen resonant BS depth profile of a partly oxidized 2300 A
Y(0 0 0 1)/400 A Nb(1 1 0)/Al2O3 ð1 1 2 0Þ sample after 3 h at 300 8C as shown
before in Fig. 3d.
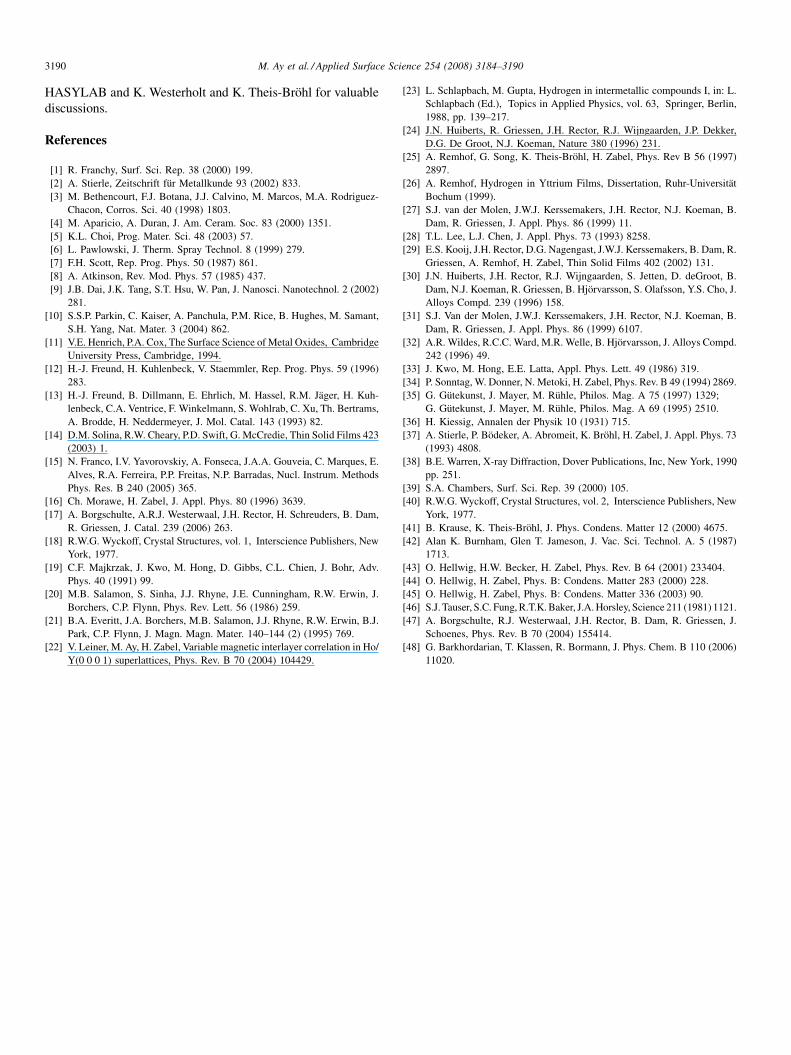
3.2.3. Surface morphology
AFM measurements supply information about surface
morphology and surface roughness (rms). The as prepared
Y(0 0 0 1)/Nb(1 1 0)/Al2O3 ð1 1 2 0Þ samples exhibit a surface
roughness of about 7 � 3 A [26,41].
After heating the Y(0 0 0 1)/Nb(1 1 0)/Al2O3 ð1 1 2 0Þsamples with Y film thicknesses of 300 A, 500 A, and
2000 A at 400 8C for 15 h, a completely oxidized quasi-
equilibrium state has been reached. Fig. 7 shows the AFM
images of these three completely oxidized Y samples. In the
AFM image of the nominally 300 A thick Y film (Fig. 7a) we
recognize conical shaped oxide precipitates of about 200 A
height with a lateral base diameter of about 1500 A. In Fig. 7b a
nominally 500 A thick Y layer features 280 A high precipitates
with a base diameter of about 4000 A. For the nominally
2000 A thick Y film shown in Fig. 7c the precipitates overlap,
whereby isolated peaks with well-defined height and diameter
are hardly recognizable. The form and shape of the conical
peaks, which form upon oxidization of the Y films, clearly
depends on the initial Y-film thickness. Thin films lead to small
Fig. 7. AFM images in contact mode of 4 mm � 4 mm regions for three
completely oxidized Y films, with different Y thicknesses (300 A, 500 A
and 2000 A). (a) The 300 A Y layer shows precipitate peaks with about
200 A maximum height and 1500 A diameter. (b) The 500 A Y layer shows
precipitate peaks with about 280 A maximum height and 4000 A diameter. (c)
The 2000 A Y layer shows precipitate peaks that are superimposed with
significantly increased height and diameter due to massive material transport.

Fig. 8. (a)–(c) Oxidation model showing schematically and simplified the main
steps of the oxidation process at ambient and elevated temperatures. (a) At
ambient temperatures oxidation proceeds through grain boundaries forming
Y2O3 channels. The remaining Y layer transforms into a Y-hydride layer YH2
covered by a 25 A thick YOxHx layer. (b) At elevated temperatures the hydrogen
concentration saturates in the Y and in the Nb layer. When saturation is reached
in the Y layer, oxidation advances at the YH2/Y2O3 interface. Small arrows
indicate the oxide growth direction at the boundary of the conical channels. The
large arrow indicates oxide material transport to the surface. (c) Final oxidation
stage is reached when the Y film is fully oxidized to Y2O3, the Nb film is
saturated with hydrogen, and oxide precipitates have formed at the surface. In
the Y2O3 some residual hydrogen remains, whereas oxygen does not penetrate
into the Nb film.
M. Ay et al. / Applied Surface Science 254 (2008) 3184–3190 3189
and isolated precipitate peaks, whereas in thicker films the
peaks coalesce and pile up. The oxidation of Y films along grain
boundaries requires perpendicular material transport, which is
seen as overgrowth in form of conical shaped precipitations.
The opening angle of the conical precipitates increases until the
oxide growth front reaches the Y/Nb interface and the oxidation
of the Y is complete. Thin films require less material transport
than thicker films and therefore the precipitates are smaller in
diameter, more uniform in size and shape, and separated from
each other.
4. Discussion and conclusion
From X-ray reflectivity and Bragg-scans it can be concluded
that after exposure to atmospheric conditions at RT, Y(0 0 0 1)
forms lateral oxide precipitates that pierce through the entire Y-
film thickness (oxide channels) and that coexists with a 25 A
thick laterally uniform YOxHx surface layer.
Continued oxidation at elevated temperature occurs at the
interface between Y/Y-oxide. Lateral oxide growth proceeds
faster at the surface than in deeper regions due to the increased
diffusion length of oxygen at the surface. Due to this
mechanism oxide channels develop a conical form that result
in an oxygen gradient normal to the film plane. Fig. 8a–c
schematically illustrate the main steps of the oxidation process
at elevated temperatures. First Y2O3 forms along deep channels
and expands laterally (Fig. 8a), resulting in randomly
distributed conical shaped oxygen precipitates. The oxygen
depth profile of a partly oxidized sample confirms a gradual
decrease of the oxygen intensity with increasing penetration
depth. At the same time hydrogen penetrates into the sample
and transforms the entire Y film into the hydride YH2 phase.
Hydrogen continues diffusing into the Nb film, thus causing a
lattice expansion of up to 4% in the Nb buffer layer. After
hydrogen-saturation is reached in the Y layer, oxidation
advances at the YH2/Y2O3 interface (Fig. 8b). Small arrows
indicate the oxide growth direction at the boundary of the
conical channels. The large arrow indicates that previously
formed oxide is now pushed to the surface, where it forms oxide
precipitates on top of the oxidation channels (Fig. 8c). The
NRA measurements confirm that a hydrogen gradient remains
in the Y oxide, while the Nb film is saturated with hydrogen.
In conclusion, we have investigated the oxidation behavior of
MBE grown epitaxial Y(0 0 0 1)/Nb(1 1 0) films on sapphire
ð1 1 2 0Þ substrates at elevated temperatures under atmospheric
conditions. The results show that the oxidation of Y films is much
more complex than for other metal films, because of the affinity
of yttrium to hydrogen. Thus the oxidation proceeds in two steps:
First a thin YOxHx layer forms at the surface, which acts as a
hydrogen source and transforms the remaining Y metal film in a
Y-hydride layer YH2. In second step and after prolonged heating,
the hydride layer is replaced by the oxide Y2O3. The second step
requires material transport to the surface, resulting in the
formation of conically shaped oxide precipitates on top of the
oxide layer. Hydrogen and oxygen depth profiles reveal that
hydrogen diffuses through the Y-oxide layer into the Nb buffer,
while oxygen transport stops at the Y/Nb interface.
In closing, we would like to remark that the role of hydrogen
and its interaction with metal oxides in general and more
specifically with yttrium oxides is of high relevance for the
heterogeneous catalysis [46,47] and for hydrogen storage [48].
In this context it is interesting to note that surface oxidized
yttrium is capable of splitting water.
Acknowledgements
We would like to thank W. Caliebe and O. Seeck (HASYLAB,
Hamburg) for their assistance during measurements at the
M. Ay et al. / Applied Surface Science 254 (2008) 3184–31903190
HASYLAB and K. Westerholt and K. Theis-Brohl for valuable
discussions.
References
[1] R. Franchy, Surf. Sci. Rep. 38 (2000) 199.
[2] A. Stierle, Zeitschrift fur Metallkunde 93 (2002) 833.
[3] M. Bethencourt, F.J. Botana, J.J. Calvino, M. Marcos, M.A. Rodriguez-
Chacon, Corros. Sci. 40 (1998) 1803.
[4] M. Aparicio, A. Duran, J. Am. Ceram. Soc. 83 (2000) 1351.
[5] K.L. Choi, Prog. Mater. Sci. 48 (2003) 57.
[6] L. Pawlowski, J. Therm. Spray Technol. 8 (1999) 279.
[7] F.H. Scott, Rep. Prog. Phys. 50 (1987) 861.
[8] A. Atkinson, Rev. Mod. Phys. 57 (1985) 437.
[9] J.B. Dai, J.K. Tang, S.T. Hsu, W. Pan, J. Nanosci. Nanotechnol. 2 (2002)
281.
[10] S.S.P. Parkin, C. Kaiser, A. Panchula, P.M. Rice, B. Hughes, M. Samant,
S.H. Yang, Nat. Mater. 3 (2004) 862.
[11] V.E. Henrich, P.A. Cox, The Surface Science of Metal Oxides, Cambridge
University Press, Cambridge, 1994.
[12] H.-J. Freund, H. Kuhlenbeck, V. Staemmler, Rep. Prog. Phys. 59 (1996)
283.
[13] H.-J. Freund, B. Dillmann, E. Ehrlich, M. Hassel, R.M. Jager, H. Kuh-
lenbeck, C.A. Ventrice, F. Winkelmann, S. Wohlrab, C. Xu, Th. Bertrams,
A. Brodde, H. Neddermeyer, J. Mol. Catal. 143 (1993) 82.
[14] D.M. Solina, R.W. Cheary, P.D. Swift, G. McCredie, Thin Solid Films 423
(2003) 1.
[15] N. Franco, I.V. Yavorovskiy, A. Fonseca, J.A.A. Gouveia, C. Marques, E.
Alves, R.A. Ferreira, P.P. Freitas, N.P. Barradas, Nucl. Instrum. Methods
Phys. Res. B 240 (2005) 365.
[16] Ch. Morawe, H. Zabel, J. Appl. Phys. 80 (1996) 3639.
[17] A. Borgschulte, A.R.J. Westerwaal, J.H. Rector, H. Schreuders, B. Dam,
R. Griessen, J. Catal. 239 (2006) 263.
[18] R.W.G. Wyckoff, Crystal Structures, vol. 1, Interscience Publishers, New
York, 1977.
[19] C.F. Majkrzak, J. Kwo, M. Hong, D. Gibbs, C.L. Chien, J. Bohr, Adv.
Phys. 40 (1991) 99.
[20] M.B. Salamon, S. Sinha, J.J. Rhyne, J.E. Cunningham, R.W. Erwin, J.
Borchers, C.P. Flynn, Phys. Rev. Lett. 56 (1986) 259.
[21] B.A. Everitt, J.A. Borchers, M.B. Salamon, J.J. Rhyne, R.W. Erwin, B.J.
Park, C.P. Flynn, J. Magn. Magn. Mater. 140–144 (2) (1995) 769.
[22] V. Leiner, M. Ay, H. Zabel, Variable magnetic interlayer correlation in Ho/
Y(0 0 0 1) superlattices, Phys. Rev. B 70 (2004) 104429.
[23] L. Schlapbach, M. Gupta, Hydrogen in intermetallic compounds I, in: L.
Schlapbach (Ed.), Topics in Applied Physics, vol. 63, Springer, Berlin,
1988, pp. 139–217.
[24] J.N. Huiberts, R. Griessen, J.H. Rector, R.J. Wijngaarden, J.P. Dekker,
D.G. De Groot, N.J. Koeman, Nature 380 (1996) 231.
[25] A. Remhof, G. Song, K. Theis-Brohl, H. Zabel, Phys. Rev B 56 (1997)
2897.
[26] A. Remhof, Hydrogen in Yttrium Films, Dissertation, Ruhr-Universitat
Bochum (1999).
[27] S.J. van der Molen, J.W.J. Kerssemakers, J.H. Rector, N.J. Koeman, B.
Dam, R. Griessen, J. Appl. Phys. 86 (1999) 11.
[28] T.L. Lee, L.J. Chen, J. Appl. Phys. 73 (1993) 8258.
[29] E.S. Kooij, J.H. Rector, D.G. Nagengast, J.W.J. Kerssemakers, B. Dam, R.
Griessen, A. Remhof, H. Zabel, Thin Solid Films 402 (2002) 131.
[30] J.N. Huiberts, J.H. Rector, R.J. Wijngaarden, S. Jetten, D. deGroot, B.
Dam, N.J. Koeman, R. Griessen, B. Hjorvarsson, S. Olafsson, Y.S. Cho, J.
Alloys Compd. 239 (1996) 158.
[31] S.J. Van der Molen, J.W.J. Kerssemakers, J.H. Rector, N.J. Koeman, B.
Dam, R. Griessen, J. Appl. Phys. 86 (1999) 6107.
[32] A.R. Wildes, R.C.C. Ward, M.R. Welle, B. Hjorvarsson, J. Alloys Compd.
242 (1996) 49.
[33] J. Kwo, M. Hong, E.E. Latta, Appl. Phys. Lett. 49 (1986) 319.
[34] P. Sonntag, W. Donner, N. Metoki, H. Zabel, Phys. Rev. B 49 (1994) 2869.
[35] G. Gutekunst, J. Mayer, M. Ruhle, Philos. Mag. A 75 (1997) 1329;
G. Gutekunst, J. Mayer, M. Ruhle, Philos. Mag. A 69 (1995) 2510.
[36] H. Kiessig, Annalen der Physik 10 (1931) 715.
[37] A. Stierle, P. Bodeker, A. Abromeit, K. Brohl, H. Zabel, J. Appl. Phys. 73
(1993) 4808.
[38] B.E. Warren, X-ray Diffraction, Dover Publications, Inc, New York, 1990,
pp. 251.
[39] S.A. Chambers, Surf. Sci. Rep. 39 (2000) 105.
[40] R.W.G. Wyckoff, Crystal Structures, vol. 2, Interscience Publishers, New
York, 1977.
[41] B. Krause, K. Theis-Brohl, J. Phys. Condens. Matter 12 (2000) 4675.
[42] Alan K. Burnham, Glen T. Jameson, J. Vac. Sci. Technol. A. 5 (1987)
1713.
[43] O. Hellwig, H.W. Becker, H. Zabel, Phys. Rev. B 64 (2001) 233404.
[44] O. Hellwig, H. Zabel, Phys. B: Condens. Matter 283 (2000) 228.
[45] O. Hellwig, H. Zabel, Phys. B: Condens. Matter 336 (2003) 90.
[46] S.J. Tauser, S.C. Fung, R.T.K. Baker, J.A. Horsley, Science 211 (1981) 1121.
[47] A. Borgschulte, R.J. Westerwaal, J.H. Rector, B. Dam, R. Griessen, J.
Schoenes, Phys. Rev. B 70 (2004) 155414.
[48] G. Barkhordarian, T. Klassen, R. Bormann, J. Phys. Chem. B 110 (2006)
11020.