outward fdi from poland and its policy context, 2012
TRANSCRIPT
Columbia FDI Profiles Country profiles of inward and outward foreign direct investment
issued by the Vale Columbia Center on Sustainable International Investment January 14, 2013
Editor-in-Chief: Karl P. Sauvant Editor: Padma Mallampally Managing Editor: Mimi Wu
Outward FDI from Poland and its policy context, 2012 by
Zbigniew Zimny∗
During the transition toward a market economy, Poland’s outward foreign direct investment
(OFDI) was small and limited to trade-supporting activities in key export markets for many
years. It took off and started growing rapidly only from 2005, when the Polish private sector had
matured enough to start generating home-grown multinational enterprises (MNEs). Some state-
owned enterprises (SOEs) also began investing abroad, sometimes with the Government’s
encouragement. In contrast, Poland adopted a laissez-faire policy toward private companies,
leaving the emergence and expansion of private MNEs to market forces. In addition, Poland
became a source and a transit country for large intra-corporate cross-border flows of funds
within both foreign and Polish MNEs, classified as FDI flows, and inflating OFDI data. During
the global economic turbulence of 2008–2011, Polish MNEs continued to invest abroad at quite
elevated levels. Their profitability still depends to a considerable extent on the domestic market,
and the Polish economy has performed well during the crisis and the subsequent economic
slowdown in Europe.
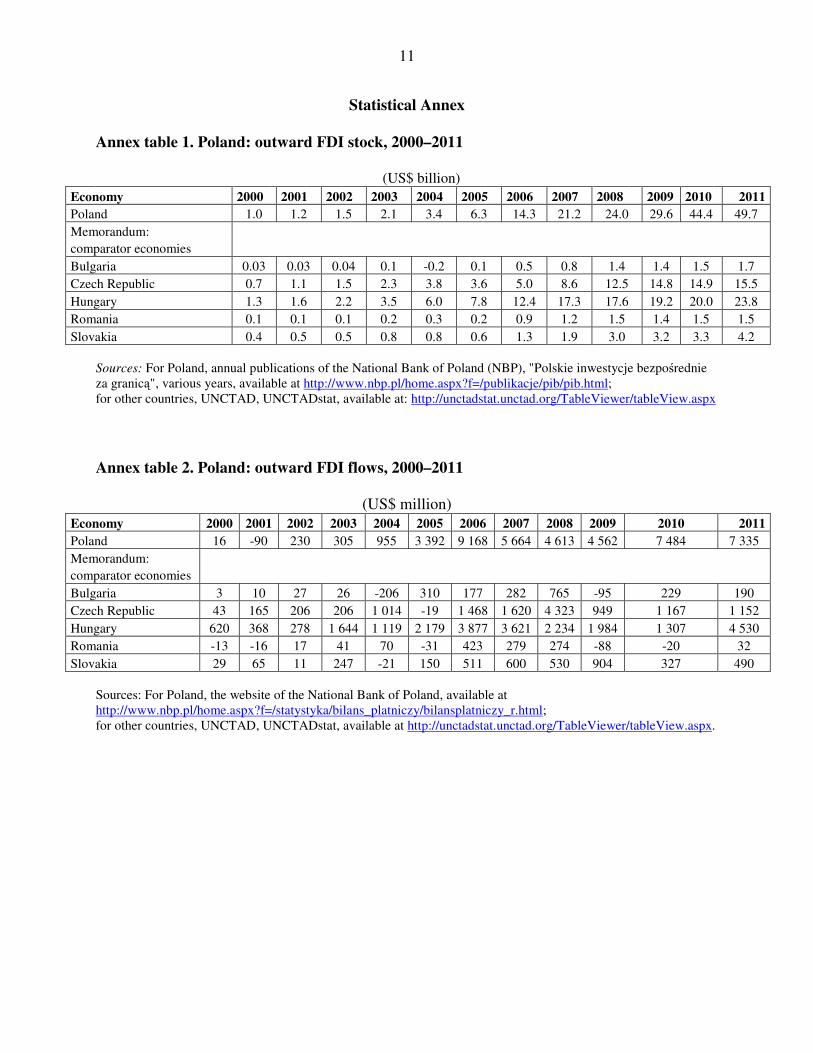
Trends and developments1 Poland is, in absolute terms, the largest source of outward FDI among the new European Union (EU) members, with an OFDI stock of US$ 50 billion in 2011 (annex table 1). However, it loses the leading position, becoming an average performer among those countries when OFDI is
∗ Zbigniew Zimny ([email protected]) is Professor of International Economics at the Academy of Finance and Business Vistula in Warsaw and consultant to international organizations. He worked for 20 years at the United Nations in New York and Geneva, doing and managing research on FDI and MNE issues. The author wishes to thank Katarzyna Blanke-Ławniczak, Kalman Kalotay and Witold Wilinski for their helpful comments. The views expressed by the author of this Profile do not necessarily reflect opinions of Columbia University, its partners and supporters. Columbia FDI Profiles is a peer-reviewed series. 1 The historical background and the longer-term development of Polish OFDI and its main determinants were analyzed in a previous Columbia FDI Profile (see Zbigniew Zimny, “Outward FDI from Poland and its policy context,” Columbia FDI Profiles, June 24, 2011, ISSN; 2159-2268, available at: www.vcc.columbia.edu). The present Profile is an update of that Profile and extends the analysis to developments with respect to OFDI in 2011 and 2012.
2
compared to the size of its economy or its population. For example, in 2011, Hungary, with an outward FDI stock much smaller than that of Poland, had a much higher ratio of OFDI stock to GDP (17% versus 10%). Other new EU member countries, such as Estonia and Slovenia, were also ahead of Poland in terms of the OFDI to GDP ratio and OFDI stock per capita.2 Most of Poland’s OFDI stock (93%) has been accumulated since 2005. In the early 1990s, in the initial phase of the transition to a market economy, Poland (like other economies in transition) relied on inward FDI (IFDI) to realize one of the key tasks of the transition: creating and strengthening the private sector. IFDI took the form of cross-border acquisitions related to privatizations in such industries as telecommunications, banking and, partly, power generation, as well as greenfield FDI projects in a wide range of industries.3 At the same time, private Polish firms were emerging, although it took time before they could expand abroad via FDI. Most of the companies that have remained under the control of the State were commercialized, and some of them also started investing abroad, often encouraged by their owner. As a result of the emergence and rapid growth of OFDI, not only IFDI but also outward FDI started contributing to the internationalization of the Polish economy through international production. Although the ratio of OFDI stock to IFDI stock is still rather small (25% in 2011, compared to 126% in the European Union), it has grown rapidly from 3% in 2000 and 7% in 2005.4 Country-level developments
Poland’s OFDI took off and started growing rapidly only six or seven years ago. During 1994–2003, average annual FDI outflows were less than US$ 100 million, fluctuating between US$ 90 million in 2001 and US$ 316 million in 1998. Outflows were concentrated in such trade-supporting activities as trading and marketing, finance, transportation, and storage in key export markets in Europe.5 Flows then jumped to an annual average of over US$ 5 billion during 2004–2011, reaching a peak in 2006, with more than US$ 9 billion (annex table 2).6 In 2006, the
2 Author’s calculations and UNCTAD FDI/TNC data base, available at: http://unctad.org/en/Pages/DIAE/World%20Investment%20Report/Annex-Tables.aspx. 3 Today, foreign firms form an important part of the Polish economy, accounting for some 40% of the assets and sales of all enterprises in the country. Some of them undertake FDI from Poland on behalf of their parent firms (see, Zbigniew Zimny, “Poland: Inward FDI and its policy context, 2010,” in Karl P. Sauvant, Thomas Jost, Ken Davies, and Ana- Maria Poveda Garces, eds., Inward and Outward FDI Country Profiles (New York: Vale Columbia Center on Sustainable International Investment of Columbia University, 2011), available at: http://www.vcc.columbia.edu/files/vale/content/Profile_eBook_PDF_2_11.pdf. 4 Calculated on the basis of data from Narodowy Bank Polski, Międzynarodowa pozycja inwestycyjna – dane roczne, available at http://www.nbp.pl/home.aspx?f=/statystyka/m_poz_inwest.html; and UNCTAD, World
Investment Report 2012: Towards a New Generation of Investment Policies (New York and Geneva: United Nations, 2012), p. 173. 5 The share of these activities in total OFDI stock was 90% in 1996, and still as high as 73% in 2000. Later on, FDI in trade-supporting activities continued to grow, but as FDI in other activities took off, its share fell to 20% in 2005 (data are from Narodowy Bank Polski, Departament Statystyki, “Polskie inwestycje bezposrednie za granica w latach 1996-2002” (Warsaw, February 2009). 6 For a detailed analysis of Polish OFDI during 2003–2006, see K. Blanke-Ławniczak, “Outward FDI from Central-East European economies in transition: Case of Poland”, in W. M. Grudzewski, I. Hejduk and S. Trzcieliński, eds., Organizations in Changing Environment: Current Problems, Concepts and Methods of Management (Madison: IEA Press, 2007), pp. 128–141.
3
largest Polish oil refining and distribution company, the state-owned PKN Orlen, purchased a refinery in Mažeikiu (Lithuania). This was by far, until very recently (see below), the largest Polish OFDI project.7 As in many economies, Polish OFDI flows were lower during the worldwide financial and economic crisis of 2008–2009 than in the pre-crisis year, 2007, when they amounted to US$ 5.7 billion. But the decreases were not drastic, and the annual levels of outflows were quite resilient, at US$ 4.6 billion in both 2008 and 2009. After that, outflows recovered, reaching around US$ 7.4 billion in both 2010 and 2011 (annex table 2). Positive and quite elevated FDI outflows have augmented the country’s OFDI stock significantly, from some US$ 21 billion in 2007, to US$ 50 billion in 2011 (annex table 1). The positive OFDI record during the crisis can be mainly attributed to Poland’s relatively good economic performance. At the height of the crisis in 2009, Poland was the only EU member with a real GDP growth (1.6%), while in 2010 the economy grew at 3.9%, and in 2011 at 4.3% ― one of the best performances among the EU countries.8 Polish MNEs still rely mostly on the domestic market for their sales, and a good situation at home meant that the crisis did not adversely affect their profitability and capacity to invest abroad. The rapid growth of Polish OFDI flows and, consequently, Poland’s OFDI stock, reflects two factors. The first is the emergence of Polish public and private MNEs—that is, domestic state-owned and private firms that became competitive enough to seek opportunities abroad not only through exports but also by producing goods and/or services in countries other than their own (see the section on corporate players below). Second, a substantial amount of recorded FDI flows from (and to) Poland consists of intra-corporate flows of funds within units of MNEs (including Polish MNEs) to other economies, undertaken for tax and regulation-related reasons. This “transit capital” FDI has been reported separately in the statistics since 2004 (when it occurred for the first time), but only for selected years for flows (but all years for stocks). Not representing investment involving lasting interest in production activity in the host economy,9 such flows of funds distort the picture of both inward and outward FDI of the countries concerned. During 2005–2007, transit capital represented 33% to 44% of Poland’s FDI outflows, and two host countries (Luxembourg and
7 In 2006, PKN Orlen acquired 53.7% of the shares of Mažeikių Nafta from the bankrupt Russian firm Yukos
International UK BV for US$ 1.5 billion and an additional 30.66% from the Government of Lithuania for US$ 852 million; see Ministerstwo Gospodarki, Departament Analiz i Prognoz “Polskie Inwestycje Bezpośrednie 2006/2007” (Warsaw: March 2008), mimeo., p.16. 8 See, Eurostat, Real GDP growth rate – volume, available at http://epp.eurostat.ec.europa.eu/tgm/printTable.do?tab=table&plugin=1&language=en&pcode=tec00115&printPreview=true#. 9 Foreign affiliates in Poland, established to channel these flows are called “Special Purpose Entities” (SPEs). They have minimal or no employment and do not produce anything; they only transfer capital among units of an MNE (often a financial group) located in different countries or undertake other (unspecified) financial operations on their behalf. The characteristic feature of this capital is that it arrives in a transit host country (and, satisfying statistical concepts, is registered there as inward FDI flow) and, typically in the same year it is invested by an SPE in another country (and, satisfying statistical concepts, is registered as outward FDI flow).
4
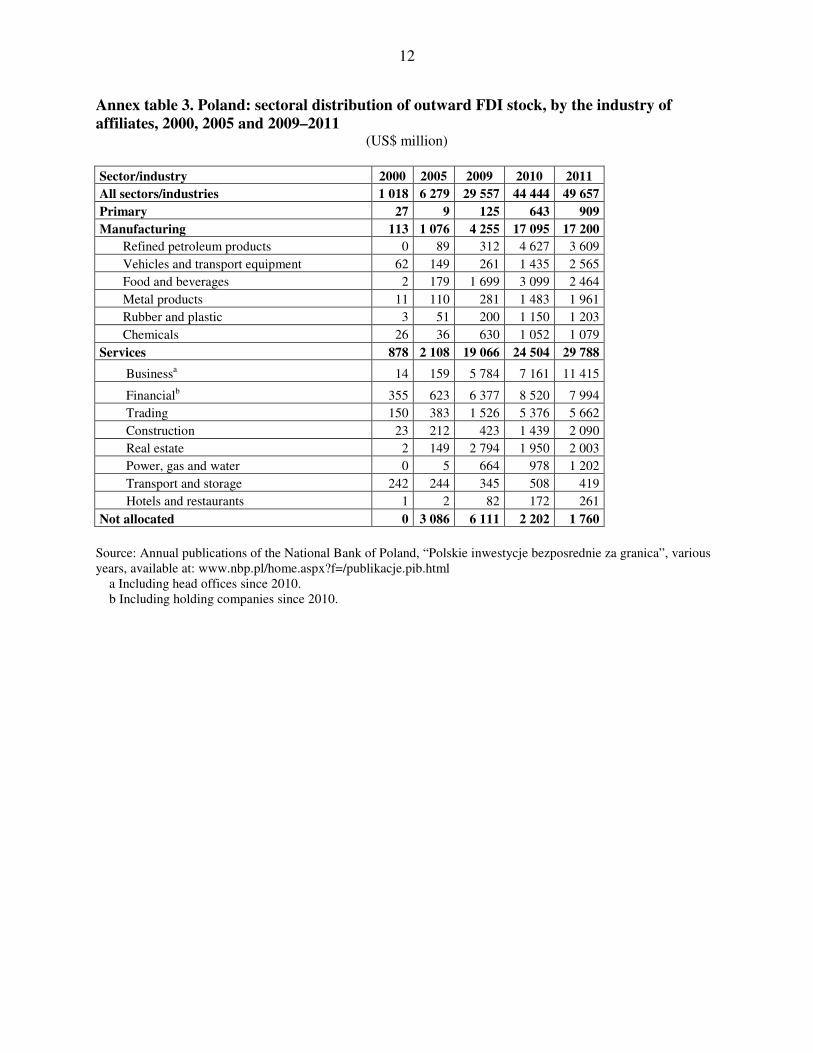
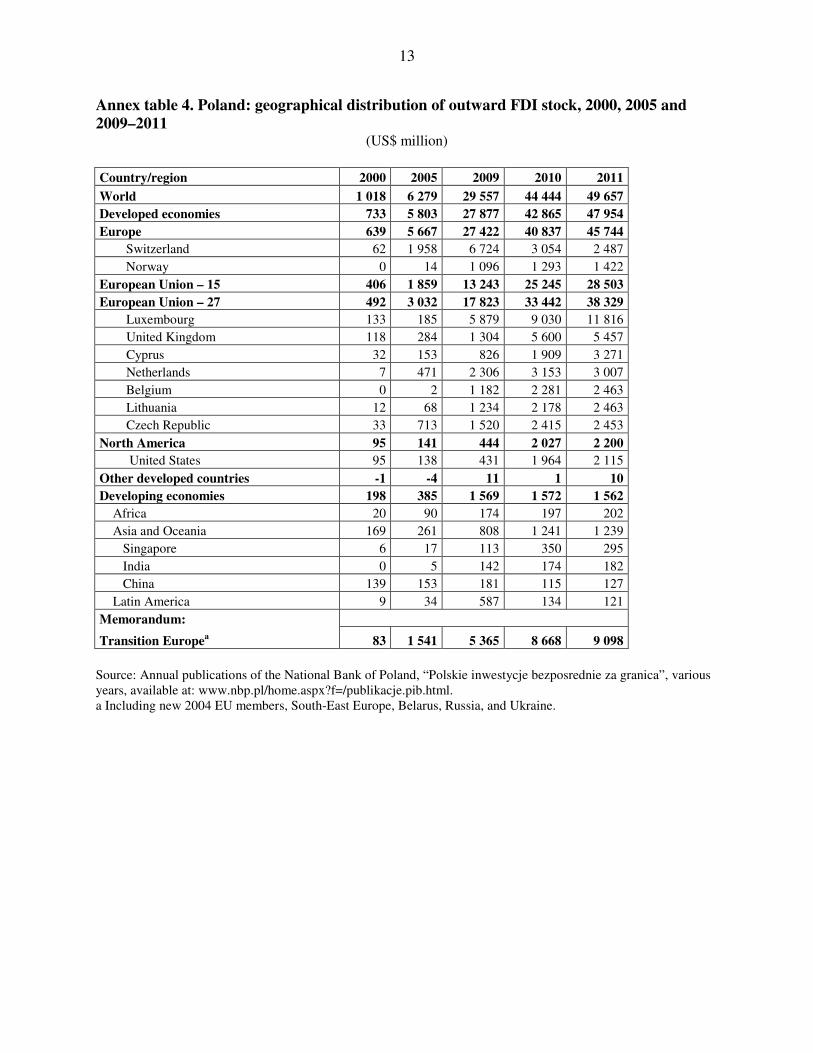
Switzerland) accounted for all of it.10 During 2010–2011, this share was lower, some 27%. 11 As regards Poland’s OFDI stock, during 2005–2011, the share of such Special Purpose Entities (SPEs) fluctuated between over 41% in 2006 and over a quarter in 2010–2011.12 This suggests that, at least recently, less than three quarters of Poland’s outward FDI represents international production of MNEs, or “genuine” FDI. However, a closer look at the industry and geographical composition of Poland’s OFDI stock suggests that the share of genuine FDI in total OFDI stock may be less than one half of the OFDI stock, and perhaps even less than that. First, as regards the industry composition of the outward stock, the category of “activities non-classified elsewhere” (i.e., activities that do not fit the standard classification of industries) accounted for nearly half of the OFDI stock in 2005 (annex table 3), and two thirds of the total outward stock in 2006–2007, resulting, most likely, at least partly from the transfers of funds,13 And although the non-allocated category’s share has gone down considerably since 2008 (annex table 3), the decline is due to a re-allocation of FDI stock data that may not reflect the real picture. Secondly, and more importantly, as regards the geographical composition of OFDI stock, in 2011 over 57% of the stock was located in six economies (annex tables 4 and 4a): Luxembourg (US$ 11.8 billion), the United Kingdom (US$ 5.4 billion), Cyprus (US$ 3.3 billion), the Netherlands (US$ 3 billion), Switzerland (US$ 2.5 billion), and Belgium (US$ 2.5 billion). These economies are known for being sources and destinations of intra-corporate fund transfers as well as convenient locations for registering companies (including holding companies) for tax and financing reasons. Thus, the genuine Polish FDI stock is not confirmed by the inward FDI data from these countries.14 Nor are records
10 Narodowy Bank Polski, Departament Statystyki, “Polskie inwestycje bezpośrednie za granicą w 2007 roku” (Warsaw: December 2008), p. 11. 11 Narodowy Bank Polski, Departament Statystyki, “Polskie inwestycje bezpośrednie za granicą w 2011 roku” (Warsaw: October 29, 2012), pp. 1 and 3. 12 Narodowy Bank Polski, "Międzynarodowa pozycja inwestycyjna Polski w 2007 roku" (Warsaw: 2008), p. 44; and "Międzynarodowa pozycja inwestycyjna Polski w 2011 roku" (Warsaw: September 2012), p. 44. 13 In 2008, OFDI stock in “other non-classified activities” was reported to be US$ 5.7 billion, down from an average annual stock of over US$ 12 billion during 2006–2007. The difference represented a re-allocation of stock in that year to “banking”, ”other financial services” and “other business services”, in an apparent attempt to assign it to industries. As a result, the OFDI stock in these industries “increased” drastically between 2007 and 2008, from US$ 0.8 billion to US$ 5.7 billion in banking and other financial services, and from US$ 0.2 billion to US$ 4.6 billion in other business services (see NBP, Departament Statystyki, “Polskie inwestycje bezpośrednie za granicą”, issues for years 2006, 2007, 2008 and 2009). OFDI stock in non-allocated activities was similarly low in 2009, at US$ 6.1 billion. Beginning in 2010, the industry codes have been changed from Polish ones to Eurostat codes. This has resulted in the reduction of OFDI stock in non-allocated activities to 3.5 per cent of the total and in skyrocketing OFDI stock in some industries, which does not seem to be supported by economic reality. Notably, the stock in banking increased to US$ 7.7 billion (from US$ 3.6 billion in 2008, not only at the cost of non-allocated activities but also “other financial services”, where the stock was reduced from US$ 2.7 billion to US$ 0.4 billion), that in business services to US$ 7.2 billion in 2011 and that in manufacturing to over US$ 17 billion in both 2010 and 2011, from US$ 4.2 billion in 2009 (NBP, Departament Statystyki, “Polskie inwestycje bezposrednie za granica,” issues for 2010 and 2011). 14 For 2006, e. g., Dutch data indicated a Polish FDI stock of US$ 21 million and those for the United Kingdom US$ 171 million (Ministerstwo Gospodarki, op. cit., 2008, p. 23). In an updated 2011 report, the Ministry of the Economy stated that information collected from monitoring specialized press and Polish embassies in at least three of these countries (Luxembourg, the Netherlands and Switzerland) “does not indicate that Polish investors have undertaken [in these countries] investment projects suggested by statistical data” (Ministerstwo Gospodarki, Departament Analiz i Prognoz “Polskie Inwestycje Bezpośrednie w 2009 roku”, Warsaw, May 2011, mimeo., pp. 20–21). The OECD reports for 2010 inward FDI stock from Poland amounting to US$ 1.6 billion in the Netherlands
5
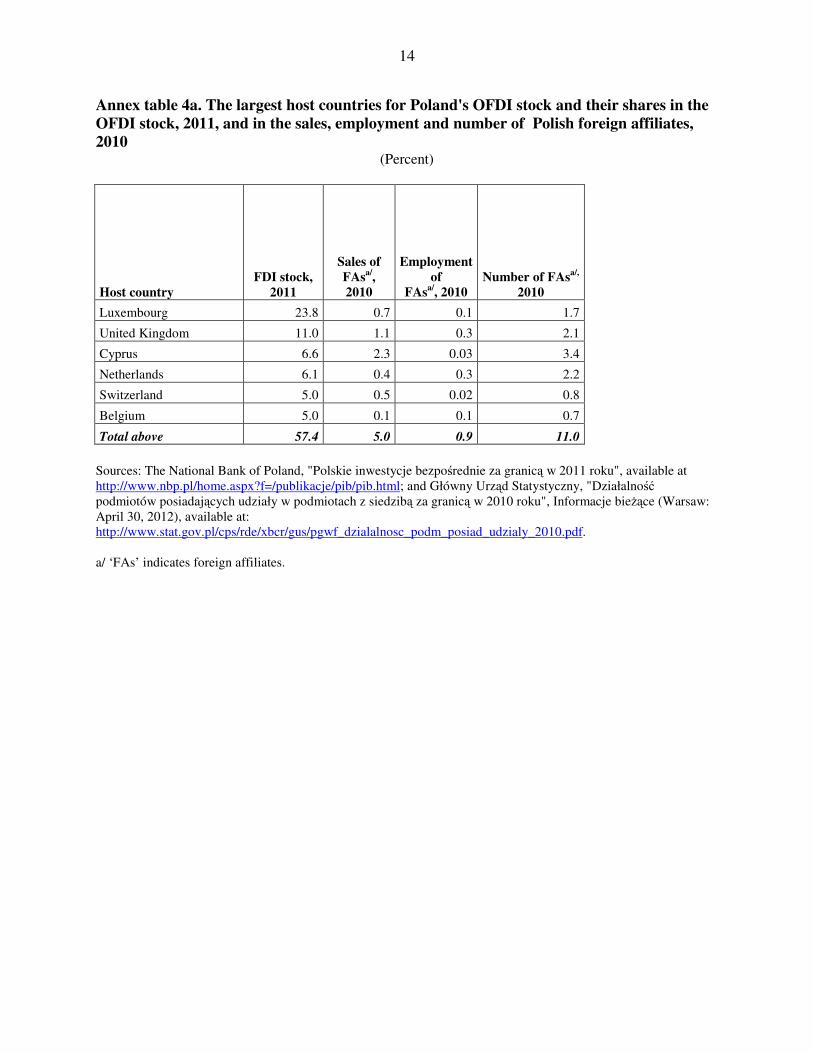
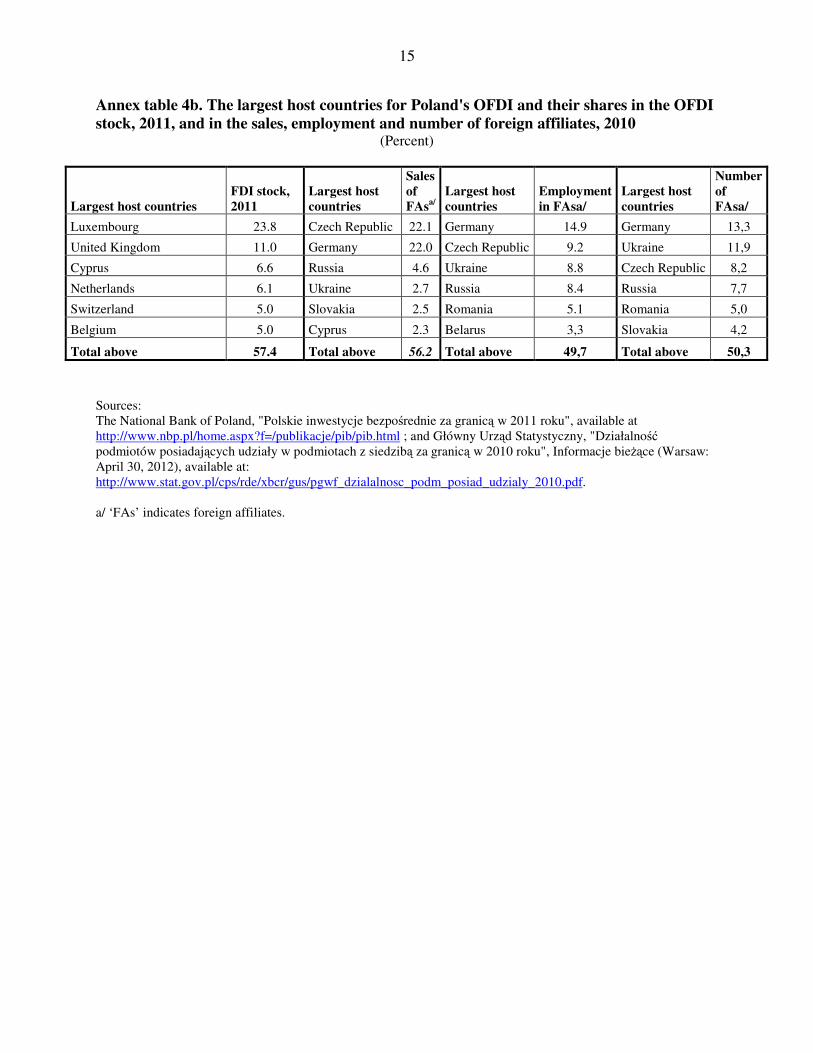
of Polish OFDI stock supported by information on other indicators of production activities of Polish foreign affiliates in these economies (see discussion below, of the geographic distribution): as shown in annex table 4a, the six economies mentioned accounted for less than 1% of the total employment and 5% of total sales of Polish foreign affiliates world-wide. When, instead of FDI stock, foreign affiliates’ sales or employment numbers are taken as measures of the international production of Polish MNEs, the geographical distribution of this production becomes similar to that predicted by the theory of the internationalization of enterprises:15 with one exception (Cyprus for the sales of foreign affiliates), the most important five (for sales) to six (for employment) host countries for Polish foreign affiliates are its neighbors or nearby countries of Central and Eastern Europe (including both members and non-members of the European Union): Germany, Czech Republic, Ukraine, Russia, Slovakia, Romania, and Belarus. Together, they account for 50% of the total number and total employment of Polish foreign affiliates and, excluding Cyprus, for 56% of those affiliates’ total sales (annex table 4b). As regards the sectoral composition of Poland’s outward FDI stock, services account for the largest stock, with business services (US$ 11.4 billion in 2011, including, since 2010, head offices and “management consultancy activities”, accounting for the bulk of this category) and financial services (US$ 8 billion in 2011, including, since 2010, holding companies) the largest service-categories for OFDI (annex table 3). They are followed by trading services (US$ 5.7 billion in 2011, which increased from US$ 1.5 billion in 2009, after the 2010 re-classification of OFDI by activities). The steadily growing OFDI in manufacturing, which rose from a stock of US$ 100 million in 2000 to US$ 1 billion in 2005 and US$ 4.3 billion in 2009, originating from small and medium-sized Polish companies, is noteworthy. Most large manufacturing companies are foreign-owned, and they do not undertake significant FDI from Poland. After re-classification, as mentioned earlier, the OFDI stock in manufacturing skyrocketed to US$ 17.2 billion. Because of re-classification, the industry data on OFDI stock should be treated with caution, in particular, as regards comparisons over time. As noted below (see the next sub-section on the corporate players), when the employment in foreign affiliates of Polish MNEs is taken as a measure, services remain the largest sector for OFDI; in terms of sales, however, foreign affiliates of manufacturing parents account for the largest share of the total. The corporate players
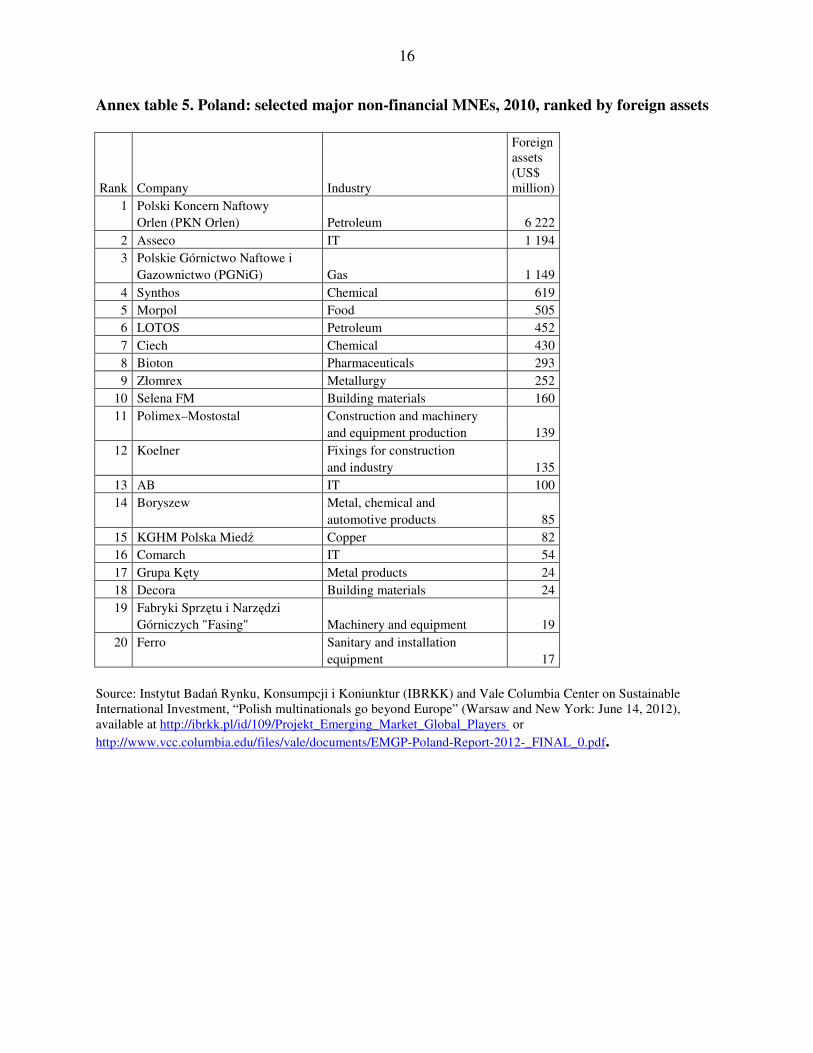
Major Polish MNEs include a number of state-owned (or state-controlled) enterprises (SOEs) in the petroleum (PKN Orlen, LOTOS), gas (PGNiG) and chemical (Ciech) industries (annex table
(up from US$ 357 million in 2009), US$ 750 million in Belgium (up from some US$ 268 million in 2009), US$ 41 million in the United Kingdom and no stock in Luxembourg (OECD.StatExtracts, available at http://stats.oecd.org/). But, according to the same source, Polish affiliates in the Netherlands produced merely US$ 11 million of value added (in 2009), suggesting that their investments are of a purely financial nature. 15 John Dunning and Sarianna Lundan, Multinational Enterprises and the Global Economy (Cheltenham: Edward Elgar, 2008), pp. 91–93. For a review of some of these theories by Polish authors, see R. Ławniczak and K. Blanke-Ławniczak, “Reverse globalization: the new phenomenon in the world economy of 21st century”, in D. Kopycińska, ed., Economic Challenges of Contemporary World (Szczecin: University of Szczecin, Microeconomics Department, 2010), pp. 21–35.
6
5). PKN Orlen had become the largest Polish MNE through the purchase of the Mažeikiu refinery in Lithuania, as noted earlier. PGNiG made some investments in Libya, Norway, Egypt, and the Czech Republic. Another SOE in the copper industry, KGHM Polska Miedź, joined the ranks of the largest Polish MNEs in terms of foreign assets in March 2012 after acquiring a Canadian copper mining company, Quadra FNX Mining, for US$ 2.8 billion.16 On this occasion, it changed its name to KGHM International. In addition to SOEs that are MNEs, selected key private players are listed in table 5. The largest among them (in terms of foreign assets) is, quite unexpectedly, Asseco Poland. It operates in the software industry, which is not characterized by large physical assets and large companies. It has grown large abroad through an aggressive foreign acquisitions campaign pursued over a decade. In 2009 and 2010, Asseco acquired a further six companies in Croatia, Denmark, Romania, Spain, and Turkey, for a total of US$ 67 million (annex table 6). Consequently, it became the largest software company in Central and Eastern Europe, and number seven on the list of the largest software firms in Europe, with total revenues of over US$ 1.6 billion and employment of 14,000 (out of which 9,500 were abroad) in 2011.17 Two other IT industry companies in annex table 5, Comarch (also a software producer, 50th among Europe’s top 100 software vendors) and AB (a distributor of software and IT equipment), are much smaller than Asseco. All other private MNEs listed in the table are manufacturing companies. Three additional MNEs in the food, wood and roof windows industries (not included in annex table 5) are worth mentioning:
• Maspex Wadowice Group, one of the largest food industry companies in Central and Eastern Europe, specializes in beverages, with sales of US$ 853 million and employment of 5,000 in 2009. Foreign sales are 40% of total sales and include exports to some 50 countries, as well as foreign production.18
• Barlinek, a wood industry company producing floorboard, veneer, pellets, and skirting boards, is one of the world’s largest suppliers of triple layer wooden floors. The company has production plants in Ukraine and Romania (and a new production facility is under construction in Russia) and marketing affiliates in Norway, Germany and Russia.19
• FAKRO, established in 1991, has grown rapidly to become the world’s second largest producer of roof windows, with a 15% share in the global market. FAKRO has 15 distribution foreign affiliates (in the United States, the United Kingdom, France, Spain, Germany, Austria, the Netherlands, Hungary, Russia, Ukraine, Slovakia, Italy, Czech Republic, Latvia, and China) and 12 foreign manufacturing affiliates (out of which seven, among others, in Europe and one in each Russia and China).20
16 “Inwestycja KGHM szansą dla innych”, Rzeczpospolita, March 7, 2012, p. B4. 17 Ranking of the top 100 European software vendors, Truffle 100, available at http://www.truffle100.com/downloads/2012/TruffleEurope-2012-v9.pdf; and http://www.asseco.pl/en. 18 See, http://www.maspex.com.pl/en/. For more on Maspex, see Katarzyna Blanke-Ławniczak, “Marketing dynamics and management excellence: the source of successful internationalization of a food processing company from transition economy (Case: Maspex Poland)”, Journal of International Food and Agribusiness Marketing, vol. 21, issue 2 (April 2009), pp. 134–148. 19 See, http://relacje.barlinek.com.pl/en/For_investors/Groups_strategy.html. 20 See, http://www.fakro.com/.
7
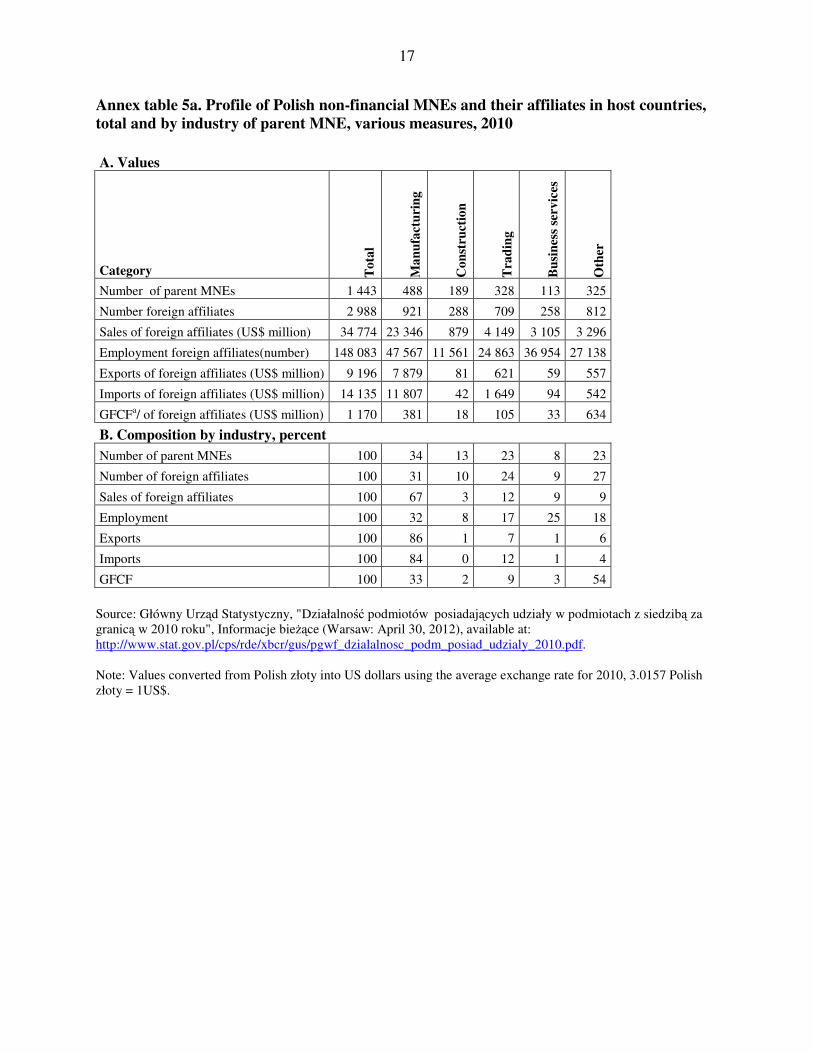
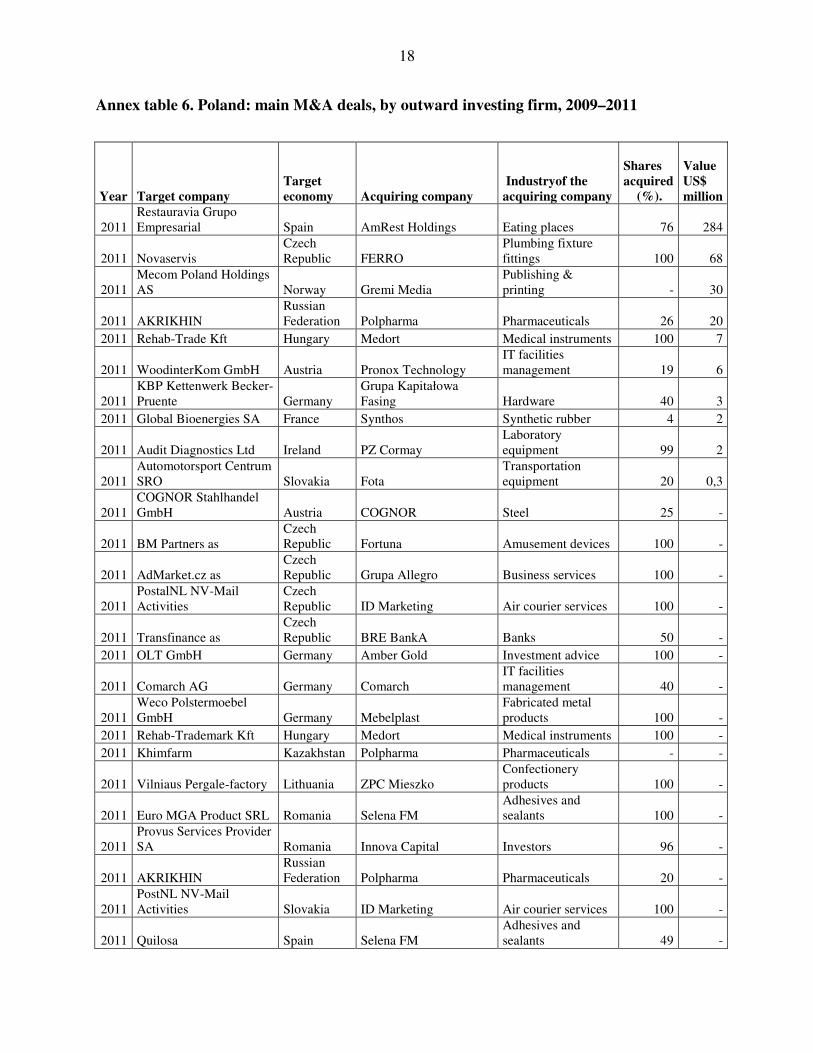
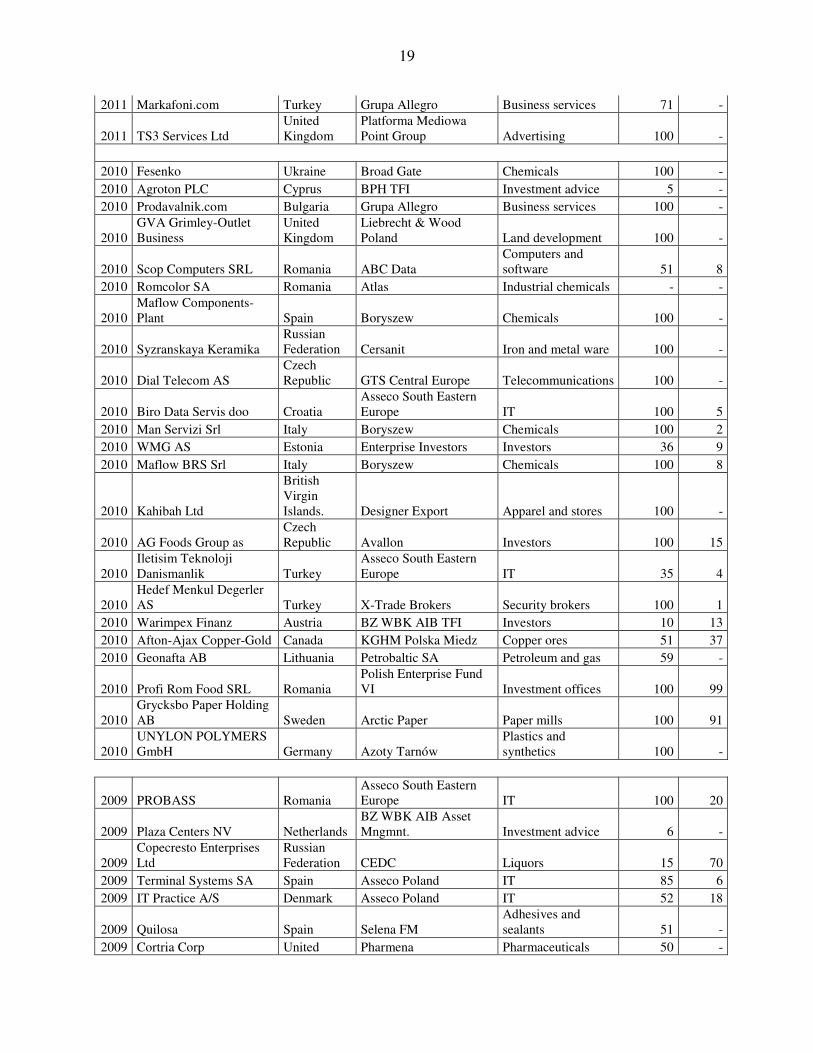
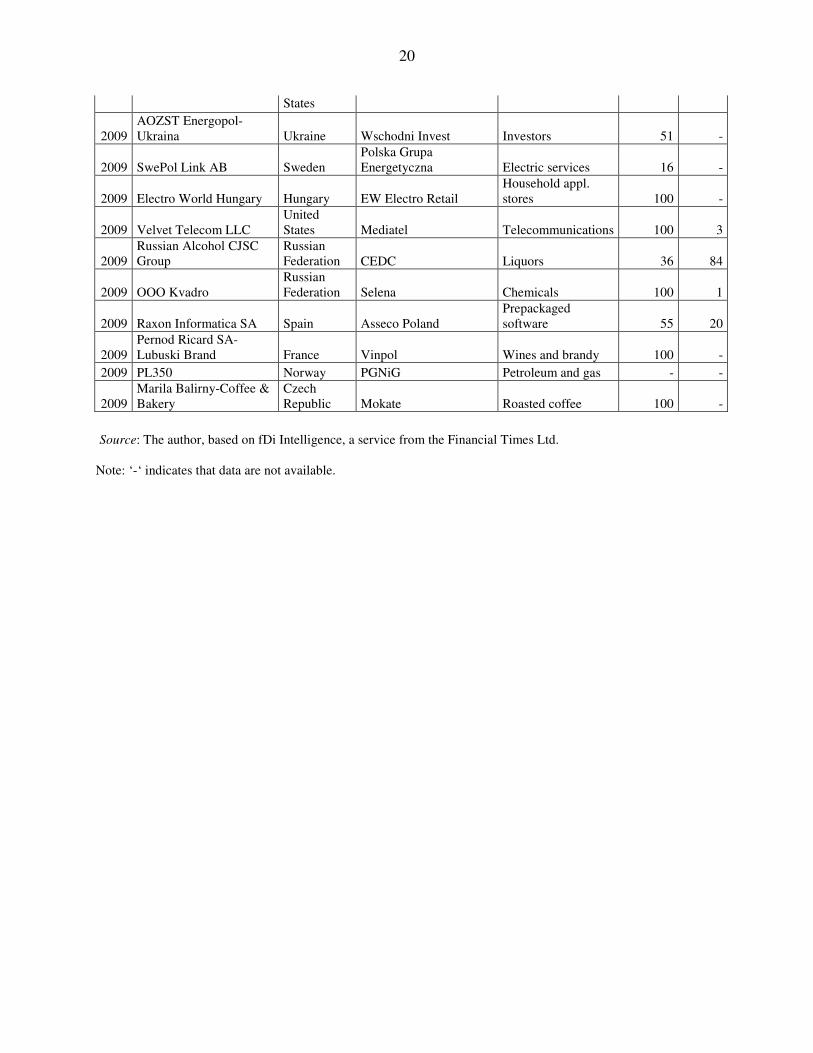
In all, by 2010, Poland had a total of some 1,443 MNEs, out of which the largest number were in manufacturing (488), followed by MNEs in trading (328) and in construction (189) (annex table 5a). These MNEs had 2,988 foreign affiliates, out of which 921 affiliates were owned by manufacturing parent firms and 709 by trading parent firms. Most foreign affiliates in construction, trading, information and communication services, finance, and business services were in the same industry as their parent firms. Manufacturing MNEs had 45% of their affiliates in the same sector and 38% in trading services, with the balance spread over several industries such as business services, construction and finance. Foreign affiliates generated in 2010 US$ 35 billion of sales and employed close to 150,000 people in host countries (annex table 5a). This is not yet much: in 2010, just one company, General Electric, the world’s largest MNE (in terms of foreign assets) had employment in its foreign affiliates larger than that of all 2,988 foreign affiliates of Polish MNEs. Its sales were more than twice as large.21 Foreign affiliates of Polish MNEs in the services sector accounted for the largest share of employment in Polish foreign affiliates abroad, while those of Polish firms in manufacturing generated the largest share (67%) of foreign affiliates’ sales (annex table 5a). As annex table 6 shows, a number of Polish MNEs are expanding through cross-border mergers and acquisitions (M&As). The largest M&A transactions in 2011 were headed by the acquisition of the Spanish firm Restauravia by AmRest Holdings for US$ 284 million, and that of Novaservis (Czech Republic) by FERRO for US$ 68 million. The policy scene Most Polish OFDI is located in Europe and governed by EU and OECD rules and treaties concerning FDI. As of June 1, 2012, Poland had signed 63 bilateral investment treaties (BITs), of which 60 were in force, and 92 double-taxation treaties (DTTs).22 They cover all important host economies for Polish FDI. One of the three non-ratified BITs is with Russia, a significant host economy for Polish FDI (hosting over US$ 1.1 billion of Poland’s OFDI stock in 2011). Successive Polish governments have been neutral about OFDI or Polish MNEs. Consequently, private Polish MNEs are a result of market forces and laissez-faire policy, without any government intervention or support. The Ministry of the Economy admitted that in a report on OFDI: “all activities of Polish enterprises related to investment abroad result in the overwhelming majority from their very own initiative. Polish firms are able to identify, select and use alone their chances to grow and develop through FDI. It does not mean, however, that they do not need encouragement and support from adequate state institutions.”23 Possible or existing forms of such a support are not mentioned, because there are hardly any, as regards OFDI.24 An FDI insurance scheme offered since a number of years by a state-owned corporation
21 Data on General Electric are from UNCTAD’s TNC/FDI data base, available at www.unctad.org/wir. 22 UNCTAD BITs and DTTs database, available at: www.unctad.org/iia. 23 Ministerstwo Gospodarki, Departament Analiz i Prognoz, Polskie Inwestycje Bezpośrednie w 2009 roku” (Warsaw: May 2011), mimeo., p. 7. 24 A KPMG publication asked surveyed firms about assistance by various institutions (private institutions such as consultancy firms and banks and government agencies including Polish embassies and consulates) as regards their foreign expansion (not distinguishing the forms of this expansion such as exports or FDI). Almost half of the respondents had not used any assistance. Around 30% used the services of business chambers and embassies and consulates, and 20%, of business consultancy firms. Only 9% had turned for assistance to government agencies
8
for export credit insurance (KUKE) does not seem to be working, as so far no foreign investor from Poland has used it.25 Government involvement could be found in at least some foreign investments by SOEs. The biggest FDI project until 2012 (when KGHM International acquired Quadra FNX Mining), the purchase of the Mažeikiu refinery in Lithuania by PKN ORLEN, mentioned earlier — in spite of the claims of the former management that it was a transaction based purely on business considerations — was actively encouraged and discussed at the political level with Lithuanian counterparts by the Polish Presidency. Investments by PGNiG, the gas giant, had also been encouraged as a means to diversify the sources of gas imports. In the past two years, the Government has been suspected of pursuing a policy of creating “national champions”. First, it openly supported the (failed) acquisition of a foreign affiliate (BZ WBK) of an Irish multinational bank by a state-owned bank, PKO BP. Secondly, it chose to try to “privatize” a regional energy concern, Energa, by selling it to another SOE, PGE (Polish Energy Group), in spite of a warning from the competition authority that the transaction will significantly reduce competition in the energy market. Thirdly, these attempts were related to the fact that Government advisors openly talk about the need to protect the remaining large Polish SOEs26 (other large firms are typically foreign affiliates). Fourthly, in the second half of 2011, a new dimension was added to the debate, as some prominent economists and government advisors started talking openly about the need to “re-polonize” foreign-owned banks (through buy-backs, not through nationalization). Some officials, including the President of the National Bank of Poland, have spoken in favor of this idea.27 While the discussion at the national level continues, action has taken place at the local level: quite recently, in 2012, the city of Wrocław, which has attracted FDI by a number of prominent MNEs such as Google, IBM, HP, Nokia–Siemens, and McKinsey & Company, has launched a program called “Polish Champions” in co-operation with the Ministry of Economy and Polish Agency for Information and Foreign Investment. The objective of the program is to support the worldwide expansion of firms from the city. The program has signed up 11 Polish companies headquartered in Wrocław, including two firms that are already MNEs, AB and Selena (annex table 5). In the future, the city hopes to attract headquarters of new Polish MNEs. Several Polish cities have shown interest in joining the program. The means of support are still rather vague. So far the program has generated a series of workshops, a communication platform and media interest.28 It remains to be seen if it results in a meaningful support to companies wishing to invest abroad.
other than consulates and embassies. Among the firms that had used assistance, more than half assessed it negatively, because of excessive bureaucracy and the low quality of information (for further discussion see KPMG and Invest in Poland, Ekspansja międzynarodowa polskich przedsiębiorstw produkcyjnych (Warsaw: 2010), pp. 40–41. 25 KUKE, Raport roczny za rok 2011 (Warsaw: 2012); and Najwyższa Izba Kontroli, Informacja o wynikach
kontroli funkcjonowania systemu wspierania kredytów eksportowych (Warsaw: March 2010). 26Jan Krzysztof Bielecki, „Narodowe ciągoty liberała”, in businessman.pl, No. 10 (37), October 2010, pp. 10–14. 27 “Czasy są takie, że trzeba być orłem”, interview with Marek Belka, President of the NBP, November 14, 2011, available at http://wyborcza.biz/biznes/2029020. 28 http://polskiczempion.pl/o-programie-polski-czempion; and “Polscy Czempioni idą w świat”, Rzeczpospolita, April 10, 2012.
9
Conclusion At the beginning of the 21st century, Polish firms hardly engaged in the foreign production of goods and services, limiting OFDI to the support of trading activities. The build-up of Poland’s OFDI has taken place only since around 2005. In only seven years, Poland’s OFDI stock ballooned nearly fifteen times, from US$ 3.4 billion in 2004 to US$ 50 billion in 2011, reflecting the emergence of Polish MNEs, both public and private, their continued investment abroad to support the country’s ever growing exports, as well as an increasing involvement of both Polish and foreign MNEs in the intra-corporate transfers of funds for tax optimization reasons. The trend toward a further growth of Polish private MNEs is set to continue, as a growing number of domestic enterprises discover the benefits of investing abroad, and acquire competitive advantages that allow them to undertake such investments. In two years only, from 2008 to 2010, the number of Polish MNEs increased by 337 companies.29 Data on cross-border acquisitions by Polish companies during 2009–2011 suggest that several new firms are engaging for the first time in FDI. Laissez-faire policy combined with relatively stable and good economic conditions in recent years, including during the global crisis, and a general support by successive governments of competition in the domestic market have helped Polish firms to expand abroad through both exports and FDI.30 Whether Poland will adopt a policy to turn SOEs into national champions and, eventually, into MNEs, will depend on the outcome of the current debate on the future of, and limits to, further privatizations. Additional readings
Cieślik, Jerzy, Internacjonalizacja polskich przedsiębiorstw. Aktualne tendencje – implikacje dla
polityki gospodarczej (Warsaw: Akademia Leona Koźmińskiego, 2010). Instytut Badań Rynku, Konsumpcji i Koniunktur (IBRKK), „Polskie inwestycje za granicą”, Studia i materiały, no. 93 (Warsaw: June 2012). Instytut Badań Rynku, Konsumpcji i Koniunktur (IBRKK), „Polskie inwestycje za granicą”, Studia i materiały, no. 90, (Warsaw: April 2010). Ministerstwo Gospodarki, Departament Analiz i Prognoz, „Polskie Inwestycje Bezpośrednie w 2009 roku,” Warsaw, May 2011, mimeo. Rosati, Dariusz and Witold Wiliński "Outward foreign direct investment from Poland," in Marjan Svetlicic and Matija Rojec, eds., Facilitating Transition by Internationalization:
Outward Direct Investment from Central European Economies in Transition (Aldershot: Ashgate, 2003), pp. 175–204.
29 Główny Urząd Statystyczny (GUS), Działalność podmiotów posiadających udziały w podmiotach z siedzibą za
granicą w 2010 roku, Wyniki wstępne, Informacje bieżące (Warsaw, April 30, 2012); and Główny Urząd Statystyczny (GUS), Działalność podmiotów posiadających udziały w podmiotach z siedzibą za granicą w 2008
roku, Wyniki wstępne, Informacje bieżące (GUS, Warsaw, June 10, 2010). 30As noted, for example, in the case of Chile, a successful country as regards OFDI, “the best policy to support OFDI is perhaps a sound policy to promote stability and competition in national markets” (Carlo Razo and Alvaro Calderon, “Chile’s outward FDI and its policy context”’ in Sauvant, et al., op. cit., p. 79).
10
Useful websites
National Bank of Poland, for data on Polish OFDI: http://www.nbp.pl/homen.aspx?f=/en/statystyka/bilansplatniczy.html for balance of payments data (in English) and Poland’s OFDI data (only in Polish). Ministry of the Economy for the only two analyses of the OFDI by a government agency, listed above (Ministerstwo Gospodarki, Departament Analiz i Prognoz “Polskie Inwestycje Bezpośrednie w 2009 roku”, Warsaw, May 2011; and “Polskie Inwestycje Bezpośrednie 2006/2007”, Warsaw: March 2008): http://www.mg.gov.pl/NR/rdonlyres/F91B004A-083D-439F-87CB-A964981E4B5F/44283/PBIZ2006fin3p2.pdf.
* * * * *
Copyright © Columbia University in the City of New York. The material in this Profile may be reprinted if accompanied by the following acknowledgment: Zbigniew Zimny, “Outward FDI from Poland and its policy
context, 2012,” Columbia FDI Profiles (ISSN: 2159-2268), January 14, 2013. Reprinted with permission from the Vale Columbia Center on Sustainable International Investment (www.vcc.columbia.edu).
A copy should kindly be sent to the Vale Columbia Center at [email protected].
For further information please contact: Vale Columbia Center on Sustainable International Investment, Mimi Wu at [email protected].
The Vale Columbia Center on Sustainable International Investment (VCC), led by Lisa Sachs, is a joint center of Columbia Law School and The Earth Institute at Columbia University. It seeks to be a leader on issues related to
foreign direct investment (FDI) in the global economy. VCC focuses on the analysis and teaching of the implications of FDI for public policy and international investment law.
11
Statistical Annex
Annex table 1. Poland: outward FDI stock, 2000–2011
(US$ billion)
Economy 2000 2001 2002 2003 2004 2005 2006 2007 2008 2009 2010 2011
Poland 1.0 1.2 1.5 2.1 3.4 6.3 14.3 21.2 24.0 29.6 44.4 49.7
Memorandum:
comparator economies
Bulgaria 0.03 0.03 0.04 0.1 -0.2 0.1 0.5 0.8 1.4 1.4 1.5 1.7
Czech Republic 0.7 1.1 1.5 2.3 3.8 3.6 5.0 8.6 12.5 14.8 14.9 15.5
Hungary 1.3 1.6 2.2 3.5 6.0 7.8 12.4 17.3 17.6 19.2 20.0 23.8
Romania 0.1 0.1 0.1 0.2 0.3 0.2 0.9 1.2 1.5 1.4 1.5 1.5
Slovakia 0.4 0.5 0.5 0.8 0.8 0.6 1.3 1.9 3.0 3.2 3.3 4.2
Sources: For Poland, annual publications of the National Bank of Poland (NBP), "Polskie inwestycje bezpośrednie za granicą", various years, available at http://www.nbp.pl/home.aspx?f=/publikacje/pib/pib.html; for other countries, UNCTAD, UNCTADstat, available at: http://unctadstat.unctad.org/TableViewer/tableView.aspx
Annex table 2. Poland: outward FDI flows, 2000–2011
(US$ million)
Economy 2000 2001 2002 2003 2004 2005 2006 2007 2008 2009 2010 2011
Poland 16 -90 230 305 955 3 392 9 168 5 664 4 613 4 562 7 484 7 335
Memorandum:
comparator economies
Bulgaria 3 10 27 26 -206 310 177 282 765 -95 229 190
Czech Republic 43 165 206 206 1 014 -19 1 468 1 620 4 323 949 1 167 1 152
Hungary 620 368 278 1 644 1 119 2 179 3 877 3 621 2 234 1 984 1 307 4 530
Romania -13 -16 17 41 70 -31 423 279 274 -88 -20 32
Slovakia 29 65 11 247 -21 150 511 600 530 904 327 490
Sources: For Poland, the website of the National Bank of Poland, available at http://www.nbp.pl/home.aspx?f=/statystyka/bilans_platniczy/bilansplatniczy_r.html; for other countries, UNCTAD, UNCTADstat, available at http://unctadstat.unctad.org/TableViewer/tableView.aspx.
12
Annex table 3. Poland: sectoral distribution of outward FDI stock, by the industry of affiliates, 2000, 2005 and 2009–2011
(US$ million)
Sector/industry 2000 2005 2009 2010 2011
All sectors/industries 1 018 6 279 29 557 44 444 49 657
Primary 27 9 125 643 909
Manufacturing 113 1 076 4 255 17 095 17 200
Refined petroleum products 0 89 312 4 627 3 609
Vehicles and transport equipment 62 149 261 1 435 2 565
Food and beverages 2 179 1 699 3 099 2 464
Metal products 11 110 281 1 483 1 961
Rubber and plastic 3 51 200 1 150 1 203
Chemicals 26 36 630 1 052 1 079
Services 878 2 108 19 066 24 504 29 788
Businessa 14 159 5 784 7 161 11 415
Financialb 355 623 6 377 8 520 7 994
Trading 150 383 1 526 5 376 5 662
Construction 23 212 423 1 439 2 090
Real estate 2 149 2 794 1 950 2 003
Power, gas and water 0 5 664 978 1 202
Transport and storage 242 244 345 508 419
Hotels and restaurants 1 2 82 172 261
Not allocated 0 3 086 6 111 2 202 1 760
Source: Annual publications of the National Bank of Poland, “Polskie inwestycje bezposrednie za granica”, various years, available at: www.nbp.pl/home.aspx?f=/publikacje.pib.html a Including head offices since 2010. b Including holding companies since 2010.
13
Annex table 4. Poland: geographical distribution of outward FDI stock, 2000, 2005 and 2009–2011
(US$ million)
Country/region 2000 2005 2009 2010 2011
World 1 018 6 279 29 557 44 444 49 657
Developed economies 733 5 803 27 877 42 865 47 954
Europe 639 5 667 27 422 40 837 45 744
Switzerland 62 1 958 6 724 3 054 2 487
Norway 0 14 1 096 1 293 1 422
European Union – 15 406 1 859 13 243 25 245 28 503
European Union – 27 492 3 032 17 823 33 442 38 329
Luxembourg 133 185 5 879 9 030 11 816
United Kingdom 118 284 1 304 5 600 5 457
Cyprus 32 153 826 1 909 3 271
Netherlands 7 471 2 306 3 153 3 007
Belgium 0 2 1 182 2 281 2 463
Lithuania 12 68 1 234 2 178 2 463
Czech Republic 33 713 1 520 2 415 2 453
North America 95 141 444 2 027 2 200
United States 95 138 431 1 964 2 115
Other developed countries -1 -4 11 1 10
Developing economies 198 385 1 569 1 572 1 562
Africa 20 90 174 197 202
Asia and Oceania 169 261 808 1 241 1 239
Singapore 6 17 113 350 295
India 0 5 142 174 182
China 139 153 181 115 127
Latin America 9 34 587 134 121
Memorandum:
Transition Europea 83 1 541 5 365 8 668 9 098
Source: Annual publications of the National Bank of Poland, “Polskie inwestycje bezposrednie za granica”, various years, available at: www.nbp.pl/home.aspx?f=/publikacje.pib.html. a Including new 2004 EU members, South-East Europe, Belarus, Russia, and Ukraine.
14
Annex table 4a. The largest host countries for Poland's OFDI stock and their shares in the OFDI stock, 2011, and in the sales, employment and number of Polish foreign affiliates, 2010
(Percent)
Host country FDI stock,
2011
Sales of FAsa/, 2010
Employment of
FAsa/, 2010 Number of FAsa/,
2010
Luxembourg 23.8 0.7 0.1 1.7
United Kingdom 11.0 1.1 0.3 2.1
Cyprus 6.6 2.3 0.03 3.4
Netherlands 6.1 0.4 0.3 2.2
Switzerland 5.0 0.5 0.02 0.8
Belgium 5.0 0.1 0.1 0.7
Total above 57.4 5.0 0.9 11.0
Sources: The National Bank of Poland, "Polskie inwestycje bezpośrednie za granicą w 2011 roku", available at http://www.nbp.pl/home.aspx?f=/publikacje/pib/pib.html; and Główny Urząd Statystyczny, "Działalność podmiotów posiadających udziały w podmiotach z siedzibą za granicą w 2010 roku", Informacje bieżące (Warsaw: April 30, 2012), available at: http://www.stat.gov.pl/cps/rde/xbcr/gus/pgwf_dzialalnosc_podm_posiad_udzialy_2010.pdf.
a/ ‘FAs’ indicates foreign affiliates.
15
Annex table 4b. The largest host countries for Poland's OFDI and their shares in the OFDI stock, 2011, and in the sales, employment and number of foreign affiliates, 2010
(Percent)
Largest host countries FDI stock, 2011
Largest host countries
Sales of FAsa/
Largest host countries
Employment in FAsa/
Largest host countries
Number of FAsa/
Luxembourg 23.8 Czech Republic 22.1 Germany 14.9 Germany 13,3
United Kingdom 11.0 Germany 22.0 Czech Republic 9.2 Ukraine 11,9
Cyprus 6.6 Russia 4.6 Ukraine 8.8 Czech Republic 8,2
Netherlands 6.1 Ukraine 2.7 Russia 8.4 Russia 7,7
Switzerland 5.0 Slovakia 2.5 Romania 5.1 Romania 5,0
Belgium 5.0 Cyprus 2.3 Belarus 3,3 Slovakia 4,2
Total above 57.4 Total above 56.2 Total above 49,7 Total above 50,3
Sources: The National Bank of Poland, "Polskie inwestycje bezpośrednie za granicą w 2011 roku", available at http://www.nbp.pl/home.aspx?f=/publikacje/pib/pib.html ; and Główny Urząd Statystyczny, "Działalność podmiotów posiadających udziały w podmiotach z siedzibą za granicą w 2010 roku", Informacje bieżące (Warsaw: April 30, 2012), available at: http://www.stat.gov.pl/cps/rde/xbcr/gus/pgwf_dzialalnosc_podm_posiad_udzialy_2010.pdf. a/ ‘FAs’ indicates foreign affiliates.
16
Annex table 5. Poland: selected major non-financial MNEs, 2010, ranked by foreign assets Foreign
Rank Company Industry
assets (US$ million)
1 Polski Koncern Naftowy
Orlen (PKN Orlen) Petroleum 6 222
2 Asseco IT 1 194
3 Polskie Górnictwo Naftowe i
Gazownictwo (PGNiG) Gas 1 149
4 Synthos Chemical 619
5 Morpol Food 505
6 LOTOS Petroleum 452
7 Ciech Chemical 430
8 Bioton Pharmaceuticals 293
9 Złomrex Metallurgy 252
10 Selena FM Building materials 160
11 Polimex–Mostostal Construction and machinery
and equipment production 139
12 Koelner Fixings for construction
and industry 135
13 AB IT 100
14 Boryszew Metal, chemical and
automotive products 85
15 KGHM Polska Miedź Copper 82
16 Comarch IT 54
17 Grupa Kęty Metal products 24
18 Decora Building materials 24
19 Fabryki Sprzętu i Narzędzi
Górniczych "Fasing" Machinery and equipment 19
20 Ferro Sanitary and installation
equipment 17
Source: Instytut Badań Rynku, Konsumpcji i Koniunktur (IBRKK) and Vale Columbia Center on Sustainable International Investment, “Polish multinationals go beyond Europe” (Warsaw and New York: June 14, 2012), available at http://ibrkk.pl/id/109/Projekt_Emerging_Market_Global_Players or
http://www.vcc.columbia.edu/files/vale/documents/EMGP-Poland-Report-2012-_FINAL_0.pdf.
17
Annex table 5a. Profile of Polish non-financial MNEs and their affiliates in host countries, total and by industry of parent MNE, various measures, 2010
A. Values
Category To
tal
Ma
nu
fact
uri
ng
Co
nst
ruct
ion
Tra
din
g
Bu
sin
ess
serv
ices
Oth
er
Number of parent MNEs 1 443 488 189 328 113 325
Number foreign affiliates 2 988 921 288 709 258 812
Sales of foreign affiliates (US$ million) 34 774 23 346 879 4 149 3 105 3 296
Employment foreign affiliates(number) 148 083 47 567 11 561 24 863 36 954 27 138
Exports of foreign affiliates (US$ million) 9 196 7 879 81 621 59 557
Imports of foreign affiliates (US$ million) 14 135 11 807 42 1 649 94 542
GFCFa/ of foreign affiliates (US$ million) 1 170 381 18 105 33 634
B. Composition by industry, percent
Number of parent MNEs 100 34 13 23 8 23
Number of foreign affiliates 100 31 10 24 9 27
Sales of foreign affiliates 100 67 3 12 9 9
Employment 100 32 8 17 25 18
Exports 100 86 1 7 1 6
Imports 100 84 0 12 1 4
GFCF 100 33 2 9 3 54
Source: Główny Urząd Statystyczny, "Działalność podmiotów posiadających udziały w podmiotach z siedzibą za granicą w 2010 roku", Informacje bieżące (Warsaw: April 30, 2012), available at: http://www.stat.gov.pl/cps/rde/xbcr/gus/pgwf_dzialalnosc_podm_posiad_udzialy_2010.pdf. Note: Values converted from Polish złoty into US dollars using the average exchange rate for 2010, 3.0157 Polish złoty = 1US$.
18
Annex table 6. Poland: main M&A deals, by outward investing firm, 2009–2011
Year Target company Target economy Acquiring company
Industryof the acquiring company
Shares acquired (%).
Value US$ million
2011 Restauravia Grupo Empresarial Spain AmRest Holdings Eating places 76 284
2011 Novaservis Czech Republic FERRO
Plumbing fixture fittings 100 68
2011 Mecom Poland Holdings AS Norway Gremi Media
Publishing & printing - 30
2011 AKRIKHIN Russian Federation Polpharma Pharmaceuticals 26 20
2011 Rehab-Trade Kft Hungary Medort Medical instruments 100 7
2011 WoodinterKom GmbH Austria Pronox Technology IT facilities management 19 6
2011 KBP Kettenwerk Becker-Pruente Germany
Grupa Kapitałowa Fasing Hardware 40 3
2011 Global Bioenergies SA France Synthos Synthetic rubber 4 2
2011 Audit Diagnostics Ltd Ireland PZ Cormay Laboratory equipment 99 2
2011 Automotorsport Centrum SRO Slovakia Fota
Transportation equipment 20 0,3
2011 COGNOR Stahlhandel GmbH Austria COGNOR Steel 25 -
2011 BM Partners as Czech Republic Fortuna Amusement devices 100 -
2011 AdMarket.cz as Czech Republic Grupa Allegro Business services 100 -
2011 PostalNL NV-Mail Activities
Czech Republic ID Marketing Air courier services 100 -
2011 Transfinance as Czech Republic BRE BankA Banks 50 -
2011 OLT GmbH Germany Amber Gold Investment advice 100 -
2011 Comarch AG Germany Comarch IT facilities management 40 -
2011 Weco Polstermoebel GmbH Germany Mebelplast
Fabricated metal products 100 -
2011 Rehab-Trademark Kft Hungary Medort Medical instruments 100 -
2011 Khimfarm Kazakhstan Polpharma Pharmaceuticals - -
2011 Vilniaus Pergale-factory Lithuania ZPC Mieszko Confectionery products 100 -
2011 Euro MGA Product SRL Romania Selena FM Adhesives and sealants 100 -
2011 Provus Services Provider SA Romania Innova Capital Investors 96 -
2011 AKRIKHIN Russian Federation Polpharma Pharmaceuticals 20 -
2011 PostNL NV-Mail Activities Slovakia ID Marketing Air courier services 100 -
2011 Quilosa Spain Selena FM Adhesives and sealants 49 -
19
2011 Markafoni.com Turkey Grupa Allegro Business services 71 -
2011 TS3 Services Ltd United Kingdom
Platforma Mediowa Point Group Advertising 100 -
2010 Fesenko Ukraine Broad Gate Chemicals 100 -
2010 Agroton PLC Cyprus BPH TFI Investment advice 5 -
2010 Prodavalnik.com Bulgaria Grupa Allegro Business services 100 -
2010 GVA Grimley-Outlet Business
United Kingdom
Liebrecht & Wood Poland Land development 100 -
2010 Scop Computers SRL Romania ABC Data Computers and software 51 8
2010 Romcolor SA Romania Atlas Industrial chemicals - -
2010 Maflow Components-Plant Spain Boryszew Chemicals 100 -
2010 Syzranskaya Keramika Russian Federation Cersanit Iron and metal ware 100 -
2010 Dial Telecom AS Czech Republic GTS Central Europe Telecommunications 100 -
2010 Biro Data Servis doo Croatia Asseco South Eastern Europe IT 100 5
2010 Man Servizi Srl Italy Boryszew Chemicals 100 2
2010 WMG AS Estonia Enterprise Investors Investors 36 9
2010 Maflow BRS Srl Italy Boryszew Chemicals 100 8
2010 Kahibah Ltd
British Virgin Islands. Designer Export Apparel and stores 100 -
2010 AG Foods Group as Czech Republic Avallon Investors 100 15
2010 Iletisim Teknoloji Danismanlik Turkey
Asseco South Eastern Europe IT 35 4
2010 Hedef Menkul Degerler AS Turkey X-Trade Brokers Security brokers 100 1
2010 Warimpex Finanz Austria BZ WBK AIB TFI Investors 10 13
2010 Afton-Ajax Copper-Gold Canada KGHM Polska Miedz Copper ores 51 37
2010 Geonafta AB Lithuania Petrobaltic SA Petroleum and gas 59 -
2010 Profi Rom Food SRL Romania Polish Enterprise Fund VI Investment offices 100 99
2010 Grycksbo Paper Holding AB Sweden Arctic Paper Paper mills 100 91
2010 UNYLON POLYMERS GmbH Germany Azoty Tarnów
Plastics and synthetics 100 -
2009 PROBASS Romania Asseco South Eastern Europe IT 100 20
2009 Plaza Centers NV Netherlands BZ WBK AIB Asset Mngmnt. Investment advice 6 -
2009 Copecresto Enterprises Ltd
Russian Federation CEDC Liquors 15 70
2009 Terminal Systems SA Spain Asseco Poland IT 85 6
2009 IT Practice A/S Denmark Asseco Poland IT 52 18
2009 Quilosa Spain Selena FM Adhesives and sealants 51 -
2009 Cortria Corp United Pharmena Pharmaceuticals 50 -
20
States
2009 AOZST Energopol-Ukraina Ukraine Wschodni Invest Investors 51 -
2009 SwePol Link AB Sweden Polska Grupa Energetyczna Electric services 16 -
2009 Electro World Hungary Hungary EW Electro Retail Household appl. stores 100 -
2009 Velvet Telecom LLC United States Mediatel Telecommunications 100 3
2009 Russian Alcohol CJSC Group
Russian Federation CEDC Liquors 36 84
2009 OOO Kvadro Russian Federation Selena Chemicals 100 1
2009 Raxon Informatica SA Spain Asseco Poland Prepackaged software 55 20
2009 Pernod Ricard SA-Lubuski Brand France Vinpol Wines and brandy 100 -
2009 PL350 Norway PGNiG Petroleum and gas - -
2009 Marila Balirny-Coffee & Bakery
Czech Republic Mokate Roasted coffee 100 -
Source: The author, based on fDi Intelligence, a service from the Financial Times Ltd.
Note: ‘-‘ indicates that data are not available.