oscillatory hyperactivity and hyperconnectivity in young apoe
TRANSCRIPT
*For correspondence:
Competing interests: The
authors declare that no
competing interests exist.
Funding: See page 20
Received: 26 February 2018
Accepted: 17 April 2019
Published: 30 April 2019
Reviewing editor: Huda Y
Zoghbi, Texas Children’s
Hospital, United States
Copyright Koelewijn et al. This
article is distributed under the
terms of the Creative Commons
Attribution License, which
permits unrestricted use and
redistribution provided that the
original author and source are
credited.
Oscillatory hyperactivity andhyperconnectivity in young APOE-e4carriers and hypoconnectivity inAlzheimer’s diseaseLoes Koelewijn1, Thomas M Lancaster1,2,3, David Linden1,2,3, Diana C Dima1,Bethany C Routley1, Lorenzo Magazzini1, Kali Barawi3, Lisa Brindley1,Rachael Adams1, Katherine E Tansey4, Aline Bompas1, Andrea Tales5,Antony Bayer6, Krish Singh1,2*
1Cardiff University Brain Research Imaging Centre, School of Psychology, CardiffUniversity, Cardiff, United Kingdom; 2Neuroscience and Mental Health ResearchInstitute, Cardiff University, Cardiff, United Kingdom; 3MRC Centre forNeuropsychiatric Genetics and Genomics, Cardiff University, Cardiff, UnitedKingdom; 4Core Bioinformatics and Statistics Team, College of Biomedical and LifeSciences, Cardiff University, Cardiff, United Kingdom; 5Department of Psychology,College of Human and Health Sciences, Swansea University, Swansea, UnitedKingdom; 6School of Medicine, Cardiff University, Cardiff, United Kingdom
Abstract We studied resting-state oscillatory connectivity using magnetoencephalography in
healthy young humans (N = 183) genotyped for APOE-e4, the greatest genetic risk for Alzheimer’s
disease (AD). Connectivity across frequencies, but most prevalent in alpha/beta, was increased in
APOE-e4 in a set of mostly right-hemisphere connections, including lateral parietal and precuneus
regions of the Default Mode Network. Similar regions also demonstrated hyperactivity, but only in
gamma (40–160 Hz). In a separate study of AD patients, hypoconnectivity was seen in an extended
bilateral network that partially overlapped with the hyperconnected regions seen in young APOE-e
4 carriers. Using machine-learning, AD patients could be distinguished from elderly controls with
reasonable sensitivity and specificity, while young APOE-e4 carriers could also be distinguished
from their controls with above chance performance. These results support theories of initial
hyperconnectivity driving eventual profound disconnection in AD and suggest that this is present
decades before the onset of AD symptomology.
DOI: https://doi.org/10.7554/eLife.36011.001
IntroductionOnce established, the cognitive impairments characteristic of Alzheimer’s disease (AD) are irrevers-
ible (Herrup, 2015). To effectively identify measures to predict and prevent AD, it is vital to identify
biomarkers at an early age, before the presence of any symptoms, and one increasingly popular
route for this is neuroimaging of genetic risk groups. The greatest genetic risk factor for developing
late-onset AD is the apolipoprotein E4 (APOE-e4) allele (Corder et al., 1993; van der Flier et al.,
2011).
APOE consists of 299 amino acids divided into receptor-binding and lipid-binding regions and
has three isoforms (e2, e3 and e4) that only differ at two of the amino acids (112 and 158), both of
which are on the receptor-binding part of the protein. APOE has a crucial role in transporting choles-
terol and other lipids, both in plasma and in the brain, but it is its role in regulating amyloid-b that
Koelewijn et al. eLife 2019;8:e36011. DOI: https://doi.org/10.7554/eLife.36011 1 of 25
RESEARCH ARTICLE
has received much attention, due to the latter’s apparently crucial role in AD (Reinvang et al., 2013;
Zhao et al., 2018). The pathological accumulation of amyloid-b could occur via multiple mechanisms
of over-production and/or impaired clearance (Zhao et al., 2018) and it appears that the presence
of the APOE-e4 isoform may differentially lead to one or more of these occurring. For example, com-
pared to APOE-e3, APOE-e4 stimulates increased recycling of the amyloid precursor protein (APP),
hence leading to an increase in amyloid-b production (Ye et al., 2005). This mostly appears to be via
modified interactions between APOE-e4 and the LRP1 receptor. Similarly, it has been shown that
APOE can bind to amyloid-b to form a complex that then promotes clearance via cell internalization
of this complex (Zhao et al., 2018). As the APOE-e4-amyloid-b complex is less stable than the other
isoforms, this may make it less effective in amyloid clearance. Finally, APOE-e4 may interfere with
protease-mediated clearance of amyloid-b via downregulation of, for example, insulin-degrading-
enzyme (IDE) (Du et al., 2009).
Whatever the precise mechanism, APOE-e4 carriers have a much increased risk of developing
sporadic AD (Corder et al., 1993), of progression to AD if diagnosed with mild cognitive
impairment (MCI) (Petersen, 1995), and to develop AD at an earlier age (Corder et al., 1993;
van der Flier et al., 2011) compared to non-carriers. Studying early effects of the APOE-e4 allele on
the brain may therefore reveal insights into the neural pathways leading to AD.
Within groups of AD patients and elderly controls, APOE-e4 carriers show alterations in brain
structure and function that follow similar patterns to those that characterise AD, but are stronger
than in non-carriers. Imaging studies show that APOE-e4 carriers present with more severely atro-
phied temporal areas (Filippini et al., 2009a; Filippini et al., 2009b; Juottonen et al., 1998), and
have elevated levels in temporo-parietal areas of the two main harmful brain deposits seen in AD:
the tau protein (Ossenkoppele et al., 2016), causing neurofibrillary tangles, and amyloid-b
(Drzezga et al., 2009), the peptide accumulating in the pathognomonic intercellular plaques.
Functional neuroimaging during a ‘resting state’ can show intrinsic fluctuations in levels of back-
ground brain activity. Fast fluctuations of rhythmic neural activity occur spontaneously and are
thought to underlie communication between brain areas (Schnitzler and Gross, 2005). These neural
oscillations, particularly in frequency bands such as the alpha band, have been linked to patterns of
white matter connectivity (Teipel et al., 2009). APOE plays a role in lipid transport, important for
myelination of white matter (Herrup, 2015). Studying neural oscillations in conjunction with variation
in this gene may therefore reveal important changes in neural connectivity. Neural oscillations can
be non-invasively measured in vivo in humans using electro- or magnetoencephalography (E/MEG),
which measure fluctuations in electric potentials or magnetic fields and hence directly reflect neural
activity at the scalp with high temporal resolution (Baillet, 2017).
To date, M/EEG studies in elderly APOE-e4 carriers have shown changes in the oscillatory alpha
band (Babiloni et al., 2006; Canuet et al., 2012; de Waal et al., 2013; Jelic et al., 1997;
Kramer et al., 2008; Ponomareva et al., 2008) and in the much lower-frequency delta band
(Cuesta et al., 2015; de Waal et al., 2013) in regions similar to those reduced in AD and MCI.
These findings suggest that the presence of an APOE-e4 allele is associated with differences in oscil-
latory brain function at a stage preceding AD symptomology, but it is not clear how early in the life
span this is established. One very small-sample study has measured MEG oscillations in healthy
young genotyped individuals, and found that low-frequency (theta) oscillations were increased in the
medial frontal cortex of APOE-e4 carriers, but did not investigate the alpha band, nor connectivity
between brain regions (Filbey et al., 2006).
Here, we used MEG to study resting-state neural activity non-invasively in a large sample of
healthy young individuals who were genotyped for APOE alleles (51 e4 carriers and 108 non-carriers).
We assessed whether and how background oscillatory neural activity and connectivity across the
whole brain in a range of frequencies is affected in young APOE-e4 carriers, decades before the
effects of ageing or potential onset of AD symptomology. To relate the significance of these findings
to brain dysfunction in AD, we further compared the young APOE-e4-related findings with resting-
state MEG data from patients with established AD and healthy age-matched controls. Finally, using
machine learning approaches, we assessed the diagnostic information content of these MEG-derived
static connectivity matrices by quantifying their accuracy in solving three problems: 1) Whether
young APOE-"4 carriers could be distinguished from young non-carriers, 2) Whether AD patients
could be distinguished from elderly controls and 3) Whether a classifier trained on identifying young
E4 carriers could identify AD patients, purely from their MEG connectivity matrices.
Koelewijn et al. eLife 2019;8:e36011. DOI: https://doi.org/10.7554/eLife.36011 2 of 25
Research article Neuroscience
Results
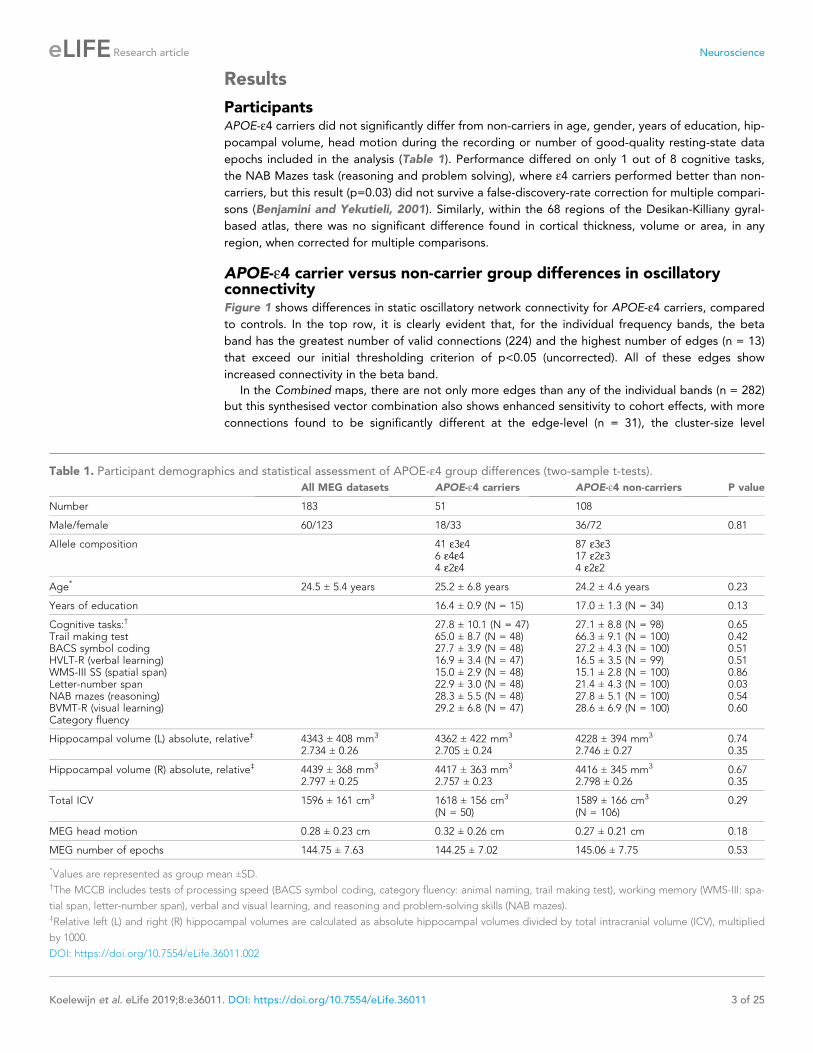
ParticipantsAPOE-e4 carriers did not significantly differ from non-carriers in age, gender, years of education, hip-
pocampal volume, head motion during the recording or number of good-quality resting-state data
epochs included in the analysis (Table 1). Performance differed on only 1 out of 8 cognitive tasks,
the NAB Mazes task (reasoning and problem solving), where e4 carriers performed better than non-
carriers, but this result (p=0.03) did not survive a false-discovery-rate correction for multiple compari-
sons (Benjamini and Yekutieli, 2001). Similarly, within the 68 regions of the Desikan-Killiany gyral-
based atlas, there was no significant difference found in cortical thickness, volume or area, in any
region, when corrected for multiple comparisons.
APOE-e4 carrier versus non-carrier group differences in oscillatoryconnectivityFigure 1 shows differences in static oscillatory network connectivity for APOE-e4 carriers, compared
to controls. In the top row, it is clearly evident that, for the individual frequency bands, the beta
band has the greatest number of valid connections (224) and the highest number of edges (n = 13)
that exceed our initial thresholding criterion of p<0.05 (uncorrected). All of these edges show
increased connectivity in the beta band.
In the Combined maps, there are not only more edges than any of the individual bands (n = 282)
but this synthesised vector combination also shows enhanced sensitivity to cohort effects, with more
connections found to be significantly different at the edge-level (n = 31), the cluster-size level
Table 1. Participant demographics and statistical assessment of APOE-e4 group differences (two-sample t-tests).
All MEG datasets APOE-e4 carriers APOE-e4 non-carriers P value
Number 183 51 108
Male/female 60/123 18/33 36/72 0.81
Allele composition 41 e3e46 e4e44 e2e4
87 e3e317 e2e34 e2e2
Age* 24.5 ± 5.4 years 25.2 ± 6.8 years 24.2 ± 4.6 years 0.23
Years of education 16.4 ± 0.9 (N = 15) 17.0 ± 1.3 (N = 34) 0.13
Cognitive tasks:†
Trail making testBACS symbol codingHVLT-R (verbal learning)WMS-III SS (spatial span)Letter-number spanNAB mazes (reasoning)BVMT-R (visual learning)Category fluency
27.8 ± 10.1 (N = 47)65.0 ± 8.7 (N = 48)27.7 ± 3.9 (N = 48)16.9 ± 3.4 (N = 47)15.0 ± 2.9 (N = 48)22.9 ± 3.0 (N = 48)28.3 ± 5.5 (N = 48)29.2 ± 6.8 (N = 47)
27.1 ± 8.8 (N = 98)66.3 ± 9.1 (N = 100)27.2 ± 4.3 (N = 100)16.5 ± 3.5 (N = 99)15.1 ± 2.8 (N = 100)21.4 ± 4.3 (N = 100)27.8 ± 5.1 (N = 100)28.6 ± 6.9 (N = 100)
0.650.420.510.510.860.030.540.60
Hippocampal volume (L) absolute, relative‡ 4343 ± 408 mm3
2.734 ± 0.264362 ± 422 mm3
2.705 ± 0.244228 ± 394 mm3
2.746 ± 0.270.740.35
Hippocampal volume (R) absolute, relative‡ 4439 ± 368 mm3
2.797 ± 0.254417 ± 363 mm3
2.757 ± 0.234416 ± 345 mm3
2.798 ± 0.260.670.35
Total ICV 1596 ± 161 cm3 1618 ± 156 cm3
(N = 50)1589 ± 166 cm3
(N = 106)0.29
MEG head motion 0.28 ± 0.23 cm 0.32 ± 0.26 cm 0.27 ± 0.21 cm 0.18
MEG number of epochs 144.75 ± 7.63 144.25 ± 7.02 145.06 ± 7.75 0.53
*Values are represented as group mean ±SD.†The MCCB includes tests of processing speed (BACS symbol coding, category fluency: animal naming, trail making test), working memory (WMS-III: spa-
tial span, letter-number span), verbal and visual learning, and reasoning and problem-solving skills (NAB mazes).‡Relative left (L) and right (R) hippocampal volumes are calculated as absolute hippocampal volumes divided by total intracranial volume (ICV), multiplied
by 1000.
DOI: https://doi.org/10.7554/eLife.36011.002
Koelewijn et al. eLife 2019;8:e36011. DOI: https://doi.org/10.7554/eLife.36011 3 of 25
Research article Neuroscience
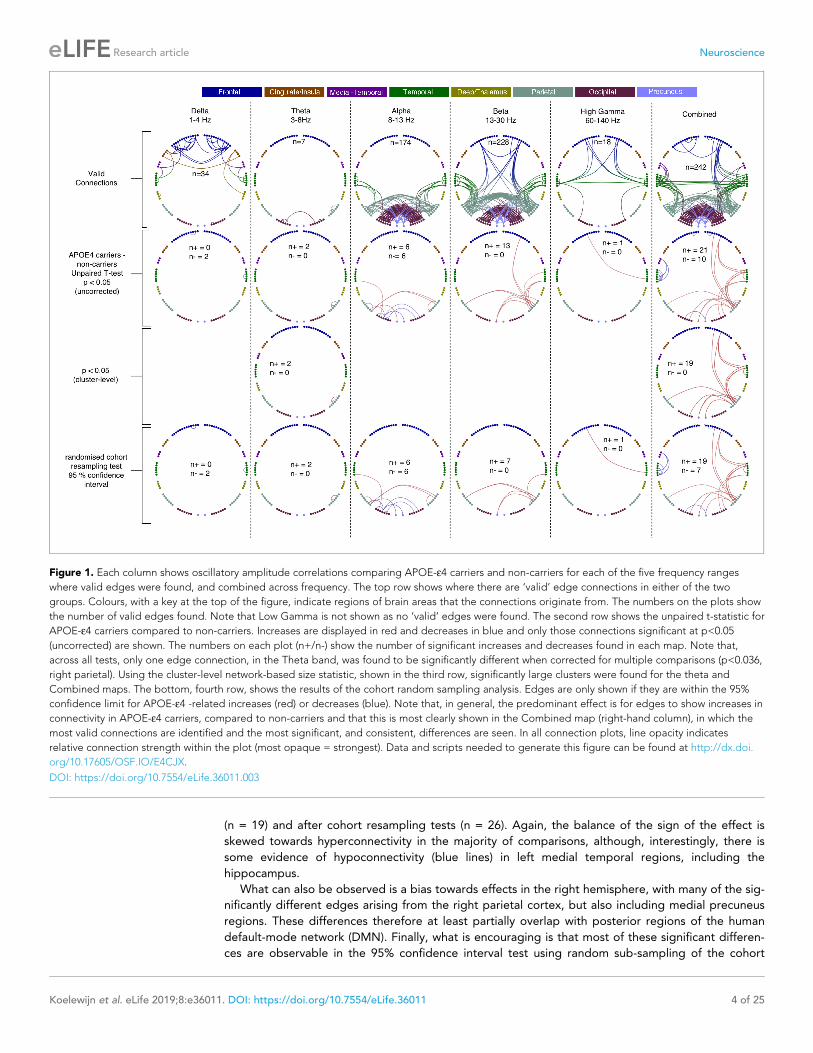
(n = 19) and after cohort resampling tests (n = 26). Again, the balance of the sign of the effect is
skewed towards hyperconnectivity in the majority of comparisons, although, interestingly, there is
some evidence of hypoconnectivity (blue lines) in left medial temporal regions, including the
hippocampus.
What can also be observed is a bias towards effects in the right hemisphere, with many of the sig-
nificantly different edges arising from the right parietal cortex, but also including medial precuneus
regions. These differences therefore at least partially overlap with posterior regions of the human
default-mode network (DMN). Finally, what is encouraging is that most of these significant differen-
ces are observable in the 95% confidence interval test using random sub-sampling of the cohort
Figure 1. Each column shows oscillatory amplitude correlations comparing APOE-e4 carriers and non-carriers for each of the five frequency ranges
where valid edges were found, and combined across frequency. The top row shows where there are ‘valid’ edge connections in either of the two
groups. Colours, with a key at the top of the figure, indicate regions of brain areas that the connections originate from. The numbers on the plots show
the number of valid edges found. Note that Low Gamma is not shown as no ‘valid’ edges were found. The second row shows the unpaired t-statistic for
APOE-e4 carriers compared to non-carriers. Increases are displayed in red and decreases in blue and only those connections significant at p<0.05
(uncorrected) are shown. The numbers on each plot (n+/n-) show the number of significant increases and decreases found in each map. Note that,
across all tests, only one edge connection, in the Theta band, was found to be significantly different when corrected for multiple comparisons (p<0.036,
right parietal). Using the cluster-level network-based size statistic, shown in the third row, significantly large clusters were found for the theta and
Combined maps. The bottom, fourth row, shows the results of the cohort random sampling analysis. Edges are only shown if they are within the 95%
confidence limit for APOE-e4 -related increases (red) or decreases (blue). Note that, in general, the predominant effect is for edges to show increases in
connectivity in APOE-e4 carriers, compared to non-carriers and that this is most clearly shown in the Combined map (right-hand column), in which the
most valid connections are identified and the most significant, and consistent, differences are seen. In all connection plots, line opacity indicates
relative connection strength within the plot (most opaque = strongest). Data and scripts needed to generate this figure can be found at http://dx.doi.
org/10.17605/OSF.IO/E4CJX.
DOI: https://doi.org/10.7554/eLife.36011.003
Koelewijn et al. eLife 2019;8:e36011. DOI: https://doi.org/10.7554/eLife.36011 4 of 25
Research article Neuroscience

(bottom row), suggesting that our results may well generalise to the wider population, rather than
being driven by a small number of cases, or controls, in our sample.
APOE-e4 carrier versus non-carrier group differences in oscillatoryactivityWhen we assessed activity across the brain using a voxelwise assessment of temporal variability in
the amplitude envelope at each location in the brain, the only differences found using TFCE (p<0.05
corrected) were in the two gamma ranges, 40–60 Hz and 60–140 Hz and are shown in Figure 2.
These were exclusively gamma hyperactivities in a right-lateralised profile, distributed over lateral
parietal, temporal and frontal regions. When a more conservative voxel-level threshold (p<0.05, cor-
rected) was applied, only one region survived in the 60–140 Hz range, localised over the right middle
and inferior frontal gyri.
In summary, gamma hyperactivities were found in mostly right-lateralised regions, some of which
also appear to show hyperconnectivity in the lower frequency ranges (principally beta and alpha).
This overlap is described graphically in the lower part of Figure 2.
Alzheimer’s disease versus elderly controlsHere, we compared our finding of a spatially-localised increase in functional brain connectivity in
young APOE-e4 carriers to connectivity changes in a cohort of AD patients, in which we have
recently reported strongly decreased alpha and beta-band oscillatory network activity in parieto-
temporal areas with MEG (Koelewijn et al., 2017), for AD patients compared to age-matched con-
trols. In our reanalysis of a subset of the same dataset, using the current pipeline (Figure 3) to com-
pare AD patients to age-matched controls, we show strongly decreased oscillatory connectivity in
predominantly parieto-temporal connections, with the most significant, and extensive, effects visible
in the Alpha and Beta ranges. Again, similar to the young APOE-e4 analysis, the most valid connec-
tions, and the most extensive pattern of significant differences, was observed in the synthesised vec-
tor combination of frequency-specific effects (right hand column). We also note that, in contrast to
the APOE-e4 analysis, most of the observed significant cohort differences are reduced connectivity,
i.e. hypoconnectivity, in AD compared to elderly controls.
Finally, when using the temporal standard-deviation of the oscillatory envelope to quantify activa-
tion at each AAL node, this cohort of patients did not show any significant differences, in any fre-
quency band, compared to their age-matched controls.
Comparing the effects in young APOE-e4 carriers to elderly patientswith Alzheimer’s diseaseFigure 4 shows a comparison of effects, taken from the most sensitive Combined connectivity maps,
in order to directly visualise the overlap of statistical differences in the two experiments. In terms of
the connections identified as valid (top row of Figure 1, Figure 3 and Figure 4a), there are clear
similarities but also differences, principally in terms of the balance between parieto-occipital connec-
tivity and parieto-temporal-frontal connections. This may reflect differences due to the large discrep-
ancy in age between the two experimental cohorts. In terms of cohort effects, it can clearly be seen
that in the APOE-e4 comparison, young carriers mostly demonstrate hyperconnectivity in a right
dominant network, whilst in the AD comparison, more extensive bilateral decreases in connectivity
are seen. In Figure 4c we show this in more detail by displaying the unthresholded t-statistics for
each comparison and then comparing the magnitude of effect-sizes for the two groups in the scatter
plot. There is a clear negative correlation of effect sizes between the two experiments (r = �0.18,
p<3.6�10�6), confirming the fact that, on average, connections that show hyperconnectivity in
APOE-e4 carriers demonstrate hypoconnectivity in Alzheimer’s cases. However, there is clearly not a
perfect correspondence between the pattern of effects.
We can also perform a more conservative comparison of the effects in the two experiments by
restricting our analysis to those connections, and AAL regions, that show a significant effect in both
experiments. This is shown in Table 2. In the Alpha band there is a single occipital connection that
has reduced connectivity in both APOE-"4 carriers and AD. In the Beta band there is a single con-
nection from the medial precuneus region to right lateral parietal that shows hyperconnectivity in
APOE-"4 carriers and hypoconnectivity in people with AD, compared to their respective controls.
Koelewijn et al. eLife 2019;8:e36011. DOI: https://doi.org/10.7554/eLife.36011 5 of 25
Research article Neuroscience

Figure 2. Spatial distribution of differences in oscillatory activity, between young APOE-e4 carriers and their matched controls and the relationship with
hyper- and hypo- connectivity. Top panel shows differences in activity as a coloured overlay depicting unpaired t-statistics (thresholded at p<0.05,
corrected using TFCE), with yellow/orange representing greater activity in the APOE-e4 carriers. Significant effects were only found in the right
hemisphere and only for the two gamma ranges tested, 40–60 Hz and 60–140 Hz. The overlays are shown depicted on a template brain surface. The far-
right column shows the results for the 60–140 Hz comparison using a more stringent voxel-wise correction for multiple-comparisons. The bottom panel
shows the distribution of differences in both connectivity and activity, between APOE-e4 carriers and non-carriers, within each AAL node that shows any
significant effect. For clarity the left and right hemispheres are shown separately. Red lines show the number of significant connections to/from each
node that are of higher strength in APOE-e4 carriers, compared to non-carriers. Blue lines show the number of significant connections to/from each
AAL node that are weaker in APOE-e4 carriers. For the right hemisphere only, as effects were only found on the right, the green lines show the most
significant t-statistic found in each AAL region for the analysis of gamma activity. Positive values indicate that gamma activity, in either band, was higher
in APOE-e4 carriers compared to non-carriers. Note that connection numbers are the sum across all frequency ranges tested, with most of these
coming from the low frequencies – only one connection (FrontalInfTriL to TemporalPoleMidR) showed hyperconnectivity in the gamma range. In
contrast, only gamma showed hyperactivity, so the green lines/marker exclusively reflect right-hemisphere gamma hyperactivity. The spreadsheet used
to generate the graphs on this figure can be found at http://dx.doi.org/10.17605/OSF.IO/E4CJX.
DOI: https://doi.org/10.7554/eLife.36011.004
Koelewijn et al. eLife 2019;8:e36011. DOI: https://doi.org/10.7554/eLife.36011 6 of 25
Research article Neuroscience
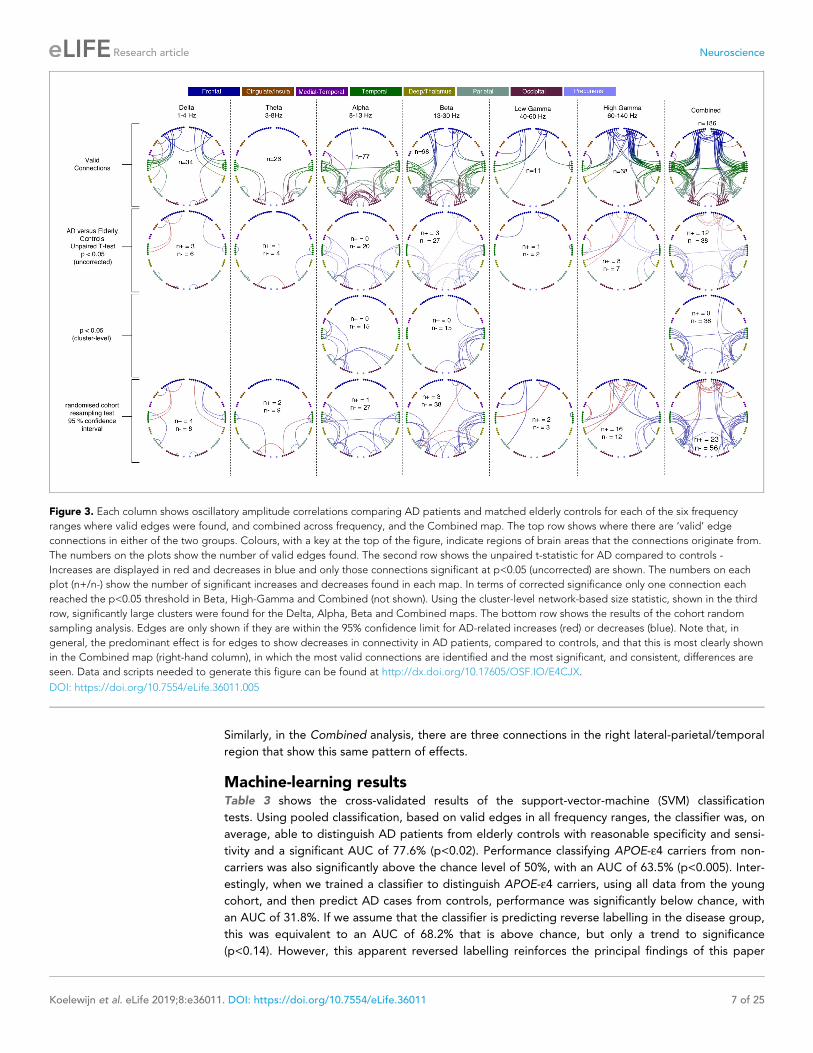
Similarly, in the Combined analysis, there are three connections in the right lateral-parietal/temporal
region that show this same pattern of effects.
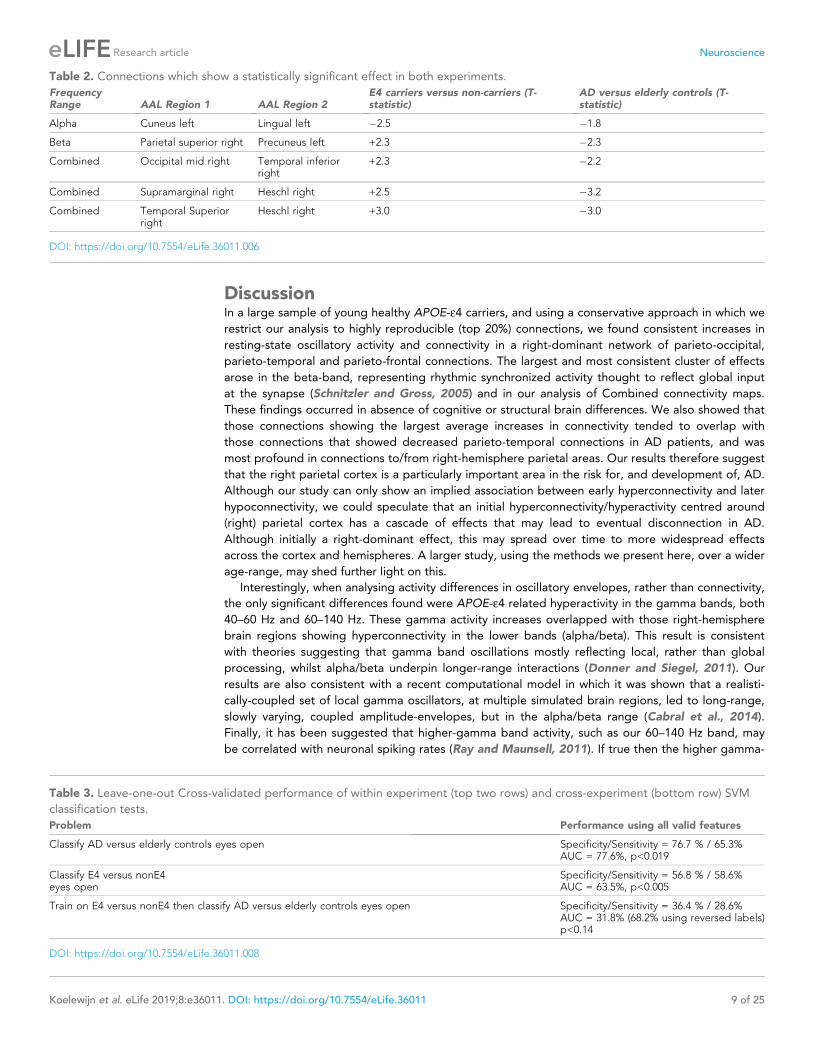
Machine-learning resultsTable 3 shows the cross-validated results of the support-vector-machine (SVM) classification
tests. Using pooled classification, based on valid edges in all frequency ranges, the classifier was, on
average, able to distinguish AD patients from elderly controls with reasonable specificity and sensi-
tivity and a significant AUC of 77.6% (p<0.02). Performance classifying APOE-e4 carriers from non-
carriers was also significantly above the chance level of 50%, with an AUC of 63.5% (p<0.005). Inter-
estingly, when we trained a classifier to distinguish APOE-e4 carriers, using all data from the young
cohort, and then predict AD cases from controls, performance was significantly below chance, with
an AUC of 31.8%. If we assume that the classifier is predicting reverse labelling in the disease group,
this was equivalent to an AUC of 68.2% that is above chance, but only a trend to significance
(p<0.14). However, this apparent reversed labelling reinforces the principal findings of this paper
Figure 3. Each column shows oscillatory amplitude correlations comparing AD patients and matched elderly controls for each of the six frequency
ranges where valid edges were found, and combined across frequency, and the Combined map. The top row shows where there are ‘valid’ edge
connections in either of the two groups. Colours, with a key at the top of the figure, indicate regions of brain areas that the connections originate from.
The numbers on the plots show the number of valid edges found. The second row shows the unpaired t-statistic for AD compared to controls -
Increases are displayed in red and decreases in blue and only those connections significant at p<0.05 (uncorrected) are shown. The numbers on each
plot (n+/n-) show the number of significant increases and decreases found in each map. In terms of corrected significance only one connection each
reached the p<0.05 threshold in Beta, High-Gamma and Combined (not shown). Using the cluster-level network-based size statistic, shown in the third
row, significantly large clusters were found for the Delta, Alpha, Beta and Combined maps. The bottom row shows the results of the cohort random
sampling analysis. Edges are only shown if they are within the 95% confidence limit for AD-related increases (red) or decreases (blue). Note that, in
general, the predominant effect is for edges to show decreases in connectivity in AD patients, compared to controls, and that this is most clearly shown
in the Combined map (right-hand column), in which the most valid connections are identified and the most significant, and consistent, differences are
seen. Data and scripts needed to generate this figure can be found at http://dx.doi.org/10.17605/OSF.IO/E4CJX.
DOI: https://doi.org/10.7554/eLife.36011.005
Koelewijn et al. eLife 2019;8:e36011. DOI: https://doi.org/10.7554/eLife.36011 7 of 25
Research article Neuroscience

that APOE-e4 carrier status in young controls is principally revealed by hyperconnectivity,
whilst Alzheimer’s disease leads to hypoconnectivity in a larger, but overlapping, set of connections.
Figure 4. Comparison of connectivity differences in the two experiments, assessed using the Combined connectivity maps. (a) Replotting of the results
for the Combined maps, extracted from Figure 1 and Figure 2 and displayed in the same format. At the bottom of this panel, a conjunction analysis is
shown in which connections that meet the 95% confidence criterion for both experiments are displayed. Three connections survive this test and are
shown in blue to reflect the fact that the effects have opposite sign (see Table 2 for more details). (b) A comparison of connections surviving a 95%
confidence interval threshold, estimated using cohort resampling, for the APOE-e4 versus young controls experiment (top row) and the AD versus
elderly controls experiment (bottom row). Here we display the thresholded connections on both the circle plots (left column) and three views of a
template brain (columns 2–4). (c) A direct comparison of effect sizes. In the left column, unthresholded t-statistics are displayed for the two experiments,
with the opacity of the lines reflecting the magnitude of the t-statistic. In the middle, the two sets of t-statistics are multiplied together for display. In
this panel, strong lines represent connections with high t-statistics for both the APOE-e4 experiment and the AD experiment, with blue colours
representing connections which show opposite effect directions for example hyperconnectivity in APOE-e4 and hypoconnectivity in AD. In the right
panel, the scatter plot shows the effect-size (i.e. unpaired t-statistic, thresholded at p<0.05 uncorrected) for the AD versus elderly control experiment,
plotted against the effect-size for the APOE-e4 carriers versus non-carriers experiment. A clear negative relationship is observed. Data and scripts
needed to generate this figure can be found at http://dx.doi.org/10.17605/OSF.IO/E4CJX.
DOI: https://doi.org/10.7554/eLife.36011.007
Koelewijn et al. eLife 2019;8:e36011. DOI: https://doi.org/10.7554/eLife.36011 8 of 25
Research article Neuroscience
DiscussionIn a large sample of young healthy APOE-e4 carriers, and using a conservative approach in which we
restrict our analysis to highly reproducible (top 20%) connections, we found consistent increases in
resting-state oscillatory activity and connectivity in a right-dominant network of parieto-occipital,
parieto-temporal and parieto-frontal connections. The largest and most consistent cluster of effects
arose in the beta-band, representing rhythmic synchronized activity thought to reflect global input
at the synapse (Schnitzler and Gross, 2005) and in our analysis of Combined connectivity maps.
These findings occurred in absence of cognitive or structural brain differences. We also showed that
those connections showing the largest average increases in connectivity tended to overlap with
those connections that showed decreased parieto-temporal connections in AD patients, and was
most profound in connections to/from right-hemisphere parietal areas. Our results therefore suggest
that the right parietal cortex is a particularly important area in the risk for, and development of, AD.
Although our study can only show an implied association between early hyperconnectivity and later
hypoconnectivity, we could speculate that an initial hyperconnectivity/hyperactivity centred around
(right) parietal cortex has a cascade of effects that may lead to eventual disconnection in AD.
Although initially a right-dominant effect, this may spread over time to more widespread effects
across the cortex and hemispheres. A larger study, using the methods we present here, over a wider
age-range, may shed further light on this.
Interestingly, when analysing activity differences in oscillatory envelopes, rather than connectivity,
the only significant differences found were APOE-e4 related hyperactivity in the gamma bands, both
40–60 Hz and 60–140 Hz. These gamma activity increases overlapped with those right-hemisphere
brain regions showing hyperconnectivity in the lower bands (alpha/beta). This result is consistent
with theories suggesting that gamma band oscillations mostly reflecting local, rather than global
processing, whilst alpha/beta underpin longer-range interactions (Donner and Siegel, 2011). Our
results are also consistent with a recent computational model in which it was shown that a realisti-
cally-coupled set of local gamma oscillators, at multiple simulated brain regions, led to long-range,
slowly varying, coupled amplitude-envelopes, but in the alpha/beta range (Cabral et al., 2014).
Finally, it has been suggested that higher-gamma band activity, such as our 60–140 Hz band, may
be correlated with neuronal spiking rates (Ray and Maunsell, 2011). If true then the higher gamma-
Table 2. Connections which show a statistically significant effect in both experiments.
FrequencyRange AAL Region 1 AAL Region 2
E4 carriers versus non-carriers (T-statistic)
AD versus elderly controls (T-statistic)
Alpha Cuneus left Lingual left �2.5 �1.8
Beta Parietal superior right Precuneus left +2.3 �2.3
Combined Occipital mid right Temporal inferiorright
+2.3 �2.2
Combined Supramarginal right Heschl right +2.5 �3.2
Combined Temporal Superiorright
Heschl right +3.0 �3.0
DOI: https://doi.org/10.7554/eLife.36011.006
Table 3. Leave-one-out Cross-validated performance of within experiment (top two rows) and cross-experiment (bottom row) SVM
classification tests.
Problem Performance using all valid features
Classify AD versus elderly controls eyes open Specificity/Sensitivity = 76.7 % / 65.3%AUC = 77.6%, p<0.019
Classify E4 versus nonE4eyes open
Specificity/Sensitivity = 56.8 % / 58.6%AUC = 63.5%, p<0.005
Train on E4 versus nonE4 then classify AD versus elderly controls eyes open Specificity/Sensitivity = 36.4 % / 28.6%AUC = 31.8% (68.2% using reversed labels)p<0.14
DOI: https://doi.org/10.7554/eLife.36011.008
Koelewijn et al. eLife 2019;8:e36011. DOI: https://doi.org/10.7554/eLife.36011 9 of 25
Research article Neuroscience
band activity we see in APOE-e4 carriers may be a reflection of the neuronal hyperactivity, associ-
ated with increased amyloid-b, seen in rodent AD models (Stargardt et al., 2015).
The highly specific spatial patterns of increased resting-state oscillatory connectivity in young
APOE-e4 carriers, identifying the right parietal cortex as the most affected area, including inter-
hemispheric connections and connections to the precuneus, complement and extend current neuro-
physiology findings. MEG studies using Graph Theory network measures have also identified a loss
of connectivity in AD, with the parietal cortex as the most affected hub (de Haan et al., 2012b;
Tijms et al., 2013). Effects were found specifically in the beta band – thought to play an important
role in long-range functional connectivity (Schnitzler and Gross, 2005). Furthermore, previous EEG
studies on APOE-e4 have identified differences in power or connectivity in the alpha band, but these
have only been investigated in older participants (Babiloni et al., 2006; Canuet et al., 2012;
de Waal et al., 2013; Jelic et al., 1997; Kramer et al., 2008; Ponomareva et al., 2008). Using the
higher spatial resolution of MEG, Cuesta et al. (Cuesta et al., 2015) studied source-localised con-
nectivity in elderly participants with and without MCI, and found that APOE-e4 carriers showed dif-
ferences only in a much lower frequency band than alpha (delta, 1–4 Hz), focused around a frontal
brain hub. Cuesta et al. measured phase-based connectivity, using the phase-locking value, a very
different measure than the amplitude correlations we used, and more prone to source leakage arte-
facts (Colclough et al., 2016). Interestingly, in our previous study we found clear changes in oscil-
latory amplitude, but not phase correlations, in the brains of AD patients (Koelewijn et al., 2017),
though we did not investigate MCI patients. For these reasons, and to reduce multiple comparisons,
we did not investigate phase-based connectivity here.
To our knowledge, only one small MEG study (N = 8) has previously investigated young APOE-e4
carriers, and found increases in mainly medial-frontal theta-band (3.5–7 Hz) oscillatory power during
a working memory task (Filbey et al., 2006). This study did not investigate connectivity, nor analyse
the alpha or beta band. Of note is that many previous neuroimaging studies used very low numbers
of participants, with the resulting APOE-e4 carrier groups being typically below N = 20, with some
notable exceptions in elderly participants (Babiloni et al., 2006; de Waal et al., 2013;
Sheline et al., 2010). Our more highly-powered MEG study in young participants therefore provides
valuable, reliable, and unique insights into the early effects of APOE-e4 on oscillatory brain function.
Functional MRI (fMRI) resting-state studies typically show that the blood-oxygen-level-dependent
(BOLD) response within the default-mode network (DMN) is reduced in healthy ageing
(Damoiseaux et al., 2008). This reduction is accelerated in AD (Buckner et al., 2008) and is also
modified in elderly APOE-e4 carriers compared to non-carriers (Sheline et al., 2010). Filippini et al.
(Filippini et al., 2009a) previously investigated DMN BOLD activity in a small sample of young
APOE-e4 carriers versus non-carriers (N = 18 each) using an independent component analysis (ICA)
technique. They found increased co-activation of areas within the DMN for e4 carriers, which were
focused on hippocampal and frontal, but posterior regions were not significantly different. Further-
more, they also found an increase in the sensorimotor network. Despite the different spatial focus of
effects, these fMRI findings are similar to ours in that they reveal increased brain connectivity in
young APOE-e4 carriers. In a more recent resting state-fMRI study of older, but healthy, APOE-e4
carriers it was found that, as well as replicating Fillipini et al.’s finding of increased hippocampal
DMN connectivity, significant increases in network activity were also found for APOE-e4 carriers in
posterior regions of the DMN, including the precuneus, and lateral parietal regions as well as frontal
cortex (Westlye et al., 2011). Importantly, these frontal and posterior-lateral regions were only sig-
nificantly increased in the right hemisphere (their Figure 1D and Table 3), showing good concor-
dance with our findings of oscillatory hyperconnectivity in similar right-hemisphere regions. Finally,
we note that some recent task-based fMRI studies have also shown APOE-e4 carrier hyperactivity in
posterior parts of the DMN (Hodgetts et al., 2019; Shine et al., 2015). Interestingly, the authors of
these studies speculate that hyperactivity/hyperconnectivity of the DMN in these young APOE-e4
carriers may reflect reduced network efficiency/flexibility.
Note that in our cohort, and other previous studies, there is little or no evidence of cortical vol-
ume changes, including hypothesised hippocampal volume decreases (Filippini et al., 2009a;
Heise et al., 2011; O’Dwyer et al., 2012; Wishart et al., 2006), suggesting that changes in both
haemodynamic and oscillatory brain function can be detected before changes in brain structure in
the pathway of increased risk for AD (Figure 5, lower panel, (Hampel et al., 2011)).
Koelewijn et al. eLife 2019;8:e36011. DOI: https://doi.org/10.7554/eLife.36011 10 of 25
Research article Neuroscience
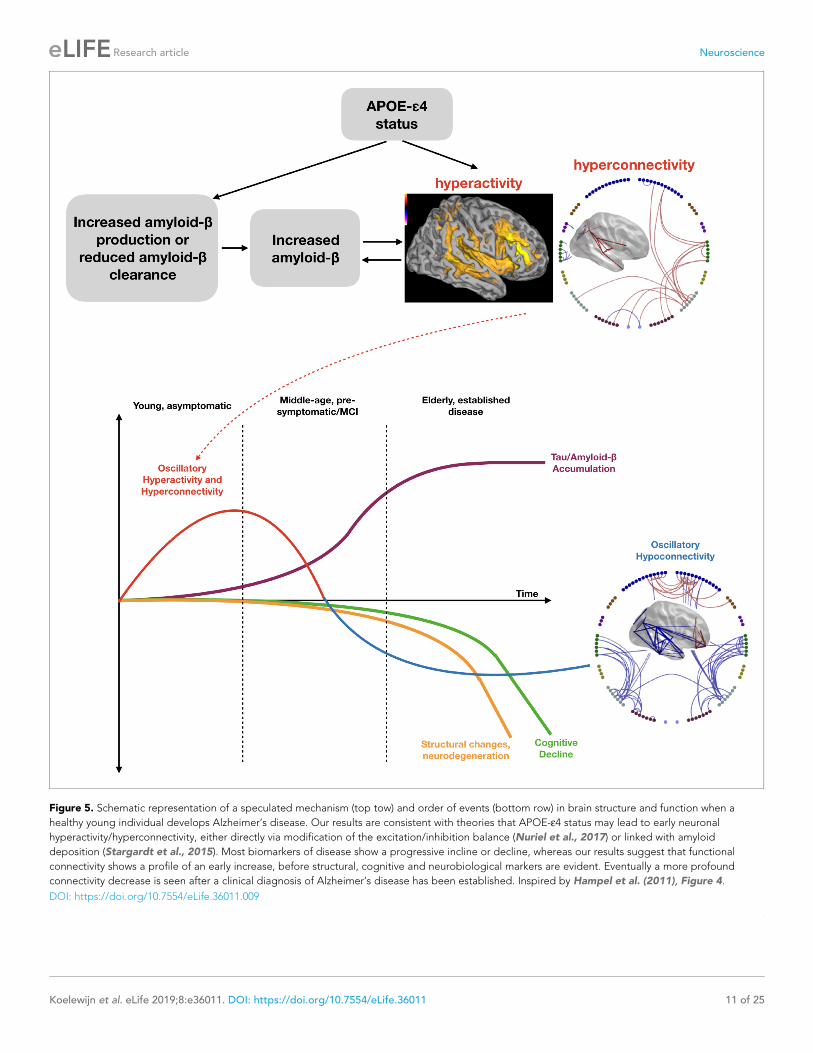
Figure 5. Schematic representation of a speculated mechanism (top tow) and order of events (bottom row) in brain structure and function when a
healthy young individual develops Alzheimer’s disease. Our results are consistent with theories that APOE-e4 status may lead to early neuronal
hyperactivity/hyperconnectivity, either directly via modification of the excitation/inhibition balance (Nuriel et al., 2017) or linked with amyloid
deposition (Stargardt et al., 2015). Most biomarkers of disease show a progressive incline or decline, whereas our results suggest that functional
connectivity shows a profile of an early increase, before structural, cognitive and neurobiological markers are evident. Eventually a more profound
connectivity decrease is seen after a clinical diagnosis of Alzheimer’s disease has been established. Inspired by Hampel et al. (2011), Figure 4.
DOI: https://doi.org/10.7554/eLife.36011.009
Koelewijn et al. eLife 2019;8:e36011. DOI: https://doi.org/10.7554/eLife.36011 11 of 25
Research article Neuroscience
The results presented here are, of course, only correlational in nature but we can speculate, in the
presence of prior in-vitro and in-vivo animal studies, what underlying neurophysiological changes
underpin our hyperactivity and hyperconnectivity findings. It is known that increased amyloid-b is
somehow related to increased neural activity, although the sequence of cause and effect is not
known (Stargardt et al., 2015). For example, it was shown in a rodent disease model that during
Braak pre-symptomatic stages 0, I and II, amyloid-b starts to accumulate within neurons, whilst at the
same time synaptic activity rises within the neurons (i.e. hyperactivity). As the disease progresses to
Braak stage VI, and amyloid-b becomes significant enough to cause plaques, synaptic activity then
falls (i.e. hypoactivity). Interestingly, it appeared that the rise in amyloid-b appeared to be linked to
a reduction of activity in the Insulin-Degrading Enzyme (IDE).
However, what it is not clear is how APOE-e4 carrier status might lead to an increased risk of the
hyperactivity <>amyloid-b relationship described above in young or even middle-aged people.
Experimental studies have demonstrated that carrying the APOE-e4 allele leads to a wide range of
effects in the brain, including impaired myelination, mitochondrial dysfunction, reduced cholinergic
function and vascular pathology (Reinvang et al., 2013). Healthy elderly APOE-e4 carriers also show
increased uptake of amyloid-binding PET ligands (PiB) (Morris et al., 2010; Reiman et al., 2009).
Already in middle age, post-mortem studies of APOE-e4 carriers have shown an increase in senile
amyloid-b plaques (Kok et al., 2009), with some evidence of this even at ages as young as 30. It is
therefore reasonable for us to speculate that in our young cohort, although amyloid-b plaques may
not have yet developed, amyloid-b may be accumulating and, as in the rodent model, be associated
with neural hyperactivity (Figure 5, upper panel). The mechanism for how APOE-e4 carrier status
leads to increased amyloid-b deposition is complex and may involve multiple mechanisms, including
disruptions of amyloid-b clearance systems dependent on receptor-mediated, cerebrovascular or
proteolytic degradation (Kanekiyo et al., 2014; Zhao et al., 2018). For example, one study has
shown that APOE-e4 leads to reduced levels of insulin-degrading enzyme (IDE), one of the most
important enzymes for amyloid-b clearance (Du et al., 2009) and, as described above, is reduced
during pre-symptomatic stages in rodent disease models which also show synaptic hyperactivity
(Stargardt et al., 2015).
It has also been shown in a recent study, however, that neural hyperactivity can also occur in
APOE-e4 mouse models in the absence of overt amyloid or tau pathology (Nuriel et al., 2017) via a
mechanism in which APOE-e4 leads to an overall decrease in inhibition caused by a reduced respon-
siveness of excitatory neurons to GABAergic input. The authors therefore suggest that it is this
APOE-e4 related shift in the excitation/inhibition balance that leads to hyperactivity that later results
in increased amyloid deposition, and hence increased risk of AD.
It is important to note, though, that increased amyloid-b is not sufficient to cause AD (Her-
rup, 2015; Sheline et al., 2010) and the presence of APOE-e4 does not guarantee progression to
AD. It remains to be investigated what role other important factors for AD play in this cascade of
events, such as the tau protein (Ossenkoppele et al., 2016). Interestingly, PET studies of AD have
also demonstrated AD-related hypometabolism in bilateral parieto-temporal regions that are very
similar to the regions we report here (Kato et al., 2016).
Our findings therefore support theories based on rodent models (Stargardt et al., 2015), human
computational models (de Haan et al., 2012b) and MCI data (Maestu et al., 2015) that propose
that hyperactivity, ultimately related to hyperconnectivity, may be at the heart of brain dysfunction
that could eventually lead to AD, and provides compelling evidence that this may already happen in
early adulthood. Areas predisposed to hyperconnectivity are thought to be prone to yield increased
accumulation of amyloid-b (Myers et al., 2014), supported by longitudinal PET and fMRI studies
which found that hippocampal hyperactivation in elderly individuals leads to widespread increased
deposition of amyloid-b as well as hippocampal signal loss and memory decline, although these
studies found no effect of APOE-e4 (O’Brien et al., 2010) or there was insufficient power to test this
(Leal et al., 2017). The present study suggests that the parietal cortex is an important common early
focus for hyperconnectivity, possibly as part of the posterior DMN. Importantly, this hyperconnectiv-
ity is present during the task-free resting-state, both avoiding and highlighting the potential con-
found of baseline-level differences in task-based group studies.
One important methodological note, for future work, is that our exploratory analysis, in which we
combined the connectivity maps from different frequency bands using a vector sum approach,
revealed both more robust connectivity patterns across participants, with increased number of valid
Koelewijn et al. eLife 2019;8:e36011. DOI: https://doi.org/10.7554/eLife.36011 12 of 25
Research article Neuroscience
edge connections, and increased sensitivity to both APOE-e4 carrier effects and Alzheimer disease-
related changes in connectivity. This simple combination of effects may therefore be worth adding
to future studies in order to, potentially, provide increased sensitivity to disease-related
modulations.
In addition to classical statistics we used machine-learning classification approaches to investigate
how much discriminative information is present within these static oscillatory connectivity matrices.
Here, the support-vector-machine (SVM) was trained used a pooled set of features taken from all
valid connectivity edges from all frequency bands and the combined map. The SVM will, as part of
its decision boundary optimisation, choose the best weighting of all these features. When tested
using leave-one-out cross validation, the classifier was able to decode APOE-e4 carriers from con-
trols and AD patients from elderly controls, with significantly better than chance performance. In our
small AD cohort, prediction performance appeared close to 70%, however, given the low number of
participants in this study, this needs to be evaluated using a larger independent sample. Although
our results here must be considered preliminary, they are encouraging – particularly as the AD
patients in our study were relatively early in their diagnosis.
In the current study, we employed MEG to show patterns of oscillatory hyperactivity and hyper-
connectivity in neural activity in young-adult APOE-e4 carriers, identifying the right parietal cortex as
an important centre in these hyperconnectivity patterns. One particularly attractive feature of MEG
is that it provides non-invasive high-temporal and spatial-resolution measures of neurophysiology
that allow for comparison with cellular hyperactivity data in a translational context (Busche et al.,
2008), providing potential biomarkers for new therapeutic and preventative studies in the pathologi-
cal processes leading to AD. Finally, an important question is why and at what stage hyperconnectiv-
ity ‘collapses’ to convert to the profound disconnection and symptomology of AD, and what further
factors determine whether e4 carriers indeed go on to develop AD. Future studies focusing on the
often-neglected middle-age group, between the very young and the elderly, as well as longitudinal
studies will be invaluable to unravel the time course of these events.
Limitations of the studyThere are several methodological limitations of this study that need to be acknowledged. Firstly, all
of the analyses we present here are associations or correlations than can only imply a link between
APOE-e4 status, hyperconnectivity and future risk of developing Alzheimer’s disease – no causal rela-
tionships can be proved in this type of study. Similarly, the partial spatial overlap between the hyper-
connectivity we observe in young APOE-e4 carriers, compared to their control group, and
hypoconnectivity shown in elderly AD patients, compared to their control group, is interesting but
again does not demonstrate a causal link or a direct trajectory. Longitudinal studies that use our
methods in individuals as they age, perhaps in older people with and without Mild Cognitive
Impairment (MCI), to see if conversion to AD can be predicted would be an exciting extension of
our work.
Although our young APOE-e4 sample size is larger (51 versus 108) than much of the previous
work in this field, it is still relatively small and our findings need replicating in an independent cohort.
Such cohorts are starting to become available as online resources (e.g. CamCAN, http://www.cam-
can.org/index.php?content=dataset) and it would be relatively straightforward to replicate our spe-
cific analysis pipeline, including our edge-thresholding procedure, to confirm the findings we report
here. Second, as this is an exploratory study, we did not perform an exhaustive test of all connectiv-
ity metrics we could have employed, such as phase-based measures and dynamic connectivity analy-
ses. We took the simplest possible measure – static oscillatory amplitude-amplitude envelope
correlation as this has previously demonstrated the best within-participant reproducibility
(Colclough et al., 2016) but this does not guarantee that such robust and repeatable measures are
the most sensitive to cohort differences. It is entirely possible that other measures, particularly time-
resolved dynamic connectivity analyses (Vidaurre et al., 2016), could be more sensitive and informa-
tive than the static amplitude-amplitude measure we used here.
Similarly, we took a conscious decision to only analyse connections that were assessed to be the
strongest and thus, the most repeatable, across participants in our cohorts. In a way, this is a form of
quality-control that rejects features (here connectivity edges) that are of low SNR and hence are
poorly estimated in individuals and we note that such a procedure is common in the application of
graph-theory methods for the analysis of network properties. It is entirely possible that we have
Koelewijn et al. eLife 2019;8:e36011. DOI: https://doi.org/10.7554/eLife.36011 13 of 25
Research article Neuroscience

chosen a procedure, and in particular a threshold (mean rank of 80%), that is sub-optimal for reveal-
ing cohort differences. This is particularly relevant for MEG in which SNR is region-dependent and
so we may have biased our analysis here to be more sensitive to superficial cortical regions (such as
the parietal lobes) whilst suppressing an analysis of poor SNR regions, such as deeper regions in the
brain. Future work could tune this parameter (as well as varying other parameters in our analysis
pipeline) to try and maximise detection and discriminability of cohort effects across the brain. How-
ever, it is worth noting that MEG source-localisation algorithms, including the beamformer we use
here, have non-uniform spatial resolution that means that regions with poor SNR, including deeper
regions, are poorly resolved and hence activity is spread over wider regions. By restricting our statis-
tical analyses to regions with higher SNR, we are protecting ourselves, somewhat, from localisation
errors that could result from this spatial spreading.
In common with previous studies, we used a procedure in which, after trial-rejection and beam-
former source localisation, trials were concatenated to form a continuous virtual-sensor timeseries
for subsequent analysis. One potential problem with this is that it introduces discontinuities in the
timeseries that could lead to sub-optimal estimations of connectivity. The precise impact of this is
difficult to predict as it depends on the exact temporal distribution of rejected trials. However, it is
likely to have the biggest impact on the very lowest frequencies, such as Delta, which only has rela-
tively few oscillatory cycles in each trial. In our experiment there was no significant difference in the
number of rejected trials between the groups (e.g. APOE-e4 carriers and their controls) but this con-
catenation procedure may have reduced our sensitivity to effects in the Delta and Theta ranges,
which showed relatively few robust connections compared to Alpha and Beta.
We chose to use a common anatomical parcellation, the AAL (Tzourio-Mazoyer et al., 2002)
atlas, which ourselves and other groups (Hillebrand et al., 2016; Hunt et al., 2016;
Koelewijn et al., 2017; Pang et al., 2016; Routley et al., 2017) have used in multiple MEG connec-
tivity analysis papers, including our recent paper on oscillatory dysconnectivity in AD
(Koelewijn et al., 2017). We therefore chose, a-priori, a commonly used atlas for our spatial reduc-
tion strategy. However, this atlas has 90 regions of largely varying size and shape and has been
defined without regard to the sensitivity profile of our MEG system to different regions of the brain.
We are therefore summarising activity, using a single virtual sensor, in what are large extended
regions of widely varying SNR. This will bias our results to detecting connectivity in certain regions
and may well be sub-optimal for detecting interactions between regions in which a finer, or coarser,
parcellation may well have been beneficial. The principled way forward here might be to derive par-
cellations that use information regarding the MEG lead-field and the resulting resolution kernels in
source-space (Farahibozorg et al., 2018).
A similar criticism might also be levelled at our source-leakage correction procedure in which we
have used multivariate orthogonalisation (Colclough et al., 2015) simultaneously across all 90 time-
courses to minimise all cross parcel correlations in the raw timeseries. This procedure may well be
most successful in conditioning, and hence detecting, high-SNR signals which will tend to be more
superficial signals with higher oscillatory power, such as the lateral parietal regions we describe in
this paper. This differential sensitivity, which stems fundamentally from the relative lack of depth-sen-
sitivity in MEG recordings but may be worsened by these analysis procedure choices, may well
explain why our findings do not fully match those found in previous fMRI studies (Filippini et al.,
2009a; Westlye et al., 2011), at least for deep and medial regions.
Materials and methodsIn this paper we present the results of analysing two MEG resting-state experiments: 1) A study of
young healthy participants who have been genotyped for APOE-e4 and 2) A study of Alzheimer’s
disease (AD) patients compared to a matched cohort of elderly controls.
Participants in experiment 1: young APOE-"4 cohortThe APOE analysis was performed on resting-state MEG data acquired at CUBRIC as part of the
‘100 Brains’ and ‘UK MEG Partnership’ projects, which together yielded a total of 183 usable data-
sets. Inclusion criteria were aged 18–65, completed or be undertaking a degree, normal or cor-
rected-to-normal vision, and no history of neurological or neuropsychiatric disorder. Of the 183
participants, 51 participants were identified as heterozygote or homozygote APOE-e4 carriers, and
Koelewijn et al. eLife 2019;8:e36011. DOI: https://doi.org/10.7554/eLife.36011 14 of 25
Research article Neuroscience

108 as not carrying an e4 allele (demographic details in Table 1). Genotyping was unsuccessful in the
remaining 24 participants, who were excluded from analysis. All participants gave informed consent
according to the Declaration of Helsinki and all procedures were approved by the Ethics Committee
of the School of Psychology, Cardiff University (EC.12.01.10.3071).
APOE genotyping in Experiment 1Genomic DNA was obtained from saliva using Oragene OG-500 saliva kits (DNA Genotek, Inc.,
Ontario, Canada). Genotyping was performed using custom Illumina HumanCoreExome-24 Bead-
Chip genotyping arrays, which contain approximately 500,000 common genetic variants (Illumina,
Inc., San Diego, CA). Quality control and imputation were implemented in plink 1.9 (Chang et al.,
2015). Individuals were excluded for any of the following reasons: 1) ambiguous sex (where samples
with undetermined X chromosome heterozygosity were excluded); 2) cryptic relatedness up to third-
degree relatives as ascertained using identity by descent; 3) genotyping completeness less than
98%; 4) non-European ethnicity admixture which was determined via population stratification, where
samples that clustered outside the CEU HapMap3 population using principal component analysis
were excluded; and 5) outliers from an autosomal heterozygosity filter. Single nucleotide polymor-
phisms (SNPs) were excluded where the minor allele frequency was less than 1%, if the call rate was
less than 98%, or if the c2 test for Hardy-Weinberg equilibrium had a p value less than 1e-6. A total
of 233,054 genotyped SNPs remained after quality control. Autosomal chromosomes were imputed
using the reference panel HRCv1.1 (hrc.r1.1.2016) using a mixed population panel (McCarthy et al.,
2016). Phasing was completed using Eagle v2.3 (Loh et al., 2016) and imputation was performed
using Mimimac3 (Das et al., 2016). Imputed data was converted to best-guess genotypes
(Chang et al., 2015) with multi-allelic sites removed. SNP filters for HWE (1e-6) and minor allele fre-
quency (1%) were re-applied. A total of 7,545,595 SNPs were successfully imputed. Variants rs7412
and rs429358 were used to estimate APOE genotype for all 183 individuals (Corneveaux et al.,
2010).
Experiment 1 young APOE-"4 cohort: data acquisition and analysisData acquisitionFive-minute whole-head MEG recordings were acquired at a 1200 Hz sample rate using a 275-chan-
nel CTF radial gradiometer system. An additional 29 reference channels were recorded for noise
cancellation purposes and the primary sensors were analysed as synthetic third-order gradiometers
(Vrba and Robinson, 2001). Subjects were seated upright in the magnetically shielded room with
their head supported with a chin rest to minimise movement. Participants were asked to rest and fix-
ate their eyes on a central red fixation point, presented on either a CRT monitor or LCD projector.
Horizontal and vertical electro-oculograms (EOG) were recorded to monitor eye blinks and eye
movements.
Participants also underwent a magnetic resonance imaging (MRI) session in which a T1-weighted
1 mm anatomical scan was acquired, using an inversion recovery spoiled gradient echo acquisition
(3T, General Electric).
Participants further performed the MATRICS Consensus Cognitive Battery (MCCB) (Kern et al.,
2008; Nuechterlein et al., 2008). Group performance was compared using two-sample t-tests,
excluding missing or incomplete data (leaving per task N = 47–48 for e4 carriers and N = 98–100 for
non-carriers, see Table 1).
MEG data analysisMEG generates multi-dimensional data, which can be analysed in a large variety of ways. We sought
to conduct an analysis investigating only consistent functional connectivity across the brain, while
reducing noise. We focused on amplitude-amplitude connectivity of beamformer-derived oscillatory
source signals, one of the most robust and repeatable types of MEG connectivity measures
(Colclough et al., 2016), across six frequency bands and 90 AAL atlas brain areas. The analysis pipe-
line also allowed a voxelwise assessment of resting-state activity within each frequency band and is
displayed in Figure 6.
All datasets were down-sampled to 600 Hz, and filtered with a 1 Hz high-pass and a 150 Hz low-
pass filter. The datasets were then segmented into 2 s epochs. The data were visually inspected and
Koelewijn et al. eLife 2019;8:e36011. DOI: https://doi.org/10.7554/eLife.36011 15 of 25
Research article Neuroscience
epochs with major artefacts such as head movements, large muscle contractions, or ocular artefacts
were excluded from subsequent analysis.
To achieve MRI/MEG co-registration, fiduciary markers were placed at fixed distances from three
anatomical landmarks identifiable in the subject’s anatomical MR scan, and their locations were man-
ually marked in the MR image. Head localization was performed at the start and end of each
recording.
The MEG sensor data were source-localised using FieldTrip (RRID:SCR_004849) version 20161011
(Oostenveld et al., 2011), with an LCMV beamformer on a 6 mm grid, using a single-shell forward
model (Nolte, 2003), where the covariance matrix was constructed per each of the following fre-
quency bands: 1–4, 3–8, 8–13, 13–30, 40–60, and 60–140 Hz. For each band, the beamformer
weights were normalized using a vector norm (Hillebrand et al., 2012), data were normalized to the
MNI template, and reduced to 90 nodes following the Automatic Anatomical Labelling (AAL) atlas
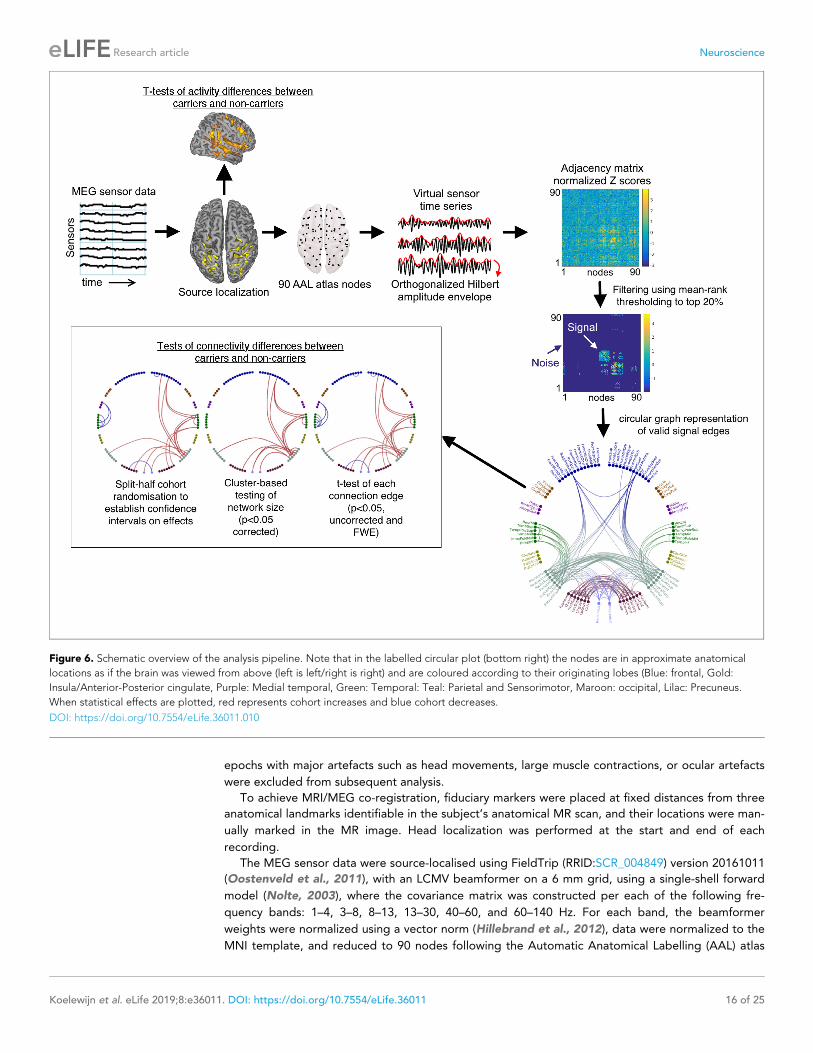
Figure 6. Schematic overview of the analysis pipeline. Note that in the labelled circular plot (bottom right) the nodes are in approximate anatomical
locations as if the brain was viewed from above (left is left/right is right) and are coloured according to their originating lobes (Blue: frontal, Gold:
Insula/Anterior-Posterior cingulate, Purple: Medial temporal, Green: Temporal: Teal: Parietal and Sensorimotor, Maroon: occipital, Lilac: Precuneus.
When statistical effects are plotted, red represents cohort increases and blue cohort decreases.
DOI: https://doi.org/10.7554/eLife.36011.010
Koelewijn et al. eLife 2019;8:e36011. DOI: https://doi.org/10.7554/eLife.36011 16 of 25
Research article Neuroscience
(Tzourio-Mazoyer et al., 2002). The selection of one node per AAL region was achieved by per-
forming a frequency analysis on all virtual channels within the AAL region, and selecting the virtual
channel with the greatest temporal standard-deviation within the region. Epochs were concatenated
to generate a continuous virtual-sensor timecourse for each voxel and then band-passed into the rel-
evant frequency-band of interest (Delta: 1–4 Hz, Theta: 3–8 Hz, Alpha: 8–13 Hz, Beta-13–30 Hz, Low
Gamma: 40–60 Hz and High-Gamma: 60–140 Hz).
The resulting 90-node time series were orthogonalized to avoid spurious correlations using a mul-
tivariate regression approach known as symmetric orthogonalization (Colclough et al., 2015). The
data then underwent a Hilbert transform to obtain the oscillatory amplitude envelope, and were sub-
sequently despiked to remove artefactual temporal transients using a median filter, downsampled to
1 Hz and trimmed to avoid edge effects (removing the first 2 and last three samples). Amplitude cor-
relations were then calculated by correlating the 90 downsampled Hilbert envelopes to each other,
and converted to variance-normalized Z-scores by applying a Fisher transform. In addition to analy-
sing effects within each frequency band separately, we also synthesised a combined measure of con-
nectivity by calculating the vector-sum of all connectivity matrices, using the following formula for
each element (i,j) in the square connectivity matrix:
Combinedij ¼ sqrtðDeltaij2 þThetaij
2 þAlphaij2 þBetaij
2 þLowGammaij2 þHighGammaij
2Þ
Assessment of activity differencesIn order to assess possible cohort differences in oscillatory activity, rather than connectivity, we also
calculated a measure of temporal variance at each beamformer-reconstructed voxel in the brain, for
each separate frequency band, via an assessment of the amplitude envelopes. Due to large varia-
tions in signal sensitivity throughout the brain, beamformer reconstructions of virtual-sensors result
in signals in which the mean and temporal standard-deviation of the amplitude envelopes are highly
correlated and show large variations across the source space. For that reason, we choose to use a
normalized measure, the coefficient of variation, which is the simply the standard-deviation of the
amplitude envelope divided by the mean of the amplitude envelope. Using this measure, voxels
which show a high fractional temporal variability, compared to the mean, will have a high value,
whilst those voxels that are of more stable oscillatory power will have a low value. We note that the
measure is similar, by analogy, to common measures employed in BOLD fMRI, such as percentage-
change from baseline. The statistical significance of group-effects was assessed using univariate vox-
elwise unpaired t-tests of this activity measure and then correcting for multiple comparisons using
randomisation testing using FSL randomise (Nichols and Holmes, 2003; Singh et al., 2003;
Winkler et al., 2014). The latter procedure was performed using threshold-free cluster enhancement
(TFCE) and 5000 iterations, without variance smoothing. This procedure tests positive and negative
cohort contrasts separately so a null hypothesis corrected p-value of 0.025 was chosen, so as to
implement a corrected two-tailed test at p<0.05. Separately for each frequency band, thresholded
t-statistics are displayed on a template brain surface mesh, extracted using FreeSurfer.
Statistical analysis of group differences in connectivityFirst, each participant’s connectivity matrix was z-scored to have zero mean and unit variance across
all connections, in order to correct for possible global differences, due to variability in data quality,
either across participants or cohorts (Siems et al., 2016). All subsequent analyses are therefore
assessments, at each connection edge, of the relative strength of connectivity, compared to the
mean, in each participant. This procedure has the advantage of ensuring that any systematic differ-
ences, either at the participant or cohort-level, are controlled for.
To avoid analysing noise, we then independently assessed which functional connections were con-
sistently present across all 159 datasets, for each frequency band and in the Combined maps. This
was done by calculating the rank of every connection in each participant’s connectivity map and
then averaging this map rank across all participants. The resulting average rank-map was thresh-
olded at 80%, such that we only consider as ‘valid’ these connectivity edges that are consistently in
the top 20%. Importantly, to ensure that large cohort differences are not missed, we performed this
assessment of valid connections separately for each cohort, and labelled connections as valid if they
passed our rank-mask threshold in either cohort. The remaining connections were discarded.
Koelewijn et al. eLife 2019;8:e36011. DOI: https://doi.org/10.7554/eLife.36011 17 of 25
Research article Neuroscience

We statistically tested the difference between groups using three different statistical approaches.
In the first, we used unpaired t-tests of the corrected Z-scores, at each of the ‘valid’ connectivity
edges, and looked for significant edges at both p<0.05 (uncorrected) and at p<0.05 (corrected using
a 5000-permutation test with omnibus thresholding).
Secondly, we tested for significant differences in connected network cluster size using methods
similar to those described in the NBS toolbox (Zalesky et al., 2010). Here, connection differences
are first thresholded at p<0.05 (uncorrected) before Matlab’s (RRID:SCR_001622) graph function is
used to convert this difference map to a binarized graph. Matlab’s conncomp function is then used
to find the largest connected cluster within this graph. The corrected significance of this largest clus-
ter is assessed using randomisation testing with 5000 iterations and thresholded at p<0.05 (cor-
rected). This network-based statistic has previously been shown to be more sensitive to cohort
effects than the simple mass-univariate testing we use in our first approach (Zalesky et al., 2010).
As previously described, we test positive and negative cluster sizes separately.
Thirdly, we tested the likely generalisation of our findings by assessing the confidence interval on
cohort-related increases and decreases in connectivity. This was done by randomly sampling half the
APOE-e4 carriers (i.e. N = 26) and half the non- APOE-e4 carriers (i.e. N = 54) and for each of the
valid edges in the map we tabulate whether the mean edge connectivity is increased or decreased
in the APOE-e4 group. This sampling strategy is repeated 5000 times and those edges that do not
have a consistent sign – either increases or decreases – on more than 95% of samples are discarded.
The end result is a set of connections that are robustly increased, or decreased, in the APOE-e4 car-
riers compared to non-carriers, irrespective of the specific individuals entered into the test.
This is an exploratory study that used previously collected data to search for differences related
to APOE-e4 carrier status. To our knowledge there has not been another published MEG study in
young volunteers but we can estimate statistical power based on other studies. Power was estimated
using the pwr function in R (Champely et al., 2018). The area under the curve (AUC) for APOE-e4
status, calculated in a recent Alzheimer’s disease case-control study (Escott-Price et al., 2015) was
transformed to Cohen’s d (Ruscio, 2008), yielding a moderate effect size (d = 0.653). For this effect
size, for our sample of 51 carriers and 108 non-carriers, we have approximately 87% power to detect
an effect of APOE-e4 status on our measures.
All network plots and brain connectivity diagrams were generated using custom in-house scripts
in Matlab (Shaw, 2019).
Supervised Machine-Learning analysisAn alternative way of investigating whether the static oscillatory connectivity matrices contain infor-
mation that distinguishes cases, compared to controls, is to attempt to train a classifier that can dis-
tinguish between the two groups. Here we used a support vector machine (SVM) (Boser et al.,
1992) analysis in which we took all valid edges, pooled across all estimated maps for each person
(Delta, Theta, Alpha, Beta, Low Gamma, High Gamma, Combined) and used these as features for
the SVM. Note that, in order to prevent biased performance, features were selected by taking the
top 20% of edges, estimated over the whole cohort so that features were not selected separately
from each group. In machine-learning it is important to use cross-validation to prevent over-fitting
(as we have more features than participants). Ideally this would be done by training on one dataset
and testing on another, but here we only have one dataset. We therefore used a Leave-One-Out
(LOO) sampling approach in which we randomly select one case (i.e. an APOE-e4 carrier) and one
control (i.e. a non-carrier) as our test sample and hence train the classifier using all other participants.
We then test how well this classifier performs on the two test participants we held back. This proce-
dure is repeated 5000 times to build up an estimate of how well the classifier can successfully cate-
gorise each participant. We then assess the accuracy of the classifier by pooling these out-of-training
estimates to obtain mean measures of Sensitivity (i.e. the true-positive rate), Specificity (true-nega-
tive rate) and the area under the receiver operating characteristic curve (AUC of the ROC). For this
binary classification the chance value for all of three measures is 0.5. One important note is that, for
the APOE-e4 experiment, we have a significantly unbalanced classification problem in that there are
twice as many non-carriers as carriers. This is important because the classifier could achieve a perfor-
mance of 66% by simply labelling all participants as non-carriers. We guard against this by taking a
conservative approach of balancing the classification, at each iteration, by only using a random sam-
ple of 50 non-carriers and 50-carriers to train the classifier and, in addition, reporting the three
Koelewijn et al. eLife 2019;8:e36011. DOI: https://doi.org/10.7554/eLife.36011 18 of 25
Research article Neuroscience
evaluation metrics we describe above. Finally, the performance of all classification analyses is ulti-
mately assessed using the AUC. To assess the statistical significance compared to chance, we use
random permutation (50,000 iterations) of the true labels to build an empirically estimated null distri-
bution of the AUC and then tested the achieved AUC against this.
Cortical volume analysisTo investigate whether brain structure was affected in APOE-e4 carriers, we performed cortical seg-
mentation using FreeSurfer v6.0 (RRID:SCR_001847, surfer.nmr.mgh.harvard.edu). We calculated
hippocampal volumes per hemisphere and total intracranial volume (ICV). Relative hippocampal vol-
umes were calculated by dividing hippocampal volumes by ICV. Following quality control, performed
using a protocol from ENIGMA (http://enigma.ini.usc.edu/) (Stein et al., 2012), volumes were
excluded for 1 e4 carrier and two non-carriers. Using the same data and analysis procedure, cortical
thickness, volume and area were also assessed within each of the subdivisions of the Desikan-Killiany
atlas (Desikan et al., 2006) included within FreeSurfer.
Alzheimer’s disease and elderly control cohort: MEG acquisition andanalysisRecruitment, acquisition and pre-processing of the AD patients (N = 14, 5F/9M, mean age 77.7
years, Mini-Mental State Examination (MMSE) score 19–27, all fulfilled criteria for probable AD
[McKhann et al., 1984]) and age-matched controls (N = 11, 7F/4M, mean age 74.4 years, MMSE
score 28–30) has been described in detail previously (Koelewijn et al., 2017). In summary though,
for inclusion as probable AD, criteria were that dementia had been established by clinical and cogni-
tive assessment (ACE-R), that cognitive impairments were progressive and included episodic mem-
ory deficit and deficit in at least one other area of cognition, and there was no evidence of other
factors that could explain the dementia syndrome such as cerebrovascular disease identified from a
previous CT scan. The study was approved by the South-East Wales Research Ethics Committee (10/
WSE04/35), and all participants provided informed consent. The procedure was identical to the
APOE analysis, except that participants were asked to rest while opening and closing their eyes fol-
lowing an auditory verbal cue (24 � 15 s alternations in total). Each dataset was split into one eyes-
open and one eyes-closed dataset, following which the statistical analysis of AD patients, compared
to the matched elderly control sample, proceeded in exactly the same way as that described above
for the APOE-e4 study in young controls. Here, we report comparison results only for the eyes-open
resting data. This was done in order to compare the pattern of effects revealed by comparing young
APOE-e4 carriers to non-carriers with those obtained by comparing AD participants to an age-
matched sample of elderly controls in the same resting-state paradigm. Note that we have previ-
ously reported results from this AD-control comparison for eyes-open resting state using a different
analysis pipeline (Koelewijn et al., 2017) but, in that dataset, 14/16 AD patients and 11/21 controls
viewed a visual grating instead of a simple blank screen. In this analysis, we decided to only include
those participants who saw a visual grating during the eyes-open period, in order to make sure that
patient-related effects were not due to presence, or not, of the visual grating as this was not
matched across the cohorts. This means we have a reduced subset of those analysed previously
that is N = 14 AD patients and N = 11 elderly controls who all performed an identical version of the
resting-state paradigm.
AcknowledgementsThe authors would like to thank Mark Woolrich and Giles Colclough for providing the ‘ROInets’
package code for orthogonalisation and variance-normalization of the connectivity Z-scores, and
Alexander Shaw for help with atemplate visualisations. We would also like to thank Suresh Muthuku-
maraswamy for initial versions of the AAL template code.
Koelewijn et al. eLife 2019;8:e36011. DOI: https://doi.org/10.7554/eLife.36011 19 of 25
Research article Neuroscience
Additional information
Funding
Funder Grant reference number Author
BRACE Loes KoelewijnAline BompasAndrea TalesAntony BayerKrish Singh
Medical Research Council MR/K004360/1 Thomas M LancasterDavid LindenKrish Singh
Medical Research Council MR/K501086/1 Bethany C Routley
Medical Research Council MR/K005464/1 Bethany C RoutleyLorenzo MagazziniKrish Singh
Wellcome WT105613/Z/14/Z Katherine E Tansey
The funders had no role in study design, data collection and interpretation, or the
decision to submit the work for publication.
Author contributions
Loes Koelewijn, Formal analysis, Validation, Visualization, Methodology, Writing—original draft, Writ-
ing—review and editing; Thomas M Lancaster, Data curation, Formal analysis, Validation, Investiga-
tion, Writing—review and editing; David Linden, Conceptualization, Resources, Data curation,
Supervision, Funding acquisition, Project administration, Writing—review and editing; Diana C Dima,
Methodology; Bethany C Routley, Lorenzo Magazzini, Kali Barawi, Lisa Brindley, Aline Bompas, Data
curation, Investigation, Project administration; Rachael Adams, Investigation, Project administration;
Katherine E Tansey, Resources, Methodology; Andrea Tales, Antony Bayer, Resources; Krish Singh,
Conceptualization, Resources, Software, Supervision, Funding acquisition, Validation, Visualization,
Methodology, Project administration, Writing—review and editing
Author ORCIDs
Loes Koelewijn http://orcid.org/0000-0002-7890-171X
Diana C Dima http://orcid.org/0000-0002-9612-5574
Lorenzo Magazzini https://orcid.org/0000-0002-8934-8374
Katherine E Tansey http://orcid.org/0000-0002-9663-3376
Krish Singh https://orcid.org/0000-0002-3094-2475
Ethics
Human subjects: All participants gave informed consent according to the Declaration of Helsinki and
all procedures were approved by the Ethics Committee of the School of Psychology, Cardiff Univer-
sity (EC.12.01.10.3071) and the South Wales NHS Research Ethics Committee (10/WSE04/35).
Decision letter and Author response
Decision letter https://doi.org/10.7554/eLife.36011.015
Author response https://doi.org/10.7554/eLife.36011.016
Additional files
Supplementary files. Transparent reporting form
DOI: https://doi.org/10.7554/eLife.36011.011
Koelewijn et al. eLife 2019;8:e36011. DOI: https://doi.org/10.7554/eLife.36011 20 of 25
Research article Neuroscience
Data availability
Both the necessary derived data and custom scripts used to create Figures 1, 2, 3 and 4 are freely
available as an Open-Science Framework project (http://dx.doi.org/10.17605/OSF.IO/E4CJX). Due
to the sensitive data of the genetic risk factors investigated here, and the need to prevent both self-
identification and third-party identification of people in this project, both the raw data and pseudo-
anonymised intermediate analysis results cannot be provided. Controlled access to the pseudo-ano-
nymised intermediate analysis results might be possible via a research collaboration after signing of
suitable data-transfer agreements and approval by both Cardiff University School of Psychology’s
Ethics Committee and the governing body for the cohort, i.e. the National Centre for Mental Health
(NCMH). Further enquiries should be directed to Professor Krish D Singh at CUBRIC, School of Psy-
chology, Maindy Road, Cardiff University, Cardiff CF24 4HQ or email: [email protected].
The following dataset was generated:
Author(s) Year Dataset title Dataset URLDatabase andIdentifier
Singh KD 2019 Derived data/measures and Matlabcode used to create the figures
http://dx.doi.org/10.17605/OSF.IO/E4CJX
Open ScienceFramework, 10.17605/OSF.IO/E4CJX
ReferencesBabiloni C, Benussi L, Binetti G, Cassetta E, Dal Forno G, Del Percio C, Ferreri F, Ferri R, Frisoni G, Ghidoni R,Miniussi C, Rodriguez G, Romani GL, Squitti R, Ventriglia MC, Rossini PM. 2006. Apolipoprotein E and alphabrain rhythms in mild cognitive impairment: a multicentric electroencephalogram study. Annals of Neurology59:323–334. DOI: https://doi.org/10.1002/ana.20724, PMID: 16358334
Baillet S. 2017. Magnetoencephalography for brain electrophysiology and imaging. Nature Neuroscience 20:327–339. DOI: https://doi.org/10.1038/nn.4504, PMID: 28230841
Benjamini Y, Yekutieli D. 2001. The control of the false discovery rate in multiple testing under dependency. TheAnnals of Statistics 29:1165–1188. DOI: https://doi.org/10.1214/aos/1013699998
Boser BE, Guyon IM, Vapnik VN. 1992. A training algorithm for optimal margin classifiers. In Proceedings of theFifth Annual Workshop on Computational Learning Theory. DOI: https://doi.org/10.1145/130385.130401
Buckner RL, Andrews-Hanna JR, Schacter DL. 2008. The brain’s default network: anatomy, function, andrelevance to disease. Annals of the New York Academy of Sciences 1124:1–38. DOI: https://doi.org/10.1196/annals.1440.011, PMID: 18400922
Busche MA, Eichhoff G, Adelsberger H, Abramowski D, Wiederhold KH, Haass C, Staufenbiel M, Konnerth A,Garaschuk O. 2008. Clusters of hyperactive neurons near amyloid plaques in a mouse model of alzheimer’sdisease. Science 321:1686–1689. DOI: https://doi.org/10.1126/science.1162844, PMID: 18802001
Cabral J, Luckhoo H, Woolrich M, Joensson M, Mohseni H, Baker A, Kringelbach ML, Deco G. 2014. Exploringmechanisms of spontaneous functional connectivity in MEG: how delayed network interactions lead tostructured amplitude envelopes of band-pass filtered oscillations. NeuroImage 90:423–435. DOI: https://doi.org/10.1016/j.neuroimage.2013.11.047, PMID: 24321555
Canuet L, Tellado I, Couceiro V, Fraile C, Fernandez-Novoa L, Ishii R, Takeda M, Cacabelos R. 2012. Resting-state network disruption and APOE genotype in Alzheimer’s disease: a lagged functional connectivity study.PLoS ONE 7:e46289. DOI: https://doi.org/10.1371/journal.pone.0046289, PMID: 23050006
Champely S, Ekstrom C, Dalgaard P, Gill J, Wunder J, De Rosario H. 2018. Basic functions for power analysis. RPackage Version https://cran.r-project.org/web/packages/pwr/pwr.pdf.
Chang CC, Chow CC, Tellier LC, Vattikuti S, Purcell SM, Lee JJ. 2015. Second-generation PLINK: rising to thechallenge of larger and richer datasets. GigaScience 4:7. DOI: https://doi.org/10.1186/s13742-015-0047-8,PMID: 25722852
Colclough GL, Brookes MJ, Smith SM, Woolrich MW. 2015. A symmetric multivariate leakage correction for MEGconnectomes. NeuroImage 117:439–448. DOI: https://doi.org/10.1016/j.neuroimage.2015.03.071, PMID: 25862259
Colclough GL, Woolrich MW, Tewarie PK, Brookes MJ, Quinn AJ, Smith SM. 2016. How reliable are MEGresting-state connectivity metrics? NeuroImage 138:284–293. DOI: https://doi.org/10.1016/j.neuroimage.2016.05.070, PMID: 27262239
Corder EH, Saunders AM, Strittmatter WJ, Schmechel DE, Gaskell PC, Small GW, Roses AD, Haines JL, Pericak-Vance MA. 1993. Gene dose of apolipoprotein E type 4 allele and the risk of alzheimer’s disease in late onsetfamilies. Science 261:921–923. DOI: https://doi.org/10.1126/science.8346443, PMID: 8346443
Corneveaux JJ, Myers AJ, Allen AN, Pruzin JJ, Ramirez M, Engel A, Nalls MA, Chen K, Lee W, Chewning K, VillaSE, Meechoovet HB, Gerber JD, Frost D, Benson HL, O’Reilly S, Chibnik LB, Shulman JM, Singleton AB, CraigDW, et al. 2010. Association of CR1, CLU and PICALM with Alzheimer’s disease in a cohort of clinicallycharacterized and neuropathologically verified individuals. Human Molecular Genetics 19:3295–3301.DOI: https://doi.org/10.1093/hmg/ddq221, PMID: 20534741
Koelewijn et al. eLife 2019;8:e36011. DOI: https://doi.org/10.7554/eLife.36011 21 of 25
Research article Neuroscience
Cuesta P, Garces P, Castellanos NP, Lopez ME, Aurtenetxe S, Bajo R, Pineda-Pardo JA, Bruna R, Marın AG,Delgado M, Barabash A, Ancın I, Cabranes JA, Fernandez A, Del Pozo F, Sancho M, Marcos A, Nakamura A,Maestu F. 2015. Influence of the APOE e4 allele and mild cognitive impairment diagnosis in the disruption ofthe MEG resting state functional connectivity in sources space. Journal of Alzheimer’s Disease 44:493–505.DOI: https://doi.org/10.3233/JAD-141872, PMID: 25281603
Damoiseaux JS, Beckmann CF, Arigita EJ, Barkhof F, Scheltens P, Stam CJ, Smith SM, Rombouts SA. 2008.Reduced resting-state brain activity in the "default network" in normal aging. Cerebral Cortex 18:1856–1864.DOI: https://doi.org/10.1093/cercor/bhm207, PMID: 18063564
Das S, Forer L, Schonherr S, Sidore C, Locke AE, Kwong A, Vrieze SI, Chew EY, Levy S, McGue M, SchlessingerD, Stambolian D, Loh PR, Iacono WG, Swaroop A, Scott LJ, Cucca F, Kronenberg F, Boehnke M, Abecasis GR,et al. 2016. Next-generation genotype imputation service and methods. Nature Genetics 48:1284–1287.DOI: https://doi.org/10.1038/ng.3656, PMID: 27571263
de Haan W, Mott K, van Straaten EC, Scheltens P, Stam CJ. 2012a. Activity dependent degeneration explainshub vulnerability in Alzheimer’s disease. PLoS Computational Biology 8:e1002582. DOI: https://doi.org/10.1371/journal.pcbi.1002582, PMID: 22915996
de Haan W, van der Flier WM, Koene T, Smits LL, Scheltens P, Stam CJ. 2012b. Disrupted modular braindynamics reflect cognitive dysfunction in Alzheimer’s disease. NeuroImage 59:3085–3093. DOI: https://doi.org/10.1016/j.neuroimage.2011.11.055, PMID: 22154957
de Waal H, Stam CJ, de Haan W, van Straaten EC, Blankenstein MA, Scheltens P, van der Flier WM. 2013.Alzheimer’s disease patients not carrying the apolipoprotein E e4 allele show more severe slowing of oscillatorybrain activity. Neurobiology of Aging 34:2158–2163. DOI: https://doi.org/10.1016/j.neurobiolaging.2013.03.007, PMID: 23587637
Desikan RS, Segonne F, Fischl B, Quinn BT, Dickerson BC, Blacker D, Buckner RL, Dale AM, Maguire RP, HymanBT, Albert MS, Killiany RJ. 2006. An automated labeling system for subdividing the human cerebral cortex onMRI scans into gyral based regions of interest. NeuroImage 31:968–980. DOI: https://doi.org/10.1016/j.neuroimage.2006.01.021, PMID: 16530430
Donner TH, Siegel M. 2011. A framework for local cortical oscillation patterns. Trends in Cognitive Sciences 15:191–199 . DOI: https://doi.org/10.1016/j.tics.2011.03.007, PMID: 21481630
Drzezga A, Grimmer T, Henriksen G, Muhlau M, Perneczky R, Miederer I, Praus C, Sorg C, Wohlschlager A,Riemenschneider M, Wester HJ, Foerstl H, Schwaiger M, Kurz A. 2009. Effect of APOE genotype on amyloidplaque load and gray matter volume in alzheimer disease. Neurology 72:1487–1494. DOI: https://doi.org/10.1212/WNL.0b013e3181a2e8d0, PMID: 19339712
Du J, Chang J, Guo S, Zhang Q, Wang Z. 2009. ApoE 4 reduces the expression of abeta degrading enzyme IDEby activating the NMDA receptor in hippocampal neurons. Neuroscience Letters 464:140–145. DOI: https://doi.org/10.1016/j.neulet.2009.07.032, PMID: 19616072
Escott-Price V, Sims R, Bannister C, Harold D, Vronskaya M, Majounie E, Badarinarayan N, Morgan K, PassmoreP, Holmes C, Powell J, Brayne C, Gill M, Mead S, Goate A, Cruchaga C, Lambert JC, van Duijn C, Maier W,Ramirez A, et al. 2015. Common polygenic variation enhances risk prediction for alzheimer’s disease. Brain138:3673–3684. DOI: https://doi.org/10.1093/brain/awv268, PMID: 26490334
Farahibozorg SR, Henson RN, Hauk O. 2018. Adaptive cortical parcellations for source reconstructed EEG/MEGconnectomes. NeuroImage 169:23–45. DOI: https://doi.org/10.1016/j.neuroimage.2017.09.009, PMID: 28893608
Filbey FM, Slack KJ, Sunderland TP, Cohen RM. 2006. Functional magnetic resonance imaging andmagnetoencephalography differences associated with APOEepsilon4 in young healthy adults. NeuroReport 17:1585–1590. DOI: https://doi.org/10.1097/01.wnr.0000234745.27571.d1, PMID: 17001273
Filippini N, MacIntosh BJ, Hough MG, Goodwin GM, Frisoni GB, Smith SM, Matthews PM, Beckmann CF,Mackay CE. 2009a. Distinct patterns of brain activity in young carriers of the APOE-epsilon4 allele. PNAS 106:7209–7214 . DOI: https://doi.org/10.1073/pnas.0811879106, PMID: 19357304
Filippini N, Rao A, Wetten S, Gibson RA, Borrie M, Guzman D, Kertesz A, Loy-English I, Williams J, Nichols T,Whitcher B, Matthews PM. 2009b. Anatomically-distinct genetic associations of APOE epsilon4 allele load withregional cortical atrophy in Alzheimer’s disease. NeuroImage 44:724–728. DOI: https://doi.org/10.1016/j.neuroimage.2008.10.003, PMID: 19013250
Hampel H, Wilcock G, Andrieu S, Aisen P, Blennow K, Broich K, Carrillo M, Fox NC, Frisoni GB, Isaac M,Lovestone S, Nordberg A, Prvulovic D, Sampaio C, Scheltens P, Weiner M, Winblad B, Coley N, Vellas B,Oxford Task Force Group. 2011. Biomarkers for alzheimer’s disease therapeutic trials. Progress inNeurobiology 95:579–593. DOI: https://doi.org/10.1016/j.pneurobio.2010.11.005, PMID: 21130138
Heise V, Filippini N, Ebmeier KP, Mackay CE. 2011. The APOE e4 allele modulates brain white matter integrity inhealthy adults. Molecular Psychiatry 16:908–916. DOI: https://doi.org/10.1038/mp.2010.90, PMID: 20820167
Herrup K. 2015. The case for rejecting the amyloid cascade hypothesis. Nature Neuroscience 18:794–799.DOI: https://doi.org/10.1038/nn.4017, PMID: 26007212
Hillebrand A, Barnes GR, Bosboom JL, Berendse HW, Stam CJ. 2012. Frequency-dependent functionalconnectivity within resting-state networks: an atlas-based MEG beamformer solution. NeuroImage 59:3909–3921. DOI: https://doi.org/10.1016/j.neuroimage.2011.11.005, PMID: 22122866
Hillebrand A, Tewarie P, van Dellen E, Yu M, Carbo EW, Douw L, Gouw AA, van Straaten EC, Stam CJ. 2016.Direction of information flow in large-scale resting-state networks is frequency-dependent. PNAS 113:3867–3872. DOI: https://doi.org/10.1073/pnas.1515657113, PMID: 27001844
Koelewijn et al. eLife 2019;8:e36011. DOI: https://doi.org/10.7554/eLife.36011 22 of 25
Research article Neuroscience
Hodgetts CJ, Shine JP, Williams H, Postans M, Sims R, Williams J, Lawrence AD, Graham KS. 2019. Increasedposterior default mode network activity and structural connectivity in young adult APOE-e4 carriers: amultimodal imaging investigation. Neurobiology of Aging 73:82–91. DOI: https://doi.org/10.1016/j.neurobiolaging.2018.08.026, PMID: 30339963
Hunt BA, Tewarie PK, Mougin OE, Geades N, Jones DK, Singh KD, Morris PG, Gowland PA, Brookes MJ. 2016.Relationships between cortical myeloarchitecture and electrophysiological networks. PNAS 113:13510–13515.DOI: https://doi.org/10.1073/pnas.1608587113, PMID: 27830650
Jelic V, Julin P, Shigeta M, Nordberg A, Lannfelt L, Winblad B, Wahlund LO. 1997. Apolipoprotein E epsilon4allele decreases functional connectivity in Alzheimer’s disease as measured by EEG coherence. Journal ofNeurology, Neurosurgery & Psychiatry 63:59–65. DOI: https://doi.org/10.1136/jnnp.63.1.59, PMID: 9221969
Juottonen K, Lehtovirta M, Helisalmi S, Sr PJR, Soininen H. 1998. Major decrease in the volume of the entorhinalcortex in patients with Alzheimer’s disease carrying the apolipoprotein E epsilon 4 allele. Journal of Neurology,Neurosurgery & Psychiatry 65:322–327. DOI: https://doi.org/10.1136/jnnp.65.3.322
Kanekiyo T, Xu H, Bu G. 2014. ApoE and ab in Alzheimer’s disease: accidental encounters or partners? Neuron81:740–754. DOI: https://doi.org/10.1016/j.neuron.2014.01.045, PMID: 24559670
Kato T, Inui Y, Nakamura A, Ito K. 2016. Brain fluorodeoxyglucose (FDG) PET in dementia. Ageing ResearchReviews 30:73–84. DOI: https://doi.org/10.1016/j.arr.2016.02.003, PMID: 26876244
Kern RS, Nuechterlein KH, Green MF, Baade LE, Fenton WS, Gold JM, Keefe RS, Mesholam-Gately R, Mintz J,Seidman LJ, Stover E, Marder SR. 2008. The MATRICS consensus cognitive battery, part 2: co-norming andstandardization. American Journal of Psychiatry 165:214–220. DOI: https://doi.org/10.1176/appi.ajp.2007.07010043, PMID: 18172018
Koelewijn L, Bompas A, Tales A, Brookes MJ, Muthukumaraswamy SD, Bayer A, Singh KD. 2017. Alzheimer’sdisease disrupts alpha and beta-band resting-state oscillatory network connectivity. Clinical Neurophysiology128:2347–2357. DOI: https://doi.org/10.1016/j.clinph.2017.04.018, PMID: 28571910
Kok E, Haikonen S, Luoto T, Huhtala H, Goebeler S, Haapasalo H, Karhunen PJ. 2009. ApolipoproteinE-dependent accumulation of alzheimer disease-related lesions begins in middle age. Annals of Neurology 65:650–657. DOI: https://doi.org/10.1002/ana.21696, PMID: 19557866
Kramer G, van der Flier WM, de Langen C, Blankenstein MA, Scheltens P, Stam CJ. 2008. EEG functionalconnectivity and ApoE genotype in Alzheimer’s disease and controls. Clinical Neurophysiology 119:2727–2732.DOI: https://doi.org/10.1016/j.clinph.2008.08.019, PMID: 18848805
Leal SL, Landau SM, Bell RK, Jagust WJ. 2017. Hippocampal activation is associated with longitudinal amyloidaccumulation and cognitive decline. eLife 6:e22978. DOI: https://doi.org/10.7554/eLife.22978, PMID: 28177283
Loh PR, Danecek P, Palamara PF, Fuchsberger C, A Reshef Y, K Finucane H, Schoenherr S, Forer L, McCarthy S,Abecasis GR, Durbin R, L Price A. 2016. Reference-based phasing using the haplotype reference consortiumpanel. Nature Genetics 48:1443–1448. DOI: https://doi.org/10.1038/ng.3679, PMID: 27694958
Maestu F, Pena JM, Garces P, Gonzalez S, Bajo R, Bagic A, Cuesta P, Funke M, Makela JP, Menasalvas E,Nakamura A, Parkkonen L, Lopez ME, Del Pozo F, Sudre G, Zamrini E, Pekkonen E, Henson RN, Becker JT,Magnetoencephalography International Consortium of Alzheimer’s Disease. 2015. A multicenter study of theearly detection of synaptic dysfunction in mild cognitive impairment using Magnetoencephalography-derivedfunctional connectivity. NeuroImage: Clinical 9:103–109. DOI: https://doi.org/10.1016/j.nicl.2015.07.011,PMID: 26448910
McCarthy S, Das S, Kretzschmar W, Delaneau O, Wood AR, Teumer A, Kang HM, Fuchsberger C, Danecek P,Sharp K, Luo Y, Sidore C, Kwong A, Timpson N, Koskinen S, Vrieze S, Scott LJ, Zhang H, Mahajan A, Veldink J,et al. 2016. A reference panel of 64,976 haplotypes for genotype imputation. Nature Genetics 48:1279–1283.DOI: https://doi.org/10.1038/ng.3643, PMID: 27548312
McKhann G, Drachman D, Folstein M, Katzman R, Price D, Stadlan EM. 1984. Clinical diagnosis of Alzheimer’sdisease: report of the NINCDS-ADRDA Work Group under the auspices of Department of Health and HumanServices Task Force on Alzheimer’s Disease. Neurology 34:939–944. DOI: https://doi.org/10.1212/WNL.34.7.939, PMID: 6610841
Morris JC, Roe CM, Xiong C, Fagan AM, Goate AM, Holtzman DM, Mintun MA. 2010. APOE predicts amyloid-beta but not tau alzheimer pathology in cognitively normal aging. Annals of Neurology 67:122–131.DOI: https://doi.org/10.1002/ana.21843, PMID: 20186853
Myers N, Pasquini L, Gottler J, Grimmer T, Koch K, Ortner M, Neitzel J, Muhlau M, Forster S, Kurz A, Forstl H,Zimmer C, Wohlschlager AM, Riedl V, Drzezga A, Sorg C. 2014. Within-patient correspondence of amyloid-band intrinsic network connectivity in Alzheimer’s disease. Brain 137:2052–2064. DOI: https://doi.org/10.1093/brain/awu103, PMID: 24771519
Nichols T, Holmes A. 2003. Nonparametric permutation tests for functional neuroimaging. Human Brain Function15:1–25.
Nolte G. 2003. The magnetic lead field theorem in the quasi-static approximation and its use formagnetoencephalography forward calculation in realistic volume conductors. Physics in Medicine and Biology48:3637–3652. DOI: https://doi.org/10.1088/0031-9155/48/22/002, PMID: 14680264
Nuechterlein KH, Green MF, Kern RS, Baade LE, Barch DM, Cohen JD, Essock S, Fenton WS, Frese FJ, Gold JM,Goldberg T, Heaton RK, Keefe RS, Kraemer H, Mesholam-Gately R, Seidman LJ, Stover E, Weinberger DR,Young AS, Zalcman S, et al. 2008. The MATRICS consensus cognitive battery, part 1: test selection, reliability,and validity. American Journal of Psychiatry 165:203–213. DOI: https://doi.org/10.1176/appi.ajp.2007.07010042, PMID: 18172019
Koelewijn et al. eLife 2019;8:e36011. DOI: https://doi.org/10.7554/eLife.36011 23 of 25
Research article Neuroscience
Nuriel T, Angulo SL, Khan U, Ashok A, Chen Q, Figueroa HY, Emrani S, Liu L, Herman M, Barrett G, Savage V,Buitrago L, Cepeda-Prado E, Fung C, Goldberg E, Gross SS, Hussaini SA, Moreno H, Small SA, Duff KE. 2017.Neuronal hyperactivity due to loss of inhibitory tone in APOE4 mice lacking alzheimer’s disease-like pathology.Nature Communications 8:1464. DOI: https://doi.org/10.1038/s41467-017-01444-0, PMID: 29133888
O’Brien JL, O’Keefe KM, LaViolette PS, DeLuca AN, Blacker D, Dickerson BC, Sperling RA. 2010. LongitudinalfMRI in elderly reveals loss of hippocampal activation with clinical decline. Neurology 74:1969–1976.DOI: https://doi.org/10.1212/WNL.0b013e3181e3966e, PMID: 20463288
O’Dwyer L, Lamberton F, Matura S, Tanner C, Scheibe M, Miller J, Rujescu D, Prvulovic D, Hampel H. 2012.Reduced hippocampal volume in healthy young ApoE4 carriers: an MRI study. PLoS ONE 7:e48895.DOI: https://doi.org/10.1371/journal.pone.0048895, PMID: 23152815
Oostenveld R, Fries P, Maris E, Schoffelen JM. 2011. FieldTrip: Open source software for advanced analysis ofMEG, EEG, and invasive electrophysiological data. Computational Intelligence and Neuroscience 2011:1–9 .DOI: https://doi.org/10.1155/2011/156869, PMID: 21253357
Ossenkoppele R, Schonhaut DR, Scholl M, Lockhart SN, Ayakta N, Baker SL, O’Neil JP, Janabi M, Lazaris A,Cantwell A, Vogel J, Santos M, Miller ZA, Bettcher BM, Vossel KA, Kramer JH, Gorno-Tempini ML, Miller BL,Jagust WJ, Rabinovici GD. 2016. Tau PET patterns mirror clinical and neuroanatomical variability in Alzheimer’sdisease. Brain 139:1551–1567. DOI: https://doi.org/10.1093/brain/aww027, PMID: 26962052
Pang EW, Dunkley BT, Doesburg SM, da Costa L, Taylor MJ. 2016. Reduced brain connectivity and mentalflexibility in mild traumatic brain injury. Annals of Clinical and Translational Neurology 3:124–131. DOI: https://doi.org/10.1002/acn3.280, PMID: 26900581
Petersen RC. 1995. Apolipoprotein E status as a predictor of the development of Alzheimer’s Disease inMemory-Impaired Individuals. JAMA: The Journal of the American Medical Association 273:1274–1278.DOI: https://doi.org/10.1001/jama.1995.03520400044042
Ponomareva NV, Korovaitseva GI, Rogaev EI. 2008. EEG alterations in non-demented individuals related toapolipoprotein E genotype and to risk of alzheimer disease. Neurobiology of Aging 29:819–827. DOI: https://doi.org/10.1016/j.neurobiolaging.2006.12.019, PMID: 17293007
Ray S, Maunsell JH. 2011. Different origins of gamma rhythm and high-gamma activity in macaque visual cortex.PLoS Biology 9:e1000610. DOI: https://doi.org/10.1371/journal.pbio.1000610, PMID: 21532743
Reiman EM, Chen K, Liu X, Bandy D, Yu M, Lee W, Ayutyanont N, Keppler J, Reeder SA, Langbaum JB,Alexander GE, Klunk WE, Mathis CA, Price JC, Aizenstein HJ, DeKosky ST, Caselli RJ. 2009. Fibrillar amyloid-beta burden in cognitively normal people at 3 levels of genetic risk for alzheimer’s disease. PNAS 106:6820–6825. DOI: https://doi.org/10.1073/pnas.0900345106, PMID: 19346482
Reinvang I, Espeseth T, Westlye LT. 2013. APOE-related biomarker profiles in non-pathological aging and earlyphases of alzheimer’s disease. Neuroscience & Biobehavioral Reviews 37:1322–1335. DOI: https://doi.org/10.1016/j.neubiorev.2013.05.006, PMID: 23701948
Routley BC, Singh KD, Hamandi K, Muthukumaraswamy SD. 2017. The effects of AMPA receptor blockade onresting magnetoencephalography recordings. Journal of Psychopharmacology 31:1527–1536. DOI: https://doi.org/10.1177/0269881117736915, PMID: 29084475
Ruscio J. 2008. A probability-based measure of effect size: robustness to base rates and other factors.Psychological Methods 13:19–30. DOI: https://doi.org/10.1037/1082-989X.13.1.19, PMID: 18331151
Schnitzler A, Gross J. 2005. Normal and pathological oscillatory communication in the brain. Nature ReviewsNeuroscience 6:285–296. DOI: https://doi.org/10.1038/nrn1650, PMID: 15803160
Shaw A. 2019. SourceMesh Features. Github. 08aa50a. https://github.com/alexandershaw4/SourceMeshSheline YI, Morris JC, Snyder AZ, Price JL, Yan Z, D’Angelo G, Liu C, Dixit S, Benzinger T, Fagan A, Goate A,Mintun MA. 2010. APOE4 allele disrupts resting state fMRI connectivity in the absence of amyloid plaques ordecreased CSF ab42. Journal of Neuroscience 30:17035–17040. DOI: https://doi.org/10.1523/JNEUROSCI.3987-10.2010, PMID: 21159973
Shine JP, Hodgetts CJ, Postans M, Lawrence AD, Graham KS. 2015. APOE-e4 selectively modulatesposteromedial cortex activity during scene perception and short-term memory in young healthy adults.Scientific Reports 5:16322. DOI: https://doi.org/10.1038/srep16322, PMID: 26552581
Siems M, Pape AA, Hipp JF, Siegel M. 2016. Measuring the cortical correlation structure of spontaneousoscillatory activity with EEG and MEG. NeuroImage 129:345–355. DOI: https://doi.org/10.1016/j.neuroimage.2016.01.055, PMID: 26827813
Singh KD, Barnes GR, Hillebrand A. 2003. Group imaging of task-related changes in cortical synchronisationusing nonparametric permutation testing. NeuroImage 19:1589–1601. DOI: https://doi.org/10.1016/S1053-8119(03)00249-0, PMID: 12948714
Stargardt A, Swaab DF, Bossers K. 2015. Storm before the quiet: neuronal hyperactivity and ab in thepresymptomatic stages of Alzheimer’s disease. Neurobiology of Aging 36:1–11. DOI: https://doi.org/10.1016/j.neurobiolaging.2014.08.014, PMID: 25444609
Stein JL, Medland SE, Vasquez AA, Hibar DP, Senstad RE, Winkler AM, Toro R, Appel K, Bartecek R, BergmannØ, Bernard M, Brown AA, Cannon DM, Chakravarty MM, Christoforou A, Domin M, Grimm O, Hollinshead M,Holmes AJ, Homuth G, et al. 2012. Identification of common variants associated with human hippocampal andintracranial volumes. Nature Genetics 44:552–561. DOI: https://doi.org/10.1038/ng.2250, PMID: 22504417
Teipel SJ, Pogarell O, Meindl T, Dietrich O, Sydykova D, Hunklinger U, Georgii B, Mulert C, Reiser MF, MollerHJ, Hampel H. 2009. Regional networks underlying interhemispheric connectivity: an EEG and DTI study inhealthy ageing and amnestic mild cognitive impairment. Human Brain Mapping 30:2098–2119. DOI: https://doi.org/10.1002/hbm.20652, PMID: 18781594
Koelewijn et al. eLife 2019;8:e36011. DOI: https://doi.org/10.7554/eLife.36011 24 of 25
Research article Neuroscience

Tijms BM, Wink AM, de Haan W, van der Flier WM, Stam CJ, Scheltens P, Barkhof F. 2013. Alzheimer’s disease:connecting findings from graph theoretical studies of brain networks. Neurobiology of Aging 34:2023–2036.DOI: https://doi.org/10.1016/j.neurobiolaging.2013.02.020, PMID: 23541878
Tzourio-Mazoyer N, Landeau B, Papathanassiou D, Crivello F, Etard O, Delcroix N, Mazoyer B, Joliot M. 2002.Automated anatomical labeling of activations in SPM using a macroscopic anatomical parcellation of the MNIMRI single-subject brain.NeuroImage 15:273–289. DOI: https://doi.org/10.1006/nimg.2001.0978, PMID: 11771995
van der Flier WM, Pijnenburg YA, Fox NC, Scheltens P. 2011. Early-onset versus late-onset Alzheimer’s disease:the case of the missing APOE e4 allele. The Lancet Neurology 10:280–288. DOI: https://doi.org/10.1016/S1474-4422(10)70306-9, PMID: 21185234
Vidaurre D, Quinn AJ, Baker AP, Dupret D, Tejero-Cantero A, Woolrich MW. 2016. Spectrally resolved fasttransient brain states in electrophysiological data. NeuroImage 126:81–95. DOI: https://doi.org/10.1016/j.neuroimage.2015.11.047, PMID: 26631815
Vrba J, Robinson SE. 2001. Signal processing in magnetoencephalography. Methods 25:249–271 . DOI: https://doi.org/10.1006/meth.2001.1238, PMID: 11812209
Westlye ET, Lundervold A, Rootwelt H, Lundervold AJ, Westlye LT. 2011. Increased hippocampal default modesynchronization during rest in middle-aged and elderly APOE e4 carriers: relationships with memoryperformance. Journal of Neuroscience 31:7775–7783. DOI: https://doi.org/10.1523/JNEUROSCI.1230-11.2011,PMID: 21613490
Winkler AM, Ridgway GR, Webster MA, Smith SM, Nichols TE. 2014. Permutation inference for the generallinear model. NeuroImage 92:381–397. DOI: https://doi.org/10.1016/j.neuroimage.2014.01.060, PMID: 24530839
Wishart HA, Saykin AJ, McAllister TW, Rabin LA, McDonald BC, Flashman LA, Roth RM, Mamourian AC,Tsongalis GJ, Rhodes CH. 2006. Regional brain atrophy in cognitively intact adults with a single APOE epsilon4allele. Neurology 67:1221–1224. DOI: https://doi.org/10.1212/01.wnl.0000238079.00472.3a, PMID: 17030756
Ye S, Huang Y, Mullendorff K, Dong L, Giedt G, Meng EC, Cohen FE, Kuntz ID, Weisgraber KH, Mahley RW.2005. Apolipoprotein (apo) E4 enhances amyloid beta peptide production in cultured neuronal cells: apoestructure as a potential therapeutic target. PNAS 102:18700–18705. DOI: https://doi.org/10.1073/pnas.0508693102, PMID: 16344478
Zalesky A, Fornito A, Bullmore ET. 2010. Network-based statistic: identifying differences in brain networks.NeuroImage 53:1197–1207. DOI: https://doi.org/10.1016/j.neuroimage.2010.06.041, PMID: 20600983
Zhao N, Liu CC, Qiao W, Bu G. 2018. Apolipoprotein E, receptors, and modulation of alzheimer’s Disease.Biological Psychiatry 83:347–357. DOI: https://doi.org/10.1016/j.biopsych.2017.03.003, PMID: 28434655
Koelewijn et al. eLife 2019;8:e36011. DOI: https://doi.org/10.7554/eLife.36011 25 of 25
Research article Neuroscience