optimization of energy production system in the dodecanese islands
TRANSCRIPT
� Corresponding author. T
E-mail address: koroneo
0960-1481/$ - see front mat
doi:10.1016/j.renene.2004.0
el.: +30-231-0995968; fax: +30-231-0996012.
[email protected] (C. Koroneos).
ter # 2004 Elsevier Ltd. All rights reserved.
5.003
Renewable Energy 30 (2005) 195–210
www.elsevier.com/locate/renene
Optimization of energy production systemin the Dodecanese Islands
C. Koroneos �, N. Zairis, P. Charaklias, N. MoussiopoulosDepartment of Mechanical Engineering, Laboratory of Heat Transfer and Environmental Engineering,
Aristotle University of Thessaloniki, P.O. Box 483, 54124 Thessaloniki, Greece
Received 30 May 2003; accepted 2 May 2004
Abstract
The ongoing depletion of the fossil fuels and the dependency of the economies on themhave made the need for new sources of energy more obvious. Renewable energy sources(RES) can ensure the sustainable development of the communities, and especially of those inwhich RES are in abundance. This study deals with the exploitation of RES in the DodecaneseIslands. Specifically, it is examined the optimum percentage by which the renewable sourcescan participate in the energy production system. Three different scenarios are examined. Thefirst scenario considers that the existent system should be used less than 75% for environ-mental reasons, in the second scenario, a minimization of the electricity production cost issought without any environmental constraints, while in the third scenario, it is consideredthat the RES’ participation in the electricity production would be 30% at most accordingto the current legislation. The environmental impacts from the energy production arequantified and a comparison is made between the impacts resulting from the existingsystem and the system found from the first scenario, because this is the scenario with thehighest penetration of the RES to the energy production system.# 2004 Elsevier Ltd. All rights reserved.
Keywords: Electricity; Energy sources; Renewable energy sources; Optimization; Dodecanese
1. Introduction
The oil crisis that took place in the last years made more obvious the depen-
dency of the world economy on the ‘‘black gold’’. As a consequence, many
countries are making an effort to move towards new energy sources which exist in
C. Koroneos et al. / Renewable Energy 30 (2005) 195–210196
abundance. The aspect of using renewable energy sources (RES) seems to be themost reliable solution, since they are inexhaustible.
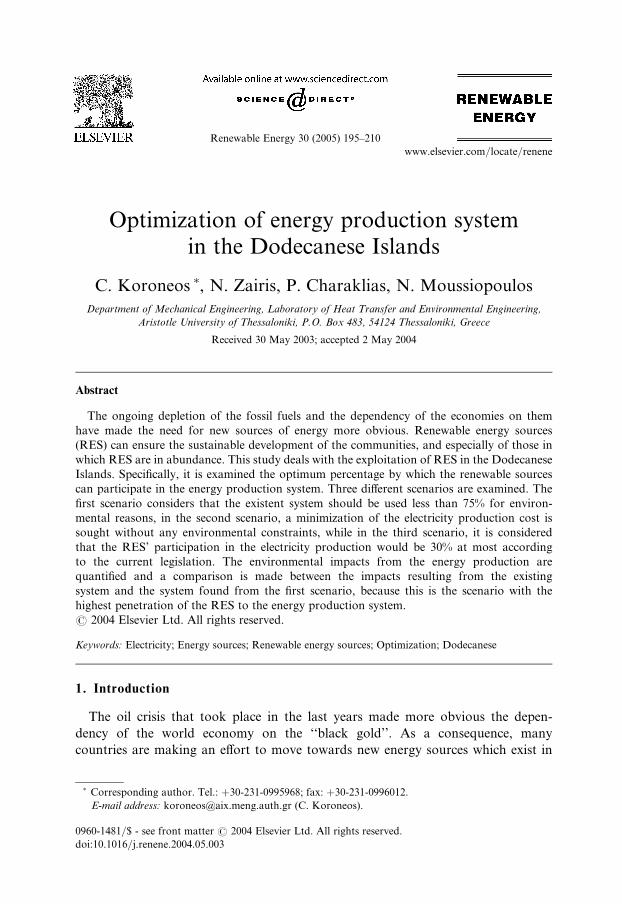
Dodecanese Islands, located in the South-East of Greece, could very well use theRES in order to meet their energy needs. The weather of these islands is sunny forthe most part of the year and the high wind speeds make wind energy an attractivesource. Beside solar and wind power, this region can exploit the geothermal fieldwhich exists in the island of Nissyros (Fig. 1 [1]).
This work examines the optimal use of wind power and geothermal energy forelectricity production and the use of solar energy for heating purposes. Threeenergy scenarios are examined, each time taking into account different environmen-tal and economic considerations.
2. The Dodecanese Islands
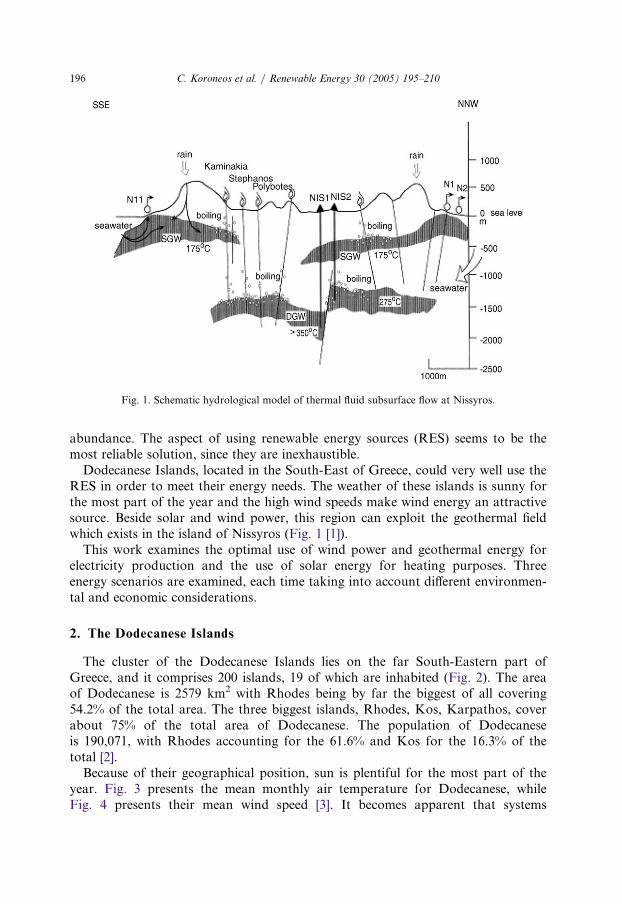
The cluster of the Dodecanese Islands lies on the far South-Eastern part ofGreece, and it comprises 200 islands, 19 of which are inhabited (Fig. 2). The areaof Dodecanese is 2579 km2 with Rhodes being by far the biggest of all covering54.2% of the total area. The three biggest islands, Rhodes, Kos, Karpathos, coverabout 75% of the total area of Dodecanese. The population of Dodecaneseis 190,071, with Rhodes accounting for the 61.6% and Kos for the 16.3% of thetotal [2].
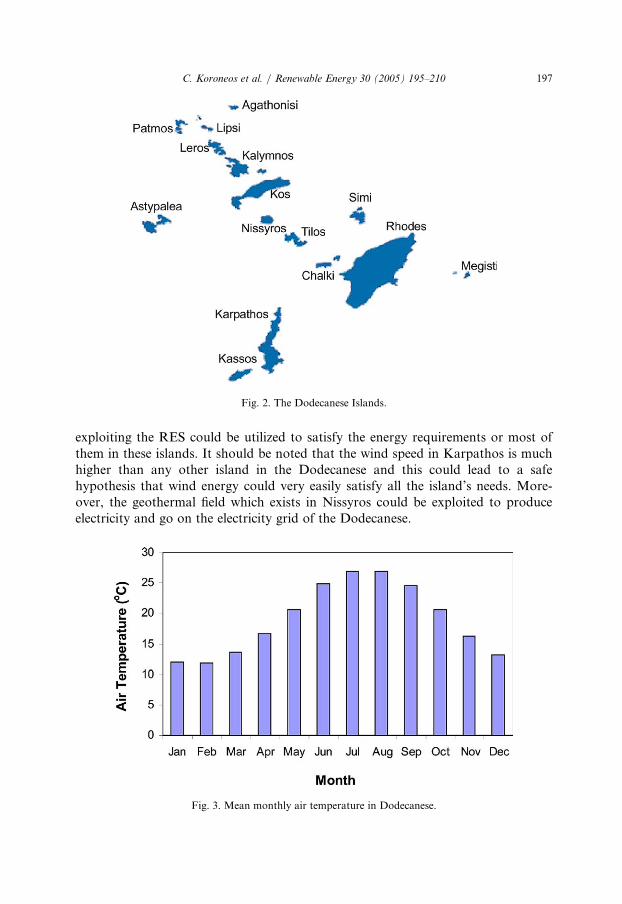
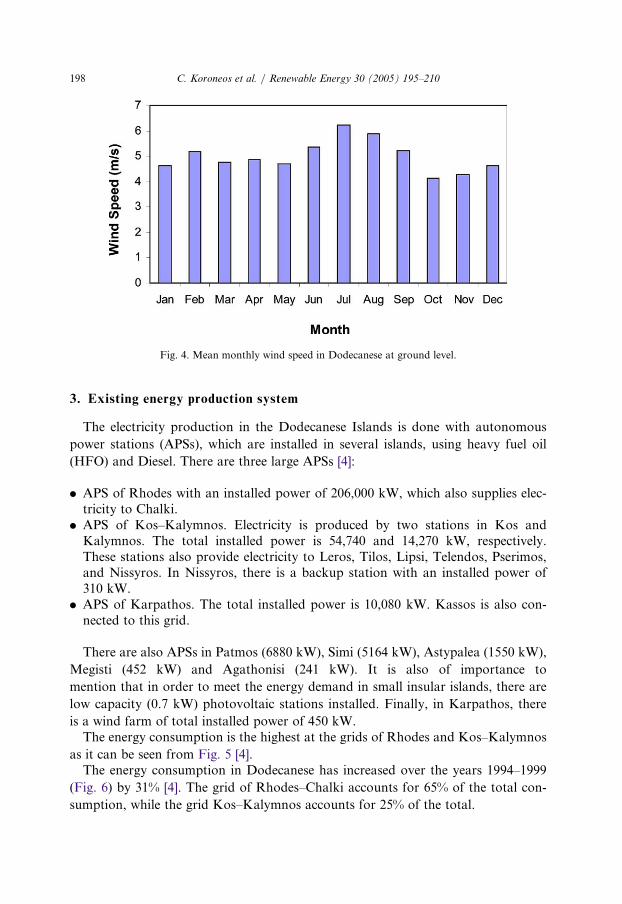
Because of their geographical position, sun is plentiful for the most part of theyear. Fig. 3 presents the mean monthly air temperature for Dodecanese, whileFig. 4 presents their mean wind speed [3]. It becomes apparent that systems
Fig. 1. Schematic hydrological model of thermal fluid subsurface flow at Nissyros.
197C. Koroneos et al. / Renewable Energy 30 (2005) 195–210
exploiting the RES could be utilized to satisfy the energy requirements or most ofthem in these islands. It should be noted that the wind speed in Karpathos is muchhigher than any other island in the Dodecanese and this could lead to a safehypothesis that wind energy could very easily satisfy all the island’s needs. More-over, the geothermal field which exists in Nissyros could be exploited to produceelectricity and go on the electricity grid of the Dodecanese.
Fig. 2. The Dodecanese Islands.
Fig. 3. Mean monthly air temperature in Dodecanese.
C. Koroneos et al. / Renewable Energy 30 (2005) 195–210198
3. Existing energy production system
The electricity production in the Dodecanese Islands is done with autonomous
power stations (APSs), which are installed in several islands, using heavy fuel oil
(HFO) and Diesel. There are three large APSs [4]:
. APS of Rhodes with an installed power of 206,000 kW, which also supplies elec-tricity to Chalki.
. APS of Kos–Kalymnos. Electricity is produced by two stations in Kos andKalymnos. The total installed power is 54,740 and 14,270 kW, respectively.These stations also provide electricity to Leros, Tilos, Lipsi, Telendos, Pserimos,and Nissyros. In Nissyros, there is a backup station with an installed power of310 kW.
. APS of Karpathos. The total installed power is 10,080 kW. Kassos is also con-nected to this grid.
There are also APSs in Patmos (6880 kW), Simi (5164 kW), Astypalea (1550 kW),
Megisti (452 kW) and Agathonisi (241 kW). It is also of importance to
mention that in order to meet the energy demand in small insular islands, there are
low capacity (0.7 kW) photovoltaic stations installed. Finally, in Karpathos, there
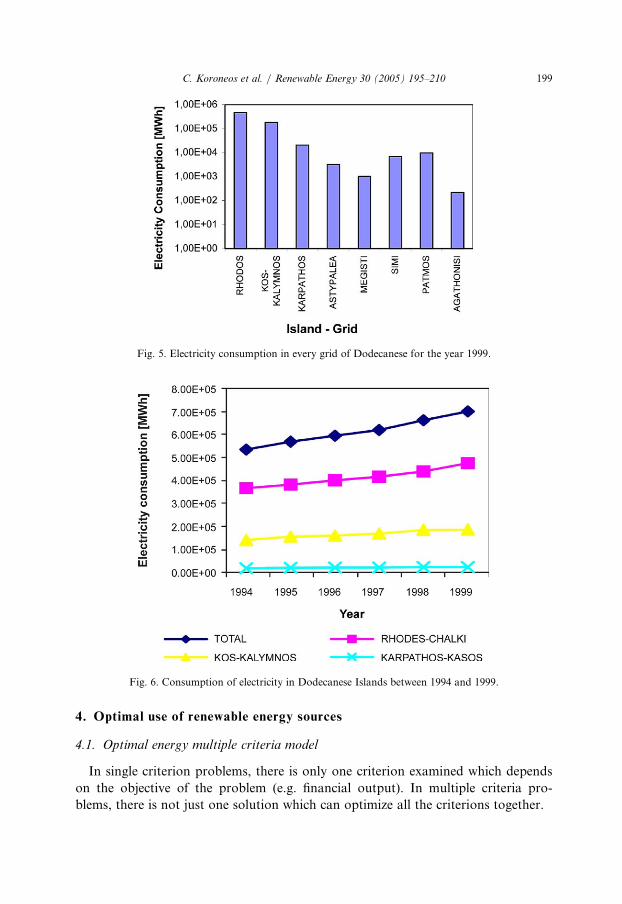
is a wind farm of total installed power of 450 kW.The energy consumption is the highest at the grids of Rhodes and Kos–Kalymnos
as it can be seen from Fig. 5 [4].The energy consumption in Dodecanese has increased over the years 1994–1999
(Fig. 6) by 31% [4]. The grid of Rhodes–Chalki accounts for 65% of the total con-
sumption, while the grid Kos–Kalymnos accounts for 25% of the total.
Fig. 4. Mean monthly wind speed in Dodecanese at ground level.
199C. Koroneos et al. / Renewable Energy 30 (2005) 195–210
4. Optimal use of renewable energy sources
4.1. Optimal energy multiple criteria model
In single criterion problems, there is only one criterion examined which depends
on the objective of the problem (e.g. financial output). In multiple criteria pro-
blems, there is not just one solution which can optimize all the criterions together.
. 5. Electricity consumption in every grid of Dodecanese for the year 199
Fig 9.ig. 6. Consumption of electricity in Dodecanese Islands between 1994 and 1999
F .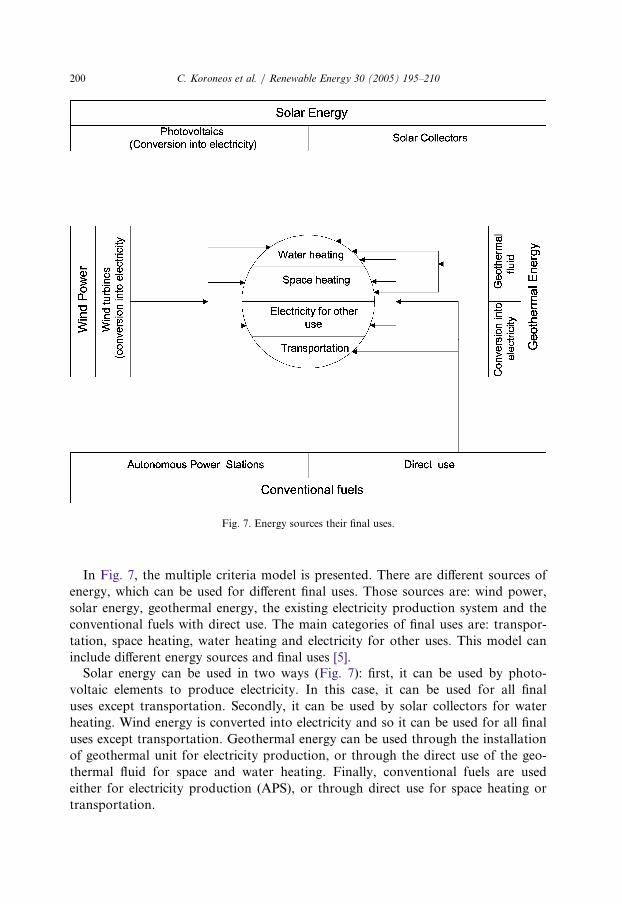
C. Koroneos et al. / Renewable Energy 30 (2005) 195–210200
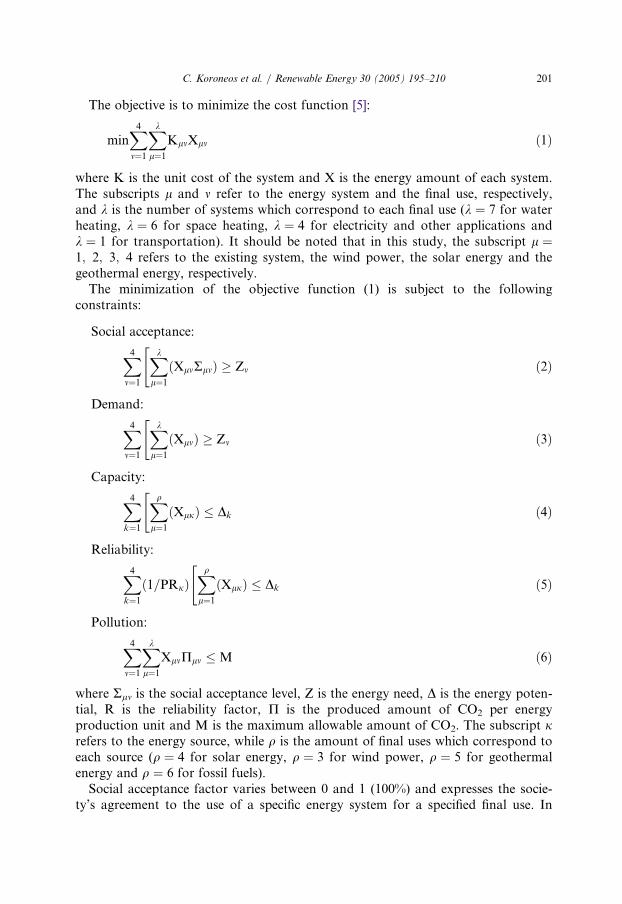
In Fig. 7, the multiple criteria model is presented. There are different sources of
energy, which can be used for different final uses. Those sources are: wind power,
solar energy, geothermal energy, the existing electricity production system and the
conventional fuels with direct use. The main categories of final uses are: transpor-
tation, space heating, water heating and electricity for other uses. This model can
include different energy sources and final uses [5].Solar energy can be used in two ways (Fig. 7): first, it can be used by photo-
voltaic elements to produce electricity. In this case, it can be used for all final
uses except transportation. Secondly, it can be used by solar collectors for water
heating. Wind energy is converted into electricity and so it can be used for all final
uses except transportation. Geothermal energy can be used through the installation
of geothermal unit for electricity production, or through the direct use of the geo-
thermal fluid for space and water heating. Finally, conventional fuels are used
either for electricity production (APS), or through direct use for space heating or
transportation.
Fig. 7. Energy sources their final uses.
201C. Koroneos et al. / Renewable Energy 30 (2005) 195–210
The objective is to minimize the cost function [5]:
minX4m¼1
Xk
l¼1
KlmXlm ð1Þ
where K is the unit cost of the system and X is the energy amount of each system.The subscripts l and m refer to the energy system and the final use, respectively,and k is the number of systems which correspond to each final use (k ¼ 7 for waterheating, k ¼ 6 for space heating, k ¼ 4 for electricity and other applications andk ¼ 1 for transportation). It should be noted that in this study, the subscript l ¼1; 2; 3; 4 refers to the existing system, the wind power, the solar energy and thegeothermal energy, respectively.
The minimization of the objective function (1) is subject to the followingconstraints:
Social acceptance:
X4
m¼1
Xk
l¼1
ðXlmRlmÞ"
� Zm ð2Þ
Demand:
X4
m¼1
Xk
l¼1
ðXlmÞ"
� Zm ð3Þ
Capacity:
X4
k¼1
Xq
l¼1
ðXljÞ"
� Dk ð4Þ
Reliability:
X4
k¼1
ð1=PRjÞXq
l¼1
ðXljÞ"
� Dk ð5Þ
Pollution:
X4
m¼1
Xk
l¼1
XlmPlm � M ð6Þ
where Rlm is the social acceptance level, Z is the energy need, D is the energy poten-tial, R is the reliability factor, P is the produced amount of CO2 per energyproduction unit and M is the maximum allowable amount of CO2. The subscript jrefers to the energy source, while q is the amount of final uses which correspond toeach source (q ¼ 4 for solar energy, q ¼ 3 for wind power, q ¼ 5 for geothermalenergy and q ¼ 6 for fossil fuels).
Social acceptance factor varies between 0 and 1 (100%) and expresses the socie-ty’s agreement to the use of a specific energy system for a specified final use. In
C. Koroneos et al. / Renewable Energy 30 (2005) 195–210202
order to determine the social acceptance factor, a leaflet and questionnaires arenecessary. In the present analysis, the social acceptance factor is considered to be100%, which means that the whole population is in favor of every energy system.
Reliability factor varies between 0 and 1 (100%) and is used to express theproblems of technical feasibility for the production and transfer of energy, and alsothe fact that RES do not constitute a continuous and stable source of energy. Thepresent analysis has been executed on a monthly basis so as to achieve morerepresentative results.
4.2. Application of multiple criteria model in the Dodecanese Islands
The energy model as applied to the Dodecanese Islands takes into considerationcertain peculiarities unique to the islands. Specifically, transportation and spaceheating are not examined because it was not possible to determine the exact energyneeds for these uses. Furthermore, only conventional fuels (direct use) are used fortransportation (Fig. 7). As a result, transportation does not affect the problem’soptimal solution. Also, it was not possible to estimate the cost of direct use of con-ventional fuels. The same problem stands for the geothermal energy as well. As faras solar energy is concerned, it is suggested only the use of solar collectors, whilethe installation of photovoltaics for electricity production is not examined, due totheir high cost and the low output they have.
Under these assumptions, the objective function which needs to be minimized is:
X4
m¼1
Km ð10Þ
where the cost of each source, Km, may consist of a fixed cost, Kf , and a cost whichvaries with the energy amount produced by the source, Kvar, i.e.:
Km ¼ Kf þKvar Xm ð7Þ
The problem is examined for each grid of the existing system separately. The useof solar energy and wind power is examined for all grids, while the installation ofgeothermal unit is examined only for Kos–Kalymnos grid, as this one includesNissyros, the only island in which geothermal energy is available.
The cost function is the sum of the costs of each energy source. The cost of theexisting electricity production system, K1, is:
K1 ¼ K11 þK12 X1 ð8Þ
where K11 is the fixed production cost and K12 is the fuel cost per kWh consumed.Table 1 presents the fixed and the fuel cost for each APS [4].
The cost for the wind power stations depends on the type of the wind turbineschosen. For a wind turbine with nominal power 600 kW, the cost, K2 in 4/year,which consists of the fixed cost of purchase, transfer, installation and of theoperation cost, is given by [6]:
K2 ¼ 23; 777þ 46; 821 X2 ð9Þ
203C. Koroneos et al. / Renewable Energy 30 (2005) 195–210
Considering that the life span of a solar collector is 15 years, the cost of instal-lation and operation of solar collectors, K3, in 4/year is given by [7]:
K3 ¼ 9250 X3 ð10ÞFinally, the cost of installation and operation of the geothermal field, K4,
depends on the nominal power of the plant. For a plant with nominal power 10 MW,the cost in 4/year—including the cost of installation and operation of the unit—isgiven by [8]:
K4 ¼ 1; 526; 045þ 0:035 X4 ð11ÞThe energy needs are the sum of the electricity consumption and the consump-
tion of energy for hot water. The energy potential of the Dodecanese Islands inRES, and especially in solar energy, wind power and geothermal energy, ispresented in Table 2. For the solar energy, it is assumed that the collectors cancover an area of 3% for the big islands and 5% for the smaller islands. Forthe wind power potential, it is assumed that 300 wind turbines can be installedaltogether based on the morphology of the islands.
The efficiency of the solar collectors is taken to be 15%, while for the wind tur-bines it is considered that 15% of the power produced is lost. Also, the geothermalplant is considered to have an availability of 90%.
The emitted CO2 from the existing system is 0.88 kg/kWh. The RES produce zeroor low emissions of CO2. Specifically, for the solar collectors and the wind turbines,CO2 is emitted only during their production stage, while the CO2 emitted from ahigh enthalpy geothermal field, in the island of Nissyros, is 0.02595 kg/kWh [10].
Three scenarios are examined. The objective in each scenario is the minimizationof the energy production cost. The first scenario examines the minimization of the
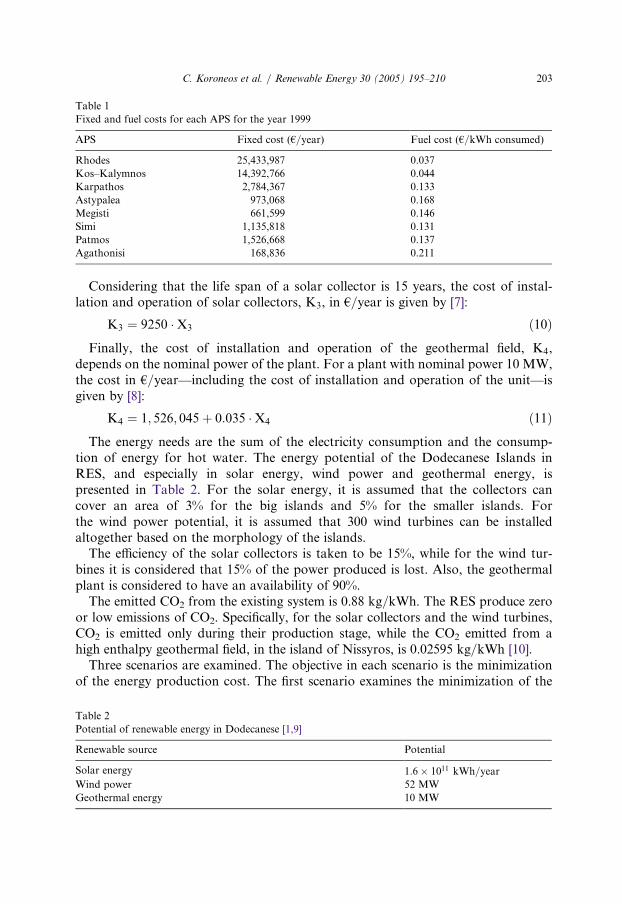
Table 1
Fixed and fuel costs for each APS for the year 1999
APS
Fixed cost (4/year) F uel cost (4/kWh consumed)Rhodes
25,433,987 0 .037Kos–Kalymnos
14,392,766 0 .044Karpathos
2,784,367 0 .133Astypalea
973,068 0 .168Megisti
661,599 0 .146Simi
1,135,818 0 .131Patmos
1,526,668 0 .137Agathonisi
168,836 0 .211Table 2
Potential of renewable energy in Dodecanese [1,9]
Renewable source
PotentialSolar energy
1:6 1011 kWh=yearWind power
52 MWGeothermal energy
10 MW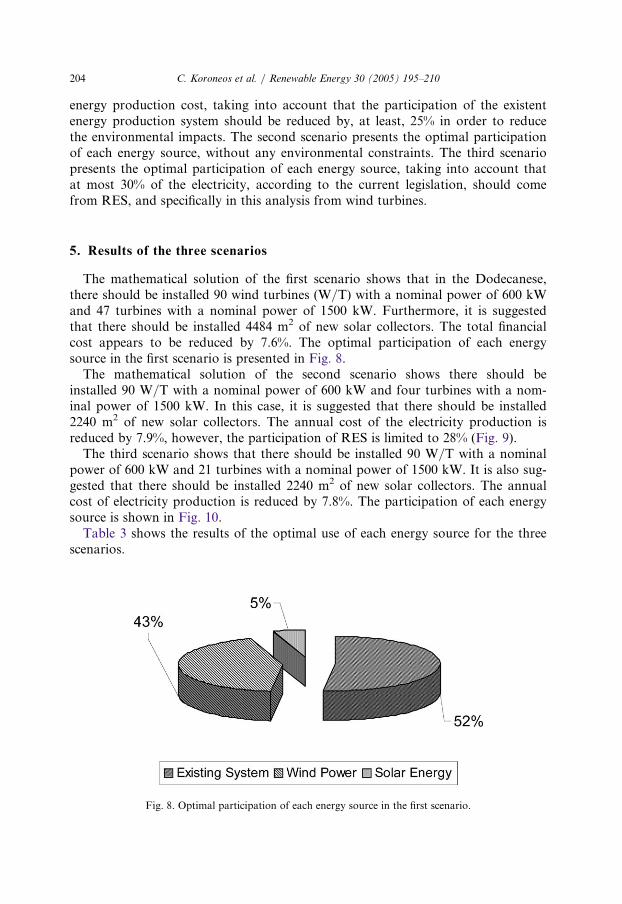
C. Koroneos et al. / Renewable Energy 30 (2005) 195–210204
energy production cost, taking into account that the participation of the existentenergy production system should be reduced by, at least, 25% in order to reducethe environmental impacts. The second scenario presents the optimal participationof each energy source, without any environmental constraints. The third scenariopresents the optimal participation of each energy source, taking into account thatat most 30% of the electricity, according to the current legislation, should comefrom RES, and specifically in this analysis from wind turbines.
5. Results of the three scenarios
The mathematical solution of the first scenario shows that in the Dodecanese,there should be installed 90 wind turbines (W/T) with a nominal power of 600 kWand 47 turbines with a nominal power of 1500 kW. Furthermore, it is suggestedthat there should be installed 4484 m2 of new solar collectors. The total financialcost appears to be reduced by 7.6%. The optimal participation of each energysource in the first scenario is presented in Fig. 8.
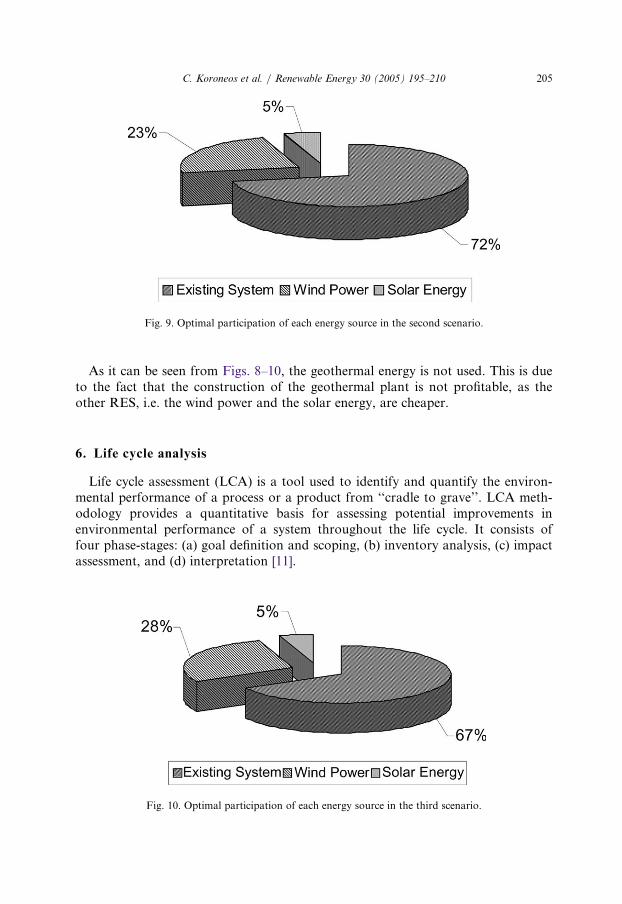
The mathematical solution of the second scenario shows there should beinstalled 90 W/T with a nominal power of 600 kW and four turbines with a nom-inal power of 1500 kW. In this case, it is suggested that there should be installed2240 m2 of new solar collectors. The annual cost of the electricity production isreduced by 7.9%, however, the participation of RES is limited to 28% (Fig. 9).
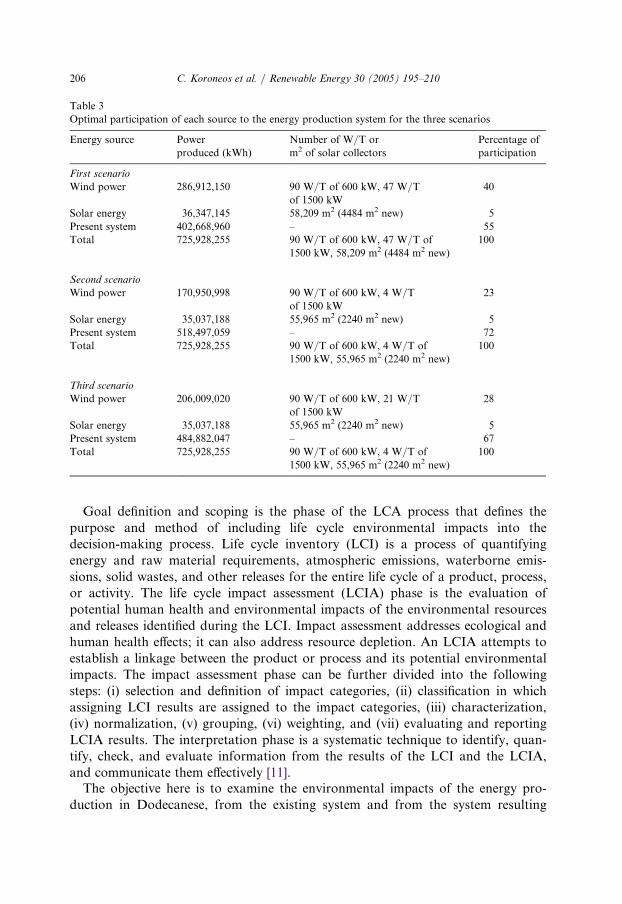
The third scenario shows that there should be installed 90 W/T with a nominalpower of 600 kW and 21 turbines with a nominal power of 1500 kW. It is also sug-gested that there should be installed 2240 m2 of new solar collectors. The annualcost of electricity production is reduced by 7.8%. The participation of each energysource is shown in Fig. 10.
Table 3 shows the results of the optimal use of each energy source for the threescenarios.
Fig. 8. Optimal participation of each energy source in the first scenario.
205C. Koroneos et al. / Renewable Energy 30 (2005) 195–210
As it can be seen from Figs. 8–10, the geothermal energy is not used. This is dueto the fact that the construction of the geothermal plant is not profitable, as theother RES, i.e. the wind power and the solar energy, are cheaper.
6. Life cycle analysis
Life cycle assessment (LCA) is a tool used to identify and quantify the environ-mental performance of a process or a product from ‘‘cradle to grave’’. LCA meth-odology provides a quantitative basis for assessing potential improvements inenvironmental performance of a system throughout the life cycle. It consists offour phase-stages: (a) goal definition and scoping, (b) inventory analysis, (c) impactassessment, and (d) interpretation [11].
Fig. 10. Optimal participation of each energy source in the third scenario.
Fig. 9. Optimal participation of each energy source in the second scenario.
C. Koroneos et al. / Renewable Energy 30 (2005) 195–210206
Goal definition and scoping is the phase of the LCA process that defines thepurpose and method of including life cycle environmental impacts into thedecision-making process. Life cycle inventory (LCI) is a process of quantifyingenergy and raw material requirements, atmospheric emissions, waterborne emis-sions, solid wastes, and other releases for the entire life cycle of a product, process,or activity. The life cycle impact assessment (LCIA) phase is the evaluation ofpotential human health and environmental impacts of the environmental resourcesand releases identified during the LCI. Impact assessment addresses ecological andhuman health effects; it can also address resource depletion. An LCIA attempts toestablish a linkage between the product or process and its potential environmentalimpacts. The impact assessment phase can be further divided into the followingsteps: (i) selection and definition of impact categories, (ii) classification in whichassigning LCI results are assigned to the impact categories, (iii) characterization,(iv) normalization, (v) grouping, (vi) weighting, and (vii) evaluating and reportingLCIA results. The interpretation phase is a systematic technique to identify, quan-tify, check, and evaluate information from the results of the LCI and the LCIA,and communicate them effectively [11].
The objective here is to examine the environmental impacts of the energy pro-duction in Dodecanese, from the existing system and from the system resulting
Table 3
Optimal participation of each source to the energy production system for the three scenarios
Energy source P
owerproduced (kWh)
Number of W/T or
m2 of solar collectors
Percentage of
participation
First scenario
Wind power 2
86,912,150 90 W/T of 600 kW, 47 W/Tof 1500 kW
40
Solar energy
36,347,145 58,209 m2 (4484 m2 new) 5Present system 4
02,668,960 – 55Total 7
25,928,255 90 W/T of 600 kW, 47 W/T of1500 kW, 58,209 m2 (4484 m2 new)
100
Second scenario
Wind power 1
70,950,998 90 W/T of 600 kW, 4 W/Tof 1500 kW
23
Solar energy
35,037,188 55,965 m2 (2240 m2 new) 5Present system 5
18,497,059 – 72Total 7
25,928,255 90 W/T of 600 kW, 4 W/T of1500 kW, 55,965 m2 (2240 m2 new)
100
Third scenario
Wind power 2
06,009,020 90 W/T of 600 kW, 21 W/Tof 1500 kW
28
Solar energy
35,037,188 55,965 m2 (2240 m2 new) 5Present system 4
84,882,047 – 67Total 7
25,928,255 90 W/T of 600 kW, 4 W/T of1500 kW, 55,965 m2 (2240 m2 new)
100
207C. Koroneos et al. / Renewable Energy 30 (2005) 195–210
from the first scenario, because this is the scenario with the highest participation ofthe RES to the energy production system. The impact assessment stage of the LCAstudy includes the determination of impact categories, the categorization, the char-acterization, the normalization and the evaluation.
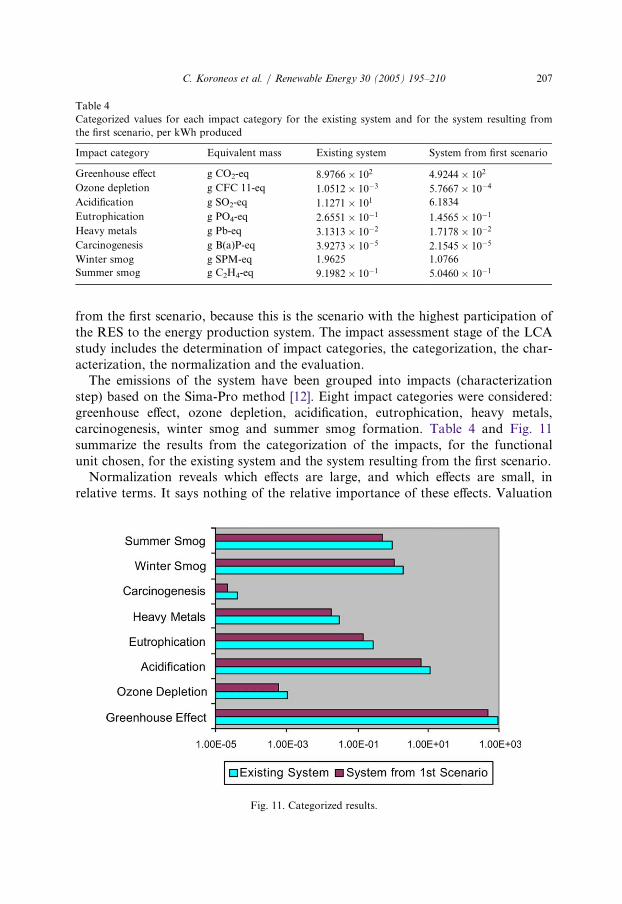
The emissions of the system have been grouped into impacts (characterizationstep) based on the Sima-Pro method [12]. Eight impact categories were considered:greenhouse effect, ozone depletion, acidification, eutrophication, heavy metals,carcinogenesis, winter smog and summer smog formation. Table 4 and Fig. 11summarize the results from the categorization of the impacts, for the functionalunit chosen, for the existing system and the system resulting from the first scenario.
Normalization reveals which effects are large, and which effects are small, inrelative terms. It says nothing of the relative importance of these effects. Valuation
Table 4
Categorized values for each impact category for the existing system and for the system resulting from
the first scenario, per kWh produced
Impact category E
quivalent mass Existing system S ystem from first scenarioGreenhouse effect g
CO2-eq 8:9766 102 4 :9244 102Ozone depletion g
CFC 11-eq 1:0512 10�3 5 :7667 10�4Acidification g
SO2-eq 1:1271 101 6 .1834Eutrophication g
PO4-eq 2:6551 10�1 1 :4565 10�1Heavy metals g
Pb-eq 3:1313 10�2 1 :7178 10�2Carcinogenesis g
B(a)P-eq 3:9273 10�5 2 :1545 10�5Winter smog g
SPM-eq 1.9625 1 .0766Summer smog g
C2H4-eq 9:1982 10�1 5 :0460 10�1Fig. 11. Categorized results.
C. Koroneos et al. / Renewable Energy 30 (2005) 195–210208
factors are used for this purpose. The evaluation of the environmental score of
each effect is calculated based on the simple formula:
Environmental score ¼ characterised value normalisation
weighting factor ð12Þ
Due to lack of such factors for Greece, Holland and European factors have been
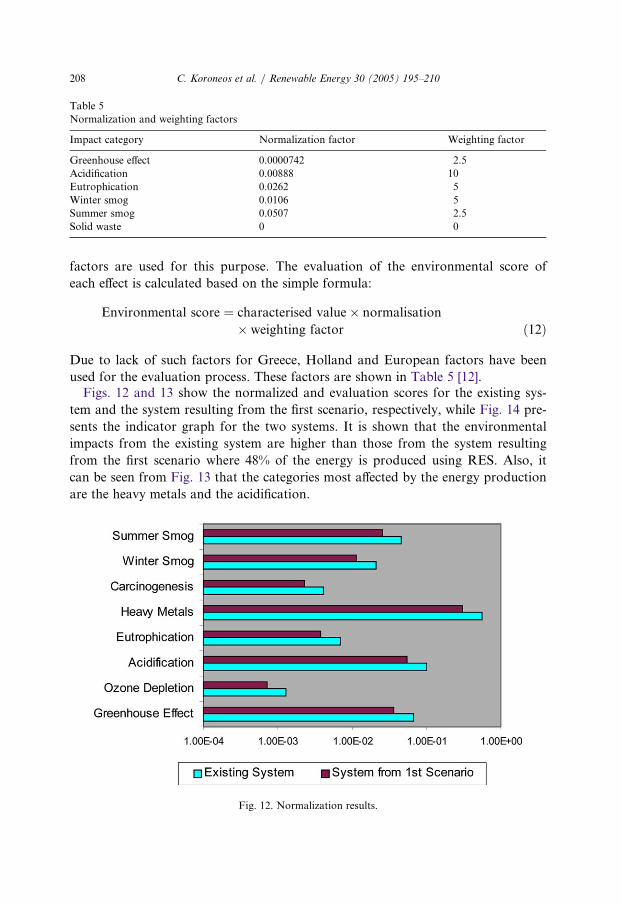
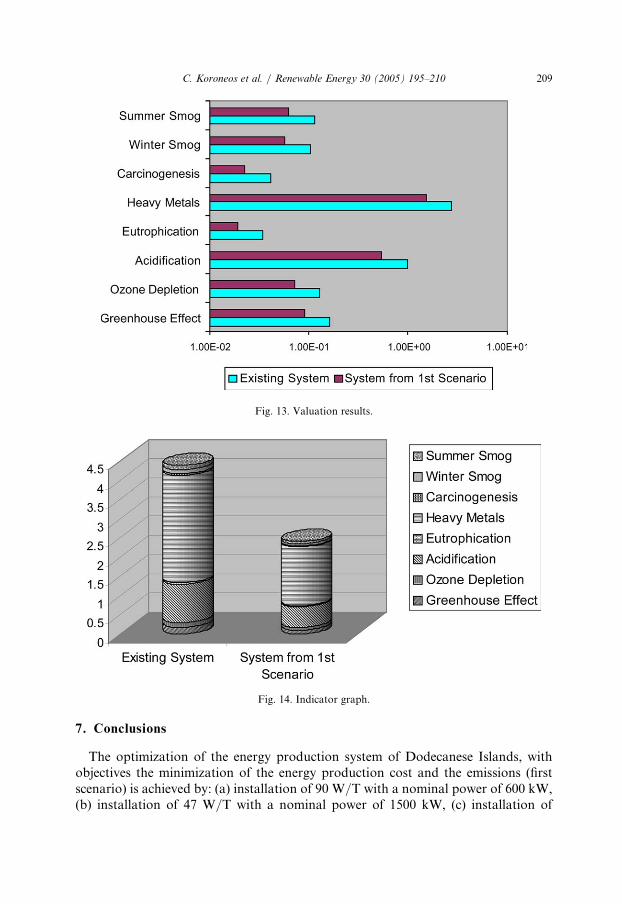
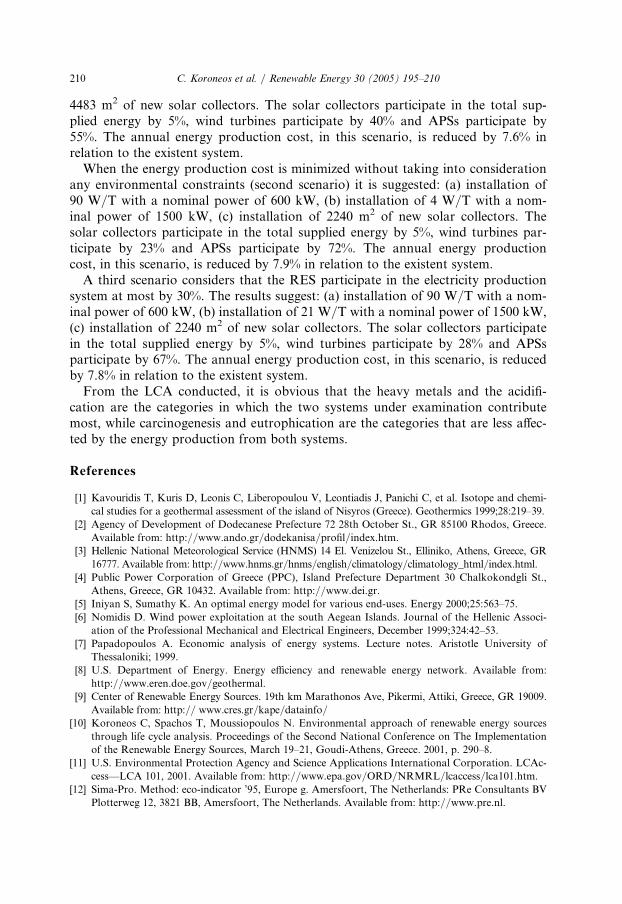
used for the evaluation process. These factors are shown in Table 5 [12].Figs. 12 and 13 show the normalized and evaluation scores for the existing sys-
tem and the system resulting from the first scenario, respectively, while Fig. 14 pre-
sents the indicator graph for the two systems. It is shown that the environmental
impacts from the existing system are higher than those from the system resulting
from the first scenario where 48% of the energy is produced using RES. Also, it
can be seen from Fig. 13 that the categories most affected by the energy production
are the heavy metals and the acidification.
Table 5
Normalization and weighting factors
Impact category N
ormalization factor W eighting factorGreenhouse effect 0
.0000742 2.5Acidification 0
.00888 1 0Eutrophication 0
.0262 5Winter smog 0
.0106 5Summer smog 0
.0507 2.5Solid waste 0
0Fig. 12. Normalization results.
209C. Koroneos et al. / Renewable Energy 30 (2005) 195–210
7. Conclusions
The optimization of the energy production system of Dodecanese Islands, withobjectives the minimization of the energy production cost and the emissions (firstscenario) is achieved by: (a) installation of 90 W/T with a nominal power of 600 kW,(b) installation of 47 W/T with a nominal power of 1500 kW, (c) installation of
Fig. 13. Valuation results.
Fig. 14. Indicator graph.
C. Koroneos et al. / Renewable Energy 30 (2005) 195–210210
4483 m2 of new solar collectors. The solar collectors participate in the total sup-plied energy by 5%, wind turbines participate by 40% and APSs participate by55%. The annual energy production cost, in this scenario, is reduced by 7.6% inrelation to the existent system.
When the energy production cost is minimized without taking into considerationany environmental constraints (second scenario) it is suggested: (a) installation of90 W/T with a nominal power of 600 kW, (b) installation of 4 W/T with a nom-inal power of 1500 kW, (c) installation of 2240 m2 of new solar collectors. Thesolar collectors participate in the total supplied energy by 5%, wind turbines par-ticipate by 23% and APSs participate by 72%. The annual energy productioncost, in this scenario, is reduced by 7.9% in relation to the existent system.
A third scenario considers that the RES participate in the electricity productionsystem at most by 30%. The results suggest: (a) installation of 90 W/T with a nom-inal power of 600 kW, (b) installation of 21 W/T with a nominal power of 1500 kW,(c) installation of 2240 m2 of new solar collectors. The solar collectors participatein the total supplied energy by 5%, wind turbines participate by 28% and APSsparticipate by 67%. The annual energy production cost, in this scenario, is reducedby 7.8% in relation to the existent system.
From the LCA conducted, it is obvious that the heavy metals and the acidifi-cation are the categories in which the two systems under examination contributemost, while carcinogenesis and eutrophication are the categories that are less affec-ted by the energy production from both systems.
References
[1] Kavouridis T, Kuris D, Leonis C, Liberopoulou V, Leontiadis J, Panichi C, et al. Isotope and chemi-
cal studies for a geothermal assessment of the island of Nisyros (Greece). Geothermics 1999;28:219–39.
[2] Agency of Development of Dodecanese Prefecture 72 28th October St., GR 85100 Rhodos, Greece.
Available from: http://www.ando.gr/dodekanisa/profil/index.htm.
[3] Hellenic National Meteorological Service (HNMS) 14 El. Venizelou St., Elliniko, Athens, Greece, GR
16777. Available from: http://www.hnms.gr/hnms/english/climatology/climatology_html/index.html.
[4] Public Power Corporation of Greece (PPC), Island Prefecture Department 30 Chalkokondgli St.,
Athens, Greece, GR 10432. Available from: http://www.dei.gr.
[5] Iniyan S, Sumathy K. An optimal energy model for various end-uses. Energy 2000;25:563–75.
[6] Nomidis D. Wind power exploitation at the south Aegean Islands. Journal of the Hellenic Associ-
ation of the Professional Mechanical and Electrical Engineers, December 1999;324:42–53.
[7] Papadopoulos A. Economic analysis of energy systems. Lecture notes. Aristotle University of
Thessaloniki; 1999.
[8] U.S. Department of Energy. Energy efficiency and renewable energy network. Available from:
http://www.eren.doe.gov/geothermal.
[9] Center of Renewable Energy Sources. 19th km Marathonos Ave, Pikermi, Attiki, Greece, GR 19009.
Available from: http:// www.cres.gr/kape/datainfo/
[10] Koroneos C, Spachos T, Moussiopoulos N. Environmental approach of renewable energy sources
through life cycle analysis. Proceedings of the Second National Conference on The Implementation
of the Renewable Energy Sources, March 19–21, Goudi-Athens, Greece. 2001, p. 290–8.
[11] U.S. Environmental Protection Agency and Science Applications International Corporation. LCAc-
cess—LCA 101, 2001. Available from: http://www.epa.gov/ORD/NRMRL/lcaccess/lca101.htm.
[12] Sima-Pro. Method: eco-indicator ’95, Europe g. Amersfoort, The Netherlands: PRe Consultants BV
Plotterweg 12, 3821 BB, Amersfoort, The Netherlands. Available from: http://www.pre.nl.