optimization of reducing sugar production from manihot
TRANSCRIPT
energies
Article
Optimization of Reducing Sugar Production fromManihot glaziovii Starch Using ResponseSurface Methodology
Abdi Hanra Sebayang 1,2, Masjuki Haji Hassan 1, Hwai Chyuan Ong 1,*, Surya Dharma 1,2,Arridina Susan Silitonga 1,2, Fitranto Kusumo 1, Teuku Meurah Indra Mahlia 3 andAditiya Harjon Bahar 4
1 Department of Mechanical Engineering, Faculty of Engineering, University of Malaya, Kuala Lumpur 50603,Malaysia; [email protected] (A.H.S.); [email protected] (M.H.H.); [email protected] (S.D.);[email protected] (A.S.S.); [email protected] (F.K.)
2 Department of Mechanical Engineering, Medan State Polytechnic, Medan 20155, Indonesia3 Department of Mechanical Engineering, Universiti Tenaga Nasional, Kajang 43000, Selangor, Malaysia;
[email protected] Department of Mechanical Engineering, Faculty of Engineering, The University of Melbourne, Parkville,
VIC 3010, Australia; [email protected]* Correspondence: [email protected] or [email protected]; Tel.: +60-16-590-3110; Fax: +60-37-967-5317
Academic Editor: Thomas E. AmidonReceived: 14 June 2016; Accepted: 4 September 2016; Published: 1 January 2017
Abstract: Bioethanol is known as a viable alternative fuel to solve both energy and environmentalcrises. This study used response surface methodology based on the Box-Behnken experimental designto obtain the optimum conditions for and quality of bioethanol production. Enzymatic hydrolysisoptimization was performed with selected hydrolysis parameters, including substrate loading,stroke speed, α-amylase concentration and amyloglucosidase concentration. From the experiment,the resulting optimum conditions are 23.88% (w/v) substrate loading, 109.43 U/g α-amylaseconcentration, 65.44 U/mL amyloglucosidase concentration and 74.87 rpm stroke speed, whichyielded 196.23 g/L reducing sugar. The fermentation process was also carried out, with a productionvalue of 0.45 g ethanol/g reducing sugar, which is equivalent to 88.61% of ethanol yield afterfermentation by using Saccharomyces cerevisiae (S. cerevisiae). The physical and chemical properties ofthe produced ethanol are within the specifications of the ASTM D4806 standard. The good quality ofethanol produced from this study indicates that Manihot glaziovii (M. glaziovii) has great potential asbioethanol feedstock.
Keywords: Manihot glaziovii (M. glaziovii); optimization; hydrolysis; fermentation; bioethanol;alternative fuel
1. Introduction
The use of alternative fuels has rapidly developed with the objective of reducing the impact ofcontinuously burning non-renewable fossil fuel. Currently, the predominant bioethanol is generallyused blended with gasoline to push down the usage of conventional fuel and can be used inexisting motor engines [1]. Bioethanol is a liquid resulting from fermentation of sugar and it issourced from plants containing carbohydrates (starch) [2]. Moreover, microorganisms are used asenzymes in the fermentation process [3]. Bioethanol is widely used as a biofuel due to the followingreasons: (1) bioethanol has high oxygen content and octane number; (2) bioethanol is non-toxic;and (3) bioethanol is environmentally friendly since it decreases pollutant emissions such as carbonmonoxide, sulphur and nitrogen oxides [4,5]. However, bioethanol has a number of disadvantages,
Energies 2017, 10, 35; doi:10.3390/en10010035 www.mdpi.com/journal/energies
Energies 2017, 10, 35 2 of 13
one of them being that it has low vapour pressure compared to gasoline, making engine starts difficultat low temperatures. In addition, bioethanol can cause corrosion in engines [6,7].
Bioethanol production from starch-based biomass is dependent on the type of feedstock andthe steps involved in the bioethanol production process [8]. In general, bioethanol productionconsists of five main steps, which are pre-treatment, hydrolysis, fermentation, distillation anddehydration [9]. The hydrolysis process breaks down the carbohydrates in the feedstock into sugar byusing enzymes [10], and hydrolysis is often taken as the parameter of interest in the effort to improvebioethanol production. First-generation bioethanol feedstocks such as corn, sweet potatoes, cassavaand sugar cane have raised concerns about global food security, and this hinders worldwide acceptanceof using bioethanol as fuel for compression-ignition engines. Hence, much effort is being made toproduce bioethanol from non-edible feedstocks [11–13].
Manihot glaziovii (M. glaziovii) has been shown to be a promising non-edible feedstock forbioethanol production because of its low cost and high starch content [14]. M. glaziovii holds highstarch content of about 70%–85% by dry weight and high rate of production per hectare, and theseproperties are suitable for bioethanol production [15]. Moreover, M. glaziovii is drought-resistant andhas a short growth cycle, and therefore it can be grown on marginal lands. M. glaziovii is native totropical countries within Africa, South America, South Asia and Southeast Asia regions [16].
Response surface methodology (RSM) is a technique based on design of experiments (DOE).RSM is used to analyse the changes of the dependent variable (i.e., response variable) due to changesin the independent variables, and it is also used to optimize the dependent variable. RSM has beenwidely used to optimize the process parameters for bioethanol and biodiesel production [17–19].RSM has been shown to be an efficient method to optimize every stage of the bioethanol productionprocess, which significantly reduces time, costs and effort associated with conventional experimentaltechniques [20].
Studies of the starch-to-glucose hydrolysis process have been widely performed. The enzymaticstarch hydrolysis process [21,22] and the acid hydrolysis process [23–25] still use conventional methods.Therefore, RSM optimization methods are used in the starch hydrolysis process into reducing sugar toobtain optimum conditions globally.
In this study, M. glaziovii starch is used as the feedstock to produce bioethanol. In addition,optimization of enzymatic hydrolysis is performed, with expectation of yielding the optimumquality of the produced reducing sugar. Response surface methodology based on the Box-Behnkenexperimental design was then used to optimize the operating parameters of the hydrolysis processes.Quadratic regression models were developed in this study and used to predict the reducing sugarconcentration from hydrolysis. The physical and chemical properties of the M. glaziovii bioethanolwere then measured according to the methods outlined in the ASTM D4806 standard [9,26].
2. Materials and Methods
2.1. Substrate and Enzymes
M. glaziovii flour was sourced from North Sumatra, Indonesia. The M. glaziovii tubers was firstpeeled and washed to remove impurities, and then cut and shredded. The shredded M. glaziovii wasadded to water, transforming into wet starch. The wet starch was dried in an oven at a temperature of50 ◦C for 48 h. This drying process is important for longer storage periods at 25 ◦C. The dried starchwas then milled and sifted to obtain starch with a homogeneous particle size.
Enzyme α-amylase from Bacillus licheniformis Type XII-A and amyloglucosidase from Aspergillus nigerare used as a catalyst liquefaction and saccharification. Both enzymes were purchased fromSigma-Aldrich (St. Louis, MO, USA), with enzymatic activity of more than or equal to 500 U/gprotein for α-amylase and greater than or equal to 300 U/mL for amyloglucosidase.
Energies 2017, 10, 35 3 of 13
2.2. Methodology
2.2.1. Composition of Manihot glaziovii Substrate
The composition of the M. glaziovii starch was measured at Bioethanol Laboratory, Faculty ofEngineering, University of Malaya. The composition of M. glaziovii starch was measured according tothe methods outlined in the AAAC International Approved Methods of Analysis.
2.2.2. Analysis of Sugars and Ethanol as by-Products
The reducing sugar content was analyzed using the 3,5-dinitrosalisilat acid (DNS) method [27].The amount of reducing sugar was determined using an ultraviolet-visible (UV-Vis) spectrophotometer(SPEKOL® 1500, Analytik Jena, Berlin, Germany). Ethanol concentration is the concentration of ethanolat the end of fermentation. It was measured with a gas chromatograph (7890A, Agilent, Santa Clara,CA, USA) system with a thermal conductivity detector and 30 m × 0.32 mm, DB-ALC2 column(Agilent) with He as carrier gas, the injector temperature and detector temperature were 150 ◦C and200 ◦C, respectively.
2.2.3. Hydrolysis Process
The general procedure of enzymatic hydrolysis was initiated by preparing the respectivesubstrates in a flask filled with distilled water. The liquefaction process involved M. glaziovii starch(10%, 17.5% and 25% (w/v)) and (90, 100 and 110 U/g) of α-amylase at 90 ◦C, stroke speed 50, 90 and130 spm. The liquefaction process was followed by a saccharification process with amyloglucosidase(36, 51 and 66 U/mL) at 70 ◦C for 240 min. Each sample was then centrifuged at 10,000 rpm for 5 minto separate the solid residue and then to test the DNS method to measure the amount of reducingsugar in each hydrolyzate. The optimization of M. glaziovii enzymatic hydrolysis was initiated.
2.2.4. Optimization of Hydrolysis Process
Response surface methodology based on Box-Behnken experimental design was used to optimizethe operating parameters of the starch hydrolysis process. The Box-Behnken experimental design isone of the optimization tools available in the design expert software version 9.0.4.1 (Stat-Ease Inc.,Minneapolis, MN, USA). The independent variables chosen for optimization are as follows: substrateloading (10%, 17.5% and 25% (w/v)), α-amylase concentration (90, 100 and 110 U/g), amyloglucosidaseconcentration (36, 51 and 66 U/mL) and stroke speed (50, 90 and 130 strokes/min, spm). The codedlevels of the independent variables (factor variables) used for hydrolysis of M. glaziovii starch arepresented in Table 1 and the Box-Behnken experimental design of the starch hydrolysis process ispresented in Table 5.
Table 1. Coded levels of the independent variables used for hydrolysis of Manihot glaziovii(M. glaziovii) starch.
Parameter UnitRange and Levels
−1 0 +1
Substrate loading (X1) % (w/v) 10 17.5 25α-amylase concentration (X2) U/g 90 100 110
Amyloglucosidase concentration (X3) U/mL 36 51 66Stroke speed (X4) spm 50 90 130
The experimental data were analyzed using response surface regression. Also, analysis of variance(ANOVA) was used to assess the quality of the model fit. The quadratic response surface model forthe reducing sugar concentration is given by Equation (1):
YRS = β0 + β1X1 + β2X2 + β3X3 + β4X4 + β12X1X2 + β13X1X3 + β14X1X4 + β23X2X3 + β24X2X4
+ β34X3X4 + β11X12 + β22X2
2 + β33X32 + β44X4
2 (1)
Energies 2017, 10, 35 4 of 13
In Equation (1), YRS is the response variable, which in this case is the reducing sugar concentration(g/L), β0 is the intercept term, β1, β2, β3 and β4 are linear coefficients, β12, β13, β14, β23, β24 andβ34 are interactive coefficients, β11, β22, β33 and β44 are quadratic coefficients, and X1, X2, X3 andX4 are the coded independent variables. In this case, X1 represents the substrate loading (% (w/v)),X2 represents the α-amylase concentration (U/g), X3 represents the amyloglucosidase concentration(U/mL) and X4 represent stroke speed (strokes per minute, spm).
2.2.5. Yeast Culturing Media Preparation
The yeast of Saccharomyces cerevisiae (S. cerevisiae) Type II, which was purchased fromSigma-Aldrich, was used to ferment the M. glaziovii starch into ethanol. Yeast peptone dextrosewas used for cultivating and maintaining dry yeast from S. cerevisiae. The yeast peptone dextrose wasprepared by 2 g of yeast extract, 4 g bacterial peptone, 4 g of glucose and 12 g agar in 200 mL of distilledwater. Then, dry yeast was activated by adding 100 mL of distilled water in flask. The solution wassterilized in an autoclave for 35 min and it was placed and maintained on a glass petri dish. The yeastis kept in an incubator at a temperature of 37 ◦C for 48 h in order to make it occulated before beingused for bioethanol production.
2.2.6. Fermentation Process
The fermentation process was carried out in 250 mL Erlenmeyer flasks. Each flask containinghydrolysed M. glaziovii starch was mixed with the following fermentation nutrients: 1 g of yeast extract,0.4 g of potassium dihydrogen phosphate (KH2PO4) and 0.2 g of ammonium chloride (NH4Cl) forevery 100 mL of hydrolysate. The solutions were mixed and then sterilized at a temperature of 125 ◦Cby autoclave for 35 min. The sterilized solutions were then inoculated with S. cerevisiae yeast. Then,the flasks were placed in an incubator shaker. Finally, the flasks were placed in an incubator shaker at37 ◦C, agitation 120 rpm for 84 h for the fermentation process. Samples were taken after 12, 24, 36, 48,60, 72 and 84 h.
2.2.7. Fermentation Kinetics
Modified Gompertz’s equation was used to determine the fermentation kinetics of the M. glazioviistarch [28], which is expressed as:
Ce = Ce.max × exp{− exp
[Re.max × exp(1)
Ce.max
]× (tL − t) + 1
}(2)
where Ce is the predicted ethanol concentration (g/L), Ce.max is the maximum ethanol concentration(g/L), Re.max is the maximum ethanol production rate (g/L/h), tL is the lag phase time (h), and t is theindependent variable of time (h).
2.2.8. Distillation Process
The ethanol extraction process was carried out in two stages: distillation and dehydration.Distillation was carried out using a rotary evaporator at a temperature, pressure and rotary speedof 60 ◦C, 175 mbar and 100 rpm, respectively. The vaporized fermentation solution was vacuumedby a pump and flowed to the other end to be condensed, resulting in an improved quality of ethanolsolution. Following that, dehydration process using zeolite was performed. Zeolite was introducedinto the dehydration column with diameter of 1 inch and the height of the zeolite is 90% (w/v).
2.2.9. Fourier Transform Infrared Spectroscopy
Fourier transform infrared (FTIR) spectroscopy is a powerful analytical technique to examine thefunctional groups of an alcohol, therefore FTIR (Tensor 27, Bruker, Billerica, MA, USA) was utilizedto identify the limits of the chemical structure of M. glaziovii bioethanol. The produced bioethanol
Energies 2017, 10, 35 5 of 13
M. glaziovii was analyzed by attenuated total reflection (ATR) sample compartment with mid-infrared(MIR) spectra in the wavenumber range of 4000–400 cm−1.
2.2.10. Physical and Chemical Properties of the Manihot glaziovii Bioethanol
The physical and chemical properties of the bioethanol produced from the inedible M. glazioviifeedstock were tested according to the methods outlined in ASTM D4806 standard. The equipmentused to analyze the physical and chemical properties of the bioethanol are summarized in Table 2.
Table 2. List of equipment used to analyse the properties of the M. glaziovii bioethanol. CHN: carbon,hydrogen, nitrogen.
Property Equipment Standard Method [9,26]
Kinematic viscosity Lovis 2000 M/ME micro viscometer andmicro density meter (Anton Paar)
DIN 53015Density ISO 12058
Elemental analysis for carbon (C),hydrogen (H) and oxygen (O) CE-440 CHN Elemental Analyzer (EIA) ASTM D5291
Calorific value IKA C2000 basic, automatic bombcalorimeter ASTM D240
Ethanol content Gas chromatograph, Agilent 7890A ASTM D4806
3. Results and Discussion
3.1. Composition of Manihot glaziovii Substrate
The M. glaziovii starch was stored in a closed container in a refrigerator before the laboratoryexperiment was conducted. The M. glaziovii starch consisted of particles with diameter 125–150 µm(98% or more particles pass through a 150 µm sieve). The content of the main components in theM. glaziovii starch was determined by chemical analysis (Table 3). The presence of more than 70 wt %of carbohydrates in the biomass makes it a potential substrate for bioethanol fuels.
Table 3. The substrate components of M. glaziovii.
Parameter Unit M. glaziovii
carbohydrates wt % 74.8proteins wt % 6.62
lipids wt % 3.12Ash wt % 5.15
fibers wt % 1.70moisture content wt % 8.61
3.2. Optimization of Starch Hydrolysis Process Operating Parameters
Once the optimal hydrolysis process is determined, the Box-Behnken design is used to test fourdifferent independent variables in the hydrolysis process. ANOVA was used to determine the effectsof the independent variables (i.e., substrate loading, α-amylase concentration, amyloglucosidaseconcentration and stroke speed) on the dependent variable (i.e., reducing sugar concentration).
Table 4 showed that the regression coefficients of the linear terms X1, X2, and X3 were significantat the 1% level as well as quadratic coefficients of X2
1 . The regression coefficients of the linear term X4,X2X4 and X3X4 were significant at the 5% level as well as quadratic coefficients of X2
2 . The polynomialmodel for reducing sugar concentration was regressed by considering the significant terms and isshown in Equation (3) below:
YRS = −886.67279 + 10.19401X1 + 15.62925X2 − 0.77128X3 + 0.91738X4 − 0.012025X2X4
+0.009287X3X4 − 0.27024X21 − 0.07333X2
2(3)
Energies 2017, 10, 35 6 of 13
In Equation (3), YRS represents the reducing sugar concentration (g/L), X1 represents the substrateloading, X2 represents the α-amylase concentration, X3 represents the amyloglucosidase concentrationand X4 represents the stroke speed.
The ANOVA results for the starch hydrolysis process are presented in Table 4. The reducing sugarconcentrations were predicted using Equation (3) for each sample and the results are shown in Table 5.
Table 4. Analysis of variance (ANOVA) results for the starch hydrolysis process. C.V.: coefficientof variation.
Source Sum of Squares df Mean Square F Value p-Value Prob > F Remarks
Model 28,689.87 14 2049.28 115.29 <0.0001 significantA-Substrate loading (X1) 22,057.47 1 22,057.47 1240.98 <0.0001 -
B-α-amylase (X2) 2041.02 1 2041.02 114.83 <0.0001 -C-Amyloglucosidase (X3) 2528.51 1 2528.51 142.26 <0.0001 -
D-Stroke speed (X4) 91.69 1 91.69 5.16 0.0394 -AB 39.38 1 39.38 2.22 0.1588 -AC 7.54 1 7.54 0.42 0.5255 -AD 1.37 1 1.37 0.077 0.7854 -BC 16.61 1 16.61 0.93 0.3502 -BD 92.54 1 92.54 5.21 0.0387 -CD 124.21 1 124.21 6.99 0.0193 -A2 1498.9 1 1498.9 84.33 <0.0001 -B2 348.88 1 348.88 19.63 0.0006 -C2 14.11 1 14.11 0.79 0.3879 -D2 12.09 1 12.09 0.68 0.4234 -
Residual 248.84 14 17.77 - - -Lack of Fit 231.66 10 23.17 5.39 0.0593 not significantPure Error 17.18 4 4.3 - - -Cor Total 28,938.71 28 - - - -
R-Squared 0.9914 - Adj R-Squared a 0.9828 - -C.V. b % 3.05 - - - - -
Notes: a Adjusted R2; b Coefficient of variation.
Table 5. Box-Behnken experimental design for the starch hydrolysis process.
SampleNo
SubstrateLoading
(% w/v) (X1)
α-AmylaseConcentration
(U/g) (X2)
AmyloglucosidaseConcentration
(U/mL) (X3)
Stroke Speed(spm) (X4)
Reducing Sugar (g/L)
Experiment Predicted
1 25 90 51 90 153.84 152.782 10 100 36 90 78.84 75.923 10 100 51 130 88.48 91.364 17.5 90 36 90 110.68 114.295 25 100 51 130 180.52 178.276 17.5 100 36 50 138.46 134.077 17.5 110 51 50 160.28 155.008 17.5 100 51 90 149.64 148.629 17.5 100 66 130 164.94 168.6310 17.5 100 66 50 150.48 151.9611 25 100 51 50 170.28 171.5712 17.5 100 36 130 130.63 128.4513 17.5 90 51 50 118.82 119.3014 17.5 110 66 90 168.84 169.4015 17.5 90 51 130 132.64 134.4516 17.5 100 51 90 148.58 148.6217 17.5 100 51 90 145.24 148.6218 10 110 51 90 92.75 93.1119 25 100 36 90 158.85 158.9220 17.5 100 51 90 150.78 148.6221 17.5 100 51 90 148.84 148.6222 17.5 110 51 130 154.86 150.9123 25 110 51 90 182.64 185.1324 25 100 66 90 191.25 190.7025 17.5 110 36 90 130.49 136.3026 17.5 90 66 90 140.88 139.2427 10 100 51 50 80.58 87.0028 10 90 51 90 76.5 73.3029 10 100 66 90 105.75 102.21
Energies 2017, 10, 35 7 of 13
ANOVA was carried out to determine the statistical significance of the quadratic response surfacemodel, and it can be seen from Table 4 that the p-value of the model was less than 0.0001, whichindicates the model was statistically significant. The coefficient of determination (R2) was found to be0.9914, which indicates that 99.14% of the experimental data were relevant and only 0.86% of the totalvariations was not explained by the model. In general, a high value of R2 indicates that there is goodfit between the predicted data and experimental data.
The adjusted coefficient of determination (Ra2) was found to be very high with a value of 0.9828,
which indicates that that the model accounted for 98.28% of the variability in the data. The coefficientof variation (C.V.) was found to be 3.05%, indicating that the deviations between the predicted dataand experimental data were small. The lack of fit was found to be small with a value of 5.39, andthis indicates that the model adequately described the relationship between the dependent variable(i.e., reducing sugar concentration) and the independent variables (i.e., substrate loading, α-amylaseconcentration, amyloglucosidase concentration and stroke speed). The corresponding p-value for thelack of fit parameter was 0.0593 (p-value > α), which indicates that there was no evidence that themodel did not fit the experimental data.
From the experimental result inputs, the optimum conditions for enzymatic hydrolysis weregenerated by DOE. The optimum substrate loading, α-amylase concentration, amyloglucosidaseconcentration and stroke speed were 23.88% (w/v), 109.43 U/g, 65.44 U/mL and 74.87 spm, respectively.The optimum reducing sugar was found to be 196.23 g/L. Verification tests in triplicate were performedunder the set of optimized parameters. Average reducing sugar of 194.98 g/L was achieved, atpredicted optimum conditions of the variables.
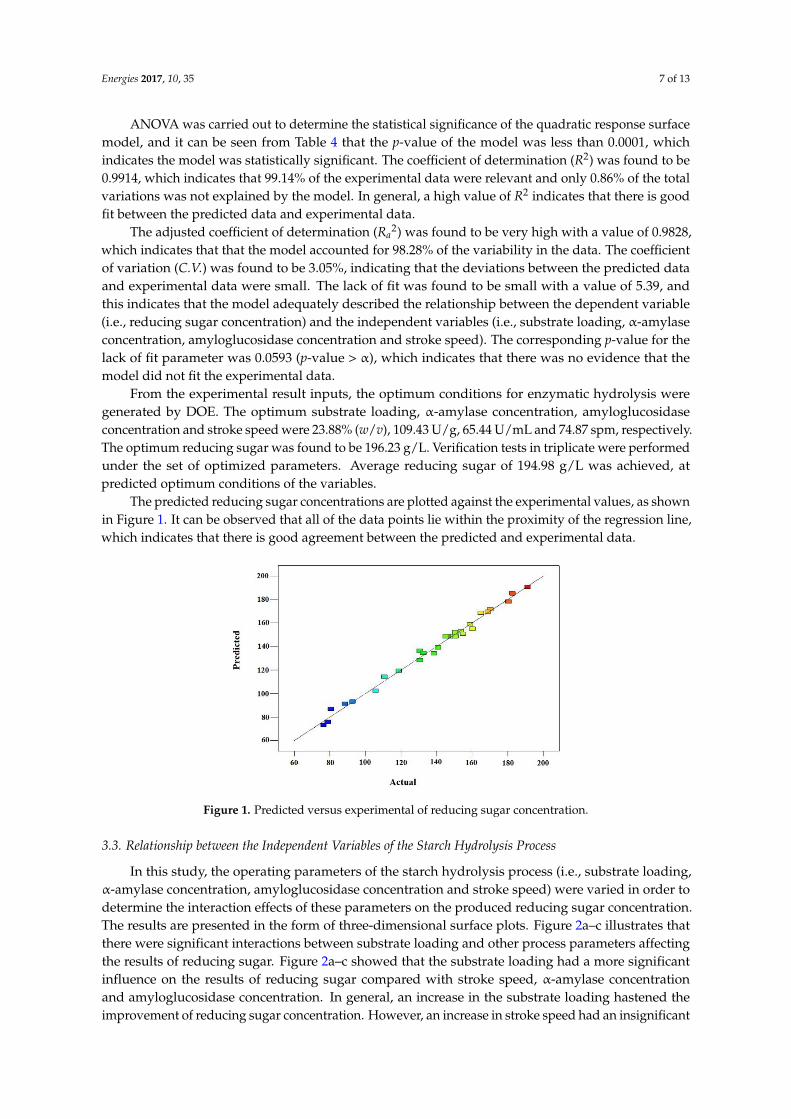
The predicted reducing sugar concentrations are plotted against the experimental values, as shownin Figure 1. It can be observed that all of the data points lie within the proximity of the regression line,which indicates that there is good agreement between the predicted and experimental data.
Energies 2017, 10, 35 7 of 13
which indicates the model was statistically significant. The coefficient of determination (R2) was found to be 0.9914, which indicates that 99.14% of the experimental data were relevant and only 0.86% of the total variations was not explained by the model. In general, a high value of R2 indicates that there is good fit between the predicted data and experimental data.
The adjusted coefficient of determination (Ra2) was found to be very high with a value of 0.9828, which indicates that that the model accounted for 98.28% of the variability in the data. The coefficient of variation (C.V.) was found to be 3.05%, indicating that the deviations between the predicted data and experimental data were small. The lack of fit was found to be small with a value of 5.39, and this indicates that the model adequately described the relationship between the dependent variable (i.e., reducing sugar concentration) and the independent variables (i.e., substrate loading, α-amylase concentration, amyloglucosidase concentration and stroke speed). The corresponding p-value for the lack of fit parameter was 0.0593 (p-value > α), which indicates that there was no evidence that the model did not fit the experimental data.
From the experimental result inputs, the optimum conditions for enzymatic hydrolysis were generated by DOE. The optimum substrate loading, α-amylase concentration, amyloglucosidase concentration and stroke speed were 23.88% (w/v), 109.43 U/g, 65.44 U/mL and 74.87 spm, respectively. The optimum reducing sugar was found to be 196.23 g/L. Verification tests in triplicate were performed under the set of optimized parameters. Average reducing sugar of 194.98 g/L was achieved, at predicted optimum conditions of the variables.
The predicted reducing sugar concentrations are plotted against the experimental values, as shown in Figure 1. It can be observed that all of the data points lie within the proximity of the regression line, which indicates that there is good agreement between the predicted and experimental data.
Figure 1. Predicted versus experimental of reducing sugar concentration.
3.3. Relationship between the Independent Variables of the Starch Hydrolysis Process
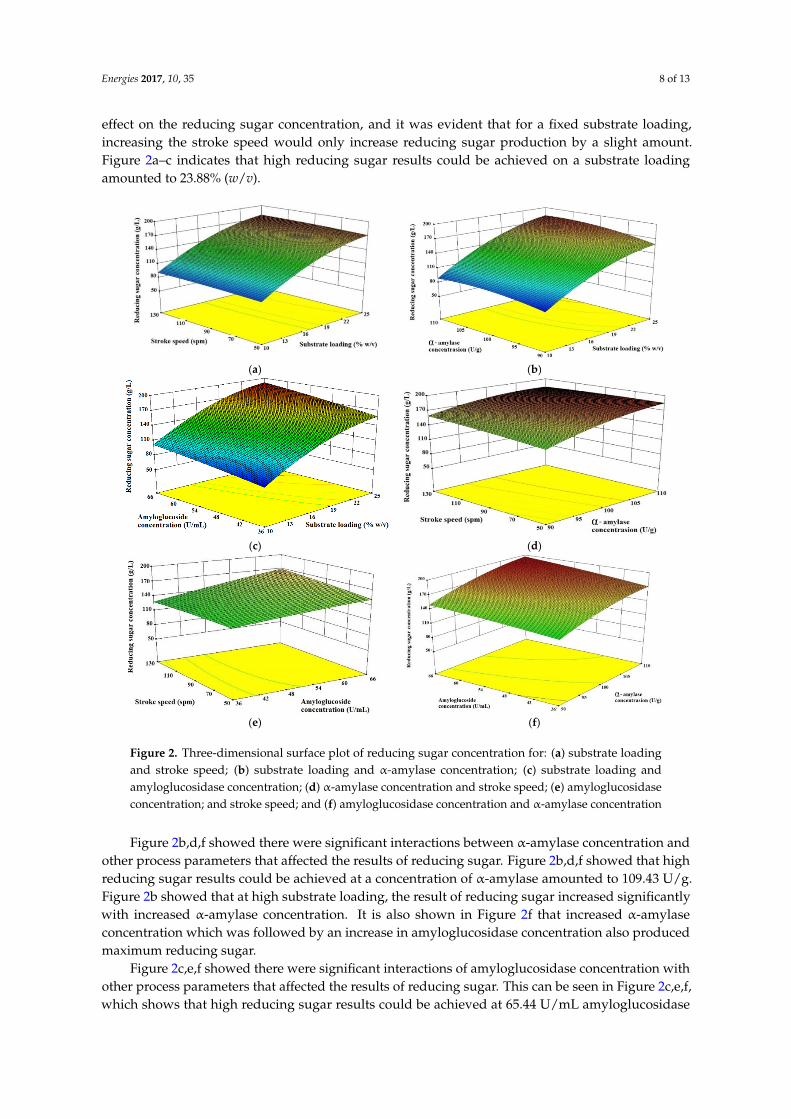
In this study, the operating parameters of the starch hydrolysis process (i.e., substrate loading, α-amylase concentration, amyloglucosidase concentration and stroke speed) were varied in order to determine the interaction effects of these parameters on the produced reducing sugar concentration. The results are presented in the form of three-dimensional surface plots. Figure 2a–c illustrates that there were significant interactions between substrate loading and other process parameters affecting the results of reducing sugar. Figure 2a–c showed that the substrate loading had a more significant influence on the results of reducing sugar compared with stroke speed, α-amylase concentration and amyloglucosidase concentration. In general, an increase in the substrate loading hastened the improvement of reducing sugar concentration. However, an increase in stroke speed had an insignificant effect on the reducing sugar concentration, and it was evident that for a fixed substrate loading, increasing the stroke speed would only increase reducing sugar production by a slight amount. Figure 2a–c indicates that high reducing sugar results could be achieved on a substrate loading amounted to 23.88% (w/v).
Figure 1. Predicted versus experimental of reducing sugar concentration.
3.3. Relationship between the Independent Variables of the Starch Hydrolysis Process
In this study, the operating parameters of the starch hydrolysis process (i.e., substrate loading,α-amylase concentration, amyloglucosidase concentration and stroke speed) were varied in order todetermine the interaction effects of these parameters on the produced reducing sugar concentration.The results are presented in the form of three-dimensional surface plots. Figure 2a–c illustrates thatthere were significant interactions between substrate loading and other process parameters affectingthe results of reducing sugar. Figure 2a–c showed that the substrate loading had a more significantinfluence on the results of reducing sugar compared with stroke speed, α-amylase concentrationand amyloglucosidase concentration. In general, an increase in the substrate loading hastened theimprovement of reducing sugar concentration. However, an increase in stroke speed had an insignificant
Energies 2017, 10, 35 8 of 13
effect on the reducing sugar concentration, and it was evident that for a fixed substrate loading,increasing the stroke speed would only increase reducing sugar production by a slight amount.Figure 2a–c indicates that high reducing sugar results could be achieved on a substrate loadingamounted to 23.88% (w/v).Energies 2017, 10, 35 8 of 13
(a) (b)
(c) (d)
(e) (f)
Figure 2. Three-dimensional surface plot of reducing sugar concentration for: (a) substrate loading and stroke speed; (b) substrate loading and α-amylase concentration; (c) substrate loading and amyloglucosidase concentration; (d) α-amylase concentration and stroke speed; (e) amyloglucosidase concentration; and stroke speed; and (f) amyloglucosidase concentration and α-amylase concentration
Figure 2b,d,f showed there were significant interactions between α-amylase concentration and other process parameters that affected the results of reducing sugar. Figure 2b,d,f showed that high reducing sugar results could be achieved at a concentration of α-amylase amounted to 109.43 U/g. Figure 2b showed that at high substrate loading, the result of reducing sugar increased significantly with increased α-amylase concentration. It is also shown in Figure 2f that increased α-amylase concentration which was followed by an increase in amyloglucosidase concentration also produced maximum reducing sugar.
Figure 2c,e,f showed there were significant interactions of amyloglucosidase concentration with other process parameters that affected the results of reducing sugar. This can be seen in Figure 2c,e,f, which shows that high reducing sugar results could be achieved at 65.44 U/mL amyloglucosidase concentration. However, in Figure 2e showed that the increase in stroke speed did not have a significant impact on increasing the reducing sugar.
The hydrolysis process (liquefaction and saccharification) for M. glaziovii starch is a process for converting starch molecules into reducing sugar that is carried out by the enzyme α-amylse and amyloglucosidase. Figure 2b,c shows reducing sugar levels rise with increasing concentration of the enzyme α-amylse and amyloglucosidase used in the hydrolysis process. This is due to the enzyme α-
Figure 2. Three-dimensional surface plot of reducing sugar concentration for: (a) substrate loadingand stroke speed; (b) substrate loading and α-amylase concentration; (c) substrate loading andamyloglucosidase concentration; (d) α-amylase concentration and stroke speed; (e) amyloglucosidaseconcentration; and stroke speed; and (f) amyloglucosidase concentration and α-amylase concentration
Figure 2b,d,f showed there were significant interactions between α-amylase concentration andother process parameters that affected the results of reducing sugar. Figure 2b,d,f showed that highreducing sugar results could be achieved at a concentration of α-amylase amounted to 109.43 U/g.Figure 2b showed that at high substrate loading, the result of reducing sugar increased significantlywith increased α-amylase concentration. It is also shown in Figure 2f that increased α-amylaseconcentration which was followed by an increase in amyloglucosidase concentration also producedmaximum reducing sugar.
Figure 2c,e,f showed there were significant interactions of amyloglucosidase concentration withother process parameters that affected the results of reducing sugar. This can be seen in Figure 2c,e,f,which shows that high reducing sugar results could be achieved at 65.44 U/mL amyloglucosidase
Energies 2017, 10, 35 9 of 13
concentration. However, in Figure 2e showed that the increase in stroke speed did not have a significantimpact on increasing the reducing sugar.
The hydrolysis process (liquefaction and saccharification) for M. glaziovii starch is a process forconverting starch molecules into reducing sugar that is carried out by the enzyme α-amylse andamyloglucosidase. Figure 2b,c shows reducing sugar levels rise with increasing concentration of theenzyme α-amylse and amyloglucosidase used in the hydrolysis process. This is due to the enzymeα-amylse and amyloglucosidase hydrolyzing α-1,4-glucoside and α-1,6-glucoside producing reducingsugar. From Figure 2a–f, the maximum concentration reducing sugar produced was 196.23 g/L (82%)when the substrate loading, α-amylase, amyloglucosidase concentration and stroke speed were 23.88%(w/v), 109.43 U/g, 65.44 U/mL and 74.87 spm, respectively. The results of reducing in this study aresimilar to a study by Naguleswaran et al. [25], with corn and triticale (80.8%–84.5%) as a feedstock,but slightly lower than that of wheat (90.8%–95.1%). Gumienna et al. [22] also conduct the enzymehydrolysis for corn starch and obtained reducing sugar of 11.7 g/L (69.40%). Moreover, Tasic et al. [24]performed acid hydrolysis on potato and produced a 114 g/L (64%) concentration of reducing sugar.It was showed that optimization of hydrolysis improved the reducing sugar and increased ethanol yield.
3.4. Ethanol Production from Manihot glaziovii
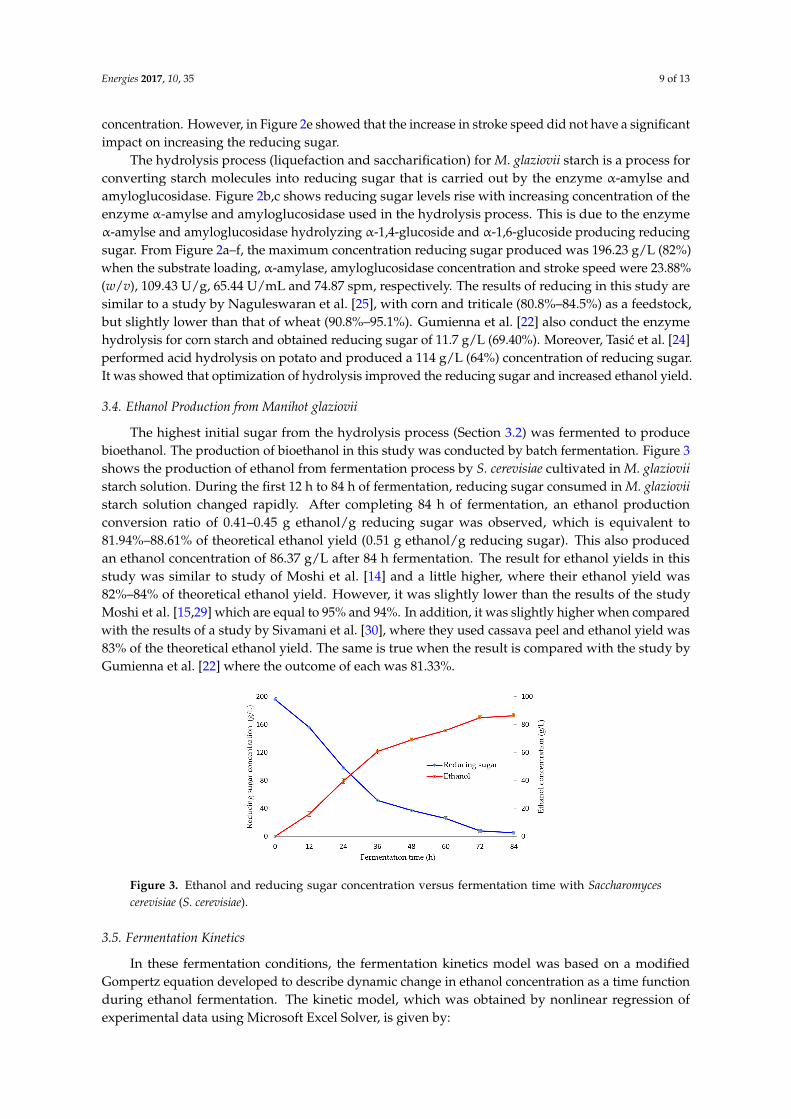
The highest initial sugar from the hydrolysis process (Section 3.2) was fermented to producebioethanol. The production of bioethanol in this study was conducted by batch fermentation. Figure 3shows the production of ethanol from fermentation process by S. cerevisiae cultivated in M. glazioviistarch solution. During the first 12 h to 84 h of fermentation, reducing sugar consumed in M. glazioviistarch solution changed rapidly. After completing 84 h of fermentation, an ethanol productionconversion ratio of 0.41–0.45 g ethanol/g reducing sugar was observed, which is equivalent to81.94%–88.61% of theoretical ethanol yield (0.51 g ethanol/g reducing sugar). This also producedan ethanol concentration of 86.37 g/L after 84 h fermentation. The result for ethanol yields in thisstudy was similar to study of Moshi et al. [14] and a little higher, where their ethanol yield was82%–84% of theoretical ethanol yield. However, it was slightly lower than the results of the studyMoshi et al. [15,29] which are equal to 95% and 94%. In addition, it was slightly higher when comparedwith the results of a study by Sivamani et al. [30], where they used cassava peel and ethanol yield was83% of the theoretical ethanol yield. The same is true when the result is compared with the study byGumienna et al. [22] where the outcome of each was 81.33%.
Energies 2017, 10, 35 9 of 13
amylse and amyloglucosidase hydrolyzing α-1,4-glucoside and α-1,6-glucoside producing reducing sugar. From Figure 2a–f, the maximum concentration reducing sugar produced was 196.23 g/L (82%) when the substrate loading, α-amylase, amyloglucosidase concentration and stroke speed were 23.88% (w/v), 109.43 U/g, 65.44 U/mL and 74.87 spm, respectively. The results of reducing in this study are similar to a study by Naguleswaran et al. [25], with corn and triticale (80.8%–84.5%) as a feedstock, but slightly lower than that of wheat (90.8%–95.1%). Gumienna et al. [22] also conduct the enzyme hydrolysis for corn starch and obtained reducing sugar of 11.7 g/L (69.40%). Moreover, Tasić et al. [24] performed acid hydrolysis on potato and produced a 114 g/L (64%) concentration of reducing sugar. It was showed that optimization of hydrolysis improved the reducing sugar and increased ethanol yield.
3.4. Ethanol Production from Manihot Glaziovii
The highest initial sugar from the hydrolysis process (Section 3.2) was fermented to produce bioethanol. The production of bioethanol in this study was conducted by batch fermentation. Figure 3 shows the production of ethanol from fermentation process by S. cerevisiae cultivated in M. glaziovii starch solution. During the first 12 h to 84 h of fermentation, reducing sugar consumed in M. glaziovii starch solution changed rapidly. After completing 84 h of fermentation, an ethanol production conversion ratio of 0.41–0.45 g ethanol/g reducing sugar was observed, which is equivalent to 81.94%–88.61% of theoretical ethanol yield (0.51 g ethanol/g reducing sugar). This also produced an ethanol concentration of 86.37 g/L after 84 h fermentation. The result for ethanol yields in this study was similar to study of Moshi et al. [14] and a little higher, where their ethanol yield was 82%–84% of theoretical ethanol yield. However, it was slightly lower than the results of the study Moshi et al. [15,29] which are equal to 95% and 94%. In addition, it was slightly higher when compared with the results of a study by Sivamani et al. [30], where they used cassava peel and ethanol yield was 83% of the theoretical ethanol yield. The same is true when the result is compared with the study by Gumienna et al. [22] where the outcome of each was 81.33%.
Figure 3. Ethanol and reducing sugar concentration versus fermentation time with Saccharomyces cerevisiae (S. cerevisiae).
3.5. Fermentation Kinetics
In these fermentation conditions, the fermentation kinetics model was based on a modified Gompertz equation developed to describe dynamic change in ethanol concentration as a time function during ethanol fermentation. The kinetic model, which was obtained by nonlinear regression of experimental data using Microsoft Excel Solver, is given by:
Ce=87.47 × exp − exp1.84 × exp 1
87.47 × 2.94− t + 1 (4)
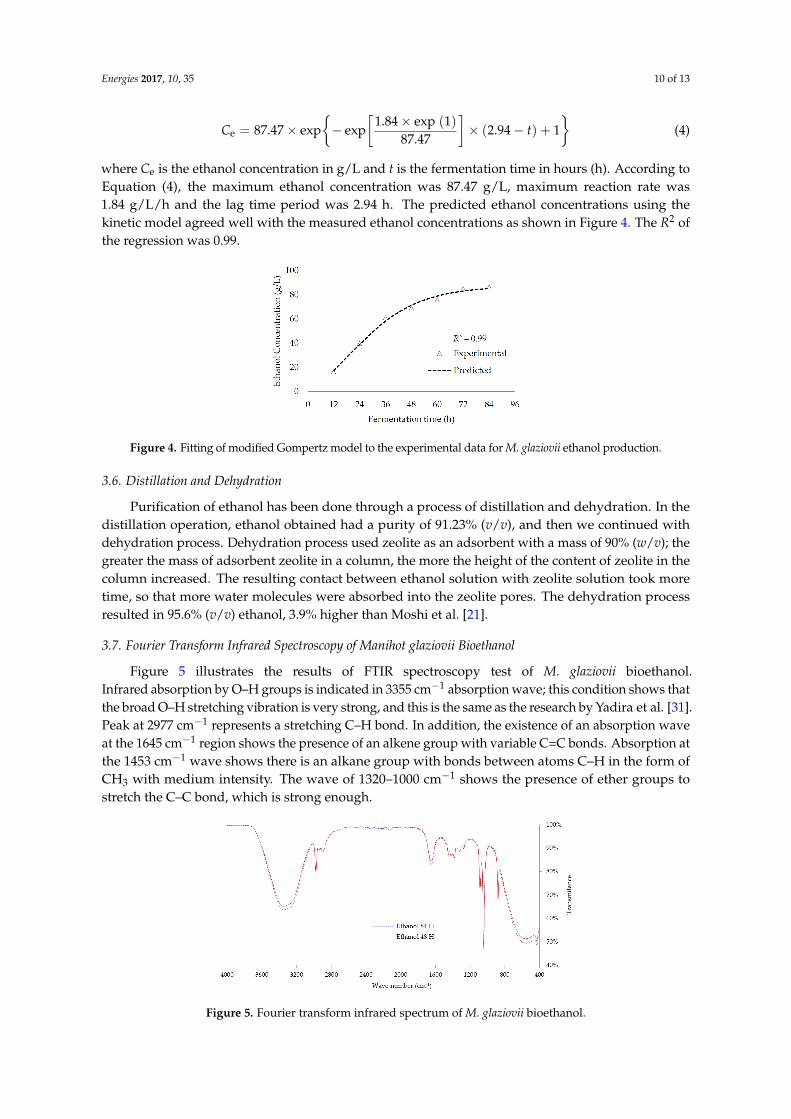
where Ce is the ethanol concentration in g/L and t is the fermentation time in hours (h). According to Equation (4), the maximum ethanol concentration was 87.47 g/L, maximum reaction rate was 1.84 g/L/h and the lag time period was 2.94 h. The predicted ethanol concentrations using the kinetic
Figure 3. Ethanol and reducing sugar concentration versus fermentation time with Saccharomycescerevisiae (S. cerevisiae).
3.5. Fermentation Kinetics
In these fermentation conditions, the fermentation kinetics model was based on a modifiedGompertz equation developed to describe dynamic change in ethanol concentration as a time functionduring ethanol fermentation. The kinetic model, which was obtained by nonlinear regression ofexperimental data using Microsoft Excel Solver, is given by:
Energies 2017, 10, 35 10 of 13
Ce = 87.47 × exp{− exp
[1.84 × exp (1)
87.47
]× (2.94 − t) + 1
}(4)
where Ce is the ethanol concentration in g/L and t is the fermentation time in hours (h). According toEquation (4), the maximum ethanol concentration was 87.47 g/L, maximum reaction rate was1.84 g/L/h and the lag time period was 2.94 h. The predicted ethanol concentrations using thekinetic model agreed well with the measured ethanol concentrations as shown in Figure 4. The R2 ofthe regression was 0.99.
Energies 2017, 10, 35 10 of 13
model agreed well with the measured ethanol concentrations as shown in Figure 4. The R2 of the regression was 0.99.
Figure 4. Fitting of modified Gompertz model to the experimental data for M. glaziovii ethanol production.
3.6. Distillation and Dehydration
Purification of ethanol has been done through a process of distillation and dehydration. In the distillation operation, ethanol obtained had a purity of 91.23% (v/v), and then we continued with dehydration process. Dehydration process used zeolite as an adsorbent with a mass of 90% (w/v); the greater the mass of adsorbent zeolite in a column, the more the height of the content of zeolite in the column increased. The resulting contact between ethanol solution with zeolite solution took more time, so that more water molecules were absorbed into the zeolite pores. The dehydration process resulted in 95.6% (v/v) ethanol, 3.9% higher than Moshi et al. [21].
3.7. Fourier Transform Infrared Spectroscopy of Manihot glaziovii Bioethanol
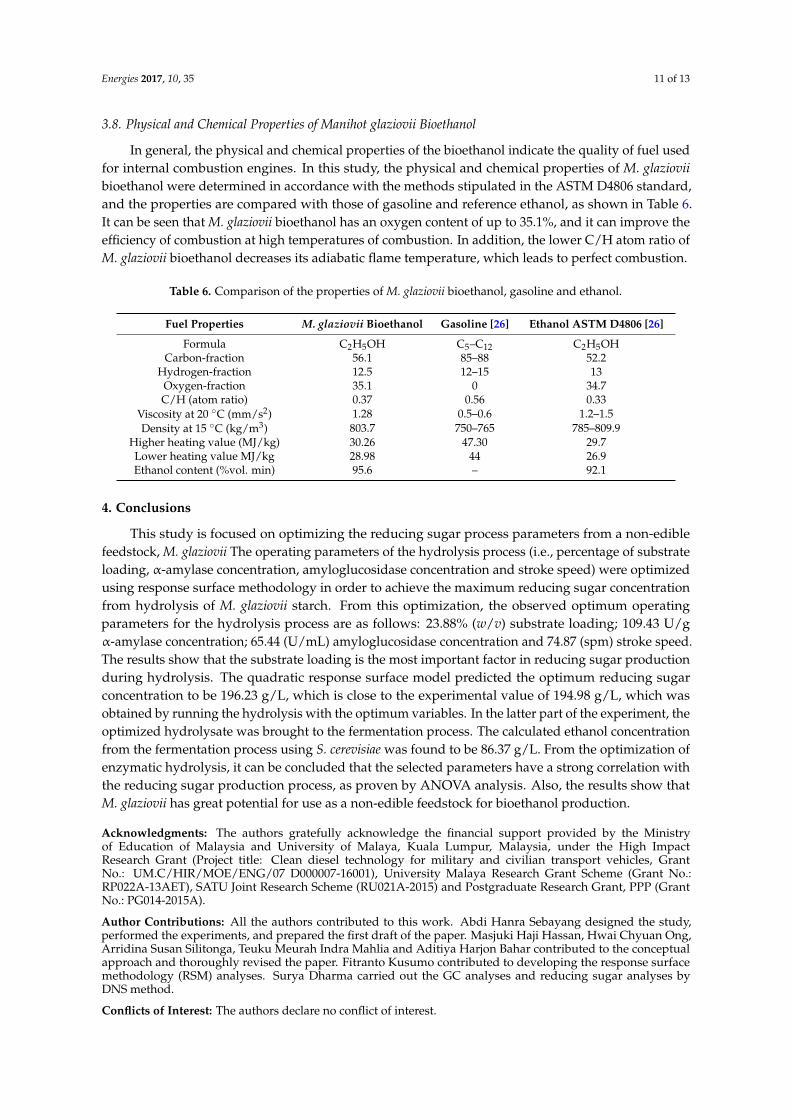
Figure 5 illustrates the results of FTIR spectroscopy test of M. glaziovii bioethanol. Infrared absorption by O–H groups is indicated in 3355 cm−1 absorption wave; this condition shows that the broad O–H stretching vibration is very strong, and this is the same as the research by Yadira et al. [31]. Peak at 2977 cm−1 represents a stretching C–H bond. In addition, the existence of an absorption wave at the 1645 cm−1 region shows the presence of an alkene group with variable C=C bonds. Absorption at the 1453 cm−1 wave shows there is an alkane group with bonds between atoms C–H in the form of CH3 with medium intensity. The wave of 1320–1000 cm−1 shows the presence of ether groups to stretch the C–C bond, which is strong enough.
Figure 5. Fourier transform infrared spectrum of M. glaziovii bioethanol.
3.8. Physical and Chemical Properties of Manihot Glaziovii Bioethanol
In general, the physical and chemical properties of the bioethanol indicate the quality of fuel used for internal combustion engines. In this study, the physical and chemical properties of M.
Figure 4. Fitting of modified Gompertz model to the experimental data for M. glaziovii ethanol production.
3.6. Distillation and Dehydration
Purification of ethanol has been done through a process of distillation and dehydration. In thedistillation operation, ethanol obtained had a purity of 91.23% (v/v), and then we continued withdehydration process. Dehydration process used zeolite as an adsorbent with a mass of 90% (w/v); thegreater the mass of adsorbent zeolite in a column, the more the height of the content of zeolite in thecolumn increased. The resulting contact between ethanol solution with zeolite solution took moretime, so that more water molecules were absorbed into the zeolite pores. The dehydration processresulted in 95.6% (v/v) ethanol, 3.9% higher than Moshi et al. [21].
3.7. Fourier Transform Infrared Spectroscopy of Manihot glaziovii Bioethanol
Figure 5 illustrates the results of FTIR spectroscopy test of M. glaziovii bioethanol.Infrared absorption by O–H groups is indicated in 3355 cm−1 absorption wave; this condition shows thatthe broad O–H stretching vibration is very strong, and this is the same as the research by Yadira et al. [31].Peak at 2977 cm−1 represents a stretching C–H bond. In addition, the existence of an absorption waveat the 1645 cm−1 region shows the presence of an alkene group with variable C=C bonds. Absorption atthe 1453 cm−1 wave shows there is an alkane group with bonds between atoms C–H in the form ofCH3 with medium intensity. The wave of 1320–1000 cm−1 shows the presence of ether groups tostretch the C–C bond, which is strong enough.
Energies 2017, 10, 35 10 of 13
model agreed well with the measured ethanol concentrations as shown in Figure 4. The R2 of the regression was 0.99.
Figure 4. Fitting of modified Gompertz model to the experimental data for M. glaziovii ethanol production.
3.6. Distillation and Dehydration
Purification of ethanol has been done through a process of distillation and dehydration. In the distillation operation, ethanol obtained had a purity of 91.23% (v/v), and then we continued with dehydration process. Dehydration process used zeolite as an adsorbent with a mass of 90% (w/v); the greater the mass of adsorbent zeolite in a column, the more the height of the content of zeolite in the column increased. The resulting contact between ethanol solution with zeolite solution took more time, so that more water molecules were absorbed into the zeolite pores. The dehydration process resulted in 95.6% (v/v) ethanol, 3.9% higher than Moshi et al. [21].
3.7. Fourier Transform Infrared Spectroscopy of Manihot glaziovii Bioethanol
Figure 5 illustrates the results of FTIR spectroscopy test of M. glaziovii bioethanol. Infrared absorption by O–H groups is indicated in 3355 cm−1 absorption wave; this condition shows that the broad O–H stretching vibration is very strong, and this is the same as the research by Yadira et al. [31]. Peak at 2977 cm−1 represents a stretching C–H bond. In addition, the existence of an absorption wave at the 1645 cm−1 region shows the presence of an alkene group with variable C=C bonds. Absorption at the 1453 cm−1 wave shows there is an alkane group with bonds between atoms C–H in the form of CH3 with medium intensity. The wave of 1320–1000 cm−1 shows the presence of ether groups to stretch the C–C bond, which is strong enough.
Figure 5. Fourier transform infrared spectrum of M. glaziovii bioethanol.
3.8. Physical and Chemical Properties of Manihot Glaziovii Bioethanol
In general, the physical and chemical properties of the bioethanol indicate the quality of fuel used for internal combustion engines. In this study, the physical and chemical properties of M.
Figure 5. Fourier transform infrared spectrum of M. glaziovii bioethanol.
Energies 2017, 10, 35 11 of 13
3.8. Physical and Chemical Properties of Manihot glaziovii Bioethanol
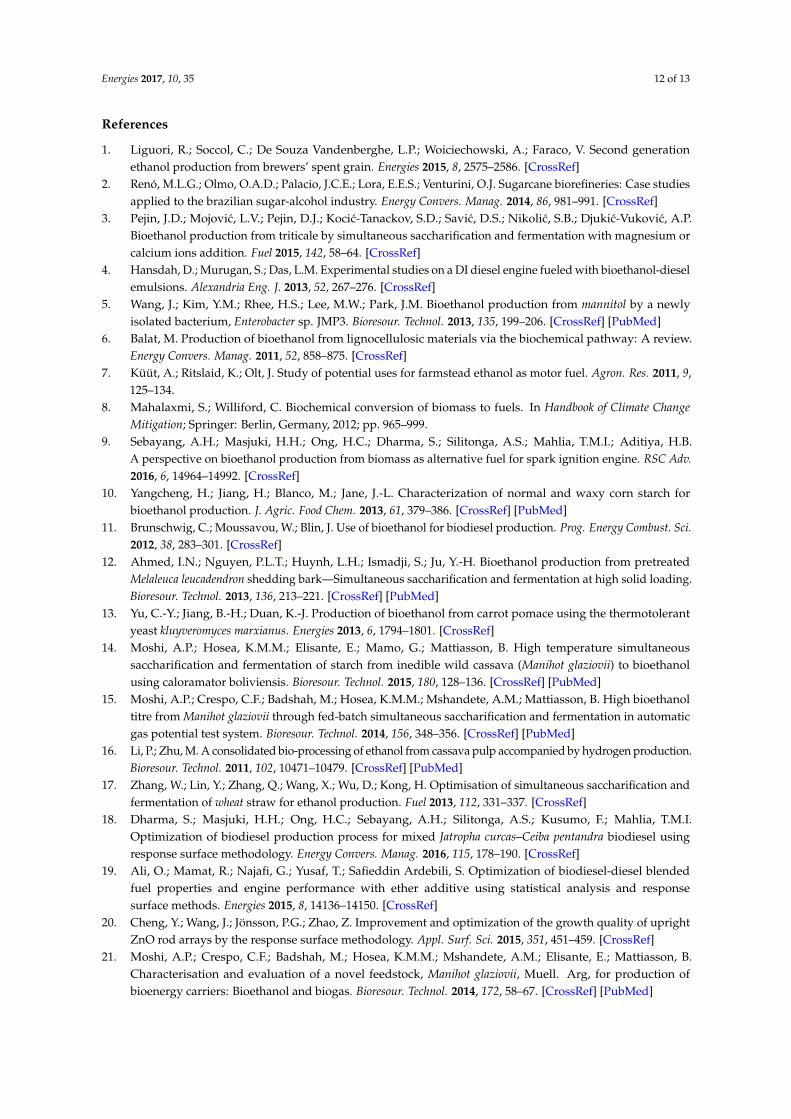
In general, the physical and chemical properties of the bioethanol indicate the quality of fuel usedfor internal combustion engines. In this study, the physical and chemical properties of M. glazioviibioethanol were determined in accordance with the methods stipulated in the ASTM D4806 standard,and the properties are compared with those of gasoline and reference ethanol, as shown in Table 6.It can be seen that M. glaziovii bioethanol has an oxygen content of up to 35.1%, and it can improve theefficiency of combustion at high temperatures of combustion. In addition, the lower C/H atom ratio ofM. glaziovii bioethanol decreases its adiabatic flame temperature, which leads to perfect combustion.
Table 6. Comparison of the properties of M. glaziovii bioethanol, gasoline and ethanol.
Fuel Properties M. glaziovii Bioethanol Gasoline [26] Ethanol ASTM D4806 [26]
Formula C2H5OH C5–C12 C2H5OHCarbon-fraction 56.1 85–88 52.2
Hydrogen-fraction 12.5 12–15 13Oxygen-fraction 35.1 0 34.7C/H (atom ratio) 0.37 0.56 0.33
Viscosity at 20 ◦C (mm/s2) 1.28 0.5–0.6 1.2–1.5Density at 15 ◦C (kg/m3) 803.7 750–765 785–809.9
Higher heating value (MJ/kg) 30.26 47.30 29.7Lower heating value MJ/kg 28.98 44 26.9Ethanol content (%vol. min) 95.6 – 92.1
4. Conclusions
This study is focused on optimizing the reducing sugar process parameters from a non-ediblefeedstock, M. glaziovii The operating parameters of the hydrolysis process (i.e., percentage of substrateloading, α-amylase concentration, amyloglucosidase concentration and stroke speed) were optimizedusing response surface methodology in order to achieve the maximum reducing sugar concentrationfrom hydrolysis of M. glaziovii starch. From this optimization, the observed optimum operatingparameters for the hydrolysis process are as follows: 23.88% (w/v) substrate loading; 109.43 U/gα-amylase concentration; 65.44 (U/mL) amyloglucosidase concentration and 74.87 (spm) stroke speed.The results show that the substrate loading is the most important factor in reducing sugar productionduring hydrolysis. The quadratic response surface model predicted the optimum reducing sugarconcentration to be 196.23 g/L, which is close to the experimental value of 194.98 g/L, which wasobtained by running the hydrolysis with the optimum variables. In the latter part of the experiment, theoptimized hydrolysate was brought to the fermentation process. The calculated ethanol concentrationfrom the fermentation process using S. cerevisiae was found to be 86.37 g/L. From the optimization ofenzymatic hydrolysis, it can be concluded that the selected parameters have a strong correlation withthe reducing sugar production process, as proven by ANOVA analysis. Also, the results show thatM. glaziovii has great potential for use as a non-edible feedstock for bioethanol production.
Acknowledgments: The authors gratefully acknowledge the financial support provided by the Ministryof Education of Malaysia and University of Malaya, Kuala Lumpur, Malaysia, under the High ImpactResearch Grant (Project title: Clean diesel technology for military and civilian transport vehicles, GrantNo.: UM.C/HIR/MOE/ENG/07 D000007-16001), University Malaya Research Grant Scheme (Grant No.:RP022A-13AET), SATU Joint Research Scheme (RU021A-2015) and Postgraduate Research Grant, PPP (GrantNo.: PG014-2015A).
Author Contributions: All the authors contributed to this work. Abdi Hanra Sebayang designed the study,performed the experiments, and prepared the first draft of the paper. Masjuki Haji Hassan, Hwai Chyuan Ong,Arridina Susan Silitonga, Teuku Meurah Indra Mahlia and Aditiya Harjon Bahar contributed to the conceptualapproach and thoroughly revised the paper. Fitranto Kusumo contributed to developing the response surfacemethodology (RSM) analyses. Surya Dharma carried out the GC analyses and reducing sugar analyses byDNS method.
Conflicts of Interest: The authors declare no conflict of interest.
Energies 2017, 10, 35 12 of 13
References
1. Liguori, R.; Soccol, C.; De Souza Vandenberghe, L.P.; Woiciechowski, A.; Faraco, V. Second generationethanol production from brewers’ spent grain. Energies 2015, 8, 2575–2586. [CrossRef]
2. Renó, M.L.G.; Olmo, O.A.D.; Palacio, J.C.E.; Lora, E.E.S.; Venturini, O.J. Sugarcane biorefineries: Case studiesapplied to the brazilian sugar-alcohol industry. Energy Convers. Manag. 2014, 86, 981–991. [CrossRef]
3. Pejin, J.D.; Mojovic, L.V.; Pejin, D.J.; Kocic-Tanackov, S.D.; Savic, D.S.; Nikolic, S.B.; Djukic-Vukovic, A.P.Bioethanol production from triticale by simultaneous saccharification and fermentation with magnesium orcalcium ions addition. Fuel 2015, 142, 58–64. [CrossRef]
4. Hansdah, D.; Murugan, S.; Das, L.M. Experimental studies on a DI diesel engine fueled with bioethanol-dieselemulsions. Alexandria Eng. J. 2013, 52, 267–276. [CrossRef]
5. Wang, J.; Kim, Y.M.; Rhee, H.S.; Lee, M.W.; Park, J.M. Bioethanol production from mannitol by a newlyisolated bacterium, Enterobacter sp. JMP3. Bioresour. Technol. 2013, 135, 199–206. [CrossRef] [PubMed]
6. Balat, M. Production of bioethanol from lignocellulosic materials via the biochemical pathway: A review.Energy Convers. Manag. 2011, 52, 858–875. [CrossRef]
7. Küüt, A.; Ritslaid, K.; Olt, J. Study of potential uses for farmstead ethanol as motor fuel. Agron. Res. 2011, 9,125–134.
8. Mahalaxmi, S.; Williford, C. Biochemical conversion of biomass to fuels. In Handbook of Climate ChangeMitigation; Springer: Berlin, Germany, 2012; pp. 965–999.
9. Sebayang, A.H.; Masjuki, H.H.; Ong, H.C.; Dharma, S.; Silitonga, A.S.; Mahlia, T.M.I.; Aditiya, H.B.A perspective on bioethanol production from biomass as alternative fuel for spark ignition engine. RSC Adv.2016, 6, 14964–14992. [CrossRef]
10. Yangcheng, H.; Jiang, H.; Blanco, M.; Jane, J.-L. Characterization of normal and waxy corn starch forbioethanol production. J. Agric. Food Chem. 2013, 61, 379–386. [CrossRef] [PubMed]
11. Brunschwig, C.; Moussavou, W.; Blin, J. Use of bioethanol for biodiesel production. Prog. Energy Combust. Sci.2012, 38, 283–301. [CrossRef]
12. Ahmed, I.N.; Nguyen, P.L.T.; Huynh, L.H.; Ismadji, S.; Ju, Y.-H. Bioethanol production from pretreatedMelaleuca leucadendron shedding bark—Simultaneous saccharification and fermentation at high solid loading.Bioresour. Technol. 2013, 136, 213–221. [CrossRef] [PubMed]
13. Yu, C.-Y.; Jiang, B.-H.; Duan, K.-J. Production of bioethanol from carrot pomace using the thermotolerantyeast kluyveromyces marxianus. Energies 2013, 6, 1794–1801. [CrossRef]
14. Moshi, A.P.; Hosea, K.M.M.; Elisante, E.; Mamo, G.; Mattiasson, B. High temperature simultaneoussaccharification and fermentation of starch from inedible wild cassava (Manihot glaziovii) to bioethanolusing caloramator boliviensis. Bioresour. Technol. 2015, 180, 128–136. [CrossRef] [PubMed]
15. Moshi, A.P.; Crespo, C.F.; Badshah, M.; Hosea, K.M.M.; Mshandete, A.M.; Mattiasson, B. High bioethanoltitre from Manihot glaziovii through fed-batch simultaneous saccharification and fermentation in automaticgas potential test system. Bioresour. Technol. 2014, 156, 348–356. [CrossRef] [PubMed]
16. Li, P.; Zhu, M. A consolidated bio-processing of ethanol from cassava pulp accompanied by hydrogen production.Bioresour. Technol. 2011, 102, 10471–10479. [CrossRef] [PubMed]
17. Zhang, W.; Lin, Y.; Zhang, Q.; Wang, X.; Wu, D.; Kong, H. Optimisation of simultaneous saccharification andfermentation of wheat straw for ethanol production. Fuel 2013, 112, 331–337. [CrossRef]
18. Dharma, S.; Masjuki, H.H.; Ong, H.C.; Sebayang, A.H.; Silitonga, A.S.; Kusumo, F.; Mahlia, T.M.I.Optimization of biodiesel production process for mixed Jatropha curcas–Ceiba pentandra biodiesel usingresponse surface methodology. Energy Convers. Manag. 2016, 115, 178–190. [CrossRef]
19. Ali, O.; Mamat, R.; Najafi, G.; Yusaf, T.; Safieddin Ardebili, S. Optimization of biodiesel-diesel blendedfuel properties and engine performance with ether additive using statistical analysis and responsesurface methods. Energies 2015, 8, 14136–14150. [CrossRef]
20. Cheng, Y.; Wang, J.; Jönsson, P.G.; Zhao, Z. Improvement and optimization of the growth quality of uprightZnO rod arrays by the response surface methodology. Appl. Surf. Sci. 2015, 351, 451–459. [CrossRef]
21. Moshi, A.P.; Crespo, C.F.; Badshah, M.; Hosea, K.M.M.; Mshandete, A.M.; Elisante, E.; Mattiasson, B.Characterisation and evaluation of a novel feedstock, Manihot glaziovii, Muell. Arg, for production ofbioenergy carriers: Bioethanol and biogas. Bioresour. Technol. 2014, 172, 58–67. [CrossRef] [PubMed]
Energies 2017, 10, 35 13 of 13
22. Gumienna, M.; Szwengiel, A.; Lasik, M.; Szambelan, K.; Majchrzycki, D.; Adamczyk, J.; Nowak, J.;Czarnecki, Z. Effect of corn grain variety on the bioethanol production efficiency. Fuel 2016, 164, 386–392.[CrossRef]
23. Meinita, M.D.N.; Marhaeni, B.; Winanto, T.; Setyaningsih, D.; Hong, Y.-K. Catalytic efficiency of sulfuricand hydrochloric acids for the hydrolysis of Gelidium latifolium (Gelidiales, Rhodophyta) in bioethanolproduction. J. Ind. Eng. Chem. 2015, 27, 108–114. [CrossRef]
24. Tasic, M.B.; Konstantinovic, B.V.; Lazic, M.L.; Veljkovic, V.B. The acid hydrolysis of potato tuber mash inbioethanol production. Biochem. Eng. J. 2009, 43, 208–211. [CrossRef]
25. Naguleswaran, S.; Li, J.; Vasanthan, T.; Bressler, D.; Hoover, R. Amylolysis of large and small granules ofnative triticale, wheat and corn starches using a mixture of α-amylase and glucoamylase. Carbohydr. Polym.2012, 88, 864–874. [CrossRef]
26. Masum, B.M.; Masjuki, H.H.; Kalam, M.A.; Rizwanul Fattah, I.M.; Palash, S.M.; Abedin, M.J. Effect ofethanol-gasoline blend on NOx emission in SI engine. Renew. Sustain. Energy Rev. 2013, 24, 209–222. [CrossRef]
27. Miller, G.L. Use of dinitrosalicylic acid reagent for determination of reducing sugar. Anal. Chem. 1959, 31,426–428. [CrossRef]
28. Dodic, J.M.; Vucurovic, D.G.; Dodic, S.N.; Grahovac, J.A.; Popov, S.D.; Nedeljkovic, N.M. Kinetic modellingof batch ethanol production from sugar beet raw juice. Appl. Energy 2012, 99, 192–197. [CrossRef]
29. Moshi, A.P.; Temu, S.G.; Nges, I.A.; Malmo, G.; Hosea, K.M.M.; Elisante, E.; Mattiasson, B. Combinedproduction of bioethanol and biogas from peels of wild cassava Manihot glaziovii. Chem. Eng. J. 2015, 279,297–306. [CrossRef]
30. Sivamani, S.; Baskar, R. Optimization of bioethanol production from cassava peel using statisticalexperimental design. Environ. Prog. Sustain. Energy 2015, 34, 567–574. [CrossRef]
31. Yadira, P.-S.B.; Sergio, S.-T.; Fernando, S.E.L.; Sebastian, P.J.; Eapen, D. Bioethanol production fromcoffee mucilage. Energy Procedia 2014, 57, 950–956. [CrossRef]
© 2017 by the authors; licensee MDPI, Basel, Switzerland. This article is an open accessarticle distributed under the terms and conditions of the Creative Commons Attribution(CC-BY) license (http://creativecommons.org/licenses/by/4.0/).