optimal design of distillation systems with less than n−1 columns for a class of four component...
TRANSCRIPT
This article appeared in a journal published by Elsevier. The attachedcopy is furnished to the author for internal non-commercial researchand education use, including for instruction at the authors institution
and sharing with colleagues.
Other uses, including reproduction and distribution, or selling orlicensing copies, or posting to personal, institutional or third party
websites are prohibited.
In most cases authors are permitted to post their version of thearticle (e.g. in Word or Tex form) to their personal website orinstitutional repository. Authors requiring further information
regarding Elsevier’s archiving and manuscript policies areencouraged to visit:
http://www.elsevier.com/copyright

Author's personal copychemical engineering research and design 9 0 ( 2 0 1 2 ) 1425–1447
Contents lists available at SciVerse ScienceDirect
Chemical Engineering Research and Design
j ourna l ho me page: www.elsev ier .com/ locate /cherd
Optimal design of distillation systems with less than N − 1columns for a class of four component mixtures
Jazmín Cortez-Gonzaleza, Juan Gabriel Segovia-Hernándeza,∗, Salvador Hernándeza,Claudia Gutiérrez-Antoniob, Abel Briones-Ramírezc, Ben-Guang Rongd
a Universidad de Guanajuato, Campus Guanajuato, Departamento de Ingeniería Química, Noria Alta s/n, 36050 Guanajuato,Guanajuato, Mexicob CIATEQ, A.C., Av. del Retablo 150, Col. Fovissste, 76150 Querétaro, Querétaro, Mexicoc Exxerpro Solutions, Av. del Sol 1B Local 4B Plaza Comercial El Sol, Col. El Sol, 76113 Querétaro, Querétaro, Mexicod University of Southern Denmark, Inst. of Chemical Eng., Biotechnology and Environmental Tech. Niels Bohrs Allé 1, DK-5230 Odense M,Denmark
a b s t r a c t
The optimal design of complex distillation systems is a highly non-linear and multivariable problem, with several
local optimums and subject to different constraints. In addition, some attributes for the design of these separation
schemes are often conflicting objectives, and the design problem should be represented from a multiple objective
perspective. As a result, solving with traditional optimization methods is not reliable because they generally converge
to local optimums, and often fail to capture the full Pareto optimal front. In this paper, a method for the multiobjective
optimization of distillation systems, conventional and thermally coupled, with less than N − 1 columns is presented.
We use a multiobjective genetic algorithm with restrictions coupled to AspenONE Aspen Plus; so, the complete
MESH equations and rigorous phase equilibrium calculations are used. Results show some tendencies in the design
of intensified sequences, according to the nature of the mixture and feed compositions.
© 2012 The Institution of Chemical Engineers. Published by Elsevier B.V. All rights reserved.
Keywords: Multicomponent distillation; Multiobjective optimization; Genetic algorithms; Pareto front
1. Introduction
Distillation is a widely used separation process, and, also, avery large consumer of energy. A large amount of researchwork has been done to improve the energy efficiency of dis-tillation systems, in terms of either the design of optimaldistillation schemes or improving internal column efficiency.Nowadays, the optimal design of multicomponent distillationsystems remains one of the most challenging problems inprocess engineering (Kim and Wankat, 2004). The economicimportance of distillation separations has been a driving forcefor the research in synthesis procedures for more than 30years.
For the separation of an N-component mixture into Npure products, as the number of components increases thenumber of possible simple column configurations sharplygrows up. Thereby, the selection of the best configuration for
∗ Corresponding author. Tel.: +52 473 732 0006x8142.E-mail addresses: [email protected], g [email protected] (J.G. Segovia-Hernández).Received 25 June 2011; Received in revised form 6 October 2011; Accepted 7 February 2012
certain mixture was a very large and time consuming prob-lem. This was one main reason that conducts researchers’work in searching general rules, heuristics, able to make a pre-liminary screening to select a lower number of alternativesto analyze. The selected configurations can be subsequentlyanalyzed with a rigorous method to find the best sequence interms of energy requirement (Nath and Motard, 1981; Nadgirand Liu, 1983).
At the moment, most of the studies have been focused oncomplete separation of N component mixtures using N − 1distillation columns, with a reboiler at the bottom and acondenser at the top of each column. Glinos and Malone(1989) show the application of thermodynamic principlesto the synthesis of distillation sequences. While economiccriteria are preferable for synthesis in the general case, thethermodynamic analysis has an advantage when heat inte-gration of the distillation system is planned, or to further
0263-8762/$ – see front matter © 2012 The Institution of Chemical Engineers. Published by Elsevier B.V. All rights reserved.doi:10.1016/j.cherd.2012.02.004
Author's personal copy1426 chemical engineering research and design 9 0 ( 2 0 1 2 ) 1425–1447
Nomenclature
Symbolsb exergy function (Btu/h)[CO2]Emiss carbon dioxide emissions (kg/s)DSC conventional direct sequenceh molar enthalpy (Btu/lb mol)hproc enthalpy of steam delivered to the process
(kJ/kg)n mole flow (lb mol/h)NHV the net heating value of a fuel (kJ/kg)LW the lost work in the system (kJ/kg)�Proc latent heat of steam delivered to the process
(kJ/kg)� the thermodynamic efficiencyQ reboiler heat duty (Btu/h)QFuel amount of fuel burnt (kW)S molar entropy (Btu/lb mol R)TAC total annual cost ($/y)T0 temperature of the surroundings (R)TFTB the flame temperature of the boiler flue gases
(◦C)Ts temperature of the system (R)Wmin minimum work for the separation (Btu/h)WS shaft work (Btu/h)x the number of atoms of carbony the number of atoms of hydrogen
discriminates among configurations having comparable eco-nomic performance. Agrawal (2003) proposed an algorithm tosystematically draw basic configurations by classifying theminto different equivalence classes based primarily on whethercolumn products were made as distillates, side draws oras bottoms. The number of configurations in each of theseequivalence classes (i.e., the cardinality of that class) was eval-uated using symmetry and simple combinatorial methods.The union of all these equivalence classes was called the setof “basic configurations”. A basic configuration may thereforebe defined as a configuration that uses (N − 1) columns to sep-arate an N-component feed into N streams each of which isrich in one of the feed components, where each componentis recovered in only one stream from only one location. Thecharacteristic of this method is that it only generates basicconfigurations. The method was also extended to include cor-responding thermally coupled configurations. On the otherhand, an exhaustive combinatorial search (Rong et al., 2003;Fidkowski, 2006) is more complete. However, it is not compact,as it includes a very large number of configurations that usemore than (N − 1) columns for an N-component feed when nis greater than three. These configurations, which we term“nonbasic” configurations, recover at least one component ormixture in at least two different locations, in such a way thatsections cannot be grouped to make (N − 1) columns. The for-mulation of the search space has not enjoyed as much successin spite of earlier efforts. One reason for this was advancedby Westerberg (2004), that any formal mathematical or logicalformulation of the search space can be developed only afterdrawing some configurations through a process of discovery,or by exploring the combinatorial of the system manually, andperhaps recognizing patterns underlying the space. Hence, ifsome structures are omitted (consciously or otherwise) in thisphase of the work, the resulting formulation may or may not
encompass the omitted structures. (Such incomplete enumer-ation of the search space will of course affect the final designwhether or not a mathematical formulation is used). There-fore, in order to find optimal configurations it is essential thatalong with mathematical optimization methods, proper atten-tion be paid to the search space formulation. Giridhar andAgrawal (2010a,b) focuses on formulating such a search spacefor multicomponent distillation, and describing some desir-able properties of a good such search space. However, the useof less than N − 1 columns for multicomponent distillationprocesses has not been extensively studied (Kim and Wankat,2004; Méndez-Valencia et al., 2008). The problem of analyzingall possible sequences became more complex, when the use ofthe thermal coupling or side stream sequences was proposed(Errico et al., 2009a).
The optimization of a distillation column involves theselection of the configuration and operating conditions tominimize the total investment and operation cost (Yeomansand Grossmann, 2000). The optimization of a complex dis-tillation system is usually characterized as a large problemsize, since the significant number of strongly nonlinear equa-tions results in serious difficulty to solve the model. At themoment, two principal approaches to optimize distillationcolumns sequence have been used: deterministic and stochas-tic.
Deterministic strategies tackled the problem consider-ing the sequence as superstructures solved with MILP andMINLP approaches, considering reduced models (Aggarwaland Floudas, 1990; Andrecovich and Westerberg, 1985; Paulesand Floudas, 1990; Viswanathan and Grossmann, 1993; Novaket al., 1996; Smith and Pantelides, 1995; Papalexandri andPistikopoulos, 1996; Bauer and Stichlmair, 1998; Dunnebierand Pantelides, 1999; Caballero and Grossmann, 1999;Yeomans and Grossmann, 2000). Some of these methods canprovide useful results; however, it would be desirable incor-porate rigorous models in the synthesis procedures, in orderto increase their industrial relevance and scope of applica-tion, particularly for nonideal mixtures. These rigorous MINLPsynthesis models exhibit significant computational difficul-ties, such as the introduction of equations that can becomesingular, the solution of many redundant equations, and therequirement of good initialization points. The high levels ofnonlinearities and nonconvexities in the MESH equations,thermodynamic equilibrium equations, and convergence diffi-culties are common problems. These difficulties translate intohigh computational times and the requirement of good initialguesses and bounds on the variables to achieve convergence.Also, these approaches just deal with one objective, totalannual cost in most of the cases. Although Messac et al. (2003)present good alternatives for the solution of this problem witha multiobjective perspective using non-linear programmingoptimizers, clear limitations in the case of solving bi-objectiveproblems are shown in Martínez et al. (2007).
In general, the optimal design of distillation systems is ahighly non-linear and multiobjective problem, with the pres-ence of both continuous and discontinuous design variables;also, the objective function used as optimization criterion isgenerally non-convex with several local optimums and subjectto several constraints. Thereby, the problem must be tackledwith a multiobjective strategy robust and reliable.
Multiobjective optimization techniques offer advantagesover single-objective optimization techniques, because theycan provide a solution with different trade-offs among dif-ferent individual objectives of the problem; so, the decision
Author's personal copychemical engineering research and design 9 0 ( 2 0 1 2 ) 1425–1447 1427
maker can select the best final solution for his/her particularneeds. The principal advantage of using a multiobjective opti-mization technique is that just one run is required to obtainthe Pareto front (Gutiérrez-Antonio and Briones-Ramírez,2009).
Solving a multiobjective problem is, in general, associatedwith the construction of a Pareto front. Each point of this frontrepresents one solution in the objective function space of themultiobjective problem. Therefore, given any pair of solutionsas vectors of their objective function values, an improvementof one component involves a deterioration of the others. Thus,in the Pareto front there is no point that is better than anotherpoint (non-dominated points), and the rest of the objectivespace points are also dominated by one or more points (dom-inated points). The construction of a Pareto front can bevery complex, depending on the nature of the multiobjectiveproblem to be solved. The presence of multi-modal objec-tive functions and non-convex constraints can complicate thetask of the optimizer. Specifically, the use of optimizers basedon non-linear programming can present problems to deter-mine Pareto fronts, since non-linear programming dependson initial estimations, given its nature as a local optimizerfor non-convex functions. These limitations are even greaterfor three-objective and multi-objective problems in general;therefore more research in that direction could be challenged.
On the other hand, stochastic optimizers deal with multi-modal and non-convex problems in a very effective way tosolve these limitations. Stochastic optimization algorithmsare capable of solving, robustly and efficiently; the challeng-ing multi-modal optimization problem, and they appear tobe a suitable alternative for the design and optimization ofcomplex separation schemes (Martínez-Iranzo et al., 2009).Among stochastic algorithms, genetic algorithms have showntheir merits in large-scale parallelism search, approaching theglobal optimum quickly and steadily. Genetic algorithms area well-established method, which has shown to have goodperformance (although it does not guarantee optimality).
A genetic algorithm is based on mimicking the principlesof genetics, natural selection, and evolution; it allows a popu-lation composed of many individuals to evolve under specifiedselection rules to a state that maximizes the fitness, i.e.,minimizes the cost function (Nguyen and Bagajewicz, 2010).Moreover, genetic algorithms have several features that makethem attractive for solving optimization problems with mod-ular simulators, where the model of each unit is only availablein an implicit form (black-box model). First, due to the fact thatthey are based on a direct search method, it is not necessaryto have explicit information on the mathematical model or itsderivatives. Secondly, the search for the optimal solution is notlimited to one point, but rather relies on several points simul-taneously; therefore the knowledge of initial feasible pointsis not required, and such points do not influence the finalsolution (Teh and Rangaiah, 2003). Also, a major advantage ofgenetic algorithms (GA) over other stochastic techniques is theavailability of several multiobjective techniques such as VEGA,MOGA, NSGA, Niche Pareto GA and NSGA-II (Vázquez-Castilloet al., 2009). Many studies have been carried out applyinggenetic algorithms to design in chemical engineering (Fragaand Matias, 1996; Leboreiro and Acevedo, 2004; Gómez-Castroand Segovia, 2008; Gutiérrez-Antonio and Briones-Ramírez,2009; Miranda-Galindo et al., 2011).
In this work, we implemented a multiobjective geneticalgorithm with constraints to obtain the Pareto front of com-plex distillation sequences. We take an alternative space of 31
arrangements that use less than N − 1 columns, for quaternarydistillations of those reported by Errico et al. (2009a,b). Theoptimal designs of these arrangements are obtained using amultiobjective genetic algorithm with restrictions (Gutiérrez-Antonio and Briones-Ramírez, 2009), which is coupled to theAspenONE Aspen Plus for the rigorous evaluation of the objec-tive and constraint functions. To the best of our knowledge,multiobjective stochastic methods have not been reported foroptimal design of a complete subspace of alternatives withless than N − 1 columns for quaternary distillations. Numeri-cal performance of this strategy has been tested in the designof columns with several mixtures, in order to examine theeffect of the relative volatilities of feed mixtures. Results allowpresenting trends for selecting the best configuration amongthose studied according to the nature of the mixture and feedcomposition.
2. Pareto front and optimization strategy
Decision making in the Chemical Process Industry involvesselecting from a large list of potential solutions. The selec-tion is virtually always based on multiple independent andoften conflicting criteria, including cost, risk, safety, reliabil-ity and environmental impact. As a result, there is seldoma single, numerically optimal, answer. To make an informeddecision, the decision-maker needs to identify the inherenttradeoffs among the various criteria. These trade-offs can berepresented through a Pareto set of options (Deb et al., 2002),wherein no member of the set is strictly better than any othermember of the set. The generation of Pareto sets throughformal, rigorous multi-objective optimization involves thesolution of a combinatorially explosive number of subprob-lems, each one of which may be non-convex and hard to solve(Siirola et al., 2004).
Classically, optimization focuses primarily on problemsthat can be evaluated and ranked based on a single met-ric. Solving such a single-objective optimization probleminvolves identifying the one solution (vector of values forthe problem decision variables) that maps to the best valueof the objective possible, while simultaneously satisfyingall constraints. There exists a plethora of algorithms andapproaches (Edgar et al., 2001) that are effective in solvingsingle objective problems, including gradient based algo-rithms (generalized reduced gradient, sequential quadraticprogramming), stochastic algorithms (simulated annealing,tabu search), and population-based algorithms (genetic algo-rithms). However, many of the problems that are of keyinterest to the design decision maker are evaluated usingmultiple conflicting goals (Papalambros and Wilde, 2000). Thesolution to this class of multiple objective problems cannot berepresented as a single point; rather, it is the set of feasiblepoints that represent the best trade-offs among the variousobjectives. By definition, all members of this set are mathe-matically optimal: none of the set members is better than anyother member in all objectives. It is thus up to the businessdecision maker to apply information external to the problem,and/or based on the unanticipated shape of the tradeoff sur-face to select the final, single solution to implement. Moreformally, multi-objective optimization entails the discovery ofthe Pareto-optimal set of non-dominated solutions.
For problems where the goal is to minimize all objectives,the dominance Pareto relationship (Grosan et al., 2006) isdefined as:
Author's personal copy1428 chemical engineering research and design 9 0 ( 2 0 1 2 ) 1425–1447
Definition 1. (Pareto dominance)Consider a maximization problem. Let z, w be two decisionvectors (solutions) from the definition domain. Solution zdominates w (also written as z � w) if and only if the followingconditions are fulfilled:
fi(z) ≥ fi(w), ∀i = 1, 2, ..., nobj (1)
∃j ∈{
1, 2, ..., nobj}
: fj(z)〉fj(w). (2)
where nobj denotes the number of objectives. That is, a feasiblevector z is Pareto optimal if no feasible vector w can increasesome criterion without causing a simultaneous decrease in atleast one other criterion. The Pareto optimal set is the collec-tion of all points for which there exists no other feasible pointthat dominates it.
For the specific problem of optimization of the arrange-ments with less than N − 1 columns for quaternary distilla-tions, our goal is generated the Pareto front of optimal designs;this set of optimal designs is integrated for all distillationsequences from minimum reflux ratio to minimum numberof stages, and all designs between these extremes. The anal-ysis of the designs that integrated the Pareto front can bringuseful information about some tendencies of these intensifiedsequences. Thereby, obtaining the set of optimal designs of theintensified sequences involves the minimization of heat duty,Qi, and the number of stages in each column of the sequence,Ni, can be formulated as:
Min(Qi, Ni) = f (Qi, Ri, Ni, Nj,i, Ns,i, NF,i, Fj,i)
subject to
yk,PS ≥ xk,PS
(3)
where Ri is the reflux ratio in the column i, Ni is the totalnumber of stages of column i, Nj,i is the stage of the flow ofinterconnection stream j in the column i, Ns,i is side streamstage in column i, NF,i is the feed stage in column i, Fj,i is theflow of interconnection stream j in column i, xk,PS and yk,PS arethe vectors of required and obtained purities of component kin their product stream PS. It is worth to mention that the for-mulation of this minimization problem is general, and it canapply for each sequence studied in this work, just consideringthe variables that are presented in the particular sequence.
Thereby, the variables in competition, Qi and Ni, areinvolved as the objectives in the optimization problem. Also,this minimization takes place considering the fulfilment of theconstraints of the problem, these constraints limit the mini-mization problem: we are looking for all the sequences thatintegrate the Pareto front, which minimizes as the heat dutyas the number of stages in each column of the sequence butsatisfying the purities required in each product stream.
The stochastic strategy implemented was presented previ-ously (Gutiérrez-Antonio and Briones-Ramírez, 2009), and it isbriefly explained next. For further details the reader is referredto the work. The optimization strategy considers the simulta-neous optimization of several objectives subjects to severalconstraints; both constraints and objectives can be as integeras continuous. The strategy conducts the optimization pro-cess, using Aspen Plus for the evaluation of the individuals,distillation sequences, generated as is explained next. Thestochastic strategy needs one individual physically feasible tobegin the optimization process; the meaning of physically fea-sible implies that, for a distillation column, the feed stage must
be minor than the total number of stages, and the reflux ratiois greater than zero. With this initial individual, the geneticalgorithm generates nind individuals varying all the variablesof design of the distillation scheme (as feed location, intercon-nection flow streams, interconnection stage location, amongothers); in this way, the algorithm has nind designs of the distil-lation schemes. These schemes are sent to Aspen Plus, one byone, in order to simulate the distillation scheme and get thevalues of the objectives and constraints of each individual.With the information of the objectives and constraints, thegenetic algorithm classifies the individuals according with thenumber of constraints satisfying, and inside each subgroupaccording with the fitness value. Then, the best individuals arechosen to be the parents of the new generation, and so; untilthe total number of generations has been reached. Then inte-gration between the rigorous simulation and the stochasticoptimization strategy is made with technology ActiveX.
For this minimization, the implemented multiobjectivealgorithm is based on the NSGA-II (Deb, 2001; Deb et al., 2002),and the constraints are handling using a slight modificationof the work of Coello-Coello (2000). This modification is as fol-lows: the entire population is divided into sub-populationsusing, as criterion, the total number of satisfied constraints,nconst. Thus, the best individuals of the generation are thosethat satisfied all nconst constraints, and they are followedby the individuals that only satisfying nconst − 1, and so on.Within each sub-population, individuals are ranked using theNSGA-II, but considering now as another objective function tominimize the difference between the required and obtainedconstraints. Next, dominance calculation of each subgroup iscarried out as follows:
dominance{Qi, Ni, minimum[0, (xk,PS − yk,PS)]} (4)
According to Eq. (4), in each subgroup we are minimizing asthe original objective functions as the difference between therequired and obtained constraints. In this way, the minimiza-tion takes into account as the objectives as the constraints ofthe problem.
3. Cases of study
As was mentioned before, we selected as study a subset of31 configurations that use less than N − 1 columns, for qua-ternary distillation, proposed by Errico et al. (2009a,b). Theseconfigurations were divided in three principal groups:
1. Distillation sequences with less than N − 1 columns with-out thermal coupling.
2. Distillation sequences with less than N − 1 columns withthermal coupling.
3. Single distillation columns with two side streams.
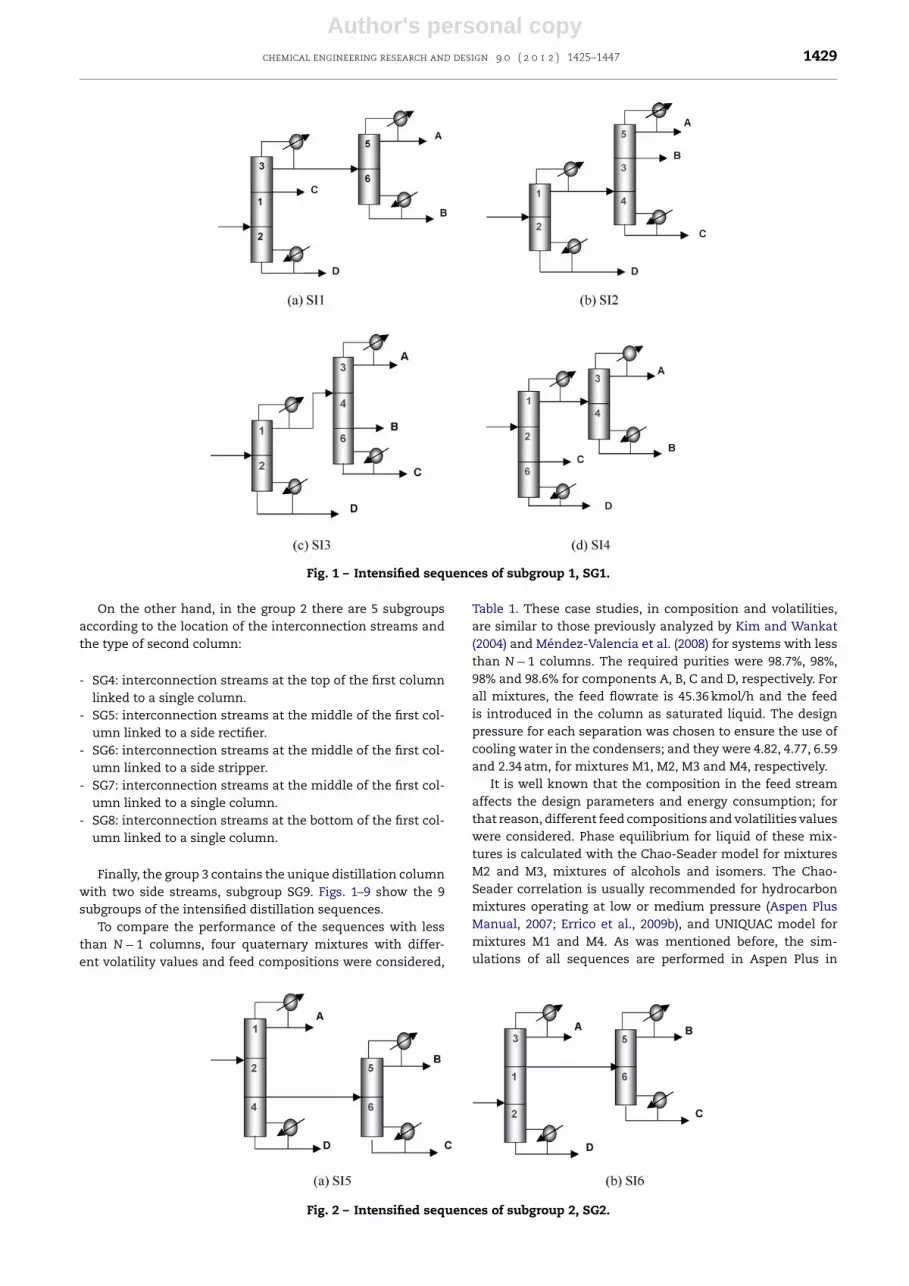
Also, each group is divided in subgroups (SG). The group 1 isdivided in the following subgroups depending on the productstream that is fed to the second column:
- SG1: distillate stream of the first column is fed to the secondone.
- SG2: side stream of the first column is fed to the second one.- SG3: bottom stream in the first column is fed to the second
one.
Author's personal copychemical engineering research and design 9 0 ( 2 0 1 2 ) 1425–1447 1429
Fig. 1 – Intensified sequences of subgroup 1, SG1.
On the other hand, in the group 2 there are 5 subgroupsaccording to the location of the interconnection streams andthe type of second column:
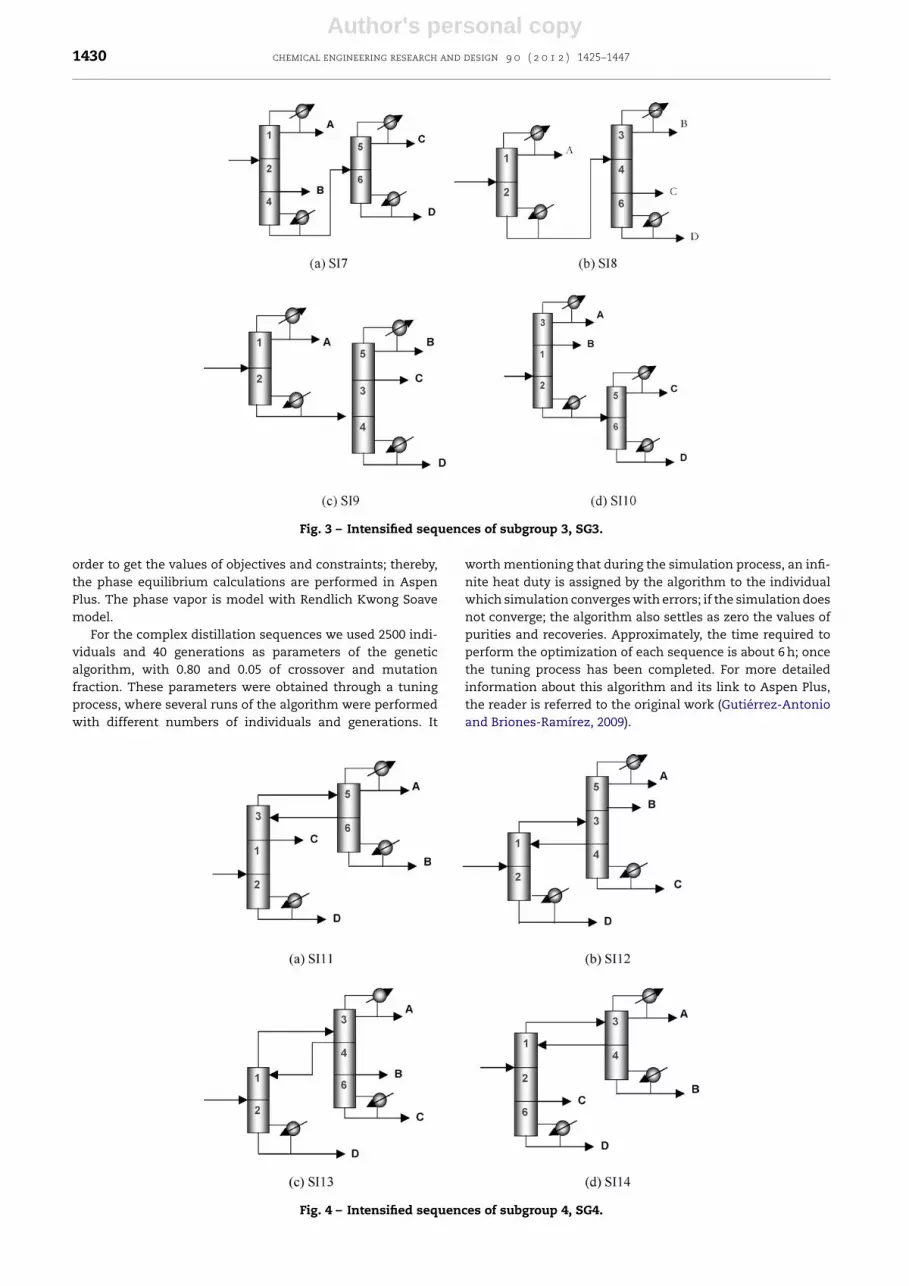
- SG4: interconnection streams at the top of the first columnlinked to a single column.
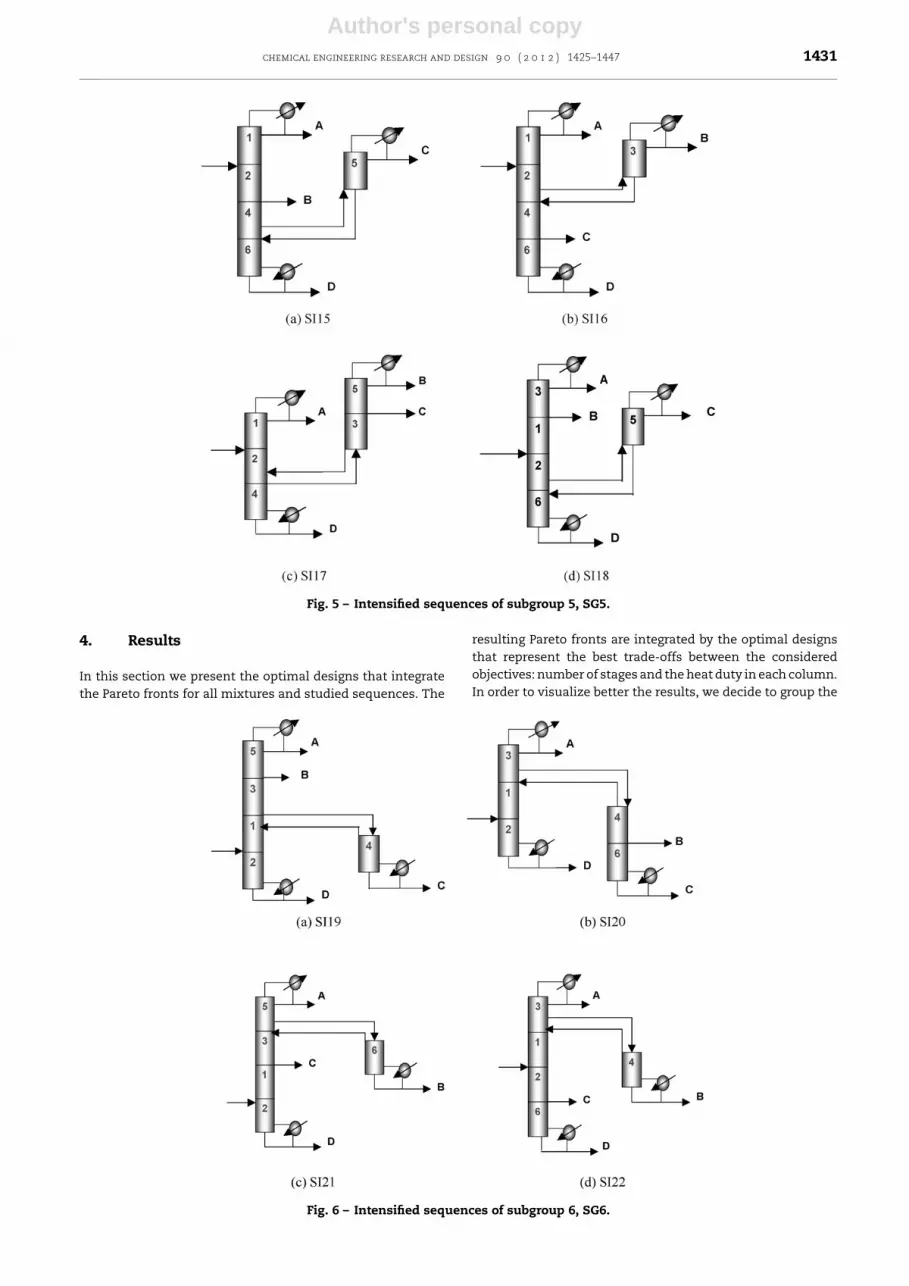
- SG5: interconnection streams at the middle of the first col-umn linked to a side rectifier.
- SG6: interconnection streams at the middle of the first col-umn linked to a side stripper.
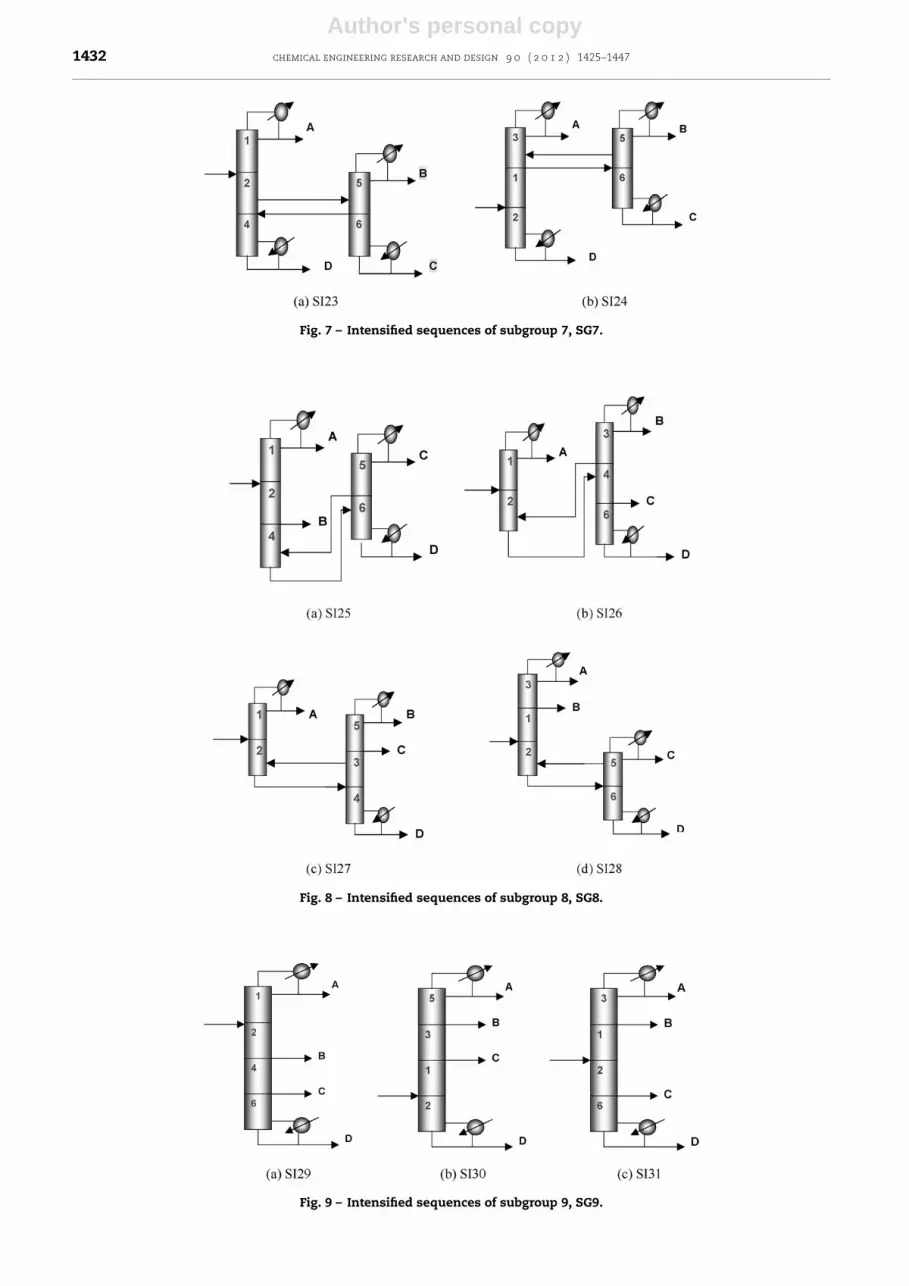
- SG7: interconnection streams at the middle of the first col-umn linked to a single column.
- SG8: interconnection streams at the bottom of the first col-umn linked to a single column.
Finally, the group 3 contains the unique distillation columnwith two side streams, subgroup SG9. Figs. 1–9 show the 9subgroups of the intensified distillation sequences.
To compare the performance of the sequences with lessthan N − 1 columns, four quaternary mixtures with differ-ent volatility values and feed compositions were considered,
Table 1. These case studies, in composition and volatilities,are similar to those previously analyzed by Kim and Wankat(2004) and Méndez-Valencia et al. (2008) for systems with lessthan N − 1 columns. The required purities were 98.7%, 98%,98% and 98.6% for components A, B, C and D, respectively. Forall mixtures, the feed flowrate is 45.36 kmol/h and the feedis introduced in the column as saturated liquid. The designpressure for each separation was chosen to ensure the use ofcooling water in the condensers; and they were 4.82, 4.77, 6.59and 2.34 atm, for mixtures M1, M2, M3 and M4, respectively.
It is well known that the composition in the feed streamaffects the design parameters and energy consumption; forthat reason, different feed compositions and volatilities valueswere considered. Phase equilibrium for liquid of these mix-tures is calculated with the Chao-Seader model for mixturesM2 and M3, mixtures of alcohols and isomers. The Chao-Seader correlation is usually recommended for hydrocarbonmixtures operating at low or medium pressure (Aspen PlusManual, 2007; Errico et al., 2009b), and UNIQUAC model formixtures M1 and M4. As was mentioned before, the sim-ulations of all sequences are performed in Aspen Plus in
Fig. 2 – Intensified sequences of subgroup 2, SG2.
Author's personal copy1430 chemical engineering research and design 9 0 ( 2 0 1 2 ) 1425–1447
Fig. 3 – Intensified sequences of subgroup 3, SG3.
order to get the values of objectives and constraints; thereby,the phase equilibrium calculations are performed in AspenPlus. The phase vapor is model with Rendlich Kwong Soavemodel.
For the complex distillation sequences we used 2500 indi-viduals and 40 generations as parameters of the geneticalgorithm, with 0.80 and 0.05 of crossover and mutationfraction. These parameters were obtained through a tuningprocess, where several runs of the algorithm were performedwith different numbers of individuals and generations. It
worth mentioning that during the simulation process, an infi-nite heat duty is assigned by the algorithm to the individualwhich simulation converges with errors; if the simulation doesnot converge; the algorithm also settles as zero the values ofpurities and recoveries. Approximately, the time required toperform the optimization of each sequence is about 6 h; oncethe tuning process has been completed. For more detailedinformation about this algorithm and its link to Aspen Plus,the reader is referred to the original work (Gutiérrez-Antonioand Briones-Ramírez, 2009).
Fig. 4 – Intensified sequences of subgroup 4, SG4.
Author's personal copychemical engineering research and design 9 0 ( 2 0 1 2 ) 1425–1447 1431
Fig. 5 – Intensified sequences of subgroup 5, SG5.
4. Results
In this section we present the optimal designs that integratethe Pareto fronts for all mixtures and studied sequences. The
resulting Pareto fronts are integrated by the optimal designsthat represent the best trade-offs between the consideredobjectives: number of stages and the heat duty in each column.In order to visualize better the results, we decide to group the
Fig. 6 – Intensified sequences of subgroup 6, SG6.
Author's personal copy1432 chemical engineering research and design 9 0 ( 2 0 1 2 ) 1425–1447
Fig. 7 – Intensified sequences of subgroup 7, SG7.
Fig. 8 – Intensified sequences of subgroup 8, SG8.
Fig. 9 – Intensified sequences of subgroup 9, SG9.
Author's personal copychemical engineering research and design 9 0 ( 2 0 1 2 ) 1425–1447 1433
Table 1 – Selected quaternary mixtures.
Mixture Components xi ˛i,H ˛i,j T (◦C) �T (◦C)
M1
A: isobutane 0.40 6.07 −11.72B: n-butane 0.10 4.68 1.29 −1.00 10.72C: n-pentane 0.10 1.91 2.45 36.07 37.07D: iso-hexane 0.40 1.00 1.91 60.01 23.94
M2
A: n-butane 0.30 27.67 −1.00B: n-pentane 0.40 11.44 2.42 36.07 37.07C: n-hexane 0.25 4.94 2.32 68.73 32.66D: n-octane 0.05 1.00 4.94 125.68 56.95
M3
A: n-butane 0.05 10.07 −1.00B: n-pentane 0.45 4.5 2.24 36.07 37.07C: n-hexane 0.45 2.08 2.16 68.73 32.66D: n-heptane 0.05 1.00 2.08 98.43 29.70
M4
A: isobutanol 0.05 5.77 107.66B: 1-pentanol 0.25 3.05 1.89 137.80 30.14C: 1-hexanol 0.40 1.78 1.72 157.40 19.60D: isoheptanol 0.30 1.00 1.78 172.01 14.61
heat duty of the sequence, instead of plotting this variable foreach column. Thereby, the Pareto fronts show the number ofstages in each column and the total heat duty of the sequence.Also, with the information generated by the Pareto front, wecalculate some other variables as thermodynamic efficiency,total annual cost and CO2 emissions in order to evaluate themintegrally.
4.1. Mixture 1
The first mixture in our analysis is a mixture of hydrocar-bons; the intermediate components, B and C, are of normalchain, and the light, A, and heavy, D, components are isomers.The feed composition contains a low concentration of the twointermediate components (20%). The relative volatilities of theadjacent components indicate that the harder separation isperformed between isobutane, A, and n-butane, B; the easiestcut includes the two intermediate components: n-butane, B,and n-hexane, C.
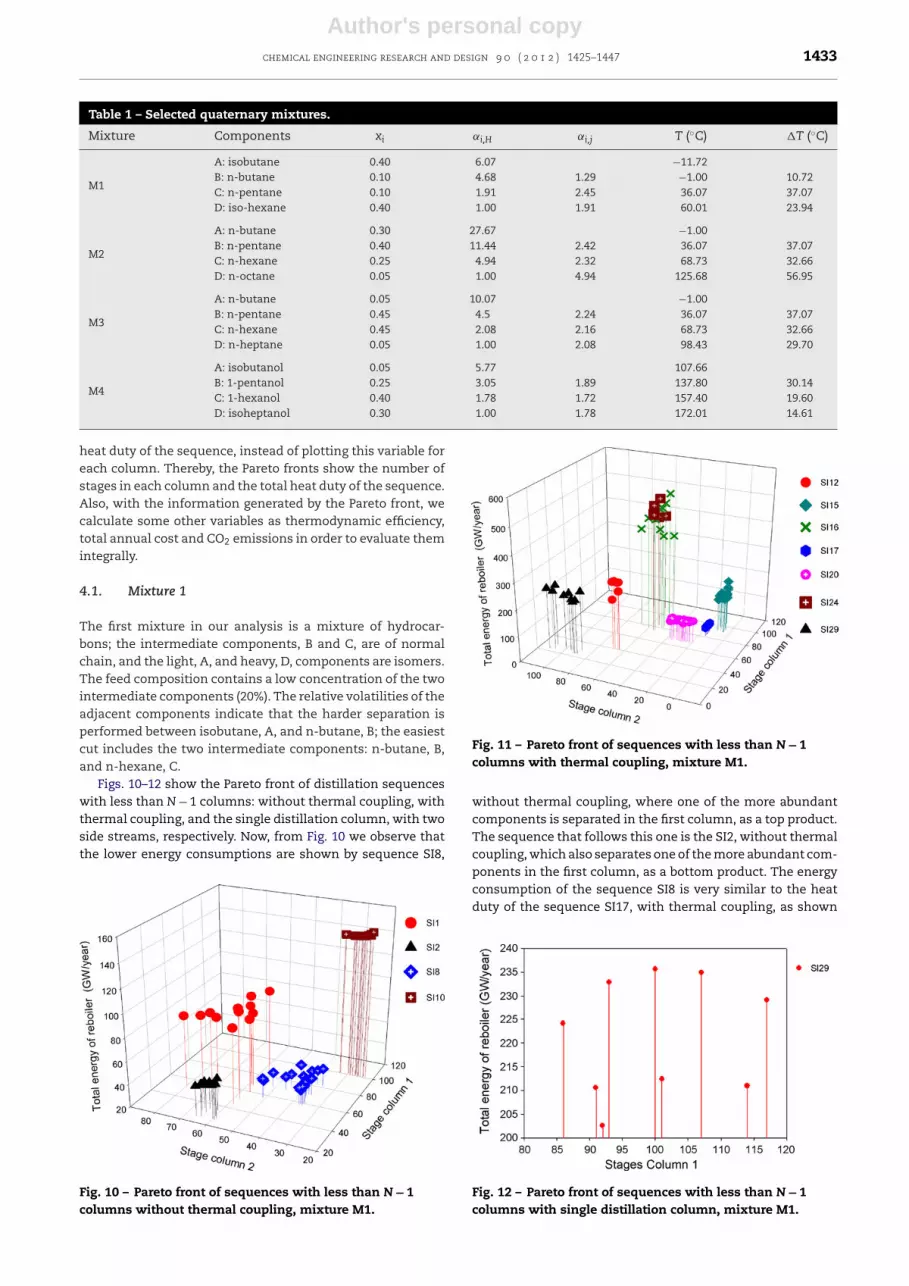
Figs. 10–12 show the Pareto front of distillation sequenceswith less than N − 1 columns: without thermal coupling, withthermal coupling, and the single distillation column, with twoside streams, respectively. Now, from Fig. 10 we observe thatthe lower energy consumptions are shown by sequence SI8,
Fig. 10 – Pareto front of sequences with less than N − 1columns without thermal coupling, mixture M1.
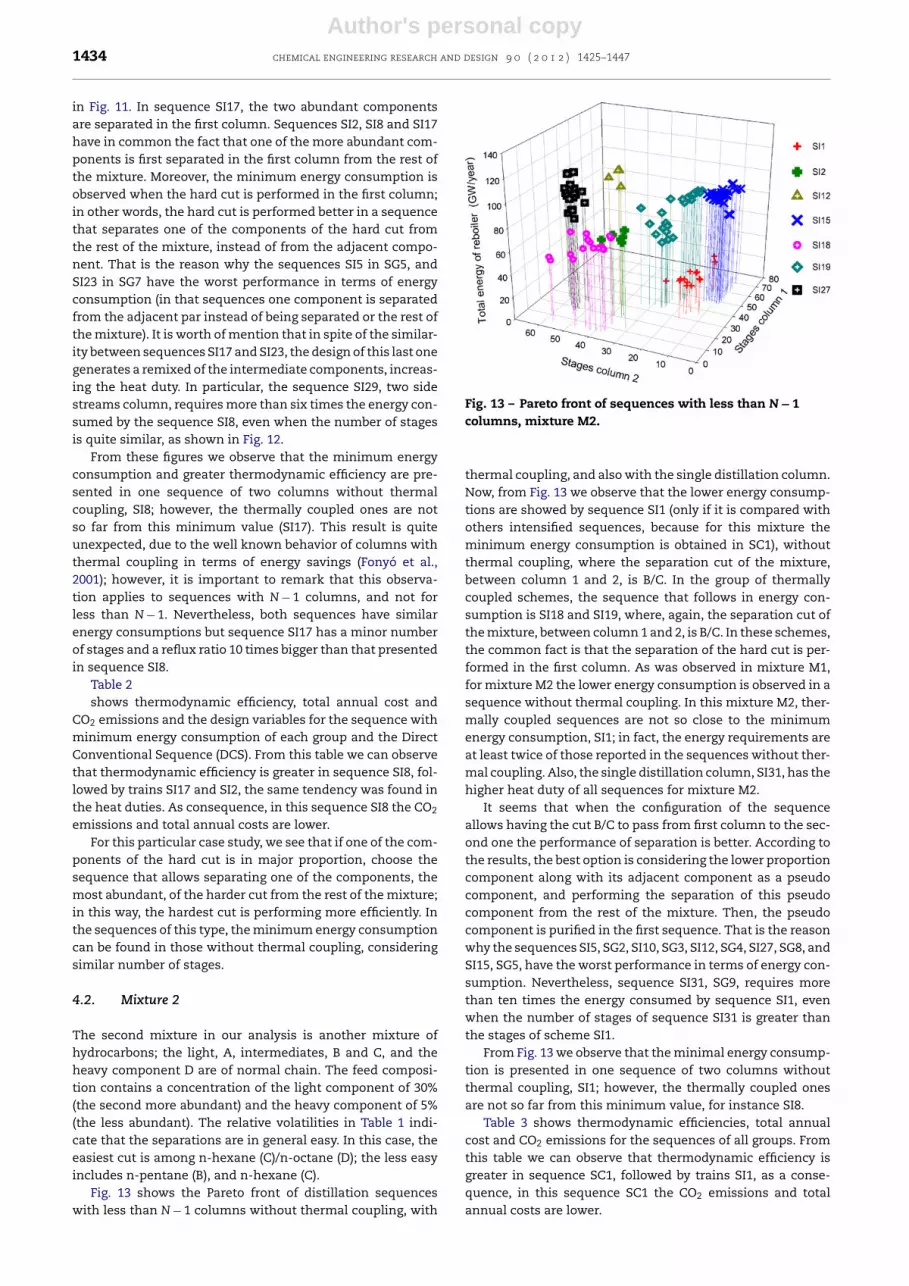
Fig. 11 – Pareto front of sequences with less than N − 1columns with thermal coupling, mixture M1.
without thermal coupling, where one of the more abundantcomponents is separated in the first column, as a top product.The sequence that follows this one is the SI2, without thermalcoupling, which also separates one of the more abundant com-ponents in the first column, as a bottom product. The energyconsumption of the sequence SI8 is very similar to the heatduty of the sequence SI17, with thermal coupling, as shown
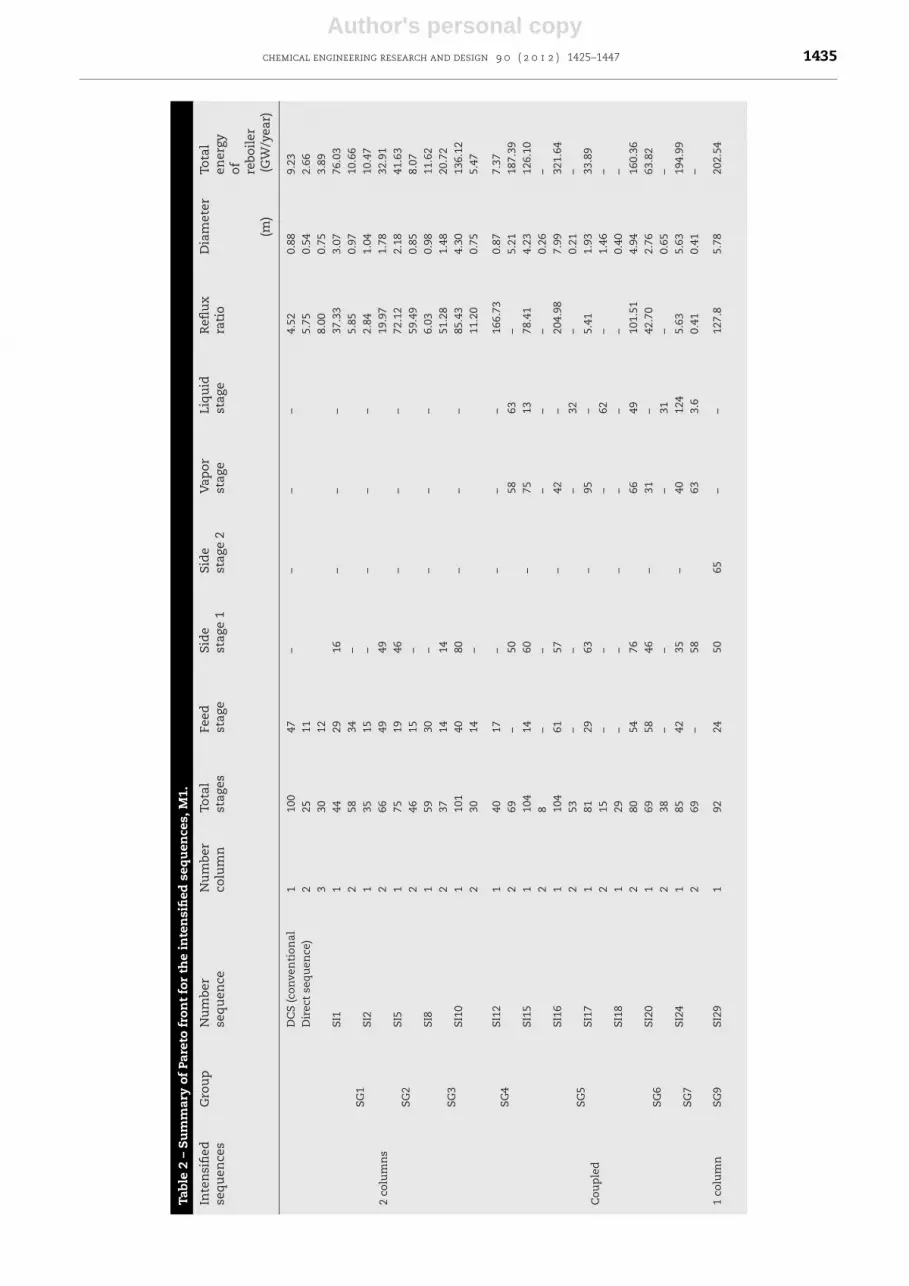
Fig. 12 – Pareto front of sequences with less than N − 1columns with single distillation column, mixture M1.
Author's personal copy1434 chemical engineering research and design 9 0 ( 2 0 1 2 ) 1425–1447
in Fig. 11. In sequence SI17, the two abundant componentsare separated in the first column. Sequences SI2, SI8 and SI17have in common the fact that one of the more abundant com-ponents is first separated in the first column from the rest ofthe mixture. Moreover, the minimum energy consumption isobserved when the hard cut is performed in the first column;in other words, the hard cut is performed better in a sequencethat separates one of the components of the hard cut fromthe rest of the mixture, instead of from the adjacent compo-nent. That is the reason why the sequences SI5 in SG5, andSI23 in SG7 have the worst performance in terms of energyconsumption (in that sequences one component is separatedfrom the adjacent par instead of being separated or the rest ofthe mixture). It is worth of mention that in spite of the similar-ity between sequences SI17 and SI23, the design of this last onegenerates a remixed of the intermediate components, increas-ing the heat duty. In particular, the sequence SI29, two sidestreams column, requires more than six times the energy con-sumed by the sequence SI8, even when the number of stagesis quite similar, as shown in Fig. 12.
From these figures we observe that the minimum energyconsumption and greater thermodynamic efficiency are pre-sented in one sequence of two columns without thermalcoupling, SI8; however, the thermally coupled ones are notso far from this minimum value (SI17). This result is quiteunexpected, due to the well known behavior of columns withthermal coupling in terms of energy savings (Fonyó et al.,2001); however, it is important to remark that this observa-tion applies to sequences with N − 1 columns, and not forless than N − 1. Nevertheless, both sequences have similarenergy consumptions but sequence SI17 has a minor numberof stages and a reflux ratio 10 times bigger than that presentedin sequence SI8.
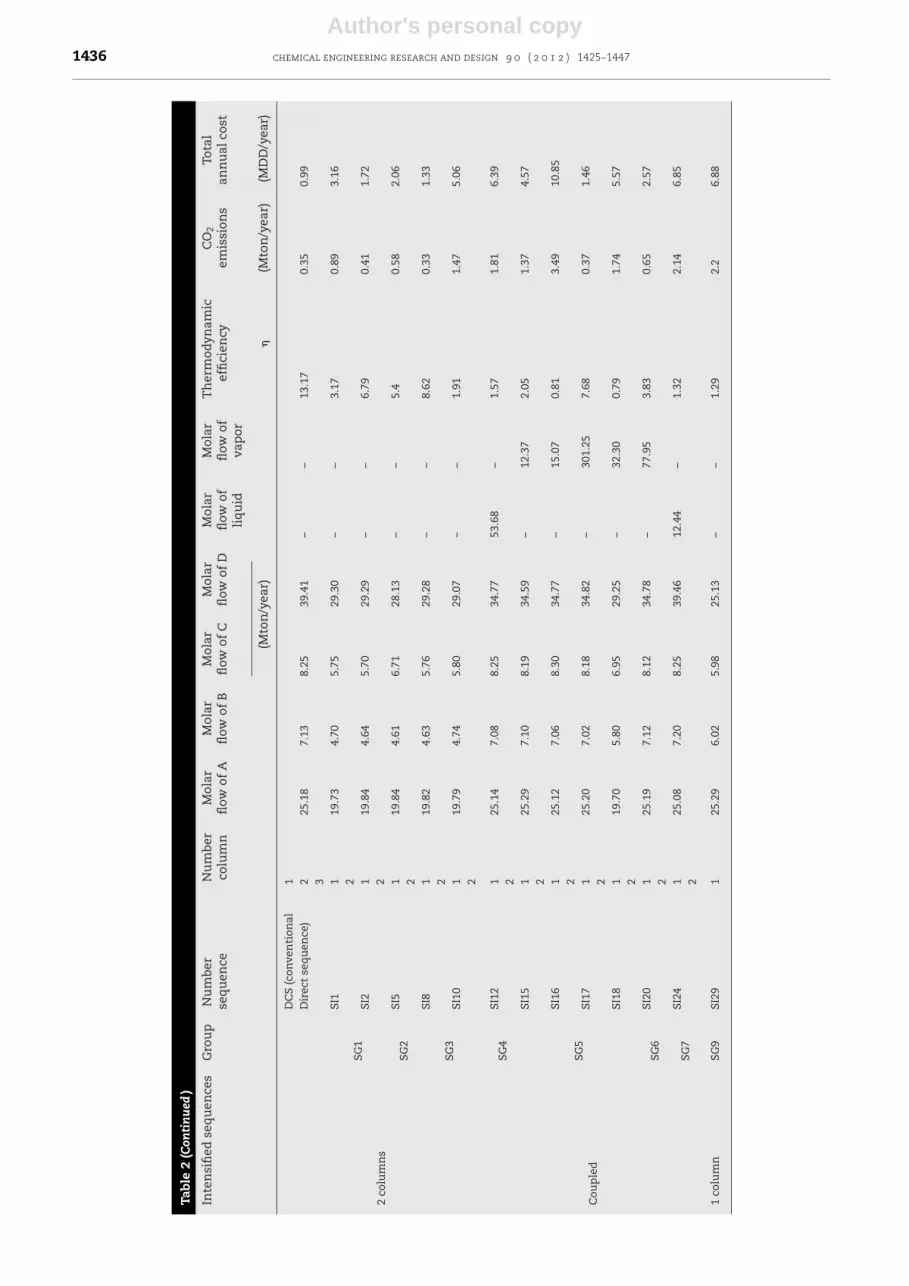
Table 2shows thermodynamic efficiency, total annual cost and
CO2 emissions and the design variables for the sequence withminimum energy consumption of each group and the DirectConventional Sequence (DCS). From this table we can observethat thermodynamic efficiency is greater in sequence SI8, fol-lowed by trains SI17 and SI2, the same tendency was found inthe heat duties. As consequence, in this sequence SI8 the CO2
emissions and total annual costs are lower.For this particular case study, we see that if one of the com-
ponents of the hard cut is in major proportion, choose thesequence that allows separating one of the components, themost abundant, of the harder cut from the rest of the mixture;in this way, the hardest cut is performing more efficiently. Inthe sequences of this type, the minimum energy consumptioncan be found in those without thermal coupling, consideringsimilar number of stages.
4.2. Mixture 2
The second mixture in our analysis is another mixture ofhydrocarbons; the light, A, intermediates, B and C, and theheavy component D are of normal chain. The feed composi-tion contains a concentration of the light component of 30%(the second more abundant) and the heavy component of 5%(the less abundant). The relative volatilities in Table 1 indi-cate that the separations are in general easy. In this case, theeasiest cut is among n-hexane (C)/n-octane (D); the less easyincludes n-pentane (B), and n-hexane (C).
Fig. 13 shows the Pareto front of distillation sequenceswith less than N − 1 columns without thermal coupling, with
Fig. 13 – Pareto front of sequences with less than N − 1columns, mixture M2.
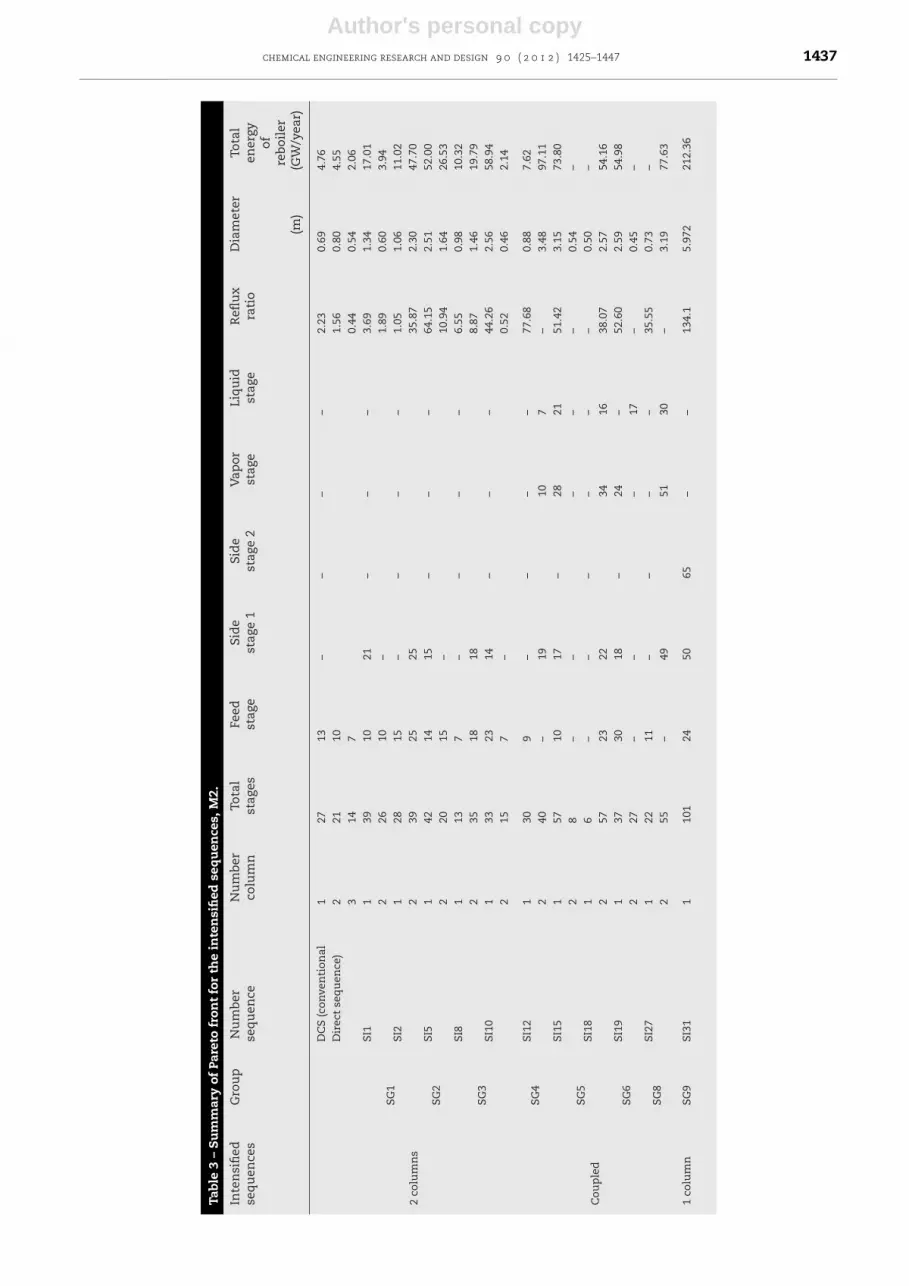
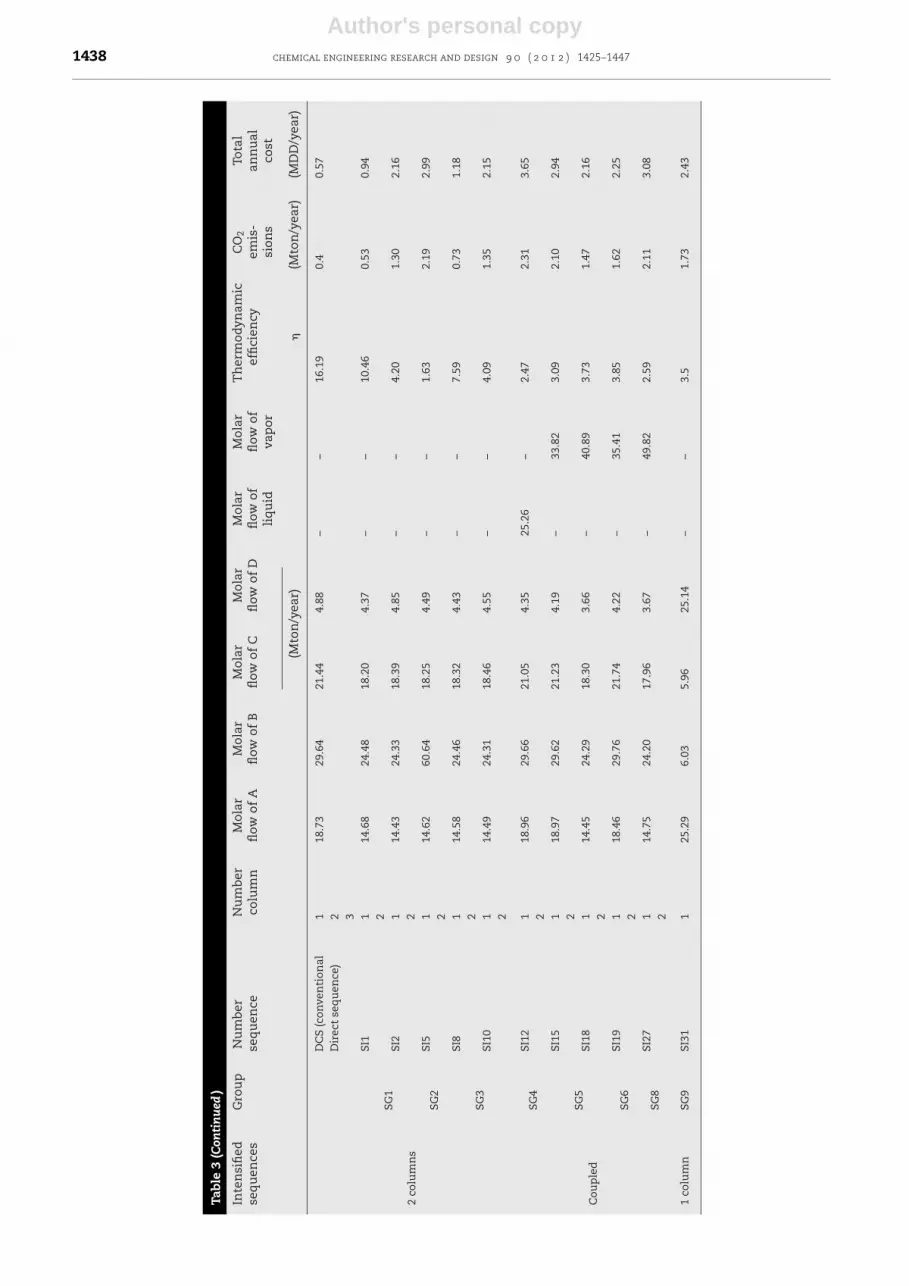
thermal coupling, and also with the single distillation column.Now, from Fig. 13 we observe that the lower energy consump-tions are showed by sequence SI1 (only if it is compared withothers intensified sequences, because for this mixture theminimum energy consumption is obtained in SC1), withoutthermal coupling, where the separation cut of the mixture,between column 1 and 2, is B/C. In the group of thermallycoupled schemes, the sequence that follows in energy con-sumption is SI18 and SI19, where, again, the separation cut ofthe mixture, between column 1 and 2, is B/C. In these schemes,the common fact is that the separation of the hard cut is per-formed in the first column. As was observed in mixture M1,for mixture M2 the lower energy consumption is observed in asequence without thermal coupling. In this mixture M2, ther-mally coupled sequences are not so close to the minimumenergy consumption, SI1; in fact, the energy requirements areat least twice of those reported in the sequences without ther-mal coupling. Also, the single distillation column, SI31, has thehigher heat duty of all sequences for mixture M2.
It seems that when the configuration of the sequenceallows having the cut B/C to pass from first column to the sec-ond one the performance of separation is better. According tothe results, the best option is considering the lower proportioncomponent along with its adjacent component as a pseudocomponent, and performing the separation of this pseudocomponent from the rest of the mixture. Then, the pseudocomponent is purified in the first sequence. That is the reasonwhy the sequences SI5, SG2, SI10, SG3, SI12, SG4, SI27, SG8, andSI15, SG5, have the worst performance in terms of energy con-sumption. Nevertheless, sequence SI31, SG9, requires morethan ten times the energy consumed by sequence SI1, evenwhen the number of stages of sequence SI31 is greater thanthe stages of scheme SI1.
From Fig. 13 we observe that the minimal energy consump-tion is presented in one sequence of two columns withoutthermal coupling, SI1; however, the thermally coupled onesare not so far from this minimum value, for instance SI8.
Table 3 shows thermodynamic efficiencies, total annualcost and CO2 emissions for the sequences of all groups. Fromthis table we can observe that thermodynamic efficiency isgreater in sequence SC1, followed by trains SI1, as a conse-quence, in this sequence SC1 the CO2 emissions and totalannual costs are lower.
Author's personal copychemical engineering research and design 9 0 ( 2 0 1 2 ) 1425–1447 1435
Tabl
e
2
–
Su
mm
ary
of
Pare
to
fron
t
for
the
inte
nsi
fied
seq
uen
ces,
M1.
Inte
nsi
fied
seq
uen
ces
Gro
up
Nu
mbe
rse
qu
ence
Nu
mbe
rco
lum
nTo
tal
stag
esFe
edst
age
Sid
est
age
1Si
de
stag
e
2V
apor
stag
eLi
qu
idst
age
Refl
ux
rati
oD
iam
eter
Tota
len
ergy
of rebo
iler
(m)
(GW
/yea
r)
2
colu
mn
s
DC
S
(con
ven
tion
alD
irec
t
seq
uen
ce)
1
100
47
–
–
–
–
4.52
0.88
9.23
2
25
11
5.75
0.54
2.66
3
30
12
8.00
0.75
3.89
SG1
SI1
1
44
29
16
–
–
–
37.3
3
3.07
76.0
32
58
34
–
5.85
0.97
10.6
6SI
21
35
15
–
–
–
–
2.84
1.04
10.4
72
66
49
49
19.9
7
1.78
32.9
1
SG2
SI5
1
75
19
46
–
–
– 72
.12
2.18
41.6
32
46
15
–
59.4
9
0.85
8.07
SG3
SI8
1
59
30
–
–
–
–
6.03
0.98
11.6
22
37
14
14
51.2
8
1.48
20.7
2SI
10
1
101
40
80
–
–
–
85.4
3
4.30
136.
122
30
14
–
11.2
0
0.75
5.47
Cou
ple
d
SG4
SI12
1
40
17
–
–
– –
166.
73
0.87
7.37
2
69
–
50
58
63
–
5.21
187.
39
SG5
SI15
1
104
14
60
–
75
13
78.4
1
4.23
126.
102
8
–
–
–
–
–
0.26
–SI
16
1
104
61
57
– 42
–
204.
98
7.99
321.
642
53
–
–
–
32
–
0.21
–SI
17
1
81
29
63
–
95
–
5.41
1.93
33.8
92
15
–
–
–
62
–
1.46
–SI
18
1
29
–
–
–
–
–
–
0.40
–2
80
54
76
66
49
101.
51
4.94
160.
36
SG6
SI20
1
69
58
46
–
31
–
42.7
0
2.76
63.8
22
38
–
–
–
31
–
0.65
–
SG7
SI24
1
85
42
35
–
40
124
5.63
5.63
194.
992
69
–
58
63
3.6
0.41
0.41
–
1
colu
mn
SG9
SI29
1
92
24
50
65
–
–
127.
8
5.78
202.
54
Author's personal copy1436 chemical engineering research and design 9 0 ( 2 0 1 2 ) 1425–1447
Tabl
e
2
(Con
tin
ued
)
Inte
nsi
fied
seq
uen
ces
Gro
up
Nu
mbe
rse
qu
ence
Nu
mbe
rco
lum
nM
olar
flow
of
AM
olar
flow
of
BM
olar
flow
of
CM
olar
flow
of
DM
olar
flow
ofli
qu
id
Mol
arfl
ow
ofva
por
Th
erm
odyn
amic
effi
cien
cyC
O2
emis
sion
sTo
tal
ann
ual
cost
(Mto
n/y
ear)
�(M
ton
/yea
r)(M
DD
/yea
r)
2
colu
mn
s
DC
S
(con
ven
tion
alD
irec
t
seq
uen
ce)
1 225
.18
7.13
8.25
39.4
1–
–13
.17
0.35
0.99
3
SG1
SI1
119
.73
4.70
5.75
29.3
0
–
–
3.17
0.89
3.16
2SI
2
1
19.8
4
4.64
5.70
29.2
9
–
–
6.79
0.41
1.72
2
SG2
SI5
1
19.8
4
4.61
6.71
28.1
3
–
–
5.4
0.58
2.06
2
SG3
SI8
1
19.8
2
4.63
5.76
29.2
8
–
–
8.62
0.33
1.33
2SI
10
1
19.7
9
4.74
5.80
29.0
7
–
– 1.
91
1.47
5.06
2
Cou
ple
d
SG4
SI12
125
.14
7.08
8.25
34.7
7
53.6
8 –
1.57
1.81
6.39
2
SG5
SI15
125
.29
7.10
8.19
34.5
9
– 12
.37
2.05
1.37
4.57
2SI
161
25.1
2
7.06
8.30
34.7
7
–
15.0
7
0.81
3.49
10.8
52
SI17
1
25.2
0
7.02
8.18
34.8
2 –
301.
25
7.68
0.37
1.46
2SI
18
1
19.7
0
5.80
6.95
29.2
5
–
32.3
0
0.79
1.74
5.57
2
SG6
SI20
1
25.1
9
7.12
8.12
34.7
8
–
77.9
5
3.83
0.65
2.57
2
SG7
SI24
1
25.0
8
7.20
8.25
39.4
6
12.4
4
–
1.32
2.14
6.85
2
1
colu
mn
SG9
SI29
125
.29
6.02
5.98
25.1
3–
–1.
292.
2
6.88
Author's personal copychemical engineering research and design 9 0 ( 2 0 1 2 ) 1425–1447 1437
Tabl
e
3
–
Su
mm
ary
of
Pare
to
fron
t
for
the
inte
nsi
fied
seq
uen
ces,
M2.
Inte
nsi
fied
seq
uen
ces
Gro
up
Nu
mbe
rse
qu
ence
Nu
mbe
rco
lum
nTo
tal
stag
esFe
edst
age
Sid
est
age
1Si
de
stag
e
2V
apor
stag
eLi
qu
idst
age
Refl
ux
rati
oD
iam
eter
Tota
len
ergy
ofre
boil
er(m
)
(GW
/yea
r)
2
colu
mn
s
DC
S
(con
ven
tion
alD
irec
t
seq
uen
ce)
1
27
13
–
–
–
–
2.23
0.69
4.76
2
21
10
1.56
0.80
4.55
3
14
7
0.44
0.54
2.06
SG1
SI1
1
39
10
21
–
–
–
3.69
1.34
17.0
12
26
10
–
1.89
0.60
3.94
SI2
1
28
15
–
–
–
– 1.
05
1.06
11.0
22
39
25
25
35.8
7
2.30
47.7
0
SG2
SI5
1
42
14
15
–
–
–
64.1
5
2.51
52.0
02
20
15
–
10.9
4
1.64
26.5
3
SG3
SI8
1
13
7
–
–
–
–
6.55
0.98
10.3
22
35
18
18
8.87
1.46
19.7
9SI
10
1
33
23
14
–
– –
44.2
6
2.56
58.9
42
15
7
–
0.52
0.46
2.14
Cou
ple
d
SG4
SI12
1
30
9
–
–
–
–
77.6
8
0.88
7.62
2
40
–
19
10
7
–
3.48
97.1
1
SG5
SI15
1
57
10
17
– 28
21
51.4
2
3.15
73.8
02
8
–
–
–
–
–
0.54
–SI
18
1
6
–
–
–
–
–
–
0.50
–2
57
23
22
34
16
38.0
7
2.57
54.1
6
SG6
SI19
1
37
30
18
–
24
–
52.6
0
2.59
54.9
82
27
–
–
–
17
–
0.45
–
SG8
SI27
1
22
11
– –
–
–
35.5
5
0.73
–2
55
–
49
51
30
–
3.19
77.6
3
1
colu
mn
SG9
SI31
1
101
24
50
65
–
–
134.
1
5.97
2
212.
36
Author's personal copy1438 chemical engineering research and design 9 0 ( 2 0 1 2 ) 1425–1447
Tabl
e
3
(Con
tin
ued
)
Inte
nsi
fied
seq
uen
ces
Gro
up
Nu
mbe
rse
qu
ence
Nu
mbe
rco
lum
nM
olar
flow
of
AM
olar
flow
of
BM
olar
flow
of
CM
olar
flow
of
DM
olar
flow
ofli
qu
id
Mol
arfl
ow
ofva
por
Th
erm
odyn
amic
effi
cien
cyC
O2
emis
-si
ons
Tota
lan
nu
alco
st
(Mto
n/y
ear)
�(M
ton
/yea
r)(M
DD
/yea
r)
2
colu
mn
s
DC
S
(con
ven
tion
alD
irec
t
seq
uen
ce)
118
.73
29.6
421
.44
4.88
–
–
16.1
9
0.4
0.57
2 3
SG1
SI1
1
14.6
8
24.4
8
18.2
0
4.37
–
–
10.4
6 0.
53
0.94
2SI
2
1
14.4
3
24.3
3
18.3
9
4.85
–
–
4.20
1.30
2.16
2
SG2
SI5
1
14.6
2
60.6
4
18.2
5
4.49
–
–
1.63
2.19
2.99
2
SG3
SI8
1
14.5
8
24.4
6
18.3
2
4.43
–
– 7.
59
0.73
1.18
2SI
10
1
14.4
9
24.3
1
18.4
6
4.55
–
–
4.09
1.35
2.15
2
Cou
ple
d
SG4
SI12
118
.96
29.6
6
21.0
5
4.35
25.2
6
–
2.47
2.31
3.65
2
SG5
SI15
118
.97
29.6
2
21.2
3
4.19
–
33.8
2
3.09
2.10
2.94
2SI
181
14.4
5
24.2
9
18.3
0
3.66
–
40.8
9
3.73
1.47
2.16
2
SG6
SI19
1
18.4
6
29.7
6
21.7
4
4.22
–
35.4
1
3.85
1.62
2.25
2
SG8
SI27
1
14.7
5
24.2
0
17.9
6 3.
67
–
49.8
2
2.59
2.11
3.08
2
1
colu
mn
SG9
SI31
1
25.2
9
6.03
5.96
25.1
4
–
–
3.5
1.73
2.43
Author's personal copychemical engineering research and design 9 0 ( 2 0 1 2 ) 1425–1447 1439
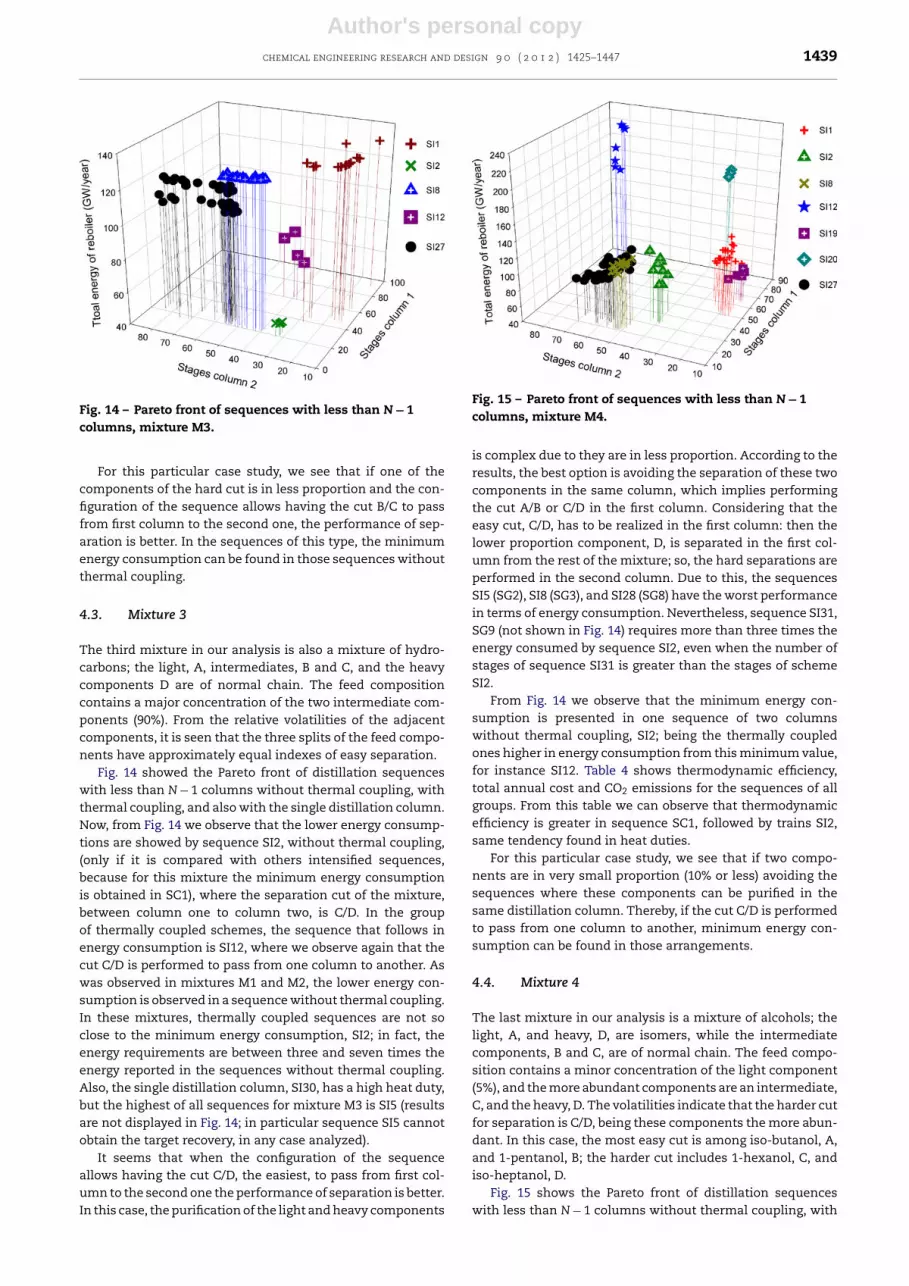
Fig. 14 – Pareto front of sequences with less than N − 1columns, mixture M3.
For this particular case study, we see that if one of thecomponents of the hard cut is in less proportion and the con-figuration of the sequence allows having the cut B/C to passfrom first column to the second one, the performance of sep-aration is better. In the sequences of this type, the minimumenergy consumption can be found in those sequences withoutthermal coupling.
4.3. Mixture 3
The third mixture in our analysis is also a mixture of hydro-carbons; the light, A, intermediates, B and C, and the heavycomponents D are of normal chain. The feed compositioncontains a major concentration of the two intermediate com-ponents (90%). From the relative volatilities of the adjacentcomponents, it is seen that the three splits of the feed compo-nents have approximately equal indexes of easy separation.
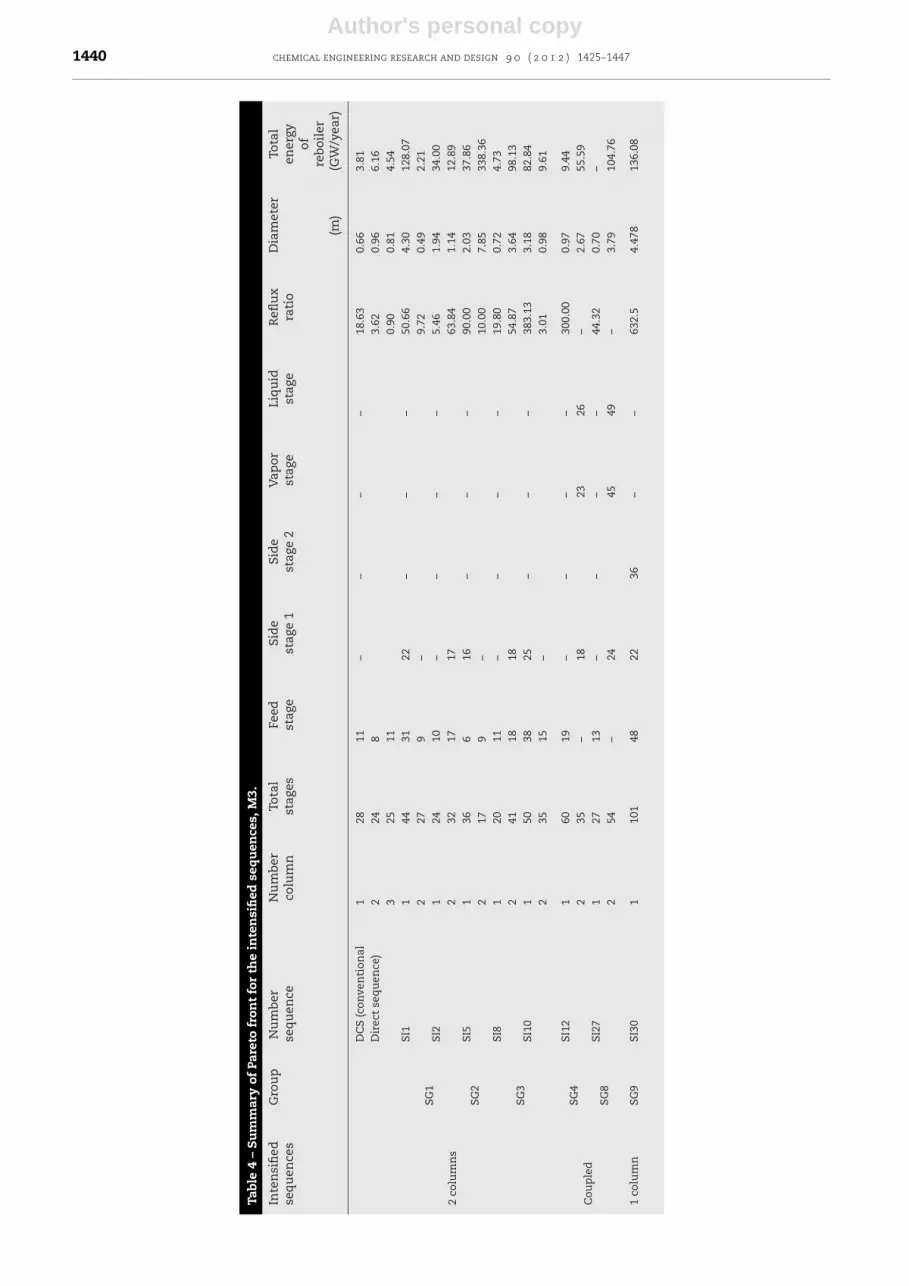
Fig. 14 showed the Pareto front of distillation sequenceswith less than N − 1 columns without thermal coupling, withthermal coupling, and also with the single distillation column.Now, from Fig. 14 we observe that the lower energy consump-tions are showed by sequence SI2, without thermal coupling,(only if it is compared with others intensified sequences,because for this mixture the minimum energy consumptionis obtained in SC1), where the separation cut of the mixture,between column one to column two, is C/D. In the groupof thermally coupled schemes, the sequence that follows inenergy consumption is SI12, where we observe again that thecut C/D is performed to pass from one column to another. Aswas observed in mixtures M1 and M2, the lower energy con-sumption is observed in a sequence without thermal coupling.In these mixtures, thermally coupled sequences are not soclose to the minimum energy consumption, SI2; in fact, theenergy requirements are between three and seven times theenergy reported in the sequences without thermal coupling.Also, the single distillation column, SI30, has a high heat duty,but the highest of all sequences for mixture M3 is SI5 (resultsare not displayed in Fig. 14; in particular sequence SI5 cannotobtain the target recovery, in any case analyzed).
It seems that when the configuration of the sequenceallows having the cut C/D, the easiest, to pass from first col-umn to the second one the performance of separation is better.In this case, the purification of the light and heavy components
Fig. 15 – Pareto front of sequences with less than N − 1columns, mixture M4.
is complex due to they are in less proportion. According to theresults, the best option is avoiding the separation of these twocomponents in the same column, which implies performingthe cut A/B or C/D in the first column. Considering that theeasy cut, C/D, has to be realized in the first column: then thelower proportion component, D, is separated in the first col-umn from the rest of the mixture; so, the hard separations areperformed in the second column. Due to this, the sequencesSI5 (SG2), SI8 (SG3), and SI28 (SG8) have the worst performancein terms of energy consumption. Nevertheless, sequence SI31,SG9 (not shown in Fig. 14) requires more than three times theenergy consumed by sequence SI2, even when the number ofstages of sequence SI31 is greater than the stages of schemeSI2.
From Fig. 14 we observe that the minimum energy con-sumption is presented in one sequence of two columnswithout thermal coupling, SI2; being the thermally coupledones higher in energy consumption from this minimum value,for instance SI12. Table 4 shows thermodynamic efficiency,total annual cost and CO2 emissions for the sequences of allgroups. From this table we can observe that thermodynamicefficiency is greater in sequence SC1, followed by trains SI2,same tendency found in heat duties.
For this particular case study, we see that if two compo-nents are in very small proportion (10% or less) avoiding thesequences where these components can be purified in thesame distillation column. Thereby, if the cut C/D is performedto pass from one column to another, minimum energy con-sumption can be found in those arrangements.
4.4. Mixture 4
The last mixture in our analysis is a mixture of alcohols; thelight, A, and heavy, D, are isomers, while the intermediatecomponents, B and C, are of normal chain. The feed compo-sition contains a minor concentration of the light component(5%), and the more abundant components are an intermediate,C, and the heavy, D. The volatilities indicate that the harder cutfor separation is C/D, being these components the more abun-dant. In this case, the most easy cut is among iso-butanol, A,and 1-pentanol, B; the harder cut includes 1-hexanol, C, andiso-heptanol, D.
Fig. 15 shows the Pareto front of distillation sequenceswith less than N − 1 columns without thermal coupling, with
Author's personal copy1440 chemical engineering research and design 9 0 ( 2 0 1 2 ) 1425–1447
Tabl
e
4
–
Su
mm
ary
of
Pare
to
fron
t
for
the
inte
nsi
fied
seq
uen
ces,
M3.
Inte
nsi
fied
seq
uen
ces
Gro
up
Nu
mbe
rse
qu
ence
Nu
mbe
rco
lum
nTo
tal
stag
esFe
edst
age
Sid
est
age
1Si
de
stag
e
2V
apor
stag
eLi
qu
idst
age
Refl
ux
rati
oD
iam
eter
Tota
len
ergy
ofre
boil
er(m
)(G
W/y
ear)
2
colu
mn
s
DC
S
(con
ven
tion
alD
irec
t
seq
uen
ce)
128
11
–
–
–
–
18.6
3
0.66
3.81
2
24
8
3.62
0.96
6.16
325
11
0.90
0.81
4.54
SG1
SI1
1
44
31
22
–
–
– 50
.66
4.30
128.
072
279
–
9.72
0.49
2.21
SI2
1
24
10
–
–
–
–
5.46
1.94
34.0
02
3217
17
63.8
4
1.14
12.8
9
SG2
SI5
1
36
6
16
–
–
–
90.0
0
2.03
37.8
62
17
9
–
10.0
0
7.85
338.
36
SG3
SI8
1
20
11
–
–
– –
19.8
0
0.72
4.73
2
41
18
18
54.8
7
3.64
98.1
3SI
10
1
50
38
25
–
–
–
383.
13
3.18
82.8
42
35
15
–
3.01
0.98
9.61
Cou
ple
dSG
4SI
121
60
19
–
– –
–
300.
00
0.97
9.44
2
35
–
18
23
26
–
2.67
55.5
9
SG8
SI27
1
27
13
–
–
–
–
44.3
2
0.70
–2
54
–
24
45
49
–
3.79
104.
76
1
colu
mn
SG9
SI30
1
101
48
22
36
–
–
632.
5
4.47
8
136.
08

Author's personal copychemical engineering research and design 9 0 ( 2 0 1 2 ) 1425–1447 1441
Tabl
e
4
(Con
tin
ued
)
Inte
nsi
fied
seq
uen
ces
Gro
up
Nu
mbe
rse
qu
ence
Nu
mbe
rco
lum
nM
olar
flow
of
AM
olar
flow
of
BM
olar
flow
of
CM
olar
flow
of
DM
olar
flow
ofli
qu
id
Mol
arfl
ow
ofva
por
Th
erm
odyn
amic
effi
cien
cyC
O2
emis
-si
ons
Tota
lan
nu
alco
st
(Mto
n/y
ear)
�
(Mto
n/y
ear)
(MD
D/y
ear)
2
colu
mn
s
DC
S
(con
ven
tion
alD
irec
t
seq
uen
ce)
1
3.09
33.6
3
38.6
2
4.54
–
–
4.50
0.30
0.70
2 3
SG1
SI1
1
2.28
27.2
7
32.7
0
4.26
–
–
1.28
2.36
4.61
2SI
21
2.19
27.3
9
32.6
8
4.25
–
– 3.
54
0.81
1.76
2
SG2
SI5
12.
72
27.4
9
32.4
9
3.74
–
–
4.57
0.67
1.53
2
SG3
SI8
1
2.41
27.1
0
32.6
9
4.26
–
–
1.61
1.85
3.69
2SI
101
2.42
27.4
1
32.3
8
4.17
– –
2.14
1.52
3.31
2
Cou
ple
dSG
4SI
12
1
3.08
33.2
0
38.8
3
4.29
51.2
8
–
3.13
1.05
2.44
2
SG8
SI27
1
3.13
33.2
6
38.6
2
4.35
–
46.7
2
1.57
1.91
3.83
2
1
colu
mn
SG9
SI30
1
3.11
28.0
7
28.0
7 3.
16
–
–
1.27
2.61
5.04
Author's personal copy1442 chemical engineering research and design 9 0 ( 2 0 1 2 ) 1425–1447
Tabl
e
5
–
Su
mm
ary
of
Pare
to
fron
t
for
the
inte
nsi
fied
seq
uen
ces,
M4.
Inte
nsi
fied
seq
uen
ces
Gro
up
Nu
mbe
rse
qu
ence
Nu
mbe
rco
lum
nTo
tal
stag
esFe
edst
age
Sid
est
age
1Si
de
stag
e
2V
apor
stag
eLi
qu
idst
age
Refl
ux
rati
oD
iam
eter
Tota
len
ergy
ofre
boil
er(m
)(G
W/y
ear)
2
colu
mn
s
DC
S
(con
ven
tion
alD
irec
t
seq
uen
ce)
126
8
–
–
–
–
18.3
4
0.86
8.88
2
51
24
3.83
1.01
11.0
73
5624
3.62
1.44
17.6
8
SG1
SI1
1
108
44
27
–
–
–
30.9
1
3.03
86.1
12
38
11
–
4.94
0.44
2.49
SI2
1
43
16
–
–
–
– 5.
74
2.13
46.4
72
4011
11
92.6
7
1.81
38.2
2
SG2
SI5
1
49
15
35
–
–
–
97.3
8
2.17
49.0
02
249
–
33.4
3
2.17
49.0
0
SG3
SI8
1
26
14
–
–
–
–
17.0
9
0.84
8.23
2
62
25
25
36.9
9
3.00
85.6
9
SI10
1
47
32
18
–
– –
602.
23
5.77
258.
222
33
15
–
10.2
9
2.04
41.9
9
Cou
ple
d
SG4
SI12
178
24
–
–
–
–
380.
86
1.40
21.3
82
79
–
17
33
37
–
4.39
145.
07
SG6
SI19
165
54
21
– 34
–
150.
46
2.52
62.7
82
22
–
–
–
37
–
0.47
–
SI20
1
77
58
42
–
11
–
438.
30
4.79
177.
312
28
–
–
–
15
–
0.40
–
SG8
SI27
1
29
12
–
–
–
–
33.0
9
0.85
–2
65–
4221
23–
2.99
85.2
0
1
colu
mn
SG9
SI30
1
97
63
19
38
–
–
199.
5
3.00
1
85.4
9
Author's personal copychemical engineering research and design 9 0 ( 2 0 1 2 ) 1425–1447 1443
Tabl
e
5
(Con
tin
ued
)
Inte
nsi
fied
seq
uen
ces
Gro
up
Nu
mbe
rse
qu
ence
Nu
mbe
rco
lum
nM
olar
flow
of
AM
olar
flow
of
BM
olar
flow
of
CM
olar
flow
of
DM
olar
flow
ofli
qu
id
Mol
arfl
ow
ofva
por
Th
erm
odyn
amic
effi
cien
cyC
O2
emis
-si
ons
Tota
lan
nu
alco
st
(Mto
n/y
ear)
�
(Mto
n/y
ear)
(MD
D/y
ear)
2
colu
mn
s
DC
S
(con
ven
tion
alD
irec
t
seq
uen
ce)
1
3.11
18.5
9
34.2
6
29.2
3
–
–
2.00
2.39
1.67
2 3
SG1
SI1
1
3.02
18.3
2
34.3
2
29.6
5
–
–
3.28
2.22
2.78
2
SI2
1
2.86
18.3
0
34.6
0
29.6
1
–
–
2.63
2.77
3.38
2
SG2
SI5
1
3.44
18.6
7
33.2
0
29.8
3
–
– 1.
86
3.01
3.81
2
SG3
SI8
13.
07
18.3
3
34.3
2
29.5
7
–
–
2.14
3.03
3.76
2
SI10
13.
06
18.6
5
28.8
4
29.1
5
–
–
0.68
9.52
10.8
92
Cou
ple
d
SG4
SI12
1
3.12
74.1
4
4.28
25.7
0
19.0
3
–
1.41
5.23
6.43
2
SG6
SI19
1
3.07
18.4
9
34.3
8
25.7
7 –
35.3
1
2.52
1.81
2.59
2
SI20
1
3.14
18.4
6
34.1
9
25.8
9
27.9
0
–
0.89
5.08
6.71
2
SG8
SI27
1
2.45
15.0
1
28.8
0
21.9
2
–
66.7
6
2.32
2.77
3.40
2
1
colu
mn
SG9
SI30
1
3.04
15.4
4
24.9
4
18.9
9
–
–
2.36
2.78
3.55

Author's personal copy1444 chemical engineering research and design 9 0 ( 2 0 1 2 ) 1425–1447
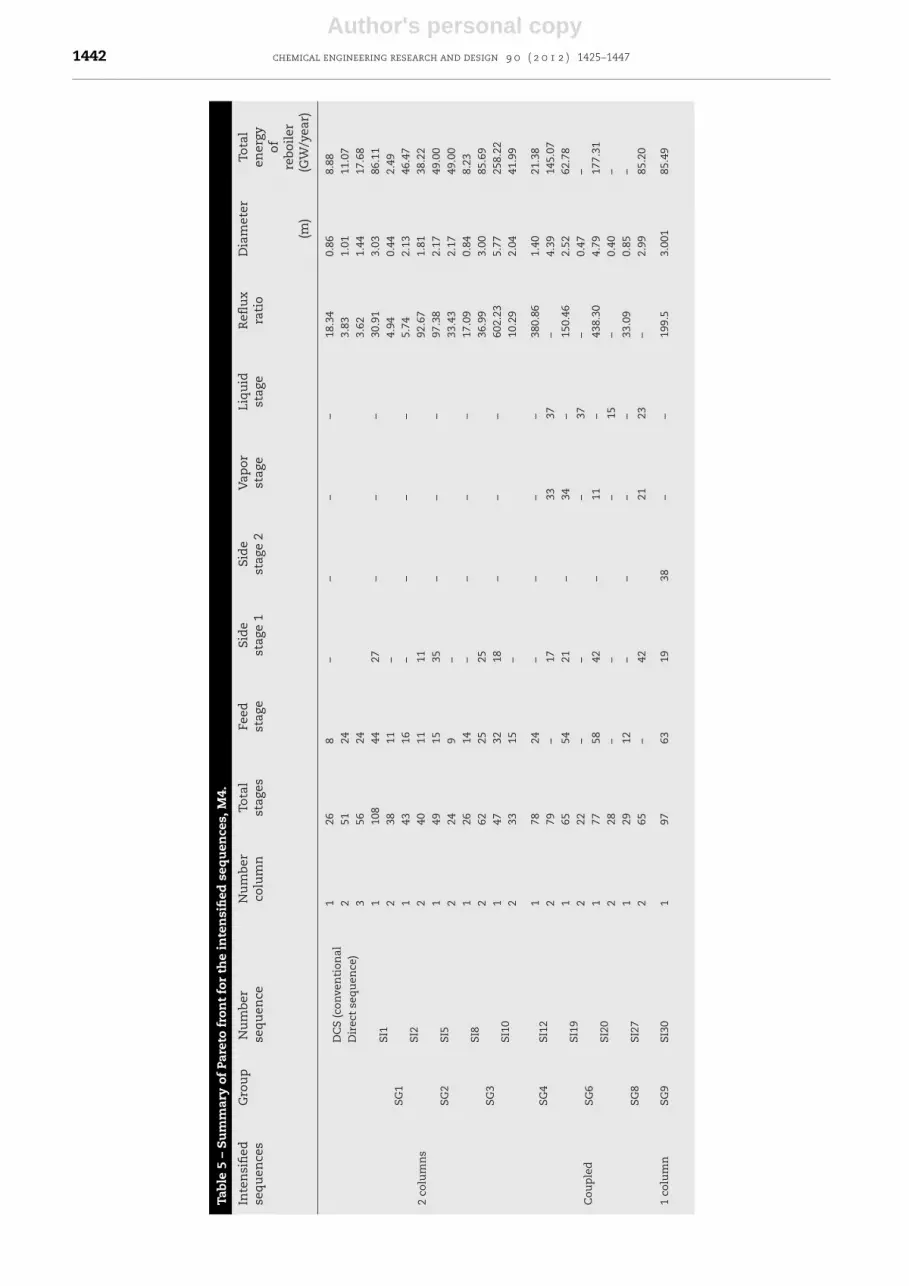
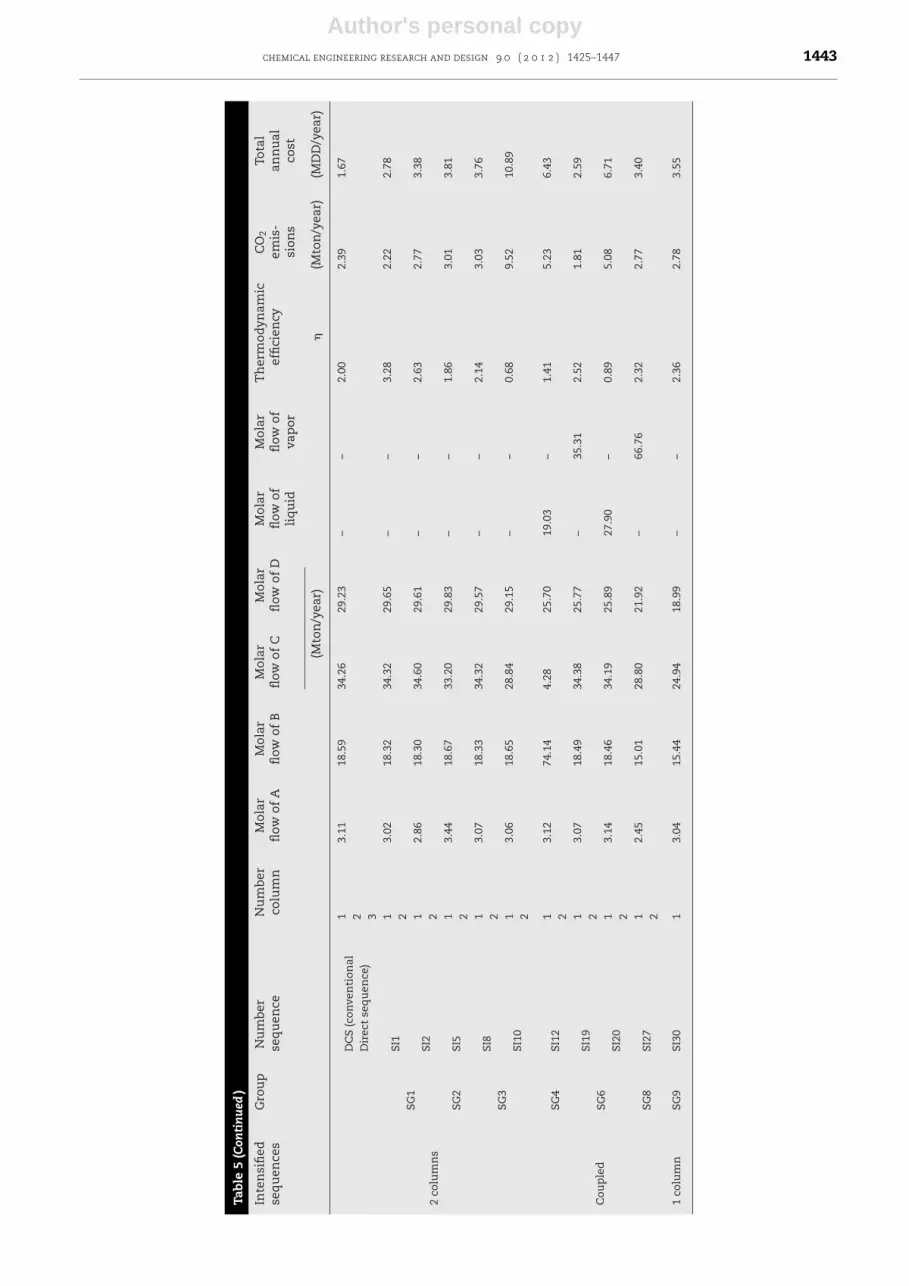
thermal coupling, and also with the single distillation column.Now, from Fig. 15 we observe that the lower energy consump-tions are showed by sequence SI20, with thermal coupling,where the separation cut of the mixture is performed betweenthe columns is C/D. In the group of schemes without thermalcoupling, the sequence that follows in energy consumption isSI2, where, again, we observe that the cut C/D is performedto pass from one column to another. In contrast with thebehavior observed in the previous mixtures, the lower energyconsumption is observed in a sequence with thermal coupling.In this mixture, a significant difference in energy consumptionis observed between sequence with and without thermallycoupled sequences. Also, the single distillation column, SI30,has a heat duty higher than the minimum value, but the high-est of all sequences for mixture M4 is SI10, Table 5.
It seems that when the configuration of the sequenceallows having the cut C/D to pass from first column to the sec-ond one the performance of separation is better. In this case,the purification of one intermediate and heavy component ishard, but they are in major proportion in the feed stream. Also,it is important to avoid making the cut considering the splitA/B; in this case, the difference in relative volatilities is bigbut the light component is present in a minor proportion (lessthan 10%). Due to this, the sequences SI12 (SG4), SI10 (SG3),and SI21 (SG6) have the worst performance in terms of energyconsumption. Nevertheless, sequence SI30 (SG9) has not thehigher energy consumption for this mixture.
From Fig. 15 we observe that the minimal energy consump-tion is presented in one sequence of two columns with thermalcoupling, SI20; being the schemes without thermal couplinghigher in energy consumption from this minimum value, forinstance SI10. The Table 5 shows thermodynamic efficiency,total annual cost and CO2 emissions for the sequences of allgroups. From this table we can observe that thermodynamicefficiency is greater in sequence SI1, followed by trains SI2;without doubt, a different tendency is found in heat duties,being the minimal energy presented in sequence SC1. As con-sequence, in sequence SI20 the CO2 emissions are lower.
For this particular case study, we see that if the light com-ponent presents the lowest composition, the minimum energyconsumption can be found if the sequence allows having thecut C/D to pass from first column to the second one the per-formance of separation, in those with thermal coupling.
4.5. Other observations for this case study
In the analysis presented before, some recommendationsabout the best scheme to separate a mixture with certain feedcomposition and relative volatilities are given. In this sec-tion, some other findings related to the sequences that arenot promising are given, in order to be applied in other studycases.
In general, the intensified sequences of two columns thatare linked between them through side streams are not feasiblefor the separation of quaternary mixtures; this due the puritiesand recoveries are not reached. We found that the feasibilityof an intensified scheme it depends on the feed composition,while the relative volatilities influence the energy consump-tion of the feasible scheme. Now, the feasibility of the schemecan be verified using distillation lines, since the columnsanalyzed in this study are staged. In order to verify this obser-vation, we calculate distillation lines that pass through adistillate composition for instance; then, we expect that inthis line the compositions of side and bottom streams were
0
0.1
0.2
0.3
0.4
0.5
0.6
0.7
0.8
0.9
1
35302520151050
Stage
x i
A
B
C
D
Fig. 16 – Composition profiles in liquid phase of the firstcolumn of sequence SI2, mixture M1.
located. The resulting line show that required compositionscannot be located in this line. Then, these schemes are notfeasible to separate the mixtures under consideration. In con-trast, the schemes of two columns with no side streams showa good behavior for the most of the cases analyzed, presentinglower energy consumptions and a reduced number of stages.These sequences are the best example of a desirable inten-sified process: reduction in capital costs (number of stages)with considerable heat duties, this in comparison with con-ventional sequences (N − 1 columns).
An unexpected behavior is that the use of intensifiedsequences of two columns that are thermally coupled showhigher energy consumptions, just below of the single distilla-tion columns with two side streams. From the obtained resultsit is clear that the energy consumption in these sequencesis higher than the requirements in schemes without thermalcoupling. Figs. 16 and 17 show the composition profiles of thefirst column of sequences SI2 and SI12 for mixture M1. Fromthese figures it is clear that component C is separated with ahigh purity in the first column of sequence SI12, with thermalcoupling, but this component is not extracted until the sec-ond column. On the other hand, the enrichment of the samecomponent in the first column of sequence SI2 is minor. Theenergy used to over purify C in the first column of the sequencewith thermal coupling is the main reason of the increasingin the energy consumption in thermal coupled sequences. Itseems that the principal feature that enables reducing energyin sequences with N − 1 columns with thermal coupling isthe one that causes increasing in energy consumption whenthe thermally coupled sequences contains less than N − 1columns.
0
0.1
0.2
0.3
0.4
0.5
0.6
0.7
0.8
0.9
1
605550454035302520151050
Stage
x i
A
B
C
D
Fig. 17 – Composition profiles in liquid phase of the firstcolumn of sequence SI12, mixture M1.
Author's personal copychemical engineering research and design 9 0 ( 2 0 1 2 ) 1425–1447 1445
Finally, the intensified sequences with just one distillationcolumn present, in general, the higher energy consumptionsof all studied sequences. In these columns, the reflux ratio isvery high since the components obtained in the side streamsrequire high purities and recoveries. Also, an elevated numberof stages is required.
5. Conclusions
A design methodology for generating optimal designs of inten-sified sequences with less than N − 1 distillation columnshas been presented. As design tool we used a multiobjec-tive genetic algorithm with constraints, which is coupled toAspen Plus in order to evaluate the objective and constraintsfunctions.
Results show that it is possible to separate mixture in thesesequences with less than N − 1 columns, with and withoutthermal coupling. The best configuration it depends on thenature of the mixture, feed composition, purities and recov-eries required. For the mixtures that we analyze, we foundthat sequences of less than N − 1 columns without thermalcoupling present the minor energy consumptions of all stud-ied sequences. This result was quite unexpected, consideringthat in sequences with N − 1 columns the thermally coupledones present minor energy consumptions.
Acknowledgments
Financial support of this work provided by Universidad deGuanajuato, CONCyTEG and CONACyT (México) is gratefullyacknowledged.
Appendix A.
The thermodynamic efficiencies of optimized designs of theTCDS schemes can be computed using the laws of the ther-modynamic. We used for this task the equations reported inthe textbook by Seader and Henley (2006). The equations are:
First Law of the thermodynamic:
∑out of system
(nh + Q + Ws) −∑
into system
(nh + Q + Ws) = 0 (A.1)
Second Law of the thermodynamic:
∑out of system
(ns + Q/Ts) −∑
into system
(ns + Q/Ts) = �Sirr (A.2)
Exergy balance:
∑into system
[nb + Q
(1 − T0
TS
)+ Ws
]−
∑out of system
[nb + Q
(1 − T0
TS
)+ Ws
]= LW (A.3)
Minimum work of separation:
Wmin =∑
out of system
nb −∑
into system
nb (A.4)
Second law efficiency where � is the thermodynamic effi-ciency:
� = Wmin
LW + Wmin(A.5)
The exergy function:
b = h − T0s (A.6)
The lost work in the system:
LW = T0�Sirr (A.7)
The thermodynamic properties like enthalpies andentropies of the streams of the distillation sequences wereevaluated through the use of the simulator of processesAspen One v12.1TM.
Appendix B.
The calculation of CO2 Emissions used framework Gadallaet al. (2005). Fuel is combusted when mixed with air, producingDioxide of Carbon (CO2) according to following stoichiometricequation:
CxHy +(
x + y
4
)O2 → xCO2 + y
2H2O (B.1)
where x and y denote the number of carbon, C, and hydro-gen, H, atoms, respectively, present in the fuel compositions,and where complete oxidation of carbon is assumed. The CO2
emissions, [CO2]Emiss (kg/s), are related to the amount of fuelburnt, QFuel (kW), in a heating device as follows (Gadalla et al.,2005):
[CO2]Emiss =(
QFuel
NHV
) (C%100
)˛ (B.2)
where ̨ (=3.67) is the ratio of molar masses of CO2 and C, whileNHV (kJ/kg) represents the net heating value of a fuel with acarbon content of C%. This is Equation B.1 shows that both:the fuel used and the heating device affect the amount of CO2
produced.The same theoretical flame temperature of 1800 ◦C may be
still used. The stack temperature of 160 ◦C is also used in thecalculations. The amount of fuel burnt can be calculated from(Gadalla et al., 2005):
QFuel = QProc
�Proc(hProc − 419)
TFTB − T0
TFTB − TStack(B.3)
where �Proc (kJ/kg) and hProc (kJ/kg) are the latent heat andenthalpy of steam delivered to the process, respectively, whileTFTB (◦C) is the flame temperature of the boiler flue gases.
Appendix C.
The costing of distillation column (carbon steel construction)was estimated by the cost equations showed in Turton et al.(2004) which are updated with the CEPCI (Chemical Engineer-ing Process Cost Index, in this case was 575.4).
Author's personal copy1446 chemical engineering research and design 9 0 ( 2 0 1 2 ) 1425–1447
The capital cost (purchase plus installation cost) is annu-alized over a period that is often referred to as plant life time,in this case is 5 years, considered 8400 h/y of operation:
Annual capital cost = Capital costPlant life time
(C.1)
Total Annual Cost (TAC) = Annual operating cost
+ Annual capital cost (C.2)
The total column cost is the sum of the installed cost ofcolumn shell and the installed cost of column trays. The sizingand costing of heat exchangers were calculated. The cost ofheat exchangers can be correlated as a function of the surfacearea assuming shell and tube, floating head, and carbon steelconstruction.
For a given number of theoretical trays, Aspen Plus sim-ulator calculates column diameter and height (for 24 in trayspacing) after converging for selected valve tray column with2 in weir height. Valve trays of Sieve type are considered.
References
Aggarwal, A., Floudas, C.A., 1990. Synthesis of general distillationsequences nonsharp separations. Comput. Chem. Eng. 14, 631.
Agrawal, R., 2003. Synthesis of multicomponent distillationcolumn configurations. AIChE J. 49, 379.
Andrecovich, M.J., Westerberg, A.W., 1985. An MILP formulationfor heat-integrated distillation sequence synthesis. AIChE J.31, 1461.
Aspen Plus 13.0, 2007. User Models. Aspen Technology, Inc.Bauer, M.H., Stichlmair, J., 1998. Design and economic
optimization of azeotropic distillation processes usingmixed-integer nonlinear programming. Comput. Chem. Eng.22, 1271.
Caballero, J.A., Grossmann, I.E., 1999. Aggregated models forintegrated distillation systems. Ind. Eng. Chem. Res. 38, 2330.
Coello-Coello, C.A., 2000. Constraint-handling using andevolutionary multiobjective optimization technique. Civil Eng.Environ. Systems 17, 319.
Deb, K., 2001. Multi-objective Optimization Using EvolutionaryAlgorithms. Wiley.
Deb, K., Pratap, A., Agarwal, S., Meyarivan, T., 2002. A fast andelitist multiobjective genetic algorithm: NSGA-II. IEEE Trans.Evol. Comput.× 6, 182.
Dunnebier, G., Pantelides, C.C., 1999. Optimal design of thermallycoupled distillation columns. Ind. Eng. Chem. Res. 38, 162.
Edgar, T.F., Himmelblau, D.M., Lasdon, L.M., 2001. Optimization ofChemical Processes, 2nd ed. McGraw-Hill, New York.
Errico, M., Rong, B.G., Tola, G., Turunen, I., 2009a. A method forsystematic synthesis of multicomponent distillation systemswith less than N − 1 columns. Chem. Eng. Process. ProcessIntensification 48, 907.
Errico, M., Tola, G., Mascia, M., 2009b. Energy saving in a crudedistillation unit by a preflash implementation. Appl. ThermalEng. 29, 1642.
Fidkowski, Z.T., 2006. Distillation configurations and their energyrequirements. AIChE J. 52 (6), 2098.
Fonyó, Z., Rév, E., Emtir, M., Szitkai, Z., Mizsey, P., 2001. Energysavings of integrated and coupled distillation systems.Comput. Chem. Eng. 25, 119–140.
Fraga, E.S., Matias, T.R., 1996. Synthesis and optimization of anonideal distillation system using a parallel geneticalgorithm. Comput. Chem. Eng. 20, 79.
Gadalla, M.A., Olujic, Z., Jansens, P.J., Jobson, M., Smith, R., 2005.Reducing CO2 emissions and energy consumption of
heat-integrated distillation systems. Environ. Sci. Technol. 39,6860.
Giridhar, A., Agrawal, R., 2010a. Synthesis of distillationconfigurations: I. Characteristics of a good search space.Comput. Chem. Eng. 34, 73.
Giridhar, A., Agrawal, R., 2010b. Synthesis of distillationconfigurations: II. A search formulation for basicconfigurations. Comput. Chem. Eng. 34, 84.
Glinos, K., Malone, M.F., 1989. Net work consumption indistillation — short-cut evaluation and applications tosynthesis. Comput. Chem. Eng. 13, 295.
Gómez-Castro, F.I., Segovia-Hernández, J.G., Hernández, S.,Gutiérrez-Antonio, C., Briones-Ramírez, A., 2008. Dividing walldistillation columns: optimization and control properties.Chem. Eng. Technol. 31, 1246.
Grosan, C., Abraham, A., Tigan, S., Chang, T.-G., 2006. How tosolve a multicriterion problem for which Pareto dominancerelationship cannot be applied? A case study from Medicine,Knowledge-Based Intelligent Information and EngineeringSystems. Lecture Notes Comp. Sci. 4253 (2006), 1128.
Gutiérrez-Antonio, C., Briones-Ramírez, A., 2009. Pareto front ofideal petlyuk sequences using a multiobjective geneticalgorithm with constraints. Comput. Chem. Eng. 33,454.
Kim, J.K., Wankat, P.C., 2004. Quaternary distillation systems withless than N–1 columns. Ind. Eng. Chem. Res. 43, 3838.
Leboreiro, J., Acevedo, J., 2004. Processes synthesis and design ofdistillation sequences using modular simulators: a geneticalgorithm framework. Comput. Chem. Eng. 28, 1223.
Martínez, M., Sanchis, J., Blasco, X., 2007. Global andwell-distributed pareto frontier by modified normalizednormal constraint methods for bicriterion problems. Struct.Multidiscip. Optim. 34, 197.
Martínez-Iranzo, M., Herrero, J.M., Sanchis, J., Blasco, X.,García-Nieto, S., 2009. Applied Pareto multi-objectiveoptimization by stochastic solvers. Eng. Appl. Artificial Intell.22, 455.
Méndez-Valencia, D.M., Vázquez-Ojeda, M., Segovia-Hernández,J.G., Bonilla-Petriciolet, A., 2008. Design and control propertiesof arrangements for distillation of four component mixturesusing less than N−1 columns. Chem. Biochem. Eng. Q. J. 22,273.
Messac, A., Ismail-Yahaya, A., Mattson, C.A., 2003. Thenormalized normal constraint method for generating thePareto frontier. Struct. Multidiscip. Optim. 25, 86–98.
Miranda-Galindo, E.Y., Segovia-Hernández, J.G., Hernández, S.,Gutiérrez-Antonio, C., Briones-Ramírez, A., 2011. Reactivethermally coupled distillation sequences: Pareto front. Ind.Eng. Chem. Res. 50, 926.
Nadgir, V.M., Liu, Y.A., 1983. Studies in chemical process designand synthesis: Part V: a simple heuristic method forsystematic synthesis of initial sequences for multicomponentseparations. AIChE J. 29, 926.
Nath, R., Motard, R.L., 1981. Evolutionary synthesis of separationprocesses. AIChE J. 27, 578.
Nguyen, D.Q., Bagajewicz, M., 2010. Optimization of preventivemaintenance in chemical process plants. Ind. Eng. Chem.Res., DOI: 10.1021/ie901433b.
Novak, Z., Kravanja, Z., Grossmann, I.E., 1996. Simultaneoussynthesis of distillation sequences in overall process schemesusing an improved MINLP approach. Comput. Chem. Eng. 20,1425.
Papalambros, P.Y., Wilde, D.J., 2000. Principles of Optimal Design:Modeling and Computation. Cambridge University Press.
Papalexandri, K.P., Pistikopoulos, E.N., 1996. Generalized modularrepresentation framework for process synthesis. AIChE J. 42,1010.
Paules IV, G.E., Floudas, C.A., 1990. A mixed-integer nonlinearprogramming formulation for the synthesis of heat-integrateddistillation sequences. Comput. Chem. Eng. 4, 1397.
Rong, B.G., Kraslawski, A., Turunen, I., 2003. Synthesis offunctionally distinct thermally coupled configurations forquaternary distillations. Ind. Eng. Chem. Res. 42, 1204.

Author's personal copychemical engineering research and design 9 0 ( 2 0 1 2 ) 1425–1447 1447
Seader, J.D., Henley, E., 2006. Separation Process Principles. Wileyand sons.
Siirola, J.D., Hauan, S., Westerberg, A.W., 2004. Computing Paretofronts using distributed agents. Comput. Chem. Eng. 29, 113.
Smith, E.M.B., Pantelides, C.C., 1995. Design ofreaction/separation networks using detailed models. Comput.Chem. Eng. 19, S83.
Teh, Y.S., Rangaiah, G.P., 2003. Tabu search for global optimizationof continuous functions with application to phase equilibriumcalculations. Comput. Chem. Eng. 27, 1665.
Turton, R., Bailie, R.C., Whiting, W.B. and Shaeiwitz, J.A., 2004.Analysis. Synthesis and Design of Chemical Process, 2ndedition. Prentice Hall.
Vázquez-Castillo, J.A., Venegas-Sánchez, J.A., Segovia-Hernández,J.G., Hernández-Escoto, H., Hernández, S., Gutiérrez-Antonio,C., Briones-Ramírez, A., 2009. Design and optimization, usinggenetic algorithms, of intensified distillation systems for aclass of quaternary mixtures. Comput. Chem. Eng. 33, 1841.
Viswanathan, J., Grossmann, I.E., 1993. Optimal feed locationsand number of trays for distillation columns with multiplefeeds. Ind. Eng. Chem. Res. 32, 2942.
Westerberg, A.W., 2004. A retrospective on design and processsynthesis. Comput. Chem. Eng. 28, 447.
Yeomans, H., Grossmann, I.E., 2000. Disjunctive programmingmodels for the optimal design of distillation columns andseparation sequences. Ind. Eng. Chem. Res. 39, 1637.