nonlinear dynamic matrix control for high-purity distillation columns
TRANSCRIPT
Nonlinear Dynamic Matrix Control for High-Purity Distillation Columns
The performance of Dynamic Matrix Control (DMC) for different prod- uct purity distillation columns is studied and compared with a conven- tional multiloop proportional-integral control structure (LV). The load- rejection capability (regulatory response) of DMC becomes worse than that of the conventional structure as product purity increases. Large load disturbances take the highly nonlinear system away from the nomi- nal linear model, adversely affecting the performance of DMC. The LV structure is less sensitive to process nonlinearities. However, simple nonlinear output transformations suggested by the fundamental design equations of the process give models that are quite insensitive to non- linearities of the process. This results in a nonlinearversion of DMC that has better performance than the standard DMC and it is much simpler than the gain and time constant scheduling DMC or adaptive DMC. The complexity of DMC when it is applied on systems with very large time constants is also addressed. Suggestions to overcome this problem are proposed.
Apostolos Georgiou, Christos Georgakis, William L. Luyben
Chemical Process Modeling and Control Research Center and
Department of Chemical Engineering Lehigh University
Bethlehem, PA 18015
Introduction The strong nonlinearities of many chemical processes such as
high-purity distillation columns limit the application of model- based linear multivariable controllers, such as DMC (Cutler, 1983) and IMC (Garcia and Morari, 1982), to relatively small ranges of the operating conditions. Imprecision of the process model makes it difficult to design model-based controllers even for fixed operating conditions. Maurath et al. (1985) applied multivariable predictive control, based on DMC principles, to two-point composition control of a low-purity column and reported that the predictive controller is adversely affected by modeling errors. This paper focuses on the application of DMC to different column designs with product purities ranging from 10,000 ppm to 10 ppm. It compares the regulatory response (feed composition disturbance) of conventional diagonal control structures (LV) with that of multivariable DMC controller.
Due to system nonlinearities, large load disturbances make the linear model inaccurate. This results in poor performance of the model-based DMC controller. McDonald and McAvoy (1985) applied DMC to a moderate-purity column (product
Present addrcss A. Gmrgiou is Chemical Engineering Dept., Princeton University. Princeton
Correspondence mnccrning this paper should be addresd to W. Luyben. NJ 08540.
purities 0.994/0.006). They reported that it is very difficult to obtain a representative process model for moderate and high- purity columns. To overcome the nonlinearity problem, they suggested the use of on-line multivariable gain and time con- stant scheduling techniques to update the process model. This results in nonlinear DMC that gives better performance than the standard DMC. However, they did not report any systematic comparison of DMC with conventional structures. In this paper, we suggest a simpler approach to overcome the strong nonlinear- ity of the high-purity columns.
First, we demonstrate that as we move from moderate-purity columns to high-purity columns, the regulatory performance of DMC becomes worse than the conventional diagonal propor- tional-integral (PI) controllers. Then, nonlinear output transfor- mations, often suggested by an analysis of the fundamental equations of the system, are used to reduce or eliminate the amount of apparent system nonlinearity. These transformations result in nonlinear LV (NLLV) and nonlinear DMC (NLDMC) controllers. The regulatory response of NLDMC is much better than that obtained by the standard DMC. The the- oretical basis of these output nonlinear transformations is found in the work of Koung and Harris (1987). More elaborate nonlin- ear transformations for high-purity columns have also been sug- gested by Alsop and Edgar (1987). Similar nonlinear transfor-
AIChE Journal August 1988 VoI. 34, No. 8 1287
mations for control of other chemical processes were proposed by Gustafsson and Waller (1983), Ogunnaike (1986a), and Georgakis (1986).
The objectives of this paper are: a ) to compare conventional diagonal control with the DMC design for moderate and high purity columns; and b) to show that the performance of DMC can be significantly improved by the use of nonlinear transfor- mation of the composition measurements.
Review of DMC The basic concepts of the DMC algorithm were presented
originally by Cutler and Ramaker (1979). Based on a linear pro- cess model, DMC calculates the required future changes in the manipulated variables that result in optimum setpoint tracking for a specified performance index. A brief development of the controller will be given here. For a detailed description, see Cutler (1983).
The output of a single-input, single-output (SISO) system can be computed from its impulse response model, {hi}, as fol- lows:
rn
Y k = yo -k h i m k - i + dk (1) i- 1
where yk is the value of the output y a t sampling time k ; hi is the i"' sampled impulse response coefficient; mk-i is the value of the input (manipulated) variable a t sampling time k-i; yo is the value of t h e y when k = 0; and dk is the load effect a t the sam- pling time k . The sampled step, {ai}, and impulse response, {h i } coefficient models are related as follows:
The DMC algorithm minimizes the square of the deviation between the predicted output trajectory and the setpoint values a t R future sampling periods by solving the constrained least squares minimization problem
.I(@) = [ ( A h - g)TQTQ(ASm - g) + K26mT6m] (3)
where J is the performance index to be minimized, @is a vector of the NC future input changes to be calculated, and Q is a diag- onal weighting matrix for the output components. A_ is the R x NC system dynamic matrix. K is the suppression factor or tun- ing parameter that penalizes the objective function for changes in the inputs 6m (Golub and VanLoan, 1980; Hoerl, 1962). In addition, the process model is used to update the output pro- jection error vector g a t the next R sampling times assuming no future control action. The future load effects are assumed to be equal to the present effect of the load disturbance since there is no knowledge of the future load effects. Therefore
=
d k + R = d,+,-, = . . . = d k = y r - Ui 6mk-j (4) i- I
where y r is the measurement of y a t sampling period k. The solution of the problem for the SISO system is
6m - = (ATQT@ _ _ + K2!)-lA_'QTQAE ( 5 )
where! is the identity matrix. If the same weighting factor used
1288 Aumst 1988
for all future outputs, then Q = I. The tuning factor K affects directly the performance and robustness of the system. A theo- retical analysis of the effect of the design parameters on the robustness and performance of DMC is given by Ogunnaike (1986b).
The extension of DMC to multiloop systems is straightfor- ward by partitioning matrices.
The Systems Studied Three different distillation columns, referred to as Columns
A, B, and C, were chosen as representative moderate-, high-, and very-high-purity columns.
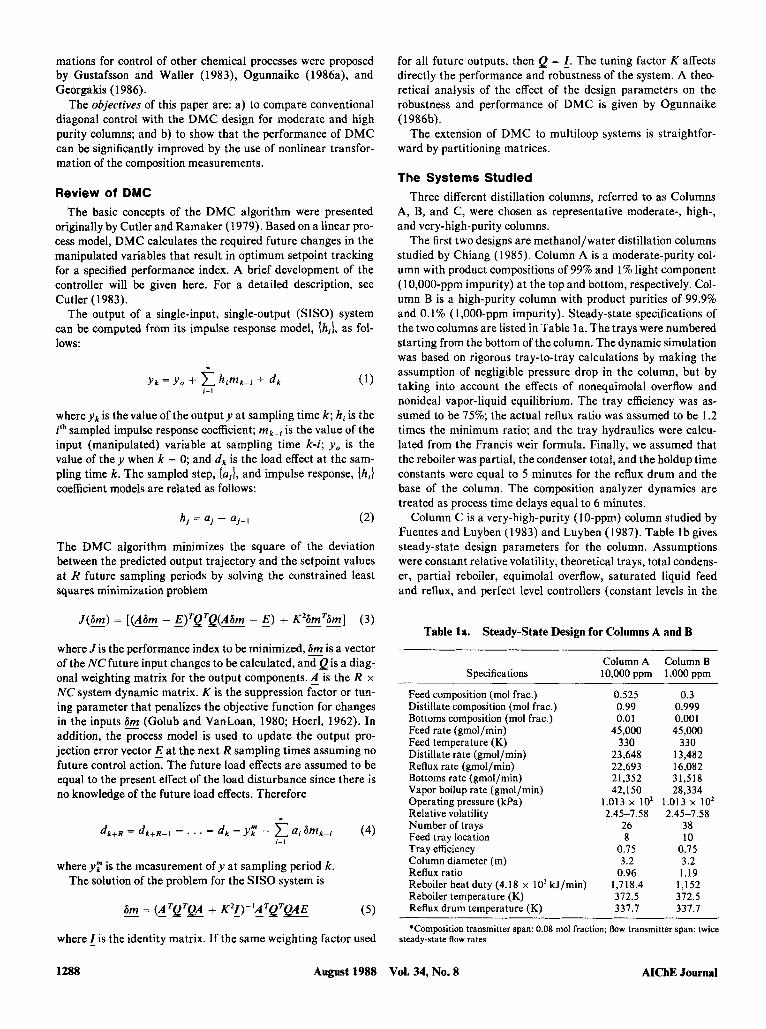
The first two designs are methanol/water distillation columns studied by Chiang (1985). Column A is a moderate-purity col- umn with product compositions of 99% and 1% light component (10,000-ppm impurity) a t the top and bottom, respectively. Col- umn B is a high-purity column with product purities of 99.9% and 0.1% (1,000-ppm impurity). Steady-state specifications of the twocolumns are listed in Table la . The trays were numbered starting from the bottom of the column. The dynamic simulation was based on rigorous tray-to-tray calculations by making the assumption of negligible pressure drop in the column, but by taking into account the effects of nonequimolal overflow and nonideal vapor-liquid equilibrium. The tray efficiency was as- sumed to be 75%; the actual reflux ratio was assumed to be 1.2 times the minimum ratio; and the tray hydraulics were calcu- lated from the Francis weir formula. Finally, we assumed that the reboiler was partial, the condenser total, and the holdup time constants were equal to 5 minutes for the reflux drum and the base of the column. The composition analyzer dynamics are treated as process time delays equal to 6 minutes.
Column C is a very-high-purity (10-ppm) column studied by Fuentes and Luyben (1983) and Luyben (1987). Table lbgives steady-state design parameters for the column. Assumptions were constant relative volatility, theoretical trays, total condens- er, partial reboiler, equimolal overflow, saturated liquid feed and reflux, and perfect level controllers (constant levels in the
Table la. Steady-State Design for Columns A and B
Column A Column B Specifications 10.000 ppm 1,000 ppm
Feed composition (mol frac.) Distillate composition (mol frac.) Bottoms composition (mol frac.) Feed rate (gmol/min) Feed temperature (K) Distillate rate (gmol/min) Reflux rate (gmol/min) Bottoms rate (gmol/min) Vapor boilup rate (gmol/min) Operating pressure (kPa) Relative volatility Number of trays Feed tray location Tray efficiency Column diameter (m) Reflux ratio Reboiler heat duty (4.18 x 10' kJ/min) Reboiler temperature (K) Reflux drum temperature (K)
0.525 0.99 0.01
45,000 330
23,648 22,693 21,352 42,150
1.013 x lo2 26 8
0.75 3.2
0.96 1,718.4 372.5 337.7
2.45-7.58
0.3 0.999 0.001 45,000
330 13,482 16,082 31,518 28,334
1.013 x lo2 2.45-7.58
38 10
0.75 3.2 1.19
1,152 372.5 337.7
*Composition transmitter span: 0.08 mol fraction; flow transmitter span: twice steady-state flow rates
~ ~~. ~ ~ Vol. 34, No. 8 AICW Journal
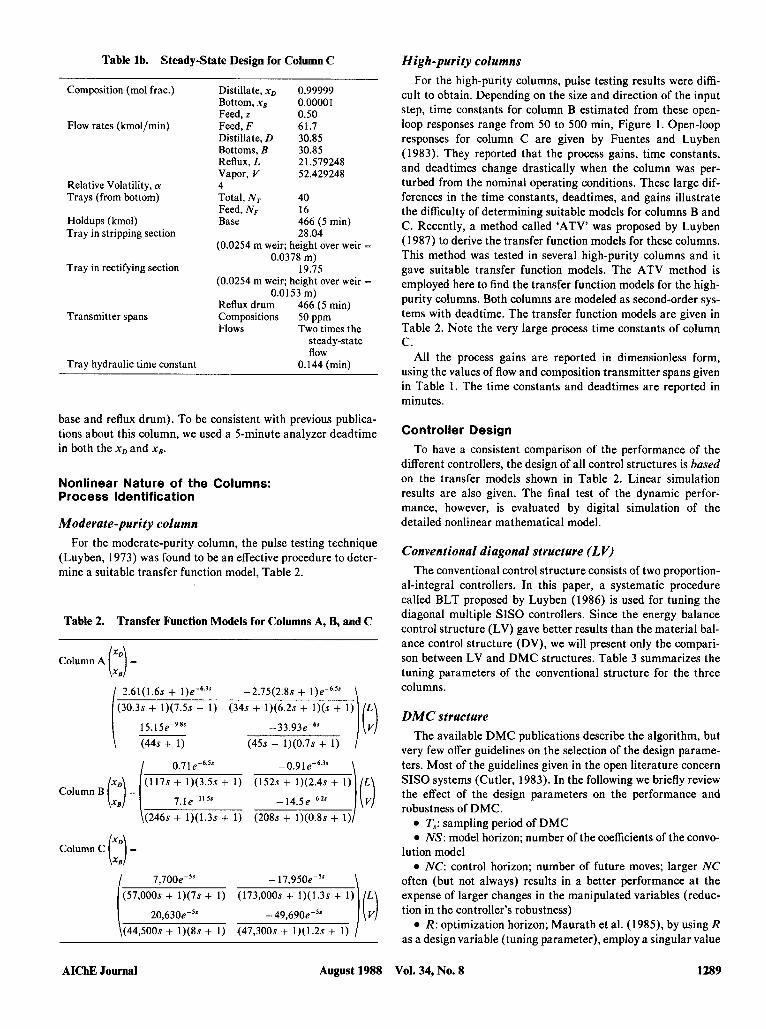
Table lb. Steady-State Design for Column C
Composition (mol frac.) Distillate, x, 0.99999 Bottom, x, 0.00001 Feed, z 0.50
Flow rates (kmol/min) Feed, F 61.7 Distillate, D 30.85 Bottoms, B 30.85 Reflux, L 21.579248 Vapor, V 52.429248
Relative Volatility, 01 4 Trays (from bottom) Total, NT 40
Feed, NF 16 Holdups (kmol) Base 466 (5 min) Tray in stripping section 28.04
(0.0254 m weir; height over weir - 0.0378 m)
(0.0254 m weir; height over weir =
0.0153 m) Reflux drum 466 (5 min)
Flows Two times the steady-state flow
Tray in rectifying section 19.75
Transmitter spans Compositions 50 ppm
Tray hydraulic time constant 0.144 (min)
base and reflux drum). To be consistent with previous publica- tions about this column, we used a 5-minute analyzer deadtime in both the xD and xB.
Nonlinear Nature of the Columns: Process Identification
Moderate-purity column For the moderate-purity column, the pulse testing technique
(Luyben, 1973) was found to be an effective procedure to deter- mine a suitable transfer function model, Table 2.
Table 2. Transfer Function Models for Columns A, B, and C
2.61(1.6s + l)e-6.3” (30.3s + 1)(7.5s + 1)
-2.75(2.8s + l)e-6.5’ (34s + 1)(6.2s + l)(s + 1) L
15.15e-9,8” -33.93eP” )Id i (44s + I ) (45s + 1)(0.7s + 1)
0.7 1 e-6.5s -0.91 e-6.3s (117s + 1)(3.5s + 1) (152s + 1)(2.4s + 1)
- 14.5e-6.25 (208s + 1)(0.8s + 1)
7.1 e-11.5r Column B 1:;) = 1
(246s + 1)(1.3s + 1)
Column c t) =
7,700e-’” - 17,950e-5s (57,000s + 1)(7s + 1) (173,000s + 1)(1.3s + 1)
20,63Oe-” -49,690ed” i (44,500s + 1)(8s + 1) (47,300s + 1)(1.2s + 1)
AIChE Journal August 1988
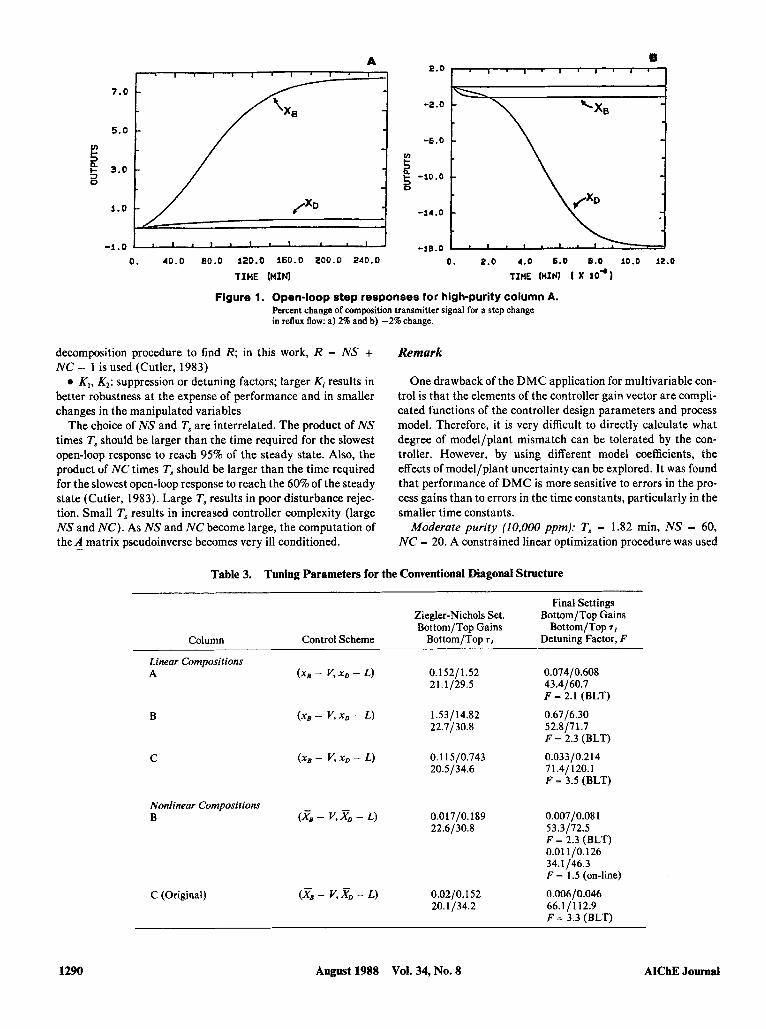
High-purity columns For the high-purity columns, pulse testing results were diffi-
cult to obtain. Depending on the size and direction of the input step, time constants for column B estimated from these open- loop responses range from 50 to 500 min, Figure 1. Open-loop responses for column C are given by Fuentes and Luyben (1983). They reported that the process gains, time constants, and deadtimes change drastically when the column was per- turbed from the nominal operating conditions. These large dif- ferences in the time constants, deadtimes, and gains illustrate the difficulty of determining suitable models for columns B and C. Recently, a method called ‘ATV’ was proposed by Luyben (1987) to derive the transfer function models for these columns. This method was tested in several high-purity columns and it gave suitable transfer function models. The ATV method is employed here to find the transfer function models for the high- purity columns. Both columns are modeled as second-order sys- tems with deadtime. The transfer function models are given in Table 2. Note the very large process time constants of column C.
All the process gains are reported in dimensionless form, using the values of flow and composition transmitter spans given in Table 1. The time constants and deadtimes are reported in minutes.
Controller Design To have a consistent comparison of the performance of the
different controllers, the design of all control structures is based on the transfer models shown in Table 2. Linear simulation results are also given. The final test of the dynamic perfor- mance, however, is evaluated by digital simulation of the detailed nonlinear mathematical model.
Conventional diagonal structure (LV) The conventional control structure consists of two proportion-
al-integral controllers. In this paper, a systematic procedure called BLT proposed by Luyben (1986) is used for tuning the diagonal multiple SISO controllers. Since the energy balance control structure (LV) gave better results than the material bal- ance control structure (DV), we will present only the compari- son between LV and DMC structures. Table 3 summarizes the tuning parameters of the conventional structure for the three columns.
DMC structure The available DMC publications describe the algorithm, but
very few offer guidelines on the selection of the design parame- ters. Most of the guidelines given in the open literature concern SISO systems (Cutler, 1983). In the following we briefly review the effect of the design parameters on the performance and robustness of DMC.
T,: sampling period of DMC NS: model horizon; number of the coefficients of the convo-
lution model NC: control horizon; number of future moves; larger NC
often (but not always) results in a better performance a t the expense of larger changes in the manipulated variables (reduc- tion in the controller’s robustness)
R: optimization horizon; Maurath et al. (1985), by using R as a design variable (tuning parameter), employ a singular value
Vol. 34, No. 8 1289
B 2.0
A 1 ~ l ~ l ' l ' ~ ~ l 1 ' 1 ' 1 ' 1 ' 1 *
7.0 -
5 . 0 - -6.0 -
-
1 , 1 1 1 . 1 -1.0 0 . 40.0 80.0 120.0 160.0 200.0 240.0 0 . 2 .0 4.0 6.0 B.0 10.0 12.0
TIME (HIN) TIHE (MINI X SO*)
Figure 1. Open-loop step responses for high-purity column A. Percent change of compition transmitter signal for a step change in retlux flow: a) 2% and b) -2% change.
decomposition procedure to find R; in this work, R = N S + NC - 1 is used (Cutler, 1983)
K , , &: suppression or detuning factors; larger Kl results in better robustness at the expense of performance and in smaller changes in the manipulated variables
The choice of NS and T, are interrelated. The product of NS times T, should be larger than the time required for the slowest open-loop response to reach 95% of the steady state. Also, the product of NC times T, should be larger than the time required for the slowest open-loop response to reach the 60% of the steady state (Cutler, 1983). Large T, results in poor disturbance rejec- tion. Small T, results in increased controller complexity (large NS and N C ) . As NS and NC become large, the computation of the A - matrix pseudoinverse becomes very ill conditioned.
Remark
One drawback of the DMC application for multivariable con- trol is that the elements of the controller gain vector are compli- cated functions of the controller design parameters and process model. Therefore, it is very difficult to directly calculate what degree of model/plant mismatch can be tolerated by the con- troller. However, by using different model coefficients, the effects of model/plant uncertainty can be explored. It was found that performance of DMC is more sensitive to errors in the pro- cess gains than to errors in the time constants, particularly in the smaller time constants.
Moderate purity (10,000 ppm): T, = 1.82 min, NS = 60, NC = 20. A constrained linear optimization procedure was used
Table 3. Tuning Parameters for the Conventional Diagonal Structure
Final Settings Ziegler-Nichols Set. BottomfTop Gains BottomfTop Gains BottomfTop T ,
Column Control Scheme BottomfTop T, Detuning Factor, F
Linear Compositions A ( X B - Y ~ X D - L) 0.1 5211.52 0.074/0.608
21.1129.5 43.4160.7 F - 2.1 (BLT)
B
C
( x B - v, X D - L) 1.53114.82 0.6716.30 22.7130.8 52.8171.7
F = 2.3 (BLT)
( X B - v, x D - L) 0.1 15/0.743 0.033/0.214 20.5134.6 71.41 120.1
F - 3.5 (BLT)
Nonlinear Compositions B (XB - v,XD - L ) 0.017/0.189 0.007/0.081
22.6130.8 53.31725 F = 2.3 (BLT) 0.01 110.1 26 34.1 146.3 F = 1.5 (on-line)
C (Original) ( X B - v, X D - ,!,) 0.02/0.152 0.006/0.046 20.1134.2 66.11112.9
F = 3.3 (BLT)
1290 August 1988 Vol. 34, No. 8 AIChE Journal
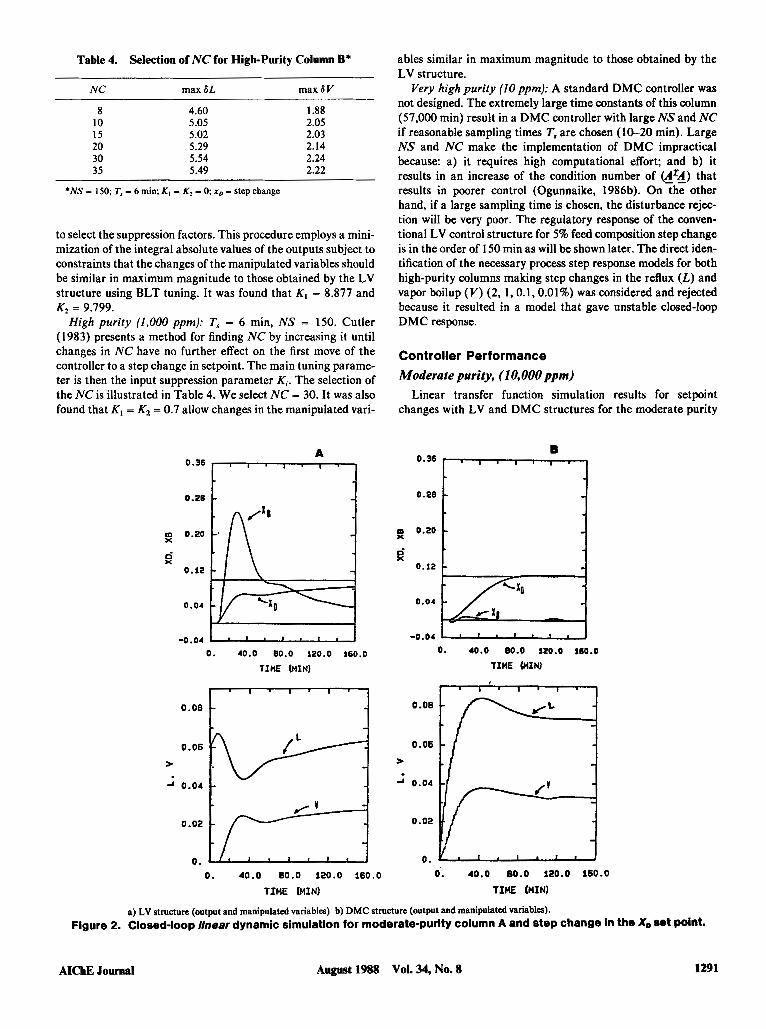
Table 4. Selection of NC for High-Purity Column B*
NC max 6 L max 6 V
8 10 15 20 30 35
4.60 5.05 5.02 5.29 5.54 5.49
1.88 2.05 2.03 2.14 2.24 2.22
*NS - 1 5 0 T, - 6 min; K, - K2 - 0; x, - step change
to select the suppression factors. This procedure employs a mini- mization of the integral absolute values of the outputs subject to constraints that the changes of the manipulated variables should be similar in maximum magnitude to those obtained by the LV structure using BLT tuning. It was found that K, = 8.877 and
High purity (1,000 ppm): T, = 6 min, NS = 150. Cutler (1983) presents a method for finding NC by increasing it until changes in NC have no further effect on the first move of the controller to a step change in setpoint. The main tuning parame- ter is then the input suppression parameter Ki. The selection of the NC is illustrated in Table 4. We select NC = 30. It was also found that K, = K2 = 0.7 allow changes in the manipulated vari-
K2 = 9.799.
A 0.36 I , , , , , 1
0.28 1 m 0.20 x
0.12
0.04
1
-0.04
0. 40.0 80.0 120.0 i60.0
TIME (MINI
ables similar in maximum magnitude to those obtained by the LV structure.
Very high purity (10 ppm): A standard DMC controller was not designed. The extremely large time constants of this column (57,000 min) result in a DMC controller with large NS and NC if reasonable sampling times T, are chosen (10-20 min). Large NS and NC make the implementation of DMC impractical because: a) it requires high computational effort; and b) it results in an increase of the condition number of (4'4) that results in poorer control (Ogunnaike, 1986b). On the other hand, if a large sampling time is chosen, the disturbance rejec- tion will be very poor. The regulatory response of the conven- tional LV control structure for 5% feed composition step change is in the order of 150 min as will be shown later. The direct iden- tification of the necessary process step response models for both high-purity columns making step changes in the reflux ( L ) and vapor boilup ( V ) (2, 1,O. 1,0.01%) was considered and rejected because it resulted in a model that gave unstable closed-loop DMC response.
Controller Performance Moderate purity, (10,000 ppm)
Linear transfer function simulation results for setpoint changes with LV and DMC structures for the moderate purity
-0.04 1-J 0 . 40.0 80.0 120.0 1so.o
TIME WIN)
0.08
0.06
W
0.04
0.02
0 .
0 . 40.0 80.0 120.0 160.0
TIME (MIN)
0 . 40.0 80.0 120.0 160.0
TIME (MINI
a) LV structure (output and manipulated variables) b) DMC structure (output and manipulated variables). Figure 2. Closed-loop linear dynamic simulation for moderate-purity column A and step change in the X, ret point.
AICbE Journal August 1988 Vol. 34, No. 8 1291
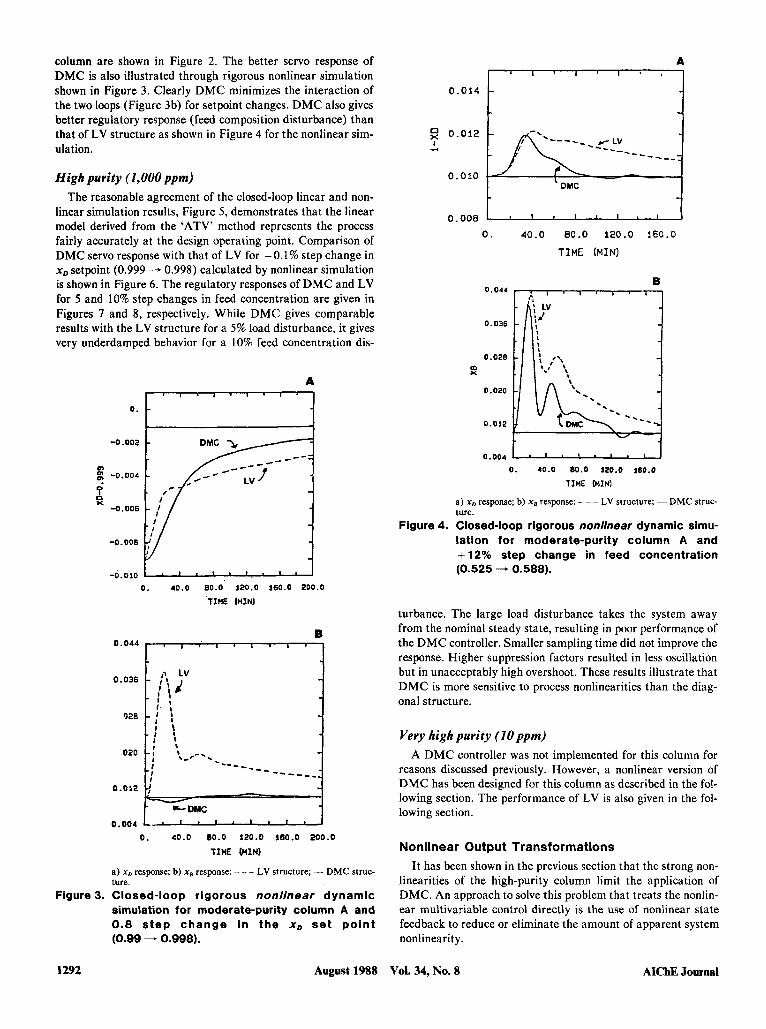
column are shown in Figure 2. The better servo response of DMC is also illustrated through rigorous nonlinear simulation shown in Figure 3. Clearly DMC minimizes the interaction of the two loops (Figure 3b) for setpoint changes. DMC also gives better regulatory response (feed composition disturbance) than that of LV structure as shown in Figure 4 for the nonlinear sim- ulation.
0.012
High purity (1,000 ppm) The reasonable agreement of the closed-loop linear and non-
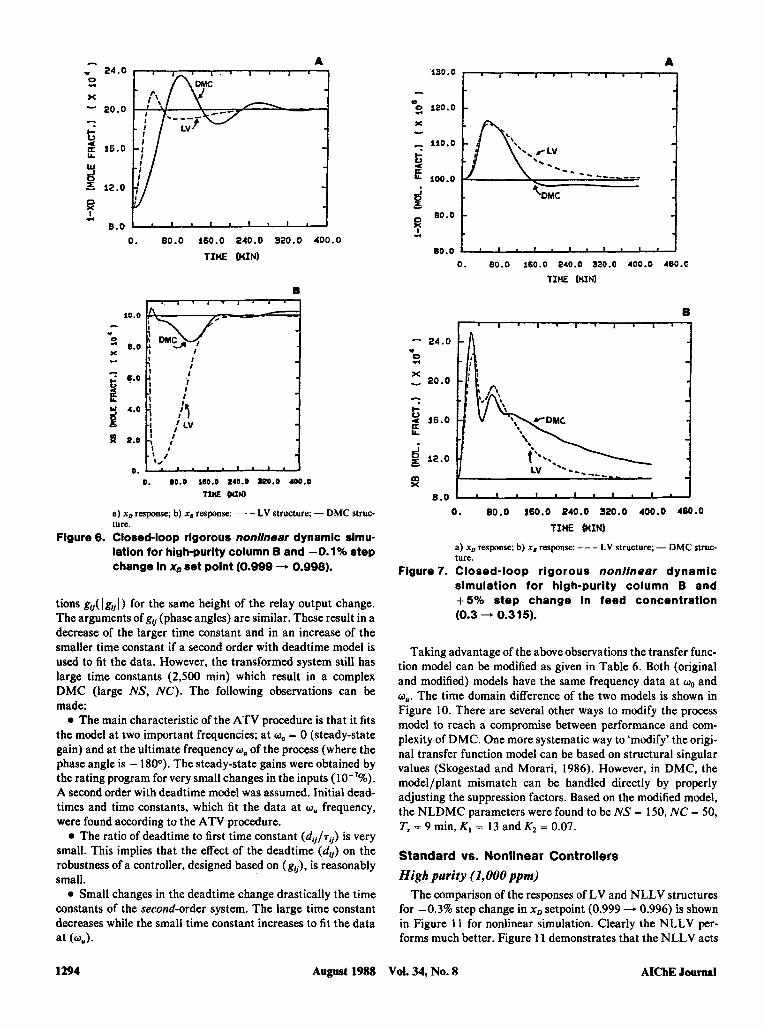
linear simulation results, Figure 5, demonstrates that the linear model derived from the 'ATV' method represents the process fairly accurately at the design operating point. Comparison of DMC servo response with that of LV for -0.1% step change in x, setpoint (0.999 - 0.998) calculated by nonlinear simulation is shown in Figure 6 . The regulatory responses of DMC and LV for 5 and 10% step changes in feed concentration are given in Figures 7 and 8, respectively. While DMC gives comparable results with the LV structure for a 5% load disturbance, it gives very underdamped behavior for a 10% feed concentration dis-
+ -=, , , ]
m m ? 0
0 x
Figure 3.
1292
A
-0.002 -
-0.004 - -
-
0 . 40.0 80.0 120.0 160.0 200.0
TIHE It4IN1
0.036
328
020
A
1 ' 1 ' " 1 " 1 t 0.014
0.008 0. 40.0 80.0 120.0 160.0
TIME ( M I N I
0.044
0.036
0.028 m x
0.020
0.012
B
0.004
0 . 40.0 80.0 120.0 160.0
TIME (MINI
a) xo response; b) x, response: - - - LV structure; - DMC struc- ture.
Figure 4. Closed-loop rigorous nonlinear dynamic simu- lation for moderate-purity column A and +12% step change in feed concentration (0.525 - 0.588).
turbance. The large load disturbance takes the system away from the nominal steady state, resulting in poor performance of the DMC controller. Smaller sampling time did not improve the response. Higher suppression factors resulted in less oscillation but in unacceptably high overshoot. These results illustrate that DMC is more sensitive to process nonlinearities than the diag- onal structure.
Very high purity (10 ppm) A DMC controller was not implemented for this column for
reasons discussed previously. However, a nonlinear version of DMC has been designed for this column as described in the fol- lowing section. The performance of LV is also given in the fol- lowing section.
Nonlinear Output Transformations It has been shown in the previous section that the strong non-
linearities of the high-purity column limit the application of DMC. An approach to solve this problem that treats the nonlin- ear multivariable control directly is the use of nonlinear state feedback to reduce or eliminate the amount of apparent system nonlinearity.
August 1988 Vol. 34, No. 8 AIChE Journsi
B
0. M.0 160.0 140.0 320.0 400.0
TInE WIM
2 . 0 , ' , " , , . I . I
-2.0 - - .(
-6.0
2
-IO.O
-14.0 a d 0. 80.0 160.0 240.0 320.0 400.0
TIHE WIN)
0 . ro.6 160.0 240.0 110.0 1 ~ 0 . 0
TIME WIN)
-2.0
- 1 K
> -6.0
-I
-10.0
-14.0
0. BO.0 160.0 240.0 920.0 400.0
TIHE WIN)
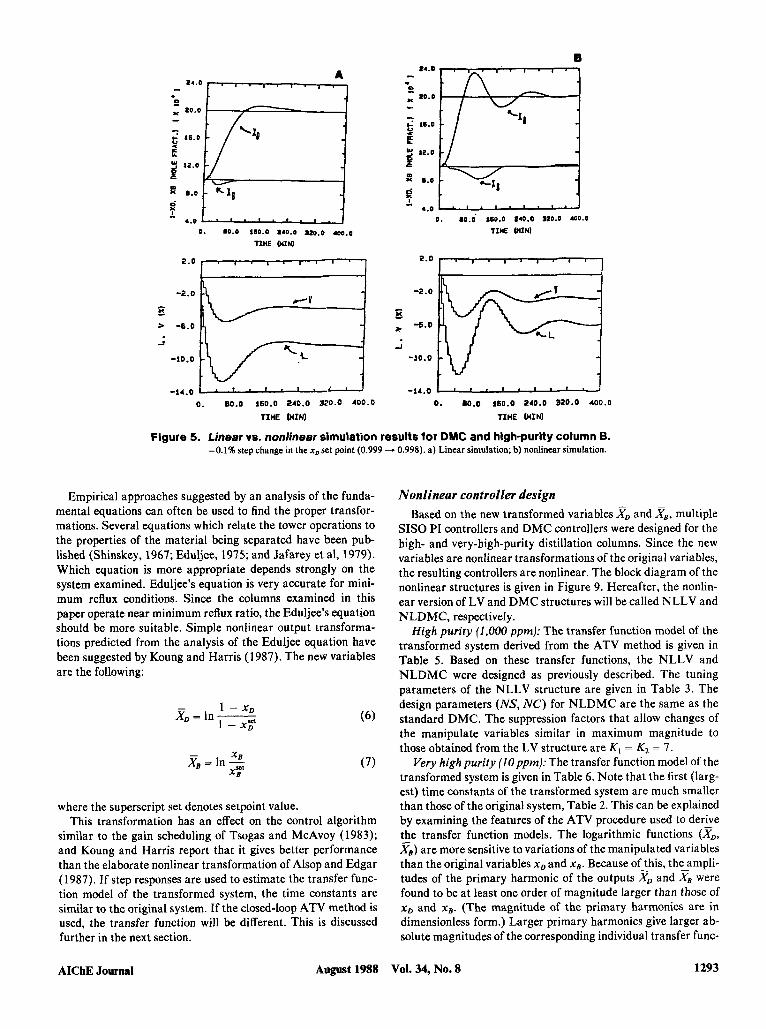
Figure 5. Linear vs. nonlinear simulation results for DMC and high-purity column B. -0.1% step change in the x, set point (0.999 -. 0.998). a) Linear simulation; b) nonlinear simulation.
Empirical approaches suggested by an analysis of the funda- mental equations can often be used to find the proper transfor- mations. Several equations which relate the tower operations to the properties of the material being separated have been pub- lished (Shinskey, 1967; Eduljee, 1975; and Jafarey et al, 1979). Which equation is more appropriate depends strongly on the system examined. Eduljee's equation is very accurate for mini- mum reflux conditions. Since the columns examined in this paper operate near minimum reflux ratio, the Eduljee's equation should be more suitable. Simple nonlinear output transforma- tions predicted from the analysis of the Eduljee equation have been suggested by Koung and Harris (1987). The new variables are the following:
(7)
where the superscript set denotes setpoint value. This transformation has an effect on the control algorithm
similar to the gain scheduling of Tsogas and McAvoy (1 983); and Koung and Harris report that it gives better performance than the elaborate nonlinear transformation of Alsop and Edgar (1 987). If step responses are used to estimate the transfer func- tion model of the transformed system, the time constants are similar to the original system. If the closed-loop ATV method is used, the transfer function will be different. This is discussed further in the next section.
Nonlinear controller design Based on the new transformed variables zD and XB, multiple
SISO PI controllers and DMC controllers were designed for the high- and very-high-purity distillation columns. Since the new variables are nonlinear transformations of the original variables, the resulting controllers are nonlinear. The block diagram of the nonlinear structures is given in Figure 9. Hereafter, the nonlin- ear version of LV and DMC structures will be called NLLV and NLDMC, respectively. High purity (1,000 ppm): The transfer function model of the
transformed system derived from the ATV method is given in Table 5. Based on these transfer functions, the NLLV and NLDMC were designed as previously described. The tuning parameters of the NLLV structure are given in Table 3. The design parameters (NS, NC) for NLDMC are the same as the standard DMC. The suppression factors that allow changes of the manipulate variables similar in maximum magnitude to those obtained from the LV structure are K, = K2 = 7 .
Very high purity (IOppm): The transfer function model of the transformed system is given in Table 6. Note that the first (larg- est) time constants of the transformed system are much smaller than those of the original system, Table 2. This can be explained by examining the features of the ATV procedure used to derive the transfer function models. The logarithmic functions (TD, xB) are more sensitive to variations of the manipulated variables than the original variables x D and x B . Because of this, the ampli- tudes of the primary harmonic of the outputs zD and FB were found to be a t least one order of magnitude larger than those of x D and xB. (The magnitude of the primary harmonics are in dimensionless form.) Larger primary harmonics give larger ab- solute magnitudes of the corresponding individual transfer func-
AIChE Journal August 1988 Vol. 34, NO. 8 1293
- . 24.0 2 x - 20.0 - c V
LL 16.0
2 z 12.0 0 x r(
8.0 0. 80.0 160.0 240.0 320.0 400;O
TIME WIN)
10.0 - . 0.0 ::
x - - 6 6 - O
B 2 4.0
a 2.0
0. 0. 00.0 110.0 24D.0 m.0 400.0
T M WNI
a) x, response; b) x, response: - - - LV structure; - DMC struc- ture.
Figure 6. Closed-loop rigorous nonlinear dynamic simu- lation for high-purity column B and -0.1% step change in x,, set point (0.999 - 0.998).
tions gi,(lgi,l) for the same height of the relay output change. The arguments of g,, (phase angles) are similar. These result in a decrease of the larger time constant and in an increase of the smaller time constant if a second order with deadtime model is used to fit the data. However, the transformed system still has large time constants (2,500 min) which result in a complex DMC (large NS, NC). The following observations can be made:
The main characteristic of the ATV procedure is that it fits the model at two important frequencies; at w, = 0 (steady-state gain) and at the ultimate frequency w, of the process (where the phase angle is - 180O). The steady-state gains were obtained by the rating program for very small changes in the inputs (lo-’%). A second order with deadtime model was assumed. Initial dead- times and time constants, which fit the data at w, frequency, were found according to the ATV procedure.
The ratio of deadtime to first time constant (d,,/Ti,) is very small. This implies that the effect of the deadtime (d,) on the robustness of a controller, designed based on (8,). is reasonably small.
Small changes in the deadtime change drastically the time constants of the second-order system. The large time constant decreases while the small time constant increases to fit the data at (4.
A
‘530*0 2
0 . 80.0 160.0 240.0 120.0 400.0 480.0
TIHE (HIM
- 24.0 .. s: - 20.0
t‘
x
- 2 36.0
-I g 12.0 5?
8 .01 ’ ’ ’ I I ’ I ’ I 0. 80.0 160.0 240.0 320.0 400.0 480.0
Figure 7.
TIME MXN)
a) xD response; b) x. response: - - - LV structure; - DMC struc- ture. C I o sed- I oo p rigor o u 8 noniin ear d y n a m ic simulation for high-purity column B and +5% step change in feed concentration (0.3 - 0.315).
Taking advantage of the above observations the transfer func- tion model can be modified as given in Table 6. Both (original and modified) models have the same frequency data at wo and w,. The time domain difference of the two models is shown in Figure 10. There are several other ways to modify the process model to reach a compromise between performance and com- plexity of DMC. One more systematic way to ‘modify’ the origi- nal transfer function model can be based on structural singular values (Skogestad and Morari, 1986). However, in DMC, the model/plant mismatch can be handled directly by properly adjusting the suppression factors. Based on the modified model, the NLDMC parameters were found to be NS = 150, NC = 50, T, = 9 min, K, = 13 and K2 = 0.07.
Standsrd vs. Nonlinear Controllers High purity (1,000 ppm)
The comparison of the responses of LV and NLLV structures for -0.3% step change in x, setpoint (0.999 - 0.996) is shown in Figure 11 for nonlinear simulation. Clearly the NLLV per- forms much better. Figure 11 demonstrates that the NLLV acts
1294 August 1988 Vol. 34, No. 8 AIChE Journal
- 14.0 . 2 - ,12.0 X
- t 2 10.0 a L
p 8.0 - 0 x -.I 6.0
$0.0 - t z 40.0 x - - a0.0 t 5 m.0
g 10.0
B I ” ’ ” ” ’ ” ’ 1
0. 0. 10.0 tW.0 240.0 M . 0 400.0 4110.0
TIHE WNJ
a) x, response; b) xB response: - - - LV structure; - DMC struc- ture.
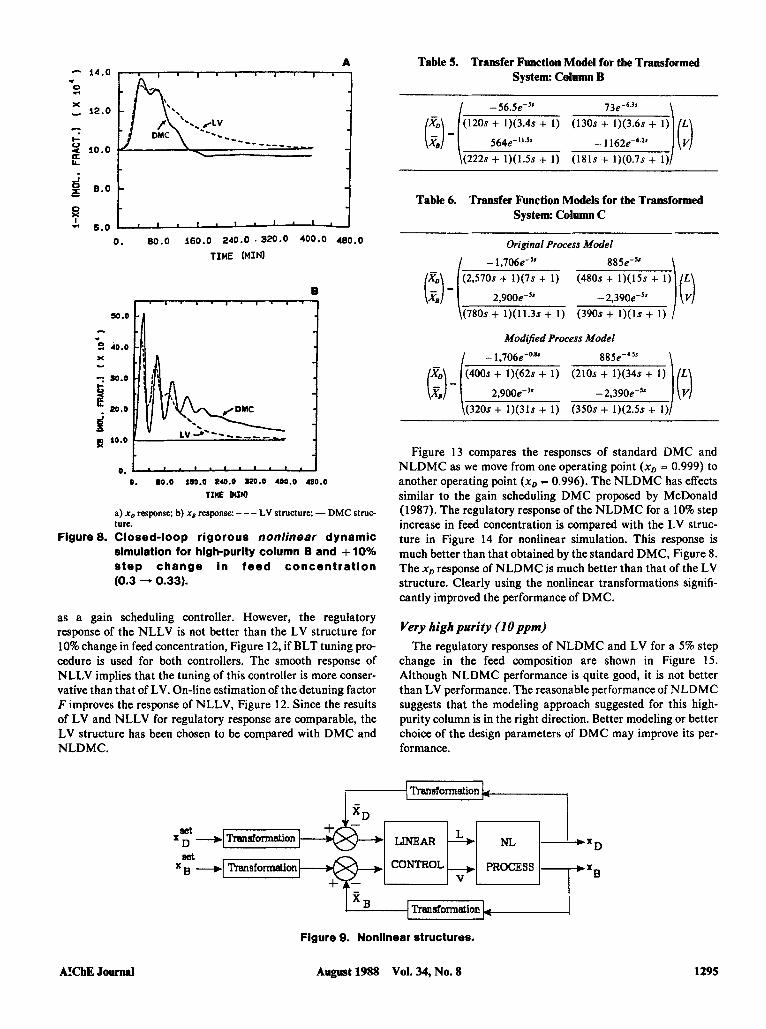
Figure 8. Closed-loop rigorous nonlinear dynamic simulation for high-purity column B and + 10% step change in feed concentration (0.3 - 0.33).
as a gain scheduling controller. However, the regulatory response of the NLLV is not better than the LV structure for 10% change in feed concentration, Figure 12, if BLT tuning pro- cedure is used for both controllers. The smooth response of NLLV implies that the tuning of this controller is more conser- vative than that of LV. On-line estimation of the detuning factor F improves the response of NLLV, Figure 12. Since the results of LV and NLLV for regulatory response are comparable, the LV structure has been chosen to be compared with DMC and NLDMC.
Table 5. Transfer Function Model for the Transformed System: Column B
-56.5e-” 73e-b.3s
(120s + 1)(3.4s + 1) (130s + 1)(3.6s + 1)
- 1 162e-6.2’ (181s + 1)(0.7s + 1)
564e- I 1 . h
(222s + 1)(1.5s + 1 )
Table 6. Transfer Function Models for the Transformed System: Column C
Original Process Model
I - 1,706e-” 88 5e-” (2,570s + 1)(7s + 1) (480s + 1)(15s + 1) lL\
2,90Oe-” (780s + 1)(11.3s + 1)
- 2,39Oe-” ,/ \ V] (390s + l)(ls + 1)
Modified Process Model
- 1,706e-”” 885e-“.” (400s + 1)(62s + 1 ) (210s + 1)(34s + I ) t) - 2,900e-” - 2,39Oe-” (320s + 1)(31s + 1) (350s + 1)(2.5s + 1)
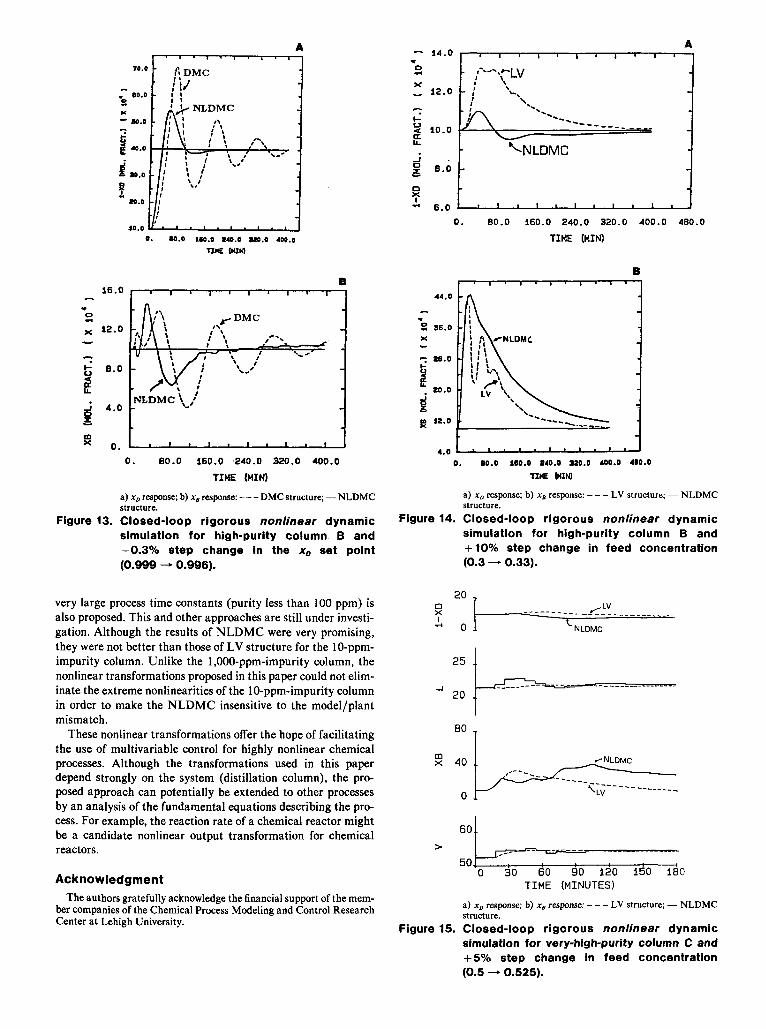
Figure 13 compares the responses of standard DMC and NLDMC as we move from one operating point (x,, - 0.999) to another operating point (x,, - 0.996). The NLDMC has effects similar to the gain scheduling DMC proposed by McDonald (1987). The regulatory response of the NLDMC for a 10% step increase in feed concentration is compared with the LV struc- ture in Figure 14 for nonlinear simulation. This response is much better than that obtained by the standard DMC, Figure 8. The X, response of NLDMC is much better than that of the LV structure. Clearly using the nonlinear transformations signifi- cantly improved the performance of DMC.
Very high purity (1 0 ppm) The regulatory responses of NLDMC and LV for a 5% step
change in the feed composition are shown in Figure 15. Although NLDMC performance is quite good, it is not better than LV performance. The reasonable performance of NLDMC suggests that the modeling approach suggested for this high- purity column is in the right direction. Better modeling or better choice of the design parameters of DMC may improve its per- formance.
Transformation
Figure 9. Nonlinear structures.
A!ChE Journal August 1988 Vol. 34, No. 8 1295
30.0 - Y E: 20.0 X - 7 10.0 U 2'
-20.0 - 0. 2.0 4.0 6.0 8.0
TIME (MINI ( X l O - ' )
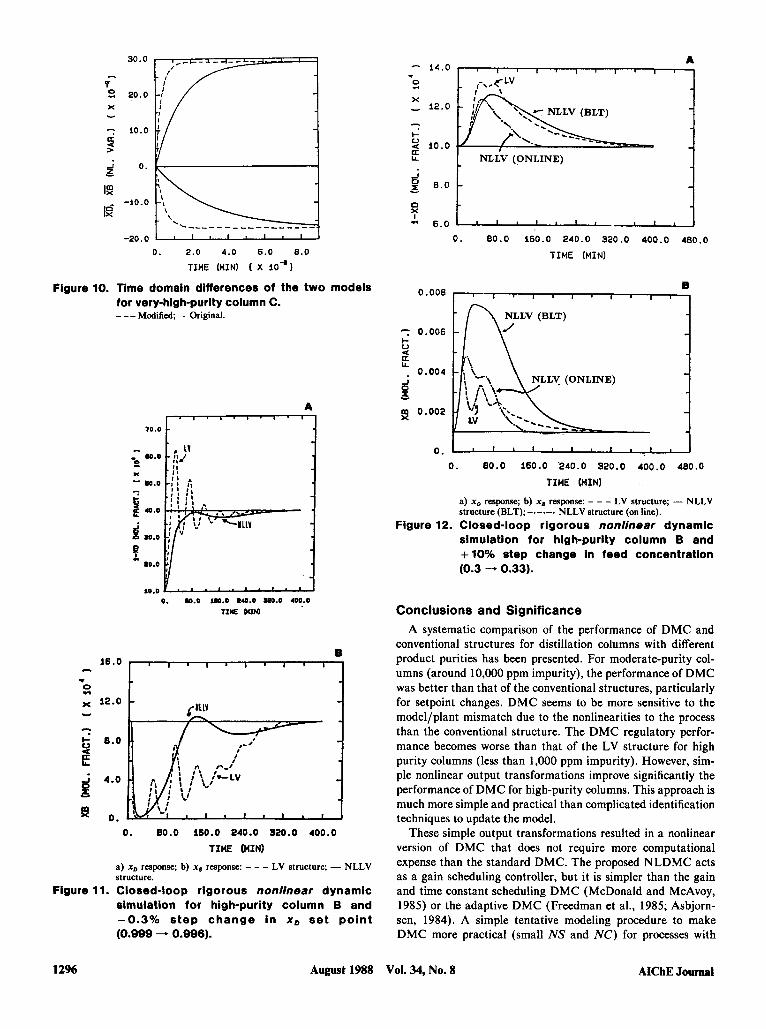
Figure 10. Time domain differences of the two models for very-high-purity column C. _ - - Modified, - Original.
70.0 -1 -
80.0 5:
- w.0 K
- 40.0
i s0.0
.I 80.0
7
ao.0 0. W.0 Sm.0 UO.0 re0.0 400.0
T I E DUN)
1
Figure 11.
1296
0 . 80.0 160.0 240.0 320.0 400.0
TIME WIN) a) xD response; b) xu response: - - - LV structure; - NLLV structure. Closed-loop rigorous nonlinear dynamic simulation for high-purity column B and -0.3% step change in x , set point (0.999 - 0.996).
August 1988
A - 14.0
-
- a LL NLLV (ONLINE)
- p 8.0 1 0 . 80.0 160.0 240.0 320.0 400.0 480.0
TIME (MINI
0.008
7 0.006 c 0 a a LL
-I 0 r
. 0.004
- g 0.002
0.
0 . 80.0 160.0 240.0 320.0 400.0 480.0
TIME (MINI
a) xD response; b) xu response: - - - LV structure; - NLLV structure (BLT); -.-.-a NLLV structure (on line).
Figure 12. Closed-loop rigorous nonlinear dynamic simulation for high-purity column B and +lo% step change in feed concentration (0.3 - 0.33).
Conclusions and Significance A systematic comparison of the performance of DMC and
conventional structures for distillation columns with different product purities has been presented. For moderate-purity col- umns (around 10,000 ppm impurity), the performance of DMC was better than that of the conventional structures, particularly for setpoint changes. DMC seems to be more sensitive to the model/plant mismatch due to the nonlinearities to the process than the conventional structure. The DMC regulatory perfor- mance becomes worse than that of the LV structure for high purity columns (less than 1,000 ppm impurity). However, sim- ple nonlinear output transformations improve significantly the performance of DMC for high-purity columns. This approach is much more simple and practical than complicated identification techniques to update the model.
These simple output transformations resulted in a nonlinear version of DMC that does not require more computational expense than the standard DMC. The proposed NLDMC acts as a gain scheduling controller, but it is simpler than the gain and time constant scheduling DMC (McDonald and McAvoy, 1985) or the adaptive DMC (Freedman et al., 1985; Asbjorn- sen, 1984). A simple tentative modeling procedure to make DMC more practical (small NS and NC) for processes with
Vol. 34, No. 8 AICbE Journal
16.0 - .. 2 x 12.0 - -
8.0
a
2 4.0 € m
LL
0.
1
30.0 =-O L 0. W.0 L60.0 140.0 -0.0 400.0
TIME WIN)
0
0. 80.0 160.0 ,240.0 320.0 400.0
TIHE (MINI
a) x, response; b) x, response: - - - DMC structure; - NLDMC structure.
Figure 13. Closed-loop rigorous nonllnear dynamic simulation for high-purity column B and -0.3% step change in the x, set point (0.999 - 0.996).
very large process time constants (purity less than 100 ppm) is also proposed. This and other approaches are still under investi- gation. Although the results of NLDMC were very promising, they were not better than those of LV structure for the 10-ppm- impurity column. Unlike the 1,000-ppm-impurity column, the nonlinear transformations proposed in this paper could not elim- inate the extreme nonlinearities of the 10-ppm-impurity column in order to make the NLDMC insensitive to the model/plant mismatch.
These nonlinear transformations offer the hope of facilitating the use of multivariable control for highly nonlinear chemical processes. Although the transformations used in this paper depend strongly on the system (distillation column), the pro- posed approach can potentially be extended to other processes by an analysis of the fundamental equations describing the pro- cess. For example, the reaction rate of a chemical reactor might be a candidate nonlinear output transformation for chemical reactors.
Acknowledgment The authors gratefully acknowledge the financial support of the mem-
ber companies of the Chemical Process Modeling and Control Research Center at Lehigh University.
- 14.0 w 0
x 4
- 12.0 - I- 0 a 10.0 U LL
$ 8.0 1 1
0. 80.0 160.0 240.0 320.0 400.0 480.0
TIME (MINI
44.0 - .. 36.0
x - - 98.0
2 i w 12.0
4.0 o. 80.0 160.0 P40.0 520.0 400.0 4no.o
TIUE WN)
a) x, response; b) x, response: - - - LV structure; - NLDMC structure.
Figure 14. Closed-loop rigorous nonlinear dynamic simulation for high-purity column B and +lo% step change in feed concentration (0.3 - 0.33).
T
> 50 4
T I M E (MINUTES) 0 30 60 90 120 150 180
a) x, response; b) x, response: - - - LV structure; - NLDMC structure.
Figure 15. Closed-loop rigorous nonlinear dynamic simulation for very-high-purity column C and +5% step change in feed concentration (0.5 - 0.525).
Notations Acronyms
ATV - auto-tuning variation BLT - biggest log-modulus tuning method
DV - material balance control structure DMC - dynamic matrix control IMC - internal model control
LV - energy balance control structure NLDMC - nonlinear dynamic matrix control structure
NLLV - nonlinear energy balance control structure SISO - single-input single-output
Letters A_ - dynamic matrix, (R x NC) a - step response coefficient d - disturbance
g,, - individual transfer function between output i and input j h - impulse response coefficient I - unit matrix, (NC x NC) j = performance index
Kf - suppression factor or DMC tuning parameters (i - 1,2) m, - ith manipulated variable NC = number of future moves NS - number of coefficients of convolution model Q - diagonal weighting matrix for output (R x R ) R - optimization horizon Ts - DMC sampling period ZD - nonlinear output transformation (top) Z, - nonlinear output transformation (bottom) x, - top composition (mole fraction) x, - bottom composition (mole fraction) y - output variable
Greek letters E - vector of projected errors (R x 1)
7, - integral time w, - zero frequency w, - ultimate frequency
6% - vector of future input changes (NC x 1)
Subscripts k - present sampling period o .. value of the output when the input variable is zero
Superscripts m - measured value
set = setpoint
Literature Cited Alsop, A., and T. F. Edgar. “Nonlinear Control of a High-Purity Distii-
lation Column by the Use of Partially Linearized Control Variables,” AIChE Meeting, Paper 10b (1987).
Asbjornsen, O., “Feed Forward Predictive and Adaptive Control by the Dynamic Matrix,” ACCProc., Paper TA4-9,21 (308), 1864 (1984).
Chiang, T. P., “Dynamics and Control of Heat Integrated Distillation Columns,” Ph.D. Thesis, Lehigh Univ. (1985).
Cutler, C. R., “Dynamic Matrix Control: An Optimal Multivariable Control Algorithm with Constraints,” Ph.D. Thesis, Univ. of Houston (1983).
Cutler, C. R., and B. L. Ramaker, “Dynamic Matrix Control: A Com- puter Control Algorithm,” AIChE Meering (1979).
Eduljee, H. E., “Equations Replace Gilliland Plot,” Hydro. Process., 54,120 (1975).
Freedman, R. W., and A. Bhatia. “Adaptive Dynamic Matrix Control: Online Evaluation of the DMC Model Coefficient,” ACC Proceed., Paper WAF-11,220 (1985).
Fuentes, C., and W. L. Luyben, “Control of High-Purity Distillation Columns,” I&ECProcess Des. Dev., 22,361 (1983).
Garcia, E. C., and M. Morari, “Internal Model Control: 1. A Unifying Review and Some New Results,” I&EC Process & Des. Dev., 21,308 (1982).
Georgakis, C., “On the Use of Extensive Variables in Process Dynamics and Control,” Chem. Eng. Sci., 41(6), 1471 (1986).
Golub, G. C., and C. F. Val Loan, “Matrix Computations,” Johns H o p kins University Press, Baltimore (1980).
Gustafsson, T. K., and K. V. Waller, “Dynamic Modeling and Reaction Invariant Control of pH,” Chem. Eng. Sci., 38,389 (1983).
Hoerl, A. E., “Application of Ridge Analysis to Regression Problems,” Chem. Eng. Prog., 60(54) (1962).
Jafarey, A., J. M. Douglas, and T. J. McAvoy. “Short-Cut Techniques for Distillation Column Design and Control: 1. Column Design,” Ind. Eng. Chem. Process Des. Dev., 18,197 (1979).
Koung, C. W., and T. J. Harris. “Analysis and Control of High-Purity Distillation Columns Using Nonlinearly Transformed Composition Measurements,” Canadian Engin. Centential Conf., Montreal (1987).
Luyben, W. L., “Process Modeling, Simulation, and Control for Chemi- cal Engineers,” McCraw-Hill(l973).
Luyben, W. L., “Simple Method for Tuning SISO Controllers in Multi- variable Systems,” I&EC Proc. Des. Dev., 25,654 (1986).
Luyben, W. L., “Derivation of Transfer Functions for Highly Nonlinear Distillation Columns,” I&EC Res., 26, 2490 (1987).
Maurath, P. R., J. D. Morningred, D. A. Mellichamp, and D. E. Seborg, “An Experimental Application of Predictive Control,” AIChE Meet- ing, Chicago (Nov., 1985).
McDonald, K., and T. J. McAvoy. “Application of Dynamic Matrix Control to Moderate and High-Purity Distillation Towers,” AIChE Meeting, Chicago (Nov., 1985).
McDonald, K., “Performance Comparison of Methods for On-Line Updating for Process Models for High-Purity Distillation Control,” AIChE Meeting (Mar. 29-Apr. 2, 1987).
Ogunnaike, B. A., “Controller Design for Nonlinear Process Systems via Variable Transformation,” I&EC Proc. Des. Dev., 25, 241 ( 1986a).
Ogunnaike, B. A., “Dynamic Matrix Control: A Nonstochastic Indus- trial Process Control Technique with Parallels in Applied Statistics,” Ind. Eng. Chem. Fund., 2 5 7 12 (1 986b).
Shinskey, F. G., “Process Control Systems,” McCraw-Hill. Chicago (Nov., 1985).
Skogestad, S., and M. Morari, “Control of Ill-Conditioned Plants: High-Purity Distillation Columns,” AIChE Meeting, Miami (Nov., 1987).
Tsogas, A., and T. J. McAvoy, “Gain Scheduling for Composition Con- trol of Distillation Columns,” Chem. Eng. Comm.. 37,275 (1985).
Manuscript received Oct. 6. 1987, and revision received Apr. 19. 1988.
1298 August 1988 Vol. 34, No. 8 AICbE Journal