operation and control of dividing wall distillation columns: part 2: simulation and pilot plant...
TRANSCRIPT
OPERATION AND CONTROL OF DIVIDING WALL
DISTILLATION COLUMNS
Part 1: Degrees of Freedom and Dynamic Simulation
M. I. ABDUL MUTALIB and R. SMITH (FELLOW)
Department of Process Integration, UMIST, Manchester, UK
The dividing wall distillation column has been known now for some 50 years. Despite itspotential to make major savings in energy and capital costs in distillation, it has not beenwidely used in practice. One of the major fears in applying the technology is uncertainty
regarding the control and operation of the arrangement. This paper investigates theoreticallythe operation and control of the dividing wall column. A degrees of freedom analysis wasperformed to determine the number of control loops required. Possible control con® gurationswere then investigated using Relative Gain Array Analysis and dynamic simulation. Theresults of these theoretical studies indicate that simple control schemes are capable ofproviding stable control.
Keywords: dividing wall distillation; thermal coupling; dynamic simulation; control; pilot plant
INTRODUCTION
Distillation remains the most important method used in thechemical industry for the separation of homogeneousmixtures, with the amount of energy used in distillationoperations being considerable. Appropriate integration ofthe distillation column with the overall process can resultin signi® cant energy savings (Linnhoff et al.1 , Smith andLinnhoff 2 ) but the scope for this is often limited. Otheroptions involve the use of complex distillation arrangementssuch as the side-stripper, the side-recti® er or the fullythermally coupled (Petyluk) con® guration. Such complexarrangements can consume signi® cantly less energy whencompared to a conventional arrangement. So far, the useof complex arrangements has largely been limited to crudeoil distillation where the side stripper arrangement has beenused extensively.
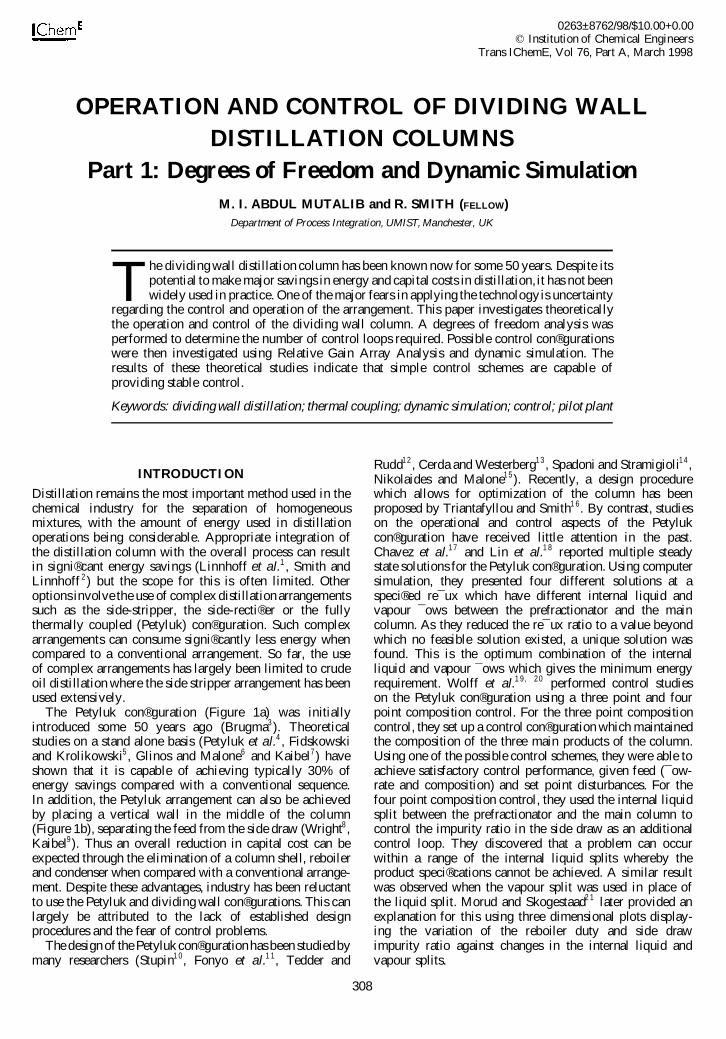
The Petyluk con® guration (Figure 1a) was initiallyintroduced some 50 years ago (Brugma3 ). Theoreticalstudies on a stand alone basis (Petyluk et al.4 , Fidskowskiand Krolikowski5 , Glinos and Malone6 and Kaibel7 ) haveshown that it is capable of achieving typically 30% ofenergy savings compared with a conventional sequence.In addition, the Petyluk arrangement can also be achievedby placing a vertical wall in the middle of the column(Figure 1b), separating the feed from the side draw (Wright8 ,Kaibel9 ). Thus an overall reduction in capital cost can beexpected through the elimination of a column shell, reboilerand condenser when compared with a conventional arrange-ment. Despite these advantages, industry has been reluctantto use the Petyluk and dividing wall con® gurations. This canlargely be attributed to the lack of established designprocedures and the fear of control problems.
The design of the Petyluk con® gurationhas been studiedbymany researchers (Stupin1 0 , Fonyo et al.1 1 , Tedder and
Rudd1 2 , Cerda and Westerberg1 3 , Spadoni and Stramigioli1 4 ,Nikolaides and Malone1 5 ). Recently, a design procedurewhich allows for optimization of the column has beenproposed by Triantafyllou and Smith1 6 . By contrast, studieson the operational and control aspects of the Petylukcon® guration have received little attention in the past.Chavez et al.1 7 and Lin et al.1 8 reported multiple steadystate solutions for the Petyluk con® guration. Using computersimulation, they presented four different solutions at aspeci® ed re¯ ux which have different internal liquid andvapour ¯ ows between the prefractionator and the maincolumn. As they reduced the re¯ ux ratio to a value beyondwhich no feasible solution existed, a unique solution wasfound. This is the optimum combination of the internalliquid and vapour ¯ ows which gives the minimum energyrequirement. Wolff et al.1 9 , 2 0 performed control studieson the Petyluk con® guration using a three point and fourpoint composition control. For the three point compositioncontrol, they set up a control con® guration which maintainedthe composition of the three main products of the column.Using one of the possible control schemes, they were able toachieve satisfactory control performance, given feed (¯ ow-rate and composition) and set point disturbances. For thefour point composition control, they used the internal liquidsplit between the prefractionator and the main column tocontrol the impurity ratio in the side draw as an additionalcontrol loop. They discovered that a problem can occurwithin a range of the internal liquid splits whereby theproduct speci® cations cannot be achieved. A similar resultwas observed when the vapour split was used in place ofthe liquid split. Morud and Skogestaad2 1 later provided anexplanation for this using three dimensional plots display-ing the variation of the reboiler duty and side drawimpurity ratio against changes in the internal liquid andvapour splits.
308
0263±8762/98/$10.00+0.00q Institution of Chemical Engineers
Trans IChemE, Vol 76, Part A, March 1998
In this paper, the complexity of the dividing wall columnwill ® rstly be assessed by performing degrees of freedomanalysis. The variables leading to the additional complexityof the column, when compared to the more establishedside draw column, will then be analysed to investigate theimpact on the operation and control of the column. Dynamicsimulation will also be used to investigate the controll-ability of the column from a theoretical point of view. Part 2of this paper will discuss pilot plant control studies on sucha column.
DEGREES OF FREEDOM ANALYSIS
A method developed by Howard2 2 for analysing thedegrees of freedom at unsteady state condition has beenused for the dividing wall column. The method is basedon the fact that the degrees of freedom for a system is equalto the sum of degrees of freedom of all the units in thesystem minus the sum of degrees of freedom for allthe interconnecting streams. This requires the system to betorn apart into smaller units with inter-stream connec-tions. When analysing the degrees of freedom for any ofthe units, hold up is included to account for the unsteadystate. The way the method handles hold up is by treatingit as a quantity stream with the same variables as theinterconnecting stream, except that a hold up quantity isused instead of ¯ owrate.
In a distillation column, the units consist of stages,condenser and accumulator, reboiler and stream splitterswhich are connected by interconnecting streams. Each ofthe interconnecting streams has degrees of freedom equalto NC + 2 where NC is the number of components presentin the stream. These variables consist of NC-1 concentrationvariables, a rate or quantity variable and two other intensivevariables i.e. temperature and pressure.
A stage in a distillation column consists of fourinterconnecting streams, a quantity stream for the hold-upand a heat stream. Note that only the liquid hold-up isaccounted for while the vapour hold-up is neglected. Sincethere are 5 streams present and each stream has NC + 2variables, with a heat quantity term, Q, the number ofvariables in the unit is 5NC + 11. The relationships amongthe variables depends on the way in which the stage isde® ned. Suppose, the stage is considered to be a single
mixed pool with the liquid leaving having the sameproperties as the liquid on the stage, the number ofrelationships is equal to 3NC + 4. These relationshipsconsist of a total material balance, an energy balance,NC-1 component balances, NC distribution relation-ships between the vapour and liquid phase, i.e. vapour-liquid equilibrium, NC-1 concentration identities for liquidleaving and liquid on the stage, two temperature identi-ties and two pressure identities for the vapour and liquidleaving and liquid on the stage. Hence the degrees offreedom for the unit are:
No. of DOF = No. of variables - No. of
relationships
= 5NC + 11 - 3NC - 4 = 2NC + 7
The degrees of freedom for a cascade of N stages can thenbe easily determined by treating the cascade as a system.Since a cascade of N stages are interconnected by 2N-2streams, the degrees of freedom are:
No. of DOF for = Sum of DOF- Sum of DOFcascade of N units for N units 2N- 2 streams
= N(2NC + 7)- 2(N - 1)(NC + 2)
= 3N + 2NC + 4
An extra degree of freedom has to be added to the abovedue to the choice for number of stages in the cascade. Thusthe number of degrees of freedom for a cascade of N stagesare 3N + 2NC + 5.
In contrast to the conventional stage, the feed and sidedraw stages are slightly different. This is due to the fact thatan extra stream is involved. For a feed stage, the numberof degrees of freedom is equal to the number of degrees offreedom for a stage plus the number of degrees of freedomfor a stream, thus giving 3NC + 9. A side draw stage canbe represented by a stage connected to a splitter whichdivides between the side draw ¯ ow (either a vapour orliquid) and the ¯ ow to the next stage. Since stages can beattached to the cascade of stages prior to the side draw stagelocation, only the number of degrees of freedom for thesplitter needs to be counted. Using the same approach asdescribed for the conventional stage, with the exception that
309OPERATION AND CONTROL OF DIVIDING WALL DISTILLATION COLUMNS: PART 1
Trans IChemE, Vol 76, Part A, March 1998
Figure 1. Fully thermally coupled columns. (a) Petyluk column; (b) Dividing wall column.
there is no hold up, the number of degrees of freedom for asplitter unit is found to be NC + 5.
A condenser and accumulator unit consist of two ¯ owstreams, a quantity stream and a heat stream. Note thatthe liquid hold up is considered as the quantity stream.The number of variables in the unit comes from thethree streams and a heat quantity term are 3NC + 7, whilethe number of relationships between the variables is2NC + 2, i.e. total material balance, a heat balance, NC-1 component balances and NC-1 concentration, a pressureand a temperature identities for liquid leaving the unit.Therefore, the of degrees of freedom for this unit areNC + 5.
The reboiler unit consists of 3 ¯ ow streams, a quantitystream and a heat stream. Again, the liquid hold up isconsidered as a quantity stream. The number of variablesin the unit which comes from the four streams and a heatquantity term are 4NC + 9. However, the number ofrelationships between the variables that can be derived forthe unit is 3NC + 4 thus giving the number of degrees offreedom to be NC + 5 (which turns out to be the same asthe condenser unit). The relationships between thevariables that can be derived for the unit consist of a totalmaterial balance, a heat balance, NC-1 componentsbalances, NC distribution relationships and NC-1 concen-tration, two pressure and two temperature identities forliquid and vapour leaving the unit.
Table 1 summarizes the degrees of freedom for each ofthe units in a typical distillation column.
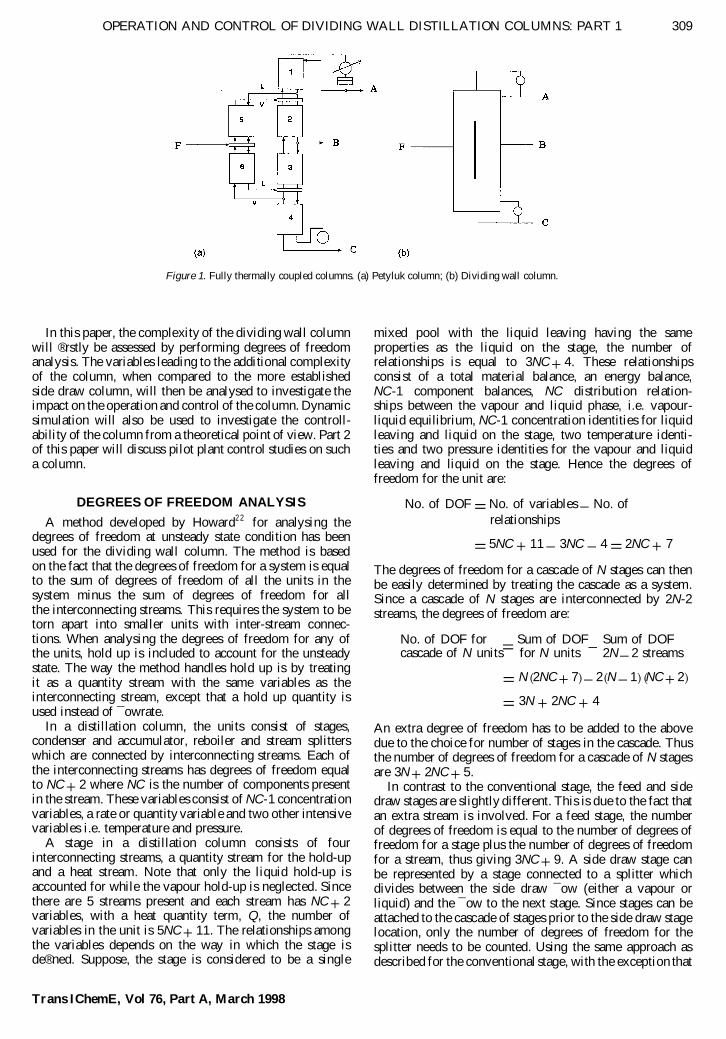
The dividing wall column can be represented by thePetyluk con® guration as illustrated in Figure 2. The columnis divided into 6 sections, each containing a number ofcascaded trays. There are three feed and three side-drawtrays located between the sections with a partial reboilerand total condenser at the top and bottom of the column.Table 2 gives details of the analysis of the degrees offreedom for the dividing wall column. Based on theanalysis, the number of degrees of freedom for the columnis thus 3(NS(1)+ NS(2)+ NS(3)+ NS(4)+ NS(5)+NS(6))+ NC + 35 where NS(i) is the number of stages insection `i ’ .
After taking into account of the inherent relationshipsand the product speci® cations, the number of degrees offreedom for the column is NC + 10. Because the feedcomposition, ¯ owrate and pressure are ® xed, the number ofdegrees of freedom left is 9. This means that only ninevariables can be manipulated or speci® ed in order to fullycontrol the system. The 9 variables involved are shownin Table 3. When comparing this to the more estab-lished side draw column, the dividing wall column has 2
additional degrees of freedom which are the liquid andvapour splits.
In the implementation of the dividing wall column, itis impractical to manipulate the vapour split. Hence, thevapour split will be left to occur naturally. Therefore, adegree of freedom is lost here. Unlike the vapour split,the liquid split can be easily manipulated using a simpledevice, thus leaving the option open to the designer. Thedecision whether to employ it as a manipulated variablewill be assessed later.
COLUMN CONFIGURATION
The design of the dividing wall column can betreated similar to the design of the Petyluk con® guration(Triantafyllou2 3 ). However, there is one major differencebetween the two columns. This results from the ® xedposition of the dividing wall which prevents the manipula-tion of the internal vapour split in the column. For thePetyluk con® guration, the vapour split was manipulatedin most of the previous studies due to the separate shellarrangement.
A steady state rigorous simulation model forthe dividing wall column was developed using the ASPENPLUST M package. The ternary mixture used for theseparation consists of methanol, iso-propanol and butanol.The Wilson equation was used for the prediction of vapourliquid equilibrium.
The con® guration of the dividing wall column wasdesigned using the method proposed by Triantafyllou andSmith1 6 , using the option for minimizing the number ofstages. The feed to the column has an equimolar composi-tion and the products speci® ed to be 98.5 mol percent. Thearrangement on the distribution of the number of stages atdifferent sections inside the column, together with theoperating parameter, are given in Figure 3.
310 ABDUL MUTALIB and SMITH
Trans IChemE, Vol 76, Part A, March 1998
Table 1. Degrees of freedom for various units in a distillationcolumn.
Unit Degrees of freedom
1. Single phase streams NC + 22. Ideal stage 2NC + 73. Cascade of N ideal stages 3N + 2NC + 54. Feed stage 3NC + 95. Stream splitter (no hold up) NC + 56. Total condenser/accumulator NC + 57. Partial reboiler NC + 5
Figure 2. Layouts of the units in a dividing wall column.
IMPACT OF THE LIQUID SPLIT ON THE MIDDLEPRODUCT COMPOSITION
In the practical implementation of the dividing wallcolumn, the liquid split can easily be manipulated. One wayof achieving this is by means of simple ¯ ow controllerinstalled externally on both liquid streams returning tothe top of each side of the dividing wall. A ratio controllercan be used to ® x or to vary the two ¯ ows according to aspeci® ed ratio. However, if a ® xed ratio is desired, aninternal mechanism located at the top of the dividingwall can serve to divide the ¯ ows to each side of the wall
according to the set ratio used. Manipulating the liquid splitat the top of the dividing wall is a way of manipulatingthe re¯ ux ratio on each side of the wall. Triantafyllouand Smith1 6 presented a procedure to optimize the re¯ uxratio in different parts of the column in the initial design.
Calculations were performed to ® nd the relation betweenthe liquid split and the composition of the light key(methanol) as well as the middle key (iso-propanol) inthe middle product. To achieve this, the liquid split waschanged at different values while keeping the vapoursplit constant at base case value, i.e. 1.29. Note that thesplit is de® ned as the ratio between the ¯ ow on the product
311OPERATION AND CONTROL OF DIVIDING WALL DISTILLATION COLUMNS: PART 1
Trans IChemE, Vol 76, Part A, March 1998
Table 2. Degrees of freedom analysis for dividing wall column.
Units Degrees of Freedom
Top Column Section.Condenser/accumulator. NC + 5Re¯ ux splitter. NC + 5Cascade of stages (Section 1). 3NT(1)+ 2NC + 5Vapour feed stage. 3NC + 9Liquid draw stage. NC + 5
Dividing Wall Section.Prefractionator side.Cascade of stages (Section 5). 3NT(5)+ 2NC + 5Feed stage 3NC + 9Cascade of stages (Section 6). 3NT(6)+ 2NC + 5
Main Side.Cascade of stages (Section 2). 3NT(2)+ 2NC + 5Liquid draw stage. NC + 5Cascade of stages (Section 3). 3NT(3)+ 2NC + 5
Bottom Column Section.Liquid feed stage. 3NC + 9Vapour draw stage. NC + 5Cascade of stages (Section 4). 3NT(4)+ 2NC + 5Partial reboiler. NC + 5
Total DOF 3(NT(1)+ NT(2)+ NT(3)+ NT(4)+ NT(5)+ NT(6))+ 27NC + 87
Restriction from 26 interconnecting streams -26NC + 52
Total column DOF 3(NT(1)+ NT(2)+ NT(3)+ NT(4)+ NT(5)+ NT(6))+ NC + 35
Restriction from inherent relationships, design speci® cations and uncontrolled variables.
Pressures on all stages, reboiler, condenser and re¯ ux splitter. NT(1)+ NT(2)+ ¼+ NT(6)+ 9Heat leaks on all stages and splitters. NT(1)+ NT(2)+ ¼+ NT(6)+ 7Holdup on all stages. NT(1)+ NT(2)+ ¼+ NT(6)+ 3No. of plates at each section. 6Feed (composition, ¯ owrate and pressure). NC + 1
Total DOF restricted 3(NT(1)+ NT(2)+ NT(3)+ NT(4)+ NT(5)+ NT(6)+ NC + 26
Degrees of freedom for the column 9
Table 3. Controlled and manipulated variables for dividing wall column.
Controlled variables Manipulated variables
1. Feed temperature Feed preheater duty2. Column pressure Condenser cooling duty3. Top product composition Re¯ ux ¯ owrate4. Middle product composition Distillate ¯ owrate5. Bottom product composition Sidedraw ¯ owrate6. Condenser/accumulator holdup Reboiler duty7. Reboiler holdup Bottom product ¯ owrate8. Light impurity in middle product Liquid split at top of dividing wall9. Heavy impurity in middle product Vapour split at bottom of dividing wall
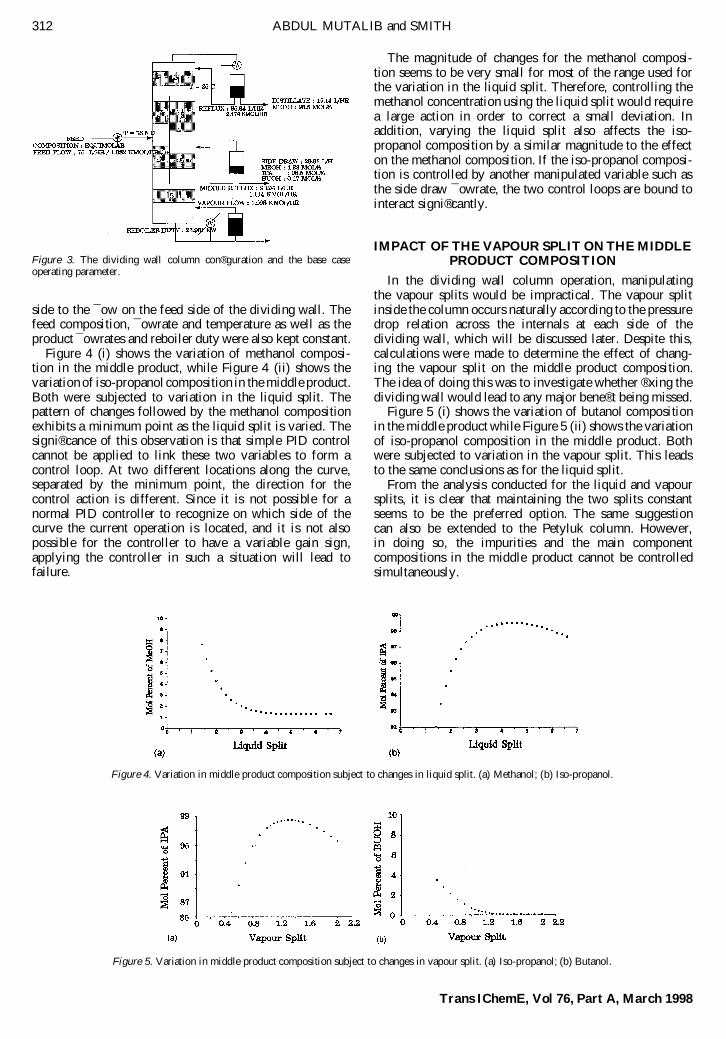
side to the ¯ ow on the feed side of the dividing wall. Thefeed composition, ¯ owrate and temperature as well as theproduct ¯ owrates and reboiler duty were also kept constant.
Figure 4 (i) shows the variation of methanol composi-tion in the middle product, while Figure 4 (ii) shows thevariation of iso-propanol composition in the middle product.Both were subjected to variation in the liquid split. Thepattern of changes followed by the methanol compositionexhibits a minimum point as the liquid split is varied. Thesigni® cance of this observation is that simple PID controlcannot be applied to link these two variables to form acontrol loop. At two different locations along the curve,separated by the minimum point, the direction for thecontrol action is different. Since it is not possible for anormal PID controller to recognize on which side of thecurve the current operation is located, and it is not alsopossible for the controller to have a variable gain sign,applying the controller in such a situation will lead tofailure.
The magnitude of changes for the methanol composi-tion seems to be very small for most of the range used forthe variation in the liquid split. Therefore, controlling themethanol concentration using the liquid split would requirea large action in order to correct a small deviation. Inaddition, varying the liquid split also affects the iso-propanol composition by a similar magnitude to the effecton the methanol composition. If the iso-propanol composi-tion is controlled by another manipulated variable such asthe side draw ¯ owrate, the two control loops are bound tointeract signi® cantly.
IMPACT OF THE VAPOUR SPLIT ON THE MIDDLEPRODUCT COMPOSITION
In the dividing wall column operation, manipulatingthe vapour splits would be impractical. The vapour splitinside the column occurs naturally according to the pressuredrop relation across the internals at each side of thedividing wall, which will be discussed later. Despite this,calculations were made to determine the effect of chang-ing the vapour split on the middle product composition.The idea of doing this was to investigate whether ® xing thedividing wall would lead to any major bene® t being missed.
Figure 5 (i) shows the variation of butanol compositionin the middle product while Figure 5 (ii) shows the variationof iso-propanol composition in the middle product. Bothwere subjected to variation in the vapour split. This leadsto the same conclusions as for the liquid split.
From the analysis conducted for the liquid and vapoursplits, it is clear that maintaining the two splits constantseems to be the preferred option. The same suggestioncan also be extended to the Petyluk column. However,in doing so, the impurities and the main componentcompositions in the middle product cannot be controlledsimultaneously.
312 ABDUL MUTALIB and SMITH
Trans IChemE, Vol 76, Part A, March 1998
Figure 3. The dividing wall column con® guration and the base caseoperating parameter.
Figure 4. Variation in middle product composition subject to changes in liquid split. (a) Methanol; (b) Iso-propanol.
Figure 5. Variation in middle product composition subject to changes in vapour split. (a) Iso-propanol; (b) Butanol.
IMPACT OF THE LIQUID SPLIT ON THEVAPOUR SPLIT
As mentioned earlier, the vapour divides to satisfy thepressure drop equalization between the sections on eachside of the dividing wall. In the case where the number ofstages are equal at each side of the dividing wall, the vapoursplit depends on the position of the dividing wall and theliquid loading of the two sections at each side of the dividingwall. The liquid loading of the two sections vary as theliquid split is changed.
Before the impact of the liquid split on the vapour splitcan be assessed, some form of relation must be establishedbetween the changes in the liquid loading and the resultingchanges in the pressure drop across a packing height ortrays. In the present case, it was decided to demonstratethe study using packing as the internals.
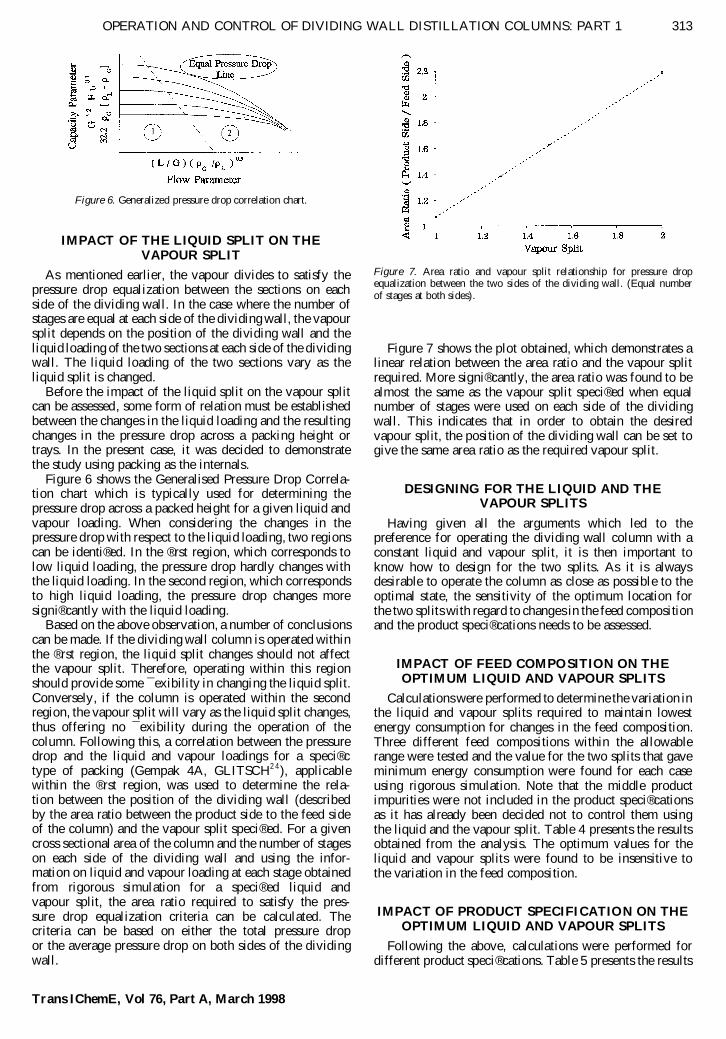
Figure 6 shows the Generalised Pressure Drop Correla-tion chart which is typically used for determining thepressure drop across a packed height for a given liquid andvapour loading. When considering the changes in thepressure drop with respect to the liquid loading, two regionscan be identi® ed. In the ® rst region, which corresponds tolow liquid loading, the pressure drop hardly changes withthe liquid loading. In the second region, which correspondsto high liquid loading, the pressure drop changes moresigni® cantly with the liquid loading.
Based on the above observation, a number of conclusionscan be made. If the dividing wall column is operated withinthe ® rst region, the liquid split changes should not affectthe vapour split. Therefore, operating within this regionshould provide some ¯ exibility in changing the liquid split.Conversely, if the column is operated within the secondregion, the vapour split will vary as the liquid split changes,thus offering no ¯ exibility during the operation of thecolumn. Following this, a correlation between the pressuredrop and the liquid and vapour loadings for a speci® ctype of packing (Gempak 4A, GLITSCH2 4 ), applicablewithin the ® rst region, was used to determine the rela-tion between the position of the dividing wall (describedby the area ratio between the product side to the feed sideof the column) and the vapour split speci® ed. For a givencross sectional area of the column and the number of stageson each side of the dividing wall and using the infor-mation on liquid and vapour loading at each stage obtainedfrom rigorous simulation for a speci® ed liquid andvapour split, the area ratio required to satisfy the pres-sure drop equalization criteria can be calculated. Thecriteria can be based on either the total pressure dropor the average pressure drop on both sides of the dividingwall.
Figure 7 shows the plot obtained, which demonstrates alinear relation between the area ratio and the vapour splitrequired. More signi® cantly, the area ratio was found to bealmost the same as the vapour split speci® ed when equalnumber of stages were used on each side of the dividingwall. This indicates that in order to obtain the desiredvapour split, the position of the dividing wall can be set togive the same area ratio as the required vapour split.
DESIGNING FOR THE LIQUID AND THEVAPOUR SPLITS
Having given all the arguments which led to thepreference for operating the dividing wall column with aconstant liquid and vapour split, it is then important toknow how to design for the two splits. As it is alwaysdesirable to operate the column as close as possible to theoptimal state, the sensitivity of the optimum location forthe two splits with regard to changes in the feed compositionand the product speci® cations needs to be assessed.
IMPACT OF FEED COMPOSITION ON THEOPTIMUM LIQUID AND VAPOUR SPLITS
Calculationswere performed to determine the variation inthe liquid and vapour splits required to maintain lowestenergy consumption for changes in the feed composition.Three different feed compositions within the allowablerange were tested and the value for the two splits that gaveminimum energy consumption were found for each caseusing rigorous simulation. Note that the middle productimpurities were not included in the product speci® cationsas it has already been decided not to control them usingthe liquid and the vapour split. Table 4 presents the resultsobtained from the analysis. The optimum values for theliquid and vapour splits were found to be insensitive tothe variation in the feed composition.
IMPACT OF PRODUCT SPECIFICATION ON THEOPTIMUM LIQUID AND VAPOUR SPLITS
Following the above, calculations were performed fordifferent product speci® cations. Table 5 presents the results
313OPERATION AND CONTROL OF DIVIDING WALL DISTILLATION COLUMNS: PART 1
Trans IChemE, Vol 76, Part A, March 1998
Figure 6. Generalized pressure drop correlation chart.
Figure 7. Area ratio and vapour split relationship for pressure dropequalization between the two sides of the dividing wall. (Equal numberof stages at both sides).
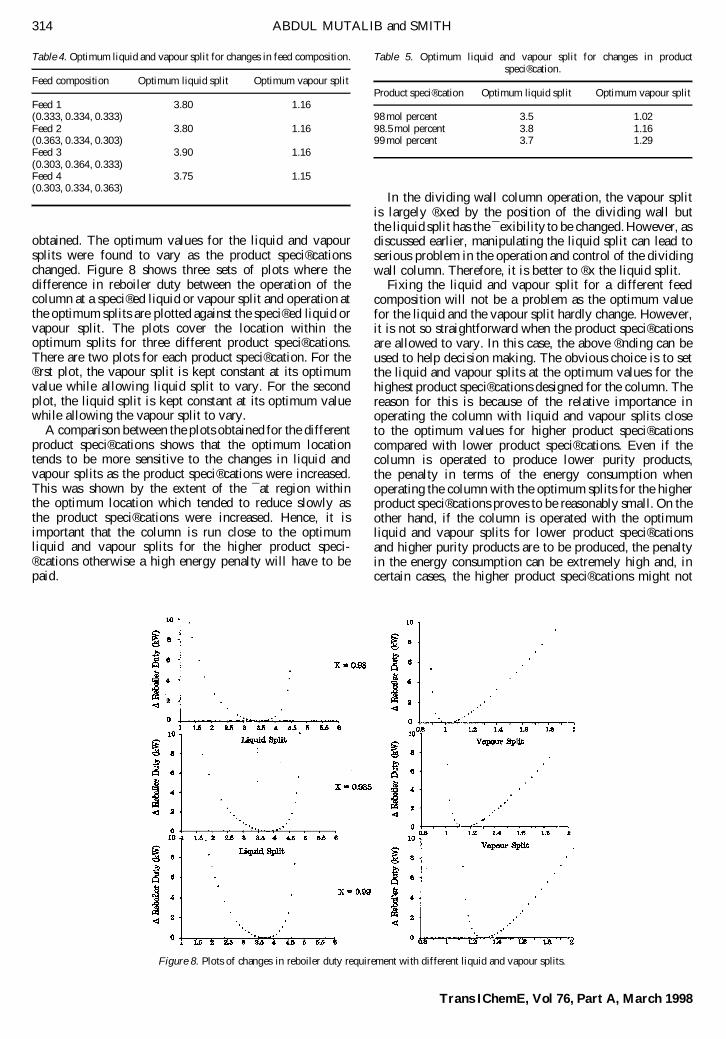
obtained. The optimum values for the liquid and vapoursplits were found to vary as the product speci® cationschanged. Figure 8 shows three sets of plots where thedifference in reboiler duty between the operation of thecolumn at a speci® ed liquid or vapour split and operation atthe optimum splits are plotted against the speci® ed liquid orvapour split. The plots cover the location within theoptimum splits for three different product speci® cations.There are two plots for each product speci® cation. For the® rst plot, the vapour split is kept constant at its optimumvalue while allowing liquid split to vary. For the secondplot, the liquid split is kept constant at its optimum valuewhile allowing the vapour split to vary.
A comparison between the plots obtained for the differentproduct speci® cations shows that the optimum locationtends to be more sensitive to the changes in liquid andvapour splits as the product speci® cations were increased.This was shown by the extent of the ¯ at region withinthe optimum location which tended to reduce slowly asthe product speci® cations were increased. Hence, it isimportant that the column is run close to the optimumliquid and vapour splits for the higher product speci-® cations otherwise a high energy penalty will have to bepaid.
In the dividing wall column operation, the vapour splitis largely ® xed by the position of the dividing wall butthe liquid split has the ¯ exibility to be changed. However, asdiscussed earlier, manipulating the liquid split can lead toserious problem in the operation and control of the dividingwall column. Therefore, it is better to ® x the liquid split.
Fixing the liquid and vapour split for a different feedcomposition will not be a problem as the optimum valuefor the liquid and the vapour split hardly change. However,it is not so straightforward when the product speci® cationsare allowed to vary. In this case, the above ® nding can beused to help decision making. The obvious choice is to setthe liquid and vapour splits at the optimum values for thehighest product speci® cations designed for the column. Thereason for this is because of the relative importance inoperating the column with liquid and vapour splits closeto the optimum values for higher product speci® cationscompared with lower product speci® cations. Even if thecolumn is operated to produce lower purity products,the penalty in terms of the energy consumption whenoperating the column with the optimum splits for the higherproduct speci® cations proves to be reasonably small. On theother hand, if the column is operated with the optimumliquid and vapour splits for lower product speci® cationsand higher purity products are to be produced, the penaltyin the energy consumption can be extremely high and, incertain cases, the higher product speci® cations might not
314 ABDUL MUTALIB and SMITH
Trans IChemE, Vol 76, Part A, March 1998
Figure 8. Plots of changes in reboiler duty requirement with different liquid and vapour splits.
Table 4. Optimum liquid and vapour split for changes in feed composition.
Feed composition Optimum liquid split Optimum vapour split
Feed 1 3.80 1.16(0.333, 0.334, 0.333)Feed 2 3.80 1.16(0.363, 0.334, 0.303)Feed 3 3.90 1.16(0.303, 0.364, 0.333)Feed 4 3.75 1.15(0.303, 0.334, 0.363)
Table 5. Optimum liquid and vapour split for changes in productspeci® cation.
Product speci® cation Optimum liquid split Optimum vapour split
98 mol percent 3.5 1.0298.5mol percent 3.8 1.1699 mol percent 3.7 1.29
be achieved even running the column at total re¯ ux.Table 6 illustrates the results from an example to explainthe above.
COMPOSITION CONTROL OF THE DIVIDINGWALL COLUMN
In order to study the control behaviour of the divid-ing wall column, a dynamic model was built usingSPEEDUPT M . Similar con® gurations for the column asmodelled previously using the ASPEN PLUST M packagewere used. The same feed and product speci® cations wereemployed. In line with the earlier suggestion, the liquidand vapour split were maintained at the optimum valuesobtained from the design method used (Triantafyllou andSmith1 6 ). The assumption of no heat transfer across thedividing wall was maintained and only decentralized controlwas used.
The short cut dynamic model which is available inSPEEDUPT M was used. Assumptions involved in usingthe short cut model are perfect material balance, i.e. noaccumulation of material in the system, and constant molalover¯ ow. In addition, since the short cut model solvesstage equilibrium by lumping several stages together toform a section within the column, constant relativevolatilitywithin the section was assumed (but varied betweensections). The maximum number of stages that can belumped within a section must be kept within a reasonablenumber in order to keep the model within an acceptableaccuracy for simulation purposes. The relative volatilitywithin each section was speci® ed by taking the averagevalue obtained for the relevant stages from the rigoroussimulation done using ASPEN PLUST M .
INTERACTION ANALYSIS
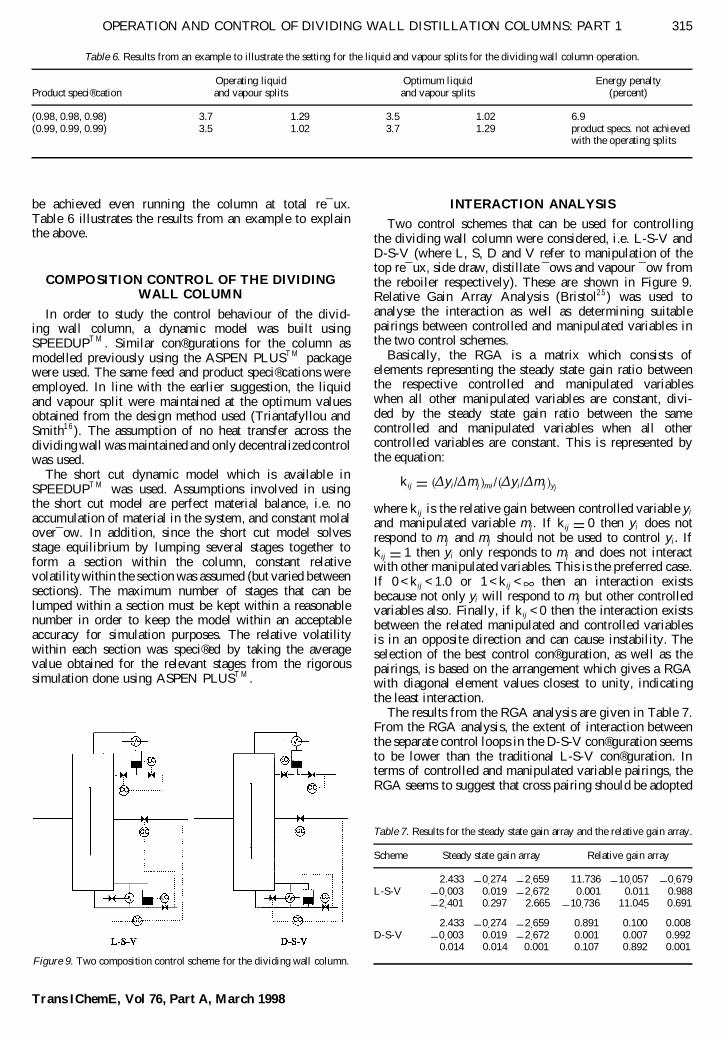
Two control schemes that can be used for controllingthe dividing wall column were considered, i.e. L-S-V andD-S-V (where L, S, D and V refer to manipulation of thetop re¯ ux, side draw, distillate ¯ ows and vapour ¯ ow fromthe reboiler respectively). These are shown in Figure 9.Relative Gain Array Analysis (Bristol2 5 ) was used toanalyse the interaction as well as determining suitablepairings between controlled and manipulated variables inthe two control schemes.
Basically, the RGA is a matrix which consists ofelements representing the steady state gain ratio betweenthe respective controlled and manipulated variableswhen all other manipulated variables are constant, divi-ded by the steady state gain ratio between the samecontrolled and manipulated variables when all othercontrolled variables are constant. This is represented bythe equation:
k ij = (¢yi / ¢mj)mi / (¢yi / ¢mj)yj
where k ij is the relative gain between controlled variable yi
and manipulated variable mj. If k ij = 0 then yi does notrespond to mj and mj should not be used to control yi. Ifk ij = 1 then yi only responds to mj and does not interactwith other manipulated variables. This is the preferred case.If 0 < k ij <1.0 or 1 < k ij <¥ then an interaction existsbecause not only yi will respond to mj but other controlledvariables also. Finally, if k ij <0 then the interaction existsbetween the related manipulated and controlled variablesis in an opposite direction and can cause instability. Theselection of the best control con® guration, as well as thepairings, is based on the arrangement which gives a RGAwith diagonal element values closest to unity, indicatingthe least interaction.
The results from the RGA analysis are given in Table 7.From the RGA analysis, the extent of interaction betweenthe separate control loops in the D-S-V con® guration seemsto be lower than the traditional L-S-V con® guration. Interms of controlled and manipulated variable pairings, theRGA seems to suggest that cross pairing should be adopted
315OPERATION AND CONTROL OF DIVIDING WALL DISTILLATION COLUMNS: PART 1
Trans IChemE, Vol 76, Part A, March 1998
Table 6. Results from an example to illustrate the setting for the liquid and vapour splits for the dividing wall column operation.
Operating liquid Optimum liquid Energy penaltyProduct speci® cation and vapour splits and vapour splits (percent)
(0.98, 0.98, 0.98) 3.7 1.29 3.5 1.02 6.9(0.99, 0.99, 0.99) 3.5 1.02 3.7 1.29 product specs. not achieved
with the operating splits
Figure 9. Two composition control scheme for the dividing wall column.
Table 7. Results for the steady state gain array and the relative gain array.
Scheme Steady state gain array Relative gain array
2.433 -0.274 -2.659 11.736 -10.057 -0.679L-S-V -0.003 0.019 -2.672 0.001 0.011 0.988
-2.401 0.297 2.665 -10.736 11.045 0.691
2.433 -0.274 -2.659 0.891 0.100 0.008D-S-V -0.003 0.019 -2.672 0.001 0.007 0.992
0.014 0.014 0.001 0.107 0.892 0.001
between the middle product and the bottom product controlloops. This means that the middle product compositionshould be controlled by the vapour ¯ ow while the bottomproduct composition should be controlled by the side draw¯ ow.
DYNAMIC SIMULATION
Dynamic simulation was then performed to observethe behaviour of the two control schemes when subjectedto set point changes and feed disturbances as shown in
316 ABDUL MUTALIB and SMITH
Trans IChemE, Vol 76, Part A, March 1998
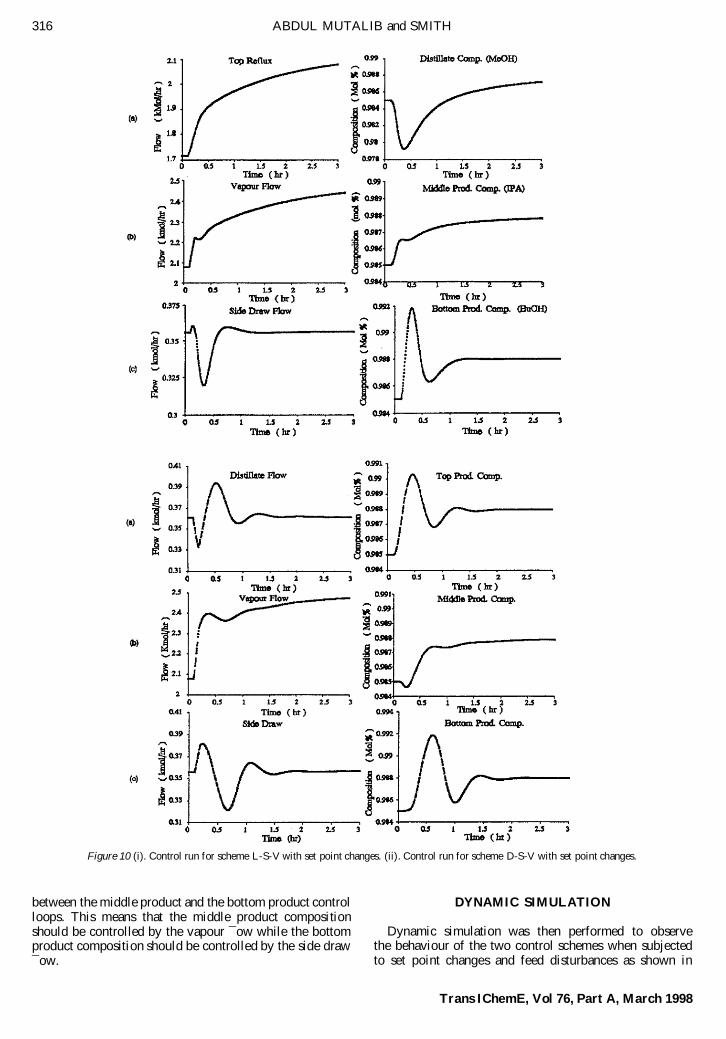
Figure 10 (i). Control run for scheme L-S-V with set point changes. (ii). Control run for scheme D-S-V with set point changes.
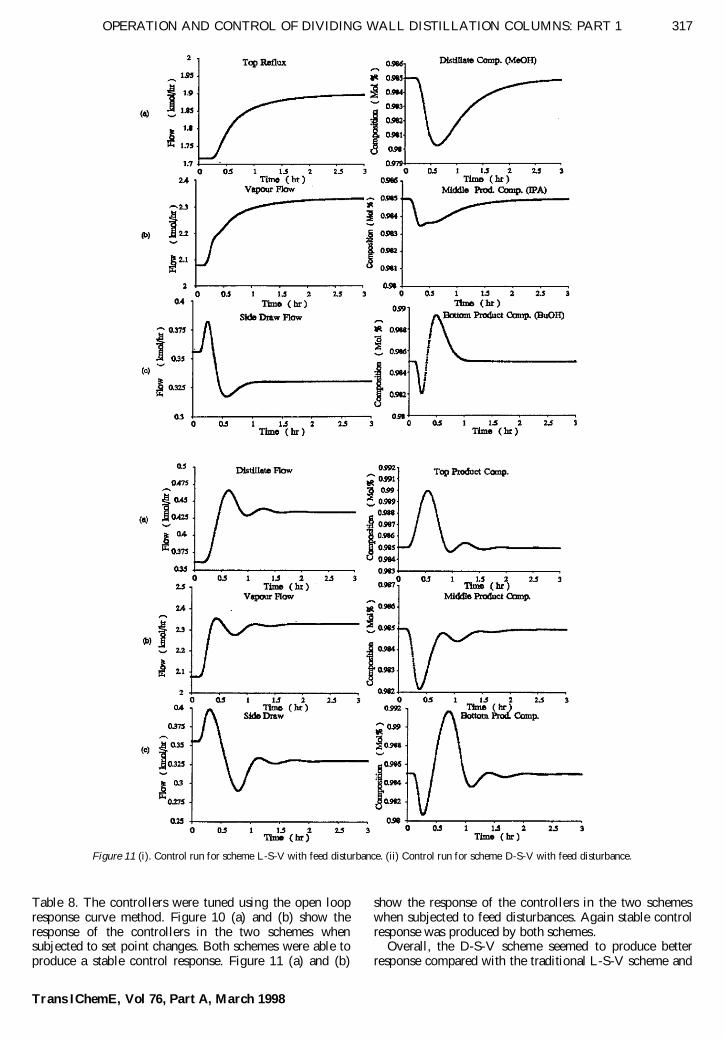
Table 8. The controllers were tuned using the open loopresponse curve method. Figure 10 (a) and (b) show theresponse of the controllers in the two schemes whensubjected to set point changes. Both schemes were able toproduce a stable control response. Figure 11 (a) and (b)
show the response of the controllers in the two schemeswhen subjected to feed disturbances. Again stable controlresponse was produced by both schemes.
Overall, the D-S-V scheme seemed to produce betterresponse compared with the traditional L-S-V scheme and
317OPERATION AND CONTROL OF DIVIDING WALL DISTILLATION COLUMNS: PART 1
Trans IChemE, Vol 76, Part A, March 1998
Figure 11 (i). Control run for scheme L-S-V with feed disturbance. (ii) Control run for scheme D-S-V with feed disturbance.
this is in agreement with the results derived from the RGAanalysis. More importantly, both schemes were able toproduce satisfactory control.
CONCLUSIONS
In this paper, studies relating to aspects of the operationand control of the dividing wall column have beeninvestigated. When compared to the side draw column,the dividing wall column has a more complex nature, shownthrough degrees of freedom analysis. This results from twoadditional manipulated variables, the liquid and vapoursplits. However, it is impractical to manipulate the vapoursplit, which is ® xed by the position of the dividing wall. Onthe other hand, the liquid split can be easily varied but hasbeen found to have little bene® t in comparison to thecomplication that will be added to the operation and controlof the column. A linear PID controller cannot be used andsevere interactions would occur between the control loops,particularly for controlling the composition of the middleproduct and its impurities. In the region of high liquid andvapour loading, varying the liquid split will also affect thevapour split considerably and this even affects the operationand control of the column further. Based on this account, itwas suggested that the column should be operated andcontrolled with a constant liquid split in addition to the ® xedvapour split. Having made the suggestion, the column canthen be operated and controlled in a similar manner asthe more established side draw column. Nevertheless, thedisadvantage of this proposal is that the impuritiescomposition in the middle product cannot be controlled.
The optimum location for the liquid and vapour splitswas found to be insensitive to the variation in the feedcomposition but this is not so for the variation in the productspeci® cation. From a sensitivity study, it was found that thelower product speci® cation has a ¯ atter optimum comparedwith the higher product speci® cations. Therefore, it wasconcluded that the design for the liquid and the vapour splitshould be based on the highest product speci® cation whenthe column is required to produce a range of productcompositions.
Two composition (three point) control scheme were
selected for demonstrating the control using simulation. Thecolumn was subjected to changes in product speci® -cation and feed disturbances. Simulation results indicatethat stable control was achievable by both control schemes.
REFERENCES
1. Linhoff, B., Dunford, H and Smith, R., 1983, Chem Eng Sci, 38(8):1175.
2. Smith, R. and Linhoff, B., 1988, Chem Eng Res Des, 66: 195.3. Brugma, A. J., 1942, US Patent 2,295,256.4. Petyluk, F. B, Platonov, V. M. and Slavinskii, D. M., 1965, Int Chem
Eng, 5(3): 561.5. Fidkowski, Z. and Krolikowski, L., 1987, AIChE J, 33(4): 643.6. Glinos, K. and Malone, M. F., 1988, Chem Eng Res Des, 66 (3): 229.7. Kaibel, G., 1988, IChemE Symp Series No. 109: 43.8. Wright, R. O., 1945, US Patent 2,471,134.9. Kaibel, G., 1987, Chem Eng Technol, 10: 92.
10. Stupin, W. J., 1970, The separation of multicomponent mixturesin thermally coupled distillation systems, PhD Diss (University ofSouthern California).
11. Fonyo, Z., Szabo, J. and Foldes, P., 1974, Acta Chim, 82: 235.12. Tedder, D. W. and Rudd, D. F., 1978, AIChE J, 24(2): 303.13. Cerda, J. and Westerberg, W., 1981, Ind Eng Chem Proc Des Dev,
20(3): 546.14. Spadoni, G. and Stramigioli, C., 1983, 3rd Int Cong Computers and
Chemical Engineering, Paris, No 27: 43.15. Nikolaides, I. P. and Malone, M. F., 1987, Ind Eng Chem Res, 26(9):
1839.16. Triantafyllou, C. and Smith, R., 1992, Trans IChemE, 70 (A2): 118.17. Chavez, R., Seader, J. D. and Wayburn, T. L., 1986, Ind Eng Chem
Fundam, 25(4): 566±576.18. Lin, W. J., Seader, J. D. and Wayburn, T. L., 1987, AIChE J, 33:
886±897.19. Wolff, E. A., Skogestad, S. and Havre, K., 1993, AIChE Ann Meet,
St. Louis, paper 195a.20. Wolff, E. A., Skogestad, S. and Havre, K., 1994, ESCAPE’ 4, Dublin,
IChemE Symp Series No 133: 111±118.21. Morud, J. and Skogestad, S., 1994, AIChE Ann Meet, San Francisco,
paper 131d.22. Howard, G. M., 1967, Ind Eng Chem Fundam, 6(1): 86.23. Triantafyllou, C., 1991, The design optimisation and integration of
dividing wall distillation columns, PhD Thesis (submitted to UMISTManchester).
24. GLITSCH, 1992, (Private Communication.)25. Bristol, E. H., 1966, IEEE Trans Autom Control, AC-11: 133±134.
ACKNOWLEDGEMENTS
The authors would like to express their appreciation to the UKDepartment of Energy, Energy Ef® ciency Of® ce, BP, Exxon, Glitch, ICI,M. W. Kellogg, and Shell for ® nancial support of this project. The authorswould also like to express their gratitude to Dr Frigyes Lestak for hiscontribution to the project.
ADDRESS
Correspondence concerning this paper should be addressed toProfessor R. Smith, Department of Process Integration, UMIST,PO Box 88, Manchester M60 1QD, UK.
The manuscript was received 4 August 1997 and accepted for publicationafter revision 22 January 1998.
318 ABDUL MUTALIB and SMITH
Trans IChemE, Vol 76, Part A, March 1998
Table 8. Set point changes and feed disturbances used.
Middle product compositionSet point changes IPA: 0.985±0.988
Feed disturbances Combined feed composition and ¯ owrateComposition: MeoH ± 0.333 to 0.363IPA ± 0.334 to 0.284BuoH ± 0.333 to 0.353Flowrate: 1.081 to 1.190kmol/hr