optical imaging of luminescence for in vivo quantification of gene electrotransfer in mouse muscle...
TRANSCRIPT

BioMed CentralBMC Biotechnology
ss
Open AcceResearch articleOptical imaging of luminescence for in vivo quantification of gene electrotransfer in mouse muscle and kneeC Bloquel†, C Trollet†, E Pradines, J Seguin, D Scherman and MF Bureau*Address: Inserm, U640, Paris, F-75006 France; CNRS, UMR8151, Paris, F-75006 France; Université Paris Descartes, Faculté de Pharmacie, Chemical and Genetic Pharmacology Laboratory, Paris, F-75270 France; Ecole Nationale Supérieure de Chimie de Paris, Paris, F-75005, France
Email: C Bloquel - [email protected]; C Trollet - [email protected]; E Pradines - [email protected]; J Seguin - [email protected]; D Scherman - [email protected]; MF Bureau* - [email protected]
* Corresponding author †Equal contributors
AbstractBackground: Optical imaging is an attractive non-invasive way to evaluate the expression of atransferred DNA, mainly thanks to its lower cost and ease of realization. In this study opticalimaging was evaluated for monitoring and quantification of the mouse knee joint and tibial cranialmuscle electrotransfer of a luciferase encoding plasmid. Optical imaging was applied to study thekinetics of luciferase expression in both tissues.
Results: The substrate of luciferase (luciferin) was injected either intraperitonealy (i.p.) or in situinto the muscle or the knee joint. Luminescence resulting from the luciferase-luciferin reaction wasmeasured in vivo with a cooled CCD camera and/or in vitro on tissue lysate. Maximal luminescenceof the knee joint and muscle after i.p. (2.5 mg) or local injection of luciferin (50 µg in the knee joint,100 µg in the muscle) were highly correlated. With the local injection procedure adopted, in vivoand in vitro luminescences measured on the same muscles significantly correlated. Luminescencemeasurements were reproducible and the signal level was proportional to the amount of plasmidinjected. In vivo luciferase activity in the electrotransfered knee joint was detected for two weeks.Intramuscular electrotransfer of 0.3 or 3 µg of plasmid led to stable luciferase expression for 62days, whereas injecting 30 µg of plasmid resulted in a drop of luminescence three weeks afterelectrotransfer. These decreases were partially associated with the development of an immuneresponse.
Conclusion: A particular advantage of the i.p. injection of substrate is a widespread distribution atluciferase production sites. We have also highlighted advantages of local injection as a moresensitive detection method with reduced substrate consumption. Besides, this route of injection isrelatively free of uncontrolled parameters, such as diffusion to the target organ, crossing ofbiological barriers and evidencing variations in local enzymatic kinetics, probably related to thereaction medium in the targeted organ. Optical imaging was shown to be a sensitive and relevanttechnique to quantify variations of luciferase activity in vivo. Further evaluation of the effectiveamount of luciferase in a given tissue by in vivo optical imaging relies on conditions of the enzymaticreaction and light absorption and presently requires in vitro calibration for each targeted organ.
Published: 08 March 2006
BMC Biotechnology2006, 6:16 doi:10.1186/1472-6750-6-16
Received: 25 October 2005Accepted: 08 March 2006
This article is available from: http://www.biomedcentral.com/1472-6750/6/16
© 2006Bloquel et al; licensee BioMed Central Ltd.This is an Open Access article distributed under the terms of the Creative Commons Attribution License (http://creativecommons.org/licenses/by/2.0), which permits unrestricted use, distribution, and reproduction in any medium, provided the original work is properly cited.
Page 1 of 15(page number not for citation purposes)

BMC Biotechnology 2006, 6:16 http://www.biomedcentral.com/1472-6750/6/16
BackgroundMethods of gene transfer to tissues are still to be opti-mized. Successful human gene therapy requires effectivegene delivery and long term expression of the transgene.Among gene transfer methods, plasmid electrotransfer is aphysical method for in vivo non viral gene delivery. Themain target organs of this method are the skeletal muscle,which allows systemic secretion of the therapeutic pro-tein, some tumors, as well as the skin, mainly for vaccina-tion applications [1]. The field of applications ofelectrotransfer is still expanding, with the use of thismethod in other organs, such as cornea [2], tendon [3],liver [4], bladder [5], brain [6]. However, most of thesestudies focused on the establishment of transfer tech-niques.
To assess the feasibility, efficacy and patterns of genetransfer methods, there is a real need for simple and pre-cise methods of evaluation. In that context, non-invasiveevaluation of transfection is of great interest. This type ofmethod allows to follow simultaneously the distributionand expression level of transferred DNA at different timesreducing the number of animals used and improving sta-tistical analysis, with each animal acting as its own con-trol. Among different methods [7,8], optical imaging isparticularly attractive because of its lower cost and easi-ness of realization. However, more sophisticated methodsof quantitative tomography have been proposed for fluo-rescence [9] and are emerging for luminescence [10].Imaging is made with a CCD (Charged Coupled Device)camera, which relies on the conversion of photons thatstrike a CCD pixel into spatially defined electric charges.Various reporter genes, encoding fluorescent proteins ofdifferent emission wavelength or bioluminescent pro-teins, are available for this method. The use of luciferaseas a reporter gene requires injection of an exogenous sub-strate but there is no need of illumination which can per-turb physiology in light sensitive tissues [11]. Luciferasesare presently more sensitive than fluorescent reporters,thanks to a high quantum yield associated to a very lowbackground level of luminescence [12,13]. Sensitivity iscurrently increasing with further development of brighterforms of luciferase [14] and red shifted mutants [15].Moreover, luciferases have a rapid turnover (t1/2 of 3hours) which allows real-time measurements of the pro-tein production in vivo [16].
Luciferases are currently used as reporters of many biolog-ical functions [13,17]. It can be a useful tool to monitorprotein-protein interactions by BRET (BioluminescenceResonance Energy Transfer) or by LCI (LuminescenceComplementation Imaging) [17]. The luciferase gene canalso be used as a tracer to study tumor growth and metas-tasis [18,19], to follow labelled infectious bacteria orviruses [20]. Tracing of in vivo transgene expression after
transfection of different tissues by DNA encoding luci-ferase is applicable [21,22]. Luciferase expression hasbeen a useful tool to monitor the transcriptional activa-tion of a gene [23,24], and transgenic mice can allow theevaluation of the efficacy of therapeutic interventions[25].
Consequently, if the method is to be largely used in ani-mal research, problems of quantification remain to bestudied and discussed. In vivo, to our knowledge only onestudy was presently devoted to quantification of genetransfer by optical imaging of luminescence [22]; in thiswork, the transfection was performed in the muscle witha luciferase-encoding AAV vector, following an i.p. injec-tion of the substrate luciferin. Thus, it seemed useful tofurther analyze if the quantification of gene transfer byoptical imaging was feasible in a simple and reliable way,possibly in several organs simultaneously, and whether alocal substrate injection could be a good alternative. Ourexperimental model was the electrotransfer of the tibialcranial muscle [26,27] and/or the knee joint [28,29] witha plasmid encoding luciferase.
In this study, i.p. and local route of administration of luci-ferin were compared. As validated, the local injectionmethod led to more sensitive luminescence detectionthan the i.p. substrate injection. Quantification of the invivo luminescence thus obtained, was highly correlated tothe in vitro measurements on the same organ. Reproduci-ble measurements were obtained with the CCD cameradevice. This non-invasive approach to quantify geneexpression in various organs was then applied to kineticstudies in the muscle and knee.
ResultsComparison of different routes of administration of luciferin substrateThe enzymatic reaction to visualize luciferase activity isgenerally obtained following intraperitoneal luciferininjection. This route of injection should allow the sub-strate to reach any location where luciferase is produced[21]. However the substrate local availability depends onsome features such as blood perfusion and the nature ofphysiological barriers to cross (endothelium, extracellularmatrix, epithelium ...). I.p. luciferin accessibility was stud-ied in two different types of compartment: skeletal muscleand joint. We chose these two tissues in particular, sincethey are both interesting targets for electrotransfer, andthey are very different in size, cellular type and vascula-ture.
By electrotransfering a luciferase-encoding plasmid intothe right knee and the left muscle of the same mouse itwas possible to observe simultaneously the luminescencein both tissues after i.p. injection of luciferin (Figure 1A).
Page 2 of 15(page number not for citation purposes)

BMC Biotechnology 2006, 6:16 http://www.biomedcentral.com/1472-6750/6/16
Page 3 of 15(page number not for citation purposes)
A Luminescence of tibial cranial muscle and knee joint area after electrotransfer of a luciferase-encoding plasmid and i.p. injec-tion of luciferinFigure 1A Luminescence of tibial cranial muscle and knee joint area after electrotransfer of a luciferase-encoding plas-mid and i.p. injection of luciferin. Observation was done 26 minutes after i.p. injection of luciferin (2.5 mg/250 µl) and 7 days after electrotransfer of 3 µg and 60 µg of luciferase encoding plasmid (pC1-luc) into the tibial cranial muscle (on the left) and the knee joint (on the right) respectively. Levels of luminescence are represented in false colours according to a scale from 400 to 1500 (whole scale 65000). 1B and 1C Fluorescence of knee joint after injection of fluorescent albumin. Skin of the leg was removed. Fluorescence was induced with λex = 540 +/- 20 nm and observation was done at λem > 630 nm. Panel B: At these wavelengths, without injecting fluorochrome, it was possible to see bones by transparency. Panel C Just after injec-tion, labelled albumin is concentrated within patella of the knee joint and some diffusion of fluorescence within the joint can be observed. Levels of fluorescence are represented in false colors.

BMC Biotechnology 2006, 6:16 http://www.biomedcentral.com/1472-6750/6/16
We controlled the procedure of injection into the kneejoint using fluorescent albumin. After removal of the skin,it was possible to see better the fluorescence localizationrelative to bones, knee joint and muscle. Position of theknee can be seen in figure 1B. After intra-articular injec-tion of fluorescent albumin a bright spot of fluorescencewas observed at the level of the patella (Fig 1C); some dif-fusion of albumin was visible in the whole joint and alsopartly outside. From the position of the knee joint in thehind leg, it appeared that the transfection area, as shownby luminescence spot in figure 1A would be within thejoint, but transfection of adjacent tissues could not be
excluded. In agreement with previous results [21,22] aplateau level of luminescence was reached after about 20to 30 min for the muscle as for the knee joint area (figure2A). However the time required to reach the plateau levelof luminescence in muscle or knee area was variablebetween different experiments and the amount of luci-ferin to inject was relatively high (2.5 mg). We thus testedif local injection of a lower amount of luciferin was a validalternative. In addition such a procedure would moreselectively evidence the knee joint transfection. Weinjected 100 µg/40 µl into the muscle and 50 µg/10 µlinto the knee joint. Under these conditions, the substrate
Kinetics of luminescence of tibial cranial muscle and knee joint after electrotransfer of a luciferase encoding-plasmid and either i.p. or local injection of luciferinFigure 2Kinetics of luminescence of tibial cranial muscle and knee joint after electrotransfer of a luciferase encoding-plasmid and either i.p. or local injection of luciferin. 3 and 60 µg of a plasmid encoding luciferase were electrotransfered into the left tibial cranial muscle and right knee joint respectively. Luminescence measurements were done 7 days after electro-transfer. Values are mean +/- SEM of the integrated values of luminescence in region of interest (ROI) of the knee joint or of the tibial cranial muscle. For all experiments, the first measurement was performed 2 minutes after luciferin injection. Panel A: i.p. luciferin injection (2.5 mg/250 µl), n = 5 Panel B: local luciferin injection into the muscle (100 µg/40 µl) and into the knee joint (50 µg/10 µl), n= 5/organ. Luminescence decreased with time in the muscle (t1/2 = 3.3 minutes), and in the knee joint (t1/
2= 16.5 minutes).
Page 4 of 15(page number not for citation purposes)

BMC Biotechnology 2006, 6:16 http://www.biomedcentral.com/1472-6750/6/16
was in large excess relative to the expected amount of luci-ferase produced that should be of a few ng (in the muscle)[30]. Besides, injecting 3 to 4 times more substrate intojoint or muscle did neither modify the level of lumines-cence nor the decrease profile, confirming that the sub-strate was actually in excess and thus was not a limitingfactor in the targeted organ (data not shown). A fast lumi-nescence decrease occurred as soon as the first measure-ments (2 minutes after local substrate injection). The t1/2of the decrease was 16.5 min for knee joint and 3.3 minfor skeletal muscle (Figure 2B). In addition, in both tis-sues a subsequent injection of the same amount of luci-ferin after one hour delay induced similar luminescenceproduction (data not shown).
After electrotransfer of 3 and 60 µg of plasmid encodingluciferase into muscle and knee joint of the same mouse,respectively, the luminescence was about 4 times higherafter local injection of 100 µg luciferin into muscle and 50µg into knee than after i.p. injection of 2.5 mg luciferin(Table 1 – experiment 1). This 4-fold increase by the localsubstrate administration was confirmed by intramuscularelectrotransfer of a higher plasmid dose (30 µg) as shownin table 1 – experiment 2. Nevertheless, maximal lumines-cence values obtained after local luciferin injection (100µg/40 µl) were significantly correlated to those after i.p.injection (2.5 mg/250 µl).
We have also tested whether the sensitivity of the i.p.injection method could be improved when compared tothe one of the muscle local procedure. For this purpose,we used an i.p. injection dose of 6 mg of substrate insteadof 2.5 mg. The luminescence signal detected wasincreased, but remained below the one obtained by localinjection. By i.p. procedure, the substrate is thus not insufficient excess, even by injecting 6 mg of substrate, rela-tive to enzyme concentration in the targeted tissue (Table2).
These experiments thus highlighted the relevance of localinjection with an excess of luciferin substrate, whichallows luminescence detection highly correlated with i.p.injection. The major drawback of this method is the rapiddecrease of the signal, which requires performing allmeasurements at the same and precisely determined timeafter luciferin injection. For all the following experiments,we used this local injection protocol.
Comparison between in vivo and in vitro measurements of luciferase activityOne of the purposes of this study was to determinewhether the levels of luminescence obtained from in vivomouse muscle with a CCD camera were quantitativelyreflective of the ones detected in vitro after lysis of eachmuscle and classical biochemical measurement with a
Table 1: Comparison between local and i.p. injection of luciferin to induce luminescence after electrotransfer of a plasmid encoding luciferase into the knee joint or tibial cranial muscle
Experiment 1 (n = 5) Experiment 2 (n = 8)Knee 60 µg Muscle 3 µg Muscle 30 µg
Local i.p. Local i.p. Local i.p.
Luminescence Millions units/min 4.37 ± 1.40 1.18 ± 0.25 3.08 ± 1.81 0.74 ± 0.38 20.41 ± 5.62 4.86 ± 1.20Ratio local/i.p. 3.46 ± 0.76 3.55 ± 0.96 3.91 ± 0.38
Correlation r2 = 0.817 r2 = 0.929 r2 = 0.980local/i.p. p = 0.0351 p = 0.0082 p < 0.0001
Values are mean ± SEM of the integrated values of luminescence in ROI of the muscle or of the knee. In the first experiment, 60 and 3 µg of luciferase-encoding plasmid were electrotransferred into one knee joint and one tibial cranial muscle respectively. Luminescence was measured with the CCD camera 3 days after electrotransfer. In the second experiment, 30 µg of plasmid were electrotransferred into both tibial cranial muscles and luminescence was measured 7 days later. For all the experiments, luciferin was injected either locally (50 µg in the knee, 100 µg in the muscle) or i.p. (2.5 mg).
Table 2: Comparison of luminescence of tibial cranial muscles after electrotransfer of a luciferase-encoding plasmid and injection of luciferin i.p. (2.5 mg or 6 mg) or locally (0.1 mg)
Luciferin administration i.p. local
2.5 mg 6 mg 0.1 mgLuminescence 105 units/min 2.05 ± 0.32 7.06 ± 2.79 18.42 ± 2.68
Values are mean ± SEM (n = 6 to 12) of the integrated values of luminescence in ROI of the tibial cranial muscle 3 days after electrotransfer of 3 µg of pC1 luc plasmid as measured in vivo after luciferin injection i.p. (2.5 mg/250 µl, n = 6 or 6 mg/250 µl, n = 6) or locally (0.1 mg/40 µl n = 12). Local injection of luciferin was performed 2 hours or more after the i.p. injection. Background luminescence was subtracted from the luminescence measured.
Page 5 of 15(page number not for citation purposes)

BMC Biotechnology 2006, 6:16 http://www.biomedcentral.com/1472-6750/6/16
luminometer. This part of the study was made only withmuscle tissue, for which the in vitro biochemical assay hasbeen optimized. Besides, measurements on the mice kneejoint would be difficult both for sampling and lysis rea-sons. Indeed we could not accurately determine whichcells were transfected in the joint, as we found expressionboth in the patella area but also in the whole joint region(delimited by the heads of the femur and the tibia) (Datanot shown). Moreover lysis of the articular tissues wouldrequire use of collagenase which may not be compatiblewith the biochemical assay buffer.
To determine the conversion factor between the lumi-nometer used for in vitro assays and the CCD camera usedfor in vivo imaging, we quantified the luminescence pro-duced by different concentrations of luciferase in a 96 wellplate in the presence of an excess of luciferin with bothsystems. Such a calibration was unfortunately not possi-ble directly in vivo in mouse tissues (see Material andMethods). A good linear correlation was found betweenluminescence levels and luciferase amounts at differenttime after luciferin addition with the camera and with theluminometer, two min after substrate addition (r2 = 0.994and r2 = 0.988 respectively, p < 0.001). During the first 5minutes after luciferin addition the luminescence levelsmeasured with the luminometer or the cooled CCD cam-era with the setting chosen (see Material and Methods)were very similar. Thus comparisons between measure-ments with both systems were made without any modifi-cations of the values.
We determined the sensitivity of both measurement sys-tems to detect luminescence of the luciferase-luciferinreaction in the optimized conditions in vitro. With theluminometer the lowest clearly detectable luminescencecorresponded to a luciferase amount of about 0.01 ng (10µl of a 1 ng/ml solution). With the CCD camera it corre-sponded to an amount of 0.05 ng (10 µl of a 5 ng/ml solu-tion) due to a higher background.
Three doses of plasmid pC1luc (0.3, 3 and 30 µg) werethen used to establish the comparison between in vivo andin vitro measurements. This comparison was made 8 daysafter i.m electrotransfer, when a maximum expressionlevel was reached.
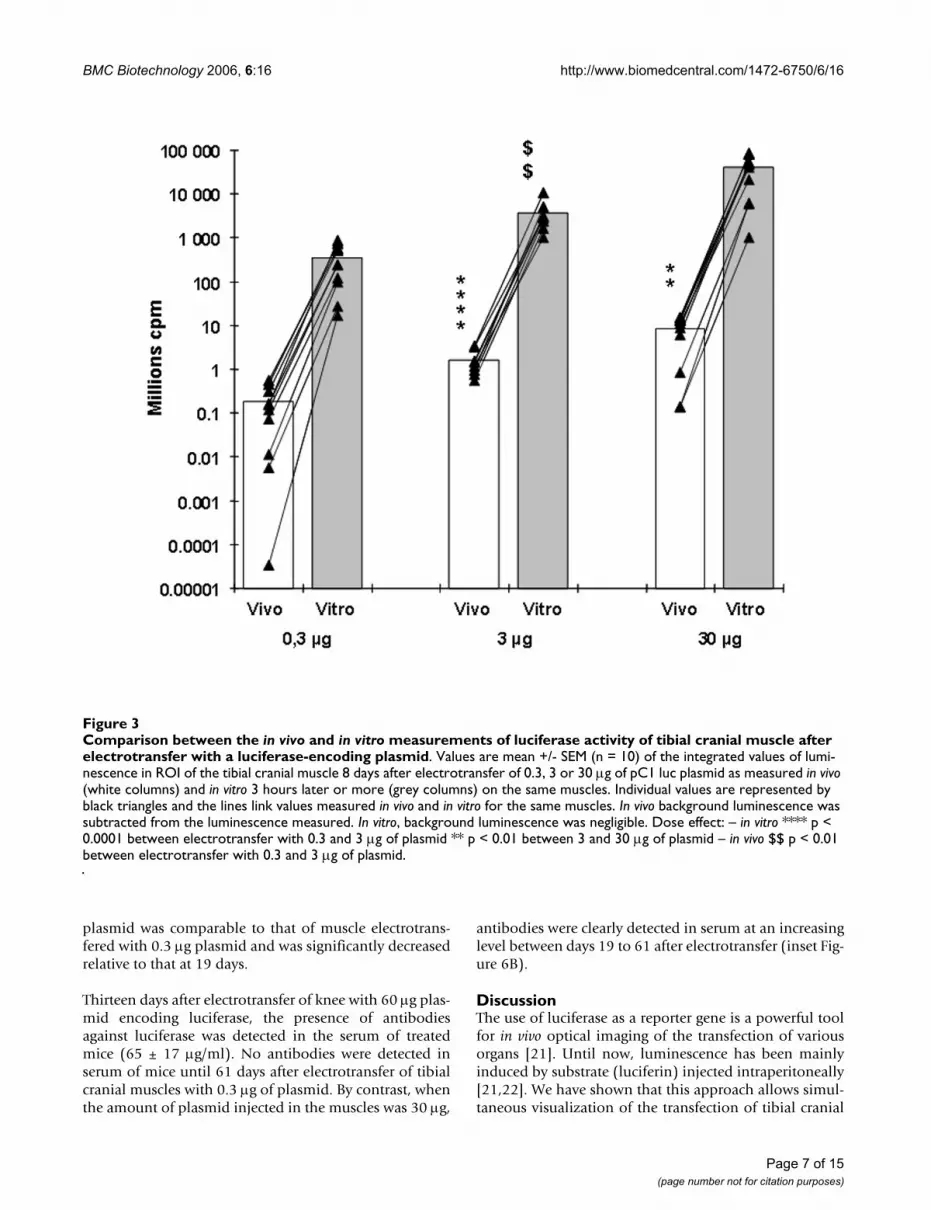
Figure 3 shows the luminescence levels as measured in vivowith the CCD camera and in vitro on lysates of the samemuscle using the luminometer on white plates. The meanlevel of luminescence was higher in vitro than in vivo by 3orders of magnitude. In spite of this difference in vitro andin vivo values of luminescence were significantly corre-lated (r2 = 0.796 p < 0.0001; Number of paired values =28).
Accordingly, dose dependence between luciferase activityand injected plasmid doses was both observed in vitro andin vivo (figures 3, 4, 5).
Figure 4 shows that luminescence resulting from the reac-tion between luciferase and luciferin in the muscle can bedetected by optical imaging as soon as 6 hours after elec-trotransfer of 0.3 µg of pCMV-luc+. By comparing in vivoand in vitro measurements of muscle luminescence andusing in vitro calibration curves with recombinant luci-ferase, we could estimate the amount of luciferase in thesemuscles which was of about 3 ng (see appendix). TheCCD device thus appeared as a sensible tool to quantifyluciferase expression in a living organism.
Reproducibility of in vivo luminescence measurements in the muscle tissueIt is known that gene expression following intramuscularelectrotransfer reaches a stable maximum value one weekafter the injection. At this point, individual values shouldbe consistently reproducible. We used this well knownproperty of the electrotransfer method to validate thereproducibility of measurements with the CCD device.Mean levels of in vivo luminescence at days 7 and 8 afterelectrotransfer of 0.3, 3 or 30 µg of the pC1-luc plasmidwere comparable as expected (Figure 5) and were signifi-cantly correlated (inset) (r2 = 0.92 p < 0.0001). Significantcorrelations between values at days 7 and 8 were alsoobserved by analyzing separately the three groups of val-ues corresponding to the three amounts of plasmid elec-trotransfered (0.3 µg, r2 = 0.89, p < 0.0001; 3 µg, r2 = 0.59,p = 0.026; 30 µg, r2 = 0.77, p = 0.0008).
Kinetic of luciferase expression in the electrotransfered knee joint and skeletal muscleFrom the above results it appears that in vivo luciferasequantification is a reliable methodology. We thus usedthis non-invasive method to study kinetics profile of luci-ferase activity in knee joint and skeletal muscle.
The expression of luciferase in the knee joint area was fol-lowed for two weeks after electrotransfer of 60 µg of pC1-luc or the same dose of a control plasmid with no encod-ing sequences. A maximum value of luminescence wasreached between 3 and 6 days after electrotransfer. Expres-sion of luciferase gradually decreased thereafter andreturned close to the control level 13 days after the electro-transfer (Figure 6A).
In skeletal muscle, luciferase expression was stable for atleast two months following the electrotransfer of either0.3 µg plasmid (Figure 6B) or of 3 µg (data not shown).By contrast, a decrease of luminescence at day 19 for thehigh dose of 30 µg plasmid, was observed. At day 62 theluminescence for muscle electrotransfered with 30 µg
Page 6 of 15(page number not for citation purposes)
BMC Biotechnology 2006, 6:16 http://www.biomedcentral.com/1472-6750/6/16
plasmid was comparable to that of muscle electrotrans-fered with 0.3 µg plasmid and was significantly decreasedrelative to that at 19 days.
Thirteen days after electrotransfer of knee with 60 µg plas-mid encoding luciferase, the presence of antibodiesagainst luciferase was detected in the serum of treatedmice (65 ± 17 µg/ml). No antibodies were detected inserum of mice until 61 days after electrotransfer of tibialcranial muscles with 0.3 µg of plasmid. By contrast, whenthe amount of plasmid injected in the muscles was 30 µg,
antibodies were clearly detected in serum at an increasinglevel between days 19 to 61 after electrotransfer (inset Fig-ure 6B).
DiscussionThe use of luciferase as a reporter gene is a powerful toolfor in vivo optical imaging of the transfection of variousorgans [21]. Until now, luminescence has been mainlyinduced by substrate (luciferin) injected intraperitoneally[21,22]. We have shown that this approach allows simul-taneous visualization of the transfection of tibial cranial
Comparison between the in vivo and in vitro measurements of luciferase activity of tibial cranial muscle after electrotransfer with a luciferase-encoding plasmidFigure 3Comparison between the in vivo and in vitro measurements of luciferase activity of tibial cranial muscle after electrotransfer with a luciferase-encoding plasmid. Values are mean +/- SEM (n = 10) of the integrated values of lumi-nescence in ROI of the tibial cranial muscle 8 days after electrotransfer of 0.3, 3 or 30 µg of pC1 luc plasmid as measured in vivo (white columns) and in vitro 3 hours later or more (grey columns) on the same muscles. Individual values are represented by black triangles and the lines link values measured in vivo and in vitro for the same muscles. In vivo background luminescence was subtracted from the luminescence measured. In vitro, background luminescence was negligible. Dose effect: – in vitro **** p < 0.0001 between electrotransfer with 0.3 and 3 µg of plasmid ** p < 0.01 between 3 and 30 µg of plasmid – in vivo $$ p < 0.01 between electrotransfer with 0.3 and 3 µg of plasmid.
Page 7 of 15(page number not for citation purposes)

BMC Biotechnology 2006, 6:16 http://www.biomedcentral.com/1472-6750/6/16
muscle and knee joint area in the same mouse. This indi-cates that the substrate can reach even a small and less per-fused compartment such as the knee joint. Such adetection method is of particular interest for the knee,since quantitative in vitro measurement of luciferase activ-ity in this tissue is difficult and has been reported only forbigger animals such as the rat [28,29]. Following luciferini.p. injection, curves of luminescence versus time had asimilar pattern in both muscle and joint. However, thetime to reach maximum level of expression was variablefrom one experiment to the other, and the amount of luci-ferin used was relatively high. Moreover, by using a higherdose of substrate (6 mg), we demonstrated that the maxi-mal level of luminescence is not reached with the com-
monly used dose of 2.5 mg substrate. In addition,selective transfection of the knee joint is difficult andsometimes neighboring tissues can also be transfected. Wetherefore tested if the local injection of lower amounts ofluciferin could be used alternatively, the other advantagebeing a more selective estimation of transfection for theknee joint.
Comparison between i.p. and local luciferin administrationBy local injection of the substrate, a maximal value ofluminescence was detected in both muscle and joint assoon as the first CCD camera observation. Luminescencethen decreased rapidly in the muscle and somewhatslower in the knee joint. Most importantly, luciferin local
Sensitivity of in vivo luminescence measurements and dose effectFigure 4Sensitivity of in vivo luminescence measurements and dose effect. Values are mean +/- SEM of the integrated values of luminescence in ROI of the tibial cranial muscle 6 h (n = 6 to 10), 1 day and 8 days (n = 10 to 20) after electrotransfer of 0.3 µg (white columns), 3 µg (clear grey columns) and 30 µg (dark grey columns) of pCMV-luc+ into the tibial cranial muscle. For all points, background luminescence was subtracted. Statistical significance of the differences **** p < 0.0001, ** p < 0.01, * p < 0.05.
Page 8 of 15(page number not for citation purposes)

BMC Biotechnology 2006, 6:16 http://www.biomedcentral.com/1472-6750/6/16
injection led to a four fold luminescence increase over 2.5mg luciferin i.p. injection. Additionally, i.p. injection of ahigher amount of 6 mg luciferin still did not allow toreach the luminescence level obtained after local injectionof 100 µg luciferin. Maximal luminescence levelsobtained after i.p. (2.5 mg) or local (0.1 mg) injection ofluciferin were highly correlated in both knee and muscle,even when different amounts of plasmid were adminis-trated in the muscle. This indicates that both proceduresof luciferin injection can be used for monitoring varia-tions of luciferase activity in vivo independently of the tis-
sue concerned or of the amount of plasmidelectrotransfered. Local procedure allows reduced sub-strate consumption and is more sensitive since it inducesmore luminescence. This improved sensitivity after localinjection of luciferin was also shown by Li et al whodetected luciferase activity of transfected rat muscles for alonger period after local than after i.p. injection of luci-ferin [31]. Nevertheless intraperitoneal injection of highamounts of luciferin remains a useful technique when thesite of luciferase production is difficult to reach or isunknown. In addition, the time to reach peak level of
Reproducibility of in vivo luminescence measurements on muscles after electrotransfer of a luciferase-encoding plasmidFigure 5Reproducibility of in vivo luminescence measurements on muscles after electrotransfer of a luciferase-encod-ing plasmid. Values are mean +/- SEM (n = 8 to 10) of the integrated values of luminescence in region of interest (ROI) of the tibial cranial muscle 7 days and 8 days after electrotransfer with 0.3 µg (white columns), 3 µg (clear grey columns) and 30 µg (dark grey columns) of pC1-luc into the tibial cranial muscle. Individual values are represented by black triangles and lines link values for the same muscles at day 7 and 8 after electrotransfer. For each amount of plasmid electrotransferred, luminescence values at day 7 (D7) and 8 (D8) did not differ. For both time of measurement (D7 and D8) a significant dose effect was observed. *** p < 0.001 between 0.3 and 3 µg (for groups D7 or D8). * p < 0.05 between 3 and 30 µg (for group D7 or D8). For all points, background luminescence was subtracted Inset: Linear correlation between values of luminescence measured at day 7 and 8 after electrotransfer. R2 = 0.92, p < 0.0001.
Page 9 of 15(page number not for citation purposes)

BMC Biotechnology 2006, 6:16 http://www.biomedcentral.com/1472-6750/6/16
Page 10 of 15(page number not for citation purposes)
In vivo kinetic of luciferase expression in the knee joint and in the tibial cranial muscle and antibody concentration in blood serum after electrotransfer of luciferase-encoding plasmidFigure 6In vivo kinetic of luciferase expression in the knee joint and in the tibial cranial muscle and antibody concentra-tion in blood serum after electrotransfer of luciferase-encoding plasmid. Panel A: Mean + SEM (n = 8) of the inte-grated values of luminescence in region of interest (ROI) of the knee joint at different times after electrotransfer of 60 µg/10 µl of pC1-luc plasmid (black square symbols) or empty plasmid (black diamond symbols). The in vivo luminescence was assayed 2 minutes after luciferin injection into the joint. Panel B: Mean ± SEM (n= 6 to 10) of the integrated values of luminescence in region of interest (ROI) of the tibial cranial muscle at different times after electrotransfer of 0.3 µg (White columns) or 30 µg (grey columns) of pC1 luc plasmid. The in vivo luminescence was assayed 2 minutes after luciferin injection into the electro-transfered muscle. For all point background luminescence was subtracted. Statistical significance for comparisons of lumines-cence between different times after electrotransfer of 30 µg of plasmid **** p < 0.0001, ** p < 0.01; after electrotransfer of 0.3 µg of plasmid $$ p < 0.01 Inset: Mean + SEM (n = 5) of the concentration of antibodies against luciferase in the blood serum at different times after electrotransfer of 0.3 µg (empty triangles) or 30 µg (black diamon) of pC1 luc plasmid into the muscle.

BMC Biotechnology 2006, 6:16 http://www.biomedcentral.com/1472-6750/6/16
luminescence in one tissue after i.p. luciferin injection isrelated to the time for the substrate to access its target. Thismight, for example, provide information on blood per-fusion.
We observed a slower luminescence decrease after localinjection of luciferin in the knee joint than in the muscle.This decrease of luminescence with time in vivo could berelated to a decrease of substrate concentration because ofdiffusion and washout by the circulation. Such an hypoth-esis is sustained by the stability of luminescence on cellsin vivo [32]. However, we used a large excess of substrate(100 µg luciferin vs < 100 ng luciferase in the muscle i.e atminimum 1000 times more substrate), and can assumethat diffusion will have not a great effect. Besides, increas-ing the substrate concentration did neither modified sig-nificantly the maximum value of luminescence nor thekinetic of luminescence decrease, highlighting no effect ofthe substrate concentration on the signal. Lastly additionof luciferin (100 µg/40 µl) to isolated electrotransferedtibial cranial muscle in a multiwell plate induced the sametype of decreased kinetics, despite a large excess of sub-strate and the absence of washout problems. These differ-ences also cannot be due to kinetic of diffusion of theluciferin inside cells since a similar kinetic profile isobtained by mixing recombinant luciferase to luciferin inthe buffer used for in vitro measurements. Moreover theamount of luciferase protein in the cells seemed to remainconstant and the cofactors required for the reaction (ATP,O2, Mg2+ principally) were in sufficient excess since a newaddition of substrate after return to luminescence back-ground induced a similar luminescence level in both mus-cle and knee joint. In conclusion, decrease ofluminescence with time seems essentially related to thereaction media and/or to enzyme complexation.
Kinetic differences between muscle and knee might thusbe linked to the reaction media which can differ accordingto the tissue. For example it has been reported that thekinetic of light production is related to the concentrationratio between the enzyme and ATP [33]. The reaction canalso lead to the production of inhibitors of the lumines-cence [34]. Lastly some molecules present in cells stimu-late [34,35] and/or inhibit the luminescence [34,36].
As a consequence, luciferase quantification in different tis-sues is sensitive to the conditions of the reaction. In agiven tissue the quantification will rely on the hypothesisthat these conditions of reaction are the same throughoutthe study.
Validation of optical imaging as a tool to quantify luciferase activity in vivoUntil now, optical imaging with luciferase was mostly pre-sented as a semi quantitative technique. From the above
consideration it was thus essential to verify if the valuesmeasured by optical imaging in these experiments wereconsistent with values obtained by the classical lumines-cence quantification method: in vitro measurements onthe supernatant of tissues homogenized in lysis buffer.
We observed a significant correlation between in vivo andin vitro measurements. This result confirms the resultsobtained by Wu et al [22], but with a local injection ofsubstrate, and thus a more sensitive method, and for awide range of plasmid dose. In addition, a clear dose effectwas observed in vivo 8 days after intramuscular electro-transfer of 0.3, 3 or 30 µg of plasmid, which is consistentwith in vitro measurements of this study and confirmedthe in vitro results of a previous work [37]. Moreover, opti-cal imaging system was sensitive enough to detect lumi-nescence resulting from the reaction of luciferase withluciferin as soon as 6 hours after intramuscular electro-transfer of 0.3 µg of pCMV-luc+ plasmid. Finally a goodreproducibility of luminescence measurements wasobserved at times for which transfection level of the mus-cle is known to be stable [30].
We can thus assume that variations of luminescencedetected with a cooled CCD camera are sensitive enough,accurate and well related to the effective amount of luci-ferase present in the studied tissue.
Taking into account differences between measurementsystems (conversion factor between the two devices, seeMaterial and Methods), our data highlight that lumines-cence in vivo was largely lower when compared to that invitro. Understanding this discrepancy is necessary toimprove sensitivity of in vivo measurements. One factorcould be the absorption and scattering of light by the tis-sue. But luminescence attenuation is not sufficientthrough a few millimeters of tissue [22,38]. The maincause of observation of a lower luminescence in vivo mustbe linked to the difference in reaction media for in vivoand in vitro measurements. Indeed media used in vitro areoptimized in order to maximally enhance the lumines-cence of the luciferase-luciferin reaction. We thusobserved that when luciferase was diluted in Tris buffer(pH 8) the luminescence produced after addition of thesubstrate and ATP was about 2 orders of magnitude lowerthan when diluted in lysis buffer (which also containTris). We verified that part of this improvement was dueto the presence of dithiothreitol (DTT) known to avoidenzyme degradation [35] and to the triton detergent, bothpresent in the lysis buffer (data not shown). In addition,in vitro measurements were usually performed in multi-well white plates, in which the light emission measuredwas higher by one order of magnitude than the lumines-cence level measured in black plates (data not shown), asexpected from previous studies [39]. Taking into account
Page 11 of 15(page number not for citation purposes)

BMC Biotechnology 2006, 6:16 http://www.biomedcentral.com/1472-6750/6/16
these two factors (difference of reaction media and thetype of plates used) seems sufficient to explain the differ-ence between in vivo and in vitro measurements. Neverthe-less, only tomographic measurements could beappropriate to collect the whole luminescence emergingfrom the muscle. Indeed, fluorescent tomographic meas-urements were proven more sensitive than planar meas-urements [9].
Our results highlight that luminescence quantification inone tissue is rather accurate and can be related to the effec-tive amount of luciferase but requires an additional cali-bration step to put in adequacy in vivo to in vitromeasurements. In vivo luminescence levels in different tis-sues are not directly related to their luciferase contentsbecause of differences in the condition of in vivo enzy-matic reaction and in tissue absorption depending on thelocation of the tissues. Thus absolute quantification instudies implying several tissues require preliminary cali-bration for all the tissues involved.
Kinetics of luciferase expression in the muscle and the kneeWe have studied kinetic profiles of luciferase activity inthe muscle or in the knee joint electrotransfer of a luci-ferase-encoding plasmid. To our knowledge electrotrans-fer into the knee joint was only reported for rats in twostudies [28,29] and non-invasive detection of luciferaseactivity in the electrotransferred mouse knee joint hasnever been done previously.
High and long term (> 2 months) level of luciferaseexpression after intramuscular electrotransfer has beenwell documented. Here, we confirm by optical imagingthe stability of luciferase expression for at least 62 days intibial cranial muscle after electrotransfer of 0.3 or 3 µg ofluciferase-encoding plasmid. In contrast, a decrease ofluciferase activity occurred three weeks after electrotrans-fer of the higher dose of 30 µg of plasmid, concomitantlyto the production of antibodies against luciferase. Similarimmune responses were also observed by others, afterpC1luc plasmid DNA transfer into the liver of C57Bl6mouse [40]. After electrotransfer of 60 µg of plasmid intothe mouse knee joint, luciferase activity reached a peakbetween 3 to 6 days and returned to the control level twoweeks after electrotransfer. A similar kinetic profile wasalso observed by Ohashi et al by in vitro evaluation of thetransgene expression in the synovium [29]. In contrastGrossin et al observed expression of an electrotransferedplasmid encoding for GFP for a longer period and local-ized mainly in the knee patellae [28]. These differencesmay be related to the use of different electrotransfer con-ditions (injection site, electric conditions and electrodes).In the present study, by using optical imaging, we havedetected the luminescence of the whole knee and it was
not possible to identify the particular type of cells trans-fected under the specified conditions. Decrease of luci-ferase activity in this tissue can be partially explained bysynovial cell turnover. Indeed, antibodies against luci-ferase were detected as soon as 13 days after electrotrans-fer of a high dose of plasmid. In muscle, the decrease ofluciferase activity and the concomitant antibodies detec-tion was only observed while injecting a higher dose ofplasmid. These results confirm that a non-self proteinexpressed into myofibres seems to be not detected by theimmune system when its concentration is below a thresh-old value as demonstrated by Miller et al [41]. With higherdose of electrotransfered plasmid, the observed immuneresponse can occur via multiple mechanisms [42]. It isknown that electrotransfer enhances the specific immuneresponse both by increasing transgene expression and byinducing inflammation [43,44] which is more importantwhen high amounts of plasmid are injected [45,46] but isreversed two weeks after electrotransfer. In summary weobserved a specific humoral immune response againstluciferase and probably cytotoxicity against muscularfibres expressing the luciferase resulting in decrease of theluciferase activity. These two types of specific immunereactions have been observed in several studies in DNAvaccination models (see for example [42]).
ConclusionIn conclusion we have shown here that optical imagingallows in vivo visualization and quantitative assay of luci-ferase activity in two different types of tissue in the mousemodel, the muscle and the knee joint, which defines asmaller and less vascularized compartment. This observa-tion can be made after i.p. or local injection of the luci-ferin substrate. We showed that local injection allowed amore sensitive detection of luciferase activity with lowersubstrate consumption. Luminescence observed in suchconditions can be assumed to be independent fromuncontrolled parameters as diffusion of the substrate tothe target cells or circulation washout.
In the field of gene therapy, this detection method couldbe useful for promoter efficacy studies and optimizationof gene transfer methods, in muscle, joint or other tissuesaccessible to the substrate of luciferase. Alternatively, luci-ferase can be used as a tracer by its fusion with other trans-genic proteins of interest that cannot be easily quantifiedand localized, or by transfecting cells of interest with aluciferase encoding plasmid. This might greatly enhancethe scope and further applications of the present study.However, care must be taken in future studies toward thedevelopment of a possible immune response against thereporter transgenic protein when high transgene expres-sion levels are required.
Page 12 of 15(page number not for citation purposes)

BMC Biotechnology 2006, 6:16 http://www.biomedcentral.com/1472-6750/6/16
MethodsAnimalsIn vivo studies were done using 6 to 8 weeks old femaleC57Bl/6 or Swiss mice (Charles River, L'Arbresle, France).Prior to all procedures, the animals were anaesthetised byintraperitoneal injection of ketamine and xylazine (BayerPharma, Puteaux, France) (100 and 10 mg/kg, respec-tively). Studies were conducted following the recommen-dations of the European Convention for the Protection ofVertebrates Animals used for Experimentation and thelocal Ethic Committee on Animal Care and Experimenta-tion.
Plasmid DNAPlasmid pC1-luc is an expression vector carrying a modi-fied cytosolic firefly luciferase gene (luc+) cloned down-stream of a CMV promoter.
In one experimental series (Figure 4) we used plasmid pXL3031 (pCMV-luc+) which also carries the modifiedcytosolic firefly luciferase gene (luc+) under the control ofa CMV promoter (gift from Aventis Pharma [47]); it leadsto comparable levels of expression of the luciferase.
Plasmid DNA was purified using Endo-free Qiagen Max-iprep kits (Qiagen, Germany). All dilutions were done insaline (NaCl 0.9 %).
Injection and electrotransfer of plasmid into the tibial cranial muscle and the knee jointPlasmid DNA (0.3 to 30 µg/30 µl) was injected into thetibial cranial muscle. Twenty seconds later, 8 square-waveelectric pulses (200 V/cm, 20 ms, 2 Hz) were deliveredthrough two stainless steel plate electrodes placed eachside of the shaved leg, using an ECM 830 BTX electropul-sator (Genetronics, San Diego, CA, USA) [26,30].
For electrotransfer of plasmid into the knee joint, 60 µg(in 10 µl) were injected into the joint by using a hamiltonsyringe. Twenty seconds after the injection, 12 electricpulses of 250 V/cm, 20 ms each at 2 Hz (personal commu-nication of Florence Apparailly) were applied using a pairof stainless steel parallel electrodes (1 cm long, 0.3 cmlarge, and 4.5 mm apart) placed at each side of the knee(anterior-posterior direction).
For all experiments electrical contact with the skin wasensured by application of a conductive gel.
Optical imaging of luminescenceLuciferin diluted in PBS (Promega, Madison WI, USA) wasinjected intraperitonealy (i.p., 2.5 mg/250 µl) or locallyinto the tibial cranial muscle (100 to 400 µg/40µl) or theknee joint (50 to 150 µg/10 µl). Optical imaging was per-formed with a cooled CCD camera (Apogee, Ap47p,
Auburn Calif, USA) placed in a black box and equippedwith a 60 mm lens opening at F 2.8 (Nikon, Japan). Dis-tance from the lens to the mouse was of 30 cm. Operatingtemperature was set at -25°C. Duration of luminescenceacquisition was between 30 s and 240 s and was initiated2 minutes after injection of the substrate. Quantum effi-ciency is > 90 % in the λ range of 500 to 680 nm. Lumi-nescence levels were integrated in region of interest (ROI)drawn by hand around luminescence zones correspond-ing to the tibial cranial muscle and/or knee joint area asestimated from superposed optical image of the mice.Background luminescence was subtracted according tovalues obtained in ROI drawn on a non transfected zoneof the mice (software β Vision+ from Biospace Mesure,Paris, France). ROI were very similar from one experimentto the other. When following kinetic of the luciferase-luci-ferin reaction strictly the same ROI were used for lumines-cence images taken at different times. In someexperiments, when the luminescence signal reached back-ground level, mice were euthanazied to remove tibial cra-nial muscles which were then frozen at -20°C for furtherin vitro luciferase assays.
Optical imaging of fluorescenceTo asses the localization of injected plasmid into the kneejoint, fluorescent albumin (BSA, Alexa Fluor 594 conju-gate from Molecular Probe, Oregon, USA) was injectedinto this tissue as described in the previous section. Fluo-rescence was induced with λex of 540 +/- 20 nm andobserved at λem > 630 nm. Lens aperture: F = 11 andacquisition time: 0.05 sec
Biochemical luciferase activity assaysAfter sample thawing, each muscle was homogenized in 1ml of cell culture lysis reagent (Promega, Charbonnière,France) supplemented with protease inhibitor cocktail(Boehringer Mannheim, Mannheim, Germany) (one tab-let for 50 ml). After centrifugation at 12,000 rpm for 10min at 4°C, the luciferase activity on 10 µl of the superna-tant was assessed in 96 wells white plate using a WallacVictor luminometer (EG&G Wallac, Evry, France), by inte-gration of the light produced during 1 s, starting after theaddition of 50 µl of luciferase assay substrate (Promega)to the lysate. Results were given for the whole muscle incounts per second (cps) for 1 ml of supernatant. It was notnecessary to substract background luminescence, whichwas very low (less than 50 cps).
Determination of a conversion factor for comparison of in vivo and in vitro measurements of luminescenceDifferent amounts of luciferase (0.001 to 10 nmoles) in10 µl were distributed in wells of a black 96 wells plate,and 50 µl of luciferin solution (Promega, Madison WI,USA) were then added in each well. Measurements withthe luminometer or the cooled CCD camera were initiated
Page 13 of 15(page number not for citation purposes)

BMC Biotechnology 2006, 6:16 http://www.biomedcentral.com/1472-6750/6/16
2 minutes after addition of the substrate. Conversion fac-tor is the ratio of measured values with both systems at agiven time.
It was not possible to establish directly a calibration curvein vivo after injection of different amounts of luciferaseinto the knee joint or the muscle. Indeed injected luci-ferase is distributed in the extracellular space and the addi-tion of luciferin does not induce detectable luminescenceessentially because of the lack of ATP. We verified thataddition of ATP with luciferin allowed to obtain lumines-cence but it is not obvious that in these conditions theluminescence measured would be equivalent to thatmeasured for the same amount of intracellular luciferase.
Titration of antibodies against luciferase in serumAt different times after electrotransfer, blood sampleswere collected by retro orbital puncture of anaesthetizedmice, centrifuged at 3000 rpm for 10 minutes at 4°C, andserums were conserved at -80°C for further ELISA anti-body detection. Microtiter plates were coated overnight atroom temperature with luciferase (1 µg/ml, Promega,Madison WI, USA) in 100 µl of PBS. The wells were thensaturated for 30 minute at 37°C with 100 µl of blockingbuffer (PBS/0.1% Tween 20/0.2% gelatine). Serum werediluted at 1:1000 in 100 µl of blocking buffer and incu-bated for 1 h at 37°C. Then 100 µl of horseradish peroxi-dase-conjugated goat anti-mouse secondary antibody(diluted 1:2000) in wash buffer (PBS/0.1% Tween 20)was added to the plates and incubated for an additionalhour at 37°C. Bound antibody was detected colorimetri-cally by using ortho-phenilenediamine (Sigma, USA) as asubstrate, diluted in sodium citrate buffer (0.1 M sodiumcitrate plus 0.1 M citric acid, pH 5.0) to a final concentra-tion of 1 mg/ml. Color was assayed at 492 nm after 5 minincubation at room temperature. Serum samples fromindividual animals were assayed in triplicate. As a controland for quantification, a serial dilution of a monoclonalantibody anti-luciferase (Sigma, L2164) was used rangingfrom 0 to 2 µg/ml in blocking buffer.
StatisticsVariance analyses on log values of the measured parame-ters, and a protected least significance test of Fisher forcomparison between treatments have been used. Correla-tions between groups of paired values were established bya linear regression analysis. Values of several separateexperiments have been gathered when variance analysisshowed no significant difference between these experi-ments.
Authors' contributionsCB performed electrotransfer and optical imaging of theknee joint. CT performed antibody detection and contrib-uted to experiments on muscles. Technical and intellec-
tual contribution of CB and CT were equivalent and theyboth contributed highly to criticism and writing of themanuscript. EP was more particularly involved in experi-ments of comparisons between in vitro and in vivo meas-urements of luciferase activity. JS participated toexperiments of electrotransfer and optical imaging of themuscle and data analysis. DS is director of the researchunit and helped to draft the manuscript. MFB was respon-sible for the design and development of this study andwriting of the manuscript. He performed a great part ofelectrotransfer and optical imaging experiments and allstatistical analyses.
AppendixEstimation of luciferase amount in the tibial cranial muscle from in vivo luminescence measurementIt is not possible to evaluate exactly the amount of luci-ferase corresponding to in vivo detected luminescence. Butestimation is possible. Indeed from linear calibrationcurve y = Ax + B, we know the relation between lumines-cence in vitro y and the amount of luciferase x. Next fromexperiment in figure 3 we know the mean ratio k betweenluminescence measured in vitro y and luminescence in vivoy' for the same amount of luciferase i.e k = y/y'. It resultsthat amount of luciferase in vivo x' ≈ (y'.k - B)/A. Hypoth-esis being that the ratio between luminescence in vitro andin vivo is constant and not dependant of the amount ofluciferase. Results of figure 3 indicate the level of approx-imation of such a hypothesis. In addition such a calcula-tion cannot be extrapolated to other tissues where theluminescence reaction is different.
AcknowledgementsWe are grateful to Dr Pascal Bigey for constructing the pC1-luc plasmid, and to Dr Florence Apparailly (INSERM U475, Montpellier, France) who communicated to us electrical parameters for plamid electrotransfer into the knee joint.
This work was in part supported by a grant I.PA (Imagerie du Petit Animal, CNRS-CEA)
References1. Andre F, Mir LM: DNA electrotransfer: its principles and an
updated review of its therapeutic applications. Gene Ther2004, 11 Suppl 1:S33-42.
2. Blair-Parks K, Weston BC, Dean DA: High-level gene transfer tothe cornea using electroporation. J Gene Med 2002, 4:92-100.
3. Jayankura M, Boggione C, Frisen C, Boyer O, Fouret P, Saillant G,Klatzmann D: In situ gene transfer into animal tendons byinjection of naked DNA and electrotransfer. J Gene Med 2003,5:618-624.
4. Heller L, Jaroszeski MJ, Coppola D, Pottinger C, Gilbert R, Heller R:Electrically mediated plasmid DNA delivery to hepatocellu-lar carcinomas in vivo. Gene Ther 2000, 7:826-829.
5. Harimoto K, Sugimura K, Lee CR, Kuratsukuri K, Kishimoto T: Invivo gene transfer methods in the bladder without viral vec-tors. Br J Urol 1998, 81:870-874.
6. Inoue T, Krumlauf R: An impulse to the brain--using in vivoelectroporation. Nat Neurosci 2001, 4 Suppl:1156-1158.
7. Bogdanov AJ, Weissleder R: The development of in vivo imagingsystems to study gene expression. Trends Biotechnol 1998,16:5-10.
Page 14 of 15(page number not for citation purposes)

BMC Biotechnology 2006, 6:16 http://www.biomedcentral.com/1472-6750/6/16
8. Shah K, Jacobs A, Breakefield XO, Weissleder R: Molecular imag-ing of gene therapy for cancer. Gene Ther 2004, 11:1175-1187.
9. Ntziachristos V, Schellenberger EA, Ripoll J, Yessayan D, Graves E,Bogdanov AJ, Josephson L, Weissleder R: Visualization of antitu-mor treatment by means of fluorescence molecular tomog-raphy with an annexin V-Cy5.5 conjugate. Proc Natl Acad Sci US A 2004, 101:12294-12299.
10. Li H, Tian J, Zhu F, Cong W, Wang LV, Hoffman EA, Wang G: Amouse optical simulation environment (MOSE) to investi-gate bioluminescent phenomena in the living mouse withthe monte carlo method. Acad Radiol 2004, 11:1029-1038.
11. Thomsen S: Pathologic analysis of photothermal and photo-mechanical effects of laser-tissue interactions. Photochem Pho-tobiol 1991, 53:825-835.
12. Troy T, Jekic-McMullen D, Sambucetti L, Rice B: Quantitative com-parison of the sensitivity of detection of fluorescent and bio-luminescent reporters in animal models. Mol Imaging 2004,3:9-23.
13. Golzio M, Rols MP, Gabriel B, Teissie J: Optical imaging of in vivogene expression: a critical assessment of the methodologyand associated technologies. Gene Ther 2004, 11 Suppl1:S85-91.
14. Tannous BA, Kim DE, Fernandez JL, Weissleder R, Breakefield XO:Codon-optimized gaussia luciferase cDNA for Mammaliangene expression in culture and in vivo. Mol Ther 2005,11:435-443.
15. Kitayama Y, Kondo T, Nakahira Y, Nishimura H, Ohmiya Y, OyamaT: An in vivo dual-reporter system of cyanobacteria usingtwo railroad-worm luciferases with different color emis-sions. Plant Cell Physiol 2004, 45:109-113.
16. Naylor LH: Reporter gene technology: the future looks bright.Biochem Pharmacol 1999, 58:749-757.
17. Welsh DK, Kay SA: Bioluminescence imaging in living organ-isms. Curr Opin Biotechnol 2005, 16:73-78.
18. Kalikin LM, Schneider A, Thakur MA, Fridman Y, Griffin LB, Dunn RL,Rosol TJ, Shah RB, Rehemtulla A, McCauley LK, Pienta KJ: In vivo vis-ualization of metastatic prostate cancer and quantitation ofdisease progression in immunocompromised mice. CancerBiol Ther 2003, 2:656-660.
19. Wetterwald A, van der Pluijm G, Que I, Sijmons B, Buijs J, KarperienM, Lowik CW, Gautschi E, Thalmann GN, Cecchini MG: Opticalimaging of cancer metastasis to bone marrow: a mousemodel of minimal residual disease. Am J Pathol 2002,160:1143-1153.
20. Cook SH, Griffin DE: Luciferase imaging of a neurotropic viralinfection in intact animals. J Virol 2003, 77:5333-5338.
21. Honigman A, Zeira E, Ohana P, Abramovitz R, Tavor E, Bar I, Zilber-man Y, Rabinovsky R, Gazit D, Joseph A, Panet A, Shai E, Palmon A,Laster M, Galun E: Imaging transgene expression in live ani-mals. Mol Ther 2001, 4:239-249.
22. Wu JC, Sundaresan G, Iyer M, Gambhir SS: Noninvasive opticalimaging of firefly luciferase reporter gene expression in skel-etal muscles of living mice. Mol Ther 2001, 4:297-306.
23. Ciana P, Raviscioni M, Mussi P, Vegeto E, Que I, Parker MG, Lowik C,Maggi A: In vivo imaging of transcriptionally active estrogenreceptors. Nat Med 2003, 9:82-86.
24. Pillon A, Servant N, Vignon F, Balaguer P, Nicolas JC: In vivo biolu-minescence imaging to evaluate estrogenic activities ofendocrine disrupters. Anal Biochem 2005, 340:295-302.
25. Gafni Y, Pelled G, Zilberman Y, Turgeman G, Apparailly F, Yotvat H,Galun E, Gazit Z, Jorgensen C, Gazit D: Gene therapy platformfor bone regeneration using an exogenously regulated, AAV-2-based gene expression system. Mol Ther 2004, 9:587-595.
26. Mir LM, Bureau MF, Rangara R, Schwartz B, Scherman D: Long-term, high level in vivo gene expression after electric pulse-mediated gene transfer into skeletal muscle. C R Acad Sci III1998, 321:893-899.
27. Aihara H, Miyazaki J: Gene transfer into muscle by electropora-tion in vivo. Nat Biotechnol 1998, 16:867-870.
28. Grossin L, Cournil-Henrionnet C, Mir LM, Liagre B, Dumas D,Etienne S, Guingamp C, Netter P, Gillet P: Direct gene transferinto rat articular cartilage by in vivo electroporation. Faseb J2003, 17:829-835.
29. Ohashi S, Kubo T, Kishida T, Ikeda T, Takahashi K, Arai Y, TerauchiR, Asada H, Imanishi J, Mazda O: Successful genetic transduction
in vivo into synovium by means of electroporation. BiochemBiophys Res Commun 2002, 293:1530-1535.
30. Mir LM, Bureau MF, Gehl J, Rangara R, Rouy D, Caillaud JM, DelaereP, Branellec D, Schwartz B, Scherman D: High-efficiency genetransfer into skeletal muscle mediated by electric pulses.Proc Natl Acad Sci U S A 1999, 96:4262-4267.
31. Li JZ, Holman D, Li H, Liu AH, Beres B, Hankins GR, Helm GA: Long-term tracing of adenoviral expression in rat and rabbit usingluciferase imaging. J Gene Med 2005, 7:792-802.
32. Balaguer P, Boussioux AM, Demirpence E, Nicolas JC: Reporter celllines are useful tools for monitoring biological activity ofnuclear receptor ligands. Luminescence 2001, 16:153-158.
33. DeLuca M, McElroy WD: Two kinetically distinguishable ATPsites in firefly luciferase. Biochem Biophys Res Commun 1984,123:764-770.
34. Fontes R, Dukhovich A, Sillero A, Sillero MA: Synthesis of dehy-droluciferin by firefly luciferase: effect of dehydroluciferin,coenzyme A and nucleoside triphosphates on the lumines-cent reaction. Biochem Biophys Res Commun 1997, 237:445-450.
35. Ford SR, Buck LM, Leach FR: Does the sulfhydryl or the adeninemoiety of CoA enhance firefly luciferase activity? Biochim Bio-phys Acta 1995, 1252:180-184.
36. Pojoga LH, Moose JE, Hilderman RH: Characterization of theinteraction of P1,P4-diadenosine 5'-tetraphosphate withluciferase. Biochem Biophys Res Commun 2004, 315:756-762.
37. Bureau MF, Naimi S, Torero Ibad R, Seguin J, Georger C, Arnould E,Maton L, Blanche F, Delaere P, Scherman D: Intramuscular plas-mid DNA electrotransfer: biodistribution and degradation.Biochim Biophys Acta 2004, 1676:138-148.
38. Rice BW, Cable MD, Nelson MB: In vivo imaging of light-emit-ting probes. J Biomed Opt 2001, 6:432-440.
39. Fritz Berthold KHRMS: Luminometer design and low lightdetection. In Methods in Enzymology Volume 305. Edited by: SimonJNAMI. San Diego, London, Boston, New York, Sydney, Tokyo,Toronto, Academic Press; 2000:62-87.
40. Herweijer H, Zhang G, Subbotin VM, Budker V, Williams P, Wolff JA:Time course of gene expression after plasmid DNA genetransfer to the liver. J Gene Med 2001, 3:280-291.
41. Miller M, Rekas G, Dayball K, Wan YH, Bramson J: The efficacy ofelectroporated plasmid vaccines correlates with long-termantigen production in vivo. Vaccine 2004, 22:2517-2523.
42. Payette PJ, Weeratna RD, McCluskie MJ, Davis HL: Immune-medi-ated destruction of transfected myocytes following DNAvaccination occurs via multiple mechanisms. Gene Ther 2001,8:1395-1400.
43. Babiuk S, Baca-Estrada ME, Foldvari M, Middleton DM, Rabussay D,Widera G, Babiuk LA: Increased gene expression and inflam-matory cell infiltration caused by electroporation are bothimportant for improving the efficacy of DNA vaccines. J Bio-technol 2004, 110:1-10.
44. Gronevik E, Mathiesen I, Lomo T: Early events of electropora-tion-mediated intramuscular DNA vaccination potentiateTh1-directed immune responses. J Gene Med 2005,7:1246-1254.
45. Hartikka J, Sukhu L, Buchner C, Hazard D, Bozoukova V, Margalith M,Nishioka WK, Wheeler CJ, Manthorp M, Sawdey M: Electropora-tion-facilitated delivery of plasmid DNA in skeletal muscle:plasmid dependence of muscle damage and effect ofpoloxamer 188. Mol Ther 2001, 4:407-415.
46. Durieux AC, Bonnefoy R, Busso T, Freyssenet D: In vivo gene elec-trotransfer into skeletal muscle: effects of plasmid DNA onthe occurrence and extent of muscle damage. J Gene Med2004, 6:809-816.
47. Soubrier F, Cameron B, Manse B, Somarriba S, Dubertret C, Jaslin G,Jung G, Caer CL, Dang D, Mouvault JM, Scherman D, Mayaux JF,Crouzet J: pCOR: a new design of plasmid vectors for nonviralgene therapy. Gene Ther 1999, 6:1482-1488.
Page 15 of 15(page number not for citation purposes)