erbium luminescence properties of niobium-rich oxide glasses
TRANSCRIPT

www.elsevier.com/locate/jnoncrysol
Journal of Non-Crystalline Solids 351 (2005) 2076–2084
Erbium luminescence properties of niobium-rich oxide glasses
L. Petit a, T. Cardinal a,*, J.J. Videau a, Y. Guyot b,G. Boulon b, M. Couzi c, T. Buffeteau c
a Institut de Chimie de la Matiere Condensee de Bordeaux (ICMCB), CNRS UPR 9048, Av. du Dr. A. Schweitzer, 33608 Pessac cedex, Franceb Laboratoire de Physico-Chimie des Materiaux Luminescents (LPCML), CNRS UMR 5620, Universite Claude Bernard LYON I,
Batiment 205, 43 bd du 11 Novembre 1918, 69622 Villeurbanne cedex, Francec Laboratoire de Physico-Chimie Moleculaire (LPCM), UMR 5803, CNRS 351, cours de la Liberation, 33405 Talence cedex, France
Received 3 December 2004; received in revised form 6 April 2005
Available online 24 June 2005
Abstract
Erbium luminescence has been investigated in niobium borophosphate glass. A correlation between luminescence intensity at
1532 nm, OH absorption and the structure of the glass network was established as a function of the niobium oxide concentration.
An increase of the radiative efficiency corresponding to 4I13/2 ! 4I15/2 (4f–4f) transition of Er3+ ions has been observed for niobium
richest glasses. The modification of the Er3+ ions site is analyzed as a function of the niobium concentration. A Judd–Ofelt analysis
has been applied to emphasize the structural change. An increase of the up conversion was also measured as the niobium oxide con-
tent increases.
� 2005 Elsevier B.V. All rights reserved.
1. Introduction
In the past years, rare earth doped glasses as lasermaterials for amplifiers around 1550 nm have received
much attention for offering the possibility of transmit-
ting data over long distances through silica based optical
fibers [1]. The interest is also important for the fabrica-
tion of planar waveguide amplifiers for integrated optics
[2]. In this particular case, among rare earths, Er3+ ions
remain attractive because of its unique emission perfor-
mance around 1550 nm corresponding to the telecom-munication window and to the eye safe spectral range.
Pumped at 980 nm, the erbium laser system can be
assimilated to a three levels system with emission around
1550 nm corresponding to its 4I13/2 ! 4I15/2 transition.
In compact optical device the Er3+ doped materials have
to present sufficient optical amplification gains because
0022-3093/$ - see front matter � 2005 Elsevier B.V. All rights reserved.
doi:10.1016/j.jnoncrysol.2005.04.058
* Corresponding author. Tel.: +33 5 4000 2543; fax: +33 5 4000 2761.
E-mail address: [email protected] (T. Cardinal).
of the shorter optical interaction path. A high erbium
concentration and a high pump power density are re-
quired. Unfortunately, high Er3+ ions content leads toenergy transfer due to ion–ion interaction and energy
migration to impurities such as OH� entities as shown
in phosphate and silicate [3,4] and high pump leads to
cooperative up conversion processes. To avoid these
problems, a trade off has to be found in terms of erbium
concentration for the lasers and amplifier applications.
In parallel, many efforts have been made to optimize
the matrix composition to avoid the luminescencequenching processes which could strongly influence the
optical amplification gain [4]. At present, phosphate
and silicate glasses are two of the most important glass
hosts for waveguide lasers and amplifiers [5].
Phosphate glasses can incorporate high Er3+ ions
content without strong luminescence quenching [6].
However, the sensitivity to moisture of most of the
phosphate limits their use as hydroxyl groups are knownto quench the emission around 1550 nm [4]. By modi-
fying the composition, it is possible to limit the

L. Petit et al. / Journal of Non-Crystalline Solids 351 (2005) 2076–2084 2077
OH� groups absorption influence and so to improve the
Er3+ emission.
Recently, research have been conducted on high
index glasses, as they may be promising for high emission
cross-section, but few systematic study has been carried
out for high niobium content in oxide glasses. The inves-tigations have been mainly carried out on germanate
glass systems [7,8]. The introduction of Nb2O5 in Er3+
ions doped borophosphate based glasses is analyzed in
this paper to understand the effect of the niobate entities
within the glass network on erbium luminescence proper-
ties. Erbium doped borophosphate glasses with erbium
molar concentration about 0.25% and various Nb2O5
content have been elaborated. A systematic study ofthe luminescence characteristics for erbium ions emission
at 1532 nm of these new glasses is reported versus the
niobium oxide content and is correlated to the glass
structure. The effects of OH� groups absorption on the
Er3+ ions luminescence properties have been also
investigated.
2. Experimental
2.1. Glass elaboration and controlled heat treatment
Erbium doped glasses of the (1 � y){(1 � x) [0.51-
Ca(PO3)2 + 0.44NaPO3 + 0.05Na2B4O7] + xNb2O5} +
yEr2O3 system were prepared by standard melting
method with x = 0.00, 0.025, 0.30, 0.40, 0.45 and 0.50and y = 0.0025. The startingmaterials Na2B4O7 (Aldrich,
99.99%), Nb2O5(Cerac, 99.998%), NaPO3 (Aldrich,
99.99%) and Er2O3 (Aldrich, 99.99%) were heated before
melting to eliminate H2O and CO2. Ca(PO3)2 was pre-
pared from CaCO3 (Merck, 99.95%) and (NH4)2HPO4
(Merck, 99%). Themixtures with appropriate molar ratio
were melted in platinum crucible at 1400–1575 �Cdepending on the composition under oxygen flow for1 h. After quenching on a carbon plate, the glasses were
annealed for 15 h at 40 �C below their glass transition
temperature. The samples were then cut and optically
polished.
2.2. Structural characterization
Reflectance infrared spectra were recorded at a spec-tral resolution of 4 cm�1 using Fourier transform infra-
red spectrometer (FTIR) (Thermo Optek Nexus 670).
The reflectance experiments were performed using an
external reflection attachment at an angle of incidence
of 12�. A computer program has been used to calculate
the optical constants (real and imaginary parts of the
dielectric constants) from the reflectance spectra by the
Kramers–Kronig analysis. The maxima of the t Im(e)spectra give directly the frequency of the absorption
bands.
The Raman spectra were collected using a micro-
Raman set-up (Labram confocal micro-Raman instru-
ment from Jobin–Yvon) with a typical resolution of
about 2 cm�1, in backscattering geometry at room
temperature. The system consists of a holographic notch
filter for Rayleigh rejection, a microscope equipped with10·, 50· and 100· objectives (the latter allowing a spa-
tial resolution of less than 2 lm), and a CCD detector.
The 632 nm emission line of a He–Ne laser was used
for excitation with maximum incident power around
10 mW.
2.3. Absorption and luminescence measurements
All the absorption and luminescence experiments
were recorded at room temperature. The UV and visible
absorption spectra were measured using a Varian spec-
trophotometer (CaryE) on L = 2 mm thick glass samples
over a spectrum range from 250 nm to 3750 nm. Infra-
red absorption spectra were recorded with a spectral
resolution of 4 cm�1 in transmission mode in the hydro-
xyl absorption wavenumber domain (2500–4000 cm�1)using Fourier transform infrared spectrometer (FTIR)
(Brucker Equinox 55). The glass sample dimensions
were approximately 1 cm2 for a thickness around L =
5 mm. The background between 3700 and 4000 cm�1
corresponds to the loss resulting from Fresnel reflection
on surface of the sample due to their linear indices. The
background values are in accordance with a simple
model of reflection at the interfaces glass–air. This back-ground was fitted to a line and subtracted before the cal-
culation of the absorption coefficient.
The luminescence and up conversion luminescence
spectra were measured at room temperature using an
AOC laser diode excitation source at 980 nm, an Edin-
burgh Instruments Infrared monochromator (M300)
and a liquid nitrogen cooled germanium detector
(ADC 403L).The lifetimes and risetimes of 4I13/2 level of erbium
ions were measured using a pulsed YAG pumped dye
laser centered at 975 nm and a high speed cooled germa-
nium detector (ADC 403 HS) on glass powder to reduce
re-absorption.
2.4. Judd–Ofelt theory
According to the Judd–Ofelt theory [9], the line
strength for an electric-dipole transition SexpEDðJ 0 ! JÞ is
defined by the relation:
SexpEDðJ ! J 0Þ ¼
Xt¼2;4;6
Xt J U ðtÞ�� ��J 0i��� ��2; ð1Þ
where jJi and jJ 0i are respectively the initial and the finalmanifold and the hkU(t)ki the double reduced matrix ele-
ments of unit tensor U(t) of rank t calculated by Carnall
[10].

6401110
990
980
1120970
1050
1130
x=0.45
x=0.40
x=0.30
ν. I
m (
ε)
2078 L. Petit et al. / Journal of Non-Crystalline Solids 351 (2005) 2076–2084
ScalcED ðJ 0 ! JÞ can be calculated by the following
relation:ZaðkÞdk ¼ q
8p3�ke2
3hcð2J þ 1Þðn2 þ 2Þ2
9nScalcED ðJ ! J 0Þ; ð2Þ
where a(k) is the absorption coefficient; �k, the average
wavelength; q, the concentration of rare earth ions per
cm3; e, the electron charge; h, the Plank�s constant; c,
the speed of light and n, the linear refractive index con-
sidered as a constant in the calculation and measured at
532 nm using the Brewster angle method.The radiative lifetime srad is then obtained by the
relation:
srad;J 0 ðJ 0 ! JÞ ¼ 1
AJ 0
¼ 1PJ 0 AEDðJ 0 ! JÞ þ AMDðJ 0 ! JÞ½ � ; ð3Þ
where AED is the radiative rates of the electric-dipoletransitions defined by the formula:
AEDðJ 0 ! JÞ ¼ 64p2e2
3hð2J 0 þ 1Þnðn2 þ 2Þ2
9�k3
ScalcED ðJ 0 ! JÞ;
ð4Þ
and AMD is the radiative rates of the magnetic-dipole
transition calculated by the following relation:
AMDðJ 0 ! JÞ ¼ 64p2e2
3hð2J 0 þ 1Þn3
�k3ScalcMDðJ 0 ! JÞ. ð5Þ
The quality of the agreement between calculated and
experimental line strength is given by the root mean
square (RMS):
RMS ¼
ffiffiffiffiffiffiffiffiffiffiffiffiffiffiffiffiffiffiffiffiffiffiffiffiffiffiffiffiffiffiffiffiffiffiffiffiffiffiPqq¼1ðScalc
ED � SexpEDÞ
2
q� p
s; ð6Þ
where q is the number of transition used for the calcula-
tion and p is the number of unknown parameters, 3 in
this case.The Judd–Ofelt parameters were calculated for all the
samples using absorption intensity corresponding to 10
4f–4f transitions from the 4I15/2 to the 2G11/2,2H9/2,
4F3/2,4F5/2,
4F7/2,2H11/2,
4S3/2,4F9/2,
4I9/2,4I11/2, erbium
levels. For the transition corresponding to 4I15/2 to4I13/2,
the magnetic-dipole line strength has been obtained
from the value reported by Weber [11].
600 800 1000 1200 1400
530
770
9301095
1220
x=0
Wavenumber (cm-1)
Fig. 1. IR spectra borophosphate niobium matrix versus Nb2O5 molar
fraction x.
3. Results
3.1. Structural studies
The reflectance IR and Raman spectra were collected
on Yb3+ ions doped sample with a constant concentra-
tion of ytterbium, about 1–2 · 1021 ions/cm3 to avoid
perturbation from erbium absorption at the excitation
wavelength as no undoped samples have been prepared.
No significant structural change is expected, and the
structural conclusions will be considered similar for
erbium doped samples.
Fig. 1 presents the IR spectra of the samples in thewavenumber range from 500 to 1500 cm�1. The spec-
trum of the borophosphate matrix (x = 0) exhibits differ-
ent bands located at 530, 770, 930, 1095 and 1220 cm�1.
As the Nb2O5 content increases up to x = 0.45, the
bands on the high energy side are strongly affected and
new bands located at 1110, 1040 and 990 cm�1 are
becoming dominant. A new band located at 640 cm�1
appears and increases with the progressive introductionof Nb2O5.
The Raman spectra of these glasses are shown in Fig.
2. The Raman spectrum of the borophosphate matrix
(x = 0) exhibits two major broad bands at around
698 cm�1 and at 1150 cm�1. The progressive introduc-
tion of Nb2O5 modifies the whole spectrum. The band
located at 1150 cm�1 disappears for x = 0.30. New
bands appear at 900 cm�1, 800 cm�1, 650 cm�1 and be-tween 200 and 250 cm�1. The new bands related to the
introduction of niobium oxide evolve differently with
the Nb2O5 content. The intensity of the band at
900 cm�1 decreases progressively as the Nb2O5 content
increases while the intensities of the bands located at
800, 650 and 250 cm�1 grow. For the highest concentra-
tion of Nb2O5, the spectrum is dominated by the two
bands at 650 cm�1 and 800 cm�1.
3.2. Absorption spectrum and Judd–Ofelt analysis
In Fig. 3, the near infrared absorption spectra of sam-
ples with x = 0.025 and 0.40 are compared. The spectra
show a broad absorption band between 2500 cm�1 and

200 400 600 800 1000 1200 1400
1250
675 800
650800
640
800900
6981040
1150
Inte
nsity
(A
.U.)
x=0.45
x=0.40
x=0.30
x=0
Wavenumber (cm-1)
Fig. 2. Raman spectra of the borophosphate glass matrix versus
Nb2O5 molar fraction x.
2000 2250 2500 2750 3000 3250 3500 3750 40000
2
4
6
Abs
orpt
ion
coef
fici
ent (
cm-1
)
Wavenumber (cm-1)
x=0.025
x=0.40
Fig. 3. Near infrared absorption spectrum for glasses with x = 0.025
and 0.40.
L. Petit et al. / Journal of Non-Crystalline Solids 351 (2005) 2076–2084 2079
3700 cm�1 attributed to OH� groups vibration [4]. As
the niobium oxide content increases for the same melt-
ing process, the intensity of the broad band above
2750 cm�1 drastically decreases while a new band ap-
pears at 2600 cm�1.
For the 4f–4f transition of the Er3+ ions, the absorp-
tion cross-sections, rabs, have been calculated from the
experimentally measured absorption coefficient andfrom Er3+ ions concentration in the glass, by the follow-
ing equation:
rabs ¼2.303 logðI0=IÞ
NL; ð7Þ
where log(I0/I) is absorbance; N, the Er3+ ion concentra-
tion (ion/cm3) and L, the thickness of the sample.
The concentrations of Er3+ ions, calculated from thedensities and the batch composition of sample, are listed
in Table 1. Table 1 presents, also, the absorption coeffi-
cient (aabs) and cross-section (rabs) at 980 nm and
1532 nm values as well as the linear index measured at
532 nm versus the Nb2O5 content. The absorption
cross-section at 980 nm and 1532 nm increases with the
increase of niobium oxide content (similar increase isobserved on the integrated absorption).
Judd–Ofelt parameters were determined from the
experimentally measured absorption spectra by a least
square fitting approach. The Judd–Ofelt parameters
of the borophosphate glasses, calculated using Eqs.
(1) and (2) considering the transition from the ground
level to the excited levels of Er3+ ions, as well as the
line strength and RMS values are reported in Table2a and b. The small values of the RMS deviation dem-
onstrate the good quality of the fit. A good agreement
between the calculated and the experimental line
strength have been obtained. X2, X4 and X6 decrease
progressively when the Nb2O5 content increases. From
the Judd–Ofelt parameters, the 4I13/2 and 4I11/2 level
lifetimes have been calculated using Eq. (3) which in-
cludes the magnetic-dipole transition term. They arestrongly related to the linear refractive index which
varies from 1.58 for x = 0.025 to 2.2 for x = 0.5. Table
3 lists the calculated lifetimes of Er3+. According to the
Judd–Ofelt theory, the lifetimes are expected to de-
crease with an increase of Nb2O5 content. In Table 3
are, also, listed the measured 4I13/2 and 4I11/2 level life-
times which were estimated by assuming a mono expo-
nential decay. The 4I13/2 level lifetime of Er3+ decreasesbut the 4I11/2 level lifetime increases with an increase of
Nb2O5 content.
3.3. Erbium emission characteristics
The luminescence properties of erbium doped glasses
have been studied versus the Nb2O5 content. The erbium
concentration is kept similar in all samples. The normal-ized emission spectra after excitation at 980 nm of sam-
ples with x = 0.00 and 0.50, observed in Fig. 4, are due
to the transition 4I13/2 ! 4I15/2. They are typical of the
Er3+ luminescence in oxide glasses. When the Nb2O5
content increases, the absorption bandwidth, listed in
Table 4 and defined by Dk = �a(k)dk/apeak where a(k) isthe absorption coefficient at the wavelength k and apeak,the absorption coefficient value at the peak, increaseswith x.
The Fig. 5(a) and (b) present, respectively, the varia-
tion of the intensity of the emission at 1532 and 1000 nm
versus Nb2O5 content for an excitation at 980 nm. The
intensity of these two emissions increases with an
increase of the niobium oxide content. The intensity dif-
ference observed for low and high niobium oxide con-
centration indicates that the increase is not only due tothe variation of absorption at 980 nm (Table 1). A
non-linear increase is clearly observed.
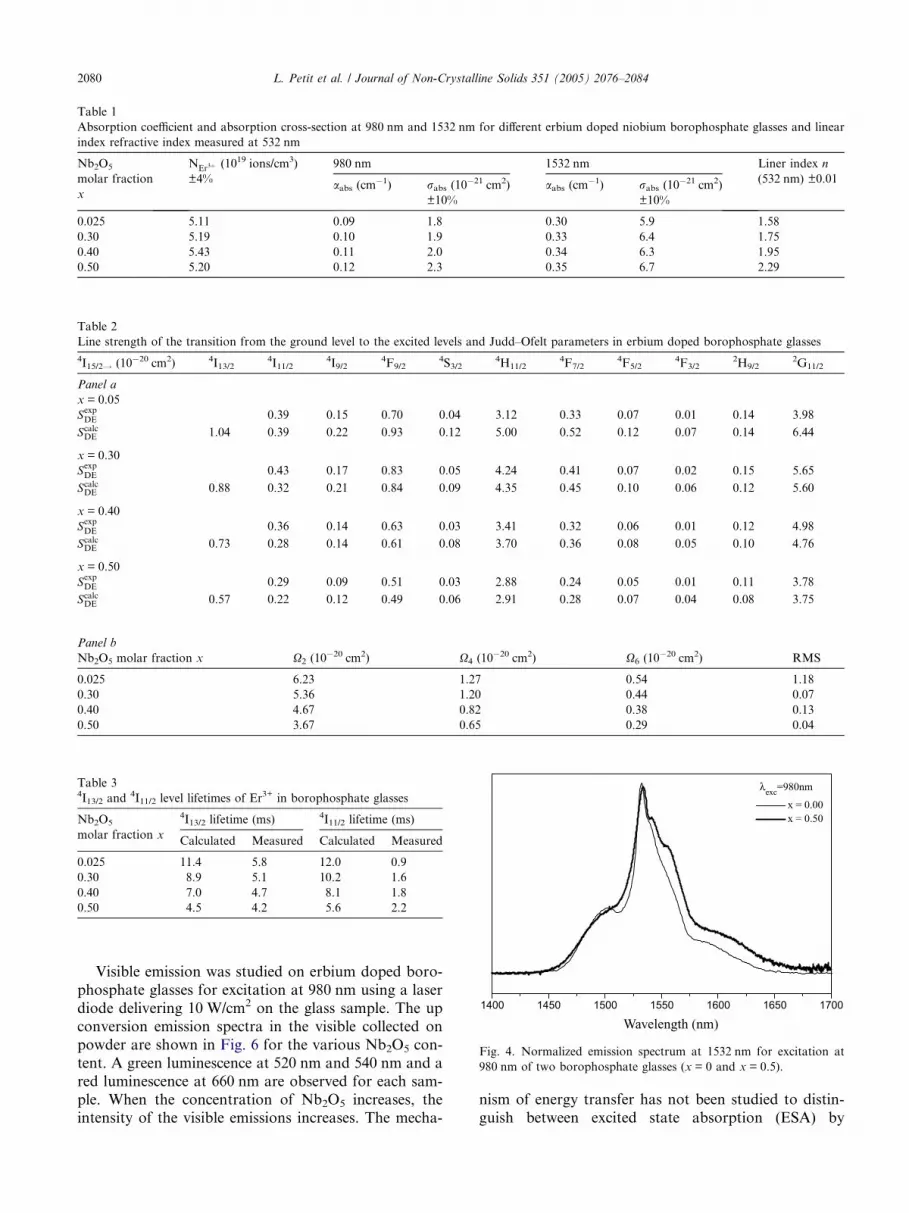
Table 1
Absorption coefficient and absorption cross-section at 980 nm and 1532 nm for different erbium doped niobium borophosphate glasses and linear
index refractive index measured at 532 nm
Nb2O5
molar fraction
x
NEr3þ (1019 ions/cm3)
±4%
980 nm 1532 nm Liner index n
(532 nm) ±0.01aabs (cm�1) rabs (10
�21 cm2)
±10%
aabs (cm�1) rabs (10
�21 cm2)
±10%
0.025 5.11 0.09 1.8 0.30 5.9 1.58
0.30 5.19 0.10 1.9 0.33 6.4 1.75
0.40 5.43 0.11 2.0 0.34 6.3 1.95
0.50 5.20 0.12 2.3 0.35 6.7 2.29
Table 2
Line strength of the transition from the ground level to the excited levels and Judd–Ofelt parameters in erbium doped borophosphate glasses
4I15/2! (10�20 cm2) 4I13/24I11/2
4I9/24F9/2
4S3/24H11/2
4F7/24F5/2
4F3/22H9/2
2G11/2
Panel a
x = 0.05
SexpDE 0.39 0.15 0.70 0.04 3.12 0.33 0.07 0.01 0.14 3.98
ScalcDE 1.04 0.39 0.22 0.93 0.12 5.00 0.52 0.12 0.07 0.14 6.44
x = 0.30
SexpDE 0.43 0.17 0.83 0.05 4.24 0.41 0.07 0.02 0.15 5.65
ScalcDE 0.88 0.32 0.21 0.84 0.09 4.35 0.45 0.10 0.06 0.12 5.60
x = 0.40
SexpDE 0.36 0.14 0.63 0.03 3.41 0.32 0.06 0.01 0.12 4.98
ScalcDE 0.73 0.28 0.14 0.61 0.08 3.70 0.36 0.08 0.05 0.10 4.76
x = 0.50
SexpDE 0.29 0.09 0.51 0.03 2.88 0.24 0.05 0.01 0.11 3.78
ScalcDE 0.57 0.22 0.12 0.49 0.06 2.91 0.28 0.07 0.04 0.08 3.75
Panel b
Nb2O5 molar fraction x X2 (10�20 cm2) X4 (10
�20 cm2) X6 (10�20 cm2) RMS
0.025 6.23 1.27 0.54 1.18
0.30 5.36 1.20 0.44 0.07
0.40 4.67 0.82 0.38 0.13
0.50 3.67 0.65 0.29 0.04
Table 34I13/2 and
4I11/2 level lifetimes of Er3+ in borophosphate glasses
Nb2O5
molar fraction x
4I13/2 lifetime (ms) 4I11/2 lifetime (ms)
Calculated Measured Calculated Measured
0.025 11.4 5.8 12.0 0.9
0.30 8.9 5.1 10.2 1.6
0.40 7.0 4.7 8.1 1.8
0.50 4.5 4.2 5.6 2.2
1400 1450 1500 1550 1600 1650 1700
λexc=980nm
x = 0.00 x = 0.50
Wavelength (nm)
Fig. 4. Normalized emission spectrum at 1532 nm for excitation at
980 nm of two borophosphate glasses (x = 0 and x = 0.5).
2080 L. Petit et al. / Journal of Non-Crystalline Solids 351 (2005) 2076–2084
Visible emission was studied on erbium doped boro-
phosphate glasses for excitation at 980 nm using a laser
diode delivering 10 W/cm2 on the glass sample. The up
conversion emission spectra in the visible collected on
powder are shown in Fig. 6 for the various Nb2O5 con-
tent. A green luminescence at 520 nm and 540 nm and a
red luminescence at 660 nm are observed for each sam-
ple. When the concentration of Nb2O5 increases, theintensity of the visible emissions increases. The mecha-
nism of energy transfer has not been studied to distin-
guish between excited state absorption (ESA) by
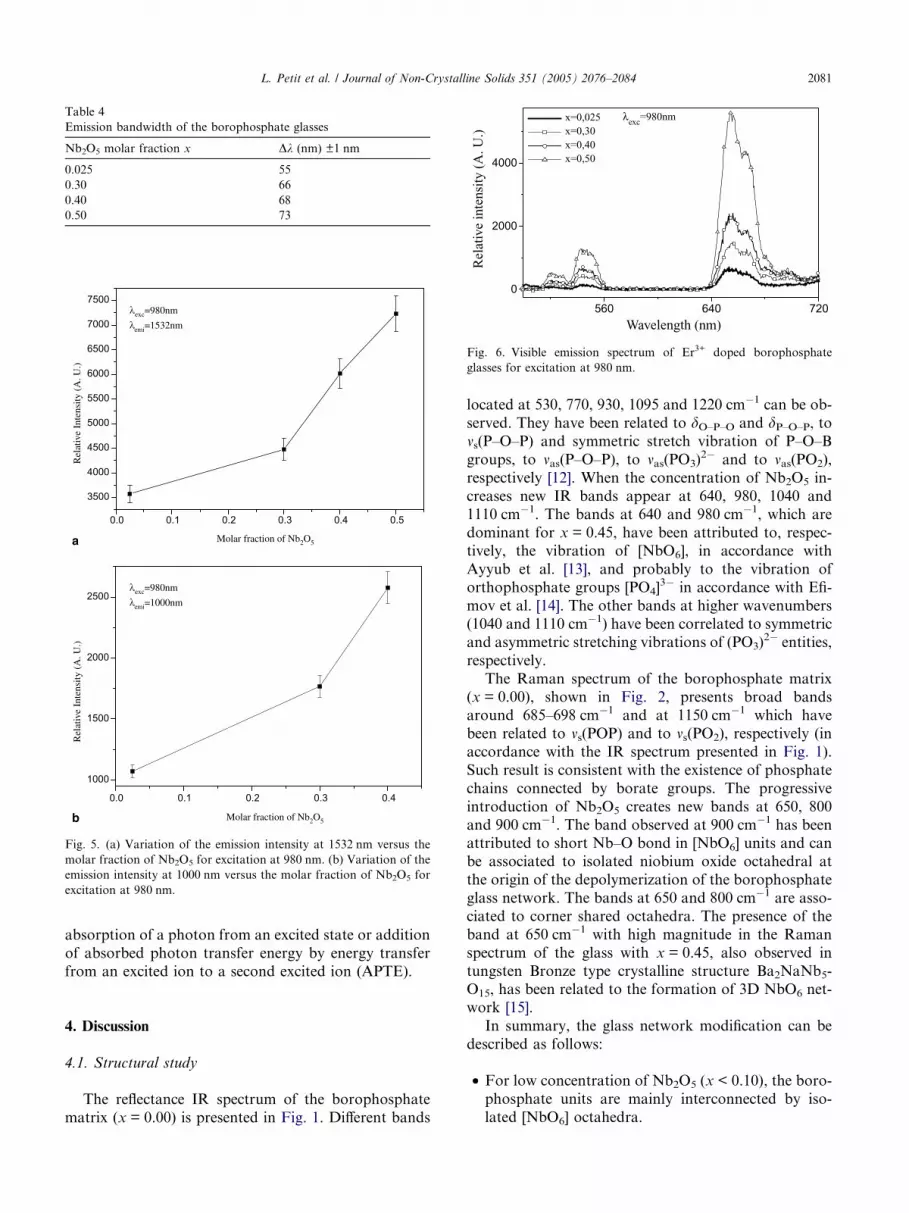
Table 4
Emission bandwidth of the borophosphate glasses
Nb2O5 molar fraction x Dk (nm) ±1 nm
0.025 55
0.30 66
0.40 68
0.50 73
a
b
0.0 0.1 0.2 0.3 0.4 0.5
3500
4000
4500
5000
5500
6000
6500
7000
7500
Rel
ativ
e In
tens
ity (
A. U
.)
Molar fraction of Nb2O5
0.0 0.1 0.2 0.3 0.4
1000
1500
2000
2500
Rel
ativ
e In
tens
ity (
A. U
.)
Molar fraction of Nb2O5
Fig. 5. (a) Variation of the emission intensity at 1532 nm versus the
molar fraction of Nb2O5 for excitation at 980 nm. (b) Variation of the
emission intensity at 1000 nm versus the molar fraction of Nb2O5 for
excitation at 980 nm.
560 640 720
0
2000
4000
Rel
ativ
e in
tens
ity (
A. U
.)
Wavelength (nm)
x=0,025 x=0,30 x=0,40 x=0,50
λexc=980nm
Fig. 6. Visible emission spectrum of Er3+ doped borophosphate
glasses for excitation at 980 nm.
L. Petit et al. / Journal of Non-Crystalline Solids 351 (2005) 2076–2084 2081
absorption of a photon from an excited state or addition
of absorbed photon transfer energy by energy transfer
from an excited ion to a second excited ion (APTE).
4. Discussion
4.1. Structural study
The reflectance IR spectrum of the borophosphate
matrix (x = 0.00) is presented in Fig. 1. Different bands
located at 530, 770, 930, 1095 and 1220 cm�1 can be ob-
served. They have been related to dO–P–O and dP–O–P, to
ms(P–O–P) and symmetric stretch vibration of P–O–B
groups, to mas(P–O–P), to mas(PO3)2� and to mas(PO2),
respectively [12]. When the concentration of Nb2O5 in-
creases new IR bands appear at 640, 980, 1040 and
1110 cm�1. The bands at 640 and 980 cm�1, which are
dominant for x = 0.45, have been attributed to, respec-tively, the vibration of [NbO6], in accordance with
Ayyub et al. [13], and probably to the vibration of
orthophosphate groups [PO4]3� in accordance with Efi-
mov et al. [14]. The other bands at higher wavenumbers
(1040 and 1110 cm�1) have been correlated to symmetric
and asymmetric stretching vibrations of (PO3)2� entities,
respectively.
The Raman spectrum of the borophosphate matrix(x = 0.00), shown in Fig. 2, presents broad bands
around 685–698 cm�1 and at 1150 cm�1 which have
been related to ms(POP) and to ms(PO2), respectively (in
accordance with the IR spectrum presented in Fig. 1).
Such result is consistent with the existence of phosphate
chains connected by borate groups. The progressive
introduction of Nb2O5 creates new bands at 650, 800
and 900 cm�1. The band observed at 900 cm�1 has beenattributed to short Nb–O bond in [NbO6] units and can
be associated to isolated niobium oxide octahedral at
the origin of the depolymerization of the borophosphate
glass network. The bands at 650 and 800 cm�1 are asso-
ciated to corner shared octahedra. The presence of the
band at 650 cm�1 with high magnitude in the Raman
spectrum of the glass with x = 0.45, also observed in
tungsten Bronze type crystalline structure Ba2NaNb5-O15, has been related to the formation of 3D NbO6 net-
work [15].
In summary, the glass network modification can be
described as follows:
• For low concentration of Nb2O5 (x < 0.10), the boro-
phosphate units are mainly interconnected by iso-
lated [NbO6] octahedra.

2082 L. Petit et al. / Journal of Non-Crystalline Solids 351 (2005) 2076–2084
• For high concentration of Nb2O5 (x > 0.30), the glass
network is more compact due to connected and less
distorted NbO6 which isolate the phosphate groups.
• When x increases from 0.1 to 0.30, the glass structure
changes from a borophosphate to a borophospho-
niobate glass structure. The glass becomes muchmore a �niobate like� glass network.
4.2. Judd–Ofelt parameter and non-radiative transfer
The theory of Judd–Ofelt has been used for analyzing
the spectral property of the rare earth ions doped glass
[16]. The Judd–Ofelt Xt parameters provide informationon the local structure and bonding in the vicinity of the
rare earth ions. They depend on the host material. X2
parameter has been reported to be affected by covalent
chemical bonding or asymmetry of the rare earth site
and X6 parameter by the rigidity of the medium in which
the ions are located [17].
From Table 2, it can be seen that the JO parameters
for x = 0.025 are in good agreement with the Judd–Ofeltparameters of a phosphate glass, X2 � 6.7 · 10�20 cm2,
X4 � 1.0 · 10�20 cm2, X6 � 0.6 · 10�20 cm2 [18]. The
JO parameters for x = 0.025 indicate that the neighbors
of Er3+ in borophosphate glass with a low Nb2O5 con-
tent are mainly phosphate groups.
One can notice in Table 2 that the Xt parameters de-
crease with the progressive introduction of Nb2O5 in the
borophosphate matrix. Ebendorff et al. attributed suchX2 change in Er3+ doped glasses to a variation of the
number of oxygen ions around Er3+ [19]. The number
and the nature of phosphate groups around Er3+ in
the borophosphate matrix are expected to change with
the introduction of niobium oxide. Niobium atoms are
most probably participating to the second shell around
the rare earth in borophosphate glass with the progres-
sive introduction of Nb2O5 in the matrix.According to the Judd–Ofelt calculations, the calcu-
lated 4I13/2 and4I11/2 level lifetimes, listed in Table 3, de-
crease when the Nb2O5 content increases, indicating that
the probability of the radiative transition between 4f–4f
levels increases. One has to notice that the main phe-
nomenon at the origin of this evolution is the increase
of the refractive index with the niobium concentration
which plays an important role as shown in relations(1)–(4).
The increase of the measured 4I11/2 level lifetime
(Table 3) can be correlated to the intrinsic vibrations
of the glass network. The non-radiative transitions are
controlled by the vibration of the phonon with the high-
est energy [20]. As shown in Fig. 1, the vibration at
1220 cm�1 disappears when the Nb2O5 content increases
and leads to a highest vibration located around1100 cm�1 with the largest Nb2O5 concentration. Using
this value, as the energy difference between 4I13/2 and
4I11/2 levels in the matrix is around 3700 cm�1, more
than three phonons are then necessary to satisfy a
non-radiative transfer in the glass for high Nb2O5 con-
tent. The probability of the non-radiative transition be-
tween 4I11/2 and 4I13/2 levels is defined by the following
relation [20]:
W NR ¼ W ð0Þ �nþ 1ð Þp with �n ¼ 1
exp hmnkT
� �� 1
; ð8Þ
where W(0) is the spontaneous emission rate at temper-
ature T = 0 K; m, the photon frequency; h, the Planck
constant; k, the Boltzmann constant and p, the number
of the emitted phonons.
An increase of the number of the phonons to induce
the non-radiative transition decreases the probability of
this transition. The increase of Nb2O5 concentration inthe borophosphate glass decreases the multiphonon
decay by a possible coupling of larger amount of bonds
such as Nb–O which are less energetic than P–O or
B–O bonds. This is in good agreement with the increase
of the emission at 1000 nm, corresponding to the4I11/2 ! 4I15/2 transition for an excitation at 980 nm as
shown in Fig. 5(b). Nb2O5 introduction in the borophos-
phate matrix seems to limit the population inversion onthe 4I13/2 level of Er
3+.
The decrease of the measured 4I13/2 level lifetime
(Table 3) with the niobium oxide concentration is in
agreement with the Judd–Ofelt calculation and traduces
an increase of the transition probability. This tendency
is highly related to the high polarizability of the Nb–O
bonds leading to higher refractive index. As shown in
relations (3) and (4), the linear refractive index isstrongly influencing the rate of the transition. One can
notice also that the measured lifetimes are shorter than
the radiative lifetime. This effect traduces the presence
of non-radiative processes. The non-radiative lifetime
can be calculated by the relation:
1=s ¼ 1=sr þ 1=snr; ð9Þ
where s is the recorded lifetime; sr, the radiative lifetime
and snr, the non-radiative lifetime.
The luminescence quantum yield is defined by the
expression:
g ¼ sobssr
. ð10Þ
The non-radiative lifetime and the luminescence
quantum yield are listed in Table 5. The luminescencequantum yield of 4I13/2 ! 4I15/2 increases significantly
with the progressive introduction of Nb2O5 in the boro-
phosphate matrix leading to a 4I13/2 measured lifetime
closer to the estimated radiative lifetime. The main ori-
gin seems to be related to the presence in large quantity
of hydroxyl groups absorbing at 3000 cm�1 for low nio-
bium oxide content. The shortening of the measured life-
time as compared to the calculated one is ascribed to

Table 5
Non-radiative lifetimes of Er3+ and luminescence quantum yield
Nb2O5 molar fraction x sNR g4I13/2 (ms) 4I11/2 (ls)
4I13/2 ! 4I15/2
0.025 11.8 0.9 0.509
0.30 11.9 1.6 0.573
0.40 14.3 1.8 0.671
0.50 63 2.2 0.933
L. Petit et al. / Journal of Non-Crystalline Solids 351 (2005) 2076–2084 2083
migration of the excitation through erbium until an
erbium ion in the vicinity of OH� groups is reached
[3,4]. Several authors suggested that OH� groups are
serious quenchers of the photoluminescence of Er3+
and Yb3+ ions. In the case of erbium ions, the radiative
luminescence is quenched by non-radiative relaxation
involving two vibrations quanta of the OH� groups.
Therefore, this effect is erbium and hydroxyl concentra-tion dependent. In silicate and phosphate, the OH�
groups� influence on the luminescence at 1532 nm has
been well studied [3,4,21]. The increase of the lumines-
cence quantum yield at 1532 nm is, probably, correlated
to the decrease of OH� groups absorbing around
3000 cm�1 as the Nb2O5 is introduced, as shown in
Fig. 3. The rising of a band that we have possibly attrib-
uted to hydroxyls at lower wavenumber (2600 cm�1)and related to niobium oxide introduction could induce
lower luminescence quenching. Recently we have shown
that the intensity of this band is dependent on thermal
treatments on the raw materials prior glass melting
and so should be dependent on OH presence [22].
Assuming such assumption, the energy of two OH�
vibrations around 2600 cm�1are not any more corre-
sponding to the 4I13/2 ! 4I15/2 4f–4f transition of erbium.Therefore, when the Nb2O5 content increases, the larger
emission at 1532 nm can be related to the cumulative ef-
fects of the increase of the transition probability, (re-
lated partially to the increase of the polarizability of
the material) and the decrease of Er3+– OH� transfer.
a b4F 7/22H11/24S3/2
4F9/2
4I11/2
4I13/2
4I15/2
4I 9/2
Fig. 7. Description of up conversion processes in borophosphate glasses pum
processes involved in the red emission.
The influence of niobium oxide can be seen by exam-
ining low and high concentration of niobium oxide
introduction in the glass composition on the emission
spectra around 1532 nm. The spectra are broadened
with the increase of the niobium oxide concentration
and the emission intensity at 1532 nm and at 1000 nmincrease strongly after x around 0.30 (Fig. 5(a) and
(b)). These two phenomena have to be related to the
change of the borophosphate to a borophospho-niobate
glass network appearing above x = 0.30.
The introduction of Nb2O5 in borophosphate matrix
is also modifying the up conversion processes leading to
green luminescence (2H11/2 ! 4I15/2 and 2S3/2 ! 4I15/2)
and to red luminescence to (2F9/2 ! 4I15/2) as presentedin Fig. 6. The green luminescence can be explained by
a second photon absorption or energy transfer by APTE
process, after excitation at 980 nm, from an excited level
(4I11/2) to the level 4F7/2 then to 2H11/2. The green emis-
sions result of a radiative transition between 4S3/2,2H11/2
and 4I15/2 levels as shown in Fig. 7(a).
For the red luminescence, two different main up con-
version mechanisms can occur by absorption of a sec-ond photon absorption or APTE process from 4I13/2or from 4I11/2 levels. In first case (Fig. 7(b)), the energy
is supposed to be absorbed from 4I11/2 to 2H11/2. Mul-
tiphonon relaxations (2H11/2 ! 4S3/2 and 4S3/2 ! 4F9/2)
lead to the transition 4F9/2 ! 4I15/2. In another case
(Fig. 7(c)), by a non-radiative decay from 4I11/2 to4I13/2, energy can be absorbed to populate the 4F9/2 level.
The radiative transition from 4F9/2 to4I15/2 leads to a red
luminescence. The decrease of the intensity of the two
emissions, within the same order with the introduction
of Nb2O5, indicates that these two emissions are related.
The more likely phenomenon is an up conversion pro-
cess involving a two photons absorption from 4I11/2level. The increase of the visible emission intensities is
in good agreement with the increase of the measured4I11/2 level lifetime with the increase of Nb2O5 content
c4F 7/22H11/24S3/2
4F9/2
4I11/2
4I13/2
4I15/2
4I 9/2
4F 7/22H11/24S3/2
4F9/2
4I11/2
4I13/2
4I15/2
4I 9/2
ped at 980 nm. (a) Process involved in the green emissions and (b, c)

2084 L. Petit et al. / Journal of Non-Crystalline Solids 351 (2005) 2076–2084
leading to larger probability for a second photon
absorption from 4I11/2 excited level.
5. Conclusion
The effect of the Nb2O5 introduction in borophos-
phate matrix on Er3+ spectroscopic properties was stud-
ied. The progressive introduction of Nb2O5 in the
borophosphate matrix leads to a more niobate glass
structure with the formation of a 3D NbO6 network
which affects strongly the optical behavior. As the
Nb2O5 concentration in the glass increases, the absorp-
tion cross-sections of Er3+ ions at 980 and 1532 nmand the emission at 1532 nm increase and the Er3+ 4I13/2level lifetime decreases. These results indicate a progres-
sive growth of the 4I13/2 ! 4I15/2 transition probability.
The niobium oxide introduction allows also to decrease
the OH� absorption around 3000 cm�1, which improves
the emission at 1532 nm, and to increase the emission
bandwidth of the 4I13/2 ! 4I15/2 transition. All these
parameters are in accordance with the amplificationmeasurements conducted recently on these materials.
The structural changes of the glass structure with the
niobium oxide content are in correlation with a progres-
sive modification of the Er3+ ions environment, con-
firmed by the Judd Ofelt model.
Acknowledgments
The authors acknowledge Dr Gilles Le Flem for fruit-
ful discussions. This work has been supported by the
CNRS in the frame of the Telecommunication program
and by the Aquitaine region.
References
[1] (a) M.J. Holmes, F.P. Payne, D.M. Spirit, Electron. Lett. 26 (4)
(1990) 2103;
(b) W. Zheng, O. Hulten, R. Rylander, J. Light. Technol. 12
(1994) 430.
[2] P. Xie, S.C. Rand, Opt. Lett. 17 (1992) 1116.
[3] E. Snoeks, P.G. Kik, A. Polman, Opt. Mater. 5 (1996) 159.
[4] Y. Yan, A.J. Faber, H. de Waal, J. Non-Cryst. Solids 181 (1995)
283.
[5] D.L. Veasey, D.S. Funk, N.A. Sanford, J.S. Hayden, Appl. Phys.
Lett. 74 (1999) 789.
[6] T. Ohtsuki, N. Peyghambarian, S. Honkanen, S.I. Najafi, J.
Appl. Phys. 78 (1995) 3617.
[7] F.F. Sene, J.R. Martinelli, L. Gomes, J. Non-Cryst. Solids 348
(2004) 63.
[8] R. Balda, A. Oleaga, J. Fernandez, J. Mavarro, Opt. Mater. 24
(1–2) (2003) 83.
[9] (a) B.R. Judd, Phys. Rev. 127 (1962) 750;
(b) G.S. Ofelt, J. Chem. Phys. 37 (1962) 511.
[10] W.T. Carnall, H. Crosswhite, H.M. Crosswhite, Special Report
Chemistry Division, Argonne Natl. Lab., Argonne, IL, USA,
1977.
[11] M.J. Weber, Phys. Rev. 157 (1967) 262.
[12] (a) G.T. Stranford, R.A. Condrate, B.C. Cornilsen, J. Mol.
Struct. 73 (1981) 231;
(b) A. Rulmont, R. Cahay, M. Liegeois-Duckaerts, P. Tarte, Eur.
J. Solid State Inorg. Chem. 28 (1991) 207;
(c) A.M. Efimov, J. Non-Cryst. Solids 209 (1997) 209.
[13] P. Ayyub, M.S. Multani, V.R. Palkar, R. Vijayaraghavan, Phys.
Rev. B 34 (1986) 8137.
[14] A.M. Efimov, V.G. Pogareva, J. Non-Cryst. Solids 275 (2000)
189.
[15] (a) J.J. Videau, T. Cardinal, G. Le Flem, Phosphorous Res. Bull.
10 (1999) 646;
(b) T. Cardinal, E. Fargin, G. Le Flem, M. Couzi, L. Canioni, P.
Segonds, L. Sarger, A. Ducasse, F. Adamietz, Eur. J. Solid State
Inorg. Chem. 33 (1996) 597.
[16] W.F. Krupke, IEEE J. Quant. Electron. QE-7 (1971) 153.
[17] E.W.J.L. Oemen, A.M.A. Van Dongen, J. Non-Cryst. Solids 111
(1989) 205.
[18] H. Takebe, Y. Nageno, K. Morinaga, J. Am. Ceram. Soc. 78
(1995) 1161.
[19] H. Ebendorff-Heidepriem, D. Ehrt, M. Bettinelli, A. Speghini, J.
Non-Cryst. Solids 240 (1998) 66.
[20] (a) R. Reisfeld, Y. Eckstein, J. Chem. Phys. 63 (9) (1975) 4001;
(b) L.A. Riseberg, H.W. Moos, Phys. Rev. 174 (2) (1968) 429.
[21] S.N. Houde-Walter, P.M. Peters, J.F. Stebbins, Q. Zeng, J. Non-
Cryst. Solids 286 (2001) 118.
[22] L. Petit, T. Cardinal, J.J. Videau, A. Tressaud, E. Durand, L.
Canioni, M. Martines, Y. Guyot , G. Boulon, Opt. Mater.,
in press.