open-file report 91-352 - usgs publications repository
TRANSCRIPT

DEPARTMENT OF THE INTERIOR U.S. GEOLOGICAL SURVEY
NATIONAL EARTHQUAKE HAZARDS REDUCTION PROGRAM, SUMMARIES OF TECHNICAL REPORTS VOLUME XXXH
Prepared by Participants In
NATIONAL EARTHQUAKE HAZARDS REDUCTION PROGRAM
July 1991
Open-File Report 91-352
This report is preliminary and has not been reviewed for conformity with U.S. Geological Survey editorial standards or with the North American Stratigraphic Code. Parts of it were prepared under
contract to the U.S. Geological Survey and the opinions and conclusions expressed herein do notnecessarily represent those of the USGS. Any use of trade, product, or firm names is for descriptive
purposes only and does not imply endorsement by the U.S. Government
Men/0 Park, California 1991
UNITED STATESDEPARTMENT OF THE INTERIOR
GEOLOGICAL SURVEY
NATIONAL EARTHQUAKE HAZARDS REDUCTION PROGRAM, SUMMARIES OF TECHNICAL REPORTS VOLUME XXXII
Prepared by Participants in
NATIONAL EARTHQUAKE HAZARDS REDUCTION PROGRAM
Compiled by
Muriel L. Jacobson

The research results described in the following summaries were submitted by the investigators on October 31, 1990 and cover the period from October, 1991 through April 1, 1991. These reports include both work performed under contracts administered by the Geological Survey and work by members of the Geological Survey. The report summaries are grouped into the five major elements of the National Earthquake Hazards Reduction Program.
Open File Report No. 91-352
This report has not been reviewed for conformity with U.S. Geological Survey editorial standards or with the North American Stratigraphic Code. Parts of it were pre pared under contract to the U.S. Geological Survey and the opinions and conclusions expressed herein do not necess arily represent those of the USGS. Any use of trade, product, or firm names is for descriptive purposes only and does not imply endorsement by the U.S. Government.
The data and interpretations in these progress reports may be reevaluated by the investigators upon completion of the research. Readers who wish to cite findings described herein should confirm their accuracy with the author.

CONTENTS
Earthquake Hazards Reduction Program
Page ELEMENT I - Recent Tectonics and Earthquake Potential
Determine the tectonic framework and earthquake potential of U.S. seismogenic zones with significant hazard potential
Objective fl-l); Regional seismic monitoring....................1
Objective (1-2); Source zone characteristics
Identify and map active crustal faults, using geophysical and geological data to interpret the structure and geometry of seismogenic zones.
1. Identify and map active faults in seismic regions
2. Combine geophysical and geologic data to interprettectonic setting of seismogenic zones..................70
Objective fI-3); Earthquake potential
Estimate fault slip rates, earthquake magnitudes, and recurrence intervals for seismogenic zones and faults disclosed by research under Objectives T-l and T-2, using geological and geophysical data.
1. Earthquake potential estimates for regions of the U.S. west of 100 W.
2. Earthquake potential estimates for regions of the U.S. east of 100 W.
3. Support studies in geochemistry, geology, srrd soils science that enable fault movements to be accurately dated.................................................153
i.

Page ELEMENT II. Earthquake Prediction Research
Collect observational data and develop the instrumentation, methodologies, and physical understanding needed to predict damaging earthquakes.
Objective (II-l); Prediction Methodology and Evaluation
Develop methods to provide a rational basis for estimates of increased earthquake potential. Evaluate the relevance of various geophysical, geochemical, and hydrological data for earthquake prediction.
1. Develop, operate and evaluate instrumentation for monitoring potential earthquake precursors.
2. Analyze and evaluate seismicity data collected prior to medium and large earthquakes.
3. Obtain and analyze data from seismically active regions of foreign countries through cooperative projects with the host countries.
4. Systematically evaluate data and develop statistics that relate observations of specific phenomena to earthquake occurrence.
5. Develop, study and test prediction methods that can be used to proceed from estimates of long- range earthquake potential to specific short-term predictions..........................................219
Objective (II-2); Earthquake Prediction Experiments
Conduct data collection and analysis experiments in areas of California capable of great earthquakes, where large popula tions are at risk. The experiments will emphasize improved coordination of data collection, data reporting, review and analysis according to set schedules and standards.
1. Collect and analyze data for an earthquake predic tion experiment in southern California, concentrating on the southern San Andreas fault from Parkfield, California to the Salton Sea.
2. Collect and analyze data for an earthquake predic tion experiment in central California, concentrating on the San Andreas fault north of Parkfield, California...........................................359
11.

PageObjective fII-3); Theoretical, Laboratory and Fault Zone
Studies
Improve our understanding of the physics of earthquake processes through theoretical and laboratory studies to guide and test earthquake prediction observations and data analysis. Measure physical properties of those zones selected for earthquake experiments, including stress, temperature, elastic and anelastic characteristics, pore pressure, and material properties.
1. Conduct theoretical investigations of failure and pre-failure processes and the nature of large- scale earthquake instability.
2. Conduct experimental studies of the dynamics of faulting and the constitutive properties of fault zone materials.
3. Through the use of drilled holes and appropriate down hole instruments, determine the physical state of the fault zone in regions of earthquake prediction experiments...............................463
Objective (11-41; Induced Seismicity Studies
Determine the physical mechanism responsible for reservoir- induced seismicity and develop techniques for predicting and mitigating this phenomena.
1. Develop, test, and evaluate theories on the physics of induced seismicity.
2. Develop techniques for predicting the character and severity of induced seismicity.
3. Devise hazard assessment and mitigation strategiesat sites of induced seismicity.......................
ELEMENT III Evaluation of Regional and Urban Earthquake Hazards
Delineate, evaluate, and document earthquake hazards and risk in urban regions at seismic risk. Regions of interest, in order of priority, are:
1) The Wasatch Front
2) Southern California
3) Northern California
iii.

Page4) Anchorage Region
5) Puget Sound
6) Mississippi Valley
7) Charleston Region
Obiective (III-l); Establishment of information systems......520
Objective (III-2): Mapping and synthesis of geologic hazards
Prepare synthesis documents, maps and develop modelson surface faulting, liquefaction potential, groundfailure and tectonic deformation........................ 586
Objective (III-3): Ground motion modeling
Develop and apply techniques for estimating strongground shaking...........................................620
Obiective (III-4); Loss estimation modeling
Develop and apply techniques for estimating earthquake losses
Obiective (III-5); Implementation
ELEMENT IV Earthquake Data and Information Services
Obiective fIV-1): Install, operate, maintain, and improve standardized networks of seismograph stations and process and provide digital seismic data on magnetic tape to network- day tape format.
1. Operate the WWSSN and GDSN and compile network data from worldwide high quality digital seismic stations.
2. Provide network engineering support.
3. Provide network data review and compilation..........635
IV.
PageObjective (IV-2); Provide seismological data and informa tion services to the public and to the seismological research community.
1. Maintain and improve a real-time data acquisition system for NEIS. (GSG)
2. Develop dedicated NEIS data-processing capability.
3. Provide earthquake information services.
4. Establish a national earthquake catalogue............660
ELEMENT V; Engineering Seismology
Objective (V-l); Strong Motion Data Acquisition andManagement
1. Operate the national network of strong motion instruments.
2. Deploy specialized arrays of instruments to measure strong ground motion.
3. Deploy specialized arrays of instruments to measurestructural response..................................670
Objective (V-2); Strong Ground Motion Analysis and Theory
1. Infer the physics of earthquake sources. Establish near-source arrays for inferring temporal and spatial variations in the physics of earthquake sources.
2. Study earthquake source and corresponding seismic radiation fields to develop improved ground motion estimates used in engineering and strong-motion seismology.
3. Development of strong ground motion analysis techniques that are applicable for earthquake- resistant design..................................... 682
LOMA PRIETA
Post earthquake investigations ............................... 691
No Reports Received...........................................698
Index 1: Alphabetized by Principal Investigator...................699
Index 2: Alphabetized by Institution..............................703
v.


1.1
Seismic Monitoring of the Shumagin Seismic Gap, Alaska
# 14-08-0001-A0616
Geoffrey A. AbersLamont-Doherty Geological Observatory of Columbia University
Palisades, New York 10964(914) 359-2900
InvestigationsSeismic data from the Shumagin seismic network (Figure 1) were collected and processed to
obtain digital waveforms, origin times, hypocenters, and magnitudes for local and regional earthquakes. The data are used for earthquake source characterization, determination of earth structure, studies of regional tectonics, analysis of possible earthquake precursors, and seismic hazard evaluation. Yearly bulletins are available starting in 1984 through 1990.
ResultsShumagin network data were used to locate 137 earthquakes from January 1 to June 30,1990,
bringing the total number of digitally recorded events in Shumagin network catalog to 5805 since 1982. The seismicity for the first half of 1990 is shown in map view on Figure 2 and in cross section on Figure 3. Events shown by solid symbols are those events that meet the following quality criteria: located by 8 or more P or S arrivals, vertical error from Hypoinverse less than 10 km, and horizontal error less than 5 km. Other events are shown by open symbols. These criteria provide a rough indication of the location quality, and show that epicenters more than 100 km from the nearest station are rarely well determined. Additional numerical tests of hypocenter stability show that when the entire network is operating, shallow events west of 166°W, east of 156°W, or seaward of the trench can not be reliably located. Also, depths of shallow earthquakes are only well-determined beneath the Shumagin Islands.
Significant reconfiguration of the network took place in the summer of 1990, in an effort to refocus network research while drastically reducing operating costs (Figure 1). Five short-period instruments were removed, approximately 1/3 of the telemetered network: stations on Sanak Island (SNK); False Pass, Unimak Island (FPS); northern Pavlof Volcano (PN6); a 3-component station at Black Hills, northern Alaska Peninsula (BLH); and Ivanof Bay, in the NE (IVF). At the central station, backup analog equipment was shut down and removed. The remaining network includes primarily stations in fie Shumagin Islands proper, where they can be sited as close as possible to the Aleutian interplate thrust, and a few stations monitoring the Pavlof and Button Volcanos in conjunction with the Alaska Volcano Observatory.
One significant improvement was made, to upgrade the central station at Sand Point to a continuous digitally-recorded broad-band station. The instrument, a Guralp CMG-4, records ground velocity at periods up to 20 s on 3 components. It is recorded separately from the telemetered network, along with one station on Pavlof Volcano (PVV), at a continuous 20 samples/second. This instrument has provided high-quality records since late July, 1990, which are being used for detailed source and propagation studies (e.g., Figures 4-5).
The overall pattern in Figures 2-3 resembles the long term seismicity. Seismicity is concentrated near the base of the main thrust zone between 35 and 50 km depth, and immediately above it within the overriding plate. Seismicity contours below 30 km depth parallel the volcanic arc, rather than the trench, and become closer to the trench west of the network (Figure 2). Seismicity appears to be sparse where the main thrust zone is shallower than 35 km, between the Shumagin Islands and the trench. Deeper seismicity extends to depths of 200 km. Some locations near 100 km depth on Figure 2 correlate with the lower plane of the double seismic zone seen in long-term seismicity.

1.1
The most significant activity in the Shumagin area has been in the outer-rise regions east and west of the Shumagin segment. On July 27,1990 a Mb 5.7 outer-rise event was recorded near the trench, east of the Shumagin "gap" but seaward of the inferred nucleation point of the 1938 Ms=8.3 event (Figure 4). Sand Point broad-band seismograms from this event show a strong radially-polarized phase on horizontal components (Figure 5), which has been modelled as a surface refracted Sp phase. Teleseismic analysis shows that this event is 40-45 km deep and has a thrust mechanism. To our knowledge this is the first outer-rise earthquake with a thrust mechanism recorded anywhere in the Aleutians.
56
Figure 1. Map of stations in the Shumagin Seismic Network, as of August 1990. Circles are short-period telemetered stations, all vertical-component except for SGB which is 3-component. Upright triangles are analog SMA-1 sites only; in addition, SMA-l's are co-located with stations at SGB, BKJ, NGI, DLG, and DRR. Inverted triangles are telemetered 3-component FBA's; CNB also has a vertical short-period seismometer. The square is the central station site at Sand Point, where all data is recorded and the location of the broad-band instrument. In addition, digital strong-motion instruments are operating at SAN and Dutch Harbor, Unalaska.

1.1
5.0 D
4.0 n3.0 D2.0 D1.0 '0.0
143 Events
TRIANGLE = StationDepth (km): CIRCLE < 50.0 < BOX < 100.0 < DIAMOND
I_________I_________I________
56.0
54.0
-166.0 -164.0 -162.0 -160.0 -158.0 -156.
Figure 2. Map of seismicity located by the Shumagin seismic network from July to December, 1990. Symbol shapes show depths, sizes show magnitudes. Filled symbols meet criteria for well-located events, described in text.
3I>
6.0 O 5.0 O 4.0 0
3.0 ° 2.0 °1.0 * 0.0 *
£ X'All Events, Jul-Dec 1990 143 Events, 71 Selected
w * ** * *£^$-» 4
o * Q °^dF&i^ >cT o
6» * * °
27Jr«/y7990
A
,
100.0
200.0
Azim= 30.00 Length= 4.00CtrLat= 55.00 CtrLon=-160.00 HWidth= 999.00
Figure 3. Cross-section of all^Shumagin Network seismicity July-December 1990, located in Figure 2.
3

1.1
164* 160' 158' 156'
52' SI-
164' 162' 158' 156*
Fig. 4. Location and mechanism of outer-rise event of 7/25/90. Also shown is raypath to broad band station SAI in Sand Point, where seismograms in Fig. 5 are recorded.
Time reference; 0 = 90072514:43:17.467
Fig. 5. Broad-band seismograms for outer-rise earthquake of 7/25/90, recorded at Sand Point. Rotated to vertical, radial, and tangential (z/,t) components. Note strong radial 'XI* phase, tentatively identified as a surface-refracted Sp phase from waveform modelling. Broad-band instrument is flat to velocity between 2.0 and 0.05 Hz.

I.I
Semi-Annual Technical Summary October through March, 1991
Seismological Data Processing Project 9930-03354
Greg Alien, Moses Smith
U.S. Geological Survey345 Middlefield Road
Menlo, Park, Ca. 94025
(415) 329-4695
This project provides services for UNIX computers and PCs in the areas of network management and maintenance, computer system management, installation, backups, maintenance, and user assistance. There are currently 19 UNIX computers in the Branch of Seismology: an Integrated Solutions Inc., multi-user system; a SUN 4/280 fileserver; 6 SUN SPARCstation Is; 6 SUN 3/60 workstations; 2 SUN 3/50 workstations; 1 SUN 3/80 workstation; 1 SUN SPARCstation SLC; 1 SUN SPARCstation 2. This project also maintains a NOVELL network of 7 PCs (MS-DOS), for the branch administrative staff. The body of this report does not contain investigations, results and reports, as these are not germain to the nature of this project.
During the first 6 months of FY91 we provided the following serivces for the Branch:
General user assistance with the use of UNIX systems.
Nightly incremental backups of the ISI and SUN computers.
Monthly system backups of the SUN file server and the ISI computer.
Maintained RTP data system buffer service to Branch UNIX and VAX computers.
Maintained the Branch Administrative Office's Novell PC network.
Maintained and upgraded application software.
Arranged for various hardware repairs for the UNIX computers.
Extended the SUN data communication sub-net from building 7 to building 8.

I.I
Moved the SUN 4/280 file server from the 2ond floor of building 8, to the new computer room on the 1st floor of building 7.
Upgraded the SUN 4/280 file server hardware by adding a 1 gigabyte, SCSI disk, and 32 serial ports.
Upgraded the operating system of the SUN 4/280 and 2 SUN workstations to SUN OS 4.1.1.
Have and are currently working with Tom Jackson, of the Consolidated Digital Recording and Analysis Project, on preparing the new computer room facilities.
1.1
Regional Seismic Monitoring Along The Wasatch Front Urban Corridor And Adjacent Intermountain Seismic Belt
14-08-0001-A0621
W. J. Arabasz, R. B. Smith, J. C Pechmann, and S. J. Nava Department of Geology and Geophysics
University of UtahSalt Lake City, Utah 84112
(801) 581-6274
Investigations
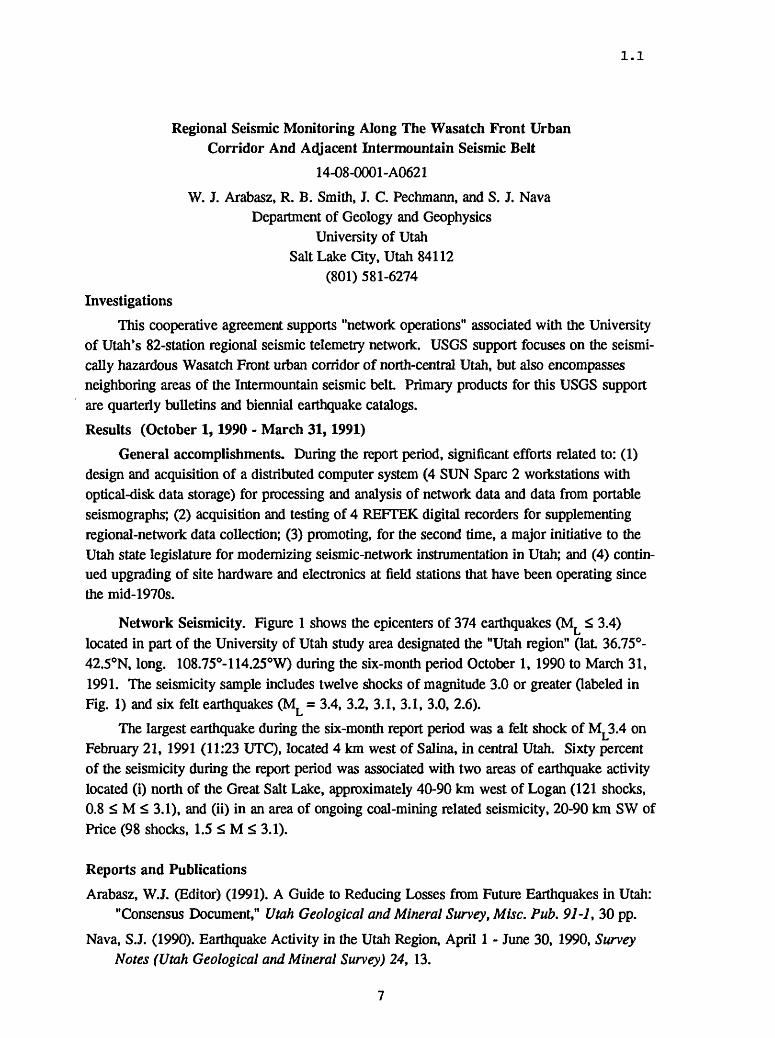
This cooperative agreement supports "network operations" associated with the University of Utah's 82-station regional seismic telemetry network. USGS support focuses on the seismi- cally hazardous Wasatch Front urban corridor of north-central Utah, but also encompasses neighboring areas of the Intermountain seismic belt Primary products for this USGS support are quarterly bulletins and biennial earthquake catalogs.
Results (October 1,1990 - March 31,1991)
General accomplishments. During the report period, significant efforts related to: (1) design and acquisition of a distributed computer system (4 SUN Spare 2 workstations with optical-disk data storage) for processing and analysis of network data and data from portable seismographs; (2) acquisition and testing of 4 REFTEK digital recorders for supplementing regional-network data collection; (3) promoting, for the second time, a major initiative to the Utah state legislature for modernizing seismic-network instrumentation in Utah; and (4) contin ued upgrading of site hardware and electronics at field stations that have been operating since the mid-1970s.
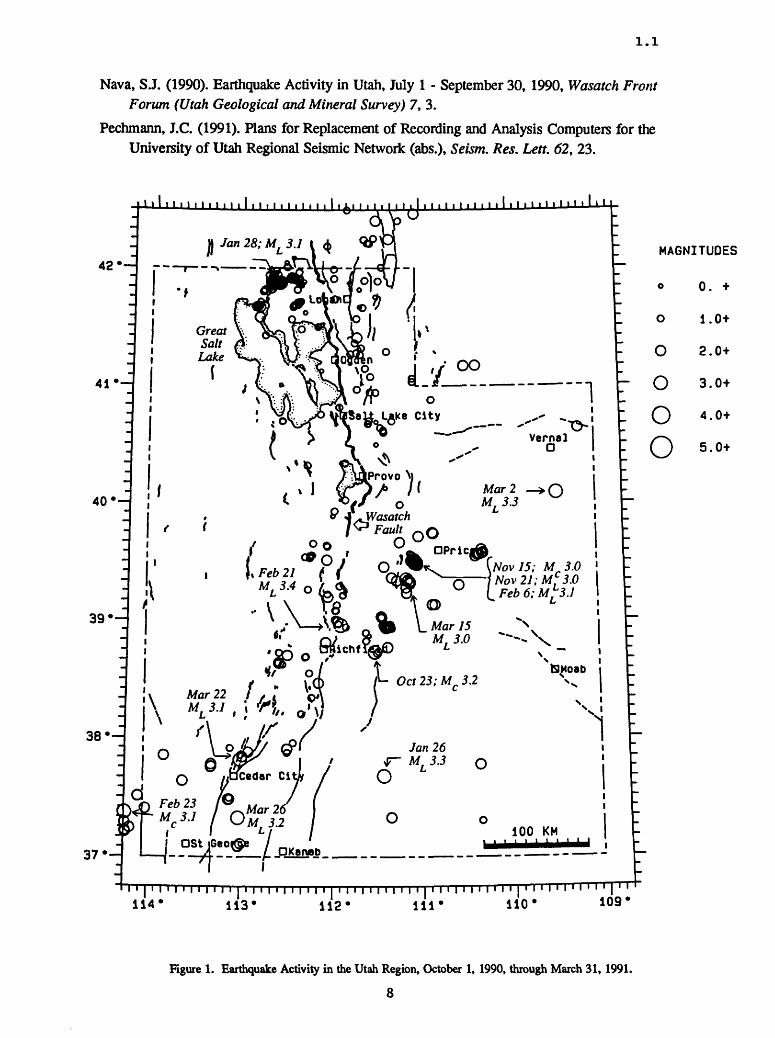
Network Seismicity. Figure 1 shows the epicenters of 374 earthquakes (M < 3.4)L*
located in part of the University of Utah study area designated the "Utah region" (laL 36.75°- 42.5°N, long. 108.75°-114.25°W) during the six-month period October 1, 1990 to March 31, 1991. The seismicity sample includes twelve shocks of magnitude 3.0 or greater (labeled in Fig. 1) and six felt earthquakes (Mt = 3.4, 3.2, 3.1, 3.1, 3.0, 2.6).
Lt
The largest earthquake during the six-month report period was a felt shock of M 3.4 on February 21, 1991 (11:23 UTC), located 4 km west of Salina, in central Utah. Sixty percent of the seismicity during the report period was associated with two areas of earthquake activity located (i) north of the Great Salt Lake, approximately 40-90 km west of Logan (121 shocks, 0.8 < M < 3.1), and (ii) in an area of ongoing coal-mining related seismicity, 20-90 km SW of Price (98 shocks, 1.5 £ M < 3.1).
Reports and Publications
Arabasz, W.J. (Editor) (1991). A Guide to Reducing Losses from Future Earthquakes in Utah: "Consensus Document," Utah Geological and Mineral Survey, Misc. Pub. 91-1 , 30 pp.
Nava, SJ. (1990). Earthquake Activity in the Utah Region, April 1 - June 30, 1990, Survey Notes (Utah Geological and Mineral Survey) 24, 13.
1.1
Nava, SJ. (1990). Earthquake Activity in Utah, July 1 - September 30, 1990, Wasatch Front Forum (Utah Geological and Mineral Survey) 7, 3.
Pechmann, J.C. (1991). Plans for Replacement of Recording and Analysis Computers for the University of Utah Regional Seismic Network (abs.), Seism. Res. Lett. 62, 23.
11111 n 11111111111. i. i. 111.11xi i. i. i. i. I. i. i. i. 11111111111111 n I liA VN W
42
O 3.0+
O 4 - 0+Salt L6Ke City ^ !
-; AT 3.0 ! Nov27;A/53.0
b L A/ar 75 M. 3.0
OStj6eof®e _ ^^^^^j^^j _ _ A _ _?___. OKanab __ _ _ __ _ _ __ _ _ __ _ _ _ - -
I ' | I I ' I I I I I I I I I I I I I I I I I I I I I I I I I I I I I I I I I I I I I I I I I M I | ' I ' I ' I ' I ' i [ 113- 112- 111- 110* 109*
Figure 1. Earthquake Activity in the Utah Region, October 1, 1990, through March 31, 1991.
8

1.1
Partial Support of Joint USGS-CALTECH Southern California Seismographic Network
#14-08-0001-A0613
Robert W. Clayton Egill Hauksson
Seismological Laboratory,California Institute of Technology
Pasadena, CA 91125 (818-356-6903)
INVESTIGATIONSThis Cooperative Agreement provides partial support for the joint USGS-Caltech
Southern California Seismic Network. The purpose is to record and analyze data from local earthquakes and generate a data base of phase data and digital seismograms. The primary product derived from the data base is a joint USGS-Caltech catalog of earthquakes in the southern California region.
For more detailed information about data access, please contact:Dr. Kate Hutton at (818)-356-6959;
or with E-mail: [email protected].
RESULTS
SeismicityThe Southern California Seismographic Network (SCSN) recorded 4691
earthquakes during the six months from October 1990 through April 1991, an average of 670 per month, making it an unusually quiet reporting period (Figure 1).
There was only one event of ML^4.0 in California during the last six months. This ML4.2 earthquake occurred on 18 December 1990 and was located in the eastern San Joaquin Valley, 8 miles east of Bakersfield. The second largest earthquake that occurred during this reporting period was an ML3.8, located in the Costa Mesa area, near the Newport-Inglewood fault at the southern edge of the Los Angeles basin, at 1721 GMT on October 17, 1990. Both events were followed by a few aftershocks. Only one earthquake of M>3.5 occurred during the first 4 months of 1991.
During the last six months the prominent areas of microseismicity were the usual ones: the Coso and Kern River areas, the San Jacinto fault, the southern Elsinore fault, the Imperial Valley and the San Bernardino and Little San Bernardino Mountain areas. Aftershocks continued at a rate clearly higher than background in the Oceanside sequence (ML5.3 on July 13, 1986) and the Coalinga sequence (ML6.3 on May 3, 1983).
Focal MechanismsThe focal mechanism for earthquakes of M>3.5 are shown in Figure 2. A total of 7
events of M>3.5 were recorded in California from 1 October 1990 to 30 April 1991 and reliable focal mechanisms could be determined for 6 events. The one M]J3.5 event (31 January 1991) for which a focal mechanism was not determined, occurred at a shallow depth (probably less than 1 km) in the Orcutt Oil Field in the Santa Maria basin. This

1.1
event was most likely induced in the oil field. The ML4.2 Bakersfield event (18 December 1990) showed a mixture of strike-slip and normal faulting. The ML3.8 Costa Mesa event (October 17,1990) also showed a mixture of strike-slip and normal faulting. Three events showing strike-slip faulting occurred in the San Bernardino Mountains. One event (14 December 1990) showing strike-slip faulting was recorded north of the Coso Geothermal Area.
Weekly Seismicity ReportIn January 1990, the Seismographic Network initiated a weekly seismicity report,
patterned after a similar report issued by the U.S. Geological Survey in Menlo Park. The language of the "earthquake report" is aimed at the general public. So far, the report has been enthusiastically received. A few members of the local media have started basing regular news features on it.
TABLE . Locations and Focal Mechanisms of M>3.5 Earthquakes that Occurred During January - September 1990
Origin
Day
901018901109901214901217901218910308
Time
UT
1721 56.080711 20.001422 33.05174421.22165643.140927 35.56
Latitude
N
33-38.7434-25.2336-33.6034-12.2035-22.0534- 8.71
Longitude
W
117-53.43116-48.88117-55.82117- 1.64118-50.53116-43.26
Depth
km
5.114.216.006.745.53
10.73
Mag
ML
3.83.53.63.74.23.7
Focal
Ddir
9511533031018570
Mechanisms
Dip Rake
75 -15080 060 -2045 080 -14090 170
Publications Using Network Data (Abstracts excepted).Hauksson, E., and S. Gross, Source parameters of the 1933 Long Beach earthquake,
Seismol. Soc. Am., Bull, 81, 81-98, 1991. Michael, A. J., Spatial variations in stress within the 1987 Whittier Narrows, California,
aftershock sequence: New techniques and results, /. Geophys. Res., 96, 6303-6319, 1991.
Mori, J., Estimates of velocity structure and souce depth using multiple P waves fromaftershocks of the 1987 Elmore Ranch and Superstition Hills, California,earthquakes, Seismol. Soc. Am., Bull, 81, 508-523, 1991.
Su, F., K. Aki, and N. N. Biswas, Discriminating quarry blasts from earthquakes usingcoda waves, Seismol. Soc. Am., Bull., 81, 162-178, 1991.
Wesnousky, S. G., Seismicity as a function of cumulative geologic offset: Someobservations from southern California, Seismol. Soc. Am., Bull., 80, 1374-1381,1990.
10

1.1
OCTOBER 1990 - APRIL 1991, ALL MAGNITUDES
ip I I I M M M l I M I |n~n -M 111111111111111111111111111
Figure 1. Map of epicenters of earthquakes in the southern California region, 1 October 1990 to 30 April 1991.
11

FOCAL MECHANISMS > 3.5OCTOBER 1990 - APRIL 1991
fo
121I I I I | I I I I I I I I I I I I I | I | I | I | I | I || I | I | I | I I I I I I I I I I I I I I I | I I I I I I I I M
120° 119° 118° 117° 116°
Figure 2. Focal mechanisms of earthquakes of M>3.5 that occurred in southern California from 1 October 1990 to 30 April 1991. (See also enclosed table).

1.1
1. Regional Seismic Monitoring in Western Washingtonand
2. Seismic Monitoring of Volcanic and Subduction Processes in Washington and Oregon
1. 14-08-0001-A06222. 14-08-0001-A0623
R.S. Crosson, S.D. Malone, A.I. Qamar and R.S. LudwinGeophysics Program
University of WashingtonSeattle, WA 98195
(206) 543-8020 October 1, 1990 - March. 31, 1991
InvestigationsOperation of the Washington Regional Seismograph Network (WRSN) and routine
preliminary analysis of earthquakes in Washington and Northern Oregon continue under these contracts. Quarterly bulletins which provide operational details and descriptions of seismic activity in Washington and Northern Oregon are available from 1984 through the first quarter of 1991. Final published catalogs are available from 1970, when the network began operation, though 1986.
The University of Washington operates 76 stations west of 120.5°W under these agreements, 28 are supported under A0622, 46 under A0623, and 2 are operated jointly. Station locations are shown as small triangles in Fig. 1. This report includes a brief sum mary of significant seismic activity. Additional details are included in our Quarterly bul letins.
Network OperationsIn August and September 1990, under JOA 14-08-0001-A0623, we installed 4 new
stations in Oregon (HBO, DBO, MPO and HSO). Patrick McChesney, a new technician who is stationed in Vancouver WA, was hired to maintain stations at Mt. St. Helens and in Oregon.
To improve our ability to function in emergency situations the University provided us with an uninterruptible power supply (UPS). To improve access to digital trace data, we are copying our "master" 9 track, 1600 bpi tapes of digital trace data to exabyte tape cartridges, and we developed software to facilitate recovery of data files. To improve communication with other agencies, we implemented a public update service. Anyone on internet can access the most current information on seismic activity. The utility "finger [email protected]" gives locations of significant Pacific Northwest earth quakes during the past several days, several of the the most recent WRSN locations, and the most recently received NEIS QED locations. The same service is available by dialing our main computer (206) 685-0889 and logging in as "quake" with password "quake".
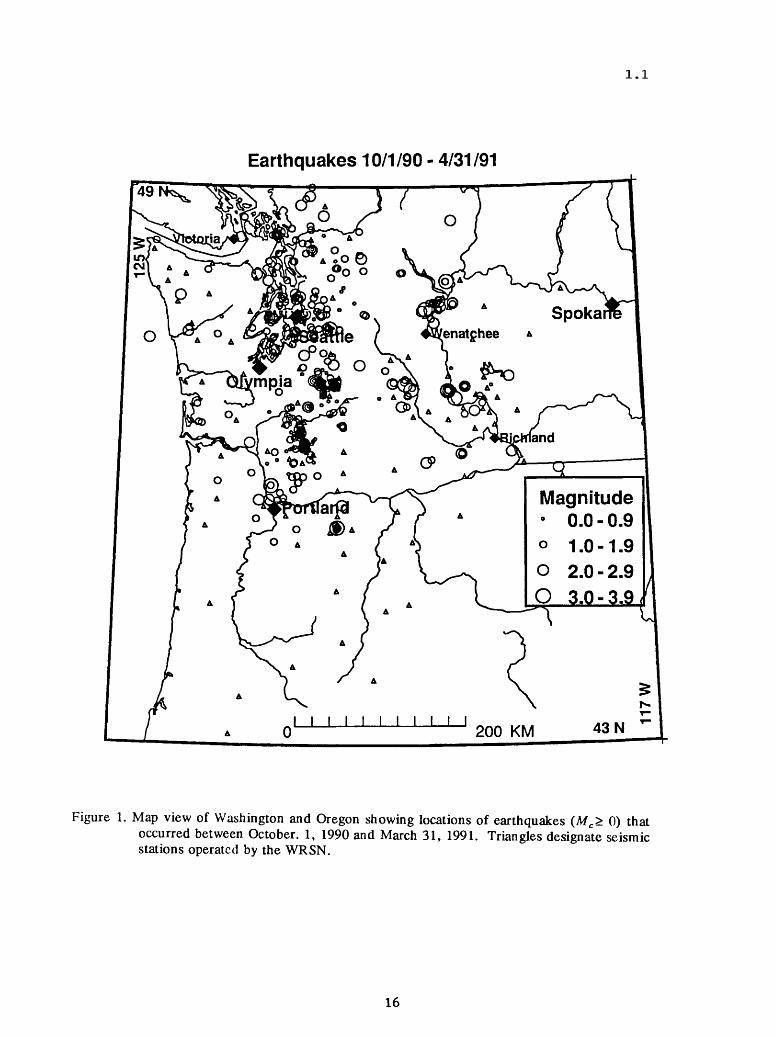
SeismicityFigure 1 shows earthquakes (M c > 0) located in Washington and Oregon during this
reporting period. Excluding blasts, probable blasts, and earthquakes outside the U. W. network, a total of 748 earthquakes west of 120.5°W were located between October 1, 1990 and March 31, 1991. Of these, 354 were located near Mount St. Helens, which has not erupted since October of 1986. East of 120.5°W, 49 earthquakes were located.
There were five earthquakes reported as felt west of Cascades, and three reported as felt to the east of the Cascades. None of these were damaging. The largest earthquakes in this reporting period were two at Mc 3.5. The first was on October 19, felt on Mt.
13

1.1
Hood, and located at a depth of ~ 6 km. It was one of 24 earthquakes (all but two smaller than M c 1.7) that occurred during a three-hour swarm of activity that day. The other Mc 3.5 earthquake was on December 30, at a depth of ~ 17 km, and was felt at North Bend, east of Seattle.
Network ReviewDuring 1990, the USGS conducted a review of all the networks which it funds. As
part of the review process, we wrote a summary report which covers operational aspects of our network data acquisition and processing, and reviews a number of network-related research projects, carried out here at the University of Washington. Copies of this over view are available from the University of Washington.
PublicationsBarker, S.E. and S.D. Malone, (in press), Magmatic system geometry at Mount St.
Helens modeled from the stress field associated with post-eruptive earth quakes, JGR.
Crosson, R.S, S.D. Malone, and R.S. Ludwin, 1990, Washington Regional Seismo graph Network - Major scientific accomplishments and Operations, Univer sity of Washington.
Ludwin, R. S., S.D. Malone, R.S. Crosson, A.I. Qamar, 1991, Washington Earth quakes 1985, in Stover, C.W and L.R. Brewer, U.S. Earthquakes, 1985, U.S.G.S. Bulletin 1954.
Ludwin, R. S., S.D. Malone, R.S. Crosson, A.I. Qamar, (in press), Washington Earthquakes 1986, in U.S. Earthquakes
Ludwin, R. S., S.D. Malone, R.S. Crosson, A.I. Qamar, (in press), Washington Earthquakes 1987, in U.S. Earthquakes
Ludwin, R. S., S.D. Malone, R.S. Crosson, A.I. Qamar, (in preparation), Washington Earthquakes 1988, in U.S. Earthquakes
Ludwin, R. S., S.D. Malone, R.S. Crosson, A.I. Qamar, (in preparation), Washington Earthquakes 1989, in U.S. Earthquakes
Ludwin, R. S., C.S. Weaver, and R.S. Crosson, (in press), Seismicity of Washington and Oregon, in.: Slemmons, D.B., E.R. Engdahl, D. Blackwell and D. Schwartz, editors, Decade of North American Geology associated volume CSMV-1; Ncotcctonics of North America.
Ma, Li, R.S. Crosson, and R.S. Ludwin, (submitted), Preliminary Report on Focal Mechanisms and stress in western Washington, in.: USGS Professional Paper "Assessing and Reducing Earthquake Hazards in the Pacific Northwest")
Malone, S.D., 1990, Mount St. Helens, the 1980 re-awakening and continuing seismic activity, Geoscience Canada, V 17, N. 3, pp. 146-150.
Thompson, K.I., (in preparation), Seismicity of Mt. Rainier - a detailed study of events to the west of the mountain and their tectonic significance,
Weaver, C.S., R.D. Norris, and C. Jonientz-Trisler, 1990, Results of Seismological monitoring in the Cascade Range, 1962-1989, earthquakes, eruptions, avalanches, and other curiosities, Geoscience Canada, V. 17, pp. 158 - 162. BSSA.
Univ. of Wash. Geophysics Program, 1991, Quarterly Network Report 90-D on Seismicity of Washington and Northern Oregon
Univ. of Wash. Geophysics Program, 1991, Quarterly Network Report 91-A on Seismicity of Washington and Northern Oregon
AbstractsJohnson, P.A., and S.D. Malone, 1991, Cluster analysis of eastern Washington
seismicity: a new algorithm, results and geologic correlations, Seismol. Res. Lett. V. 62, p. 47.s. Lett. V. 62, p. 47.
Jonientz-Trisler, C., C. Driedger, and A.I. Qamar, 1990, Seismic signatures of debris
14

1.1
flows on Mt. Rainier, WA, EOS, V. 71, No. 36, p 1068.Jonientz-Trisler, C., and C. Driedger, 1990, Seismic evidence of historic debris flows
and dry season floods on Mount Rainier, Washington, 1961-1990, EOS, V. 71, N. 41, p 1145.
Malone, S.D., 1991, The Hawk seismic data acquisition system, Seismol. Res. Lett., V. 62, p. 23.
Malone, S.D., A. Qamar, and C. Jonientz-Trisler, 1991, Recent seismicity at Mount Rainier, Washington, Seismol. Res. Lett., V. 62, p. 25.
Moran, S. C., and S.D. Malone, 1990, Focal mechanism solutions from recent earth quakes in the deeper magmatic system at Mt. St. Helens, EOS, V. 71, N. 41, p. 1145.
Moran, S.C., and S.D. Malone, 1990, Pre-1980 seismicity at Mt. St. Helens: is the past the key to the present, EOS, V. 71, N. 36, p 1067.
Nabelek, J., K. Werner, R. Yeats, and S. Malone, 1990, The August, 1990, Wood- burn, Oregon earthquake sequence: constraints from broadband regional recording and geological implications, EOS, V. 71, N. 41, p. 1145.
Qamar, A. and J. Zollweg, 1990, The 1990 Deming Washington earthquakes: a sequence of shallow thrust earthquakes in the Pacific Northwest, EOS, V. 71, N. 41. p 1145.
15
1.1
Earthquakes 10/1/90 - 4/31/91
Figure 1. Map view of Washington and Oregon showing locations of earthquakes (Mc > 0) that occurred between October. 1, 1990 and March 31, 1991. Triangles designate seismic stations operated by the WRSN.
16

I.I
Central California Network Operations
9930-01891
Wes HallBranch of SeismologyU.S Geological Survey
345 Middlefield Road-Mail Stop 977Menlo Park, California 94025
(415)329-4730
Investigations
Maintenance and recording of 343 seismograph stations (444 components) located in Northern and Central California. Also recording 68 components from other agencies. The area covered is from the Oregon border south to Santa Maria.
Results
1. Bench Maintenance RepairA. seismic VCO units 105 B. summing amplifiers 1 C. seismic test units 2 D. VO2H/JO2L VCO Units 36 E. DC-DC Converters 3
2. Production/FabricationA. J512A VCO units 43 B. J512B VCO units 8 C. summing amplifier units 20 D. dc converter/regulators 28 E. V02H/V02L Units 21
3. Rehabilitation: VCO enclosures 28
4. Discriminator Tuning: J120 discriminators 52
5 Equipment Shipped: J512A VCO for HVO 10
6. Ordered and load components on 100 ea additional J512 VCO's
7. New seismic stations: JJR (Joaquin Road); LPK (Park); LRB (Red Bank); GRO (Round Mountain); LPG (Panther Gulch); LVR (Valentine Ridge).
8. Stations deleted: HPR (Peckam Road); HFH (Flint Hills); HKR (Kinkaid Ranch); BSCE, BSCN, BSCV, BSCZ (Stone Canyon).
9. Completed RFP for "Repair, Modify, Calibrate and Perform Quality Control Checks on Seismic Instruments".
10. Contract award and completion of 30 day training for two seismic field technicians from the Bendix Corporation.
11. Fabricate 256 channel interface for Tustin Digitizer to Cusp.
12. Fabricate 256 channel interface for PC computer system.
13. Discontinued recording on one Develocorder.
17

1.1
Cooperative New Madrid Seismic Network
14-08-0001-G1922 14-08-0001-G1923R. B. Herrmann A. C. Johnston, J. M. Chiu
Department of Earth Center for Earthquakeand Atmospheric Sciences Research and Information
Saint Louis University Memphis State University 3507 Laclede AvenueSt. Louis, MO 63103 Memphis, TN 38152
(314) 658-3131 (901) 678-2007
PurposeThe object of this effort is to upgrade the regional seismic networks in
the central Mississippi Valley to provide the data sets necessary for future research in the earthquake process and in earthquake generated ground motion.
In order to accomplish this, the satellite telemetry capability of the US National Seismic Network will be used to communicate between central data collection points at Memphis and St. Louis and the intelligent regional seismic network nodes to be placed at five sites in the region.
Major tasks involve the design and implementation of the data centers, the regional nodes at satellite uplink points, and the seismic sensors in the field. Data will be transmitted from the sensors to a node using all digital telemetry, 20 and 24 bit, to the extent possible with the present funding. The final network will consist of 5 nodes, each collecting data from a broadband sensor, an accelerometer and three-component seismometers.Progress to Date
Major emphasis has been on the design of the regional nodes. This has melded with a complementary effort to replace the PDF 11/70 and PDP 11/34 data processing and collection systems. The off line data processing has been moved to a SUN 4, with the ability to process all previously archived PDP 11/70 data tapes. Since the replacement of the PDP 11/34 and the develop ment of the regional node have very similar requirements, the 11/34 replace ment will provide the heart of the regional node.
The following decisions have been made:
1. To replace the PDP 11/34, an Intel based 486 PC will be used. This will have a 150 mB ESDI drive, VGA adapter, ethernet connection, and mouse. A 16 bit A/D will be used together with a Sprengnether 128 channel multiplexer board. The VenturCom real time VENIX/386 operating system will be used with the added benefit of supporting UNIX, NFS, a DOS emulator and X11R3.
18

1.1
2. The regional intelligent data collection nodes will run the real time OS/9000 operating system with similar hardware.
3. A USNSN satellite dish has been installed at Saint Louis University, Memphis State University and at one regional node site at Marked Tree, Arkansas.Future Plans
The PC based PDF 11/34 replacement will be in operation in July. Details will be given to other users of the original PDF 11/34 - PDP 11/70 systems.
The first field uplink will be at New Madrid, and will be functional in October, 1991.
The project will be complete in August, 1992. PublicationsHaug, E. J., R. B. Herrmann, and J.-M. Chiu (1991). The cooperative New
Madrid Seismic Network - implementation of the regional nodes (abs), Seism. Res. Letters 62, 33.
19
1.1
Next Generation Seismic Studies of the New Madrid Seismic Zone#14-08-0001-G1534
Arch C. Johnston and Jer-Ming ChiiiMemphis State University
Center for Earthquake Research and InformationMemphis, TN 38152
901-678-2007Robert B. Herrmann
Department of Earth and Atmospheric Sciences Saint Louis University
3507 LacledeSt. Louis, MO 63103
314-658-3131Investigations
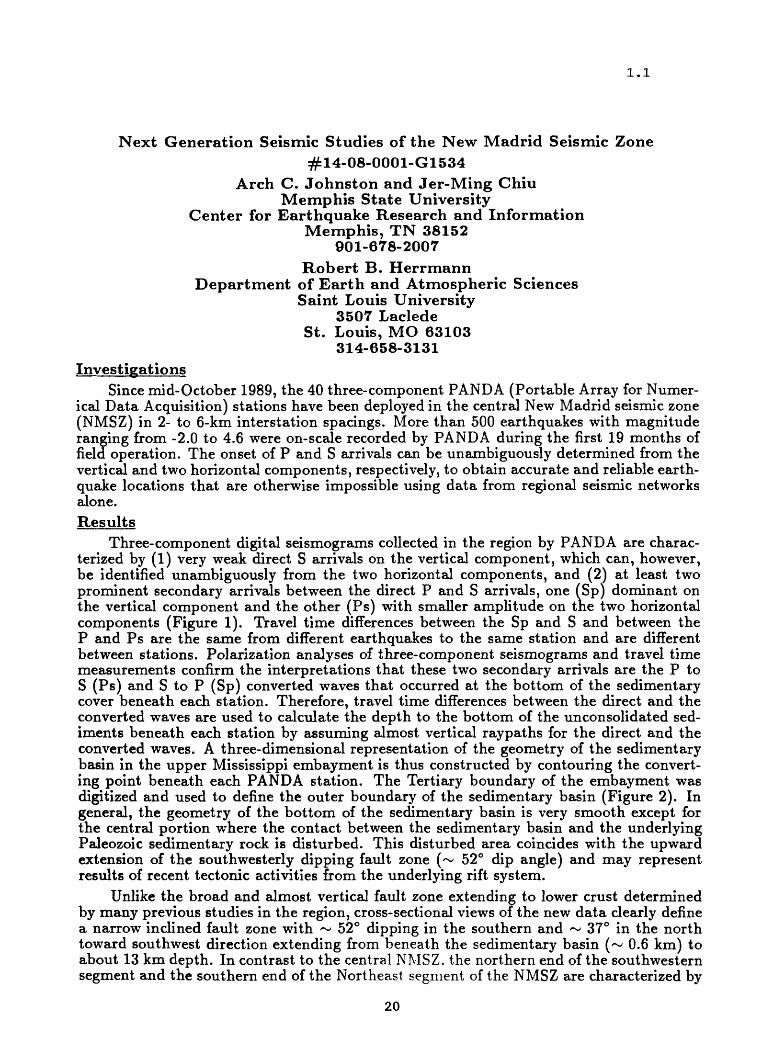
Since mid-October 1989, the 40 three-component PANDA (Portable Array for Numer ical Data Acquisition) stations have been deployed in the central New Madrid seismic zone (NMSZ) in 2- to 6-km interstation spacings. More than 500 earthquakes with magnitude ranging from -2.0 to 4.6 were on-scale recorded by PANDA during the first 19 months of field operation. The onset of P and S arrivals can be unambiguously determined from the vertical and two horizontal components, respectively, to obtain accurate and reliable earth quake locations that are otherwise impossible using data from regional seismic networks alone.Results
Three-component digital seismograms collected in the region by PANDA are charac terized by (1) very weak direct S arrivals on the vertical component, which can, however, be identified unambiguously from the two horizontal components, and (2) at least two prominent secondary arrivals between the direct P and S arrivals, one (Sp) dominant on the vertical component and the other (Ps) with smaller amplitude on tne two horizontal components (Figure 1). Travel time differences between the Sp and S and between the P and Ps are the same from different earthquakes to the same station and are different between stations. Polarization analyses of three-component seismograms and travel time measurements confirm the interpretations that these two secondary arrivals are the P to S (Ps) and S to P (Sp) converted waves that occurred at the bottom of the sedimentary cover beneath each station. Therefore, travel time differences between the direct and the converted waves are used to calculate the depth to the bottom of the unconsolidated sed iments beneath each station by assuming almost vertical raypaths for the direct and the converted waves. A three-dimensional representation of the geometry of the sedimentary basin in the upper Mississippi embayment is thus constructed by contouring the convert ing point beneath each PANDA station. The Tertiary boundary of the embayment was digitized and used to define the outer boundary of the sedimentary basin (Figure 2). In general, the geometry of the bottom of the sedimentary basin is very smooth except for the central portion where the contact between the sedimentary basin and the underlying Paleozoic sedimentary rock is disturbed. This disturbed area coincides with the upward extension of the southwesterly dipping fault zone (~ 52° dip angle) and may represent results of recent tectonic activities from the underlying rift system.
Unlike the broad and almost vertical fault zone extending to lower crust determined by many previous studies in the region, cross-sectional views of the new data clearly define a narrow inclined fault zone with ~ 52° dipping in the southern and ~ 37° in the north toward southwest direction extending from beneath the sedimentary basin (~ 0.6 km) to about 13 km depth. In contrast to the central NMSZ. the northern end of the southwestern segment and the southern end of the Northeast segment of the NMSZ are characterized by
20

1.1
almost vertical fault zone that intersects with the central zone around Ridgely, Tennessee, and around New Madrid, Missouri respectively, where seismicity are the highest in the region. Over the 19 months of PANDA operation, seismicity shows a seasonal pattern that can be correlated with the fluctuation of regional water level. Such correlations may suggest that seasonal variations of regional hydroinduced pressure in the upper crust due to water level changes on the surface may play an important role in the generation of earthquakes in the central NMSZ. Three-dimensional velocity inversions for P and S waves are calculated independently to investigate velocity structures in the upper crust. Preliminary inversion results suggest a P-wave low velocity zone at depth between 2.5 and 5 km which may be associated with clastic sediment filling the graben. Earthquakes were relocated using the new velocity model after inversion. Figure 3 shows several representative cross sectional views of the central NMSZ using data base located by regional network model (regional), Walter Mooney's velocity model (old), and the new velocity model obtained from velocity inversions. The linear fault zone features have been significantly improved when new velocity model is used. The fault zone geometry in the central NMSZ show a very clear correlation and response to the dirction of the pinching northeastern segment NMSZ in the north and the southwestern segment NMSZ in the south.Reports
Bataille, K. and J.M. Chiu, Polarization analysis of high-frequency, three-component seis mic data, Bull. Seiamo. Soc. Am., v. 81, no. 2, 622-643, 1991.
Chen, K.C., J.M. Chiu, Y.T. Yang, S.C. Chiu, A.C. Johnston, and the PANDA Group, Three-dimensional geometry of the sedimentary basin and its tectonic implications in the upper Mississippi embayment: results from the PANDA experiment, EOS, v. 71, no. 17, p. 264, present at the Spring AGU meeting, 1991.
Chiu, J.M., G. Steiner, R. Smalley, and A.C. Johnston, PANDA: a simple, portable seismic array for local- to regional-scale seismic experiments, Bull. Seismo. Soc. Am., v. 81, no. S, 1991.
Chiu, J.M., G. Steiner,R. Smalley, A.C. Johnston, and the PANDA Group, The PANDA II - a PC-based seismic array, presented in the ESSA meeting, Oct., 1990.
Chiu, J.M., A.C. Johnston, and the PANDA Group, The September 26, 1990, Md=4.8, Cape Girardeau Earthquake and its aftershocks, presented in the ESSA meeting, Oct., 1990.
Chiu, J.M., K.C. Chen, Y.T. Yang, S.C. Chiu, A.C. Johnston, and the PANDA Group, A high-resolution PANDA experiment in the central New Madrid seismic zone, EOS, v. 71, no. 43, p. 1435, presented in the Fall AGU meeting, 1990. presented in the ESSA meeting, Oct. 1990.
Chiu, J.M., K.C. Chen, Y.T. Yang, S.C. Chiu, A.C. Johnston, and the PANDA Group, A high-resolution PANDA experiment in the central New Madrid seismic zone, invited talk in the GSA meeting, Oct. 1990.
Chiu, J.M., K.C. Chen, Y.T. Yang, S.C. Chiu, A.C. Johnston, and the PANDA Group, A high-resolution PANDA experiment in the central New Madrid seismic zone, presented in the ESSA meeting, Oct. 1990
Yang, Y.T., J.M. Chiu, Z.S. Liaw, K.C. Chen, S.C. Chiu, A.C. Johnston, and the PANDA Group, Fault zone geometry and crustal velocity structures in the central New Madrid seismic zone using the PANDA data, EOS, v. 71, no. 17, p. 264, present at the Spring AGU meeting, 1991.
21

1.1
(sec)17 10
NS
PS
Ii^tj^^^^M^v^A^^'vV
Figure 1. A typical three-ccmponent digital seismogram recorded by thestation in the New Madrid seismic zone. Cearly direct P, S, and converted Ps and Sp can be identified.
0 (m) 0 -50 50 -100 100-150
__ 150-200 I| 200-250 | | 250-300
300-350350-400 400-450 450-500 500-550550-600 600-650 BELOW 650
Figure 2. A three-dunensional presentation of
join?!station.
22

A-A' INEM MOEU 38.91 -89.69 flittt HIOTMSIONN» 11 11 ttttf. 9999999999*9999
A-A' IW9CT HQKLI 36.3H -89.69 A«:M momiivm «-(T iflCGIOMU 36. 34 -89.69 MliM morraiaw
36.90'
35.80*
8-8* INEM HOOELI 36.10 -89.57 At* MIOTMIIOMH
0 0.
o» '"» 1
i^t. 'p % .
0 ° i.sg°0 00%° % 0
0 & 'SoIfB'B § a °0 °" DO
° B° t 0 °° «o ° O o ^ a i
0 o°° 0° °
0
8-8* INOONET HOOELI 36.10 -89.57 BUM UIOTMHOMH g-8' inECIOMk' 36.10 -89.57 AISM MIOTHIIOKMKM j»l.l»l»»iii»it»»i»i» j» it KK i l i » l t ;«. i»iiiti»iiiiii » H *
- »°- O O O
o
0 rf> 00
0
la PANDA DATA 3b PANDA DATA 3c REGIONAL DATA
Figure 3. Two representative cross-sectional views of the central New Madrid seismic zone, A-A' (top three) in the north and B-B' (bottom three) in the south. Map views of the seismicity determined from the PANDA array and locations of A-A* and B-B* are shown in the left. Data used to construct (3a) and (3b) are PANDA locations (Oct. 1989 - May 1991) determined by a new velocity model obtained from 3-dimensional P and S velocity inversions and by a velocity model determined from seismic reflection/refraction data by Mooney and Andrews (1984) respectively. Data used in (3c) are the regional seismic network data (June 1974 - Dec. 1990). It is clear that data quality has been improved dramatically from (3c) to (3b), and from (3b) to (3a). The fault zone dips about 52* in the B-B 1 section and about 37° in the A-A* section.

1.1
Central Aleutians Islands Seismic Network
Agreement No. 14-08-0001-A0259
Carl Kisslinger, Julie Hill, and Bruce KindelCooperative Institute for Research in Environmental Sciences
Campus Box 216, University of ColoradoBoulder, Colorado 80309
(303)492-6089
Brief Description of Instrumentation and Data Reduction MethodsThe Adak seismic network consists of 13 high-gain, high-frequency, two-component
seismic stations and one six-component station (ADK) located at the Adak Naval Base. Sta tion ADK has been in operation since the mid-1960s; nine of the additional stations were installed in 1974, three in 1975, and one each in 1976 and 1977.
Data from the stations are FM-telemetered to receiving sites near the Naval Base, and are then transferred by cable to the Observatory on the Base. Data were originally recorded by Develocorder on 16 mm film; since 1980 the film recordings are back-up and the primary form of data recording has been on analog magnetic tape. The tapes are mailed to CIRES once a week.
At CIRES, the analog tapes are played back through an analog-to-digital (a-to-d) con verter into a computer at four-times the speed at which they were recorded. This computer then digitizes the data, automatically detects events, demultiplexes each event, and writes them to disk. These events are edited to eliminate spurious triggers, and a tape containing only seismic events is created. All subsequent processing is done from this tape. Times of arrival and wave amplitudes are read from an interactive graphics display terminal. The earthquakes are located using a program originally developed for this project by E. R. Eng- dahl, which has been modified several times since.
Data Annotations
The scheduled maintenance trip for the summer of 1990 was not made, due to medical problems of contract personnel. By October, 1990 most of the stations were down and the events that were recorded could not be located. The decision was made to shut down the net work until the maintenance trip could be made in the spring of 1991. Since then, the U.S.G.S. decided to permanently shut down the network. A final field trip to Adak will be made this summer in order to retrieve all equipment and restore the station sites.
Current Observations
All analog data have now been digitized. Some of the older data (early 1980s) that were archived on to 9-track tapes have been lost because of the natural deterioration of these tapes with age. For this reason, all archived data are now being transferred to Exabyte tapes, which supposedly have a longer shelf life and require significantly less storage space. All 1990 events have been located and the primary emphasis for the remainder of the contract will be on filling in the data gaps that exist because of the work load resulting from the May 1986 earthquake.
The location work for this report includes: (1) 188 earthquakes located for April and May, 1989; (2) 218 earthquakes located for October through December, 1989; (3) 77 earth quakes located for January and February, 1990; and, (4) 239 earthquakes located for June through September, 1990.
24

1.1
The total of events located for all time periods is 722. Fifteen of the 1989 events and ten of the 1990 events, which were located with data from the Adak network, were also large enough to be located teleseismically (U.S.G.S. PDEs). The epicenters of the 1989 and 1990 events are shown in Figures 1 and 2, respectively.
Cross-sections for the 1989 and 1990 data and a catalog of all hypocenters determined for the time period reported are included in our Semi-Annual Data Report to the U.S.G.S. Recent research using these data is reported in the Technical Summary for U.S.G.S. Grant No. G1368.
25

1.1
52 N
51 N
.
, Y.^- ' a. '. f '
O '.
'." °*
'. o
of. 0 ' '.<*
178 W 177 W '176 W O 175 W
LEGEND
a 2.2 ond bcknr
= 2.3 to 3.0
O a 3.1 to 3.9
O = 4.0 to 4.9
O= PDC mognUud*
ADAK SEISMICITY: APRIL-DECEMBER 1989UNIVERSAL TRANSVERSE MERCATOR PROJECTION
720 EVENTS
ALL DEPTHS
15 km
Figure 1: Map of seismicity located for April through December, 1989. Events located for this report include April and May, and October through December, 1989. All epicenters were determined from Adak network data. Events marked with squares are those for which a teleseismic body-wave magnitude has been determined by the U.S.G.S.; all other events are shown by symbols which indicate the duration magnitude determined from Adak network data. The islands mapped (from Tanaga on the west to Great Sitkin on the east) indicate the geographic extent of the Adak seismic network.
26

1.1
52 N
51 N
a t>*°
*
<J'
A*--. - . '. -»... -> . : .*"t'r \»*^ .
a .
178 W 177 W 176 W
LEGEND
175 W
= 2.3 to 3.Oo = 3.1 to 3.9O = 4.0 to 4.9
D = PDE mognilud.
SEISMICITY: JANUARY-SEPTEMBER 1990UNIVERSAL TRANSVERSE MERCATOR PROJECTION
576 EVENTS O
ALL DEPTHS
IS km
Figure 2: Map of seismicity located for January through September, 1990. Events located for this report include January and February, and June through September, 1990. Symbols as in Figure 1.
27

I.I
Alaska Seismic Studies
9930-01162
John C. Lahr, Christopher D. Stephens, Robert A. Page, Kent A. Fogleman
Branch of Seismology U. S. Geological Survey345 Middelfield Road
Menlo Park, California 94025(415) 329-4744
Investigations
1) Cooperated with the Geophysical Institute of the University of Alaska (UAGI) and National Earthquake Information Center (NEIC) in the operation of the Alaska Earthquake Information Center (AEIC) in Fairbanks. Continued collection and analysis of data from the high-gain short-period seismograph network extending across southern Alaska from the volcanic arc west of Cook Inlet to Yakutat Bay, and inland across the Chugach Mountains.
2) Cooperated with the Branch of Igneous and Geothermal Processes, UAGI, and the Alaska Division of Geological and Geophysical Surveys in operating the Alaska Volcano Observatory (AVO) . Under this program, our project monitors the seismicity of the active volcanoes flanking Cook Inlet and operates six- and an ten-station arrays of seismographs near Mt. Spurr and Mt. Redoubt, respectively.
3) Cooperated with the Branch of Engineering Seismology and Geology and the UAGI in operating 15 strong-motion accelerographs in southern Alaska, including 11 between Icy Bay and Cordova in the area of the Yakataga seismic gap.
Results
1) Preliminary hypocenters have been determined by the AEIC for 2049 earthquakes that occurred in southern Alaska during the period July-December 1990. Focal mechanisms for about 250 of these events were determined using initial P-wave polarities. Shallow seismicity (Figure 1) tends to be concentrated in areas that have remained active for at least the last few years. North and west of the Chugach Mountains shallow seismicity occurs within the crust of the North American Plate but appears to be poorly correlated with mapped traces of principal faults. In contrast, most of the shallow seismicity beneath the Chugach Mountains and extending southward into near-offshore areas is in the subducted Pacific plate. Significant aftershock activity is continuing from the 1987/88 Gulf of Alaska sequence of large earthquakes (Lahr and others, 1988), as indicated by the northerly-trending zone of epicenters along longitude 143° W and south of latitude 59° N.
Notable crustal shocks from this time period include:
28

continuing seismicity (M < 2) within a tight cluster beneath Redoubt volcano following the 1989-1990 eruption sequence (Brantley, 1990); a magnitude 4.1 shock on November 22 beneath Cook Inlet north of the Kenai Peninsula (near 61° N, 151° W) where the rate of seismicity has been noticeably elevated for about two years; and a magnitude 5.6 mb (5.2 Ms NEIC) shock on July 11 in southeastern Alaska near Glacier Bay for which a focal mechanism determined from the polarities of initial P-waves indicates almost pure thrust, but the direction of the axis of maximum compressive stress is poorly constrained [R. Horner, personal communication, 1991]. No unusual patterns of seismicity were observed in or around the Yakataga seismic gap, although both the data completeness and the magnitude threshold for detection in this area continue to be affected adversely by unreliable recording.
The .Wadati-Benioff seismic zone (WBZ) within the subducted Pacific plate is clearly expressed by earthquakes located deeper than 30 km depth (Figure 2) . The largest event that occurred during this time period was a magnitude 5.6 (5.3 mb , NEIC) shock on August 13 located 73 km deep beneath Iliamna volcano, where WBZ shocks in the magnitude range 5-6 occur about once a year. A shock of magnitude 5.3 (5.1 mb, NEIC) on December 28 was located 74 km deep in the WBZ near latitude 63° N, longitude 148.6° W. Sixteen other shocks had magnitudes of 4 or larger.
2) The last significant eruption of Redoubt volcano occurred on April 21, 1990, and since then the rate of volcano-tectonic seismicity at the volcano has continued to decline slowly. Nearly all of the recent seismicity is located at depths of 2 to 10 km within a broad (~ 9 km-wide) zone that extends 5 km north from the summit, but most is concentrated beneath the summit.
In July, episodes of vigorous steaming activity began to occur[G. Tytgat, personal communication, 1991] . On Helicorder records,these events appear to have high-frequency (~ 10 Hz) onsetsfollowed by sustained energy near 2 Hz lasting up to about 40minutes. Many of these events appear as weak signals on SSAM(seismic spectral amplitude measurement) records. The rate ofoccurrence and recorded amplitudes of steam events increasedrapidly at the end of August, decreased slowly until late November,increased rapidly again and remained high until late January, 1991,and then gradually declined until at least mid-April.
A distinct change beginning November 4 was noted in the character of SSAM records for seismographs located within 3 km of the dome. For periods ranging from a few hours to more than a day, sustained excitation with energy predominantly in the frequency range 1.3-2.1 Hz was observed. These signals often began and terminated abruptly. Because of similarites to signals generated by the swarms of long-period events that preceded many of the earlier eruptions, the level of concern color code (Brantley, 1990) was raised from yellow to orange on November 5, which prompted resumption of 24-hour monitoring of the volcano. By November 9, it became apparent that a different process, such as the interaction
29

I.I
of ground water with a buried heat source, was causing these signals, and the level of concern color code was lowered to yellow.
3) Microearthquakes that occurred beneath western Prince William Sound were relocated using a velocity model derived from results of the 1988 TACT marine seismic reflection/refraction profiling experiment . Nearly all of the well-constrained hypocenters occur in a 10-to-20 km thick zone below a depth of about 18 km. The upper surface of this seismic zone coincides with a pronounced, regional seismic reflector (Brocher and others, 1991) . Focal mechanisms typically indicate an axis of least compressive stress that dips at a low angle to the west or northwest . The earthquakes are interpreted as defining the shallow, subhorizontal part of the Aleutian Wadati-Benioff zone, and the reflector as marking the overlying megathrust . The megathrust, which slipped on the order of 20 m in 1964 in the second largest earthquake of this century
9.2), is practically aseismic today.
4) Seismic data from Alaska has been inverted to obtain a tomographic image of the velocity structure down to a depth of 200 km. This work (Kissling and Lahr, 1991) used an approximate solution to the full inversion, so results are preliminary. The most striking anomalies occur beneath the Kenai Peninsula - Cook Inlet region, where the subducted Pacific plate appears as a slab of high P-wave velocity (up to +5%) beneath a low velocity (up to - 10%) zone. The Wadatti-Benioff zone (WBZ) seismicity tends to lie within the high-velocity gradient zone between these anomalies, although in some regions the seismicity is located well within the region of low velocity. Further inversion work is planned to verify the relative location of the earthquake zone with respect to the anomalies.
P-wave first-motion data for events within the WBZ were used to determine composite focal mechanisms. The T-axes of these mechanisms tend to remain parallel to the dip of the WBZ as is increases from about 10° to 60°. This pattern is consistent with WBZ earthquakes occurring within a contiguous plate which is sinking due to gravitational forces and acting as a stress guide.
5) No strong-motion recorders were triggered by earthquakes in southern Alaska during the last year.
6) The digital signal co-processing (DSP) board used with the XDETECT online data acquisition system (Tottingham and Lee, 1989) has been upgraded from a 5 MIPS unit to a 25 MFLOP unit. With this modification, the number of data channels for which spectral analysis can be performed in real time has been increased from 32 to 64 while achieving both higher dynamic range and a better signal-to-noise ratio.
A network of pressure sensors will be installed this summer to monitor for explosive eruptions at the Cook Inlet volcanoes. Analog signals will be telemetered to the AVO recording center in Fairbanks via standard FM telemetry channels used for seismic data.
30
I.I
To accomplish this, a new interface was designed to connect the voltage output of the pressure transducer with the telemetry hardware.
References
Brantley, S. R., ed., 1990, The eruption of Redoubt Volcano, Alaska, December 14, 1989 - August 31, 1990, U. S. Geological Survey Circular 1061, 33 p.
Brocher, T. M., M. A. Fisher, C. D. Stephens, M. J. Moses, and E. L. Geist, 1991, Structure and tectonics of the northern Gulf of Alaska, [abs.], Geol. Soc. Amer. Abstr. with Programs , Cordilleran Section, v. 23, n. 2, p. 8.
Kissling, Edi, and Lahr, J.C., 1991, Tomographic image of the Pacific slab under southern Alaska, Eclogae Geol. Helv., (in press) .
Lahr, J. C., R. A. Page, C. D. Stephens, and D. H. Christensen, 1988, Unusual earthquakes in the Gulf of Alaska and fragmentation of the Pacific plate, Geophvs. Res. Let., v. 15, p. 1483-1486.
Tottingham, D. M., and W. H. K. Lee, 1989, User manual for XDETECT, in. Lee, W. H. K., ed., IASPEI Software Library, V. 1: Toolbox for Seismic Data Acquisition, Processing, and Analysis, Seismological Society of America, El Cerrito, CA, p. 89-118.
Reports
Brantley, S. R., ed., 1990, The eruption of Redoubt Volcano, Alaska, December 14, 1989 - August 31, 1990, U. S. Geological Survey Circular 1061, 33 p.
Brocher, T. M., M. A. Fisher, and C. D. Stephens, 1990, TACTOffshore: Results from the 1988 TACT seismic survey in the northern Gulf of Alaska and Prince William Sound [abs.], EOS, Trans. Amer. Geophvs. Union, v. 71, p. 1581.
Brocher, T. M., M. A. Fisher, C. D. Stephens, M. J. Moses, and E. L. Geist, 1991, Structure and tectonics of the northern Gulf of Alaska, [abs.], Geol. Soc. Amer. Abstr. with Programs/ Cordilleran Section, v. 23, n. 2, p. 8.
Chouet, B. A., R. A. Page, J. N. Davies, and J. A. Power, 1991,Forecasting eruptions as Redoubt volcano, Alaska [abs.], Seismol. Res. Let., v. 62, p. 25.
Chouet, B. A., R. A. Page, J. N. Davies, J. A. Power, J. C. Lahr, D. H. Harlow, and C. D. Stephens, 1990, Forecasting the December 14, 1989 and January 2, 1990 eruptions at Redoubt volcano, Alaska [abs.], EOS, Trans. Amer. Geophvs. Union, v. 71, p. 1701.
31

I.I
Harlow, D. H., J. A. Power, B. A. Chouet, J. C. Lahr, and R. A. Page, 1990, Earthquake families and their implications for the eruption dynamics of Redoubt volcano, Alaska; December 13, 1989 to January 3, 1990 [abs.], EOS, Trans. Amer. Geophys. Union, v. 71, p. 1701.
Kissling, Edi, and Lahr, J.C., 1991, Tomographic image of the Pacific slab under southern Alaska, Eclogae Geol. Helv., (in press) .
Lahr, J. C., J. A. Power, D. H. Harlow, and R. A. Page, 1990, Spatial and temporal distribution of seismicity associated with the recent eruptions of Redoubt volcano, Alaska [abs.], EOS, Trans. Amer. Geophys. Union, v. 71, p. 1709.
March, G. D., J. A. Power, D. H. Harlow, and J. C. Lahr, 1990, Acquisition, processing, storage, and display of seismic data during the 1989-1990 eruption of Redoubt volcano, Alaska [abs.], EOS, Trans. Amer. Geophvs. Union, v. 71, p. 1709.
Page, R. A., C. D. Stephens, K. A. Fogleman, T. M. Brocher, M. A. Fisher, and G. S. Fuis, 1991, Seismicity and current tectonics of south-central Alaska [abs.], Geol. Soc. Amer. Abstr. with Programs, Cordilleran Section, v. 23, n. 2, p. 86.
Power, John, J. N. Davies, R. A. Page, J. C. Lahr, D. H. Harlow, B. A. Chouet, G. D. March, and T. L. Murray, 1990, Seismic evolution of the 1989-1990 eruption of Redoubt volcano, Alaska [abs.], EOS, Trans. Amer. Geophvs. Union, v. 71, p. 1700.
Rogers, J. A., and C. D. Stephens, 1991, SSAM: A PC-basedrealtime seismic spectral amplitude measurement system for volcano monitoring [abs.], Seismol. Res. Let., v. 62, p. 22.
Stephens, C. D., J. N. Marso, J. C. Lahr, and J. A. Rogers, 1990, Realtime seismic spectral amplitude monitoring during the 1989-1990 eruptions of Redoubt volcano, Alaska [abs.], EOS, Trans. Amer. Geophvs. Union, v. 71, p. 1709.
32

u>
SOUTHERN ALASKA SEISMICITY, JULY - DECEMBER 1990 DEPTHS 30 KM AND SHALLOWER, 874 EVENTS '
65'
64
63
62
61
57'
156 ' 138> 137' 136 . 135*
Figure 1. Epicenters of 874 shallow earthquake'iT'tnat occurred^between July and December 1990, Magnitudes arefrom amplitudes of seismic signals; the magnitude threshold for completeness varies across the network, Contour with alternating long and short dashes outlines inferred extent of Yakataga seismic gap. Neogene and younger faults (George Plafker, personal communication, 1988) are shown as solid lines. A - Anchorage, CI - Cook Inlet, GB - Glacier Bay, IV - Iliamna volcano, PWS - Prince William Sound, RV - Redoubt volcano.

SOUTHERN ALASKA SEISMICITY, JULY - DECEMBER 1990 DEPTHS BELOW 30 KM, 1125. EVENTS
65
64
63
62
61
57'
156'155 ....
'"' 1S2< «1' ISO- ,49- 148- 147- 146- 14S- 144- 143- 142- 141- >« 138!« 1M
Figure 2. Epicenters of 1125 shocks deeper than 30 km that occurred between July and December 1990. The depths of earthquakes north of 64.5 degrees N are suspect. See Figure 1 for details about magnitudes and identification of map features.

I.I
Northern and Central California Seismic Network Processing
9930-01160
Fredrick W. LesterBranch of Seismology
U.S. Geological Survey345 Middlefield, MS 977Menlo Park, CA 94025
(415) 329-4747
Investigations
1. In 1966 a seismographic network was established by the USGS to monitor earthquakes in central California. In the following years the network was expanded to monitor earthquakes in most of northern and central California, particularly along the San Andreas Fault, from the Oregon border to Santa Maria. In its present configuration there are over 500 single and multiple component stations in the network. The primary responsibility of this project is to monitor, process, analyze, and publish data recorded from this network.
2. This project continues to maintain the primary seismic data base for the years 1969 to the present on both computers and magnetic tapes for those interested in doing research using the network data. As soon as older data are complete and final the preliminary data base is updated with the final phases and locations.
3. Recently video has become increasingly useful in documenting research activities being con ducted by the USGS, especially activities related to the Parkfield Prediction Experiment. In addition, computer animation of geophysical data sets have allowed researchers to study the data in time series and in 3-dimensions. The two technologies work well in communicating the research being done here to a wide audience that includes other geoscientists as well as untrained but interested laymen who are able to understand the material when it is presented in a visually appealing way.
4. As time permits some research projects are underway on some of the more interesting or unusual events or sequences of earthquakes that have occurred within the network.
Results
1. Figure 1 illustrates 9709 earthquakes located in northern and central California and vicinity during the time period October 1990 through March 1991. That level of activity is normal for a six month time period. The largest earthquake located for the month occurred on October 23 near Mono Lake along the eastern border of California. That earthquake had a magnitude of 5.7 and was followed by 140 aftershocks through March 1991. More than 50 of those were recorded in the first 24 hours, with the largest, a M4.1 shock, occurring approximately 4 minutes after the mainshock.
Seismic data recorded by the network are being processed using the CUSP (Caltech USGS Seismic Processing) system. CUSP was designed by Carl Johnson in the early 1980's and has since undergone some revisions for the Menlo Park operation. On September 1, 1989 we began using revised CUSP software in a generic format This new format makes CUSP more universally acceptable to groups that are using or plan to use it in the future because the
35
I.I
commands are relatively non-specific to any particular group operation.
In late October 1990 we began using new software and hardware to process the earthquake data. At that time we converted from very old DEC PDF 11/44 computers and Tektronics 4014 terminals to newer and much faster DEC VAXstation 3100 computers. The new works tations now perform all of the functions of the older computers and terminals, and more, including automatic event detection and preliminary processing, and final manual processing. The new program used for final manual processing of the data is called TIMIT. This new program incorporates the old processing program QED, plus includes many new features which make processing much smoother, faster, and more efficient
This year we plan to begin publishing, probably on a monthly basis, a preliminary catalog of earthquakes for northern and central California. The format is not yet established but it will probably be some type of listing of events accompanied by a text explaining the processing and what is in the catalog, and a map showing the epicenters. The catalog will be approxi mately complete at the magnitude 1.5 in the central core of the network and something approaching M2.0 in the more remote portions of the net. The final data will be published in an annual catalog after year's end. Steve Walter has begun work on publishing catalogs for the years prior to 1991.
2. The current catalog is relatively complete and correct through February 1991. The data from March are somewhat incomplete and some errors still remain to be identified and corrected. Also, quarry blasts need to be identified for January through March.
3. New hardware was purchased for the new Geologic Division video editing room by Steve Walter. He is currently setting up the new facility which will greatly enhance our ability to produce high quality videos.
4. Steve Walter continues to investigate the seismicity in the Medicine Lake region. He is co author of paper in press that describes the historical seismicity and crustal deformation in that region. Also, Steve presented and definitive paper describing 10 years of seismicity in the region around Mount Lassen, Mount Shasta, and Medicine Lake at the Spring SSA-GSA joint conference in San Francisco.
Nan Macgregor and Dave Oppenheimer presented at paper at the Spring SSA-GSA conference that assessed the potential for earthquakes in the east San Francisco Bay region.
Reports
Dzurisin, D., Donnelly-Nolan, J., Evans, J.R., and Walter, S.R., (in press), Crustal sub sidence, seismicity, and structure near Medicine Lake, California, Journal of Geophysical Research, 43p.
Oppenheimer, D. H., and Macgregor-Scott, N.G., 1991, Seismic potential of the east San Francisco Bay region of California, Seismological Research Letters 62, p 13.
Walter, S.R., 1991, Ten years of earthquakes at Lassen Peak, Mount Shasta and Medicine Lake volcanoes, northern California: 1981 - 1990 (abstract), Seismological Letters 62, p 25.
36

I.I
42
41
lM"lTi|Trr|lMrflT|lf*fl|lMMlMMi
FIGURE 1. Seismicity for northern and central California
and vicinity during October 1990 - March 1991
37
1.1
Western Great Basin - Eastern Sierra Nevada Seismic NetworTc
Cooperative Agreement 14-08-0001-AOO 1 October 1990 - 31 March 1991
W.A. Peppin and D.M. dePoloSeismological LaboratoryUniversity of Nevada
Reno, NV 89557(702) 784-4315
Investigation
This contract supported continued operation of a seismic network in the western Great Basin of Nevada and eastern California, with the purpose of recording and locating earthquakes occurring in the western Great Basin, and acquiring a data base of phase times and analog and digital seismograms from these earthquakes. Research using the data base was performed under USGS contracts 14-08-0001-G1524 and 14-08-0001-A0618 and is reported elsewhere in this volume.
Results
During the time period 1 October 1990 to 31 March 1991 2,601 earthquakes were registered by the University of Nevada within the University of Nevada seismic network, which monitors the eastern Sierra Nevada - Western Great Basin area with special emphasis on the Mammoth Lakes/Long Valley caldera region (Figure 1). Of the 2601 events located during this six month period, 45 were magnitude 3 and greater and three exceeded 4 in magnitude, the 24 October 1990 Lee Vining-Mono Lake earthquake (Me 5.0), the 5 November 1990 (Me 4.0) Lee Vining-Mono Lake aftershock and the 2 January 1991 Carson City event (Me 4.6). Figures !_ and 2^ show a map of these events. Three significant swarms occurred during this period, the Lee Vining-Mono Lake sequence, the Carson City sequence and a burst of activity in the Long Valley caldera near the southwest flank of the resurgent dome. Although seismicity has been intense in the caldera, this statistic is misleading because of the very dense station coverage near this area.
Seismicity in the vicinity of the caldera is shown in Figure ^2, and is dominated by five groups of events, numbered 1 through 5 in this figure. ^ is the Lee Vining-Mono Lake swarm of earthquakes, 2^ continuing south-moat activity which had a significant increase in late March 1991. Because of the reactivation of uplift (Dec 1989) and the close proximity of the swarm to the town of Mammoth Lakes, this activity commands special attention and warrants careful monitoring. _3 is the seismicity in the mountain block south of the caldera, which appears to be the most consistent and steady source of earthquakes in this region. 4^ are continuing aftershocks of the the November 1984 Round Valley earthquake, and 5^ are
38
continuing aftershocks of the 1986 Chalfant Valley sequence.
Catalogs covering the seismicity are shortly to be published for the time period up to 31 December 1989. The previous network computer system, consisting of a PDPll/70 and a PDPll/34 was replaced by the Microvax/CUSP system on 7 November 1989. The completion of a bulletin through 1989 will put, in a single place, all of the information taken from the PDPll/70 system. Every effort has been made to maintain consistent procedures in making the transfer to the CUSP system, so that the completeness of the catalog, the computation of magnitudes, and the location procedures will be comparable. However, researchers should note that some inconsistency is bound to creep in, so use caution. Before 7 November 1989 all of the catalog locations were obtained from the PDPll/70 system; after 1 January 1990 all come from the CUSP system; for the two months November and December 1989 the catalog contains a mix of events. Because of considerable computer down time in December 1989, quite a bit of data was lost. We are now working on merging data with the USGS CUSP system in Menlo Park to recover this lost data, and plan to include this in our bulletin as well.
With the onset of the CUSP system, the network data stream now includes calibrated digital waveforms from nine wideband (0.05 to 20 Hz) three-component digital stations located around this region (Figure 1) . Therefore, the MEM/GRM file pairs after 7 November 19§9 also contain this information together with the uncalibrated vertical waveforms used for earthquake timing. Also operating on the Microvax system is an Exabyte data logger, which continuously records the incoming digital data on tape, and is being kept as an ongoing data library, providing access to data for distant teleseisms and large events. Calibration pulses for the digital stations (not complete at this writing) are found on the UNR Microvax system in ROOT$DUAO:[CALPULSES]. The UNR computer can be reached either by 1200-baud remote modem (numbers 702-784-1592 or 702-784-4270): please call Bill Peppin at 702-784-4975 for information how to log onto the computer (KERMIT is available). The microvax cluster can also be accessed through the TELNET address 134.197.33.248 and supports TCP/IP communications through the FTP file transfer package from Multinet.
39

1.1
Nevada Western Great Basin Seismicity 1 October 1990 through 31 March 1991
120
L-TAHOE
+ 36
0r
100 Km
D D Q]
2345 40
Magnitude Figure 1

1.1
Mammoth - White Mountains Seismicity 1 October 1990 - 31 March 1991
119.4 119.2 119.0 118.8 118.6 118.4 118.2 118-0
38.2
38.0
37.8
37.6
37.4
* -
38.2
38.0
37.8
37.6
37.4
37.2 37.2
37.0*
37.0
36.8 36.8
119.4 119.2 119.0 118.8 118.6 118.4 118.2 118.0
a
23
25 KmFigure 2
4 5

1.1
Shallow Seismic Reflection Surveys in the New Madrid Seismic Zone
14-08-0001-G1925 9950-1896
Eugene S. Schweig, IIILisa R. Kanter
Center for Earthquake Research and InformationMemphis State University
Memphis, TN 38152(901) 678-2007
Eugene A. LuziettiKaye Shedlock
Branch of Geologic Risk AssessmentU.S. Geological Survey, Box 25046, MS 966
Denver, CO 80225(303) 236-1621
Objectives:
Although the New Madrid seismic zone (NMSZ) is the most active seismic zone east of the Rocky Mountains, it has little surface expression. Surface faulting from the great 1811-12 earthquake sequence has not been unambiguously identified, and the presence of additional faults with Holocene activity is uncertain. Our ob jective is to examine several intriguing and potentially seismogenic tectonic features in the vicinity of the NMSZ using high-resolution seismic reflection data to deter mine the role that faulting has played in their origin and the age and amount of displacement on the faults. This project is a collaboration of the authors named above at Memphis State University and the U.S.G.S and Roy VanArsdale at the University of Arkansas. This report describes results for the Bootheel lineament of Missouri and Arkansas and the Crittenden County fault zone of Arkansas. Another part of the project, a study of Crowley's Ridge, Arkansas, is described in the report by VanArsdale in this volume.
Results to date:
During the summer of 1990 we acquired 27 km of shallow, high-resolution Mini-Sosie reflection data, which were processed at the U.S.G.S. For each line we collected one second of two-way travel time, corresponding to approximately the upper 1.2 km of the crust. Data quality was generally high. We were able to image reflectors between depths of about 50 m and 800 m.
42

1.1
We collected eight seismic reflection profiles, totalling 11.5 km in length, across the Bootheel lineament, which has been proposed as a possible surface rupture of the 1811-12 earthquake sequence. The Bootheel lineament is associated with 1811- 12 liquefaction and fissuring and is the site of topographic anomalies. We wanted to find out whether it is also the site of subsurface faulting. Five profiles were collected across the main trace of the lineament and three profiles were collected over a paral lel, less-distinct trace about 4 km to the west.
Regional focal mechanisms suggest that dextral offset would be expected on the Bootheel lineament. Gentle folding with wavelengths of about 800 m and ampli tudes of 10 m to 25 m is evident on nearly every profile, generally coinciding with the surface traces of the lineament. The profiles identify some zones of deformation that had not been traced on the surface. Zones of disruption, in which reflectors dis appear, underlie several lineament traces. The overall picture is of a complex zone of deformation consisting of multiple flower structures and fractured rock, with de formation at least as young as the base of the Quaternary (Figure 1). We will acquire additional lines during 1991 to further resolve the geometry and age of these fea tures.
The subsurface Crittenden County fault is known from borehole data in Crit- tenden County, Arkansas, where it displaces Cretaceous and Paleozoic rocks and lo cally preserves Devonian section beneath the Cretaceous unconformity. On propri etary petroleum industry seismic lines, the fault appears as a northwest-dipping re verse fault with splays, displacing the top of Paleozoic and top of Cretaceous reflec tors. This structure lies only 30 km from the Memphis, Tennessee area, thus infor mation on its nature and age are critical to seismic risk assessment.
We ran nine Mini-Sosie profiles, eight of which crossed the Crittenden County fault. By combining well logs from local boreholes with log and lithologic descrip tions from adjacent counties, we were able to confidently identify several of the re gional reflectors on our profiles. At the level of the Cretaceous reflector, the Crit tenden County fault appears as a northeast-trending fault zone several hundred me ters wide; within the Paleocene and Eocene section, the structure is a down-to-the- southeast monoclinal flexure, with minor faulting in places (Figure 2). We there fore propose the term Crittenden County fault zone for this feature. The amount of relief across the flexure increases to the southwest, reaching approximately 80 m in the Paleocene Fort Pillow Sand on line BS-1. The profiles indicate that most of the stratigraphic thinning over the flexure occurred during and after deposition of the Eocene Memphis Sand. Although it is not always clearly imaged, the Tertiary-Qua ternary boundary reflector shows arching and disruption over the Crittenden County fault zone, suggesting very young activity on the zone. We plan to further delineate the extent, magnitude, and age of most recent activity of this zone in fu ture work.
43

1.1
Reports:
Luzietti, E.A., Shedlock, K.M., King, K.W., Schweig, E.S., III, Kanter, L.R., and Van Arsdale, R.B., 1990, A seismic reflection survey of the Crittenden County fault, northeast Arkansas: EOS, Transactions, American Geophysical Union, v. 71, p. 1435.
Schweig, E.S., III, Kanter, L.R., Shen, F., Li, Y., VanArsdale, R.B., Shedlock, K.M.,Luzietti, E.A., and King, K.W., 1990, A seismic reflection survey of the Bootheel lineament in Missouri: EOS, Transactions, American Geophysical Union, v. 71, p. 1436.
Schweig, E.S., III, Kanter, L.R., VanArsdale, R.B., Luzietti, E.A., and Shedlock, K.M., 1991, Shallow seismic reflection surveys in the New Madrid seismic zone: EOS, Transactions, American Geophysical Union, v. 91, supplement to no. 17, p. 264.
Figure 1. Profile BS-6 across the Bootheel lineament in southeastern Missouri.
44

1.1
ro ru rog si §
MIGRRTION STRCK, BS-1LO U> UJ LO
1
Figure 2. Profile BS-1 across the Crittenden County fault zone, Arkansas. K = top of the Cretaceous section; Ppc = top of the Porters Creek Clay; Pfp = top of the Fort Pillow Sand; Efi = top of the Flour Island Formation; Ems = top of the Memphis Sand; Q/T = Quaternary-Tertiary boundary.
45

1.1
Regional Microearthquake Network in the Central Mississippi Valley
14-08-0001-A0619
William V. Stauder and Robert B. HerrmannDepartment of Earth and Atmospheric Sciences
Saint Louis University3507 Laclede Ave.
St. Louis, MO 63103(314) 658-3131
InvestigationsThe purpose of the network is to monitor seismic activity in the Central
Mississippi Valley Seismic zone, in which the large 1811-1812 New Madrid earthquakes occurred. The following section gives a summary of network observations during the last six months of the year 1990, as reported in Net work Quarterly Bulletins No. 65 and 66.
ResultsIn the last six months of 1990, 112 earthquakes were located by the 40
station regional telemetered microearthquake network operated by Saint Louis University for the U.S. Geological Survey and the Nuclear Regulatory Commission. Figure 1 shows 112 earthquakes located within a 4° x 5° region centered on 36.5°N and 89.5°W. The magnitudes are indicated by the size of the open symbols. Figure 2 shows the locations and magnitudes of 90 earth quakes located within a 1.5° x 1.5° region centered at 36.25°N and 89.75°W.
In the last six months of 1990, 44 teleseisms were recorded by the PDF 11/34 microcomputer. Epicentral coordinates were determined by assuming a plane wave front propagating across the network and using travel-time curves to determine back azimuth and slowness, and by assuming a focal depth of 15 kilometers using spherical geometry. Arrival time information for teleseismic P and PKP phases has been published in the quarterly earthquake bulletin.
The significant earthquakes occurring in the last six months of 1990 include the following:
August 7 (0505 UTC). New Madrid, Missouri Region. mbLg 3.0 (SLM). Felt (IV) at Wyatt, Missouri and (IE) at Wolf Island, Missouri.
August 29 (1934 UTC). Tennessee. mbLg 3.5 (NEIS), 3.4 (TUL). Felt (V) at Ripley; (IV) at Burlison, Henderson and Henning; (III) at Covington, Gates and Munford, Tennessee. Also felt (IV) at Blytheville and Tomato; (III) at Armorel, Manila and Osceola, Arkansas.September 26 (1318 UTC). Cape Girardeau, Missouri Region. mbLg 5.0 (TUL), 4.8 (BLA). MD 4.7 (SLM). Slight damage in the Cape Girardeau area and in southern Illinois. Felt (V) in many areas of southern Missouri, southern
46

1.1
Illinois, and western Kentucky. Also felt in Indiana, Arkansas, Tennessee and at Cincinnati, Ohio.
September 27 (0147 UTC). Cape Girardeau, Missouri Region. mbLg 3.0 (NEIS), 3.2 (TUL). MD 3.3 (SLM). Felt (IV) at Benton and Scott City; (III) at Allenville, Dutchtown and Oran; (II) at Cape Girardeau. Felt (III) at Thebes, Dlinois. Also felt at Paducah, Kentucky.
October 24 (0820 UTC). Southern Illinois. mbLg 3.5 (NEIS), 3.2 (TUL). MD 3.4 (SLM). Felt (IV) at Bluford, Dix, Richview, Tamaroo and Woodlawn; (HI) at Centralia, Dahlgren, Irvington, Johnsonville, Kell, McLeansboro, Murphys- boro, Radom and Vernon.
October 30 (0655 UTC). Cape Girardeau, Missouri region. mbLg 2.3 (NEIS). Felt at New Hamburg and in the Cape Girardeau area.
November 09 (0339 UTC). New Madrid, Missouri region. MD 3.4 (SLM). mbLg 3.6 (NEIS). Felt (V) at Conran and Dexter; (IV) at Baderville, Catron, Lilbourn, New Madrid and Portageville; (HI) at Canalou, Jackson, Kewanee, Matthews, Parma and Risco. Felt (IV) at Tiptonville and Wynnburg, Tennes see. Also felt at Paducah, Kentucky.
November 21 (1607 UTC). New Madrid, Missouri region. MD 2.7 (SLM). Felt (III) at Ridgely, Tiptonville and Wynnburg, Tennessee; (II) at Finley and Mason Hall, Tennessee.
December 17 (0524 UTC). Illinois. MD 3.2 (SLM). Felt (IV) at Crawfords- ville, Lafayette and Waynetown, Indiana. Felt (III) at Bainbridge, Battle Ground, Darlington, Kentland, Ladoga, Logansport, Mulberry, New Market, New Ross, Radnor, Roachdale and Veedersburg, Indiana. Also felt (HI) at Danville, Illinois.
December 20 (1404 UTC). Indiana. mbLg 3.6 (BLA). Felt (V) at Bainbridge, Danville, Greencastle, Putnamville, Quincy and Roachdale. Felt (TV) at Amo, Clayton, Cloverdale, Coatesville, Eminence, Fillmore, Martinsville, Monrovia, Nashville, Reelsville, Russellville and Stilesville.
The September 26, 1990 New Hamburg, Missouri earthquake was the third largest event in the central Mississippi Valley during the last 16.5 years. A report summarizing the focal mechanism and aftershock monitoring of this event can be found as an appendix to CMVSN Bulletin #65 (Taylor and Wuenscher, 1990).
A composite focal mechanism for the mainshock and principal aftershock was calculated from forty-four P-wave first motions. A modified version of FOCMEC (Snoke et aL, 1984) was used to search for all consistent mechanisms. 585 solutions met the search requirements of having three or fewer incon sistencies. The distribution of solutions is shown in Figure 3.
As one can see in Figure 3, the distribution of T-axes is bimodal and one average mechanism will not be representative of all solutions. Of the 585 solutions, 471 (80.5 percent) have T-axes clustered to the northwest, while the
47

1.1
other 114 (19.5 percent) have T-axes clustered to the southeast. Therefore, the entire population was split and two average mechanisms were calculated. For the 80.5 percent, Mech "A" is the average solution. This mechanism has NP1: strike = 14.2°, dip = 78.2°, slip = 161.2°, NP2: strike = 108.2°, dip = 71.6°, slip = 12.5°; T-axis: trend = 330°, plunge = 21°, P-axis: trend = 62°, plunge = 4°. The ©95 (polar equivalent of two standard deviations) are 20 and 22 degrees for the P- and T-axes respectively. For the remaining 19.5 per cent, Mech "B" is the average solution and has NP1: strike = 198.0°, dip = 74.9°, slip = 158.9°, NP2: strike = 293.8°, dip = 69.6°, slip = 16.1°; T-axis: trend = 155°, plunge = 25°, P-axis: trend = 246°, plunge = 4°. The © are 14 and 15 degrees for the P- and T-axes respectively. Both of these mechanisms are shown in Figure 3.
References
Snoke, J.A., J.W. Munsey, A.G. Teague and G.A. Bollinger (1984). FOCMEC A program for focal mechanism determination by combined use of polarity and SV-P amplitude ratio data (Abstract), Earthquake Notes 55, No. 3.
Taylor, K.B. and M.E. Wuenscher (1990). Appendix Special Investigations of Seismic Activty The Ripley, Tenn. Earthquake of 29 Aug. 1990 and The New Hamburg, Missouri Earthquake of 26 Sept. 1990, in Stauder, W., R. Herrmann, M. Wuenscher, K. Taylor, S. Michell and M. Whit- tington (1990). Central Mississippi Valley Earthquake Bulletin Quarterly bulletin No. 65 - Third Quarter 1990, St. Louis University, St. Louis, MO.
48

-91.5 90.5 -89.5 -88.5
FIGURE 1CUMULATIVE EVENTS 01 JUL 1990 TO 31 DEC 1990
LEGEND: ^ STATION o EPICENTER
36.0
35.0
0-87.5
49
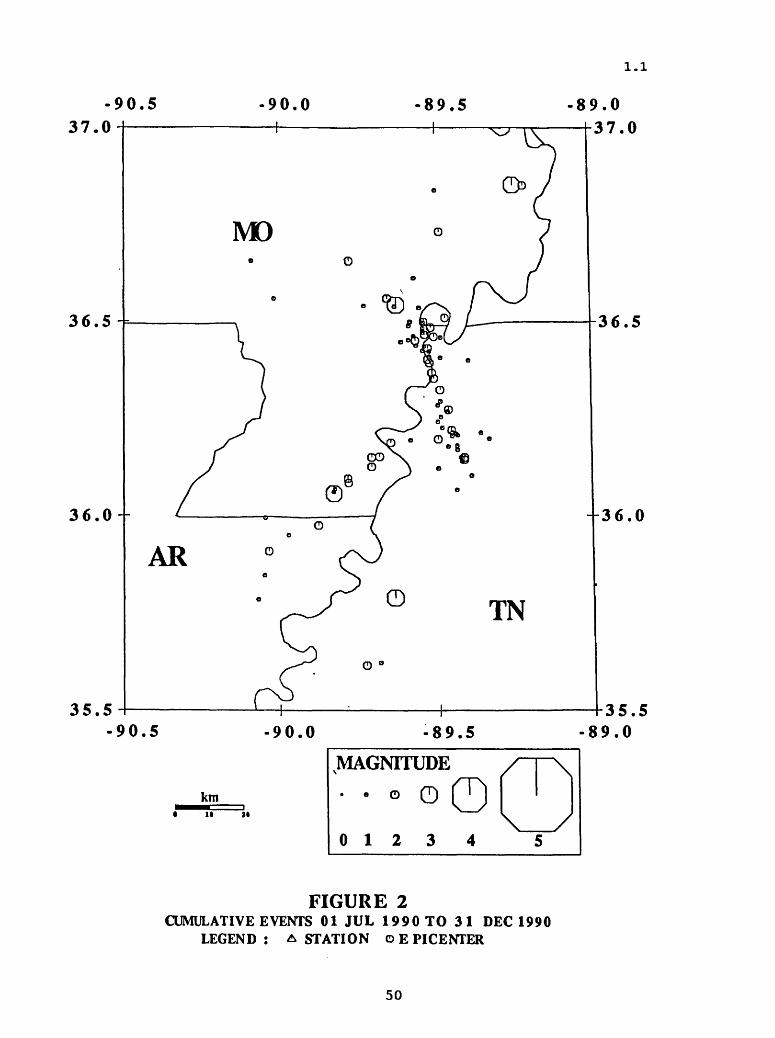
1.1
36.0-
35.5-90.5
km
90.0 89.5
1* 21
MAGNITUDE
e O
0123
36.0
35.5-89.0
FIGURE 2CUMULATIVE EVENTS 01 JUL 1990 TO 31 DEC 1990
LEGEND: A STATION o E PICENTER
50

1.1
Pressure and tension axes for all acceptable solutions having three or fewer inconsistencies. The distribution of "P" and "T" axes shows there are two possible average solutions. There are 585 solutions in the figure.
New Hamburg, Missouri main shock and aftershock composite focal mechanisms with pressure and tension axes shown by "P" and "T'. Compressional first motions are shown by circles, dilatations by tri angles. Mech "A" and Mech "B" are two alternative solutions based upon the bimodal distribution of solutions in the figure above.
FIGURES51

I.I
Consolidated Digital Recording and Analysis
9930-03412
Sam Stewart Branch of Seismology
U. S. Geological Survey 345 Middlefield Road Mail Stop 977
Menlo Park, California 94025
Investigations.
The "Consolidated Recording and Analysis" project has as its primary goal the design, development and support of computer-based systems for processing earthquake data recorded by large, telemetered seismic networks. This includes (1) realtime systems capable of monitoring up to 1000 stations and detecting and saving waveforms from earthquakes registering just slightly above background noise level to very large ones, (2) near-realtime and offline systems to analyze, catalog and archive the detected waveforms, (3) support and documentation for the users of the system.
Hardware for these systems is based upon Digital Equipment Corporation (DEC) VAX series of micro-computers. Currently, this includes the VAX 750, microVAX II, and VAXstations 2000, 3100 and 3200.
Software is based upon the DEC/VMS operating system, the CUSP database system, and the GKS graphics system. VMS is a major operating system, well documented and developed, and has a rich variety of system services that facilitate our own system development. CUSP is a state-driven data base system designed for systematically processing large numbers of earthquakes recorded by large local seismic networks. It was developed by Carl Johnson of the USGS. GKS is an international-standard graphics analysis package that provides interactive input facilities as well as graphical output to a workstation. We use the DEC implementation of GKS.
The main goal for the last year has been to complete development of the "Generic" version of CUSP. This is a more modular, more generalized, more integrated version of CUSP than the one we have used since 1984. The Generic CUSP consists of a realtime earthquake event detection and processing module, the earthquake (offline) processing module (QED, Quake EDitor) a new interactive graphics module known as "TIMIT", a new interactive station display program known as "STNMAP", and extensive online documentation in the form of "help" files. Generic CUSP retains the use of the Tektronix 4014 graphics terminals with the high-speed graphics interface, and adds the ability to use the DEC VaxStation series of workstations for interactive graphic analysis of earthquakes.
Results.
1. Since 1984 the CALNET network processiny project (see Project 9930-01160, Rick Lester, this volume) has used CUSP system software developed in tJ^e early 1980's to process waveform data from earthquakes occurring primarily within the network. The hardware consisted of two DEC PDP 11/44 computer systems, and two Tektronix 4014 graphics terminals. Magnetic tape operations were required at several steps in the
52
I.I
processing.During October 1990 the CALNET project completed the
transition from the 11/44 CUSP system to a 'Generic' CUSP system built around DEC VAXstation 3200, 3100 and 2000 hardware and the VAX/VMS operating system. The hardware/software systems are integrated into an earthquake processing environment by using DEC Local Area VaxCluster (LAVC) software and appropriate networking hardware.
2. A program to convert CUSP digitized seismogram files into the Lament AH format with the SUN XDR (External Data Representation) format was written and is now in routine use. This is a very significant improvement in the ability to convert CUSP data and digitized waveforms to a format immediately usable in a non-CUSP environment.
3. A program to convert CUSP digitized seismogram files into the SEG-Y format was written and is now available.
4. The RTP-to-CUSP software was re-written and is being tested. The main change was to replace DCL command routines with the equivalent Fortran programs. The net result is less demand on the CPU, more efficient error-handling, and more efficient maintenance and modification of the software.
5. We continue to provide hardware and software support for the two Parkfield seismic networks (Varian and Haliburton). We also provide CUSP software support for INEL (Idaho National Engineering Laboratories), CUSP software and operating system support for UNR (University of Nevada at Reno), and CUSP software support for the Caltech/USGS Cooperative Seismic Network in Pasadena.
6. We continued responsibility for providing general VAX/VMS computing services to the Branch of Seismology in Menlo Park.
Reports:
None.
53

1.1
Earthquake Hazard Research in the Greater Los Angeles Basin and ItsOffshore Area
#14-08-0001-A0620 Ta-liang Teng and Thomas L. Henyey
Center of Earth SciencesUniversity of Southern California
Los Angeles, CA 90089-0740(213)740-5838
INVESTIGATION
Monitor earthquake activity in the Los Angeles Basin and the adjacent offshore area. Upgrade instrumentation by installing large dynamic telemetry systems and deploying downhole seismometers. Carry out waveform analysis for crustal anisotropy and stress field determination. Investigate the reflected and converted phases to delineate the Los Angeles basin-basement contact.
RESULTS
During 1990, a total of 690 earthquakes were located in the Los Angeles basin and its offshore area. The February 28, 1990 Upland sequence with a M=5.5 main shock accounts for more than half of the events recorded in 1990. In the meantime, Santa Monica bay, the Newport-Inglewood fault, and the Whittier fault and its NW extension have been seismically active. Figure 1 shows the 1990 seismicity in the greater Los Angeles basin. About 95% of the reported 1990 events have magnitudes less than ML = 3.0. A total of 36 events have ML > 3.0. The number of earthquakes per day in the Los Angeles basin during 1990 is shown in Figure 2. The large peak beginning on February 28 corresponds to the Upland earthquake sequence. The detection threshold and location precision are being improved constantly. Figure 3 gives the capability of the Los Angeles Basin Seismic Network's (LABNET) current resolutions on epicenter and focal depth.
The continued increase in the number of recorded earthquakes can be explained in part by the improvement of the seismic network coverage that allows lowering of the detection threshold with more precise locations. But an overall increase of seismic activity in the Greater Los Angeles area has been recognized in the recent past. The October 17,1987 Whittier Narrows earthquake (ML = 5.9) was followed by a very long aftershock sequence with a large number of events that lasted well into 1988; this activity has not died out completely, even in 1990. Meanwhile, the first Upland sequence occurred on June 26,1988 with a main shock ML = 4.6. A large swarm occurred in Santa Monica bay on January 19, 1989, some 25 km off the coast south of Malibu, with main shock ML = 5.0; this activity is still on-going during 1990. During this reporting period, an even larger swarm, the second Upland sequence, occurred on February 28,1990 with main shock ML = 5.5. This second Upland sequence was very strong; it consisted of at least three large aftershocks in the range of ML = 4.6-4.7 and the aftershocks accounted for more than half of the recorded and located events in 1990. The two Upland sequences form a NE- trending aftershock zone; this orientation is more obvious from the fault-plane solutions. Both sequences are believed to have occurred on a NE-trending fault that undergoes left- lateral strike-slip movement.
54
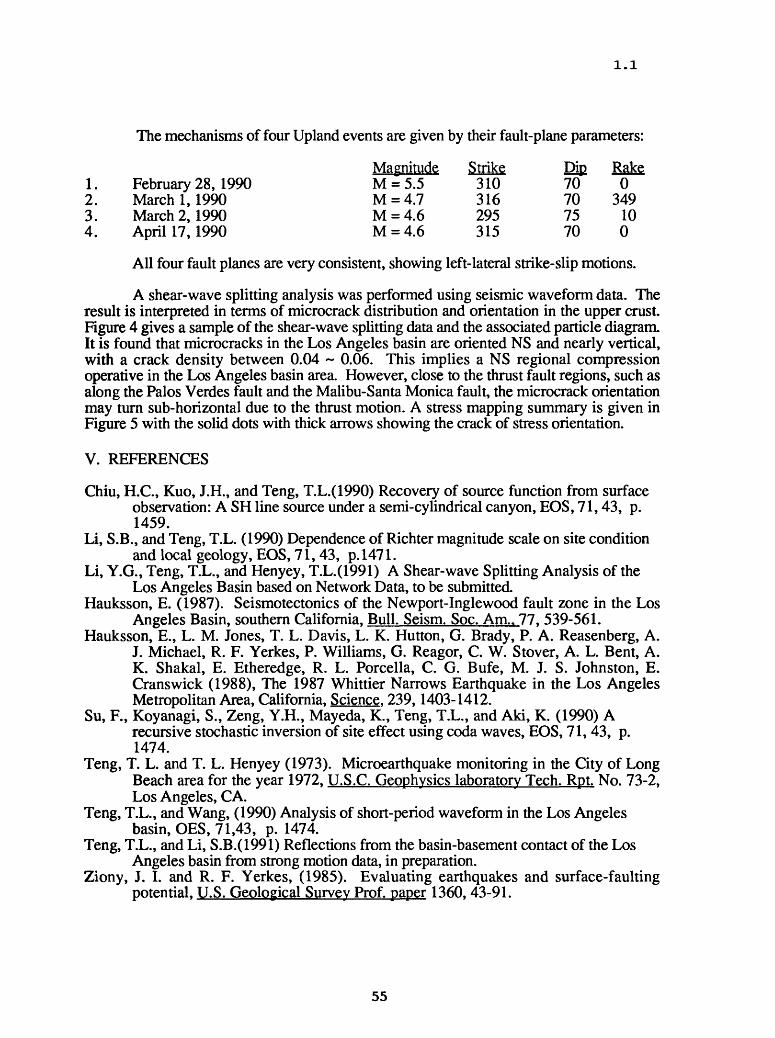
1.1
The mechanisms of four Upland events are given by their fault-plane parameters:
Magnitude Strike Dip Rake1. February 28, 1990 M = 5.5 310 70 02. March 1,1990 M = 4.7 316 70 3493. March 2, 1990 M = 4.6 295 75 104. April 17, 1990 M = 4.6 315 70 0
All four fault planes are very consistent, showing left-lateral strike-slip motions.
A shear-wave splitting analysis was performed using seismic waveform data. The result is interpreted in terms of microcrack distribution and orientation in the upper crust. Figure 4 gives a sample of the shear-wave splitting data and the associated particle diagram. It is found that microcracks in the Los Angeles basin are oriented NS and nearly vertical, with a crack density between 0.04 ~ 0.06. This implies a NS regional compression operative in the Los Angeles basin area. However, close to the thrust fault regions, such as along the Palos Verdes fault and the Malibu-Santa Monica fault, the microcrack orientation may turn sub-horizontal due to the thrust motion. A stress mapping summary is given in Figure 5 with the solid dots with thick arrows showing the crack of stress orientation.
V. REFERENCES
Chiu, H.C., Kuo, J.H., and Teng, T.L.(1990) Recovery of source function from surfaceobservation: A SH line source under a semi-cylindrical canyon, EOS, 71,43, p.1459.
Li, S.B., and Teng, T.L. (1990) Dependence of Richter magnitude scale on site conditionand local geology, EOS, 71,43, p. 1471.
Li, Y.G., Teng, T.L., and Henyey, T.L.(1991) A Shear-wave Splitting Analysis of theLos Angeles Basin based on Network Data, to be submitted.
Hauksson, E. (1987). Seismotectonics of the Newport-Inglewood fault zone in the LosAngeles Basin, southern California, Bull. Seism. Soc. Am.. 77. 539-561.
Hauksson, E., L. M. Jones, T. L. Davis, L. K. Hutton, G. Brady, P. A. Reasenberg, A.J. Michael, R. F. Yerkes, P. Williams, G. Reagor, C. W. Stover, A. L. Bent, A.K. Shakal, E. Etheredge, R. L. Porcella, C. G. Bufe, M. J. S. Johnston, E.Cranswick (1988), The 1987 Whittier Narrows Earthquake in the Los AngelesMetropolitan Area, California, Science. 239,1403-1412.
Su, F., Koyanagi, S., Zeng, Y.H., Mayeda, K., Teng, T.L., and Aki, K. (1990) Arecursive stochastic inversion of site effect using coda waves, EOS, 71, 43, p.1474.
Teng, T. L. and T. L. Henyey (1973). Microearthquake monitoring in the City of LongBeach area for the year 1972, U.S.C. Geophysics laboratory Tech. Rpt. No. 73-2,Los Angeles, CA.
Teng, T.L., and Wang, (1990) Analysis of short-period waveform in the Los Angelesbasin, OES, 71,43, p. 1474.
Teng, T.L., and Li, S.B.(1991) Reflections from the basin-basement contact of the LosAngeles basin from strong motion data, in preparation.
Ziony, J. I. and R. F. Yerkes, (1985). Evaluating earthquakes and surface-faultingpotential, U.S. Geological Survey Prof, paper 1360, 43-91.
55
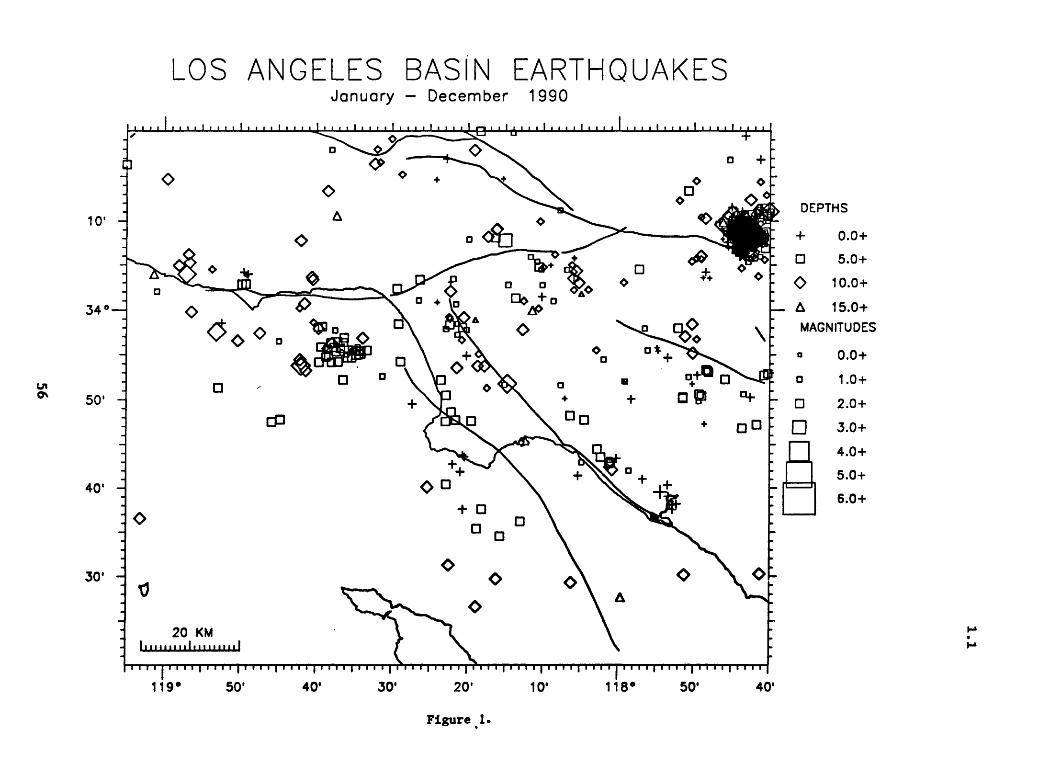
en
LOS ANGELES BASIN EARTHQUAKESJanuary - December 1990
10' -
34°
50' -
40' -
30' -
20 KM I.........I...mini
119' 50'\ ' ' T r
10' 118° 50' 40'
Figure 1.
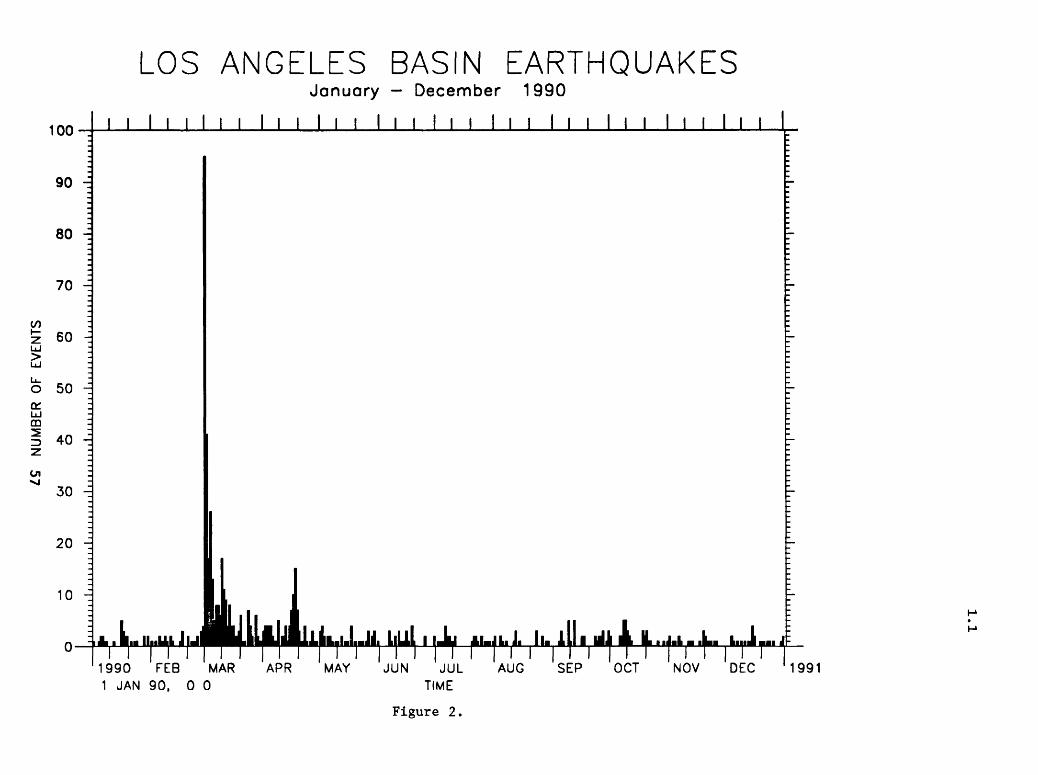
LOS ANGELES BASIN EARTHQUAKES
100
January - December 1990
J I I I I III I I I I I I I I I I I I III I I
C/)
90 -i
80 -j
70 -\
60 -j
o 50 -. o:LJ CD
i 40 -3
30 -_
20 -=
10 -
1990 FEB MAR 1 JAN 90, 0 0
APR MAY JUN JUL TIME
Figure 2.
AUG SEP OCT NOV DEC '1991

1.1
HYPOCENTER UNCERTAINTY UXYOO
31 62 93 124 1551 1 7°30'
LONGITUDE (KM)
O 31 62 93 124
LONGITUDE (KM)
155 117030'
Figure 3.
58

01 23456789 10
0.5
TRAVCLTIMC (S)
FLA FLA
-W C-W
FLA
S2 *
FLA
SLOW SLOW
OH1V ^HIM**^^^
OH IN
DH1E
01 23456789 10
0.5
TRAVELTIMC (S)
OH1 S2<
OH1
E-W C-W
WM^Wn
DH1N
DH1C S
01 23456789 10
OH1 -4-32
SI
OH1
SLOW SLOW
Ln vo
Figure 4a. Figure 4b. Figure Ac.

1.1
10'
34*
501
40'
- GFPSMMA A 2!*14
iiiimiiitiiiiiii'"11111111^^^^
ALH MSHSCI
TRK EXG
^ 54< JL.'"
30' 20' I04 118' 50'
Figure 5*
60
1.1
Shallow Seismic Reflection Surveys in the New MadridSeismic Zone
14-08-0001-1926
Roy B. VanArsdale Geology Department
University of Arkansas Fayetteville, Arkansas 72701
(501) 575-3355
Kaye Shedlock Robert Williams
Branch of Geologic Risk Assessment U.S. Geological Survey, Box 25046, MS 966
Denver, CO 80225 (303) 236-1621
Objective
Shallow seismic reflection surveys in the New Madrid seismic zone is a project that includes three primary targets in nor theastern Arkansas and southeastern Missouri. These targets are Crowley's Ridge (AR), the Bootheel Lineament (MO), and the Crit- tenden County fault zone (AR). Roy VanArsdale (University of Arkansas), Eugene Schweig and Lisa Kanter (Memphis State Univer sity) , Kaye Shedlock (USGS), Eugene Luzietti (USGS), and Rob Wil liams (USGS) are collaborating on this project. The focus of this status report is on the Mini-Sosie reflection lines across the margins of Crowley's Ridge. The principal objective of the Crowley's Ridge study is to determine if the ridge is fault bounded. The status of the Bootheel Lineament and Crittenden County fault zone studies are described in a separate report by Schweig et al. in this volume.
Progress
During the summer of 1990, five Mini-Sosie reflection lines totalling 11 km were recorded across the margins of Crowley's Ridge (Fig. 1) and processed at the U.S.G.S. One second of two- way travel time was collected for each line which approximately corresponds to the upper 1.2 km of the crust. The quality of the data was generally good with better results from the terraces adjacent to Crowley's Ridge and data quality diminishing over the ridge.
All of the lines, with the possible exception of line 4, rev eal faulting that displaces Cretaceous and overlying Tertiary strata (VanArsdale et al., 1990). However, reflectors were not imaged in the upper 200 m so it is not possible to determine whether Quaternary strata are displaced.
61

1.1
The most interesting of the profiles is line 5. This line reveals a gentle anticlinal fold (10 m amplitude) beneath Crowley's Ridge, a down-to-the-east fault (10 m of displacement) at the eastern boundary of the ridge, and a major normal fault system (50 m of displacement) in the eastern portion of the line that may be west-bounding faults of the Reelfoot rift (Figs. 1 and 2). The faults clearly displace Cretaceous strata and appear to displace Tertiary strata. Tertiary strata in profile 5 gener ally dips gently eastward; however, east of the fault labeled RR in Figure 2 the Tertiary strata dips gently westward. Thus, it appears that Tertiary or Holocene reactivation of fault RR tilted the Tertiary strata westward. Continuing studies are underway to better define the structure and stratigraphy revealed in the Mini-Sosie lines.
Reports
VanArsdale, R.B., Scherer, G.G., Schweig, E.S., III, Kanter, L.R., Williams, R.A., Shedlock, K.M., and King, K.W., 1990, Seismic reflection survey of Crowley's Ridge, Arkansas, EOS, v. 71, p. 1435.
62

1.1
MISSOURI
MISSOURI
ARKANSAS
91 W ,'
Fig. 1. Index map of Crowley's Ridge (shaded) seismic lines.Seismic line locations are labeled 1-5 and the Reelfoot rift boundaries are represented by dashed lines.
63

OS
USGS MINI-SOSIE PROFILE: LINE 5 CROWLEYS RIDGE. flRK.
IS 5 a, s
fi^ ilST2."V'.?% -;^*TS»Ji*<?5Ti **«*-:*»JU.*^-.7.T:;
1.0
Fig. 2. Seismic line 5 of Figure 1. Line length is 5 km.RR - Reelfoot rift fault and RBF - ridge boundary fault. T - Tertiary, K - Cretaceous, P » Paleozoic.

I.I
Field Experiment Operations
1-9930-01170
John VanSchaackBranch of Seismology
U.S. Geological Survey345 Middlefield Road, Mail Stop 977
Menlo Park, California 94025(415) 329-4780
Investigations
This project performs a broad range of management, maintenance, field operations, and record keeping tasks in support of seismology and tectonophysics networks and field experiments. Seismic field systems that it maintains in a state of readiness and deploys and operates in the field (in cooperation with user projects) include:
a. 5-day recorder portable seismic systems.b. "Cassette" seismic refraction systems.c. Portable digital event recorders.
This project is responsible for obtaining the required permits from private landowners and public agencies for installation and operation of network sensors and for the conduct of a variety of field experiments including seismic refraction profiling, aftershock recording, teleseism P-delay studies, volcano monitoring, etc.
This project also has the responsibility for managing all radio telemetry frequency authorization for the Office of Earthquakes, Volcanoes, and Engineering, and its contractors.
Personnel of this project are responsible for maintaining the seismic networks data tape library. Tasks includes processing daily telemetry tapes to dub the appropriate seismic events and making playbacks of requested network events and events recorded on the 5-day recorders.
Results
Portable NetworksSeventeen 5-day magnetic tape recorders, along with 5
digital recorders and 8 telemetered sensors were used in a tomographic study of the Loma Prieta earthquake rupture area. The experiment started in July 1990 and ended in November 1990. Stations from the Central California Seismic network were also included in the experiment. The data from this experiment are being analyzed.
65

I.I
Tape DubbingMagnetic tapes of all stations in the Central Cal. Net. are
dubbed at the M4 level for earthquakes. All smaller events to M2.5 are digitized only and added to the quarterly catalog and data library.
Permanent NetworksGood progress has been made in "hardening" the Central Cal.
Network. Several local stations have been moved from phone lines to radio. Approval has been grated to modify our microwave network so that more data can be transmitted to University of California, Berkeley. We have also received permits to install several digital seismic stations in the Bay Area. Equipment is being ordered.
66

I.I
Geothermal Seismotectonic Studies
9930-02097
Craig S. WeaverBranch of Seismology
U. S. Geological Surveyat Geophysics Program AK-50
University of WashingtonSeattle, Washington 98195
(206) 442-0627
Investigations
1. Continued analysis of the seismicity and volcanism patterns of the Pacific Northwest in an effort to develop an improved tectonic model that will be useful in updating earthquake hazards in the region. (Weaver, Yelin)
2. Continued acquisition of seismicity data along the Washington coast, directly above the interface between the North American plate and the subducting Juan de Fuca plate. (Weaver, Yelin, Norris, UW contract)
3. Continued seismic monitoring of the Mount St. Helens area, including Spirit Lake (where the stability of the debris dam formed on May 18, 1980 is an issue), Elk Lake, and the south ern Washington-Oregon Cascade Range (north of Newberry Volcano). The data from this monitoring is being used in the development of seismotectonic models for southwestern Washington and the interaction of the Basin and Range with the Oregon Cascades. (Weaver, Grant, Norris, Yelin, UW contract)
4. Study of earthquake catalogs for the greater Parkfield, California region for the period 1932-1969. Catalogs from the University of California (UCB) and CalTech (CIT) are being compared, duplicate entries noted, and die phase data used by each reporting institution are being collected. The study is emphasizing events greater than 3.5, and most events will be relocated using station corrections determined from a set of master events located by the modern networks. (Meagher, Weaver)
5. Study of estuaries along the northern Oregon coast in an effort to document probable sub sidence features associated with paleosubduction earthquakes (Grant).
6. Study of seismically recorded rockslides and avalanches on Cascade volcanoes (Norris).
7. Formation of the Pacific Northwest Earthquake Team by Rob Wesson, Chief of the Office of Earthquakes, Volcanoes, and Engineering. (Weaver)
Results
The Pacific Northwest Regional Team began functioning in November, 1990. This team is part of three major changes in the USGS portion of the National Earthquake Hazards Reduction Program (NEHRP) since November 1990. First, as part of the Federal budget pro cess for Fiscal Year 91, USGS NEHRP funding was increased from $35M to $50M. The earthquake legislation authorizing the increased funding level directed the USGS to pursue regionally-based studies in four areas: 1) southern California, 2) the San Francisco Bay area, 3) the New Madrid region, and 4) the Pacific Northwest. The Chief of the Office of
67

I.I
Earthquakes, Volcanoes, and Engineering (OEVE), Rob Wesson, established "Regional Teams" in each region named in the legislation to oversee the development of science plans, review internal USGS proposals submitted to the regional programs, and help set the priorities of work to be funded by the USGS external program. Each Regional Team has a leader; Craig Weaver (206-553-0627) is the Pacific Northwest Regional Team leader. Team members for the Pacific Northwest are listed below.
Second, to meet the directives of the legislation increasing the NEHRP budget and recog nizing that the increase was not added to our fiscal base funding (but is essentially a one-time increase), the Chief of OEVE divided the total amount of NEHRP funds into two components-core and regional. Core funds essentially represent program funding levels for FY90, and were distributed in approximately the same distribution as FY90 funds. The regional funds are to be used to initiate new efforts in the four regions. Under the regional program (new funds), about $1.5M was allocated for the Pacific Northwest: $900K was allo cated for internal USGS work and $696K was set aside for additional FY91 gjrants to outside investigators. As of March 31, 1991, the $900K has been distributed to projects within the USGS as shown in the summary below and research proposals from the external (non-USGS) community are in peer review. The internal core program budget for the studies in the Pacific Northwest is about $1137.5K; this number is still preliminary and may be revised after final project budgets are set. In addition to the internal core program, the internal and external regional program, about $1207.5K of external research for FY91 has already been funded in the region; this total includes cooperative funding of $100.0K each to the state geological sur veys of Oregon and Washington. The external research proposals now receiving FY91 funds were selected for support by the scientific peer review process conducted last spring.
Third, the USGS adopted a new national plan and four regional plans to guide our pro gram. The national plan is currently referred to as the "Page Plan", after the chair of the committee established to revamp the old NEHRP plan. The new national plan will be issued as a USGS Circular later in 1991. The Pacific Northwest Regional Science Plan was written by Shedlock and Weaver and has gone to press; it is being issued as a USGS Circular 1067 in late May, 1991. The conclusions of that plan are reproduced below.
PACIFIC NORTHWEST REGIONAL TEAM
Craig Weaver, Branch of Seismology, Seattle Team LeaderKaye Shedlock, Chief, Branch of Geologic Risk Assessment, GoldenBob Masse, Chief, Branch of Global Seismicity and Magnetism, GoldenAl Lindh, Chief, Branch of Seismology, Menlo ParkWill Prescott, Chief, Branch of Tectonophysics, Menlo ParkTom Holzer, Chief, Branch of Engineering, Seismology, and Geology, Menlo ParkPete Lipman, Chief, Branch of Igneous and Geothermal Processes, Menlo ParkRandy Updike, Associate Chief, OEVE, RestonElaine Padovani, Deputy Chief for External Programs, OEVE, RestonGarry Rogers, Geological Survey of Canada, Sydney, British ColumbiaMike Lisowski, Branch of Tectonophysics, Menlo ParkRowland Tabor, Branch of Western Regional Geology, Menlo ParkBob Bucknam, Branch of Geologic Risk Assessment, GoldenDal Stanley, Branch of Geophysics, GoldenDon Swanson, Branch of Igneous and Geothermal Processes, Seattle
CONCLUSIONS OF PACIFIC NORTHWEST SCIENCE PLAN
A great subduction-zone earthquake that could devastate the Pacific Northwest is possi ble; crustal and intraplate earthquakes near population centers of the Pacific Northwest are
68

I.I
probable. Either type of earthquake would severely impact the region. Loss of life could be high and damages could easily run into the billions of dollars. Thus, the principle scientific objectives of the USGS/NEHRP program in the Pacific Northwest are to establish estimates of the probabilities of the occurrences of crustal, intraplate, and great subduction-zone earth quakes and to establish estimates of the effects and damage due to each type of earthquake. Since earthquake hazards in the Pacific Northwest are both regional and local in scale, the earthquake hazard assessment program must be both regional and local in scale. The program must include: (1) regional and local monitoring of seismicity and deformation, (2) tectonic framework studies, (3) improved seismic hazard and risk assessments, and (4) cooperative hazard-mitigation studies.
The resulting scientific information will provide the foundation necessary for State governments, local governments, and the private sector to implement effective programs for earthquake hazard mitigation, preparedness, and response on regional and local scales.
Reports
Grant, W. C. and Weaver, C. S., 199?, Seismicity of the Spirit Lake area: Estimates of possi ble earthquake magnitudes for engineering design, in The formation and significance of major lakes impounded during the 1980 eruption of Mount St. Helens, Washington, U. S. Geological Survey Professional Paper, edited by R. L Shuster and W. Meyer, (for ever in press). Funded by Earthquake, Geothermal, and Volcano Hazards.
Ludwin, R., C. S. Weaver, and R. S. Crosson, 1991, Seismicity of Washington and Oregon, GSA Decade of North American Geology Associated Volume, Neotectonics, (in press). Funded by Geothermal, Volcano Hazards and Earthquake Programs.
Weaver, C. S., Norris, R. D., and C. Jonientz-Trisler, 1990, Seismological monitoring in the Cascade Range, 1960-1989: Earthquakes, eruptions, avalanches, and other curiosities, in Geoscience Canada, 17, 158-162. Funded by Volcano, Geothermal, and Earthquake Hazards Programs.
Yelin, T. S. and H. J. Patton, 1991, Seismotectonics of the Portland, Oregon region, Bull. Seis. Soc. Am., 109-130. Funded by Earthquake and Geothermal Programs.
Norris, R. D., 1991, The Cascade Volcanoes: Monitoring history and current land manag- ment, for U. S. Geol. Surv. Open-File Report, 91-31, (in press, 80 pages). Funded by Volcano Hazards.
Shedlock, K. M., and Weaver, 1991, Program for earthquake hazards assessment in the Pacific Northwest, U. S. Geol. Surv. Circular 1067, 29 pp., (in press). Funded by Earthquake Hazards.
Weaver, C. S. and K. M. Shedlock, (in revision) Estimates of seismic source regions from considerations of the earthquake distribution and regional tectonics, for U.S. Geol. Surv. Prof. Paper, Earthquake Hazards in the Pacific Northwest, A. Rogers, W. Kockelman, G. Priest, and T. Walsh, eds., (34 pages, 10 figures). Funded by Geothermal and Earth quake Programs.
Norris, R. D., 1991, Seismic observations of rock and debris falls at Mount St. Helens, Wash ington, (abs), Seis. Res. Lett., (in press).
69

1.2
Analysis of Seismic Data from the Shumagin Seismic Gap, Alaska
#14-08-0001-G1981
Geoffrey A. Abers, Klaus H. JacobLamont-Doherty Geological Observatory of Columbia University
Palisades, New York 10964(914) 359-2900
InvestigationsThe mechanics of rupture on plate boundary faults remain poorly understood, but play a critical
role in the nucleation and extent of major earthquakes. This is particularly true of subduction zones, where little local seismic data exist. The Shumagin network has recorded 10 years of digital seismic data within 0-100 km of the main Aleutian interplate thrust, with a variety of types of instruments. We analyze here the spatial distribution and rupture processes of small-to-moderate (M<5) earthquakes, by using the local network waveforms to determine their rupture histories. A primary task is to use empirical Green's function techniques to remove path effects in waveforms of moderate-sized earthquakes, by deconvolving from these seismograms the waveforms of small earthquakes from the same location and with the same mechanism. The resulting wavelets reflect the source behavior of the larger earthquakes, and can be quantified using a variety of standard measures (e.g., seismic moment, radiated seismic energy, duration, stress drop). We explore these measures and their variation between different parts of the main thrust zone, in order to document variations in the mechanical behavior of the interplate thrust.
In particular, we are testing the possibility that variations exist between shallow and deep parts of the thrust zone, following the suggestion from teleseismic analyses that deeper earthquakes (40- 50 km depth) have much higher stress drops than shallower events (25-35 km) closer to the trench. We are also testing for differences between aftershock behavior and background seismicity, and for alpng-strike differences that may be related to subduction zone segmentation. As a parallel part of this study, we analyze the spatial variability of seismicity and earthquake mechanisms in different parts of the main interplate thrust.
ResultsInitial work has concentrated on selecting events appropriate for empirical Green's function
analysis, determining variations in instrument characteristics, and analyzing event clustering. In order for empirical Green's function methods to be successful, differences between waveforms for primary study events and secondary "Green's function" events must be entirely due to source properties, so significant effort is being made to insure that non-source effects are minimized. Variable instrument calibration is potentially a problem for data spanning a long time, such as the digital Shumagin network data (10 years). Thus, we have completed a catalog of instrumental calibration information, system changes, gain changes, and failures. Fortunately the network is usually serviced only once per year so few opportunities exist for operators to change its configuration; most station hardware changes rarely and the dominant problem is drift of natural frequencies of seismometers with age. The most significant changes have occurred at our central station in Sand Point, where new instrumentation has been frequently tested. All these changes have been compiled, and instrument response functions are now archived in the headers of seismograms.
A second potential source of error in empirical Green's function methods is path differences between primary and secondary events caused by differences between the hypocenters of the two events. We try to minimize this effect by careful selection of events in clusters, where there is the greatest chance of finding several close events. Initial inspection of the Shumagin catalog shows that the spatial distribution of seismicity is markedly heterogeneous at depths shallower than 40 km (e.g., Figures 1, 2). Some of the heterogeneity is due to swarms or aftershock clusters and appears in only some years of data collection, but much of it is long-lived (Figure 1). The best- defined seismicity is in the Shumagin Islands part of the newtork, where many events are within 1-
70

1.2
2 focal depths of a station. In the Shumagin Islands region we have identified several concentrations of events near the main thrust zone, i.e. between 20 and 40 km depth (Figure 2). Of the 242 selected events (5930 possible pairs), there are 485 event pairs with spacing less than 1.0 km and 148 event-pairs with spacing less than 0.5 km, based on Shumagin catalog locations (Figure 3). Of the possible event-pairs in Figure 2, 375 event-pairs have magnitude differences greater than 2.0 and 1556 event-pairs have differences greater than 1.0, so that there are many useful event-pairs to choose from. Events in these clusters are being relocated using a joint relocation procedure, in order to refine these observations and to best identify closely spaced events. Closely-spaced events will be examined for similarity of mechanism and quality of recorded waveforms, in order to select the best events for deconvolution.
61 Events 1982-1983
~e?/ . s . -dP
55.5
153 Events 1984-1985
55
-161 -160.5 -160 -159.5 -159^ "5
55.5
55
-161 -160.5 -160 -159.5
137 Events 1986-1987
55.5
115 Events 1988-1989
55
1.5
55.5
55
-161 -160.5 -160 -159.5 -161 -160.5 -160 -159.5 -15!I4-5
Figure 1. Shumagin network locations near Shumagin Islands, for events 20-40 km deep. Symbols: triangles, stations; circles, events 20-30 km deep; squares, events 30-40 km deep. Four 2-year time periods are shown, in order to distinguish persistent from transient event clusters. Events are selected from the Network catalog, and include all events recorded by 8 or more phases, with HYPOINVERSE standard errors in epicenter and depth all less than 5 km. .,,

1.2
I I I I I I
55.3
55.1
54.9
54.7
161.0 -160.8 -160.6 -160.4 -160.2 -160.0 -159.8 -159.6 -159.4 -159.2 -159.
Figure 2. Identification and location of clusters of earthquakes used in preliminary analysis. Map shows all earthquakes in Shumagin Catalog between 20 and 40 km depth, solid symbols for events in identified clusters. Comparison with Figure 1 shows that some of these clusters (e.g., 1,2,3) are long- lived features of seismicity, while others (e.g., 6,7) are transient features such as aftershock sequences. Symbols same as Figure 1.
72

1.2
Cluster 1 Cluster 2
Cluster 6
km
Figure 3. Histograms showing event spacings for all pairs of events within clusters shown on Figure 2. For all event pairs within clusters, horizontal distances are calculated and tabulat ed. These results are for original HYPOIN- VERSE locations used to produce catalogs, and currently are being refined by joint hypocenter relocation.
73

1.2
SEISMIC SOURCE ANALYSIS USING EMPIRICAL GREEN'S FUNCTIONS
9910-02676
John Boatwright and Leif Wennerberg Branch of Engineering Seismology and Geology
U.S. Geological Survey345 Middlefield Road, MS 977Menlo Park, California 94025
415/329-5609, 5659 or FTS/459-5609, 5659
Investigations
Our research has focused on extending the Green' s function technique to separate source and site spectral characteristics from multiple recordings of moderate-sized earthquakes. We have devised and applied a series of inversions to recordings of the aftershocks of the 1989 Loma Prieta earthquake.
Results
1) The relative site response has been determined as a function of frequency for a set of eleven stations in and around the Marina District in San Francisco. The seismic ampli fication of six stations within the Marina District appears remarkably consistent relative to a nearby station at Fort Mason, sited on Franciscan Sandstone. The Marina stations exhibit a peak at 1 Hz amplified by a factor of 6-10 and a broad sidelobe at 2-3 Hz amplified by a factor of 3-4. two stations sited just outside the Marina on dune sands do not exhibit the strong low-frequency peak in amplification.
2) We have devised a new method of empirically determining site response and source spectra by fitting Brune models conditioned by a frequency independent Q to the recordings, and projecting the residuals on the sites. This analysis has been applied to four San Francisco stations using epicentrai distances of about 100 km, and four accelerograph sites which recorded the Loma Prieta main shock at epicentrai distances from 2-25 km, by Boatwright, et al. (1991). The absolute site amplifications are fixed through frequency-specific geotechnical constraints. The epicentrai studies determined Q = 380 and 414 for S and P waves, respectively. The stress drops of the 28 after shocks did not vary as a function of seismic moment for earthquakes with M0 < 1021 dyne-cm.

1.2
3) We have extended this spectral inversion technique to analyze the geometrical and an- elastic attenuation using a line of stations sited along the axis of the San Francisco Peninsula from the Santa Cruz Mountains up to San Francisco. After fitting the sources and attenuation, the residuals are projected onto the set of stations and to a set of distances, resulting in a map of residual attenuation as a function of distance and frequency. The residual attenuation for the P and S waves is surprisingly similar. There are a series of troughs and peaks which are reasonably constant over frequencies > 5 HZ in the distance range from 30 to 60 km, which are assumed to represent arri vals which have been critically refracted from a series of velocity discontinuities from 10 to 20 km in depth. Then a broad region of relatively little variation extends from 60 to 90 km at high frequencies; there are some weak peaks and holes for frequencies < 3 Hz. Finally, there is a strong peak at low frequency (« 1 Hz) at 100 km which is at a slightly further distance than a broad amplification at frequencies > 15 Hz, but it is unclear whether this high-frequency amplification corresponds to a critically refracted arrival or to a frequency dependence of the attenuation.
Reports
Boatwright, J., Seekins, L.C., and Mueller, C.S., Seismic amplification in the Marina District: Bulletin of the Seismological Society of America, in press.
Boatwright, J., Fletcher, J.B., and Fumal, T.E., A general inversion scheme for source, site, and propagation characteristics using multiply recorded sets of moderate- sized earthquakes: Bulletin of the Seismological Society of America, in press.
Fletcher, J.B., and Boatwright, J., Geometric and anelastic attenuation along the San Francisco Peninsula inferred from a joint inversion of digital seismograms: submitted to Bulletin of the Seismological Society of America.
75

1.2
Analysis of the 1957 Andreanof Islands Earthquake 14-08-0001-G1766
Thomas M. BoydColorado School of MinesDepartment of Geophysics
Golden, CO 80401(303) 273-3522
Project Summary and Goals
Recent studies have indicated that the spatial distribution of moment release can be quite heterogeneous along any particular rupture zone. The most common explanation for this heterogeneity has been the rupture of strong patches, or asperities, along the fault plane [e.g., Ruff and Kanamori, 1983]. These strong patches could arise from spatial variations of the frictional characteristics along the fault or from geometrical barriers inherent to the fault's shape. Alternatively, the spatial distribution of moment release could have little to do with the physical characteristics of the fault's surface and may be related to the dynamics of slip and how regions of the fault interact with neighboring regions [e.g., Rundle and Kanamori, 1987; Horowitz and Ruina, 1989].
Distinctions between these two models can not be made from the analysis of single events [e.g., Thatcher, 1990]. Conclusive observations can only be drawn from a study of the moment-release distribution generated by several great earthquakes, all of which rupture the same fault segment. In this context, an excellent region of study is the central Aleutian Arc. In 1986, a magnitude 8.0 (Mw) earthquake occurred near the AndreanofIslands. Its slip distribution, aftershock, and preshock sequence have been described in detail in a number of recent studies. Prior to 1986, the central Aleutian Arc was ruptured by another great earthquake in 1957 (Mw > 8.5). The 1957 Andreanof Islandsearthquake, however, remains poorly understood. Its seismic moment, slip distribution, and rupture area have not been well constrained.
The short time span between the 1957 and 1986 earthquakes provides us with a unique opportunity to study a complete seismic cycle bounded by two instrumentally recorded great earthquakes. In fact, it represents the only complete seismic cycle instrumentally observed along the Aleutian Arc. As briefly described in this summary, we are continuing our work on assembling and interpreting observations pertinent to the 1957 earthquake and the interseismic period between the 1957 and 1986 events. Progress can be summarized as;
1) We have developed and applied a methodology for assessing confidence bounds on rupture lengths constrained using surface-wave directivities.
2) Page scanning and relocation of seismicity listed in both the BCIS and ISS for the years 1957 thru 1989 continues.
3) Source mechanisms for aftershocks of the 1957 event have been classified by event type (thrust, normal, etc.), and bodywave modeling of selected events has begun.
76

1.2
Rupture Length Estimates and Error Bounds
Accurate determinations of kinematic rupture parameters have been accomplished for some time using the so-called directivity function [e.g., Ben-Menahem, 1961; Ben- Menahem and Toksoz, 1962, 1963; Udias, 1971]. Unfortunately, because it is highly nonlinear, this function is difficult to invert. Using the simulated annealing method [Kirkpatrick et al., 1983], however, we have constructed an inversion process which is capable of extracting accurate estimates of kinematic rupture parameters and provides the probability distribution of their values.
A PhD. level graduate student supported by this project, David Lane, has developed an ensemble approach in which several independent inversions are run simultaneously. The objective of each inversion is to maximize the joint probability distribution P(M=wlD=d), where M represents the kinematic rupture parameters, and D represents the observed data. After several iterations the algorithm generates solutions distributed as exp(-E/kT;),where E represents the error between a possible solution and the observed data, and Tj isthe control parameter of the jth inversion. We contend that the maximum likelihood estimate obtained during a single inversion is less important than the marginal distribution of rupture parameters. Since each of the inversions are independent we obtain the marginal distributions P(A/p«) by summing over the joint inversions. Figure 1shows inversion results for the 1957 event using data recorded at Pietermaritzburg South Africa. We find that the observed directivity can be best modeled with bilateral source that ruptured 300 km to the west, 615 km to the east, at a velocity of about 1.5 km/s. Preliminary results from this portion of the project were presented at the 1990 Fall AGU meeting in San Francisco [Lane and Boyd, 1990]. An overview of the technique and its applications to other historically significant earthquakes will be presented at the 1991 Spring AGU meeting [Boyd et al., 1991].
Seismicity Relocations
Using the slab geometry described by Boyd and Creager [1991] and Creager and Boyd [1991] we have calculated P-wave travel-time perturbations to approximately 550 stations as a function of epicentral position. The calculated residuals are used directly as epicentrally varying station corrections to generate relocated epicenters without additional ray tracing. We are using this procedure to relocate all of the shallow seismicity (BCIS and ISS) that occurred between 160 W and 175 E longitude from the years 1957 through 1989.
Figure 2 shows our relocations of the earthquake activity recorded during the year 1957. Figure 3 shows space-time plots of the same seismicity distribution. From our relocations it appears as though the aftershock sequence can be divided into three temporal units. During the first, lasting about 2.2 days after the mainshock, aftershock activity is generally confined to the rupture zone defined from the surface-wave directivities described above. During the second time period (2.2 to 47 days after the mainshock) activity expands eastward to fill the Unalaska seismic gap. Activity within this portion of the aftershock zone, although low level, is persistent throughout the rest of 1957. After 47 days of activity, seismicity expands westward to include the Rat block.
77
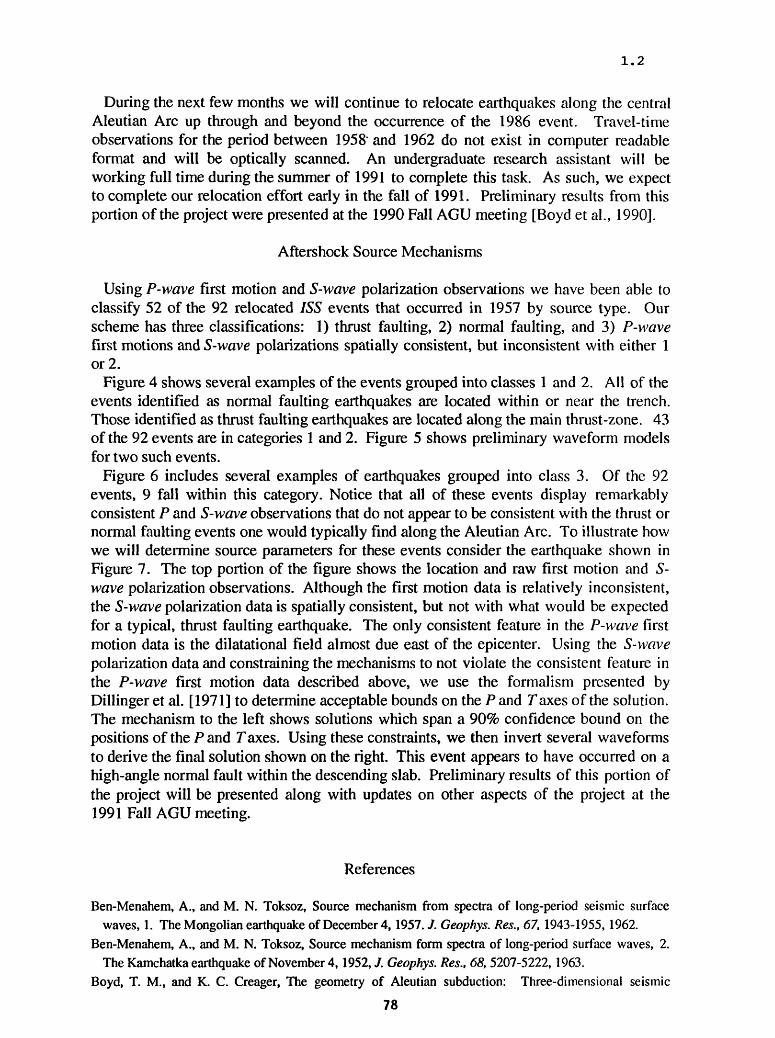
1.2
During the next few months we will continue to relocate earthquakes along the central Aleutian Arc up through and beyond the occurrence of the 1986 event. Travel-time observations for the period between 1958' and 1962 do not exist in computer readable format and will be optically scanned. An undergraduate research assistant will be working full time during the summer of 1991 to complete this task. As such, we expect to complete our relocation effort early in the fall of 1991. Preliminary results from this portion of the project were presented at the 1990 Fall AGU meeting [Boyd et al., 1990].
Aftershock Source Mechanisms
Using P-wave first motion and S-wave polarization observations we have been able to classify 52 of the 92 relocated 755 events that occurred in 1957 by source type. Our scheme has three classifications: 1) thrust faulting, 2) normal faulting, and 3) P-wave first motions and S-wave polarizations spatially consistent, but inconsistent with either 1 or 2.
Figure 4 shows several examples of the events grouped into classes 1 and 2. All of the events identified as normal faulting earthquakes are located within or near the trench. Those identified as thrust faulting earthquakes are located along the main thrust-zone. 43 of the 92 events are in categories 1 and 2. Figure 5 shows preliminary waveform models for two such events.
Figure 6 includes several examples of earthquakes grouped into class 3. Of the 92 events, 9 fall within this category. Notice that all of these events display remarkably consistent P and S-wave observations that do not appear to be consistent with the thrust or normal faulting events one would typically find along the Aleutian Arc. To illustrate how we will determine source parameters for these events consider the earthquake shown in Figure 7. The top portion of the figure shows the location and raw first motion and S- wave polarization observations. Although the first motion data is relatively inconsistent, the S-wave polarization data is spatially consistent, but not with what would be expected for a typical, thrust faulting earthquake. The only consistent feature in the P-wave first motion data is the dilatational field almost due east of the epicenter. Using the S-wave polarization data and constraining the mechanisms to not violate the consistent feature in the P-wave first motion data described above, we use the formalism presented by Dillinger et al. [1971] to determine acceptable bounds on the P and Taxes of the solution. The mechanism to the left shows solutions which span a 90% confidence bound on the positions of the P and Taxes. Using these constraints, we then invert several waveforms to derive the final solution shown on the right. This event appears to have occurred on a high-angle normal fault within the descending slab. Preliminary results of this portion of the project will be presented along with updates on other aspects of the project at the 1991 Fall AGU meeting.
References
Ben-Menahem, A., and M. N. Toksoz, Source mechanism from spectra of long-period seismic surface waves, 1. The Mongolian earthquake of December 4,1957. J. Geophys. Res., 67, 1943-1955, 1962.
Ben-Menahem, A., and M. N. Toksoz, Source mechanism form spectra of long-period surface waves, 2. The Kamchatka earthquake of November 4,1952, J. Geophys. Res., 68, 5207-5222, 1963.
Boyd, T. M., and K. C. Creager, The geometry of Aleutian subduction: Three-dimensional seismic
78

1.2
imaging, J. Geophys. Res., 96, 2267-2291, 1991. Boyd, T. M., E. R. Endgahl, and W. Spence, Aftershocks of the 1957 Aleutian Islands earthquake, EOS, 71,
1469,1990. Boyd, T. M., F. D. Lane, and E. R. Engdahl, Historical earthquakes: Rupture length estimates based on
aftershock locations and surface wave observations, Abstract, EOS, 72, 189, 1991. Creager, K. C., and T. M. Boyd, The geometry of Aleutian subduction: Three-dimensional kinematicflow
model, J. Geophys. Res., 96, 2293-2307,1991. Dillinger, W. H., A. J. Pope, and S. T. Harding, The determination of focal mechanisms using P- and S-
wave data, NOAA Tech. Report NOS 44, 56 pp., 1971. Horowitz, F. G., and A Ruina, Slip patterns in a spatially homogeneous fault model, J. Geophys. Res., 94,
10,279-10,298,1989. Kirkpatrick, S., C. D. Gelatt, and M. P. Vecchi, Optimization by simulated annealing, Science, 220, 671-
680, 1983. Lane, F. D., and T. M. Boyd, A simulated annealing approach to the inversion of surface wave directivities:
Application to the 1957 Aleutian Islands earthquake, EOS, 71, 1468, 1990. Ruff, L., and H. Kanamori, The rupture process and asperity distribution of three great earthquakes from
long-period diffracted P-waves, Plrys. Earthq and Planet. Inter., 31, 202-230,1983. Rundle, J. B., and H. Kanamori, Application of an inhomogeneous stress (patch) model to complex
subduction zone earthquakes: A discrete interaction matrix approach, J. Geophys. Res., 92, 2606-2616,1987.
Stauder, W., and A. Udias, S-wave studies of earthquake of the North Pacific, Part II: Aleutian Islands,Bull. Seismol. Soc. Am., 53, 59-77, 1963.
Thatcher, W., Order and diversity in the modes of Circum-Pacific earthquakerecurrence, J. Geophys. Res.,95, 2609-2624, 1990.
Udias, A., Source parameters of earthquakes from spectra of Rayleigh waves, Geophys. J. R. Astr. Soc., 22,353-376,1971.
79
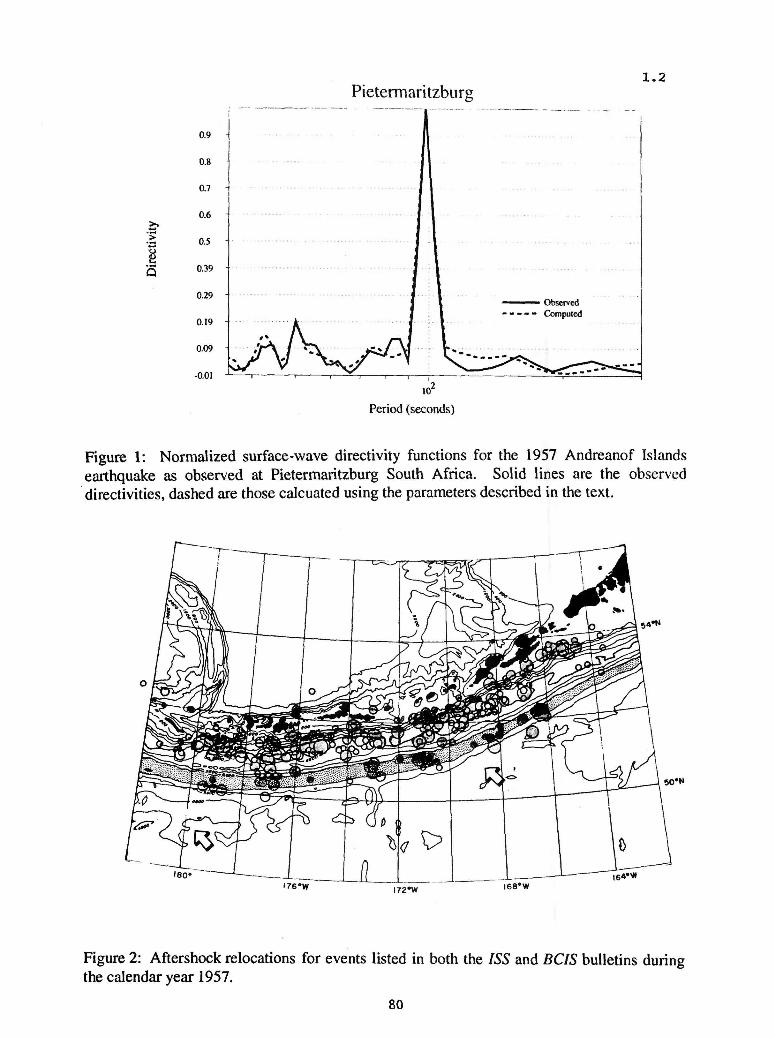
Pietermaritzburg1.2
Period (seconds)
Figure 1: Normalized surface-wave directivity functions for the 1957 Andreanof Islands earthquake as observed at Pietermaritzburg South Africa. Solid lines are the observed directivities, dashed are those calcuated using the parameters described in the text.
180-
I76»W I72*W |68*W164'*
Figure 2: Aftershock relocations for events listed in both the 755 and BCIS bulletins during the calendar year 1957.
80
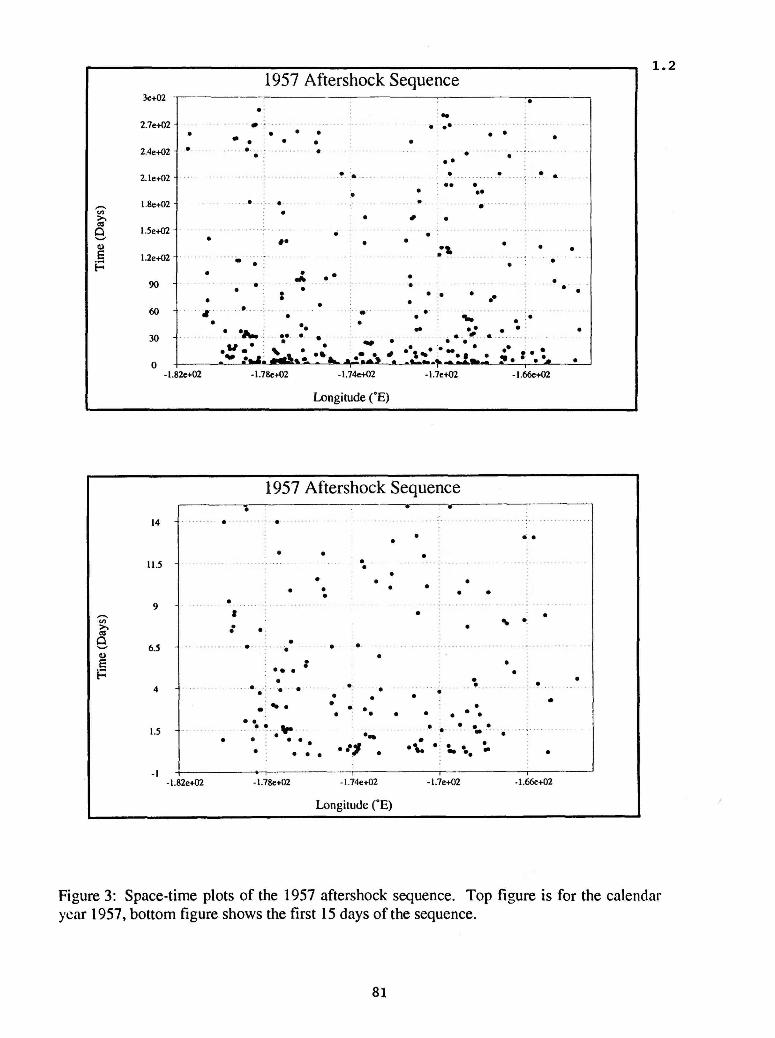
oo
«
8 1H
3e+02 -
2.7e+02 -
2.4e+02
2.1e+02
l.8e+02
l.Se+02 -
l.2e+02
90 -
60 -
30 -
0 -U
1957 Aftershock Sequence
* * * * *. ... t : .... . . ................... . ^ t .... ^ .............. .. . i ' ' . ;"**
i " * :
" . " " " * *' . '--
» ...... . : ...... . .... . ........ .. * ! * . . . *. ' .. ; y ^ ; -
xil* ^ "S^.-!A *. -'L: 'r-il*^ «\%2e+02 -1.78e+02 -1.74e+02 -1.7e+02 -1.66e+02
Longitude (°E)
1.2
Time (Days)
5 * 5. * c; z
1957 Aftershock Sequence« .
. . . -; ............
. ' «.
: .^
*
* . : - . .
i . . ' % *
: , . »- ' - - - - --- -- -. ..
...-'
.. ; . . . ...... ..v.............. % ".* .. . . ^^ . A A . . *:.. -* - . - -. ----- . ... ? . » -. .
-1.82e+02 -1.78e+02 -l.74e+02 -l.7e+02 -1.66e+02
Longitude (°E)
Figure 3: Space-time plots of the 1957 aftershock sequence. Top figure is for the calendar year 1957, bottom figure shows the first 15 days of the sequence.
81

DBN
KIR
00 NJ
Much 15 1957 02b D**«l« km Much 22195714k DeMh-34 km
V*"HON |
KIR
Figure 4: First motion (755) and S-wave polarization observations [Stauder and Udias, 1963] for events that appear to be either thrust faulting or normal faulting earthquakes. Closed circles are compressional first arrivals, open circles are dilatational first arrivals. Source mechanisms shown are those that would be expected for typical interplate thrust earthquakes.

117 1957 16h
Normal Faulting EarthquakesApril 191957
April U 1957 20h
21957 14b
Thrust Faulting Earthquakes,17 1957 2a
1019571th
22195714k
Figure 5: Source mechanisms inferred from P-wave first motion, S-wave polarization, and waveform matching. Observed waveforms are solid, synthetics are dashed. All other
symbols are as defined in Figure 4.
to
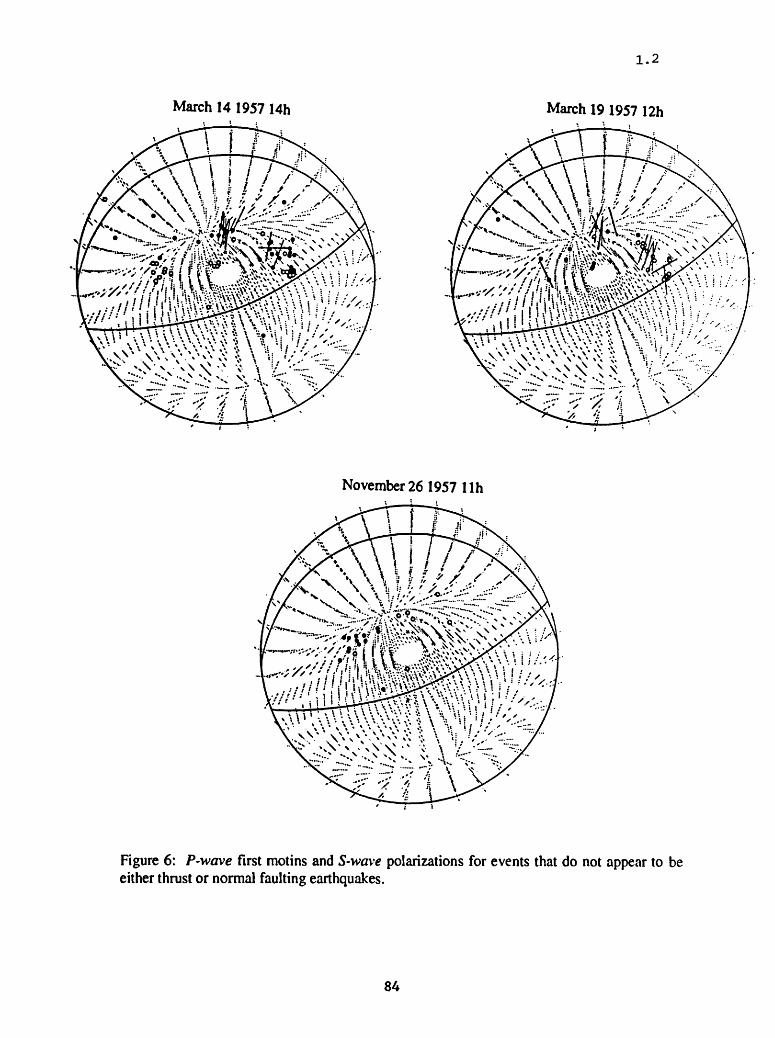
1.2
March 14 1957 14h March 19 1957 12h
November 26 1957 llh
Figure 6: P-wave first motins and 5-wavc polarizations for events that do not appear to be either thrust or normal faulting earthquakes.
84

1.2
March 11 1957 03h 265/20/107
UPP f;
290/7<y-98Depch«25km
SH ^-r-^ DBN
HKC
. p
PAS
Figure 7: Source mechanism determination for and event in class 3. Map shows location of the event in question plus four of its aftershocks. Top focal sphere shows the observed first motions and polarization directions. Using the polarization directions the focal sphere to the left shows acceptable positions of the P and T axes. With this constraint, the focal sphere to the right shows the final source mechanism and several modeled waveforms.
85

1.2
Earthquake Hazard Investigations in the Pacific Northwest
14-08-0001-G1803
R.S. Crosson and K.C. CreagerGeophysics Program
University of WashingtonSeattle, WA 98195
(206) 543-8020
October 1, 1990 - March 31, 1991
InvestigationsThe objective of this research is to investigate earthquake hazards in the Pacific
Northwest including problems related to possible large subduction earthquakes. Improve ment in our understanding of earthquake hazards is based on better understanding of the regional structure and tectonics. Current investigations by our research group focus on the configuration of the subducting Juan de Fuca plate, differences in characteristics of seismi- city between the overlying North American and the subducting Juan de Fuca plates, and kinematic modeling of deformation of the Juan de Fuca slab.Deep three-dimensional velocity structure of the Cascadia Subduction zone
Using an approximation to non-linear inversion, we estimated the velocity structure of the upper mantle portion of the Cascadia subduction zone using a data set of about 10,000 relative arrival times of teleseismic P waves recorded from 1980 to 1990 on WRSN (Washington Regional Seismic Network) short-period vertical stations in Washington and Northern Oregon. To approximate non-linear inversion, linear travel-time inversions (conjugate gradient method) were performed alternately with three-dimensional ray trac ing.
The most prominent and robust characteristic of the models obtained is a steeply east ward dipping fast, planar feature which is inferred to be the thermal and compositional anomaly associated with the subducting Juan de Fuca oceanic plate. The high velocity zone is located at a depth of approximately 100 km beneath the Cascade volcanos, similar to subduction zones elsewhere. At shallow depths (i.e. 60-80 km) the velocity anomaly is consistent with projections from models of slab structure from 40-60 km depth.
At 48° N latitude, the high velocity zone extends to depths of 400 km or more. However, south of 46°, the velocity anomaly disappears at a depth of ~ 150 km. Consid ering the tectonic history of the region and other geophysical observations such as seismi- city, this observation is consistent with a deep slab which has separated completely from the shallow slab in the south, and descended into the mantle. The three-dimensional velo city structure is used to model other geophysical observations, such as the regional gravity field and P-wave amplitude variations due to geometrical ray spreading.Kinematic Modeling:
We are working on the theoretical formulation and implementation of a finite element scheme to invert for both the geometry of a thin sheet (the slab) and the flow field within it which minimizes the global dissipation power associated with its membrane deformation rate. The sheet is assumed to be a fluid with a Newtonian or a power-law rheology, and an effective viscosity at least a few orders of magnitude higher than that of the surrounding mantle. The boundary conditions used for Cascadia subduction are that (1) seaward of the trench, the sheet is a spherical shell rotating at the Juan de Fuca/North America relative plate rates, and (2) the slab dips 20° into the mantle along two cross sections under north ernmost California and under northernmost Vancouver Island. The geometry and flow field are otherwise free to vary except that the flow must not cross the slab.
86

1.2
The important aspect of the fixed part of the geometry is the concave ocean ward bend in the trench axis which occurs at the latitude of the Olympic Mountains and Puget Sound. The combination of the bend in the trench and the downward dipping slab produce the problem, like that of a table cloth hanging over the corner of a table, that there is too much slab material for the available space. The trench geometry forces along-arc compres sion of the slab, or geometric arching/buckling, or a combination of the two. We have investigated two possibilities: For the first we fix the geometry so that the slab dips at 20° along all cross sections and invert for the flow field only. In the second, we allow the geometry to vary using the boundary conditions described above. Root-mean-squared effective strain rate of the flow field calculated in the second experiment is reduced by a factor of ten relative to the first experiment, and the geometry after inversion displays a pronounced arch whose axis is normal to the trench and dips at about 10° under Puget Sound. The arch is flanked by parallel troughs. This minimum strain-rate geometry is simi lar to the slab geometry estimated by hypocenter distributions and receiver function ana lyses.
It is well known that a sheet of corrugated metal is difficult to bend along an axis nor mal to the corrugations. This is because of strong resistance to membrane strains. Simi larly, once the arch has formed in the shallow portions of the slab (above 50 km depth), it is difficult to bend the arch from its 10° dip to its 50° dip at a depth of 150km and below. Our seismic tomography results provide compelling evidence that the slab below a depth of 150 km dips steeply. Bending the arch provides a possible explanation for the observed pronounced concentration of intra-plate seismicity beneath the Puget Sound basin relative to regions to the north or south. We are investigating this hypothesis. ArticlesBoyd, T.M., and K.C. Creager, 1991, The geometry .of Aleutian subduction: Three-
dimensional seismic imaging, JGR, V. 96, pp. 2267-2291.Creager, K.C. and T.M. Boyd, 1991, The geometry of Aleutian subduction: Three-
dimensional kinematic flow modeling, JGR, V. 96, pp. 2293-2307.Lees, J.M. and R.S. Crosson, (in press), Bayesian ART versus conjugate gradient methods
in tomographic seismic imaging: An application at Mount St. Helens, Washington, AMS-SIAM: Conference on spatial statistics and imaging - June, 1988.
Ma, Li, R.S. Crosson, and R.S. Ludwin, (submitted), Preliminary Report on Focal Mechanisms and stress in western Washington, in: USGS Professional Paper "Assess ing and Reducing Earthquake Hazards in the Pacific Northwest")
Mundal, I., M. Ukawa, and R.S. Crosson, 1991 (in press), Normal and anomalous P phases from local earthquakes, and slab structure of the Cascadia Subduction zone, BSSA
Lees, J.M. and J.C. VanDecar, 1991, Seismic tomography constrained by Bouguer gravityanomalies, with application to western Washington, PAGeoph., V. 135, pp. 31-52.
Abstracts Chiao, L.Y., and K.C. Creager, 1990, Geometric Constraints of Cascadia Subduction, EOS,
V. 71, N. 41, p. 1574. VanDecar, J.C., R.S. Crosson, and K.C. Creager, 1990, Deep three-dimensional velocity
structure of the Cascadia subduction zone, EOS, V. 71, N. 41, p. 1462. VanDecar, J.C., R.S. Crosson, and K.C. Creager, 1990, Deep three-dimensional velocity
structure of the Cascadia subduction zone, EOS, V. 71, N. 36, p. 1144. VanDecar, J.C., R.S. Crosson, and K.C. Creager, 1990 (in press), Teleseismic travel-time
inversion for Cascadia subduction zone structure employing three-dimensional ray tracing, presented at the XXII General Assembly, European Seismological Commis sion, Barcelona, Spain, Fall, 1990.
VanDecar, J.C., R.S. Crosson, and K.C. Creager, 1991 (in press) Inferences on the tec tonic evolution of deep Cascadia subduction zone structure, for 1991 Vienna IUGG meeting
87
1.2
Source Characteristics of Earthquakes Along the Northern San Jacinto Fault Zone and Faults Within Northern Baja California, Mexico (1915-1956)
14-08-0001-G1954
Diane I. DoserDepartment of Geological Sciences University of Texas at El Paso El Paso, Texas 79968-0555
(915) 747-5501
Objective: Between 1915 and 1956 two earthquakes with magnitude > 6.0 occurred along the northern San Jacinto fault, and seven earthquakes occurred along faults in northern Baja California. The source processes of these earthquakes will be determined through waveform modeling of regional and teleseismic body waves. Foreshocks and aftershocks of these earthquakes will be relocated using a bootstrap technique, and focal mechanisms will be determined through grid searches of first motion data. Data from available geological and geophysical studies will provide additional constraints on fault processes. The information obtained from the study will be used to determine the rupture length, moments, and causative faults associated with the earthquakes on the northern San Jacinto fault, and the nature of faulting and rate of moment release within Baja California. The latter information is needed to evaluate how plate motion from the Gulf of California is being transferred across Baja California to the San Andreas, Imperial, and San Jacinto fault systems and how it may affect the recurrence rates of earthquakes within southern California.
Progress to Date: The past five months of this project have been devoted to data acquisition and analysis. Tasks completed during this time period include:
(1) Waveform modeling of earthquakes along the northern San Jacinto fault has been completed and a paper on the results is in preparation for the Bulletin of the Seismological Society of America. The modeling results suggest that the 1918 (M=6.8) San Jacinto earthquake occurred along a fault with an orientation similar to that of the Claremont branch of the San Jacinto fault at a depth of 8 km. Data for the 1923 (M=6.3) San Bernardino earthquake are limited to waveforms from one station and a few first motion polarities, however these data indicate that the event did not occur along a strike-slip fault with orientation similar to the 'San Jacinto fault near San Bernardino. The orientation that best fits the data is similar to the strike of the Banning fault.
(2) Waveform modeling of earthquakes associated with the February 9-15, 1956 San Miguel sequence is in progress. Preliminary results of the modeling suggest 1.2x10**!9 N-m of moment was
88

1.2
released during the sequence. The mainshock on February 9 appears to be composed of 2 to 3 subevents. The February 15 aftershock also appears to be a double event. A change in strike from 120° for the mainshock to 100° and 130° for the February 14 and 15 aftershocks is consistent with changes in the trend of surface faulting observed along the San Miguel fault. Results of the modeling will be presented at the 1991 Spring meeting of the American Geophysical Union at a special session on historic earthquakes. A special volume of Pure and Applied Geophysics will be published on the papers presented at the session.
(3) Waveform data for the remaining Baja earthquakes has been collected and digitized. Waveform modeling will commence once the study of the 1956 San Miguel sequence is completed.
(4) All mainshocks, aftershocks, and foreshocks in Baja, California have been relocated. Collection of first motion data for the events has been completed and is awaiting analysis.
(5) The PI has been sharing analysis software with Dr. Craig Nicholson at the University of California, Santa Barbara. Dr. Nicholson is completing a study of historic earthquakes along the San Andreas fault zone in southern California sponsored by the USGS. The PI and Dr. Nicholson hope to collaborate on a paper that will summarize the results of their studies of historic earthquakes in southern California.
89

1.2
Seismotectonics in the Northeastern United States
14-08-001-G1796
John E. Ebel, James W. Skehan, S.J., and David C. RoyWeston Observatory
Dept. of Geology and GeophysicsBoston College
Weston, MA 02193(617) 899-0950
Objective: The primary objective of this research is to improve the calculated locations of earthquake hypocenters in New England (particularly to better constrain the event focal depths) by relocating earthquakes using new network station travel-time residuals. These residuals are to be found from a time-term tomographic analysis of the P wave arrivals on the New England Seismic Network (NESN) stations from the 1984 Maine Seismic Refraction Profile (MSRP) and from the 1988 New York-New England Seismic Refraction Experiment (NY-NEX). The relocated earthquake hypocenters are used to reexamine the present Seismotectonics of the northeastern United States in an effort to identify seismically active structures in the region.
Crustal Structure Analysis: A new computer code to perform a tomographic time- term analysis for New England has been put together by Zhu (1991). The code is more general and flexible than that used by Kafka and Ebel (1988) in their tomographic analysis of Maine. The new code has been tested successfully on several synthetic data sets. We have analyzed a data set consisting of P-wave first arrivals from the MSRP and NY-NEX experiments to search for lateral crustal velocity variations throughout New England. This work was performed in several steps. First, travel times from the P arrivals from the data set were used to construct a plane layered starting model for the tomographic analysis. While based on a completely different set of stations, the starting model was very close to the crustal model for Maine found by Luetgert ct al. (1987). This starting model was then used to invert for lateral and vertical seismic velocity variations across the region. Time terms for both the shot points and the stations were calculated relative to this tomographic model. As a final step, shot and station time terms were also calculated relative to the starting model, which was held fixed. These time terms were calculated to be used in the HYPO78 program for event location. HYPO78 does not allow lateral velocity variations in the crustal model, so the full time-term analysis results which include the lateral velocity variations cannot be used directly in that program.
Crustal Structure Results: The tomographic time-term analysis found crustal seismic velocity variations throughout northern New England. These velocity variations are generally consistent with other crustal models for the region (Figure 1). In particular, the upper crust was found to have strong lateral velocity variations (Figure 2) which show some correlation with the surface geology. In particular, the metasediments of the Kearsarge-Central Maine Synclinorium have somewhat lower seismic velocities than the average, and the mafic plutonic belts through the regions are somewhat faster than average. The lower crust is much more laterally uniform in seismic velocity than the upper crust, although a reduced velocity region under the White Mountains of New Hampshire is imaged at about 20 km depth (Figure 3). The Moho deepens from SSE at a depth of 33 km to NNW at the U.S.-Canada border in
90

1.2
Maine at a depth of 38 km. Time terms relative to the tomographic model, shown in Figure 4, are generally quite small. In contrast, the time terms relative to the plane- layered starting model with no lateral velocity variations are much larger (Figure 5).
Event Location Analysis: A major goal of this research was to try to improve event locations and focal depths by the calculation of a more accurate crustal model and set of station time terms for the region. We tested this by relocating the 1984 MSRP blasts using the Chiburis and Ahner (1980) crustal model (C&AM) and the starting model (SM) found from this analysis. C&AM, derived from data from southern New England, has rather different layer velocities than the models which have been derived using data from Maine (Figure 1). Surprisingly, it proved to be somewhat more accurate at locating the shots than SM, even when we included the time terms of Figure 5 in SM. The average epicentral error with C&AM is 3.59 km, while with SM it is 3.93 km without the station time terms and 4.30 km with the station time terms. The average depth error for these surface-focus shots is 3.44 km with C&AM, 7.14 km with SM and no time terms, and 7.27 km with SM and the time terms.
Conclusions: Errors in the calculation of epicenters and depths of seismic events (earthquakes and blasts) in New England are only a very weak function of the crustal seismic velocity structure used in the location program. Even a somewhat inappropriate crustal model gives epicenters and depths comparable to those from better models of the region, and knowledge of the lateral variations of the crustal seismic velocities cannot be easily used to improve hypocenter accuracy. We view our results as indicating that seismic station density, station distribution, and seismogram signal-to-noise are the controlling factors affecting the calculation of accurate event epicenters and depths for events in New England. One implication of this analysis is that in New England a sparse network of seismic stations, such as that planned for the National Seismic Network, will constrain earthquake epicenters to no better than +-5 to +-10 km and earthquake depths to no better than +-10 km.
References:
Chiburis, E.F., and R.O. Ahner, 1980. Northeastern U.S. Seismic Network Bulletin No. IS - Seismicitv of the Northeastern United States April 1. 1979 - June 30. 1979. published by Weston Observatory, Department of Geology and Geophysics, Boston College, Weston, MA.
Hughes, S., and J.H. Luetgert, 1991. Crustal Structure of the New EnglandAppalachians and Adirondack Mountains: The 1988 New England - New York Seismic Refraction Profile, submitted to J. Geophys. Res.
Kafka, A.L., and J.E. Ebel, 1988. Seismic Structure of the Earth's Crust Underlying the State of Maine, Studies in Maine Geology: Volume 1. pp. 137-156, published by the Maine Geological Survey, Augusta, ME.
Luetgert, J.H., C.E. Mann, and S.L. Klemperer, 1987. Wide-Angle Deep CrustalReflections in the Northern Appalachians, Geophys. J. R. astr. Soc.. 89. 183-188.
Taylor, S.R., and M.N. Toksoz, 1979. Three-Dimensional Crust and Upper Mantle Structure of the Northeastern United States, J. Geophys. Res.. 84. 7627-7644.
Zhu, H., 1991 (in progress). A Tomographic Analysis of the Crust of New England. M.S. thesis, Department of Geology and Geophysics, Boston College, Chestnut Hill, MA.
91
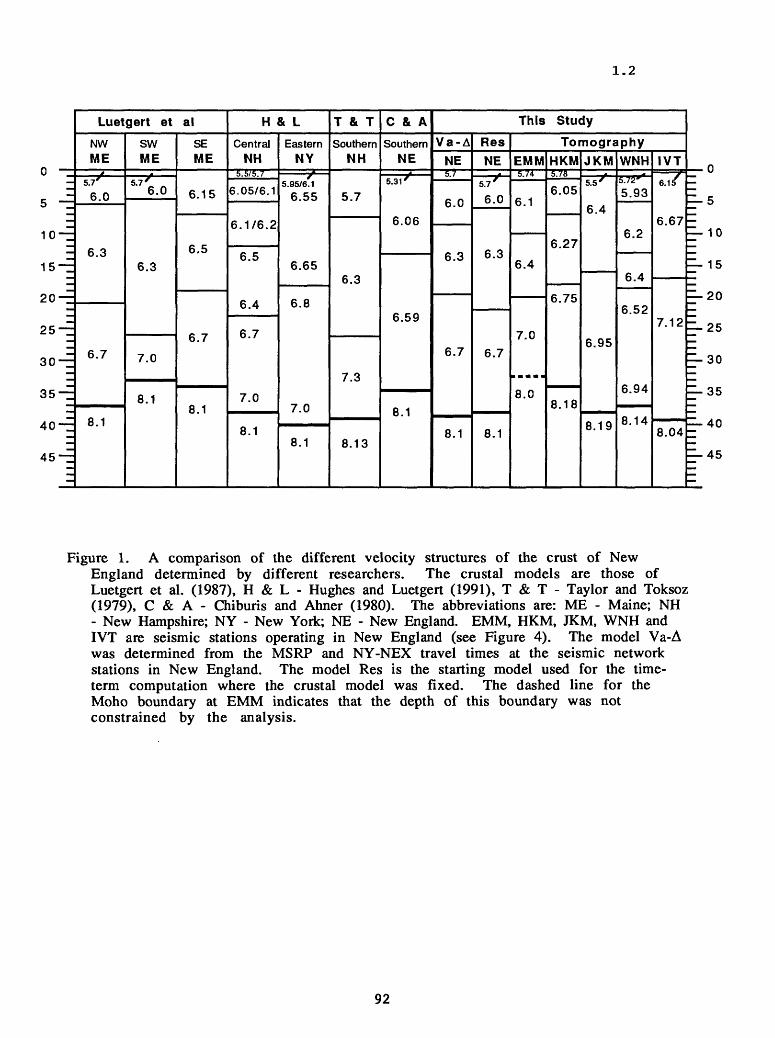
1.2
0
5
10
15
20
25
30
35
45
_
__
-
Z
z
~
-£
-
-=_
Luetgert et al
NW ME
5.7^
6.0
6.3
6.7
8.1
SW ME
"6.0
6.3
7.0
8.1
SE ME
6.15
6.5
6.7
8.1
H & L
Central NH
6.05/6.1
6.1/6.2
6.5
6.4
6.7
7.0
8.1
Eastern NY
r 5.95/6.1
6.55
6.65
6.8
7.0
8.1
T & T
Southern NH
5.7
6.3
7.3
8.13
C & A
Southern NE
5.31'
6.06
6.59
8.1
This Study
Va-A
NE
6.0
6.3
6.7
8.1
Res
NE
5.7
6.0
6.3
6.7
8.1
Tomography
EMM
6.1
6.4
7.0
8.0
HKM
6.05
6.27
6.75
8.18
JKM5.5'
6.4
6.95
8.19
WNH
5.93
6.2
6.4
6.52
6.94
8.14
IVT
6.15
6.67
7.12
8.04
mmm
_-
^-
L3-
0
5
10
15
20
25
30
35
40
45
Figure 1. A comparison of the different velocity structures of the crust of New England determined by different researchers. The crustal models are those of Luetgert et al. (1987), H & L - Hughes and Luetgert (1991), T & T - Taylor and Toksoz (1979), C & A - Chiburis and Ahner (1980). The abbreviations are: ME - Maine; NH - New Hampshire; NY - New York; NE - New England. EMM, HKM, JKM, WNH and IVT are seismic stations operating in New England (see Figure 4). The model Va-A was determined from the MSRP and NY-NEX travel times at the seismic network stations in New England. The model Res is the starting model used for the time- term computation where the crustal model was fixed. The dashed line for the Moho boundary at EMM indicates that the depth of this boundary was not constrained by the analysis.
92

1.2
Velocity IndexDepth :km/sec
6 kmkm/sec
5.8-6.0 6.0-6.2 6.2-6.4 6.4-6.6 6.6-6.8 6.8-7.0
XXXXXXxxxxxx xxxxxx xxxxxx xxxxxx xxxxxx xxxxxx xxxxxx xxxxxx
Figure 2. Results of the time-term tomographic analysis for the seismic velocity distribution in New England at a depth of 6 km.
93

1.2
Velocity Index Depth : 2O kmkm/sec
5.6-5.8 5.8-6.0 6.0-6.2 6.2-6.4 6.4-6.6 6.6-6.8
Figure 3. Results of the time-term tomographic analysis for the seismic velocity distribution in New England at a depth of 20 km.
94

1.2
-0.006 XX°-004
X -o.0.425 X
Figure 4. Source and receiver time terms in seconds relative to the laterally-varying tomographic seismic velocity model for the study region.
95

1.2
I Source-84 100 km
* r^r «-£
Figure 5. Source and receiver time terms in seconds relative to the fixed starting seismic velocity model (model Res of Figure 1) for the study region.
96
1.2
Seismicity and Crustal Structure in an Active Collisional Orogen,Soviet Central Asia
14-08-0001-G1802
Michael W. Hamburger, Gary L. Pavlis,Haydar J. Al-Shukri, Emmanuel Ramos, Robert MellorsDepartment of Geological Sciences, Indiana University
Bloomington, Indiana 47405(812)855-2934
Terry L. Pavlis Department of Geology and Geophysics
University of New OrleansNew Orleans, Louisiana 70148
(504) 286-6797
Investigations
This program focuses on the highly active seismic zone between the Pamir and Tien Shan mountain belts in Soviet Central Asia. The Garm region is located directly atop the collisional boundary between the Indian and Eurasian plates, and is associated with a dense concentration of both shallow and intermediate-depth earthquakes. The fundamental aims of this collaborative research project with the USSR Academy of Sciences are: (1) to elucidate the structures and processes involved in active deformation of a complex collisional plate boundary, and (2) to examine the temporal variations in seismicity near Garm, in the form of changing spatial, depth, and stress distribution of microearthquakes that precede larger events. The seismological data base for this study includes the combined resources of the global, regional, and local seismic networks. Geological structures in the Garm region have been studied using compilation of published geological information, analysis of satellite imagery, and geological field work in the Peter the First, Gissar, and Darvaz mountain ranges near Garm.
Results
Teleseismic Travel Time Inversion. In collaboration with Alek Lukk (Institute of Physics of the Earth, Moscow), we have compiled traveltime data from 218 teleseismic earthquakes recorded at the Garm network stations, in order to obtain information on mid- to lower crustal velocities. These data have been augmented by arrival time data from fourteen regional seismic stations operating in the Pamir, in the Tadjik Depression, and in Afghanistan. We have begun work with a new teleseismic inversion routine based on the work of Al-Shukri and Mitchell (1987). The first stage of data reduction involved calculation of travel time residuals from the raw arrival time data, removal of clearly unreliable readings, and examination of azimuthal characteristics of the travel- time residuals. We have now obtained preliminary results from the teleseismic inversion, and an example of the resultant velocity model (for the upper mantle) is shown in Figure 1. Among the preliminary conclusions are: (1) identification of anomalously low- and high-velocity zones, respectively, in the crust beneath the Pamir and Hindu Kush, (2) an upper mantle velocity high beneath the southeastern Pamir, and (3) anomalously high velocities in the sub-lithosphere mantie associated with the Fergana Valley and the Hindu Kush deep seismic zone (Mellors et al. t 1991). The latter observation contrasts with local earthquake inversion beneath the Hindu Kush zone (Roecker, 1982) that indicated anomalously low seismic velocities (produced by subducted continental crust?) associated with the upper portion of the Hindu Kush zone.
Earthquake Focal Mechanisms. Our continuing work with earthquake focal mechanisms (Ramos etal, 1991) involves examination of stress orientations associated with 14,000 shallow
97

1.2
events in the Garm region. We found that the entire region is dominated by north- to northwest- trending horizontal compressive stresses (Figure 2). The PFR shows more northwesterly trending axes of principal stress that deviate from both the north-south stresses observed in the adjoining crystalline mountains and from the predicted north-south plate motion vector of the India-Eurasian plate motion. At depth and under an inferred decollement surface, the stress patterns of the basement conform with the regional trend, indicating that the stress field within the sedimentary rocks of the PFR may be rotated from the regional stress system.
Geologic Structure. In order to examine active tectonic structures within the seismically active Garm region, we have completed two structural cross sections across the core of the Peter the First Range (PFR). The PFR is an actively deforming fold-thrust belt marked by intense seismicity as well as Quaternary deformation (Hamburger etal., 1991). The two sections were constructed from Garm to the Darvaz Range and a from Khait to the Darvaz Range (Pavlis and Hamburger, 1990). In the previous reporting period, we presented one of these cross sections, showing intense compressive deformation near the core of the range. Figure 3a illustrates a line-length restoration of the original section, shown as Figure 3b. This cross section probably represents a maximum-displacement end-member in a range of allowable sections. That is, in projecting struc ture into the subsurface, we assumed that all structures that cannot be accomodated by deformation within the thrust sheet must be accomodated by sub-thrust duplexing where the duplex is devel oped entirely within a complete stratigraphic section that was overriden by a master thrust system (Vakhsh thrust). This assumption leads to a large portion of the section (right half of section) that is unconstrained by surface geology. Nonetheless, this restoration leads to a reasonable basinal geometry for the system with a uniformly tapered section thickening toward the south. Moreover, if the assumed sub-thrust geology is correct, even this section produces an underestimate of the total shortening in the belt because the footwall cutoff for the Vakhsh thrust is not within the line of section, thus resulting in an unknown gap in the middle of the restored section.
Despite the ambituities of cross-section reconstruction in areas where subsurface data are lacking, two key points should be emphasized: First, the magnitude of the apparent shortening in this section is very large given the evidence for Plio-Pleistocene ages (0-5 Ma) for the structures (Hamburger et al, 1991). The total shortening, ignoring the potential gap in the middle of the restored section, is 68 km, suggesting that shortening rates are probably in excess of 2 cm/yr. Second, even conservative estimates of the total shortening suggest significant convergence. If we use only the left side of the restored section (constrained only by unfolding folds) together with an assumption of relatively minor offset (20 km of net slip) on the Vakhsh thrust, the total shortening across the belt is approximately 50 km, indicating minimum convergence rates of approximately 1 cm/yr.
References
Al-Shukri, H. J. and B. J. Mitchell, 1987, Three-dimensional velocity variations and the relation to the structure andtectonic evolution of the New Madrid seismic zone, J. Geophys. Res., 92, 6377-6390.
Billington, S., B.L. Isacks, and M. Barazangi, 1977, Spatial distribution and focal mechanisms of mantleearthquakes in the Hindu Kush-Pamir region: A contorted Benioff zone, Geology. 5, 699-704.
Hamburger, M.W., D.R. Sarewitz, T.L. Pavlis, G.A. Popandopulo, 1990, Structural and seismic evidence for intra-continental subduction beneath the Peter the First Range, Soviet Central Asia, Geol. Soc. Am. Bull, in rev.
Mellors, R.M., H.J. Al-Shukri, M.W. Hamburger, A.A. Lukk, and G.A. Popandopulo, 1991, Velocity structure ofthe crust and upper mantle in the Pamir-Tien Shan region, Soviet Central Asia [abstract], EOS, Trans. Am.Geophys. Un., in press.
Pavlis, T. L., and M. W. Hamburger, 1990, The Jura-Cretaceous Tadjik Depression, Soviet Central Asia: Riftedmargin of Asia vs. foreland basin, Geol. Soc. Am. Abs. w/Prog., in press.
Ramos, E.G., M.W. Hamburger, A.A. Lukk, and S.L. Yunga, 1991, Seismicity and stress patterns within acollisional plate boundary, Soviet Central Asia [abstract], EOS, Trans. Am. Geophys. Un., in press.
Roecker, S.W., 1982, Velocity structure of the Pamir-Hindu Kush region: Possible evidence of subducted crust, J. Geophys. Res., 87, 945-957.
98

1.2
65 E 67 69 71 73 75
B
iUJu< I- V)
6,00
j? 2, 73' 1.6H0.55-0.55
I-2.73-3. 82-t.Pl-6. 00
DISTANCE CKM)
Figure 1. Results of teleseismic inversion for crust and upper mantle velocities beneath the Central Asian region (from Mellors et al, 1991). (A) Regional topography and configuration of the seismic network. 1000- and 3000-m topographic contours are shown by light and heavy shading, respectively. Recording stations are shown by filled triangles. Heavy lines show the contours to the top of the Pamir-Hindu Kush intermediate-depth seismic zone, from Billington et al. (1977). Grid lines indicate block boundaries defined for teleseismic inversion. (B) Results from three-dimensional tomographic inversion; example of velocity anomalies in layer three (depth 200-350 km). Shading indicates percentage velocity perturbation to nominal layer velocity of 8.6 km/s. Negative velocity perturbations, by convention, represent higher seismic velocities. Note the correlation of the high velocity block beneath the Hindu Kush with the intermediate-depth seismic zone. [Note that very high velocity beneath westernmost Hindu Kusb is unconstrained by raypath coverage.]
99

1.2
33
= 2784
70 E V
C
\\\\* + -r-r
71'
Figure 2. (A) Earthquake focal mechanism solutions for moderate-sized events (ML > 3.0) in the Garm region, 1971-1988. Shown are the horizontal projections of the axes of maximum compression of earthquake mechanisms determined by Lukk and Yunga (1988). Small symbols indicate earthquakes with 3.0 £ ML £ 4.0; large symbols indi cate earthquakes with ML £ 4.0. Light lines indicate the 9000 foot topographic contour, and heavy lines indicate rivers. (B) Equal area projection showing distribution of principal stress axes for large events (ML £ 4.0; top) and all events (ML £ 2.0; bottom) located within the Peter the First Range. Kamb contours are shown at intervals of 2.0 a Heavy arrow shows the average orientation of P-axes, using Bingham statistics. Light arrows show orientation of India-Eurasia plate convergence direction (P). from NUVEL-1 plate motion model [DeMets et al.. 1990] and direction normal to trend of Pamir/Peter the First Range structural boundary (N). (Q Principal stress orientations for the Peter the First Range. Axes show projections of maximum and minimum principal stresses for best-fit double couple solution for all mecha nisms located within a IS x IS km square surrounding each gridpoint P-axes are shown by double bars; T-axes are shown by single bars. Light lines indicate drainage network.
100

Back Rotation above duplex andjor)----- ip
Darvaz slratigraphic section
-20km - 20 km
portion of r*Morad toeilon constmlncd by known surfte* geology
JO» ^^^^ ^^^^^^^^^_ ^^^"^^M^^^^r*9,qrv-..---->- M ^g^Lxngy
Figure 3. Restoration of geologic cross section along a transect from the Darvaz Range to the Gissar Range (through the central portion of the Peter the First Range). The balanced cross section (A) assumes that at least part of the back-rotation observed in the core of the PFR is a consequence of duplexing beneath the leading edge of the thrust sheet (B) Restored cross section, indicating a minimum of 68 km shortening within the plane of the section.
Symbols: Pls=Permian limestone, TRs=Triassic sedimentary and volcanic rocks; Us=Lower Jurassic sedimentary rocks; mJc=Middle Jurassic conglomerate and sandstone; uJe=Upper Jurassic evaporites and shale; lKs=lower Cretaceous sandstone, siltstone, conglomerate and shale; uKls=Upper Cretaceous limestone and marl; lT=lower Tertiary limestone, shale, and marl; uT=upper Tertiary (Neogene) sandstone and conglomerate.

1.2
Analysis of Earthquake Data from the Greater Los Angeles Basin and Adjacent Offshore Area, Southern California
#14-08-0001-G1761
Egill Hauksson
Seismological Laboratory,California Institute of Technology,
Pasadena, CA 91125818-3566954
INVESTIGATIONSSeismotectonic analysis of earthquake data recorded by the CIT/USGS and USC
networks during the last 15 years in the greater Los Angeles basin. Improve models of the velocity structure to obtain more accurate earthquake locations including depth and to determine focal mechanisms. Studies of the earthquake potential and the detailed patterns of faulting along major faults in the metropolitan area and adjacent regions.
A comprehensive study entitled: The 1988 and 1990 Upland Earthquakes: Left-Lateral Faulting Adjacent to the Central Transverse Ranges, is in press in the Journal of Geophysical Research
RESULTSThe 1988 and 1990 Upland Earthquakes: Left-Lateral Faulting
Adjacent to the Central Transverse Ranges
Two earthquakes (M^=4.6 and M]j=5.2) occurred at almost the same location in Upland, southern California, in June 1988 and February 1990 and had similar strike-slip focal mechanisms with left-lateral motion on a northeast striking plane (Figure 1). The focal mechanisms and aftershock locations showed that the causative fault was the San Jose fault, an 18-km-long concealed fault that splays west-southwest from the frontal fault of the central Transverse Ranges. Left-lateral strike-slip faults adjacent to the frontal faults may play an important role in the deformation of the Transverse Ranges and the Los Angeles basin as suggested by these Upland earthquakes, the left-lateral strike-slip 1988 (M/,=4.9) Pasadena earthquake on the Raymond fault, 30 km to the west of Upland, and scattered background seismicity along other active left-lateral faults. These faults may transfer slip away from part of the frontal fault toward the south. Alternatively, these faults could represent secondary faulting related to the termination of the northwest striking right-lateral strike-slip faults to the south of the range front (Figure 2). The 1988 and 1990 Upland earthquakes ruptured abutting or possibly overlapping segments of the San Jose fault. The edges of the overlapping aftershock zones, which are sharply defined, together with background seismicity, outline a 14-km-long aseismic segment of the San Jose fault. The 1988 mainshock originated at 9.5 km depth and caused aftershocks between 5 and 12 km. In contrast, the 1990 mainshock focus occurred at the top of its aftershock zone, at 5 km, and caused aftershocks down to 13 km depth. These deep aftershocks tapered off within 2 weeks. The rate of occurrence of aftershocks in magnitude-time space was the same for both sequences. The state of stress reflected in the focal mechanisms of the aftershocks is identical to that determined from background activity and did not change with time during the aftershock sequence. The constant stress state suggests that the 1988 and 1990 events did not completely release all the stored slip on that segment of the fault. The presence of 14 km of unbroken fault, the abrupt temporal termination of deep aftershocks, and the
102

1.2
constant stress state all suggest that a future moderate-sized earthquake (M/,=6.0-6.5) on the San Jose fault is possible with a rupture length of at least 14 km and possibly 18 km.
PUBLICATIONS and REPORTSHauksson, E., Earthquakes, faulting,and stress in the Los Angeles Basin, /. Geophys.
Res., 95, 15365-15394, 1990. Hauksson, E. and L. M. Jones, The 1988 and 1990 Upland earthquakes: Left-lateral
faulting adjacent to the central Transverse Ranges, submitted to the AGU fall meeting,1990.
Hauksson, E. and S. Gross, Source Parameters of the 1933 Long Beach Earthquake, Bull.Seismol. Soc. Amer., 81,81-98, 1991.
Hauksson, E. and L. M. Jones, The 1988 and 1990 Upland earthquakes: Left-lateralfaulting adjacent to the central Transverse Ranges, /. Geophys. Res. in press, 1991.
Hauksson, E. and C. R. Alien, Seismicity and seismogenic faults in the vicinity of the Portof Los Angeles, POLA Seismic Workshop, Proceedings, in press, 1991
Hutton, L. K., L. M. Jones, E. Hauksson, and D. D. Given, Seismotectonics of southernCalifornia, Decade of North American Geology, Neotectonics of North America,Geological Society of America, in press, 1991.
103

1.2
Upland 1981-1990
10- -
34«
r
a .
«. .... >»*HFJW < ---"' "luit -oc" x . "K^^iri*£>""'""' * "3tm' *" '"'./ .
».^
' . ; \\Q- \%
3 KM
118"
T | I T i r
55'
|
SO' 45*
TIMES
O 0.0+
X 3316.0+MAGNITUDES
0.0+
o 2.0+
O 3.0+
4.0+
5.0+
CMF SJF " v WCF CHF
r
(D)
0246 Distance (km)
0246 Distance (km)
6 6 10 12 Distance (km)
14 16
Figure. 1. Earthquakes recorded by the Southern California Seismic Network between 1981 and 1989 (shown by circles) and 1990 (shown by crosses), (a) A map showing earthquake epicenters and active faults and end points A-A1 , C-C, and D-D1 , (b) The earthquake hypocenters within 4 km of the line A-A1 projected onto the line. Dashed lines are projected at 65° and 70° from the surface traces of the Cucamonga and San Jose faults, respectively, (c) The earthquake hypocenters within 5 km of the line C-C projected onto the line. Dashed line is projected at 85° from the surface trace of the San Jose fault, (d) The earthquake hypocenters within 6 km of the line D-D1 projected onto the line, along strike of the San Jose fault. Three zones are outlined: the aftershock zone of 1988 (A), the aftershock zone of 1990 (A and B), and the aseismic zone (C).
104

1.2
(a) THRUST FAULTING MODEL
15 II8*OO 45 90
15'
S4«00'
(b) STRIKE-SLIP FAULTING MODELIS* ne«oo' 45' so'
is'
54«00'
^Figure. 2. Maps of the region of the Upland earthquakes showing active faults from Ziony and Jones [1989]. Faults are dotted where inferred, dashed where concealed, and solid where well located, (a) The thrust faulting model where the shading illustrates where the compressional tectonics of the Transverse Ranges may extend to the south of the Sierra Madre fault. In this model the San Jose fault transfers some of the thrust motion to the Elysian Park thrust, located to the south of the Sierra Madre fault. Some of the slip may be transferred back to the northwest along the Verdugo fault, (b) The strike-slip faulting model where the northeast trending strike-slip faults are secondary faults related to the abrupt termination of the northwest trending strike-slip faults.
105

1.2
Source Characteristics of California Earthquakes and Attenuation Effects
14-08-001-G1872
Donald V. HelmbergerSeismological Laboratory
California Institute of TechnologyPasadena, CA 91125
(818)356-6998
Investigations
Our long term objective is to determine the characteristics of earthquakes occurring in Southern California. The basic strategy has been to study the larger modern events since they are well-recorded and then to compare the records from these events (Masters) to interpret historic events or recent ones to obtain quick preliminary results. The primary data sets for these studies are the PAS (low gain recording), long term running teleseismic stations such as De Bilt, starting in 1917, and some of the older Caltech stations. Essentially we think better locations can be obtained using a combination of waveform data and travel time constraints.
Results
In this summary period two studies will be emphasized; (a) on the rupture properties of the Loma Prieta earthquake which will be used to compare with the 1906 event, and (b) a re- examination of historic earthquakes along the San Jacinto fault zone.
We have used 24 broadband teleseismic and 48 components of local strong motion velocity records of the 1989 Loma Prieta earthquake in a formal inversion to determine the temporal and spatial distribution of slip. Separate inversions of the teleseismic data (periods 3-30 sec) or strong motion data (periods 3-30 sec) or strong motion data (periods 1-5 sec) result in similar models. The data require bilateral rupture with relatively little slip in the region directly updip from the hypocenter. Slip is concentrated in two patches; one centered 6 km northwest of the hypocenter at a depth of 12 km and with a maximum slip of 350 cm, and the other centered about 5 km southeast of the hypocenter at a depth of 16 km and with a maximum slip of 460 cm. The bilateral nature of the rupture results in large amplitude ground motions at sites located along the fault strike, both to the northwest and the southeast. This bilateral rupture also produces relatively modest ground motion amplitudes directly updip from the hypocenter, which is in agreement with the velocity ground motions observed at Corralitos. There is clear evidence of a foreshock (magnitude between 3.5 and 5.0) about 2 seconds before the main part of the rupture; the origin time implied by strong motion trigger times is systematically 2 seconds later than the time predicted from the high-gain regional network data. The seismic moment obtained from either of the separate data sets or both sets combined is about 3.0x1026 dyne-cm and the potency is 0.95 km3 , see Wald et al. (1991) for details.
The high level of seismic activity and the potential for large earthquakes in the San Jacinto fault zone, southern California make it desirable to have accurate locations and source parameters for as many previous events as possible. Prior to the installment of a dense seismic network in this region, earthquakes were located using only a few stations with generally poor azimuthal coverage resulting in considerable uncertainty in the locations. We relocate and obtain moment estimates for historic (pre- WWSSN) earthquakes in the western Imperial Valley by comparing the waveforms and travel times with recent earthquakes in the region. All the events are in the ML 5.5-6.5 range.
106
1.2
The historic earthquakes occurred in 1937, 1942 and 1954. We use the 1968 Borrego Mountain, 1969 Coyote mountain, and 1987 Elmore Ranch earthquakes as calibration events. We employ regional and teleseismic data from continuously operating stations, with Pasadena, De Bilt, Berkeley, Ottawa and St. Louis recording most of the events. The waveforms imply that all the events are almost pure strike-slip events on vertical or near-vertical faults. Approximate values for the strikes were obtained and are within the range of observed strikes for well studied earthquakes in this region. The earthquakes are relocated by comparing S-P and surface wave -S travel times of historic events with the presumably well-located recent events. The relocations require only a small change in location for the 1954 event and a larger adjustment in the 1942 epicenter. It also appears that the 1969 earthquake may have been mislocated. The moment estimates are obtained by direct comparison of the maximum amplitudes. The moment estimates imply that the 1968 and not the 1942 earthquake is the largest to have occurred in the region this century. Previous magnitude estimates suggested the 1942 event was larger, see Bent and Helmberger (1991) for details.
ReferencesBent, A. and D. V. Helmberger (1991). Seismic Characteristics of Earthquakes along the offshore
extension of the western transverse ranges, California, BSSA 81, 399-422.Wald, David J. and D. V. Helmberger (1990). Rupture model of the 1989 Loma Prieta earthquake
from the inversion of strong motion and broadband teleseismic data, BSSA in press.Bent, Allison L. and D. V. Helmberger (1991). A re-examination of historic earthquakes in the
San Jacinto fault zone, California, BSSA, in press.
107

1.2
Finite Element Modeling of Fault-Related Deformation in Southern California
Award No. 14-08-0001-G1780
Eugene Humphreys and Ray Weldon Department of Geological Sciences
University of Oregon Eugene, Oregon 97403
The southern California deformation field, and associated uncertainties, are estimated by finite element modeling of a faulted elastic plate. Most significantly, this provides slip rate estimates of the major faults. The faulted plate is driven by (1) the NUVEL Pacific-North America velocity at the model margins, (2) VLBI line-length rate of change data, (3) geologically-estimated fault slip rates, and (4) the fault geometries. An important property of this modeling is that is provides a kinemati- cally consistent solution. A perfect (i.e., strain-free) solution is not possible; rather, we find the deformation field that minimizes the strain energy within the elastic blocks. As such, our use of finite element modeling is solely for kinematic purposes; calculated stresses are simply indications of kinematic misfit. (This is similar to cutting a southern California map into crustal blocks and sliding the pieces so as to best account for the displacement data listed above while minimizing overlap and underlap of the pieces.)
We address the uncertainties associated with our estimated velocity field by driving many simu lations, each with a perturbed data set, and then examining the resulting velocities. The perturbed data are obtained by Monte Carlo sampling over the velocity distribution of each datum, using the cited uncertainties in their values.
Geodetic models (with slip-rate data given very low weight) and geologic models (with no VLBI data) are mutually consistent within 95% confidence at most locations. However, the geodetic models have velocities east of the San Andreas fault that are 2-5 mm/yr greater than the geologic models (velocities with respect to North America). Near VLBI sites at Jet Propulsion Lab and Pear- blossom, both located in major fault zones, motion is better explained by present-day accumulation of elastic strain related to the earthquake cycle than to steady-state fault slip.
The best-fit velocity field is shown in Figure 1. This solution has: the Sierra Nevada-Great Val ley block moving at 10 ±1 mm/yr N44CW±6°; oblique convergence (N8°W±8°) across the central California coastal region at 7 l/2±lV£ mm/yr; relatively rapid north-northwesterly motion of the Mojave (9±1 mm/yr N22°W±16° at Roger Lake); and significant rotation of crust south of the big bend of the San Andreas fault, consistent with 10-15 mm/yr of right-lateral slip west of the Elsinore fault. This figure also shows the variance in the velocity of each element; owing to uncertainties in San Andreas fault slip rate in the Mojave and convergence rates across the western Transverse Ranges, the Transverse Ranges velocities are the least well constrained. Figure 2 shows the resulting fault slip rates. Figure 3 shows the uncertainty in velocity of a few selected points.
An aspect of southern California kinematics that has not been well investigated is the conse quence of a more westerly orientation of the Pacific plate than allowed by the uncertainties admitted by NUVEL. However, a Pacific orientation 5° more westerly than NUVEL reduces the overall strain energy of the model, and results in significantly different velocities of some regions (such as a more westerly Sierra Nevada-Great Valley block and less crustal rotation south of the Transverse Ranges). What the presented deformation maps show is that under the constraint of NUVEL relative Pacific- North America motion, a kinematically reasonable solution is available. All such solutions are simi lar to that shown in the included figures.
Important aspects of this modeling capability are: new data are incorporated easily, and the kinematic consequences of various assumptions (such as assumed fault activity in a region) can be tested easily.
108

1.2
3.7mm/yr
Figure 1. Velocities and uncertainties of joint geologic-geodetic model of southern Califor nia kinematics. Velocities are with respect to North America, and maximum values are the NUVEL Pacific-North America value of 49 mm/yr. Gray shading indicates the variance in velocitv of the shaded element, as indicated with the scale.
109

1.2
100km
Figure 2. Fault slip rates of joint geologic-geodetic model of southern California kinematics. Values are in mm/yr. Open rectangles are "slippery nodes", which allow free slip in the direction indicated by the rectangle orientation; the rate is model determined. Solid rectan gles are "split nodes", which imposes a rate of the indicated amount in the indicated direc tion. Rectangles with circles represent a "cut", which allows complete freedom in rate and orientation; rectangle orientation is model-determined slip orientation. Stars represent triple junctions, which allow freedom of motion.
110

1.2
Roger_Lk_34.90N_117.80W I I 0.9 mm/yrSigma_X = 0.7 mm/yr Mean_X = 2.4 mm/yr Sigma_Y = 1.4 mm/yr Mean_Y = 8.5 mm/yr
11 R
1 \J*&
10.0
9.1
8 1
7.2
6.3
W**T
4.4
//
\
X
#v_
/ /^^y\y
^
vN
1n
y
^
°J O Ot Ot CO N; *? O O r-1 CNJ CO
ME
68.8m
AN
^T
ij/ :
m/yr [^
;
10 10 IT) rf c» TT IT) UJ 1^ OC
Sierran_Block_36.40N_119.60 W I I 0.9 mm/yrSigma_X = 0.6 mm/yr Mean_X = 0.5 mm/yr Sigma_Y = 1.5 mm/yr Mean_Y = 8.9 mm/yr
VNDGI I 0.7 mm/yrSigma_X = 0.5 mm/yr Mean_X = -2.7 mm/yr Sigma_Y = 1.0 mm/yr Mean_Y = 42.0 mm/yr
HO. 1
44.4
yiO O
*rO» 1
42.4
41.7
41.0
40.3
Ow*w
OO.9
1C «J -;
>/^/
L
k^
A4)V_y
\\
> Ji/
1 I I 1 1 1 1 1 1 1 1MEAN
1 1 1 1
42.1 mm/yr
HOSGRI FAULT I I 0.9 mm/yrSigma_X = 0.4 mm/yr Mean_X = -2.7 mm/yr Sigma_Y = 1.5 mm/yr Mean_Y = -7.2 mm/yr
Figure 3 Contoured probability of velocity for selected locations. Rates in mm/yr, proba bility contours are, 30%, 60% and -90% certainty, and the dot is the probability centroid. Vertical axis is velocity parallel to NUVEL Pacific, and horizontal axis is velocity normal to NUVEL Pacific. Inset shows velocity of the centroid, where up is NUVEL parallel. "VAND" represent the VLBI site at Vandenberg.
Ill

1.2
FIELD AND MECHANICAL STUDIES OF EARTHQUAKE GROUND RUPTURESProgram Task No. 1.2
Marie D. Jackson Branch of Igneous and Geothermal Processes
U. S. Geological Survey \ 2255 North Gemini Drive
Flagstaff, Arizona, 86001 FTS 765-7186
Investigations
1. Field and mechanical study of ground cracks associated with the 1974 ML=5.5*and 1983 ML=6.6 Kaoiki, Hawaii, earthquakes.
2. Investigations of late Quaternary movement along the Hat Creek Fault, northeastern California.
Results
1. Kaoiki Seismic Zone
The Kaoiki seismic zone, a young tectonic feature of Mauna Loa volcano, Hawaii, is the site of recurrent moderate-magnitude earthquakes that cause serious damage. Ground rupture zones from the 1983 ML=6.6 earthquake, the 1974 ML=5.5 earthquake, and an older, undated earthquake, all trend N48°E a direction that is nearly parallel to nodal planes of the 1983 and 1974 main shocks' focal mechanism. Individual ruptures consist of arrays of left-stepping, en echelon cracks with predominantly opening displacements, which strike roughly EW, about 30°-50° clockwise from the overall trend of the zones.
Geologic mapping of these rupture zones suggests that the ground cracks are part of a "fracture-process zone" located ahead of the parent fault that, during propagation, stressed the rocks above its tip and induced tensile failure of the near-surface rocks (Pollard et al., 1982). As the coseismic deformation progressed, the opening- mode cracks created in the crack tip region of the parent strike-slip fault coalesced, and crack segments linked to form progressively longer, left-stepping crack arrays that range in length from several tens of meters to several kilometers. Shear displacements were apparently transmitted from the parent faults to the earth's surface through these breakdown zones. An approximate calculation'that uses an estimated fault size and the observed seismic moment, and treats the 1983 Kaoiki earthquake as a Mode-Ill crack, demonstrates that motion along a parent fault that extends to a height of somewhat less than a kilometer below the earth's surface generates sufficient tensile stress above its tip to induce tensile failure parallel to the mapped cracks (Jackson et al., 1988).
Many aftershocks of the 1983 event are strike-slip but an equal number are low-angle thrust events. Based on aftershock data and body-wave modelling, Thurber et al. (1989) suggested that the 1983 rnainshock initiated as a strike-slip event of moderate magnitude that preceded the main moment release on a low-angle thrust fault. An estimate of the seismic moment release from strike-slip motion during
112

1.2
the 1983 mainshock, computed as a geodetic moment from field data, is about one third of the NEIS teleseismically-determined moment for the 1983 earthquake. However, field data and the position of the mainshock hypocenter suggest that a fault plane approximately 12 km by 11 km slipped during the 1983 mainshock. This large fracture apparently formed during a single seismic event. Small but consistent right-lateral displacements across the ground cracks support the first-motion data for strike-slip faulting. These data confirm the importance of right-lateral strike-slip faulting in the Kaoiki seismic zone.
In the past six months, I submitted a manuscript (33 ms. p., 18 figs) to Journal of Geophysical Research, which describes the structure and propagation paths of the 1974 and 1983 Kaoiki ground ruptures, and their relation to the long-term geologic history and recent seismicity of Mauna Loa's SE flank. Summaries of the data presented in this paper have appeared in previous EQHRP reports. I received revi-ews from J. G. R. in mid-April and am currently making revisions to the paper. I am also continuing a collaboration with P. Delaney (U.S.G.S) and P. Segall and T. Arnadottir (both at Stanford)' to further investigate the trilateration data that spans that the 1983 rupture. Results from this analysis will be included in the J.G.R. paper.
2. Hat Creek Fault
The Hat Creek fault, located about 30 km north of Lassen Peak, is the westernmost, and perhaps youngest, expression of Basin and Range normal faulting in northeastern California. The fault is composed of prominent NNW-trending escarpments that offset Quaternary and Pliocene volcanic rocks by more than 300 m. These escarpments, which are modified by erosion to a repose angle of about 35°, form the eastern side of an asymetric graben, along which the Hat Creek Basalt flowed during the Late Pleistocene or Early Holocene (Muffler et al., 1989). Recent slip along the fault forms an 11-km-long, left-stepping scarp as much as 30 m high cutting the Hat Creek Basalt. Stream gravels, estimated to be no more than 15,000 years old (Muffler et al., 1989), overlie the Hat Creek Basalt and were offset as much as 20 m by this youngest faulting. Monoclinal flexures, accomodated in part by slip along columnar joints within the host basalt, join the left-stepping fault segments. These monoclines have S-shaped axial planes and record interactions resulting from components of vertical and small strike-slip motions along the underlying fault.
The average Holocene vertical displacement along the fault has been about 2 mm per year, and the existence of this prominent young scarp in an area of low modern seismicity suggests that movement has been episodic with a periodicity of hundreds, or perhaps thousands of years (Muffler et al., 1989) .
The purpose of this study is to use field data and mechanical analysis to investigate the structure of the Hat Creek fault and to evaluate its earthquake potential. The Hat Creek project will investigate how a normal fault propagates and develops a surface rupture, and how their en echelon segments link to transfer predominantly dip-slip displacements. Field work undertaken by this project will include 1:24,000 mapping of the entire young Hat Creek scarp, detailed 1:5000 scale mapping of critical kilometer-long exposures along the scarp, and 1:1000 scale
113

1.2
mapping of the S-shaped monoclines at two left-steps. Analytical work undertaken will include 1) mechanical analysis of the surface deformation over a growing normal fault and 2) analysis of interactions at left-steps using methods of elasticity and fracture mechanics.
In the past 6 months, I began preparations for mapping the young Hat Creek Fault scarp. This includes 1) designing an aerial photo survey at several scales of the Hat Creek scarp, 2) setting up and calibrating the PG-2 stereographic plotter at the Flagstaff Center and arranging for both reducing and enlargement capabilities, and 3) working with the Photogrammetry Group at Flagstaff to prepare 1:1000 topographic base maps of the S-shaped monoclines. I plan to spend several weeks in the field in August and September, beginning detailed mapping of the scarp.
I am working with Dan Dzurisin (I.G.P./ C.V.O.) to develop a transect of GPS stations across the Hat Creek Rim as part of the proposed Lassen GPS network to be measured this summer.
References cited
Endo, E. T., 1985, Seismotectonic framework for the southeast flankof Mauna Loa volcano, Hawaii: Ph.D. Thesis, Univ. of Wash.,Seattle.
Jackson, M. D., E. T. Endo, P. T. Delaney, 1988, Ground rupture fromthe 1983 Kaoiki earthquake, Mauna Loa volcano, Hawaii (Abs.):Seismological Research Letters, v. 59, p. 35.
Jackson, M. D., and E. T. Endo, 1989, Genesis of a strike-slip faultzone: the 1974 and 1983 Kaoiki ground ruptures, Mauna Loa Volcano,Hawaii (Abs): EOS, v. 70, p. 1409.
Muffler, L. J. P., Clynne, M. A., and Holcomb, R. T., 1989, LateQuaternary faulting of the Hat Creek Basalt (Abs.): EOS, v:"70, p.1310.
Pollard, D. D., P. Segall, P. T. Delaney, 1982, Formation andinterpretation of dilatant echelon cracks: Geological Society ofAmerica Bulletin, v. 93, p. 1291-1303.
Thurber, C. H., Y. Li, and C. Johnson, 1989, Seismic detection of alow-velocity layer beneath the southeast flank of Mauna Loa,Hawaii: Geophys. Res. Let., v. 16, p. 649-652.
Wyss, M., 1986, Regular intervals between Hawaiian earthquakes:Implications for predicting the next event: Science, v. 234, p.726-728.
Reports
Jackson, M. D., and Endo, E. T., submitted. The 1974 and 1983 Kaoiki ground ruptures, Mauna Loa volcano, Hawaii: Journal of Geophysical Research, 33 ms. p., 18 figs., 1 table. Director's approval 3/12/91.
114

1.2
Seismicity Patterns and the Stress State in Sub duct ion-Type Seismogenic Zones
Grant Number 14-08-0001-G1810
Carl Kisslinger and Susanna GrossCooperative Institute for Research in Environmental Sciences
Campus Box 216, University of ColoradoBoulder, Colorado 80309-0216
(303)492-6089
Research during October, 1990 through April, 1991 was directed to the following efforts:(1) further development of the analysis of the effect of stress redistribution by moderate earthquakes on the spatial distribution of smaller earthquakes in the neighborhood; and(2) investigation of an alternative to the modified Omori relation for modeling aftershock sequence decay.
Seismicity-based Stress Model
The seismicity based stress model is a model of the changes in stress expected in the neighborhood of magnitude 4 and greater earthquakes in the central Aleutians. These changes in stress are compared with changes in the spatial distributions of smaller earth quakes nearby. Significant similarities between the changes in stress and the changes in seismicity have been found, especially when the surrounding earthquakes occur within 15 km of the hypocenters of the large earthquakes. The first attempt at a seismicity stress model was reviewed and several improvements made.
The stress field is computed with reference to a coordinate system centered on the large earthquake, with the z direction taken normal to the plane of slip, and x parallel to the slip vector. Four components of the stress tensor have been compared with changes in seismicity. rzz shows the strongest relationship with the seismicity, with decreases in the compression across the fault plane corresponding to increases in seismicity. rxz also shows a relationship to the seismicity, with increases in the shear stress in the same sense of the fault slip being associated with increases in seismicity. ryz and rxx show no relationship to the seismicity. This result suggests that the smaller surrounding earthquakes have a mechanism similar to that of the large earthquake. If conjugate planes were active, TXX would be expected to correlate to changes in seismicity.
115

1.2
The method of assessing the significance of a change in seismicity as related to a change in stress has undergone considerable evolution since the early stages of the model formulation. The stress change from the large earthquake calculated at the hypocenters of small earthquakes comprises a set of numbers. When the small earthquakes are divided into those that occurred before and after the large earthquake, there are two sets of numbers. A comparison between these sets can be made with a t test,
. _ -6 ^
where T\ and TI represents the two sets of stresses, with r being an average, n the number of points in the data set, and a a standard deviation. Assessment of the significance of t was made on the basis that a\ and GI were not necessarily equal, but there is a problem with doing this sort of statistics on earthquakes, because they may not be independent of one another in space or time. The use of t represented an improvement over earlier formulations, but absolute assessment of its significance is still a subject of inquiry.
Investigations of the temporal behaviour of the relationship between modeled stress and seismicity were undertaken during this period. These produced some preliminary results suggesting that the rheology of the crust is not purely elastic. When data before and after all the larger earthquakes were pooled, there were enough smaller earthquakes to break them up into a larger number of time slices. When the normal component of the traction on the slip plane TZZ was averaged in each bin, the plot in Figure 1 resulted.
This figure shows that the similarity between stress and seismicity gradually increasing from the time of the occurrence of the mainshock. The time axis is replaced by the event number, counting all events in the catalog, to smooth out fluctuations in seismicity rate. 1000 events roughly correspond to 15 months. The error bars on the plot are the standard deviations of the means of the stresses in each bin. The gradual increase in similarity between the stress model and the seismicity could be due to a time-dependent friction type of rheology.
An important area of work for the seismicity based stress model is improvement of the source model. The current model is based on an assumed uniform source orientation. To improve it, independent determination of focal mechanisms for about 100 magnitude 4 events in the central Aleutians is needed. Teleseismic data for these events have been read off of CD-ROMs and are being processed. Focal depths from the C ASN network are used to determine take off angles, and the resulting angles and azimuths can be used to find first motion focal mechanisms.
116

1.2
-.01
-.015
00eo £-.025
-.03
-.035
I I I I I I I I I I I I I I 7
I I I I I I I I I I I I I I I I I I
-1000 -500 0 500 Relative Event Number
1000
Figure 1: Average modeled normal stress evaluated at the hypocenters of small nearby earthquakes as a function of relative event number, where 1000 events roughly correspond to 15 months. The error bars are standard deviations of the mean.
117
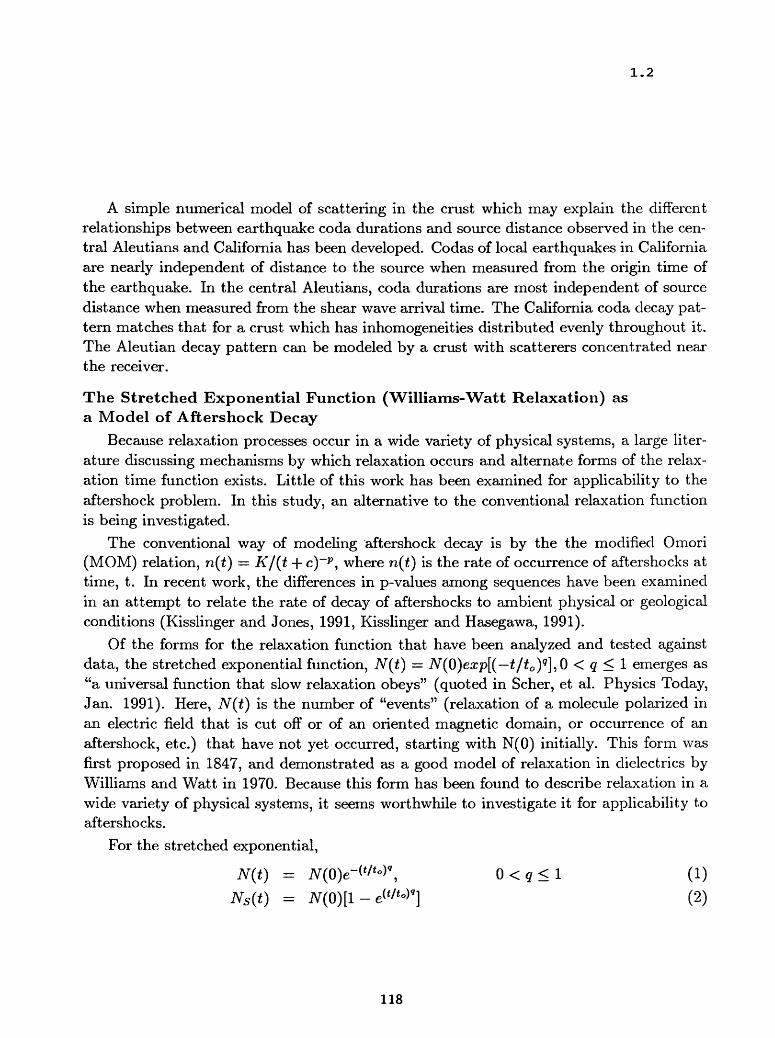
1.2
A simple numerical model of scattering in the crust which may explain the different relationships between earthquake coda durations and source distance observed in the cen tral Aleutians and California has been developed. Codas of local earthquakes in California are nearly independent of distance to the source when measured from the origin time of the earthquake. In the central Aleutians, coda durations are most independent of source distance when measured from the shear wave arrival time. The California coda decay pat tern matches that for a crust which has inhomogeneities distributed evenly throughout it. The Aleutian decay pattern can be modeled by a crust with scatterers concentrated near the receiver.
The Stretched Exponential Function (Williams-Watt Relaxation) as a Model of Aftershock Decay
Because relaxation processes occur in a wide variety of physical systems, a large liter ature discussing mechanisms by which relaxation occurs and alternate forms of the relax ation time function exists. Little of this work has been examined for applicability to the aftershock problem. In this study, an alternative to the conventional relaxation function is being investigated.
The conventional way of modeling aftershock decay is by the the modified Omori (MOM) relation, n(t) = K/(t + c)~p , where n(t) is the rate of occurrence of aftershocks at time, t. In recent work, the differences in p-values among sequences have been examined in an attempt to relate the rate of decay of aftershocks to ambient physical or geological conditions (Kisslinger and Jones, 1991, Kisslinger and Hasegawa, 1991).
Of the forms for the relaxation function that have been analyzed and tested against data, the stretched exponential function, N(t) = N(Q)exp[( t/t0 ) 9],0 < q < 1 emerges as "a universal function that slow relaxation obeys" (quoted in Scher, et al. Physics Today, Jan. 1991). Here, N(t) is the number of "events" (relaxation of a molecule polarized in an electric field that is cut off or of an oriented magnetic domain, or occurrence of an aftershock, etc.) that have not yet occurred, starting with N(0) initially. This form was first proposed in 1847, and demonstrated as a good model of relaxation in dielectrics by Williams and Watt in 1970. Because this form has been found to describe relaxation in a wide variety of physical systems, it seems worthwhile to investigate it for applicability to aftershocks.
For the stretched exponential,
N(t) = 7V(0)e-W°)9 , 0 < q < 1 (1)
Ns(t) = 7V(0)[1 - e^°)9 ] (2)
118

1.2
n(t) = qN(Q)t9- l t?e-WJq . (3)
where N(t) is the number of events that have not yet occurred, starting with N(Q) at t = 0, NS is the cumulative number that have occurred to time £, n(t) is the rate of occurrence at t.
This may be put in a form similar to the MOM relation by letting K = qN(Q)t~q and p = 1 q : n(t) = Kt~pe~Wto) ~p . Here p is always less than 1. For those sequences for which the modified Omori p is greater than 1, the exponential factor, with a small value of t0 , produces the rapid decay rate. For q = l,p = 0, this becomes the straight exponential decay (Debye relaxation).
One more empirical model for aftershock decay would be of limited interest, but the stretched exponential relaxation has been related to a well-defined physical model by others and so the values of parameters resulting from the fit of this function to aftershock data may give additional insight into the physics of the aftershock generating process. Also, a problem with the MOM relation that apparently has not been noted previously is that if p < 1, the cumulative number of aftershocks diverges. Values of p < 1 are frequently found when the MOM relation is fit to real data, though values greater than 1 may be more common. A divergent aftershock series contradicts the postulate that a finite number of sites are loaded at the instant of the mainshock and that these fail at a decreasing rate to produce a sequence with a finite number of aftershocks, toward which the sequence converges more or less slowly. There is no problem for p > 1, as NS converges to N(0) at very long times.
A program for calculating the maximum likelihood estimates of the parameters in the stretched exponential function from aftershock time series has been written and tested for a number of the southern California sequences previously studied. The fits of the modified Omori relation and the stretched exponential function have been compared by use of the Akaike Information Criterion. The quality of fit by this criterion is very similar, with the MOM slightly better in many cases, the stretched exponential distinctly better in a few. Because the stretched exponential function avoids the problem of divergence for slowly decaying sequences modelled by a power law, and the parameter t0 has a clear physical meaning and obvious dependence on ambient physical conditions, especially temperature, further investigation of this model is warranted.
PublicationsKisslinger, C. and L. M. Jones, Properties of aftershock sequences in Southern Califor
nia, accepted for publication in J. Geophys. Research, 96, 1991.
119
1.2
Gross, S. J. and C. Kisslinger, A seismicity-based stress model applied to the central Aleutians (abs), Seism. Res. Lett., 62: 31, 1991.
Gross, S. J. and D. Schmerge, A revised duration magnitude for the Central Aleutians Seismic Network (abs), Seism. Res. Lett., 62: 24, 1991.
120

1.2
Integrated Seismological and Tectonic Studies of the Loma Prieta Earthquake Sequence
Agreement No. 14-08-0001-G1831
A. Lerner-Lam, W. Menke, D. Simpson, W.Y. Kirn, L. Seeber, S. Hough, and K. FischerLamont-Doherty Geological Observatory
Palisades, N.Y. 10964
(914) 359-2900
OverviewFollowing the October 17, 1989 Loma Prieta earthquake, an array of 22 IRIS/PASSCAL
(Incorporated Research Institutions for Seismology/Program for Array Studies of the Continen tal Lithosphere) instruments was deployed in the epicentral area in the Santa Cruz Mountains (Figure 1; Simpson et al., 1989). Eleven of these instruments were installed by October 22; the remainder were installed before October 29 of 1989. The instruments remained in place through November.
We have undertaken an integrated approach for using aftershock recordings to examine the structure of the Southern Santa Cruz Mountains segment of the San Andreas Fault (SAP). Both IRIS/PASSCAL and CALNET phase data have been used to relocate events and to obtain focal mechanisms for over 1000 Loma Prieta aftershocks. The IRIS/PASSCAL waveform recordings have been used to study both the stress drop of a subset of aftershocks and the regional attenuation structure. Studies of both seismicity and aftershock waveforms are used to elucidate the complex fault zone structure in the vicinity of the Loma Prieta rupture and to understand the mainshock-aftershock rupture processes.
Data ProcessingAftershock waveform data were recorded on 3-component L-22 2-Hz velocity sensors
paired with IRIS/PASSCAL RefTek recorders. Sampling was at 200 sps, with high- and low- gain recordings. Triggering was via STA/LTA comparisons with a threshhold of 4.5. Instru ment response is theoretically flat to velocity between =3 and 100 Hz; Menke et al. (1991) bench-tested the sensors following the aftershock deployment and showed the L-22 to be free of spurious resonances only for frequencies below 25 Hz.
The IRIS/PASSCAL data set consists of 763 m>1.5 events that have been associated with events in the CALNET catalog. Preliminary CALNET event hypocenters were relocated using path-dependent station corrections generated using 20 years of CALNET phase data (Seeber and Armbruster, 1990). Visual inspection of waveforms suggest that these relocations can provide a significant improvement in (at least) relative event locations. The correlation between hypocenter proximity and waveform similarity improved significantly from the prelim inary to the relocated hypocenters.
Results I: Structure of the Fault Zone from Focal Mechanism ObservationsFirst-motion focal mechanisms were determined for more than 200 aftershocks in a
volume beneath the PASSCAL array deployment extending from the surface to 20 km depth. First motions were obtained from both the PASSCAL and CALNET arrays but the densely- spaced PASSCAL array provided improved coverage of the focal sphere for the shallowest aft ershocks. Focal mechanisms were determined using a grid-search algorithm and were assessed using a statistical model based on the binomual distribution (Guo et al., 1990).
121

1.2
The directions of the compressional (P) axes of 151 well-determined focal mechanisms were averaged in 2 km-thick depth intervals and the variability was determined by computing the standard deviation of the P-axis azimuth. About 70% of the P-axes of events below 4 km lie within a 90-degree quandrant with a mean consistent with the main shock focal mechanism. The shallower aftershocks are also consistent with the P-axes azimuth of the main shock, but the scatter in azimuth is reduced by about 50%. Moreover, the hypocenters of the shallow aft ershocks do not appear to lie on the extension of a plane defined by the deeper aftershocks and are scattered in a broader zone.
The lateral distribution of both aftershock and pre-Loma Prieta focal mechanisms provide further insight into the nature of fault complexity (e.g. Seeber and Armbruster, 1990). When viewed down-dip (Rgure Ib), pre-Loma Prieta hypocenters of the Lake Elsman source and 1989 aftershocks are spatially distinct. In fact, they seem to be mutually exclusive, suggesting that structures that were active during the precursory period were inactive during the aftershock sequence (with the prominant exception of the northern creeping section of the SAP).
Pre-Loma Prieta hypocenters are clustered within the foot wall of the Loma Prieta rup ture, on a set of secondary faults that branch off the main fault (Figure 1). Like the main fault, these secondary faults move right-laterally with a large component of reverse motion, but, unlike the main rupture, they dip northeast and the motion is consistently up on the northeast side. The seismicity provides a precursory signal with a strong burst close in space and time to the nucleation point of the main shock (i.e. the Lake Elsman events). This seismicity origni- ates from secondary faults antithetic to the main rupture. Perhaps the most significant aspect of the seismicity during 20 years prior to Loma Prieta is the absence of earthquakes on the upcoming rupture (Figure Ib).
While not detracting from the hypothesis of total stress drop, an investigation into the 3- dimensional variability of aftershock focal mechanisms does yield systematic patterns that sug gest interactions with neighboring elements of the fault zone. Focal mechanisms tend to be similar to each other and to the main shock mechanism-a mixture of reverse and right-lateral slip along the southestern side and, to a lesser extent, along the upper northwestern rim of the rupture. These are the portions of the rupture rim that intersect the main shock slip vector at large angles.
The persistent intense aftershock zone along the lower southeast rim suggest post-seismic creep down-dip of that zone. Many of the mechanisms share with the main shock similar slip vector projections on the rupture plane, but have distinct nodal planes. These events probably rupture secondary faults within the fault zone which accommodate an overall kinematics simi lar to the main shock.
Strike-slip dominates on the southeast side, at the juncture with the creeping segment, reverse slip dominates on the northwest side, toward the juncture with a locked segment. This pattern of slip resembles the slip distribution in the main shock rupture resolved from near-field seismograms. This asymmetric distribution of slip is consistent with the 1989 rupture being confined on the northwest by a locked and highly stressed portion of the fault and on the southeast by a weak and creeping portion of the fault.
Results II: Structure of the Fault zone from Waveform AnalysisPrevious studies have shown that it is difficult to independently resolve source properties
of small earthquakes and attenuation. We have analyzed a subset of the IRIS/PASSCAL data set using an empirical Green's function method, where-by the recording of a small event is used to deconvolve path and site effects from the recording of a nearby larger event (Hough et al., 1991). In a pilot project using data from a prelimanary data set containing 55 events, we find 4 pairs of events suitable for empirical Green's function analysis. We also analyze waveforms from an additional 8 events that occur close to these pairs.
We show that the largest aftershocks are well-modelled by an omega-square source spec trum and we obtain estimates of the P -wave corner frequency for a total of 15 events. Brune
122

1.2
stress drops are observed to have no systematic variation over the range of moments spanned by the data set, down to 1019 dyne*cm. There is a suggestion that aftershocks that occured outside the mainshock rupture have higher stress drops than those that occured within the main shock rupture.
A m/=3.4 foreshock in the subsequence associated with the 4/18/90 ATI/=5.4 Watsonville earthquake yields a stress drop estimate of 820 bars. This value is well outside the stress drops obtained for all other events (6 to 266 bars).
Site-specific attenuation parameters suggest large lateral and vertical heterogeneity in P - wave attenuation structure (Figure 2). Station HOLY, in a valley near the surface trace of the SAP, is characterized by low Q values, while stations to the north of the aftershock zone are characterized by the highest Q values. Paths that travel to the surface along strike of the main shock rupture plane to station HOLY yield Q values of 75-90, while paths that travel though the hanging wall yield Q values closer to 150. These low-Q values can not be plausibly explained by attenuation within very shallow near-surface sediments. Low whole-path Q values are obtained from both shallow and deep events whose paths traverse along strike of the fault zone, suggesting that attenuation above 4-6 km is comparable to that in the fault zone at depth. This further suggests that a significant fault zone continues from the top of the main shock rupture to the surface.
Whole-path Q values for paths 50-70 km long are significantly higher than estimates for paths 20-40 km long (e.g. 275-850 vs 70-290, respectively), suggesting a significant increase of Q with depth.
We also conducted a study of spectral ratios from pairs of stations in the PASSCAL array using one station near the fault trace and one west of it (Menke, 1990). Anomalously low spectral ratios, indicating anomalously high attenuation, are observed for a substantial number of events, especially events in the deeper half of the main shock rupture. These results also suggest high attenuation along the fault zone.
Velocity Structure from Loma Preita RecordingsWe have conducted synthetic experiments using the actual distribution of sources and
receivers at Loma Prieta (Caress et al., 1990). These studies show that the dense sampling of the aftershock zone is sufficient to resolve heterogeneities on the scale of a 1-km thick low- velocity zone. We trace rays through a 3-dimensional model that contains low velocities in the volume defined by the aftershock seismicity. Raypaths, travel times, and their partial deriva tives are calculated analytically. We orthogonalize the inverse problem with respect to the source location and solve for the velocity perturbation that minimizes the sum of the 2-norm of the travel-time misfit. We invert the resulting travel times (assigned Gaussian-distributed errors with a standard deviation of 0.05 s) and retrieve a well-resolved image of the original structure.
Summary and ConclusionsWe suggest that the high scatter in P-axis orientations within the main shock rupture and
the difference between on-rupture and off-rupture stress drop are consistent with a model in which the Loma Prieta event removed most of the stress load within the mainshock rupture as delineated by the early aftershocks. From the reduced variability in the orientation of shallow P-axes, the high stress drop of off-rupture events, and the inferred 3-dimensional attenuation structure, we conclude that increased or significant residual stress may exist on a complex sys tem of shallow faults. Our results may be diagnostic of a situation in which the Santa Cruz segment of the San Andreas is segmented down-dip and can produce several distinct charac teristic earthquakes. Further, the shallow stress may be relieved by post-main shock seismic or aseismic movement on a complex system of shallow thrust and strike slip faults.
123

1.2
Publications
Caress, D.W., K.M. Fischer, and A. Lemer-Lam (1990). Tomographic imaging of the Loma Prieta rupture zone, (abstract), Trans. Am. Geophys. U. 71, 562.
Guo, H., A. Lemer-Lam, J.G. Armbruster, and Z. Tu (1990). Variability of small-aftershock focal mechanisms in the Loma Prieta rupture zone from PASSCAL and CALNET data, (abstract), Trans. Am. Geophys. U..
Hough, S.E., L. Seeber, A. Lemer-Lam, J. Armbruster, and H. Guo (1991). Empirical Green's function analysis of Loma Prieta aftershocks, submitted to Bull. Seism. Soc. Am.
Menke, W. (1990). Evidence for high attenuation along the San Andreas fault in the Loma Prieta aftershock zone (abstract), Trans. Am. Geophys. U. 71, 1471.
Menke, W., L. Shengold, H. Guo, G. Hu, and A. Lemer-Lam (1991). Performance of the short-period geophones of the IRIS/PASSCAL array, Bull. Seism. Soc. Am 81, 232-242.
Seeber, L. and J.G. Armbruster (1990). Fault Kinematics in the 1989 Loma Prieta rupture area during 20 years before that event, Geophys. Res. Lett. 17, 1425-1428.
124

1.2
NW
4
6
8
10
12
14
16
18
DISTANCE ALONG STRIKE (KM)5 9 13 17 21 25 29 33 37i i i t i i i t i i i i i i i
450400350300250200150100500
total slip (cm)
C* OoO,
<f$t&+:Po& *
37.357 122.099
ii
10
20.
SE
t \ T L.
^ MS X
36.969 -121.526
Figure 1. Face (C) and dip (B) view of rupture. Dip view shows hypocenters (+'s are aft ershocks; o's are before the main shock). Face view shows slip vecotrs. The narrow band selected for the face view (6 km wide; indicated in dip view) includes some seismi- city clearly off the main fault; most seismicity above dashed line is not on the main fault. Dip view includes only seismicity deeper than about 6 km. The two M =5 Lake Ellsman events are part of the western-most cluster north of the rupture. Compare with total slip distribution for the main shock (A; from Steidl et al., 1991; sections are prop erly aligned and at the same scale). Segmentation of rupture surface suggested by seismicity (e.g. dip view) shows correlation with zones of distinct slip.
125
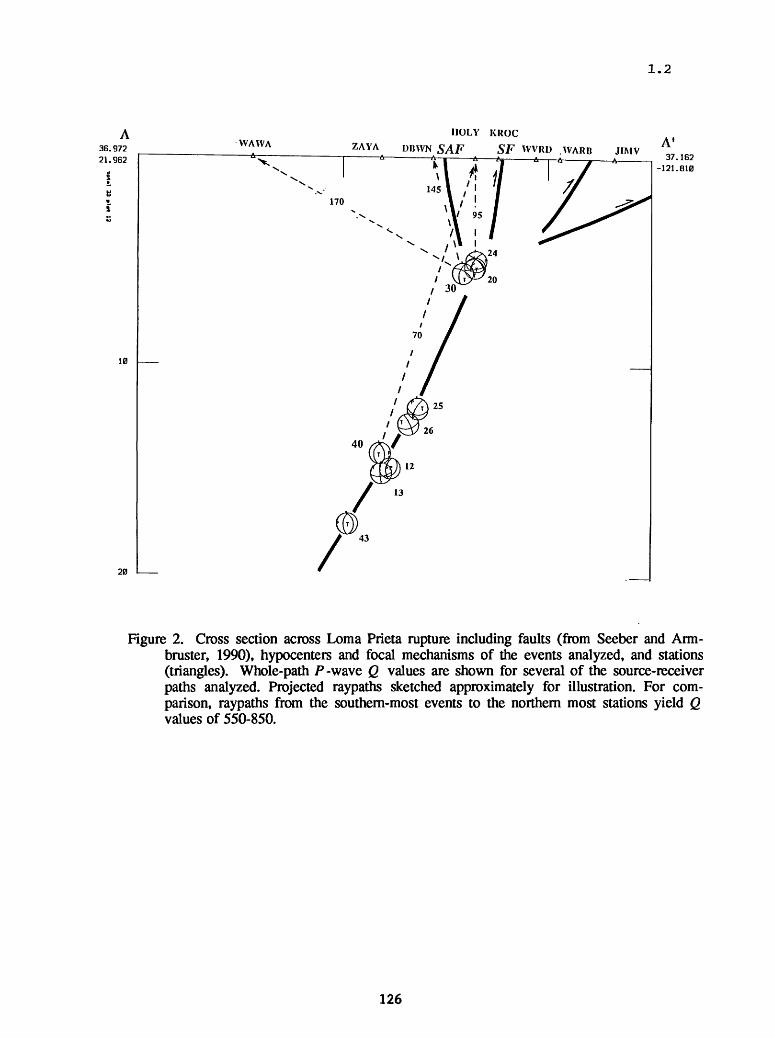
1.2
A36.97221.962
VVAWA
10
20
HOLY KROC
ZAYA DIHVN SAP SF WVRD .WARD JIMV
170
13
43
A'37.162
-121.810
Figure 2. Cross section across Loma Prieta rupture including faults (from Seeber and Arm- bruster, 1990), hypocenters and focal mechanisms of the events analyzed, and stations (triangles). Whole-path P -wave Q values are shown for several of the source-receiver paths analyzed. Projected raypaths sketched approximately for illustration. For com parison, raypaths from the southern-most events to the northern most stations yield Q values of 550-850.
126

1.2
Slip History of San Andreas and Hay ward faults
9910-04192
J. J. Lienkaemper Branch of Engineering Seismology and Geology
U.S. Geological Survey345 Middlefield Road, MS 977Menlo Park, California 94025
(415) 329-5642
InvestigationsDetermine slip rates and earthquake recurrence times on San Andreas and Hayward faults. Compare rates of geologically determined surface slip to rates of historic creep and geodetically determined deep slip. Analyze effects of structural complexity and fault segmentation upon inferring recurrence from slip rate.
Results1. Earlier Work. Along most of the Hayward fault, offset features yield creep rates of 3.5- 6.5 mm/yr over decades, but a 4-km-long segment in south Fremont has crept at 8.5-9.5 mm/yr [Lienkaemper and Borchardt, 1990; Lienkaemper et al., in review]
USGS/GDMG trenching in central Fremont 1986-1987 [Borchardt et al., in review] showed a Holocene slip rate of 5 mm/yr which may be too low because it excludes much of the 200-m-wide fault zone. Thus the ~9 mm/yr creep rate in south Fremont may better represent the full long-term slip rate on the fault. To test this possibility, in 1989 and 1990 we trenched at the Masonic site in Union City where the fault seems narrower.
2. Quaternary Slip Rates. Masonic Site. We identified 6 buried fan units offset by the fault by: C) 0-20 m, E) 40 ± 6 m, G) 66 ± 5 m, I) 88 ± 5 m, K) 131 ± 6 m, and M) 167 ± 6 m. Radiocarbon dates constrain slip rate for 3 units: 1) >7.2 and <8.6 mm/yr on E (~ 5 ka), 8.0 ± 0.6 mm/yr (8.3 ka) on G, and <9.2 mm/yr (14.2 ka BP) on K. The rate of unit G, 8 mm/yr, is distinctly more reliable than the other two because the age of onset for the unit is especially well-constrained. More trenching and radiocarbon dating may improve the measurements. We cannot yet distinguish changes in slip rate during latest Quaternary and Holocene at this site.
The Masonic slip rate is only 8 mm/yr, but such geologic rates are often minima because faults are wide compared to lengths of slip markers. Our goal at Masonic site was to inquire if the 9 mm/yr creep in south Fremont might reasonably approximate long-term slip rate for the entire Hayward fault. The Masonic rate supports this proposal, but we may still underestimate the full slip rate of the Hayward fault, because the 9-mm/yr creep segment in Fremont had surface rupture in 1868.
ReportsBorchardt, G., J. J. Lienkaemper, and K. Budding, Holocene slip rate of the Hayward
fault at Fremont, California: in review.
Lienkaemper, J. J., and G. Borchardt, Holocene slip rate of the Hayward fault at Union City, California (abstr.): Seism. Res. Letts. 62, 14, 1991.
Lienkaemper, J. J., G. Borchardt, and M. Lisowski, Historic creep rate and potential for seismic slip along the Hayward fault, California: submitted to JGR.
127

1.2
Shear-wave birefringence and P- & S-wave delay times in the New Madrid seismic zone
Agreement No. 14-08-0001-G1995
Robert P. Meyer and Xiao R. Shih Department of Geology and Geophysics
University of Wisconsin-Madison1215 West Dayton Street, Madison, Wisconsin 53706
(608) 262-1698
Scientific objectives of the project.The University of Wisconsin (UW) deployed an array of 3-component digital
instruments in the New Madrid seismic zone to investigate past and present rifting and faulting in the crust and upper mantle. We plan to use P and S time delays from both local and teleseismic events to look for velocity anomalies in a greater depth interval than previous seismic studies in the area, with the time delays from crustal path constrained by the results of the USGS refraction study (Mooney et al., 1983). At individual stations, seismic anisotropy inferred from shear-wave birefringence should reveal tectonic stress vectors that induce microfracture alignment in the upper crust and the preferred crystal-lattice orientation of rock fabrics in the crust and upper mantle.
The project consists of two phases. Phase I, which is a reconnaissance phase, is funded under the above agreement starting 15 February 1991.
Deployment in the New Madrid seismic zoneAn array of 12 UW three-component digital seismographs and five PASSCAL
Reftek instruments was deployed in the seismic zone from 9 February to 5 April (Figure 1). Station spacing varied from 10 to 30 km due in part to considerable difficulty in finding quiet, unflooded sites in the embayment. The cross-shaped array extended approximately 130 km parallel to the embayment and 150 km perpendicular to the embayment, following USGS refraction lines.
During the deployment, the UW instruments were set to trigger on either local or teleseismic events, and to record at 50 samples/sec, after each trigger, for 60 seconds or 15 minutes, respectively. The Reftek seismographs were set to record continuously at 20 samples/sec. The seismometers used have 1 Hz natural frequency, i.e., Hall-Sears HS10-1 for all UW and two Reftek seismographs, and Geotech S13 for three Reftek seismographs. To evaluate response and performance of these instruments, we collocated the UW instrument with Reftek seismograph at four sites, and collocated a UW or Reftek seismograph with the PANDA (Portable Array of Numerical Data Acquisition) instruments of Memphis State University at three sites, including one site installed with UW, Reftek, and PANDA instruments (Figure 1).
128
1.2
The field observation was approximately 60 days limited by (1) PASSCAL Reftek instruments needing to be returned by early April, and (2) increasing noise level due to farming activities in spring.
Data reduction and analysisUp to date (three months after the beginning of the project), we have
completed transcribing data. Locations of numerous local and regional events have been provided by the PANDA array (Figures 1), and will also be provided by the local permanent networks in the area. Table 1 lists the 35 teleseismic events and number of stations that recorded each event during the deployment, based on comparison between the bi-weekly QDE report and the cluster of UW instrument triggers (minimum three triggers). Most of them have clear P phases (Figure 2a and b), but fewer have good S phases (Figure 2c).
We have gained experience on setting different instrument trigger ratio and gain depending on the noise level and ground condition in the embayment and adjacent highlands. Still at a stage of data reduction, our current analysis includes (1) searching for procedures to separate a teleseismic event from local events or noise, and (2) comparing data collected by different instruments, and different seismometers at collocating sites on aspects of frequency content and signal-to-noise ratio (Figure 2).
On necessity of Phase II deploymentPhase I of the New Madrid seismic zone deployment has shown that good P
and S phases from both teleseismic and local earthquakes can be recorded by the portable digital instruments at the same site. It was also an opportunity to test the seismographs in a wet, windy, and cold environment. The current data set consists of teleseismic S phases at all sites, and S phases from some local events under the embayment sites for shear-wave birefringence analysis. However, more P and S phases with a better azimuthal coverage must be obtained in order to derive meaningful anomalies through P and S time delays.
In the proposed phase II of the deployment, we plan to use the four winter months when the noise level is at minimum. The key to the winter deployment is the retirement of tape recorders in UW seismographs, the only cold-limiting component in the instrument. They will be replaced by disks, which are now proved to work at -20°C. Modifications to accommodate this is in progress.
Reference citedMooney, W.D., M.C. Andrews, A. Ginzburg, D.A. Peters, and R.M. Hamilton,
1983. Crustal structure of the northern Mississippi Embayment and a comparison with other continental rift zones, Tectonophysics, 94: 327-334.
129

New
M
ad
rid
S
eis
mic
Z
on
e
Stu
dy
UW
1
99
1T
able
1. T
eles
eism
ic E
vent
s N
o.
Yea
r D
ay
Tim
eL
ncn
tin
nS
ts.
90.5
°W90
°W89
.5°W
89°W
Fig
ure
1. T
he U
W d
eplo
ymen
t in
the
New
Mad
rid
seis
mic
zon
e. T
he
cros
s-sh
aped
arr
ay c
onsi
sted
of U
W i
nstr
umen
t (o
pen
squa
res)
, an
d R
efte
k in
stru
men
t (h
exag
ons)
, so
me
of w
hich
wer
e co
lloca
ted
wit
h PA
ND
A s
tati
ons
(sta
rs).
Loc
atio
ns o
f ear
thqu
akes
(di
amon
ds)
duri
ng
the
depl
oym
ent
(2/9
-4/5
) sh
own
here
wer
e de
term
ined
by
the
PAN
DA
arr
ay d
ata.
01
1991
2
12
21 4
2 29
.6
Loy
alty
Is.
3
02
1991
2
14
1
63
722.5
G
ulf
of C
A
603
19
91
2 14
23
3121.3
E
aste
r Is
. 7
04
1991
2
16
01 2
3 40
.9
Kur
il I
s.
1005
19
91
2 18
02
37
28.6
P
hili
ppin
e Is
. 8
06
1991
2
18
05 5
5 50
.8
Mex
ico-
Gua
t. 12
07
1991
2
20
04 4
8 07
.2
Eas
ter
Is.
1308
19
91
2 20
21
46
22.4
P
apua
N.
Gui
nea
709
19
91
22
0
232627.1
G
ulf
of C
A
810
19
91
2 21
02
35
32.4
B
erin
g S
ea
1311
19
91
2 23
02
42
39.3
N
icar
agua
7
12
1991
2
24
11 5
8 22
.8
El
Sal
vado
r 8
13
1991
2
26
072547.1
T
yrrh
enia
n S
ea
914
19
91
227
08
34
35.3
A
rgen
tina
9
15
1991
3
01
01 5
7 03
.2
Cen
tral
Sib
eria
5
16
1991
3
01
17 3
0 26
.5
Cos
ta R
ica
817
19
91
3 02
03
32
11.9
G
uate
mal
a 6
18
1991
3
05
134907.7
C
.Am
eric
a 7
19
1991
3
05
22 3
5 47
.3
S. S
umat
era
720
19
91
3 08
09
02
21.6
E
. S
iber
ia
921
19
91
3 08
11
36 3
0.9
E.
Sib
eria
13
22
1991
3
08
11 5
5 01
.0
E.
Sib
eria
13
23
1991
3
10
12 2
8 26
.7
Col
ombi
a 6
24
1991
3
14
15 5
7 52
.2
Ale
utia
n Is
. 7
25
1991
315
185055
.8
Arg
enti
na
526
19
91
3 16
06
02
10.6
C
osta
Ric
a 10
27
1991
3
17
06 2
6 52
.2
E.
Sib
eria
4
28
1991
3
19
10 5
6 17
.2
Col
ombi
a 4
29
1991
3
19
12 0
9 24
.3
Cre
te
430
19
91
3 21
05
53
13.3
P
eru
431
19
91
32
6
1234
57
.7
Dom
inic
a 9
32
1991
4
01
05 0
3 58
.1
Mex
ico
533
19
91
40
1
073446.4
M
exic
o 8
34
1991
4
01
090125.2
M
exic
o 5
35
1991
404
0322
58.4
S
.Pan
ama
8

u>
560
(C)
Figu
re 2
. P
and
S a
rriv
als
of a
tel
esei
smic
eve
nt f
rom
Ber
ing
Sea,
MB
= 6.
3, o
n Fe
b. 2
1. (
a) P
arr
ival
on
the
vert
ical
co
mpo
nent
at
nine
sei
smog
raph
s. H
oriz
onta
l sc
ale
is i
n se
cond
s. P
IO a
nd R
PIO
, 12
0 an
d R
I20
are
collo
cate
d U
W a
nd
Ref
tek
seis
mog
raph
s, (
b) P
arr
ival
s on
ver
tica
l co
mpo
nent
aft
er 2
-8 s
ban
d-pa
ss f
ilte
r at
col
loca
ted
UW
and
Ref
tek
seis
mog
raph
s, w
here
Ref
tek
at R
I20
was
con
nect
ed t
o H
S10-
1 se
ism
omet
ers,
and
that
at
RPI
O w
as c
onne
cted
to
S13
seis
mom
eter
s. T
o m
ake
the
wav
e fo
rms
at t
he d
iffe
rent
ins
trum
ents
com
para
ble,
a 1
0-s
high
-pas
s fi
lter
was
app
lied
to t
he
Ref
tek
reco
rds
at e
ach
stat
ion
(RI2
0f a
nd R
PlO
f).
(c)
S ar
riva
ls o
n N
S an
d E
W c
ompo
nent
s at
sei
smog
raph
P09
and
co
lloca
ted
seis
mog
raph
s PI
O a
nd R
PIO
. A
2-8
s b
and-
pass
fil
ter
was
app
lied
to e
ach
trac
e, a
nd t
he h
igh-
pass
fil
ter
was
al
so a
pplie
d to
Ref
tek
reco
rd.
H
NJ

1.2
Fault Interaction, Segmentation, and Geometry along the San Andreas Fault System, Southern California
14-08-0001-G1984
Craig NicholsonInstitute for Crustal Studies, University of California
Santa Barbara, California 93106805-893-8384
PROJECT PLAN
1) Convert the analog FM-tapes from the 5-day portable recorders deployed in the epicentral region of the 1986 North Palm Springs (NFS) earthquake into digital data and incorporate the digital data into the event database. This requires the use of the USGS playback system in Menlo Park. The digital data will then be examined to determine accurate arrival times and polarities of P- and S-waves, and better spatial resolution of aftershock source characteristics. This task can only be performed if the playback system is operational, and the converted digital data are made available to this project Digital data from the portable GEOS instruments have already begun to be examined and analyzed [e.g., Mori andFrankel, 1990].
2) Invert the phase data from all the portable and permanent regional stations for improved station corrections, revised earthquake hypocenters, and the local 3-dimensional velocity structure in the northern Coachella Valley. Analyze the resulting improved earthquake hypocenters and single- event focal mechanisms to identify patterns of interacting subsurface faults involved in the 1986 NPS sequence.
3) Examine available historical records of the 1948 Desert Hot Springs (DHS) earthquake to improve our understanding of the location, magnitude, moment and possible fault geometry involved during this earlier seismic rupture of the southern San Andreas fault.
PROGRESS
This project began on 1 March 1991; this report documents progress through 24 April 1991.
1) The Branch of Seismology in Menlo Park has been contacted regarding the digitization of the NPS 5-day analog tapes. The tapes have been found, but the playback system is apparently not fully operational at present We are currently awaiting further developments to determine exactly if and when the data can be digitized, and if a specific time period can be scheduled for use of the Menlo Park playback system.
2) A preliminary high-resolution tomographic inversion of P-arrival times in the vicinity of the NPS earthquakes has already been performed [Lees and Nicholson, 1990] to produce preliminary images of 3-D velocity perturbations. The inversion was based largely on data from the regional network of telemetered stations and the portable GEOS recorders. We are awaiting the digital data from the eight 5-day analog recorders to expand the data set, increase resolution, and perform a similar inversion using S-wave arrivals. The preliminary tomographic images of velocity perturbation within the northern Coachella Valley reveal high-velocity anomalies in the region along the fault responsible for most of seismic slip during the NPS mainshock [Hartzell, 1989] and most of the aftershock hypocenters [Nicholson et al., 1986], suggesting that the distribution of high-velocity anomalies outline the asperity responsible for the earthquake.
132

1.2
3) Requests for copies of historical seismograms of the 1948 DHS earthquake have been sent to nearly all the observatories that recorded the event. Nearfield records at Berkeley and Caltech particularly from the portable stations deployed by Caltech in the epicentral region immediately following the 1948 event have already been examined [Nicholson et al., 1987]. Copies of regional and teleseismic records at stations SEA, VIC, OTT, HAL, FLO, SLM, CLE, WES, NOL, LPZ, and DBN have already been received. Useful records are expected from additional European and Pacific area stations, and from regional stations archived with the USGS in Denver. ITiese later stations include: TUO, SIT, COL, SLC, BUF, BER, and SJP, as well as possible records from PFA, BDA, BCN, BUT, BZM, RCD, CHK, PHI, and CSC. However, I have yet to get a response from the USGS historical archives regarding availability of various seismograms.
Preliminary results indicate that the 1948 DHS event likely ruptured the adjacent segment along the Banning fault to the southeast of the 1986 NFS earthquake. The preliminary focal mechanism based on the P-wave first-motions is oblique strike-slip with a small reverse component; the fault likely dips NE at 60°-70°; the moment magnitude is more likely Mw 6.2 than 6.5; and the focal depth of the mainshock is approximately 12 km [Nicholson, 1987; Nicholson et al., 1987].
I have also been working closely with Tom Boyd, Diane Doser, Steve Hartzell, Hiroo Kanamori, John Na*b£lek, Lisa Wald, and Terry Wallace about availability of various station records, forward and inverse modelling of regional and teleseismic records for seismic source parameters, appropriate Green's functions, instrument responses, and digitizing old records.
REFERENCES
Hartzell, S. (1989). Comparison of seismic waveform inversion results for the rupture history of afinite fault: Application to the 1986 North Palm Springs, California, earthquake, /. Geophys.Res., 94, 7515-7534.
Lees, J.M., and C. Nicholson, High resolution travel-time tomography in the northern CoachellaValley from inversion of aftershock arrival times of the 1986 ML 5.9 North Palm SpringsEarthquake, Seismol. Res. Lett., 61, 48, 1990.
Nicholson, C., R.L. Wesson, D. Given, J. Boatwright and C.R. Alien (1986). Aftershocks of the1986 North Palm Springs earthquake and relocation of the 1948 Desert Hot Springs earthquakesequence (abstract), EOS Trans. AGU, 67, 1089-1090.
Nicholson, C., Seismic slip on the southern San Andreas fault: 1948 and 1986 (abstract), Seismol.Res. Lett. (Earthquake Notes), 58, 14 (1987).
Nicholson, C., H. Kanamori and C.R. Alien, Comparison of the 1986 and 1948 earthquake alongthe southern San Andreas fault, Coachella valley, California (abstract), EOS Trans. AGU, 68,1362 (1987).
Mori, J. and A. Frankel, Source parameters for small events associated with the 1986 North PalmSprings, California, earthquake determined using empirical Green functions, Bull. Seismol.Soc. Am., 80, 278-295.
133

1.2
Earthquake Research in the Eastern Sierra Nevada Western Great Basin Region
Contract 14-08-0001-C1524, 1 Nov 1990 - 30 Mar 1991
W.A. Peppin and D.M. dePoloSeismological Laboratory, MS 168
University of NevadaReno, NV 89557(702) 784-4218
Investigations
This contract supports continued research focused on the eastern Sierra Nevada and western Great Basin region. We have investigated: (1) the 24 October 1990 Lee Vining earthquake and its aftershocks, (2) pulse-width studies for estimates of stress drops, (3) mantle anisotropy under the western U.S. Some of these results are described below.
Results
(1) The Lee Vining Earthquake
An earthquake sequence occurred beginning at 06:15:20.51 GCT along the eastern Sierra Nevada north of Lee Vining, California, 38.052 N, 119.121 W, with an event of magnitude 5.0 at a focal depth of 11.6 km (Horton, dePolo and Walter, 1991). Portable event recorders were deployed to record the aftershocks, and these were used to perform a master event location of the aftershock dataset. As with essentially all of the larger earthquakes which have occurred along the eastern Sierra from Susanville, California to Bishop, this event was dominantly strikeslip, Figure !_. Because the larger event and several of its aftershockswere recorded on the University of Nevada digital array, and because the mechanisms of the aftershocks were similar to that of the mainshock, it was possible to deconvolve the smaller events from the larger ones to obtain direct estimates of the source following Mueller (1985) and subsequent authors. For the largest event, deconvolution yielded a seismic moment of 3.0e23 dyn-cm and a source duration of 0.54 second, which gives 31 bars for the Brune stress drop.
An effort was made to determine which of the two focal planes for the mainshock was the plane of faulting. Note in Figure 1 that the aftershocks define an ENE trend perpendicular to the mountain front. Pulse widths of these earthquakes were read on the University of Nevada network, and the variation of pulse width with azimuth was analyzed, 18 pulse-width observations. These showed a pattern more consistent with rupture on the NNW-trending fault plane. This work is described in a manuscript in preparation.
(2). Pulse-Width Studies
134

1.2
Smith and Priestley (1991) have finished the of stress drops as obtained by the pulse-width method of Frankel and Kanamori (1983), Smith and Priestley (1991). Their results are significant for use in arrays such as ours where most of the signals are uncalibrated vertical waveforms. Their results show low stress drop in the region believed to have ruptured in the main event of the 1984 Round Valley sequence and higher stresses around the edges of this zone. This result is similar to the results found by Mori and Frankel (1990) for aftershocks of the Palm Springs earthquake: higher stress drops occur around the edges of the presumed rupture.
At this writing, Smith and Priestley have completed reading pulse widths for the larger Chalfant Valley data set. This work will be presented in Ken Smith's Ph.D. dissertation.
Peppin, dePolo, Priestley and Brune have completed pulse width studies of the 1980 Mammoth Lakes aftershock sequence recorded by portable digital instrumentation operated by the U.S. Geological Survey. Records analyzed include the larger events of the sequence as presented by Archuleta and others (1982). Estimated stress drops obtained using the method of Frankel and Kanamori (1983) are substantially higher than reported by Archuleta and others (1982), comparable with the results obtained by Lindley and Archuleta (1990) in their reanalysis of this sequence. The data (Figure 2) show no sign of departure from similarity at moments less than 10E21 dyn-cm, but the observations are scattered owing to the short pulse widths of many of these observations and the attendent uncertainty this attaches to the estimates of stress drop.
(3). Anisotropy Studies.
Martha Savage and coworkers continue their study of upper-mantle anisotropy under the western United States using data from the UNR, Berkeley, and Caltech networks. The results of a quite voluminous data analysis are shown in Figure _3. In this figure, the shear-wave splitting measurements are shown of the dominant directions of anisotropy for the phases SKS and SKKS at all depth, and for S phases from sources deeper than 400 km. The bars by each station name designate average direction of fast directions of anisotropy for that site, with the circle size proportional to the time lag between extremal S-wave arrivals. The station ORV alone shows no detectable component of velocity splitting. The numbered sites represent data obtained from portable recorders. The observations at SCZ are from Ansel and Nataf (1989).
135

1.2
Written Submittals, This Contract Period
Nicks, W.F., Peppin, W.A., Horton, S.P. and D.M. dePolo, 1991. Digital data acquisition at the University of Nevada, Reno, Seis. Res. Lett., 62, 37.
Horton, S.P. and D.M. dePolo, 1990. A magnitude 5.0earthquake near Mono Lake, California, Seis. Res. Lett., 62,52. ~~
Peppin, W.A. and R.S. Dollar, 1990. Real-time analog and digital data acquisition through CUSP, internal review, U.S.G.S.
Figure 2
Pulse Width Stress Drops vs Seismic Moment, All Sites
E u
C CD
E o2o'E
e cn'CD ooen o
23
22
21
20
O
O
O
O
o o o
o o*o
o*
0 1 2
Log Stress Drop (bars)
136

The Lee Vining Sequence
COMPRESSION
DILATATION
KILOMETERS

1.2
0)-u
no C O
NX>O\ 1 ,£>s 2.0s
latitude
Figure 3
138

1.2
Determination of Earthquake Hypocenters, Focal Mechanisms, and Velocity Structures
in the Morgan Hill/Coyote Lake and Bear Valley/Stone Canyon areas of
Central California through the use of Fast, Accurate Three-Dimensional Ray Tracing.
14-08-0001-G1948
Steven W. RoeckerDepartment of Earth and Environmental Sciences
Rensselaer Polytechnic InstituteTroy, New York 12180-3590
(518)-276-6773
Objectives: This project will apply a new three-dimensional ray tracing technique to determine earthquake hypocenters, focal mechanisms, and velocity structures in the Loma Prieta area of central California, and is an extension of our work in the Morgan Hill/Coyote Lake and Bear Valley/Stone Canyon areas. The primary objectives of the study are two: (1) to address the importance of, and to develop an algorithm for, routine determination of earthquake locations and fault plane solutions using three-dimensional ray tracing in these areas, and (2) to refine the locations and mechanisms of previously recorded earthquakes in these areas and improve the definition of their P and S wave velocity structures. Bom of these objectives will improve our understanding of the seismic activity, the nature of faulting, and the tectonic environment in which these earthquakes occur. A fast, accurate, and robust three-dimensional ray tracing technique recently developed by the PI will be used to analyze the data. The speed and robust ness of the technique will make the analysis of large volumes of data feasible, and will allow it to be used in a routine application. The ability of the algorithm to trace rays through large gradients makes it particularly useful for examining locations and structures in the Loma Prieta region, because previous studies have suggested large velocity gradients in these areas.
Progress to Date: In the short time that we have been working on this project, we have accomplished the following:
1. We have upgraded the software to use more efficient searching algoritms, and a more accu rate distance conversion technique. We have also included new versions of inverse covariance matrix smoothing subroutines and are testing novel ways to use these smoothing techniques with problems of large numbers of variables.
2. A graduate student who started this term (Chandana Gupta) will be assisting in this project has been taught the theory behind the techniques and also how to use the software by the PI and by the student (Alan Lin) who did much of the work on the predecessor of this project.
3. Gupta and Lin have gone through the USGS aftershock data from Loma Prieta and prepared a dataset for the analysis. Gupta has done preliminary relocation work on this data set and is setting up the gridding system to be used in the inversion.
139

1.2
SALTON TROUGH TECTONICS AND QUATERNARY FAULTING
9910-01292
Robert V. Sharp Branch of Engineering Seismology and Geology
U.S. Geological Survey345 Middlefield Road, MS 977Menlo Park, California 94025
415/329-5652 or FTS/329-5652
Investigations
1) Geologic mapping of the Superstition Mountain fault.
2) Post-1987 afterslip on the Superstition Hills fault and a northwest-trending cross fault.
Results
1) Mapping of the Superstition Mountain fault and the adjacent geology is now com pleted in the Brawley NW, Superstition Mountain, and Plaster City NW 7.5' quad rangles. A seismic reflection profile across the concealed northern part of the fault has been made to help clarify its geometric relation to the southern Coyote Creek fault. The active trace of the latter fault was revealed by the 1968 surface rupture associated with the Borrego Mountain earthquake. Data from the reflection profile have not been processed yet.
2) Post-seismic slip is monitored at 66 stations along the various breaks of the Supersti tion Hills zone. Slip continues to grow both by episodic creep events and by more- or-less steady "background" creep. The largest cumulative right-lateral displace ment, measured on the northern strand near the northern extensional stepover, is now about 85 cm. Plotted with a logarithmic time axis, displacement values at most stations have deviated noticeably downward from linear extrapolations of earlier data points le. t the displacement growth is now in its asymptotic phase and is within prob ably a few centimeters of its "final" amount.
In stark contrast to the behavior of the Superstition Hills fault zone, the apparent absence of afterslip on northeast-trending faults in the Superstition Hills has been puzzling. In March, 1990, however, left-lateral slip along a short, well-preserved segment of surface rupture on the central of the three major cross faults showed
140

1.2
noticeably greater than slip observed shortly after the 1987 earthquakes. Monuments erected there showed about 7 mm of left-lateral growth of slip by March 1991. Not only is this section of the fault actively moving, preliminary analysis shows the slip to be following the same power law of growth as the Superstition Hills fault. Monu ments erected on the other two major cross faults have not shown similar increases in left-lateral slip.
Reports
Saxena, S.K., Sharp, R.V., and Acacio, A., 1991, Geoscience and geotechnical aspects, in Schiff, A.J., ed., Philippine earthquake reconnaissance report, to be published by Earthquake Engineering Research Institute (EERI).
141
1.2
Seismotectonic Framework and Earthquake Source Characterization (FY91) Wasatch Front, Utah, and Adjacent Intermountain Seismic Belt
14-08-0001-G1762
R.B. Smith, W.J Arabasz, and J.C. Pechmann* Department of Geology and Geophysics
University of UtahSalt Lake City, Utah 84112-1183
(801) 581-6274
Investigations: October 1,1990 - March 31,1991
1. Review and synthesis of seismotectonics, seismicity, and models of earthquake occurrence in the Intermountain seismic belt
2. Moment-magnitude relation for the 1983 Borah Peak, Idaho, earthquake sequence.
3. Analysis of attenuation and site effects using three-component digital recordings of aft ershocks of the 1983 Borah Peak, Idaho, earthquake.
Results
1. We've completed a major review and synthesis of the seismotectonic framework, historical and instrumental seismicity (including induced seismicity), and models of earthquake occurrence in the Intermountain seismic belt (ISB; Smith and Arabasz, 1991). The study area (see Fig. 1 A) covers a sizable part of the western United States within which 49 moderate to large earthquakes (5.5<MS <7.5) have occurred since 1900, including three surface-faulting earthquakes. Contemporary deformation in the region is well known to be dominated by intra- plate extension, although strike-slip deformation is locally important
A 56-yr sample of earthquakes (1930-1985, M>3.0) in Figure 1A shows the ISB extend ing in a curvilinear, branching pattern at least 1500 km from southern Nevada and northern Arizona to NW Montana. Normalized rates of seismicity in the ISB, on average, are lower by about a factor of 4 than those along the plate boundary in California. Converging evidence suggests that earthquake activity in the central ISB, which defines an arcuate, parabolic epicen- tral pattern symmetric about the eastern Snake River Plain (ESRP) and with an apex at Yel- lowstone Park, is distinctive from the ISB to the north and south in being fundamentally influenced by the Yellowstone hotspot. Figure 1 illustrates some noteworthy features of space-time seismicity along the ISB: (1) Intense seismicity in the Hebgen Lake-Yellowstone Park region (northern part of Box 2) marks the most seismically active region within the ISB. This region is characterized by a seismically-deduced N-S extensional strain rate of
*J. Bott, J.E. Shemeta, S.J. Nava, and D.B. Mason also contributed significantly to the work reported here.
142
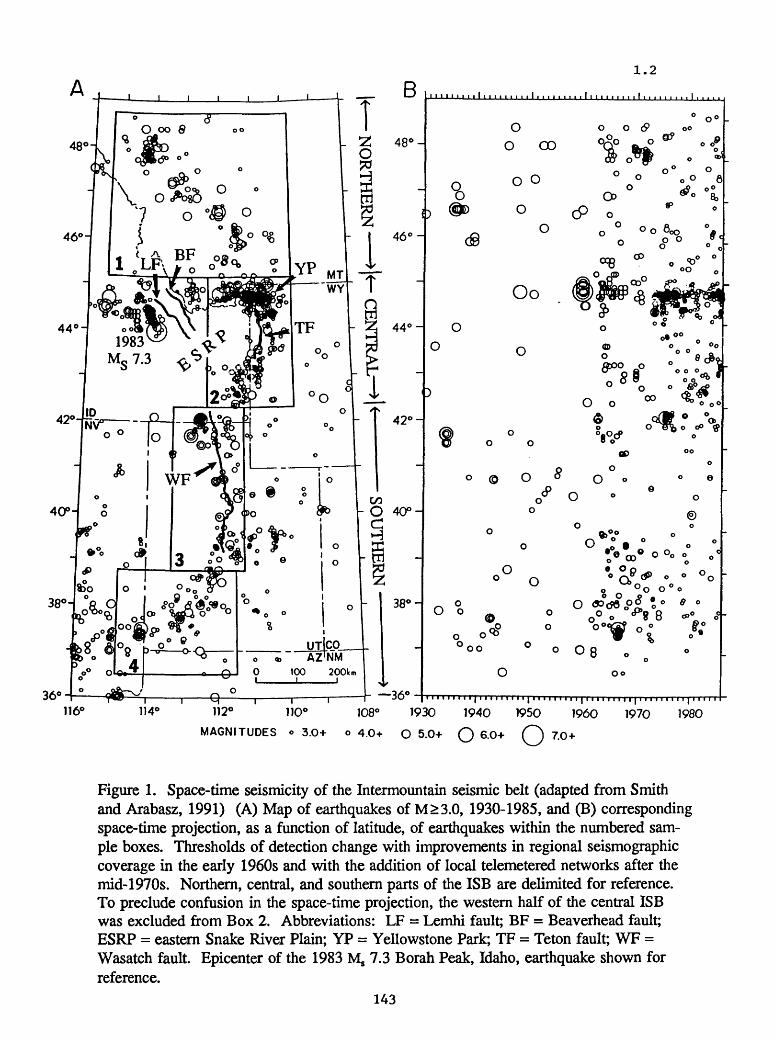
116' 108° 1930 1940 1950 1960 1970 1980
MAGNITUDES o 3.O+ o 4.O+ O 5.0+ O 6.O+ C^ 7.O+
Figure 1. Space-time seismicity of the Intermountain seismic belt (adapted from Smith and Arabasz, 1991) (A) Map of earthquakes of M>3.0, 1930-1985, and (B) corresponding space-time projection, as a function of latitude, of earthquakes within the numbered sam ple boxes. Thresholds of detection change with improvements in regional seismographic coverage in the early 1960s and with the addition of local telemetered networks after the mid-1970s. Northern, central, and southern parts of the ISB are delimited for reference. To preclude confusion in the space-time projection, the western half of the central ISB was excluded from Box 2. Abbreviations: LF = Lemhi fault; BF = Beaverhead fault; ESRP = eastern Snake River Plain; YP = Yellowstone Park; TF = Teton fault; WF = Wasatch fault. Epicenter of the 1983 Ms 7.3 Borah Peak, Idaho, earthquake shown for reference.
143

1.2
1 x 10~15 /sec and a corresponding deformation rate of 4.7 mm/yr. (2) There is a prominent seismic gap in the vicinity of the Teton fault (TF), south of Yellowstone Park, and another prominent seismic gap surrounding the Lemhi fault (LF) and the Beaverhead fault (BF), NW of the eastern Snake River Plain (see Fig. 1A). Active central segments on all three faults have ruptured in Holocene time and have slip rates ranging from as high as 2 mm/yr on the Teton fault to about 0.3 mm/yr on the Lemhi and Beaverhead faults. The latter faults are simi lar in character to the neighboring Lost River fault, which produced the Mg 7.3 Borah Peak earthquake in 1983. (3) Since the mid-1960s despite effective seismic coverage only sparse earthquakes of M> 3.0 have been recorded along a zone more than 200 km long between about 39.5°N and 41.5°N, encompassing the most geologically active parts of the Wasatch fault. (4) Background seismicity (M>3.0) appears to have decreased since the mid-1970s in the northern and southern ISB (Boxes 1 and 4), despite marked improvements in seismographic coverage during that period.
2. We have improved our previously-determined empirical relation between seismic moment (M0) and local magnitude (ML) for aftershocks of the 1983 Mg 7.3 Borah Peak, Idaho, earth quake by adding data from more earthquakes and by calculating new station corrections for log MQ and ML. The data set now consists of MQ and ML measurements for 57 aftershocks of 2.3 < ML < 6.0, plus the main shock (Figure 2). Seismic moments for 55 of these aftershocks were computed from pulse areas of SH waves recorded at 12 USGS 3-component digital sta tions, located at epicentral distances of less than 50 km. Local magnitudes for these 55 aft ershocks were computed from peak amplitudes of synthetic Wood-Anderson seismograms made from the digital data. For the other two aftershocks and the main shock, we determined ML using amplitude measurements from analog Wood-Anderson seismographs located in Utah at epicentral distances of 390 to 480 km. Seismic moments for these three events have been determined by others using long-period data recorded at regional and teleseismic distances.
The relation between log MQ and ML is clearly nonlinear, but can be approximated by the following pair of linear regression lines:
log MQ = (1.2±0.1)ML + 16.8±0.3 (2.3<ML <3.5) log MQ = (1.5±0.1)ML + 15.8±0.2 (3.5£ML <6.0)
These linear log M0 relations are nearly identical to those that we previously found for Borah Peak aftershocks, but are better constrained by the available data. The data point for the main shock is not included in the linear regressions because its ML value of 6.7 is based on ampli tude measurements from only one station, and because it appears to lie above the approximate linear trend of the data for 3.5<ML ^6.0. The concave-upward log MQ-ML relation for the Borah Peak earthquake and its aftershocks (Figure 2) is very similar to that observed for Cali fornia earthquakes. This result contradicts previous findings that the log MQ-ML relation for ISB earthquakes differs substantially from that found for California earthquakes.
3. We are studying attenuation and site effects in central Idaho using USGS 3-component digital recordings of aftershocks of the 1983 Borah Peak, Idaho, earthquake. The goals of this
144

1.2
234567 LOCAL MAGNITUDE
27
26
V25
24
23
H22CO LU CO
21
20
19-
STANDARD ERRORS
234567 LOCAL MAGNITUDE
Figure 2. Left, log seismic moment versus local magnitude for the Borah Peak main shock (ML = 6.7, M0 = 2.5 x 1026 dyne-cm) and 57 aftershocks of 2.3 £ML £ 6.0. Right, the same data plotted with one-standard-deviation error bars. Also shown in both plots are two linear relations derived from least-squares regression of these data. The circles indicate earthquakes for which M0 and ML were determined from local digital recordings. The triangles (three larg est data points) indicate earthquakes for which M0 was determined from long-period regional and teleseismic data and ML was determined using Wood-Anderson instruments in Utah. All M0 and ML estimates are averages of observations from at least two stations, except for the ML of the main shock.
145

1.2
research are to (1) determine a 1-D attenuation model for the upper crust in this region, and (2) determine if attenuation can account for the nearly constant SH-wave pulse widths of 0.23 ±0.1 sec for aftershocks of M0 < 1021 dyne-cm that we examined in previous studies. Inspection of displacement seismograms from a set of 61 aftershocks of 1019 <M0 < 1021 dyne- cm shows that P- and SH-wave pulses are often similar for the same source to receiver paths. There is also some indication of site effects at particular stations. For example, P-wave pulses from 14 earthquakes recorded at station DTS are strikingly similar, with pulse width and pulse complexity being a function of earthquake size.
Measurements of SH-wave pulse widths and pulse areas have been used to compute seismic moments and fault radii for the 61 earthquakes, assuming a circular source model. Plots of log SH-wave pulse width versus log M0 for each station indicate that measured pulse widths are are systematically larger at some stations (e.g., CEM, MGW) than at others (e.g., DTS). After applying empirical station corrections for log MQ, measurements of log MQ and pulse width from different stations were averaged for each earthquake with two or more obser vations. The average pulse widths range from 0.1 to 0.33 sec, and calculated stress drops range from one to ten bars. Work currently in progress involves examination of P- and SH- wave spectra to search for characteristic spectral shapes, corner frequencies, or resonances that might be associated with particular stations, and measurements of attenuation from the rate of spectral falloff below the corner frequency.
Reports and Publications
Arabasz, WJ. (Editor) (1991). A guide to reducing losses from future earthquakes in Utah: "Consensus document," Utah Geological and Mineral Survey, Misc. Publ. 91-1, 30 pp.
Arabasz, W.J., J.C. Pechmann, SJ. Nava, and E.D. Brown (1991). Information from observa tional seismology relevant to earthquake engineering in the Wasatch Front area, Utah (abstract), Earthquake Engineering Research Institute Annual Meeting, February 14-16, 1991, Salt Lake City, Utah.
Byrd, J.O.D. and R.B. Smith (1990). Paleoseismicity and earthquake capability of the Teton fault, Wyoming (abstract), EOS, Trans. Am. Geophys. Union 71, 1452.
Mason, D.B. and R.B. Smith (1990). Paleoseismicity of the Intermountain seismic belt from magnitude scaling of Quaternary fault lengths and displacements (abstract), EOS, Trans. Am. Geophys. Union 71, 1559.
Smith, R.B. and W.J. Arabasz (1991). Seismicity of the Intermountain seismic belt, in Neotec- tonics of North America, D.B. Slemmons, E.R. Engdahl, M.D. Zoback, M.L. Zoback, and D. Blackwell (Editors), Geol. Soc. Am. SMV V-l, in press.
Smith, R.B., D.B. Mason, and H.M. Benz (1991). Paleoseismicity and expected strong ground motions of large normal faulting earthquakes in the Intermountain region (abstract), Earth quake Engineering Research Institute Annual Meeting, February 14-16, 1991, Salt Lake City, Utah.
Sylvester, A.G., J.O.D. Byrd, and R.B. Smith (1991). Geodetic evidence for aseismic reverse creep across the Teton fault, Teton Range, Wyoming, Geophys. Res. Lett., in press.
146

1.2
Identification of Active Faults and Source Characteristics in the New Madrid Seismic Zone
14-08-0001-G1870
William V. StauderDepartment of Earth and Atmospheric Sciences
Saint Louis University3507 Laclede
St. Louis, MO 63103(314)658-3131
Investigations
The purpose of this research is to investigate the spatial distribution of earthquake foci in (1) the middle or off-set portion of the New Madrid Seismic Zone (NMSZ) between New Madrid, Missouri and Gratio, Tennessee, and (2) along the southern portion of the zone, especially in the neighborhood of the Blytheville Arch. The hypothesis is that the spatial distribution, together with focal mechanisms, will identify the orientation of fault surfaces and the motion on the faults in these ambiguous portions of the zone.
Advantage is taken of the presence of elements of the 40-station, three- component PANDA array deployed in the central part of the NMSZ during the last quarter of 1989 through 1990. Digital trace and phase data, which were picked by the Center for Earthquake Research and Information (CERI) have been received for the first twelve array tapes covering the period 18 November 1989 through 22 Jan 1991. 431 events have been located by PANDA. Of these, 141 have well-constrained hypocentral parameters (A I A, AIB, or Bl A quality). Seventy-one of these well-constrained events (see Fig ure 1) were also recorded by the permanent SLU network. Using the PANDA locations as master events, station corrections will be calculated for the per manent SLU network. With these station corrections, more than 1100 hypo- centers determined using data from seven or more station within the NMSZ (1979 -1990), will be relocated.
147

36.0
35.5-90.5 -90.0 -89.5
km ! 2*
MAGNITUDE
CD
0123 4
37.0
36.5
36.0
35.5-89.0
PANDA NETWORK LEGEND: A STATION o E PICENTER
148

1.2
QUATERNARY BLIND THRUSTING IN THE SOUTHWESTERN SACRAMENTO VALLEY, CALIFORNIA
Contract # 14-08-0001-G2059
Jeffrey R. Unruh (Dept. of Geology) Lewis P. Munk (Dept. of Land, Air and Water Resources)
Eldridge M. Moores (Dept. of Geology) Randal J. Southard (Dept. of Land, Air and Water Resources)
all at: University of California, Davis 95616
OBJECTIVESThe goal of this study is to conduct a detailed Quaternary geological evalutation of the
southwestern Sacramento Valley. Previous workers (Wong and Ely, 1983; Eaton, 1986; Wentworth and Zoback, 1989) have noted that the seismotectonic setting of this region is similar to the Coalinga area, western San Joaquin Valley, California, where a magnitude 6.7 earthquake occurred on a blind thrust fault in 1983. A sequence of earthquakes that included two M6.0+ mainshocks and at least one M5.0+ aftershock occurred in the southwestern Sacramento Valley in 1892 (Dale, 1977; Toppozada et al., 1981). The source of this sequence is presently enigmatic, but recent work suggests that much of the western Great Valley of California, including the study area, may be characterized as a seismically-active fold and thrust belt (Namson and Davis, 1988; Wentworth and Zoback, 1989). We are pursuing a multi-disciplinary study to test the hypothesis that Quaternary deformation in this region, and possibly the 1892 earthquake sequence, occurred by movement on blind thrusts. Specifically, we intend to:
1) Determine the location and geometry of blind thrusts beneath the southwestern Sacramento Valley through analysis of seismic reflection profiles;
2) Map Quaternary tectonic-geomorphic features in the study area;3) Relate patterns of surface deformation to the geometry of the underlying thrust system;4) Place constraints on the rate and timing of uplift due to thrusting using tephrachronology and
soil-stratigraphic studies.
PRELIMINARY RESULTSTo date, we have obtained over 75 km of industry seismic reflection data from the Rumsey
Hills and Dunnigan Hills areas of the southwestern Sacramento Valley. Figure 1 is a schematic east-west cross-section illustrating the major structural features visible in the reflection profiles. The seismic data clearly image an east-vergent blind thrust at a depth of 4.0 seconds two-way time (approximately 7 km depth, based on proprietary depth-velocity curves) beneath the eastern Rumsey Hills. The thrust can be traced eastward beneath the Dunnigan Hills, where it ramps up to a depth of 3.1-3.1 seconds (approximately 4.5 km). Time-migrated reflection profiles reveal that at least one west-vergent thrust roots in the blind east-vergent thrust beneath the Dunnigan Hills (Figure 1). We interpret this thrust as a backthrust. Projection of the thrust westward suggests that it may surface in the western Rumsey Hills, where numerous west-vergent thrusts have been mapped (Kirby, 1943; Ramirez, 1990). The intersection of the blind, east-vergent thrust and west- vergent backthrust beneath the Dunnigan Hills forms an eastward-tapering underthrust wedge.
Uplift of the Rumsey Hills and Dunnigan Hills during the Quaternary is consistent with east- vergent underthrusting and wedging. West-vergent backthrusts in the Rumsey Hills are mapped as placing Cretaceous strata over Plio-Pleistocene conglomerates (Kirby, 1943; Taylor, 1955). Asymmetric fault-bend folding above the backthrusts, visible in the seismic reflection data, has uplifted and folded the Dunnigan Hills during Quaternary time. The apparent lack of surface deformation east of the Dunnigan Hills suggests that displacement on the blind east-vergent thrust is transferred to the backthrusts so that the strata east of the wedge tip remained "pinned" and essentially undeformed.
149

1.2
We are currently negotiating with a major oil company to obtain additional seismic data from this region and other areas of the southwestern Sacramento Valley. Using this data, we expect to clarify certain elements of our preliminary structural interpretation, and determine how far along strike individual thrusts extend.
We have also begun a study of tectonic-geomorphic development in the Rumsey Hills/Dunnigan Hills region. Our goal is to directly relate patterns of surface deformation to the geometry of the underlying blind thrusts. Based on reconnaissance studies, we have identified flights of alluvial terraces developed adjacent to several streams which cross the Rumsey Hills and Dunnigan Hills structures. Each terrace may be considered an originally horizontal or gently-dipping datum. Relative uplift and tilting of the terraces may be inferred by comparison with the profile of the modem stream channel. We anticipate that the terraces record a history of progressive deformation during evolution of the Rumsey Hills and Dunnigan Hills. Beginning in spring of 1991, we will map and survey these terraces. Drawing on Suppe's (1985) kinematic models for fault-bend and fault-propagation folding, we wish to test the hypothesis that the geometry of the underlying thrusts will give rise to distinctive patterns of surface uplift and tilting. The kinematic models predict that: 1) incremental uplift occurs above ramps in thrusts; 2) incremental tilting of horizontal material surfaces in the hanging wall occurs when the surfaces pass through kink bands tied to changes in fault dip; and 3) progressive deformation is different for fault-bend and fault- propagation folds. We will modify these models as appropriate for the underthrust wedge geometry observed in the study area. We will compare the observed patterns of surface deformation with predictions from models based on analysis of seismic reflection data. We seek to determine if general, geomorphic criteria can be developed to infer the gross geometry of active blind thrusts from patterns of surface deformation.
As a complimentary study, we will attempt to determine the rate of deformation by estimating the ages of stable geomorphic surfaces in the Dunnigan Hills. Relative ages will be determined by mapping morpho-stratigraphic units. Estimates of absolute age will be constrained by soil- stratigraphic relationships, magnetostratigraphy, tephrachronology, and possibly by radiocarbon dating. We have mapped several exposures of two previously undescribed Plio-Pleistocene tuffs in the study area. The tuffs have been sampled by Andre Sarna-Wojcicki (USGS) for correlation with other known Quaternary tephra in the western United States, or radiometric dating. The soil stratigraphic study is on-going and several representative sites have been selected for detailed description, sampling and laboratory characterization.
We have completed a detailed study of the longitudinal profiles of three streams crossing the Dunnigan Hills and related Quaternary structures to the south (Munk and others, 1991). The stream profiles are distinctly convex across the Quaternary structures, a departure from the smooth, concave-up profile of an idealized graded stream. For comparison, three streams in the southwestern Sacramento Valley were also chosen for study that do not cross any areas of obvious Quaternary uplift. We developed best-fit curves to describe the longitudinal profiles using non linear regressive methods (exponential decay model, y=a (exp)Ab). Regression coefficients (rA2=0.95 to 0.99) indicate that this model is appropriate for describing these stream reaches. Hypothesis testing revealed that the model-derived decay parameters (b) for the streams crossing the Quaternary structures were statistically different from the control streams at the 95% confidence interval. Testing also indicated that the decay parameter (b) was not different within the two groups at a 95% confidence interval. We interpret the localized deviations from convexity for streams crossing the Quaternary structures as evidence for relatively recent uplift.
Based on our preliminary work in the Rumsey Hills and Dunnigan Hills regions, we believe that the 1892 Winters/Vacaville earthquake sequence probably occurred by movement on one or more blind thrusts beneath the southwestern Sacramento Valley. If so, the faults should conservatively be considered active and capable of generating moderate to large magnitude earthquakes.
150

1.2
REPORTS
Unruh, J.R., and Moores. E.M., 1990, Kinematics of Quaternary blind thrusting in thesouthwestern Sacramento Valley, California: Abstracts with Programs, Geological Societyof America Annual Meeting, Dallas, Texas, p 224.
Unruh, J.R., and Moores, E.M., 1990, Three-dimensional internal structure of a reactivatedtriangle zone, southwestern Sacramento Valley, California: EOS (Transactions, AmericanGeophysical Union), v. 71, no. 43, p. 1632-1633.
Unruh, J.R., Moores, E.M., and Verosub, K.L., 1991, Quaternary blind thrusting andpotential seismic hazards in the southwestern Sacramento Valley, California: GeologicalSociety of America Abstracts with Programs, Cordilleran Section, p. 105.
Phipps, S.P., Unruh, J.R., and Moores, E.M., 1991, Young crustal wedging and imbricatethrusting, Sacramento Valley and northern Coast Ranges, California: Geological Societyof America Abstracts with Programs, Cordilleran Section, p. 89.
Munk, L.P., Unruh, J.R., Moores, E.M., and Southard, R.J., 1991, Fluvial geomorphicindicators of neotectonism in the southwestern Sacramento Valley, California: GeologicalSociety of America Abstracts with Programs, Cordilleran Section, p. 82.
Unruh, J.R., and Moores, E.M., in revision, Quaternary blind thrusting in the southwesternSacramento Valley, California: submitted to Tectonics, September 1990.
Munk, L.P., and Southard, R.J., in press, Morphology and composition of non-calcareoussilica pendants in a California Palexeralf[abs.]: Proceedings, Soil Science Society ofAmerica, Annual Meeting, Denver, Colorado, 1991.
REFERENCES
Dale, D.C., 1977, California earthquakes of April 19-29,1892: Calif. Div. Mines Geol. Spec.Rept. 129, p. 9-21.
Eaton, J.P., 1986, Tectonic environment of the 1892 Winters/Vacaville earthquake, and thepotential for large earthquakes along the western edge of the Sacramento Valley: United StatesGeol. Surv. Open File Rept. 86-370, 11 p.
Kirby, J.M., 1943, Rumsey Hills area: Calif. Div. Mines Geol. Bull. 118, p. 601-605. Namson, J.S., and Davis, T.L., 1988, Seismically active fold and thrust belt in the San Joaquin
Valley, California: Geol. Soc. Amer. Bull., v. 100, p. 257-273. Ramirez, V.R., 1990, Post-Eocene movement on the Coast Range thrust, northern Sacramento
Valley, California[abs]: American Assoc. Petrol. Geol. Bull., v. 74, p. 745. Suppe, J., 1985, Principles of Structural Geology: Prentice-Hall, New Jersey, 537 p. Taylor, R.K., 1955, Geology of the central portion of the Rumsey quadrangle, California: M.S.
thesis, University of California, Berkeley. Toppozada, T.R., Real, C.R., and Parke, D.L., 1981, Preparation of isoseismal maps and
summaries of reported effects for pre-1900 California earthquakes: Calif. Div. Mines Geol.Open File Rept. 81-11, 182 p.
Wentworth, C.M., and Zoback, M.D., 1989, The style of late Cenozoic deformation at the easternfront of the California Coast Ranges: Tectonics, v. 8, p. 237-246.
Wong, I.G., and Ely, R.W., 1983, Historical seismicity and tectonics of the Coast Ranges Sierrablock boundary: implications to the 1983 Coalinga earthquakes, in Bennett, J., andSherburne, R., eds, The 1983 Coalinga, California, earthquakes: Calif. Div. Mines Geol.Spec. Publ. 66, p. 89-104.
151
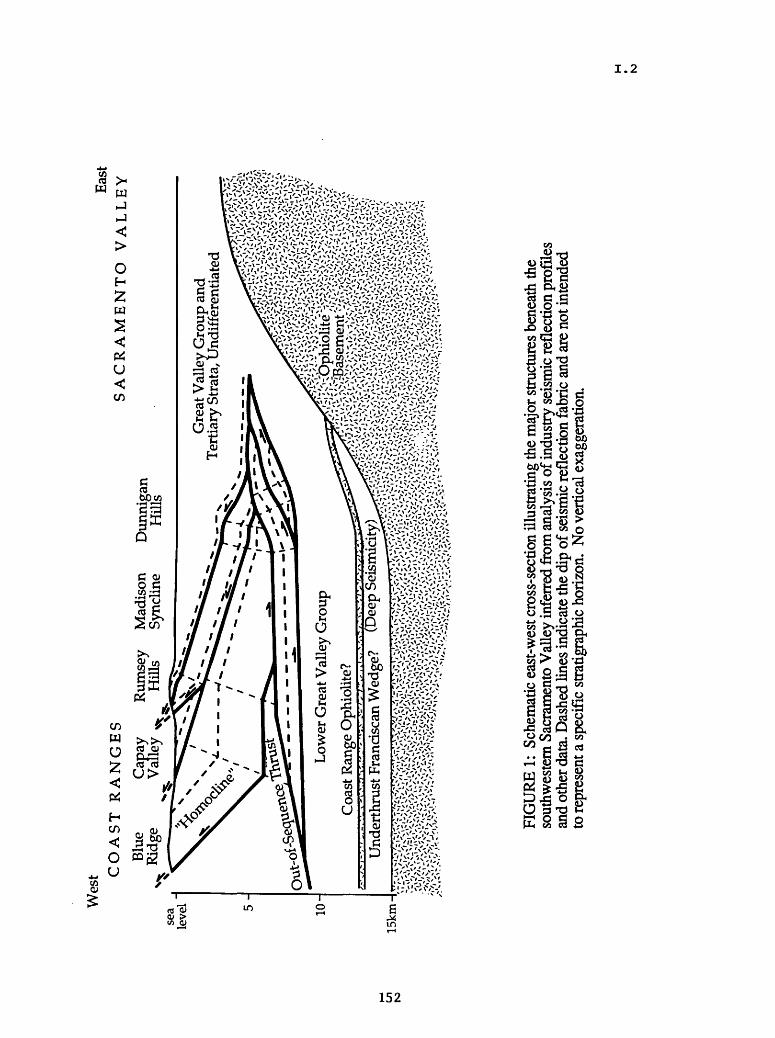
Wes
t
Cn
fo
CO
AS
T
RA
NG
ES
Eas
t S
AC
RA
ME
NT
O
VA
LL
EY
Blu
e R
idge
Cap
ay
Val
ley
Rum
sey
Mad
ison
H
ills
Sync
line
Dun
niga
n H
ills
Gre
at V
alle
y G
roup
and
T
erti
ary
Stra
ta, U
ndif
fere
ntia
ted
Low
er G
reat
Val
ley
Gro
up
Coa
st R
ange
Oph
iolit
e?
Und
erth
rust
Fra
ncis
can
Wed
ge?
(Dee
p Se
ism
icity
)15
km-
FIG
UR
E 1:
Sche
mat
ic e
ast-w
est c
ross
-sec
tion
illus
tratin
g th
e m
ajor
stru
ctur
es b
enea
th th
e so
uthw
este
rn S
acra
men
to V
alle
y in
ferr
ed fr
om a
naly
sis
of in
dust
ry s
eism
ic re
flect
ion
prof
iles
and
othe
r dat
a. D
ashe
d lin
es in
dica
te th
e di
p of
seis
mic
refle
ctio
n fa
bric
and
are
not
inte
nded
to
repr
esen
t a s
peci
fic s
tratig
raph
ic h
oriz
on.
No
verti
cal e
xagg
erat
ion.
H to

1.3
Late Quaternary Recurrence Intervals on the Owens Valley FaultZone, Lone Pine, California
14-08-0001-G1783
Paul Bierman and Alan GillespieDepartment of Geological Sciences, Mail Stop AJ-20
Seattle, WA 98195
Objectives: Our investigation has two main objectives: to constrain more tightly current estimates of recurrence intervals and fault slip rates for the Lone Pine fault, a subsidiary strand of the Owens Valley Fault Zone and to evaluate rigorously the accuracy, precision, and utility of rock varnish dating methods.
Results; Since the preparation of the last report we have done the following:
Continued processing thermoluminesence samples with Dr. G. Berger, Western Washington University. We are dating 12 samples from the two trenches opened across the colluvial wedge shed from the Lone Pine fault. We anticipate that most age data will be available during the summer of 1991.
Collected 44 varnished cores from a granodiorite boulder sequentially exposed on the fault scarp at Lone Pine. We have analyzed varnish on the cores using an SEM and techniques presented in Bierman and Kuehner (in press). These data suggest that the concentration of K and Ca are higher in the younger varnish and that the concentration of Ti and Fe are higher in the older varnish. The cation ratio of the younger varnish is higher than that of the older varnish. We are testing these observations by analyzing varnish from several other sites where the varnish should be of two distinct ages.
Prepared and analyzed three synthetic rock varnish standards. We have conducted a blind interlaboratory comparison which suggests that many if not all previously published cation ratios may be inaccurate (Bierman and Gillespie, 1991). We are using these standards to control the quality of our SEM analyses. These standards are available from Bierman.
Collected rock varnish samples from geomorphic features of known age for the purpose of testing sample preparation methods for 14C analyses of rock varnish. We have run several line and method blanks to verify that our line and chemical preparation methods are not contaminating the small amounts of organic material present in varnish. We hope to complete our C analyses by the end of 1991.
153

1.3
Dissemination of Results; We have presented and will continue to present our data and findings at meeting of professional societies and in refereed publications. We presented three poster sessions at the Geological Society of America, Penrose conference on Methods of Exposure Age Determination, October 1990.
Publications Resulting from NEHRP funding;
Bierman. P. and Gillespie, A., in press, Range Fires: Asignificant factor in exposure-age determination and geomorphic surface evolution: Geology.
Bierman, P. and Kuehner, S., in press , Accurate and precise measurement of rock varnish chemistry using SEM/EDS: Chemical Geology.
Bierman. P. and Gillespie, A., 1991, Accuracy of rock varnish chemical analyses: implications for cation ratio dating: Geology, v. 19, p. 196-199.
Bierman, P., Kuehner, S., and Gillespie, A., 1991, Precision of rock varnish chemical analyses and cation-ratio ages: Geology, v. 19, p. 135-138.
Bierman. P. and Gillespie, A., 1990, Range Fire: A dramatic andsignificant factor in the dating and evolution of Geomorphic Surfaces: Geological Society of America Abstracts with Programs, v. 22, n. 7, p. A110.
Bierman. P. and Gillespie, A., 1990, An independent evaluation of the potential precision and accuracy of rock-varnish cation ratio dates: Geological Society of America Abstracts with Programs, v. 22, n. 7, p. A270.
Bierman, P. and Gillespie, A., 1990, Varnish cation-ratio ages - How precise can they be? Geological Society of America Abstracts with Programs, v. 22, n. 3, p. A8.
Bierman, P. and Gillespie, A., 1989, Rock varnish, alluvial fans,and tectonism in the southern Owens Valley, CA: Geological Society of America Abstracts with Programs, v. 21, n. 6, p. A343.
154

1.3
Surface Faulting Studies
9910-02677
M.G.Bonilla Branch of Engineering Seismology and Geology
U.S. Geological Survey345 Middlefield Road, MS 977
Menlo Park, CA 94025(415) 329-5615
Investigations
The geology of the Marina District is under study to better understand the pattern of earthquake damage there. Maps dating back to 1851, archival materials including photographs, published reports, and logs of borings made from 1912 to 1990 are being used to decipher the geology, including the artificial fills.
ResultsA map showing contours on the buried surface of the bedrock was prepared based on
borings, offshore geophysical data, and geologic interpretations. The general form of the bedrock surface is of a northwest-trending valley whose elevation ranges from sea level to about 90 m below sea level. The section above the bedrock consists of stiff fine-grained Pleistocene estuarine deposits; a dense Pleistocene sand layer; Holocene bay deposits, beach sand, and dune sand; and various artificial fills.
Earthquake effects reported by others have a relation to geologic setting that ranges from obscure to clear. Ground motion amplification and severe building damage (i.e., building use restricted by City authorities) occurred on both natural ground and artificial fill. Damage to pipelines, pavements, sidewalks, and curbs is nearly all on artifical fills of various ages. Liquefaction-related sand boils are restricted to the hydraulic fill emplaced in 1912 for the Panama- Pacific International Exposition. Apparently, amplified ground motion and severe building damage are related to the buried valley and its overlying sedimentary section, but certain types of damage and liquefaction were related to artificial fills. A report was prepared giving results to date.
Reports
Bennett, M.J., Bonilla, M.G., and Holzer, T.L., 1990, Liquefaction in the Marina District, SanFrancisco, California, during the Loma Prieta earthquake [abs.]: Geological Society ofAmerica Abstracts with Programs, v. 22, no.7, p. A188.
Bonilla, M. G., 1990, Historical faulting, in Moore, G.W., Bonilla, M. G., Rapp, R. H.,Rinehart, W. A., Liebert, Lee, Simkin, Tom, Seller, D. R., and Zoback, M. L.,Geodynamic Map of the Circum-Pacific Region, Arctic Sheet: U.S. Geological SurveyQrcum-Pacific Map Series, Map CP-38, scale 1:10,000,000.
Bonilla, M. G., and Lienkaemper, J. J., 1991, Factors affecting the recognition of faults exposedin exploratory trenches: U. S. Geological Survey Bulletin 1947, 54 p.
Bonilla, M. G., in press, Geology and historical development of the Marina District, SanFrancisco, California: Seismological Society of America special issue on Loma Prietaearthquake.
155
1.3
NORTHERN SAN ANDREAS FAULT SYSTEM
9910-03831
Robert D. Brown Branch of Engineering Seismology and Geology
U.S. Geological Survey345 Middlefield Road, MS 977Menlo Park, California 94025
415/329-5620 or FTS/459-5620
Investigations
1. Synthesis studies of the geology, seismology, and tectonics of the San Andreas fault system, especially in northern California.
2. Advisory activities for Bay Area Regional Earthquake Preparedness Project (BAREPP) and San Francisco Bay Conservation and Development Commission (BCDC), both of which are state agencies.
3. Research and review of work by others on the tectonic setting and earthquake potential of Diablo Canyon Power Plant (DCPP), near San Luis Obispo, California. Activities are in an advisory capacity to the Nuclear regulatory Commission (NRC) staff and are chiefly to review and evaluate data and interpretations obtained by Pacific Gas and Electric Company (PG&E) through its long-term seismic program.
Results
1. Completed report reviewing geology, seismology, and tectonics near Diablo Canyon; report submitted to NRC in February, 1991.
2. Completed chapter, co-authored with D. Hill and R. Wallace, on the San Andreas fault system. Chapter is planned for publication in a book, The Geological Character of Active Fault Zones, edited by R. Bucknam and P. Hancock, and sponsored by the International Geological Correlation Program.
156

1.3
Reports
1. U.S. Geological Survey Staff, 1991, Review of geological and geophysical interpreta tions contained in pacific Gas and Electric Co. final report of the Diablo Canyon Long Term Seismic Program for the Diablo Canyon power plant A report to the staff of the U.S. Nuclear Regulatory Commission: U.S. Geological Survey admin istrative report, 27 p.
2. Brown, Robert D., 1990, Quaternary deformation in Wallace, R.E., ed., The San Andreas fault system, California: U.S. Geological Survey professional paper 1515, p. 83-113.
3. Brown, Robert D., 1991, Seismicity and geologic structure, San Francisco Bay region, California [abs.]: Geological Society of America Abstracts with Programs, v. 23, no. 2, p. 9.
157

1.3
Characterization of Quaternary Deformation Associated with Concealed Thrust Faulting
14-08-0001-G1875
Thomas F. BilliardGeomatrix Consultants, Inc.
One Market PlazaSpear Street Tower, Suite 717
San Francisco, California 94105(415) 957-9557
William R. LettisWilliam Lettis & Associates
936 Dewing Avenue, Suite GLafayette, California 94549
(415) 284-5789
STUDY APPROACH AND METHODS
The goal of this study is to determine the rates of Quaternary surface deformation in the vicinity of the 1987 ML 5.9 Whittier Narrows Earthquake. We are conducting a paleoseismic investigation of the Monterey Park Hills and Montebello Hills area to quantify uplift of these active Quaternary anticlines. Characterization of surface deformation through detailed Quaternary geologic and geomorphic mapping and analysis will provide constraints on the timing and style of folding associated with blind thrust faults under the study area. Coseismic uplift and surface deformation occurred during and/or immediately following the 1987 Whittier Narrows earthquake. We believe the data will provide the basis for assessing the kinematic and geometric relationship of the fold to the underlying fault and the Quaternary rate of activity on these blind faults.
This project has been divided into two phases: 1) initial investigations were designed to develop a Quaternary stratigraphic column and map the distribution of Quaternary surfaces in the Whittier Narrows region, and 2) the collection of soil and age data for determination of rates of deformation. The goal of the current phase of study is to gather soil data, date surflcial deposits, and integrate the Quaternary deformational data into kinematic models of surface deformation derived from carefully constructed and controlled, balanced structural cross sections in the study area.
158

1.3
RESULTS AND STATUS OF THE INVESTIGATION
Results of the initial investigations were published as a Geological Society of America Abstract. Details of the results are contained in the final technical report for award # 14-08- 0001-G1680. A manuscript discussing the results of the initial investigation has been submitted to the Geological Society of America Bulletin for publication. Results from the first phase of the study were used in the Alquist-Priolo zoning of a fault in the northeast part of the study area.
We have completed field investigations during which time we worked to refine our soil stratigraphy and relative ages of geomorphic surfaces. Soil data was collected in order to develop a local chronosequence in order to correlate the tectonically deformed geomorphic surfaces in the study area. The urban nature of the study area presents challenges in the attempt to conduct traditional soil-geomorphic studies. Landscape modification precludes utilizing standard approaches common to most soil studies and required development of a new method for evaluating relative soil-profile-development indices in the study area. Despite removal of significant portions of soil profiles in some cases, we are confident in our correlation of geomorphic surfaces in order to evaluate surface deformation. Bone samples from separate Quaternary geologic units have been submitted for numeric age determinations.
We are collecting additional structural field data to more tightly constrain the kinematic model. Geologic and geophysical data in our field area have been obtained from petroleum exploration drill holes and reflection seismology provided by Chevron U.S.A. Shallow subsurface geologic information has been obtained from Caltrans borings along the major freeways that cross the field area.
159

1.3
LATE QUATERNARY SLIP RATES ON ACTIVE FAULTS OF CALIFORNIA
9910-03554
Malcolm M. Clark Branch of Engineering Seismology and Geology
U.S. Geological Survey345 Middlefield Road, MS 977Menlo Park, California 94025
415/329-5624 or FTS/459-5624
Investigations
1. Recently active traces of Calaveras fault zone at Tres Pinos Creek and San Felipe Creek, California (KJ. Kendrick [Harms], J.W. Harden, M.M. Clark).
2. Recently active traces of Owens Valley fault zone, California (Sarah Beanland [NZGS], Clark).
3. Degradation of fluvial terrace risers along Lone Pine Creek, San Bernardino County (Kendrick, in conjunction with J.B.J. Harrison, L.D. McFadden [UNM], and RJ. Weldon [University of Oregon]).
4. Revision of slip-rate table and map of late Quaternary faults of California (Clark, Kendrick, J.J. Lienkaemper, K.R. Lajoie, C. prentice, M.J. Rymer, D.P. Schwartz, R.V. Sharp, J.D. Sims, J.C. Tinsley, RJ. Weldon).
5. Late Quaternary evolution of the San Timoteo Badlands region, southern California (Kendrick, in conjunction with D.M. Morton and L.D. McFadden).
Results
4. We are in the process of revising, updating, and publishing (as a USGS Bulletin) the slip-rate table and map of late-Quaternary faults of California (USGS OFR 84-106). Our aim is to review all entries in OFR 84-106 and add all new data generated since its release. We welcome any relevant unpublished data from workers in this field.
5. A minimum of three surfaces have been recognized through the mapping of the Quaternary units in San Timoteo and Reche Canyons, San Bernardino and Riverside Counties. In San Timoteo Canyon nine soils have been described on three surfaces and two associated paleosurfaces. An additional soil has been described in reche Canyon. Preliminary analysis indicates that development of these soils is similar to that of soils in Cajon Canyon, 40 km to the northwest, although eolian input is less than in the San Timoteo area.
160

1.3
Reports
Beanland, Sarah, and Clark, M.M., __, The Owens Valley fault zone, eastern California, and surface rupture associated with the 1872 earthquake: U.S. Geological Survey Bulletin 1982, in press.
Clark, D.H., Clark, M.M., Gillespie, A.R., 1991, A Late Pleistocene ice field in the Mokelumne drainage, north-central Sierra Nevada [abs.]: Geological Society of America Abstracts with Programs, v. 23, no. 2, p. 13.
161

1.3
INVESTIGATION OF PEAT STRATIGRAPHY IN ESTUARINE FLATS NEARANCHORAGE, ALASKA, AS A MEANS OF DETERMINING RECURRENCE
INTERVALS OF MAJOR EARTHQUAKES
14-08-0001-G1949
Rodney A. Combellick and Richard D. RegerAlaska Division of Geological & Geophysical Surveys
794 University Ave., Suite 200Fairbanks, Alaska 99709
(907) 474-7147
Investigations
Borehole drilling and continuous core sampling are being conducted in three estuaries along the eastern shore of Cook Inlet south of Anchorage, Alaska, to determine cycles of late-Holocene estuarine deposition and coseismic subsidence in the Cook Inlet region. Our goal is to obtain subsurface data from as many estuaries as possible in the Kenai Peninsula portion of the region that subsided during the great earthquake of 1964. The resulting database should provide a regional chronology of coseismic subsidence during the late Holocene.
Previous NEHRP-supported drilling along Turnagain and Knik Arms in upper Cook Inlet revealed multiple submerged peat layers possibly associated with six to eight coseis mic subsidence events during the past 4,700 calendar years, which corresponds to a recur rence interval of 590 to 780 years. The current program involves drilling and examination of tidal-channel exposures in estuaries of Fox River (Kachemak Bay), Kasilof River, and Kenai River.
Results
Drilling was conducted at Fox River Flats at the head of Kachemak Bay near Homer in February 1991. Nine boreholes were drilled to a maximum depth of 39.5 ft (12 m). In eight of these boreholes, 0-9 ft (0-2.7 m) of silt and clayey silt overlie clean, saturated sand and gravel to an undetermined depth. The ninth, most seaward borehole revealed silt and clayey silt to at least 20-ft (6-m) depth. No apparent submerged peat layers were en countered at any of the borehole locations. However, the core samples will be examined carefully for thin peat layers that may not be visible through the liners and for other datable organic material that may establish age and rate of sedimentation.
Initial results at Fox River Flats, which includes estuaries of Fox River, Sheep Creek, and Bradley River, indicate that the depositional system has been dominated by fluvial pro cesses for an undetermined length of time. Fluvial reworking and deposition may have re moved or prevented development and preservation of peats that could have been submerged and buried during coseismic subsidence. However, because there may be isolated areas in the system that have escaped fluvial reworking, we will examine tidal-channel exposures and perform additional shallow drilling in May 1991, to attempt to locate possible rem nants of submerged peats or rooted tree stumps.
Preliminary hand drilling in the Kenai River estuary has revealed shallow buried peat layers at two locations. Radiocarbon dates obtained from these peats suggest burial events at 1,265± 130 and 2,815+230 radiocarbon yr BP (1,060-1,300 and 2749-3322 calendar yr BP, respectively; GX-16471 and GX-16470). Deeper drilling at additional sites at Kenai River and Kasilof River estuaries will be conducted in May 1991.
162

1.3
Reports
Combellick, R.A., 1986, Chronology of late-Holocene earthquakes in southcentral Alaska: Evidence from buried organic soils in upper Turnagain Arm: Geological Society of America Abstract with Programs, V. 18, no. 6, p. 569.
Combellick, R.A., 1990, Evidence for episodic late-holocene subsidence in estuarine de posits near Anchorage, Alaska: Basis for determining recurrence intervals of major earthquakes: Alaska Division of Geological & Geophysical Surveys Public-Data File 90-29, 67 p.
Combellick, R.A., 1991, Paleoseismicity of the upper Cook Inlet region, Alaska, as recorded by peat stratigraphy in nine tidal-flat boreholes: Geological Society of America Abstracts with Programs, v. 23, no. 2, p. 15.
163

1.3
Investigation of coastal neotectonics and paleoseismicity of the southern Cascadia margin as recorded in coastal marsh systems
Agreement No. 14-08-0001-G1799
Mark Darienzo and Curt PetersonDepartment of Geology
Portland State University Portland, Oregon 97207
(503)-725-3022
Wetlands in four northern Oregon estuaries (Neawanna Creek (46°), Nestucca Bay (45.2°), Siletz Bay (44.9°) and Yaquina Bay (44.6°)) were investigated for evidence of coseismically buried peats, both in cores and cutbanks and the results were combined with and compared to completed studies in Netarts Bay (45.4°) and Alsea Bay (44.4°) (Darienzo and Peterson, 1990; Peterson and Darienzo, 1990).
The focus of this report will be on the record of buried peats in the upper 2.5 m in four out of the six bays (Neawanna, Netarts, Siletz and Alsea Bay), because similarities were noted in the upper 2.5 m of marsh stratigraphy between those bays. Evidence for rapid coseismic burial for the last five events based on criteria from Atwater (1987), Darienzo and Peterson (1990), and Peterson and Darienzo (1991), includes but is not limited to the following:
1) Buried peats are widespread and correctable within each bay.2) Buried peats have abrupt contacts with overlying lower organic
layers in all cases and gradual contacts with underlying lower organic layers in most cases.
3) There is usually an anomalous and distinct sandy layer immediately above the buried peat. This layer also has a greater % sand content than the underlying peat as well as the overlying deposit. Mechanisms of placement (river flood, storm, or tsunami) of the anomalous sand layers from Neawanna and Siletz and additional layers from Netarts and Alsea are pending.
4) Triglochin rhizomes (usually a low marsh species and tidal flat colonizer) overly a few well-developed peats (indicative of high marsh settings).
Similarities between the bays are:1) The number of buried peats in the top 2.5 m are the same (five).
164
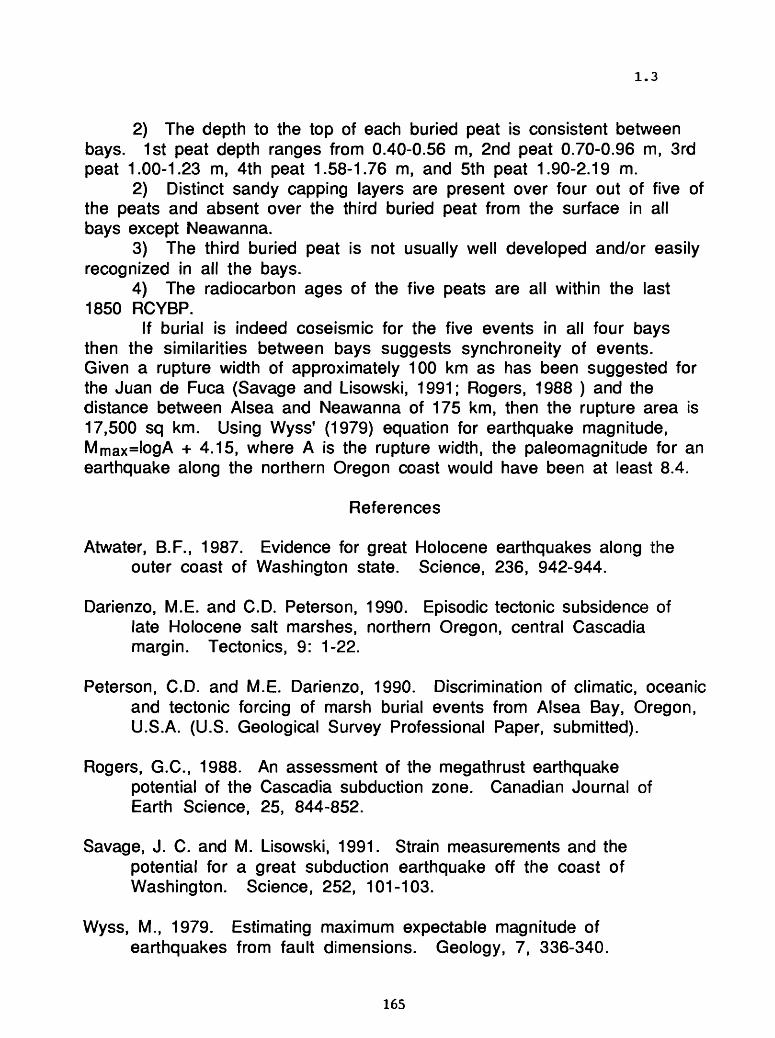
1.3
2) The depth to the top of each buried peat is consistent between bays. 1st peat depth ranges from 0.40-0.56 m, 2nd peat 0.70-0.96 m, 3rd peat 1.00-1.23 m, 4th peat 1.58-1.76 m, and 5th peat 1.90-2.19 m.
2) Distinct sandy capping layers are present over four out of five of the peats and absent over the third buried peat from the surface in all bays except Neawanna.
3) The third buried peat is not usually well developed and/or easily recognized in all the bays.
4) The radiocarbon ages of the five peats are all within the last 1850 RCYBP.
If burial is indeed coseismic for the five events in all four bays then the similarities between bays suggests synchroneity of events. Given a rupture width of approximately 100 km as has been suggested for the Juan de Fuca (Savage and Lisowski, 1991; Rogers, 1988 ) and the distance between Alsea and Neawanna of 175 km, then the rupture area is 17,500 sq km. Using Wyss1 (1979) equation for earthquake magnitude, Mmax='ogA + 4.15, where A is the rupture width, the paleomagnitude for an earthquake along the northern Oregon coast would have been at least 8.4.
References
Atwater, B.F., 1987. Evidence for great Holocene earthquakes along the outer coast of Washington state. Science, 236, 942-944.
Darienzo, M.E. and C.D. Peterson, 1990. Episodic tectonic subsidence of late Holocene salt marshes, northern Oregon, central Cascadia margin. Tectonics, 9: 1-22.
Peterson, C.D. and M.E. Darienzo, 1990. Discrimination of climatic, oceanic and tectonic forcing of marsh burial events from Alsea Bay, Oregon, U.S.A. (U.S. Geological Survey Professional Paper, submitted).
Rogers, G.C., 1988. An assessment of the megathrust earthquakepotential of the Cascadia subduction zone. Canadian Journal of Earth Science, 25, 844-852.
Savage, J. C. and M. Lisowski, 1991. Strain measurements and the potential for a great subduction earthquake off the coast of Washington. Science, 252, 101-103.
Wyss, M., 1979. Estimating maximum expectable magnitude of earthquakes from fault dimensions. Geology, 7, 336-340.
165

1.3
ANALYSIS OF CONVERGENT DEFORMATION KINEMATICS AND RATES OF THESANTA CRUZ MOUNTAINS AND RELATIONSHIP TO THE SAN ANDREAS FAULT
AND THE LOMA PRIETA EARTHQUAKE
14-08-0001-GI830
Thomas L. Davis and Jay Namson
DAVIS AND NAMSONCONSULTING GEOLOGISTS
1545 NORTH VERDUGO ROAD, SUITE 105GLENDALE, CA 91208
(818)507-6650
I. Objectives
A. Detection of seismically active blind thrusts in the Santa Cruz Mountains.
B. Determine the geometry, kinematics and slip rates of blind thrusts in the Santa Cruz Mountains.
C. Determine regional convergence rates and thrust fault slip rates in the Santa Cruz Mountains.
D. Determine the relationship between active convergence and strike-slip deformation of the Santa Cruz Mountains and the San Andreas Fault.
II. Approach: Compilation of surface geologic maps and subsurface data from oil and gas exploration wells into one retrodeformable cross section. Regional structural analysis of area using surface and subsurface maps to identify major structural trends, structural style and timing.
III. Results: Available surface and subsurface data have been collected. One retrodeformable cross section has been constructed (Figure 1) and different structural solutions have been evaluated. Specific conclusions include:
A. The region is dominated by two anticlinoria: the Santa Cruz Mountains anticlinorium (SCMA) and the Ben Lomond Mountain anticlinorium (BLMA).
B. The SCMA is best explained as a southwest vergent fault- propagation fold caused by a blind thrust stepping up from a regional detachment between 15-18 km depth.
166

1.3
C. The SCMA either folds the San Andreas fault into a northeast dip or the San Andreas fault has a vertical dip.
D. Results so far cannot determine whether the BLMA is southwest or northeast vergent. Other work by Davis and Namson in the central Coast Ranges indicate the general vergence direction is southwest.
E. Southwest vergence of the BLMA would suggest that it is a fault- bend fold resulting from a blind thrust stepping up from the regional detachment.
F. Northeast vergence of the BLMA would suggest that it is a fault- propagation fold resulting from a northeast vergent blind thrust stepping up from a regional detachment. It is problematic whether a northeast vergent BLMA reaches the San Andreas fault at depth. If it does, it could fold the San Andreas fault steeply to the southwest to provide a geometry consistent with the focal mechanism and main event/aftershock depth distribution of the Loma Prieta earthquake.
G. The Vergeles-Zayante fault is an Oligocene and Miocene age normal fault that has had some minor reactivation during late Cenozoic convergence.
H. The area has been subjected to two phases of convergence during the late Cenozoic: a late Miocene event which began just prior to Purisima Formation deposition and a late Pliocene to Quaternary event. The two phases seem to have similar geometry and activated similar structures.
IV. Conclusions: If the SCMA and BLMA are both caused by southwest verging thrust faults, then their structural geometry and that of the San Andreas fault is inconsistent with the focal mechanism and main event/aftershock depth distribution of the Loma Prieta earthquake. Instead it is suggested that Loma Prieta earthquake is the result of subduction of the lower crust below the regional detachment. If the BLMA is caused by a northeast verging thrust fault, then it is possible that the San Andreas fault has been folded to the southwest and the Loma Prieta earthquake occurred along a portion of the San Andreas fault deformed by late Cenozoic convergence.
167

1.-
37°15'
00
I I Quaternary Alluvium
fcVyl Quaternary Marine Terraces
p ! -iii|:!p|i| Quaternary and Pliocene Strata
RE-Z-Bj Miocene and Oligocene Strata
[ '' )'« ] Cretaceous and Eocene Strata
fc * * H| Franciscan Assemblage and Ophiolite
fcffi&5J Mesozoic Granite and Metamorphic Rocks
<> oil and gas exploration wells
FIQ.1
122015' 122°00'

1.3
Investigation of the Late Quaternary Slip Rate of theNorthern San Andreas Fault at the Vedanta Wind Gap,
Marin County, California
NEHRP Contract 14-08-0001-G1777
N. Timothy Hall1 Tina M. Niemi2
Earth Sciences Associates701 Welch Road
Palo Alto, California 94304
Progress Summary 4191
The summer and fall of 1990 were devoted to trenching at the Vedanta Retreat wind gap site on the northern San Andreas fault in Marin County. Our investigation focused on mapping the subsurface sediments in the marsh northwest of the gap and matching them with deposits identified east of the fault within the wind gap. Samples were collected for radiocarbon and sedimentary analyses. The trench log data have yielded information on the slip rate, paleoseismic events, and style of faulting. Research also continues on cores of live Douglas fir trees along the 1906 trace of the San Andreas fault and slabs of trees buried in the marsh.
The trench log data are presently being studied and prepared as the doctoral dissertation of T.M. Niemi. The preliminary conclusions to date include:
Slip rateThe offset equivalent of the truncated, buried channel uncovered east of the San Andreas fault at the north end of the wind gap has been identified 40.5 ± 3.5 m to the northwest in the marsh. The channel segments east and west of the San Andreas fault have similar channel geometries, channel fill, and a weighted average, two sigma, fractionation- corrected and dendrochronologically calibrated radiocarbon age of 1,790 ± 85 years B.P. These data yield a minimum slip rate of 23 ± 3 mm/yr for the northern San Andreas fault north of the confluence with the San Gregorio fault.
Paleoseismic eventsA sequence of 5-6 pre-1906 paleoseismic events have been identified in fault-perpendicular trenches on the basis of upward terminating faults, crack fills, and geometric relationships of rotated and truncated blocks. Two to three of these events deform a burn horizon radiocarbon dated as A.D. 600-1200. Only an approximate chronology of these events is possible given the conventional radiocarbon age determination of detrital organic debris. Additional AMS dating is needed to bracket the age of the events more precisely.
Now at: Geomatrix, One Market Plaza, Spear Street Tower, Suite 717, San Francisco, CA 94105
Also at: Geology Department, Stanford University, Stanford, CA 94305
169

1.3
Style of faultingIn our 1988 field season, we recognized the left-stepping compressional step-over or bend of the 1906 trace of the San Andreas fault at the south end of the wind gap. Slip is transferred through the 8 m step-over by northeast-verging thrust and oblique faults. The trench investigations provide data for a three-dimensional analysis of the fault geometry at a compressional step-over of the strike-slip fault. A manuscript of this structural analysis is currently under preparation.
Strike-slip fault, dashed where location inferred
Figure 1: Sketch map of the wind gap showing locations of trenches, faults, and buried offset channel.
Publications:
Niemi, T.M., and Hall, N.T., (submitted 1991), Late Holocene slip rate of the northern San Andreas fault, Marin county, California.
Niemi, T.M., and Hall, N.T., 1991, Preliminary estimate of slip rate for the northern San Andreas fault at the Vedanta wind gap, Marin County, California (abst.): Cordilleran Section Meeting, San Francisco, California, March 25-27,1991, Geological Society of America Abstracts with Programs, v. 23, no. 2, p. 83.
Prentice, C.S., Niemi, T.M., and Hall, N.T., 1991, Quaternary tectonics of the northern San Andreas fault, San Francisco Peninsula, Point Reyes, and Point Arena, California, in Geologic Excursions in Northern California: San Francisco to the Sierra Nevada, D. Sloan and D. L. Wagner, eds.: California Division of Mines and Geology Special Publication 109, p. 25-34.
Niemi, T.M., and Hall, N.T., 1990, San Andreas fault at the Vedanta Retreat, in, B.J. Bilodeau and S.O. Davis, eds., Geologic Guidebook to Point Reyes: American Association of Petroleum Geologists Pacific Section Guidebook #66, AAPG Annual meeting San Francisco, CA, June 3-6,1990, p. 19-24.
4/24/91
170

1.3
TECTONICS OF CENTRAL AND NORTHERN CALIFORNIA
9910-01290
William P. Irwin Branch of Engineering Seismology and Geology
U.S. Geological Survey345 Middlefield Road, MS 977Menlo Park, California 94025
415/329-5639 or FTS/329-5639
Investigations
Preparing and revising manuscripts pertaining to the geology and tectonics of northern California and southwestern Oregon.
Results
Much of the report period was spent preparing a description of the geology and tectonic development of the Klamath Mountains province for publication in the USGS Bulletin series. The report is designed to be supplemental to a geologic map of the Klamath Mountains, scale 1:500,000, which is now in press. In addition, an extensive revision of a preliminary geologic map of the Red Bluff 100,000 quadrangle was completed and the map resubmitted for further technical review. The map, which originally was released as Open-File Map 84-105, covers the tectonically complex junction of the northern Coast Ranges, Great Valley, Klamath Mountains, and Cascade Ranges provinces. It is co-authored with M.C. Blake, Jr., D.S. Harwood, E.J. Helley, A.S. Jayko, and D.L. Jones, and is being prepared for publication in the USGS Miscellaneous Map series.
Reports
No reports this period.
171

1.3
Coastal Tectonics Western United States
9910-01623
Kenneth R. Lajoie Branch of Engineering Seismology and Geology
U.S. Geological Survey345 Middlefield Road MS 977Menlo Park, California 94025
(415) 329-5747,329-5641
Investigations
1 Coastal tectonics central Chile
2. October 23,1990 Mono Basin earthquake
Results
1. Kenneth Lajoie visited the coast of central Chile with Stephen Ward (University of California, Santa Cruz) and Sergio Barientos (University of Chile) primarily to investigate co-seismic uplift recorded by emergent Holocene marine strandlines. Financial support was provided by an NSF grant to Stephen Ward.
Emergent Holocene strandlines record co-seismic uplift over the past 5 to 7 ka on Santa Maria and Mocha Islands (37° 00' and 38° 20' south latitude, respectively), which lie near the outer edge of the continental shelf, about 90 km east of the axis of the Chile trench and about 30 km west of the mainland. Most of the strandlines on these islands are beach ridges, but a few are depositional and erosional terraces.
On the western peninsula of Santa Maria Island at least forty beach ridges that group into eleven distinct ridge complexes underlie a low coastal plain about 2-km wide and 12-m high along its landward margin. The age and original elevation of the highest strandline are 5.1 ka and -6.2 m, respectively, based on correlation with a recently published Holocene sea-level curve from Barbados. These figures yield an average uplift rate of about 3.0 m/ka. Presently, it is not known whether each beach ridge or
172

1.3
each ridge complex reflects a co-seismic uplift event. If the former, the uplift for each event averaged 0.4 m and the the interval between events averaged 130 yr. If the latter, the uplift for each event ranged from 0.5 to 3.0 m (average 1.5 m), and the interval between events ranged from 250 to 1100 yr (average 555 yr). Uplift during a large earthquake in 1835 was 2.4 to 3.0 m, but the uplift during a larger earthquake in 1960 was 0.0 m. Obviously, the strandline record does not reflect every large seismic event.
On Mocha Island up to 34 beach ridges and terraces underlie a low coastal plain that ranges from 0- to 2-km wide and virtually encircles the island. The highest strandline is covered by landslide deposits in most places and none of the lower strandlines can be traced around the entire island. Consequently, it is not known if the Holocene strandline sequence is tilted. However, a Pleistocene terrace that caps the mountainous interior of the island dips southward. Where exposed at the northern end of the island the highest Holocene strandline lies at an elevation of about 35 m. The age and original elevation of this strandline are 7.3 ka and -14 m, respectively, based on correlation with the Holocene sea-level curve from Barbados. These figures yield an average uplift rate of 6.6 m/ka, which is consistent with uplift rates of 6.0 to 7.2 m/ka based on radiocarbon dates obtained from lower strandlines by a group of Japanese geologists in 1973. On the northeastern shore of the island, the 34 strandlines group into at least eight poorly distinguished complexes. As on Santa Maria, it is not clear whether each beach ridge or each ridge complex reflects a co-seismic uplift event. If the former, the uplift for each event ranged from 4 to 15 m and the interval between events ranged from 500 to 2,300 yr. If the latter, the uplift for each event ranged from 1.0 to 3.0 m and the interval between events ranged from 100 to 500 yr. In this case, each ridge would probably represent a large storm event. Uplift during the 1835 earthquake was 0.6 m, and uplift during the 1960 earthquake was 0.9 to 1.8 m.
Santa Maria and Mocha are far enough apart (about 150 km) that major earthquakes affect each island differently. More importantly, however, the uplift rates on the two islands, and possibly on the tip of the Arauco Peninsula between them, are much higher than along the mainland coast. The islands and the tip of the peninsula probably lie above an eastward dipping secondary thrust fault in the upper plate of the South
173

1.3
American megathrust. The rapid uplift of the offshore islands most likely reflects slip on the secondary fault, not on the shallower dipping magathrust. Slip on the secondary fault could occur independently of slip on the the megathrust, or vice versa. It may be, however, that slip occurred on both faults during the 1960 earthquake. Ward and Barientos inverted the surface displacements and obtained differential slip on the megathrust by assuming that all the slip occurred on that fault. If some slip occurred on a secondary fault, which seems likely, the slip on the megathrust was probably uniform.
This preliminary study of the emergent Holocene strandlines on Santa Maria and Mocha Islands provides important insights for ongoing work on similar strandlines near Cape Mendocino and at Ventura in northern and southern California. A discouraging conclusion from all work on Holocene strandlines.is that a complete history of seismic events may never be recorded, even under ideal conditions.
2. A moderate earthquake of duration magnitude about 5.0 struck Mono Basin in eastern central California on October 23, 1990. The epicenter lies in the northern part of the basin, about 8-km northeast of the surface trace of the Sierra Nevada range-front fault. The axis of the syncline that forms Mono Basin parallels a regional zone of northeast-trending left- lateral faults within and east of the basin. The junction of this zone with a zone of northwest-trending right-lateral faults within and south of the basin creates a structural bend characterized by east-west crustal extension and resultant Pliocene to Holocene volcanic eruptions. First- motion data from the October 23 earthquake and some of its aftershocks indicate that the fault rupture occurred on either a plane striking 332° and dipping 75° west, or on a plane striking 55° and dipping 75° southeast. Unfortunately, neither after-shock nor geologic data constrain the rupture to either plane. However, the trends of both possible rupture planes parallel the two trends of regional faults (Figure 1). Furthermore, the direction of extension for normal oblique slip on either plane parallels the estimated direction of regional extension based on geologic data. The strike of the possible northwest-trending rupture plane paralles the strike of the range-front fault, but the dips are opposite. This relationship suggests that the rupture might have occurred on a normal fault above and anithetic to the range-front fault.
The earthquake was felt over a broad region of central Califonia, but
174

1.3
produced no surface ruptue and caused little damage, even in Mono Basin. Seismic data from stations west of the basin overestimated the magnitude of the earthquake, possibly due to low attenuation in the crystalline rocks beneath the Sierra Nevada.
Reports
Stein, M., Wasserburg, G. J., Lajoie, K. R., and Chen, J. H., in press, U- series ages of solitary corals from the California coast, Geochim. Cosmochim. Acta.
175

1.3
Paleoseismic Investigations Along the Northern Reach of the Calaveras Fault Zone,Alameda County, California
Agreement No. 14-08-0001-G1987
William R. Lettis and Keith I. Kelson, Principal InvestigatorsGary D. Simpson
William Lettis & Associates936 Dewing Ave. Suite G
Lafayette, CA 94549
(415) 284-5789
Objectives of Study Obtain detailed paleoseismic information at the Leyden Creek research site along the northern Calaveras fault zone, including Holocene slip rate(s), amounts of displacement per event, and timing of paleoseismic surface rupture events.
Assess the nature and location of late Quaternary deformation along the fault zone within Sunol Valley through the identification and delineation of fault-related features and late Quaternary deposits and geomorphic surfaces.
Progress to Date Obtained excavation permit from East Bay Regional Park District and initiated permitting process for other land owners.
Prepared detailed topographic map (scale 1:465, contour interval = 0.5 m) of the Leyden Creek site using a Topcon total station. Established several bench marks so that future trenches and boreholes can be accurately located on the base map.
Delineated geomorphic surfaces and surficial deposits on l:465-scale topographic map, providing stratigraphic and geomorphic framework for selection of exploratory trench localities.
Selected locations for hand-auger borings in key surficial deposits, which will help refine assessment of stratigraphy and assist in selection of exact trench localities.
Results to Date Delineated five fluvial terrace surfaces at the Leyden Creek site, several colluvial wedges derived from the Calaveras fault scarp and deposited onto the terrace surfaces, and a linear boulder levee deposit. This boulder levee, which trends perpendicular to the fault, may be displaced and thus may provide an excellent piercing point Alluvial fan, debris flow, and landslide deposits have also been mapped at the site.
176
1.3
Based on mapping of these deposits, we have developed several preliminary depositional models. Upon further investigation, these models will assist in locating trenches to maximize paleoseismic data, will provide information on the influence of fault activity on deposition at the site, and will provide a framework from which to assess the Holocene slip rate.
Analysis of possible tectonic offset of a paved road on the north side of the Leyden Creek site indicates that landsliding may have influenced the road offset. This suggests that the creep rate given by Kelson and others (1991) may be partially a result of non-tectonic processes.
PapersKelson, K.I., Lettis, W.R., and Simpson, G.D., 1991, Paleoseismic Investigations
Along the Northern Calaveras Fault, Alameda County, California: Geological Society of America Abstracts with Programs, v. 23, no. 2, p. 41.
177

1.3
ACTIVE MARGIN TECTONICS, PACIFIC NORTHWEST REGION
9910-04492
P.A. McCrory Branch of Engineering Seismology and Geology
U.S. Geological Survey345 Middlefield Road, MS 977Menlo Park, California 94025
415/329-5677 or FTS/329-5677
Investigations
Document recent tectonic deformation in the vicinity of the Puget Sound metropolitan area and relate it to the earthquake potential in this region.
Results
1. FY91 research focuses on tectonically deformed sediments exposed along the coast of the Quinault Indian Reservation, Washington. Preliminary stratigraphy has been constructed for three key sedimentary sequences within the Quinault formation: the Point Grenville, Taholah, and Duck Creek sections. The next task will be to determine the age of these sequences so as to understand the rates at which the sedimentary units are being compressed and tilted.
2. Rock samples collected in FY89 have been reprocessed to concentrate micro- fossils for analyses of age and uplift data.
3. Analyses of rock samples collected in FY89 for age and uplift data are in progress.
Reports
None this reporting period.
04/91
178

1.3
Quaternary Chronostratigraphy and Deformation History, Los Angeles Basin, California
9910-04555
Daniel J. Ponti Branch of Engineering Seismology and Geology
U.S. Geological Survey345 Middlefield Road MS 936
MenloPark,CA 94025(415) 329-5679
Investigations
1. Amino-acid geochronology, faunal correlations, and uplift history of upper Pleistocene marine terraces in San Pedro, Los Angeles basin, California (with C. Powell, and K. Lajoie).
2. Origins and characteristics of off-fault surface ruptures produced by the 1989 Loma Prieta earthquake (with R. Wells).
Results
1. Three marine terraces of late Pleistocene age are now recognized in the city of San Pedro, California. Ratios of D-alloisoleucine to L-isoleucine (alle/Ile) from 20 molluscan genera calibrated against ratios from sites of known age indicate that all three terraces formed during marine oxygen- isotope stage 5 (124-81 ka). All three terraces are faunally and morphologically distinct, but only the lower two can be distinguished solely on the basis of amino-acid data.
The lowest and youngest Mesa terrace (see Fig. 1) is the most extensive and comprises most of the southern portion of the first terrace as previously mapped by Woodring and others (1946). Marine sediments deposited on the terrace platform comprise the Palos Verdes Sand, which on this terrace exhibits a molluscan faunal assemblage that at some localities (eg. Crawfish George's) contain extralimital northern taxa. The intermediate Pacific terrace is restricted to northeastern San Pedro and was originally mapped by Woodring and others as part of the first terrace. Although its platform is only several meters higher than that of the Mesa terrace, alle/Ile ratios from 11 genera clearly distinguish the Pacific terrace from the Mesa. Furthermore, the Palos Verdes Sand on the Pacific terrace contains some extralimital southern molluscan taxa, indicative of somewhat warmer water temperatures. The highest and oldest Gaffey terrace (Terrace 2 of Woodring and others) occurs in northern and central San Pedro; its platform is more than 15 m higher than that of the Pacific terrace, and the terrace is morphologically distinct. Fossil molluscan assemblages from this terrace contain a greater percentage of extralimital southern taxa than from those of the Pacific terrace, but alle/Ile ratios from the Gaffey and Pacific terraces are essentially equivalent.
Based on the morphology of the terraces and the faunal data, the Gaffey, Pacific, and Mesa terraces must represent marine terrace formation during three different sea-level high-stands. During each successive high-stand, water temperatures were progressively cooler. These data, plus amino-acid ratios that restrict the ages of the terraces to less than -124,000 years, lead to the conclusion that the Gaffey, Pacific, and Mesa terraces formed during oxygen isotope substages 5e (-124-118 ka), 5c (-102 ka) and 5a (-81 ka), respectively. Assuming constant uplift, we derive a late- Pleistocene-to-Recent uplift rate of -0.35 m/ka for this portion of the Palos Verdes Hills (likely due to movement of the Palos Verdes Hills fault and/or associated blind thrusts) and paleo-sea levels for isotope substages 5c and 5a of approximately -2 to -4 m and -4 to -5 m Respectively; this is in good agreement with data from other parts of the California coast The inability of the amino-acid data to distinguish between the Pacific and Gaffey terraces can be attributed to non-linear epimerization kinetics and the different diagenetic temperature histories of the three terraces. Modelling the kinetic
179

1.3
pathways for the three terraces (assuming the assigned ages) predicts that amino-acid ratios for the Mesa terrace should be significantly lower than those of the Pacific terrace, and that there should be little statistical difference among ratios from the Pacific and Gaffey terraces (Fig. 2). This model also predicts a full-glacial to interglacial temperature shift of ~3° C, which is consistent with CLIMAP data.
400
300 200-
100
0
400-1
300-
200-
100
0
A1
B B*
1 Mile
V.E. Mesa Terrace
f^^N Pacific TerraceK.\\.\\^l
\//\ Gaffey Terrace
^^^^H Upper Terraces
Figure 1. Map of the San Pedro area showing the distribution and elevations of the upper Pleistocene marine terraces. Labelled points refer to significant fossil localities.
EPIMERIZATION KINETICS, SAN PEDRO, CA
Gaffey Terrace Pacific Terrace
Mesa Terrace
120 100 80 60 40 20 0AGE(kyr)
Figure 2. Modeled epimerizationkinetics in the taxa Protothaca staminea, for upper Pleistocene marine terraces in San Pedro. Bars represent mean alle/Ile ± 1 a. The models account for non-linear epimerization kinetics and the different diagenetic temperature histories experienced by deposits on each terrace. They predict that alle/Ile values for the Pacific and Gaffey terraces should not be statistically different, and that glacial to interglacial temperature variations should have been on the order of 3° C.
180

1.3
2. The pattern of ground rupture produced by the 1989 Loma Prieta earthquake is qualitatively consistent with tectonic extension across the crest of the uplifted hanging-wall block; however, we note that in many cases there is a complex interaction of the fractures with large landslides, and that displacement vectors are parallel to regional slope directions. In addition, the total amount of observed extension in the Summit Road-Skyland Ridge area is two orders of magnitude greater than would be predicted by tectonic extension alone. These observations suggest that any tectonic signal is strongly overprinted by much larger gravity-driven displacements. The tendency for left-lateral extension is easy to explain by topographic collapse on bedrock structures trending more northerly than the ridge crest; it is more difficult to explain with tectonic models.
During this period, we have examined the geometry and displacement of the coseismic surface ruptures with respect to varying topography, bedrock lithology, and geologic structure. Along much of the Summit Road ridge, displacements and fracture geometry are consistent with our conclusion that shaking-induced ridge-top spreading, graben formation, and hillside collapse produced most of the extensional ground ruptures. These features are primarily controlled by bedding planes, faults, joints and other weak zones in the underlying Tertiary sedimentary strata of the hanging-wall block. In other parts of the Summit Road-Skyland Ridge area, much of the fracturing appears to be a result of shaking-induced slope failure, commonly on bedding-controlled slip surfaces. Although a few fractures exhibit displacements that are consistent with right-lateral reverse faulting inferred for the mainshock, and others may reflect growth of folds due to N-S compression, they are usually small and discontinuous.
The formation of similar ground ruptures in the Santa Cruz Mountains and elsewhere near the San Andreas fault in 1906 suggest that this type of ground failure is not dependent on fault kinematics and is not unique to the Summit Road-Skyland Ridge area or to the Loma Prieta earthquake. Similar deformation associated with earthquakes in Chile, Alaska, and southern California suggest that ground ruptures associated with collapse of topography may be common in regions of severe shaking and may represent a more widespread seismic hazard than previously realized.
Reports
Ponti, D.J., 1990, Off-fault surface fractures produced by the 1989 Loma Prieta, California, earthquake: a significant hazard for the Santa Cruz Mountains: Geological Society of America Abstracts with Programs, v.22,n.7,p.A187.
Ponti, D.J., Lajoie, K.R., and Powell, C.L. II, 1990, Upper Pleistocene marine terraces in San Pedro, southwest ern Los Angeles basin, California: implications for aminostratigraphy and coastal uplift: Geological Society of America Abstracts with Programs, v. 23, n. 2, p. 89.
Ponti, D.J., and Wells, R.E., 1991, Off-fault ground ruptures in the Santa Cruz Mountains, California: ridge- top spreading vs. tectonic extension during the 1989 Loma Prieta earthquake: Bulletin of the Seismological Sodety of America, submitted.
181
1.3
Determination of Slip Rates and Dating of Earthquakes for the Imperial and Cerro Prieto Fault Zones,Northern Baja California
and Sonora, Mexico
14-08-0001-G1669
Thomas Rockwell Andy Thomas Robert West
Dept. of Geological SciencesSan Diego State University
San Diego, CA 92182(619) 594-4441
Objective; The primary purposes of this study are: 1) to date earthquakes along the Imperial and Cerro Prieto faults, where possible; and 2) to determine a slip rate across these two faults. These data will further our understanding on the timing of past earthquakes for two of the region's most prominent and seismically active faults and help resolve how slip is distributed in the southern San Andreas fault system.
Results: High ground water and agriculture have impeded preliminary work on the Cerro Prieto fault so our work has focused primarily on the Imperial fault. We excavated trenches across the fault at Tamaulipas (Cucapa) and at the International Border.
At Tamaulipas, we surveyed the telephone pole alignment along the old railroad grade, emplaced near the turn of the century, and measured about 2.9 m of right-lateral deflection, assuming a N40W azimuth for the fault. Trenching in Tamaulipas exposed the fault zone in Arroyo Beltran, where dextral shear during the 1940 earthquake was accomodated almost entirely by drag or bending at the surface. Paleomagnetic samples where taken (with Ken Verusub) to help measure the amount of deflection of the sediments.
The border site, located immediately south of the International Border, exposed the fault as a 2-4 m wide zone of rupture (consistent with historical accounts of the 1940 rupture) in stratified fluvial and possibly lacustrine deposits. Detailed analysis of the faulted stratigraphy indicates up to three paleoseismic events prior to the 1940 event. One of the events is weakly expressed by folding or tilting and liquefaction within the fault zone. A second is suggested primarily by a major liquefaction event. The first does not appear to have been associated with a large amount of slip and the second event may not even be on the Imperial fault. The character of the sediments, the absence of weak soils or other indicators of a hiatus in deposition, along with several C-14 dates, suggests that the upper 2.5 m of section was deposited rapidly and is probably associated with the filling of the last lake at about 300 yrs B.P.
182

1.3
At this site, a post-1905 treeline is right-laterally displaced 5.0 ± 0.25 m. A buried channel, preserved at a depth of about 70 cm, stratigraphically overlies the evidence for the previous seismic events. The channel flowed at a high angle to the fault zone and is offset 5.0 + 0.2 m, in close agreement to the offset treeline. The age of the channel is most likely pre-1905, based on the historical record of no flooding in this area. These data indicate that no other earthquakes have broken the surface along this section of the fault this century, and that the rate of pre-1940 creep must have been low.
183

1.3
The Bootheel Fault, Southeastern Missouri, and Its Relationship to theNew Madrid Seismic Zone
14-08-0001-G1772 14-08-0001-G1930
Eugene S. Schweig, IIICenter for Earthquake Research and Information
Memphis State UniversityMemphis, TN 38152
(901) 678-2007
Objectives:
Although the New Madrid seismic zone is the site of the greatest historical earthquakes in eastern North America, the surface expression of the causative fault(s) for these earthquakes has never been found. We are investigating a discon tinuous linear feature, the Bootheel lineament, in southeastern Missouri and northeastern Arkansas, that is a candidate for at least one of the coseismic faults of the New Madrid earthquakes of 1811 and 1812 (Figure 1). The objectives of this study are to demonstrate whether the lineament is indeed a fault, and, if so, to char acterize its length, geometry, and displacement, and to determine whether or not it has ruptured prior to 1811.
Results:
During the latest reporting period we have continued mapping the northern part of the Bootheel lineament in more detail (Figure 1). We have also reexamined satellite images and now extend the lineament south of our previous southern ex tent for a total length of about 135 km.
A very wet season has hampered our trenching efforts, but we have excavated two new sites perpendicular to the trace of the Bootheel lineament. These sites were chosen because they are near the edge of an abandoned stream meander that crosses the lineament. By identifying the exact trace of the lineament in these trenches, we hope to be able to excavate trenches parallel to the lineament, but across the aban doned channel, in order to identify any horizontal displacements that may exist.
Trench site 3, a portion of which is shown in Figure 2A, is located north of the abandoned channel and 1 km south of trench site 1. We logged two shallowly dip ping dikes at the location of the trace of the lineament in addition to other minor liquefaction features elsewhere in the trench. Because the dikes intruded massive clay, we were not able to observe any vertical displacements that may have existed, although the block between the two dikes has almost certainly dropped because of removal of the liquefied sand from below.
184

-90°
1.3
-89
Sites 1.3. 4 -/ %
O M^S.O
O M^3.o ^ 2.0
50km
Rgure 1: The Bootheel lineament shown in relation to the New Madrid seismic zone (1974-1987). The thin black lines were located on aerial photography. The thick patterned line is from satel lite imagery. The approximate locations of the trenches are also shown.
185
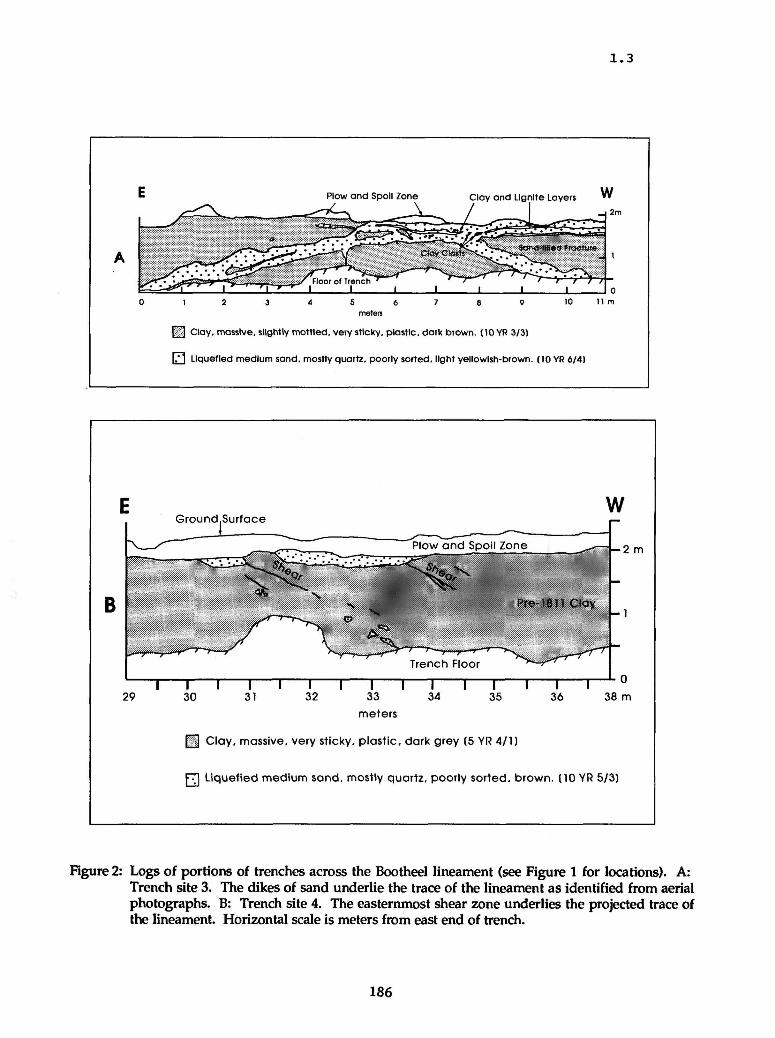
1.3
_i 2m
10 11m
Clay, massive, slightly mottled, very sticky, plastic, dark brown. (10 YR 3/3)
Liquefied medium sand, mostly quartz, poorly sorted, light yellowish-brown. (10 YR 6/4)
Ground.Surfacew-2 m
36 38 m
meters
Clay, massive, very sticky, plastic, dark grey (5 YR 4/1)
~H Liquefied medium sand, mostly quartz, poorly sorted, brown. (10 YR 5/3)
Figure 2: Logs of portions of trenches across the Bootheel lineament (see Figure 1 for locations). A: Trench site 3. The dikes of sand underlie the trace of the lineament as identified from aerial photographs. B: Trench site 4. The easternmost shear zone underlies the projected trace of the lineament. Horizontal scale is meters from east end of trench.
186

1.3
Trench site 4 (Figure 2B) is located within the abandoned channel, about 200 m south of site 3. There is no obvious trace of the lineament at this site, but the loca tion was interpolated from the north and south. There is no sand dike at the pro jected location of the trace, but rather a shallowly dipping shear zone. The shear is marked by an alignment of mineral grains and lignite. The shear zone was seen to be dipping about 30° to the west on both walls of the trench. The morphology of the surface beneath the plow zone is suggestive of thrust faulting. A similar geometry was seen in trench site 1 where the lineament was marked by a westward dipping sand dike. A short trench was excavated about 5 m south of site 4 and the shear zone again was present. The presence of this shear zone is an exciting development because it was not directly associated with liquefaction and therefore cannot be easily dismissed as collapse and offset due to removal of material from below.
Reports:
Schweig, E.S., III, and Marple, R.T., 1990, The Bootheel lineament, northeastern Arkansas, and the New Madrid seismic zone, in Guccione, M.J., and Rutledge, E.M., eds., Field guide to the Mississippi alluvial valley, northeast Arkansas and southeast Missouri: Friends of the Pleistocene South-Central Cell, p. 265-277.
Schweig, E.S., III, and Marple, R.T., in press, The Bootheel lineament: A possible co- seismic fault of the great New Madrid earthquakes: Geology.
Marple, R.T., and Schweig, E.S., III, in press, Remote sensing of alluvial terrain in a humid, tectonically active setting: the New Madrid seismic zone: Pho- togrammetric Engineering and Remote Sensing.
Schweig, E.S., III, in press, The Bootheel lineament and its implications for earth quake risk in the New Madrid seismic zone: Association of Engineering Geol ogists Abstracts.
187
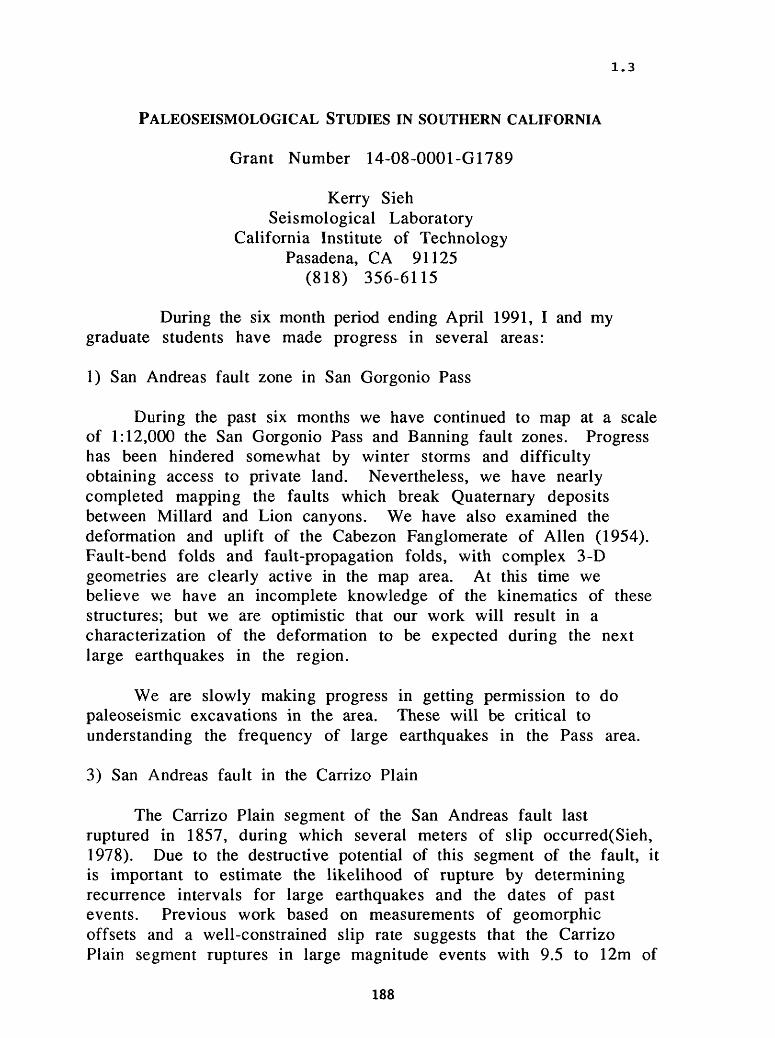
1.3
PALEOSEISMOLOGICAL STUDIES IN SOUTHERN CALIFORNIA
Grant Number 14-08-0001-G1789
Kerry SiehSeismological Laboratory
California Institute of TechnologyPasadena, CA 91125
(818) 356-6115
During the six month period ending April 1991, I and my graduate students have made progress in several areas:
1) San Andreas fault zone in San Gorgonio Pass
During the past six months we have continued to map at a scale of 1:12,000 the San Gorgonio Pass and Banning fault zones. Progress has been hindered somewhat by winter storms and difficulty obtaining access to private land. Nevertheless, we have nearly completed mapping the faults which break Quaternary deposits between Millard and Lion canyons. We have also examined the deformation and uplift of the Cabezon Fanglomerate of Alien (1954). Fault-bend folds and fault-propagation folds, with complex 3-D geometries are clearly active in the map area. At this time we believe we have an incomplete knowledge of the kinematics of these structures; but we are optimistic that our work will result in a characterization of the deformation to be expected during the next large earthquakes in the region.
We are slowly making progress in getting permission to dopaleoseismic excavations in the area. These will be critical tounderstanding the frequency of large earthquakes in the Pass area.
3) San Andreas fault in the Carrizo Plain
The Carrizo Plain segment of the San Andreas fault last ruptured in 1857, during which several meters of slip occurred(Sieh, 1978). Due to the destructive potential of this segment of the fault, it is important to estimate the likelihood of rupture by determining recurrence intervals for large earthquakes and the dates of past events. Previous work based on measurements of geomorphic offsets and a well-constrained slip rate suggests that the Carrizo Plain segment ruptures in large magnitude events with 9.5 to 12m of
188

1.3
slip every 250 to 450 years (Sieh and Jahns, 1984). Direct dating of the past several large earthquakes would vastly improve our understanding of this portion of the fault, and would minimize the dependence of our understanding on simplistic models of fault behavior.
Our work at the Bidart site in 1989 and early 1990 allowed Carol Prentice and I to recognize seven faulting events in the past 3000 years. Unfortunately, two depositional hiatuses, each on the order of a thousand years, prevented us from being certain that all the events of the past 3000 years are discernable in the sediments. Nevertheless, we determined a maximum average recurrence interval of about 500 years.
Within the past few months, graduate student Lisa Grant has examined the alluvial fan upon which the Bidart trench is situated for information about its depositional history. Evidence suggests that the locus of active deposition has been migrating along the fan from the northwest to the Bidart site, at its southeastern active margin. By carefully placing several excavations along the fault's traverse of this fan, she hopes to obtain a sedimentary section without major hiatuses and, thus, to recognize and date all faulting events of the past few thousand years. Preliminary assessment of her current excavation on the Bidart fan is that she will be able to precisely date one or two earthquakes prior to the 1857 event. Additional excavation is planned for the summer.
We would also like to understand the relationship between slip per event ,and the timing of major earthquakes in the Carrizo Plain. Lisa Grant has processed data from the 3-D excavation that we finished at the Phelan site in late September of 1990. We measured 6.6-6.9m of offset from a buried alluvial fanhead channel which is displaced by a single slip event. A radiocarbon date from the uppermost faulted layer is consistent with faulting during the 1857 earthquake. However, the amount of offset is significantly less than the 9.5m measured by Sieh and Jahns (1984) 2.6 km to the northwest at Wallace Creek. The discrepancy raises the question of whether the amount of slip in 1857 varied substantially over a short distance, or whether the 9.5-m offsets at Wallace Creek represent more than one event. Lisa has found two additional high-quality offsets of approximately 7m each between the Phelan and Bidart sites. She has documented each offset by making a topographic map. She has also made topographic maps of a high-quality 21m offset
189

1.3
with the same source channel as one of the 7m offsets, and a 14-18m offset on the Bidart fan.
In March 1991 we received a radiocarbon date of 1016+/-19 years BP from a charcoal sample which we collected from sediments within the offset alluvial channel at the Phelan site. The sample appears to be from a layer which was burned in place by a wildfire. If this date is correct it constrains the date of the pre-1857 earthquake to be much older than previously suspected. We have sent an additional sample from the same layer to date for corroboration.
4) Garlock fault
In November 1990 we received from the NSF-University of Arizona accelerator lab the radiocarbon date for a sample from a trench across the Garlock fault in Searles Valley. The sample, a charred twig, has a dendrochronologically corrected age range of 1488 A.D. to 1808 A.D. This sample underlies a gravel bed offset during the most recent earthquake along this part of the Garlock fault, and thus provides a 500-yr maximum age for that event.
Since late January 1991, Sally McGill has been working at a site at the western end of Pilot Knob Valley where the latest Pleistocene shoreline of Lake Searles crosses the Garlock fault. We expect to obtain a fairly precise estimate of the slip rate of the Garlock fault at this site. Sally has had 16 trenches excavated across the shoreline and across the two main fault strands. The trenches across the shoreline reveal well-sorted beach sands and gravels that pinch-out against a wave-cut cliff.
So far the shoreline has been located within a few meters of either side of each of the two fault zones. Projecting the shoreline from these trenches to the fault zones suggests that the shoreline is offset about 35 m across the southern fault zone and about 46 m across the northern fault zone. Three-dimensional excavations to follow the shoreline to its precise intersection with each fault are in progress. Care should be used in interpreting the projected offsets reported above because we have found several shorelines north of the northern fault zone, and at this time, it is not clear whether or not the shoreline offset about 46 m across the northern fault zone
190

1.3
correlates with the shoreline offset about 35 m across the southern fault zone.
We hope to find shells or other dateable material within the beach sediments, but so far we have been unsuccessful in this respect. However, previous mapping by George I. Smith and C-14 dating of his samples indicate that the most recent highstands of Lake Searles occurred about 11,500 C-14-yr B.P., at about 12,200 C- 14-yr B.P., and between about 15,700 and 16,300 C-14-yr B.P. (G.I. Smith, personal communication, 1989; dates are uncertain by 1 GOO- 2000 yr). U-Th and C-14 dating of corals by Bard and others (1990) suggests that C-14 dates within this range underestimate the true age by 2000-3500 yr.
A nearby channel that presumably incised during or shortly after desiccation of the most recent highstand of Lake Searles is offset about 35-38 m across the southern fault zone and about 32-33 m across the northern fault zone. This suggest a slip rate of about 5 mm/yr (69 m / (H,500 + 2000 yr)).
191

1.3
Evaluation of the Use of Compressive Growth Structure in Earthquake Hazard Assessment
14-08-0001G 1699
John Suppe, R.E. Bischke, J. Shaw
Department of Geological and Geophysical SciencesPrinceton UniversityPrinceton, NJ 08540
(609)258-4119
Investigations:The object of this study is to characterize active crustal faults in the greater Los
Angeles region that do not reach the surface, utilizing growth fault-propagation and growth fault-bend fold theory. Emphasis will be placed on determining slip rates on blind thrust faults in the transpressive environment of the Santa Barbara Channel.
Results:Axial Surface or Dip Domain Mapping
We present a straightforward technique of analyzing three-dimensional structural geometry by mapping axial surfaces (Tearpock and Bischke, 1991) through a grid of 100 high resolution seismic reflection profiles located in the eastern Santa Barbara Channel, along the Blue Bottle and offshore Oak Ridge trends. Fundamental to the theories of fault- related folding (Suppe, 1983; Suppe and Medwedeff, 1990; Suppe et al., 1991) is the formation of folds in the upper crust by migration of material through active axial surfaces in response to slip on non-planar faults. The locations of these axial surfaces can often be readily interpreted from seismic reflection profiles (Figure 1). Axial surface maps are generated by projecting these surfaces to the horizontal datum of the reflection profiles, and plotting their locations on a map (Figure 3).
When plotting the axial surfaces on a map, distinctions can be made between active, inactive, and growth axial surfaces. Active axial surfaces, which are located at bends in fault surfaces, actively deform and bisect growth (syntectonic) and pre-growth strata. Inactive and growth axial surfaces are passively translated above faults, and either terminate at fault surfaces or are refracted into the syntectonic section. Furthermore, growth axial surfaces have the additional property in that growth sediments deposited early in the slip history of the underlying fault record a wider lank band width than do growth sediments deposited later (Figure 1). These narrowing upward kink bands, or growth triangles, have been recognized in the Santa Barbara Basin and in other areas of southern California and throughout the world (Suppe et al., 1991). Inactive growth axial surfaces do not bisect the angle between the beds due to thickness changes across the axial surface. These thickness changes record different sedimentation and/or fault slip rates. All of these axial surfaces record the amount of slip that has occurred during the formation of the structure, and thus if ages of syntectonic sediments are known, one can determine slip rates along the causative faults.
The pattern of the trends of the axial surfaces on the map provides direct information on the subsurface structure and slip history of the underlying fault(s). The spacing between inactive and active axial surfaces reflects the magnitude of slip on the underlying fault, and limb length and fault slip can be calculated in cases where limb dip and fault geometry can be constrained. In cases where fault geometry cannot be inferred, limb length provides a reasonable estimate of the fault slip (Suppe et al., 1991). Changes in horizontal spacing, (i.e. convergence or divergence), of axial surface pairs suggests a change in slip on the underlying fault along strike. Changes in axial surface trends may also reflect gradual changes in subsurface fault geometry, such as changes in fault step up angle. Dramatic
192

1.3
differences in the limb length between different sets of axial surface pairs suggests that the structures grew by movement on different faults and/or at different times. In addition, terminations and offsets of axial surfaces help to identify subsurface fault tears ( Tearpock and Bischke, 1991) (Figure 2).
Offshore Oak Ridge and Blue Bottle TrendsAn axial surface map of the offshore Oak Ridge and Blue Bottle trends generated by
this method is presented in Figure 3. The active axial surface which bounds the northern flank of the Oak Ridge trend (axial surface A, Figure 2 and 3), extends for over 38 km in the eastern Santa Barbara Channel, from due south of the city of Santa Barbara east to the onshore Ventura Basin. The inactive axial surface (A*), which bounds the southern flank of the fold parallels the active axial surface (A), along the northern front of the offshore Oxnard Plains. The limb length of the fold (L), which can be measured directly from the map, remains roughly constant at 11.5 km. This value represents a minimum estimate of the dip slip component of movement on a deep seated fault beneath the channel.
Deformed near surface sediments along the offshore Oak Ridge trend (Figure 1), indicate that this deep seated fault remains active. The great depth and the dip of this fault, represented in a balanced model in Figure 2A, suggests that it surfaces to the south of Santa Cruz Island. Since the beginning of the deposition of the Repetto mudstone (estimated at 3.3 m.y.), we calculate that this deep channel fault has slipped at a minimum average rate of 1.7 mm/year. Traces of selected axial surfaces of the shallower Blue Bottle fold, modeled in Figure 2B, are also reported on the map in Figure 3B. In general, the limb length of the fold and fault slip on the Blue Bottle thrust remains constant across the eastern channel. This structure is also presently active and a 1.6 mm/year can average slip rate for the Blue Bottle fold is calculated using an estimated early Pleistocene age of fold growth initiation and the maximum limb width on the north flank of the trend of 1.2 km (Figure 3B).
The combined 3.3 mm/year early Pleistocene to Recent fault slip rates calculated for the channel faults can account for only about one third of the predicted 10 mm/year of shortening along the plate margin directed normal to the San Andreas Fault (DeMets et al., 1987; and others). This 10 mm/year value represents the normal component of the vector which describes the discrepancy between the calculated Pacific-North American relative plate motion and estimates of slip rates on the San Andreas Fault. The remaining 6 or 7 mm/year of predicted crustal shortening normal to the San Andreas since the early Pleistocene represents the amount of shortening which must be accommodated by other structures in the western Transverse Ranges northeast of this transect. Present day convergence rates across the channel must be accounted for by movement on these and other faults beneath the Santa Barbara Channel and along the Santa Barbara coast.
ReferencesDeMets, C, Gordon, R.G., Stein, S., and Argus, D.F., 1987. A revised estimate of
Pacific-North America Motion and Implications for Western North America Plate Boundary Zone Tectonics, Geophysical Research Letters, Vol. 14, No. 9, p. 911- 914.
Suppe, J. and Medwedeff, D. A., 1990. Geometry and kinematics of fault-propagation folding, Ecologae Geol. Helv., v. 83/3, p. 409-454.
Suppe, J., 1983. Geometry and kinematics of fault-bend folding, Am. J. Sci., v. 283, p. 684-721.
Suppe, J., Chou, G.T. and Hook, S.C., 1991. Rates of folding and faulting determined from growth strata, Thrust Tectonics, K.R. McKlay ed., Unwin Hyman, Publisher in press.
Tearpock D. and R. E. Bischke, 1991. Applied subsurface geological mapping. Prentice- Hall, N. J. 649 p.
193
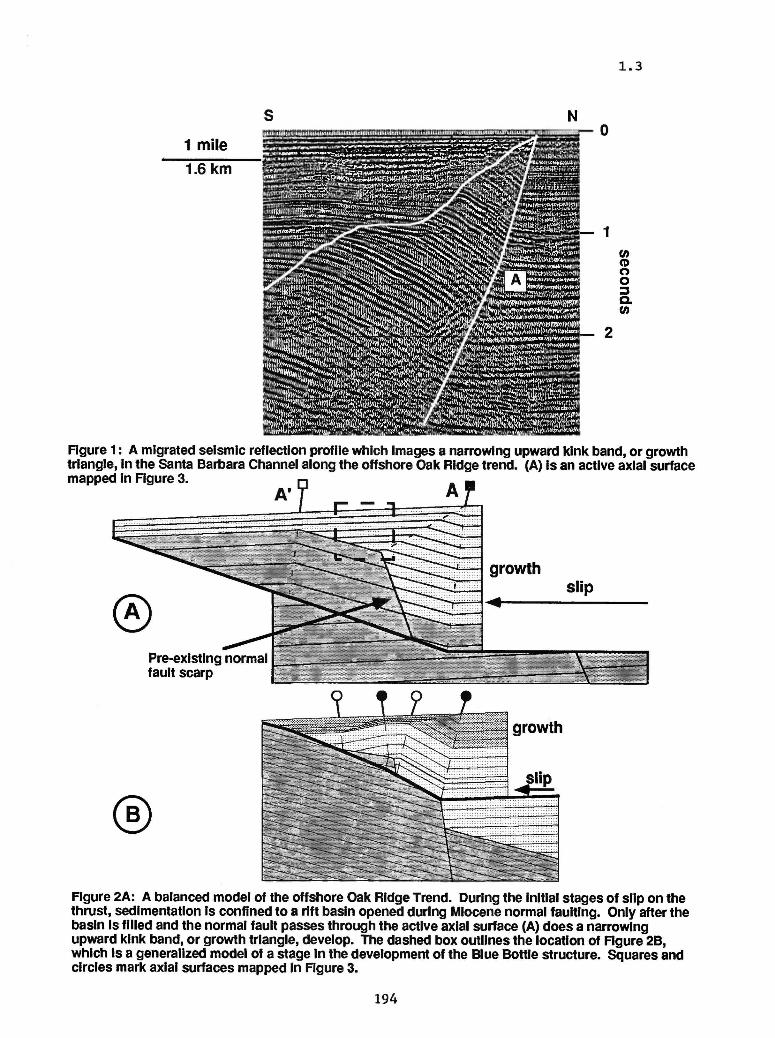
1.3
1 mile 1.6km
. 0
(A <D O O
Q. W
Figure 1: A migrated seismic reflection profile which Images a narrowing upward kink band, or growth triangle, in the Santa Barbara Channel along the offshore Oak Ridge trend. (A) Is an active axial surface mapped in Figure 3.
Pre-existing normal fault scarp
Figure 2A: A balanced model of the offshore Oak Ridge Trend. During the initial stages of slip on the thrust, sedimentation is confined to a rift basin opened during Miocene normal faulting. Only after the basin is filled and the normal fault passes through the active axial surface (A) does a narrowing upward kink band, or growth triangle, develop. The dashed box outlines the location of Figure 2B, which is a generalized model of a stage In the development of the Blue Bottle structure. Squares and circles mark axial surfaces mapped In Figure 3.
194

1.3
= Active axial surface o D = Inactive axial surface
Anacapa Islands
Rgure 3A: A map of the active (A) and Inactive (A1) axial surfaces associated with the offshore Oak Ridge trend. In the west, the axial surfaces terminate into a series of left-stepping tear faults, and to the east offsets in axlai surface (A1) suggest other subsurface tears. The similar shapes of (A) and (A') and the orientations of the tear faults suggests oblique left-lateral reverse slip (S) on the underlying thrust directed NE to SW. (L) represents the limb length of the fold and the minimum amount of dip slip on the underlying thrust fault.
= Active axial surface OD = Inactive axial surface
Anacapa Islands
Rgure 3B: A map of selected axial surfaces of the Blue Bottle trend. Constant spacing of the axial surfaces across most of the channel suggests that slip on the underlying thrust(s) remains roughly constant, in the west, the widening of the Blue Bottle trend is caused by folding of the structure by the underlying thrust associted with the offshore Oak Ridge Trend, in the east, the back or north limb of the Blue Bottle fold terminates into a tear fault which also offsets the Oak Ridge axial surface (A1).
195

1.3
STUDIES IN THE WESTERN I0HLANDS, SOUTHEAST MISSOURI
14-08-0001-G1931
James D. Vaughn and James R. PalmerMissouri Department of Natural Resources
Division of Geology and Land SurveyP.O. Box 250
Rolla, MO 65401(314) 364-1752
Investigations and Objectives
In September of 1990 we launched a pilot study in the Western Lowlands to better determine if clastic dikes and zones of soft-sediment deformation are of paleoseismic origin, and to search for other possible evidence of paleoearthguakes. Of necessity, the project also entails differentiation of sand dikes, sandblows and other features produced by the great 1811-12 New Madrid earthquakes. The ultimate aim, however, is to improve knowledge about earthquake hazards in the Central Mississippi Valley by determining the approximate timings, locations, magnitudes, and effects of major prehistoric events.
Results
Two- and three-dimensional excavations at seven main ditch-bank locations within a 30-km-long area of the Western Lowlands revealed numerous features interpreted to have been produced by four major earthquakes: three major prehistoric events and the great 1811-12 New Madrid earthquakes. Subsequent paragraphs describe initial results at some of the more significant sites investigated.
1. Site DM1
This site extends about 800 m along Dudley Main Ditch and is by far the most significant site we studied. Here, we identified a complex suite of inferred paleoearthquake features (fig. 1) including the following: several tens of mostly west- to north-trending clastic dikes; buried coalesced sandblows and possible mud-sand and mud volcanoes at three stratigraphic levels; gentle sinusoidal folds; possible monoclinal drag folds; and abundant soft-sediment deformation. Relations among these and other features are presently interpreted to represent three major prehistoric earthquakes large enough to generate liquefaction (body-wave magnitude at least 5.5-6.0 and probably 6.0 or greater). Two radiocarbon dates on wood samples broadly bracket all three events between ca. 22,750 and 3,570 yrs. B.P. (Teledyne 1-16,459 and 1-16,460).
196
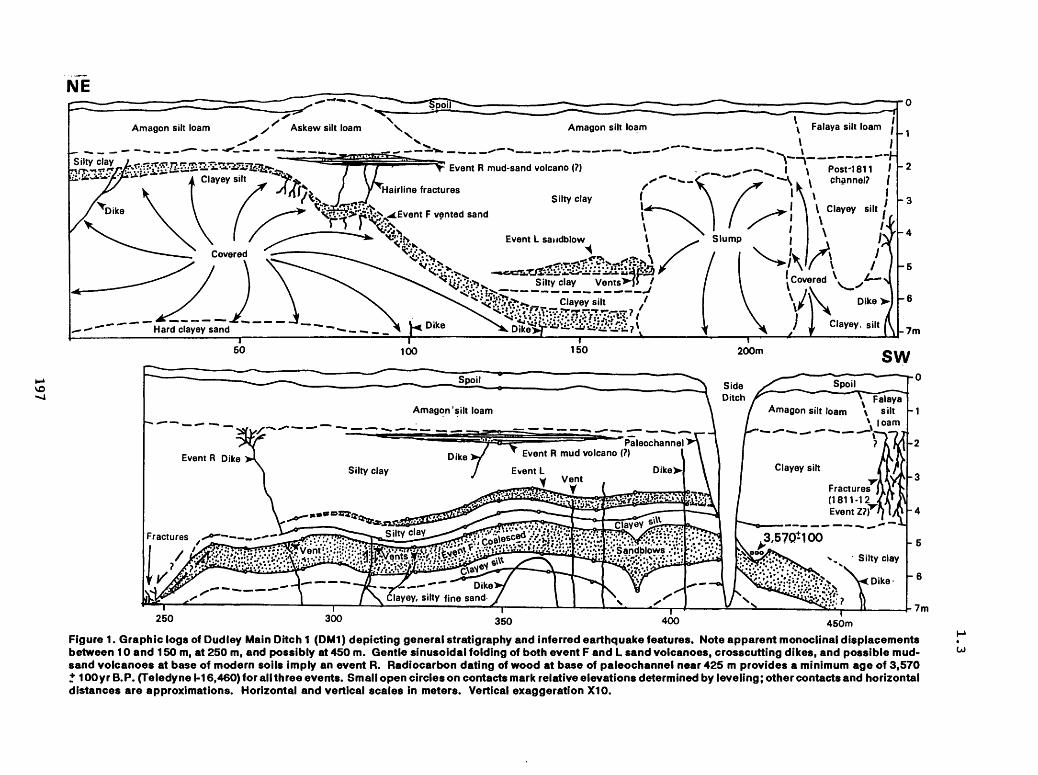
vo
Falaya silt loamAmagon silt loam
Event R mud-sand volcano (?)
Hairline fractures
Post-1811*-\ k i channel? /
l\ » I I
Event L saudblow
Silty clay Vents>-J> /
Amagon silt loam silt loam
250 300 350 400 450m
Figure 1. Graphic logs of Dudley Main Ditch 1 (DM1) depicting general stratigraphy and inferred earthquake features. Note apparent monoclinal displacements between 10 and 150 m, at 250 m, and possibly at 450 m. Gentle sinusoidal folding of both event F and L sand volcanoes, crosscutting dikes, and possible mud- sand volcanoes at base of modern soils imply an event R. Radiocarbon dating of wood at base of paleochannel near 425 m provides a minimum age of 3,570 * 10Oyr B.P. (Teledy ne 1-16,460) for all three events. Small open circles on contacts mark relative elevations determined by leveling; other contacts and horizontal distances are approximations. Horizontal and vertical scales in meters. Vertical exaggeration X10.

1.3
Preliminary observations of the stratigraphy along EM1 suggest that significant vertical displacement(s) during events F and L may have created a lake basin. Alternative explanations are that the lake basin originated from alluvial damming or abandonment of a paleochannel. However, the apparent monoclines, myriad tension fractures, and lateral continuity of a clayey silt bed beneath vented deposits of event F appear to more strongly support a displacement origin. At this time, we can only speculate that the apparent vertical displacement could have been caused by seismically induced compaction, by deep structural deformation, or by a combination of the two.
Brief 2-D and 3-D investigations of abundant soft-sediment deformations at EM1 revealed a variety of deformation structures of probable seismic origin: 1) ball-and-pillow structures produced by liquefaction and foundering of very fine sands and silty very fine sands; 2) intensely contorted and disrupted beds produced by liquefaction; 3) small anticlines and reverse shears within beds immediately below vented deposits of event F likely created by collisions of soil blocks during strong oscillations; and 4) cyclic, crisscrossing water-escape structures and small folds above coseismic tension fractures attributed to a seismically generated increase in fluid pressure.
2. Other Paleoearthquake Sites
Investigations, of ditch-bank exposures at EM2, MD1, and JC1 revealed additional dome-shaped deposits that may have been vented onto paleosurfaces. Associated small clastic dikes, sand-intruded burrows, crisscrossing tension fractures, and soft-sediment deformations strengthen the case for a paleoseismic origin. However, bioturbation and pedogenetic and diagenetic alternations make interpretations of these vented deposits difficult and ambiguous. Carbonaceous silt collected about 55 cm below a probable buried sandblow at MD1 yielded a radiocarbon date of ca. 13,430 yrs. B.P. (Teledyne 1-16,463). We are awaiting an AMS-radiocarbon determination on small wood samples collected 2-3 cm below a probable buried sandblow at JC1.
3. Sites With 1811-12 Features
At sites JC1 and SF2 we identified several tens of liquefaction features that are attributed to the great 1811-12 New Madrid earthquakes. Features at JC1 include a swarm of northwest- to northeast-trending clastic dikes as much as 30 cm wide (partly attributable to lateral spreading) and two clastic sills. Liquefaction features at SF2 include a suite of northeast-trending clastic dikes and several small to medium sized surficial sandblows. JC1 and SF2 are probably the northernmost points in the Western Lowlands where lateral spreads and sandblows of 1811-12 age have been confirmed.
Reports
Vaughn, J.D., and Palmer, J.R., New evidence of late-Quaternary earthquakes in the Western Lowlands, New Madrid seismic zone (abs): Geological Society of America Abstracts with Programs, vol. 23, No. 3, p. 64.
198

1.3
Vaughn, J.D., 1991, Looking for prehistoric earthquakes in theNew Madrid seismic zone: Outlook On Missouri Geology and Water Resources v. 3, No. 3, Mo. Dept. of Natural Resources, Division of Geology and Land Survey.
Vaughn, J.D., in prep., Active tectonics in the Western Lowlands of southeast Missouri: an initial assessment: extended abstract to be submitted for Louis Uhfer, Jr., Conference on the Geology of the mid-Mississippi Valley.
Vaughn, J.D., and Palmer, J.R., in prep., Vestiges of major paleoearthquakes in the Western Lowlands, southeast Missouri: manuscript intended for Science.
199

1.3
Paleomagnetic Investigations of Non-Brittle Deformation along Active Faults
Agreement No. 14-08-0001-G814
Kenneth L. VerosubDepartment of Geology
University of California - DavisDavis, California 95616
(916) 752-6911 or 0350
We have found what appears to be non-brittle deformation in sediments adjacent to an active fault other than the San Andreas Fault at Pallett Creek. The fault is exposed in the cut bank of a stream channel along Buckeye Creek in Yolo County, California. The fault was discovered recently by UC-Davis researchers during field investigations related to the 1892 Winters-Vacaville earthquake series. The fault has a significant normal component, but it appears to have a strike-slip component as well. It has not been previously mapped, and we doubt that it is the causative fault of the 1892 earthquakes. Nevertheless, the fault is almost certainly active because it displaces deposits of the present floodplain of Buckeye Creek, an actively meandering stream. The exposure that we studied consists of alluvial plain deposits of the Plio-Pleistocene Tehama Formation, which has been deeply incised by Buckeye Creek. In the vicinity of the fault, the sediments contain small vertical cracks indicating that there may be distributed shear. Forty-nine paleomagnetic samples were collected along a line that was parallel to bedding and perpendicular to the fault. Adjacent to the fault, the samples were collected with a spacing of 3-5 cm; farther from the fault the spacing increased to about 20 cm. The farthest sample was 6.3 m from the fault. All samples were subjected to step wise alternating field demagnetization at levels of 0, 5,10, 15, 20, 25, 30, 40, 50 and 60 mT. The samples were strongly magnetized, and a few had very minor secondary components of magnetization. All of the samples had very stable primary components of magnetization with well-defined endpoints. Initial rock magnetic studies indicate that the magnetic carrier is single-domain or pseudo-single domain magnetite.
The declinations of these samples as a function of distance from the fault are shown in Figure 1. These data are our initial results, and clearly more work must be done at this site. For example, some of the directions appear to be anomalous, and these directions must be verified by additional sampling. In addition, there is some scatter in the data which might be reduced if we had more samples at each distance. Despite these problems there does seem to be a clear trend in the data which imply progressive counterclockwise deflection of the declinations as we approach the fault. Until we have collected more samples and have more information about the sense of motion on the fault, we cannot speculate on how this deflection might be interpreted in terms of a specific model of non-brittle deformation. What our results do demonstrate is that the declinations observed at Pallett Creek can not be dismissed as an isolated or unique situation and that non-brittle deformation may indeed be a common phenomenon associated with active faulting.
200
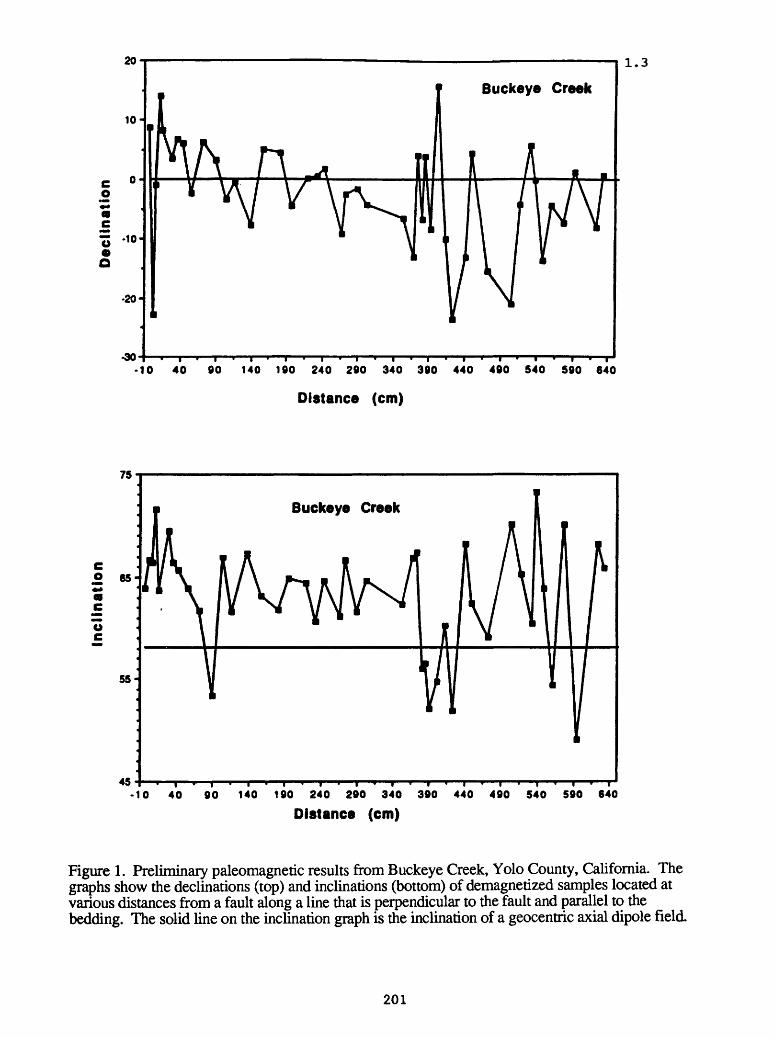
o O
10 40 90 140 190 240 290 340 390 440 490 540 590 640
Distance (cm)
Oe
10 40 90 140 190 240 290 340 390 440 490 540 590 640
Distance (cm)
Figure 1. Preliminary paleomagnetic results from Buckeye Creek, Yolo County, California. The graphs show the declinations (top) and inclinations (bottom) of demagnetized samples located at various distances from a fault along a line that is perpendicular to the fault and parallel to the bedding. The solid line on the inclination graph is the inclination of a geocentric axial dipole field.
201

1.3
Paleoseismology of the San Andreas fault at Wrightwood, CA
Agreement No. 14-08-0001-G1986
Ray Weldon Department of Geological Sciences
University of Oregon Eugene, Oregon 97403-1272
(503) 346-4584
IntroductionThis project is the continuation of work begun at the US Geological
Survey, in cooperation with Tom Fumal and David Schwartz. Earlier results are included in summaries by Schwartz et al. under the project entitled "Segmentation of the southern San Andreas fault". During the past year work has focussed on digitizing trench logs of the southeastern portion of the small pull apart basin (where initial work focussed), and collecting digital data from exposures across the northwestern portion of the zone.
ResultsWe have successfully correlated the past 5 events on the two strands of
the fault zone that bound the pull apart, and have obtained precise C-14 analyses (from Stuiver's lab) to date them. We are quite confident of the completeness of the record in this interval because all of these events are represented on both margins of the zone at the same stratigraphic horizon. The results are summarized in Figure 1. Because several of the C-14 dates yield multiple calendar ages, we have chosen the calendar age most consistent with the average sedimentation rate. While alternative sedimentation curves are possible, they produce periods of extremely low or high sedimentation that are not represented by variations in sediment type. We have recognized at least ten additional (older) deformational events, mainly on minor faults and folds within the pull apart basin. We are working to place these events in the stratigraphy by retrodeforming the digitized trench logs. We are also working to find additional evidence for these events on other unstudied structures, and to date them.
On Figure 2 we have compared our results with the record at Pallett Creek and have built a map of past rupture distribution, based on all of the evidence we are aware of. Figure 2a shows the timing of the most recent events dated at Wrightwood and Pallett Creek, the only places where a long record exists. The sites are about 30 km apart and yield quite similar
202

1.3
records, which lends credence to established paleoseismic techniques and the hazard estimates derived from such data. While only the latest five Wrightwood events are as precisely dated as the Pallett Creek events, differences in detail allow critical questions to be raised. If one accepts the concept of characteristic earthquakes [Schwartz and Coppersmith, 1984, 1986; Schwartz, 1987], in which rupture repeatedly spans the same segment of a fault, there should be total agreement if the sites are on the same segment and little agreement in the records if they are on different segments. Because many earthquakes do correlate between these two sites, one could infer that the sites are on the same segment. It is therefore possible that the earthquakes that do not occur in both records have been missed in the other record, thus substantially lowering the recurrence interval for the segment and raising the inferred seismic hazard. Indeed the two most recent events that don't appear at both Wrightwood and Pallett Creek occur at times of low sedimentation or poor preservation of the record, perhaps supporting the hypothesis that they were missed.
Alternatively, if both records are correct, then some ruptures occurred at both sites and others did not, calling into question the widely held assumption of characteristic earthquakes. If one constructs the simplest distribution of rupture for the southern San Andreas fault for the past five earthquakes (Figure 2b, which includes data from other paleoseismic sites and historic evidence) a series of highly noncharacteristic earthquakes results. Other distributions are likely because our assumption of "simplest" requires the smallest number of events, that all data are correct, and that overlapping C-14 ages mark the same earthquake. However, it is clearly impossible for all of the data to be correct and for the model of characteristic earthquakes to strictly hold. Additional work, including the longer record we are working on at Wrightwood, will be required to answer these questions.
203

1.3
240
220-
Preferred sedimentation curve
limited by cultural artifacts and historic data
1400 1500 1 600 1700
age (AD calender years)
1800 1 900
Figure 1. Timing of the most recent 5 deformational events at Wrightwood, CA. Stratigraphic position of radiocarbon samples, corrected to calendar years, and deformational events are plotted versus depth; shaded region represent possible timing of events. The past two deformational events correspond with the 1857 and 1812 earthquakes, previously recognized from historic and dendrochronologic records. The previous events occurred about 1700, 1550, and 1450 AD.
204
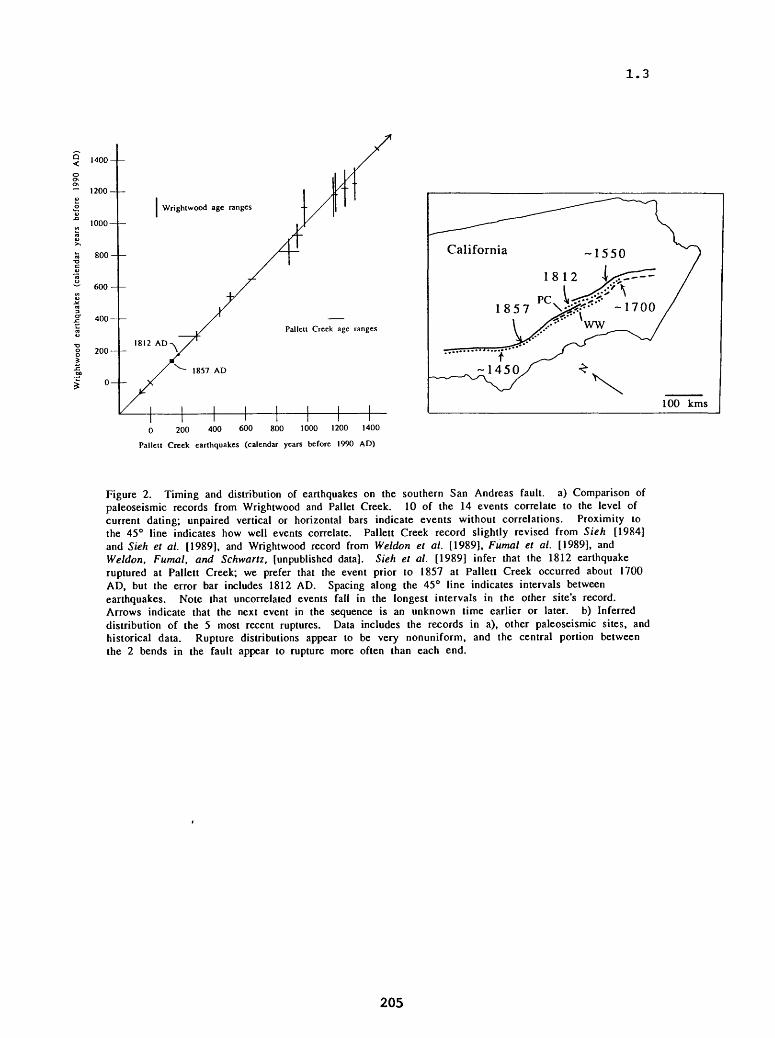
1.3
1400
- 1200
1000
800
600
400
100 kms
0 200 400 600 800 1000 1200 1400
Palletl Creek earthquakes (calendar years before 1990 AD)
Figure 2. Timing and distribution of earthquakes on the southern San Andreas fault, a) Comparison of paleoseismic records from Wrightwood and Pallet Creek. 10 of the 14 events correlate to the level of current dating; unpaired vertical or horizontal bars indicate events without correlations. Proximity to the 45° line indicates how well events correlate. Pallett Creek record slightly revised from Sie-/i [1984J and S/e/i el al. [1989J, and Wrightwood record from Weldon et al. [1989], Fumal el al. [1989], and Weldon, Fumal, and Sc/iwar/z, [unpublished data]. Sie/i et al. [1989] infer that the 1812 earthquake ruptured at Pallett Creek; we prefer that the event prior to 1857 at Pallett Creek occurred about 1700 AD, but the error bar includes 1812 AD. Spacing along the 45° line indicates intervals between earthquakes. Note that uncorrelated events fall in the longest intervals in the other site's record. Arrows indicate that the next event in the sequence is an unknown time earlier or later, b) Inferred distribution of the 5 most recent ruptures. Data includes the records in a), other paleoseismic sites, and historical data. Rupture distributions appear to be very nonuniform, and the central portion between the 2 bends in the fault appear to rupture more often than each end.
205

1.3
Plio-Pleistocene rotations across the San Andreas Fault system- paleomagnetic constraints on inelastic strain accumulation
9540-03546
Ray WellsBranch of Western Regional Geology
345 Middlefield Road, MS 975Menlo Park, California 94025
(FTS) 459-4933
Investigations
We have begun sampling widespread Plio-Pleistocene tephra units in the Bay area for paleomagnetic study of rotations. These tephras were deposited quickly and may represent uniformly magnetized sheets, which could provide ideal strain markers for deformation studies across the San Andreas system. These studies could place useful bounds on the relative proportion of permanent strain to elastically-restored deformation in the San Francisco Bay region. Our first target is the Wilson Grove Tuff (6 ma). Studies have begun in the seven known localities (Sebastapol, Petaluma, Sears Point, Berkeley Hills, Pinole, Lafayette and Green Valley) between the San Andreas and Green Valley faults to test for tectonic rotation. This will be useful feasibility study that will allow us to evaluate the magnetic character of the tuff and potential pitfalls (mostly relating to structural setting of individual sites).
If promising results are obtained from the Wilson Grove tuff, we will begin paleomagnetic study in known localities of Huichica and Lawlor tuffs (4 Ma), Putah tuff (3.4 Ma), and Rockland tuff (400 Ka) to establish characteristic paleomagnetic signatures and possible value in studies of rotation rate. If we are successful, we will later expand distribution of sample sites through specific study of additional localities with high potential for preservation of the tuffs. This may involve some additional K-Ar and chemical analysis.
Analysis of rotation data in the context of various crustal deformation models may establish permanent dextral shear strain between faults. This will be compared with paleoseismic slip rates and geodetic data to derive a more complete strain model.
Results: This is a new project; no results as yet.
Reports: No reports.-Jt*""ati r 206

1.3
Framework Geology of the San Jose - San Francisco Region
9540-04389
Carl M. Wentworth and Earl E. Brabb Branch of Western Regional Geology
U.S. Geological Survey345 Middlefield Road
MenloPark,CA 94025(415) 329-4950 or-5140
INVESTIGATIONS
Work has begun by Brabb and D.L. Jones (UC Berkeley) to improve the available geologic mapping in Contra Costa and Alameda Counties by field checking, selected remapping, and careful reinterpre- tation, with emphasis on the identity of stratigraphic units, occurrence of faults, and structural interpretation. One day per week since October, 1990 has been spent in the field. Preliminary results were presented at Cordilleran GSA in San Francisco.
Work has continued on compilationof a digital materials map of the south bay region at a scale of 1:125,000 compiled from existing data, and its application to the preparation of hazards maps.
RESULTS
Several previously unknown faults zones have been recognized in the east bay area, some of which exhibit Holocene displacement. Major differences in the character and depositional history of geo logic units juxtaposed by these faults indicate extensive offset. Significant fault-normal shortening and resultant thrusting has occurred between the Hayward and Calaveras faults and possibly between the Calaveras and Greenville faults. Advice was provided to M. Johnson to aid the selection of 8 new borehole sites for installation of strainmeters.
Regional analysis of the spatial variation of seismic hazards is greatly facilitated by geographic in formation systems (GIS), with which relevant area! factors can be compiled and manipulated by computer and plotted in various ways. The south bay regional database contains information from which regional estimates of surface faulting, shaking, liquefaction, and landsliding can be made. The materials database and GIS system (ALACARTE-ARC/INFO) were applied to preparation of a new predictive intensity map of the region for a 1906 earthquake (Borcherdt and others, 1991).
A new crustal cross section drawn across the Coast Ranges (Blake and others, 1991) prepared to illustrate the effect of obductive underthrusting of a Franciscan wedge on later distribution of base ment rocks also points out that most upper crustal rock in the Coast Ranges may be part of several interacting thrust sheets overlying a mid-crustal decollement and that even the major active faults cannot be assumed to extend at high angle down into the lower crust.
207

1.3
REPORTS
Blake, M.C., Jr., Jones, D.L., McLaughlin, R.J., and Wentworth, C.M., 1991, Tectonic significance of fragments of Sierran basement in the northern Coast Ranges, California (abs.): Geological Society of America, Abstracts with Programs, v. 23, no. 2, p. 6.
Jones, D.L., and Brabb, E.E., 1991, New geologic map of Contra Costa and Alameda Counties, Cali fornia (abs.): Geological Society of America, Abstracts with Programs, v. 23, no. 2, p. 40.
Jones, D.L., and Brabb, E.E., 1991, Juxtaposed Cenozoic stratigraphic assemblages in the east Bay hills - Mt. Diablo region, central California Coast Range (abs.): Geological Society of America, Abstracts with Programs, v. 23, no. 2, p. 40.
Olson, J. A., Wentworth, C.M., and Showalter, P.K., 1991, Seismicity of the southern San Francisco Bay region, California, and its correlation with mapped faults (abs.):Geological Society of America, Abstracts with Programs, v. 23, no. 2, p. 85.
Wentworth, C.M., Borcherdt, R.D., Fitzgibbon, T.T., and Showalter, P.K., 1991, Application of GIS technology to seismic zonation in the San Francisco Bay region, California: Proceedings of the Fourth International Conference on Seismic Zonation, Stanford, CA, August, 1991, submitted.
Borcherdt, R.D., Wentworth, C.M., Janssen, A., Fumal., T., and Gibbs, T., 1991, Methodology for predictive GIS mapping of special study zones for strong-ground shaking in the San Francisco Bay region, CA: Proceedings of the Fourth International Conference on Seismic Zonation, Stan ford, CA, August, 1991, submitted.
208

1.3
Subsurface Structure and Convergence Rates AcrossActive Fold-Thrust Belt of
Northern Los Angeles Basin, California
14-08-0001-G1967
Robert S. YeatsDepartment of Geosciences
Oregon State University104 Wilkinson Hall
Corvallis,OR 97331-5506503-737-1226
Investigations
This project began March 1. The long-range objective is to work out the subsurface structural geology of the fold-thrust belt at the northern margin of the Los Angeles basin from Santa Monica to downtown Los Angeles. During the first year, we will focus on the Beverly Hills, East Beverly Hills, Cheviot Hills, and San Vicente oil fields and extend the study south to the northern edge of the Inglewood oil field. This area should contain evidence for the northern continuation of the Newport-Inglewood fault, a possible segment boundary of the fold-thrust belt.
The project is receiving additional support from the Southern California Earthquake Center, which permits us to have four people (Gary Huftile, Cheryl Hummon, Craig Schneider, Bob Yeats) on the project rather than two. We have begun to construct structure contour maps on correlatable horizons, which will lead to retrodeformable cross sections, one through Culver City, Cheviot Hills, and Beverly Hills fields, and one through East Beverly Hills, San Vicente, and Sherman oil fields. Craig Schneider will focus on structures affecting the Miocene sequence, and Cheryl Hummon will concentrate on the longer wavelength structures affecting Pliocene-Quaternary strata.
In addition, a residual gravity map has been acquired from A. Griscom (see Jachens and Griscom, 1985). The residual gravity will be modeled as an independent test of retrodeformable cross sections that are being constructed by us and by others to work out convergence rates and provide a geological framework for distribution of instrumentally-located earthquakes.
Most of the wells are directionally drilled from town lots zoned for industrial use, and bottom-hole locations are commonly hundreds of meters from the surface location. To deal with this problem, Margaret Mumford is constructing a well base map at a scale of 1:6000 to show the map projection of the directionally-drilled wells. This well base map will be made available to all investigators through the Southern California Earthquake Center. We now have collected about 400 of the approximately 2000 wells to be used in the study. These well files will also be curated for public use through the
209

1.3
Southern California Earthquake Center.
Reference Cited
Jachens, R. C., and Griscom, A., 1985, An isostatic residual gravity map ofCalifornia--A residual map for interpretation of anomalies from intracrustal sources, in Hinze, W. J., ed., The utility of regional gravity and magnetic anomaly maps: Soc. Expl. Geophys., Tulsa, Oklahoma, p. 347-360.
210

1.3
Segmentation and Displacement Partitioning BetweenSurface Reverse Faults and Blind Thrusts,
Western Transverse Ranges, California
14-08-0001-G1798
Robert S. Yeats and Gary J. HuftileDepartment of Geosciences
Oregon State UniversityCorvallis,OR 97331-5506
(503) 737-1226
Investigations
Three cross sections (Figure 1, sections A-A5, B-B', and C-C') have been retrodeformed to the top of the Saugus Formation (300.+.100 ka; Lajoie et al., 1982; Levi et al, 1986; K. Lajoie, pers. comm., 1987)). This allows the determination of convergence rates for only the youngest structures formed after the end of Saugus deposition. Cross section E-E' has been completed in first draft by Prof. Huafu Lu of Nanjing University. Cross sections F-F* and G-G* are under construction. A geologic map, structure contour maps, and cross sections of the Piru 7h -minute quadrangle have been completed and are being drafted for submission as an Open-File Report. Mapping of the Piru quad was spot checked, and oil wells were interpreted in preparation for cross section D-D5.
A residual gravity map was acquired from A. Griscom (see Jachens and Griscom, 1985). The residual gravity will be modeled as an independent check of the cross sections A-A' through G-G\
Results
In the Modelo lobe segment of the San Cayetano fault, south-verging displacement is taken up entirely on the San Cayetano fault and associated folding. To the west, at Red Mountain (Figure 2), displacement is entirely taken up on the Red Mountain fault and associated folding. In between, in the Ojai Valley area (Figure 3), there is no north-dipping reverse fault. Displacement is taken up on a blind thrust. The surface expression of the blind thrust is the south-dipping homocline south of Sulphur Mountain and the Lion fault set (Figure 1) which dips south and extends down into bedding within the homocline, forming a passive backthrust above the blind thrust (Namson, 1987; Huftile; 1988; Namson and Davis, 1988; Huftile, 1991). Between Ojai Valley and the Modelo lobe, there is both the south-dipping homocline and a surface reverse fault, implying that the displacement is partitioned between the two structural types.
At South Mountain, there has been 2.5 km of vertical displacement since the end of Saugus deposition (Yeats, 1988). To the west of South Mountain, post-Saugus displacement decreases to zero. There displacement has been transferred, along a decollement in mudstone of the Rincon Formation, to the Ventura Avenue fold belt.
211

1.3
Horizontal shortening on the three cross sections varies from 5.9 km in the west at Red Mountain (Figure 2), to 4.6-5.7 km at Ojai Valley (Figure 3), and to 6.8 km at the Upper Ojai Valley (Figure 4) since the end of Saugus deposition at 300±100 ka. The cross sections have been retrodeformed showing minimum shortening. Shortening rates vary from 2.2±0.7 cm/y along A-A', to 2.1+0.9 cm/y along B-B', to 2.6±0.9 cm/y along C- C'. This implies an increase in convergence from west to east. The convergence rates are consistent with earlier estimates by Yeats (1981, 1983) of 2.0 cm/y and Rockwell (1983) of 1.7±0.4 cm/y.
Reports
Huftile, G. J., 1991, Thin-skinned tectonics and oil accumulation of the Upper OjaiValley and Sulphur Mountain area, Ventura basin, California: in press, AmericanAssociation of Petroleum Geologists Bulletin.
Huftile, G. J., in prep., Displacement transfer between surface reverse faults and blindthrusts, central Ventura basin, California: to be submitted to Tectonics.
Huftile, G. J., 1991, Displacement transfer between the Red Mountain and SanCayetano faults, Ventura basin, California, m_Keller, E. A., ed., Active folding inthe western Transverse Ranges: Guidebook, Geol. Soc. America, October 1991Convention.
Huftile, G. J., and Yeats, R. S., in prep., Cenozoic structure of the Piru 7^-minutequadrangle, California: to be submitted to USGS as an open-file report.
Yeats, R. S., 1991, The Ventura fault problem, in Keller, E., ed., Active folding andreverse faulting in the western Transverse Ranges, southern California: Geol.Soc. America guidebook, Annual Convention, in press.
Yeats, R. S., 1991, Contribution of folding to slip-rate determination: Oak Ridge fault atSouth Mountain, m Keller, E., ed., Active folding and reverse faulting in thewestern Transverse Ranges, southern California: Geol. Soc. America guidebook,Annual Convention, in press.
Yeats, R. S., and Huftile, G. J., 1991, Transfer of displacement from surfacefaulting at South Mountain to folding and blind thrusting at Ventura Avenueanticline, in Keller, E., ed., Active folding and reverse faulting in the westernTransverse Ranges, southern California: Geol. Soc. America guidebook, AnnualConvention, in press.
Yeats, R. S., Huftile, G. J., and Stitt, L. T., in prep., The east Ventura basin:
References cited
Huftile, G. J., 1988, Structural geology of the Upper Ojai Valley and ChaffeeCanyon areas Ventura County, California: unpub. M. S. thesis, Oregon StateUniversity, Corvallis, 103p.
, 1991, Thin-skinned tectonics of the Upper Ojai Valley and Sulphur Mountainarea, Ventura basin, California: in press, American Association of PetroleumGeologists Bulletin.
Jachens, R. C., and Griscom, A., 1985, An isostatic residual gravity map ofCalifornia-A residual map for interpretation of anomalies from intracrustal
212

1.3
sources, in Hinze, W. J., ed., The utility of regional gravity and magnetic anomalymaps: Soc. Expl. Geophys., Tulsa, Oklahoma, p. 347-360.
Lajoie, K. R., Sarna-Wojcicki,A. M., and Yerkes, R. F., 1982, Quaternarychronology and rates of crustal deformation in the Ventura area, California, in,Cooper, J. D., compiler, Neotectonics of southern California: Geol. Soc. AmericaCordilleran Section Field Trip Guidebook, p. 43-51.
Levi, S., Schultz, D. L., Yeats, R. S., Stitt, L. T., and Sarna-Wojcicki, A. M., 1986,Magnetostratigraphy and paleomagnetism of the Saugus Formation near Castaic,Los Angeles County, California: Cordilleran Section, Geol. Soc. America,Neotectonics Field Trip Guide, p. 103-110.
Namson, J., 1987, Structural transect through the Ventura basin and westernTransverse Ranges, in Davis, T. L. and Namson, J. S., eds., Structural evolution ofthe western Transverse Ranges: Society of Economic Paleontologists andMineralogists, Pacific Section Guidebook 48A, p. 29-41.
, and Davis, Thorn, 1988, Structural transect of the western Transverse Ranges,California: Implications for lithospheric kinematics and seismic risk evaluation:Geology, v. 16, p. 675-679.
Rockwell, T. K., 1983, Soil chronology, geology, and neotectonics of the north centralVentura basin, California: unpub. Ph. D. dissertation, University of California,Santa Barbara, 424p.
Yeats, R. S., 1981, Deformation of a 1 Ma datum, Ventura basin, California: finalreport, USGS contract 14-08-0001-17730, Mod. 3, Menlo Park, 26 p.
, 1983, Large-scale Quaternary detachments in the Ventura basin, southern California: Journal of Geophysical Research, v. 88-B1, p. 569-583.
, 1988, Late Quaternary slip rate on the Oak Ridge fault, TransverseRanges, California: Implications for seismic risk: Jour. Geophys. Res., v. 93, p. 12,137-12,149.
Figure captions
Figure 1; Index map showing the surface traces of western Transverse Ranges faults and major folds, and cross section locations for this paper, Yeats (this volume), and Yeats and Huftile (this volume). The domain boundary separates late Pleistocene surface reverse fault displacement on the Oak Ridge fault in the east and displacement transferred along a decollement in mudstone of the Rincon Formation to the Ventura Avenue anticline and Rincon anticline. Abbreviations are: CB-Carpinteria basin, UOV- Upper Ojai Valley, ACS-Ayers Creek syncline, RMA-Red Mountain anticline, and VF- Ventura fault.Figure 2; Cross section A-A'. The top is the interpretation of the present-day structure, and the bottom is retrodeformed to the top of the Pleistocene Saugus Formation, 300±100 ka. The Saugus Formation is lightly shaded and the Oligocene Sespe Formation, near the top of the competent sandstones, is darkly shaded. Abbreviations are: Qs-Pleistocene Saugus Formation, Qca-Pleistocene Casitas Formation, Qmp- Pleistocene "Mudpit Shale", Qsb-Pleistocene Santa Barbara Formation, QTf-Plio- Pleistocene Fernando Formation, Tfr-Pliocene Fernando Formation bearing benthic foraminifera of the Repettian Stage, Tsq-Pliocene Sisquoc Formation, Tm-Miocene
213

1.3
Monterey Formation, Tr-upper Oligocene to lower Miocene Rincon Formation, Tcv- Miocene Conejo Volcanics, Tv-Oligocene Vaqueros Formation, Tsp-Oligocene Sespe Formation, Tcw-Eocene Coldwater Formation, Ted-Eocene Cozy Dell Formation, Tma- Eocene Matilij a Formation, Tj-Eocene Juncal Formation, Til-Eocene Llaj as Formation, Tpl-undifferentiated Paleocene strata, K-Cretaceous, PJF-Padre Juan fault, TCF-Tule Creek fault, APF-Arroyo Parida fault, SYF-Santa Ynez strike-slip fault, SYB-Santa Ynez backthrust, and MCF-Mid-Channel fault. Tew, Ted, and Tma together form Upper Eocene (U. Eo.) strata.Figure 3: Cross section B-B', present-day and retrodeformed to the top of the Saugus Formation. Abbreviations are the same as in Figure 2; Mgr-Mesozoic granite, TT- Taylor thrust, BT-Barnard thrust. Movement on the Taylor thrust is constrained to between 1.3-0.65 Ma by Yeats (1983).Figure 4: Cross section C-C', present-day and retrodeformed to the top of the Saugus Formation. Abbreviations are the same as in Figure 2; LMA-Lion Mountain anticline, and RS-Reeves syncline.
214

^10 km ^v£: Lowlands 655^5 I. t ~3f~ iii i
3* u / T°Pat00a ..]}. <#3>,.X"I / YIODELO \^OLSER F ?
LOBE J+Z- ^^j-aSs^raMtesW
r- fi fc w *-^^PrtSw'.:^
Santa Monica Mountains
MALfBU
Figure 1

N10E
NJt-» ON
VenturaAve. anticEne
Santa BarbaraChannel
inactiveOak Ridge
fault
Lake CasitasSho[e RedMtn. AyersCr.
Santa YnezMtns.
Pin
S.L.
Figure 2

10h-l -J
N8E
Pin ?
Santa Clara
V. Ventura Ave. anticline
Shore fS&HL Taylor M°jy» I °fi%» thrust--
- - ^ »A A'/
Sulphur Mtn. anticlinorium
Lion fault set
Topatopa Mtns. pjn 9'
-6 km
J-10km
-1SI<m
Pininactive
Montalvo Oak Ridge fault fault
ss /
Lion fault set
Figure 3
Pin ?

N12E-
to(-> oo
,*h?J* Oxnard Plain
fi Oak Ridge VenturaAve.« ^A/^ffiJ? antidine
Upper Oj'ai
Sulphur Mtn. *' anticlinorium
Uon fault Topatopa Mtns. Pin
Figure 4
LO

II.1
The Coda Site Amplification Factors at Frequencies 1.5,3.0,6.0 and 12.0 Hz for Central California
No. 14-08-0001-G1966
Keiiti AkiDepartment of Geological SciencesUniversity of Southern California
Los Angeles, CA 90089-0740(213) 740-5830
MethodSince the pioneering work of Aki (1969), the fundamental separability of source, site and
path effects in the coda wave power spectrum has been confirmed by many researchers (Aki and Chouet, 1975; Phillips and Aki, 1986, Su el al., 1990; Mayeda el al., 1991). We use the sameformula to isolate the site effect by considering the coda power spectrum p(co/t) = Source(co)*Site(co)* path(co/t), here co is the circular frequency and t is the lapse time measured from the origin time of an event. Under the assumption that the coda energy is the sum of back-scattered wave energy from heterogeneities in all directions we derived a matrix form from above expression:
Gv + n = d
where d is the data vector which can be obtained from the observed coda power spectrum and v is the model vector which contains the relative site amplification factors to be determined and n is a noise vector. G is a real matrix. In practice, this matrix could be huge and very sparse. By applying the recursive stochastic inversion method (Zeng et al., 1991) we are able to solve our problem efficiently.
DataA total of 185 earthquakes located in the central California area recorded by 134 short-
period seismic stations of USGS at Menlo Park from 1984 to 1990 were collected for this study. The magnitude of these earthquakes ranged from 1.8 to 3.5 and their depths ranged from 0 to 20 km. These 134 seismic stations are located on a wide variety of geologic settings ranging from alluvium to Mesozoic rocks. All the seismograms used were recorded by USGS standard vertical instruments with the natural frequency of 1 Hz. All seismograms were corrected for instrument response by the use of the calibration information provided by Eaton (1980). Since instrument gain settings changed frequently over the time period spanning our collected events, special care was taken to ensure the proper gain corrections by using station history files. Since the calibration curve is non-linear above 16 Hz, our octave bands are limited to center frequencies from 1.5 to 12 Hz.
Results(1) The coda site amplification in central California.
The final inversion results of relative site amplification factors are listed in Table 1. The typical standard errors, in natural log, are about 0.065, 0.056,0.051 and 0.050 for frequencies 1.5, 3.0, 6.0 and 12.0 Hz separately.
In general, from Table 1, we found that the site amplification factor of a station is mainly controlled by its underlying surface geology. The site amplification is high for young, Quaternary sediments and decreased with increasing geologic age at all frequencies between 1.5 and 12.0 Hz. The rate of decrease varies with frequency. Site amplification factors decrease faster at low frequencies than that at higher frequencies.
(2) The relation of coda site amplification factors with surface geology.
219

II.1
To quantify the relation between site amplification factor and site geology condition, the surface geology of station sites was classified into five groups: (a) Quaternary sediment, (b) Tertiary Pliocene sediments, (c) Tertiary Miocene through Cretaceous sediments, (d) Franciscan formation and Mesozoic granitic rocks, (e) pre-Cretaceous metamorphic rocks. The station site amplification factors in each group were logarithmically averaged and the mean value was assigned to the median geologic age of that group. Figure 1 shows the mean values versus their median geologic age. The standard error as well as standard error of the mean are also shown. A smooth power law relation is observed between mean site amplification and the median geologic age. This relation provides a simple way to estimate site effect at a specific site with known surficial geology.
(3) The correlation between coda site amplification factors and earthquake ground motion.A remarkable linear correlation was found between logarithmic amplification factor and the
magnitude site residual for the USGS seismic network at Menlo Park determined by Eaton (1991), as shown in Fig. 2, where XMGK is amplitude magnitude residual and FMGK is duration magnitude residual. This results suggests that our method provides an effective means of weak motion site amplification estimation.
Comparison of our site amplification factors with strong motion results obtained from the Loma Prieta earthquake (Shakal £t al, 1989; Chin and Aki, 1991) suggest that weak and strong motion site amplification correlate well in the region outside the epicentral source region beyond epicentral distance of about 50 km. Within this region, however, the weak motion amplification factor estimated from coda wave do not agree with observed site effect on strong ground motion suggesting a non-linear site effect within epicentral source region at sediment sites for strong motion.
ReferencesAki, K., Analysis of the seismic coda of local earthquakes as scattered waves, J. Geophys. Res.,
74, 615-631, 1969. Aki, K., and B. Chouet, Origin of coda waves: Source, attenuation and scattering effect, J.
Geophys. Res., 80, 3322-3342, 1975. Phillips, S., and K. Aki, Site amplification of coda waves from local earthquakes in central
California, BSSA, 76, 627-648, 1986. Su, F. £j al., A recursive stochastic inversion of site effect using coda waves, EOS, 71, 1475,
1990. Mayeda, K. el al, Site amplification from S-wave coda in the Long Valley Valdera Region,
California, BSSA, in press, 1991. Chin, B., and K. Aki, Simultaneous determination of source, path and recording site effects on
strong ground motion during Loma-Prieta earthquake - a preliminary result on pervasivenon-linear site effect, BSSA, in press, 1991.
Eaton, J. P., Response arrays and sensitivity coefficients for standard configurations of the USGSshort-period telemetered seismic system, USGS Open-file report, 80-316, 1980.
Eaton, J. P., Determination of amplitude and duration magnitudes from CALNET records, BSSA,in press, 1991.
Shakal, A. el al., CSMIP strong-motion records from the Santa Cruz Mountains (Loma Prieta),California earthquake of 17 October 1989, California Strong Motion InstrumentationProgram Report No. OSMS 89-06, 195, 1989.
Zeng el al., Scattering wave energy propagation in a random isotropic scattering medium, 1,Theory, J. Geophys. Res., 96, 607-620, 1991.
220

IZZ
l-otn'ooxtDcncixxnggotj'o'ox;
g OJU»U»CJCJCJCJCJCJCJCJCJCJCJU»CJCJCJCJCJCJCJCJCJCJCJCJCJCJCJCJCJCJCJCJCJCJCJCJCJCJCJCJCJCJCJCJCJCJCJW
CJMCJ* CJMMMM UIMMM M CJ » Ul Ul M M M « Ul Ul CJ Ul « M M M Ul M CJ * * » M Ul « Ul M M Ul CJ M M Ul Ul Ul *> *
MMMMMMMMMMMMMMMMMMMMMMMMMMMMMMMMMMMMMMMMMMMMMMMMMMMMMMMMMMMMMMMM K-
U*M M«« MMMCJ MMMM*UI M Ul »Ul M * Ul Ul Ul M * * CJ M M * M M M M M * » Ul M«M
M|
000000000 OOOOOOOOM OOMOpOOOOO OppMMpppppppJ-'MM MMppOfcJ M
|UMMl^AO«Mmk>VjCJ«UIMmmMMUIO«<oVjMCJ^CJM-JCBMOOtO\M<OUICJV>^CdOCJOUItOMXril IMO»^UtU«3MWo3»Oa»U»3»Uie»CJMUICJCJOCDlllMU10»-.JO»»0«0»MCBO»UIUIM>-«BUI-JO»»-JO»00(*;*-
o
OOOOOOOOOOOOOOOOOOOOOOOOOOOOOOOOOMOOOOMOOOOOOOOOMOOOOOOMMMOOMpMpavH-
OOOOOOOOOOOOOOOOOOOOOOOOOOOOOOOOOOOOOMO
* & o !_,o> (D
* MMKJM CJM
MO o»cj»aa*>>J<B-O
M MCJCJ* * » CJ Ul CJ CJ N> t-> t-> t-> CJ t-> » N> N> Cll CJ Ul M CJ Ul N> M CJ MM* » M « CJ M »- U> * * Ul » Ul Ul M CJ Ul M CJ Ul * » »- CJ M M M M«M(AbJMOM«JM^«M«ouiuicaaDbJMbJaBuiui«>j««>«Juiuiuia»ui-JMbJV>v>v>Mui^uiokM«ookOMM«o<ouiokaDovovoaDaD-JbJ*icBMaD* <«> O\ WCJUI CBbJUICJM «OkOMUIOtCB -JO«UI| OJM CJOtMUl -J^bJUICJMbJOCBMVO*!-* -JCBbJ<
«OOOOOOOOOOOt-»OOOOt-»»-'OOOOOOOOOOOOOOOOOOI-«OOOOOOOOOOOOOOOOOOOOOOOOOOO
MO 00000<I I I I I I I I I IIII I I I I I
Km M a\ MMUI * M -J -Jui -j« CJ «OtCBUI« O-J »D SO<9»<
MO OOOOOOOOOOOOOOOOOOOMOMOOOOOOOOOOOOOMOOOOOOOOOOOOOOOOOOOOOOOOOOOOOO
I I I I I II I I II III III -II II I I I I I I I I I I I I I I I I I I I I III MO OOOOOOOOOOOOOOOOOOOOOOOOOOOOOOOOOH«OOOOOOOOOOOOOOOOOOOOOOOt-»OOOOOOOO
MO bJbJUIoJCJMMOOat«OOIO\O\MatMoJO\MCBO«MK>CJMMM»MoJMO«OUIMUIMUIMOCJOMatVOUI<O««CBCBOMOOUI«CJ*OMOoJ
Jt 3 MM33
>-k>-k ccccccccccc
I'll

zzz
KV
*)t
U
I IJ
1
OQ n>
ft r !,
-IJ
-
-U
U
-I
-«J
I,
I'll
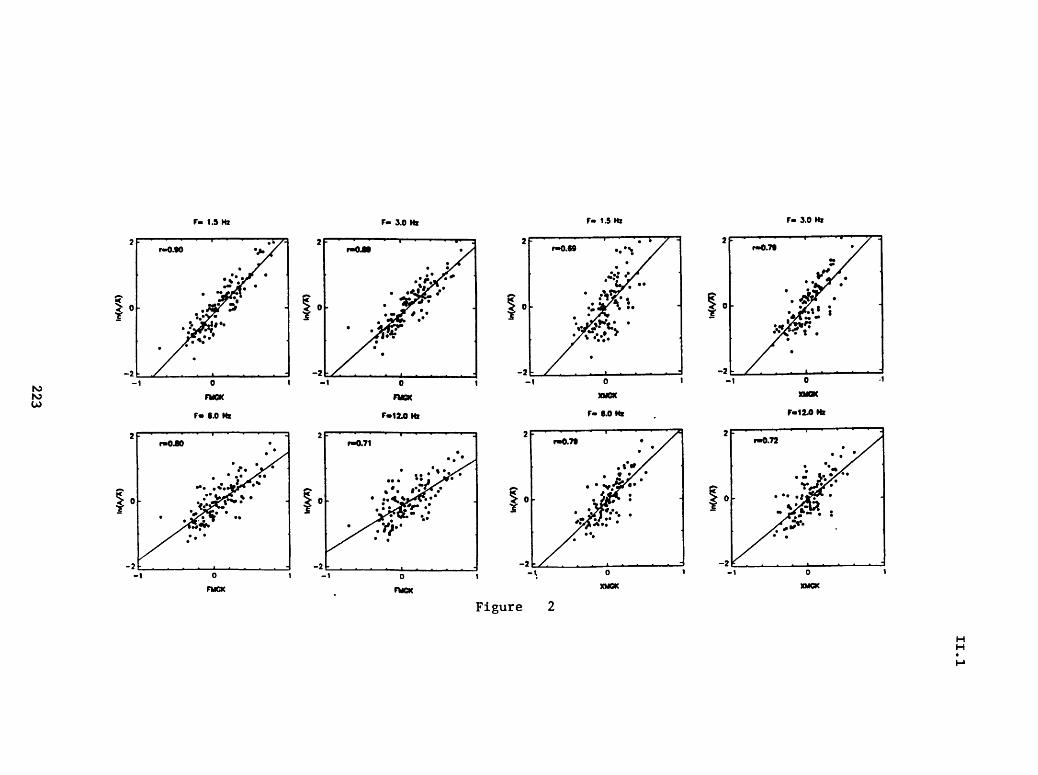
Tm 1.5 Hi F- 3.0 Hi F« 1.5 Hi F- 3.0 Hi
r-0.90
-2 - -20
FMCK
F- 6.0 Hi
r-0.80
-20
FMCK
-2 -_ -1
0
FUCK F-IJ.O HI
0
FUCK
r«0.69
o xucx
F» 6.0 Hi
-2 i
r»0.7»
0
XMCK
Figure 2
-2 1.1 -1
r-0.7»
0
XU6K
-2t
f-0.72
oXMCK
H H

II.1
On-Line Seismic Processing
9930-02940
Rex AlienBranch of SeismologyU.S. Geological Survey
345 Middlefield Road, MS 77Menlo Park, California 94025
(415) 329-4731
Investigations and Results
The INMOS RTP system is working with six picker processors at present, and is being tested with real digital data from a 100-station subset of CALNET. Expansion of the system by plugging in more processors and telling the software about the expan sion did indeed go just as smoothly as advertised. The A/D is complete except for some tweaking, and Grey Jensen says he expects no major problems. The INMOS equipment appears to receive the digital data smoothly, and the earlier difficulties with interprocessor communication in the INMOS system itself have been resolved.
The Mk I RTP's at Menlo Park and the University of Utah have continued to operate satisfactorily, as have the Mk IPs at Menlo Park and Caltech.
224
II.1
Long Baseline Tiltmeters: Southern California
14-08-0001-G1790
John BeavanLamont-Doherty Geological Observatory of Columbia University
Palisades, New York 10964(914) 359-2900
InvestigationsWe are analysing data from a 535 m long-baseline half-filled water tube tiltmeter that has
operated for eight years at Pinon Flat Observatory (PFO) in the San Jacinto Mountains of southern California. This analysis, in conjunction with analysis of data from a similar instrument by the University of California, San Diego (UCSD), is used to investigate:
(1) sources and magnitudes of noise affecting the tilt signal;(2) methods of referencing tiltmeters to depth;(3) interpretation of tilt signal.
We also work on the development of improved water level sensors for future tiltmeter installations.
Results (April, 1991)
1. Tiltmeter Sensor DevelopmentDevelopment of a simple absolute sensor (USGS Open File Report 90-54, pp 163-165,
1989) is virtually complete, and two prototypes will be installed at Mammoth Lakes, California during Spring 1991. The power requirements have been reduced to about 250 mA at 12 V; since most of the electronics can be turned off between samples this makes the instrument potentially operable from batteries for extended periods of time.
2. PFO Tiltmeter Data AnalysisThe analysis of the Pinon Flat tiltmeter data was discussed in USGS Open File Report 90-
334, pp 165-168. The micrometer intercomparison experiment between the LDGO and UCSD tiltmeters has now been terminated. The LDGO interferometers at PFO continue to collect data. We plan, in conjunction with UCSD, to publish the results from the PFO long-baseline tilt experiment during 1991.
3. Mammoth Lakes Tilt DataThe past year of tilt data from the long base tiltmeter at Mammoth Lakes, as edited and
corrected at Lamont, is illustrated in Figure 1. Corrections for vertical strain (i.e., vertical motions of the end piers relative to the bottoms of the boreholes) have been made using data from the vertical strainmeters installed by Roger Bilham in late 1989. No temperature corrections have yet been made, but these do not appear to be particularly significant. The edited data agree closely with analysis done independently at the University of Colorado (Bilham, pers. comm., 1991). Figure la shows corrected and edited data from the individual tilt components. Figure Ib shows 14-day averages of the tilt rate and its azimuth. Figure Ic is an alternate presentation of the tilt vector data that shows the monthly-averaged path that the point of a freely hanging pendulum would describe with respect to the ground. These plots all
225
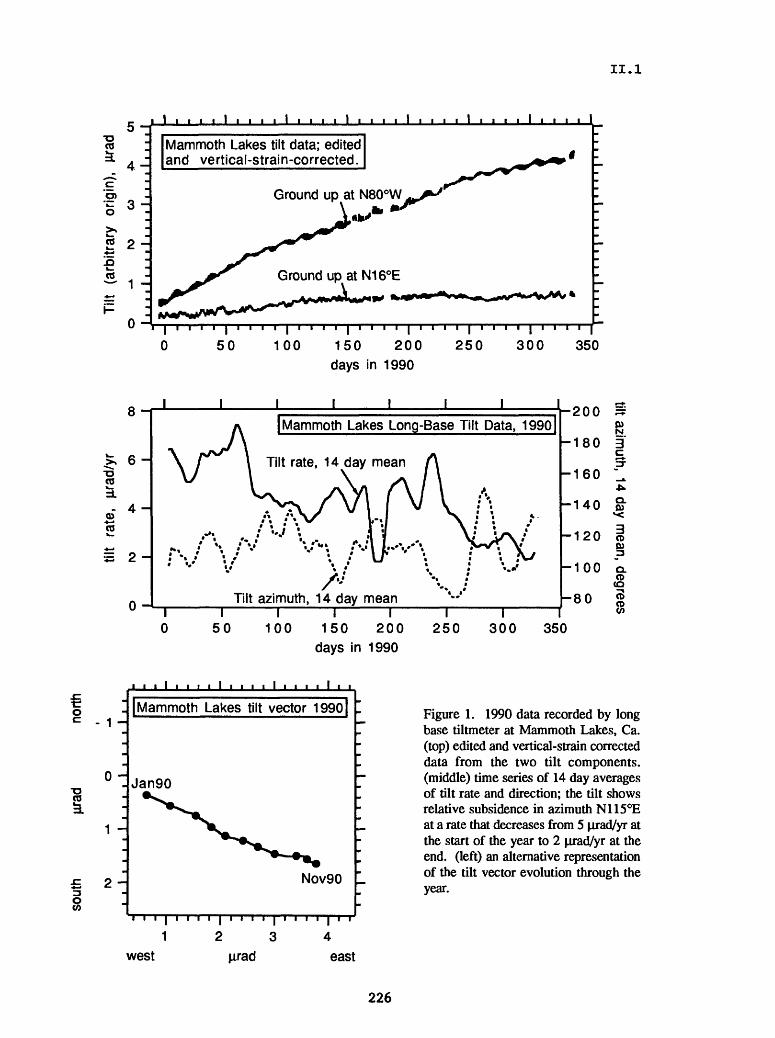
II.1
ow_to
5-1
4 -
o>5 3
CO O v- ^
1
0
I I I
Mammoth Lakes tilt data; edited and vertical-strain-corrected.
50 100
^1 i I
150 200 days in 1990
250 300 350
8 -I
>, 6Hcok.
to
S 2 H
0 -
I I
[Mammoth Lakes Long Base Tilt Data, 1990|
Tilt rate, 14 day mean
Tilt azimuth, 14 day mean1^
50 100 150I I
200 250
-200
-180
-160
-140
-120
-100
-80I
300 350
N
Q. 05*<
CD
Q. CD (Q
CDCD
days in 1990
- 1 -
0 -
d ___
2-
oCO
[Mammoth Lakes tilt vector 1990[
Jan90
Nov90
west2 3
firad
Figure 1. 1990 data recorded by long base tiltmeter at Mammoth Lakes, Ca. (top) edited and vertical-strain corrected data from the two tilt components, (middle) time series of 14 day averages of tilt rate and direction; the tilt shows relative subsidence in azimuth N115°E at a rate that decreases from 5 urad/yr at the start of the year to 2 |irad/yr at the end. (left) an alternative representation of the tilt vector evolution through the year.
east
226

II.1
demonstrate the rapid deformation episode that has been occuring since late 1989 (Langbein et al. t 1990). The data describe a tilt rate of ~5 jirad/yr at the start of 1990, decreasing to ~2 jorad/yr at present. The azimuth of the tilting has been fairly constant at 115°±20° throughout the episode. This is consistent with the model developed by Langbein (1990) to fit the 2-color geodimeter data.
We note that different assumptions regarding the vertical strain corrections to the data (including the application of no vertical strain correction at all) reduce the 1990 tilt rates by no more than 20% and increase the tilt azimuth by no more than 20°. We will not discuss these technical details further here, but they are something we will examine closely in the future in order to assure the optimum recovery of tilt rates from the instrument. This result does indicate, however, that the first two years of data from the Mammoth instrument (prior to installation of the deep references) can be usefully used even though their quality is not as high as the 1990 and later data.
4. Need for Absolute Sensors at Mammoth LakesThe Mammoth tiltmeters use the LDGO laser interferometer water level sensors. These are
subject to losing their measurement baseline during local earthquakes, power failures or instrument breakdowns. Roger Bilham has been working on a technique to "catch" counter jumps in the interferometer system by using a rapid sampling technique. However, it is not the instantaneous jumps that are most troublesome when editing the interferometer data, for these can usually be accurately corrected by matching the continuous data on either side of the jump (Figure 2a).
Rather, it is when the instrument has been disturbed by a local earthquake or a visit to the vault, or when it has been out of action for some time due to a laser failure or interferometer misalignment, that repair of any offset becomes difficult (Figure 2b). These Figures illustrate the primary reason why we have been developing the absolute sensor, and the reason why we wish to run two of them in parallel with one arm of the Mammoth Lakes riltmeter.
4000-
3000-
CO
CO » c.U Oo
[Editing fringe jumps in data from interferometer sensor
I I I I I T 188.0 188.5 189.0 189.5 190.0 190.5 191.0
days in 1990
Figure 2a. Instantaneous jumps in the interferometer fringe counter can be repaired by matching the continuous data on either side.
227
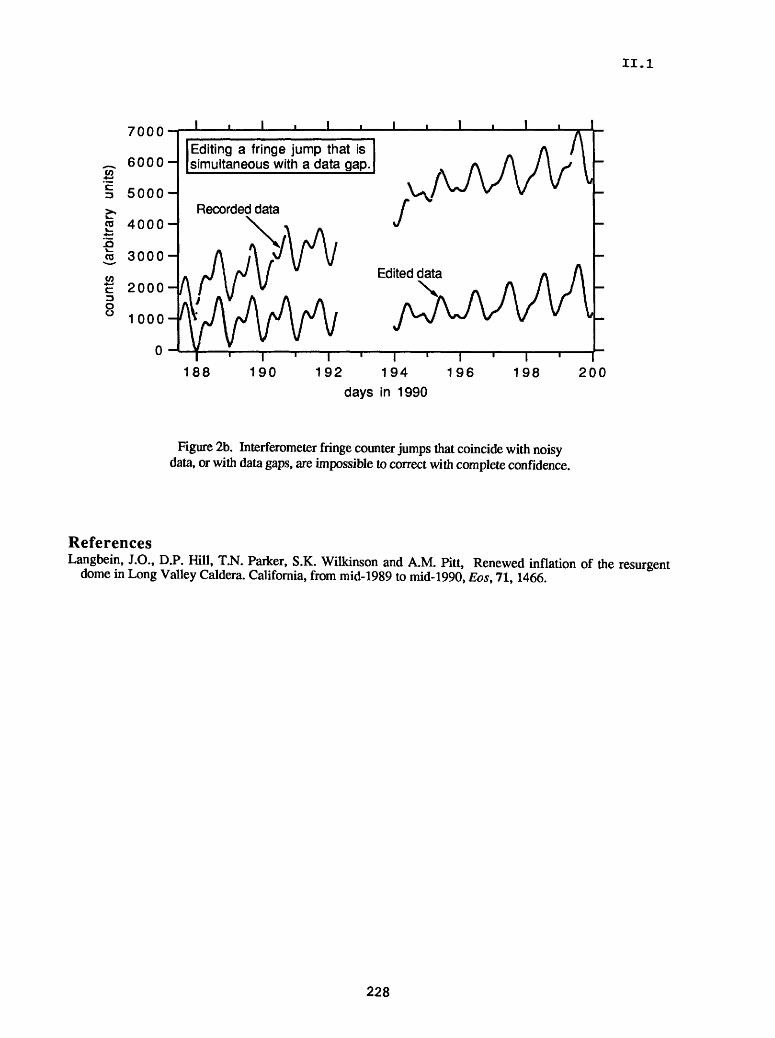
II.1
7000
_ 6000- w
§ 5000-
2 4000-2co 3000H
2000H
1000
0 J
Editing a fringe jump that is simultaneous with a data gap.
Recorded data
188
vA/VAA
Edited data
T T190 192 194 196
days in 1990
198 200
Figure 2b. Interferometer fringe counter jumps that coincide with noisy data, or with data gaps, are impossible to correct with complete confidence.
ReferencesLangbein, J.O., D.P. Hill, T.N. Parker, S.K. Wilkinson and A.M. Pitt, Renewed inflation of the resurgent
dome in Long Valley Caldera. California, from mid-1989 to mid-1990, Eos, 71,1466.
228
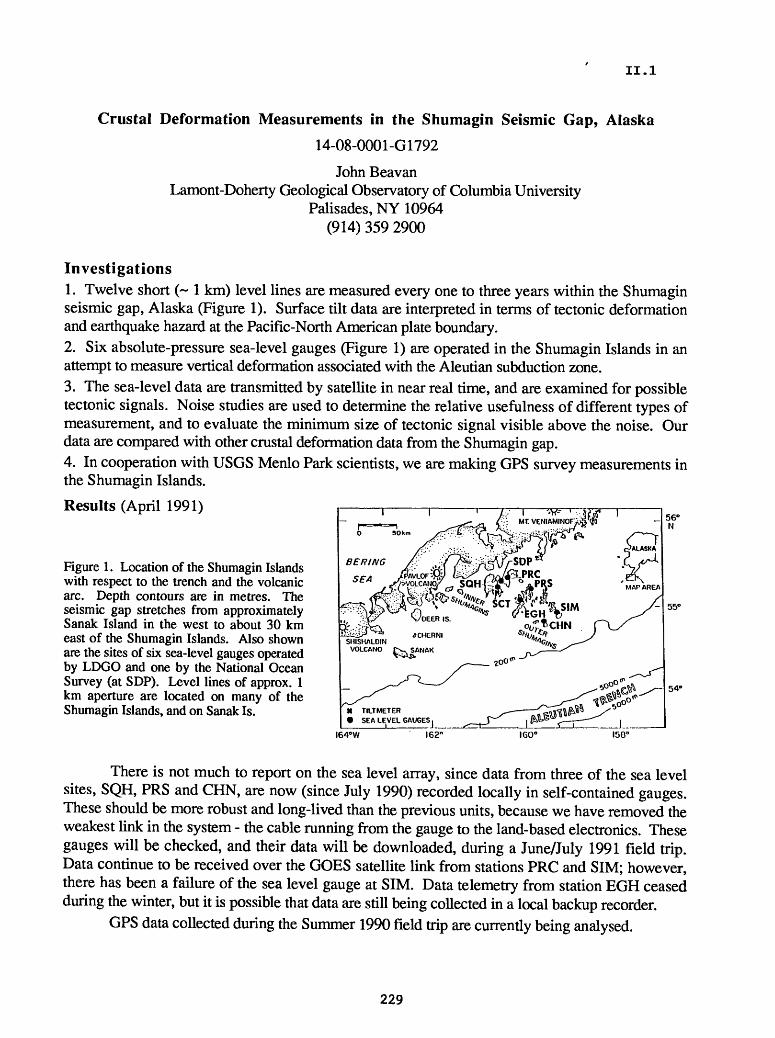
II.1
Crustal Deformation Measurements in the Shumagin Seismic Gap, Alaska
14-08-0001-G1792
John BeavanLamont-Doherty Geological Observatory of Columbia University
Palisades, NY 10964(914) 359 2900
Investigations1. Twelve short (~ 1 km) level lines are measured every one to three years within the Shumagin seismic gap, Alaska (Figure 1). Surface tilt data are interpreted in terms of tectonic deformation and earthquake hazard at the Pacific-North American plate boundary.2. Six absolute-pressure sea-level gauges (Figure 1) are operated in the Shumagin Islands in an attempt to measure vertical deformation associated with the Aleutian subduction zone.3. The sea-level data are transmitted by satellite in near real time, and are examined for possible tectonic signals. Noise studies are used to determine the relative usefulness of different types of measurement, and to evaluate the minimum size of tectonic signal visible above the noise. Our data are compared with other crustal deformation data from the Shumagin gap.4. In cooperation with USGS Menlo Park scientists, we are making GPS survey measurements in the Shumagin Islands.
Results (April 1991)
Figure 1. Location of the Shumagin Islands with respect to the trench and the volcanic arc. Depth contours are in metres. The seismic gap stretches from approximately Sanak Island in the west to about 30 km east of the Shumagin Islands. Also shown are the sites of six sea-level gauges operated by LDGO and one by the National Ocean Survey (at SDP). Level lines of approx. 1 km aperture are located on many of the Shumagin Islands, and on Sanak Is.
I64°W 162"
There is not much to report on the sea level array, since data from three of the sea level sites, SQH, PRS and CHN, are now (since July 1990) recorded locally in self-contained gauges. These should be more robust and long-lived than the previous units, because we have removed the weakest link in the system - the cable running from the gauge to the land-based electronics. These gauges will be checked, and their data will be downloaded, during a June/July 1991 field trip. Data continue to be received over the GOES satellite link from stations PRC and SIM; however, there has been a failure of the sea level gauge at SIM. Data telemetry from station EGH ceased during the winter, but it is possible that data are still being collected in a local backup recorder.
GPS data collected during the Summer 1990 field trip are currently being analysed.
229

II.1
Finite Element Modeling of the California Fault System
Agreement No.l4-08-0001-G-1947
Peter BirdDepartment of Earth and Space Sciences
University of CaliforniaLos Angeles, CA 90024
(213) 825-1126
Investigations Conducted:
1. Our previous thin-plate finite element program, with faults, that we developed in 1978-84 for modeling of California (Bird and Baumgardner, 1984) was improved by incorporation of the methods described in Bird (1989) for the representation of a Mohr/Coulomb/Navier frictional layer within crustal blocks. This is intended to improve realism and to speed convergence. The modified code was tested on input datasets from 1984.
2. An improved method was devised for the representation of vertically-dipping, strike-slip faults. Previously, we had imposed a constraint equation to preclude relative convergence or divergence across these fault plane. This conserved volume exactly, but made it impossible to determine the normal stress on vertical faults, which was therefore assumed to be lithostatic. In the new method, volume conservation on such planes is only approximated, by use of a large stiffness (penalty function method). Although this seems less elegant, the new method allows determination of anomalous (deviatoric) normal stress, for a fully realistic treatment of friction.
3. All of the older parts of the code were rewritten by the P.I., in order to improve clarity, emphasize assumptions and approximations, trap common input errors, and follow structured-programming precepts. The goal is to produce a code which can be widely distributed, understood, and used by non-specialists.
Results:
1. The improved treatment of friction in crustal blocks did not cause any major change in the character of solutions, which remained realistic. Unfortunately, it did not yield monotonic convergence, either. The source of residual oscillations is thought to be within the code which updates fault stiffness. (This was one of the major motivations for reprogramming all of this old material from scratch.)
2. The new method of representing strike-slip faults is much more compactly represented within the stiffness matrices, allowing a bandwidth which is 40% smaller than before. This gives either a 60% reduction in computing cost, or alternatively a 30% increase in (linear) spatial resolution at fixed cost.
3. The rewritten code is being checked with such tools as the IBM VS-FortranIntercompilation Analyzer and the Interactive Debugger, which were not available during the previous code generation. In this environment, completely error-free code within 1-2 months is a reasonable goal.
230

II.1
Planned Investigations:
1. Revise the input dataset to incorporate new heat flow data, new relative plate rotations, and new seismic constraints on crustal thickness, chiefly from published time-term analyses.
2. Compute a suite of models, adjusting the nonlinear frictional/creep rheology of faults and crustal blocks.
3. Add elastic-anti-dislocation corrections to the solutions for all fault elements which have been temporarily locked, and positive dislocations in elements which have moved.
4. Compare model predictions to geodetic data and compute scores. Select the best-fitting model.
5. In conclusion, we hope to determine: the friction of the San Andreas and otherCalifornia faults, and whether this decreases with net slip and thickness of the gouge layer (Byerlee, 1990); the Theological constants for the crustal blocks between faults; the long-term average slip rates of all the major faults; the pattern of present velocities, strain-rates, and stress-rates; and (therefore) the locations of greatest seismic risk.
References Cited
Bird, P., and J. Baumgardner (1984) Fault friction, regional stress, and crust-mantlecoupling in southern California from finite element models. J. Geophys. Res.. 89.1932-1944.
Bird, P. (1989) New finite element techniques for modeling deformation histories ofcontinents with stratified temperature-dependent rheologies. J. Geophys. Res.T 94.3967-3990.
Byerlee, J. (1990) Friction, overpressure, and fault normal compression, EOS, 71,1580.
231

II.1
High Temporal and Spatial Resolution of Crustal Deformation with GPS
14-08-0001-G1673
Yehuda Bock and Jeff GenrichInstitute of Geophysics and Planetary Physics
Scripps Institution of OceanographyLaJolla, CA 92093
(619) 534-5292 E-Mail: [email protected]
Objectives
GPS surveying has the potential to provide crustal deformation precursors for the prediction of large earthquakes and, in particular, to allow the rapid and dense monitoring of coseismic and postseismic strain transients which would add to our fundamental understanding of the physics of the earthquake process. The goal of this research is to develop and evaluate the capability of surveying spatially dense, small- and possibly medium-aperture, three-dimensional geodetic networks, in near real-time with several millimeter-level accuracy using kinematic-type GPS techniques.
Data Collected
Imperial Fault Kinematic Survey
In May 1991, we surveyed a large portion of the Imperial College network across the northern part of the Imperial Fault near El Centra This network has been surveyed previously with very precise EDM instruments (first the Kern Mekometer and then the Kern Geomensor) since the early 1970's, with USGS support [Mason, 1987]. The Geomensor measures distances with an accuracy of ± (0.1 mm + 0.1 ppm). The network consisted of approximately 300 stations at the time of the October 15, 1979 Imperial Valley earthquake, with stations about 800 meters apart at road intersections, about half of which lay in an 8x10.5 km block extending more than 6 km on either side of the surface break. The network was last measured horizontally in 1987. In January-April 1991 the network was leveled by Imperial College using trigonometric leveling. The network is ideal for kinematic GPS surveying. The terrain is flat and there are very few obstructions which in most cases can be easily avoided.
The portion of the network that we surveyed is shown in Figure 1. We deployed 4-5 Trimble 4000 SST receivers for four days (5-6, 8-9 May). Two receivers were used in kinematic mode while the remaining 2-3 receivers were deployed as base stations in static mode. To obtain redundancy we surveyed crossover points. Furthermore, the roving receivers moved from site to site synchronously. Typically, each kinematic site was surveyed for 10 minutes in order to average out multipath errors. Each roving team was able to survey about 10 points during two kinematic windows (five or more satellites) of 75 and 60 minute duration. Based on our Kennedy Alignment Array results (see below), we expect that the precision of a kinematic position will be on the order of 1-2 mm, horizontally and vertically. We plan to compare our results with the horizontal and vertical measurements collected by Mason and his colleagues.
Parkfteld to Cholame Surveys
In November 1990 and February 1991, we performed static, kinematic and pseudo-kinematic GPS measurements along the San Andreas Fault between Parkfield and Cholame. We used Trimble 4000 SST receivers in November and Ashtech XII receivers in February.
232

II.1
We collected data at four sites near Parkfield that have been surveyed regularly by the USGS since 1986. We surveyed 12 marks along a 12 km profile crossing the San Andreas fault at Parkfield. Two receivers were held fixed at the endpoints of the profile for a six hour period while the other two receivers surveyed the remaining 10 marks in the so-called pseudo-kinematic mode. The profile was first surveyed by us in November, 1990.
We surveyed the USGS Kennedy Ranch Alignment Array located 10 km southeast of Parkfield using kinematic GPS (Figure 2). On 11 November 1990, we observed the ten points of the 258 m long array with one hour of observations using three Trimble 4000 SST receivers. On 8-10 February 1991, we reobserved the array for one hour on each day using three Ashtech XII receivers. The data at the two end points of the array were collected at a 1 second sampling rate for the entire one hour period for all surveys. A roving receiver measured the intermediate points with repeated 3 minute occupations sampled at a 15 second sampling rate.
We surveyed a 12-station kinematic profile across the San Andreas Fault along Highway 46 near Cholame. Four receivers were deployed at the endmost points of the profile. A roving receiver measured the intermediate points with 3-5 minute occupations. This profile has also been measured twice by Ken Hudnut
Permanent GPS Geodetic Array
The Permanent GPS Geodetic Array (PGGA) has been operated a NASA pilot project since the spring of 1990 by Scripps Institution of Oceanography (SIO) and the Jet Propulsion Laboratory, with assistance from Caltech, MIT and UCLA (Bock and Shimada, 1990; Bock et al., 1990; Bock 1991). The objectives are to monitor crustal deformation continuously, in near real-time and with millimeter accuracy, using a fully automated and economically feasible system. The roles of the PGGA also include providing reference sites for more detailed GPS geophysical surveys and supplying precise GPS orbital information.
Everyday at 00:00 UTC a personal computer at SIO invokes a series of programs that dial up the PGGA stations using high-baud-rate modems over commercial telephone lines, download the previous 24 hours of data, uncompress and reformat the data, copy the data to a magnetic disk residing on a network of scientific workstations and to an optical storage device for archiving. Everyday at 02:00 UTC one of the workstations invokes a program which copies via electronic links orbit tracking data from the Cooperative International GPS Network (CIGNET) Data Processing Center at the National Geodetic Survey in Rockville, Maryland. When all PGGA and CIGNET data reside on the magnetic disk, the same workstation invokes another series of programs which perform a simultaneous least-squares estimation of station position and satellite orbits, and plots the time series of changing site positions including those from the last 24 hours of data. This process is performed automatically without any human intervention.
SIO uses an optical storage device for archiving the raw and RINEX PGGA data. The Epoch- 1 Infinite Storage Server is a state-of-the-art storage system permitting rapid, easy, low cost permanent storage. The Epoch has 300 GB (gigabytes) of online WORM type optical disk storage, using a jukebox arrangement. Our basic mechanism of data dissemination is by means of computer-to-computer communications using FTP (File Transfer Protocol a standard communications protocol distributed with most computer workstations) over INTERNET. Any INTERNET users can access PGGA and CIGNET data in this way. This method has has proven efficient in current PGGA operations. The data are available to scientific users as soon as they are archived on the optical disk, usually within several hours for PGGA data and within 1-3 days of collection for CIGNET data. We are using the PGGA data to support our investigations of the temporal resolution of GPS.
233

II.1
Kennedy Alignment Array Survey Implications for GPS Strainmcters and Kinematic GPS
We surveyed the Kennedy Ranch Alignment Array on four days with one hour of observations each day, at a 1 second sampling rate. One measurement was made in November 1990 and three measurements were made on consecutive days in February, 1991. We were extremely careful in tribrach calibration and tripod setup. Centering the tripod was facilitated by the excellent survey marks installed by the USGS: plastic caps with a small drilled hole. We set up the antennas at the same height and orientation on each day and observed the same cluster of six satellites. However, in November we used Trimble systems and in February, Ashtech systems.
The history of baseline position for the two end points of the array is depicted in Figure 3. Note that the vertical axis scale is 1 mm. The two surveys agree to within 0.2 mm in all three baseline components, indicating that this segment of the fault was locked over the three month period between our two surveys. Ten kilometers to the northwest near Parkfield, the fault was moving at 11.5 ± 0.9 mm/vr in the right lateral sense (Figure 4). We plan to resurvey the array in the fall.
In Figure 5 we depict the variation in position every 1 second for the line between the endpoints of the array. We estimate the integer-cycle phase ambiguities from the total observation span. The varying positions are then determined every second holding the ambiguities fixed to their integer values. We see clear systematic behavior in the positions on which are superimposed higher frequency fluctuations. The systematic signature is due primarily to antenna multipath effects. Since the GPS orbits have 12 hour periods we view the same constellation of satellites every day, approximately four minutes earlier due to the difference between the civilian 24 hour day and the sidereal rotation rate of the earth. By shifting the time series of position by four minutes we get almost complete correlation between the systematic signature observed on successive days. We can easily extract the multipath signature (Figure 6) by low-pass filtering the measurement noise and then eliminate it from the time series of position estimates (Figure 7). The power spectrum of the time series of position is shown for one of the days in Figure 8 (it is very similar for the other days and for other short baselines that we have monitored). We can draw several conclusions from this experiment for continuous and kinematic GPS:(1) Multipath effects will tend to average out over a period of several minutes. Therefore, to achieve one millimeter level precision with kinematic GPS a site should be occupied for about ten minutes. Several millimeter to one centimeter precision can be achieved with shorter occupations.(2) In order to increase the resolution of millimeter-level position for a continuous GPS strainmeter, it is necessary to model the effect of multipath on the position components.(3) Multipath effects can be modeled for GPS strainmeters to an rms of a millimeter or two at a resolution of about one minute.
References:
Bock, Y. and S. Shimada (1990), "Continuously monitoring GPS networks for deformationmeasurements," in Global Positioning System: An Overview. Y. Bock and N. Leppard (eds.),Springer Verlag, 40-56.
Bock, Y., F. Wyatt, D.C. Agnew, J.-B. Minster, W. Gurtner, P. Henkart, S. Shimada, S.S.O.Puntodewo, K. Stark, D. Rosenblatt, Z.-K. Chen and P. Worcester (1990), "Continuousmonitoring of crustal strain using GPS in Southern California", GPS '90 meeting, Ottawa,Canada, September 3-7,1990, 853-865.
Bock, Y. (1991), "Continuous monitoring of crustal deformation," GPS World InnovationColumn, Vol. 2, No. 5, in press.
Mason, R.G., Geomensor surveys in the Imperial Valley, California, report to the U.S.Geological Survey, 1987.
234

.TAMARISK 3
N
ii. i
1 Mile
O KinematicD Static Crossover
Single Measurement
Imperial Fault Repeated
Measurement
O O O
35 34 33 32 31 30 29 28 27 ^26 25 24 23
Figure 1: Imperial College Network obserued with kinematic GPS (5-9 May 1991)
235

roCO ON
N
U.S.G.S.KENNEDY RANCH HOUSEALINEMENT ARRAY
,«KENN ^\ tx n)OGE *»
S S s s ssKENC - KENS 230° AZ
KENC KENN Az
. KENCx Vi
X
KENC KENS '2.7m KENC KENN las.im
//' > > s//' ? ^ s //0' 2 SNc^ ^
S \\. ys*//j f N' »
7.">. c/./ /j 1 1 \ ' ^~~f~/ 7^»~ ~"~"~ ~* x** x 1 ^ N
KENC-t2
3
4
56
10.0m
19.9m
24.9m
30.0m
39.7n»49.5m
1 60.1m
Figure K2
H H
(adapted from U.S.G.S. location map)
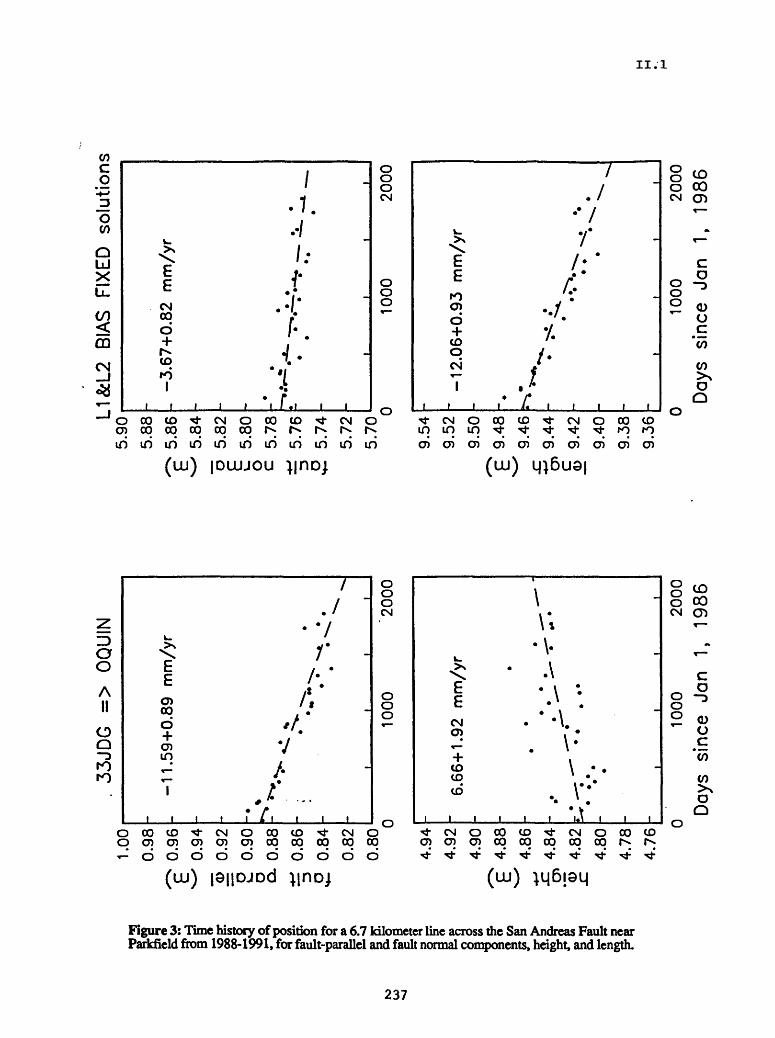
II. 1
tflCgD
0
QLJ XL.
<CD
CMI
«8m
/.1.
i.
£ .fCM . /*
s \>1 '
CO . *ro *'/
i : i*i i i i i i / .t i i
Q
OCN
O
O
i~*\OCOCO^CNOCOCO 0)0000000000^^
CN O
irtiftirtiftiDiftiftinmmm(ui) IOILUOU
//
/ /< 7'.E / E i*
rO . O) .46 * CO '*° / CN .*
T . J* /*
i i i i / i i i i i
O OoCN
OO 0
f-^
CO00CD*~
-
Co
<DOcCO
CO^^^
0Q
^-CNOCOCD^CNOCOCD
O)O)O)O>O>O>O>O)O>O>
(uu)
5o0
A II
OQ-3
ro
/
/ ~/ '
>s * v^ 7
E / *E /'.
S /« *
i /O> Jin ¥
^ /
i i i i i Zi i i i
oooCN
O O O'r*
r~iOCOCO^I-CNOCOCD^CNO
<«-" 6666666666
u.
^E
CN 0)
COCOCO
1 1 1
\1
V A
\ * ' \: "\*\ . r'
1 1 1 M 1 1 1
OOoCN
O O0
i~*\
CO 00°2
-
co-3
ocw
t/y>OQ
CNOCOCO^CNOCOCOo>cococococor>^r>^
(uu) |0||DJDd (ILJ)
Figure 3: Time history of position for a 6.7 kilometer line across the San Andreas Fault near Parkfield from 1988-1991, for fault-parallel and fault normal components, height, and length.
237
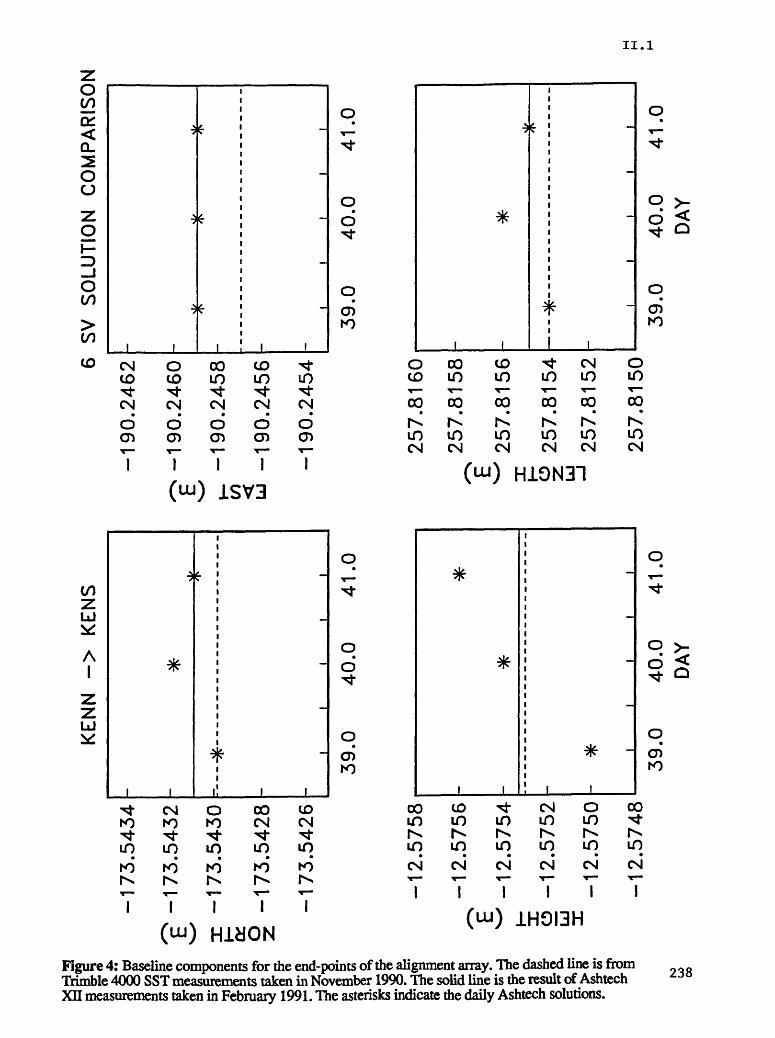
Figure 4:
Baseline
components for
the
end-points of
the
alignment
array. The
dashe
d line
is
from
Trimble
4000
SST
measurements taken
in
November 1990.
The
solid
line
is
the
result
of
Ashtech
Xn
measurements
taken
in
February 1991.
The
asterisks indicate
the
daily Ashtec
h solution
s.
-173.5
434
^ -
173.5
432
i
-17
3.5
43
0DC
. i
-17
3.5
42
8
-17
3.5
42
6
10
(T m
ij J
T Q
^L .
\J / \
J 5
^ -
12.5
756
T
^ -
12
.57
54
h- o -1
2.5
752
LJ 1
-12.5
750
KEN
N ->
K
ENS
*
* T-
1 1
1 1
1
39.0
40.0
41.0
\i£_
X|V
i^^k
\[/ i
i i
i i
-1 2
.5748
39.
0 40
.0
41.0
DAY
6 S
V
SO
LUTI
ON
C
OM
PA
RIS
ON
-19
0.2
46
2
-190.2
460
-190
.245
8
-190
.245
6
-190
.245
4
39.0
257.8160
257.
8158
257.8156
i | 25
7.81
54LJ -1
257.8152
257.8150
39.0
40
.0
40.0
D
AY
41.0
41
.0
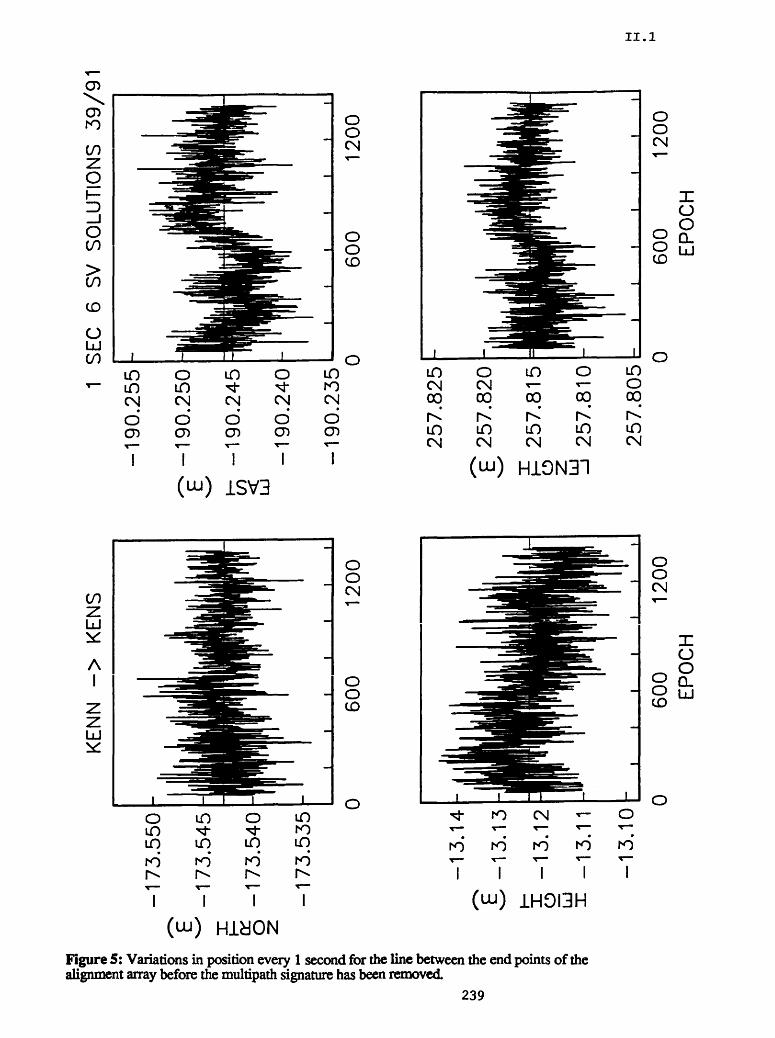
63
1*9
e A
3
(A
KE
NN
->
K
EN
S
-13.10 :
060
0 1200
EPOCH
to
< LJ
1 SEC 6
SV SOLUTIONS
39/9
1
-190.255
-190.250
-190.245
-190.240
-190.235
I I
I II
I I
0600
257.825
£ 257.820
' "~ 257.815
257.810
257.805
o z LJ
1200
I I ...... I
_ I
! I
060
0 1200
EPOCH

ovzis qiBdpinui aqj si siuj. 'sspu jtrauiamsBsra aqj jo Suuajjy sssd-MOi Jagr? Xmje juarauSnB
aqi jo sjuiod pus aqj trasMjaq sun aqj joj puooss i tava uopisod in suopBtreA ^
HEIGHT (m)NORTH (m)
I I I
o
CJi CJi CJI CJi CJi
oo o ro ->. CD
CDo o
ho o o
co
m
I V
mCO
m m o0° o
NO O O
LENGTH (m)hO K3 K3 CJi CJi CJi
0000
-^
00
hoCJi
00
00T
hoCJi-vjbo ro o
EAST (m)
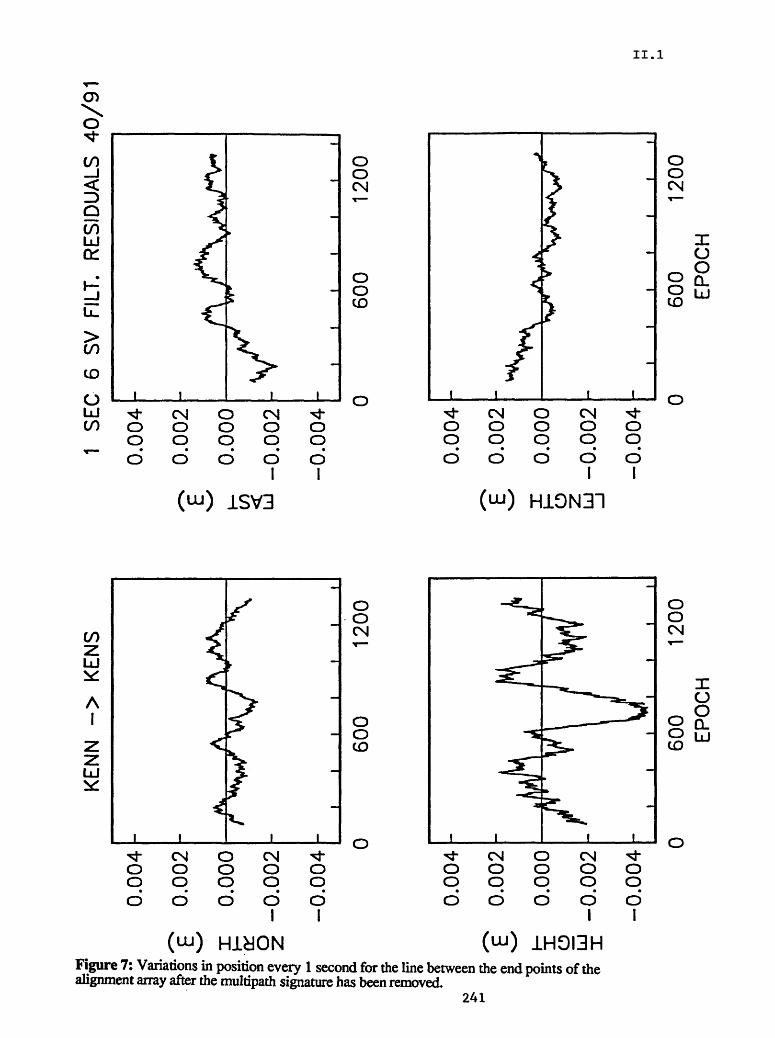
II.1
Q(/) LU01
Lu
(/)
CO
O LU
_L
O O
(N O O
O O O
O
CN O O
O O (N
O O CD
O O
1^-
oo
o
^
<*
<
/1
F
* -
>
-
0oCN
Xo§2
O jjjto
oCN O CN "3-O O O OO O O O
O O O O
JLSV3 HJL9N31
COzLU
LU
I
Oo
o
CN O O
O Oo
ICN O O
O
o oCN
O O CD
O O
OI
1HOI3HFigure 7: Variations in position every 1 second for the line between the end points of the alignment array after the multipath signature has been removed.
241

SP
EC
TRU
M
OF
KE
NN
->
K
EN
S1
SE
C
SO
LUT
ION
S
DA
Y
39/9
1
ro **
ro
00 I oo S 8, f "8 52. t 5 a C
/i
X h-
o CL O
O
0.5
0.0
0
.5
1.0
1.5
2.0
2.5
3.0 -4
.0
-3.0
-2
.0
-1.0
0.0
x
o LJ x O o,0
-3
.0
-2.0
-1
.0
0.0
LO
G10
(F
RE
Q)
(Hz)
O o X
H-
O LJCL
O o
0.5
0
.0
0.5
1
.0
1.5
2.0
2
.5
3.0
0.5
0
.0
0.5
1
.0 1
.5
2.0
2.5
3.0-4
.0
-3.0
-2
.0
-1.0
0.0
-4.0
-3
.0
-2.0
-1
.0
0.0
LO
G10
(F
RE
Q)
(Hz)

II. 1
FAULT ZONE TECTONICS
9960-01188
Katherine S. Breckenridge, F. Brett Baker, Robert W. Simpson Branch of Tectonophysics
U.S. Geological Survey345 Middle field Road, MS 977Menlo Park, California 94025
(415) 829-4849
Investigations
[l] Direct maintenance of creepmeter and alinement array networks in California (Schulz, 1989; Wilmesher and Baker, 1987).
[2] Update archived creep on the USGS Low Frequency computer.
[3] Monitor creepmeter data for possible earthquake precursors, primarily in the Parkfield, Cali fornia area, site of the USGS-California State earthquake prediction experiment, and in the San Juan Bautista, California region.
Results
[l] Currently 30 extension creepmeters, one contraction meter, and 7 strong-motion creepmeters are operating; 22 of the extension meters, the contraction meter, and all 7 strong-motion meters have on-site strip chart recorders. Of the total 38 instruments, data from 29 are telemetered to Menlo Park (Figures 1,2). All Parkfield instruments and telemetry units were calibrated in late April to detect any systematic errors which may have developed over the past few years. Only a few problems were discovered, and those will be addressed as soon as possible. The majority of sites are functioning and manual measurements correspond closely with telemetered data.
[2] Fault creep data from USGS creepmeters along the San Andreas, Hayward, and Calaveras faults have been updated through January, 1991, and stored in digital form (1 sample/day). Telemetry data are also stored in digital form (1 sample/10 minutes), and can be merged with daily-sample data to produce long- or short-term plots. Data for 1990 are shown in Figures 3 and 4.
[3a] Parkfield creep data are being closely monitored to detect changes in rate which, although significant within the context of the historic record, may fall outside the established alert cri teria. The rate increase observed at Middle Mtn. (XMM1) within the past 9 months roughly corresponds to the increase in low-level seismicity seen near that site. On March 19, 1991 the first B-level creep episode occurred, with 5 mm of slip recorded in 16 hours at both Varian Ranch (XVA1) and Parkfield (XPK1), during a rainy period. The automated event- detection algorithm notified personnel in the early stages of the event, and both sites were inspected the next morning, when the amount of movement was verified by manual measure ment. Figure 5 displays creep and rainfall data.
Alinement arrays VAR4 and X464 adjacent to creepmeters XVA1 and X461 were reoccupied during the first week of April after the Parkfield B-level alert. VAR4 showed an offset of 8.6 mm between the instrument station and the end station since the previous occupation in June 1989 (Figure 6). Between May 1986, when the array was installed, and April 1991, an
243
II. 1
offset of about 32 mm was observed for an average rate of 6.7 mm/yr. In the first seven months of measurements (6 surveys) the average rate was 18.6 mm/yr. The long-term aver age rate determined from the creepmeter is 7 mm/yr. Thus, in spite of the large event on creepmeter XVA1 during the B-level alert, long-term rates at VAR4 show a decrease rather than an increase, which corresponds with the diminishing rate seen on the creepmeter.
X464 was previously measured in August 1990. Creep rates inferred from the alinement array since July 1988 are elevated compared to the those derived from the creepmeter. Analysis indicates possible nontectonic movement of the instrument station in a manner that produces artificially high rates of creep. Additional surveys of X464 and neighboring sites will be made in the coming months to determine whether the increase might be caused by local site effects or by a slip rate change along the fault that can be confirmed at other sites over a distance of several kilometers.
[3b] Data from six instruments along the San Andreas Fault between San Juan Bautista and Melendy Ranch are being examined to characterize changes in fault slip before and after the October 17, 1989 Loma Prieta earthquake. A slip deficit has been occurring at Melendy Ranch (XMRl) since August, 1988. Three prior episodes have been observed by Burford (1988) in the record for this site, all of which were terminated by M4 to M5 earthquakes within 7 km of the creepmeter. Therefore we might anticipate a similar event to occur some time in the next year. The investigation of creep and tensor strain events at San Juan Bautista continues with Dr. Michael Gladwin at the University of Queensland, Brisbane, Australia.
Reports
Breckenridge, K.S. and Burford, R.O., 1990, Changes in Fault Slip Near San Juan Bautista, Cali fornia Before the October 17, 1989 Loma Prieta Earthquake - A Possible Precursor? EOS (Trans, Am. G. Union.), v. 71, No. 43, 1461 (1990).
References Cited
Burford, R.O., 1988, Retardations in Fault Creep Rates Before Local Moderate Earthquakes along the San Andreas Fault System, Central California: Pageoph, v. 126, Nos. 2-4, pp. 500-529.
Schulz, Sandra S., Catalog of Creepmeter Measurements in California from 1966 through 1988, U.S. Geological Survey Open-File Report 89-650.
Wilmesher, J.F. and Baker, F.B., Catalog of Alinement Array Measurements in Central and Southern California from 1983 to 1986, U.S. Geological Survey Open-File Report 87-280.
244
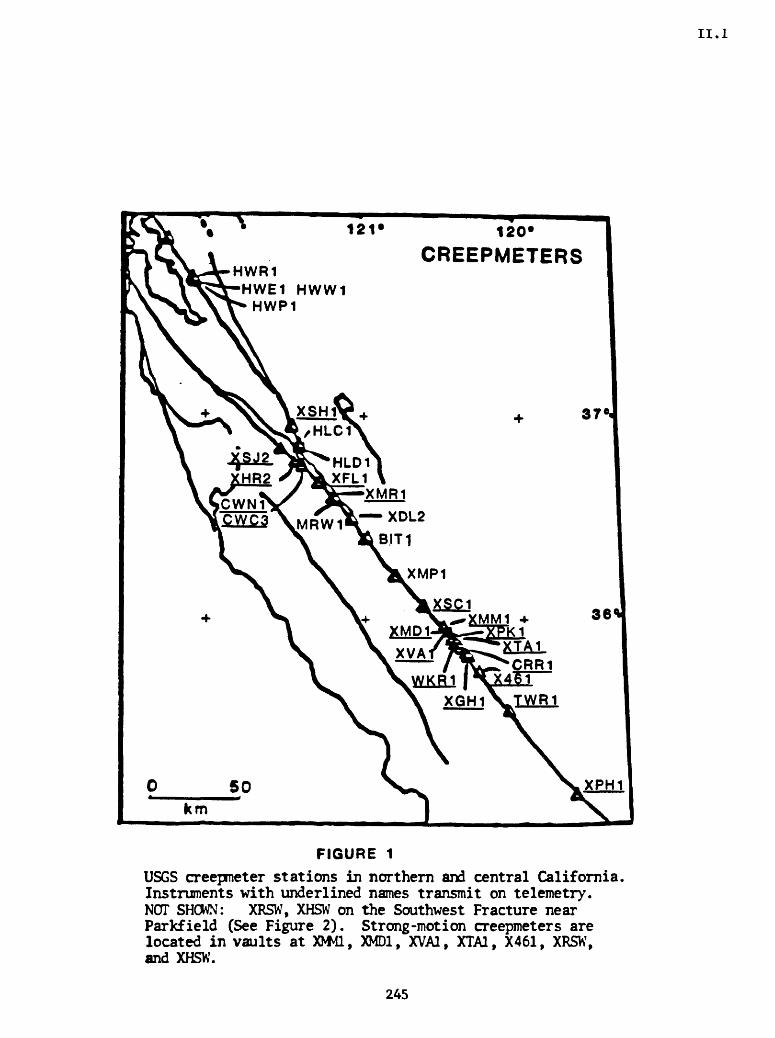
II.1
120*
CREEPMETERSHWR1
HWE1 HWW1 HWP1
CWN1 CWC3
XTA1 CRR1
WKR1
XGH1
FIGURE 1
USGS creepmeter stations in northern and central California, Instruments with underlined names transmit on telemetry. NOT SHOWN: XRSW, XHSW on the Southwest Fracture near Parkfield (See Figure 2). Strong-motion creepmeters are located in vaults at XNM1, XMD1, XVA1, XTA1, X461, XRSW, and XHSW.
245
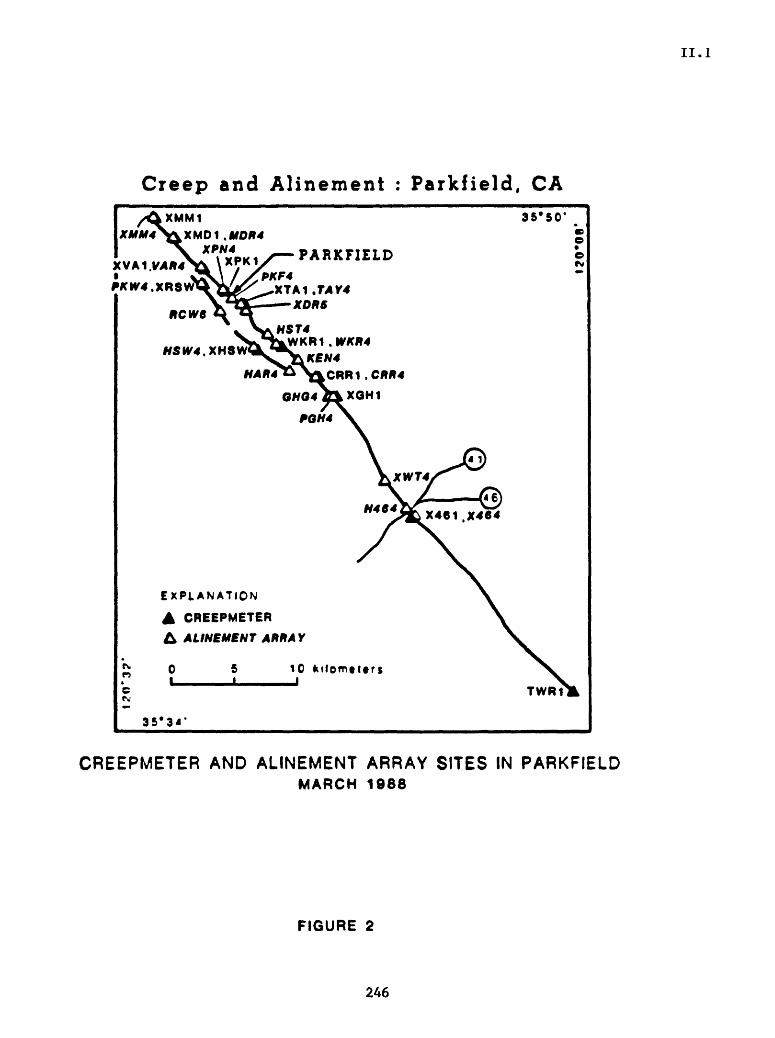
II.1
Creep and Alinement : Parkfield, CA
XMM1
\XMM4 \\XMD1 .UDR4 XPN4
XPK1 %^\/,/PKF4
SS'SO*
PARKFIELD
MS 74 WKR1 .WKR4
KEN4 HAR4!"\%CRR1 . CRR4
EXPLANATIONA CREEPMETER
A ALINEMENT ARRA Y
10 kilomtttrs
TWR1
35*34
CREEPMETER AND ALINEMENT ARRAY SITES IN PARKFIELDMARCH 1988
FIGURE 2
246

PARKFIELD CREEP (In Millimeters)
1990
300xscl
1990 Feb Mar Apr May Jun Jul Aug Sep Oct Nov Dec^Southwest Trace
Figure 3
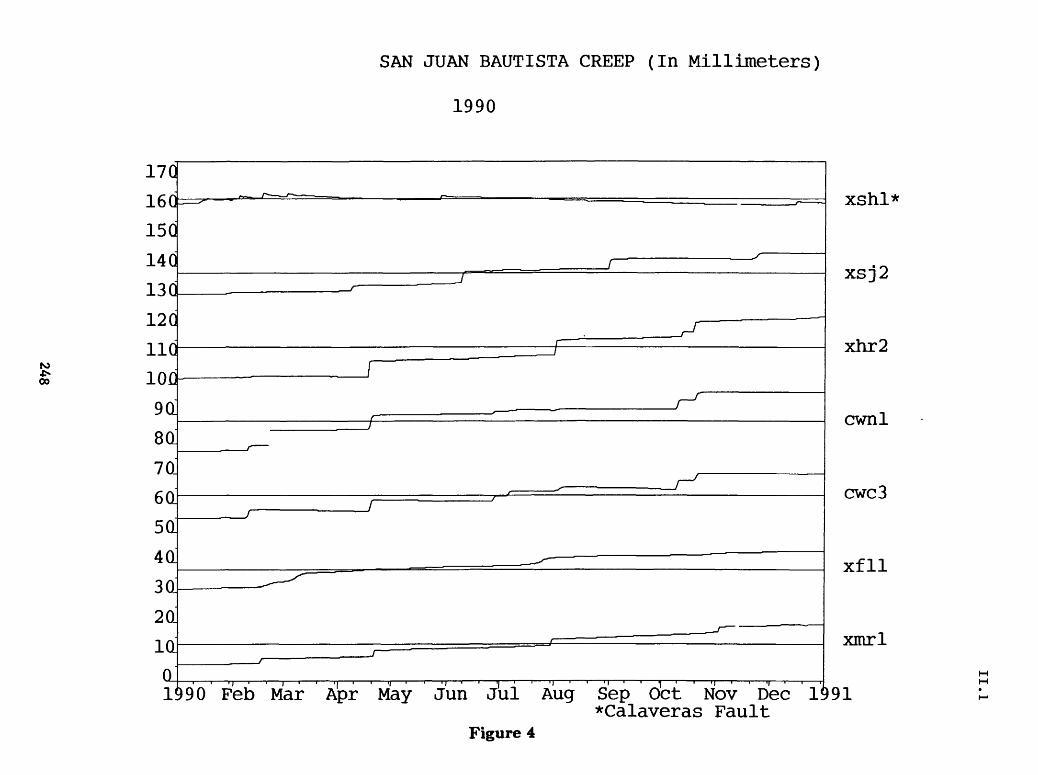
SAN JUAN BAUTISTA CREEP (In Millimeters)
1990
ro4Soo
170
160
15G
14G
13G
12G
11C
100
9(1
8CL
7Q
60
5Q
4d
30
20
idQ1§90 Feb Mar Apr May Jun Jul Aug Sep Oct Nov Dec
*Calaveras FaultFigure 4
xshl*
xsj2
xhr2
cwnl
cwc3
xfll
xmrl

t-vo
XVAl Creep (In Millimeters)10 _
0
feb 10 20 mar 10
XPK1 Creep (In Millimeters)10 _
I . I .
20 apr
0
feb 10 20 mar 10 20 apr
Rainfall (In Inches)10 J
j
0 i i i i i i i i i i i i i i i i i i i i i i i i i i i r i
feb 10 20 mar 10 20 apr
Figure 5

to
RIG
HT
LATE
RAL
MO
VEM
ENT
IS P
OSI
TIV
E (m
m o
r mm
/yr)
3ofo' I

II.1
Secular changes in the cumulative slip and strain associated with the seismicity preceding the Loma Prieta earthquake
Award 14-08-0001-G1846
Michael Ellis Center for Earthquake Research and Information, MSU, Memphis
IntroductionThe primary objective of the research was to search for a systematic relationship between
seismic strain that accumulated between 1969 and 1989 and the characteristics of the Loma Prieta rupture. Several interesting results have emerged from the analysis of cumulative seismic strain along the San Andreas from San Francisco and Melendy Ranch. These are:1) Orientation of the principal strain axes show a systematic relationship to the rate of creep along
the San Andreas;
2) Tensoral strain components along and across the fault show cyclic sign changes;3) Foreshocks on subsidiary faults may have contributed to the size of the main event, since they may have generated an asperity on the future rupture plane.
We consider the latter most significant. Each of these items is described in more detail below.
Fault-normal extension
Seismic strain from foreshocks to the 1989 Loma Prieta earthquake may have generated the asperity within the northwestern part of the main rupture. The sum of the foreshocks, including all along-fault seismicity between 1969-89, was to slightly reduce the normal strain across the asperity region (Fig. 1). As a result, the principal compressive stress axis rotated away from its typical fault-normal position into an orientation that increased the shear stress , thereby forming the asperity (Fig. 2); The asperity would then be closer to failure than elsewhere on the fault, although
of similar strength. When the main rupture encountered the foreshock-generated asperity, slip increased, thereby releasing larger seismic moment. The type of asperity introduced here may be new, since it need not be of relatively high strength but simply sustain relatively high shear stress
prior to its rupture.
251
II.1
The model proposed here, albeit briefly, has interesting implications. The role of
subsidiary faults along strike-slip faults is usually given short thrift. It is possible, however, that
movements on subsidiary faults may either add or subtract to the moment-release during a large
earthquake. Moreover, the reorientation of stress induced by subsidiary faulting may explain
seismic quiessence and b-value variation prior to large events.
Fault bends
Tensoral strain components, resolved along and across the local San Andreas trend, show a
cyclic sign change such that parts of the fault are being extended along the fault (and concomitantly
shortened across the fault) and other parts are being shortened along the fault (Fig. 1). The
magnitude of seismic strain increases from north to south. Significant strain is first detected, from
north to south, at the Black Mountain bend. This is an expected result, and prompts the question,
is the cyclic strain character related to fault bends? There are four conspicuous bends along the
fault, two of which appear to match sign changes in the strain (Fig. 1). We hesitate to make too
much of the direct correlation (or lack of it), since strains induced by fault bends are not necessarily
simply distributed.
Fault-normal maximum compression
The orientation of the Z axis fans from fault-normal near Melendy Ranch to an oblique
angle further north, in the direction of decreasing creep rate. The fault-normal strains near
Melendy Ranch are consistent with observations of fault-normal compression further south.
Fault-oblique compression toward the north is consistent with a decreasing rate of creep. That is,
as the fault becomes progressively locked toward the north, shear strains increase and therefore
the principal compressive strain rotates toward the fault. This is consistent with expectations from
laboratory rock mechanic experiments.
Publications
Ellis, M., Peppin,W. A., and Johnson, P. A., 1991, Spatial variations in cumulative strain
between 1969-89 along the Loma Prieta section of the San Andreas fault. Seismological
Research Letters, 62, p29.Ellis, M. 1991, The role of subsidiary faulting in the generation of an asperity prior to the 1989
Loma Prieta earthquake. (In review with Nature.)
252

II.1
Are the sign changes linked to fault bends?2.0
1.5-
0.5-
5 0.0o
extension
shortening
_ _ _ strain across the fault
strain along the fault
-2.0 1
north
i i i i i i i8 10 12 14 16 18 20 22
distance along fault south
Figure 1: Tensoral components, en and e22/ plotted with distance along the San Andreas (San Francisco to Melendy Ranch). Short vertical bars indicate the position of prominent fault bends. The far left bar marks the Black Mountain bend.
253

H H
earthquakes along subsidiary faults
state of stress along main fault
n
fewer (?) earthquakes along subsidiary faults
state of stress along main fault
n
State of stress along the main faultprior to foreshocks.
Note that the orientation of themaximum principal stress is at a
high angle to the main fault.
State of stress along the main faultafter foreshocks.
Note that the orientation of themaximum principal stress
has rotated, such that the main fault is now closer to failure.
m cs
Figure 2; The role of subsidiary faulting on the stress state of the main fault is illustrated by this simplified Mohr-circle diagram. Prior to a large earthquake, movement takes place on smaller, subsidiary faults that are unstable. Thus, "background" seismicity is controlled by the smaller faults. The effect of the smaller faults is to reduce the fault-normal strain on the main fault. This has the effect of increasing the shear stress (figure at right). Thus, the principal stress rotates, such that an "asperity" is formed on the main fault. As the principal stresses rotate, so the number of subsidiary faults that are stable is reduced. This may cause seismicity levels to decrease, and perhaps b-value to drop.

II.1
Distribution of cumulative slip, moment release and strain associated
with seismicity in the New Madrid region.
Award 14-08-0001-G1932
Michael Ellis Center for Earthquake Research and Information, MSU, Memphis
IntroductionThe distribution of seismicity within the New Madrid region suggests that specific
structures are responsible for its generation, rather than "floating" structures. Thus, the occurence of one of the largest earthquakes known in the USA should not be regarded as a fluke. In order to
best evaluate the seismic hazard of the region, which lies between two large metropolitan areas, it is necessary to understand the tectonic setting. The basic data set to do this is the seismic catalog. Thus the first step we have undertaken is to evaluate the completeness of the joint MSU - St. Louis catalog, known as the SLU catalog.
Completeness testingWe test the SLU catalog for completeness using a simple technique that assumes a complete
catalog is characterized by a Poisson process. Day-to-night noise levels can be detected by systematic variations in non-Poissonian behavior [Rydelek and Sacks, 1989]. Within a given
magnitude range, the origin time of a seismic event is converted to a phase (or hour) angle on the local 24-hour clock, and events in the catalog are summed to form the phasor plots shown below (Fig. la-c). The null hypothesis of random events can be rejected when the phasor sum walks further than a certain length (95% confidence in Fig. 1). A day-night modulation of detected
seismicity will result in a walkout biased toward nightime hours.
Fig. la below shows the phasor sum for all events > md 1.5 (6/29/74 - 12/31/90). The
phasor sum walks out near midnight, and it is clear that the catalog is incomplete. The source of non-randomness is missed events during the day when noise is increased. In late 1986 archiving procedures were standardized and digital capability was added to the network. Fig. Ib shows the
phasor sum for all events > mj 1.5 since 1/1/87, which are also included in the final segment of
Fig. la. The catalog is complete down to m^ 1.5, which shows the benefit of the new archiving
procedures and digital format. In fact, the catalog appears complete down to mj 0.5 since the
255

II.1
beginning of 1987. The catalog as a whole tests complete to
tomd 1.7.
2.0 (Fig. Ic), and probably down
It is particularly interesting that departures from a linear b- value relation are found before
the catalog becomes incomplete. In other words, the self-similarity often assumed to govern the
range of earthquake sizes breaks down somewhere near magnitude 1.7. Further work is in
progress to substantiate this claim.
95% confidence
v*§
Figure 1
Figure 1: a) All events, M>1.5 between 1974 and 1990. The number of events is indicated.
The phasor plot is oriented such that midnight (CDT time) points to the right. Clearly a walkout is
noted near midnight, which indicates that most events are recorded during night-time hours, b)
An enlargement of the whole catalog between 1987 and 1990, from which time the network was
digital. A dramatic improvement may be noted, c) All events of M>2.0. The catalog appears
complete above this magnitude.
The magnitude level to which a catalog is complete is important to those estimating
recurrence intervals based on b-value curves. Unfortunately, the Sacks / Rydelek test, while
extremely simple and straightforward, is not infallible. Further work is currently underway to test
the homogeneity of the network from the point of view of completeness testing.
Publication
Hass, L., Ellis, M, Rydelek, P., and Chin, S. C., 1991, Completeness test for the Memphis Area
Regional Seismic Network (MARSN) catalog, 1974-1990. American Geophysical Union,
Spring Annual Mtg., Abstracts with program, 72, pi96.
Reference
Rydelek, P. A. and Sacks, I. S. 1989, Testing the completeness of earthquake catalogues and the
hypothesis of self-similarity. Nature, 337, 251-253.
256

II.1
Analysis of Natural Seismicity at Anza
9910-03982
Joe Fletcher, and Lawrence M. BakerBranch of Engineering Seismology and Geology
U.S. Geological Survey345 Middlefield Road
MenloPark,CA 94025(415)329-5628,5608
Investigations:
1). The sensors for the Anza array are Hal Sears HS-10 2 Hz geophones. These transducers have several advantages over other geophones including a large case to coil range of about 1 cm, a calibration coil placed on the rim of the sensor to reduce inductive pickup with the main coil, and no resonances below about 150 Hz. However their 2 Hz natural frequency severely limits their response to long-period ground motion. This lack of long-period response can severely limit the usefulness of the Anza array data for many investigations such as the study of surface waves or the modeling of ground motion for large damaging shocks by summing records of small events. In FY 1991 we investigated the options for upgrading the array to one of several senosors that have much lower natural frequencies.
2). Digital time series data from the Anza array are presently stored in realtime on magnetic tape at IGPP. Event files from these raw data tapes are edited and copied to archive tapes for IGPP and the USGS. Thus data access is only through the mounting of tapes. During this half year we investigated several options for providing access to Anza data over networks. Such a system would allow wider distribution of and more immediate access to the Anza data.
Results:1). Two sensors were considered: the Guralp CMG-4 and Streckeisen STS-2. Both have respones to well below the 2 Hz natural frequency of the HS-lOs. CMG-4s were used to record aftershocks of the Loma Prieta earthquake at Corralitos, a station near the epicenter. Figure 1 shows the records for a M = 3.4 aftershock from a Kinemetrics force-balance accelerometer and Figure 2 is the same event from the CMG-4s. Note that the horizontal records are very similar (the sensors were about 2m apart), although the vertical components show some differences. It was very difficult to null the DC offsets as the sensors appeared to be very sensitive to temperature.
Streckeisen STS-2s have been used recently at Pinyon Flat Observatory in short- baseline array experiments. Records from these instruments demonstrate their increased sensitivity to long periods (120 s versus 60 or 30 s) and are also low noise. Their response to high frequency waves of 40 to 50 Hz was judged to be good enough to be compatible with the existing instrumentation. STS-2s have an auto-centering system so that DC offsets should not be a problem.
In conjunction with Jon Berger and Frank Vernon at IGPP/UCSD we decided to purchase STS-2s for the Anza array. The STS-2s have the widest bandwidth currently available expecially at long periods (120 s to 50 Hz) in a package that would not require an extensive vault. The auto-centering system is a distinct advantage for realizing the most dynamic range from the sensor. Nine three-component sensors will be purchased this FY. We anticipate funds will be available to upgrade all stations the following year.
257

II.1
2). A Micro VAX computer system will be purchased as a front-end file server to the VAXStation currently performing the realtime data acquistion. A dual-ported 1GB disk will be attached between the Micro VAX and the VAXStation. In addition, an erasable optical disk will be attached to the Micro VAX for archiving the data. DECnet/Internet access will be provided by the MultiNet TCP/IP software package for VMS, which will also be installed on the VAXStation used for analysis of the data in Menlo Park. Data will be routinely telemetered over the Internet to SCEC to be incorporated into the routine processing of phase information for Southern California.
258

II. 1
KOI COMP =V FBA TIME: 89 303 11-17-13. 23 OPS=
KINEMETRICS FBA
Comp Z
1. 2. 4. 5. 6. 7. TIME-SECS *1.00
9. 10.
Figure 1. Accelerograms for a m = 3.4 aftershock of the Loma Prieta earthquake using a Kinemetrics force-balance accelerometer. Station was located at Corralitos near the mainshock epicenter.
9910-03982259

II.1
CRG COMP =V FBA TIME: 89 303 11-17-13.203 OPS=
GURALP
Comp Z
o. 1. 2. 3. 4. 5. 6. TIME-SECS *1.00
7. 8. 9.
Figure 2. Accelerograms from the low gain channels of a CMG-4 located within about 2m of the sensor which recorded Figure 1. Sense of direction is reversed 260 compared to Figure 1.
9910-03982

II. 1
Strain Rates Across California: GPS Reoccupation of an Historical Triangulation Network Between San Francisco and Lake Tahoe
14-08-0001-G1964
Lewis Gilbert, John Beavan, Chris ScholzLamont-Doherty Geological Observatory of Columbia University
Palisades, NY 10964(914) 359 2900
InvestigationsThe part of the U.S. Primary Triangulation Arc that crosses California between the San
Francisco Bay area and the Sierra Nevada is being reoccupied by Global Positioning System (GPS) surveying. The purpose is to extend the post-1906 deformation history of this network to the present; the network was measured by triangulation in 1922, 1928, ~1948 and -1963. The derived shear-strain history will be interpreted in terms of plate-boundary models of the region, and compared with strain changes indicated by regional earthquake moment release rate variations.
Results (April 1991)The transcontinental control network was completed in the late 19th century; the
westernmost marks in that network span California from the Sierra Nevada to the San Andreas Fault (SAF). After the 1906 San Francisco earthquake Bowie (then head of the Coast and Geodetic Survey) realized that the control network had been deformed, and decreed that the network from the Sierra to the SAF should be resurveyed periodically in hopes that measured deformations would lead to future earthquake predictions. Those remeasurements were carried out in increasingly haphazard fashion in roughly 1922, 1928, 1948, and 1963. The goal of our field effort is to extend the crustal deformation history of this network and to establish a high-quality regional pre-seismic baseline.
ReconnaissanceA reconnaissance trip was made using NASA funding in August 1989 in order to establish
the current state of the survey monuments, and to organize access and other logistical matters. All but one of the eleven historical marks had survived, or had reference marks that had survived, though a few needed repairs of various forms. The one exception was Mt. Tamalpais (Figure 1) which was destroyed around 1950 during construction of a radar facility; however, a new mark at this site has been measured since the early 1950s. Three of the old marks were inappropriate for GPS measurements because of nearby structures; these required the establishment of eccentric monuments.
Prior ResultsThe existing triangulation data have been analysed (under NASA funding) to learn about
historical changes in strain rates (Gilbert et al, EOS, 69, p 1448, 1988; Eos, 70, p 1354, 1989). There is a hint of a reorientation of the strain field between the 1948 and 1963 triangulation measurements, which potentially coincides with the increase in moderate magnitude seismicity in the San Francisco vicinity (Ellsworth et al., 1981, in Earthquake Prediction, Maurice Ewing series vol.4, pp. 126-140). The errors in the historical data are substantial, and the GPS measurements will allow us to confirm whether or not this reorientation has actually taken place.
261

II.1
GPS field-workThe GPS campaign (entitled NCPAR91a) was carried out during the period 19-28 March
1991 (Figure 1) using nominal 7 hour observation sessions. During that time ~6 inches of rain fell in the Great Valley and 10 feet of snow accumulated in the Tahoe region. This followed a winter of abnormally light precipitation and greatly eased immediate water related concerns for the local population. It also rendered a significant proportion of the mountain-top sites inaccessible and the carefully prepared observation schedule was thrown away midway through the first day of observations. Despite the less-than-advertised weather, all of the operators performed brilliantly and the accomplishments of this effort would not have been possible without their at times heroic efforts. Accomplishments thus far:1) All marks in the historical network with the exception of the two Sierra marks (Round and Lola) have been visited with GPS at least once. Most of those have been observed three times; the exceptions being Vaca (2 sessions) and Helena (1 session). These data are adequate for comparison with the historical record across the Great Valley. A summary of the measured lines is shown in Figure 1.2) The historical network has been tied to the California HPGN at three stations: Presidio was occupied by the USGS for 4 days; HPGN 0304 (Merd, near Mary) and HPGN 0309 (Rosvl, near Pine) were both occupied for 2 days while the nearby station was occupied for at least one day.3) Azimuths were observed at Mary, Ross and Pine and ties between the eccentrics and station marks were measured.
Plans for completion1) Vaca and Helena need to be occupied 1 and 2 more times respectively.2) Round and Lola need to be tied into the historical network (3 sessions each).3) Both of the above tasks require reoccupation of two other previously occupied stations (Mary and probably Diablo).
We plan to accomplish this fieldwork during a short trip in the second half of July 1991.
AcknowledgementsThanks are due to GPS operators Steve Jaum6, Chris Marone, Russell Such, Wei-hau
Wang and Jerry Svarc; to Bob King, Ken Hudnut and UNAVCO for loan of GPS equipment; to Don d'Onofrio and Mike Lisowski for assistance with connecting the historical data-set to the California HPGN survey.
262

II.1
-40
-39
-38
123.5 I
122.5
-40
- 39
- 38
- 37
Day 080
123.5
Day 081
122.5 I
.>. >,.
h40
-39
-37
123.5
Day 082
122.5 I__
iF-i .«r-40
-39
-38
- 37
Figure 1, part 1. Sites occupied during the NCPAR91a GPS campaign, and day-to-day observation scenarios.
263
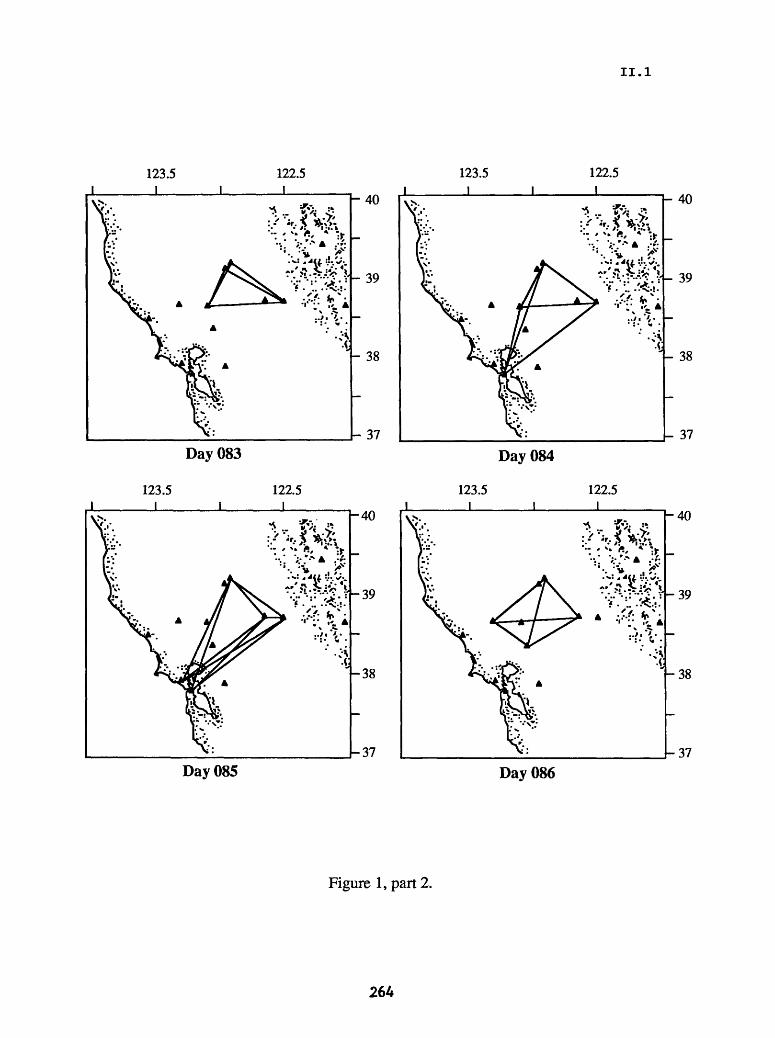
II.1
123.5
Day 083
123.5I
Day 085
122.5
122.5
-40
- 39
- 38
- 37
-40
39
h38
r-37
123.5 I
122.5
- 40
- 39
Day 084
123.5I
Day 086
\- 38
- 37
122.5
V- 1ft £-40
h-39
-38
-37
Figure 1, part 2.
264
II.1
Review and Evaluation of Predictions Made Using M8
Award No. 14-08-0001-G2061
Ray E. HabermannCooperative Institute For Research in Environmental Sciences
Campus Box 216, University of ColoradoBoulder, Colorado 80309
We are presently pursuing three lines of work in an attempt to understand the effects of catalog heterogeneity on the M8 algorithm:
1) We are examining three teleseismic cases which were the initial successes of the algorithm.
2) We are examining different algorithms for identifying aftershocks.
3) We are testing the algorithm on synthetic data sets with known heterogeneity.
Teleseismic Cases:The initial application of M8 to a large number of regions was
described by Keilis-Borok and Kossobokov (1986). They applied M8 to 143 regions of the world using the PDE catalog. The results of this application were:
16 TIPS 9 Mainshocks12 False Alarms 4 in TIPS4 Successes 5 Missed
Figure 1 shows the temporal distribution of the onset times of these TIPS. If a relationship exists between the TIPS and the occurrence of large earthquakes, one would expect similar temporal distributions for the two phenomena. The temporal distribution of large earthquakes is approximated as the number of events with M > 6.0 / year (shown as circles in Figure 1). This distribution is uniform at the 15% confidence level. Neither of the distributions of TIP initiation times are uniform at even the 0.1% level. This difference suggests that the TIP initiations are driven by some other phenomena, perhaps by characteristics of the catalog.
The four successes were:1971 New Guinea M = 8.1 1978 Taiwan M = 8.0
265

II.1
1977 Sumba M = 8.0 1976 Tonga M = 8.2
We are examining these successes in detail at present in order to develop an understanding of the catalogs used.
Aftershock Identification:The aftershock identification technique used in M8 was originally
developed by Knopoff and others. It assumes that aftershocks occur within a fixed radius and time period of a mainshock and that this radius and time period are the same for all mainshocks of the same magnitude. We are presently implementing the software for applying this algorithm to seismicity catalogs in any format. All software which we develop will be made available to interested parties and will eventually be included in the IASPEI Software Library.
Synthetic Catalogs:We are interested in examining the effects of catalog heterogeneity
on all aspects of the M8 algorithm. We will be using synthetic catalogs with known heterogeneity to examine these effects. These catalogs will be generated using the technique developed by Davis and Frohlich (1991). We are presently implementing that technique.
References:
Davis, Scott D. and Frohlich, C., Single-link cluster analysis, synthetic earthquake catalogs, and aftershock identification,Geophys J. Int., 104, 289-306, 1991.
Keilis-Borok, V. I. and V.S. Kossobokov, Times of increased probability for strongest earthquakes in the world (in Russian), Computational Seismology, 19, 48-58, Moscow, Nauka, 1986.
266

oLLJ
O LU CC LL
TIP Initiation Times in PDE Data
10
140Z
DOm
120g
100
m m
C/)
1970 1975 ONSET TIME
1980
Figure 1. The initial application of the M8 algorithm to teleseismic seismicity data resulted in 39 TIPS, 16 of which had 5 or more functions triggered. The temporal distribution of the onset times of these TIPS is shown by the histograms (dark = 5 or 6 functions triggered). Both of these distributions are different from a normal distribution at the 99+% level. This non-uniformity could be argued to reflect non-uniformity in the world-wide distribution of large earthquakes. The yearly number of M = 6+ events listed in the PDE is shown by circles. This distribution is uniform at the 85% confidence level. The mismatch between the TIP initiation times and the earthquake occurrence time distribution must be examined and explained.

II.1
Southern California Earthquake Project 91-9930-01174
Thomas H. Heaton Branch of Seismology
U.S. Geological Survey 525 S. Wilson Ave. Pasadena, CA, 91106 FAX: 818-405-7827
Introduction
This project covers almost all of the activities of the Pasadena Office of the U.S. Geological Survey. This is a large and complex project that includes the operation of the 250-sta- tion Southern California Seismic Network (SCSN), response to major southern California earthquake sequences, and basic research in earthquake physics.
Investigations
1. Operation, maintenance, development and recording of the Southern California Seismic Network consisting of 220 U.S.G.S. telemetered seismometers and 66 seismometers telemetered from other agencies. All stations are recorded on the CUSP digi tal analysis system.
2. Routine Processing of Southern California Network Data. Rou tine processing of seismic data from stations of the coopera tive southern California seismic network was continued for the period September 1990 through April 1991 in cooperation with scientists and staff from Caltech. Routine analysis includes interactive timing of phases, location of hypocenters, calcu lation of magnitudes and preparation of the final catalog using the CUSP analysis system. About 800 events were detected in most months with a regional magnitude completeness level of 1.8.
3. Development and testing of an automated real-time earthquake location capability that is fast, reliable, uses data from all network stations, and is not dependent on exotic hardware.
4. Collaboration with Caltech to develop a network of very broad band seismic stations in southern California.
5. Correlation of waveforms from closely spaced sites. Studies were carried out on waveform data from over 100 aftershocks of the 1990 Upland earthquake, recorded on a small aperture array. The temporary array consisted of 5 sites spaced at 50 to 100 meters, each with 3-component velocity and acceleration sensors. Comparisons of waveforms showed much variation in the high-frequency amplitudes and waveforms between these closely spaced stations.
6. Network recordings of teleseisms. Using data from the newly
268
II. 1
installed continuous recording system, we plotted record sec tions from teleseismic events consisting of 10 to 15 minutes of data from over 200 stations. A variety of P and S phases can be seen in the data.
7. Examination of estimates of radiated energy. Using a proce dure proposed by Kanamori (pers. comm.) to measure radiated energy, we estimated radiated energy from 66 events of magni tude 3.5 to 5.5 which were recorded on the low-gain and force- balance-accelerometer (FBA) components of the network. In this magnitude range the energy estimates consistently track the local magnitudes, although with a different slope than the traditional Gutenberg-Richter relation.
8. Teleseismic surface waves recorded on the network. Record sections were constructed for teleseismic Rayleigh waves (15 to 25 sec. period) recorded on both the southern and northern California seismic networks.
9. Loma Prieta source inversion. We have collaborated on an investigation of the rupture history of the 1989 Loma Prieta earthquake by inverting strong motion and teleseismic wave forms .
10. Base-isolated structures. We have studied the hypothetical response of base-isolated buildings to synthetic near-field ground motions from large M>7.5 strike-slip earthquakes.
Results
1. Operation and maintenance of field stations and recording sys tems continued with little failure during this reporting period. Time varying attributes of the system are completely recorded on a data base (DBASE III). Documentation of the system and changes to the system continued to be developed by the preparation of semi-annual network bulletins.
2. Routine Processing of Southern California Network Data. The projects to upgrade the southern California seismic network are continuing. To increase the accessibility and research potential of the seismic data, a series of semi-annual Network Bulletins have been issued since 1985. These bulletins pro vide information about how to access data from the network, problems with the data, details of the processing computer systems, and earthquakes in southern California. As part of this project, documentation of past and present station con figurations has been compiled. Digital Audio Tape drives (DAT) are now recording the entire network continuously at 100 samples per second which requires 3 tapes per day. Only tapes containing large teleseisms or significant local events are permanently archived. Software has been developed to select any time slice of this continuous data to study phases not triggered by the online CUSP system.
269

II.1
3. Development of Real-Time Analysis Systems. A software program (PICKLE) has been developed that runs in parallel with the existing online data acquisition system on a DEC MicroVAX com puter. This developing system locates about 3 times as many earthquakes as our previous 64-station RTF. In addition, amplitudes from low-gain and force-balance accelerometers are now used in the calculation of magnitude.
4. Deployment of very broad band seismic systems. We are colla borating with Caltech to complete deployment of 18 very broad band stations within southern California by the end of 1992. Our prototype station, PAS, has been in operation since 1988 and Goldstone (GSC) , Pinion Flat (PFO), Seven Oaks Dam (SVD), Santa Barbara (SBC), and Isabella (ISA) became operational in the past Fall and Winter. 1990. All stations have 24-bit digitizers for very broad band channels and also have strong motion channels for a total dynamic range exceeding 200 db. Data is telemetered via high speed modem by an implementation of Gopher on Caltech's Sun computers. Data logging is trig gered by both QED messages from NEIC and RTP messages from the Southern California Seismic Network. Data from these systems is available either by direct telephone access or through Internet.
5. Close examination of the waveforms from sites spaced at 50 to 100 meters, show that acceleration amplitudes can vary by more than a factor of 5, indicating strong site effects for the high-frequency waves (5-20 hz). If data are integrated to displacement, the waveforms show more coherence. Quantitative estimates of the waveform coherence were determined with respect to both station and event spacing. The results showed that the waveforms vary more with respect to station spacing than with respect to event spacing, suggesting more complexity in structure in the shallow region of the stations", as com pared to the deeper region around the earthquakes. Other interesting features in these waveforms include clear examples of near-field terms (displacement ramps between P and S) and examples of shear-wave splitting (0.1 sec difference in arrival time of S waves on different components).
6. The new continuous recording system of the network data on 4 mm cassette tapes, enables us to look at teleseismic arrivals that normally do not trigger the regular network data stream. We have looked at several well-recorded teleseisms and have seen clear arrivals of various P phases such as P, pP, sP, PcP, PP, ScP, sScP, PKPPKP. If the data are filtered and stacked S phases such as S, ScS, SKS have also been seen on some events. This improvement in data acquisition allows us to use the network data to study detailed mantle and core structures of the Earth. Cooperation with researchers in Menlo Park have already enabled us to make record sections of teleseisms that include over 400 stations and span over 10 degrees. Fig. 1 shows an example of southern California and Menlo Park data combined for an Aleutian event of 1/23/91.
270

II. 1
7. Kanamori (pers. comm.) has suggested a method of estimating radiated energy by using the integrated value of a velocity- squared seismogram. Using this value with appropriate expres sions for the distance attenuation and the assumed source radiation pattern, one can determine a value for the radiated energy. This method was tested using 66 events of magnitude 3.5 to 5.5 that were well-recorded by the low-gain and FBA components of the network over the last several years. Each event was recorded by 5 to 27 components. The results of the energy estimated from each record are plotted in Fig. 2 as a function of the local magnitude (ML) determined frorc that same record. There is a good correlation between the estimate of radiated energy and the local magnitude. A regression of these data gives a relationship, log E = 8.7 + 2.2 ML. This is quite different from the Gutenberg-Richter relationship, log E = 11.4 + 1.5 ML .
8. Teleseismic Rayleigh waves recorded on California seismic net works. Large magnitude (M>7.2) earthquakes generate large enough Rayleigh waves (15-25 sec. periods) to be recorded on the short-period California regional networks. We have digit ized FM tape recordings of these surface waves from several earthquakes and for several hundred stations. We find that the surface waves are very coherent as they travel across Cal ifornia, but significant variations in phase velocity can readily be seen. We are using these observations to map aver age crustal velocity structure.
9. Loma Prieta source inversion. Inversion of strong motion and teleseismic waveforms for the slip history of the 1989 Loma Prieta earthquake indicates bilateral rupture with oblique slip on a 70° dipping plane (probably the Sargent fault). There is compelling evidence that the main rupture was pre ceded by a foreshock (magnitude 3.5 to 4.5) about 2 seconds before the main initiation of rupture. Large regions of slip were centered 6 km northwest and 6 km northeast of the hypo- center. There appears to be relatively little slip in the region directly updip from the hypocenter. The duration of slip at any point on the fault is a parameter of fundamental importance and this modeling study yields a duration of only 1 second (or less).
10. Hypothetical -response of base-isolated structures. Synthetic ground motions for sites within 10 km of large strike slip earthquake ruptures are convolved with the theoretical response for base isolated structures to determine whether or not the range of the isolators will be exceeded. Assuming a slip duration for any point on the fault of 4 seconds and a site located 2 km from a large earthquake of slip 5.0 meters results in differential displacements in the base isolators of 30, 65, and 80 cm assuming free periods of the isolation sys tem of 1.0, 1.5, and 2.0 seconds, respectively. The prelimi nary conclusion of the study is that, given our current under standing of long-period near-field ground motions, we cannot preclude the possibility of failure of base-isolated systems
271

II. 1
within 10 km of very large earthquakes.
Publications
Given, D. , 1991, Real-time earthquake data processing and hazard notification in southern California, Seism. Res. Let. 62 f p 23.
Hartzell, S., and T. Heaton, 1990, Earthquake ground motion at close distances, EPRI/Stanford/USGS workshop on modeling ground motion at close distances, held at Palo Alto, CA, Sept. 1990.
Hauksson, E., L. Jones, J. Mori, R. Clayton, T. Heaton, H. Kana- mori, D. Helmberger, 1990, The Southern California Seismic Network: Report to the U.S. Geological Survey, U.S. Geol. Surv. Open File Rep., submitted.
Heaton, T., 1991, Seismology in the U.S., 1986-1990, The U.S. National Report to the IUGG, Review of Geophysics, in press.
Heaton, T., and S. Hartzell, 1991, Near-field ground motions in large earthquakes and base-isolated structures, Seisin. Res. Let. 62, p 49.
Hutton, L.K., and L. Jones, 1991, Changes in the rate of seismi-city in southern California between 1932 and 1989, Seisin. Res.Let. 62, p 47.
Kanamori, H., J. Mori, D. Anderson, and T. Heaton, 1991, Seismic excitation by the Space Shuttle Columbia, Nature, 349, 781-782.
Mori, J. and A. Frankel, 1991, Correlation of P-wave amplitudes and travel time residuals for teleseisms recorded on the southern California Seismic Network, submitted to J. Geophys. Res.
Mori, J., 1991, Estimates of velocity structure and source depth using multiple P waves from aftershocks of the 1987 Elmore Ranch and Superstition Hills, California, earthquakes, Bull. Seismol. Soc. Am. (in press).
Mori, J., 1991, Near-field waveform data recorded on a small seismic array for aftershocks of the 1990 Upland, California, earthquake, Seism. Res. Let. 62, p 15.
Wald, D., D. Helmberger, and T. Heaton, 1991, The rupture process of a large earthquake: Loma Prieta, Seism. Res. Let. 62, p29.
Wald, D., D. Helmberger, and T. Heaton, 1991, Rupture model of the 1989 Loma Prieta earthquake from the inversion of strong motion and broad-band teleseismic data, Bull. Seism. Soc. Am., in press.
272

II.1
Wald, L., and T. Heaton, 1991, Rayleigh wave observations of the California networks from the 17 October 1987 New Britain earthquake, Seisin. Res. Let. 62, p 32.
Wald, L., D. Given, J. Mori, L.K. Hutton, 1991, The Southern California Network Bulletin; January December, 1990, U.S. Geol. Surv. Open-File Rep. 91-255, 1991, 42 p.
Figure Captions
Fig. 1. Combined data from southern California and Menlo Park for an Aleutian earthquake on 1/23/91. There are over 400 stations used in this record section which are spread over 1100 km of epicentral distance. The data have been stacked in bins of 10 km epicentral distances.
Fig. 2. Radiated energy as a function of ML estimated from over 600 records from 67 events. A linear regression of this data gives the relation log E=8.7 +2.2 ML.
273

DIS
TAN
CE
(DE
C)
ro *w -e*
H-
OQ C

to -J
Cn
H-
TO C n fD
N)
10'
101,
0.7
lOn
1
0,.
Id
. 10it
10a
S
*.
f
i0u
^»
li°
" ..
..li
°"
....
Ii0lt
^i
0"
....li°"
Ifo
^
EN
ER
GY
(E
RG
S)

II. 1
Finite Element Modeling of Crustal Deformation in the Loma Prieta Region
Award No. i4-08-0001-G1852
Eugene Humphreys and Ray Weldon Department of Geological Sciences
University of Oregon Eugene, Oregon 97403
(503) 346-5575
We have examined two aspects of Bay-area crustal deformation through the use of 3-D, visco- elastic finite element modeling of faulted crust (Figure 1 shows the model):(1) By driving the crustal model with various velocity distributions at the base of the lower crust, we have addressed the driving stresses of the transform system in the Bay area; in particular, we examine whether the upper crustal blocks are driven by stresses transmitted laterally through the elastic upper crust or by stresses transmitted up from the mantle lithosphere through the viscous lower crust.(2) By requiring consistency among geodeticly-determined far-field motion, geologically- and geodeticly-estimated fault slip rates, and some notion of crustal physical deformation processes, we have estimated the Bay-area crustal kinematics of the upper (faulted) crust and of the lower (viscous) crust.
Our models are limited in scope. We assume that Moho velocities parallel the Pacific-Sierra Nevada relative motion vector of Argus and Gordon. We assume an elastic upper crust that is bro ken with faults of zero shear strength, and a lower crust that is of constant viscousity. If faults have a laterally constant shear strength, a regional field of shear stress would result that could be superim posed to obtain a complete solution; however, if significant variations in lateral fault strength exist, we have not modeled this potentially important aspect of the problem. Also, by not modeling a lower crust of laterally-variable viscous strength, we cannot address how these strength variations trade off with variations in the driving velocity field at the base of the crust to produce the observed surface kinematics. Thus, our models represent the kinematics and dynamics of a crust where lateral variations in both fault strength lower crustal viscousity are not controlling the physics of deforma tion.
Figure 2 shows the velocity field and fault slip rates at the surface of the earth for the best model (as measured by the LI misfit from the geologic and geodetic data). Under the restrictions of these assumptions, we conclude that driving forces come from below, and that the mantle shear zone is essentially a fault located at X =80 km (i.e., Figure lc, lowest curve on right hand side). How ever, even in this case we cannot concentrate surface deformation as narrowly as it occurs (note rela tively high rates for Hosgri and Calaveras-Hayward systems in Figure 2). By including a fault strength that has friction increasing with fault-normal stress, the San Andreas through the restraining Loma Prieta region would be relatively strong: this would tend to broaden the deformation zone yet further. We conclude that a mechanism tending to concentrate a shear load on the San Andreas, such as a low-strength zone of lower crust beneath the San Andreas or a more northwesterly-oriented man tle shear zone, is likely.
More robust conclusions can be drawn from the kinematic aspects of the model. Surface kinematics imply an uplift field, which is shown in Figure 3 for the model discussed in Figure 2. Note that predicted Loma Prieta region uplift rate is ~2 mm/yr relative to the surrounding country (which is subsiding at ~ 1 mm/yr). Figure 4 shows the velocity difference between the viscous layer (at 20 km depth) and the elastic plate. As shown in Figure 5, this results from vertical gradients of the horizontal velocity in the lower crust. Thus, these velocity differences are proportional to the
276
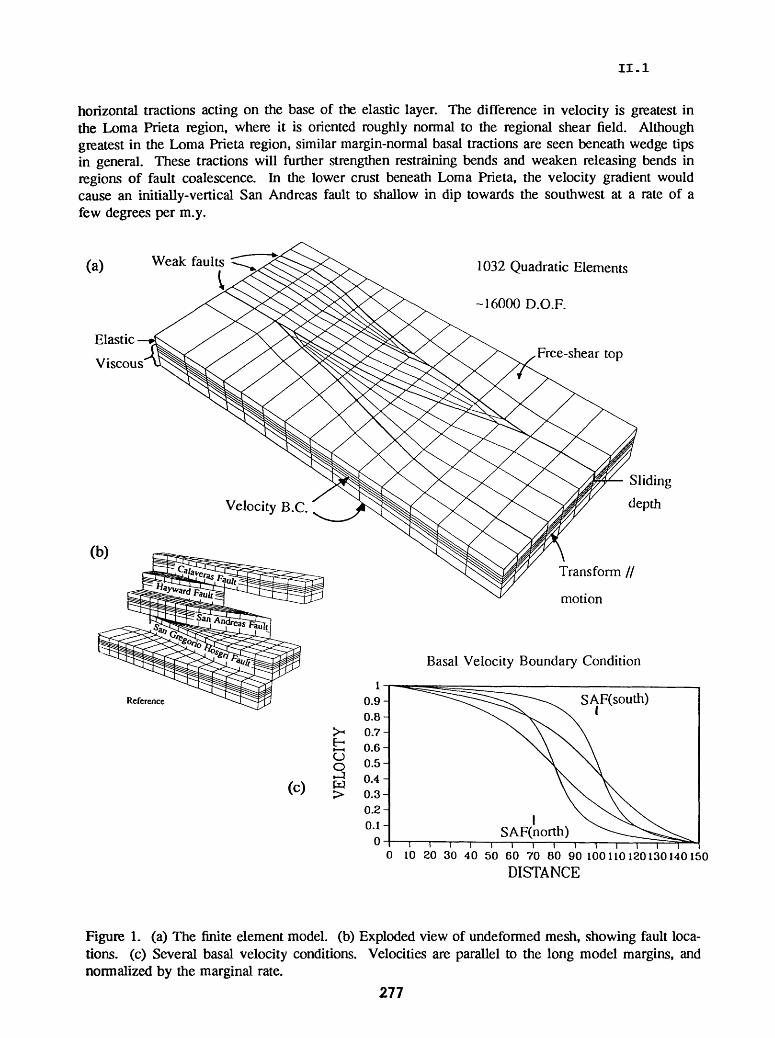
II.1
horizontal tractions acting on the base of the elastic layer. The difference in velocity is greatest in the Loma Prieta region, where it is oriented roughly normal to the regional shear field. Although greatest in the Loma Prieta region, similar margin-normal basal tractions are seen beneath wedge tips in general. These tractions will further strengthen restraining bends and weaken releasing bends in regions of fault coalescence. In the lower crust beneath Loma Prieta, the velocity gradient would cause an initially-vertical San Andreas fault to shallow in dip towards the southwest at a rate of a few degrees per m.y.
(a) Weak faults
Elastic
Viscous
1032 Quadratic Elements
-16000 D.O.F.
Free-shear top
Sliding
depth
Transform //
motion
Basal Velocity Boundary Condition
Reference
(C)
O O Jw
10.9- 0.8- 0.7- 0.6- 0.5- 0.4- 0.3- 0.2- 0.1-
0________SAF(north)
0 10 20 30 40 50 60 70 80 90 100110120130140150
DISTANCE
Figure 1. (a) The finite element model, (b) Exploded view of undeformed mesh, showing fault loca tions, (c) Several basal velocity conditions. Velocities are parallel to the long model margins, and normalized by the marginal rate.
277

II. 1
X km
Figure 2. Velocity at the surface, showing slip rates of faults (mm/yr) and velocity vectors (with respect to right hand side; maximum velocity is 40 mm/yr). This Figure is for a 30 km thick crust, of which the upper 7.5 km are elastic and faults (free-slip surfaces) extend to 12.5 km. Basal velocity is given by a narrow zone near the center of the model (at X - 80 km, i.e., Figure Ic, lowest curve on right hand side). Velocity across entire model is 40 mm/yr, from Argus and Gordon for Pacific- Sierra Nevada relative motion.
Figure 3. Vertical uplift rate, in mm/yr, for the model described in Figure 2. Uplift rate near wedge tips (such as at Loma Prieta) is sensitive to the relative rates of the three participating faults.
278

II.1
Figure 4. Velocity difference, in mm/yr, between the crust at 20 km and the surface, for the model described in Figure 2. These veloci ties indicate lower crustal flow, and therefore horizontal tractions acting on the base of the elastic upper crust.
80
Xkm
Figure 5. Exploded view of crustal deforma tion. Block-like motion of upper crust and viscous flow of lower crust is apparent. This example is driven by a narrow, relatively eas terly, mantle shear zone (Figure Ic, upper curve on right hand side).
279

II.1
Instrument Development and Quality Control
9930-01726
E. Gray JensenBranch of Seismology
U.S. Geological Survey345 Middlefield Road - Mail Stop 977
Menlo Park, California 94025(415) 329-4729
Investigations
This project supports other projects in the Office of Earthquakes, Volcanoes and Engineering by designing and developing new instrumentation and by evaluating and improving existing equipment in order to maintain high quality in the data acquired by the Office. Tasks undertaken during this period include repair and modification of Seismic Group Recorders (SGR's), blasters and accessories, development of a master clock and construction of an RTF digitizer interface, among other things.
Results
Bench tests of a digital seismic telemetry prototype using a FAX modem integrated circuit were performed. These tests demonstrated the feasibility of using such a device for real-time telemetry of seismic data at 9600 baud of standard bandwidth radio and microwave links. A production prototype is being constructed. Tests have also been performed on a set of radios designed to accept 9600 baud digital data as an input and transmit it using a somewhat wider bandwidth.
A new six-channel amplifier/filter circuit board was designed and 30 of them were built. This design integrates function from two different boards used earlier. The units built so far will be used on PC-based seismic data acquisition systems in the USSR and Alaska. Local tests during the Loma Prieta seismic refraction profile were successful.
A new precision electronic clock, Master Clock III, was built and used in the field. This clock is microprocessor-based and uses a 2-line display and keypad as the user interface. The new unit is more compact and more versatile than previous OEVE master clocks. Four more are under construction. A better printer/strip chart recorder has been found for use in the eight new blasters. This clears the way for adding a master clock and a printer to these units.
PC-AT software was developed to control interfaces to a Tustin A/D converter and parallel time information. This will be the basis for the seismic data acquisition part of the new RTP system Rex Alien is developing using transputers.
280

II.1
FAULT MECHANICS AND CHEMISTRY
9960-01485
C.-Y. King Branch of Tectonophysics
U.S. Geological Survey345 Middlefield Road, MS/977Menlo Park, California 94025
(415) 329-4838
Investigations
[l] Water temperature and radon content were continuously monitored at two water wells in Parkfield, California.
[2] Water level was continuously recorded at six other wells in central California.
[3] Water temperature and electric conductivity were periodically measured, and water samples were taken from most of these wells and two springs in San Jose for chemical analysis.
[4] Cumulative slip distribution for a long sequence of slip events along a laboratory fault is studied.
Results
1. Multi-Cycle Slip Distribution Along a Laboratory Fault
Slip distribution along a laboratory fault, which consists of eight spring-connected blocks that are elastically driven to slide on a frictional surface, has been examined for a "long" sequence of slip events to test the applicability of some conceptural models proposed recently in the literature. The distributions of large slip events are found to be quite variable and do not fit the uniform-slip or characteristic-earthquake models. The rupture-initiation points are usually not near the corresponding maximum-slip points, in contrast to observations by Thatcher [1990] and Fukao and Kikuchi [1987] that earthquake hypocenters are commonly near corresponding regions of maximum slip in the fault planes. This contrast may suggest that either the present observations or their observations are not representative, or that the teleseismically determined hypocenters may not always be true rupture-initiation points as usually assumed. Large slip events are also found to be a stress-roughening process. They are triggered by small events when stresses have simultaneously reached the critical levels at most locations along the fault. This suggests that earthquake-prediction monitoring efforts should not be limited to a small region near an asperity but should be spread out to cover the entire fault segment in a seismic gap in order to detect the condition of simultaneous strain buildup.
281

II.1
2. Geochemical Measurements along Hayward Fault
Geochemical measurements have been made about once a month since 1976 at two water wells In Oakland and two springs in Alum Rock Park in San Jose approximately along the Hayward fault. Temperature, salinity and electric conductivity of ground water are measured m situ with a portable instrument. Water samples are taken for chemical analysis in the laboratory. Also measured are water level at wells and flow rate at one of the springs. Figures 1-4 show some of the raw data recorded at the four sites, arranged from north to south.
The portable instrument has suffered a gradual deterioration of sensitivity since 1981. A new probe was added beginning in early 1986. This instrument did not record any useful data when the 1989 Loma Prieta earthquake occurred. It was replaced by a new one in early 1990.
Reports
King, C.-Y., 1990, Gas-geochemical approaches to earthquake prediction: Proceedings of the International Workshop on Radon Monitoring in Radioprotection, Environmental Radioactivity and Earth Sciences ITCP, Trieste, Italy, April 13-14, 1989, Eds. L. Tommasino, G. Furlan, H.A. Khan, and M. Monin, p. 244-274. World Scientific, Singapore.
King, C.-Y., 1990, Earthquake-Prediction techniques: Encyclopedia of Earth System Science (in press), Academic Press, Inc., 26 pages (Approved by Branch Chief in mid-1990).
King, C.-Y., 1991, Multicycle slip distribution along a laboratory fault: J. Geophys. Res., 18 pages (in press), (Date of Branch Chief's approval: 12/20/90).
King, C.-Y., 1991, Multicycle slip distribution along a laboratory fault, EOS, Trans. Amer. Geophys. Union, Program and Abstract Supplement for Spring 1991 Meeting, p. 275:.
282

3 pTemper ature ( C )
1C
1976197719781979198019811982198319841985198619871988198919901991
^ n fondue t ivity (uS/cm)__________________________________40i) 300 20D1976197719781979198019811982198319841985198619871988198919901991
Q ^salinity(O/QO)______________________________________
0.
1576197719781979198019811982198319841985198619871988198915901991
to water surface(meters)
-ID
1976197719781979198019811982198315841985198619871988198915901991
Upper San Leandro Filter Plant rainfall(inches)
Qni . L.I.L. JW ,I,IL, Mi|,, r ,jiu, ^ . ^m..,Mnf., .M.,,i.ia,... f ,f,,. .jiu. JL^. . ,,IILA .j ,i 15761577157815791580158119821983 1984 158515861587 1^881589 15901^91
Figure 1.
COoo<N

3 nTemperature(C)
15
1Q
conductivity(uS/cm)
0 4$alinity(Q/QQ)
0.3:5
Sfr 00cs
ndepth to water surface(meters)
Upper San Leandro Filter Plant rainfall(inches)
19761 8919901^91
Figure 2

inflow rate(gal/min)
53
Q-\ ^AW
1976197719781979198019811982198319841985198619871988198919901991
3^temperature(C)3C 2f 2C1976197719781979198019811982198319841985198619871988198919901991
conductivity(uS/cm)400.300.200.100.
2.22.2.2.2.0
salinity(o/oo)1.5 ID 05
Upper San Leandro Filter Plant rainfall(inches)
H-ii , . . ....i. -. A-. w, .^. '. < ,i, , .1,1^761^771^781^791^801^811^821^831984198519861^871^881^891^901^91
UJL.^891^
oo
Figure 3,

3 5temperature(C)
3d
2
2031976197719781979198019811982198319841985198619871988198919901991
conductivity(uS/cm)
1976:
salinity(o/oo)
VO00
1.45
1.41^76 197719781^79 1^801^811^821^83 1984 1^85 19861987 19881989 1^901991
Upper San Leandro Filter Plant rainfall(inches)
Q97619
l, ll m.i.iiiL. iiiL.4* 1 ... T , -. \ T 1 T"- I. lli^nllB _Um\m4",i i<lil1JgiT L ' .4 U I Jl . *] ** KTiP . I m^-J-if ' t ^Mii B - t *i m I"! M. . i mi i . i * ^^T^ I'.*U^_ .IB iPMHIt^^^^i I i t uii
1^761^771^781^791^801^811^821^831^841^851^861^871^881^891^901^91
Figure 4.

II.1
Earthquake Hazard in the Santa Barbara Channel from Strain Rate Measurements Using the Global Positioning System
Contract 14-08-0001-G1956
Kristine LarsonColorado Center for Astrodynamics Research
University of ColoradoBoulder, CO 80309
(303) 492-6583
Frank WebbJet Propulsion Laboratory, MS 238-624
Pasadena, CA 91109(818) 354-4670
Investigation
The objective of this research is to measure strain rates across the Santa Barbara Channel. We are repeating a GPS survey in this region which was first done in 1987. As part of our work, we are installing reference marks at some of these sites
Progress Report
The sites we are planning to observe are shown in Figure 1. The experiment is scheduled for June 3 through June 6. Trimble 4000ST GPS receivers are being provided by NASA and UNAVCO.
Reference marks were installed and measured at Center, Soledad, and Lacumbre in April.
Data from the 1987 and 1991 experiments will be analyzed during the summer of 1991, using the GIPSY software.
287
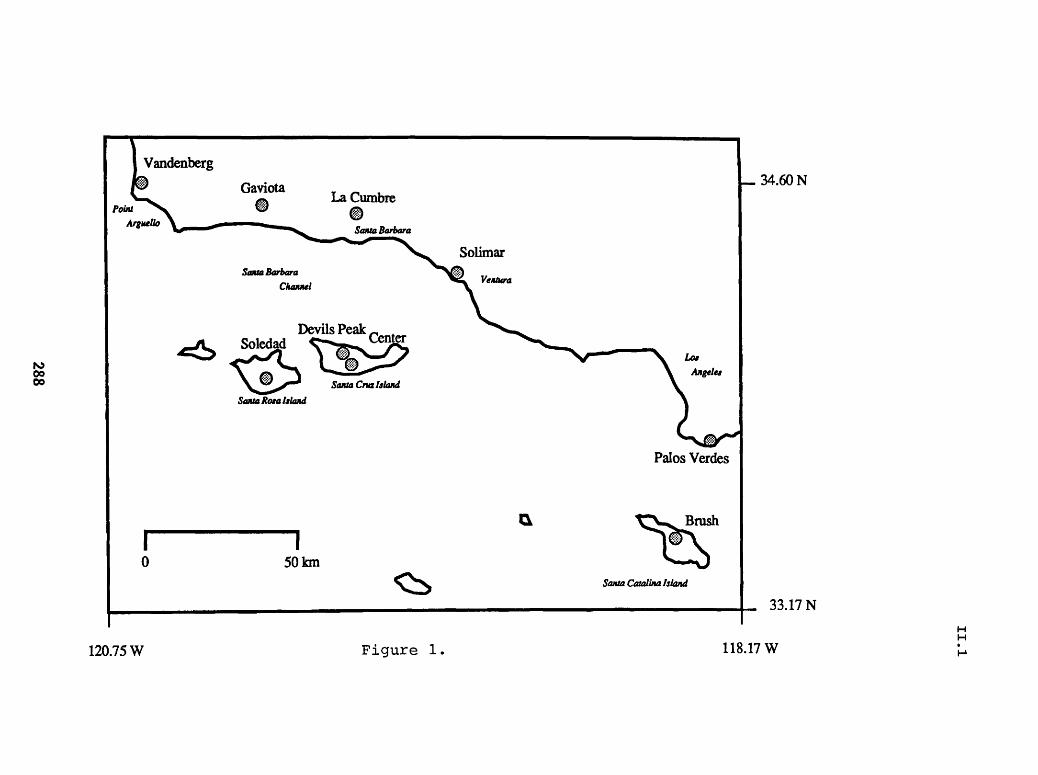
0000
Vandenberg
GaviotaLaCumbre
Santa Barbara
Santa Rota Island
Solimar
VeiUura
- 34.60 N
Palos Verdes
120.75 W
I50km
Figure 1
Santa Catalina Island
33.17 N
118.17 WH H

II. 1
Investigation of Parkfield borehole earthquake catalog for fault zonetrapped waves
Contract No. 14-08-0001-G1979
Peter Leary and Y.-G. LiDepartment of Geological Sciences, University of Southern California, Los Angeles,
California 90089-0740 (213) 740-8256
Proposal Activity Examine the complete microearthquake catalog of the borehole seismic network on the San Andreas fault at Parkfield, California, for evidence of fault zone trapped waves.
Background A systematic borehole seismic investigation of the small normal fault near Oroville, CA, that ruptured in a 1975 M=5.7 earthquake, showed that fault zone trapped waves could be excited by sources within the fault trace (Li and Leary, 1990). The observed propagating waveforms agreed with calculations based on a plane parallel four- layered fault with layer thicknesses and velocities controlled by body wave travel time data. On the basis of these observations similar waveforms were identified in a limited collection of vertical component seismograms recorded by the San Andreas fault zone borehole seismometer network (Li, et al. 1990). Interpretation of the waveforms in terms of the plane parallel fault structure seen at Oroville yielded a fault zone model consistent with body wave tomography velocities for the wall rock and having a narrow low velocity fault zone core layer for which there was no body wave tomographic control. The Parkfield fault zone trapped mode waveforms were observed at a single borehole seismometer network station, MM, that is immediately adjacent to the San Andreas fault (Fig.l). Stations located further from the fault, EA, FR, VC, ST, JS, JN, and GP were not observed to record such waveforms. In the context of a very simple uniform vertical, planar, parallel layered San Andreas fault, this result was not unexpected. However, it was important to the identification and interpretation of the trapped mode waveforms to confirm the systematics of the trapped wave observations with the complete Parkfield borehole seismic network catalog.
Data The complete catalog of event recorded by the Parkfield borehole seismic network from start-up in 1987 through 1990 were acquired, first on 9-track tape (12/90), and latterly on Exabyte cassette (3/91), in the form of UNIX tape archive ('tar') files. Seismograms for a month of events 50 to 80 events are read in for screen and plotter display. Four months of events 4/90, 5/90, 6/90 and 7/90 ~ have been examined. As a first pass, events recorded at station MM that appear to have conspicuous trapped mode waveforms are selected for comparison with the same events recorded elsewhere in the network. This selection is made with two tests in mind: systematic features of the source location and possible uniqueness of these waveforms to station MM.
Results Of the approximately 200 events examined, some 20 to 30 have possible to probable trapped mode waveforms appearing at station MM. The lower panel of Fig. 1 shows 6 events from the May, 1990, catalog month that show clear trapped mode waveforms at MM. The events are located by number in the upper panel of Fig. 1. The seismograms are vertically spaced to indicate the offset from station MM relative to the offset of the nearest event (15). The events are approximately aligned to a common P-wave first arrival. All candidate trapped waves arrivals lie behind the direct S wave arrival time as computed for a uniform Possion halfspace of P-wave velocity 5.2 km/s (as given by velocity tomography). It is interesting to note that intermediate offset events 10,13,25 are
289

II.1
reported as located over a 4 km line normal to fault. The MM waveforms of events 10 (relative offset 6 km) and 25 (relative offset 10 km) suggest that they are mislocated.
Fig. 2 shows another selection of 05/90 events showing trapped mode waveforms at station MM. The events are located in the upper left panel. In the remaining panels the vertical offset of trace is in kilometers relative to the closest event (in this case #52), and the P-wave arrivals are approximately aligned. Shear wave arrival times for a uniform shear wave velocities associated with uniform P-wave velocities of 5.2 and 4.8 km/s are shown. Candidate fault zone trapped waves energy is seen to follow the shear wave arrival times, as expected. Station FR, located on the faster, granite terrain of the western crustal block, and station EA, located 1 km from the San Andreas fault in the slower, metasedimentary terrain of the eastern crustal block, show no evidence for trapped mode waveforms. On the other hand, for events 40,46, 50 and 52 stations JN and JS show waveforms similar to the MM waveforms identified as trapped waves. For the near-by event 52, JS records a waveform that appears after the expected S-wave arrival. The absence of trapped mode waveforms at FR and EA is consistent with a San Andreas fault zone trapped wave interpretation, as the stations are too far from the fault to allow evanescent waves to reach these stations at amplitude. The presence of prominent post S arrival waveforms at stations JS and JN is not consistent with a simple fault zone geometry, suggesting instead that trapped wave energy is moving along shallow low velocity structures excited by fault zone trapped wave energy. This interpretation of station JS and JN waveforms is consistent with the location of these stations in a canyon surface structure that may be fault controlled.
At present the prime avenue of investigation of Parkfield trapped wave systematics is to attempt to decide if the waveforms recorded at station MM represent near surface waveguide structures that have little relevance to the deep structure of the San Andreas fault. However, even if the trapped mode waveforms are characteristic of near surface structures, the excitation of these near surface structures may proceed only via deep fault zone trapped mode excitation. In this case, the critical use of trapped mode observations as a means of precisely locating events relative to the fault at depth remains intact.
Fig. 1 Top: Parkfield event location map. Locations of all recorded Parkfield borehole seismic network events for May, 1990 are shown as dots; locations of events shown in below are numbered; locations of borehole seismic stations are given by letters; # denotes the town of Parkfield. Bottom: Parkfield events showing trapped mode waveforms as recorded at station MM; the horizontal axis is time in units of 16 msec; the events are approximately aligned at a common P-wave first arrival time; the vertical axis is relative offset from MM in km; the solid line is the shear wave arrival time for a Poisson solid with VP = 5.2 km/s.
Fig. 2 Upper left: same as Fig. 1. All other panels: clockwise from upper right, events 40, 42,46, 50, and 52 as recorded at stations MM, EA, JN, JS, and FR approximately aligned to a common P-wave first arrival and vertically adjusted for relative offset from the recording station. A single line denotes expected arrival times of shear body wave for a Poisson solid with P-wave velocity 5.2 km/s; where two lines are shown the shallower line denotes S arrival times for a P-wave velocity of 4.8 km/s. Events were selected as showing a trapped mode waveform at station MM. No such arrivals appear at stations FR and EA, while stations JN and JS shown some form of arrival at approximately the same times as the waveforms at MM.
290
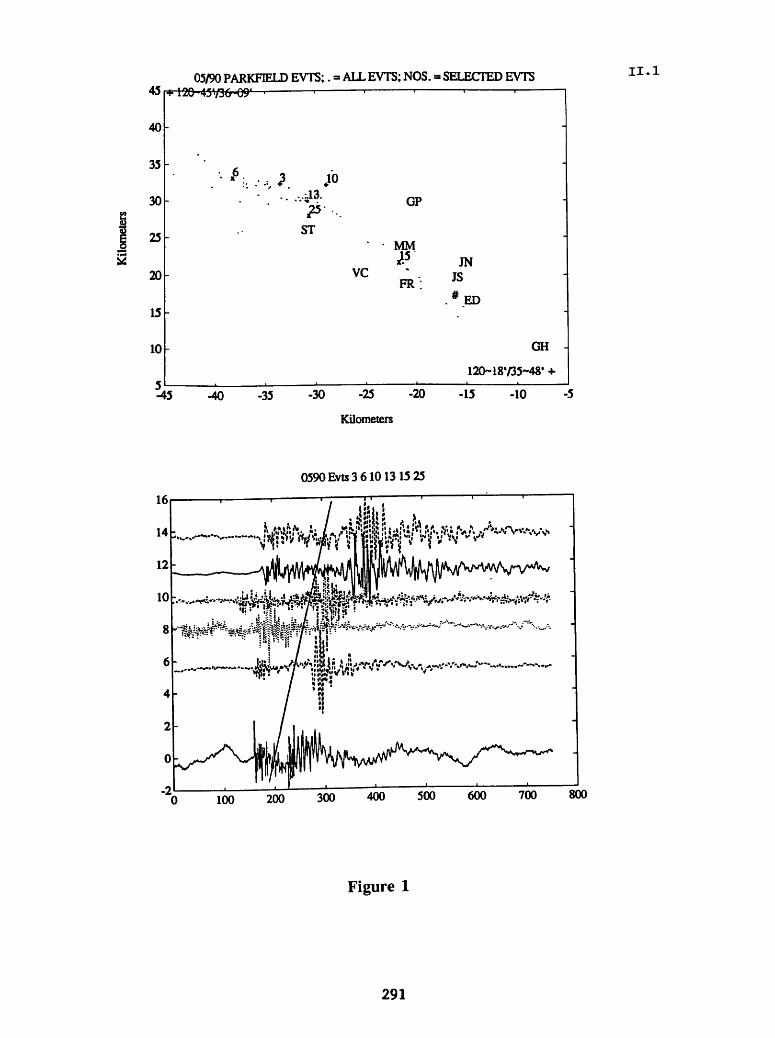
05/90 PARKFIELD EVTS;. = ALL EVTS; NOS. = SELECTED EVTS45|+120-45V3(K>9' ' ' ' ' '
II.1
40
35
30
25
20
15
10
ST
VC
GP
MM '
FR :JN
JS#
-45 -40 -35 -30 -25 -20
Kilometers
ED
GH -|
120-18735-48' +
-15 -10 -5
0590 Evts 3 610 13 15 25
16
^
100 200 300 400 500 600 700
Figure 1
291

II. 1
05/90 PARKFIELD EVTS:.- ALL EVTS: NOS. SELECTED EVTS
ST
CP
' MM
vcFR
.ED
CH
120-l></35~48' +
-45 ^0 -35 -30 -25 -20 -15 -10
Kilometen
0590 Evtt 40 42 46 50 52 - MM
100 200 300 400 500 600 700 800
0590 Evtt 40 42 46 50 52-FR
0 100 200 300 400 500 600 700 800
0590 Evtt 40 42 46 50 52-EA
100 200 300 400 500 600 700 800
0590 Evtt - 40 42 46 50 52 - JS 0590Evt*4042465052JN
i
100 200 300 400 500 600 700 800
Time (x 16 ms)100 200 300 400 500 600 700 800
Tune (x 16ms)
Figure 2
292

II.1
Operation of Borehole Tiltmeters at Pinon Flat Observatory, California and Analysis of Secular and Tidal Tilt
14-08-0001-G1765
Judah Levine Joint Institute for Laboratory Astrophysics
Campus Box 440University of Colorado
Boulder, Colorado 80309(303) 492 - 7785
Objectives: To install borehole tiltmeters at Pinon Flat Observatory in Southern California; to compare the performance our instruments installed at three different depths; to analyze the data at secular and tidal periods; and to compare our results with those obtained from other instruments at the same site.
Results: We currently have three instruments installed at Pinon Flat Observatory and all three have been operating during this report period. The installation in BOC has been somewhat more troublesome than the other two because of the continued accumulation of rust and metal chips at the bottom of the casing. We have experimented with different bottom brackets to keep the instrument from resting on the chips. The data acquired with the newer brackets have been somewhat quieter at intermediate periods (hours to days), but the longer- term signals are essentially unchanged. The data from BOC continues to be somewhat noisier than the data from the two shallower boreholes.
We have obtained initial results from finite-element models designed to model our data in general and to explain the difference between BOB and the other two instruments in particular. Our results so far show that three effects are important in understanding the responses of all of the tiltmeters: (1) deviations of the boreholes from the local vertical; (2) sloping topography and (3) a change in the elastic properties of the material in the vicinity of BOB. Although the three effects are different in detail, they all share the common property of coupling local strain and local tilt. These coupling coefficients are independent of frequency, but are most easily observed with the tides, where both the amplitude and phase of the signals are well known.
The most surprising result of our computations is that these effects are not small at Pinon Flat. Using the vertical variation in the elastic parameters known from well logs and other sources, we find that the tiltmeter in borehole BOB responds to local strain with an admittance of about 0.3 /-iradians/^strain. This coupling constant is essentially independent of frequency. Since local tilt tides and local strain tides are of the same order of magnitude, this amounts to about a 30% effect on a measurement of the tilt tides.
293

II.1
The tip of borehole BOC also produces a surprisingly large coupling between local strain and local tilt. We know from gyroscope measurements made shortly after the borehole was drilled that the bottom of the casing deviates from the vertical by about 8°, and this tip results in a strain-tilt coupling factor of about 0.15 /zradians//zstrain.
Since strain is a tensor while tilt is a vector, the coupling between strain and tilt is more complicated than the single admittance parameter discussed above, and we are currently working to including this additional complication into our models.
Summary of Data Collected: We acquire the data from our three instruments at PFO (2 channels/instrument) every 6 minutes. These same values are also transmitted to the PFO central recording trailer and are digitized and recorded there 12 times/hour.
294

II.1
CRUSTAL STRAIN
9960-01187
M. Lisowski, J.C. Savage, W.H. Prescott, N.E. King, J.L. Svarc Branch of Tectonophysics
U.S. Geological Survey345 Middlefield Road, MS/977Menlo Park, California 94025
(415) 329-4855
Investigations
The principal subject of investigation was the analysis of deformation in a number of tectonically active areas in the United States.
Geodolite surveys during the reporting period include measurement of the Mexicali, Point Reyes, Garlock, Chase, Pinyon Flat, Farallon, and Loma monitor networks. GPS surveys include the southern California and Parkfield monitors, Farallon-Sierra arc, Parkfield network, Parkfield quadrilateral, Mono Chain network, and five profiles in the San Francisco Bay Area. GPS ties to some Geodolite stations were made at Pinyon Flat and in the Mexicali network. A list of networks surveys is given in Table 1.
A new GPS monitor network was established on the Anza seismic slip gap, a section of the San Jacinto fault which has not ruptured in a major earthquake in the last century. The San Jacinto fault has ruptured in magnitude 6 and 7 events several times since the 1890's. However, there are two seismic gaps; from Cajon Pass to Riverside and from Anza to Coyote Mountain. We established a 5-station network spanning the southern gap (Anza to Coyote Mountain). This area is also monitored by the ANZA seismic network, a joint project of USGS and the University of California at San Diego, and two of the new GPS stations are at ANZA seismic station sites. This network will be surveyed several times each year. We will also re-survey the network after any nearby earthquakes (M > 5.5), or if the seismicity changes significantly.
A permanent GPS network is being established to monitor the Hayward fault. Con tinuous GPS monitoring is part of the Bay Area Future Earthquakes Project. One station in San Leandro is operational and another in Hayward is expected to be online soon. The baselines are short, less than 20 kilometers. Remote control and data dumps are through a high-speed modem. Two more stations are planned. Two Ashtec dual-frequency receivers and two Trimble dual-frequency receivers will operate continuously at a sampling rate of 30 seconds. The data will be used to investigate the nature of high-frequency noise in geodetic measurements, to determine whether detectable short-term signals exist, and to monitor fault slip.
295

290
E E
240-
190
Allison
84 86 88 90 92
640
E
590-
540
Hamilton
E E
3
120
70-
20
Eagle Rock
84 86 88 90
84 85 86 87 88 89 90 91 92
Tlme,yr
Figure 1. Geodolite distances measured from Loma Prieta plotted as a function of time, linear fits to all data left of the vertical line.
92
The sloping lines are

II.1
TABLE 1. Geodolite and GPS Surveys October 1990-April 1991
Network
Loma MonitorParkfield GPS QuadrilateralParkfield GPS MonitorChaseGarlockMono Chain GPSFarallonFarallon-Sierra GPSFarallon-Sierra GPSSouthern CA GPS MonitorLoma MonitorLoma GPS MonitorLoma MonitSouthern SF Bay RM TiesParkfield GPS QuadrilateralLoma GPS MonitorLoma MonitorLoma GPS ProfileSouthern SF Bay GPS ProfileCentral SF Bay GPS ProfileGolden Gate SF Bay GPS ProfileNorthern SF Bay GPS ProfileLoma GPS MonitorParkfield GPS QuadrilateralPinyon FlatPt. ReyesMexicaliPt. ReyesLoma MonitorLoma GPS MonitorParkfield GPS
Dates
90/10/0290/10/0390/10/04-0590/10/10-1190/10/22-2590/10/30-11/0390/11/0790/11/08-0990/11/14-1790/11/27-3090/12/0590/12/0590/12/1090/12/20-2191/01/1591/01/1691/01/1791/02/06-0891/02/12-1591/02/19-2191/02/2591/02/26-2891/03/0591/03/2091/04/30-05/0391/01/30-3191/03/06-1891/04/03 fc 04/1091/04/0791/04/0891/04/16-22
Days
11224512441112111343131142132117
Geodolite Lines
3
2021
6
3
3
3
13174773
GPS Sta tion Days
59
24
101720
5
1468
151815515445
5
533
GPS Stations
510
20
5718
5
1468
131513513445
5
527
Totals 80 146 223 202
Results
1. Deformation of the Loma Prieta Geodolite Monitor Network 1984-8 to 1991.2.
Geodolite measurements of distance from a geodetic station located 11 km northeast of the epicenter of the Loma Prieta earthquake (Ms = 7.1; October 1, 1989) to three stations 31 to 43 km distant provide an unusually complete record of deformation in the epicentral area. The three measured distances are shown in Figure 1 as a function of time from October 17, 1984 to April 9, 1991. The earlier date represents the first occupation of the current station mark on Loma Prieta, and the latter date represents the most recent observations. (For data extending back to mid-1981 see the previous semi-annual report.) The coseismic offset has been removed from the data in Figure 1. The pre- earthquake observations are shown by open circles and the post-earthquake observations by solid circles. The sinuous lines bracketing the data are a smoothed version of the
297

PINYON FLAT STRAIN
2
0)
1.0
0.5:
o.O:
-0.5 :
-1.070
'(5
CM CM
<D
vo oo
1.0
0.5-
o.o-
-0.5-
-1.070
0.052±0.020 |ustrain/yr
75 80 85 Time, yr
0.028±0.017 jistrain/yr
ft
75 80 85 Time, yr
90
90
0.104±0.012 jistrain/yr
80 85 Time, yr
35°
34° -
33°
12)' 120" 119° 118° 117° 116° 115° 114°
Figure 2. Tensor strain accumulation at Pinyon Flat, California, referred to a coordinate system with the 1 axis directed S45°E and the 2 axis N45°E. Error bars represent 1 S.D. on either side of plotted point. Heavy vertical dashed lines represents the time of 1979 Imperial Valley earthquake, The location map shows the Pinyon Flat network (shaded quadrilateral PF) and earthquake epicenter (star).

II.1
data offset upward and downward by two standard deviations. The sloping lines in each plot represent linear fits to all data before the first foreshock (Mi = 5.0; June 27, 1988; vertical line in the figure). Those lines represent our best estimate of the pre-earthquake trend. We have previously (Geophysical Research Letters, 17, 1211-1214, 1990) argued the pre-earthquake data following the first foreshock may be anomalous. The linear fits to the pre-foreshock data are reasonable predictors of the subsequent measurements for the Eagle Rock and Hamilton lines. The Allison data seem to deviate from the linear fit in the 1984.5 to 1989.8 interval, but the post-earthquake data seem to be on a parallel trend. For Eagle Rock the post-earthquake data exhibit a steeper trend than that defined by the linear fit to the pre-foreshock data.
2. Strain Accumulation at Pinyon Flat, California, 1974-1991.
A small 10-line trilateration network centered on Pinyon Flat, site of the UCSD long- base, Michelson-interferometer strainmeters, has been monitored since 1974 by Geodolite surveys. Strain accumulation plots deduced from those surveys are shown in Figure 2. The strain is referred to a coordinate system with the 1 axis directed S45°E. parallel to the nearby San Jacinto fault and the 2 axis directed N45°E. In October 1979 a M6.9 earthquake occured on the Imperial Fault at the Mexican border (Figure 2) 160 km SE of the network. The rupture extended northwest to within 100 km of the network. The shear strain accumulation does not appear to have changed trend at the time of that earthquake. In the figure the postearthquake observations are shown as solid points, and only those observations have been used in determining the linear fits shown in the figure. Notice that shear strain e;12 is better determined than are the extensions e'^ and 622- Notice also the improvement in measuring extensions starting in 1984 when new pressure transducers were introduced.
3. Summary of Strain Accumulation Rates in Alaska and the Western U.S. Outside of California
Average principal strain rates measured in trilateration networks in the western U.S. and Alaska are summarized in Figures 3 and 4 and Tables 2 and 3. High rates of strain accumulation are observed near Yellowstone National Park. The Hebgen network shows a uniaxial NNE extension at a rate of 0.253 ± 0.015//strain/yr between 1974 and 1987. Contraction dominates the strain in the nearby Yellowstone network, but this contraction was measured during an interval (1984-1987) when leveling data shows a collapse within the caldera. A relatively low rate of east-west extension (0.033 ± 0.009//strain/yr) is observed across the Wasatch front near Ogden, Utah. No significant deformation is observed in networks near Hanford, Washington, or crossing the Rio Grande rift near Socorro, New Mexico. Low strain rates with nearly equal amounts of extension and contraction are measured in two networks located within the Basin and Range province in Nevada. A significant rate of NE directed contraction was observed in the Olympic Peninsula. In Alaska, high rates of shear strain are observed across the Fairweather transform fault. North to northwest directed contraction was observed in the Icy Bay and Yakataga networks which are adjacent to a seismic gap in the Alaska-Aluetian subduction zone. No significant strain has been measured adjacent to the Shumagin seismic gap. Northeast directed extension was observed across the Denali fault, which shows clear geomorphic evidence for right-lateral slip.
299

II.1
40°
120°
Figure 3. Map of the western United States showing trilateration network locations and average principal strain rates measured in each. Networks are keyed by number to Table 1 where network names, averaging interval, principal strain rates, and the azimuth of the axis of maximum extension are detailed. Transform faults are shown with heavy solid lines, spreading ridges by double solid lines, and subduction zones by a barbed line with the barb on the overthrust plate.
TABLE 2. Average Principal Strain Rates and Azimuth of Extension Axis in USGS Trilateration Networks: Western U.S. Outside of California
Principal Strain Rates*Number
123456789
Network
OlympicSeattleHanfordHebgenYellowstoneOgdenFallenExcelsior*Socorro
Interval
1982-19901972-19851972-19831974-19871984-19871972-19901973-19851972-19821972-1985
ci, //strain/yr
0.011 ±0.0270.027 ± 0.019
-0.016 ± 0.0130.253 ± 0.0150.104 ± 0.0890.033 ± 0.0090.034 ± 0.0150.042 ± 0.0170.009 ± 0.016
£2, //strain/yr
-0.092 ± 0.028-0.036 ±0.013-0.024 ±0.013
0.000 ±0.015-0.203 ± 0.088-0.009 ± 0.010-0.026 ± 0.015-0.050 ± 0.016-0.018 ±0.017
Azi. Max. Extension
149°± 7°158°± 6°177°± 1°14°± 2°33°± 9°90°± 5°
128°± 5°113°± 4°84°±15°
Reference*
Savage et al.Savage et al.Savage et al.
r!991a]r!991a]1991a]
Dzurisin et al. [1990]Dzurisin et al. [1990]Savage et al. [1991b]UnpublishedSavage and Lisowski [1984]Savage et al. [1985]
Extension reckoned positive.Northeastern part of Excelsior networkDzurisin, D., J. C. Savage, and R. O. Fournier, Recent crustal subsidence at Yellowstone caldera, Wyoming, Bull.
Volcanology, 52, 247-270, 1990. Savage, J. C., and M. Lisowski, Deformation in the White Mountain Seismic Gap, California-Nevada, 1972-1982,
J. Geophys. Res., 89, 7671-7688, 1984. Savage, J. C., M. Lisowski, and W. H. Prescott, Strain accumulation in the Rocky Mountain States, J. Geophys.
Res., 90, 10310-10320, 1985. Savage, J. C., M. Lisowski, and W. H. Prescott, Strain accumulation in western Washington, J. Geophys. Res.,
in press, 1991a. Savage, J. C., M. Lisowski, and W. H. Prescott, Strain accumulation across the Wasatch Fault near Ogden, Utah,
J. Geophys. Res., in press, 1991b.
300
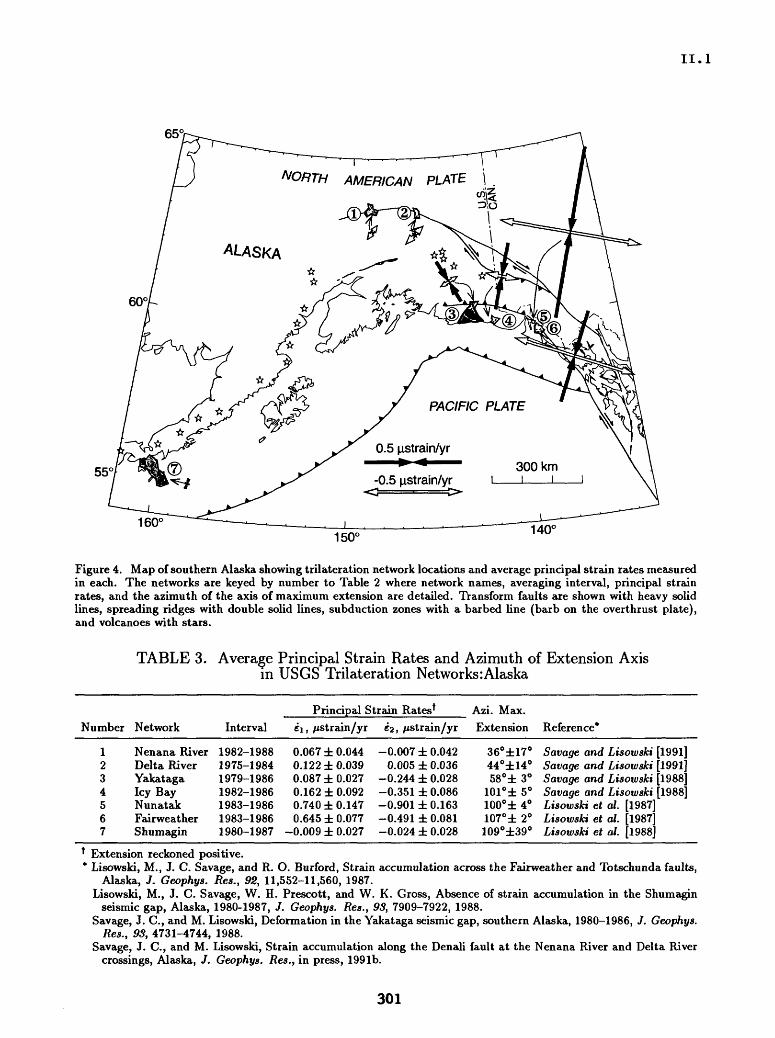
II.1
65
60
AMERICAN PLATE
160150
Figure 4. Map of southern Alaska showing trilateration network locations and average principal strain rates measured in each. The networks are keyed by number to Table 2 where network names, averaging interval, principal strain rates, and the azimuth of the axis of maximum extension are detailed. Transform faults are shown with heavy solid lines, spreading ridges with double solid lines, subduction zones with a barbed line (barb on the overthrust plate), and volcanoes with stars.
TABLE 3. Average Principal Strain Rates and Azimuth of Extension Axis in USGS Trilateration Networks:Alaska
Number Network
___ Principal Strain Rates* ___ Azi. Max.
Interval e\, /istrain/yr Cj, /istrain/yr Extension Reference*
1234567
Nenana RiverDelta RiverYakatagaIcy BayNunatakFairweatherShumagin
1982-19881975-19841979-19861982-19861983-19861983-19861980-1987
0.067 ± 0.0440.122 ± 0.0390.087 ± 0.0270.162 ± 0.0920.740 ± 0.1470.645 ± 0.077
-0.009 ± 0.027
-0.007 ± 0.0420.005 ± 0.036
-0.244 ± 0.028-0.351 ± 0.086-0.901 ± 0.163-0.491 ± 0.081-0.024 ± 0.028
36°±17°44°±14°58°± 3°
101°± 5°100°± 4°107°± 2°109°±39°
Savage and LisowskiSavage and LisowskiSavage and LisowskiSavage and LisowskiLisowski et al.Lisowski et al.Lisowski et al.
19871987:1988
1991199119881988
* Extension reckoned positive.* Lisowski, M., J. C. Savage, and R. O. Burford, Strain accumulation across the Fairweather and Totschunda faults,
Alaska, J. Geophys. Res., 92, 11,552-11,560, 1987. Lisowski, M., J. C. Savage, W. H. Prescott, and W. K. Gross, Absence of strain accumulation in the Shumagin
seismic gap, Alaska, 1980-1987, J. Geophys. Res., 93, 7909-7922, 1988. Savage, J. C., and M. Lisowski, Deformation in the Yakataga seismic gap, southern Alaska, 1980-1986, J. Geophys.
Res., 93, 4731-4744, 1988. Savage, J. C., and M. Lisowski, Strain accumulation along the Denali fault at the Nenana River and Delta River
crossings, Alaska, J. Geophys. Res., in press, 1991b.
301

II.1
4. Repeatibility of GPS Observations in the Loma Monitor Network
Monthly Global Positioning System (GPS) observations of the relative positions Loma Prieta, Allison and Eagle Rock began in about 1985. We have carefully examined a subset of 18 GPS observations of two vectors made over a two-year time period. The beginning of the subset coincides with the availability of reasonably good tracking data from CIGNET North American fiducial sites in late 1987. The end of the subset was determined by the Loma Prieta earthquake (18 October 1989). The GPS data were processed with Bernese software, improved orbits and fixed biases. The data are plotted in Figures 5-6 and the one sigma repeatibilities are given in Table 4.
The results with and without bias fixing are identical at a few millimetes. Either the biases are very nearly integer, so that fixing them has little effect, or the biases have significant fractional parts and were not fixed. Only about 5% of the biases were not fixed. The standard deviations of Geodolite measurements of these two lines are also shown in the table for comparison. The north component of the GPS results is somewhat better than the Geodolite and the east component is somewhat worse.
TABLE 4. Standard Deviations of GPS and Geodolite Observations
Line North East Up
Loma Prieta-Allison (43 km)GPS 4 mm 10 mm 21 mmGeodolite 9 mm
Loma Prieta-Eagle Rock (32 km)GPS 5 mm 11 mm 18 mm
____Geodolite____________________________7 mm_______________________
GPS standard deviations are calculated from the residuals to a weighted linear least-squares fit to observations.
Geodolite standard deviations are calculated from the formula a = [(3mm)2 + (0.2ppm x L)2]1 /2 (Savage and
Prescott, JGR, 1973).
Reports
Lisowski, M, J.C. Savage,and W.H. Prescott, The velocity field along the San Andreas fault in central and southern California, Journal of Geophysical Research, 96, 8369-8389, 1991.
Savage, J.C., M. Lisowski, and W.H. Prescott, An apparent shear zone trending north- northwest across the Mojave Desert into Owens Valley, Eastern California, Geophysical Research Letters, 17, 2113-2116, 1990.
Savage, J.C., and G. Plafker, Tide gage measurements of uplift along the south coast of Alaska, Journal of Geophysical Research, 96, 4325-4335, 1991.
Savage, J.C., and M. Lisowski, Strain measurements and the potential for a great subduction earthquake off the coast of Washington, Science, 252, 101-103, 1991.
302

0.10-
0.08-
E 0.06-
3 ^ 0.04-
0.02-
0.00^
87.5
0.10-
0.08-
E 0.06-
3-^ 0.04-
0.02-
0.00^I
87.5
88.0
|LP1 - Allison North]
FIXED: rms = 0.0044 m o FREE: rms = 0.0039 m
88.5 89.0
Time, yr
[LP1 - Allison East |
89.5
FIXED: rms = 0.0101 m o FREE: rms = 0.0095 m
88.0 88.5I
89.0 89.5Time, yr
II.1
90.0
90.0
0.20-1
0.15-
Eo" 0.10-
0.05-
0.00^
87.5 88.0
|LP1 - Allison Up|
FIXED: rms = 0.0210 m o FREE: rms = 0.0223 m
88.5 89.0
Time, yr89.5 90.0
Figure 5. North, east, and up components of GPS measured relative position vector between LP1 and Allision plotted as a function of time. Error bars represent 1 standard error from a weighted linear fit to the data.
303

II.1
0.10-
0.08-
E 0.06-
30.04-
0.02-
0.00-
87.5 88.0
|LP1 - EagleUn North]
FIXED: rms = 0.0051 m o FREE: rms = 0.0051 m
T88.5 89.0
Time, yr89.5 90.0
0.10-
0.08-
0.06-
0.04-
0.02-
I
0.00^
LP1 - EagleUn East)
FIXED: rms = 0.0115 m o FREE: rms = 0.0121 m
87.5 88.0 88.5 89.0 Time, yr
89.5 90.0
0.20H
0.15-
E
3" o.io-
0.05-
o.oo-l87.5
|LP1 - EagleUn Up|
FIXED: rms = 0.0184 m o FREE: rms = 0.0164 m
88.0 88.5 89.0Time, yr
89.5 90.0
Figure 6. North, east, and up components of GPS measured relative position vector between LPl and EagleUn plotted as a function of time. Error bars represent 1 standard error from a weighted linear fit to the data.
304

II.1
Stability of the M8 and CN Earthquake Prediction Algorithms
14-08-0001-G1972
Jean-Bernard MinsterInstitute of Geophysics and Planetary Physics A-025
Scripps Institution of OceanographyUniversity of California, San Diego
La Jolla,CA 92093-0225
Investigation
The purpose of this project is to conduct a systematic investigation of the stability and robustness of the long-term earthquake prediction algorithms "M8" and "CN", developed in the Soviet Union by Dr. Keilis Borok and his co-workers (e.g. Keilis-Borok et al., 1980a,b, 1988; Keilis-Borok and Kossobokov, 1988). Current claims for California include successful prediction of several events of magnitude 6.5 and greater, including the Superstition Hills events and the Loma Prieta earthquake. However, it appears that this success was predicated on recent updates to the earthquake catalog. This raises several issues which must be addressed as part of an overall evaluation of the approach.
We intend to use the computer programs that implement the most up-to-date definition of the algorithms, as well as the most up-to-date catalogs used to test the method. We will 1) conduct a systematic investigation of the dependence of the results on the free parameters of the algorithm, namely the magnitude threshold used to scale all measures of seismicity, and the spatial sampling strategy, and 2) examine in detail how sensitive the algorithms are to both random and systematic fluctuations in magnitude estimates, which we suspect to be the most critical source of instability in the results (other than the short time span of existing catalogs).
Initial Accomplishments (February-March 1991)
As an initial action, we have obtained from Mark Matthews of Stanford University the most recent version of a program that realizes algorithm "M8". This program was last updated by Dr. V. Kossobokov when he visited the USGS in 1989-90, and was adapted for use without modification on UNIX workstations (SUN) by Dr. Matthews at Stanford. The status of this implementation was discussed by the P.I. with Drs. Matthews and Keilis Borok during the special symposium held during the AAAS meeting on February 18,1991 in Washington D.C. The version of the code we have is written in FORTRAN, although not in a uniform style, presumably because the program was actually written over an extended period of time. It consists of a monolithic main program, approximately 103 lines long, which deals with the I/O operations, the interactive dialog with the user, the algorithm itself, and the ouput, as well as a handful of subroutines aimed primarily at manipulating dates (e.g. Julian vs. epochal). This particular version of the program contains no comments, and due in part to the name space limitations of FORTRAN, variable names are not particularly meaningful.
We also secured an earthquake catalog for California, containing 7577 entries representing "main shocks" between 1963 and 1989. Aftershock sequences have already been removed, and the number of aftershocks is recorded for each main shock. This last quantity plays a prominent role in the algorithm. This catalog is the one that was used by Soviet seismologists to declare a TIP ("Time of Increased Probability'*) encompassing the
305

II.1
Loma Prieta earthquake. We have been able to verify that running the program with the provided sample input file and catalog produces an output indicating a TIP for this period.
However, no indication is provided as to the underlying characteristics of the seismicity that actually caused the TIP. An option offered by the interactive dialog to produce output files contining the seven seismicity functions that define the patterns was found to be inoperable. A very careful and protracted examination of the code shed only a little light on this issue. In fact, although the fundamental characteristic of "M8" is that the algorithm should be "frozen" except for a scaling magnitude threshold [e.g. Gdbrielov et al., 1986; Minster, 1989], we have found several apparent discrepancies between the definitions of the seven functions of seismicity upon which "M8" is based as described in the various papers cited herein, and as used in the code with the sample input.
Based on our experience to date, we have determined that the first order of business should be to prepare a new implementation of the algorithm, with appropriate in-code documentation, so as to permit better tracking of implementation details and code modifications. Since most of the algorithm depends on bookkeeping details, we have chosen to use "C" as the implementation language. In addition, the code will be executable through a "front end" in which the catalog and parameter perturbations suggested to test the robustness of the predictions will be collected. We have initiated this task, and are verifying the algorithm descriptions against published descriptions (both in English and in Russian). When finished and tested, the code will be made available to other groups working on the same topic.
References
Gabrielov, A.M., etal., 1986, Algorithms of long-term earthquake's prediction, International School for Research Oriented to Earthquake Predition Algorithms, Software and Data Handling, Lima, Peru, Sept 1986.
Keilis-Borok, V.I., L. Knopoff, and I.M. Rotwain, 1980a, Bursts of aftershocks, long- term precursors of strong earthquakes, Nature, 283, 259-263.
Keilis-Borok, V.I., L. Knopoff, I.M. Rotwain, and T.M. Sidorenko, 1980b, Bursts of seismicity as long-term precursors of strong earthquakes, /. Geophys. Res., 85, 803-811.
Keilis-Borok, V.I., L. Knopoff, I.M. Rotwain, and C.R. Alien, 1988, Intermediate-term prediction of occurrence times of strong earthquakes, Nature, 335, 690-694
Keilis-Borok, V.I., and V.G. Kossobokov, 1988, Premonitory activation of seismic flow: Algorithm M8, in workshop on Global Geophysical informatics with applications to research in earthquake predictions and reduction of seismic risk, 15 Nov.-16 Dec 1988.
Minster, J.B., 1989, Earthquake prediction in the California/Nevada Region by Gabrielov et al., A review, in Proceedings of the National earthquake Prediction Evaluation Council, R.G. Updike, ed., U.S.G.S. Open-file report 89-144.
306

II.1
Array Studies of Seismicity9930-02106
David H. OppenheimerBranch of Seismology
United States Geological Survey345 Middlefield Road - MS 977Menlo Park, California 94025
415-329-4792
Investigations
1. Continue consolidation and clean-up of phase data of central California Seismic Network (CALNET) from 1968 through present.
2. Investigate seismic gaps and seismotectonics in the east San Francisco Bay region.
Results1. A milestone was reached in the collection, organization, relocation, archiving, and docu
mentation of CALNET earthquake data since 1968 (see previous Semi-Annual Reports). We acquired during the past year University of Nevada at Reno traveltime data for the first half of the 1980's (previously available only on paper records), Wood-Anderson amplitudes at select University of California at Berkeley seismic stations, and the original U.C. Berkeley calculated Richter magnitudes. We completed merging these data with the U.S.G.S. catalog and relocated the joint data set with a new version of Hypoinverse which locates each earthquake with the 1-D gradient velocity model appropriate for the initial earthquake location. In addition, the magnitudes were recalculated with Jerry Baton's revised formulations for coda and amplitude magnitude which considers time dependent station gain and site corrections. The resulting set of 280,000 earthquakes is now complete to the best of our knowledge. Preliminary quality checks to remove sys tematic errors in magnitude determination and gross blunders were begun, and corrections are scheduled for this summer. The data set resides on a computer accessible to anyone with access to Internet and is always available for distribution.
2. As reported in the previous Semi-annual technical summary, the 20 years of microseismi- city in the San Francisco Bay area defines aseismic regions (gaps) at the base of the seismogenic zone which are likely sites for main shocks to rupture. If correct, this model provides a way to forecast both the place and magnitude of future main shocks. Together with knowledge of the fault slip rate and record of historic earthquakes, it is then possible to make intermediate-term predictions of earthquake occurrence. These findings were presented at a Symposium on the Xianshuihe Fault in Chengdu, China. An article is also in preparation to be submitted to the proceedings of the Symposium.
Research on seismic gaps was focussed on the region east of the San Francisco Bay. Preliminary findings were presented at the G.S.A.-S.S.A. symposium, Neotectonic Frame work of the Seismic Hazards of the San Andreas Transform Boundary, is the Concord- Calaveras-Sunol fault system . Several northwest-trending faults accommodate the rela tive Pacific-North American plate motion in this region, including the Calaveras-Sunol,
307
II.1
Franklin, Concord, Antioch, and Greenville faults, but numerous reverse faults also exist. Fault segmentation in this region is usually expressed by right step-overs accommodated by conjugate left-lateral faults with lengths of less than 5 km. These short, step-over faults are capable of generating magnitude (M) 4 1/2 earthquakes, such as occurred in April, 1990 near Alamo on a fault connecting the Calaveras-Sunol and Concord faults. The microseismicity recorded by the U.S. Geological Survey since 1969 ranges in depth from 5 to 12 km; their locations and focal mechanisms clearly define segments of vertical strike-slip faults, but segments on each of the Calaveras-Sunol, Concord, and Antioch faults are aseismic.
The most prominent microseismic gap exists on the Calaveras-Sunol fault and extends 30 km from Calaveras Reservoir to Dublin. The rupture area of this segment is capable of generating an earthquake of M6 1/2-6 3/4. There is no observed creep on this gap, but geodetic data indicates a slip rate of approximately 5 mm/yr. In 1861 a M5.6 earthquake occurred at the northern end of this gap, producing a fissure 13 km in length. While the magnitude of this earthquake is too small to have ruptured the entire length of this gap, its occurrence together with the length of the microseismicity gap and observed accumu lation of strain indicate that the fault is locked and likely to rupture in another main shock.
Earthquakes also occurred in the vicinity of this gap in 1858 (M6.1) and 1864 (M5.7), but it is not known whether they ruptured the Calaveras or the nearby Hayward fault . Like the M5.6 1861 earthquake, these two earthquakes were not large enough to have ruptured the entire gap. Two rupture forecasts are possible. If the series of earthquakes in the 1860's ruptured this gap in its entirety, then it is unlikely that this gap would rup ture in the near future assuming a slip rate of 5 mm/yr and an anticipated slip of approxi mately 1.5 m during rupture. Alternatively, if the gap was not completely ruptured by these earthquakes, then this gap conceivably has now accumulated a sufficient slip deficit to be considered a likely site for a main shock.
Reports
Budding, K.E., D.P. Schwartz, and D.H. Oppenheimer, Slip rate, earthquake recurrence, and seismogenic potential of the Rodgers Creek fault zone, northern California: Initial results, Geophys. Res. Let., 18, 447-450, 1991.
Benz, H.M., G. Zandt, and D.H. Oppenheimer, Lithospheric structure of northern California from teleseismic images of the upper mantle, submitted to J. Geophys. Res., 1991.
Oppenheimer, D.H., and N. MacGregor-Scott, Seismic potential of the east San Francisco Bay region of California, Seism. Res. Lett., 62, p. 13, 1991.
308

II.1
Variations in Electrical Properties Induced by Stress Along the San Andreas Fault at Parkfield, California
Supported by the U.S. Geological Survey, Department of Interiorunder award number 14-08-0001-G1357
Stephen K. Park Tien Chang Lee
Institute of Geophysics and Planetary PhysicsUniversity of California
Riverside, California 92521
IntroductionWe are monitoring fluctuations of resistivity with telluric
currents in Parkfield. The array uses grounded telephone lines as dipoles (Figure 1). The analysis has been discussed in previous reports and will not be reviewed here. We look at daily fluctuations of the telluric coefficients relating Dipoles 1 through 6 to the reference dipoles of Dipoles 7 and 8. Thus, we are looking at relative variations, rather than absolute ones. Changes in the telluric coefficients are directly related, albeit through the response of a complex, heterogeneous earth, to changes of resistivity.
Discussion of DataWe have now completed an error analysis for our data and have
set 95% confidence intervals for the telluric coefficients. These limits are shown as dashed lines in Figures 2 through 4. The excursion in the telluric coefficent on Dipole 2 which occurred approximately one month before the M=4 earthquake just south of the array in May, 1989 is significant at the 95% confidence interval. This fluctuation corresponds to changes on tensor strainmeter (EA and DL in Figure 1) which are straddled by Dipole 2. However, the data from the strainmeter is suspect because an adjacent dilatometer recorded no change at that time. We suggested in a previous report that the change may be due to precipitation, but now discount that possibility for two reasons. First, the amount of precipitation at that time was minor and not seen on all gauges in the region. Second, no changes of resistivity are seen at times of major storms in Parkfield. We now believe that the changes are associated with the strain anomaly.
Our data have also now been compared to Parkfield alerts, precipitation, magnetic storms, and temperature (available in Final Report for 1989-1990 and in manuscript accepted by JGR). With the exception of the strain anomaly mentioned above, we find no correspondence between these phenomena and fluctuations of resistivity which are significant at the 95% confidence interval. The correspondence is negative both in that significant changes in telluric coefficients occur when there is no anomalous behavior and in that no changes of resistivity are seen when other phenomena are anomalous. However, no alert higher than a C level has been called
309

II. 1
for Parkfield since the telluric array was installed (1988). Also, we did see significant changes prior to the largest earthquake to occur in Parkfield since 1988. Lack of a coseismic change anywhere on the array leads us to discount any change of resistivity directly related to release of strain energy, however. We are no closer to identifying the mechanism responsible for the change in 1989, but the correspondence with the strain anomaly is not coincidental.
Results of the analysis for 1990 for Dipoles 1 through 6 are shown in Figures 2 through 7. We plot the projection of the daily fluctuation of the telluric coefficient onto the major and minor eigenvectors (upper and lower plots for each dipole, respectively) and the coherency as a measure of the data quality. The results for 1990 are uneventful, with no significant fluctuations occurring since the beginning of the year. (Note that we had a plotting error in the last report, so the fluctuations seemed much greater than in actuality.) There are several excursions beyond the 95% confidence interval in Figures 2 through 7, but none of them last for more than 2 days or are seen on more than one dipole. We thus conclude that these excursions are not significant.
The data quality during the last three months degraded on Dipole 2 and during the last month on Dipoles 5 and 6. We do not know the cause of this degradation, but the quality has improved dramatically in 1991. We suspect that noise on the telephone line to Lc (Figure 1) is the problem.
ConclusionsWe have significant changes in the telluric coefficients at a
95% confidence interval, although we cannot explain these changes at this time. Correspondence with other phenomena is intriguing, but is insufficient to help us explain the mechanism producing the changes of resistivity. We cannot locate where are the resistivity changes nor estimate their magnitudes because we have not yet run a 3-D inversion using the electrical structure of Parkfield. In any case, we suspect that our results will be nonunique.
310

II.1
Figure 1 - Telluric monitoring array in Parkfield. Electrodes ar< marked with dots and eletronically created dipoles are showi with lines. Strain meters at Eades (EA) and Donna Lee (DL) are shown.
^-'- - * ' L'_rV. irl-a ' *" ' ' "- - ^~f"'',""~~~ m* _m i i I ' ' ~^ "i 4,-i. *^^fc»^^; J
% . r"! $-A£J^>*$i , i/Tr. / t^r^ [ - "v « c % "^l 0/ x GC^.^- ^o^w t\^Mm^umM^^-^ ~ y^^^&wMc'jfa^^\ V-.W-G?^.L«iJL!i * '"/t" * 1 '. frr^ A ! ; .>" j ^ -'k \2 : :N ..'A ' ^ * -^ "V^" ^Jggg^Ns't .^., a .fer r crir?T^rr^-^r-^ rn*T ^ r ^r-tc~.Ts^-^iss ri-// ^-urtaH^k^i
x- hypocenter (1966)
311

Figure 2 - Residual analysis for Dipole 1 for 1990. The first plot is the projection of the residual on the major eigenvector and the second is the projection on the minor eigenvector. Projections are shown with a scale of +5% to -5%. Coherencies are between the signal predicted using the telluric coefficients and the measured signalare shown between .998 and 1.000.
II.1
+2X. DIPOLE 1 SMOOTH- 9
1.1
**"******"
12090
+2X DIPOLE 1 SMOOTH- 9
tummmmfm"
_* * «.* mu * _ * * * ^ m m *^" ^BB* %
24090
DIPOLE 1 SMOOTH- 9
-2X.
» » »»* » -», »* » *«> ».»» »»>** ** ******»***»»«.»* *__
1.1
90 36090
312

II.1
Figure 3 - Residual analysis for Dipole 2 for 1990. See caption of Figure 2 for explanation.
DIPOLE 2 SMOOTH- 9
12090
DIPOLE 2 SMOOTH- 9
»*.*»** ** »»»»*»*»»*»»,
24090
DIPOLE 2 SMOOTH- 9
* »*»»*»»»» * * »« »
1.
36090
313
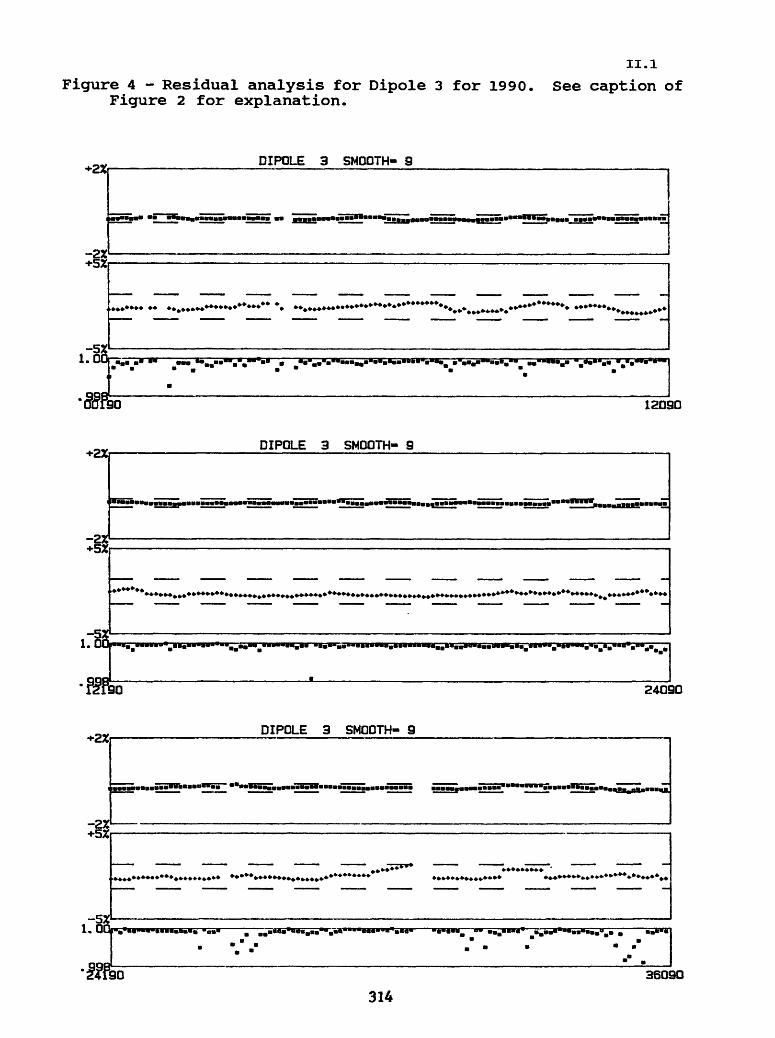
Figure 4 - Residual analysis for Dipole 3 for 1990 Figure 2 for explanation.
ii.1 See caption of
DIPOLE 3 SMOOTH- 9
12090
DIPOLE 3 SMOOTH- 9
>» ***«
24090
"2X DIPOLE 3 SMOOTH- 9
1155
"»»**
36090
314

II.1
Figure 5 - Residual analysis for Dipole 4 for 1990. See caption of Figure 2 for explanation.
_______________DIPDLE 4 SMOOTH- 9
-
+2%
12090
DIPOLE 4 SMOOTH- 9
+2X
24090
DIPOLE 4 SMOOTH- 9
i-j
36090315
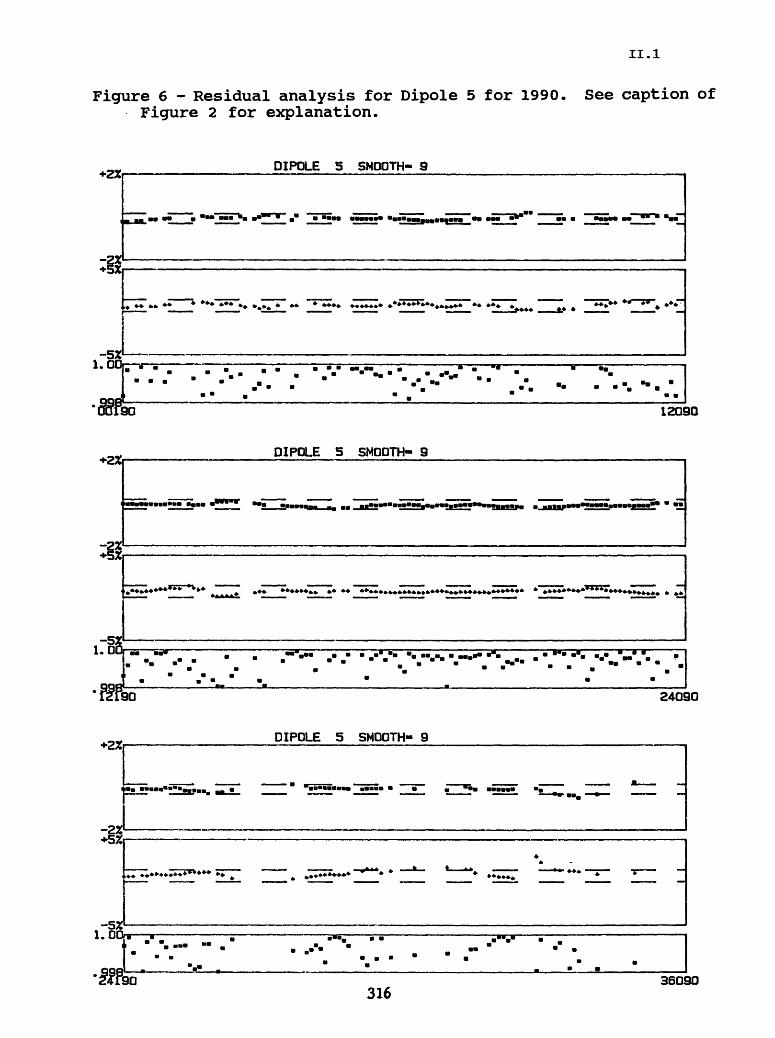
II.1
Figure 6 - Residual analysis for Dipole 5 for 1990. See caption of Figure 2 for explanation.
________________DIPOLE 5 SMOOTH- 9
1.
*» ** *** »»>w __ * **»
+2X
12090
DIPOLE 5 SMOOTH- 9
l.Ot
I M
»*»»*»»***** ^»* ^^~ »» »**»« »»» »« ««»««»««««,» » «« ««««**«» « « * »»»» »****** » »»»»»» » »,
+2*
24090
DIPOLE 5 SMOOTH- 9
»» *' »»^
1«I
'i2?90 36090316

II.1
Figure 7 - Residual analysis for Dipole 6 for 1990. Figure 2 for explanation.
See caption of
>£Z DIPOLE 6 SMOOTH- 9
..- ...mm
»****4
iia12090
>2X DIPOLE 6 SMOOTH- 9
V
gfe 24090
+2% DIPOLE 6 SMOOTH- 9
"* '
*-**»*-,****
-5Z l.OQ
36090
317

II.1
Earthquake Fundamentals
9930-02103
Paul A. Reasenberg Donna Eberhart-Phillips, Mark Matthews, Randall White
Branch of SeismologyU.S. Geological Survey
345 Middlefield Road - MS 977Menlo Park, California 94025
415-329-5002
Investigations1. Loma Prieta Earthquake2. Seismic Velocity and Seismicity3. Microclusters, Composite Clusters and Omori's Law4. Investigation of Pattern-recognition Approaches to Earthquake Prediction
Results1. The 1989 Loma Prieta aftershocks describe a tabular zone corresponding to the
southwest-dipping mainshock fault surface, which ruptured from 17 to 5 km depth, as well as distributed and clustered shallow seismicity apparently associated with the mapped traces of the San Andreas and Sargent faults. The aftershock focal mechanisms are quite varied and cannot be explained by a uniform stress field. The prior seismicity suggests a vertical San Andreas fault below the mapped trace with right-lateral strike- slip mechanisms. Geological analysis suggests that both the San Andreas and Sargent faults are active and that the San Andreas fault has had right-lateral surface rupture in the recent past.Despite thorough analysis of the existing data, we still do not know how the 1989 earth quake sequence is related to either the mapped fault traces or the Peninsula segment of the San Andreas Fault (Figure 1). These questions are being investigated with a seismic calibration shot experiment in the epicentral zone. The experiment will allow precise relocation of the shallow seismicity and calculation of detailed 3-D Vp and Vp/Vs crustal models, and will provide data on critical Moho reflections along the San Francisco Pen insula.We are carrying out six controlled-source explosions that will be recorded at permanent network and temporary seismograph stations. Approximately 80 stations will reoccupy the sites of portable instruments that were deployed during the 1989 aftershock sequence. In addition, approximately 180 stations will be used for a refraction/reflection profile across the Zayante, San Andreas and Sargent faults.
318

II.1
2. Analyzing 3D velocity models in relation to seismicity and rupture behavior shows corre lations between the mainshock rupture area and high-velocity blocks adjoining the fault; between creeping sections and uniform sharp velocity contrasts across the fault; and between microseismicity patterns and velocity variations. The Parkfield mainshock ini tiated under Middle Mountain, the only area where a 40-km-long region of low velocity material impinges on the San Andreas fault. This material has low velocity and low resistivity, but does not have correspondingly low gravity; thus the low velocity may be due to high fluid pressure. 3D velocity models, developed from local earthquake travel- times, appear to image variations in material properties that influence rupture behavior in active fault zones.
3. Spatial and temporal variations in the Omori decay parameter, p, were reliably obtained for regions in central and southern California from hundreds of small earthquake clusters, each cluster consisting of only 2 or a few events, using a compositing method. The tem poral behavior of such composites is assumed to reflect the stress relaxation process representative of the entire region in which the clusters occur, as opposed to the tradi tional point estimates of p obtained from an individual large earthquake aftershock sequence. Spatial variations in central California suggest that p is positively related to the average contemporary slip rate on the San Andreas, Calaveras and Hayward faults. In southern California, p is positively correlated with regional heat flow.The study was expanded to include the catalog of earthquakes for the Garm region, USSR, in an effort to explore the relationships among stress relaxation rates, contem porary tectonics and geology. This seismically active region is part of the collision plate boundary between the Indian and Eurasian plates. Several other regional catalogs, includ ing areas of extension, subduction and volcanism, are now being prepared for inclusion in the study.
4. A group from The Institute of Mathematical Geophysics and Earthquake Prediction in Moscow has spent nearly two decades developing and refining statistical approaches to earthquake forecasting. These approaches rely on "pattern recognition" techniques to identify anaomalous character in pre-mainshock seismicity, and they have been applied to California seismicity data with apparent success. In particular, the M8 algorithm is claimed to have predicted the Loma Prieta earthquake of October, 1989.
We have investigated the behavior of the M8 algorithm in California with particular attention to the issue of where the supposedly anomalous precursory events occur relative to the mainshock location. We have found that key earthquakes generating TIPs in Cali fornia lie in volcanic and geothermal areas distant from the sources of mainshocks that they help to "predict". In particular, we found that M8 does produce a TIP in a region surrounding the Loma Prieta epicenter, but the TIP disappears if seismicity from the Geysers Geothermal Area is excluded from the analysis. This is disturbing, for the Geysers is a sight of known induced seismicity. Hence, the seismicity rate increase detected by M8 as a supposed precursor to a mainshock is actually man-made.
A TIP that (barely) includes the Loma Prieta epicenter, centered at a point to the southeast of Loma Prieta also produces a TIP that includes the eventual mainshock. This TIP is found, however, to depend critically on swarms of seismicity is the Mammoth
319
II.1
Lakes region of the central Sierra Nevada, and in a volcanic region of southeastern Cali fornia called Indian Wells Valley.
We have investigated the temporal, as well as spatial, sensitivity of the M8 algorithm, and we have found a rather disturbing fact. The reported success of the algorithm in retrospective application to California (4 of 4 successful predictions, 0 false alarms) depends very much on the starting date of the calculations. For instance, if one defines the "background" starting in 1970, rather than 1975, one finds that the algorithm only predicts 1 of 4 earthquakes correctly and generates 6 false alarms.
ReportsEllsworth, W. L., D. M. Eberhart-Phillips, and E. Kissling, 1990, Imaging the crust with
seismic tomography: a review, Programme and Abstracts, 22nd General Assem., Eur. Seis. Com., p 81.
Michael, A. J., and D. Eberhart-Phillips, Relationships between fault behavior, subsurface geology, and three-dimensional velocity models, accepted Science, 1991.
Eberhart-Phillips, D., 1991, Using gravity data in inversions for three-dimensional velocity structures, Seismol. Res. Lett., v. 62, p. 19.
Eberhart-Phillips, D., 1991, Overpressure in the Parkfield preparation zone, Seismol. Res. Lett., v. 62, p. 46.
Reasenberg, P.A., 1990, Microclusters and compound clusters (abstract), EOS, v. 71, p 1457-Matthews, M.V., On the performance of the M8 earthquake-prediction algorithm in California,
to be submitted to Science.Matthews, M.V., 1991, Do seismicity patterns predict California mainshocks? (abstract), M.V.
Matthews, A A AS Annual Meeting, Washington, D.C., February, 1991.
320

II.1
FLUID PRESSURE AND EARTHQUAKE GENERATION
Project #9960-04451
Evelyn Roeloffs, Eddie G. Quilty Branch of Tectonophysics
U.S. Geological Survey345 Middlefield Road, MS 977
Menlo Park, CA 94025(415)329-4093
Investigations:
1. Real-time monitoring and processing of water level data from Parkfield, Cali fornia as part of the Parkfield Prediction Experiment. Real-time monitoring of water level data from two sites near Palmdale, California. Processing includes removal of tidal and barometric fluctuations and automatically screening for anomalous signals. A beeper monitoring system provides 24 hour a day notification of water level anomalies near Parkfield.
2. Analysis of water level records and development of theoretical solutions to study response to fault creep, seismic waves, and barometric pressure. Searching of water level data for changes that may be related to to the earthquake genera tion process.
Results:
1. In cooperation with the USGS Water Resources Division, water level data from a network of 11 sites near Parkfield, California were collected throughout the reporting period. Water level data were also collected from two sites in the Mojave Desert. Site locations are shown in Figures la and Ib, and raw water level, barometric pressure, and rainfall data are shown in Figures 2a-e.
2. A paper on the transfer functions relating barometric pressure to water level in the Parkfield area was revised and accepted for publication. Further work has identified sets of data from the Gold Hill site near Parkfield that produce a con sistent transfer function in a limited sub-tidal frequency band. At those frequen cies where the transfer function estimates are well constrained, little frequency dependence is seen. After a best fitting multiple of barometric pressure is sub tracted from both water level and strain data sets, residuals with periods corresponding to frequencies where the transfer funtions are well constrained can be seen. Since the residuals also lie in the band that displays little frequency dependence, a simple multiple of the barometric pressure should have removed these residuals if they were of barometric origin. In particular, the water level and strain residuals seen at Gold Hill three days before the 1985 Kettleman Hills earthquake are not of barometric origin and may be precursors.
3. Two hydrogeologists from the All-Union Institute for Engineering Geology and Hydrogeology, near Moscow, visited Menlo Park to further discuss water level
321

II.1
data from the epicentral region of the December 7, 1988 Spitak (Armenia) earth quake. The data are of special interest because Soviet scientists have identified water level changes in several wells that they believe to be intermediate-term pre cursors to the Spitak earthquake. Discussions continued on clarifying the Soviet scientists interpretation of these data.
4. In cooperation with John Rudnicki and Jitao Yin of Northwestern University, creep-related water level changes at the Middle Mountain site near Parkfield are being interpreted using coupled poroelastic solutions of flow induced by fault slip. Preliminary results suggest the fault plane is impermeable and that the location of the slip zone relative to the well influences the water level recovery time.
Reports:
Quilty, E.G., and E. Roelofls, "Removal of barometric pressure effects from water level data", in press, Journal of Geophysical Research, 1991.
Quilty,E. and E. Roelofls/Correlated Water Level and Strain Signals AfterBarometric Filtering at Gold Hill Near Parkfield, California: Possible EarthquakePrecursors ?', December 1990,EOS,Trans. Amer. Geophys. Union,Vol. 71,Page1473A-
E. Roelofls,'Groundwater Levels and the 1988 Spitak, Armenia Earthquake',December 1990,EOS,Trans. Amer. Geophys. Union,Vol. 71,Page 1454,A.
322
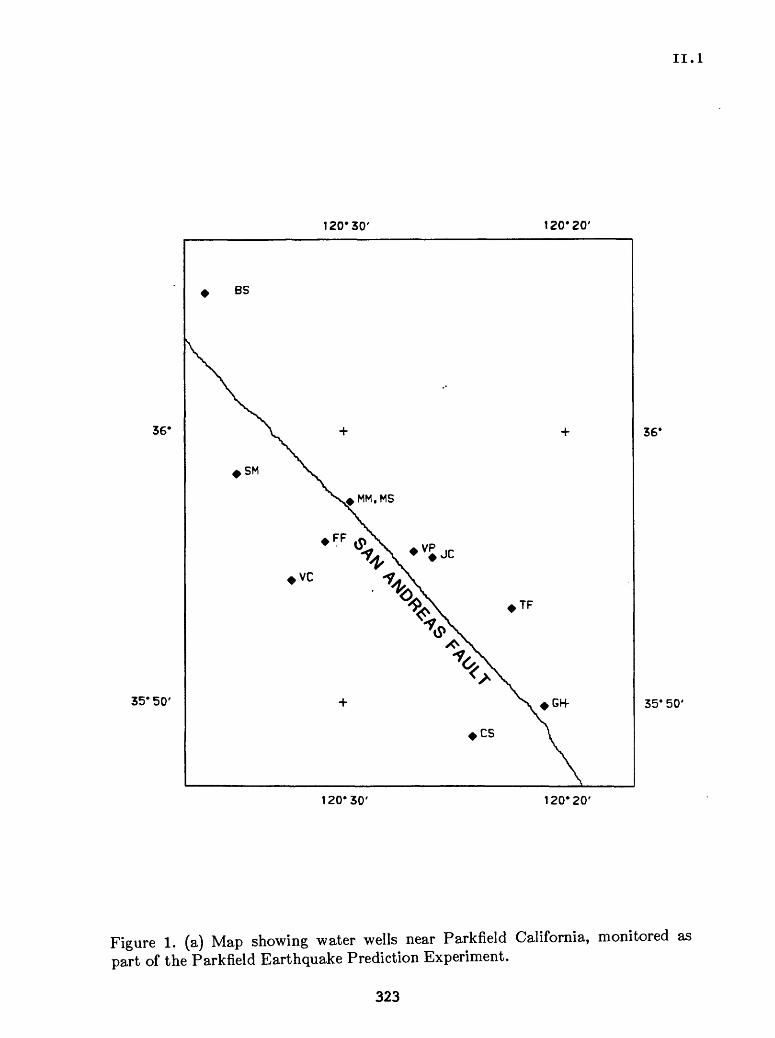
II.1
120*30' 120*20'
36*
35* 50'
BS
vc
TF
GH-
36*
35*50'
120*30' 120*20'
Figure 1. (a) Map showing water wells near Parkfield California, monitored as part of the Parkfield Earthquake Prediction Experiment.
323

II. 1
118*
34* 40'
34*30'
34* 20'
117*50' 117*40'
HV
118* 117*50' 117*40'
117*30'
34*40'
34*30'
- 34* 20'
117*30'
Figure 1. (b) Map showing wells HV and CJ near the Mojave segment of the San Andreas fault.
324
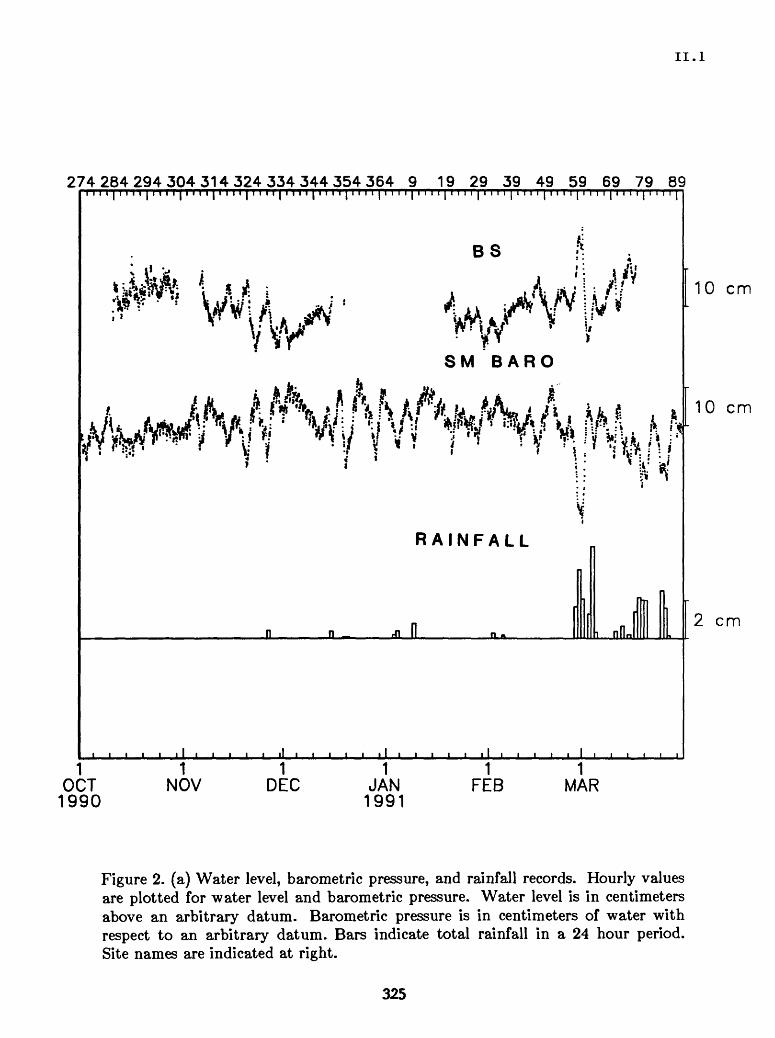
II.1
274 284 294 304 314 324 334 344 354 364 9 19 29 39 49 59 69 79 89i " i " i 1 i " i i i r " i TTT T" i " i " r " i " i i" i
BS
SM BARO
RAINFALL
i nfU
10 cm
10 cm
2 cm
1OCT 1990
1 NOV
1 DEC
1JAN 1991
1 FEB
1MAR
Figure 2. (a) Water level, barometric pressure, and rainfall records. Hourly values are plotted for water level and barometric pressure. Water level is in centimeters above an arbitrary datum. Barometric pressure is in centimeters of water with respect to an arbitrary datum. Bars indicate total rainfall in a 24 hour period. Site names are indicated at right.
325

II.1
274284294304314324334344354364 9 19 29 39 49 59 69 79 89
1OCT 1990
1NOV
M A ,
NeHn-t
1DEC
1JAN 1991
SM
MM
MS
1FEB
1MAR
*10cm
10 cm
10 cm
Figure 2. (b) Water level records plotted as in Figure 2(a).
326

II.1
274284294304314324334344354364 9 19 29 39 49 59 69 79 89I I I I I I I
1OCT
1990
I I ill
1NOV
1 DEC
1JAN 1991
vw
FF
vc
1 FEB
1 MAR
10 cm
10 cm
10 cm
Figure 2. (c) Water level records plotted as in Figure 2(a).
327

II.1
274284294304314324334344354364 9 19 29 39 49 59 69 79 89I I I I | I I I I I I I I I I I I I I I I I II I I I I I I I I T I T ITIT^T Till I I I I I I I I I I 1 I I I I T I T I T II I I I I I I I I I I I I I I I I I I I I I I I I I
» 1 A JC 10 cm
TF
' *Vte !, . * ' = &
cs
10 cm
^V''"v''***^^^10 cm
GH t A
10 cm1(w-"*«-*(ft*^^ JW^
<n^T ^p /
111111OCT NOV DEC JAN FEB MAR 1990 1991
Figure 2. (d) Water level records plotted as in Figure 2(a).
328

II.1
274284294304314324334344354364 9 19 29 39 49 59 69 79 89
i i t il i i i i i i I i i i i i i I i i t i i
10 cm
10 cm
2 cm
1JAN 1991
1 MAR
Figure 2. (e) Water level, rainfall, and barometer records plotted as in Figure 2(a).
329

II. 1
Interpretation of Slip-Induced Water Well Level Changes at Parkfield
14-08-0001-G1691
J. W. RudnickiDepartment of Civil Engineering
Northwestern UniversityEvanston, IL 60208
(708)-491-3411
(For period October 1, 1990 to March 31, 1991)
Objective
Properly calibrated water wells can function as inexpensive and sensitive strainmeters. Solutions predicting water well level changes due to slip are needed to infer fault slip history and distribution from observed water well level changes. Recent solutions for pore pressure changes induced by fault slip have demonstrated that the coupling between deformation and pore fluid diffusion can strongly affect the response of the well to slip, particularly if the well is close to the fault, and, consequently, the inference of fault slip from water well level changes. The objective of this study is to assess effects of coupling between deformation and diffusion on the inference of fault slip from observed water well level changes and to include these effects in the analysis of observed water well level changes at Parkfield.
Results
We have examined coupled deformation-diffusion effects on the recovery of five creep induced water level changes recorded in the deep interval of the Middle Mountain well from January 1989 to July 1990. The observed water level changes are characterized by a sharp drop and a slow recovery with magnitudes of the change ranging from 11 to 15 cm.
In work reported in the abstract by Yin et al. [1990], we used the following function suggested by Wesson [1988] to describe the slip history of the creep events:
The values of UQ , the final displacement, and the constants b and C were obtained from data
at two creepmeters near the well. In more recent work, we have found that the recovery of the water level can be modelled adequately by using a simple step function for the slip history. In other words, the time scale of water level recovery is so slow that the detailed form of the slip increase is not important. The induced pore pressure response is obtained from Rudnicki's [1987] solution for the instantaneous slip on an impermeable plane in a fluid-saturated porous medium. We calculated the pore pressure responses for y = 460 m (the distance of the well from the fault trace), a diffusivity of c = 0.15 m2/s (a value consistent with those inferred from
330

II.1
tidal analysis of the well) and various values x or, equivalently, 0=tan'1(y/x). Comparison of the results with the five observed water level changes indicates that the values of x range from 0 (0=90°) to 322 m (0=55°). This suggests that the main portion of the creep events may have stopped at different distances from the well. Replotting the water level changes (divided by the maximum change) against 4ct/r2 (r2 = x2 + y2 ) with the value of x appropriate for each event diminishes the spread of the data (Figure 1). The calculated results for 0=55° and 0=90° are also shown.
In order to examine the effect of the permeability of the fault plane on the water level decay, we have also calculated the pore pressure induced by a sudden introduction of slip on a permeable plane. Because fluid diffusion across the fault is possible for this case, the pore pressure change for the permeable fault decays much faster than that for the impermeable fault. Although the results for the permeable fault can be made to fit the data by choosing the diffusivity to be very small, the results for the impermeable fault appear to give a better fit.
References
Rudnicki, J. W., Plane strain dislocations in linear elastic diffusive solids, J. Appl. Mech., 54, 545-552, 1987.
Wesson, R. L., Dynamics of fault creep, J. Geophys. Res., 93, 8929-8951, 1988.
Publication
Yin, J., E. A. Roeloffs, and J. W. Rudnicki, Coupled deformation diffusion effects on water level changes induced by fault creep at Parkfield, California (Abstract), EOS, Transactions of the AGU, 43, p. 1474, 1990.
331

Pore Pressure Response vs Water Level Changes
1.00 -i
0.80 -
0.60 -
K>
Q_
0.40 -
0.20 -
0.00 J
i*
0.0
ooooo Event 1 Theta=55°oaaoa Event 2 ......60°AAAAA Event 3 ......70°AAAAA Event 4 ......80°
Event 5 .. ...90°c=0.15 m /s y=460 m
1.0
2.0T
0*0
3.0 4.0
6
H H

II.1
Use of Stress Drop Models to Interpret Geodetic Measurements at Loma Prieta
14-08-0001-G1847
J. W. Rudnicki, M. Wu and L. M. KeerDepartment of Civil Engineering
Northwestern UniversityEvanston, IL 60208-3109
(708)-491-3411
(For period October 1,1990 to March 31, 1991)
Objective
Surface deformation due to slip in the earth's crust is typically interpreted using the well- known dislocation method. Here, we employ an alternative approach in which slip regions are approximated by planar zones of prescribed stress drop (rather than relative displacement, i.e., dislocation). By applying this approach to the observed coseismic geodetic data associated with the 1989 Loma Prieta, California, earthquake, we are able to obtain estimates for the slip induced stress drop and moment, and the critical energy release rate at the termination of rupture.
Results
The Loma Prieta event is modeled as shear slip of an inclined elliptical crack embedded in an elastic half-space. The shear stress drop is assumed to be uniform with a component A ts along the strike and a component AT^ along the dip direction of the fault. The resulting slip is calculated using the method of Lee et al. [1987]. Normal relative displacement over the fault plane, which tends to occur because of the free surface, is constrained to be zero. A fairly large set of forward searches was performed to find the model parameters that give a best fit to the observed coseismic geodetic data [Lisowski, personal communication, 1990] subject to the constraint that the fault geometry agrees roughly with the aftershock locations [Dietz and Ellsworth, 1990].
Reasonable agreement with the deformation data is obtained with a model for which subequal components of stress drop along strike and dip are applied over an oblique fault plane. Table 1 shows the fit of the best model to the geodetic data. For brevity, the data with magnitudes smaller than 35 mm are not shown. The mean misfit to all data is 40.8 mm, about 2.5 times the data error which is about 15 mm. The largest misfit occurs for the line Ipl-lp2. As pointed out by Lisowski et al. [1990], it is likely that this line is affected by local movements, given the widespread surface cracking and secondary faulting observed in the epicentral area [U.S,G.S. Staff, 1990]. The strike, the inclination angle (downdip), the depthof the fault center, the fault length, and the fault width are about N48° W, 75°, 11.5 km, 50 km, and 17 km, respectively. The stress drop components determined by minimizing the difference between the observed and predicted surface deformation are ATS = 1.2 MPa and AT^ = 1.5
333

II.1
MPa. The calculated geodetic moment is 2.5 xlO19 Nm. The maximum energy release rate (energy released per unit area of fault advance) occurs near the top of the fault and is estimatedto be 5.5xl06J/m2 . If it is assumed that the slip propagated according to the criterion that the energy release rate is equal to a critical value, then the estimated value is the critical energy release rate corresponding to arrest of the earthquake. The slip distribution over the fault surface is approximately elliptical. The average slips in the strike and (reverse) dip directions are [us] = 1.1 m and [ud] = 0.9 m, respectively.
The geodetic moment, the dipping angle, and the ratio between strike and dip slip arevery close to those (2.8xl019 Nm, 70°, and 1.3) of Lisowski et al. [1990]. The magnitudes of our strike and dip slip are smaller than theirs (1.6 m and 1.2 m) because our best model prefers a fault geometry having a larger area. If we use the geometry suggested by Lisowski et al., the mean misfit to data is increased to be 64 mm.
References
Dietz, L. D., and W. L. Ellsworth, The October 17, 1989, Loma Prieta, California, earthquake and its aftershocks: Geometry of the sequence from high-resolution locations, Geophys. Res. Lett., 17, 1417-1420, 1990.
Lee, J. C., Farris, T. N. and L. M. Keer, Stress intensity factors for cracks of arbitrary shape near an interfacial boundary, Engn. Frac. Mech., 27, 27-41, 1987.
Lisowski, M. J., W. H. Prescott, J. C. Savage, and M. J. Johnston, Geodetic estimate of coseismic slip during the 1989 Loma Prieta, California, earthquake, Geophys. Res. Lett., 17, 1437-1440, 1990.
USGS Staff, The Loma Prieta, California, earthquake: An anticipated event, Science, 247, 286-293, 1990.
Publication
Wu, M. and J. W. Rudnicki, Use of stress drop models to interpret geodetic measurements at Loma Prieta, California (Abstract), presented at Fall AGU Meeting, 1990.
334

Table 1. Model Fit to Geodetic Data
II.1
Station - Station Observed (nun)
Calculated (nun)
Residual (mm)
Geodolite Line Leneth Changes
allisonamericanamericanbielbielbielbmt rfbutanobutanobutanogilroyhamil echamil ecllagasllagasloma useallisoneagle rkhamiltonlomadwrIplIplbrush 2brush 2chamberfremontgilroyjuanIplfremontcanadacanadafairviewgilroygilroycanadap2P3p3p4
bmt rfhamiltonloma useeagle rkloma usemindegoloma usedumpeagle rkpomllagasllagassheeprm2Iplsheeprm2mindegolomancerlomancerlomancerpr61P2Ip4fremontmulliganvargojuanjuanmulliganvargosargentfairviewsargentgilroysargentsheeprm2gilroyP3p4P5P5
-3975-66101235
-107176-39-95-46-4837
-42-54
7417510925951
-274-40
-212-18
4912342-63-36
-20454-39-86-68-89-69-5144666646
.2
.0
.5
.5
.4
.5
.2
.7
.2
.2
.5
.3
.1
.0
.3
.0
.0
.7
.1
.1
.9
.0
.1
.4
.9
.5
.4
.8
.0
.2
.3
.3
.2
.9
.8
.9
.6
.6
.6
.0
±±±±±±±±±±±±±±±±±±±±±±±±±±±±±±±±±±±±±±±±
11.9.7.7.
11.8.
18.5.5.
11.7.8.
12.6.
11.12.8.5.6.
20.5.7.
10.6.7.6.
11.8.
15.12.12.25.13.12.11.7.
23.14.23.11.
8482681751997098080129092047392076151013
-25.52.
-32.60.
218.-98.106.-32.-56.-32.-50.
3.-24.
5.14.
122.78.
202.52.
-236.146.
-221.-9.
30.127.
6.-33.-13.
-239.-15.-8.-1.
-19.-16.-19.-8.-5.
5.11.6.
1783419329849069156941719382060431075233
-14.22.
-33.41.17.-9.
69.-7.
-39.-13.
2.33.
-17.-59.
59.52.30,57.-1.
-37.-187.
9.-8.
19.-4.
36.-29.-23.
35.69.
-31.-84.-48.-73.-50.-43.
50.61.55.39.
1372043403392071925231430266083998821437
Table 1. (continued)
335

II.1
GPS
GPS
GPS
P5p5p7P5
East
IplIplIplIpl
North
IplIplIplIpl
Up
IplIplIplIpl
Total Mean 1
p6P7p8chamb 2
allisoneagle unhamiltonbrush 2
allisoneagle unhamiltonbrush 2
allisoneagle unhamiltonbrush 2
£ ms £ j_ L-
87-4373
-41
342256541
-110-205-106-229
-105-211-114-40
J. UI0 /
.3
.3
.7
.8
.8
.2
.6
.3
.6
.4
.6
.2
.5
.8
.4
.0
±±±±
±±±±
±±±±
±±±±
13.13.10.12.
5.11.7.
15.
3.5.2.4.
33.24.25.27.
- 40.8
7560
9806
8666
4758
mm
-0-98
-7
702436678
-103-145-96
-205
-139-202-131-143
.8
.6
.0
.3
.2
.6
.0
.4
.7
.3
.2
.1
.1
.6
.4
.4
88-3365-34
-35-18-0
-37
-6-60-10-24
33-917
103
.1
.7
.7
.5
.4
.4
.4
.1
.9
.1
.4
.1
.6
.2
.0
.4
Observed Changes are given with the conventions: Post-Seismic value -Preseismic value, and Station B - Station A.
336

II. 1
Hydrogen and Other Non-Radon Geochemlcal Monitoring
Project * 9980-02773
Motoak1 SatoBranch of Igneous and Geothermal Processes
U.S. Geological Survey, MS-959, Reston, VA 22092(703) 648-6766, FTS 959-6766
INVESTIGATIONS
We continuously monitor soil hydrogen at 1.5 m depth along the San Andreas fault and Calaveras fault 1n central California. There are 4 telemetered monitoring sites 1n the Hoilister area, and 7 sites 1n the Parkfleld area, of the latter 5 sites are equipped with duplicate sensors Installed 17 m apart.
We also continuously monitor water conductivity, dissolved CO?, and dissolved H£ of pumped water from two wells, one drilled Into the San Andreas fault zone and the other about 500 m from the fault.
RESULTS
Soil Hydrogen
1. Hoilister Area:
Telemetered data from 4 sites (Shore Road, San Juan Bautlsta, denega Winery, Melendy Ranch) are shown 1n F1g. 1.
Shore Road: This site showed less than 10 ppm Increases between Nov 5 and Nov 25. The sensor was tested on Nov. 26 by Injecting 0.1% Ho Into the ground. The discontinuous change on this date was caused by this test. There was a 15-ppm peak on Mar. 5, and 4 smaller peaks until Mar. 27. These peaks occurred during the heavy rainfalls which caused "oscillatory" slips that are characteristically observed at this site. The oscillatory slips are probably dllatlonal movement of the fault, the opening motion appearing as a right lateral slip and the closing motion as a left lateral slip because of the way the creepmeter 1s configured (Sato, 1986, JGR). Regardless of the exact mechanism for the H2 Increases, these hydrogen peaks are rain-Induced Inasmuch as the oscillatory slips are rain-Induced.
San Juan Bautlsta: This site had not recorded any H2 event since January 1990 until Nov 26, when a series of Irregular H2 Increases began to appear as shown 1n F1g. Ib and F1gs. 2a - 2e (1n expanded time scale). The first two smaller peaks that occurred shortly before midnight of Nov 26 (GMT), however, are the results of Injection of calibration gas. Because the shapes of the peaks that followed were so Irregular, artificial causes such as unstable air cells were suspected Initially and thus reported. Field Inspection 1n early April showed that the monitoring system was functioning properly and the peaks recorded were probably natural. A M 4.7 earthquake took place at about 5 km NE of Watsonvllle (about 20 km NNW of San Juan Bautlsta) on March 23, 1991. This site 1s located at the northern end of the current soil H2 monitoring network and recorded a clear anomalous H2 peak about a month before the M-5.1 earthquake
337
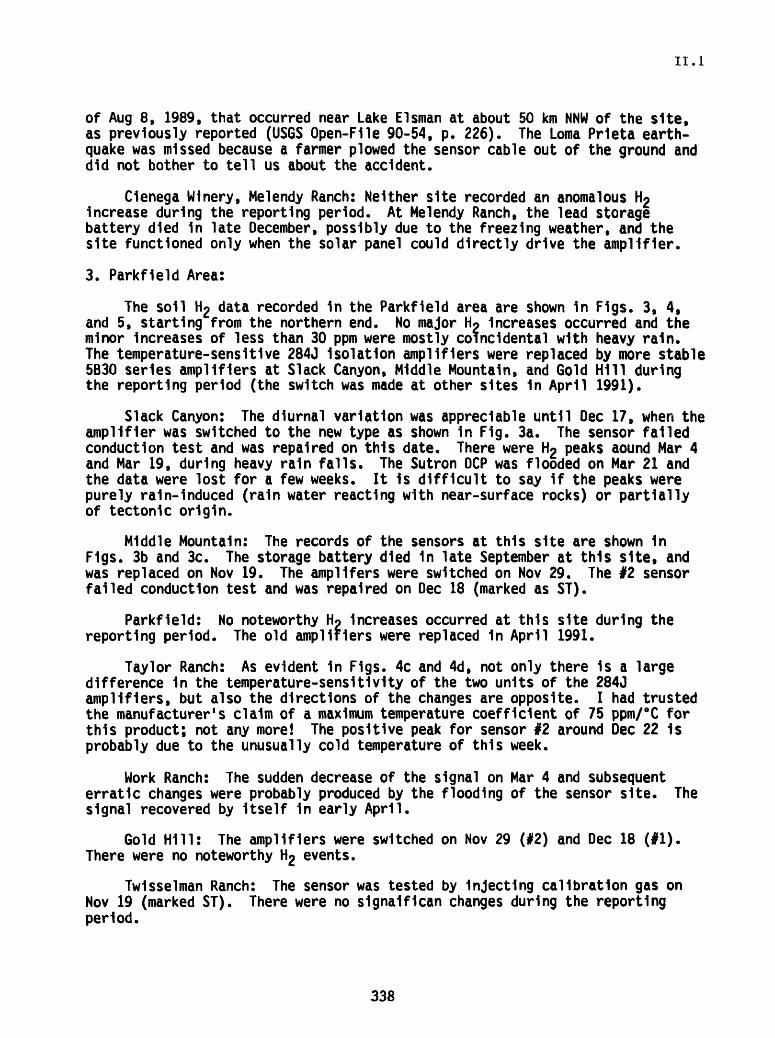
II. 1
of Aug 8, 1989, that occurred near Lake Elsman at about 50 km NNW of the site, as previously reported (USGS Open-File 90-54, p. 226). The Loma Prleta earth quake was missed because a farmer plowed the sensor cable out of the ground and did not bother to tell us about the accident.
Clenega Winery, Melendy Ranch: Neither site recorded an anomalous H2 Increase during the reporting period. At Melendy Ranch, the lead storage battery died 1n late December, possibly due to the freezing weather, and the site functioned only when the solar panel could directly drive the amplifier.
3. Parkfleld Area:
The soil \\2 data recorded 1n the Parkfleld area are shown 1n F1gs. 3, 4, and 5, starting from the northern end. No major Ho Increases occurred and the minor Increases of less than 30 ppm were mostly coincidental with heavy rain. The temperature-sensitive 284J Isolation amplifiers were replaced by more stable 5B30 series amplifiers at Slack Canyon, Middle Mountain, and Gold H111 during the reporting period (the switch was made at other sites 1n April 1991).
Slack Canyon: The diurnal variation was appreciable until Dec 17, when the amplifier was switched to the new type as shown 1n F1g. 3a. The sensor failed conduction test and was repaired on this date. There were H2 peaks aound Mar 4 and Mar 19, during heavy rain falls. The Sutron DCP was flooded on Mar 21 and the data were lost for a few weeks. It 1s difficult to say 1f the peaks were purely rain-Induced (rain water reacting with near-surface rocks) or partially of tectonic origin.
Middle Mountain: The records of the sensors at this site are shown 1n F1gs. 3b and 3c. The storage battery died 1n late September at this site, and was replaced on Nov 19. The amplifers were switched on Nov 29. The 12 sensor failed conduction test and was repaired on Dec 18 (marked as ST).
Parkfleld: No noteworthy Ho Increases occurred at this site during the reporting period. The old amplifiers were replaced 1n April 1991.
Taylor Ranch: As evident 1n F1gs. 4c and 4d, not only there 1s a large difference 1n the temperature-sensitivity of the two units of the 284J amplifiers, but also the directions of the changes are opposite. I had trusted the manufacturer's claim of a maximum temperature coefficient of 75 ppm/°C for this product; not any more! The positive peak for sensor 12 around Dec 22 1s probably due to the unusually cold temperature of this week.
Work Ranch: The sudden decrease of the signal on Mar 4 and subsequent erratic changes were probably produced by the flooding of the sensor site. The signal recovered by Itself 1n early April.
Gold H111: The amplifiers were switched on Nov 29 (12) and Dec 18 (II). There were no noteworthy H2 events.
Twlsselman Ranch: The sensor was tested by Injecting calibration gas on Nov 19 (marked ST). There were no s1gna1f1can changes during the reporting period.
338

II.1
Water Geochemistry
1. laylor Ranch:
Water conductivity, dissolved C02 , and dissolved Ho data are shown 1n F1g. 6. Cumulative rain data collected at FUnge Flat are also shown (F1g. 6d). The ganged metering bellow pump, which regulates the water/air mixing ratio 1n the degassing chamber and which frequently breaks down, was replaced by a new dgal diaphragm-pump, which 1s rated for continuous duty, on Nov 27. There were peak- like changes at around Dec 22, but these were probably caused by overcompen- satlon of the temperature correction circuitry for the conductivity sensor and C02 monitor during the pre-Chr1stmas cold spell.
2. Miller Ranch:
The old pump was replaced by the new type on Nov 21 and the flow rate was readjusted on Nov 27 (F1g. 7). Because of the kink 1n the water supply hose, the pump was stressed and broke down on Feb 3. The data after this date are not valid for dissolved gasses. The water conductivity sensor 1s placed 1n the upstream of the metering pump and 1t works as long as water 1s supplied from the well. The variation of the dissolved Ho sensor signal (F1g. 7c) seems to be domlnantly caused by temperature variation; this 1s Indicated by Its similarity to the temperature data recorded at Gold H111 (F1g. 7d). A1r-cond1t1on1ng of the Geochemistry Shed will take care of the problem.
339

100 h3sh: S3 Sep 1990 263 - 03 Apr 1991 093
I I I I I I I 1 I I I I Ioct nov dec 1991 feohSsj: 33 Sep 1990 268 - 03 Apr 1991 093
1800-
0 ti d ..rflr
1951I i i i j i i i r
act nav d«c 1951 feb1QO h2cw: S3 Sep 1990 268 - 03 Apr 1991 093
r i i 91oct nov dec 1991 feb
hHmr: S3 Sep 1990 S68 - Q3 Apr 1991 093
II.1
-UJtV
I f nrar
Fig. la
Shore Road
apr
Fig. Ib
San Juan Bautista
1 I I ,mar apr
Fig. Ic
Cienega Winery
mar apr
Fig. Id Melendy Ranch
i r F | i i i i i r r oct nov dec 1991 feb
i | r i | mar apr
(Fig. 1) Soil hydrogen data recorded in the Hollister area from October 1990 to April 1991.
340

10Q3_
26 27 S9 : 32 Dec 1990 336 - 10 Dec 1950 338
1000.
10h3aj: 03 Jan 1991 003 - 32 J«n 1591 025
1000.
10h2a j: 33 F«b 1991 836 - 10 F«ta 1991
1000.
6 7 8 9 10 11 : 28 F«b 1991 093 - IS ««r 1331 074
1000.
_k L
II.1
1VJ -V^ ^1^1. ,
t
20
JJL
Fig. 2a
Dec 26-29,
Fig. 2b
Dec 02 - 14
Fig. 2c
Jan 03 - 22,
Fig. 2d
Feb 05-14,
13 14
Fig. 2e
Feb 28 - Mar 15,
(Fig. 2) Soil hydrogen data recorded at San JUan Bautista plotted in expanded time scale.
341

II.1
100 h2sc: 33 See 1930 258 - 05 Apr 1991 095
old ampnew amp
octI
novI ' '
dsc 19
Fig. 3a
Slack Canyon
I ' ' i i i feb mar apr
hSmm: 22 Nov 1990 326 - 09 Apr. 1 jl 099
100 _
new amp
II
|ii i . . , i i | r Tdec 1991 ieti mar apr
h2m2: 22 Nov 1993 326 - OS Apr 1991 095
130 _
new amp ST
Fig. 3b
Middle Mountain Sensor #1
| i i | i r ^ f«b mar apr
Fig. 3c
Middle Mountain Sensor #2
dec 1991
(Fig. 3) Soil hydrogen data recorded in the northern section of the Parkfield
area. Prior to Nov. 22, the Middle Mountain site was not operational,
342

II.1
hepk : e5 Seo 1990 £58 - 05 ftcr 1591 095
1QG _
0
10Q _
0
2QQ .
1QQ .
0
20a .
0
old amp
j i i | i i i ' i 1 ' ' 1 ' ' i ' ' |oct nov dec 1991 feb mar apr
hpk2: 25 Sep 1920 2S8 - 05 Apr 1991 095
old amp
iWf^^I i i i i i , i i | i i j i i i i i |
oct nov dec 1951 -feb mar apr htal: S5 Sep 199Q 268 - Q3 Apr 1991 093
old amp
i
1 i i | i i |ii 1 ' ' I ' ' 1 ' ' oct nov dac 1391 feb mar apr
hta2: 25 Sap 1990 258 - 05 Apr 1991 095
old amp
MJfajM,jiiyuM^^
Fig.4a
Parkfield Sensor #1
Fig. 4b Parkfield Sensor #2
Fig. 4c Taylor Ranch Sensor #1
1Fig. 4d Taylor Ranch Sensor #2
oct dac 19 feb mar apr
(Fig. 4) soil hydrogen data recorded in the central section of the Parkfield area. The diurnal changes are mostly due to the temperature effect on the old amplifier 284J.
343

II.1
ICO-
10Q
old amp
i9 i '1991 fio aar : 82 Nov 159B 355 - B3 ftpr 1991 893
old amp
i '1281
' I « I mar
Fig. 5a
Work Ranch Sensor #1
Fig. 5b
Work Ranch Sensor #2
10B ^ 22 Nov 199^ 32S - B3 Apr 1991 B93
new amp
, i91die 1591 fib mar
IQQ hghZ: ZZ Nov 199fl 356 - B3 ftpr 1991^95
oldamp
new amp
i ' ' idie 1S91 .
,11,, fib mar
old ampS.T.
inov
I die
r^tFig. 5c
Gold Hill Sensor //
I aor
Fig. 5d
Gold Hill Sensor #2
laor
Fig. 5e
Twisselman Ranch
I > I ' I ' | 1981 tift mar apr
(.Fig.5) Soil hydrogen data recorded in the southern section of the Parkfield area from Nov 22, 1990, to April 1991.
344
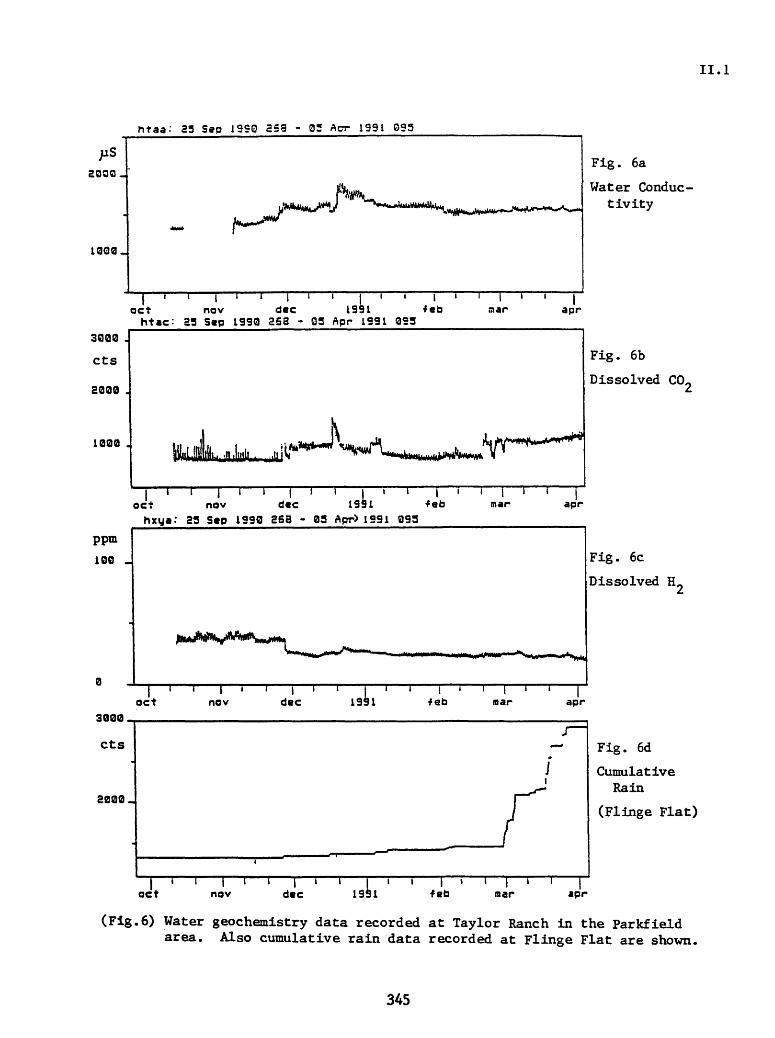
II.1
htaa: 23 Sap 19SO 253 - « Acr 1991 095
jiS
2000 -I
1QOQ.
Fig. 6a
Water Conduc tivity
i i91act nov dec 1991 *eb
htac: 03 Scp 199Q 2S3 - 33 Apr 1991 Q93mar apr
3000 4
cts
2300 .
1000 . tLunk. .n. iita'^tfA'"*1" <^
Fig. 6b
Dissolved CO,
i 1191oct nov dec 1991 -feb
hxya: 23 S«p 1990 263 - B3 ftpr> 1991 093
apr
ppm
100 J
0
3000.
cts
2000-.
] i i | i ij r oct nov dec 1991
' l
Fig. 6c
Dissolved H.
mar apr
Fig. 6d
Cumulative Rain
(Flinge Flat)
oct nov dec 19 febi 7
mar apr
(Fig.6) Water geochemistry data recorded at Taylor Ranch in the Parkfield area. Also cumulative rain data recorded at Flinge Flat are shown
345

II.1
hmia: 32 Seo 1990 =53 -
pS
2030 .
1303
2000.
cts
1000.
MY^
1 ' ' oct
hmic: 23
.li
oJt
III'
hmi
HOC .ppm
100 J
lly 1
i i
i: 23
^JMl . !l
l!im*^*** j
T
L j 1 %Jrwf W ,jtf*^^
^-«^^ ^^Vu^u^^
lu
| i i | i i i t i (ii nav dec 1991 feb Sep 1990 2S8 - 05 Apr 1991 095
pump j. fixed
lijyL *L
V\Li
i i i j i inav dec
pum
bro
P
ker
,
1991 feb
1 ' ' Imar apr
Li *
i ' ' 1mar apr
Fig. 7 a
Water Conduc tivity
Fig. 7b
Dissolved CO-
Sep 1990 268 - 05 Apr 1951 3S-3
kjiltij K '!( L «I li iiiUK 1. U.. I
;
Fig. 7c
Dissolved H~
' ' I ' ' ioct nav dec 1991 fac mar hgh3: 53 Sep 1990 268 - 33 ftpr 1391 095____________
apr
30
SO
10
o
Fig. 7d
Temperature
(Gold Hill)
-jii1iI|ir act nav dac
i 1 j i l | I I | feb mar apr
(Fig. 7) Water geochemistry data recorded at Miller Ranch near Parkfield, Temperature data reocrded at Gold Hill are also shown.
346
II.1
Aseismic Creep and Crustal Deformation of Large Normal Faults Implications from the Teton Fault
14-08-0001-G6197
Arthur G. SylvesterDepartment of Geological Sciences, and
Institute of Crustal StudiesUniversity of California
Santa Barbara, California 93106(805)893-3156
OBJECTIVE
This is a joint investigation in cooperation with Dr. Robert Smith (University of Utah). The objective of my part of the investigation is to determine whether or not aseismic vertical creep is presently occurring across the central segment of the Teton fault as inferred from our two precise leveling surveys in 1988 and 1989. The 1991 survey will duplicate the first two surveys as closely as possible in terms of methods, equipment, standards, climate, and procedures.
RESULTS
We have begun preparations for the fieldwork which will take place in late August, 1991, including calibration of leveling rods, the mustering of personnel, and acquisition of reservations and permits.
347
II.1
An Absolute Long-Base Tiltmeter with Vertical Anchoring
14-08-0001-G1336
Frank K. Wyatt, Hadley O. Johnson,Mark A. Zumberge, and Duncan Carr AgnewInstitute of Geophysics and Planetary Physics
University of California, San DiegoLa Jolla, California 92093-0225
(619)534-2411
This just-ended grant has supported work on the design, construction, and development of a long baselength tiltmeter intended for use in crustal deformation studies, with emphasis on the means by which these instruments might be anchored to depth. The work has included monitoring and evaluating various systems against the existing instruments at Pinon Hat Obser vatory (PFO). In general for long-base tiltmeters to be useful in crustal deformation measure ment, they must be stable, engineered for ease and reliability of use, and suitable for installa tion in a variety of locations. We have been working toward these ends for the past few years, with most of our recent efforts focussing on field testing of equipment designed to operate unattended with minimal cost to the quality of the data. Construction of a new 550-m long- base tiltmeter with optical-fiber anchoring was completed in January, 1990. Since that time we have tried various modifications on the instrument, and are currently working on a manual describing its construction and noise characteristics.
To repeat some of what was presented in our previous report: the most difficult problem in the development of highly stable systems for deformation measurement is deciphering what pan of the observed signals are due to the earth and what part due to instrument instability. Development work at PFO benefits from the number of high quality instruments there a situa tion that makes possible the direct comparison and evaluation of new systems. In this case, however, the new instrument was constructed to fulfill two roles: first as a test system, and second as an earth-monitoring system complementary to existing measurements at the site. For this second purpose it was installed orthogonally to the existing pair of extremely stable EW long-base tiltmeters (parallel ones, run by L-DGO and UCSD). To some degree this arrange ment limits what we can say. Nevertheless we can demand similar-quality signals from the different measurement systems and interpret any degradation in either short-term noise or long-term stability as a weakness of the noisier/less-stable system.
Figure 1 presents some data from the UCSD long-base tiltmeters at PFO, and shows the relative quality of the various components. The top two traces are, in effect, from the same instrument: the upper one from the original (-1982) EW instrument, 535 m in length, and the lower from its extension to 651 m (funded by this grant sequence). These two records agree quite well, suggesting both that extended instrument (with its "new design" sensors at one end) is functioning properly and that the ground is tilting uniformly. The bottom trace presents the record of the new NS instrument Overall, the new, fully automated systems and the older
348

II.1
manual tiltmeter appear to behave about equally well. Most of the gaps evident in the record are related to continued work on the end vaults. The long-term tilt rate for the new instrumen tation is comparable to that of the older system, and the short-term noise (days and shorter) only slightly worse. As we have found for all the instrument at Pifton, anchoring of die end- monuments is critical to achieving long-term stability. Though the optical-fiber anchors for the NS instrument extend to substantial depths, the short dataset presented here has been corrected for end-monument motion using only the shallow mechanical-anchoring measurements (extend ing to depths of 5.4 m). The fibers are more affected by the annual temperature cycle than we anticipated (-50 |im P-P; see below) and we are still working on the best means to remove their temperature cycle.
Figure 2 presents recent observations from the vertical optical-fiber anchoring experi ments in the two end-vaults of the NS tiltmeter: UPL and CHI. For UPL, the figure presents integrated strain for two depth intervals under the test vault: one (FOA6) from 5.4 m to a depth of 10.4 m and the other (FOA7) to 50 m. For CHI, the integrated strain is shown for the depth range of 5.5 m to 30 m. This figure also shows the ground temperature at a depth of 0.5 m, and makes quite clear that all the (vertical) fiber anchors show large annual cycles, reflecting the integrated temperature effect over some depth. Since each has a different phase relative to the near-surface temperature, the thermal environments must be different and the fiber response is not yet easily predicted. With the almost two years of data shown here we can begin to separate long-term drift from the annual cycle.
A related fiber-anchoring project at PFO is the horizontal-monitoring system installed at the south end of the NS strainmeter. (This was built under an earlier NSF grant) The south end end-monument was previously the least stable of the six laser strainmeter end-monuments at the observatory. Figure 3 shows data from the installation: an equal-arm optical-fiber anchor system extending to 25-m depths down a pair of oppositely oriented, slanted holes, each drilled 30° from vertical. The record presents the strainmeter data before and after application of this end-monument motion correction, along with the correction itself. (The north end-monument of this strainmeter is not anchored to depth.) This certainly suggests that this method of anchoring is doing its job. There is no obvious annual cycle in the corrected strain data presumably because the fiber measurements are made in two similarly slanting boreholes such that the thermal environment of the two arms is similar. Overall, for horizontal anchoring, the efficacy of optical-fiber anchoring for long-base deformation monitoring seems to be well esta blished, while for vertical anchoring still more work is needed.
349

Long Base Tilts at Pinon Flat Observatory - 1990
1.0
0.8
-o 0.6 o
0.4
0.
EW Tilt (107.3°) 535 m
EW Tilt (106.3°) 651 m
NS Tilt (0.3°) 550 m
Daily Precipitation 20 cm/full-scale
. ft , j___ii t I II I ,______I M .1_______I_______I
40 80 120 160 200 Time (day number 1990)
H H
240

Dis
pla
cem
ent
Dis
pla
cem
en
t
o
oro
o
oo
o
o
oen
O
O
I
O
2J,
N*
O D10 00 10
D
O
IT
O
^J^
D*
IQ
Q. §:
o(D O
O o O D O IT O 5* (Q
H

II.1
Pinon Flat Observatory: Comparative Studies and Geophysical Investigations
14-08-0001-G1763
Frank K. Wyatt, Duncan Carr Agnew,and Hadley O. Johnson
Institute of Geophysics and Planetary PhysicsScripps Institution of OceanographyUniversity of California, San Diego
LaJolla, CA 92093-0225(619)534-2411
This grant provides support for collaborative studies with several USGS-sponsored inves tigators conducting research at Pinon Flat Observatory (PFO). The initial aim of this work was to evaluate instrumentation developed for the measurement of ground deformation, the idea being to operate simultaneously a number of continuously recording sensors and small geodetic arrays, and, by direct intercomparison, to identify the merits and limitations of the various tech niques. As instrument work has progressed the focus of the work has naturally shifted to the use of the combined results to learn more about the earth. Good progress has been made in evaluating the instruments in a common setting and in establishing better bounds on the behavior of the crust in this technically active area.
One of the longer-running comparison projects at PFO has been the operation of parallel long-base Michelson-Gale tiltmeters by ourselves and by the Lamont-Doherty group. These are, so far as we know, giving the best long-period tiltmeter data anywhere. Figures 1 and 2 show the data from both instruments. Except for the large and long-lasting artifact produced when the 115-m extension tube was added in late 1986, and fluid of a slightly different density mixed with that originally used, the EW UCSD instrument gives a very smooth record, with variations less than 0.1 jirad about the mean trend. What this means is that a year of such data (as we now have for a NS instrument as well) gives a better estimate of secular tilting than even several years of geodetic leveling over distances of tens of km.
What is most exciting in Figure 1 is the apparent general agreement between the Lamont-Doherty instrument records and those from the UCSD instrument: both showed the same high tilt rate in 1985-1986 of 0.2 jirad/yr and now show a near zero rate of about 0.02 uiad/yr. Since these two 535-m long instruments, are only separated by 15 m, they might be reacting to localized effects such as ground-water changes, though the local water-level records do not suggest this. One data source not yet fully examined is the "hydraulic ties" between the paired vaults at the two ends of the tiltmeter, these ties are short (15 m-long) half-filled tubes, which extend the LOGO tiltmeter conduit onto the UCSD optics table. Measuring the LDGO water height on the UCSD table and in the LDGO end-vaults ties the tilt results together, and will allow us to identify the source of the disagreements that are clearly present at periods of less than a year. Thus, although there remain a number of issues to sort out, we expect that we will be able to do so; and, in the end, learn from them not just lessons that can be applied to any future tiltmeter deployments, but also some definite facts about vertical deformation at this site.
352

II.1
A particularly exciting prospect in geodetic studies these days is the comparison of GPS with other types of measurements. We have begun to pursue this as a cooperative effort with Dr. John Langbein, using the USGS Two-Color EDM data from the networks around Pinyon Flat. These networks offer many lines that can be occupied by both EDM and GPS systems. Over the span of this network (-10 km), the Two-Color system is the most precise available, with 1 mm or better precision better than has been shown for GPS. A systematic comparison of the two should teach us about both systems.
Another area of current interest in GPS measurement is the question of what size signal can be detected over short baselines given continuously recording receivers. Since the spring of 1990 a continuously-operating GPS network (the PGGA) has been running in Southern Cali fornia over baselines of -100 km (Bock and Shimada, in Global Positioning System: An Over view, Sringer-Verlag, 1990). A much shorter scale is of interest for fault studies, and we, like many others, have been eager to try the experiment of a "GPS strainmeter": two receivers, operating continuously, separated by about 10 km. Together with Dr. Yehuda Bock, we have begun such measurements with the goal of interpreting the results in terms of the deformation patterns already known for the area from USGS Geodolite, USGS Two-Color and UCSD laser strainmeter records.
This new GPS line extends west from PFO to a site 13 km away in Pine Meadow. As always, logistics dictated much of our choice; we sought a secure location (hence on private property) with large rock outcrops so mat we could initially use a simple rock-bolt for the monument. The site we have chosen is just outside (east) of the mapped San Jacinto fault zone, but still within the region of strain accumulation as shown by long-term Geodolite meas urements. We have installed one of the SIO Trimble receivers there, connected to a PC which, using software from Trimble, operates the receiver as a continuous tracker, a high-speed modem is used to download the data nightly into the same computer at IGPP which collects the other PGGA data. Our ultimate aim is that at least the initial processing of this signal will be done as part of the PGGA effort. The PFO end of the line is operated similarly using a UCLA Trimble receiver, installed on a deeply-anchored geodetic mark. Dr. Dave Jackson has volunteered the UCLA receiver as part of the cooperative exercise which involves several agencies. We plan to keep this line running continuously for at least a year, after which time we intend to move the remote receiver to another location one giving us a much shorter base line. (We would have preferred to do this study in the other order, but field-preparation costs dictated that we do the longer line first) Data from these baselines should serve several pur poses, but most importantly they will allow for detailed error analysis of the day-to-day GPS results and precise monitoring of local fault-zone activity.
353

II.1
TJ O
Long-Base Tilt ©107.3° - Pinon Flat Observatory
1 - North Polm Springs EO
2 - Superstition Hills EQ
1984 1986
Time (year)
1988 19-90
Figure 1
TJ O
Long-Base Tilt @107.3° - Pinon Flat Observatory
Corrected Tilt
L-DGO
Daily Precipitation Vi, 4 cm/div
1 - North Palm Springs EO
2 - Superstition Hills EQ
f drilling
ill i. Ml. J.,ill.1984 1986
Time (year)1988 1990
Figure 2
354

II.1
Pinon Flat Observatory: A Facility for Studies of Crustal Deformation
14-08-0001-G1764
Frank K. Wyatt, Duncan Carr Agnew,and Hadley O. Johnson
Institute of Geophysics & Planetary PhysicsScripps Institution of OceanographyUniversity of California, San Diego
LaJolla, CA 92093(619)534-2411
This grant supports the operation of Pifion Flat Observatory (PFO) as a research center for the study of crustal deformation. Through this grant, the U.S. Geological Survey provides 50 percent of the funding needed both for running the 160-acre facility and for maintaining the reference-standard instruments there. Matching funds are provided by a grant from the National Science Foundation. The work done at PFO includes establishing the accuracy of instruments designed for measuring various geophysical quantities by comparing results from them with data from the best available continuously recording deformation monitors. Such comparison then provides for an accurate record of strain and tilt changes in the area near the observatory, between the active San Jacinto fault and southern San Andreas fault systems. All of this effort is intended to foster development of precision instrumentation and from this an improved understanding of the earth. Particularly for crustal deformation studies, more accu rate measurements are needed for a better understanding of the mechanics of faulting. The site continues to be utilized by roughly 20 different research teams, with some recent efforts focus ing on GPS and seismic correlation/waveform studies.
Figure 1 shows the many geodetic monitoring networks in the immediate vicinity of PFO. The USGS Crustal Strain Program has used a single-color EDM (Geodolite) to monitor strain around the observatory since 1973. More recent additions include the fan-shaped net work of the USGS two-color EDM (Tetrameter), some GPS points observed by the National Geodetic Survey and the MIT et al. Salton Trough/Riverside County cooperative surveys since 1986 (solid dots), and a USGS/NGS leveling line (solid line with dots). Over the next few years, the single-color EDM measurement program is to be phased out in this area in favor of GPS, because of GPS's lower cost and nearly equal precision of observation. This is espe cially true because access to some of the monuments in the existing local network depends heavily on use of a helicopter (needed for the Geodolite work, but an extra expense for GPS). GPS receivers makes it possible for us to take over the geodetic monitoring of "Pinyon Net work," and we have taken the first steps toward doing this. Providing long-term geodetic strain monitoring fits into the facility operation because it, like other data we collect, provides a reference standard for measurements of strain.
The USGS group made its (perhaps) final Geodolite measurement of the Pinyon Network in May of 1991. Working with the USGS team, simultaneous GPS measurements were made using a combination of USGS Ashtech and Scripps Trimble receivers. The asterisks and dashed line in the lower drawing outline the outer extent of the GPS strain-monitoring network
355

II.1
that was observed. Two of the EDM monuments (Lookout and Toro, the two southernmost ones) were used in this new network. In three other cases this was not possible because of access problems, so we established new GPS marks close by. The USGS team, led by Karl Gross, provided use of their helicopter to transport the receivers to Lookout and Toro on April 30, at the end of their first day of EDM observations. The first full day of GPS observations on the new network was May 1, with eight receivers observing for seven hours (five portables around the periphery of the network, plus three continuous trackers: two (one Ashtech and one Trimble) at PFO, and another at Pine Meadow, 13 km to the west). EDM measurements planned for that day had to be abandoned because of extremely strong winds. On May 2, seven Scripps-run receivers observed another full session (except for Toro and Lookout, which had to be removed a few hours early again because of the winds). The USGS group (again via helicopter) set up their Ashtech receivers at four EDM points we do not expect to be able to occupy again, providing us with the data necessary to from a tie between the old and new reference network, through a very-long-distance eccentric reduction. (The EDM monument Sheep, southeast of PFO, was not observed with GPS).
We plan to analyze these data in the near future (Trimble and Ashtech together), and will then be ready to help with other strain surveys planned for the area by the USGS and others. All this will enable us to continue to track the longest-period strain accumulation near the observatory complementing the high-resolution, short-term monitoring of the long-baseline instruments there.
v TJl

II.1
Deformation Networks near PFO
TJ 3
o
33.9
33.8 - :
33.7 -
33.6 -
33.5
33.4 -
33.3 -117.0
-*:;-'-... i ..- "' " /
-116.8 -116.6 -116.4 East Longitude
-116.2 -116.0
33.75
33.70
33.65
o 33.60
GPS point ("PFO polygon" Geodolite net replacement) _
Continuous GPS line (begun April 1991)
// Existing ../ GPS point
33.55
33.50
Twov-color EDM j Level lineGeodolite line
-116.60 -116.50 -116.40 -116.30East Longitude
II.1
Seismic Quiescence as an Earthquake Prediction Tool
Agreement No. 14-08-0001-G1962
Max Wyss and R.E. HabermannCooperative Institute for Research in Environmental Sciences
University of ColoradoBoulder, CO 80309-0216
(303)492-5642
Heterogeneity of Reporting in the Earthquake Catalog of the Western North Anatolian Fault Zone
In collaboration with researchers from the University of Kiel we have investigated the difference in magnitudes reported by the German and the Turkish analysts. During the first two years of operations two magnitudes Mt and M2 were reported for each earthquake based on dif ferent definitions, one by each research group. During the second two years only one magnitude was reported. We used this data set to test our method to detect inadvertent changes in the mag nitude scale. The direct comparison of the duplicate magnitude sets gave the "observed" magni tude difference which we used for calibration. The heterogeneous data set on which we tested the GENAS method to detect magnitude scale changes was made up of two years of Mt data fol lowed by two years of M2 data. Our method found the time of change and the magnitude shift correctly within small uncertainties. However, we also found that in addition to a shift, stretching of the magnitude scale occurred.
Heterogeneity of Reporting in the Revised Preliminary Earthquake Catalog of Central Cali fornia
We concentrated our initial efforts with this new catalog on the area surrounding the Loma Prieta earthquake. We found that magnitude shifts are present in this catalog. North and south of Loma Prieta, positive and negative magnitude shifts exist, respectively. The raw data for the southern part of the Loma Prieta aftershock zone show an extremely impressive seismicity rate decrease in excess of 50% that lasted for many years. This observation might be interpreted as a quiescence precursor to the Loma Prieta mainshock of 18 October 1989. However, we found that three negative magnitude shifts of -0.1 each probably accumulated a difference of AM=»-0.3 between the 1970s and the late 1980s magnitudes in this area. After correcting for what we inter pret as magnitude shifts, no precursory quiescence anomaly exists before the Loma Prieta earth quake. We find that the type of heterogeneity found is different in neighboring volumes with dimensions of 20 km in some parts of central California.
358

II.2
Continuation of Creep and Strain Studies in Southern California
Final Technical Report Contract #14-08-61666
C. Alien and K. SiehCaltech; Seismological Laboratory; Pasadena, CA 91125
(818)356-6115
IntroductionDuring the past two years of this contract, this Creep and Strain project has continued
Caltech's longstanding monitoring of fault slip in the near field with creepmeters (some telemetered), slipmeters, and alignment arrays. This project improves and maintains monitoring instrumentation along the San Andreas fault and Imperial fault in southern and central California. Also, numerous alignment arrays across the San Andreas fault and other active faults are monitored.
Primarily, during the past six months, maintenance and servicing of the instruments has been performed. Also, some of the creepmeter data are telemetered to Caltech from several stations, and our most recent work has substantially improved the satellite telemetry. These efforts have resulted in much lower field maintenace for these instruments during the past year. We have, in particular, accomplished modifications of our data retrieval software to work with recent changes in the GOES satellite telemetry system.
We continue to maintain our creepmeters and slipmeters; creepmeters on the Imperial fault are located at Ross Road (telemetered), Heber Road, Tuttle Ranch, and Harris Road (Brawley fault). Caltech creepmeters on the southern San Andreas fault are at Salt Creek (telemetered), Mecca Beach, and North Shore (telemetered). Slipmeters are at Lost Lake (near Cajon Pass), Jack Ranch (Parkfield area), and Twisselman Ranch (Cholame segment).
Recent Problem SolvedProblems with adapting our creepmeter telemetry datalogging software to changes in the
GOES system hampered us until recently. Fortuitously, no creep events occurred during the few months when our automated demultiplexing and archiving were down. The datalogging was maintained during this time, and weekly manual decoding checks were performed (to see if instruments were performing well, and look for any large creep signals). Now that we have updated our demultiplexing and archiving software, we still need to re-process (and archive) these backlogged data.
Recent ResultsDuring March and April of 1991, we have recorded numerous creep signals on our
telemetered creepmeters on the Imperial and San Andreas faults. The first possibly significant one of these was recorded at both Salt Creek and North Shore [Figure 1], on Julian Day (JD) -060, shortly after heavy rainfall throughout southern California. We actually record air temperature, and we noted rapid changes at this time - probably associated with a passing storm front and rain in the area. Perhaps importantly, this rain followed a drought of several years' duration.
The creep event we recorded on the southern San Andreas fault was right-lateral, and lasted about 2 days, at both sites. The amplitudes recorded were only 0.4 - 0.5 mm at Salt Creek, and 0.3 mm at North Shore. Particularly because of the small amplitude of the creep observed at this time, and low signal-to-noise ratio, we made no formal notice of the event, though we briefly discussed it with colleagues at Caltech and at the USGS.
359

II. 2
i I I I I I I I I I I I I I I I I
Vt 1
I »
North Shore
Cittp
.4 Ml
Ml CfMk(0J mm)
j_I
KM 9Utf - 9LJ639*4on SIT 9LM6 - 9LK3
9*4cm
Figure 1. Records of the small creep event on the San Andreas fault (JD 059-061), as recorded at both the North Shore and Salt Creek telemetered creepmeter sites.
More recently (JD 091), a creep event was recorded at Ross Road on the Imperial fault. This event [Figure 2] had an amplitude of about 9.3 mm. The event was not accompanied by any particularly notable air temperature (and possibly rain) changes. Interestingly, a similar creep event (of 7.0 mm amplitude) was observed by the Ross Road instrument on JD 093 of 1990 [Figure 3]. The creep event in 1990 did not cause measureable creep at any of the non-telemetered creepmeters adjacent to Ross Rd. For the recent creep event of JD 091,1991, we have not yet been to the field to check our other instruments. They will be checked and serviced next week, so we will determine at that time whether or not this creep event has been recorded by our non-telemetered creepmeters on the Imperial fault. We did not record any creep on either of the telemetered creepmeters on the San Andreas fault at (or near) the same time.
MOM MOOdDcy 091. 1991
(94mm)
I
4
u '0 LT « 8
i
; \CBTO
_ .9)49 iMk/vtlt"^"\
till
MOM Moid D«y 093, 1090
(7.0 mm)
tlNFIMTIII ~
M*C/v»lt
I "ii i i i i
99 99 08 9L.M - 9I.M2
Figure 2. Records of the JD 091, 1991 creep event on the Imperial fault, as recorded at the Ross Road telemetered creepmeter site. Note similarity in amplitude and time of year to the 1990 creep event shown in Fig. 3.
OS 9M89 - 91.098
Figure 3. Records of the JD 093,1990 creep event on the Imperial fault, as recorded at the Ross Road telemetered creepmeter site. This creep event was only recorded at Ross Road.
99CUT
360

II. 2
Because this creep event on JD 091,1991 at Ross Road was recorded at well above the noise level, and the amplitude was substantial, we have reported this creep event semi- formally (by email and telephone) to several colleagues at Caltech and the USGS. Until we can see if the other creepmeters recorded the event, we cannot be sure that this is like the 1990 creep event (that was localized at Ross Road). We are curious to get this result, but would not plan to make any formal notification until the results of our field trip come in. It is interesting to note that a 5 mm creep event on two instruments at Parkfield has recently caused a B-level alert there - this may be causally associated with the recent rains (W. Prescott, USGS, pers, comm.). In the case of Parkfield, however, such an event is clearly unusual, whereas the 9.3 mm event we've just recorded at Ross Road may not be so unusual.
Concluding RemarkThis project has been generating data for 25 years, and these data have all been
archived at Caltech. Caltech will continue to maintain this project, and continue to improve our capabilities, funding permitting. At present, we have merged the Creep and Strain project into our Earthquake Geodesy project, since there is much overlap, both scientifically and in terms of personnel involved, between the two. Unfortunately, this merger resulted in a $50,000 cut in combined funding of the Creep and Strain and GPS projects from 1990 to 1991, despite reviewers' comments that this merger seemed a logical step on our part. This radical cut in our funds has necessitated drastic humbling of our plans for Creep and Strain work in 1991, though we hope to be able to maintain the telemetered creepmeters, at least. Our hopes to survey and upgrade a number of the alignment arrays and to install telemetry at additional creepmeter sites, have been dashed for 1991.
361

II.2
Patterns of Slip Distribution at Depth and Stress Transfer Associated with Three Sequential Earthquakes Along the Calaveras Fault, California
Agreement No. 14-08-0001-G2063
Atilla Aydin Department of Earth and Atmospheric Sciences
Purdue UniversityCivil Engineering Bldg.
West Lafayette, IN 47907-1397
Phone (317) 494-3696 Fax (317) 496-1210
The progression of slip and the associated stress field from one fault segment to the adjacent segment poses an interesting problem, with wide-ranging implications ranging from earthquake prediction to the nature of loading system in the upper crust. Three sequential moderate earthquakes - the 1979 Coyote Lake, the 1984 Morgan Hill and the 1988 Alum Rock along central Calaveras fault in the eastern San Francisco Bay Area (Figure 1) - provide a unique opportunity to decipher the coseismic evolution of slip distribution and the perturbed stress field from one earthquake to the other.
We invert coseismic geodetic data, recorded by the U.S. Geological Survey Network, for slip at depth for the Coyote Lake and Morgan Hill earthquakes by using a 3-D elastic dislocation model in half space. We then calculate the stress field corresponding to each displacement field, thus describing quantitatively the mechanical process of slip and stress transfer from one segment to the next during a given earthquake. For example, Figure 2a illustrates the strike slip distribution for the 1979 Coyote Lake earthquake and Figure 2b shows the shear stress changes on the Morgan Hill segment induced by the 1979 Coyote Lake earthquake. Eventually, we plan to analyze the relationship between an earthquake's perturbation of stress field on the neighboring segment and its correlation with the next earthquake on that segment and the stress drop.
NW SE
M5.1 M&2 1988 1984
M5.9 1979
Alum Rock Morgan Hill Coyote Lake
Figure 1. Three sequential earthquakes on the central Calaveras fault.
362

II.2
(a)
00 5 10 15
I I I I I I I I I I I I I I I
W10
20 25 30 35
0 0
0
10
15 20 25 30 35
(b)
0 10 15 20 25 30 35
o 10 15 20 25 35 40
DISTANCE ALONG STRIKE (KM)
Figure 2. (a) Coseismic strike-slip (in meters) distribution for the 1979 Coyote Lake earthquake, (b) Shear stress change (in bars) on the Morgan Hill segment induced by the 1979 Coyote Lake earthqauke.
363

II.2
Southern San Andreas Crustal Deformation
14-08-0001-G1809
John Beavan, Lewis GilbertLamont-Doherty Geological Observatory of Columbia University
Palisades, New York 10964(914) 359-2900
Investigations1. Historical water level recordings from three sites around the Salton Sea are being investigated to determine tectonic tilting, taking account of as many noise and error sources as possible.2. The tectonic tilt so derived is being compared with leveling data from the area.3. LDGO-designed pressure-sensor gauges at five sites around the sea are being used to measure water level continuously, to investigate noise sources, to determine the level of detectability of tectonic tilt signals in the data, and to measure tectonic tilting.4. A dense network of sites near the Southern San Andreas and northern Imperial Valley Faults is being surveyed approximately annually to cm-level horizontal accuracy, using Global Positioning System (GPS) techniques (in cooperation with Dr. R. Reilinger of MIT and others).
Results (April 1991)1. Three of the five water level sites (Figure 1) continue to operate; problems with the other two should be addressed later this year. Recent data are shown in Figure 2. No significant long-term tilt trends are observed above the estimated noise level of a few mm/yr.2. The local backup recorders installed at sites SB, FT and BM proved invaluable during an extended central recording site failure early this year. The central site was repaired in March 1991, and the backup data were recovered from all three remote sites during the same time period. At FT and BM the data were complete (see bm_ft trace in Figure 2); the early 1991 gap at SB was due to a solar panel failure at the site.3. Two LDGO personnel and 3 LDGO receivers participated in the March 1991 GPS field campaign (STRC91). See the report by R. Reilinger in this volume for more information.4. Analysis of the STRC90 and STRC91 GPS campaigns at LDGO continues; we promise a substantial report on this effort in our next semi annual report.
SAW ANDREAS FAULT
BRAWfLEY SEISMIC ZONl
SUPERSTITION HILLS FAULT
IMPERIAL FAULT
Figure 1. Map of study region, showing tectonic setting and water level network. Continuous recording pressure gauges have operated at SP since May 1985, SB since January 1986, BP since December 1986, and BM and FT since May 1987. The data are digitally telemetered, via the repeater site shown, to SP, from where they can be accessed by modem. Datum control of the water level gauges is provided by leveling them to nearby NGS benchmarks; clockwise from SP, these are G70, V1255, K1299, Extra No. 2 and Q1299. The SB to FT baseline length is 35 km, FT to SP is 14 km.
364

II.2
0.20-1
E 0.15-j
00.10-
0.05-o
7 0.00- o
-0.05-
-0.10-
sb_sp
sb ft
88 89 90I
91
0.25-
0.20-=
0.15-5
^ 0.05-=oo 0.00-:
| -0.05-=
-0.10-=
sb_bm
87
i^
88 89
1^
90
1^
91
Figure 2. Differences between water level series after low-pass filtering at 4 day period. These differences may be converted to apparent ground tilt (i.e., true ground tilt plus measurement noise of various sorts) by dividing by the distance between the gauges. The rms value of these difference series is close to 1.0 cm. Positive trends on the plots indicate ground uplift of the second-named site relative to the first. All trends are within the estimated noise level of a few mm/yr. Gaps are due to vandalism and other problems at one or both sites. Staff gauges adjacent to the pressure sensors have periodically been read manually as a check on gauge stability; generally the agreement is 5 mm or better. The gauges have also been leveled approximately annually to nearby arrays of benchmarks; their stability has been at the mm level. Gauges sp and bp are not currently operating.
365

II.2
ACCELERATION, VELOCITY, AND VOLUMETRIC STRAIN FROM PARKFIELD GEOS NETWORK
9910-02089
Roger D. Borcherdt, Malcolm J. Johnston,C. Dietel, G. Glassmoyer, and Allan Lindh
Branch of Engineering Seismology and GeologyU.S. Geological Survey
345 Middlefield Road, MS 977Menlo Park, California 94025
415/329-5619 or FTS 459-5619
Investigations
* Maintain GEOS array near Parkfield, CA, to serve as a strong-motion array to provide broad-band, high-resolution measurements of the mainshock as well as an array to provide measurements of pre-, co-, and post-seismic strain and displacement field perturbations for purposes of earthquake prediction.
* Maintain up-to-date archive of all events recorded in anticipated rupture zone.
* Develop theoretical basis and models to interpret colocated measurements of volumetric strain and seismic displacement fields.
Results
* An array of 15 stations has been maintained at 95% or greater reliability since July, 1987. An up-to-date digital data archive is being maintained and summarized in monthly internal USGS reports by C. Dietel. (See previous reports for detailed description of the array.) Events recorded along Parkfield segment of study zone during time interval indicated are summarized according to magnitude and depth (Table 1, Figure 1). Examples of colocated measurements of volumetric strain (Figure 2; traces 1, 2, and 3), ground velocity (Figure 2, Figure 3; traces 4, 5, and 6), and ground acceleration (Figure 2, traces 4, 5, and 6; Figure 3, traces 1, 2, and 3) for a magnitude 3.1 event are shown.
Reports
(see projects Borcherdt et al., [9910-02689 and 9901-03009] and Johnston for related reports.
366

II.2
TABLE 1
HYPO-71 LISTING: PARKFIELD EARTHQUAKES RECORDED ON ONE OR MORE GEOS STATIONS FROM NOVEMBER 16, 1990 TO FEBRUARY 24, 1991.
9011169011179011229011239011289011309011309012 49012 490121890122690122690122690122891 1 491 1 591 1 991 11991 11991 12191 12891 2 491 2 491 2 591 2 591 21091 216
0571 7
1156726342425428
13131332630
23 023 223 7614026833
22 973983824715542 72 8437
1121038
1232
12.5338.0510.5832.4654.7359.358.02
59.2325.7252.6829.124.09
18.5057.6516.068.034.816.47
15.6327.004.81
21.0446.9525.6818.5824.8955.82
35 58.0036 3.9135 59.5235 59.6035 57.1835 56.8535 56.8935 56.1735 56.3136 0.1336 0.6236 0.5336 0.7135 53.3336 0.2235 53.5135 54.2335 59.0035 59.0535 46.8435 44.3435 46.8035 46.9636 0.9535 58.6935 57.4336 0.10
120120120120120120120120120120120120120120120120120120120120120120120120120120120
31.1936.8633.7833.7629.4329.7729.4331.7531.1234.5634.4334.5634.0326.0833.8826.0626.9933.6633.6020.0317.9020.1319.9733.8931.6630.3834.52
7.877.635.935.81
13.5111.6010.909.98
10.785.225.184.955.33
10.825.53
10.236.405.975.878.36
12.248.178.395.32
11.279.136.62
2.452.162.062.172.233.092.081.891.861.662.192.532.191.442.571.433.111.551.682.901.832.792.061.882.091.991.67
34 13430 12828 9128 9330 13844 6926 13529 7025 7715 12926 13031 13023 13218 13936 13218 14338 12913 11417 8640 5725 4938 5728 5921 13432 13528 11218 98
2.3 0.078.9 0.073.6 0.073.6 0.090.7 0.071.0 0.111.1 0.061.6 0.131.4 0.123.0 0.113.7 0.083.5 0.104.3 0.073.2 0.033.9 0.083.3 0.044.8 0.083.7 0.063.8 0.077.0 0.104.5 0.056.9 0.107.3 0.064.8 0.053.6 0.060.8 0.083.0 0.10
0.30.30.30.30.40.20.30.40.40.40.30.30.30.40.20.30.20.30.30.20.20.20.20.30.20.30.4
0.20.40.20.20.30.3 S0.30.4 S0.50.70.30.30.30.6 S0.20.5 S0.30.30.30.3 S0.40.4 S0.4 S0.30.30.30.5
9910-02089 367

PARKFIELDFigure 1
40'
o00
36°-
55' -
COo\00
50' -
45'
40' -
35' i i
30' 25' 20' 15' 10'
. O W
fa A / velocity
FBA / dilatometer
20 KM; . , i I I I I I I I I I I I I I
40' 35' 30'1 ' I
25'
* K
36
- 55'
- 50'
- 45'
- 40'
20' 15' 10'
DEPTHS
0.0+
* 1.5+
* 3.0+
<£ 4.5+
H 6.0+
O 7.5+
D 9.0 +
+ 10.5+
X 12.0 +
* 13.5 +
MAGNITUDES
0.0+
0.5 +
* 1.0+
* 1.5+
* 2.0+
* 2.5+
$ 3.0+
<£ 3.5+
<fc 4.0 +
<k 4.5+
M M
N5
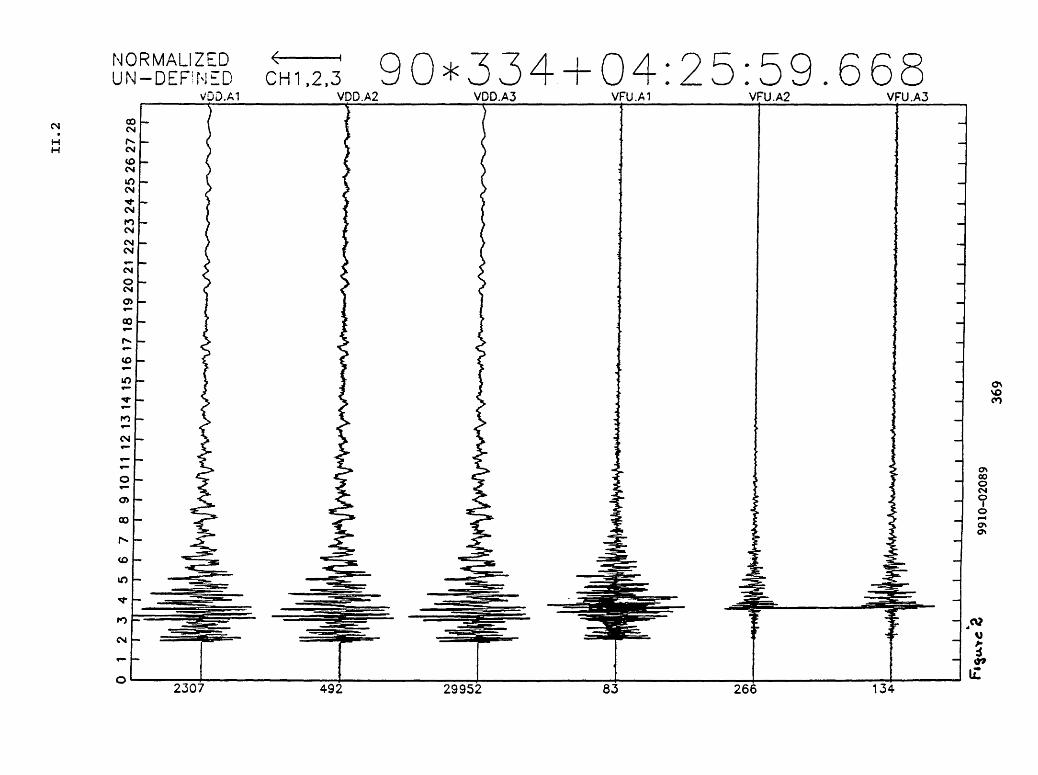
CM
H H
NORMALIZEDUN-DEFINED
VDD.A1
< l
CH1,2,3 90*334 + 04:25:59.668VDD.A2 VDD.A3 VFU.A1 VFU.A2 VFU.A3
2307 492 29952 266 134

CM
HH
NORMALIZED UN-DEFINED
EFU.A190*334 + 04:26:00.180
EFU.A2 EFU.A3 EVU.V1 EVU.V2 EVU.V3
14216 13734

II.2
Seismic Studies of Fault Mechanics
9930-02101
William L. Ellsworth Lynn Dietz and Randall White
Branch of SeismologyU.S. Geological Survey
345 Middlefield Road - MS 977Menlo Park, California 94025
415-329-4784
Investigations1. Analysis of preshocks and aftershocks of the 1989 Loma Prieta earthquake.
2. Analysis of seismic noise in the hours preceding the 1989 Loma Prieta earthquake.
3. A test of local earthquake tomography.
Results1. The Loma Prieta earthquake occurred beneath one of the most densely instrumented por
tions of the U.S.G.S. seismic network, and provides an unusual opportunity to analyze the "complete" aftershock sequence of a major event and relate it to "background" seismicity.We calculated station delays and 1-dimensional velocity models to improve the locations over those determined by routine procedures. To model the contrasting surface geology across the San Andreas fault, we derived a separate velocity model for each side using a simultaneous inversion of the mainshock and aftershock traveltimes. The resulting loca tions have an estimated relative precision of ±0.3 km. This model relocates the explo sions to an epicentral accuracy of ±0.5 km. Our best estimate of the main shock focal depth is 16.3 km, slightly shallower than earlier estimates. Modelling studies suggest a possible range of depths of >14 to <18 km. Using this calibrated crustal model, we determine the locations of over 8000 events from January 1, 1969 to the instant of the earthquake and over 8000 aftershocks through the end of August 1990.Geometry of the Earthquake. Well-constrained aftershock hypocenters of October 18- 31, 1990, form a 60 km long zone with the mainshock at its base. Most aftershocks cluster around the perimeter of the distribution and surround a relatively aseismic patch (-15x30 km) which we believe approximates the extent of main shock rupture. In the central and northwestern parts of the zone, earthquakes at depths above about 10 km define numerous disjoint fault structures. The earthquakes deeper than 10 km define a plane dipping 65°±5°SW and striking N51°W±2°, consistent with the mainshock focal mechanism. In the southeastern 15 km of the aftershock zone the dipping zone warps into a vertical surface that corresponds with the San Andreas fault.The distribution of events in the sequence, as seen in map and cross-sectional projections stongly suggest the presence of discrete structures. Some of these structures seen in the aftershock sequence correspond to those active before the main shock, but most cannot be resolved in the pre-event data.
371

II.2
Focal mechanisms indicate that many of the alinements of hypocenters coincide with the nodal planes, providing strong support for the argument that they represent coherent faults. The diversity of mechanisms in the aftershock series is particularly wide, with virtually no events similar to the main shock. In particular, the larger events have mechanisms that span the full range of possibilities: right-lateral, left-lateral; reverse and normal. The spatially-averaged strain release in the aftershock sequence, computed by summing seismic moment tensors, does not conform with a simple pattern, and may be best described as a random pattern, as one would obtain by summing randomly oriented mechanisms.Relationship between Preshocks, Main Shock and Aftershocks. Seismic activity recorded before the earthquake is dominated by high levels of activity along the San Andreas fault to the southeast of the Loma Prieta earthquake and activity along the Sar gent fault. These appear to be near-vertical right-lateral strike slip faults. Most of the seismic energy release during this period occurred in the two M 5 events near Lake Els- man, at the intersection of the Sargent fault with the San Andreas fault at the northwest end of the rupture. An important sequence of M 4-5 events in 1964-1968 also occurred due east of the main shock.In contrast to the relatively high level of activity in the vicinity of the earthquake, rela tively few events locate within the aftershock zone. There are a few events in the central part of the zone that lie vertically below the trace of the San Andreas fault. They sug gest the possibility of a vertical San Andreas to a depth of about 10 km. Preliminary focal mechanism data for these events supports this interpretation. The strike of the best mechanisms, however, lies distinctly 10°-15° clockwise of the San Andreas fault, compli cating the association.As with many other earthquakes that can be studied with high-resoultion aftershock com bined with detailed models of the seismic slip the Loma Prieta earthquake probably has few, if any aftershocks on the primary rupture surface. Thus, inferences about the rela tionship of the main shock to other faults must be based on more than just aftershock mapping. The very low levels of seismicity in the 20 years before the Loma Prieta earthquake that might be associated with its causative fault similarly reminds us that other large active faults may be "hidden" within the southern Santa Cruz mountains, only to be revealed when they produce their earthquakes.
2. Ground motion recorded by the U.S.G.S. telemered seismic network directly above the source region of the Ms 7.1 October 18, 1989 Loma Prieta earthquake show neither change in microearthquake activity nor variations in seismic noise immediately preceding the main shock. From October 1 until the main shock, only seven earthquakes, none larger than M 1.5, occurred within 10 km of the eventual aftershock zone. All located near the ends of the aftershock zone. Two of these (M 0.8 and M 1.2) occurred about 3 1/4 hours before the main shock, and appear to be normal aftershocks of the August 9, 1989 Lake Ellsman earthquake (M 5.2).During the 7 1/4 hrs immediately preceding the main shock, ground motion power spec tral densities and cross-spectral coherency were examined at three stations within 7 km of the epicenter, at three stations 35 km from the epicenter, and at one station about 70 km from the epicenter. Spectra energy near 2 to 3 Hz and 10 to 13 Hz predominates.
372

II.2
Most to all of the high levels above 8 Hz can be traced to cultural sources. Although it is difficult to trace the origin of the high levels at 2 to 3 Hz, most are believed to be of cultural origin and none are believed to be related to the impending Loma Prieta earth quake. Whatever the source of the high spectral levels, we observe almost identical spectral characteristics in data recorded at stations both near and far from the epicentral area two years before, and four and one-half months after, the main shock.The only coherent signal we see on any of the seismograms in the band from 0.1 to 2.5 Hz is a here-to-fore unrecognized electronic signal present on USGS model J302 VCO units at 5.27 s period. We find no other evidence of correlated electronic or seismic sig nals before the Loma Prieta earthquake.
3. Seismic traveltime tomography using locally recorded earthquakes has proven to be an effective tool for imaging earth velocity structure under a wide range of experimental conditions, and has received commeasurately wide application using a multitude of methods, assumptions, techniques and approximations. Differences between various approaches include the selection of the starting model and hypocenters, treatment of the unknown hypocenters, parameterization of the medium, ray tracing strategy, formulation of a linear problem and its solution, and iteration (if any) of the algorithm to conver gence. We have examined many of these options as applied to the recovery of a 3-D model using a synthetic data set (created without ray tracing) and an actual set of source-receiver observations from the southern Santa Cruz mountains, California. We find that our inverse models are trustworthy only when:
1. The full, coupled hypocenter and structure problem is solved.2. Accurate ray tracing is used.3. The starting model satisfies the coupled problem inverse problem.4. Hypocenters and raypaths are updated at each velocity step.5. Iteration continues to convergence.
When these conditions are met, linear measures for assessing the solution including the resolution and covariance matrices provide appropriate guidance to the interpretation of the resulting solution. Failure to include all of these steps leads to numerically stable (and well-resolved!) models that contain serious artifacts and errors.A sobering aspect of even our most successful model is the dramatic loss of lateral resolution below the average depth of the earthquake population. We suggest that published models of 3-D structure in the southern Santa Cruz mountains, which are based on essentially the same rayset, probably do not resolve structures with lateral dimensions smaller than 5 km that may be present below about 8 km depth.The synthetic data set created for this test is available for experimentation from [email protected].
373
II.2
ReportsAgnew, D.C., and Ellsworth, W.L., in press, Earthquake prediction and long-term hazards
assessment: U.S. National Report to the 20th General Assembly International Union of Geology and Geophysics, 21 p.
Ellsworth, W.L., and Dietz, L.D., in press, Crustal stress and seismic strain release in the 1989 Loma Prieta, California earthquake: Proceedings Seventh Joint Meeting fo the U.S.-Japan Conference on Natural Resources (UJNR) Panel on Earthquake Prediction Technology, Tsukuba Japan, 16 p.
Ellsworth, W.L., 1991, Loma Prieta: putting the pieces together: Nature, v. 349, p. 371-372.Ellsworth, W.L., in press, Comments on temporal variations of direct and coda waves as
reliable predictors of future earthquakes: in Evaluation of proposed earthquake precursors, IASPEI Sub-Commission on Earthquake Prediction, Wyss, M., Chairman, 3P-
Ellsworth, W.L., Dietz, L.D., and Lindh, A.G., 1990, Accomodation of North American- Pacific Plate motion along the Loma Prieta earthquake rupture zone: where is the real San Andreas fault? (abs.): EOS, Transactions American Geophysical Union, v. 71, p. 1646.
Ellsworth, W.L., 1991, Practicing earthquake prediction: translating Earth science research into action: International Seminar on Earthquake Prediction and Hazard Mitigation Technology, Tsukuba Japan, 20 p.
Ellsworth, W.L., Eberhart-Phillips, D., and Kissling, E., 1990, Imaging the crust with seismic tomography (abs.): XXn General Assembly European Seismological Commission, Program and Abstracts, p. 81.
Ellsworth, W.L., Eberhart-Phillips, D., and Kissling, E., 1991, A test of local earthquake tomography (abs.): Seismological Research Letters, v. 62, p. 31-32.
Castillo, D.A., and Ellsworth, W.L., 1991, The seismotectonics of the San Andreas fault system north of Point Arena anong the Coast Ranges of Northern California (abs.): Seismological Research Letters, v. 62, p. 11.
374
II.2
THEODOLITE MEASUREMENTS OF CREEP RATES ON SAN FRANCISCO BAY REGION FAULTS
14-08-0001-G1992
Jon S. GalehouseDepartment of Geosciences
San Francisco State UniversitySan Francisco, CA 94132
(415)338-1204
We began to measure creep rates on San Francisco Bay region faults in September 1979. Amount of slip is determined by noting changes in angles between sets of measurements taken across a fault at different times. This triangulation method uses a theodolite to measure the angle formed by three fixed points to the nearest tenth of a second of arc. Each day that a measurement set is done, the angle is measured 12 times and the average determined. The amount of slip between measurements can be calculated trigonometrically using the change in average angle. The precision of our measurement method is such that we can detect with confidence any movement more than a millimeter or two between successive measurement days.
We presently have theodolite measurement sites at 23 localities on active faults in the San Francisco Bay region (see Figure 1). Most of the distances between our fixed points on opposite sides of the various faults range from 50-275 meters. These distances are noted on Figures 2 through 6 as the IS (Instrument Station) to ES (End Station) distances. These figures also show the average rate of movement at each measurement site as determined by the slope of the least-squares line which also appears on each of the graphs. The graphs also show the time of the Loma Prieta earthquake as a vertical line.
We remeasured most of our sites about once every two to three months prior to the 17 October 1989 Loma Prieta earthquake. Following the quake, we established new Sites 22, 23, and 25 on the San Andreas fault northwest and southeast of the epicentral area and Site 24 on the Hayward fault in Fremont (see Figure 1). We also began more frequent measurements on sites on the San Andreas fault (14, 10, 22, 23, 25), on the Hayward fault (17, 13, 12, 2, 1, 24), and on the Calaveras fault in the Hollister area (6, 4). These more critical sites were measured about every six to seven weeks throughout 1990 but are now once again being measured about every two to three months. The following is a brief fault-by-fault summary of our movement measurements through 10 May 1991. Included are brief statements regarding the effect of the Loma Prieta earthquake on creep rates at our measurement sites.
SAN ANDREAS FAULT (see Figure 2) - We have been measuring horizontal slip on the San Andreas fault at Site 14 at the Point Reyes National Seashore Headquarters for over six years and at Site 10 in South San Francisco for eleven years. Both sites have shown virtually no net slip and neither was affected by the 17 October 1989 earthquake thus far.
In November 1989, we began measuring a USGS site (our Site 22) in Woodside that had not been remeasured for many years. Our results compared to unpublished USGS measurements in 1977 show that virtually no surface slip occurred between 16 February 1977 and 4 November 1989 and virtually none has occurred since. We also established in November 1989 measurement Site 23 on the San
375

II. 2
Andreas fault near the southeastern end of the aftershock area near San Juan Bautista. Virtually no slip has occurred at this site. In July 1990, we established Site 25 on the San Andreas fault just southeast of the aftershock zone. This site is near the northwestern end of the central creeping segment of the San Andreas fault and the creep rate is about 12.8 mm/yr.
Our Site 18 (not shown on Figure 1) in the Point Arena area has averaged less than a millimeter per year of right slip for the past ten years.
In summary, the San Andreas fault at our measurement sites does not appear to have been affected by the Loma Prieta earthquake in the 19 months since October 1989. Northwest of the epicenter and aftershock area, the San Andreas fault is still virtually locked, with very little, if any, creep occurring along it.
HAYWARD FAULT (see Figure 3) - We have been measuring horizontal slip at five sites along the Hayward fault for more than a decade. Although creep characteristics (steady or episodic) differ from site to site, the overall rates are similar.
Since we began measuring Site 1 at Rockett Drive in Fremont in September 1979, the fault has moved rather episodically with an overall average rate of right slip of about 5.1 mm/yr. Relatively rapid right slip of about a centimeter over a few months time alternates with relatively slower slip over a period of two or more years. The fault at Site 1 was in one of its relatively slower phases of movement prior to the Loma Prieta earthquake and that slower phase has now persisted for three years. Our Site 24 on Camellia Drive in Fremont was established after the Loma Prieta earthquake. Although relatively high slip rates have been reported for this site in recent years based on curb offsets, it is not creeping now. Perhaps the fault at Site 24 moves episodically (similarly to Site 1 which is about four kilometers to the northwest) and has been in its slow phase since we began measuring it more than a year ago.
Movement along the Hayward fault at Site 2 in Union City has been much more continuous and much less episodic than movement at Site 1. The average rate of right slip has been about 4.6 mm/yr since we began measurements in September 1979.
Extremely uniform movement characterizes Site 12 on D Street in Hayward. Two active traces of the Hayward fault occur here and their combined movement rate has been about 4.7 mm/yr since we began measurements in June 1980. Our nearby Site 13 on Rose Street in Hayward has the same overall rate of movement (4.7 mm/yr) since June 1980, but the movement is more episodic than at Site 12.
Since we began measurements in August 1980 in San Pablo (Site 17) near the northwesterly end of the Hayward fault, the overall average rate of right slip (about 4.6 mm/yr) has been similar to the overall rate at the other Hayward fault sites. However, superposed on the overall slip rate in San Pablo are changes between some measurement days of up to nearly a centimeter in either a right-lateral (more common) or left-lateral (less common) sense. This pattern was more pronounced between mid- 1980 to mid-1986 and has been less pronounced since.
In summary, the Hayward fault has been creeping at a rate of about 4.6 to 5.1 mm/yr since at least 1979 and does not appear to have been affected by the Loma Prieta earthquake thus far.
CALAVERAS FAULT (see Figure 4) - We have been measuring horizontal slip at two sites on the Calaveras fault in the Hollister area for over eleven years. Slip at both sites has been rather episodic with intervals of relatively rapid right slip typically lasting a couple months or less alternating with longer periods of time when little net slip occurs. The Loma Prieta earthquake occurred during an interval of slower movement that had persisted for about a year at Site 4 along Seventh Street in
376

II.2
Hollister. The earthquake apparently triggered up to 14 millimeters of right slip (see Figure 4). Overall the rate of right slip is about 7.1 mm/yr for the past 11.5 years.
Slip at Site 6 along Wright Road just 2.3 kilometers northwest of Site 4 is also episodic. The Loma Prieta earthquake occurred during an interval of slower movement that had persisted for about a year at Wright Road (similar to the situation at Seventh Street). The earthquake apparently triggered up to 12 millimeters of right slip. The overall rate of slip at Wright Road is about 12 mm/yr for the past 11.5 years, about 5 mm/yr faster than the rate at nearby Seventh Street. Either the creep rate on the Calaveras fault decreases significantly from Wright Road southeast to Seventh Street or undetected surface movement is occurring outside our 89.7 meter-long survey line at Seventh Street.
After the rapid slip triggered by the Loma Prieta earthquake, both sites in the Hollister area returned to the slower mode of movement which has persisted for over 17 months thus far (through 6 April 1991). A more detailed discussion of the effect of the Loma Prieta earthquake on the Calaveras fault in the Hollister area was published in Geophysical Research Letters (Galehouse ,1990). The paper also discusses the effect of the Morgan Hill earthquake. No immediate surface displacement had occurred at either of our Hollister area sites when they were measured the day after the Morgan Hill earthquake in 1984. However, within the following 2.5 months, both sites showed over a centimeter of right slip which was followed by a relatively long interval of slower slip (see Figure 4).
In contrast to our sites in the Hollister area, Site 19 in San Ramon near the northwesterly terminus of the Calaveras fault was not affected by the Loma Prieta earthquake. It remained virtually locked as it has been throughout our 10.4 years of measurements.
CONCORD - GREEN VALLEY FAULT (see Figure 5) - We began our measurements at Site 3 and Site 5 on the Concord fault in the City of Concord in September 1979. Typical movement characteristics on the Concord fault are intervals of relatively rapid right slip of about 7-10 millimeters over a period of a few months alternating with intervals of relatively slower right slip of about a millimeter or two a year over a period of several years. This pattern has been somewhat less pronounced for the past three years. The overall average rate of right slip is 3.5 mm/yr at Site 3 and 2.7 mm/yr at Site 5.
It appears that the Loma Prieta earthquake and the 1990 swarms of earthquakes near Alamo (between the southeastern end of the Concord fault and the northwestern end of the Calaveras fault) had no effect on the Concord fault at our measurement sites in the City of Concord.
We began measuring Site 20 on the Green Valley fault near Cordelia in June 1984. Large variations tend to occur at this site between measurement days, possibly because logistical considerations resulted in our survey line being particularly long (335.8 m). However, our results suggest that the Green Valley fault behaves similarly to the Concord fault which is along trend to the southeast, i.e., relatively rapid right slip in a short period of time (months) alternating with relatively slower slip over a longer period of time (years). The overall average rate of movement has been 5.5 mm/yr for the past 6.8 years.
It is tempting to suggest that shaking from the Loma Prieta earthquake triggered the onset of the latest phase of relatively rapid displacement on the Green Valley fault. However, the measurement intervals are too far apart to lend strong support for this hypothesis and as far as we know, there is no additional evidence suggesting a
377
II.2
relationship between the two. It is probably only a coincidence that the Green Valley fault began a period of relatively rapid movement at a time that could be approximately related to the Loma Prieta earthquake. Nevertheless, the movement characteristics of the Green Valley fault do suggest a relationship with the Concord fault. Even though the episodes of relatively rapid slip and relatively slower slip on the Green Valley and Concord faults occur at different times, they are similar in amount of slip and duration of the intervals. We consider the Concord and Green Valley faults to be different names for the southeastern and northwestern segments of the same fault.
RODGERS CREEK FAULT (see Figure 6) - We measured Site 16 on the Rodgers Creek fault in Santa Rosa from August 1980 until we had to abandon it for logistical reasons in January 1986. During these 5.4 years of measurements, no significant surface slip occurred and we concluded that the Rodgers Creek fault was not creeping at this site.
In September 1986, we established Site 21 on the Rodgers Creek fault near Penngrove. Although the least-squares average at Site 21 is 2.1 mm/yr of right slip for the past 4.6 years, the net movement is virtually nil (see Figure 6). Because variations of several millimeters tend to occur from one measurement day to another, it is difficult to know whether the Rodgers Creek fault is really creeping slowly or whether it is not moving at all. Perhaps the results will become less ambiguous at this site as we continue our measurements over a longer period of time. In addition, we intend to consult with cognizant USGS personnel in the near future and establish another measurement site on the Rodgers Creek fault.
The Loma Prieta earthquake does not appear to have had any effect on the Rodgers Creek fault at Site 21.
WEST NAPA FAULT (see Figure 6) - We began measurements at Site 15 in Napa in July 1980. Similarly to the situation on the Green Valley and Rodgers Creek faults, there tends to be a lot of surface "noise" at this measurement site. The overall average rate of right slip on the West Napa fault over the past 10.7 years is only 0.2 mm/yr. In other words, the West Napa fault is virtually locked at the surface with virtually no creep occurring. We had previously thought that the West Napa fault may have begun to creep in late 1990. However, we then discovered that one of our triangulation points in an asphalt driveway had become unstable and had yielded bad data.
The Loma Prieta earthquake does not appear to have had any effect on our results for the West Napa fault.
OTHER FAULTS (see Figure 1) - Not much, if any, net slip appears to have occurred at our two sites along the Antioch fault since May 1980 (Site 11) and November 1982 (Site 9). However, much subsidence and mass movement creep occur both inside and outside the Antioch fault zone and it is probable that these nontectonic movements obscure any slow tectonic slip that might be occurring. Our two sites on the Seal Cove-San Gregorio fault have shown virtually no net slip since November 1979 (Site 7) and May 1982 (Site 8). The Loma Prieta earthquake appears to have had no noticeable effect on the rate of movement at any of our sites on the Antioch and Seal Cove-San Gregorio faults.
PUBLISHED ABSTRACT
Gatehouse, J. S., 1991, Creep rates on Bay area faults during the past decade: Geol. Soc. Am. Abstracts with Programs, vol. 23, no. 2, p.27.
378

II.2
121° 30'
38°-
Seal Cove Fault
-37 37° 30'-
- 37 37°-
123° 00' 122° 30'
Figure 1. Numbered dots are San Francisco State University theodolite measurement sites.Epicenters and magnitudes are indicated for the24 April 1984 Morgan Hill earthquake (MHEQ) and the 17 October 1989 Loma Prieta earthquake (LPEQ).
379
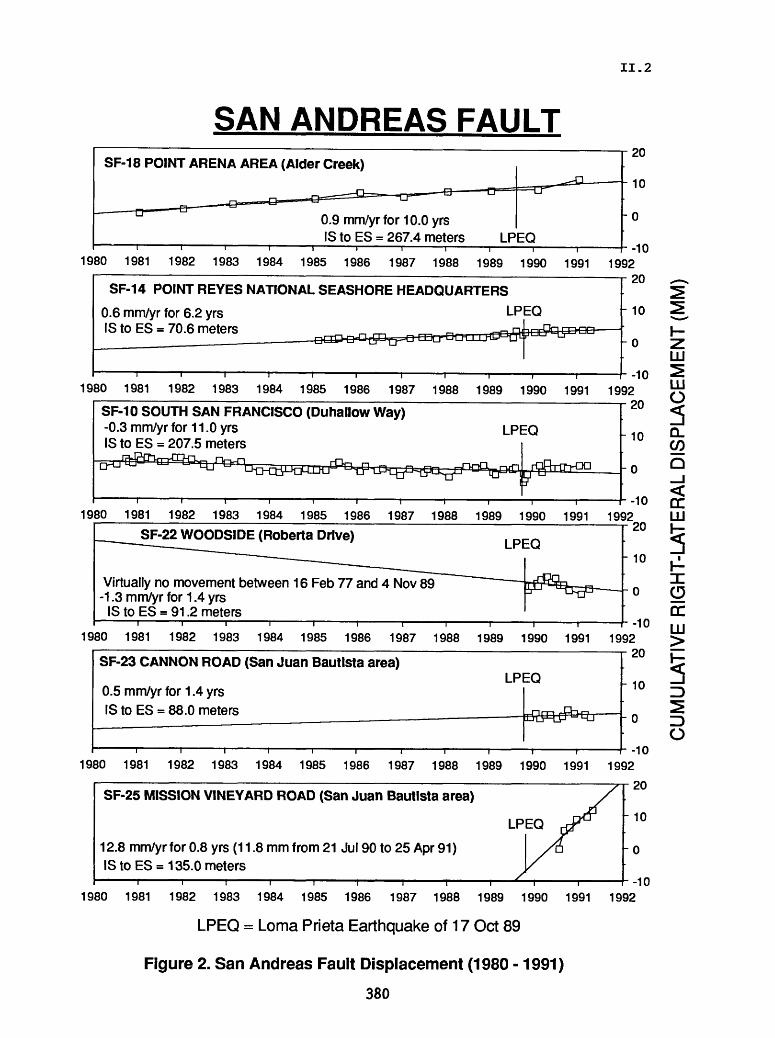
Tj
(5' i a. 3 n> (0 31 "2. n> o <D (D 3 (O
00 o (O
(O
m
D H i
o 3 Q) Tl
3.
£ Q) m Q)
C
Q) 5"
CO
00 o CO
. 00
^
CO
00 ro CO
. 03
^
CO CO
00 CO
.
CO 00
^
O5
CO
00 CO
00
CO
m
co CO
O
gp
bo 3 3 ro c_ co
o ro
01 co
ro
en O Z m O 3]
O >
O 0) c_ 0) I 0)
0}
o -
§CO
CO o CO
CO CO
CO ro
8 o CO
00 CO
03
N)
CO
03
CO 8 CO
00
Oi
CO
03
OS
CO
00 8 00 CO
00
CO (O
(O o CO
CO CO
CO
3
3m
3
co »
! II
- 00
C
?
0) 00
0)
0)
m
D
CO
00 o CO
00 CO
00 ro CO oo CO CO
_
2 co 00 en co
oo co 00 VI
CO
00
00
o>
(D
-^
ro
o
oM
^
o
-L
rvj ~
.
^'
^^
^^
^*
0)
m
D
co 03
O CO
03 CO
00 ro co
oo
co co 2 CO
.
CO
00
Oi
CO
_ (O
m
CO
03
O CO
00 CO
. 00
^
ro CO s CO 2 CO
.
CO
03
O)
CO
03 CO
03
03 CO
03
CO CO
CO
O CO
CO
ooS
o
o^°o
o
co ^H. 0
3 m
g
co J
-
ro o
51
C/5
Tl
_L GO
TJ O Z m Z m a (D * O i
> Z > Z o 31 m
-^
ro
o
o
H
H
CU
MU
LATI
VE
RIG
HT-
LATE
RA
L D
ISP
LAC
EM
EN
T (
MM
)

-n
(5' 3 CO i1
13 m
D o
00n;1
m JO I
s-
o
(O (O
(O
o a
Q>
ro
o
CU
MU
LATI
VE
RIG
HT-
LATE
RA
L D
ISP
LAC
EM
EN
T (
MM
)

oo
ro
Tl
(5'
C O fi), ? (D
0) n o &)
o (D
(D CO CO
CO
mrr
.
o
^,
P
(B
3.
to vl to to 00 o to 00 to 00 ro to oo
H
co to 2I
IT m
0)
Q)
2. 2
. ^ ^
O>
a"o
CO
00
CO
±h
to 00
^
O) to _
00
H
to
oo
oo to 00 to to
to
o 8-
to
to
ro
CO i m 3) I CO
to to 00 o to 00 to 00 ro to s to 00 to _
to 00
O) to
oo 00
00 to to
to
to si
to to CO
~
o _^ to
oo
to oo
ro i- CO to oo
to 00 en to 00
"0) to 00 to 00
00 to 00 to to 8"
to to
_^ to
I a a 1 l c I1 1 i ^
i)
TJj
m
V
°H
I n 8 [~|| T q 8 d c 5 £
} 1 5 o m
r-
CO
"D
n
ct
Q
I*
C*
~kcf
3
P 2.
P
CD 551
§CO 71 *m (O CO z 3)
Z o § »< o 57 £
p 3 3" p k *^ OT
o > > m 0)
Tl
ro
o4!
k O
O)
Os
O oro
o
6o
o
o
H
H
g_i
. _k
_i
. o
ro
-I*
oo
o
CU
MU
LATI
VE
RIG
HT-
LATE
RA
L D
ISP
LAC
EM
EN
T (M
M)

n
(5* 3 en O
o 3
O
O <D 3 I <D
00 u>
S* O
<D <D 3 (O
->l
CO (O
(O
m
0 o 0) "0 zs.
CD
§ »
0) m 0) 00
CO
CO v|
CO co 00 o CO
0
0 ro CO
00 co CO
.
CO
.
CO
0
0 0) CO
0
0
VI
CO
00
0
0 CO
CO
CO o CO
CO
CO
C
O
N>
w£
03 m 3
coj-
- O
CO -
«O -J.
b r
' 3£
CD ^
CD w
3
CO CO
0
0 o CO
0
0 CO
0
0 ro CO 8 CO 2 Ol 0) CO _
00 v| CO
00
00 CO
00
CO
CO
C
O o CO
C
O
ro ^
o o
-^
ro
o
oU
l o0)
o
CO
C
O ro
CO 71 g 8 O o 30
O 0)
0 3
m 3
01 I £ <
ro
-^
o o
-^
ro
o
oCO o
8 8
g S
o
o o
o o I o m
m m
-n
H
H
CU
MU
LATI
VE
RIG
HT-
LATE
RA
L D
ISP
LAC
EM
EN
T (
MM
)

11 (5' i (Q
fl) O
Tl A
fi)
<D
C JT ,
^t 3
-*>
<D
(O
(O
m O o 2. Q> m -Q I CD O 00
CO
(O
(O
CO oo
o CO oo CO oo
to CO s CO
00 CO g? CO
00
O) CO
00 CO
00
00 CO
00
CO 8- CO
CO
CO
CO ro
03 01 3
CO
00 o CO
00
CO
00 ro CO s CO CO
_t
CO
00 CO
_
00
^
CO
00
00 CO
00
CO CO
CO o 8- CO
CO
03
Tl ro _t DO O
O O m
DO 03 o DO m m * 5 <D
0) i? (Q
CO
00 o CO
00
CO
00 ro CO s to .
CO
CO
00 00
CO
00
CO
CO
CO o CO
CO ^
CO
CO ro
55 o
3 m
3
co J
-
ro o
8 e
n^ *
3
*<
£
55CD
£
03
T1 O
3) O
O O m
DO 03 O DO m m * I 03 0) 3
0) DO
O (0
0)
m
c/)
3D o o o m 3D
C/) o 3D m
m
. o
-^
oro
oco
o4^
o
en o
H H
CU
MU
LATI
VE
RIG
HT-
LATE
RA
L D
ISP
LAC
EM
EN
T (
MM
)

II.2
DEEP BOREHOLE PLANE STRAIN MONITORING14-08-0001-G1812
Michael T Gladwin,
Department of PhysicsUniversity of Queensland
StLucia, 4067AUSTRALIA.
ACTIVITIES
1. Monitoring and analysis of the data from San Juan Bautista over the eighteen months following the Loma Prieta earthquake has provided significant results.
2. A catalogue of anomalous strain steps in the San Juan data has also been pro duced for comparison with the nearby creepmeter data. Investigation of the long term stability of individual tidal components of the San Juan data has been completed and a paper is in preparation. Techniques for providing optimal signal detectability in the presence of typical geophysical noise are currently being investigated.
3. Calibration procedures taking both ocean loading and topographical effects into account have been completed for the Pinon Flat strain data. Similar procedures have applied to the San Juan instrument and will soon be applied to the three Parkfield instruments. A collaborative paper with D. Agnew and F. Wyatt is under preparation and will detail calibration procedures for strain instrumentation, incorporating com parison of the borehole tensor strain data from the Pinon Flat instrument with the both laser strain data and with predicted tidal data.
4. Regular processing of the Parkfield strain data has continued, with monthly reporting of any anomalous strain signals and correlation with other instruments. A near real time response procedure has been developed, tested and installed on the Menlo Park system to provide interpretable automated data for the Parkfield sites at reasonable reliabliity.
5. To facilitate comparison with other data sets, as of the beginning of 1991, all strains are expressed in engineering units. This change is of significance when refer ring to any previous reports.
RESULTS
The tidal admittance of San Juan data from 1986 until 1990 was examined using the dominant, thermally uncontaminated earth tide components O\ and M2. Two month data windows of 90 minute data were used to provide normalised tidal com ponent amplitude every month. The strain step of the Loma Prieta earthquake (Ms =l.l, 17 October 1989) only was removed from the record before processing. Results are shown in Figure 1 for the ea and ft data sets. Error bars indicate the precision of determination for each assuming equal partition of noise over all tidal components. It is clear from Figure 1 that there have been no significant or systematic changes of tidal admittance on this instrument over the whole period under discussion. In particular, the admittance anomalies suggested by Johnston and Lmde,(EOS 71, p 1461, 1990) for Searle Road (SRL) dilatometer data are absent in these tensor strain observations. In fact, this problem has been reexamined (Linde, Gladwin and Johnston, submitted, GRL) and we find that there are no precursory changes in tidal admittances at either site. The earlier report of an anomaly was due to then unrecognized changes in instru ment gain. That report also suggested post earthquake changes in admittance which, in our recent collaborative work, Linde has attributed to an excessively high voltage being applied to the SRL sensor.
385

II.2
Borehole tensor strain observations at San Juan Bautista in the near field region of the Loma Prieta event indicated an extended anomaly in the fault parallel shear beginning late in 1988 and continuing up to the earthquake (Gladwin et al., 1991). The event was followed by a two month relaxation period, after which the rate of increase of shear strain yj returned to the pre-seismic rate (1140 ne per annum), with evidence of a further increase in the rate from mid 1990. During the whole of this period, and in particular since mid-1988, the areal strain remained constant to less than 200 n 6, indicating a simple shear environment. As noted above, there was no evidence of change of tidal response on any of the instrument gauges during this latest anomaly period since Loma Prieta.
The maximum shear axis of the indicated shear strain accumulation is N42°W, close to the strike of the San Andreas fault in that region. Strains at San Juan Bautista with the Loma Prieta step removed are shown in Figure 2, and may indicate a continu ing and increasing shear strain anomaly in the region approximately parallel to the San Andreas fault system. This result has been submitted for publication.
RELEVANT PUBLICATIONS
Gladwin, M. T., High Precision multi component borehole deformation monitoring. Rev.ScUnstrum., 55, 2011-2016, 1984.
Gladwin, M.T., Gwyther, R., Hart, R., Francis, M., and Johnston, M.J.S., Borehole Tensor Strain Measurements in California. /. Geophys. Res. 92. B8 pp7981- 7988, 1987.
Gladwin, M. T. and Hart, R. Design Parameters for Borehole Strain Instrumentation. Pageoph.,123, 59-88, 1985.
Gladwin, M. T. and Wolfe, J. Linearity of Capacitance Displacement Transducers. J.Sc Jnstr. 46, 1099-1100, 1975.
Johnston, M.J.S., Gladwin, M.T., and Linde, A.T. Preseismic Failure and Moderate Earthquakes. IA.S.P.EJ. , Tokyo, August 19-30, S7-65, 35 , 1985.
Johnston, M. J. S., Linde, A.T., Gladwin, M.T., and Borcherdt, R.D. Fault Failure with Moderate Earthquakes. Tectonophysics. 144, 189-206, 1987.
Myren, G.D., Johnston, M.J.S., Linde, A.T., Gladwin, M.T. and Borcherdt, R.D. Borehole Strain Array near Parkfield, California. EOS (Trans. Am.G.Union), 68, 44, 1358 (1987).
Gladwin, M. T., Hart, R., and Gwyther, R. L. Continuous Regional Deformation Measurements Related to the North Palm Springs Earthquake of July 8, 1986.EOS, (Trans. Am. G. Un.) 69 1432, 1988.
Gladwin, M. T., Hart, R., and Gwyther, R. L. Continuous Deformation Measurements prior to the Loma Prieta Earthquake. EOS, (Trans. Am. G. Un.) 71, 1461, 1990
Gladwin, M.T., Gwyther, R.L., Higbie, J.W. and Hart, R.G., A Medium Term Precur sor to the Loma Prieta Earthquake? Geo. Res. Let.(in press).
386

II.2
25
20
15
10
01988 1988.5 1989 1989.5 1990 1990.5 1991 1991.5
Figure 1. Amplitude of the A/2 and O l tidal components for the period 1988 to 1991 for area! strain ea and shear strain YI- Standard deviations are shown. There is no significant change of admittance for any component.
-10001986 1987 1988 1989 1990 1991 1992
Figure 2. Area! and shear strain data for the three and a half years prior to the Loma Prieta event, and the year following, with the step in data at the event removed. The change of character of the shear records is evident. The times of the two Lake Ellsman earthquakes are indicated (LE1.LE2), as are the times of the Loma Prieta earthquake (LP), a Loma Prieta aftershock (a), the Chittendon earthquake sequence (Ch), and creep events also monitored on nearby creepmeters (+).
387

II.2
The USGS Parkfield Dense Seismograph Array (UPSAR)
9910-03974
Margaret Hellweg, Joe Fletcher, Lawrence M. Baker, and Paul SpudichBranch of Engineering Seismology and Geology
U.S. Geological Survey345 Middlefield Road
Menlo Park, California 94025(415) 329-5647, (415) 329-5628, (415) 329-5608, or (415) 329-5654
Investigations
1. Record local and regional seismicity.
2. Archival and processing in the database.
3. Instrument problems: Old and new.
4. Implementation of array data evaluation program GIGAS
Results
1. During 1990 and the first 4 months of 1991, the array recorded continuously, with at least 10 of 14 stations online at all times. In that time, the array recorded approximately 300 local events (A < 60 km). Since August, 1990, the earthquake activity in the Parkfield area has increased. Several of the local events were strong enough to saturate the velocity sensors in the S-arrivals, and to produce signals from the accelerometers which clearly exceeded the noise levels. Among the more than 200 regional events recorded by the array are several magnitude 3 and above shocks from Long Valley Caldera, Mono Lake and the Nevada Test Site. In addition, the array recorded P-arrivals from the Philippine event in July, 1990 and the deep earthquake in the Peru-Brazil region. The primary source of false triggers has been located. These triggers are caused by Howitzer activity at Camp Roberts, a California National Guard Training Center located 15 km west of the array.
2. As the data is retrieved from Parkfield, it is archived and checked for instrument problems and errors. This procedure is now coupled with a SYBASE database which has been designed to manage information associated with or derived from UPSAR. As the data is archived, station parameters and trigger information are automatically inserted into the appropriate database tables and properly linked to previous records. Since the archival program access to the database was implemented in early 1991, the statistics and parameters for the backlog of data have been inserted into the database. Association with event catalogs is also current.
3. Two of the major problems that plagued the array were resolved. In October and November, 1990, the clock circuits in all array elements were altered to improve the resilience of the timing adjustment capability. Since the alteration, timing for
388
II.2
events clustered in space has been consistent. The problem with the analog to digital converters in four of the Reftek data acquisition systems (DAS) has also been solved. The pre-gain amplification in these four DASs was altered so that the output of the converters is comparable to that of the other 10 DASs. Unfortunately, the telemetry problems have not yet been solved. During a period of intense cold, they were even aggravated. We are currently attacking this problem from two aspects. We are designing a logic analyzer to observe and test the telemetry system. We have also commissioned an alteration in the DAS software which will allow us to more closely observe its processing.
4. UPSAR data can now be processed interactively using standard array processing techniques which are implemented in GIGAS on a VAXstation under UIS- Windows. This program has been used to study the timing and beams for events with similar locations. Since November, 1990, the timing has been very reliable, and due to the increase in seismic activity near Parkfield since August, 1990, we have been able to investigate a number of local clusters of events.
Reports
1. Hellweg, M., Spudich, P., Fletcher, J.B. and Baker, L.M., 1991, Increasing theresolution of beamforming: An example from the USGS Parkfield Seismograph Array (UPSAR) [abs.]: XX. General Assembly of the International Union of Geodesy and Geophysics, August 11-24, 1991, Vienna, Austria
389

II. 2
Monitoring the Southern San Andreas Fault A Monument Anchoring Experiment
14-08-0001-G1786
Hadley O. Johnson, Frank K. Wyatt,and Duncan Carr Agnew
Institute of Geophysics and Planetary PhysicsUniversity of California, San Diego
9500 Gillman DriveLa Jolla, California 92093-0225
(619) 534-2019
This grant supports the operation of a fiber-optic anchoring experiment on the Coachella segment of the San Andreas Fault specifically, on the western flank of Durmid Hill, near the termination of the San Andreas Fault and its junction with the Brawley Seismic Zone (Figure 1). The experiment involves measuring the differential vertical motion of four points in the ground from depths of 1.65 m to 48 m. The aim of this project is to measure and understand the stability of the near-surface material in the region to determine if it is stable enough to support precise measurements of strain and tilt. Efforts at Pinon Flat Observatory (PFO) have shown that observatory-based instruments can measure signals up to one thousand times more precisely than geodetic surveying techniques in the period range of months to minutes, while accurately recording the secular accumulation of deformation provided that the instruments are adequately anchored to depth. Determining what depth is adequate in the material of this area as a first step toward consideration of more extensive instrumentation is the goal of this project. The study area, along the eastern shore of the Salton Sea has been identified as one of the more likely initiation points for a great earthquake during our lifetime. Figures 1 and 2 (modified from E.A. Babcock's thesis, University of Cal ifornia, Riverside, 1969) present the land ownership, cultural features, and the geology of the area immediated adjacent to the instrument site MEK.
Construction at the field site began in September, 1990, after preparation of the optical-fiber sensors in our lab, and after the unbearably hot summer weather of the Imperial/Coachella Valley, with its extreme daytime temperatures. By using lengths of optical fiber for the interferometric path-length measurement, as opposed to tensioned wires or laser interferometry in evacuated tubing, it is possible to make many differential measurements in the same borehole rather easily, and with high precision and low cost. The fiber optic sensors were constructed by first cutting them to the desired length and silvering their ends, and then permanently sealing them against moisture. (This last part is technically difficult because of the water pressures encounted in borehole work). After drilling was completed, the bundle of fibers (12) was lowered to the bottom of the open borehole and they were cemented in place. We next built a sub-surface vault for housing the optics and electronics. The vault was made of two 4-foot-diameter sections of drainage culvert tipped on end; these were positioned side-by-side with a "window" cutout connecting the two. The taller of the
390

II. 2
two sections of culvert serves as an entrance-way while the shorter buried section houses the laser, optics, and electronics necessary to make the differential displacement measurements. The installation was completed on December 13, 1990, and we have been collecting data since that time.
Figure 3 shows data from the optical fiber vertical strainmeters: MEK SHAL refers to the depth interval from 5.1 m to 7.9 m, MEK MIDL 7.9-22.9 m, MEK DEEP 22.9- 47.8 m, and MEK LONG 5.1-47.8 m. (One final depth interval, from 1.7 m to 5.1 m, is not shown here as we have yet to install its sensor; owing to optical fiber's sensi tivity to temperature and the extreme temperature variations expected near the ground surface we have designed and built a mechanical gauge for this shallow depth range.) Initially all the fiber measurements showed some amount of diurnal temperature change; this was greatly reduced when vault insulation (dirt and styrofoam) was added on 1991:018. Up until this point the vault was exposed to the elements. The mid- depth fiber (MEK MIDL) continued to show a pronounced temperature response because one of its fibers was pinched where it entered the optics box in the vault, creating an artificial strain in the fiber. This was remedied on 1991:035 and all the interferometers have done well since that time. One of the more encouraging aspects about this data is that, apart from the diurnal cycles from MEK MIDL, the sum of the three intermediate-interval measurements (SHAL, MIDL, and DEEP) agree so well with the single measurement spanning the whole interval (LONG): this consistency (which, simply to reduce clutter, is not presented in the figure) shows that the sensors are operating as desired.
Though it is not the primary aim of this work, we also see various short-period "geophysical" signals on several of the fibers. This is most true of the longest fiber measurement, where vertical strain changes caused by air-pressure loading are conspi cuous. We have estimated the response to this using the nearest pressure record we had for this time period (at PFO, 65 km away), getting -5.1 GPa for the long-period ratio of air-pressure to strain. For comparison we get three times this number for the material at PFO. The earth tides observed in the MEK LONG record, which are larger than expected, allow for an estimate of Poisson's ratio for the "rock" at MEK. We estimate Poisson's ratio to be 0.43, which is quite high; the material at MEK is remarkably elastic in shear. Finally, an estimate of Young's modulus, calculated from both of the effects above, suggests a modulus one-tenth of that deduced for Pinyon Flat. Given the relative weakness and plasticity of the depositional material in the Coachella Valley, this is pretty much what we should expect.
Once the air-pressure signal is removed, the residual strain on the Long fiber is quite smooth and appears be settling down rapidly. This is an especially rewarding outcome given that the fibers were tensioned only two days before the electronics were installed, which is where the data presented here begins. Even with such a short record we can say that the long-term ground movements appear to be small and well enough behaved to suggest long-baseline strain and tilt measurement is possible in this area. All in all we could not ask for better results to have come out at the start.
391

II.2
Instrument Site: MEK : - Proposed Site I
Figure 1
* Instrument Site: MEK San Andraas lauM
Heel tow ho4e
Bocrepo fotiiictlofi
Lake Caruila sand
Lake Cahulla aid
Qualamary aluvkiin Shavers Wa«
Figure 2 352

II.2
cQ)E<DO
JDQ. (0
'Optical-Fiber Ground Displacement Observation - MEK
500
400
300
200
100
rv\
MEK SHAL
MEK MIDI
MEK DEEP
MEK LONG
MEK LONG (w/ baro removed)
Inverted BARO (» PFO; 60 kPa F.S.)
1. Switches set wrong.
2. Failure of power supply.3. Power Outages.
MEK INTP (40°C F.S.)'
350 360 5 15 25 Time (Day Number, 1990-1991)
35
Figure3
393

II.2
TILT, STRAIN, AND MAGNETIC FIELDMEASUREMENTS
9960-2114M. J. S. Johnston, R. J. Mueller, G. D. Myren
Branch of TectonophysicsU. S. Geological Survey
Menlo Park, California 94025415/329-4812
Investigations
[l] To investigate the mechanics of failure of crustal materials using data from both deep borehole tensor and dilational strainmeters and near surface strainmeters, tiltmeters, and arrays of absolute magnetometers.
[2] To develop physical models of -incipient failure of the earth's crust by analysis of real-time records from these instruments and other available data.
Results
[1] RECENT SEISMOMAGNETIC AND VOLCANOMAGNETIC EVENTS: IMPLICATIONS FOR PHYSICAL MECHANISMSRecent seismic and volcanic events for which focussed magnetic and elec tromagnetic monitoring data have been obtained have occurred on the Izu Peninsula in Japan, the Long Valley volcanic region in California and on the San Andreas fault. For volcanic events, contributions from different physical processes can be identified in different time periods. These processes include slow near-surface thermal demagnetism effects, piezomagnetic effects, and effects from rotation/displacement of magnetized material. Second-order effects such as electrokinetic effects and changes in the telluric current system that result from modification of the electrical conductivity structure, may also occur but critical parameters such as pore pressure gradients, zeta poten tials, etc, are not measured and are poorly constrained. For seismic events, coseismic contributions are instantaneous with no indication of short-term response effects with a decay time constant as expected for fluid driven elec trokinetic processes. Simple piezomagnetic dislocation models using parame ters determined geodetically or seismically generally match the observed sig nals in size and sign but other possibilities can not be completely discounted. Transient higher frequency signals might be driven by localized dynamic changes in electrical conductivity, localized charge generation mechanisms, and electrokinetic effects. Formulation of realistic models of these processes that avoid violation of other available geophysical data poises an interesting challenge in this field.
[2] ON PHYSICAL MECHANISMS PERTAINING TO THE LOMA PRIETA EARTHQUAKE ULF ELECTROMAGNETIC EMISSIONUnusual ULF signals were recorded predominately in the frequency band 1 Hz to 0.01 Hz at three different times during the month prior to the October 18, 1989, Loma Prieta M,7.1 earthquake (Fraser-Smith et al., 1990). Three physical mechanisms are considered relevant if these signals are assumed to be generated in the hypocentral region. These are: 1) dynamic changes in
394

II.2
electrical conductivity due to strain driven crack opening and closure, 2) dynamic charge generation due to strain, hydrodynamic, and gasdynamic processes, and 3) electrokinetic effects due to dynamic pore pressure varia tions. Since the electrical conductivity varies between 1 S/m and 0.01 S/m and the seismic attenuation factor (1/Q) is about 0.03 in this region, dynamic magnetic, seismic and strain signals are attenuated comparably in the 1 Hz to 0.01 Hz frequency band. The absence of detectable seismic or strain signals on nearby seismometers and borehole strainmeters at the 10 micron/sec and 10~ll /sec level, respectively, strongly limits the size (i.e. the moment) of the source region driving the mechanisms above. Conservative models of these processes suggest stress gradients and pore pressure gradients exceeding 1 Kbar/km and 1 bar/km are required to generate the required crack oscilla tion and electrokinetic effects, respectively, but associated strain oscillations from these gradients should be readily detectable unless the region affected is quite small. These problems, together with the inherent difficulty facing charge generation mechanisms of continuously maintaining charge separation within this conducting region for a long enough time and over a large enough area, suggest that the ULF electromagnetic signals were generated relatively close to the receiver.
[3] BOREHOLE STRAIN ARRAY IN CALIFORNIAA network of 15 borehole strainmeters along the San Andreas fault zone and in the Long Valley Caldera continue to be monitored and maintained. All instruments are installed at depths between 117-m and 324-m and all are between 1-km and 5-km from the the surface trace of the fault. High fre quency dilatometer data in the frequency range 0.005 Hz to 100 Hz are recorded on 16-bit digital recorders with least count noise less than 10~n . Low frequency data from zero frequency to 0.002 Hz are transmitted through the GOES satellite to Menlo Park, CA, using a 16-bit digital telemetry sys tem. At the USGS in Menlo Park the data are displayed in "almost real time" and are continuously monitored with detection algorithms for unusual behavior. Least-count noise is about 5*10~12 for the on-site digital recordings, and about 2*20~n for the satellite telemetry channels. Earth strain tides, strain transients related to fault creep and numerous strain seismograms from local and teleseismic earthquakes with magnitudes between -1 and 6 have been recorded on these instruments. Static moments and total earth quake moments are determined from the co-seismic strains and total strain changes observed with the larger events.
[4] CROWLEY LAKE AND SAN ANDREAS LAKE WATER LEVEL MONITORINGWater level monitoring sites have been installed on Lake Crowley in the Long Valley/ Mammoth Lakes region and San Andreas lake on the San Andreas fault just south of San Francisco. These data provide differential water level measurements (tilt) with a measurement precision of less than 1 mm on base lines of 5 to 8 kilometers. Monthly averages of the data from San Andreas lake between 1979 and 1989 indicate a tilt rate of 0.02±0.08 microradians/yr (down S34«E).
[5] DIFFERENTIAL MAGNETOMETER ARRAY IN CALIFORNIAWe continue investigations of local magnetic fields and relationships to cru- stal strain and seismicity in the Parkfield region and in southern California. The network consists of 9 stations which are all sampled synchronously every 10 minutes and transmitted with 16-bit digital telemetry to Menlo Park, CA through the GOES satellite. Data are monitored daily with particular atten tion to the seven stations operating in the Parkfield region of central
395
II.2
California.[6] PRE- AND POST RUPTURE EARTH TIDAL RESPONSE NEAR
THE OCTOBER 18, 1989, LOMA PRIETA ML 7.1 EARTH QUAKE.Modification of the elastic properties of fault zones prior to fault failure has long been expected and should be detected by changes in earth tidal response. High quality tidal strain recordings were obtained in the epicentral region prior to, and following, the October 18, 1989, ML 7.1 Loma Prieta earth quake. These recordings were made in deep boreholes with both Sacks- Evertson dilational strainmeters (sensitivity 10~n) and 3-component tensor strainmeters (sensitivity 10~9 ). The closest dilatometer, SRLS, was 33 km to the south-east along strike from the epicenter of the earthquake but probably less than 10 km from the southern end of the final rupture. Tidal admittance (normalized by ocean-load corrected theoretical earth tides) has been calcu lated at 10 day intervals with a sliding 2 month data window of hourly aver aged data starting in August, 1987 and ending in August, 1990. The cose- ismic offset is not included. During the 2-year period prior to the earthquake, the normalized M2 amplitude may have increased in a linear manner by a few percent per year but scatter in these estimates (probably due either to small data gaps, incomplete removal of atmospheric pressure loading, and/or incomplete correction for ocean loading) is of the same order(<r= 2.5%). A least-square linear fit to these data prior to the earthquake indicates a rate of 2.9±0.5%/year. During the 2-month period immediately before the earth quake, M2 amplitudes calculated at 10 day intervals from a sliding 15 day window of 10-min data have a standard deviation of 1.5%. We conclude that no significant variation in M2 tidal admittance occurred before the Loma Prieta earthquake. Since fractional changes in strain tide amplitudes are pro portional to changes in Poisson's ratio and inverse bulk modulus (Beaumont and Berger, 1974), this implies stability of these parameters at the few per cent level during the two years before the earthquake. Following the earth quake, however, we have observed a uniform decrease with time in normal ized M2 amplitude that now totals more than 10%. This is probably a conse quence of continuing fracture of fault zone materials to the south and beneath this instrument.
[7] POSSIBLE TECTONOMAGNETIC EFFECT OBSERVED FROM MID-1989, TO MID-1990, IN LONG VALLEY CALDERA, CALI FORNIA.Precise measurements of local magnetic fields have been obtained with a differentially connected array of three proton magnetometers in the Long Val ley caldera region since 1984. Two magnetometers are located inside the cal- dera with a third reference magnetometer located 26 km southeast of the cal dera. After correction for secular variation, it is apparent that an anomalous 2 nT decrease in the magnetic field occurred from mid-1989 to mid-1990 at the magnetometer located closest to the center of the resurgent dome inside the caldera. During this period a significant increase in geodetic strain rate of 8.5 ppm/a was observed on the two-color geodimeter network within the cal dera from October, 1989, to mid-1990 and a dramatic increase in seismic activity occurred from December, 1989 to July, 1990. A simple dilatational point-source model with pressure increasing by 52 Mpa from October 1989 to August 1990 at a depth of about 7 km beneath the center of the resurgent dome can be fit to the strain data. If this same model is used to calculate piezomagnetic fields in the caldera, the results obtained agree with the observed local magnetic field data provided the Curie point isotherm is at a
396

II.2
depth of <5 km. Taken together, these magnetic, seismic and geodetic data suggest that an episode of active magmatic intrusion occurred from late 1989 to mid-1990 at a depth of about 7-8 km beneath the resurgent dome within the Long Valley caldera. Other indications of this intrusion should be evident in measurements of leveling, local gravity, and seismic imaging data.
[8] SAN FRANCISCO BAY AREA INSTRUMENT CLUSTERSites for eight dilatometers, three water wells, 2 tensor strainmeters, and three creepmeters along the Hayward fault in the East Bay have been selected (Fig l). Boreholes at the strainmeter and water well sites will soon be drilled to depths between 500 and 1000 feet. Installation is expected to start in a late summer.
Reports
Mueller, R. J., M. J. S. Johnston, and J. O. Langbein, 1990, Possible Tecto- nomagnetic Effect Observed from Mid-1989 to Mid-1990 in Long Valley Cal dera, California. Trans. Am. Geophys. Un. v71, 1467.
Johnston, M. J. S. and A. T. Linde, 1990, Possible Change in Earth Tidal Response Before the October 18, 1989, Loma Prieta ML 7.1 Earthquake. Trans. Am. Geophys. Un. v71, 1461.
Mueller, R. J., M. J. S. Johnston, and J. O. Langbein, 1990, Possible Tecto- nomagnetic Effect Observed from Mid-1989 to Mid-1990 in Long Valley Cal dera, California. Geophy. Res. Lett, (in press).
Hill, D. P., M. J. S. Johnston, J. O. Langbein, C. E. Mortensen, A. M. Pitt, and S. Rojstaczer, 1991, Response Plans for Volcanic Hazards in the Long Valley and Mono Craters Area, California. U. S. Geological Survey Open-File Report 91-xxx
Johnston, M. J. S., 1991, Recent Seismomagnetic and Volcanic Events: Implica tions for Physical Mechanisms, Abs for IUGG/IASPEI Meeting, August 11- 24, Vienna (in press).
Johnston, M. J. S., and A. Fraser-Smith, 1991, On Physical Mechanisms pertain ing to the Loma Prieta Earthquake ULF Electromagnetic Emissions, Abs for IUGG/IASPEI Meeting, August 11-24, Vienna (in press).
397

122*10'PROPOSED MONITORING SITES
122'05' 122*
II.2
121*65'
37'45"
122'10' 122*05' 122"
0 1 2 3"4 5 KM
A STRAINMETER
D CREEP
£1 WATER WELL
37'40'
37'35'
37'30'
398

II.2
GEODETIC STRAIN MONITORING
9960-02156 9960-02943
John Langbein Branch of Tectonophysics
U.S. Geological Survey345 Middlefield Road, MS/977Menlo Park, California 94025
(415) 329-4853
Investigations
Two-color geodimeters are used to survey, repeatedly, geodetic networks within selected regions of California that are tectonically active. This distance measuring instrument has a precision of 0.1 to 0.2 ppm of the baseline length. Currently, the crustal deformation is being monitored within the south moat of the Long Valley caldera in eastern California, near Pearblossom, California on a section of the San Andreas fault that is within its Big Bend section and across the San Andreas Fault at Parkfield, California. Periodic comparisons with the prototype, two-color geodimeter are also conducted near Parkfield, California. These intercomparison measurements serve as a calibration experiment to: monitor the relative stabilities of the portable and prototype geodimeters.
Results
1. Long Valley Caldera
The data from the Casa subnetwork (Figures 1 and 2) continue to show extension in response to inflation beneath the resurgent dome. However, on the baseline CASA- KRAKATAU, the extension rate has decreased to nearly its background rate during the past 6 months relative to 75mm/arate that started in October 1989. Because of its location and its high frequency of observations, this baseline is particularly sensitive to changes in inflation beneath the resurgent dome. The previous semi-annual report discussed the results of modeling the data. Those conclusions still appear to be valid.
Perhaps more important is the observation that the initiation of inflation in October 1989 preceded the seismicity by several months. This observation is illustrated in Figure- 3 where the bottom panel shows the time and magnitude of caldera earthquakes with M>1.5. The upper panel shows the extension of the baseline CASA-KRAKATAU and the cumulative moment of the earthquakes located both in the caldera and under Mammoth Mountain. Although there was a small earthquake swarm one month after the onset of inflation, most of the seismic strain release occurred some 4 to 5 months later.
399

II.2
2. Parkfield
Part of my time was devoted to sorting gear left by Bob Burford's retirement, and the delivery of two more two-color geodimeters from CIRES. I am now the project chief of Burford's two-color project (9960-02943) and so I have merged both his and my projects. Furthermore, since we will not be contracting with CIRES for the operation and maintenance of the Parkfield two-color instrument, this is now my responsibility. (We now contract directly with D. Hamann for the operation of the instrument).
The new two-color geodimeters were delivered to Parkfield by CIRES by the end of March 1991. In late November, we tried operating the more complete of the two instruments. We found that the blue laser was weak and noisy, and that the heater servo would not keep the the modulator cavity at a resonance unless the input power to the cavity was attenuated by 6-to 10-db. Until we install a functioning blue laser on the instrument and when I can find time, testing of this instrument will be a low priority.
After the recent B-level alert in mid March 1991,1 wrote some algorithms to attenuate the seasonal affects of rainfall and soil moisture on both the two-color line-length changes and the creepmeter data. To date, this has been the only B-level alert from the Parkfield prediction experiment and it was triggered by two large (>5--mm) creep events at two adjacent creepmeters, XPK1 and VAR1, separated by 3-km. Coinciding with the near simultaneous creep events was a storm that dropped about 9-cm of rain in three days. If the creep event with 5^mm of slip extended to any significant depth, greater than 0.5-km, then other strain monitoring instrumentation should have recorded detectable signals. The nearby dilatometers and two-color baselines did not detect any signal during the time of the apparent creep event. Most likely, the rainfall triggered some localized displacements near the piers of the two creepmeters. Examination of both the long-term creepmeter and two-color data show that several of the meters and baselines have seasonal (365-day period) and shorter term fluctuations correlated with heavy rain preceding the events. Furthermore, the seasonal periodicities change in amplitude and phase from year to year. The algorithm attempts to incorporate these simple observations. During each "rainfall" year (July 1 to June 30), combination of a 365-day sinusoid and a rainfall function is fit to a version of the data with its long-term secular rate removed. The rainfall function is the daily rainfall amounts convolved with an exponential function with a 30-day decay constant. (See Langbein et a/., 1990). Physically, the rainfall function represents the fast wetting of the soil followed by a period of desiccation. Functional continuity is constrained from one rainfall year to the following rainfall year. The results of the data adjustment are mixed. For the two-color data, this algorithm significantly reduces the variance for nearly all baselines. Figure-4 shows one example for the baseline MIDE. Although the variance of the creep data is reduced by this algorithm, the high frequency noise is increased and the algorithm falsely introduces "creep" events at times of rain when there was no creep detected. Figure-5 gives XPK1 as an example.
400

II.2
Reports
Langbein, J., "Earthquake explanations in Scientific correspondence to Nature, Nature", v. 349, p. 287, 1990.
Langbein, J.O., D.P. Hill, T.N. Parker, S.K. Wilkinson, and A.M. Pitt, Renewd inflation of the resurgent dome in Long Valley Caldera, California, from mid-1989 to mid-1990, EOS, v. 71, p. 1466, 1990.
401

II.2
Figure Captions
Figure 1. Map showing the location of all the baselines within and near the Long Valley caldera that are measured with a two-color geodimeter. The locations of the caldera, resurgent dome, Inyo craters, Crowley Lake and the major roads are also shown.
Figure 2. Changes in distances for the seven most frequently measured baselines within the caldera. These baselines use CASA as the central instrument station. The error bars represent ±1 standard deviation.
Figure 3. Plot showing the relation between inflation of the caldera and seismicity within the caldera since January 1988. The bottom plot shows the time and size of all earthquakes greater than Ml.5. that occurred within the caldera. The upper panel shows the cumulative moment release of caldera earthquakes (scale on left), and the extension observed on the baseline CASA-KKAKATAU which nearly spans the resurgent dome (scale on right).
Figure 4. The affect of fitting to the baseline MIDE a function combining the rainfall data and sinusoids having a year-long period but differing amplitudes and phases. The bottom panel is the line-length changes from the baseline MIDE after a linear trend has been removed. The middle panel is the computed function having both the seasonal function and the rainfall data convolved with an exponential with a 30-day decay constant. The larger sharp spikes represent times of rain that correlate with observed displacements. The top panel shows the residual line-length changes after the function in the middle panel is subtracted from the detrended data. The standard deviation of the detrended data is 3.28-mm, and this is reduced to 1.48-mm after the data has been adjusted from the affects of seasonal variations and rainfall.
Figure 5:. The affect of fitting to the creepmeter data from XPKl a function combining the rainfall data and sinusoids having a year-long period but differing amplitudes and phases. The bottom panel is the line-length changes from the baseline XPKl after a linear trend has been removed. The middle panel is the computed function having both the seasonal function and the rainfall data convolved with an exponential with a 30-day decay constant. The larger sharp spikes represent times of rain that correlate with observed displacements. The top panel shows the residual line-length changes after the function in the middle panel is subtracted from the detrended data. The standard deviation of the detrended data is 3.1-mm, and this is reduced to 2.4-mm after the data has been adjusted from the affects of seasonal variations and rainfall.
402

4S O
45' -
40' -
35' -
119' 55 45'
FIGURE 1

DIS
PLA
CE
ME
NT
, m
m
H Q

o Cn
CM: 100 o
w S oauI-H
s01t 4
u01
1988
1988
: Caldera Quakes
f ^Mammoth,,.- ": ' Quakes
... .....
i1989
i i i i i r1990
TIME
90
60
70
60
502w
r- 40W
30 £3Q
20
10
0
FIGURE 3N5

ISO
MIDE1 -RESIDUflLS5 -
0 -
-5 :
E E
UJ2UJo
1984 1985 1986 1987 1988 1989 1990 1991 1992
RfllNFflLL-FUNCTION5 -
0 -Q. 0)5 -5
10
5
1984 1985 1986 1987 1988 1989 1990 1991 1992
DETRENDED-DflTfl
0 -
5 -
1984 1985 1986 1987 1988 1989 1990 1991 1992
FIGURE 4
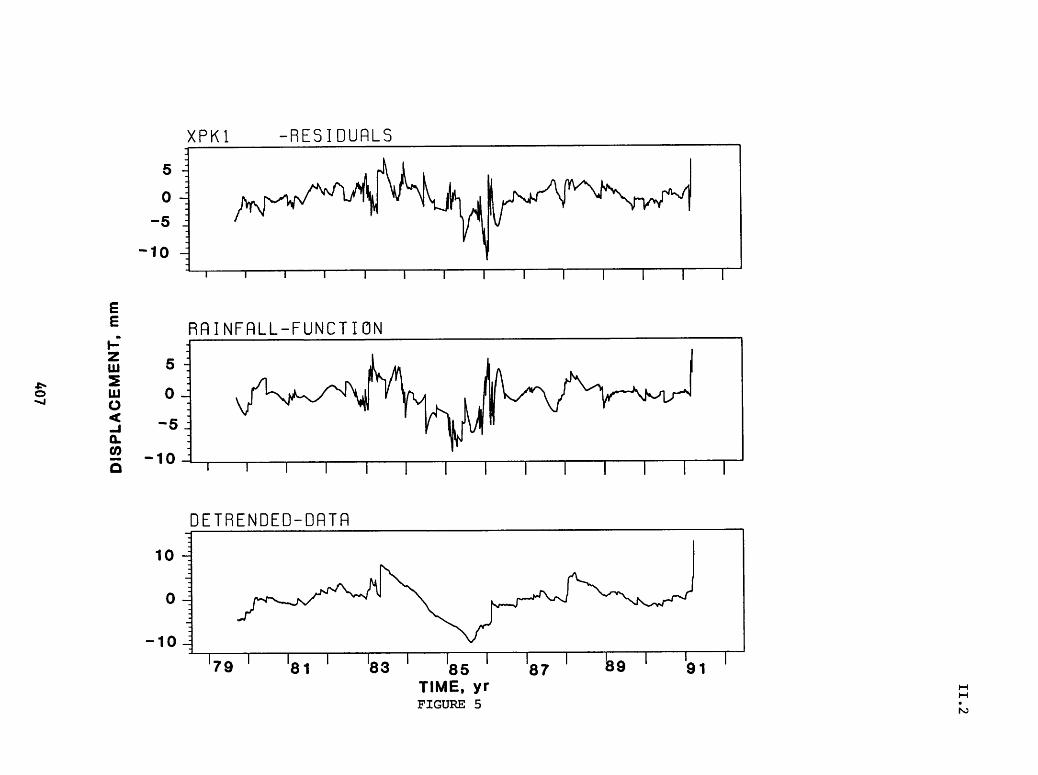
DIS
PL
AC
EM
EN
T,
mm
i oI
CD 00 03
CO
H _
O
m o
o -
en*<
00 co-1
CO"
o
o.I.
...I..
..I...
.Io
01
ID o i a
ID
ID ID ID r~ i i Q
I .A O
01
o
01
.1.... I.
...I. ..,!..,.
I ID rn CO i i
a cz ID r~ CO

II.2
Microearthquake Data Analysis
1-9930-01173
W. H. K. Lee U.S. Geological SurveyBranch of Seismology
345 Middlefield Road, MS 977Menlo Park, California 94025
(415) 329-4781
Investigations
The primary focus of this project is the development of state-of-the-art computation for analysis of data from microearthquake networks. For the past six months I have been involved in:
(1) Implementing Seismic Instrumentation for Topical Volcano StudiesIn collaboration with Gray Jensen and Sam Rodriquez, I am designing and implementing seismic instrumentation for topical volcanic studies. Two portable arrays (one telemetered and one hardwired are being implemented to meet the scientific objectives of volcano research. These two portable arrays are based in PC-technology, and are designed to have a dynamic range of about 90 db. The hardwired array will have 64 channels, and the digital telemetered array will have up to 48 channels.
(2) Using PC for Network Data Acquisition and ProcessingA low-cost 128-channel PC data acquisition, processing and analysis was implemented with the off-the-shelf hardware and a multiplexer designed by Jim Ellis and modified by John Rogers. Preliminary results for using this system to record a set of stations selected from the USGS CALNET was presented at the 1990 AGU Fall National Meeting in San Francisco. I also organized a symposium on "Seismic Network Data Acquisition, Processing and Analysis" at the 1991 SSA Annual Meeting in San Francisco, CA.
ReportsLee, W. H. K. , C. F. Daiss, P. B. Dawson, J. R. Evans, and W. D.
Hall (1990). Using a PC-based system for data acquisition from selected stations of the USGS Central California Seismic Network (Abstract), EOS, v. 71, p. 1496.
Lee,\ W. H \K., (1991). Using personal computers for seismicnetwork operations and research. Seism. Res. Lett., v. 62, p. 22.
408

II.2
Lee, W. H. K., (editor), 1991. "Digital Seismogram Analysis and Waveform Inversion". IASPEI Software Library, Volume 3, Seism. Soc. Am., El Cerrito, CA.
Lee, W. H. K., (editor), 1991. "Source Code Package for IASPEI Software Library Volume 3", Seism. Soc. Am., El Cerrito, CA,
409

II. 2
The Downholc Seismology Project at Parkfield
USGS, #14-08-0001-01968P.E. Malin and M.G. Alvarez
Duke University, Durham, NC
Introduction.
In the past 6 months we have moved the MEQ data reduction and our analysis part of the Parkfield Downhole Seismology Project to Duke University, in Durham, NC. Data are continuing to be distributed to UCB and the USGS on a weekly basis, using both a new computer transfer via FTP and Email, as well as the traditional mailing of tapes. In 1991, we have published or have participated in the publishing of the following paper based on data from the project:
1991 Malin, P.E., and M.G. Alvarez. Recent changes in the episodic character ofParkfield microearthquake activity. Manuscript submitted to Science in 4/91.
1991 Ben-Zion, Y., and P.E. Malin. San Andreas fault zone head waves near Parkfield, California. Science. 251, 1592-1594..
1991 Blakeslee, S.N., and P.E. Malin. High-frequency site effects at two Parkfield downhole and surface stations. BSSA. 81, 332-345.
Current Investigations.
Our must recent work has concentrated on the regional distribution of microearthquake moment release near Parkfield. By separating microearthquakes by region, we have observed a location-dependent increase in the rate of cumulative moment (and, by implication, fault slip) near and on the San Andreas fault at Parkfield, CA. The subset of events outside of the Parkfield segment of the San Andreas fault show increased rates of cumulative moment beginning in April 1990. The subset at Parkfield shows the same increase some 4 to 8 months later. Prior to this change and back as far as June 1987, the average cumulative moment rate was nearly constant, except for the occurrence of an M«4 event in May 1989. Since this event, the cumulative moment rates have increased non-linearly with time. We suggest the data give evidence of a southward diffusing stress front, propagating at a speed of 45 to 90 km/yr.
The region of the Parkfield microearthquake study is shown in Figure 1, along with the epicenters of all the events and the sites of the borehole seismographs used to detect and locate them. Figure 2 shows these events in cross section. Figure 3 shows the cumulative moment of Parkfield events from June 1987 to several months after May 1989, when the M~4 event took place. This earthquake occurred midway between the 2 southernmost recording sites and at a depth of more than 8 km, a somewhat uncommon location for events of any size. The moments of individual events were calculated by integrating the S-wave displacement and velocity spectra over frequency and assuming that the resulting values fit a frequency-squared model of the earthquake source (5). Summing these moments as a function of time yields the curve in Figure 3, which also shows the least-squares trend line and resulting residuals. (For reasons of scale, the moment of the M«4 event has been omitted from the figure.)
410

Z Moment = A + -(Tf -t)-
II.2
The trend line and residual moments suggested to us that Parkfield microearthquake activity was being driven by some steady process in which the fault would slip rapidly forward in one period, as evidenced by increased activity, only to lag behind in the next period. It thus seemed possible to anticipate periods of overall increased and decreased seismicity, albeit without reference to any particular location, event size, or precise timing. The M=4 event occurred in a period when microearthquake activity was lagging behind the average. However this event was not anticipated on the basis of the prior cumulative moment data, as no events of this magnitude took place in the earlier lulls in cumulative moment. A significant departure from this trend began after the first quarter of 1990, and differed by region, as illustrated in Figure 4.
The change in seismic activity can be separated by region, as indicated by the boxes shown in Figures 1 and 2. Boxes 1 and 2 divide the seismicity taking place on the San Andreas fault into northern and southern segments, Box 2 containing the Parkfield segment, Box 1 containing the segment to the north. Box 3 contains all events outside of the Parkfield segment, including Box 1 and the events surrounding but not on the Parkfield segment. We have considered our cumulative moment data in the light of two mechanical models, one for time to failure in rate-dependent material processes (9-11) and a more general one for stress diffusion along rupturing plates (12). In the case of cumulative moment, the former model is given by
m
where t is time and A,K,m, and Tf are constants to be determined from the data. We have used a simplex algorithm (13,16) to fit various subsets of our data with this relation, making use of new cumulative moment data as they came in from the field. Fits to the data before the M=4 event proved unstable, due apparently to a decreasing rate of cumulative moment in that time period. In terms of the time-to-failure model, this suggests that the data prior to the M=4 event do not belong to the foreshock sequence of this earthquake; they may perhaps belong to the aftershock sequence of some other event outside our time window (10,11). Fits to the cumulative moments in Boxes 2 and 3 for the time period after the M=4 earthquake, shown in Figure 4, indicate that events in that time period are also unrelated to the M~4 event. Moreover, the Tf derived from the Box 2 and Box 3 data sets differ by about a month, and this difference is increasing with the addition of more data. We thus have no confidence that the time-to-failure model applies to the Parkfield area.
Instead, we propose that the cumulative moment data give evidence of a stress diffusion process taking place somewhere below the seismically active region north of Parkfield. Our proposal stems from the observation that the 1990 change in cumulative moment took place first in the north and then some 4 to 8 months later in the south. Since the distance between the centers of the boxes used to separate the regions is about 30 km, the propagation speed of the implied disturbance is on the order of 45 to 90 km/year. Theoretical analysis of stress relaxation below the seismogenic zone indicates that when propagation speeds are reduced to less than 100 to 200 km/year by "barriers" or "asperities" (inhomogeneities in crustal strength), the result is elastic loading of these features (12). The rate of loading would be proportional to the seismicity and the trend of the cumulative moment.
411

II.2
Figure 1. Map showing locations of the Parkfield borehole seismographs (triangles), the epicenters of 1,856 microearthquakes, and the regions discussed in the text and other figures. Box 3 includes the events in Box 1. The westward fanning of events in Box 1 is due in part to the poor station coverage and faster velocities in this region. Figure 2. Hypocenters of events in Boxes 1 and 2 projected onto vertical planes through the zone of highest seismicity in each box. These planes probably correspond to the San Andreas fault. The seismicity in Box 2 shows clustering which is not seen in Box 1. The dashed lines indicate the approximate outlines of the aseismic patches where moderate earthquakes might take place in the future (1). The recording stations are shown as solid triangles.Figure 3. The cumulative moment, trend, and residual of all Parkfield area earthquakes up to and beyond the M=4 earthquake of 5.89. The numbers written above the peaks and below the troughs of the residual moments are the number of days between these time points. The moment of the M«4 event was removed before least squares fitting of the trend line.Figure 4. Cumulative moments by region from 6.87 to the beginning of 3.91. The moments in Box 3, which includes all events outside of Box 2, show a rapid change in trend in the second quarter of 1990. A similar change appears to have taken place some 4 to 8 months later in Box 2. The data in each box have been fit with time-to- failure models, with the respective Tf times shown by corresponding vertical lines.
References and Notes1. W. H. Bakun and T. V. McEvilly, Science 205, 1375 (1979).2. W.H. Bakun and T.V. McEvilly, J. Geophys. Res. 89, 3051 (1984).3. W. H. Bakun and A. G. Lindh, Science 229, 619 (1985).4. P. E. Malin et al., ibid 244, 557. (1989)5. D. J. Andrews, in Earthquake Source Mechanics, American Geophysical Union
Monograph 37, K. Aki and P. Richards, Eds., American Geophysical Union, Washington, D. C., (1986).
6. J. D. Sims, USGS Misc Field Studies Map MF-2115 (1990).7. W. R. Dickinson, Bull. Geo. Soc. Am. 77, 707 (1966).8. A. G. Lindh and D. M. Boore, Bull. Seismol. Soc. Am. 71, 95 (1981).9. B. Voight, Science 243, 200 (1989).10. C. G. Bufe et al., EOS 71, 1461 (1990).11. D. J. Varnes, PAGEOPH 4, 661 (1989).12. F. K. Lehner, V. C. Li, J. R. Rice, JGR 86, 6155 (1981).13. J. E. Dennis and D. J. Woods, SI AM 87, 116 (1987)14. N. Toksoz et al., Pure Appl. Geophy. 117, 1258 (1979).15. C. H. Scholz, Nature 267, 121 (1977).16. We thank numerous colleagues at the University of California at Berkeley
and the United States Geological Survey, with whom we have shared the effort of keeping the Parkfield downhole seismology project alive, and without whose efforts none of the results discussed here would have been possible. We thank G. Lindley of UCSB for use of his simplex curve fitting routine.
412

II.2
Figure 4
36° 10.00'-
36° 00.00'-
35° 50.00'-
35°40.00'-
120° 50.00'1
120° 40.00'r
120° 30.00'I I 1 I IT
120° 20.00' 120° 10.00'
0 -1.0 < M < 0.0O 0.0 < M < 1.0
8 1.0 < M < 2.02.0 < M < 3.0
413

IQ
12-
14-
18-
20-
74J_
..
Q
74
72
72
70_L
68 66 64 62
I 70 68
I 66
I 64
60 58 56J_
54 52I
A A A JtA A
50J_
48 46I
I 60
I 58
I 56
L Mag > 1.0 Mag < 1.0
Borehole Station
44I
n-
n
62 60 58 56 54
Minutes North of 35 Degrees
I52
I 50 48
I 46
I 44
42I
I 42
-fO
-20to

Cum
ulat
ive
Mom
ent (
dynn
es-c
m)
2 4
00
'
00
0)
s <o
-II

(N
H H
a-621
7-621
6-621
5-621
*- 621
a-621
2-621
1-621
0-60
6.87 12.87 6.88 12.88 6till
Cumulative Moment = delta + [K/m (Tf - t)A-m]
atooinCM
in
n2
-.-
Box 2 p-*^
^^^ ^ r*"** r-"''~'~^
. *?* .. f Box 3^x* " ,. .." '"i //
^ -. » -i
.89 12.89 6.90 12.90I I I I
/r*7 ""~
;X / /I'T! /' ! -X^'
</ v~*'^*
SJJ?
<^~^*i-^^""" x'^..--1* .^
--/ Xx1^ *^ / .'_^^ «_^ *"
^
^^
j
-«621
~7621
-6621
-5621
-4 621
-3 621
-2621
H621
-0eO
6.87I
12.87 6.88 12.88 6.89
Time (mo.yr)
12.89 6.90 12.90
vo r-l Sf

II.2
Leveling survey of the Imperial Valley Mekometer network
14-08-0001-G1961
Ronald G. Mason Geology DepartmentImperial College
London SW7 2BP, England (011-4471) 589 5111
Investigation
This project involves (1) leveling the main block of the existing high precision edm network to first order accuracy, and (2) extending the network, and the measurements, to provide better coverage of the Imperial fault and Brawley seismic zone north of their junction (Figure 1). This will be the first leveling in the network. It will produce no immediate scientific return, but it will enable future movements of the ground surface to be monitored in three dimensions.
Results
During this reporting period twelve weeks were spent in the field, and the program is now almost complete. More than 170 stations in the main block, and fifty new stations in the extensions, have been leveled, involving almost 400 km of leveling line in all (Figure 1). Connections have been made to five NGS benchmarks occupied repeatedly by GPS during the past few years, and to numerous other NGS benchmarks. Preliminary assessment of the results indicates a standard error of about two mm, which satisfies the criterion of first-order accuracy.
It was not part of the original program to make horizontal measurements. However, because of impending GPS occupation of a major part of the main block by Yehuda Bock of IGPP, La Jolla, it was decided to measure the lengths of all previously measured fault-crossing lines. Though less accurate than the Mekometer, the Kern DM503 edm used will enable horizontal coordinates derived from the most recent (1987) Mekometer measurements to be updated with sufficient accuracy for a meaningful assessment to be made of the GPS results in all three dimensions.
417
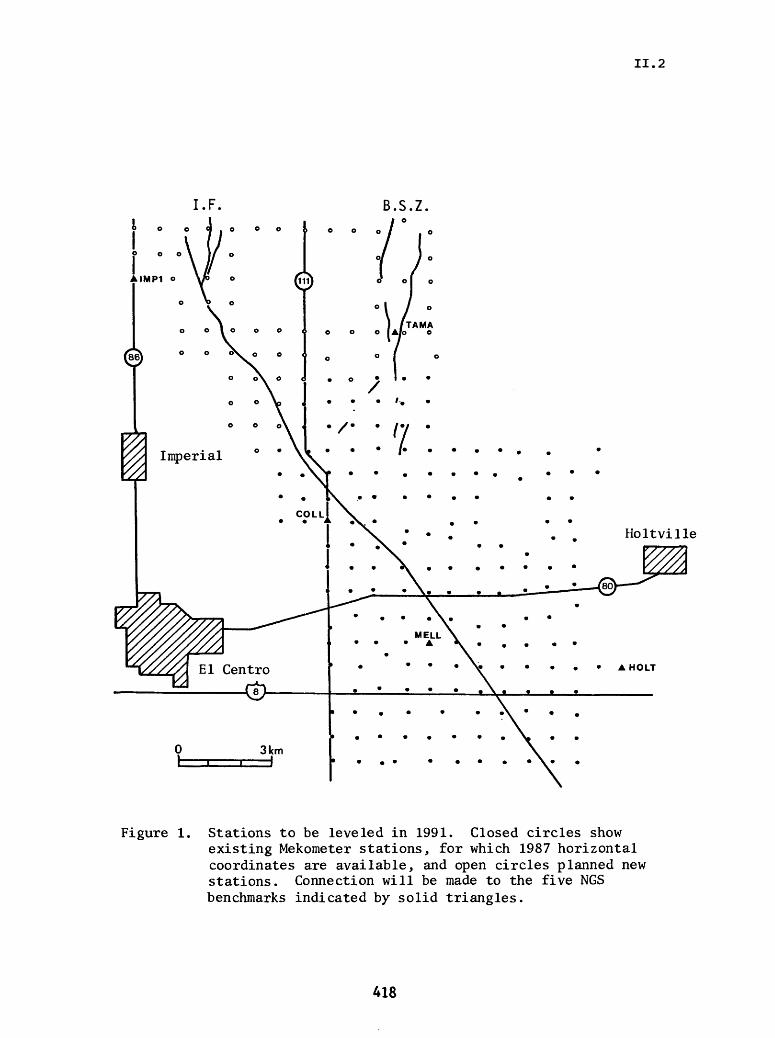
II.2
B.S.Z.
Holtville
Figure 1. Stations to be leveled in 1991. Closed circles showexisting Mekometer stations, for which 1987 horizontal coordinates are available, and open circles planned new stations. Connection will be made to the five NGS benchmarks indicated by solid triangles.
418

II.2
Parkfield Prediction Experiment
9930-02098
Andrew Michael and Cathy AvilesBranch of Seismology
Office of Earthquakes, Volcanoes and Engineering345 Middlefield Road, Mail Stop 977
Menlo Park, California(415) 3294777(FTS) 459-4777
Investigations
1. Seismological research associated with the Parkfield Earthquake Prediction Experiment including seismicity studies and three-dimensional velocity modeling and its relationship to seismogenic behavior.
2. Seismological Research on the Loma Prieta earthquake including stress analysis and three- dimensional velocity modeling similar to that done at Parkfield. The three-dimensional velocity modeling efforts included participation in a sequence of explosions in the Loma Prieta area that were recorded on both dense lines and a distributed array of portable stations in addition to the CALNET array.
3. Stress analysis of the Whittier Narrows earthquake sequence and development of new stress inver sion tools.
Results
1. By developing three-dimensional velocity models at Parkfield and Loma Prieta (both with Donna Eberhart-Phillips) in addition to previous work at Morgan Hill and work by Donna Eberhart- Phillips at Coalinga and Kettleman Hills we have developed some new ideas on how sub-surface geology imaged by VP structure relates to seismogenic behavior of the faults. By comparing the VP structure along the faults we have noted the following relationships: mainshocks release most of their energy where higher velocity material impinges on the fault and the fault creeps aseismi- cally where lower velocity material is in contact with it or where the fault is well defined by a sharp velocity contrast. These ideas may help with earthquake prediction by providing a physical basis for fault segmentation models.
2. Seismicity studies at Parkfield have failed to support geometric bends as the source of segmenta tion there. Previously Nishioka and Michael showed that the 5° bend seen in the trace of the San Andreas Fault at Middle Mtn was not present in the hypocenters and now Aviles and Michael have shown that the background seismicity does not follow the fault offset through Cholame Val ley at the south end of the rupture. While some normal faulting mechanisms are seen near Cho lame Valley they fall in the same plane of hypocenters as strike-slip mechanisms that define a planar San Andreas fault.
3. Previous work at Loma Prieta revealed that the stress regime in the mainshock rupture area became very heterogeneous following the mainshock. We are now attempting to relate the remaining stresses to the mainshock's dislocation. The goal is to be able to use the complex pat tern of aftershock faulting to constrain the mainshock rupture pattern.
419

II.2
4. Some of the stress inversion techniques being used at Loma Prieta were developed and tested on the Whittier Narrows aftershocks sequence. There we were able to show that the stress state dur ing the aftershocks had a significant component of spatial heterogeneity but were unable to relate this to the mainshock rupture. However, tests using simulated data suggested that the errors in the data were large enough to mask the effects of the mainshock's dislocation. At Loma Prieta the errors are comparable, but the mainshock is larger and the simulations suggest that we should be able to define its effects.
Reports
Michael, A. J. , 1990, Energy constraints on kinematic models of oblique faulting: Loma Prieta versus Parkfield-Coalinga, abstract, EOS, 71, 1646.
Aviles, C.A. and Michael, A. J., 1990, Complications at the southern end of the 1966 Parkfield rupture zone, abstract, EOS, 71, 1473.
Michael, A. J., 1991, Spatial variations in stress within the 1987 Whittier Narrows, California, aft ershock sequence: new techniques and results, J. Geophys. Res., 96, 6303-6320.
Michael, A. J., and Eberhart-Phillips, D. M., 1991, Relationships between Fault Behavior, Subsurface Geology, and Three-Dimensional Velocity Models, Science, submitted, in press.
Eberhart-Phillips, D. M., Michael, A. J., and W. D. Stanley, 1991, Overpressure in the Parkfield Preparation Zone?, abstract, Seismology Research Letters, 62,46.
420

II.2
Experimental Tilt and Strain Instrumentation
9960-01801
C.E. MortensenBranch of TectonophysicsU.S. Geological Survey
345 Middlefield Road, MS 977Menlo Park, California 94025
(415) 329-4856
Investigations
1. There are currently 139 Data Collection Platforms (DCP's) that transmit a variety of data to the Direct Readout Ground Station (DRGS) in Menlo Park. Fifty-five of these DCPs transmit data at 10-minute intervals on an exclusively assigned random channel, which is being utilized under a special agreement with NESDIS. The remainder of the DCPs report at standard 3 or 4-hour intervals as assigned by NESDIS. This system transmits data from all types of low-frequency instruments including dilatometers, creepmeters, strainmeters, water- level meters, magnetometers, tiltmeters, and related measurements.
2. Networks of tiltmeters, creepmeters and shallow strainmeters have been maintained in various regions of interest in California. A network of tiltmeters located at seven sites monitor crustal deformation within the Long Valley caldera. Roger Bilham of the University of Colorado and Jon Beaven of Lamont-Doherty installed a very long baseline tiltmeter in Long Valley. This project provided three DCP's to collect the data and return it to Menlo Park via GOES satellite. We also monitor the data received to keep track of deformation within the caldera, comparing results frequently with the USGS tiltmeter array. Other tiltmeters are located in the San Juan Bautista and Parkfield regions. Creepmeters located along the Hayward, Calaveras and San Andreas faults between Berkeley and the Parkfield area are maintained in cooperation with the Fault Zone Tectonics project. A shallow strainmeter is located near Parkfield, while observatory type tiltmeters and strainmeters are sited at the Presidio Vault in San Francisco, and a tiltmeter is installed in the Byerly Seismographic Vault at Berkeley. Data from these instruments are telemetered to Menlo Park via the GOES satellite.
3. A system to backup the satellite telemetry system with non-volatile, solid-state memory and dialup or dedicated telephonic communications path has been developed. Included in this system is the capability to lock the DCP timing to a radio time standard. This feature enables more efficient utilization of the assigned satellite bandwidth. The system is known as the Companion because of its interfacing role with satellite DCP's. The system is currently deployed at the Long-baseline tiltmeter at Long Valley caldera.
4. A low-cost, short-haul digital telemetry system utilizing UHF radios, packet controllers and off-the-shelf digital data converters has been developed, tested, and is currently in use in Parkfield monitoring the tilt of monuments that support the reflectors that constitute the 2- color laser network. This system, components for which cost less than $1500 per site, automatically polls the remote sites and transfers the data to a computer file, calculating the mean and standard error in the process. The system, including the tiltmeters, can easily be removed and transported to other locations.
421

II.2
5. Conducted advisory activities for the Regional Interagency Steering Committee (RISC), which is convened bimonthly by FEMA to accomplish and coordinate regional planning for earthquake preparedness and response.
6. Conducted advisory activities as a member of the Advisory Committee for the Impact Study of Higher Transmission Rates Through the GOES Data Collection System.
Results
1. Conducted regional monitoring of deformation in Central California, Parkfield, and the Long Valley caldera areas. Maintained and operated instruments and associated telemetry systems in those regions.
2. Provided recommendations to FEMA Region IX planning personnel on new draft Federal Disaster Response Plan. Participated in US Army Corps of Engineers, South Pacific Division and California Office of Emergency Services earthquake response exercise for Southern California.
3. Reviewed and contributed to two reports that examine the feasibility of different techniques for achieving higher transmission rates and data throughput over the Geostationary Operational Environmental Satellite (GOES) Data Collection System: (1) "An Impact Study of Higher Transmission Rates Through the GOES Data Collection System" and (2) "An Impact Study of the GOES Data Collection System Using Code Division Multiple Access".
Reports
1. Mortensen, Carl E., 1990, High transmission rates through the GOES Data Collection System for crustal deformation monitoring, in Proceedings of NSF/USGS Workshop on Crustal Deformation Measurement and Earthquake Mechanics.
422

II.2
Analysis of Crustal Deformation Along the Southernmost Segment of the San Andreas Fault System, Imperial Valley, California: Implications for Earthquake
Prediction
14-08-0001-G1679
R.E. ReilingerEarth Resources Laboratory
Dept. of Earth, Atmospheric, and Planetary SciencesMassachusetts Institute of Technology
Cambridge, Massachusetts 02142(617) 253-7860
INVESTIGATIONS
This project involves using geodetic observations in conjunction with other geophysical and geolog ical information to investigate contemporary tectonic processes along the southernmost segment of the San Andreas fault system. Our primary efforts during the present contract period include:
1. Completing a multi-institutional GPS campaign along an approximately 500 km section of the Pacific-North America plate boundary from northeast of Los Angeles, California to the Gulf of California, northern Mexico.
2. Continuing analysis and interpretation of 1986 to 1990 GPS measurements in the Imperial Valley-Salton Trough with emphasis on temporal and spatial patterns of regional strain ac cumulation, and strain release associated with the 1987 Superstition Hills earthquakes.
RESULTS
1. From 7 March through 3 April 1991, a consortium of universities, and state and federal agencies, undertook an extensive Global Positioning System measurement campaign along a 475 km section of the Pacific-N. American plate boundary from the Gulf of California, Baja, California, Mexico to the Big Bend segment of the San Andreas fault northeast of Los Angeles, California (Figure 1). Participating institutions included Caltech, CICESE, L-DGO, M.I.T., NGS, Riverside County Flood Control, San Bernardino County Survey, UNAVCO, University of Mexico, University of Texas at Dallas, and USGS. A total of 23 Trimble 4000 SST and 4 Ashtec receivers were used to observe 108 stations. In addition, simultaneous observations were made by the Orange County Survey using 8 dual frequency Ashtec receivers (sites not shown in Figure 1).
The primary objective of the 1991 STRC GPS campaign was to continue monitoring the spatial and temporal distribution of crustal strain along this seismically active segment of the plate boundary. Towards this end, most sites observed in the Coachella Valley-Riverside County portion of the network have a history of GPS observations dating to 1988, and all sites
423

II.2
in the Imperial Valley date to 1986. Through cooperation of the San Bernardino County Sur vey, the network was extended north along the San Andreas fault in western San Bernardino County (site selection and coordination directed by Ken Hudnut). In addition, observations were made at 4 sites in San Diego County to facilitate ties to GPS observations planned by the San Diego County Survey (site information provided by Duncan Agnew, UCSD).
Complete copies of the original field data for the U.S. portion of the 1991 STRC experiment (excluding NGS and Orange County) are on file at M.I.T. and the Riverside County Flood Control. M.I.T. is converting the data to RINEX format for distribution to all participants in the experiment and for archiving at UNAVCO, SCEC, NGS, and NASA CDDIS.
2. We continue to concentrate on reduction, analysis, and interpretation of the 1986-1991 GPS observations in collaboration with Caltech, L-DGO, NGS, and U.T. Dallas. Initial results from the 1986-1989 observations are reported in 2 papers submitted for publication to JGR. Preliminary processing of the 1990 observations by Shawn Larsen at Caltech (Bernese) and Richard Bennett at M.I.T. (GAMIT), using broadcast orbits, indicate average day-to-day repeatability of less than 4 mm in baseline length. Some improvement is expected with inclusion of regional and global fiducial stations and improved satellite orbits.
Figure 2 shows horizontal displacements from 1988 to 1990 based on our preliminary and partial 1990 reduction. These measurements give a preliminary deformation rate across the Imperial Valley of 4.5 ± 0.4 cm/yr. This rate is less than our previous GPS estimates (1986- 1988: 5.9 ± 1.0 cm/yr; 1988-1989: 5.2 ± 0.9 cm/yr), and, while higher, is in better agreement with conventional geodetic estimates obtained from 15 years of USGS EDM observations of the Salton Network (3.4 ± 0.1 cm/yr; Prescott et al., EOS, 68, 1506, 1987).
PUBLICATIONS
Larsen, S. C., R. E. Reilinger, H. Neugebauer, and W. Strange, GPS Measurements of Deformation Associated with the 1987 Superstition Hills Earthquake, Imperial Valley, California: Evidence for Conjugate Faulting, Seismological Research Letters, 62, 34, 1991 (abstract).
Larsen, S., and R. Reilinger, Age constraints for the Present Fault Configuration in the Impe rial Valley, California: Evidence for Northwestward Propagation of the Gulf of California Rift System, J. Geophys. Res., in press, 1991.
Larsen, S., R. Reilinger, H. Neugebauer, and W. Strange, GPS Measurements of Deformation As sociated with the 1987 Superstition Hills Earthquakes, Imperial Valley, California, J. Geophys. Res., submitted, 1991.
Larsen, S., and R. Reilinger, GPS Measurements of Strain Accumulation Across the Imperial Valley, California: 1986-1989, J. Geophys. Res., submitted, 1991.
424

II.2
- 33"
11^
T'N \ \ .*..\ v\ *f
Figure 1. GPS sites observed during the 1991 Salton Trough-Riverside County (STRC) campaign ( ). Triangles show mobile VLBl stations.
33.5
33
\
Horizontal Displacement1988 - 1990
10 cm
0 Km 20
-116.5 -116 -115.5 -115
Figure 2. Preliminary GPS horizontal station displacements from 1988-1990. Only part of the 1990 data have been included (provided by Shawn Larsen).
425

II. 2
Emplacement of Alignment Arrays Across the Elsinore and San Jacinto fault zones in southern California
14-08-0001-G1771
Thomas Rockwell Harold MagistraleColleen Haraden
Dept. of Geological SciencesSan Diego State University
San Diego, CA 92182(619) 594-4441
Obi ective; To emplace alignment arrays across strands of the southern San Jacinto and Elsinore fault zones and associated NE- striking cross faults for the purposes of: 1) measurement of creep or triggered slip, should it occur; and 2) measurement of coseismic fault slip should rupture occur on one of the fault segments under study.
Results; To date, nineteen lines have been built. Along the San Jacinto fault zone, four are across the southern Clark fault in Clark Valley and two are near Anza, one is across the Superstition Mountain fault, and one is across the Dixieland fault (in the same vicinity as the Caltech array). Along the southern Elsinore fault zone, six lines have been emplaced across the Elsinore fault, three across the Laguna Salada fault, and one across the northeast striking Yuha Wells fault.
Eight of the alignments have been surveyed more than once. Figure 1 shows the difference in fault parallel location of monuments determined from two surveys of the Dixieland array. Error bars (+ one sigma) represent a combination of machine and survey errors. Within error, no movement has been detected across any of the lines to date. Henceforth, we plan to resurvey each line once a year.
Figure 1. Comparison between two surveys of the Dixieland array.Dixieland differences, corrected wrt 2
-50
-40
-30
-20
-10
0
10
20
30
40
50
Explanation
O 9/22/90
X 4/19/91
-100 100 200
Distance, m426

II.2
Analysis of Postseismic Crustal Motions in California
14-08-0001-G1960
I. Selwyn Sacks and Fred F. PollitzCarnegie Institution of Washington
5241 Broad Branch Road, N.W.Washington, DC 20015
Objectives
Postseismic relaxation is known to be an important factor in the crustal deforma tion process in tectonically active regions. Some earlier studies have employed quantita tive models to interpret regional crustal deformation data, and these have focussed pri marily on studies of large historic earthquakes in Japan. In California, postseismic relax ation has long been suspected of being responsible for the accelerated displacement rates observed after various historic earthquakes (1906 San Fransisco, 1952 Kern County), and some of these observations have been previously interpreted using analytical models of viscous relaxation of a shallow asthenosphere. The studies of Tabei (1989), Rydelek and Sacks (1990), Pollitz (1991), and ongoing work have clarified the role of postseismic dis placements on observed crustal deformation in Japan and California. These results per tain to the following objectives:1. To develop rheological models for tectonically active regions, particularly elastic plate thickness and mantle asthenospheric viscosity.2. To obtain slip models of large historic earthquakes, particularly when such estimates are poorly known or unknown from other means.3. Evaluate relaxation effects following recent earthquakes (1983 Coalinga, 1989 Loma Prieta).
The theory developed by Pollitz (1991) for modeling postseismic relaxation in a spherical earth geometry is the basis for the modeling work in this project.
Application to the Great 1857 Earthquake, Southern California
The results summarized here are discussed in detail in the report by Pollitz and Sacks (1991). Analysis of crustal deformation data following the 1857 earthquake yields not only a rheological model of the southern California crust and upper mantle but also a firm estimate of the slip distribution associated with the earthquake. Regarding the slip distribution, postseismic displacement analysis appears to provide the only geophysi cal method for estimating the slip of large historic earthquakes when neither seismic recordings nor coseismic displacements are available. Various conventional methods for determining the slip include (1) analysis of recorded seismic waves, (2) analysis of geodet- ically determined coseismic displacements, and (3) mapping of the surface slip distribu tion. It is often found that the slip models derived from these three methods differ sub stantially. Discrapancies using methods (1) and (2) have been reported by Linde and Silver (1990) for the 1960 Chilean earthquake and Arnadottir et al. (1990) for the 1989
427
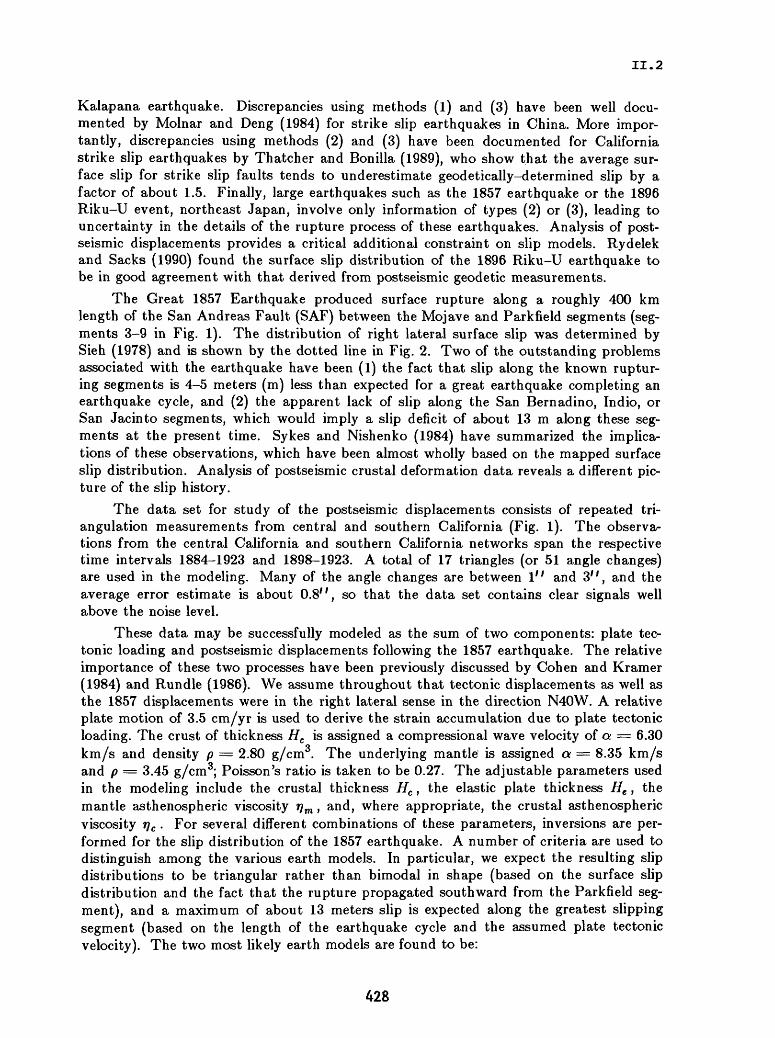
II.2
Kalapana earthquake. Discrepancies using methods (1) and (3) have been well docu mented by Molnar and Deng (1984) for strike slip earthquakes in China. More impor tantly, discrepancies using methods (2) and (3) have been documented for California strike slip earthquakes by Thatcher and Bonilla (1989), who show that the average sur face slip for strike slip faults tends to underestimate geodetically-determined slip by a factor of about 1.5. Finally, large earthquakes such as the 1857 earthquake or the 1896 Riku-U event, northeast Japan, involve only information of types (2) or (3), leading to uncertainty in the details of the rupture process of these earthquakes. Analysis of post- seismic displacements provides a critical additional constraint on slip models. Rydelek and Sacks (1990) found the surface slip distribution of the 1896 Riku-U earthquake to be in good agreement with that derived from postseismic geodetic measurements.
The Great 1857 Earthquake produced surface rupture along a roughly 400 km length of the San Andreas Fault (SAF) between the Mojave and Parkfield segments (seg ments 3-9 in Fig. 1). The distribution of right lateral surface slip was determined by Sieh (1978) and is shown by the dotted line in Fig. 2. Two of the outstanding problems associated with the earthquake have been (1) the fact that slip along the known ruptur ing segments is 4-5 meters (m) less than expected for a great earthquake completing an earthquake cycle, and (2) the apparent lack of slip along the San Bernadino, Indio, or San Jacinto segments, which would imply a slip deficit of about 13 m along these seg ments at the present time. Sykes and Nishenko (1984) have summarized the implica tions of these observations, which have been almost wholly based on the mapped surface slip distribution. Analysis of postseismic crustal deformation data reveals a different pic ture of the slip history.
The data set for study of the postseismic displacements consists of repeated tri- angulation measurements from central and southern California (Fig. 1). The observa tions from the central California and southern California networks span the respective time intervals 1884-1923 and 1898-1923. A total of 17 triangles (or 51 angle changes) are used in the modeling. Many of the angle changes are between I" and 3/; , and the average error estimate is about 0.8/; , so that the data set contains clear signals well above the noise level.
These data may be successfully modeled as the sum of two components: plate tec tonic loading and postseismic displacements following the 1857 earthquake. The relative importance of these two processes have been previously discussed by Cohen and Kramer (1984) and Rundle (1986). We assume throughout that tectonic displacements as well as the 1857 displacements were in the right lateral sense in the direction N40W. A relative plate motion of 3.5 cm/yr is used to derive the strain accumulation due to plate tectonic loading. The crust of thickness Hc is assigned a compressional wave velocity of a = 6.30 km/s and density p = 2.80 g/cm3. The underlying mantle is assigned a = 8.35 km/s and p = 3.45 g/cm3; Poisson's ratio is taken to be 0.27. The adjustable parameters used in the modeling include the crustal thickness Hc , the elastic plate thickness He , the mantle asthenospheric viscosity v\m , and, where appropriate, the crustal asthenospheric viscosity rj c . For several different combinations of these parameters, inversions are per formed for the slip distribution of the 1857 earthquake. A number of criteria are used to distinguish among the various earth models. In particular, we expect the resulting slip distributions to be triangular rather than bimodal in shape (based on the surface slip distribution and the fact that the rupture propagated southward from the Parkfield seg ment), and a maximum of about 13 meters slip is expected along the greatest slipping segment (based on the length of the earthquake cycle and the assumed plate tectonic velocity). The two most likely earth models are found to be:
428

II. 2
Model 1. He = 16 km, Hc = 16 km, r) m = 0.25-(1.67-1019 Pa-s), or Model 2. He = 16 km, Hc = 33 km, rj m = 0.5-(1.67-1019 Pa-s), rj c /rjm = 0.48. The viscosity estimates lie within the broad range of values estimated by Rundle (1986), and the elastic plate thickness agrees well with the values inferred from strain accumula tion data (Thatcher, 1983; Savage, 1983). Slip distributions for Model 1 and Model 2 are shown in Fig. 3 at various levels of variance reduction. To show that the distribution shapes for Model 1 and Model 2 are essentially independent of the reference model, slip distributions were also derived about a reference model consisting of 7 m uniform slip on the San Andreas fault (segments 3-9). Fig. 3 shows that these distributions are also tri angular in shape.
These slip models may be further refined by the requirement that the observed resi duals be consistent with a normally distributed data set. We have found that this requirement severely limits the range of acceptable slip models, and the preferred slip model for the 1857 earthquake is shown by the solid line in Fig. 2. The corresponding fit to the data set is shown in Fig. 4 for Model 1 and Model 2, each of which is associated with 57% variance reduction. The corresponding displacements from Model 2 have been calculated for the plate tectonic loading and postseismic displacement components, which are shown separately in Fig. 5. Finally, the slip models are moderately sensitive to possible slip along the San Jacinto segment during the 1857 earthquake. The model ing suggests that the San Jacinto segment participated in the 1857 rupture with 1-4 m of slip, and that strain accumulation since 1857 has been dominated by the San Jacinto fault rather than the southern SAF. The dominance of the San Jacinto fault in accomo- dating the present-day tectonic strain is supported by the results of King and Savage (1983) using trilateration data and those of Dixon et al. (1990) using satellite-based observations. The lack of strong felt intensities at San Bernadino during the 1857 event (Agnew and Sieh, 1978) may indicate that the San Jacinto segment slipped in a "slow earthquake" rather than an impulsive event.
Implications for Seismic Hazard
These conclusions are somewhat preliminary, and we need to look very critically at tradeoffs in the components of the slip models. There are, however, some strong implica tions of these results, since the advocated slip model is factor of 1.5-2 greater than the average surface slip distribution. If our slip estimates are correct, then estimates of seismic hazard along the central and southern SAF would have to be revised. We wish to re-emphasize that the average surface slip for other historic ruptures of California strike slip faults tends to underestimate the geodetically-determined slip by a factor of about 1.5 (Thatcher and Bonilla, 1989). Assuming a relative motion rate of 3.5 cm/yr and a 380-year earthquake cycle (Sieh et al., 1989), the expected accumulation of slip during an earthquake cycle is about 13.3 m. We infer that the Carrizo Plain segment and part of the Chalome segment slipped the full 13.3 m during the 1857 event. This may explain why the southern part of the Chalome segment has not been observed to slip indepen dently of the Carrizo Plain segment and would imply much reduced seismic hazard along the Chalome segment in the near future. Those segments which slipped less than 13.3 m during the 1857 event may be assumed to have slipped a complementary amount during a minor event within the earthquake cycle. One or two such minor events evidently occur within each 380-year earthquake cycle (Sieh et al., 1989), and those segments which appear to participate in such lesser events (Transverse Ranges segment and Mojave segment) may be expected to slip similar amounts during the next minor event.
429
II.2
Finally, the inferred participation of the San Jacinto fault in the 1857 event may explain why the 1857 event did not rupture the San Bernadino and Indio segments, as had occurred in previous great earthquakes. The increasing role of the San Jacinto fault in accomodating tectonic displacements certainly implies greater seismic hazard along this segment than has been previously thought. Since the greatest remaining slip deficits along the central and southern SAF appear to be concentrated along the southernmost segments (San Jacinto and Mojave segments) this implies that the next minor earth quake may begin in the south and propagate northward, suggesting that special atten tion be paid to seismic activity along the San Jacinto fault.
References
Agnew, D.C. and K. Sieh (1978). A documentary study of the felt effects of the Great California Earthquake of 1857, Bull. Sets. Soc. Am., 68, 1717-1729.
Arnadottir, T., Segall, P. and P. Delaney (1990). A fault model of the June 26, 1989 Kalapana earthquake derived from geodetic and seismic data, EOS, 71, 1561.
Cohen, S.C. and M.J. Kramer (1984). Crustal deformation, the earthquake cycle, and models of viscoelastic flow in the asthenosphere, Geophys. J. Roy. Astr. Soc., 78, 735-750.
Dixon, T., Blewitt, G., Larson, K., Agnew, D., Hager, B., Kroger, P., Krumega, L., and W. Strange (1990), GPS measurements of regional deformation in southern Califor nia, EOS, 71, 1051-1056.
King, N.E. and J.C. Savage (1983). Strain rate profile across the Elsinore, San Jacinto, and San Andreas faults near Palm Springs, California, 1973-81, Geophys. Res. Lett., 10, 55-57.
Linde, A.T. and P.G. Silver (1989). Elevation changes and the Great 1960 Chilean Earthquake: support for aseismic slip, Geophys. Res. Lett., 16, 1305-1308.
Molnar, P. and Q. Deng (1984). Faulting associated with large earthquakes and the average rate of deformation in central and eastern Asia, /. Geophys. Res., 89, 6203- 6227.
Pollitz, F.F. and I.S. Sacks (1991). Modeling of postseismic relaxation following the Great 1857 Earthquake, southern California, Bull. Seis. Soc. Am., submitted.
Pollitz, F.F. (1991). Postseismic relaxation on the spherical earth, Bull. Seis. Soc. Am., submitted.
Rundle, J.B. (1986). An approach to modeling Present-day deformation in southern California, /. Geophys. Res., 91, 1947-1959.
430

II.2
Rydelek, P.A. and I.S. Sacks (1990). Asthenospheric viscosity and stress diffusion: a mechanism to explain correlated earthquakes and surface deformations in northeast Japan, Geophys. J. Inter., 100, 39-58.
Savage, J.C. (1983). Strain accumulation in western United States, Ann. Rev. Earth Sci., 11, 11-43.
Sieh, K. (1978). Slip along the San Andreas fault associated with the Great 1857 Earth quake, Bull. Seis. Soc. Am., 68, 1421-1448.
Sieh, K., Stuvier, M., and D. Brillinger (1989). A more precise chronology of earthquakes produced by the San Andreas fault in southern California, /. Geophys. Res., 94, 603-623.
Sykes, L.R. and S.P. Nishenko (1984). Probabilities of occurrance of large plate ruptur ing earthquakes for the San Andreas, San Jacinto, and Imperial faults, southern California, /. Geophys. Res., 89, 5905-5927.
Tabei, T. (1989). Crustal movements in the Inner Zone of southwest Japan associated with stress relaxation after major earthquakes, /. Phys. Earth, 87, 101-131.
Thatcher, W. and M.G. Bonilla (1989). Earthquake fault slip determination from geolo gic, geodetic, and seismological observations; implications for earthquake mechanics and fault segmentation, U.S. Geol. Survey Open File Rep. 89-0815, pp. 386-399.
Thatcher, W. (1983). Nonlinear strain buildup and the earthquake cycle on the San Andreas fault, /. Geophys. Res., 88, 5893-5902.

£ro
Fernando Wilson
Castro *
-120 -118 Longitude
-116
Figure 1. Network of monuments in central and southern California used in this study. The San
Andreas fault is subdivided into a number of distinct segments which are named as follows: 1 =
Indio, 2 = San Bernadino, 3 + 4 = Mojave, 5 = Transverse Ranges, 6 Carrizo Plain,
7 + 8 Chalome, 9 = Parkfield, 10 San Jaeinto.
H H

II.2
28
15
cw
J _i
10B 268 388 488 see
San Jacinto Distance (km) Parkfield
Figure 2. Solid line is preferred slip model constructed from expected slip deficit along the San
Andreas Fault at 1857, based on the slip history given by Sieh et al. (1989). It is assumed that
the 1857 event marks the end of a 380-year cycle during which 13.3 meters of total slip is accu
mulated. Segments which have no history of slip within the cycle are assigned the full 13.3 me
ters during the 1857 event, and those which participated in lesser events within the cycle are as
signed correspondingly less slip. Dotted line is the Sieh (1978) observed surface slip distribution.
Dashed line represents 4.7 m of slip which is the best fitting value on the San Jacinto segment ob
tained from Model 2.
433

ff 16 km He = 16 km rjm = 0.25-(1.67-1019 Pa - s)
2M 3M
Ht = 16 km He = 33 km
tim = 0.5-(1.67-1019 Pa - s) = 0.48
CO
Sv /
a«^H
53
I ' ' ' ' I ' ' ' ' I ' ' ' ' |
H, = 16 km Ht = 16 km i?m =0.25-(l.67-1019 Pa-s)
MODEL T
San Jacinto Distance (km) Parkfield
Ht = 16 km //e = 33 km
tjm = 0.5-(1.67-1019 Pa - s) = 0.48»7m
MODEL 2
i
San Jacinto Distance (km) Parkfield
Figure 3. Slip distributions along the San Andreas fault (segments 3 - 10) resulting from damped inversion of triangulation data about a reference model (heavy solid line). Each distri bution corresponds to a given level of variance reduction from postseismic effects, with the initial variance defined using the original data corrected for the effect of plate tectonic loading. Vari ance reductions are given,by: Solid = 55%, dotted = 50%, short dashed = 45%, long dashed = 40%, dash-dot = 35%.
H
to

II.2
ri -P
o -1
-2
-3-3 -2 -i
Scaled synthetic
13
C C/)
-1
-2
-3-3 -2
Model 2
-1
Scaled synthetic
Figure 4. Observed scaled angle changes (corrected for plate tectonic loading) vs. synthetic
scaled angle changes due to postseismic displacements from (a) Model 1 or (b) Model 2, based on
the preferred slip model of Fig. 2, augmented by 6.1 m (Model 1) or 4.7 m (Model 2) slip on the
San Jacinto fault. The data residuals are consistent with a normally distributed data set.
435

PLATE TECTONIC LOADING
II.2
-122 -120 -118 Longitude
-116
36
o3*j
334
-122
100 cm
POSTSEISMIC DISPLACEMENTS
(1884 - 1923)
(1808 . 1023)
-120 -118 -116
Longitude
Figure 5. Vector horizontal displacements along the two subnetworks corresponding to (a) plate
tectonic loading, and (b) postseismic displacements. Earth Model 2 (defined in text) is assumed,
and postseismic displacements are based on the preferred slip distribution of Fig. 2.
436
II.2
MECHANICS OF FAULTING AND FRACTURING
9960-02112
Paul Segall Branch of Tectonophysics
U.S. Geological Survey345 Middlefield Road, MS/977Menlo Park, California 94025
(415) 329-4861
Investigations
1. A resurvey of a GPS network in the Santa Cruz area to determine coseismic displacements associated with the Loma Prieta earthquake.
2. An experiment to use GPS to look for transient post-seismic strain diffusion along the San Andreas fault northwest of the Loma Prieta rupture.
3. Analysis of deformation and slip on the San Andreas Fault near Parkfield, California.
4. An analysis of the 1989 Kalapana, Hawaii earthquake from surface deformation measurements.
Results
1. A GPS network in the Santa Cruz - Watsonville area was resurveyed following the October 17, 1989 MS 7.1 Loma Prieta earthquake to determine coseismic displacements and to constrain the geometry of faulting and distribution of fault slip. The network was first surveyed by the California Department of Transportation (Caltrans) in the year prior to the earthquake. The Caltrans network is in the epicentral region of the earthquake, in an area not well covered by other horizontal monitoring networks. The Caltrans survey employed single frequency GPS receivers and short (1 to 1.5 hour) observing sessions. The post earthquake survey, in March of 1990, employed Trimble 4000 SST dual frequency GPS receivers and 6 hour sessions. The pre- and post- earthquake data was processed with broadcast orbits using the Bernese software. Precision of the Caltrans measurements, estimated by comparing daily solutions, is on the order of several centimeters due to the short observing sessions and differential ionospheric delay in the single frequency data. Nevertheless, significant displacements were obtained. Maximum relative horizontal displacements are ~ 30 cm. Station Trail located 9 km SW of the fault uplifted 40 cm with respect to the coastline west of Santa Cruz (Williams and Segall, 1990).
2. An experiment to test for post-seismic strain diffusion northwest of the Loma Prieta rupture was undertaken in cooperation with the crustal strain project. Strain diffusion is
437

II.2
predicted by theoretical models of viscoelastic relaxation below the seismogenic crust, and has been suggested as a mechanism to explain sequential rupturing along a fault system. An array of geodetic stations was established that crosses the San Andreas 20 km northwest of the end of the Loma Prieta rupture. We surveyed these stations in January, April, and September of 1990, and again in May of 1991. We have found that the apparent displacements between January, 1990 and April or September are comparable to the short term repeatability of the measurements. There is evidence from the GPS array crossing the central part of the Loma Prieta rupture that post-seismic signals exceeding the measurement noise level are present after 16 months of monitoring. This suggests post earthquake transients may be seen in the most recent survey.
3. We have continued to work on inversion methods for estimating fault slip from crustal deformation measurements. To formulate well-posed, regularized inverse problems, we have proposed new regularizing functionals that are physically motivated. These functionals are defined in terms of the traction distribution on a fault surface, but they may also be written in terms of quadratic forms in derivatives of slip. Letting {r(f), f 6 £} denote the fault surface traction field, we define the stress magnitude (SM) functional as
SM= / TiTidE, JE
and the stress roughness (SR) functional as
We have determined how to minimize each of these functionals over a hyperplane determined by values of a collection of linear functionals (deformation measurements). Applying these methods to robust estimates of the long-term rates of line length change from the two-color geodetic network at Parkfield, CA, we have indepdently corroborated the finding by Segall and Harris (1986) of a "locked zone" at depth beneath Parkfield. Figure 1 shows the slip "best" slip estimate produced by minimzing SR. The horizontal coordinate is distance from the Carr Hill site, and the grey scale is aseismic slip-rate in mm/yr.
4. We have modeled the static surface deformations of the June 1989 earthquake determined by repeated leveling and EDM (data collected by staff of the Hawaiian Volcano Observatory). We have employed a nonlinear inversion algorithm to estimate the fault geometry that best fits the leveling and EDM data separately and for both data sets combined. The fault plane solution that best fits the geodetic data is a shallow (about 5 km deep), low-angle, north-dipping thrust fault. In all cases the depth of the fault found from the geodetic data (5 km) is considerably shallower than the depth of the hypocenter determined from the seismic data (9 km). Several possible explanations for this depth discrepancy have been investigated. Two-dimensional, finite element calculations were
438

II.2
used to show that lateral and vertical heterogeneity in elastic properties can account for some, if not all, of the discrepancy. This result is of general importance, since virtually all previous geodetic modeling has assumed elastic homogeneity.
Reports
Segall, P., and M. Lisowski, Surface displacements in the 1906 San Francisco and 1989 Loma Prieta earthquakes, Science, v. 250, p. 1241-1244, 1990.
Segall, P. The Loma Prieta Earthquake, in Physics News in 1990, American Institute of Physics, reprinted in EOS v. 72, p. 163, 1991.
Burgmann, R., P. Segall, L. Liu, M. Lisowski, W. H. Prescott, and J. P. Svarc, The Search for Postseismic Strain Diffusion Northwest of the October 17th, 1989, Loma Prieta Rupture Zone Using Repeated GPS Measurements, EOS Transactions AGU, v. 71, p. 1455, 1990.
Williams, C. and P. Segall, Loma Prieta earthquake displacements in the Santa Cruz - Watsonville area determined by GPS, EOS Transactions AGU, v. 71, p. 1460, 1990.
Arnadottir T., P. Segall, G. Beroza, and P. Delaney, Depth Discrepancy between Fault Models derived from Geodetic and Seismic Data for the 1989 Kalapana Earthquake Seismological Research Letters, v. 62, no. 1, p. 35, 1991.
Arnadottir T., P. Segall, and P. Delaney, A Fault Model for the June 26, 1989 Kalapana earthquake derived from geodetic and seismic data, EOS Transactions AGU, v. 71, p. 1561, 1990.
439

Estimate of interseismic slip rate near Parkfield, CA, 1984-1990
o
-n =
CM
inOJ
in
20 10
Lateral distance to Car Hill, km
10 20ro

II.2
Geodetic Measurement of Coseismic Slip and Block Rotation in Southern California
Annual Technical Report Contract* 14-08-0001-G1805
K. Sieh and K. HudnutCaltech; Seismological Laboratory; Pasadena, CA 91125
Internet: sieh or [email protected](818) 356-6115 or-6937
IntroductionThis report briefly describes work accomplished in the first year of this project. The first year
of this project has primarily involved an intensive data collection effort. Our short-term aim was to increase the density of geodetic monumentation and measurements along the southern San Andreas fault. Longer-term goals are to accomplish this along other segments of surficial fault traces in southern California with major assistance from the Southern California Earthquake Center (SCEC), and to initiate a study of block rotation in the Salton Trough. We primarily utilize Global Positioning System (GPS) technology to perform high-accuracy surveys of relatively dense survey networks across active faults and folds. This project has now been merged with other ongoing Caltech projects; these are the Creep and Strain project and the Los Angeles Basin GPS project.
Caltech's earthquake geodesy project was established to collect and interpret interseismic and coseismic geodetic data in southern California. Our approach combines measurements of diverse baseline lengths, depending on the depth to seismogenic structures and anticipated interseismic and coseismic deformations within a particular network.
During 1990, our first year of funding on this grant, we established 30 new monuments of high quality along the southern San Andreas fault. We obtained data with which we can now compute very high-accuracy coordinates on these, as well as approximately 100 existing geodetic monuments judged to be of good quality (and often having useful historical survey data). This was accomplished for the extraordinarily low total cost to NEHRP of $70,000, because we were able to obtain major field support from local government survey organizations. Our work has been concentrated so far in three locations; the southern San Andreas fault (from Cajon Pass to Bombay Beach), the Los Angeles Basin, and Parkfield. Our emphasis has been upon establishing excellent geodetic coverage where it was most needed; in large spatial gaps in the Los Angeles Basin, and intermediate-baseline coverage along the southern San Andreas fault.
Our major Inter-County GPS survey of February and March 1991 has recently been completed successfully, with Caltech's supervision of GPS measurements on ~70 stations. Five of these were observed continuously, and the rest were each observed for 3 six-hour sessions. The survey covered the areas of Los Angeles, Orange, San Bernardino, and Riverside Counties (Fig. 1). Government survey organizations in each of these counties provided considerable support for this Caltech-managed and designed project. Caltech accomplished this entire field survey for <$7,000 of NEHRP funds. Through agreements established by Hudnut for the Inter-County survey, this $7,000 was matched by a total of approximately $115,000 of outside field support from participating local governments. This effort accomplished a complete resurvey of the Los Angeles Basin network, resurvey of the Orange County GPS network (first observed with GPS by Orange Co. in 1988), addition of-15 new sites along the San Bernardino Mtns. segment of the San Andreas fault, and merging of data from these 70 stations with the VLBI network and the adjacent Salton Trough - Riverside County (STRC) network that we have helped to establish with MIT, Lamont-Doherty, NGS and others.
In the Los Angeles Basin, our goal is to identify the slipping and locked patches of the detachment faults underlying the Basin with repeated GPS surveys and historical data. Similarly, repeated surveys of our arrays along the southern San Andreas fault will help us to identify
441

II. 2
localized locked and aseismically slipping fault patches. Remeasurement of these arrays would, for instance, help to pinpoint the source of any large aseismic slip signals observed on the continuously-operating instruments at Pinon Flat or around the Salton Sea. An additional motive is to understand better the relationship of surficial structures and future surficial coseismic slip to deep slip on the fault.
Fig. 1 Summary map of most of the Caltech GPS sites established in 1990 and 1991 (shown as dots). All sites surveyed by us or under our supervision by the four Counties shown (Riv. Co., Orange Co., San Berd. Co., and LA Co. & City) are included. Also shown are the main VLBI and bedrock monument stations we have used extensively for control in our surveys.
Accomplishments in 1990We accomplished, during the first year of funding on this project, the establishment of several
extensive new GPS networks in key areas of southern California where better geodetic coverage had been needed. We have installed about 30 new monuments, and made first GPS occupations on these and about 100 existing monuments. In addition, we have been given data from repeated GPS occupations of many primary and secondary stations in the Riverside Co. and Orange Co. GPS networks. To summarize, we have conducted the following surveys:
December 1989: A total of 30 receiver-days on about 25 stations in a seed effort to comparestatic and repeated kinematic GPS results with Mike Jackson (UNAVCO; Univ. ofColorado), [not funded by this grant]
February 1990: 2 receivers operated during the collaborative Salton Trough/Riverside Co.campaign for a total of 24 receiver-days and 8 new primary stations in the CoachellaValley. These new sites were selected and monumented by Caltech with assistance fromRiverside County.
March 1990: 7 receivers operated for the initial GPS epoch on the Los Angeles primary controlnetwork with Los Angeles Co. and City of LA, for a total of 63 receiver-days and 24stations.
April 1990: 5 receivers operated to conduct kinematic GPS on Prof. Sylvester's array atPainted Canyon near Mecca and to tie this and the Durmid Hill array to the Black Butte
442

II.2
VLBI station. A total of 20 receiver-days and 15 stations, some of which were occupied several times by both kinematic and static GPS.
September 1990: 2 receivers operated by Caltech, one at the JPL MV1 VLBI site adjacent to Rogue on MV3 and WVR at same site, the other at the Palos Verdes FAA site. This test of the semi-continuous monitoring concept was done for 20 days, yielding 40 receiver-days. Note: these data are available via ftp by request to any interested persons.
October 1990: Between 6 and 8 receivers using static GPS only; operated for the initial GPS epoch on the thirty new GPS sites we established along the Coachella Valley segment with Riverside Co. All new stations tied to the Black Butte VLBI station as well as primary stations of the STRC network. A total of 63 receiver-days and 30 new stations (cost considerations did not allow 3 full nights per site). Additionally, Riverside Co. provided at no expense to NEHRP the data from another 63 receiver-days of static GPS from subnetworks in Palm Springs and the vicinity of Lake Elsinore, mainly reoccupations of existing STRC primary and secondary sites.
November 1990: 7 receivers using static GPS only for the reoccupation, and additions to the Highway 46 array across the San Andreas fault at the southeast end of the Parkfield segment. All stations tied to the PGGA Carr Hill monument Caltech installed. Total of 21 receiver-days and 15 monuments (cost considerations did not allow 3 full nights per site).
November 1990 - present: 1 receiver continuously tracking on the PGGA Carr Hill monument in collaboration with Yehuda Bock and the PGGA. So far we have obtained about 80 receiver-days of data.
February / March 1991: About 20 receivers operated under our direction by local government agencies during 19 days of surveying, adding ~50 new high-accuracy stations in key areas (see Fig. 1). Also, participated in the STRC91 survey again this year, and simultaneously ran 8 receivers in Orange Co. Total of -380 receiver-days of data that we will begin to process and analyze in summer of 1991. [Funded by the FY'91 continuation of this grant]
From this summary, one can see that this project has efficiently collected a large quantity of high-quality GPS data. Much of the data has already been processed in a preliminary fashion using the Trimvec software. We have so far amassed over 500 megabytes of GPS data from this project (this does not include the STRC'90 data collected by other collaborating institutions). Much of this data set represents repeated measurements of sites previously surveyed by GPS. Processing of these data has begun but will certainly need to continue through 1992.
443

II.2
Southern San Andreas fault new geodetic arrays
Legend0 hort-ap«ruir« array
*^v* prepoaad danaa array
ailatlng atatie OPS mark
>** nawry aatabltohwl OPS array ^ (VLBIaltatlaallluatratatfby
thin daahad llnaa)
' 50km '
. Map of the southern San Andreas fault geodedc arrays we completed in 1990 and will continue to measure in 1991 and 1992. Five arrays spanning the Coachella Valley segment of the San Andreas fault are now established by static (and some kinematic) GPS surveying. Also shown are the Salton Trough - Riverside Co. (STRC) GPS sites, Caltech's short-aperture arrays surveyed by total-station EDM, and the four existing creepmeters along this fault segment.
Southern San Andreas faultNew GPS Stations
installed and surveyed inOctober 1990
New GPS Station
STRC Station
VLBI and PGGA Station
Figure 5. Detail of the new monuments established and surveyed to high accuracies during Oct. 1990 along the Coachella Valley segment using static GPS measurements. All data were collected with major support from Riverside County. The monument installations, descriptions, and data management and archiving for this work were documented and completed within a month after the field work. Preliminary processing of the data using Trimvec to obtain ±5 cm relative horizontal positions has also been completed. The data will next be processed with the Bernese software, pending support to do so.
444

II.2
Low Frequency Data Network
Semi-Annual Report
S. Silverman, K. Breckenridge, J. HerriotBranch of Tectonophysics
U. S. Geological SurveyMen/o Park, California 94025
415/329-4862May 9, 1991
9960-01189
Investigations
[l] Real-time monitoring, analysis, and interpretation of strain, creep, magnetic, tilt and other low frequency data within the San Andreas fault system and other areas for the purpose of understanding and anticipating crustal deformation and failure.
[2] Enhancements to satellite-based telemetry system for reliable real-time reporting and archiv ing of crustal deformation data.
[3] Development and implementation of backup capablities for low frequency data collection sys tems.
[4] Specialized monitoring, including automated alerts, and display of data relevant to the Parkfield region.
Results
[l] Data from low frequency instruments in Southern and Central California have been collected and archived using the Low Frequency Data System. In the six months over over eight mil lion measurements from over 100 satellite platforms have been received via satellite telemetry and subsequently archived by Low Frequency Network computers for analysis.
[2] The project has operated a configuration of an Integrated Solutions (ISI) V24S computer run ning under the UNIX operating system, with another ISI serving as data storgage backup. Sun Microsystems 4/65 and 4/75 computers are being installed to eventually replace the ISI systems. The new computers will provide more reliable computing and increased speed and data storage capacitiy. Data from the Network are available to investigators in real-time and software for data display and analysis is available. Tectonic events, such as creep along the fault, can be monitored while still in progress. Also, periodic reports are produced which display data collected from various groups of instrumentation.
[3] The project continues to use a five meter satellite receiver dish installed in Menlo Park for retrieval of real-time surface deformation data from California and South Pacific islands. The GOES geostationary satellite together with transmit and receive stations make possible a reliable realtime telemetry system. Further expansion of the number of platforms monitored is ongoing. A new satellite receive station is being purchased to improve data telemetry receipt from the aging GOES satellite.
[4] The project continues to take an active part in the Parkfield Prediction activities. Software has been written to provide scientists with automated alerts for signals which may indicate
445
II.2
anomolous tectonic activity. Kate Breckenridge is the monitor for Parkfield creep events, which includes contact via paging system during periods of increased activity. Stan Silver- man is the alternate monitor for Parkfield strainmeter data, which also includes contact via paging system for alerts. Also, data collection and computer operations are automatically monitored for abnormal activity and project members are paged for in the event of problems with either.
[5] The project has continued to provide real-time monitoring of designated suites of instruments in particular geographical areas. Terminals are dedicated to real-time color graphics displays of seismic data plotted in map view or low frequency data plotted as a time series. During periods of high seismicity these displays are particularly helpful in watching seismic trends. The system is used in an ongoing basis to monitor seismicity and crustral deformation in Central California and in special areas of interest. New display facilities are being purchased for improved monitoring and to help communicate seismic research programs to the public.
446

II.2
Parkfield Area Tectonic Framework
9910-04101
John D. Sims Branch of Engineering Seismology and Geology
U.S. Geological Survey345 Middlefield Road, MS 977Menlo Park, California 94025
(415) 329-5653
Investigations
1. Field investigations of late Holocene and historic slip rates in the Parkfield and Carrizo Plain segments of the San Andreas fault
2. Field investigations of liquefaction of unconsloidated sediments
3. Field investigations of structural and stratigraphic relations of late Cenozoic rocks and underlying Franciscan and granitic basement in central California
4. Synthesis of neotectonics of the San Andreas, Paicines, and Calveras faults in the San Juan Bautista-Hollister-San Benito area
5. Field conference and lectures at Japan Geological Survey.
Results
1. Continued work on the Carrizo Plain at the Phelan site. We will conduct the final session of trenching in May 1991. This session will complete the work begun in the grabben last year. I will also collect additional details to support our inferences on the timing of individual events along the locked segment of the San Andreas.
Our network of surveyed quadrilaterals, established on the San Andreas, White Canyon, Red Hills, Gold Hill, and Gillis Canyon faults in the Parkfield-Cholame area, totals 19 quadrilaterals. Fifteen quadrilaterals lie across the San Andreas, 2 on the White Canyon, and one each on the Red Hills and Gold Hill faults. These quadrilaterals are resurveyed every 2 months to gain background information on the sites prior to the next Parkfield earthquake.
2. Following the 17 October 1989 Loma Prieta earthquake I began a project to study earthquake- induced liquefaction structures caused by the 1906 San Francisco earthquake, and the 1989 Loma Prieta earthquake and its April 1990 aftershock. The 1989 and 1990 events formed compound sandblows in sediments of Soda Lake near Watsonville, California. The objective of the project is to investigate areas that liquefied in response to shaking by the 1906 and 1989 earthquakes. I will compare relationships between structures formed in the 1906 and 1989 earthquakes and structures formed in Soda Lake by the 1989 Loma Preita earthquake and its 1990 aftershock.
Current investigations are centered on trenches excavated at three sites that had soil liquefaction events in either the 1906 San Francisco or the 1989 Loma Prieta earthquakes, or both. One site, near Spreckles had ground fissuring and sand blows developed in the 1906 earthquake. I located trenches at or near those fissures and sand blows as determined from photos taken just after the 1906 earthquake. A second site, the Scattini Farms near Castroville, was affected by soil liquefaction in both 1906 and 1989. I excavated trenches at this site using the 1989 fissures as
447

II.2
a guide. The third site, Miller Farms near Watsonville, was affected by soil liquefaction in 1989 and presumably in 1906. I excavated trenches at this site using the 1989 fissures as a guide.
The Spreckles site proved to not have preserved a record of liquefaction resulting from the 1906 earthquake. The Salinas River, along which the site lies, flooded in the early 1920's. The effect of the flood was to erode the banks and deposit younger materials on the floodplain. Thus, the record of the 1906 liquefaction event was destroyed.
The Scattini site yielded a record of two liquefaction events-the 1906 and the 1989. The 1989 fissures and sandblow deposits were easily observed even though the cultivated fields in which they occur had been leveled, plowed and disked. The fissure walls were clearly exposed in our trenches and the sand dikes were easily traceable up to the bottom of the recent plowed zone. The fissures assigned to the 1906 earthquake were less clear. The fissure boundaries were traceable but the contrast between the sand dike sediment and the host strata was more subtle than with the 1989 dikes. No surface sand blow material was observed and the termination of the sand dike ended well below the recent plowed zone.
The Miller Farms site yielded a record of the 1989 soil liquefaction event. This site, as the Scattini site, had been leveled, plowed and disked in preparation for new crops. All fissures and sand dikes continued up into the recent plowed zone. This site lies along the Pajaro River and may have been affected by flooding in the early 1920's floods. Thus, this site too may have had the record of the 1906 soil liquefaction event removed as well. I am in the process of evaluating several other sites and plan on trenching at least one more this fiscal year. The main requirement for this additional site is that it have liquefied in at least both the 1906 and 1989 earthquakes and preferably earlier earthquakes. Excavation of this trench site would then be followed by a paper describing our findings to date.
We completed the paper on our findings at Soda Lake near Watsonville, Calif. The sediments in Soda Lake were shaken by one more earthquake, an aftershock in the Loma Prieta series, of M=4.6 on March 23,1991. Shaking from this earthquake induced a third episode of liquefaction in the sediments of Soda Lake. To our knowledge this will be the first report of three liquefaction events at a single site.
3. Geologic mapping of the Stockdale Mountain and Orchard Peak 7 Vz -minute quadrangles is in progress. The Stockdale Mountain Quadrangle is about 60 percent complete and the Orchard Peak Quadrangle is about 40 percent complete. The final copilation and editing of the Salinian block basement topography map is now in progress.
5. The San Andreas transform boundary between San Benito and Hollister, California, consists of three major faults the San Andreas (SAF), Calaveras (CF), and Paicines (PF). This stretch of the SAF is the northern part of the creeping segment. The CF veers in a north-northwesterly direction away from the SAF from near Stone Canyon 20 km southeast of Hollister and con tinues for about 150 km. The PF is subparallel to the SAF and merges with the CF about 5 km northwest of Hollister. Studies of the San Andreas system along this stretch of the transform boundary show significant variation in slip rate on the different faults comprising the boundary. Alluvial deposits of the San Benito River at Melendy Ranch about 32 km southeast of Hollister record an 800-year-long average slip rate of 22+5 mm/yr. This late Holocene rate is indistin guishable from the 22 mm/yr historic rate recorded by an offset corral fence built in 1945. This late Holocene rate is 12 ± 6 mm/yr less than the historic rate of 33 +1 mm/yr on the southern creeping segment of the SAF between San Benito and Parkfield. The rate at Melendy Ranch is greater than the minimum long-term rate of about 7.5 to 12 mm/yr on the San Francisco Peninsula. These slip-rate data show a possible northwestward decrease of about 20 mm/yr in
448

II.2
the slip rate along the SAP. The northwestward decrease in slip rate is attributed to a two-part transfer of slip from the SAP to the PF and CF south of Hollister. The CF displaces a 14,000- year-old alluvial-terrace riser of the San Benito River 125 ±15 m in a right-lateral sense at Winfield Ranch, about 10 km southeast of Hollister and 22 km northwest of Melendy Ranch. Three radiocarbon ages yield a combined age estimate of 14,425±215 CAL B.P. for the formation of the terrace riser. These data yield a late-Quaternary slip rate of 9 mm/yr for the CF southeast of Hollister. This rate for the CF is similar to the 8 to 10 mm/yr decrease in slip rate along the SAP northwestward from near Stone Canyon, which suggests that slip is transferred from the SAP to the CF. Northwest of the junction of the CF and PF the geodetic slip rate for the CF is greater than 9 mm/yr. The greater rate results from additional slip being transferred from the PF. Geodetic measurement of slip on the PF suggests a rate of 6 to 11 mm/yr. If nearly all the slip on the PF is transferred to the CF, then northwest of Hollister the slip rate for the CF is estimated to be 15 to 20 mm/yr. Slip may occur at a similar rate across the combined Calaveras and Hayward faults north of Hollister.
5. I gave a series of lectures at the Japan Geological Survey and Chiba University in Janyary and February 1991. I also participated in a field conference studying the left-lateral strike-slip active faults in central Hokaido. The purpose of the field conference was to focus more attention on these important faults and to explore possible collborative studies between the USGS and Japan Geological Survey.
Sims, J.D., 1991, Distribution and rate of slip across the San Andreas transform boundary, Hollister area, central California: Geological Society of America Abstracts with Program, v. 23, p.
449

II.2
18 May 1991
Semi-Annual Technical Report XXXII
Modeling and Monitoring Crustal Deformation 9960-02488
Ross S. Stein, Wayne Thatcher, and Grant A. MarshallOffice of Earthquakes, Volcanoes, and Engineering
345 Middlefield Road, MS 977Menlo Park, California 94025
Tel 415/329-4840, FTS 459-4840 Fax 415 329 5163
INVESTIGATIONS
1. We analyzed 400 km of precise leveling data carried out during 1947-1990 to measure the coseismic deformation of the 1989 M=7.1 Loma Prieta, California, earthquake and to constrain the fault geometry and slip.
2. We investigated the interaction of extensional and conjugate fault systems in diverse environments to shed light on fault initiation, growth, and friction.
3. We studied the contemporary and Holocene deformation of the Asal Rift, Djibouti, for this insights it may shed on the less accessible mid-ocean ridges.
RESULTS
1989 Loma Prieta, California, Earthquake. Leveling surveys conducted along a 400-km-long network before and after the 1989 M=7.1 Loma Prieta earthquake provide observations of the coseismic elevation changes used to determine the faulting geometry and slip. After correction for systematic errors and groundwater-induced subsidence, we consider slip on planar, concave-upwards ("listric"), and concave-downwards faults in an elastic half-space. The 211 leveling observations are best satisfied with a rupture surface that extends from 4 to 12 km depth. Both planar and non-planar faults produce elevation changes consistent with the data. If the fault slip is uniform, die observations require 2.4 m of right- lateral strike slip and 1.7 m of reverse slip on a 34-km-long plane that dips 60° SW. A significantly better fit is obtained with two co-planar segments, each with its own rake. A larger reverse component of 115° is found NW of the epicenter, and a larger strike-slip component 165° is found to the SE (here, 90° is pure strike slip and 180° is pure reverse slip). The observed elevation changes have a combined signal/noise ratio of 4.7; misfit/noise of the uniform slip model is 1.6; for the 2-rake model is it 1.3. Independent support for the mean slip comes from modeling by others of the more sparse GPS, Geodolite, and VLBI observations; support for the change in rake along strike comes from inversion of teleseismic waveforms and local strong ground motion, and from focal mechanisms of the aftershocks. However, the modeled fault lies above and to the SW of the aftershock zone, and does not intersect the mainshock hypocenter. This inconsistency with seismic data may arise from our use of an elastic half-space in lieu of a more realistic crustal stiffness model. Reverse slip NW of the 1989 epicenter appears to accommodate contraction at an restraining bend in the strike of San Andreas fault system (Marshall, Stein, and Thatcher).
450

II.2
Extensional and conjugate fault geometries. Seismically active strike-slip faults typically show mutually orthogonal right- and left-lateral fault planes. Normal fault dips at earthquake nucleation depths are concentrated between 40° and 50°. Both the observed orientations and their strong clustering are surprising, since conventional faulting theory suggests either fault initiation with conjugate 60° and 120° intersecting planes and 60° normal fault dip or fault reactivation with a broad range of permitted orientations. The observations place new constraints on the mechanics of fault initiation, rotation, and evolutionary development. We speculate that the data could be explained by fault rotation into the observed orientations and deactivation for greater rotation or by formation of localized weak shear zones beneath the brittle-ductile transition in the Earth's crust. Initiation as weak frictional fault seems unlikely (Thatcher and D.P. Hill).
Asal Rift, Djibouti. The frequency and character of rifting events along mid-ocean ridges are largely unknown. Such events are nearly aseismic, which limits the utility of seismic observations. The depth and locus of faulting and intrusion are therefore poorly resolved, and how the repetition of such events and broadscale deformation gives rise to rift structures is unexplored. The Asal rift in the Afar depression of Djibouti, Africa, provides the best subaerial analogue for youthful slow-spreading mid-ocean ridges. Seismic, geodetic and field observations of a seismo-volcanic event in 1978 at Asal yield estimates of the fault and fissure locations, geometry, and slip, and volume of basalt extruded in a rifting event. A 9±1 ky-old lake shoreline there has been warped downward by 70 m, providing a precise measure of the broadscale vertical deformation of the rift and the throw across 15 rift faults during the Holocene. The rift topography furnishes an older datum, which may be inferred to be 34±6 ky old using the Holocene deformation rate. Holocene and late Quaternary fault slip rates range up to 5 mm a' 1 . We find that faults throughout the rift have been active during the Holocene. Holocene slip rates diminish beyond 4 km from the rift axis; late Quaternary rates decrease beyond 6-7 km. The Holocene slip rates are used to estimate repeat times by taking the slip observed on 5 inner rift faults which slipped in 1978 as characteristic; we find tectonic events on individual faults recur every 200-300 yr. However, half the rift faults slipped together in the 1978 event. If this is typical, then groups of faults are activated every 100-150 yr. We suggest that half the events take place in the rift axis and are accompanied by volcanic extrusion; the remainder occur peripheral to the neovolcanic zone and involve fault slip only, each group having a repeat time of 200-300 yr. Taking the ~11 km width of the rift and its 16 mm a' 1 spreading rate, the mean age of the material in the rift must be ~350 ka. This is an order of magnitude older than the inferred age of the formation of the rift topography. The subsidence rate of the rift axis during the past 35 ky is -8-9 mm a' 1 , while the rate of infilling by volcanic extrusion is <1 mm a'1 . The resulting net subsidence rate is about equal to the half-spreading rate of the rift, and could not be sustained for 300 ky without significant infilling by lavas. Thus both observations suggest that the long-term deformation cannot be steady-state. Instead, we suggest that there is a rifting/filling cycle at Asal, with the last filling episode completed at ~35 ka; during the rifting episodes, we find that rift growth is self-similar (Stein, P. Briole, J.-C. Ruegg, and P. Tapponnier).
REPORTS PUBLISHED OR SUBMITTED DURING Tins PERIOD (excluding abstracts):
Ekstrom, G., R. Stein, J.P. Eaton, and D. Eberhart-Phillips, Seismicity and geometry of a 110-km-long blind thrust fault, 1, The 1985 Kettieman Hills, California, earthquake, in press, /. Geophys. Res., 1991.
451

II.2
Hill, D.P., and W. Thatcher, A minimum energy criterion for frictional slip on misoriented faults, submitted to Bull. Seismol. Soc. Am., 1991.
Marshall, G.A., R.S. Stein, and W. Thatcher, Faulting geometry and slip from coseismic elevation changes: The October 17, 1989 Loma Prieta, California, earthquake, Bull. Seismol. Soc. Am., 1991.
Rundle, J. P., T. M. Dixon, C. Goad, E. H. Metzger, J. B. Minster, R. Sailor, and R. S. Stein, Overview and Recommendations, in Geodesy in the Year 2000, National Academy Press, 9-22,1990 (reprinted in EOS, Trans. AGU, 1991).
Stein, R.S., and G. Ekstrom, Seismicity and geometry of a 110-km-long blind thrust fault, 2, Synthesis of the 1982-1985 California earthquake sequence, in press, /. Geophys. Res., 1991.
Stein, R. S., P. Briole, J.-C. Ruegg, and P. Tapponnier, Contemporary, Holocene and late Quaternary deformation of the Asal rift, Djibouti: Implications for the mechanics of slow- spreading ridges, submitted to /. Geophys. Res., 1991.
Thatcher, W., and D.P. Hill, Fault geometry in extensional and conjugate strike-slip environments and its implications, submitted to Geology, 1991.
Yeats, R.S., A. Farah, M.A. Mirza, T. Nakata, M.R. Pandey, R.S. Stein, and K.S. Valdiya, The Himalayan frontal fault system, submitted to Geological Character of Active Faults, IGCP-206 Volume, Cambridge University Press, 1990.
452

II.2
Northeast Striking Cross Faults, Detachments, Crustal Blocks and Strain Partitioning in Southern California: A Search for Changes in Seismicity and Focal Mechanisms
Precursory to Major Earthquakes
USGS 14-08-0001-G-1688
Lynn R. Sykes and Leonardo SeeberLamont-Doherty Geological Observatory of Columbia University
Palisades, New York 10964
Objective:
For the past 5 years we have been studying the detailed distribution of earthquakes, focal mechanisms, rotations of small crustal blocks, N.E. striking cross-faults, the existence of shallow-angle detachment faults and premonitory changes before large earthquakes along the southern San Andreas and San Jacinto faults in southern California. Major emphasis has been given to the large tectonic knot centered near San Gorgonio Pass and to 2 recent earthquakes near the southern end of the Salton Sea. Little of the present seismic activity occurs on the major throughgoing faults themselves. Instead much of it is situated on secondary faults and detachments. Seismicity in the months before the 1986 North Palm Springs earthquake appears to be concentrated on a detachment fault that determined the lower limit of the rupture. Secondary cross-faults at the two ends of the rupture were active during the aftershock sequence. The purpose of this study is to use relocated hypocenters and single-event focal mechanisms to examine precursory changes in three regions near the San Jacinto and southern San Andreas faults that contain prominent cross-faults and detachment faults. One includes small earthquakes associated with a magnitude 6 event on a cross-fault near the southern end of the Salton Sea that was a short- term precursor to a larger event in 1987 on the Superstition Hills fault. A temporal sequencing of activity along NW and NE trending conjugate faults of the Brawley zone has been identified and is being examined in detail. Future changes in activity on the next cross fault to the north of the one that ruptured in 1987 could be a precursor to a larger event that would rupture the southern San Andreas. We have developed computer programs to automatically determine hundreds of focal mechanism solutions of high quality so as to examine in detail the hypothesis that the San Andreas is a weak fault. Moderate earthquakes prior to the 1989 Loma Prieta earthquake in central California, most or all of which are outside the ensuing rupture zone, show a pattern of accelerating moment release. In light of this precursory change in Seismicity in a region of complex fault interaction, we have begun re-examining seisimicity of moderate-to-large earthquakes in southern California to establish if such changes also occur before large earthquakes on the San Andreas system in southern California.
Results:
Two large strike-slip ruptures 11.4 hours apart occurred on intersecting, nearly orthogonal, vertical faults during the November 1987 Superstition Hills earthquake sequence. This rupture was investigated in the paper "Cross-fault triggering in the November 1987 Superstition Hills Earthquake Sequence, Southern California" that was published in Geophysical Research Letters in February, 1989 by Hudnut, Seeber, and Pacheco. They show evidence that this sequence is the latest in a northwestward progression of earthquakes (1979, 1981, and 1987) rupturing a set of parallel left-lateral cross-faults that trend northeast between the Brawley seismic zone and the Superstition Hills fault. It is inferred that the observed northwestward progression of ruptures on cross-faults may continue. The next cross-fault expected to rupture intersects both the San Andreas fault and
453

II.2
the San Jacinto fault zone. They hypothesize that slip on the cross fault decreased normal stress on the main fault and triggered main strand rupture after a delay that was caused by fluid diffusion.
The paper "Seismicity and fault interaction, southern San Jacinto fault zone and adjacent faults, southern California: implications for seismic hazard" by Petersen, Seeber, Sykes, Nabelek, Armbruster, Pacheco and Hudnut shows waveform inversion results for the Borrego Mountain earthquake of 1968 and the Coyote Mountain earthquake of 1969. They found evidence for precursory seismic activity along some of the secondary faults of the region and redefined the extent of seismic gaps along the San Jacinto fault zone. The Anza seismic gap may be longer than previously proposed. Hazard in California was also assessed in the paper "Regional probabilistic seismic hazard analysis for the San Francisco Bay area" by Petersen, Jacob, Sykes, and Pacheco. This paper analyzes the seismic hazard using the 30-year probabilities determined by the Working Group (1990). The paper indicates that the 30-year probability for exceeding 50 cm/s pseudo-velocity response at 1 s period is between 40-60% for much of the Bay area that is located on mud or alluvium.
An abstract "Seismicity changes in the San Francisco Bay region before the Loma Prieta earthquake of 1989" by Jaume" and Sykes establishes a pattern of accelerating moment release prior to 1989 Loma Prieta earthquake. Most, if not all, of the M > 5.0 earthquakes in the 35 years prior to this earthquake are outside the ensuing rupture zone. In the paper "Seismic activity on neighbouring faults as a long-term precursor to three large earthquakes in the greater San Francisco Bay area," Sykes and Jaume" show that accelerating moment release has occurred before three large earthquakes in central California and also before the 1948 Desert Hot Springs earthquake in southern California.
In the paper "Fault kinematics in the 1989 Loma Prieta rupture area during the 20 years before that event" by Seeber and Armbruster, they studied changes in the frequency of occurrence of small earthquakes recorded by the USGS Network within about 75 km of the rupture zone of the 1989 Loma Prieta Earthquake. They relocated several thousand earthquakes using station corrections that were developed from quarry blasts. Those station corrections were allowed to vary spatially so as to correct for large variations in seismic velocity across several of the major faults in the area. They divided earthquakes on the Calaveras and other surrounding faults into two classes ~ those that were expected on the basis of a dislocation model for the 1989 earthquake to have their shear strain either augmented or decreased in the 20 years before 1989. For a large number of small earthquakes they then formed the ratio of those for which the shear strain was expected to be increased to those for which shear strain was expected to be decreased. They found that this ratio increased in the few years before the 1989 earthquake.
In the abstract "Historic earthquakes along the Loma Prieta segment of the San Andreas fault" by Tuttle, Sykes, and Jaume', the magnitudes and locations of historic damaging earthquakes in the San Francisco Bay region were re-interpreted from intensity data based upon experience from the Loma Prieta earthquake. In the preprint "Re- evaluation of historic earthquakes in the vicinity of thye Loma Prieta segment of the San Andreas fault" by Tuttle and Sykes, they suggest that the June 1838 earthquake ruptured both the Peninsular and Loma Prieta segments of the San Andreas fault, that the 1868 Hayward earthquake was of the same size of the 1989 Loma Prieta earthquake, and that the 1865 Santa Cruz Mountains earthquake occurred northeast of the Loma Prieta segment and was of magnitude 6.3 to 6.6.
Publications:
Hudnut, K.W., L. Seeber, and J. Pacheco, Cross-fault triggering in the November 1987 Superstition Hills earthquake sequence, southern California, Geophys. Res. Lett., 16, 199-202, 1989.
454

II.2
Jaume*, S.C., and L.R. Sykes, Seismicity changes in the San Francisco Bay region before the Loma Prieta earthquake of 1989 (abstract), EOS, Trans. AGU, 71, 288, 1990.
Nicholson, C, L. Seeber, P. Williams, and L.R. Sykes, Seismicity and fault kinematics through the eastern Transverse Range, California: Block rotation, strike-slipfaulting and shallow-angle thrusts, J. Geophys. Res., 91, 4891-4908, 1986.
Nicholson, C., L. Seeber, P.L. Williams, and L.R. Sykes, Seismic deformation along thesouthern San Andreas fault, California: Implications for conjugate slip androtational block tectonics, Tectonics, 5, 629-649.
Pacheco, J., and J. Nabelek, Source mechanisms of three moderate southern Californiaearthquakes of July 1986, Bull. Seismol. Soc. Amer., 78, 1907-1929, 1988.
Petersen, M.D., L. Seeber, J. Nabelek, J. Armbruster, J. Pacheco, and K.W. Hudnut,Seismicity and fault interaction, southern San Jacinto fault zone and adjacent faults,southern California: implications for seismic hazard, submitted to Tectonics.
Petersen, M.D., K. Jacob, L.R. Sykes, and J. Pacheco, Regional probabilistic seismichazard analysis for the San Francisco Bay area, submitted to the fourth annualconference on seismic microzonation.
Seeber» L., and C. Nicholson, Block/fault rotation in geologic and interseismicdeformation, US. Geol. Sury. Open File Report, 86-850, 185-203, 1986.
Seeber, L., J.G. Armbruster, P. Williams, and L.R. Sykes, Faults antithetic to the SanAndreas delineated by seismicity in the San Gorgonio Pass of southern California(abstract), EOS, Trans. AGU, 67, 1200 1986.
Seeber, L., J.G. Armbruster, M. Tuttle, Secondary faults associated with the 7 July, 1986Palm Springs earthquake rupture on the San Andreas fault (abstract), Seismol. Soc.Am. Abstracts with Programs, pp. 20, 1987.
Seeber, L., and J.G. Armbruster, Secondary faults as agents for segmentation of themaster strands in southern California (abstract), IUGG Conference, Vancouver,Canada, Aug. 17-22, 1987.
Seeber, L., and J.G. Armbruster, Fault kinematics in the 1989 Loma Prieta rupture areaduring the 20 years before that event, Geophys. Res. Lett., 17, 1425-1428, 1990.
Sykes, L.R., and S.C. Jaume*, Seismic activity on neighbouring faults as a long termprecursor to three large earthquakes in the greater San Francisco Bay area, Nsture,348, 595-599, 1990.
Sykes, L.R., and L. Seeber, Great earthquakes and great asperities, San Andreas fault,southern California, Geology, 113, 835-838,1985.
Tuttle, M.P., L. Sykes, and S. Jaume\ Historic earthquakes along the Loma Prieta segmentof the San Andreas fault (abstract), EOS Trans. AGU, 71, 1448, 1990.
Tuttle, M.P., and L.R. Sykes, Re-evaluation of historic earthquakes in the vicinity of theLoma Prieta segment of the San Andreas fault, preprint, 1991.
Williams, P., S. Fagerson, and K. Sieh, Triggered slip of the San Andreas fault after theJuly 8, 1986 North Palm Springs earthquake (abstract), EOS, Trans. AGU, 67,1090, 1986.
Williams, P.L., L.R. Sykes, C. Nicholson, and L. Seeber, Seismotectonics of theeasternmost Tranverse ranges, California: Relevance for seismic potential of thesouthern San Andreas fau\t,Tectonics, 9, 185-204,1989.
455

II.2
Nearfield Geodetic Investigations of Strain across Faults in Southern California
14-08-0001-G1690
Arthur G. SylvesterDepartment of Geological Sciences, and
Institute of Crustal StudiesUniversity of California
Santa Barbara, California 93106(805)893-3156
OBJECTIVE
The long-term, fixed purpose of this investigation is to search for and monitor the spatial and temporal nature of nearfield displacement across active and potentially active faults. Thus, we document pre-, co- and post-seismic displacement and aseismic creep, if any, especially where seismographic, paleoseismic and geomorphic evidence indicates current or recent fault activity. The geodetic arrays range in length from 300 m to 7000 m and are intermediate in scale, therefore, between the infrequent, regional geodetic surveys traditionally done by the National Geodetic Survey, and point measurements by continually recording instruments such as creepmeters, tiltmeters, and strainmeters. All leveling is done according to First Order, Class II standards, and horizontal surveys are done to First Order standards.
RESULTS
We releveled four level lines in March 1991 across the southern San Andreas fault in the Salton Trough, specifically: BAT CAVES, NORTH SHORE, CORVINA BEACH, and BOX CANYON. We found that the BAT CAVES line, a 2300 m-long line of 53 permanent bench marks that courses over Durmid Hill, rose 2 mm since March 1990 (see accompanying figure). NORTH SHORE continues to tilt basinward at a rate of 2 urad/yr; two resurveys of CORVINA BEACH indicate that it is tilting basinward at the same rate. Insignificant change was observed at BOX CANYON.
Durmid Hill has risen 8 mm between September 1985 and March 1991, judging from interpretations of eight precise levelings (see figure). The uplift rate of 1.5 rnm/yr is close to the geologic uplift rate of 1- 3 mm/yr inferred to have been caused by transpressive mechanisms of oblique slip of the southern San Andreas fault, which passes through the length of the hill. During the past decade, however, dextral surface slip recorded on the fault within the hill has been less than 3 mm/yr, significantly less that the 8.5 mm/yr expected from the ratio of right lateral slip to uplift inferred from geologic evidence. Either substantial dextral slip across the hill has escaped detection, or uplift mechanisms other than that of simple transpression are involved. Together with Dr. Roger Bilham (CIRES), we are evaluating the mechanism of the uplift and its implication for the activity of fault.
J We have completed the programming of a new leveling adjustment program to run on Macintosh SE microcomputer.
456

II. 2
BAT CAVES SEP 1985 TO MAR 1991
uj CDz <oI-o ED
uj
uj oc
BC01 arbitrarily held fixed
500 1000 DISTANCE
1500 METERS
2000
80
COocUJ
60-
40-
20-
sw
TOPOGRAPHIC PROFILE
500 1000
DISTANCE
1500
METERS
2000
Upper: Height changes of permanent bench marks, Bat Caves Buttes level line, Durmid Hill, southern San Andreas fault, from September 1985 to March 1991. The horizontal solid line represents the 1985 survey, solid dots represent the March 1991 survey, and intermediate points represent the 1989 and 1990 surveys. Surveys in 1986, 1987, and 1988 are not shown to reduce clutter, but they fit between 1985 and 1989. The vertical dashed line is the position of the San Andreas fault.
Lower: Topographic profile along the length of the level line.
457

II.2
EXPERIMENTS ON ROCK FRICTION CONSTITUTIVE LAWS APPLIED TO EARTHQUAKE INSTABILITY ANALYSIS
USGS Contract 14-08-0001-G-1364
Terry E.TullisJohn D. Weeks
Department of Geological SciencesBrown University
Providence, Rhode Island 02912(401) 863-3829
INVESTIGATIONS:1. Characterization of friction evolution effect with stretched exponentials.2. Exploration of frictional behavior of silica glass.3. Study of surface chemistry at individual contact points between silica glass surfaces using
Raman spectroscopy.4. Comparison of steady-state velocity dependence of friction of bare granite surfaces and
simulated granite gouge.5. Improvements to our program invert experimental data for friction constitutive parameters.6. Possible new interpretation of serpentine data.
RESULTS:
1. In recent work, we have hypothesized that the evolution effect in rock friction is caused by the gradual diffusion of water away from the microscopic points of contact, resulting in an increase in
true bonding across the sliding sur faces. We envision the removal of contaminant water molecules from contacting points to be due to diffu sion under the driving potential of the normal force pressing the sliding sur faces together. When we began to try to model this process it quickly became apparent that a simple diffu- sional process could not explain the large range of times over which the strengthening was observed to occur. If the removal were due to a single process with a simple rate constant, such as the diffusion of water away from stressed contacts all of which had nearly the same diameter, then the process should be essentially complete within one order of magni tude of time. The total time taken by the process would depend on its time
o t5
0.66-
i 0.64 - oS § 0.62 -
o O 0.60-
data - - normal exponential stretched exponential
10 100
Seconds
IIFIJ
1000
FTTTJ
10000
Figure 1. Increases in static coefficient of friction following stationary holds for quartzite (dots). Plotted versus log time the data is nearly lin ear over 3 orders of magnitude in time. This cannot be fit by a process with a single time constant and a normal exponential decay (dashed line is best fit normal exponential), but can be well fit by a stretched exponential of the form u = JLU- Auexp(-(//T)P) with (0^=0.681, Au=0.121, i=385 sec, and 0=0.31 (solid line). Stretched exponentials with a similar form but extending over a larger range of limes would correspond to lower values of |3.
458

II.2
constant. This behavior is characteristic of exponential decay processes. However, the data for strengthening of nominally stationary frictional contacts reported originally by Dieterich (1972), and also seen in our experiments, extends over several orders of magnitude in time. This is illus trated in Figure 1 for one of our most reproducible data sets. In this figure we have shown the best fit exponential decay to this data as the dashed line and it clearly does not fit the data at all well. In contrast we have also shown a fit to this data using a "stretched exponential" (e.g. Scher et al., 1991) which fits the data remarkably well. Curves of this form also fit our relaxation data during these stationary holds much better than simple exponentials. Although stretched exponentials are not commonly used in most physical modeling, they appear to arise in a number of physical situa tions, often ones involving the behavior of disordered materials. This could suggest that processes occurring in disordered materials could be in some way responsible for the evolution effect and it calls to mind the amorphous material found by TEM examination of our experimentally produced fault gouge (Yund, et al., 1990). Another situation that might produce such an extended range of times could perhaps be the diffusion of contaminant water away from a fractal distribution of con tact sizes as one might expect from the fractal character of surfaces.
2. In order to make confident extrapolations from laboratory measurements of rock friction to fault behavior, it is necessary to understand the fundamental physics controlling frictional behav ior. We have started a program aimed at understanding the role of surface chemistry in controlling the velocity dependence of rock friction by exploring the frictional behavior of silica glass. This material was chosen because it is very uniform in mechanical and chemical properties and a great deal is known about its fracture mechanics and surface chemistry. It was hoped that silica glass, being of the same composition as quartz, would show similar frictional behavior and that this would provide a basis for experiments in which the chemical environment is varied. In fact, in an experiment conducted at 25 MPa normal stress, in both velocity stepping and timed hold tests the frictional behavior is very similar to that of quartzite under the same conditions- it is strongly
velocity weakening over the entire range of velocity studied (0.00316 to 10.0 Jims' 1 ) and has a moderate decay dis tance of the evolution effect. In fact, it is sufficiently velocity weakening that slid ing was unstable unless our high-speed rotary servo control was employed to arti ficially increase the stiffness of the system. Timed hold tests indicate that the frictional strength increases linearly with log(time) as expected from previous tests on other materials.
MicrometerStiff spring
s Compliant force- measuring spring
Lower window 10mm
Figure Z Environmental microscope-stage chamber for Raman spectroscopy of loaded contact The contact between lens and cover slip can be examined in reflected or transmitted light. The micrometer is used to position the lens relative to the cover slip prior to contact and then to measure the force between the lens and cover slip after contact, using the previously calibrated dou ble-cantilever force-measuring spring. The stiff double-cantile ver spring ensures no hysteresis in the force measurement.
3. As part of our effort to make direct measurements of the healing process rep resented by the evolution effect, we have started a program to examine the behavior of single contacts under load using Raman spectroscopy. This is being done in collab oration with Professor James Lauer of RPI who has established the best existing lab-
459
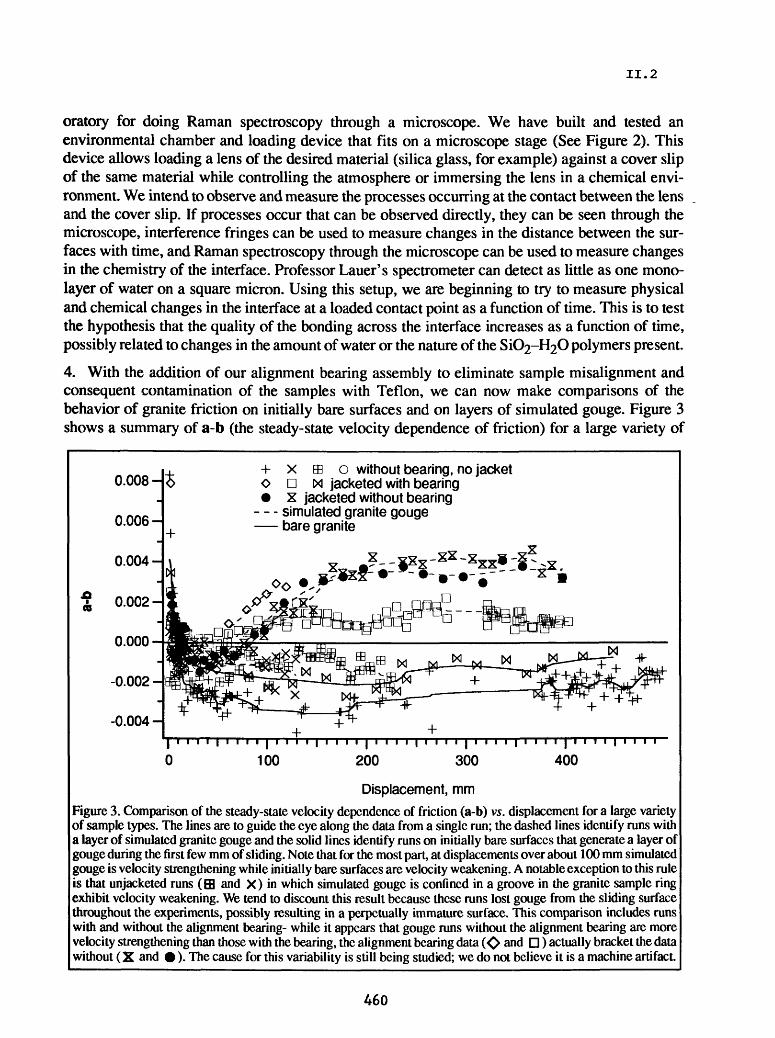
II.2
oratory for doing Raman spectroscopy through a microscope. We have built and tested an environmental chamber and loading device that fits on a microscope stage (See Figure 2). This device allows loading a lens of the desired material (silica glass, for example) against a cover slip of the same material while controlling the atmosphere or immersing the lens in a chemical envi ronment. We intend to observe and measure the processes occurring at the contact between the lens and the cover slip. If processes occur that can be observed directly, they can be seen through the microscope, interference fringes can be used to measure changes in the distance between the sur faces with time, and Raman spectroscopy through the microscope can be used to measure changes in the chemistry of the interface. Professor Lauer's spectrometer can detect as little as one mono- layer of water on a square micron. Using this setup, we are beginning to try to measure physical and chemical changes in the interface at a loaded contact point as a function of time. This is to test the hypothesis that the quality of the bonding across the interface increases as a function of time, possibly related to changes in the amount of water or the nature of the SiC^-F^O polymers present.
4. With the addition of our alignment bearing assembly to eliminate sample misalignment and consequent contamination of the samples with Teflon, we can now make comparisons of the behavior of granite friction on initially bare surfaces and on layers of simulated gouge. Figure 3 shows a summary of a-b (the steady-state velocity dependence of friction) for a large variety of
(0
+ X ffl o without bearing, no jacket O D N jacketed with bearing X jacketed without bearing
- - - simulated granite gouge bare granite
0.008-
0.006-
0.004-
0.002-
0.000
-0.002-
-0.004-
Displacement, mmFigure 3. Comparison of the steady-state velocity dependence of friction (a-b) vs. displacement for a large variety of sample types. The lines are to guide the eye along the data from a single run; the dashed lines identify runs with a layer of simulated granite gouge and the solid lines identify runs on initially bare surfaces that generate a layer of gouge during the first few mm of sliding. Note that for the most part, at displacements over about 100 mm simulated gouge is velocity strengthening while initially bare surfaces are velocity weakening. A notable exception to this rule is that unjacketed runs (ffl and X) in which simulated gouge is confined in a groove in the granite sample ring exhibit velocity weakening. We tend to discount this result because these runs lost gouge from the sliding surface throughout the experiments, possibly resulting in a perpetually immature surface. This comparison includes runs with and without the alignment bearing- while it appears that gouge runs without the alignment bearing are more velocity strengthening than those with the bearing, the alignment bearing data (O and d) actually bracket the data without (X and ). The cause for this variability is still being studied; we do not believe it is a machine artifact
460

II.2
sample types, including simulated gouge and bare surfaces. All the data sets shown in Figure 3 are quite similar in the first few tens of millimeters of sliding: an initial velocity strengthening gives way to velocity weakening to neutral behavior. At displacements greater than about 100 mm, the data fall into two distinct groups: simulated gouge which becomes strongly velocity strengthening at large displacements, and bare surfaces which remain velocity weakening throughout the 400 mm of sliding that we have done so far (actually, unjacketed gouge runs with gouge in a grooved rock sample fall into the velocity weakening group as well; see the caption to Figure 3 for more discus sion). When we started this comparison, we expected that with enough sliding the simulated gouge would attain a state much like that of the much thinner and more intensively sheared gouge that forms on bare surfaces; it has been a surprise to us and, we suspect, to others, that this has not hap pened.
While the simulated gouge samples universally exhibit velocity strengthening at large displace ments, a situation that is usually associated only with stable sliding, a closer look indicates that the details of the response to velocity changes are important. Individual traces from one of our simu lated gouge runs are shown across the bottom of Figure 4 keyed to the displacement at which they occurred and to the particular values of a-b that they generated. These traces show that at low dis-
200 Displacement, mm
Figure 4. Comparison of a-b for the two simulated gouge runs, along with data traces showing the details of the response of the frictional strength to an increase in velocity from 1 urn s" 1 to 10 urn s" 1 . The traces along the bottom have a negative value of b2 leading to overall velocity strengthening with short term velocity weakening, a situa tion that can produce unstable sliding or earthquakes in spite of the velocity strengthening response.
461
II. 2
placement, the response to a velocity change is simple velocity strengthening- after the transient peak caused by the direct effect, the new steady-state is at a higher level at the higher velocity. At large displacement, whereas the new steady-state is higher, giving an overall velocity strengthen ing response, the short-term response includes an oscillation down to a lower frictional strength- that is, it shows short-term velocity weakening. At 40 mm displacement, the situation is similar to the larger displacement: the short term response is velocity weakening with a long-term neutral response. It has been shown (Blanpied and Tullis, 1986; Horowitz, 1988) that this situation can lead to instability or earthquakes in spite of overall velocity strengthening. The cause of the nega tive value of the second evolution parameter (b2> is not known at this time.
5. We have expanded our inversion routine that solves for the constitutive parameters in the Diet- erich-Ruina two-state variable friction constitutive law to include two types of improvements:(1) the ability to solve for zero- and one-state variable forms of the constitutive equations, and(2) the use of a damped least-squares inversion routine that greatly increases the stability of the inverse procedure. The ability to vary the number of state variables in the constitutive law allows us to quantitatively compare models having one and two state variables, as well as models which have no evolution effect. In addition to the ability to vary the number of parameters in the inversion routine, we have also created a damped version of the program, which both solves for ln(Dc) and uses a Marquardt-Levenberg Inverse Operator (see Aki and Richards, 1980). The damped version greatly enhances the stability of this severely non-linear problem. Solving for the natural log of Dc (the characteristic decay distance of the evolution effect) restricts the program to positive values and the use of the Marquardt-Levenberg damping limits the area of model space available in each iteration. In order to determine the model variances/covariances, an undamped version of the inverse routine is used after convergence is achieved with the damped routine.
6. We are continuing our investigation of the frictional behavior of serpentinite. As reported pre viously, the steady-state velocity dependence of serpentinite undergoes a transition from velocity weakening at intermediate sliding rates to velocity-strengthening at slower rates. We have used our inversion routine to model the velocity-strengthening behavior at the slowest velocities. Our pre liminary results indicate that the details of the low-velocity behavior can be adequately modelled using a constitutive law having no state variables, that is, only the direct effect deformation rate dependence is required. This means that our results are not inconsistent with the transition to veloc ity-strengthening at low velocity resulting from a gradual disappearance of the evolution effect. Modelling of the transitional velocity steps is still in progress.
REPORTS:
Weeks, J.D., Beeler, N.M., Tullis, T.E., Reinen, L.A., and Blanpied, M.L., Velocity dependence of frictional behavior of simulated granite gouge to large displacement, EOS Trans. Am. Geophys. Union, 71, 1578, 1990.
Reinen, L.A. Weeks, J.D., and Tullis, T.E., The effect of normal stress and sliding velocity on the frictional behavior of serpentine, EOS Trans. Am. Geophys. Union, 77, 1579, 1990.
Tullis, T.E., Stuart, W.D., and Simpson, R.W., Instability model for Parkfield earthquakes,including the effect of New Idria, Coalinga and Kettleman Hills events, EOS Trans. Am. Geophys. Union, 77, 1632, 1990.
462

II.3
Investigation of Slip Localizationin Large-Displacement Faults
for Application to Laboratory Fault ModelingUSGS Grant # 14-08-0001-G19466
Ronald L. Biegel 1 and Frederick Chester2^Lamont-Doherty Geological Observatory
of Columbia University Palisades, New York 10964
^ Department of Earth and Atmospheric SciencesSt. Louis University3507Laclede Ave.
St. Louis, Missouri 63103
InvestigationModels which seek to explain the state of stress and the mechanics of slip on the
San Andreas Fault are based on assumptions about stress conditions in the fault, pore fluid pressures and sources, thickness of the fault zone, and physical properties of the brecciated layer such as fracture density, grain size distribution and permeability. Although realistic fault models require such detailed knowledge of the mechanical properties of the material within the zone, many of these assumptions are not verified through direct or geophysical observations. Moreover, extrapolation of laboratory friction data to natural faults requires a thorough understanding of strain accommodating mechanisms in fault zones which at present is limited. Therefore, we have begun a structural study of deformation across the width of the San Andreas and San Gabriel faults in order to characterize fault zone
morphology, mineralogic alteration, and the distribution and range of grain size structures.
Samples are being analyzed using optical, scanning and backscattered electron microscopy and x-ray diffraction. Particle size distribution, texture, and petrofabric of localized shear features will be documented and related to the overall structure of the fault. We will use this information to improve mechanical models of seismogenic faults.
ResultsWe have completed collection of a suite of samples from across the width of the
North Branch of the San Gabriel Fault. The San Gabriel Fault is an ancient trace of the San Andreas Fault and is considered an analogue of the modern San Andreas at depth (Anderson et al., 1983). We chose exposures of the faults at Devils Canyon and Bear Creek as our initial sample sites. On the north side of the fault at Devils Canyon is a Precambrian gneiss while the south side of the fault consist of a granodiorite and
amphibolite dike complex. One of the principal surfaces of the North Branch at this locality
is well-defined by the juxtaposition of the two rock units along a continuous layer of ultracataclasite. The samples from this locality were examined using X-RD, optical and scanning electron microscopy and the following preliminary observations can be made.
463
II.3
These results will be presented at the Spring session of the American Geophysical Union (Biegel et al., 1991).1. At a distance of 63 meters from the core of the fault, the amphibolite host consist of almost equal amounts of pyroxene and amphibole with small amounts of epidote and clay. The pyroxene/amphibole grains are highly fractured along cleavage planes which have been chemically altered and weakened. The granodiorite host rock consist of nearly equal amounts of quartz and plagioclase (many times partially altered to clay), with large numbers of intragranular and transgranular cracks. Many of the plagioclase grains contain quartz inclusions. These observations suggest that the damage zone of the fault at depth extends at least to this distance from the fault surface.2. At a distance of 10 meters from the fault core, the granodiorite has undergone a high degree of localized grain size reduction and possesses a cataclastic fabric. Grain size reduction occurred mainly in anastomosing bands within plagioclase grains. Dense networks of extension and shear fractures in plagioclase occur along chemically altered cleavage planes. The fluids necessary to alter the plagioclase seem to reach the grains along pre-existing fractures. This grain size reduction mechanism operates in addition to the tensile failure mechanism due to loading of the grains in compression at the poles observed in both simulated and natural fault gouge by Sammis et al. (1987), Biegel et al. (1989). The amphibolite is completely crushed and largely altered to clays3. At a distance of 2.7 m from the fault the granodiorite is highly comminuted and contains clay alteration products. X-ray diffraction analysis has confirmed the presence of smectite and illite. The grain size distribution in this sample ranges from a diameter of approx. 1 mm down to the submicron scale. The larger grains contain high numbers of intragranular cracks, while the smallest grains appear to lack any significant crack population.4. Samples from the ultracataclasite zone are composed almost entirely of clay (illite, montmorillinite) and zeolite (laumotite) alteration products. The presence of folded, broken and comminuted veins and the preferred orientation of clay within the ultracataclasite suggests that alteration of feldspars to laumontite and clays occurred primarily at depth during displacement on the fault. The only porphyroclast observed within the ultracataclasite are quartz particles less than ~50 microns diam.5. We conclude that the mechanisms leading to fault rock structure are primarily cataclastic particle size reduction in the damaged zone with a transition to mineralogic alteration of the finest particles within the core of the fault. Both mineralogic alteration and slip appear to be extremely localized in the zone.
References
Anderson, J. L., R. H. Osborne, and D. F. Palmer, Petrogenisis of cataclastic rock within the San Andreas fault zone of Southern California, Tectonophysics. 67,221-249,
LtL 464

II.3
Biegel, R. L., C. G. Sammis, and J. H. Dieterich, The frictional properties of a simulated fractal fault gouge, Journal of Structural Geology. H, 827-849,1989.
Biegel, R. L. and F. M. Chester, Cataclasis and slip localization in the San Gabriel Fault, Southern California, in press, Transactions American Geophysical Union.
Sammis, C. G., G. C. P. King, and R. L. Biegel, The kinematics of gouge deformation, Pure and Applied Geophysics. 125.777-812.1987.
465
II. 3
Friction Constitutive Behavior of Saturated Faults at Hypocentral Conditions
USGS 14-08-0001-G1768
Frederick M. Chester*
Lamont-Doherty Geological Observatory, Palisades, NY 10964; (914)359-2900.(*Permanent address: Department of Earth & Atmospheric Sciences, Saint Louis University,
3507 Laclede, St. Louis, MO 63021; (314)658-3124.)
Investigations
The goal of the project is to determine the friction constitutive behavior of water saturated faults at hypocentral conditions through laboratory experiments and constitutive modeling. The experimental portion of the project includes shear of wet and dry quartz gouge within simulated faults at normal stresses to 100 MPa and temperatures to 250 °C, under triaxial compression. The experiments involve velocity stepping, slide-hold-slide and temperature stepping. Water saturated and nominally dry conditions are being investigated to determine the effects of water on frictional behavior, and in particular, to search for evidence of solution transfer at elevated temperatures and low sliding velocities. From these data we will determine the relationship between slip rate and temperature, and the form of temperature-dependence in rate- and state-dependent friction constitutive laws. The constitutive modeling portion of the project involves development and refinement of a temperature-dependent friction constitutive law, and using this law, analysis of our experiments and previously published stress-relaxation experiments on ultra-fine quartz gouge at hydrothermal conditions [Higgs, 1981]. These latter experiments show clear evidence for operation of solution-precipitation processes.
Results
The first suite of experiments investigating velocity and temperature dependence of friction in quartz gouge at both wet and dry conditions was completed during the summer of 1990. Using a servo-controlled triaxial apparatus, 1.5-mm thick layers of fine-grain (< 100 fim diameter) quartz gouge were sheared between rough steel surfaces to slip displacements of 10 mm, at a constant effective confining pressure of 20 Mpa, and under room-dry or water-saturated conditions. In each experiment the slip velocity was stepped between 4., 0.4 and 0.04 |im/s while temperature was maintained at a constant value between 22 and 85 °C. In some tests the temperature also was abruptly increased by 25 to 30 °C during a period in which the slip velocity was maintained at a constant 0.04 |im/s. The transient and steady-state changes in frictional strength resulting from the imposed steps in temperature and velocity were measured.
Use of steel blocks in the sample assembly increases the thermal conductivity of the sample and allows rapid equilibration of temperature. A step in temperature of 25 to 30 °C to a new equilibrated temperature condition is achieved in less than 100 s. Thermal expansion of the sample column during temperature changes is significant; expansion is approximately 1 |j,m axial lengthening per °C temperature change. The expansion is measured by the transducer used to generate the feedback signal for displacement servo-control. Accordingly, the command signal is modified to achieve a constant shear displacement rate of 0.04 |im/s across the gouge layer during each temperature step. Corrections are based on separate calibration experiments, conducted under load feedback, that define the thermal expansion of the sample column during a standardized heating procedure.
Differential axial force is measured with a load cell positioned inside the pressure vessel (Fig. 1). As such, the components of the sample assembly contributing to the total resistance to slip are the 1) shear of the gouge layer, 2) deformation of the jacket, and 3) lateral slip between the two
466

II. 3
steel spacers (Fig. 1). The jacket consists of a 5-|im thick copper foil inside a 2-mm thick sheet of lead. The spacer interface is lubricated with graphite powder to facilitate the lateral slip.
The velocity and temperature dependent friction law proposed by Chester (1988) may be used to describe the behavior of the quartz gouge. This friction law is based on the rate and state dependent law formulated by Dieteiich (1979) and Ruina (1983), with assumptions regarding normal stress dependence following Rice and Gu (1983). The addition of temperature dependence assumes that the time-temperature relationship for the microprocesses producing velocity dependence are described adequately with an Arrhenius relationship. The single state variable law is given by:
(a = T/G = |a* + a[ln(V/V*) + Qa/RT] + b0 and
d0/dt = (-V/L)[0 + ln(V/V*) + Qb/RT],where a and b are the friction parameters describing the direct and evolution effect, and Qa and Qb are the apparent activation energies for these effects.
The experimental results are qualitatively consistent with the constitutive formulation presented above in that 1) an abrupt increase in temperature induces a direct and evolution effect similar to, but in the opposite sense as, that induced by a step increase in slip-rate, 2) the characteristic distance for the evolution effect is similar for temperature and slip-rate changes, and 3) the magnitudes of Qa and Qb appear different.
Observations from other experimental studies also are consistent with the rate-, state- and temperature-dependent friction constitutive formulation above. Sliding experiments conducted at particularly high velocities and normal stresses should generate elevated temperatures through frictional heating, and could show evidence of temperature-dependent friction [Chester, 1988]. Room-temperature friction experiments on granite by Blanpied et al. [1989] do show a correlation between frictional heating (temperature changes measured with sensors) and a change in apparent rate-dependence that can be explained by our temperature-dependent friction law formulation [Chester, 1988; M. Blanpied, personal communication, 1990]. More recent experiments on friction in granite at hydrothermal conditions [Blanpied et al., 1990] show an increase in friction with an increase in temperature over the range of conditions where velocity weakening is observed, and a decrease in friction with an increase in temperature over the range of conditions where velocity strengthening is observed. Similar observations were made by Higgs [1981]. This inverse relationship between the effects of temperature and slip-rate on frictional strength is inherent in the constitutive formulation.
Presently we are quantifying the rate and temperature dependence of the quartz gouge in our experiments. In order to do this we must characterize the rate and temperature dependence of the lead jackets and the graphite lubricated interface because the jacket and interface help support the differential load measured by the internal load cell (Fig. 1). Accordingly, experiments have been conducted specifically to determine the time and temperature dependent strength properties of the jacket and graphite lubricated surface. These experiments utilize a set of steel sliding blocks with a smooth sliding surface separated by graphite similar to the graphite lubricated interface in the quartz gouge experiments. By conducting sliding experiments on the graphite at different pressures it is possible to separate the effects of the jacket from the graphite because only the graphite interface displays a pressure sensitive strength (Figure 2). Compared to the frictional strength of the quartz gouge, the graphite and the jackets are weak, however, they show significant rate-strengthening behavior (Figure 2). Additional calibration experiments that will characterize the jacket and graphite behavior in a unique fashion are planned for the summer of 1991 to allow quantification of the rate and temperature dependence of the apparatus effects and the quartz gouge layers.
The paper describing our constitutive analysis of the stress relaxation experiments by Higgs [1981] using the rate and temperature dependent friction law has been submitted for publication.
467
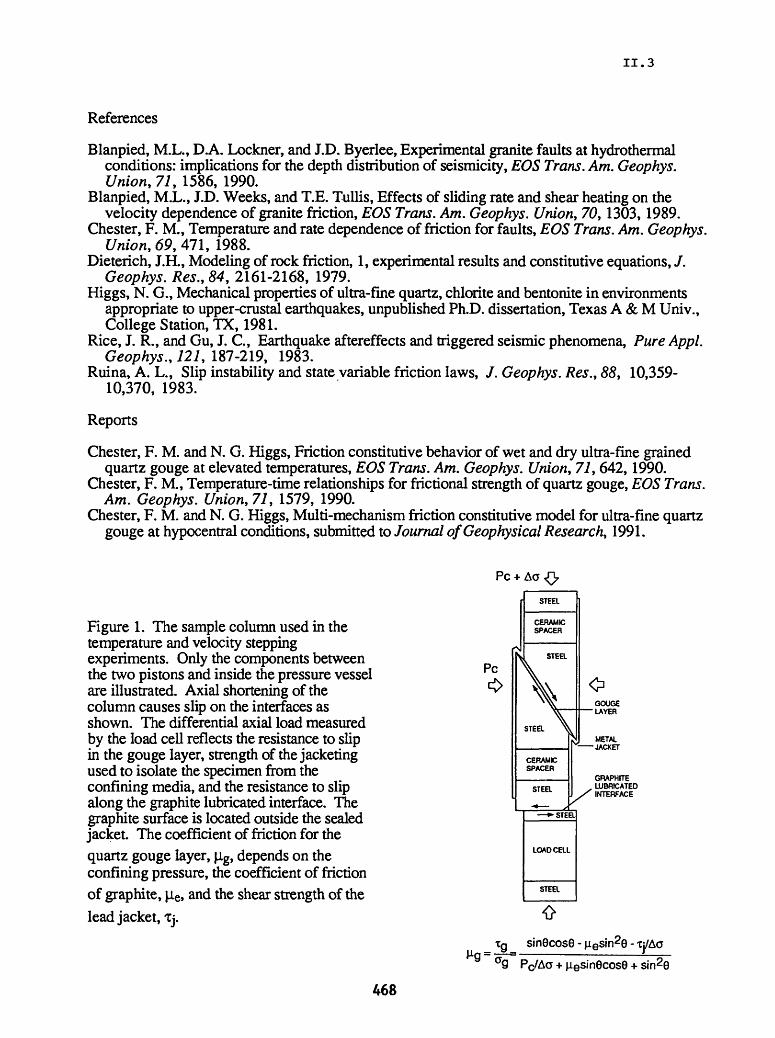
II. 3
References
Blanpied, M.L., D.A. Lockner, and J.D. Byerlee, Experimental granite faults at hydrothermalconditions: implications for the depth distribution of seismicity, EOS Trans. Am. Geophys.Union, 71, 1586, 1990.
Blanpied, M.L., J.D. Weeks, and T.E. Tullis, Effects of sliding rate and shear heating on thevelocity dependence of granite friction, EOS Trans. Am. Geophys. Union, 70, 1303, 1989.
Chester, F. M., Temperature and rate dependence of friction for faults, EOS Trans. Am. Geophys.Union, 69, 471, 1988.
Dieterich, J.H., Modeling of rock friction, 1, experimental results and constitutive equations, /.Geophys. Res., 84, 2161-2168, 1979.
Higgs, N. G., Mechanical properties of ultra-fine quartz, chlorite and bentonite in environmentsappropriate to upper-crustal earthquakes, unpublished Ph.D. dissertation, Texas A & M Univ.,College Station, TX, 1981.
Rice, J. R., and Gu, J. G, Earthquake aftereffects and triggered seismic phenomena, Pure Appl.Geophys., 121, 187-219, 1983.
Ruina, A. L., Slip instability and state variable friction laws, /. Geophys. Res., 88, 10,359-10,370, 1983.
Reports
Chester, F. M. and N. G. Higgs, Friction constitutive behavior of wet and dry ultra-fine grained quartz gouge at elevated temperatures, EOS Trans. Am. Geophys. Union, 71, 642,1990.
Chester, F. M., Temperature-time relationships for frictional strength of quartz gouge, EOS Trans. Am. Geophys. Union, 71, 1579, 1990.
Chester, F. M. and N. G. Higgs, Multi-mechanism friction constitutive model for ultra-fine quartz gouge at hypocentral conditions, submitted to Journal of Geophysical Research, 1991.
PC +
Figure 1. The sample column used in the temperature and velocity stepping experiments. Only the components between the two pistons and inside the pressure vessel are illustrated. Axial shortening of the column causes slip on the interfaces as shown. The differential axial load measured by the load cell reflects the resistance to slip in the gouge layer, strength of the jacketing used to isolate the specimen from the confining media, and the resistance to slip along the graphite lubricated interface. The graphite surface is located outside the sealed jacket. The coefficient of friction for thequartz gouge layer, |ig, depends on the confining pressure, the coefficient of frictionof graphite, |ie, and the shear strength of the lead jacket, TJ. o
sinGcosG - nesin26
J9 PC/ACT + Hesi'n6cos9
468

II. 3
20Graphite Friction T=24 C
Pc=20 MPa
V = 4 I 0.4 I 4
Pc=5 MPa
4 I 0.4 I 4
Pc=35 MPa
4 I 0.4 I 4
Pc=20 MPa
4
4 6
Shear Displacement (mm)
10
Figure 2. Representative results of a velocity stepping experiment on graphite lubricated steel interfaces. Graphite is sheared by stepping between velocities of 4 and 0.4 jim/s at room temperature and several different confining pressures. This is raw friction data showing the combined rate and pressure dependence of the jacket and graphite.
469

II.3
Mechanics of Earthquake Faulting9960-01182
James H. DieterichU.S. Geological Survey
345 Middlefield Road, MS 977Menlo Park, California 94025
(415) 329-4867
INVESTIGATIONS
1. Fault interactions and earthquake recurrence. Joint studies with Robert Simpson (USGS) and Allin Cornell (Stanford) were conducted on the effect of fault interactions on earthquake recurrence times and earthquake probabilities.
2. Direct observation of sliding surfaces during frictional slip. An new type of friction experiment is being developed which permits direct, microscopic, observation of surface contacts during frictional slip. The experiments require transparent materials and provide data on contact size distributions and the time- and displacement-dependent evolution of contacts.
RESULTS
1. Fault interactions. One objective of this study is to examine the effect of fault interactions on the time to recover a stress drop on a fault segment using highly idealized 3D elastic dislocation models (Figure 1).
_
The time to recover a stress drop (f = T/ T ) on fault locked segment 1 exactly satisfies the time-predictable estimate of recurrence (T = D/V) only if all other dislocation segments slip at the long term rate V. However, fault interactions alter the time- predictability of earthquakes. If adjacent the adjacent seismogenic segments 2 and 2' are locked during the stress cycle on segment 1, the time to recover a stress drop on 1 is greater than the time predictable recurrence time (Fig. 2). Assuming adjacent segments are locked, but slip intermittently in earthquakes, such that the total slip segments slip is the average rate over long time periods, then time-predictable model will give the average time to recover a stress drop on a segment. However, in any particular stress cycle on segment 1, the recurrence time will vary depending on the occurrence of slip events on the adjacent
470

II.3
segments 2 and 21 . The effect of fault interactions decreases as segment length increases and appears not to be significant for great earthquakes. These effects are somewhat smaller for subduction and normal fault zones.
Interactions of this type may be one source of the 'intrinsic variability1 of earthquake recurrence times. Knowledge of the slip history on nearby segments could reduce this source of uncertainty in recurrence time estimates.
2. Observations of frictional surfaces. J. Dieterich and B. Kilgore have developed experiments for direct microscopic observation of sliding surfaces during slip. The experiments employ transparent materials and exploit the characteristic of ground surfaces to diffuse transmitted light while regions in actual contact transmit light rays across the sliding surface without scattering. Hence, in proper illumination, actual points of contact appear as bright spots against a dark background. Optical resolution of the system is better than 2 microns. The goal of the experiments is to better understand the physical processes that underlie the rate- and state- dependence of fault friction.
Trial experiments with Lucite plastic and soda-lime glass have demonstrated the feasibility of the approach. Sliding experiments with both materials exhibit pronounced rate- and state-dependent constitutive properties and a characteristic sliding distance, Dc, as seen in rocks. It is found that contact size distributions correlate well with Dc. Estimates of contact stresses, from measurements of the actual area of contact, agree with the indentation strengths of about 0.4 GPa and 7 GPa for the plastic and glass, respectively.
Preliminary, photocell measurements of transmitted light intensity appear to provide a quantitative means to continuously monitor contact area during slip. During slide-hold- slide tests, light intensity increases with the logarithm of the hold time and correlates with peak shear stress following the hold which also increases with the logarithm of contact time (Fig.3). Independent indentation creep tests confirm that contact area increases with hold time. These measurements support the notion that the state variable is a measure of contact lifetime and that time-dependent increases of fault strength are the result of creep at points of contact that increases the real are of contact
471

II.3
Surface
Figure 1. Idealized elastic dislocation model of a vertical strike slip fault
VERTICAL STRIKE SLIP FAULT
Q>
I CO
o
<p
fe
IP
o>
Length/W of segments2 2"
Creep on segment 3 and 45,10 Segments 1 and 2 are locked
- 0
-Time-predictable recurrence = 1. All segments, except 1, creeping at V= const.
2 4 6 8 10 Length of segment 1, L t /W
12
Figure 2. Comparison of the time to recover a stress drop in the elastic model to time-predictable recurrence.
2400
.§. 2300
t° 2200
o£ 2100
2000
o shear stress
co o.
.3
S>
CO
CO0>
10 100 1000
Hold time (s)
Figure 3. Increase in light intensity and peak shear stress during hold, Lucite plastic at 5 MPa.
472

II.3
REPORTS
Blanpied, M. L., Lockner, D. A. and Byerlee, J. D., Experimental granite faults at hydrothermal conditions: implications for depth distribution of seismicity, Abstract, EOS, Trans. Am. Geophysical Union, 71,1585,1990.
Blanpied, M. L., Lockner, D. A. and Byerlee, J. D., Fault stability inferred from granite sliding experiments at hydrothermal conditions, Geophys. Res. Lett. 18,609-612,1991.
Dieterich, J. H., 1990 Working Group Study on Probabilities of Earthquakes in the San Francisco Bay Region, California , Abstract, EOS, Trans. Am. Geophysical Union, 71, 11447, 1990.
Dieterich, J. H. and Linker, M. F., Effects of Variable Normal Stress on Rock Friction: Observations at 5 MPa Normal Stress , Abstract, EOS, Trans. Am. Geophysical Union, 71, 1585, 1990.
Kilgore, B. D., Blanpied, M. L. and Dieterich, J. H., 1990, Granite Friction Experiments at a Range of Velocities and Normal Stresses , Abstract, EOS, Trans. Am. Geophysical Union, 71, 1596, 1990.
Linker, M. F. and Dieterich, J. H., Effects of Variable Normal Stress on Rock Friction: Observations at 5 MPa Normal Stress (submitted to Jour. Geophys. Res.).
473

II.3
Stressing, Seismicity and Rupture of Slip-Deficient Fault Zones
14-08-0001-G1788
R. Dmowska and J. R. Rice (PI)Division of Applied Sciences and Department of Earth and Planetary Sciences,
Harvard University, Cambridge, MA 02138(617) 495-3452 and 3445
1. Investigations1.1 The influence of asperities along subduction interfaces on the stressing and seismicity of
adjacent areas has been investigated for three zones of large earthquakes with known asperity distributions: Rat Islands 1965, Alaska 1964 and Valparaiso 1985. A final text (Dmowska and Lovison, 1991) has been submitted for publication.
1.2 Partial breaking of a mature seismic gap has been investigated based on seismic history and seismotectonics of western segment of New Britain. A final text (Dmowska et al., 1991) has been submitted for publication.
1.3 Seismic behavior of the outer-rise has been investigated as a possible predictive indicator for large subduction earthquakes. The work was a continuation of our previous research; preliminary results (Dmowska and Lovison, 1990) have been presented.
1.4 Theoretical modeling, by finite element methods, of viscoelastically mediated stress transfer and redistribution associated with the earthquake cycle continued, directed to subduction zones and to post-seismic effects of the Loma Prieta earthquake. An abstract was presented on the latter topic (Linker and Rice, 1990).
1.5 A study on elevated pore pressure as a basis for the weakness of major faults was completed. A final text was submitted (Rice, 1990) and is now in press for publication.
1.6 Studies have begun on examining rate- and state-dependent friction on the shallower portions of a vertical half-plane fault moving in a strike-slip mode in an otherwise elastic half space. The initial focus is on seeing to what extent models which are uniform in the along-strike direction can nevertheless give rise to spatio-temporally complex slip histories with strong along- strike variability (Rice, 1991b).
2. Results2.1 Continuing and completing work that has been partially summarized previously, we have
investigated the influence of large-scale fault inhomogeneities in large subduction earthquakes on the style of deformation and seismic behavior of incoming oceanic plate and slab at intermediate depths during the earthquake cycle. The zones of three large subduction events of Rat Islands 1965, Alaska 1964 and Valparaiso 1985 have been searched for earthquakes with mfc ^ 5.0 if available and for as long time periods as possible. It has been found that in general the seismicity in the incoming oceanic plate clusters in front of asperities (=areas of highest seismic moment release and strongest locking). It is usually lacking in areas adjacent to non-asperities, that is to zones that slip during the main event but with appreciably smaller seismic moment release, and possibly slip seismically/aseismically during the whole cycle. Similar behavior occurs in the downgoing slab at intermediate depths, where seismicity during the cycle clusters (but less strongly than in the oceanic crust) next to asperities and downdip from them. We infer that the locking of asperities causes higher stresses associated with the earthquake cycle itself to occur in areas adjacent to asperities, both updip and downdip from them, and that such stressing is much less pronounced in the areas adjacent to non-asperities. This opens the possibility of identifying the areas of highest seismic moment release in future subduction earthquakes, and carries implications for where the highest deformation and, possibly, precursory phenomena and/or nucleation of a future event might occur. A full text was completed in March '91 (Dmowska and Lovison, 1991) and submitted
474

II. 3
for publication.2.2 To better understand the mechanics of subduction and the process of breaking a mature
seismic gap, we studied seismic activity along the western New Britain subduction segment (1470E - 1510E, 408 - 80S) through earthquakes with mb > 5.0 in the outer-rise, the upper area of the subducting slab and at intermediate depths to 250 km, from January 1964 to December 1990. The segment last broke fully in large earthquakes of December 28, 1945 (Ms = 7.9) and May 6, 1947 (Ms = 7.7), and its higher seismic potential has been recognized by McCann et al. (1979). Recently the segment broke partially in two smaller events of February 8, 1987 (Ms = 7.4) and October 16, 1987 (Ms = 7.4), leaving still unbroken areas.
We observe from focal mechanisms that the outer-rise along the whole segment was under pronounced compression from the late 60's to at least Octoberl987, signifying the mature stage of the earthquake cycle. Simultaneously the slab at intermediate depths below 40 km was under tension before the earthquake of October 16, 1987. That event, with a smooth rupture lasting 32 sec, rupture velocity of 2.0 km/sec, extent of approximately 70 km and moment of 1.2 1027 dyne- cm, did not change significantly the compressive state of stress in the outer-rise of that segment. The earthquake did not fill the gap completely and this segment is still capable of rupturing either in an earthquake which would fill the gap between the 1987 and 1971 events, or in a larger magnitude event (Ms=7.7-7.9), comparable to earthquakes observed in that segment in 1906,1945 and 1947.
The situation in western New Britain is mechanically similar to that of Michoacan, Mexico, where the earthquake of Playa Azul on October 25,1981 (Ms=7.3) occurred in the central part of the area identified previously as a seismic gap (Michoacan gap, Kelleher et al., 1973). Subsequently the whole gap broke on September 19,1985 in the Ms=8.1 Michoacan earthquake.
This extended work of which the preliminary form had been summarized earlier. A full text was completed in April '91 (Dmowska et al., 1991) and submitted for publication.
2.3 Seismic behavior of the outer-rise is being studied as a possible predictive indicator for large subduction earthquakes (Dmowska and Lovison, 1990). It is known that the outer-rise breaks in tension adjacent to uncoupled subduction zones and in both tension and compression near coupled areas, where there are tensional events predominantly following large underthrust earthquakes and compressional events (much less frequent) grouped towards the end of the cycle. Our recent work (Dmowska and Lovison, 1989, 1991) shows a high tendency of both tensional and compressional outer-rise events to occur in front of areas of highest seismic moment release (asperities) in the associated great thrust events. The compressional events are plausibly interpreted as a sign of stress increase associated with the maturing seismic gap and hence provide an important intermediate-term precursor for large subduction events (Dmowska and Lovison, 1988). However, these events are not seen in all tectonic settings, and our goal in this work is to identify which features of the tectonic setting give rise to compressional outer-rise seismicity, so that the absence or not of such events adjacent to a particular gap may be more reliably interpreted. Thus we have expanded to a fuller set of zones the study reported in the previous summary (also, Dmowska and Lovison, 1990), on the relation between seismic behavior of the outer-rise and the age of the incoming oceanic plate, rate of convergence and degree of coupling, using data for earthquakes with mb ^ 5.5 around the Pacific. Thus far the results continue to support previous conclusions that the strongest correlation is with age, that there is no correlation with rate of convergence, but that there is a weak correlation between the magnitude of outer-rise activity and seismic coupling. For example, older oceanic plate (> 80 Ma) breaks usually with the presence of compressional outer-rise events, including large ones (mb ^ 6.0), before large subduction earthquakes, and with tensional events predominantly afterwards, whereas very young oceanic plate (< 20 Ma) shows limited outer-rise activity, with earthquakes of smaller sizes (mb < 6.0) that are predominantly tensional, and with only a few compressional events marking mature segments ready to break in large subduction events.
2.4 Work on the Loma Prieta study (Linker and Rice, 1990) was extensively summarized in the previous Yellow Book report (under grant number G1844). Work continued on mesh
475

II.3
refinements and modeling techniques. We are attempting to estimate time-dependent stress transfers, due to relaxation processes in the deeper crust following the earthquake, as this may affect the timing of future events on the San Francisco peninsula segment of the San Andreas fault and possibly to some extent on the Hayward and Calaveras faults. The modeling addresses not only coseismic static stress changes, but also the possibility that those stresses cause relaxation processes to occur in the deeper fault zone and crust that result in further stress changes which can greatly exceed those coseismic stresses at large distances from the epicenter (Rice and Gu, 1983). The time scale of any such delayed stress transfers depends on relaxation times for those deep creep processes. The time scales are poorly constrained at present, but we aim to use our modeling of surface deformation, in conjunction with ongoing geodetic measurements in the region, to improve understanding of these processes.
In the finite-element modeling of earthquake cycles in subduction zones, done in collaboration with Dr. W. D. Stuart of USGS, work continued on exploring a fuller range of parameters and devising more refined meshes which could give better estimates of stress changes in the descending slab in the vicinity of the locked end of the thrust contact zone. Some preliminary results were given in the previous summary and a manuscript on this work is now in preparation.
2.5 A final manuscript was completed in December (Rice, 1990) on the work on elevated pore pressure in fault zones as a basis for fault weakness. The abstract follows: The San Andreas Fault is weak in an absolute sense, in that it moves under shear stresses far smaller than implied by the most obvious reading of lab friction results (Byerlee law with hydrostatic pore pressure and friction coefficient f = 0.6 to 0.9). It is also weak in a relative sense, in that the adjoining crust seems to be mechanically stronger; such is implied by the stress state there having a horizontal maximum principal direction that makes a steep angle to the trace of the S AF, much larger than the 25° to 30° angle (i. e., 45°- 0.5 arctan f) expected from standard frictional failure considerations, and in the range of 60° to nearly 90°. It is shown that a maturely deformed fault zone which is weak relative to its surroundings, due to inherent material strength and/or pore pressure differences, develops stresses within it which are distinct from those of its surroundings. Because of those stress differences, it is found that pore pressure distributions which are high, and near to the fault-normal compressive stress, within the fault zone, but that decrease with distance into the adjacent crust, are consistent with both the absolute and relative weakness of the SAP; the pore pressure in such distributions is less than the least principal stress at every point, so there is no hydraulic fracturing, even though the pressure in the fault zone may be greater than the least principal stress in the nearby crust. Such pore pressure distributions are shown to result from the following assumptions: (I) there is a supply of fluids near the ductile roots of crustal fault zones, where pore pressure must be nearly lithostatic; (II) active fault zones are far more permeable than the adjoining rock of the middle crust; and (ffl) fault permeability is a rapidly diminishing function of effective normal stress. Evidence in support of these assumptions is discussed. The resulting pore pressure distributions adjust significantly from hydrostatic, such that the effective normal stress, and hence also the brittle frictional strength, becomes approximately independent of depth along the fault zone. These assumptions also predict the possibility of diffusive surges of pore pressure that propagate upwards along a fault in a slow wave-like manner.
In continuations on this theme, some continuing theoretical work has been done on the predicted wave-like propagation of surges of pore pressure (Rice, 199la), and the types of pore- pressure distributions discussed (adjusting from hydrostatic so that the effective normal stress becomes independent of depth) have been used in some of the modeling described next.
2.6 Preliminary results have been obtained on analysis of slip on a long vertical strike-slip fault between elastically deformable crustal blocks. These blocks are driven such that each point on the fault moves, in long-term average, at an imposed "plate" velocity. The analysis is done by boundary integral equation methods based on the Chinnery solution, with procedures modified from those developed earlier by W. D. Stuart and T. E. Tullis. Dieterich-Ruina rate- and state- dependent friction applies on the fault surface, and A-B [=VdTss(V)/dV] varies with depth, in a
476

II.3
manner similar to that in the 2D anti-plane strain Tse-Rice (JGR'86) model, being negative in the cool/shallow crust and positive in hot/deeper regions (V=slip speed; Tss=steady state frictional strength). At each depth, constitutive properties in the models are either uniform in the along-strike direction or are perturbed, sometimes only slightly, from uniformity. In a model corresponding, roughly, to the version which results here when A-B is independent of depth, Horowitz and Ruina (JGR'89) showed that spatio-temporally complex slip resulted over at least a narrow parameter range. Simulations corresponding to the Tse-Rice case, in which the slip variation with depth is constrained to be the same at each cross section along strike, give simple limit-cycles of repeated great earthquakes. However, the fully 3D simulations sometimes show complex slip histories, somewhat suggestive of a spectrum of earthquake sizes, with aperiodic recurrence and variable rupture area, and with highly variable moment release along strike in some large events. These effects diminish somewhat with mesh refinement and may be an artifact of an inadequate mesh refinement. The number of cases run at the time of writing is still too limited to allow definitive conclusions, but this raises a concern about conclusions on spatio-temporal complexity drawn on the basis of fault modeling with more ad-hoc discretizations (spring-connected rigid blocks, cellular automata). It remains an open issue as to whether realistic complexity of slip can result in situations for which fault properties and loading are uniform along strike, versus situations in which strong variation of properties and/or of the geometry of fault zones (bends, offsets, sub- parallel strands, as mapped at the surface) is necessary to explain slip complexity.
ReferencesDmowska R. and L.GLovison, Influence of asperities in zones of large subduction earthquakes
on style of deformation and seismic behavior of incoming oceanic plate and slab at intermediatedepths - Alaska 1964, Rat Islands 1965, Valparaiso 1985 and Colombia 1979, EOS, Trans.Am. Geophys. Un., 70, p. 1063, 1989.
Dmowska R. and L.C.Lovison, Intermediate-term seismic precursor for some coupled subductionzones, Pure Appl.Geophys.,126, N. 2-4, 643-664, 1988.
Dmowska R. and L.C. Lovison, Seismic behavior of the outer-rise (abstract), EOS, Trans. Am.Geophys. Un., 71, p. 1468, 1990.
Dmowska R. and L.C.Lovison, Influence of asperities along subduction interfaces on the stressingand seismicity of adjacent areas, submitted to the topical issue of Tectonophysics onEarthquake Source Physics and Earthquake Precursors, March 1991.
Dmowska R., L.CLovison-Golob and JJ.Durek, Partial breaking of a mature seismic gap: the1987 earthquakes in New Britain, submitted to the topical issue of Pure and AppliedGeophysics on Earthquake Source Mechanisms and Seismotectonics, April 1991.
Dmowska R., J.R.Rice, L.C.Lovison and DJosell, Stress transfer and seismic phenomena incoupled subduction zones during the earthquake cycle, J.Geophys.Res., 93, NO. B7, 7869-7884, 1988.
Linker, M. F. and J. R. Rice, Models of postseismic stress transfer and deformation following theOctober 17, 1989 Loma Prieta earthquake, Northern California, Eos Trans. AGU, 71, 1653,1990.
Rice, J. R., Fault stress states, pore pressure distributions, and the weakness of the San AndreasFault, in Fault Mechanics and Transport Properties of Rocks: A Festchrift in Honor of W. F.Brace, ed. B. Evans and T.-F. Wong, Academic Press, in press; submitted Dec. 1990 (also,Abstract, EOS, Trans. AGU, 71, No. 43, p. 1652, 1990)
Rice, J. R., Pore-pressure surges in fault zones, AGU-MSA 1991 Spring Meeting (supplement to23 April 1991 EOS), abstract H31B-10, p. 116,1991a.
Rice, J. R., Spatio-temporally complex fault slip: 3D simulations with rate- and state-dependentfriction on a fault surface between elastically deformable continua, AGU-MSA 1991 SpringMeeting (supplement to 23 April 1991 EOS), abstract T42A-08, p. 278,1991b.
Rice, J. R. and J.-C. Gu, Earthquake aftereffects and triggered seismic phenomena, Pure Appl.Geophys., 121, 187-219, 1983.
477

II. 3
April 22. 1991
Strength Recovery in Rocks and Minerals:
Collaborative Research
Brian Evans and Teng-fong Wong, Co-Principal Investigators
USGS Grant # 14-08-OOO1-G1806 Dept. of Earth, Atmospheric, & Planetary Sciences
Massachusetts Institute of Technology Cambridge MA 02139
USGS Grant # 14-08-0001-G1807 Dept. of Earth & Space Sciences
State University of New York, Stony Brook Stony Brook NY
Objectives:
Along geologic faults, repeated earthquake instabilities generate wear materials, which result in a thickening gouge zone as seismic slip accumulates. Seismologic observations suggest that faults may recover in strength during the aseismic period of the earthquake cycle. Field observations of fault zones indicate that minerals in the gouge, breccia, and wall rocks can participate in complex petrologic reactions which probably affect the mechanical properties of the fault. The coupled effect of wear processes which occur during slip, and healing processes which operate in the interseismic period, may result in variation of seismic stress drop and productivity with recurrence time, tectonic environment, and cumulative slip. It is important to have a fundamental understanding of the wear and healing mechanisms and their relation to fault instability. In this project we are investigating strength recovery by solution transfer processes in faulted samples of Carrara marble, Maryland diabase, and Sioux quartzite, and in quartz and calcite gouge.
Long Term Evolutionary Effects
In the last semi-annual report, we discussed strength recovery in series of triaxial mechanical tests at temperatures ranging between 700-950°C in faulted samples of Maryland diabase. Microscopic examination indicates that the melt which is formed in small pockets originally, is injected into narrow fractures during deformation, possibly during dilatancy prior to failure. There are several possible explanations for the strength recovery cycles. One important aspect affecting the strength are variations in the effective pressure caused by the generation and migration of the melt [Fredrich and Evans, 1990].
Fredrich and Evans have initiated a second suite of experiments to investigate the effect of solution transfer processes on the strength recovery of granular aggregates. In these tests, a 0.6 mm thick layer of simulated quartz gouge with a mean grain size of 3 fim was sheared between forcing blocks of Sioux Quartzite in an internally-heated, gas-medium, servo-
476

II.3
controlled deformation apparatus. The sample assembly was saturated with water and sheared at temperatures, T =230+5 °C, confining pressures, P =250 MPa, and pore pressures
1 \*»
P =75 MPa. In some runs, temperature was elevated to a new value, T , for varyingri2O 2
periods of time, t__, prior to loading at a reduced temperature T. Thus, the experiments areH 1
equivalent to slip-hold-slip experiments, except that the "hold" period occurs at a higher temperature than the "slip " portion.
The diameter and length of the forcing blocks were 15.9 mm. A 2.4 mm diameter hole in the upper forcing block reached to within 2 mm of the 30° inclined sawcut and facilitated access of the pore fluids to the fault zone. Axial stress was supplied by a hydraulic loading system, measured with an external load cell, and transmitted to the sample through an alumina column with a diameter of 18.4 mm. Both the alumina column and sample were enclosed in thin-walled (0.3 mm) copper tubing. Displacement was measured with a differential transformer (DCDT) mounted between the moving ram and fixed wall of the pressure vessel; the DCDT signal was compared to a control signal generated by a 12-bit D/A converter. The control signal was a ramp function which corresponded to a constant (axial) displacement rate
of 28 x 10" mm s" . The load and displacement signals were sampled by a 12-bit A/D converter at 1/s with typical resolutions of 370 N and 0.01 mm.
Preliminary results indicate a dramatic strength recovery for samples which are "healed" at elevated temperatures prior to loading (Figure 1). Samples loaded at =*230°C after a healing period at elevated temperatures exhibit instability, whereas samples loaded at the same temperature without prior healing, exhibit stable sliding with a quasi steady-state strength established at shear strains =3-4%. Experiments in which the time to loading tL is held constant for healed and unhealed samples indicate that the strength recovery is not due to increases in the time of stationary contact for the healed samples (Figure la and Ib). Experiments in which the healing time is varied indicate that much of the strength recovery occurs during the first 60 minutes of healing, as might be predicted on the basis of hot isostatic pressing results (e.g., Brantley, PhD. dissertation, Princeton University, 1987; Evans and Lockner, 1989).
Scanning electron microscopy (SEM) indicates that sliding in the unhealed samples is accompanied by the development of shear zones within the gouge layer. Abundant evidence for the activity of solution-transfer processes is observed in the healed samples. Current efforts are focused on the quantitative characterization of neck growth and contiguity in the healed samples. Additional experiments to determine the effect of fluid pressure, temperature, and particle size on the healing behavior are also underway.
Wear Processes and Short Term Evolutionary Effects
Using the conventional triaxial configuration, Wong and coworkers at SUNY, Stony Brook are investigating the stabilization of slip by wear processes. In these experiments the frictional sliding behavior was monitored as a function of cumulative slip when a simulated gouge layer of ultrafine quartz was sheared. In a typical experiment, the sliding behavior evolved from dynamic instability to stable sliding through several sequential stages.
479

II.3
Supercritical oscillations marked the onset of dynamic instability. Tens and sometimes hundreds of stick-slip events occurred, while the stress drop amplitude decreased monotonically with accumulated slip. The results could be interpreted with a simple wear model and allow the estimation of the friction constitutive parameters through the observation of the oscillation period as a function of load point velocity. Preliminary results were discussed in some detail in the previous semi-annual report. During this period, we have completed the experimental suite and have prepared two papers reporting the results [Gu and Wong, 1991; Wongetal., 1991].
References
Evans, B., and D. Lockner, Densification and Electrical Properties of Hot Pressed Quartz Aggregates, EOS, 70, 1323, 1989.
Fredrich, J. T., and B. Evans, High Temperature Fracture and Flow of Maryland Diabase, presented at Fall AGU Meeting, 1990.
Gu, Y. and T.-f. Wong, The effects of loading velocity, stiffness, and inertia on the dynamics of a single degree of freedom spring-slider system, /. Geophys. Res., in press, 1990.
Wong, T.-f., Stabilization of faulting by wear processes, International Symposium on Earthquake Source Physics and Earthquake Precursors, Tokyo, 1990.
Wong, T.-f., Y. Gu, and T. Yanagidani, and Y. Zhao, Stabilization of faulting by cumulative slip, in press, Fault Mechanics and Transport Properties of Rocks, A Festschrift in Honor ofW. F. Brace, edited by B. Evans and T.-f. Wong, Academic Press, London, UK., 1991.
480

II.3
D Q_
(D
o(D
_C GO
250
200
150
100
50
0
T 1 = 242±6°C
t=37 min
345
Shear Strain (%) 48i

II.3
Pressure Solution, Crack Healing and Crustal Stress
9960-04543
Stephen H. HickmanBranch of TectonophysicsU.S. Geological Survey
345 Middlefield Rd., MS 977Menlo Park, CA 94025
(415) 329-4807
Investigations
1. To better understand the processes controlling the physical and temporal evolution of physical properties in the earth (e.g. permeability, seismic velocities, and density), the mechanisms and kinetics of solution-transport creep and the micromechanics of friction and fault strengthening, we are conducting a detailed experimental study of pressure solution and crack healing under load in simple quarts/water systems. This study employs experiments with single crystals in well-controlled model geometries and experiments on polycrystalline aggregates.
2. To help constrain the in-situ matrix permeability of rock at great depth, we are continuing (together with David Lockner of the U.S.G.S., Menlo Park) simultaneous measurements of permeability and resistivity on cores recovered from the 12-km-deep Kola Deep Well in the Soviet Union. By making simultaneous permeability and resistivity measurements at a variety of confining pressures, we hope to quantify ~ and perhaps correct for the effects of stress-relief cracking on physical property measurements made on cores recovered from deep boreholes.
3. To improve our understanding of the mechanics of breakout formation and the state of stress in tectonically active areas, we have initiated a cooperative U.S./Soviet program to study the distribution, orientation, and morphology of stress-induced borehole breakouts in several deep and ultra-deep boreholes in the Soviet Union. These studies will employ borehole televiewer logs, oriented four- and eight-arm caliper logs and laboratory and borehole measurements of rock physical properties.
4. To evaluate competing theories for the localization of seismicity within the New Madrid Seismic Zone (NMSZ) and provide constraints on the mechanics of intraplate earthquakes, we are initiating a program to make measurements of stress orientations and magnitudes, natural fracture and fault orientations, permeability, pore pressure and heat flow within and adjacent to the NMSZ.
5. S. Hickman wrote a review paper on stress in the lithosphere and the strength of active faults as part of the 1991 U.S. National Report to the International Union of Geodesy and Geophysics.
Results
1. All components for the see-through hydrothermal vessel to be used in the single-crystal pressure solution and crack healing experiments are now in hand. We are currently assembling and testing this apparatus.
482

II.3 S. Hickman, Semi-Annual Report, 5/15/91
2. Results from the simultaneous permeability and resistivity measurements that we made on cores obtained from the bottom of the Kola well at depths of 11.4 to 12.0 km, which were discussed in the preceding two Technical Summaries, have been written up and are in press. We are currently continuing this study using a suite of 16 additional core samples obtained from the Kola well at depths ranging from 0.9 to 12.2 km. Similar tests will also be conducted on representative rock samples obtained from surface outcrops at the Kola site.
3. In response to our visit to the U.S.S.R. in the summer of 1990, we are preparing for a joint U.S.G.S./Soviet Ministry of Geology study of borehole breakouts and in-situ stress to be conducted in the 4-km-deep Tyrnauz well during the summer of 1991. The Tyrnauz well is located in the Caucasus Mountains in a region of active north-south crustal shortening associated with collision of the Arabian and Eurasian plates. This area is characterized by numerous large earthquakes, including the M = 6.9 Armenian earthquake of December 7,1988, and has been the subject of extensive Soviet and American seismologic and geologic investigations.
4. Although insufficient money was obtained this year to drill any new wells near the New Madrid Seismic Zone, we are using FY 1991 funds to repair and update our hydraulic fracturing equipment We plan on using this equipment during FY 1992 to conduct stress measurements in an approximately 2.7-km-deep "hole of opportunity" currently being drilled by the Dupont Chemical Company in western Tennessee, on the edge of the Mississippi Embayment
Reports
Hickman, S., The strength of active faults in the Earth's crust and the high stress/low stress controversy, EOS, Trans. Amer. Geophys. Union, 71, 1579, 1990.
Hickman, S., and B. Evans, Experimental pressure solution in halite: the effect of grain/interphase boundary structure, /. Geol. Soc. London, 148, 549-560,1991.
Lockner, D., S. Hickman, V. Kuksenko, A. Ponomarev, A. Sidorin and J. Byerlee, Laboratory-determined permeability of cores from the Kola Superdeep Well, USSR, Geophys. Res. Lett., (in press) 1991.
Hickman, S., Stress in the lithosphere and the strength of active faults, Rev. Geophys., (in press) 1991.
483

II.3
EXPERIMENTAL ROCK MECHANICS
9960-11180
Stephen H. Kirby Branch of Tectonophysics
U.S. Geological Survey345 Middlefield Road, MS/977Menlo Park, California 94025
(415) 329-4847
InvestigationsSeveral areas of research are being pursued as a followup to the
publication of our Science paper of April of this year on the roles of mantle phase changes in deep earthquakes and deep subduction mechanics: (1) We are investigating the spatial and temporal distribution of deep earthquake seismic moment release in relation to slab descent rates and ages. This work is in collaboration with Art McGarr. (2) We are studying in detail with Emile Okal the deep seismicity of the Indonesia subduction zone because it shows beautifully the onset of deep-earthquake activity with increases in plate age and descent rate. This will be combined with thermal and stress modelling of the deep seismic deformation. (3) The basalt-» eclogite transformation involves a volume change of -15 to -18% , and without question occurs in subducting oceanic crust. Such a large volume change should have significant effects on the state of stress of subducting crust. Following earlier suggestions of Ringwood (1972) and Pennington (1983), we have considered the consequences of this transformation on intermediate-depth subduction-zone earthquakes in light of the results of preliminary laboratory kinetics experiments in our lab and in light of recent work on the distribution of fluids from the dehydration of oceanic crust and uppermost mantle in subduction zones.
Results1. Previous work by McGarr (1977) and by Abe and Kanamori (1979) have
identified peaks in seismic moment release with depth in subduction zones at 100-250, about 250-450 and and 450-700 km. McGarr has associated these peaks with the effects of the volume changes of partial melting of the oceanic crust and the olivine-> spinel and spinel-»postspinel transformations, respectively. Our analysis of more recent earthquake catalogues by Astiz et al. (1987) and by
484

II.3
Abe (1981,1984) and others have refined these maxima to depth intervals of 60 to 150 km, 350-425 and 550-650 km. Moreover, we have shown that most of the large deep earthquakes (mg > 6.9) occur near the bottom or near the lateral
edges of the deep earthquake population, not generally in the middle of the deep Wadati-Benioff zone. This result is incompatible with models of deep earthquake stresses dominated by the negative buoyancy of the slab and the viscous forces resisting plate motion. A model of the deep-slab stress state involving deviatoric stresses that stem from the volumetric strains of mantle phase changes and a distribution of phase changes governed by kinetics predicts that stresses should be maximized near the kinetic limits of olivine metastability (Kirby et al., 1991). This may help explain this peculiar pattern of deep earthquake moment distribution.
2. Drawing on earlier work, our 1991 Science paper put together a unified hypothesis of deep seismic deformation that evoked the cold thermal structure and resultant reduced reaction rates in coldest slab interiors, leading to a laminated structure of metastable upper mantle minerals in the coldest slab interiors and denser forms near the wanner slab boundaries. This structure of mantle phase changes produces a slab stress state that is dominated by layer- parallel compression in the region of metastability and permits a failure process, which has been termed transformational faulting, to occur in the region of olivine metastability. According to this hypothesis, only those subduction zones that remain cold enough to permit olivine metastability at depths substantially below 350-420 km can produce deep earthquakes. The Indonesia SZ shows an abrupt deepening of earthquake activity from west to east near the Sunda Straight as the slab descent rate and age of the subducting lithosphere also progressively increase to the east. We are using Indonesia as a natural laboratory to see how a systematic change in slab thermal structure can influence SZ seismicity. Preliminary thermal modelling suggests that slab-minimum temperatures at 400 km need to be less than about 500-600 °C in order for significant olivine metastability and deep earthquake activity to occur.
3. Intermediate-depth earthquakes, at depths between about 50 and 280 km are predominately intraplate. Most of the global seismic moment for these events is a depths between 60 and 140 km, bracketing the depths of the postulated roots of arc volcanoes. Most previous work on this earthquake population has emphasized the geodynamic-scale forces: the negative buoyancy of slabs and the viscous and frictional forces resisting slab descent. Pennington (1983) has suggested that some of these events may be produced by stresses that accompany the volume changes associated with the
485

II.3
basalt-> eclogite transformation, a hypothesis that has not gained favor. Brad Hacker has done experiments on one of the key reactions involved in that phase change and has demonstated that it is exceedingly sluggish under dry conditions and occurs at far greater rates in the presence of water. These results, combined with recent work on the genesis of arc volcanoes (reviewed by Simon Peacock, 1991) point to three major consequences of possible large- scale dehydration of subducting oceanic crust and uppermost mantle at depths of about 80-150 km: (A)The overdriven basalt-* eclogite phase change can occur under fluid-present conditions and large deviatoric stresses can be produced from the volume change in the subducting crust. (B) Seismic failure by fracture and frictional sliding is then possible, facilitated by the reduced effective normal stresses that attend the presence of fluid pressure. (C) Migration of aqueous fluids to the hotter mantle asthenospheric wedge above the slab where partial melting can occur due to the downward shift in the solidus temperatures. This model helps explain many of the peculiarities of intermediate-depth earthquakes and their close spatial association of the locus of intermediate-depth earthquakes with the presumed magma sources of arc volcanoes.
Some intermediate-depth earthquakes pose a significant earthquake hazard, with moment magnitudes as high as 8.1. The largest events are often associated with the subduetion of hot-spot seamount chains and aseismic ridges. Examples include the Louisville Ridge in the Tonga SZ, the Kyushu Palau Ridge in the Ryuku SZ, the Magellan seamount chain in the Izu-Bonin- Marianas SZ and the Carneigie Ridge in the South America SZ. Thicker crust in these regions gives the it higher thermal inertia and higher stresses stemming from the crustal transformation strains. Some subducting hot-spot ridges, such as the Cocos and Nasca Ridges in Central and South America, have hitherto had no large intermediate-depth earthquakes in the instrumental period and may, in this context, be considered intermediate-depth seismic gaps.
ReportsKirby, S.H., Effects of slab thermal structure and phase changes on the depths
of subduction-zone earthquakes, Eos, v. 72, p. 198, 1991.Kirby, S.H., W.B. Durham and L.A. Stern, Mantle phase changes and deep-
earthquake faulting in subducting lithsophere, Science, v. 252, pp. 216- 225, 1991.
Additional ReferencesAbe, K, Magnitudes of large shallow earthquakes from 1904 to 1980, Phys. Earth
Planet. Inter., v. 27, pp. 72-92, 1981.
486

II.3
Abe, K., Complements to "Magnitudes of large shallow earthquakes from 1904 to1980", Phys. Earth Planet. Inter., v. 34, pp. 17-23, 1984.
Abe, K. and H. Kanamori, Temporal variation of the activity of intermediateand deep focus earthquakes, J. Geophys. Res., v. 84, pp. 3589, 1979.
Astiz, L., T. Lay and H. Kanamori, Large intermediate-depth earthquakes andthe subduction process, Phys. Earth Planet. Inter., v. 53, pp. 80-166, 1988.
McGarr, A., Seismic moments of earthquakes beneath island arcs, phasechanges and subduction velocities, J. Geophys. Res., v. 82, pp. 256-264, 1977.
Peacock, S., Fluid processes in subduction zones, Science, v. 248, pp. 328-337,1990.
Pennington, W., Role of shallow phase changes in the subduction of oceaniccrust, Science, v. 220, pp. 1045-1047, 1983.
Ringwood, A.E., Phase transformations and mantle dynamics, Earth Planet. Sci.Lett., v. 14, pp. 233-241, 1972.
487

II.3
ROCK MECHANICS
9960-01179
David Lockner Branch of Tectonophysics
U.S. Geological Survey345 Middlefield Road, MS/977Menlo Park, California 94025
(415) 329-4826
Investigations
Laboratory experiments are being carried out to study the physical properties of rocks at elevated confining pressures, pore pressure and temperature. The goal is to obtain data that will help us to determine what causes earthquakes and whether we can predict or control them.
Results
The velocity dependence of rock friction is important in determining the stability of fault slip. We are continuing our studies of the velocity dependence of rock friction under combined conditions of (1) elevated temperature, (2) high fluid pressure and (3) high confining pressure. Recent experiments have shown that the combination of these three variables results in frictional behavior that is significantly different than the effects of any single or pair of these variables. Since all three of these conditions are expected to be present at hypocentral depths, we believe that these results will have important implications for our understanding of earthquake processes. Previous experiments were conducted at a single effective normal stress (300 MPa). We are now varying temperature, fluid pressure and normal stress to determine velocity sensitivity under more appropriate hypocentral conditions.
Maps of recently active breaks within the Hayward fault of central California, which is characterized by fault creep, have been examined and compared to maps of the San Andreas fault, to look for differences in fault geometry that may be related to their sliding behavior. The patterns of recent breaks of the Hayward fault are consistent with those found within the creeping section of the San Andreas, and they appear to have plausible physical explanations in the findings of laboratory experiments. The distinguishing geometric features of the examined locked and creeping faults are: (1) P-type secondary traces predominate over R(Reidel)-type traces in creeping sections, whereas the opposite relation holds for locked sections; and (2) R-type secondary traces make smaller angles to the local fault strike in creeping sections than they do in locked sections. Two different maps of the
488

II.3
Hayward fault gave similar results, supporting the inference that the patterns identified are basic characteristics of the fault rather than artifacts of a particular mapping procedure.
P shears predominate over R shears under laboratory conditions that allow dilation within the fault zone. In our own experiments, P-shear development was favored by the generation of excess pore-fluid pressures. We propose that creep in California faults also is the result of fluid overpressures that are maintained in a low-permeability gouge zone and that significantly lower effective stresses, thus helping to stabilize slip and producing high values of the ratio P/R. Small R-trace angles may also be an indicator of low effective stresses, but the evidence for this is not conclusive because other factors can also affect the size of the angles.
Low strength clay minerals are a common constituent of fault gouges, and are often cited as a possible explanation for the low ambient shear stresses along the San Andreas fault inferred from heat flow constraints and in situ stress measurements. Montmorillonite, the weakest of the clay minerals, undergoes a gradual phase transition to illite with depth. In order to compare the shear stresses supported by these two minerals with those thought to exist along the San Andreas, we have measured the frictional sliding behavior of pure montmorillonite, mixed montmorillonite/illite and pure illite as a function of effective pressure, simulating burial to seismogenic depths. Strength measurements verify that the effective pressure law for friction holds for these minerals under all conditions. That is, the measured stresses were a function of the effective pressure, Pc Pp , independent of the choice of confining and pore pressure. This relation, common for many other rock types, was previously untested for these clays under most conditions. Results show that dry samples were consistently stronger than saturated samples, and that strength increased with increasing illite content. In addition, the coefficient of friction increased as a function of pressure for the montmorillonite gouge, but was independent of pressure for the illite gouge. This behavior may be explained by the presence of loosely-bonded interlayer water in the montmorillonite, which is squeezed out at higher pressures, changing the frictional characteristics of the clay. The non-expanding illite was not affected in this way. For the montmorillonite to illite compositional profile, an average shear stress of 60 MPa was determined for crustal conditions to 15 km, assuming a normal hydrostatic gradient. If montmorillonite remains stable at depth, the resulting average shear stress is reduced to 30 MPa. In either case, these values are above the 10-20 MPa shear stress limit along the San Andreas inferred from heat flow constraints. Strength may be reduced to in situ levels if fluid pressures become greater than hydrostatic within the gouge zone.
Intact samples of granite and sandstone have been deformed to failure at 50 MPa confining pressure. In these experiments, the acoustic emission (AE) rate was used to control deviatoric stress on the sample. As a result, fault growth, which normally would occur unstably in a fraction of a second, was stabilized and extended to a matter of minutes and even hours. In addition, amplitude and arrival times of AE signals were recorded on a network of transducers. Inversion of the arrival time data allowed for the three-dimensional location of AE events during initial loading, fault nucleation and growth stages in each
489

II.3
experiment. Fault nucleation occurred abruptly and after peak strength in all granite experiments, showing no obvious clustering or change in AE patterns prior to nucleation. However, statistical analysis of AE locations and amplitudes showed systematic changes in b-value and geometric parameters (in part related to fractal dimension) between peak stress and nucleation. These changes suggest that microcracking first began to organize in the granite samples near peak stress, a result that is consistent with bifurcation theory. Similar trends were observed in the sandstone experiments, although, in that case, clustering on AE events occurred early in the loading cycle. We interpret this early clustering in the sandstone samples as resulting from pre-existing strength heterogeneities.
The processes of nucleation and growth of faults in intact brittle rocks are examined in light of new faulting experiments with Westerly granite. The experiments include accurate location of acoustic emission events which show that the faults grew and propagated within their own plane, from a nucleation site smaller that 2cm2 , to a roughly planar surface that traverses the entire sample. The growth and propagation were facilitated by intense microcracking within a process zone with dimensions of about 1cm in front of the fault zone.
A new model proposed here assumes that fault nucleation and growth are controlled by the opening of microcracks in a self-organized style. An open crack generates local stress field with regions of high induced tension and compression. Potential cracks within the region of high tension induced by the open crack, would be activated due to the enhancement of the tension normal to them. The stress analysis reveals that faults can nucleate and propagate when the ratio crack spacing/crack length attains a critical value, estimated as 2. As the regions of high tension have restricted orientations, the angle between a fault plane and the axis of maximum compression, /?, is restricted to the range of 20°-30°. This prediction provides a physical basis for the empirical parameter of 'internal friction'. The model explains the decrease of (3 with the decrease of confining pressure and the relations between strength and confinement in brittle rocks.
Reports
Byerlee, J.D., Friction, overpressure and fault normal compression, Geophysical Research Letters, 17, 2109-2112, 1990.
Lockner, D.A., Byerlee, J.D., Kuksenko, V., Ponomarev, A., and Sidorin, A., Observations of quasi-static fault growth from acoustic emissions, Eos, American Geophysical Union Transactions, 71, 1586, 1990.
Lockner, D.A., Hickman, S., Byerlee, J.D., Kuksenko, V., Ponomarev, A., Sidorin, A., and Khakaev, B., Laboratory-determined permeability of cores from the Kola superdeep well, USSR, Geophysical Research Letters, in press, 1990.
Lockner, D.A., Byerlee, J.D., Kuksenko, V., Ponomarev, A., and Sidorin, A., Quasi-static fault growth and shear fracture energy in granite, Nature, 350, 39-42, 1991.
490

II.3
Morrow, C.A., and J.D. Byerlee, A note on the frictional stength of laumontite from Cajon Pass, California, Geophysical Research Letters, 18, 211-214, 1991.
Morrow, C., Radney, B., and Byerlee, J., Frictional strength and the effective pressure law of montmorillonite and illite clays, in Fault Mechanics and Transport Properties of Rocks, Evans, B., and Wong, T.-F., eds., Academic Press, New York, in press, 1991.
Reches, Z., and Lockner, D.A., Self-organized cracking - a mechanism for brittle faulting, Eos, American Geophysical Union Transactions, 71, 1586, 1990.
491

II. 3
Accurate Three-Dimensional Calculations for Advancing Slip Zonesin the Earth's Crust
(Joint funding with NSF Grant EAR-8707392)
J. W. Rudnicki and L. M. KeerDepartment of Civil Engineering
Northwestern UniversityEvanston, II 60208
(708)-491-3411
(For period October 1, 1990 to March 31, 1991)
Objectives
Understanding the mechanism by which slip is transmitted from depth to the surface and along the strike of the fault from freely slipping to locked zones is of great importance for understanding the earthquake process and for possibly anticipating damaging events. A major impediment to more accurate and realistic analyses has been the difficulty of making calculations for three dimensional cracked bodies. We are doing three-dimensional analysis of slip zones (cracks) in an elastic half-space to determine stresses and surface deformations due to the advance of shear faults into locked, or more resistant, portions of the shallow crust. The goal of these studies is to understand three-dimensional geometric effects on the intensity of stressing near the edges of slip zones.
Results
Work during the current period has focussed on the development and implementation of an analytical solution for constant slip in a triangular region in an elastic half-space. The solution is constructed by superposition using Comninou's [1973] solution for an angular dislocation in a half-space. Because triangular elements can be used to model arbitrarily-shaped slip zones, this solution has advantages over solutions for uniform slip in rectangular elements. For a vertical rectangular fault, the solution has been checked against that of Chinnery [1961] by combining two triangular elements to make a rectangle. For dipping faults, the solution has been checked against numerical results for a rectangular fault provided by Simpson [personal communication, 1990].
When uniform slip triangles are combined to approximate a slip zone of uniform stress drop (by solving for the slip in each triangle needed to yield a given value of the stress drop at the centroid of the triangle), the results indicate that they overestimate the free surface displacements by comparison with the more elaborate calculations of Wu et al. [1991]. This occurs because the uniform slip elements do not allow the fault surface relative slip to taper smoothly to zero at the edges of the slip zone, as does the procedure of Wu et al. [1991]. Nevertheless, the discrepancy diminishes with increasing number of elements and calculations using the uniform slip triangles are substantially more efficient.
492

II. 3
Examination of the stress predicted near the edge of a slip zone made up of uniform slip triangles indicates that, as expected, the stress is more singular than the r1/2 behavior near a crack in an elastic body. Unfortunately, we have, as yet, found no reliable method for inferring the stress intensity factors (and energy release rates) from results for the uniform slip triangles.
References
Chinnery, M. A., The deformation of the ground around surface faults, Bull. Seismol. Soc. Am., 51, 355-372, 1961.
Comninou, M. A., Angular dislocation in a half-space, Ph.D. Dissertation, Northwestern University, Evanston, Illinois, 45 pp., 1973.
Publications
Kuo, C., M. Wu, J. W. Rudnicki, and L. M. Keer, Intepretation of coseismic deformation data using three dimensional crack (stress drop) models (Abstract), presented at NSF/USGS Workshop on Crustal Deformation Measurement and Earthquake Mechanics, Morro Bay, California. March 18-22, 1990.
Wu, M., C. Kuo, J. W. Rudnicki, and L. M. Keer, Modeling of coseismic surface deformation using non-kinematic approach (Abstract), Seismol. Res. Let., 61, p. 38, 1990.
Wu, M., J. W. Rudnicki, C. Kuo, and L. M. Keer, Surface deformation and energy release rates for constant stress drop slip zones in an elastic half-space, to appear in J. Geophys. Res., 1991.
493

II.3
Heat Flow and Tectonic Studies
9960-01177
John H. Sass Arthur H. LachenbruchBranch of Tectonophysics Colin F. WilliamsU.S. Geological Survey Branch of Tectonophysics2255 North Gemini Drive U.S. Geological SurveyFlagstaff, AZ 86001 345 Middlefield Road(602) 527-7226 Menlo Park, CA 94025FTS: 765-7226 (415) 329-4879/4881
FTS: 459-4879/4881
Investigations:
The geothermal study of the Santa Maria Basin and environs is nearing completion. The results of this study have been combined with published heat-flow data from the San Joaquin and Ventura Basins in an expanded investigation of hydrologic, sedimentary and tectonic controls on heat flow in Central California Basins.
A preliminary interpretation of apatite fission-track analyses of samples from the Ca- jon Pass research well has been received, and additional samples have been sent to Australia for analysis.
Two manuscripts on heat-flow results from the Cajon Pass research well have been accepted for publication in the Journal of Geophysical Research. The first presents the detailed interpretation of thermal measurements in the well, and the second discusses the implications of the Cajon Pass heat-flow measurements for the strength of the San Andreas fault system.
A pilot study of thermal conductivity anisotropy of core samples from the KTB pilot borehole is continuing.
Precision temperature monitoring in the USL-Pearson well near Parkfield is continu ing. Monitored temperatures remained stable over the past six months.
A manuscript on tectonic implications of eastern Sierra Nevada heat flow was pub lished in Tectonics.
An investigation of the thermal regime of the southern Basin and Range is continuing.
A manuscript on heat flow on the North Slope of Alaska has been prepared for sub mission to the GSA Bulletin and is currently in internal (USGS) review.
A modeling study of coupled heat/fluid flow in the Colville Basin on the North Slope of Alaska is in progress.
A new laptop computer-based portable logging system is nearing completion, and a high temperature and pressure thermal conductivity apparatus is under development.
494
II.3
Results:
Central California Basins. [Williams and Galanis] Preliminary results from geother- mal studies in the Cuyama, onshore Santa Maria, offshore Santa Maria, and western Ven- tura Basins, coupled with published heat-flow data from the San Joaquin and eastern Ventura Basins, reveal highly variable hydrologic, sedimentary, and tectonic controls on measured heat flow.
In the Santa Maria Basin, low sedimentation rates and small refraction corrections (<5%) suggest that measured heat flow (80 ±10 mW/m2 ) is consistent with the neighbor ing Coast Range heat-flow high. Aside from temperature fluctuations resulting from oil and gas production disturbances, the only deviation from this result appears in the Santa Maria Valley, where temperature gradients in shallow Plio-Pleistocene sediments are de pressed to near zero. Simple analytical models suggest that shallow ground water flow, active since the middle Pleistocene, may account for the heat loss. Temperature profiles from the South Cuyama Basin cross at least one active thrust fault, and there are some indications that fluid flowing along the fault(s) may account for local variations in shallow (<500 m) temperatures.
Measured heat flow in the southern San Joaquin and eastern Ventura Basins aver ages 45 to 55 mW/m2 , a result related primarily to rapid sedimentation and lithospheric thickening. Ground water flow may be disturbing near-surface temperatures in Ventura's Fillmore district, but profiles in other areas are essentially conductive, despite the presence of permeable formations and topographic relief. In general, thermal studies in these Cali fornia Basins have yet to provide clear evidence for deep, basin-scale or fault-focused flow systems. However, spatial coverage is limited, and significant mass transport is certainly possible without disturbing the thermal regime beyond measurement uncertainties.
Parkfield Monitor. The Project's Long-Term Temperature Monitor (LTTM) has been operating in the USL-Pearson IB (PRSN) well near Parkfield for approximately 1 */2 years. During the first eight months of operation, the ±0.2 mK (±0.0002°C) resolution capability of the monitor was occasionally negated by the effects of extreme diurnal surface temperature variations and rain-related disturbances to the electronics. The surface elec tronics have been reconfigured, and the adverse effects of surface disturbances eliminated. Monitored temperatures have remained remarkably stable over the past six months. It was designed to test whether strain changes along the San Andreas fault near Parkfield gener ate identifiable thermal-hydrologic signals or measurable strain-heating in the fault zone. These possibilities will be tested by the onset of the long-awaited Parkfield earthquake.
Sierra Nevada. [Saltus and Lachenbruch] Eight new heat flow measurements in the southern Sierra Nevada constrain models of thermal evolution and lithospheric structure. Low reduced heat flows (18 to 21 mW/m2 ) in the southwest Sierra Nevada are consistent with previous results from the northwestern and central Sierra Nevada and extend the known region of linear heat flow-heat production correlation an additional 150 km to the south. Isostatic residual gravity and measured rock densities are also linearly correlated in the central Sierra Nevada, suggesting a general association between the upper crustal distribution of density and heat production. The linear residual gravity-density relation implies that isostatic residual gravity anomalies have upper crustal sources and therefore
495

II.3
is evidence against a flexural model of Cenozoic Sierra Nevada uplift. New reduced heat flows measured in the southeast Sierra Nevada are relatively high (32 to 57 mW/m2 ) and correlate spatially with a region of high seismicity that includes extensional earthquake swarms; this correlation supports the view that Basin and Range extensional tectonics and associated magmatic processes are encroaching on the eastern Sierra Nevada. In the stable southwest Sierra Nevada, as in the central and northwestern Sierra Nevada, the persistence of low reduced heat flow at the surface is consistent with a thermal origin for the Cenozoic uplift of the Sierra Nevada, provided the conductive lithosphere is at least 60 to 90 km thick. Simple order-of-magnitude calculations show that thermal uplift models combining mechanisms such as advective warming and thinning of the mantle lithosphere, advection of basaltic magma and heat into the crust, simple thermal expansion, and eclogite-to-basalt phase conversion can account for the timing and amount of Cenozoic Sierra Nevada uplift. Thermal models do not need the assumptions of unusual lithospheric strength and crustal buoyancy required by mechanical models for Cenozoic uplift driven by a Mesozoic crustal root.
Southern Basin and Range. [Lachenbruch and Sass] More than 200 values of heat flow are now available from the crystalline terranes of the Southern Basin and Range Province (SBR) of Arizona and southern California, and the Paleozoic sedimentary rocks of the southwestern Colorado Plateau (CP). Heat flow ranges from about 5 mW m~2 on the CP near Flagstaff, Arizona, to more than 150 mW m~2 in the crystalline rocks bordering the Salton Trough in SE California. The heat-flow pattern within this region is complex and appears to be controlled by regional physiographic and tectonic features. Unlike in the adjacent Sierra Nevada batholith, no statistically valid relation was found between heat flow and near-surface radiogenic heat production in the SBR, a condition attributable to the complex tectonic history with lateral movement of basement terranes and heat sources in the SBR. Like the high mean heat flow in the northern Basin and Range (92 ±9 mW/m2 ), the high value in the SBR (82 ±3 mW/m2 ) probably results from upward mass motion associated with Late Cenozoic lithosphere extension even though there has been little or no extension in much of the SBR in the last 10 m.y. The thermal anomaly from such regional extension is expected to decay slowly with lithosphere time constant. On a more local scale, Cenozoic extension is believed to have removed 10- 20 km from presently exposed mid-crustal rocks in metamorphic "core complexes." Decay of the associated local thermal anomaly depends on the depth and radioactivity of the isostatically compensating return flow. Observed mean heat flow and heat production in core complexes are statistically indistinguishable from regional means, although core complexes lie in a region surrounded by relatively high heat-flow. Implications of these observations for the origin of core complexes are being investigated with simple models.
North Slope of Alaska. [Deming, Sass, and Lachenbruch] In conjunction with the U.S. Geological Survey's exploration program in the National Petroleum Reserve, Alaska (NPRA), several high-resolution temperature logs were made in each of 21 drillholes be tween 1977 and 1984. These time-series of shallow (average 600 m) temperature pro files were extrapolated to infinite time to yield equilibrium temperature profiles (±0.1°C). Thermal gradients are inversely correlated with elevation, and vary from 22°C/km in the foothills of the Brooks Range to as high as 53°C/km on the coastal plain to the north.
496

II.3
Shallow temperature data were supplemented with 24 equilibrium temperatures (±3-5°C) estimated from series of bottom-hole temperatures (BHTs) measured near the bottom of petroleum exploration wells. A total of 601 thermal conductivity measurements were made on drill cuttings and cores. Near-surface heat flow (±20%) is inversely correlated with el evation and ranges from a low of 27 mW/m2 in the foothills of the Brooks Range in the south, to a high of 90 mW/m2 near the north coast. Subsurface temperatures and thermal gradients estimated from corrected BHTs are similarly much higher on the coastal plain than in the foothills province to the south. Significant east-west variation in heat flow and subsurface temperature is also observed; higher heat flow and temperature coincide with higher basement topography. The observed thermal pattern is consistent with forced convection by a topographically driven groundwater flow system; alternative explanations are unsatisfactory. Average groundwater (Darcy) velocities in the postulated flow system are estimated to be of the order of 0.1 m/yr; minimum estimates of the effective basin- scale permeability are of the order of 10~ 14 m2 . Organic maturation data collected in other studies indicate that these systematic variations in thermal state have persisted for tens of million of years. The groundwater flow system thought to be responsible for these variations has probably existed for the same period of time, and may have provided the driving mechanism for petroleum migration and accumulation at Prudhoe Bay.
Colville Basin, North Slope of Alaska. [Deming and Lachenbruch] A hydroge- ologic model of coupled heat/fluid flow is being used to study regional-scale groundwater flow in the Colville Basin. Several hundred permeability measurements on cores have been compiled, and a large-scale computer model has been designed. Preliminary modeling re sults indicate (surprisingly) that free convection in the basin is nearly ubiquitous, even at permeabilities as low as 0.01 mD. This phenomenon may be important in part in explaining some aspects of heat-flow observations on the North Slope and suggests to us that perme ability on the basin scale (hundreds of km) must be highly anisotropic (> 100:1). Goals of the work in progress include (1) determining if our heat-flow observations can be explained by basin-scale groundwater flow, (2) determining the possible and/or likely importance of free convection in the basin, (3) estimating the basin-scale permeability and comparing it to core measurements, (4) determining the effect of permafrost on the basin-scale flow system, i. e. } what happens to the flow system when the permafrost is removed?
Lab instrumentation. At present, the best source of information on the variation of thermal conductivity in the range 0 to 350° C remains a 50-year old study by Birch and Clark. Those results and a limited number of more recent ones were obtained on dry rocks under substantial axial (but not confining) pressure. An apparatus is being developed that will be capable of measuring conductivity on water-saturated rocks under confining pressures sufficiently high to prevent boiling of pore fluids. The data set so obtained will be compared to measurements of acoustic velocities and mass properties on the same specimens over the same temperature and pressure ranges in an effort to establish a reliable empirical relation between petrophysical properties and thermal conductivity.
Field instrumentation. A new laptop PC-based portable logging system (PLS) is being developed. The new PLS will provide complete hardware and software compatibility with the logging truck system while retaining backpack portability.
497
II. 3
Reports:
Lachenbmch, A. H., and McGarr, A., Stress and heat flow: U.S. Geological Survey Pro fessional Paper 1515, p. 260-277, 1990.
Lachenbmch, A. H., and Sass, J. H., Heat flow from Cajon Pass, fault strength, and tectonic implications: Submitted to Journal of Geophysical Research.
Morgan, P., Sass, J. H., and Jacobson, R., Thermal regime of the Valles Caldera (abstract): Eos, v. 71, no. 43, p. 1684, 1990.
Salt us, R. W., and Lachenbmch, A. H., Thermal evolution of the Sierra Nevada-Tectonic implications of new heat-flow data: Tectonics, v. 10, p. 325-344, 1991.
Sass, J. H., Climate plumbs the depths: Nature, v. 349, p. 458, 1991.
Sass, J. H., Jacobson, R., and Sorey, M. L., Heat flow from DOE's magma-energy research well at Long Valley, California (abstract): Eos, v. 71, no. 43, p. 1684, 1990.
Sass, J. H., Lachenbmch, A. H., Moses, T. H., and Morgan, Paul, Heat flow from a scientific research well at Cajon Pass, California: Submitted to Journal of Geophysical Research.
Williams, C. F., and Galanis, S. P., Jr., Preliminary heat flow results from the Santa Maria Province, California: Implications for the southern extent of the Coast Range heat flow anomaly (abstract): Eos, v. 71, no. 43, p. 1223, 1990.
498

II.3
Micromechanics of Rock FrictionUSGS 14-08-0001-G1668
C. H. Scholz, R. L. Biegel, W. Wang, G. N. Boitnott, N. Yoshioka
Lamont-Doherty Geological Observatory of Columbia University Palisades, NY 10964
We have completed our investigation of initial slip , and two manuscripts reporting our results have been submitted for review. Synopsis of these papers are given at the end of the report. The first paper (Biegel et al.) documented a roughness dependent evolution of friction in the first several hundred microns of displacement. In Paper 2, Boitnott et al. successfully applied an elastic contact model to the initial stages of slip, the shear stress- displacement relation in the earliest stages being constrained by the topographic data. The model indicates that resistance to slip is provided by an asperity scale coefficient of friction of -0.35 or an adhesive strength term of ~5 GPa. Beyond initial slip the surfaces continue to strengthen to friction coefficients of ~0.50 to 0.65. This strengthening is due to slip hardening mechanism of ploughing and asperity interlock. Two projects to determine the nature of these mechanisms are currently in progress.
One project involves measuring the friction of different surfaces of quartzite and granite sliding on surfaces of optically flat sapphire. The greater hardness of the sapphire and its flatness prevent ploughing or asperity interlock from occurring. The resulting friction must arise solely from shearing of contacts. We have successfully conducted friction test on sapphire samples to normal loads of 20 MPa with no damage to the sapphire, demonstrating that the assumptions are correct to these normal loads. Typical friction coefficients are 0.15 to 0.18, independent of roughness. We have now initiated a final series of experiments involving different roughnesses of sapphire and quartzite. The results of these experiments will allow us to determine the ploughing term for the surfaces as well as confirm the asperity strength term from Paper 2. This information can then be used to resolve the strength due to asperity interlock.
The importance of slip hardening mechanisms to rock friction is discussed in Paper 1 where it was shown that slip hardening correlates with normal closure of the surfaces and that closure diminishes to a threshold value with onset of steady state friction (see Figure 1). A new series of experiments have been initiated to explore this friction regime. We have developed a technique to measure the evolution of contact during slip. Brown and Scholz, (1985) and Yoshioka and Scholz, (1989) have already shown than short, rapid, normal and shear pulses (glitches) can be used to test the normal and shear stiffness of the surface during sliding. We have built and tested an electronic control unit that will generate a preprogrammable sequence of normal and shear glitches. The results are demonstrated in Figure 2, a plot of the shear stiffness of the surface as a function of displacement. The figure shows that the shear stiffness increases with increasing displacement from ~2.4 MPa/micron following 60 microns slip to ~5 MPa/micron after 160 microns of slip. We believe that this increasing shear stiffness is due to increasing normal closure resulting from asperity interlock during slip hardening as shown in Figure 1. Once a complete set of values for shear stiffness vs. slip distance are collected, we will invert for the contact properties of the surfaces during various stages of slip hardening.
Naota Yoshioka presented a paper to the Symposium on Earthquake Source Physics in Tokyo (Nov., 1990) on the micromechanics of contacting surfaces. The paper was submitted for publication in a special issue of Tectonophysics (Yoshioka, Boitnott, Biegel, Wang, and Scholz)
W. Wang is now preparing a manuscript on his research results on the wear mechanism (Wang, W. and C. H. Scholz, 1990)
499

II. 3
Synopsis 1: Micromechanics of Friction in Rock: 1. Effects of Surface Roughness on Initial Friction and
Slip Hardening in Westerly Granite R. L. Biegel, W. Wang, C. H. Scholz, G. N. Boitnott, and N. Yoshioka
Friction was measured for sliding surfaces of Westerly granite sheared in a rotary apparatus at normal stresses up to 20 MPa. A profilometer measured the roughness before and after each experiment, and these data were used to parameterize surface roughness. Axial displacement transducers measured the normal closure. Total accumulated slip for most experiments was less than 200 microns, but several were extended to a few cms. Macroscopic frictional properties evolved toward steady state through two distinct regimes, denoted initial slip and slip hardening. A finite shear compliance was observed the instant shear loading began and the shear stress increased nonlinearly with displacement. Initial shear stiffness was roughness dependent. For all samples, during initial slip, smoother samples supported equal or higher shear stresses than rough samples at any given displacement.
Slip hardening began once the surfaces reached a fully sliding state marked by a yield point in the friction-displacement data. Appearance of the yield point was roughness and normal load dependent; samples with rougher surfaces and/or higher normal loads required longer displacements to reach yield. In post-yield, the shear strength of the surfaces continued to increase, though at a reduced rate. Slip hardening was observed to be roughness and normal load dependent. Rougher surfaces exhibited higher rates of slip hardening than smooth, and over much greater slip distances. Normal closure was most rapid at the start of sliding, decreasing with increasing displacement. We observed a systematic relation between the rate of closure and slip hardening; rougher surfaces exhibit higher rates of slip-related closure. This suggests that slip hardening is due to increasing asperity interlock resulting from slip-related closure. The greater slip hardening for the rougher surfaces results in higher friction of these surfaces than the smoother when quasi- steady state friction is reached. The latter occurs at about 300 micron of slip, when both the rate of closure abruptly decreases to a residual rate due to wear. This coincided with the rate of normal closure reaching a minimum. Beyond 300 microns, or so, slip hardening and closure ceased, characterizing a third stage in which friction is nearly steady state.
Synopsis 2: Micromechanics of Rock Friction: 2. Quantitative Modeling of Initial Friction with Contact Theory
G. N. BornsroTT. R. L. BIEGEL, C. H. SCHOLZ, N. YOSHIOKA. AND W. WANG
A constitutive model is developed which predicts the mechanical properties of two rough surfaces in contact under shear with constant normal load during the early stages of rrictional sliding. These fundamental solutions include the development or slip at the contacts, a phenomenon which begins immediately upon application of the snear load. Upon initial application of the normal load, the model predicts that the joint con sists of a finite number of contacts under a wide variety of local normal loads. As shearing develops, more and more contacts will begin to fully slide, with the contacts under low local normal load sliding first. This development of sliding is the cause of the non-linear force-displacement relation for deformation of the joint in shear. Two asperity scale strength laws are examined.
The model is tested with experiments on lapped surfaces of Westerly Granite with a variety of surface roughnesses and under a wide range of normal loads (10 to 35 MPa). Geometric model parameters are constrained by direct measurement of surface profiles. For both strength laws, the model quantitatively predicts the shear compliance and development of slip for the first few microns or shear displacement, successfully describing the effect of surface roughness and normal load. We find that for the sim ple friction strength law, n-« lies between 0.3 and 0.36, being a constant independent of normal load and surface roughness. For the simple adhesion strength law, L is con strained to be between 3 and / GPa. This initial slip model helps explain the nrst yield point in the friction curve which may correspond to the gradual transition from the elastic deformation and partial slip of asperity contacts to a condition of fully sliding - AA contacts. When a large population of contacts are fully sliding, the model under- ** estimates the frictional strength, indicating that displacement strengthening mechanisms are important.

II. 3
References
Biegel, R. L., W. Wang, C. H. Scholz, G. N. Boitnott, and N. Yoshioka,Micromechanics of friction in rock: 1. Effects of surface roughness on initialfriction and slip hardening in Westerly granite, submitted, /. Geophys. Res.
Boitnott, G. N., R. L. Biegel, C. H. Scholz, W. Wang, and N. Yoshioka,Micromechanics of friction in rock: 2. Quantitative modeling of initial friction withcontact theory, submitted, /. Geophys. Res.
Brown, S. and C. H. Scholz, Closure of random elastic surfaces in contact, /. Geophys.Res., 90, 5531-5545, 1985.
Wang, W. and C. H. Scholz, Wear processes during frictional sliding of rock: Atheoretical and experimental study, Trans. Am. Geophys. Union, 71, 630, 1990.
Yoshioka, N., and C. H. Scholz, Elastic properties of contacting surfaces under normaland shear loads, /. Geophys. Res., 97, 17681-17700, 1989.
Yoshioka, N., and C. H. Scholz, Micromechanics of the behavior of contacting surfaces:A new new approach to rock friction, submitted, Tectonophysics, Special Issue:Earthquake Source Physics and Earthquake Precursors.
10 MPa LONG DISPLACEMENT
M10-L1
Oe
0.6T
0.5-
0.4-
W O
0.0- T
100 200 300 400 500 600 700DISPLACEMENT, MICRONS
800 1000
Figure 1. Friction-displacement diagram for Westerly granite at 10 MPa, showing evolution to steady-state friction. The M10 denotes experiments with rough surfaces (#60 grit), the S10 denote smooth surface (#120). The normal closure data for two of the experiments are shown by the lower plots and signified by C*. The slip-related closure is interpreted as due to increasing asperity interlock and associated oblique asperity contact as discussed in Paper 1. Note the rollover in the normal closure curve at the point where slip hardening ends, ~80 microns for the smooth and ~250 microns for the rough. Slip hardening and closure are greater and persist to longer displacements for rougher surfaces because they can interlock more deeply. The closure which continues during steady state friction is due to wear.
501

II.3
5.2-
4.8-
73
CJ 0)
JC
4.0-
3.6-
3.2-
2.4
/
60 80 100 120 140
Disp (micron)
,
160
i180
Figure 2. Plot showing evolution of shear stiffness of contacting surfaces with displacement Increasing shear stiffness of contacting surfaces is due to increase in asperity interlock with displacement. Greater interlock also results in normal closure as shown in Figure 1, above. Data was obtained using newly built preprogrammable "glitch" generator to impose short, rapid reverse displacements to the overall forward slip. This allows the elastic contact properties of the surface to be sampled during the course of the experiment. The glitch generator can also produce a series of 4 different pulses in a cycle (not shown here), allowing full sampling of the surface properties.
502

II.3
Systems Analysis of Geologic Rate Processes:
SPACE-TIME MODELS, COUPLED OSCILLATORS, AND GENETIC CODES: CALIFORNIA EARTHQUAKE RECURRENCE PATTERNS
9980-02798
Herbert R. Shaw and Anne E. GartnerBranch of Igneous and Geothermal Processes, U. S. Geological Survey
MS-910, 345 Middlefield Road, Menlo Park, CA 94025(415) 329-5245, 5209
Objective: The objective for this report period extends the ideas outlined in three preceding reports; the strategy is elaborated more fully in the Report of 4/1/89-9/30/89 (NEHRP, Summaries, XXIX, p. 378-384).
Results: Progress continues to be hampered by the absence of Anne Gartner on Active Duty in the Navy and by the loss of crucial programming support from Pat Doherty (ISD) to other Geologic Division projects. Steps are being taken to see if we can renew his affiliation with this project, but until that happens we have gone about as far as we can with manual data manipulations and graphics. However, there is still much to be described about what we have learned to date from these limited calculations and displays. If for some reason it is impossible to get the needed programs written for additional calculations and computer graphics, Shaw will begin to write a summary report in which he will use Adobe Illustrator Version 3 to graphically illustrate those patterns discovered to date. The present report gives an example of such an Adobe plot (Fig. 1), in this case illustrating some of the possible regimes of chaotic bistable intermittency outlined in the report of 4-1-90 to 9-30-90 and discussed below.
The background of experience in nonlinear dynamics gained in this Project is contained in publications cited in previous reports and in subsequent ones by Shaw (1991), Chouet and Shaw (1991), and Shaw and Chouet (1991). The Short Course Chapter by Shaw (1991) contains descriptive material illustrating many types of computer experiments, both digital and analog, as well as physical experiments in mechanics and fluid dynamics relevant to concepts of multiple coupled nonlinear oscillators. This is the context of the latest Semiannual Technical Summary, which we add to below. Chouet and Shaw (1991) documents evidence for a low-dimensional attractor in the oscillatory nonlinear dynamics of near-surface tremor on the East Rift of Kilauea, while Shaw and Chouet (1991) discusses the general spatial fractal hierarchies of tremor in the magma transport path from the mantle to the surface in terms of extensional fracture percolation and spatiotemporal self-organization. In the latter context, the role of coupled tectonic relaxation oscillations is central and forms a natural connection between the nonlinear dynamics of magma-tectonic earthquakes and tectonic earthquakes in general. In tectonic earthquakes the analogous transport involves 'diffusive 1 percolation of volumetric strain rates, fracture fields, and earthquake moments. In some instances, if not generally, this tectonic percolation field is directly coupled with the magmatic flux at the base of the crust. Unfortunately, the existence of such interactions is demonstrable only in the vicinities of local maxima of the magma flux converging toward cratonic volcanic foci (volcanic 'attractors1 in the
503

II.3
general sense) such as those associated with the Mono Craters - Long Valley - Eastern Sierra Nevada - Owens Valley - White Mountains - Inyo - Mojave plutonic- volcanic Provinces. Our working hypothesis for tectonic analogs of the Hawaiian "tremor model of magma transport" (TMMT) is that there is an analogous self- organized system of tectonic relaxation oscillations with spectra of relaxation times that also scale in a universal manner, though not necessarily with the same scaling exponents as the tremor case. The general idea of this coupling was introduced by Shaw (1980) but so far has not been tested quantitatively using the coseismic short- period earthquakes in Hawaii for direct comparison with the TMMT.
An implication of our working hypothesis is that we should see in the spatio- temporal spectra of tectonic earthquakes evidence of multistability and fractal and/or multifractal intermittency, as mentioned in the last report. Figure 1 is a composite plot of events with M > 4.9 in the three broadly defined 'apical' regions of California and adjacent portions of Nevada, Baja California, and the Pacific continental shelf outlined in previous reports. Plotted in this way, the earthquakes of these three regions can be viewed as a system of coupled oscillators in a generalized attractor field of chaotic Instability, or alternatively as a system of three interacting bistable oscillators. The latter description appears to hold for this magnitude range over significant intervals of the record, as shown by the fact that oscillations between A&B, A&C, and B&C are more prevalent than oscillations within single regions or among all three regions (the dashed lines bounding each region represent the approximate range of magnitudes 4.9 < M < 8.0, where breaks-in-slope of curves within each interval represent the magnitudes of individual events).
Many examples of time series of analogous chaotic bistability are figured in Shaw (1991; see especially Figures 8.16, 8.18, and 8.38). One important mechanism of switching can be identified with the possible existence of 'interior chaotic crises' or 'chaotic bursts' relative to unstable periodic attractor states embedded in the general attractor field of each region (the 'core attractor' of that region). In the tectonic context, these unstable periodic attractors might be represented by period-doubling or mode- locked nonlinear resonances hints of which we think we see in the pseudobinary records, as mentioned in the last report. An intriguing implication of this interpretation is that the times between bursts would have power-law scaling relative to the proximity of a lower forcing frequency to a critical event frequency, threshold stress state, and characteristic time for tectonic stress relaxation. Such scaling is categorically similar to the universal power-law scaling of durations and onset time intervals of tremor events described in Shaw and Chouet (1991). Another implication of this model is that, for a constant forcing frequency, the distribution of recurrence times for a characteristic rupture length and average event frequency would conform to a lognormal distribution analogous to that of Nishenko and Buland (1987), thus bridging the existing hiatus between statistical analyses of observations and statistical analyses of nonlinearly periodic and chaotic dynamical models. That is, according to Nishenko and Buland (1987) the recurrence times of characteristic earthquakes on specific faults, when normalized relative to the average recurrence time for each fault, appear to have an invariant lognormal distribution that holds over a very wide range of earthquake magnitudes, and presumably over the corresponding range of characteristic fault lengths (cf., Shaw and Gartner, 1986). Each of these distributions would be analogous to a particular distribution of 'bursting times' in the above nonlinear model at a constant forcing frequency just below the corresponding critical frequency that is characteristic of the core attractor.
504

II.3
This dynamical interpretation is based on studies of several different types of coupled oscillation in the laboratory (e.g., Ditto, et al., 1989). Therefore it would formally refer to the behavior of one of our regions subjected to a known variation of external forcing frequencies. In actuality, it is likely that all three regions coexist in a self-organized critical state of interaction, mutually and with other neighboring regions. In that case, the above patterns would imply that there is a critical state of multistability in which each of the regions operates in the neighborhood of generalized nonlinear resonance with all other regions. This resonance state, then, would be associated with an unstable periodic attractor characteristic of each region (its 'core attractor1 state). Such a model would appear to further imply that intervals of time-predictable and/or magnitude-predictable behavior are likely to refer only to special neighborhoods of these attractors, and that the long-term intermittency would constitute a mixture of both of these limiting regimes as well as nonlinearly periodic regimes. This appears to support other studies by our project in which we have examined long records of several types of time series said to conform to one or the other type of predictability, finding that both end-members as well as other intervals of nonlinear intermittency appear to exist over different temporal and spatial scales of observation. Mixed characteristics of these types would appear to be typical of intermittent chaotic time series. It should also be noted that an interval of nonlinear periodicity generally will differ fundamentally in pattern from that of an interval of harmonic periodicity. The latter, sometimes invoked to describe special subsets of earthquake recurrence patterns, therefore is likely to be a special case (see Shaw, 1991, Fig. 8.32, and references cited there).
In Figure 1 there are a few intervals of rapid switching between all three regions. Although they are relatively infrequent, they may be significant as harbingers of more general interactions between the three apical regions, with or without the involvement of interior regions. These occurrences are seen in expanded plots but are obscured in Figure 1, which was constructed from the expanded plots and then 'compressed' in time to highlight the dominantly bistable intervals. This compression also slightly distorts the time axis so that it is difficult to identify individual event times precisely. An example of a 'triple-switch' that is not perceptible in Figure 1 but represents a time of large seismic energy release in one region is a sequence that occurred in 1954-1955, when several large events in region B were bracketed between excursions to both regions A and C (the events in B correspond to the western Nevada 'swarm 1 culminating in late 1954). This time interval also represents the peak of 5-year earthquake counts in the total catalog for M > 4.9 (Shaw, 1987, Fig. 18 A). Although Figure 1 does not show this as a conspicuous episode, it does show that the prior 30 years was characterized by a high frequency of switching between pairs of all three bistable regions compared to the preceding and following 30-year intervals. We also note that the 1952 Kern County earthquake occurred near this time and was the largest event interior to the apical regions since the 1906 San Francisco earthquake. Examination of analogous singularities among the ten pseudobinary sequences involving these three apical regions and interior regions D (LA vicinity) and E (SF vicinity) will be the subject of future reports.
505

II.3
References:
Ditto, W. L, S. Rauseo, R. Cawley, C. Grebogi, G.-H. Hsu, E. Kostelich, E. Ott, H. T. Savage, R. Segnan, M. L. Spano, and J. A. Yorke, Experimental observation of crisis-induced intermittency and its critical exponent, Phys. Rev. Letters, 63, p. 923-926, 1989.
Nishenko, S. P. and R. Buland, A generic recurrence interval distribution for earthquake forecasting, Bull. Seismol. Soc. Am., 77, p. 1382-1399, 1987.
Shaw, H. R., The fracture mechanisms of magma transport from the mantle to the surface, in R. B. Margraves, ed., Physics of Magmatic Processes, p. 201- 264, Princeton NJ, Princeton Univ. Press, 1980.
Shaw, H. R., A linguistic model of earthquake frequencies applied to the seismic history of California, U.S.G.S., Open-file Report 87-296, 1987.
Shaw, H. R., Magmatic phenomenology as nonlinear dynamics: Anthology of some relevant experiments and portraits, Chapter 8 in G. V. Middleton, ed., Geological Association of Canada Short Course On Nonlinear Dynamics, p. 8.1-8.53, Hamilton, Ontario, Canada, May 24-26, 1991.
Shaw, H. R. and A. E. Gartner, On the graphical interpretation of paleoseismic data, U.S.G.S., Open-file Report 86-394, 1986.
Chouet, B. and H. R. Shaw, Fractal properties of tremor and gas-piston events observed at Kilauea Volcano, Hawaii, J. Geophys. Res., in press, 1991.
Shaw, H. R. and B. Chouet, Fractal hierarchies of magma transport in Hawaii and critical self-organization of tremor, J. Geophys. Res., in press, 1991.
(Figure 1, next page)
506

1B
B
18501900
1950 Y
EAR
2000
Figure 1. Intermittency of earthquakes M
> 4.9 among three characteristic regions
of California and vicinity. T
hese are the NW
(A), N
E(B
), andSE
(C)
apical regions of Fig. 1 in NE
HR
P Sum. Tech. R
epts., XX
IX, p. 384,1989.
Variations w
ithin regions represent magnitudes betw
een 5 and 8 (dashed). The oscillatory behavior is typically bistable betw
een pairs of these regions.
II.3
FAULT PATTERNS AND STRAIN BUDGETS
9960-02178
Robert W. Simpson Branch of Tectonophysics
U.S. Geological Survey345 Middlefield Road, MS/977Menlo Park, California 94025
(415) 329-4865
Investigations
Three-dimensional dislocation models were used to investigate the relationship between changes in static stress on major Bay Area faults after the 1989 Loma Prieta earthquake and changes in rates of seismicity. Models were also constructed to simulate patterns of Bay Area seismicity over 50,000 years on patches resembling the segments defined by the Working Group on California earthquake probabilities. The rate investigations were carried out in collaboration with Paul Reasenberg and the simulations in collaboration with Jim Dieterich, Allin Cornell, Steve Winterstein and S.-C. Wu.
Results
Changes in static stresses produced by the Loma Prieta earthquake suggest that some faults in the Bay Area, such as the Hayward fault, were slightly relaxed relative to their pre-Loma Prieta stress state, whereas others, such as the San Andreas north and south of the Loma Prieta rupture, were more highly stressed. Comparing the fault segments for which stress loading decreased or increased with a map prepared by Paul Reasenberg showing seismicity rates before and after Loma Prieta yielded fair agreement over much of the Bay Area. The Hayward fault and the Mt. Lewis trend showed decreases in seismicity in agreement with the modelled stress changes. The San Andreas on the Peninsula and a 5 km region around it showed increases in seismicity, again in agreement with the model. Segments along the San Gregario fault showed both consistencies and inconsistencies with the modelled stress changes so, as always, the world is not simple. Overall the agreements are encouraging, and, in fact, quite surprising given the size of the stress changes involved (1 bar or less).
A simulation of Bay Area seismicity over a period of 50,000 years was made using seven rectangular dislocations in an elastic halfspace to represent the seven fault segments in the Bay Area discussed by the Working Group report (Probabilities of Large Earthquakes in the San Francisco Bay Region, California - U.S.G.S. Circular 1053, 1990). The seven dislocations were assigned breaking strengths that were consistent with recurrence times assumed in the working group report. They were loaded by large dislocations at depth under the surface fault traces. These large dislocations were forced to slip at geologically
508

II.3
resonable rates. The faults were assumed to have zero friction for this first simulation. Results obtained to date have shown increases in the coefficient of variation of small segment recurrence times as a result of stress loading from the failures of larger segments. Also noted was a tendency for the four segments on the Peninsula side of the Bay to break in phase and for the three on the east side of the Bay to: also break in phase. Segments on opposite sides of the Bay tended to fail out of phase. This was because failure on one side of the Bay produced left-lateral shear stresses on the other side - thereby delaying the onset of the next earthquake. Future simulations will be designed to see if changes in normal stresses and non-zero friction values can produce pairing in time of moderate size earthquakes on opposite sides of the Bay as was observed on several occasions in the 180D's.
509

II.3
MECHANICS OF LITHOSPHERE PLATES
9960-03419
William D. Stuart Branch of Tectonophysics
U.S. Geological SurveyPasadena, California 91106
818 405-7816FTS 961-7816
Investigations
Pacific-North America Plate Interaction
Current work is an attempt to derive from mechanical principles the locations, slip rates, and lifetimes of major plate boundary faults in southern and central California since late Oligocene time. A special case is the present configuration. The data most useful for testing the models for earlier times are measured offsets, rotations, and uplifts of geologic units and crustal blocks.
Interaction of Plates on a Sphere
The goal here is to construct a model using the theory of spherical elastic shells to try to simulate the motions of tectonic plates in the Pacific basin since late Mesozoic time (e.g. Engebretson et al., GSA Spec. Paper 206, 1985). The first stage of the study is to understand the smaller scale problem of interaction of the present Juan de Fuca, Pacific, and North America plates. In this case two-dimensional elastic plate theory, coupled with appropriate constitutive laws at plate margins and bottoms, seems to be an adequate approximation.
Results
Pacific-North America Plate Interaction
In a plane stress model starting with only the San Andreas fault, it is possible to derive approximately the location, slip rate, and length of the Garlock fault. The computed stress field in the area corresponding to the Owens Valley to Death Valley region is extensional to the west. It appears that other major faults like the oblique thrusts bounding and within the Transverse Ranges, can be derived as well, after taking account of the subducting upper mantle slab reported by Humphreys and others.
Interaction of Plates on a Sphere
As previously reported, a procedure has been developed to compute the stress and velocity fields for the Juan de Fuca plate as it interacts with the Gorda, Pacific, and
510

II.3
North America plates. The procedure makes the plane stress approximation and uses edge dislocations to represent strike slip and opening mode boundaries. Subduction is represented by a new approximation involving distributed body forces that maps three- dimensional deformation into two dimensions.
Reports
Stuart, W. D., Buffer faults and seismic quiescence at Parkfield, EOS, 71, 1645, 1990 (abstr.).
Tullis, T. E., W. D. Stuart, and R. W. Simpson, Instability model for Parkfield earthquakes, including the effect of New Indria, Coalinga and Kettleman Hills events, EOS, 71, 1632, 1990 (abstr.).
Stuart, W. D., Seismic quiescence at Parkfield due to detachment faulting, Nature, 349, 58-61, 1991.
Banks, P. O., W. D. Stuart, and S. -W. Liu, Piezomagnetic fields of screw dislocation models, Jour. Geophys. Res., accepted.
511

II. 3
STUDY OF THE CORRELATION BETWEEN WATER LEVEL FLUCTUATION AND RESERVOIR INDUCED SEISMICITY - PHASE I
14-08-0001-G-1713
Pradeep Taiwan!Department of Geological Sciences University of South Carolina
Columbia, SC 29208 (803) 777-6449
Objective: To study the role of lake level fluctuations on the mechanism of reservoir induced seismicity (RIS) by monitoring of groundwater and seismicity at the Bad Creek pumped storage facility in northwestern South Carolina.
Investigations
Impoundment of the reservoir started at 12:58PM on January 6, 1991. Seismicity was monitored on 3 component portable digital stations and on permanent stations (Figure 1). Water levels were monitored in three wells, #1-3 (Figure 2).
Results
The preliminary results of groundwater and seismic monitoring are summarized below.
a. Groundwater Monitoring: Wells #1 and 2 lie within the reser voir whereas well #3 lies outside it. Well #1 (top of ground elevation 2212 ft) encountered shear zone F between depths of 51 and 61 ft. The shallowly dipping shear zone outcrops about 100 ft to the west. Well #2 (top of ground elevation 2295.7 ft) intersected shear zone E at depths of 90 to 101 ft. Well #3 located about 1,000 ft outside the reservoir encountered shear zone C at a depth of over 290 ft.
Filling of the reservoir was done in stages (Figure 3). Water level was held at different levels and water levels in various wiers and shallow observation wells were monitored to see if there was any leakage. Leakage occurred near the west dam when the pond level reached an elevation of 2305 ft. After that the lake level was quickly lowered. The pore pressure (expressed as head of water) in wells #1 and 2 mimics the lake level. However, water level in well #3 (note different scale on the left) responded to the filling with a large time delay. The water level increase in well #3 did not respond to periods of no increase in the reservoir, it kept on increasing. However, when water level in the reservoir was lowered, there was an almost immediate response in well #3 (Figure 3). The data are being analyzed to obtain hydrological properties of the shear zones.
512

II. 3
b. Seismological Investigations: In addition to the 3 permanent stations surrounding Lake Jocassee and Bad Creek Reservoir, additional portable stations were deployed at sites surrounding the Bad Creek site (Figure 1). We deployed 3 component L-22, 2HZ PASSCAL data loggers at these locations. These instruments were obtained on a six month loan from IRIS. Accurate timing was provided by Omega clocks. We continued to use permanent station BC1 to count events. A small increase in seismicity was observed following the start of impoundment (Figure 4). An example of a small event on March 21, 1991 recorded at station GAT is shown in Figure 5. These data are now being analyzed.
Reports
Talwani, P, Salvador, M., Randall, G. and Owens, T.: Preliminary results of digital recording during impoundment of Bad Creek Reservoir, in northwestern South Carolina. Presented at annual meeting of IRIS, in Hilton Head, South Carolina, March 1991.
Talwani, P., Salvador M., Randall, G. and Widdowson, M.: Induced Seismicity studies at Bad Creek Project, South Carolina, Phase 2 - the impoundment stage: To be presented at the Spring AGU Meeting in Baltimore, May 1991.
Rajendran, K., Talwani, P., and Acree, S.: Relative roles of load and pore pressure in triggering earthquakes at Monticello Reservoir, South Carolina. Manuscript submitted to Bulletin of Seismological Society of America.
513

II. 3
PermanentSeismic Station
PortableSeismic Station
Quarry
SGC
1 km
WFTBC1
DHS
SMT
Fig 1. Shows location of sites occupied by seismographs and*^ __ ___ __ _ ^ m^ m ^^ _ ^^ fquarries in the viclfiity of Bad Creek and Lake
514

II.3
SHEAR ZONE F
SHEAR ZONES E & D
UPPER RESERVOIR ELEV. 2310
1800
Fig 2. Location of shear zones In Bad Creek area. The lake outfne shows the extent of fill pond (2310 ft) and stapled pattern shows the maximum drawdown (2150 ft). The numbers show the location of the observation wete.
515

in
2135
2130
2125
g 2120
j§ 2115£g 2110
2105
2100
2095
2090
20B5
BAD CREEK POND AND WELL ELEVATIONST I T T T I I
BADCREEK POND
OW3
I
I
CM CM
into*r4fcZZ CMS
CM
0 200 400I I i i i I i i I i I i i i i i i I I i I i i i i I i i i i m
600 800 1000 1200 1400 1600 180CT TINE (hrs)
DATE 01-04-91 TO 03-15-91Fig 3. Comparison of water level hi wete * 1.2,3 & the Bad Creek Reservoir.
Impoundment began at 12.58PM on January 6,1991.
H H
U)

II.3
III HIcc o
5 -
CO HI 4 X
3 0JE 3CC
uII0 2-
ccu0i 15 'z
0
PCC
CO
OS
jLL
vL rw
B n1 H... .1 I .
320 335 350 365
NOVEMBER' DECEMBER 1 JAI
IBIB15 30
NUARY ' FEE
45 60 75 90
JRUARY ' MARCH APRIL
Fig 4. Number of earthquakes with S-Pcl.0 sec at station BC,ck>se to Bad Creek reservoir during November 16,1990-Aprfl 13, 1991.
517

0.005
0.000
-0.005
-0.010-
5-
0-51 JO
_ A -5
N
EMMMM
20 40
»»«** *
60 120
MAR 21 (080), 1991 -U
1 ' 1
MAR 21 (080), 1991
12-
1 ' 1 '
MAR 21 (080), 1991 17:14:52.775
i 12140
Fig 5A. Threecomponent i
80 100 SECONDS
ng at GAT of a smal event on March 21,1991.
160 180 H H

Ul M VO
2-2
4 2 0-
ro 0
O
0.005-
0.000--0.005-
-0.010 =
0 oO -0
° -4
X
0-
-6-
b 1 \
38 40 42 46
J991
gat*<**W^^
I), 1991 -
44
SECONDS Fig 5B. Same event on expanded time scale at different stations.
48 50H H
U>
III.l
Regional and National Seismic Hazard and Risk Assessment
9950-01207
S.T. Algermissen Branch of Geologic Risk Assessment
U.S. Geological SurveyDenver Federal Center, MS 966
Denver, CO 80225(303) 236-1610
Investigations
1. Improved measures of ground motion over acceleration and velocity are being investigated for mapping at a national scale.
2. A number of issues in modeling probabilistic seismic ground-motion in the easternUnited States are under investigation to improve such ground-motion estimates in thisregion for the next generation of seismic hazard maps:A. The effect of modeling earthquake sources as points vs. finite-length ruptures.B. The effect of various alternative source depths over a range of 3 to 10 km.C. The effect of various maximum magnitude assignments.D. The characterization of a best-estimate ground-motion value using mean, trimmedmean, and median values.
3. Investigation of relationships between magnitude scales used in attenuation functions in the eastern U.S. and magnitude scales provided in earthquake catalogs of the region. Conversions between the various magnitude scales can significantly affect seismic rate estimates and estimates of ground-motion hazard in the region.
4. A complete probabilistic ground-motion hazard mapping system is under development for use with a Macintosh n personal computer system.
5. A presentation on new efforts in national seismic hazard mapping was given at the Fall AGU meeting, San Francisco. Other presentations on various aspects of seismic hazard and risk were given by project staff to the Central United Earthquake Consortium, the Building Seismic Safety Council, the State of California and the University of Puerto Rico. Three lectures were presented at the international training course "Understanding Earthquakes and Mitigating Their Effects" sponsored by the Office of Earthquakes Volcanoes and Engineering, Branch of Global Seismology.
Results
1. Project staff have been cooperating with the Building Seismic Safety Council, the National Center for Earthquake Engineering Research, and the Structural Engineers Association of California on identifying improved measures of ground motion for use in structural design. In part, as a result of the interaction, a new generation of probabilistic ground-motion hazard maps which allow development of uniform hazard spectra has been prepared by the project for nationwide use in the "NEHRP Recommended Provisions for the Development of Seismic Regulations for New
520

III.l
Buildings" published by the Federal Emergency Management Agnecy and developed by the Building Seismic Safety Council (BSSC). A strategy for development of the maps evolved in a cooperative effort between the USGS and the committee on Seismic Hazard Maps of the BSSC. The new maps are for spectral response acceleration instead of the now traditional peak effective ground acceleration and velocity. The new maps present 5 percent damped uniform hazard spectra (equal probability response spectra) for a reference site condition (soil profile S2) with a 90 percent nonexceedance probability for exposure times of 50 and 250 years (return periods of 474 and 2372 years, respectively). The uniform hazard spectra are useful for two-stage seismic code provisions that provide elastic design criteria to ensure building serviceability and inelastic design criteria to guard against collapse. Preliminary ground-motion results indicate that the entire response spectra can be adequately modeled using spectral values at 0.3 and 1.0 second. The maps and the design procedures are currently out for ballot by the BSSC. A paper describing the maps and the design method has been prepared for the Fourth International Conference on Seismic Zonation.
2.A. Investigations of earthquake rupture models in the eastern United States considered: 1) short, medium and long (San Andreas-like) rupture length vs. magnitude models, 2) two random-vibrations attenuation models for peak acceleration and spectral velocity, and 3) two very different sites, one within a region having a low rate of historical seismicity and a second site near the New Madrid Seismic Zone. Results suggest that point-source models are adequate up to magnitude 7.0 Ms for diffuse and low-seismicity sources which produce low to medium probabilistic ground motions (less than about 0.3 g, peak horizontal accelerations) at the desired return periods. However, for sources having high activity rates with maximum magnitudes above 6.5 Ms, it is necessary to model the source with finite ruptures, particularly for sites closer to the source than 60 km and for return periods producing ground motions larger than about 0.3 g peak horizontal acceleration.
B. The effect of changing source-depth for strong ground-motion between 3 and 10 km is often as great as changing the maximum magnitude by 0.6 magnitude units. When compared to the range of hazard estimates resulting from alternative source zone configurations, uncertainty in source-depth of strong ground-motion is a minor source of uncertainty.
C. For distributions of maximum magnitude having center magnitudes of 5.5 to 7.3 Ms and for probabilistic ground motions having return periods of 10^ years or less, the effect of a choice of maximum magnitude over a range of 0.6 magnitude units is small compared to the range of hazard estimates resulting from alternative source zone definitions and seismicity parameters
D. Although a mean of alternative hazard estimates is in keeping with the concept of an "expected number** under uncertainty, it is highly sensitive to extreme estimates and the presence of methodological bias in minority estimates. The median estimate, on the other hand, is both resistant to extreme estimates as well as less sensitive to methodological differences resulting in a more stable hazard estimate. Trimmed means may be preferred to medians where there are more than just a few alternative estimates that need to be combined.
3. Many earlier recorded earthquakes in the eastern United States have only epicentral intensity (!Q) listed to indicate their size and, when various size measures are reported for different earthquakes, one must first convert these to a single magnitude scale in order to estimate rates, Gutenber-Richter b-values, and maximum magnitudes. The magnitude scale selected must be the same scale that is used in the attenuation function for ground-motion hazard estimation (typically mLg, or M in the Eastern U.S. and ML and MS in the Western U.S.). It might be expected that the probabilistic ground motion
521

III.l
hazard estimates would not depend on the specific magnitude scale that was used in the calculations. We have found, however, that when historic earthquakes are converted to moment magnitude M and seismicity rates calculated, the Atkinson-Boore (1990) attenuation for moment magnitude results in considerably higher probabilistic ground motions at sites in areas of low seismicity than when m^ values for the earthquakes are calculated, seismicity rates calculated and ground motions estimated using the Atkinson-Boore (1990) attenuation for mLg (assuming /W£=/wLg)- We are currently investigating the numerous relationships between magnitude scales that have been used in attenuation functions (e.g., Atkinson and Boore's conversion from M to mLg) and in earthquake catalogs (e.g., various conversions of the form mb=a+blo for the older earthquakes) with an aim to resolve questions related to ground-motion and earthquake- rate estimation that result from the various treatments of magnitudes.
4. The USGS computer program used in the estimation of probabilistic ground-motion hazard, SEISRISK IE, has previouly been adapted for use on IBM or IBM-compatible personal computers (Arnold, 1990). We have recently adapted SEISRISK IE to a Macintosh n computer system and have further developed utility programs for seismicity catalog manipulation, seismicity parameter estimation and hazard map plotting in order to create a complete hazard mapping system for a Macintosh II personal computer. All of the programs have been tested and a proto-type system has been installed at the Geological Research and Development Center in Bandung, Indonesia, with the cooperation of the Agency for International Development, Office of Foreign Disaster Assisstance under the auspices of The International Decade for Natural Hazard Reduction. The compact and relatively inexpensive system will, for the first time, allow complex probabilistic ground-motion hazard calculations and mapping to be performed in a "desk-top" environment. Future development of the system will concentrate on creating a Mac-like "windows" interface for the user. Once developed, the user interface could easily be adapted to the next generation of hazard-mapping software, FRIENDLY, that is currently in testing.
Reports
Algermissen, S.T., Krumpe, P.R., and Hays, W.W., 1991, The Worldwide Earthquake Risk Management (WWERM) Program: Proceedings of the 23rd. U.S. Japan Panel on Wind and Seismic Effects, Tokyo, Japan, May 13-17,1991. 3 p.
Algermissen, S.T., Leyendecker, E.V., Bollinger, G.A., Donovan, N.C., Ebel, J.E., Joyner, W.B, Luft, R.W., and Singh, J.P., Probabilistic ground-motion hazard maps of response spectral ordinates for the United States: Fourth International Conference on Seismic Zonation, Stanford University, Aug. 26-29, 1991, (in press).
Algermissen, S.T, Leyendecker, E.V., Perkins, D.M., Thenhaus, P.C., Bender, B.K., Wheeler, R.L., and Hanson, S.L., 1990, New generation probabilistic ground motion hazard maps for the United States: EOS, v. 71, No. 43, p. 1439.
Algermissen, S.T., Perkins, D.M., Thenhaus, P.C., Hanson, S.L., and Bender, B.L., 1990, Probabilistic earthquake acceleration and velocity maps for the United States and Puerto Rico: U.S. Geological Survey Miscellaneous Field Investigation Mapsm MF-2120,2 sheets, scale 1: 5M.
Barnhard, L.M., Stover, C.W., Hopper, M.G., Thenhaus, P.C., and Algermissen,5.T., 1990, Intensity studies of the May 2,1983 Coalinga, California earthquake, in,
522

III.l
Rymer, M.J., and Ellsworth, W.L., eds., The Coalinga, California earthquake of May 2, 1983: U.S. Geological Survey Professional Paper 1487, p. 349-358.
Thernhaus, P.C., 1990, Perspectives on the seismic hazard and risk of the New Madrid Seismic Zone: Earthquakes and Volcanoes: v. 4, Nft* 1, p. 4-21.
Thenhaus, P.C.,and Singer, F.R., 1990, Study Plan for Study '8$. 1.17.3.10 ~ Relevant Earthquake Sources: U.S. Geological Survey Yucca Mountain Project Report, 25 p., 5 figs, (in review).
U.S. Geological Survey, 1990, Draft review of earthquake hazard assessments of plant sites at Paducha, Kentucky and Portsmouth, Ohio: Administrative report to the Department of Energy, 210 p.
References
Arnold, E.P., 1990, Program SEISRISK HI adapted to personal computers: U.S. Geological Survey Open-File report 89-557 A-N.
Atkinson, G.M. and Boore, D.M., 1990, Recent trends in ground motion and spectral response relations for North America: Earthquake Spectra, V. 6, p. 15-35.
523

III.l
Holocene paleoseismology, western Washington9540-04004
Brian F. AtwaterU.S. Geological Survey at Department of Geological Sciences
University of Washington AJ-20Seattley Washington 98195
(206) 553-2927 FTS 399-2927
INVESTIGATIONS AND RESULTSPrecise radiocarbon dating for testing synchrony of coastal subsidence (incollaboration with Minze Stuiver, David K. Yamaguchi, and Gary A. Carver)
(1) Completed in first spruce-dating experiment. Presented these results at GSA/SSA meeting in San Francisco and prepared report submitted to Nature in May, 1991. Found no evidence against synchrony of submergence about AD 1700 at two areas 55 km apart in coastal Washington.
(2) Received 2 ages on red-cedar ring blocks previously dated through ring-width pattern matching by David Yamaguchi. Results (in years A.D.):
Ring dates by Yamaguchi Age range by C-14 (>95% confidence)
1645-1655 1643-16641640-1660 1640-1674, or 1738-1798, or 1936-1953
(3) With Gary Carver, collected samples from submergence-killed spruce at Humboldt Bay, California, for comparison with existing tree-death ages for Washington. Selected rings are being submitted in May for precise radiocarbon dating by Minze Stuiver.
Diatom test of rupture segmentation 900-1300 years ago (by Eileen Hemphill- Haley)
(1) Completed seasonal (4 times per year) sampling of modern diatoms along leveled transects at Willapa Bay. Found vertical zonation in which certain species are abundant only on wetland surfaces near high-tide levels.
(2) Using fossils of these wetland-indicator species, identified at Willapa Bay a buried wetland soil not evident in outcrop as a dark or peaty layer. The soil appears to represent the penultimate submergence event in the area and may, on the basis of stratigraphic position, correlate with buried soils dated in the range 900-1300 years old farther north (near Neah Bay) and south (near the Columbia River and in northern Oregon). Lack of a dark or peaty layer is probably due to oxidation that destroyed organic matter but spared the siliceous shells (frustules) of diatoms.
Liquefaction (in collaboration with Stephen F. Obermeier)Completed report on liquefaction features in the range 900-1300 years
old near Grays Harbor.
524

III.l
REPORTSAt water, B.F., and Yamaguchi, D.K., 1991, Sudden, probably coseismic
submergence of Holocene trees and grass in coastal Washington state: Geology, v. 19 (in press).
At water, B.F., 1991?, Earthquake-induced subsidence and liquefaction during the past 2000 years along the Copalis River, southern coastal Washington: submitted to Journal of Geophysical Research in April, 1991.
Atwater, B.F., Stuiver, M., and Yamaguchi, D.K., 1991?, Radiocarbon dating and great-earthquake potential in the northwestern United States: submitted to Nature in May, 1991.
Atwater, B.F., Jimenez Nunez, Hector, and Vita-Finzi, Claudio, 1991?, Net late Holocene submergence despite earthquake-induced submergence, south- central Chile: submitted in May, 1991, to Quaternary Internationa] special volume, "Impacts of Neotectonics on Quaternary Coastal Evolution", edited by Yoko Ota, Alan R. Nelson, and Kelvin Berryman.
525

III.l
PUGET SOUND PALEOSEISMICITY
9950-04484
ROBERT C. BUCKNAM
U.S. Geological SurveyBranch of Geologic Risk Assessment
Box 25046, Denver Federal Center, MS 966Denver, Colorado 80225
(303) 236-1604
INVESTIGATIONS
Study of late Holocene uplift in the central Puget Sound region.
RESULTS
Geologic studies and limiting 14C dates (summarized below) from three sites have refined our understanding of late Holocene deformation in the central Puget Sound region. The most conspicuous evidence of deformation is a marine platform at Restoration Point on southern Bainbridge Island, which has been uplifted about 7 m. Rounded detrital charcoal in sandy mud that underlies a gravelly beach bar associated with the raised platform has been dated at 1546-1349 cal yr B.P. (tree-ring calibrated calendar years). The date provides a maximum estimate on the timing of the uplift event. The raised platform is well-preserved and lacks intermediate level shorelines, which implies that the uplift was sudden and likely associated with an earthquake.
A section of peat at a small salt marsh 5 km to the north of Restoration Point lacks evidence of large vertical displacement contemporaneous with that at Restoration Point. The marsh, located near Winslow, Wash., is on the opposite side of an inferred WNW-trending Quaternary fault associated with a prominent gravity anomaly (Gower and others, 1985). The peat began to form 1980-1740 cal yr B.P.; other samples higher in the section range in age from 1690-1525 to 788-706 cal yr B.P. The lack of conspicuous stratigraphic breaks in the section indicates that deformation associated with the uplift was dramatically less at the Winslow site than at nearby Restoration Point (7 m) and probably much less than the present tidal range of about 3.5 m.
The data from these two sites is not sufficient, alone, to clearly define a causal structure for the deformation. The displacement pattern, however, is consistent with that expected for movement on the Quaternary fault inferred by Gower and others (1985), and the lack of evidence of surface faulting between the two sites suggests that the observed displacements may be the result of folding above a fault that did not reach the surface. The trend and sense of slip on the inferred structure, which is at a high angle to the trend of the Juan de Fucca subduction zone to the west, is consistent with a NNE compressive state of stress in the upper crust in the Puget Sound basin as indicated by earthquake focal mechanisms and wellbore breakout data (M.L. Zoback, 1990).
The third site, a large salt marsh at Lynch Cove about 30 km southwest of Restoration Point, is on the upthrown side of the inferred Quaternary fault. Peat that contains abundant wood fragments and overlies tideflat mud with sharp contact and woody plants rooted in the tideflat mud are interpreted as evidence of abrupt uplift at the site, which allowed growth of freshwater plants on the mud. The basal 5 cm of the peat and the roots, dated at 1225-975 and 1055-975 cal yr B.P. respectively, provide a minimum estimate for the timing of uplift. Growth of the woody plants may postdate the uplift by only a few decades. A !4C date of a shell-rich layer about 30-50 cm below the mud/peat contact provides a maximum estimate for the time of the uplift of 1530-1330 cal yr B.P. The present salt marsh results from a relatively recent transgression of salt water across the lower peat owing to a relative rise of sea level during the past several hundred years.
526

III.l
TABLE-Summary of radiocarbon ages constraining Late Holocene deformation in central Puget Sound
Locality
Restoration Pt
Winslow Marsh
Lynch Cove
Lynch Cove
Lynch Cove
Sample identification
890923.01E Beta-36045
900918.01A GX-16225-AMS
880428.01D Beta-29145
890925.01 Beta-36046
900920.01 GX-16267
Radiocarbon Age ± la (yr B.P.)
1,560±90
1,920±100
1,170±90
1,050±70
2,700±85
la Calibrated age range (yr B.P>)
1,546-1349
1,989-1,740
1,226-975
1,053-926
1,531-1,331
Sample material
Detrital charcoal
Twig (Thuja plicata)
Peat
Wood (root)
Shells (Ostrea luridd)
Conventional radiocarbon ages calibrated using Method B of CALIB program of Stuiver and Reimer (1986), error multiplier=1.00, and bidecadal calibration curve. Shell sample calibrated with marine calibration curve and A=800±25 years.
527

III.l
Geology and Tectonic Evolution of the Western Transverse Ranges, California
9950-04063
Russell H. CampbellBranch of Geologic Risk Assessment
U.S. Geological Survey922 National CenterReston, VA 22092
FTS 959-6784(703) 648-6784
Investigations
The current focus of the project is the assembly of a digital spatial database in a GIS (geographic information system) format for the Los Angeles 30 x 60 minute quadrangle (1:100,000 scale). Digital geologic map data are being compiled in 7.5 minute quadrangle panels, together with base map separates (contours, roads, streams and shorelines) and digital elevation models (DEM's). The base materials are either publicly available from USGS(NMD) sources, or can readily be incorporated by scanning or manual digitizing. The project is a cooperative interagency (CDMG) and interbranch/interoffice (BP&S, BWRG, BRGP) effort.
Initial compilation has concentrated on preliminary geologic map compilation in the southwestern quarter of the 30 x 60 minute sheet, in cooperation with R.F. Yerkes and P.K. Showalter, both of BWRG. The switch from pen-and-ink graphics map preparation to computer-aided (GIS) preparation has required significant front-end time for hardware setup and learning complex software (Arc/Info).
Fieldwork will focus on stratigraphic and structural problems and interpretation.
Results
1. The l:24,000-scale geologic map and accompanying text for the Point Dume quadrangle, California, has been approved by BGRA and submitted to BETR for edit.
2. The eight 7.5 minute panels for the southwest quarter of the Los Angeles 30 x 60 minute quadrangle are in various stages of preparation.
528

III.l
TECTONICS OF SEISMIC SOURCE ZONES, CENTRAL INTERIOR OF THE UNITED STATES
9950-04542
ANTHONY J. CRONEBranch of Geologic Risk Assessment
U.S. Geological SurveyBox 25046, MS 966,
Denver, Colorado 80225(303)236-1595
PURPOSE OF PROJECT
To provide basic geologic and geophysical information on the distribution, characteristics, and frequency of large earthquake in the central interior of the United States and contribute to a better understanding of the structural features that might produce large, potentially damaging intraplate earthquakes. Project members are: Donley S. Collins, Anthony J. Crone, Richard L. Dart, Sharon F. Diehl, William L. Ellis, Meridee Jones-Cecil, Richard F. Madole, and Henri S. S wolfs.
INVESTIGATIONS
1. D.S. Collins continued processing selected samples of well cuttings from the Dow Chemical Co. #1 Garrigan and the Stroke Petroleum #1 Russell drill holes for analysis of insoluble residues. The analysis of insoluble residues will hopefully assist in correlating Lower Paleozoic rocks throughout Reelfoot rift
Collins also examined 12 thin sections and hand samples of core from holes drilled adjacent to the Meers fault to determine the petrology of rocks in the core. (Core is on loan from Ken Luza, Oklahoma Geological Survey.) The petrologic information will refine the interpretation and modeling of the potential field data in the vicinity of the fault.
2. A.J. Crone completed the purchase of 125.72 miles (202.28 km) of Vibroseis seismic-reflection data across the fault systems that bound Reelfoot rift The goal of this study is to clarify the geologic history and the earthquake potential of the rift-bounding faults, particularly the faults that are close to Memphis, Tennessee.
Crone and Michael N. Machette (Branc of Geologic Risk Assessment) spent about 1/2 of the reporting period completing field work and analyzing data from their studies of two historic surface-rupturing intraplate earthquakes in Australia. This research is largely supported by a USGS G.K. Gilbert Fellowship (FY 90-91) to study the paleoseismic history of intraplate earthquakes. Their studies focused on the 11 km of scarps formed by the 1986, MS 5.8 Marryat Creek earthquake in South Australia, and the 34 km of scarps formed by the 1988-series of earthquakes (Ms 6.3-6.7) near Tennant Creek, Northern Territory. They are collaborating with J. Roger Bowman (Australian National University, Canberra), who is studying the seismology of both earthquakes.
3. R.L. Dart completed the final versions of the set of computer-generated subcrop, structure contour, and isopach maps for various time systems of Paleozoic rocks in the Upper Mississippi Embayment. Dart maintained and periodically updated the data base of subsurface geologic information that was used to create these maps. He also made preparations to convert the data base from a PC-based DOS format to an ARC/Info format to make the subsurface data compatible with Geographic Information Systems (GIS) data bases.
4. S.F. Diehl continued petrologic investigations of Dow Chemical Co. #1 Garrigan and the Dow Chemical Co. #1 Wilson drill holes in Reelfoot rift, northeastern Arkansas.
5. W.L. Ellis began a comprehensive compilation and evaluation of the published stress-measurement data within a 300-km radius of the New Madrid seismic zone because existing compilations are incomplete and the published data is scattered among several references. He continued a low-level effort to identify areas of past mineral exploration or
529
III.l
other shallow drilling in the New Madrid region where small-diameter boreholes might be available for shallow hydraulic-fracturing measurements.
Ellis completed an examination and evaluation of the existing data on the distribution of least-stress magnitudes in south-central Oklahoma and its possible relationship to structural features of the Frontal Wichita Fault System and the McClain County fault zone.
6. M. Jones-Cecil continued her interpretation of the potential field data of southwestern Oklahoma to clarify the structural relationship and seismic potential of the Meers fault in relation to other faults in the Frontal Wichita fault system. She initiated both a paleomagnetic and a shear-plane orientation study of core from holes drilled adjacent to the Meers fault (Core is on loan from Kenneth Luza, Oklahoma Geological Survey).
7. R.F. Madole and Joseph G. Rosenbaum (Branch of Geophysics, Denver) designed accessory equipment to be used with a modified Livingston piston sampler and refined methods for obtaining undeformed cores from shallow- and deep-water sites in Reelfoot Lake, western Tennessee. Cored sediment from the lake will be examined for evidence of soft-sediment deformation or other disturbance that was caused by the 1811-12 New Madrid earthquakes. If a stratigraphic record of the 1811-12 earthquakes can be documented in the lacustrine deposits, future efforts will search for evidence of prehistoric earthquakes in deeper cores.
8. H.S. Swolfs continued his analyses of structural features in the Dow Chemical Co. #1 Garrigan drill hole in Mississippi County, Arkansas. This drill hole is located on the crest of the Blytheville arch, a major structural feature that coincides with one of the prominent seismicity trends in the New Madrid seismic zone.
RESULTS
1. (Collins) Samples from 47 depth intervals between 2,860 and 12,048 ft in the Dow Chemical Co. #1 Garrigan drill hole show no distinctive changes in the proportions or types of insoluble residues might assist in correlating the Paleozoic rocks in Reelfoot rift. However, the insoluble residues do provide information on the depositional setting for the Lower Paleozoic rocks. An assemblage of Late Cambrian trilobites from 7,986 ft in the Garrigan well can be roughly correlated with a similar assemblage from 10,800-11,100 ft in the nearby Dow Chemical Co. #1 Wilson well, which implies that there is 2,000-3,000 ft of structural relief between the wells. A sedimentologic and stratigraphic analysis of the fine-grained clastic rocks between 8,380 and 9,220 ft in the Garrigan well indicates deposition in a deep-water submarine fan setting. The analysis also indicates that at least one episode of relative sea- level lowering occurred during deposition of these rocks. The paleontologic and sedimentologic analysis were conducted in conjunction with M.E. Taylor (Branch of Paleontology and Stratigraphy, Denver). The heavy mineral fraction of the insoluble residues from the Strake Petroleum #1 Russell well indicates that metamorphic rocks were exposed in the source area of the Paleozoic sedimentary rocks. Work is continuing on the samples from this well.
The initial examination of hand samples and thin sections of the drill core adjacent to the Meers fault indicates that the dike-like body, interpreted from aeromagnetic data to be immediately south of the Holocene rupture, is probably composed of extensively sheared and altered meta-gabbro or meta-andesite and diorite. This is the first reported diorite in this area of the Meers fault.
2. (Crone) Approximately 66 miles (106 km) of the newly acquired seismic-reflection data are located across the southwestern boundary of the rift and 59 miles (95 km) across the northwestern boundary. The commercially processed record sections, field tapes, and supporting data have arrived and initial studies to interpret these data will begin during the nextrepjorting period. Reprocessing these data will also start during the next reporting period.
The main objective of Crone and Machette's Gilbert Fellowship research is to identify and date prehistoric ruptures on the faults that produced the Marryat Creek and Tennant Creek earthquakes in order to establish recurrence intervals for intraplate surface-rupturing earthquakes. We excavated two trenches across the Marryat Creek fault scarps and four trenches across the Tennant Creek fault scarps, all of which are formed thrust faulting. We have completed lithologic/structural logs of the trenches, detailed site maps, and plots of scarp profiles, and we are preparing a manuscript describing the results of our studies.
530

III.l
At present, we have only preliminary results from our Gilbert Fellowship research. The trench stratigraphy at the two Marryat Creek sites and at two of the four Tennant Creek sites show that the historical earthquakes reactivated ancient faults. However, there was no clear evidence of fault-scarp derived colluvium in the Quaternary deposits in any of the six trenches and there is no compelling geomorphic evidence of prehistoric faults scarps at any of the sites. These relations indicate that the historic earthquakes were associated with faults that had ruptured in the past, but that the recurrence interval for surface-rupturing earthquakes on these faults is probably measured in time increments of at least tens of thousands of years and possibly hundreds of thousands of year or more (millions of years?). Dating the Quaternary deposits in the trenches will provide additional insight into the minimum time of the prehistoric earthquakes on these faults. Samples collected during the field work are being analyzed for thermoluminescence (TL) dating (John Prescott, University of Adelaide, Australia), for Electron Spin Resonance (ESR) dating (Kazuhiro Tanaka, Central Research Institute of Electric Power Industry, Abiko, Japan; Hugh Millard, Branch of Isotope Geology, USGS, Denver), and Uranium-series dating (Dan Muhs, Branch of Isotope Geology, USGS, Denver).
3. (Dart) Additional subsurface geologic data from 6-10 drill holes was acquired and incorporated into the existing data base. The computer plots of a series of 20 subcrop, structure contour, and isopach maps has been completed. The series of maps also includes two base maps that show the location of the drill holes with respect to political boundaries, major structural features, and selected seismic-reflection lines. Current efforts are focusing on preparing data tables and a descriptive and interpretative text to accompany the maps.
4. (Diehl) The paragenetic sequence of vein-filling mineralization is similar in the Dow Chemical Co. #1 Garrigan and the Dow Chemical Co. #1 Wilson drill holes. Veinlets in both drill holes are first filled by quartz followed by a succession of siderite, dolomite, ferroan dolomite, and ferroan calcite. Compared to the rocks in Reelfoot rift, the carbonate-platform rocks northwest of the rift have mineralized veinlets that contain fewer mineral species and a less complex sequence of veinlet mineralization. One explanation for the difference in mineralization history is that rocks in the rift have been more extensively fractured and mineralized because of localized seismic activity from rift- related extensional tectonics. The effects of extensional tectonism diminished away from the rift, resulting in less fracturing and mineralization in the carbonate-platform rocks outside of the rift.
Veinlets in the #1 Garrigan hole and fractures and dikes in the Tri-State Fluorspar mineral district at the northern end of the Mississippi Embayment have a similar orientation, and limited data indicates that they may be similar in age. Sericite in fractures in the Fluorspar mineral district have been dated at 200-240 Ma (T. Hayes, oral commun.) and diagenetic illitic clay in Cambrian sedimentary rocks along the Mississippi Embayment is late Pennsylvanian to Permian in age based on K/Ar dates (Rothbard, 1983). Based on these data, I infer that the illite-filled fractures in the #1 Wilson drill hole are also Permian in age. The #1 Wilson and #1 Garrigan drill holes are located near the southwestern end of the rift and the Fluorspar district is near the northeastern end of the rift, 200 km away. If the inferred age of the fracture opening and filling in the drill holes is accurate and is from the same deformational event that occurred in the mineral district, then this combined information may indicate an episode of Late Paleozoic reactivation of the rift
5. (Ellis) By utilizing earthquake focal-mechanism solutions, borehole breakouts, hydraulic-fracturing data, and stress-relief measurements from published sources, some information on the in situ stress field is available at 35 locations within a 300-km radius of the New Madrid seismic zone. Most of these locations are in southern Illinois. The data cover a depth range extending from near the surface to 22 km deep. The consistency of horizontal stress orientations throughout this depth range indicates that the contemporary tectonic stress field is expressed in the upper few hundred meters of the crust, and that shallow stress measurements may provide useful data on the orientation and distribution of tectonic stress within and around the New Madrid seismic zone. Furthermore, near-surface variations in the regional and local stress patterns might provide insight into the mechanics of deformational processes that are operating at seismogenic depths, and also aid in identifying specific faults that might be prone to failure in the contemporary stress field.
6. (Jones-Cecil) Interpretation of the aeromagnetic, ground magnetic, and gravity data from the Lawton 1:100,000 quadrangle suggests that the Quaternary reactivation of the Meers fault was strongly controlled by Late Paleozoic structural features. The interpretation of eight of the ground magnetic profiles agrees with interpretation of shallow seismic-reflection studies that indicate the Meers fault is a fault zone; in addition, at least two splays mapped along
531

III.l
the Holocene rupture correspond to interpreted splays of the magnetic basement To date, modeling has assumed that the observed magnetic field is principally due to induced magnetization. To test this assumption, 34 paleomagnetic saqmples have been drilled from the unoriented drill core on loan from the Oklahoma Geological Survey (OGS). Koenigsberger ratios and inclination of the remnant magnetization will be determined for these cores. As a pilot study, the relative orientation of shear planes in the OGS core was measured (with the assistance of Lee-Ann Bradley, Br. of Geologic Risk Assessment). Even though the core is unoriented, it was possible to reassemble contiguous sections of core, and thus provide relative shear-plane orientations within the sections. Several of the contiguous sections had one or more clusters of shear-plane orientations. In at least two cases, these clusters suggested conjugate shear planes that could have formed during either near-horizontal or near-vertical stress. Rake angles of slip indicators on the shear planes were generally greater than 65°, indicating predominantly dip-slip movement. The results from this pilot study are encouraging; oriented cores from within and adjacent to the Meers fault zone might be useful in determining paleostress directions.
7. (Madole) Four cores (two approximately 3 m long and two approximately 7 m long) were obtained with the modified equipment during April 1991. These cores were collected in collaboration with E.S. Schweig and J.E. Mirecki of the Center for Earthquake Research and Information (CERI), Memphis State University. The sedimentology and stratigraphy of the cores will be analyzed using radiographs, grain-size analyses, palynology, and measurements of magnetic susceptibilities and remnant magnetization during the next reporting period.
8. (Swolfs) The crosscutting relationships between two nearly orthogonal sets of veins, previously described by Swolfs and others (1990), in oriented core C #1 from the Dow Chemical Co. Garrigan #1 drill hole have been studied at mesoscopic and microscopic scales. At the mesoscopic scale, the intersections of the two sets suggested an alternating or episodic formation of set #1 before and after the formation of set #2. At the microscopic scale, however, this ambiguity is resolved and set #2 clearly predates set #1. Set #2 veins are internally strained and, typically, stretched and necked where they intersect set #1 veins that are less than 2 mm wide. (These constricted segments of set #2 veins show as milky streaks across set #1 veins at the scale of the core.) Set #1 veins that are wider than 2 mm clearly truncate set #2 veins.
Calcite-grain morphologies differ between the two sets of veins. In the younger set #1, which is present only in core C #1 (2,430- 2,439 m), the calcite grains are typically fibrous and subhorizontally elongated. The fibers are planar to slightly sigmoidal, optically continuous across the veins, and show predominantly antitaxial growth from a median suture toward the walls. In veins wider than 2 mm, individual fibers partially overlap each other. The cross- sectional dimensions of the fibers average about 0.2 mm. Nearly all of these veins have a drusy wall-lining of authigenic quartz. This younger system of extensional veins developed slowly in compacted, lithified, and brittle sandstone beds under conditions of deep burial and excess hydrostatic pressure. The older set #2 veins probably extend a vertical distance of at least 1,052 m in the drill hole and contain equant grains of calcite, but the drusy-quartz lining is absent. This system of thin veins (approximatley 1 mm) typically shows terminal crack-forking that is usually associated with unstable fracture growth during deformation.
REFERENCES CITED
Rothbard, D.R., 1983, Diagenetic history of the Lamotte Sandstone, southeast Missouri, in Kisvarsanyi, G. and others, eds., Proceedings of international conference on Mississippi Valley type lead-zinc deposits, University of Missouri-Rolla, Rolla, Missouri, p. 385-395.
Swolfs, H.S., McKeown, F.A., and Glick, E.E., 1990, Episodes of extension recorded in Cambrian rocks in the Reelfoot rift, Mississippi Embayment [abs.]: EOS, Transactions, American Geophysical Union, v. 71, no. 17, p. 638.
532

III.l
REPORTS
1. Bradley, Lee-Ann, and Jones-Cecil, Meridee, 1991, Density and magnetic susceptibility measurements of rocks in the Wichita uplift and Slick Hills, southwestern Oklahoma: U.S. Geological Survey Open-File Report 91- 269, 31 p.
2. Collins, D.S., in press, Insoluble residue of selected samples from the Dow Chemical B.L. Garrigan #1 drill hole [abs.], in Lowell, G.R. and Clendenin, C.W., eds., Proceedings of Louis Unfer, Jr. Conference on geology of the Mid-Mississippi Valley region: Southeast Missouri State University, June 13-14,1991, Cape Girardeau, Missouri, Missouri Department of Natural Resources Special Report.
3. Crone, AJ., 1990, Late Quaternary tectonism and intraplate seismicity in the central interior of the United States [abs.], in Gregson, P.J., compiler, Australian Bureau of Mineral Resources, Geology, and Geophysics, Record 1990/44, Recent Intraplate Seismicity Symposium, Perth, Western Australia, September 5-7,1990.
4. Dart, R.L., and Swolfs, H.S., 1991, Contemporary stress in northeastern Arkansas [abs.]: EOS, Transactions, American Geophysical Union, v. 72, no. 17, p. 264.
5. Dart, R.L., and Swolfs, H.S., in press, Subparallel faults and horizontal-stress orientations-An evaluation of in- situ stresses inferred from elliptical well bore enlargements: Proceedings of the Norwegian Petroleum Society meeting on structural modelling, Stavinger, Norway, October, 1989.
6. Diehl, S.F., Goldhaber, M.B., and McKeown, F.A., in press, Fluid-migration paths inferred from mineralized stylolites and fractures from drill cores in the New Madrid Region [abs.], in Lowell, G.R. and Clendenin, C.W., eds., Proceedings of Louis Unfer, Jr. Conference on geology of the Mid-Mississippi Valley region: Southeast Missouri State University, June 13-14,1991, Cape Girardeau, Missouri, Missouri Department of Natural Resources Special Report.
7. Ellis, W. L., in press, Stress distribution in south-central Oklahoma and its relationship to crustal structure and contemporary seismicity, in Rock mechanics as a multidisciplinary science-Symposium on rock mechanics, 32nd, Norman, Oklahoma, 1991, Proceedings: A. A. Balkema, Rotterdam.
8. Jones-Cecil, Meridee, 1990, Ground-magnetic profiles across the Meers fault, SW Oklahoma-Quaternary reactivation of a Late Paleozoic fault zone: Geological Society of America Abstracts with Programs, v. 22, no. 7, p. A18.
9. Jones-Cecil, Meridee, in press, Total-field aeromagnetic and derivative maps of the Lawton area, southwestern Oklahoma: U.S. Geological Survey GP-998-A, 2 oversized sheets, scale 1:100,000.
10 Jones-Cecil, Meridee, and Robbins, S.L., in press, Bouguer and isostatic residual gravity anomaly and derivative maps of the Lawton area, southwestern Oklahoma: U.S. Geological Survey GP-998-B, 3 oversized sheets, scale 1:100,000.
11. McKeown, F.A., Hamilton, R.M., Diehl, S.F., and Glick, E.E., Diapiric origin of the Blytheville and Pascola arches in the Reelfoot rift, east-central United States Relation to New Madrid seismicity: Geology, v. 18, p. 1158-1162.
12. Swolfs, H.S., in press, Structural characteristics in the Dow Chemical B.L. Garrigan #1, Mississippi County, Arkansas [abs.], in Lowell, G.R. and Clendenin, C.W., eds., Proceedings of Louis Unfer, Jr. Conference on geology of the Mid-Mississippi Valley region: Southeast Missouri State University, June 13-14,1991, Cape Girardeau, Missouri, Missouri Department of Natural Resources Special Report.
13. Taylor, M.E., Collins, D.S., Palmer, A.R., and Repetski, J.E., in press, Upper Cambrian biostratigraphic correlations in the Reelfoot basin, northeastern Arkansas [abs], in Lowell, G.R. and Clendenin, C.W., eds., Proceedings of Louis Unfer, Jr. Conference on geology of the Mid-Mississippi Valley region: Southeast Missouri State University, June 13-14, 1991, Cape Girardeau, Missouri, Missouri Department of Natural Resources Special Report.
533

III.l
SEISMOTECTONIC RESEARCH STUDIES9950-04556
A.F. EspinosaBranch of Geologic Risk Assessment
U.S. Geological SurveyBox 25046, MS 966, Denver Federal Center
Denver, CO 80225(303) 236-1597
Investigations
1. Post-earthquake investigations were undertaken and a study of the mb = 5.4 Laramie Mountians, Wyoming, event of 18 October 1984 is in progress.
2. Continued investigations of the aftershock of the Ms = 7.8 Peru earthquake of 3 October 1974 are underway.
3. Continued work and preparation of the geologic map-report for the Anchorage B- 8 SE quadrangle Alaska, was started and awaits field checking; further geologic interpretation is underway, as well as the beginning of text preparation which is intended to include extensive surficial geologic information that benefits from the ongoing studies of gradients of lateral moraines. This work aided correlation of geologic map units, both within this area and with type or reference deposits elsewhere in the region.
4. A continuous research study of the surficial geologic manifestations of the Chilean Tectonic Subduction Zone which were investigated in middle and southern Chile during part of an austral summer as part of a special USGS grant. Samples of several types of organic materials have been analyzed and their relation to submerged and emerged sediments is under study in cooperation with the Branch of Central Mineral Resources.
5. A continuous effort is underway in the final editing process of the focal- mechanism solutions and their distribution in Alaska and the Aleutian Islands for 889 earthquakes, which took place from 1927 through 1989, and are being revised and reviewed for publication.
6. Continuous work on a focal-mechanism distribution map for Alaska and the Aleutian Islands is being prepared for publication.
7. Continued study of relations among seismicity, tectonism and hydrothermal regime in the west moat of the Long Valley caldera, California.
8. Continued study of relations among seismicity, tectonism, and hydrothermal regime in Chile.
534

III.l
Results
Continued analysis of temperature and gamma-ray logs in a line of shallow (75 - 250 m) holes that cross the Imperial fault near El Centra, California with the
objective of studying the hydrothermal effects of the Imperial Valley earthquake of October 15, 1979.
1. The results obtained in the post-earthquake study of the Laramie Mountains earthquake are:
a. The majority of the 47 locally recorded aftershocks occupy a small cylindrical volume roughly 4 km in diameter by 5 km in height.
b. Most aftershocks occurred between about 21 and 24 km in depth.
c. Based on aftershock depths, the main shock probably occurred below 21 km and is therefore one of the deepest known earthquakes of mb - 5.4 (ML = 5.5) within the continental interior; also, associated intensity-felt area (287,000 km) was larger than expected for that magnitude.
d. Two directions of horizontal extensional stress (about N 20° E and N 50° E) are associated with the aftershock sequence and in general agreement with the regional northeasterly stress distribution.
2. The aftershock study of the October 1874 Peruvian earthquake shows that:
a. Most of the 131 located aftershocks occur south of the main shock epicenter. Depths range from about 10 km for the oceanward events to about 60 km for aftershocks below the coastal town of Chilca.
b. The aftershocks are being relocated using Jim Dewey's joint hypocenter determination (JHD) program.
3. For the Anchorage B-8 SW quadrangle, Alaska, map units have been described, interpreted, and map preparation and regional geologic framework aspects of the text almost completed prior to the impending technical review.
5. Stratigraphic interpretation of emerged and submerged tidal deposits southeast of downtown Anchorage, Alaska has resulted in a USGS Bulletin presently entitled, The Girdwood Member of the Twenty Mile River Formation - late Holocene silt and peat stratigraphy. Turnagain Aram and vicinity, southccntral Alaska (Schmoll, and Bartsch-Winkler).
5. A surflcial geologic map of the Eklutna River drainage basin, Municipality of Anchorage, is in preparation for publication.
535

III.l
6. Reinterpretation of some early, provision surficial geologic maps and detailed airphoto interpretation of sectors of the Bulkana A-l and Nebesna B-6 quadrangles, Alaska has been completed in cooperation with the Branch of Alaska Geology and is in preparation for publication.
7. A preliminary analysis of precision temperature and gamma-ray logs in the MLGRAP #1 and #2 wells, Long Valley caldera, California has been open-filed along with the data (Diment and Urban, 1990a), and the results discussed at the Fall AGU meeting (Diment and Urban, 1990b). Copies of the Open-File report were distributed to the Town of Mammoth Lakes/California Energy Commission to facilitate their search for hot water suitable for space heating. Our results have contributed to sell design and exploration strategy for this demonstration project.
8. A continuous effort is underway in preliminary analysis of precision temperature and natural gamma-ray logs obtained in 1980-81 in the line of shallow holes that crosses the Imperial Fault near El Centre, California indicates that: (1) temperature were noticeably depressed in the vicinity of the fault implying that water had flowed down the shallow part of the fault for a considerable period prior to the 1979 earthquake; and (2) elevated isotherms indicate that water is flowing up at El Centre which is near a seismic lineament that may be an extension of the Superstition Mountain fault. These results have been reported in an abstract (Urban and Diment, 1990b). Analysis is continuing in an effort to derive a suitable correction for the slight artesian flow observed in some of the holes. Diment and Urban (1991) submitted an abstract for a special session at the AGU Spring meeting "The Potential of Tectonism and Volcanism for Producing Significant Excursions of the Water Table". The abstract contains some observations from the Long Valley caldera that may be relevant tot he problem.
9. The temperatures and thermal conductivity data for several drill holes in central Chile have been assembled and partially analyzed. The geologic background material has been obtained. Most of the information necessary to complete a report on the thermal regime of the area is in hand. However, detailed topographic maps necessary for terrain corrections have not been obtained yet.
536

III.l
Reports
Diment, W.H., and Urban, T.C., 1990, Significance of precision temperature and natural gamma-ray logs of the MLGRAP boreholes, Long Valley caldera, California: EOS, Transactions American Geophysical Union, v. 71, no. 43, p. 1692.
Diment, W.H., and Urban, T.C., 1991, Response of the Hot Bubbling Pool geothermal system of the Long Valley caldera, California, to earthquakes and tectonism: EOS, Transactions American Geophysical Union, v. 72, (accepted).
Langer, C.J., and Bollinger, G.A., 1991, The southeastern Illinois earthquake of 10 June 1987 the later aftershocks: Seismological Society of American Bulletin, v. 81, p. 423-445.
Langer, C.J., Martin, R.A., Wood, C.K., Snyder, G.L., and Bollinger, G.A., 1991, The Laramie Mountains, Wyoming, earthquake of 18 October 1984 A report on its aftershocks and seismotectonic setting: U.S. Geological Survey Open-File Report 91-258, 45 pp.
Urban, T.C., and Diment, W.H., 1990, The shallow thermal regime near the Imperial fault after the October 15,1979, Imperial Valley earthquake: Inferences of earthquake- induced change: EOS, Transactions American Geophysical Union, v. 71, no 43, p. 1603-1604.
Yehle, L.A., Schmoll, H.R., and Dobrovolny, Ernest, 1990, Geologic map of the Anchorage B-8 SE and part of the B-8 NE quadrangles, Alaska: U.S. Geological Survey Open-File Report 90-238, 37 p., scale 1:25,000.
537
III.l
Ground Motion Modeling in the Eastern U. S.With Emphasis on Effects of New Madrid Earthquakes
on Memphis and St. Louis
14-08-0001-G1769
Robert B. HerrmannDepartment of Earth and Atmospheric Sciences
Saint Louis University3507 Laclede AvenueSt. Louis, MO 63103
(314) 658-3131
InvestigationsThis program is focused on the specification of representative time his
tories for future large New Madrid earthquakes at target sites of Memphis, Tennessee and St. Louis, Missouri. This will be accomplished by a combina tion of deterministic and probabilistic techniques for the generation of time histories. Because of the unique environment of sites within the Mississippi River flood plain, e.g., 1000 meter thicknesses of very low velocity materials, effort is first directed toward constraining the wave propagation properties of the surface material.Results1. A paper on the extension of random process theory to account for crustal layering was published in the December Bulletin, Seismological Society of America.2. Processing is continuing on the September 26, 1990, an m, =4.6 earth quake occurred 175 km south-southeast of St. Louis near Cape Girardeau, Missouri. Surface-wave analysis for focal mechanism determination is ham pered by the lack of recording long period seismographs in eastern North America.3. Work has begun on analyzing the data from the PANDA experiment at New Madrid. Recordings of local earthquakes are being analyzed to deter mine a t* for P and S arrivals. These data will be analyzed to constrain the attenuation of the thick alluvial layers at New Madrid.PublicationsOu, G.-B. and R. B. Herrmann (1990). A statistical model for ground motion
produced by earthquakes at local and regional distances, Bull. Seism. Soc. Am. 80, 1397-1417.
538

III.l
9950-01896
INVESTIGATION OF SEISMIC WAVE PROPAGATION FOR DETERMINATION OFCRUSTAL STRUCTURE
K.W. King
SEMI-ANNUAL TECHNICAL SUMMARY10-1-90 to 3-31-91
Investigations1. Seismic reflection survey of Crowleys Ridge, Arkansas. During July, 1990 14 km of
high-resolution, shallow reflection Mini-Sosie data was acquired across the boundaries of the ridge to determine if the ridge is structurally controlled. During October and November, 1990, these data were processed to produce 5 stacked reflection records of 1 s two-way-traveltime. One second of this data corresponds to about the upper 1.2 km of the crust.
2. Seismic reflection survey of the Crittenden County Fault, northeast Arkansas - data processing and interpretation. To improve understanding of the location, attitude, sense and magnitude of displacement of this fault about 12 km of high-resolution Mini-Sosie seismic reflection data, which were acquired during the summer of 1990, were processed into eight stacked sections of 1 s two-way traveltime data. The data were collected along surface projections of the Crittenden County fault. This fault is located in an 8 km wide zone of predominantly down-to-the-nortnwest displacement that marks the southeast boundary of the Reelfoot Rift.
3. Mini-Sosie high resolution reflection surveys of the Bootheel Lineament in the New Madrid seismic zone - data processing and interpretation. To assess the seismogenic potential of deep structures, and surface features of the Bootheel Lineament which may be associated with current seismicity 23 line kilometers of high resolution Mini- Sosie seismic reflection data were acquired in July and August, 1990. These data were processed into stacked sections during October and November, 1990.
4. A seismic reflection survey of the Bootheel Lineament in Missouri - data processing and interpretation. To define the character of the Bootheel lineament, a likely surface rupture from the great New Madrid earthquakes of 1811 and 1812,11.5 km of high resolution Mini-Sosie seismic reflection data were acquired in September, 1990. These data were processed into 8 stacked profiles of 1 s two-way-traveltime data.
5. Investigations of seismic ground response in Santa Cruz, California. In this study we have collected geologic and seismic observations from the region around Santa Cruz (King and others, 1990). This area experienced damage during the Loma Prieta earthquake. Immediately after the earthquake a seismic network was established within the city and numerous aftershocks were recorded. High-resolution seismic refraction and reflection data were also acquired at several of the aftershock recording stations. Using geologic, seismic refraction, and seismic reflection data, we have constructed models of the near-surface geology around several of the seismic installations. Previously, Cranswick and others (1990) have shown that the level of damage correlates quite well with the near-surface geology. Using the geologic models, we are attempting to model the level and frequency spectra of the observed ground motion from the recorded aftershocks. From this we hope to be able to predict the level of ground shaking within an area before an earthquake occurs, and as such allow local governments to place and design structures accordingly.
539
III.l
6. Seismic refraction and surface-wave data interpretation as part of an investigation of foundation problems related to heaving soils and weathered bedrock in the Pierre Shale southwest of Denver, Colorado. An investigation was conducted to assess the possible relative contribution of bedrock rebound to the excessive amount of structural damage found in the area. High-resolution seismic refraction techniques were used to further project and verify the geologic information. These data were collected during June, 1990, and were processed during October and November, 1990.
7. Digital recordings of aftershocks of the October 17,1989, Loma Prieta, California, earthquake: Santa Cruz, Los Gatos, and surrounding areas. This report describes the field areas, field operations, and complete data set mat is now available on compact disk (Carver and others, 1990). The field effort was divided into five study areas: Santa Cruz, Rebecca Ridge in the Santa Cruz Mountains, Los Gatos, the Watsonville-Salinas area, and Robinwood Lane near Summit Road in the Santa Cruz Mountains. Generally, the intent was to record seismically induced ground motion to determine relative site response to ground shaking between several nearby locations.
8. Site response studies in south and west Seattle, Washington. Report submitted for internal review.
9. Vibration investigation of effects of induced vibrations to archaeological structures.
Results1. Results from 4 above were presented at the December, 1990 AGU meeting in San
Francisco (VanArsdale and others, 1990). One reflection profile (line 5) which crosses the eastern border of Crowleys Ridge at Jonesboro, Arkansas interpretation reveals an anticline in Tertiary strata at a depth between 100 and 600 m. The anticline is approximately 750 m wide and has an amplitude of about 10 m. Three kilometers east of the anticline the same strata are faulted down-to-the-east about 60 m. Deformation imaged in this line approximates the western boundary of Reelfoot Rift thus suggesting late Tertiary or Quaternary fault reactivation. Crowleys Ridge has been previously interpreted as an erosional remnant of Tertiary and Pleistocene sediments. However, reflection lines 1,2,3, and perhaps 4 of this study suggest that the boundaries of Crowleys Ridge are fault controlled.
2. Results from 5 above were presented at the December, 1990 AGU meeting in San Francisco (Luzietti and others, 1990). The reflection data show that the Crittenden County fault appears to offset Eocene and younger sediments by more than 40 m. The sense of offset is down to the southeast, indicating that the fault is antithetic to the rift boundary.
3. Results from 6 above were presented at the December, 1990 AGU meeting in San Francisco (Sexton and others, 1990). Preliminary processing of the data reveal faults and other structures in Cretaceous and Paleozoic age rocks have been imaged. These structures lie on or close to the projection of the Bootheel lineament and could be associated with that feature. If this is the case, it would represent a significant increase in the estimated length of the lineament.
4. Results from 7 above were presented at the December, 1990 AGU meeting in San Francisco (Schweig and others, 1990). In general, sedimentary layers between 50 and 750 m deep are well imaged. Gentle warping with maximum structural relief of about 20 m and disruption of reflectors are evident beneath strands of the lineament
540

III.l
on several of the lines. Reflectors believed to be as young as the Tertiary - Quaternary boundary are involved in the deformation, implying geologically young motion on this zone.
5. Preliminary results from 1 above show that simple 3-layer geologic models can be used to predict the general shape of and amplification of a site's spectral response curve relative to a site located on bedrock; in some cases the positions of resonant peaks are also predicted. Currently the models employ no attenuation factor. Future work will include attenuation and more than three layers as the seismic reflection data indicate up to 6 or 7 significant impedance contrasts are present in the upper 300 m of the ground.
6. Results from 6 above show that the seismic refraction data verify the boundaries of the soil horizon, Slocum alluvium, and the top of the Pierre Shale, but does not show the steep dip of the bedding in the shale. Based on the seismi-refraction data, the horizon near the surface of the Pierre Shale at 4.2 m contains a distinct offset of about 2 m. Movement on the Golden fault, approximately located as crossing the refraction profile, may have caused displacement on the shale alluvium contact.
7. The report mentioned in 7 above is intended to serve as a user's guide to the Loma Prieta aftershock data that were recorded in the Santa Cruz - Los Gatos areas. A total of 161 aftershocks were recorded by three or more seismographs. The instruments were moved frequently so that 101 different recording sites were occupied for varying lengths of time. Forty-three sites were occupied in the city of Santa Cruz, including a major sub-experiment involving an 11-station, approximately 3.5 km long, across the downtown area in the flood plain of the San Lorenzo River. Studies of the topographic influence on seismic waves were also conducted at Rebecca Ridge and Robinwood Lane. Eleven stations were occupied in the city of Los Gatos.
8. The site response study of South and West Seattle is a nominal response investigation of the Puget Sound area. The report shows the feasibility of a response study of the area.
9. The investigation has shown that railroad trains, vibration construction equipment and low-flying helicopters are a vibration threat to most types of southwest archaeological construction.
ReportsKing,K., Carver, D., Williams, R., Worley, D., Cranswick, E., and Meremonte, M., 1990,
Santa Cruz Seismic Investigations Following the October 17,1989 Loma Prieta Earthquake: USGS Open-File Report 90-307,57p.
Luzietti, E.A., Shedlock, K.M., King, K.W., McKeown, F.A., Schweig, E.S., Kanter, L.R., and VanArsdale, R.B., 1990, A seismic reflection survey of the Crittendon County fault, northeast Arkansas: EOS (Transactions American Geophysical Union), v. vl, no. 43, p. 1435.
VanArsdale, R.B., Scherer, G.G., Schweig, E.S., Kanter, L.R., Williams, R.A., Shedlock, K.M., and King, K.W., J1990, Seismic reflection survey of Crowleys Ridge, Arkansas: EOS (Transactions American Geophysical Union), v. 71, no. 43, p. 1435.
Sexton, J., Henson, H., Dial, P., and Shedlock, K.M., 1990, Mini-Sosie high resolution reflection surveys of the Bootheel Lineament in the New Madrid Seismic Zone: EOS (Transactions American Geophysical Union), v. 71, no. 43, p. 1436.
541

III.l
Schweig, E.S., Kanter, L.R., Shen, F., Li, Y., VanArsdale, R.B., Shedlock, K.M., Luzietti, E.A., and King, K.W., 1990, A seismic reflection survey of the Bootheel Lineament in Missouri: EOS (Transactions American Geophysical Union), v. 71, no. 43, p. 1436.
Carver, D.L., King, K.W., Cranswick, E., Worley, D.M., Spudich, P., and Mueller, C., 1990, Digital recordings of aftershocks of the October 17,1989, Loma Prieta, California, earthquake: Santa Cruz, Los Gatos, and surrounding areas: U.S. Geological Survey Open File Report 90-683.204 pp.
Willliams, R.A., and King, K.W., Site response estimates in the Salt Lake Valley, Utah, from borehole seismic velocities: Director Approval 12-28-90, submitted to Bull. Seism. Soc. Am. 1-9-91.
542

III.l
ACCRETIONARY WEDGE AND ADJACENT ABYSSAL PLAIN OFF OREGONAND WASHINGTON
Contract 14-08-0001-G1800
Principal Investigator: LaVerne D. Kulm*Co-Principal Investigator: Robert S. Yeats**
Graduate Research Assistant: Chris Goldfinger**
*College of Oceanography**Department of Geosciences
Oregon State UniversityCorvallis, OR 97331
(503)737-5211
Investigations
The overall objective of this project is to characterize and determine the timing of deformational events in the subducting Juan de Fuca plate (abyssal plain) and deformation front (accretionary wedge) of the Cascadia convergence zone off Oregon and Washington. A neotectonic map was constructed of the subducting oceanic plate, accretionary wedge, and adjacent continental shelf basins off central and northern Oregon to identify the styles and area! extent of deformation. We are trying to identify and date discrete deformational events and relate them to the distribution of earthquakes on the subducting oceanic plate and in the subduction zone.
Results
Active Fault Zones and Segment Boundaries: Abyssal Plain
Sidescan sonar surveys, SeaBeam bathymetry, single/multichannel seismic records, and ALVIN submersible observations show surflcial and basement faults in the Cascadia subduction zone. At least three major left-lateral strike-slip faults (A-C) occur on the abyssal plain and extend into the accretionary wedge and forearc basins of the continental shelf off central and northern Oregon (Figs. 1, 2; Goldfinger et al., 1990, 1991; Mackay et al., 1991). These faults are possible segment boundaries (Goldfinger et al., 1990) which strike uniformly between 282° and 298°.
Wecoma fault (Fault A), a prominent linear fault scarp oriented 295°, extends at least 17 km across the abyssal plain from 45°10'N (Fig. 1A,B; Appelgate, et al., 1989; Goldfinger et al., 1989, 1990). High-resolution SeaMARC-IA sidescan sonar images display along-strike reversals in vertical separation and a very straight trace, characteristic of strike-slip faults. Seismic reflection and magnetics data show 75-100 m of vertical basement separation across the fault. Using seafloor channels and a ridge that are crosscut by the fault, we calculate between 300 and 2500 m of left-lateral separation along the fault (Appelgate et al., 1991). Structural and stratigraphic constraints on the offset of the late Pleistocene channel shown in figure IB result in a Holocene slip-rate of between 5 and 11 mm/yr (Appelgate et al., 1991; Goldfinger et al., 1991). Isopach maps of the pre-faulting abyssal plain sediments surrounding Fault A indicate these acoustic units are offset 5-6 km by the fault (Goldfinger et al., 1991). Faulting began 1.0 to 0.6 Ma, which gives an average rate of slip of 5-9 mm/yr, similar to the Holocene rate. Reconstruction of erosional events within the channel that crosses this fault (Fig. IB), using carbon-14 dating of sandy turbidites cored within the channel, will further constrain the latest Pleistocene/Holocene rate of slip.
Fault A can be traced eastward onto the initial deformation front (marginal ridge) of the
543

III.l
accretionary wedge (Fig. 1 A, structural reentrant), where it is expressed as a set of splays that breach the initial thrust ridge and adjacent structural basin to the east. Southeasterly-trending gullies (fault-controlled zones imaged in sidescan) along the seaward face of the deformation front contain live chemosynthetic-type clams and tube worms as well as methane-derived carbonate slabs and crusts, which are evidence of both past and present fluid venting along the fault zone. In situ displacements of the strata and numerous structures (slickensides and mullions, fractured rocks, and veins/webs) show the extensive disruption and fluid movement through the sandstones and mudstones comprising the accretionary wedge. All data indicate that the strike-slip fault is presently active where it cuts across the main deformation front. Multichannel (144 channels) seismic records made across the fault on the abyssal plain show stratigraphic displacement throughout the sedimentary section and display flower structures typical of strike-slip faults. Small offsets of the basaltic basement appear to be local and may be due to the strike-slip juxtaposition of local variations in the basement surface. Deep seismic reflections in abyssal-plain sediments show vertical separation, which also implies basement involvement. Faults A and B are associated with north-plunging, anticlines in the abyssal plain a few kilometers seaward of their intersections with the deformation front (Figs. 1 A,2; Goldfinger et al., 1990). The southern flanks of both anticlinal structures are truncated by splays of the strike-slip faults in complex positive flower structures. Methane-derived fluids are venting along the anticlinal structures and faults, indicating-they are active (Kulm et al., 1989).
Faults B and C offset the main deformation front in a left-lateral sense (Figs. 1A,2). Fault B occurs at a major change in vergence direction of the thrust sequences from seaward vergence to the south and landward vergence to the north. This vergence change occurs along the fault as it extends eastward into the accretionary wedge, implying that the interaction of the strike-slip fault with the accretionary wedge structures may induce changes in vergence direction. This is further supported by seismic interpretation of the intersection of fault A with the deformation front. In the zone between the splays of fault A, a local vergence change from landward to seaward occurs (Fig. 1A).
Catastrophic Events: Great Earthquakes
Turbidity-current events have been used to demonstrate the near-term hazard of great earthquakes on the Cascadia subduction zone off Oregon and Washington (Adams, 1990). To further evaluate this hazard, several gravity cores were collected adjacent to active faults on the abyssal plain and at the foot of headless submarine canyons which cut into the deformation front (Fig. 1 A). The cores contain from 1 to 12 turbidites. High-resolution radiolarian biostratigraphy and radiocarbon dating indicate that the sediments in all cores are younger than 15,000 yrs. B.P (i.e., post-glacial). Radiocarbon dating of a 2.5 m-long turbidite-bearing core (W7905A-136GC) on the abyssal plain produced ages of 6,580 ±110 and 10,460 ±130 yrs B.P. (before 1950 A.D.) at stratigraphic intervals of 139 cm and 227 cm, respectively. Six turbidites occur in the upper interval and indicate a recurrence interval of one turbidite every 1,096 yrs and five turbidites in the lower interval indicate one turbidite every 776 yrs on the average. A total of 12 turbidites occur in this core. This core and three others in the vicinity that contain turbidites are located in the middle of a 580 km-long gap (Adams, 1990) between the apparently synchronous deposition of turbidites in Cascadia deep-sea channel and Astpria Canyon, near the Columbia River, and turbidite deposition to the south on the abyssal plain near Cape Blanco.
We have obtained a preliminary date for the time of collapse of one of the largest slumps found along the initial deformation front off northern Oregon. The debris pile from the 32 km3 slump (Fig. 1A, labeled "10-15 ka slump") rests upon a seismic reflector on the abyssal plain that is essentially coincident with the seafloor north and south of the pile, with no onlap from turbidite sedimentation. A core 1.55 m-long taken on top of this debris pile contains only hemipelagic sediment (Fig. 1 A, labeled "core"). Radiolarian biostratigraphy indicates an age younger than 15,000 years B.P. for the oldest sediment in this core. A calibrated radiocarbon date of 10,300
544

III.l
±150 yrs B.P. (before 1950 A.D.) was obtained near the bottom of this core to confirm the biostratigraphic age. Using Holocene hemipelagic and Pleistocene turbidite sedimentation rates and high-resolution 3.5 kHz and multichannel seismic records across the debris pile, we estimate an age of 10,000-24,000 yrs B.P. for the slump. If this catastrophic slump was associated with a large earthquake, it occurred during latest Pleistocene time.
Active Fault Zones: Accretionary Wedge and Forearc Basins
Faults A and B can be traced 120 km landward (southeast) of the initial deformation front, across the continental slope (accretionary wedge) and onto the inner continental shelf (Fig. 2). They both displace strata of probable late Pleistocene to Holocene age on the shelf, and project onshore near Cape Foulweather and Alsea Bay, respectively (Goldfinger et al., 1990). Faults C, D, and the other four significant faults presently under investigation off central and northern Oregon (44°-46°N) also cut strata of the same age and are traced onto the middle to inner continental shelf. These faults are recognized as strike-slip structures on the basis of offset fold axes, sigmoidal bending of fold axes, linear scarps, and offset of the shelf break and slope terrace break in map view. Mismatched stratigraphy, apparent reverse drag, and truncation or repetition of structures characterize the seismic sections.
Extensive folding of late Pleistocene to Pliocene sediments also occurs on the upper slope and shelf to within a few kilometers of the coast. Two styles of folds are present: fault-parallel folds, which are found in close proximity to the throughgoing strike-slip faults, and folds striking 300° to 340°, averaging about 310°-320°. The fault-parallel folds are apparently related to a convergent component across the strike-slip faults, a relation observed in some of the seismic-reflection data. The NW-srriking folds are close to being normal to the plate convergence direction (055°-071° Riddihough, 1984; DeMets et al., 1990), and are compatible with the regional tectonic setting of oblique plate convergence.
The age of deformation related to these structures is somewhat problematic in the inshore areas. However, some of the folds and faults deform the sea floor in water depths between 30 and 100 m., and many others show stratigraphic evidence of growth in the uppermost reflectors. A high percentage of the folds in figure 2 are active on the basis of scarps formed by flexural-slip faulting during growth of the structures and stratigraphic thickening or thinning in fold axes. Flexural-slip faulting is very common on the Oregon shelf and is well documented onshore in the South Slough syncline of the Coos Bay area (Mclnelly and Kelsey, 1990; Fig. 2, see inset for location). The observed flexural-slip-fault scarps in relatively shallow water indicate activity on these faults subsequent to Holocene sea-level rise, and therefore Holocene downwarping of the synclines. Flexural-slip fault scarps presently offset the sea floor in water depths as shallow as 60 m and are well-preserved despite this wave action. These scarps are developed in strata of probable Pleistocene and Holocene age, not older rocks in which erosional hogbacks might develop. Most eustatic sea level curves indicate that the last glacial lowstand would have flooded these fault scarps about 8,000 to 10,000 years ago, after which the scarps would have passed through the surf zone and would have been smoothed by wave-base erosion. We conclude that these scarps must post-date their residence time in the surf zone at about 8,000 to 10,000 years ago.
A significant result of the mapping of these offshore and nearshore folds and faults has been the discovery that many active synclines, both fault-parallel and otherwise, project onshore into coastal bays, some of which show evidence of coseismic subsidence of marshes. At the present time, Nehalem, Tillamook, Netarts, Siletz, Nestucca, Yaquina, Alsea, and Coos bays all appear to be sites of active downwarping in synclinal axes (Fig. 2). Additionally, several of the fold axes and faults show a good correlation with previously mapped faults and folds onshore, although the ages of the onshore structures are not independently known. A good example of this correlation occurs at Tillamook Bay, where an onshore left-lateral fault mapped by Niem and
545

III.l
Niem (1985) lies on trend and has the same sense of vertical and horizontal displacement as an active left-lateral fault mapped on the shelf to within 4.6 km of the coast. Downwarping of Pleistocene terrace deposits at Yaquina and Siletz Bays supports a correlation between active offshore synclines and some of Oregon's coastal bays
Reports (also cited in text)
Appelgate, B, Goldfinger, C. , MacKay, M.E., Kulm, L.D., Fox, C.G., Embley, R.W., andMeis, P.J., 1991. A left-lateral strike-slip fault seaward of the central Oregon convergent margin, Tectonics (submitted).
Goldfinger, C, Kulm, L.D., Yeats, R.S., Appelgate, B., MacKay, M.E. and Moore G.F.,1991. Transverse structural trends along the Oregon convergent margin: Implications for Cascadia earthquake potential and crustal rotations, Geology (submitted).
Goldfinger, C., Mackay, M., Kulm, L.D., and Yeats, R.S., 1990, Neotectonics and possible segmentation of the Juan de Fuca plate and Cascadia subduction zone off central Oregon (abstr.): EOS, Trans. Am. Geophys. Union, v. 71, p. 1580.
MacKay, M.E., Moore, G.F., Cochrane, G.R., Moore, J. C., and Kulm, L.D., 1991.Landward vergence and oblique structural trends in the Oregon margin accretionary prism: Implications and effect on fluid flow, Earth and Planetary Science Letters (submitted).
References Cited
Adams, J., 1990, Paleoseismicity of the Cascadia subduction zone: evidence from turbidites off the Oregon-Washington margin: Tectonics, v. 9, 569-583.
Appelgate, T.B., Kulm, L.D., Embley, R.W., Fox, C.G., 1989, Surficial structure of thecentral Oregon convergent margin: results from a SeaMARC-lA sidescan sonar survey (abstr.): EOS, Trans. Am. Geophys. Union, v. 70, p. 1345.
DeMets, C., Gordon, R.G., Argus, D.F., and Stein, S., 1990, Current plate motions: Geophysical Journal International, v. 101, p. 425-478.
Goldfinger, C., Appelgate, T.B., Kulm, L.D., and Yeats, R.S., 1989, Sidescan sonar imaging of probable active faults on the Juan de Fuca plate adjacent to the central Oregon continental margin (abstr.): EOS, Trans. Am. Geophys Union, v. 70, p. 1329
Kulm, L.D., Appelgate, T.B., and Fox, C., 1989, Sidescan survey of structures and fluid vent sites on the central Oregon margin and subducting Juan de Fuca plate (abstr.): EOS, Trans. Am. Geophys. Union, v. 70, p. 1345.
Mclnelly, G.W. and Kelsey, H.M., 1990, Late Quaternary deformation in the Cape Arago-Bandon region of coastal Oregon as deduced from wave-cut platforms, Jour. Geophys. Res., v. 95, p. 6699-6713.
Niem, A.R., and Niem, W.A., 1985, Oil and gas investigation of the Astoria basin, Clatsop and northernmost Tillamook counties, northwest Oregon, Oregon Department of Geology and Mineral Industries, Oil and Gas Investigation No. 14.
Riddihough, R.P., 1984, A model for recent plate interactions off Canada's west coast: Canadian Journal of Earth Sciences, v. 14, p. 384-396.
546
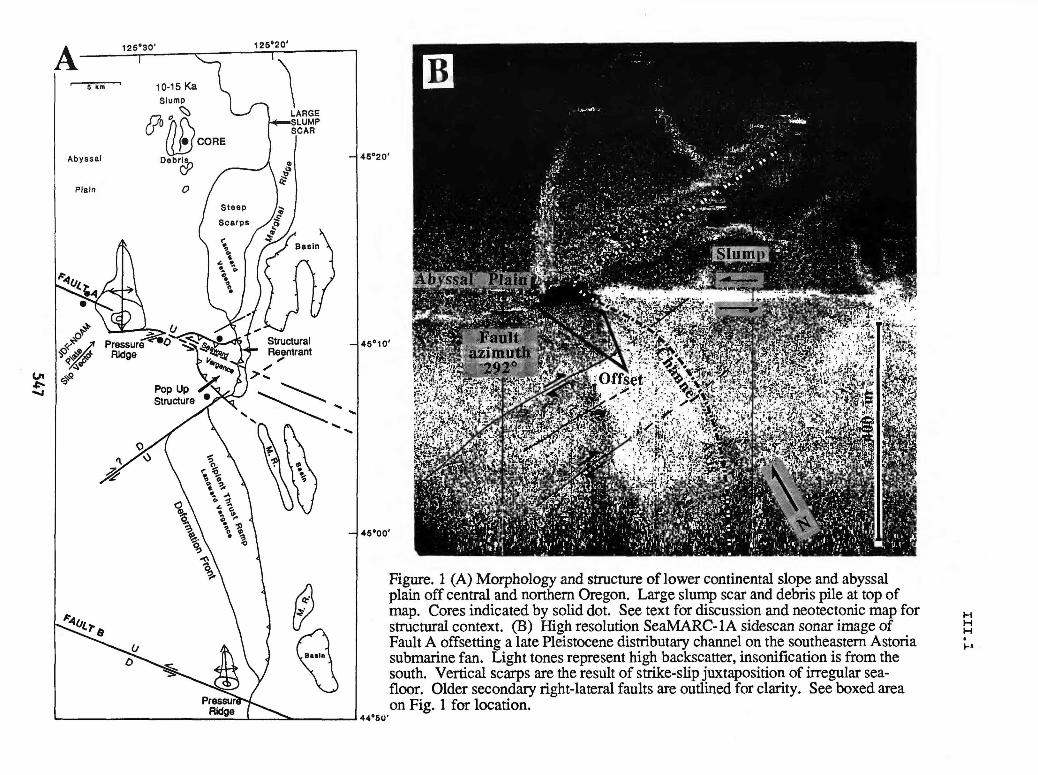
- 45'20'
- 45°10'
- 45*00'
44"60'
Figure. 1 (A) Morphology and structure of lower continental slope and abyssal plain off central and northern Oregon. Large slump scar and debris pile at top of map. Cores indicated by solid dot. See text for discussion and neotectonic map for structural context. (B) High resolution SeaMARC-lA sidescan sonar image of Fault A offsetting a late Pleistocene distributary channel on the southeastern Astoria submarine fan. Light tones represent high backscatter, insonification is from the south. Vertical scarps are the result of strike-slip juxtaposition of irregular sea- floor. Older secondary right-lateral faults are outlined for clarity. See boxed area on Fig. 1 for location.
H H H M

III.l
Tillamook Bay
ietarts Bay
WASHINGTON
/^Columbia River
45°i
Yaquina Bay
44°30f-
Alsea Bay
125?30'FAULT Bar and ball on downthrown side (where known). Arrows indicate relative motion. Dotted where concealed, dashed where inferredTHRUST FAULT Sawteedi on upper plate. SCARP Ticks face downslope
* SYNCLINE Arrows indJcatephinge- ANTICLINE ^ SUBMARINE CHANNELS ' SHELF EDGE
Figure 2. Structure map of the northern and central Oregon margin. Most structures cut or deform the sea floor. The deformation front is a thrust fault south of Fault B, and the base of a seaward dipping ramp north of Fault B. SB = slope break; T = Tillamook Bay fault. See text and legend for explanation.
548

III.l
Hazard potential and paleoseismic implications ofliquefaction-induced landslides along the
Wasatch Front, Utah
Agreement No. 14-08-0001-G2058
Mike Lowe, Kimm M. Harty, and Gary E. ChristensonUtah Geological Survey606 Black Hawk Way
Salt Lake City, Utah 84108
(801) 581-6831
ABSTRACT
The object of this research study is to conduct geologic investigations of fifteen Late- Pleistocene/Holocene liquefaction-induced lateral-spread and flow landslides along the Wasatch Front, Utah. Engineering studies indicate that much of the Wasatch Front is underlain by saturated sandy sediments which have a high potential for liquefaction during earthquakes. It is impractical to preclude development in these high-liquefaction potential zones because they are areally extensive and liquefaction is not generally a life-threatening hazard. However, large slope failures accompanying liquefaction present a greater hazard, and require a different planning approach. At present, development is proceeding with little consideration of the hazards due to liquefaction-induced landslides, partly because no evidence is available that indicates that the existing slope failures have been reactivated by earthquakes occurring after the initial failure, and partly because the potential for failure elsewhere on previously unfailed slopes is little known. If recurrent movement can be shown to take place on the landslides, local governments are more likely to avoid development on these features and adjacent similar slopes, or look for an area- wide mitigation strategy to reduce the risk.
We propose to date the timing of liquefaction-induced slope failures as closely as possible, infer the geologic and hydrologic conditions under which they originally occurred, determine if there is evidence for recurrent movement, evaluate failure type (lateral spread versus flow failure; extent of internal deformation), and assess the potential for future movement of the landslides during earthquakes. To assess the timing of initial and possible subsequent movements of the landslides and to help determine failure types, we will conduct a thorough, systematic study of geologic and geomorphic aspects of these slope failures and subsidiary structures. The study will involve primarily surficial geologic mapping of the slope failures and surrounding Quaternary deposits, and geomorphic mapping of landslide features. Radiocarbon dating supplemented with well-documented Great Salt Lake and Lake Bonneville lake-level chronologies and associated stratigraphic relationships will be the principle means of determining the approximate ages of the slope failures. Landslide scarps will be profiled for relative age comparisons. Trenches will be excavated across main and minor scarps to look for colluvial-wedge stratigraphy resulting from initial and recurrent movements on the landslides, in toe areas to date the over-ridden soil/sediment, and in closed depressions to collect material for dating from basal layers of pond deposits. Holocene Great Salt Lake lake-level chronology will be used to reconstruct hydrologic conditions at the time of failure.
The objective of the proposed project is to assess the hazards presented by liquefaction-induced landslides, and the need for consideration of such hazards in land-use planning. It is anticipated that some of the existing landslides occurred when climatic conditions were wetter than the present, and that many of these landslides are flow failures rather than lateral spreads as currently mapped. In addition to helping reduce earthquake-induced landslide hazards in Utah, methods developed may prove valuable for evaluating similar problems elsewhere.
549

III.l
TEMPORAL AND SPATIAL BEHAVIOR OF LATE QUATERNARY FAULTING, WESTERNUNITED STATES
9950-04540
Michael N. MachetteBranch of Geologic Risk Assessment
U.S. Geological Survey, Box 25046, MS 966Denver, Colorado 80225
(303) 236-1243
PURPOSE OF PROJECTTo define regional variations in the time-space partitioning of paleoseismic activity in the late Quaternary as a guide to understanding the accumulation and release of strain on faults in the Western United States. This project will serve as an umbrella for diverse but interrelated aspects of paleoseismicity in the Western United States. We will study selected faults that are critical to interpreting the paleoseismology and neotectonics in regions of active faulting. Our research will apply paleoseismologic studies to important problems at three different scales: (1) refine methodologies for dating fault movements that are applicable to a wide variety of tectonic problems and areas, (2) examine the long-term behavior and interaction of faults in a broad region (ca. 20,000 km2) that are exposed to the same regional stress field, and (3) study the time-space distribution of strain accumulation and release in the upper crust on a regional (province-wide) scale. Project members are R.C. Bucknam, AJ. Crone, K.M. Haller, and M.N. Machette.
INVESTIGATIONS1. Haller and Machette started compilation of a database of Quaternary faults in the Western
United States. Their first priority is to compile/generate data for a neotectonic transect of the northern Basin and Range province from the Wasatch fault zone to the Sierra Nevada frontal fault zone. The limits of our transect are 39° and 41°N. and 111° and 120°W. This east-west strip transect allows us to build upon the Wasatch fault zone study of Machette and others and I°x2° quadrangle mapping in Utah by BGRA personnel (Anderson, Barnhard, and Bucknam). Thus, our main concern for completing a systematic fault study is with Nevada; previous mapping by Barnhard (Elko I°x2°), Wallace (Winnemucca I°x2°), and Bell (Reno I°x2°) can be used with the addition of specific age data for faults. Haller completed the fieldwork for the Ely I°x2° quadrangle last summer and has been analyzing this data during the reporting period. This leaves the Lovelock and Millett I°x2° quadrangles as our main mapping objectives for the next 2 years. We will be cooperating with personnel of the Nevada Bureau of Mines (John Bell and associates), the Center for Neotectonics (Steve Wesnousky and associates), and Kelvin Berryman of the New Zealand Geological Survey (visiting scientist status, FY 92?).
2. Crone and Machette (BGRA) completed their field studies of two historical surface-rupturing intraplate earthquakes in Australia as part of their USGS Gilbert Fellowship (FY 90-91) to study the paleoseismic history of intraplate faults. Their studies focused on the 11-km-long, boomerang-shaped scarp formed by the 1986, Ms 5.8 Marryat Creek earthquake in South Australia, and the 34 km of scarps formed by the 1988 series of earthquakes (Ms 6.3-6.7) near Tennant Creek, Northern Territory. They are collaborating with J. Roger Bowman (Australian National University, Canberra), who is studying the seismology of both earthquakes.
550

III.l
Crone and Machette spent about one half of the reporting period completing fieldwork and analyzing data from their study of the Marryat Creek and Tennant Creek earthquakes. The main objective of their research is to identify and date prehistoric ruptures on these thrust faults in order to establish recurrence intervals for intraplate surface-rupturing earthquakes. They excavated two trenches across the Marryat Creek fault scarps and four trenches across the Tennant Creek fault scarps, and have completed lithologic/structural logs of the trenches, detailed site maps, and plots of scarp profiles. A rough draft of a manuscript describing the results of their field studies is nearly completed, but critical age determinations are still pending.
3. Bucknam continued photographic monitoring of the short-term natural degradation of the 1983 Borah Peak fault scarps using precision close-range photogrammetry that was initiated in 1985. The objective is to see what relation exists between climatic parameters and rates of scarp collapse and retreat. Repeat photographs and the USGS PG-2 computer-assisted analytical plotter are being used to map selected parts of scarps and to measure the volume and rate of retreat.
RESULTS1. Haller, assisted by L.A. Bradley and M.N. Machette, completed field reconnaissance of late
Quaternary faults in the Ely, Nev., I°x2° quadrangle. These data are being compiled using the USGS's PG-2 analytical plotter and aerial photographs (for digitization at a scale of 1:24,000 using ARCINFO) and publication at 1:250,000 scale. Most of the fault compilations at 1:24,000 scale have been completed; digitization awaits installation of a multiuser ARCINFO license, implementation of Ala Carte (Macintosh-based front end for ARCINFO), and acquisition of new Ethernet communications software (Pathways).
Most of the late Quaternary range-front normal faults in the Ely I°x2° quadrangle flank the eastern sides of the major mountain blocks. Comparison of the morphology of scarps on alluvium in this quadrangle and scarps of known age in Utah (Bonneville, Drum Mountains, and Fish Springs) indicates that none of the Ely scarps are of unequivocal Holocene age. The eastern half of the quadrangle is dominated by latest Pleistocene (10-30? ka) faulting and the west half by older faulting (>30 ka?). Faults in the eastern half of the Ely quadrangle are expressed by nearly continuous scarps, either on bedrock or on alluvium. One of the more recently active structures, the 100-km-long Schell Creek Range fault is characterized by younger faulting (-15 ka) along the middle part of the fault and older faulting at its ends. Scarps along the entire length of the fault record numerous faulting events, although the timing of these older events cannot be estimated. It appears that several other faults in the eastern half of the quadrangle have had faulting events roughly coincident (latest Pleistocene) with those along the Schell Creek Range. In contrast, the faults in the western half of the quadrangle are characterized by discontinuous eroded scarps, most of which are on bedrock or at the bedrock/alluvium interface. Those scarps that are on alluvium are subdued (highly degraded) and faulting displaces only the older deposits along the range front, which are assumed to predate the most recent pluvial episode.
In contrast, fault scarps in the Millett I°x2° quadrangle appear to be generally younger than those in the Ely I°x2° quadrangle on the basis of initial aerial-photo reconnaissance and unpublished scarp morphology data of Pearthree and others (1990; USGS Contract Report 14- 0001-08-G1360). The distribution of scarps is denser in the Milieu quadrangle, and several faults cut deposits related to the most recent pluvial episode (latest Pleistocene, ca. 12-15 ka). Some of the longer range-front faults, such as the Toyaibe, appear to be segmented. In
551

III.l
addition, frontal faults of the Cortez, Eastgate, Simpson, Toyaibe, and East Shosone Ranges and piedmont scarps of the Crescent Valley appear to have been active in the Holocene. Thus, the abundance of scarps, their often fresh appearance, and their crosscutting relations with young lake deposits indicate a much higher level of paleoseismic activity in the Millett I°x2° quadrangle than in the Ely I°x2° quadrangle. This relation probably becomes even more pronounced as one goes westward into the Central Nevada Seismic Belt (Fairview Peak, Dixie Valley, and Pleasant Valley faults; Reno I°x2° quadrangle). If we were to pick the region of minimum paleoseismic activity in the Nevada part of the transect, it would probably include the north-south corridor between Eureka and Ely. However, even this region has relatively abundant late Quaternary fault scarps compared to the western part of Utah. We speculate that the position of the Central Nevada Seismic Belt and the surrounding area of relatively high paleoseismic activity (in relation to the province as a whole) reflects the loci of modern, active extension that is concentrated along the western margin of the province. On the other hand, the unusually high level of activity on the Wasatch fault zone (with respect to adjacent structures) represents a trailing edge effect as the Basin and Range province moves westward from the Colorado Plateaus and Rocky Mountains provinces. Further development of this simple model requires completion of a systematic mapping of Quaternary faults in the transect and analysis of age data to delineate spatial and temporal patterns and timing of Quaternary faulting.
3. At this time, we only have preliminary results from our Gilbert Fellowship research. The trench stratigraphy at the two Marryat Creek sites and at two of the four Tennant Creek sites show that the historic earthquakes reactivated ancient faults. However, there was no clear evidence of fault-scarp derived colluvium in the Quaternary deposits in any of the six trenches, and there is no compelling geomorphic evidence of prehistorical faults scarps at any of the sites. These relations indicate that the historical earthquakes were associated with faults that had ruptured in the past, but that the recurrence interval for surface-rupturing earthquakes on these faults is probably measured in time increments of at least tens of thousands of years and possibly hundreds of thousands of years or more (millions of years?). Dating the Quaternary deposits in the trenches will provide additional insight into the minimum time of the prehistorical earthquakes on these faults. Samples collected during the fieldwork are being analyzed for thermoluminescence (TL) dating (John Prescott, University of Adelaide, Australia), for Electron Spin Resonance (ESR) dating (Kazuhiro Tanaka, Central Research Institute of Electric Power Industry, Abiko, Japan; Hugh Millard, USGS, Denver), and Uranium-series dating (Dan Muhs, USGS, Denver).
REPORTSBirkeland, P.W., Machette, M.N., and Haller, K.M., 1991, Soils as a tool for applied Quaternary
geology: Utah Geological and Mineral Survey Miscellaneous Publication 91-3,63 p.
Crone, A.J., and Haller, K.M., 1991, Segmentation and the coseismic behavior of Basin-and- Range normal faults Examples form east-central Idaho and southwestern Montana, U.S.A., in Hancock, P.L., Yeats, R.S., and Sanderson, D.J., special eds., Characteristics of active faults (Special Issue): Journal of Structural Geology, v. 13, no. 2, p. 151-164.
Machette, M.N., Personius, S.F., Nelson, A.R., Schwartz, D.P., and Lund, W.R., 1991, The Wasatch fault zone, Utah Segmentation and history of Holocene earthquakes, in Hancock, P.L., Yeats, R.S., and Sanderson, D.J., special eds., Characteristics of active faults (Special Issue): Journal of Structural Geology, v. 13, no. 2, p. 137-150.
552

III.l
DATABASE MANAGEMENT
9910-03975
Charles S. Mueller Branch of Engineering Seismology and Geology
U.S. Geological Survey345 Middlefield Road, MS 977Menlo Park, California 94025
415/329-5646
Investigations
1. Develop new techniques for playback, processing, management, and export of seismic waveform data, with emphasis on large aftershock datasets collected with portable digital event-recording seismographs (e.g., GEOS).
2. Design and implement relational databases for strong-motion and aftershock data.
Results
1. New datasets played back, processed, and archived:Aftershocks of the 17 October 1989 Loma Prieta earthquake archived on CD-ROM.
Exported to:Geomatrix Consultants Woodward-Clyde Consultants Cornell University Purdue University Stanford University University of Texas University of Utah University of Nevada Reno Saint Louis University University of Wisconsin Pacific Engineering Japan Geological Society Electric Power Research Institute New Zealand Division of Land and Soil Sciences California Division of Mines and Geology University of Southern California University of California Davis University of California Berkeley University of California-^Santa Barbara University of California-^Santa Cruz
Reports
Mueller, G, and Glassmoyer, G., 1990, Digital recordings of aftershocks of the 17 October 1989 Loma Prieta, California, earthquake: U.S. Geological Survey Open-File Report 90-503, 147 p. with CD-ROM.
04/91 553

III.l
Element 1.1
EARTHQUAKE RECURRENCE AND QUATERNARY DEFORMATION IN THE CASCADIA SUBDUCTION ZONE, COASTAL OREGON
9950-04180
ALAN R. NELSON and STEPHEN F. PERSONIUS
U.S. Geological SurveyBranch of Geologic Risk Assessment
MS 966, Box 25046Denver, CO 80225
(303) 236-1596; FTS 776-1596
INVESTIGATIONS
The project consists of two components: Nelson's study of coseismic changes in late Holocene sea level as revealed by salt marsh stratigraphy, and Personius1 study of fluvial terrace remnants along major Coast Range rivers to determine styles and rates of late Quaternary deformation.
RESULTS
Below are abstracts from four recently submitted papers.
Differing Holocene sea-level histories
The south-central Oregon coast lies about 70-90 km arcward of the leading edge of the overiding North American plate in the central part of the Cascadia subduction zone. Tectonic movements during subduction of the Juan de Fuca plate beneath the North American plate must have affected the rate of relative sea-level rise in estuaries along this coast, but no regionally consistent stratigraphic record of sea-level change has been found. Instead, protected tidal inlets in four estuaries along the south-central Oregon coast contain tidal-marsh stratigraphic sequences that suggest contrasting styles of sea-level rise during the late Holocene. The record of gradual relative sea-level rise in the northern part of the study area (about 1.6 mm/yr since 2 ka in the Siuslaw River estuary) indicates there have been no large (>0.5 m), sudden changes in relative sea-level throughout the region, such as have occurred along subduction zone coasts during some historic great earthquakes. Regional coseismic subsidence events are not recognized in the southern part of the study area either, but the stratigraphic record of abrupt transgressive and regressive overlap boundaries in marsh sequences, especially in western Coos Bay, is consistent with local coseismic subsidence and uplift events on faults and folds in the active accretionary wedge of the North American plate.
Radiocarbon dating submergence events
Radiocarbon ages on different materials from buried tidal-marsh soils near Coos Bay, Oregon range over many hundreds of years. This range in ages combined with uncertainties about the age
554

III.l
relations among dated materials in the same soils and the times of soil submergence and burial produce large errors in dating the coseismic subsidence events that some soils represent Combined errors on calibrated conventional 14C ages and recurrence times for submergence events of about the same length (150-500 years) preclude 14C correlation of most buried soils along the southern Oregon coast Only where long time intervals (>700 years) separate events, or where suites of ages above and below the tops of soils agree, can events be correlated by conventional 14C methods. At least a two to three-fold increase in the precision of 14C dating buried soils is needed to determine the extent of zones of coseismic subsidence produced by past great plate-boundary earthquakes in this part of the Cascadia subduction zone.
Modern marsh foraminiferal zones
Foraminiferal assemblages from three surface transects across estuarine marshes on the central Oregon coast reflect vertical floral zones based on vascular plants. Discriminant analysis distinguishes assemblages of modern mudflat, low marsh, and high marsh zones using the types of percentage data found in fossil assemblages. Upland samples are barren of foraminifera. The high marsh is dominated by Trochammina macrescens f. macrescens and T. inflata. The highest part of the high marsh, above mean higher high water, is usually marked by increases in the percentage of T. inflata and Haplophragmoides sp. Miliamminafusca is found throughout the high and low marsh. The low marsh may be divisible into two subzones: an upper subzone with T. macrescens f. macrescens and T. inflata and a lower subzone with Ammotium salsum and Ammobaculites exiguus. Mudflat assemblages contain Reophax nana, M.fusca, A. salswn, A. exiguus, and low numbers of calcareous species. Assemblages resemble those studied in other cool-temperate tidal marshes, but the elevational range of the high marsh foraminiferal zone in Oregon is greater than the range of equivalent zones in the tidal marshes of eastern North America. Large ranges on low and high marsh assemblage zones limit the precision with which changes in paleosea levels can be estimated from fossil assemblages in Oregon.
Deformation of fluvial terraces
Fluvial terraces are generally poorly preserved along most rivers in the Oregon Coast Range, but some terrace sequences along the Umpqua, Smith, Siuslaw, and Siletz Rivers can be correlated well enough to provide information about their age and origin. Most terraces on inland reaches of these rivers are underlain by a bedrock strath and have a sequence of cover sediments consisting of a 1- to 3-m-thick basal deposit of sandy pebble channel gravel overlain by a 2- to 7-m-thick deposit of overbank sand and silt Terraces generally converge near the coast, where they consist of finer- grained estuarine sediment
The ages of some terraces in the Coast Range were determined by radiocarbon dating of detrital charcoal and wood, experimental thermoluminescence (TL) dating of fluvial sediment, and tentative correlations with marine terraces. Radiocarbon analyses on charcoal and wood from the silty overbank sediments in the lowest continuous terrace along most Coast Range rivers yielded generally consistent early Holocene ages (7,000-10,000 yr BP). The regional distribution and consistent age of this terrace indicates that climatic change was probably the cause of stream aggradation in latest Pleistocene and early Holocene time. Aggradation is thought to have been related to increased colluviation brought on by the warmer, drier early Holocene climate and perhaps to base level rise, rather than to an influx of glacial outwash sediment. Numerous nonsynchronous terrace remnants are present at various elevations along Coast Range streams, but these terraces were probably formed as a result of "complex responses" to such events as periodic floods or isolated landslides, and do not represent long-term changes in river behavior.
555

III.l
Older terrace remnants are present at elevations up to 200 m or more above present river levels. The stratigraphic sequences exposed in the older terraces are essentially identical to the lower terraces, although clay-rich, deeply oxidized soil profiles on the higher terraces have obscured some of the original textures and bedding. TL age determinations on older terrace sediments from the Umpqua and Smith Rivers generally increased in age with increasing terrace height and ranged from about 15 ka to >200 ka. Ages of older fluvial terraces near the coast were also estimated by tentatively correlating them to poorly preserved marine terraces and assumed correlations to the marine oxygen-isotope record. Although poor terrace preservation prevented definitive correlation, reasonable projections of stream gradients similar to the modern rivers support correlation of some older fluvial terraces to marine terraces and middle to late Pleistocene sea-level high stands. The continuous early Holocene terraces, which converge near sea level near the coast, probably are modern analogs of these older fluvial terraces.
REPORTS
Nelson, A. R., and Personius, S. F., The potential for great earthquakes in Oregon and Washington-- An overview of recent coastal geologic studies and their bearing on segmentation of Holocene ruptures, central Cascadia subduction zone, in Rogers, A. M., Kockelman, W. J., Priest, G. R., and Walsh, T. J., eds., Assessing and reducing earthquake hazards in the Pacific Northwest: U.S. Geological Survey Professional Paper 1560, (in press), 66 ms. p., 7 figs.
Nelson, A.R., and Jennings, A.E., 1991, Foraminiferal assemblage zones in Oregon tidal marshes- Relation to marsh floral zones and sea level: Journal of Foraminiferal Research, v. 21, (in press), 53 ms. p., 10 figs. 2 tables.
Nelson, A.R., Constrasting styles of late Holocene relative sea-level change revealed by tidal-marsh stratigraphy, south-central Oregon coast, Cascadia subduction zone, in Fletcher, C.P., and Wehmiller, J.F., eds., Quaternary coasts of the United States Lacustrine and marine systems: SEPM-IGCP Special Publication, (submitted), 35 ms. p., 6 figs.
Nelson, A.R., Discordant 14C ages limit correlations of Holocene tidal-marsh soils in the Cascadia subduction zone, southern Oregon: Quaternary Research, (submitted), 34 ms. p., 5 figs.
Personius, S.F., Age and origin of fluvial terraces in the central Oregon Coast Range: U.S. Geological Survey Bulletin, (submitted), 68 ms. p., 35 figs., 2 tables.
556

III.l
Earthquake Intensities
14-08-0001-G1510
A.I. Qamar and R.S. LudwinGeophysics Program
University of WashingtonSeattle, WA 98195
(206) 543-8020
InvestigationsWe are compiling a data base of information on earthquakes prior to 1928 in Washing
ton and Oregon. The data base will allow us to improve the historical catalog by providing convenient access to existing earthquake catalogs, and will provide a framework for storage and retrieval of historical earthquake information. We will use a commercially available PC/Mac data base so that both existing catalogs and our improved catalog will be available to other investigators. We hope to eventually include events up until 1970, when the Wash ington Regional Seismograph Network was installed.
A number of catalogs of seismicity of Washington and Oregon exist; from Holden (1887), to the DNAG catalog (1990). Later catalogs are usually based on the earlier ones, with some corrections and additions, but usually with minimal review of original source material, and often without documentation or commentary on the sources of data for revi sions. The various catalogs generally cover somewhat different time periods or geographic areas. Over the years, attempts were made to quantify and condense the information, and to assign locations to the earthquakes for mapping purposes. These locations were some times based on minimal information, such as a single felt report. The DNAG catalog was made by compiling several earlier catalogs and, in addition to locations, supplies magnitudes estimated from maximum intensities. Small time discrepancies between the original sources have also caused multiple entries for a single earthquake to be introduced into the DNAG catalog.
The DNAG type of catalog, consisting of one summary line per earthquake, is inade quate to describe older earthquakes which lack instrumental data. Felt reports and descrip tions of damage are important sources of information for these earthquakes. For the pur pose of evaluating earthquake hazards, we are accumulating a file of information for each earthquake. We are now collecting and organizing information, and will make available information accessible. We have scanned nearly a dozen existing catalogs, and will soon begin compiling our data base. Each existing catalog (e.g. Holden, Townley and Alien, Bradford, DNAG) will form a table in the data base, which will include the verbatim event entries for events in Washington, Oregon, or southern British Columbia.
Once the existing sources have been compiled, we will begin work on correcting and improving the catalog. We will concatenate all the existing sources, and sort all events by reported occurrence time. Thus sorted, we can create a table for each event which refer ences all accounts of the event. We will be able to identify and correct duplicate entries, flag events which need further documentation, and cross-reference other earthquakes, if a sequence is reported. Additional material, such as newspaper or diary accounts, or refer ences to special investigations will also be included.
PublicationsLudwin, R.S. and Qamar, A.I., 1991 (abstract), Reevaluation of the 19th century
Washington and Oregon earthquake catalog using original accounts; the moderate sized earthquake of May 1, 1882, Seismol. Res. Lett. V. 62, p 52.
557

III.l
The Undrained Residual Strength of Cohesive Soils and Landslides During Earthquakes
Agreement No. 14-08-0001-G1953
Dr. Timothy D. StarkAssistant Professor of Civil Engineering2217 Newmark Civil Engineering Lab.
University of Illinois205 N. Mathews Ave.
Urbana, IL 61801
(217) 333-7394
Project Summary
A significant number of landslides have occurred in cohesive soils during earthquakes. Most notably, seven major landslides occurred during the 1964 Alaskan earthquake and all involved large masses of Bootlegger Cove clay. A recent re-evaluation of the Fourth Avenue slide in Alaska, showed that the surface lateral movements were either several feet or less than six inches. In areas where the movements were greater than six inches, it is postulated that the shear strength of the Bootlegger Cove clay was reduced to the residual value by undrained strain softening. Once the residual strength condition developed, several feet of lateral movement occurred.
The main objective of the research proposed was to investigate the undrained residual strength of cohesive soils and the occurrence of landslides during earthquakes. To achieve this objective, undrained ring shear tests are being performed on undisturbed specimens of the Bootlegger Cove clay. The results of the ring shear tests will be compared to the undrained shear strength values back-calculated for the Fourth Avenue slide, to estimate the strength mobilized at the time of sliding. The proposed investigation of the Fourth Avenue slide will greatly aid in the understanding of the magnitude of undrained strain softening which can occur during earthquake shaking.
Case histories involving lateral displacements during the 1989 Loma Prieta earthquake will also be investigated to confirm the findings from the Fourth Avenue slide analysis. Ring shear tests will be performed on specimens of San Francisco Bay Mud to measure the undrained strain softening characteristics and residual strength. The results of the ring shear tests will be compared to the undrained shear strength values back- calculated for the various case histories.
Summary of Research Results
The proposed undrained ring tests on undisturbed and remolded specimens of San Francisco Bay mud have already been conducted at various shear displacement rates and effective consolidation stresses of 100, 250 and 400 kPa. An electric variable speed motor
558

III.l
was connected to the Bromhead ring shear apparatus using a pulley system. The existing gear box system was disconnected so that shear displacement rates ranging from 20 to 890 mm/minute could be obtained using the pulley system. It can be seen from Figure 1 that the ratio of undrained residual strength to the undrained peak strength, termed the undrained residual strength ratio, decreases with increasing shear displacement rate. The undrained residual strength ratio decreases from 0.80 at a drained displacement rate of 0.019 mm/minute to 0.32 at undrained displacement rates greater than or equal to 465 mm/minute. These results indicate that Bay mud undergoes a drained strength loss of 20% from the peak to the residual value and an undrained strength loss of 68%.
Since the undrained residual strength ratio is at or near the minimum value at a displacement rate of 400 mm/minute, this rate was assumed to be representative of the undrained tests. Nine naturally occurring cohesive soils, some with different clay fractions, were also tested at a displacement rate of 400 mm/minute and a normal stress of 400 kPa. It can be seen from Figure 2 that the undrained residual strength ratio starts at a value of approximately 0.95 and decreases sharply to approximately 0.35 at a clay fraction of approximately 15%. The undrained residual strength ratio remains approximately equal to 0.35 for clay fractions greater than 15%. This data indicates that soils with a clay fraction of 15% or greater are susceptible to a large (60 to 70%) strength loss during rapid loadings. These results appear to have significant application to the occurrence of landslides in cohesive soils during earthquakes.
For comparison purposes, the drained residual strength for San Francisco Bay mud and the nine naturally occurring cohesive soils was also measured. The ratio of the undrained and drained residual strengths is shown in Figure 3. It can be seen that the ratio of the residual strengths has a value of approximately 1.0 for clay fractions less than about 5%. The ratio then decreases rapidly to 0.39 at a clay fraction greater than approximately
sul_residual strength for clay fractions between
70. ine rauo men decreases rapiuiy 10 u.jy ai a ciay rracuon greaier man approximately 5%. The ratio increases to approximately 1.0 at a clay fraction of about 40%. This iggests that the undrained residual strength is approximately 60% lower than the drained jsidual strength for clay fractions between 15 ana 30%.
From these observations it may be concluded that the undrained residual strength is 60-70% lower than the undrained peak strength and is also 50-60% lower than the drained residual strength for clay fractions between 15 and 40%. These results suggest that cohesive soils are susceptible to a significant strength loss during earthquakes and that slopes which have an adequate factor of safety based on the drained residual strength may be unstable during shaking if the clay fraction lies between 15 and 40%.
In summary, the initial results of this research have been very successful. The next step is to conduct undrained ring shear tests on the Bootlegger Cove Clay from the Fourth Avenue landslide. (It is anticipated that undisturbed samples of the Bootlegger Cove Clay from the Fourth Avenue Slide will be obtained during the week of July 7, 1991.) The ring shear results will be compared to the undrained shear strength values back-calculated for the Fourth Avenue slide to estimate the strength mobilized at the time of sliding. If these strengths are similar, it will provide an insight into the undrained strength mobilized during earthquakes, and thus the cause of landslides in cohesive soils during earthquakes.
559

in O\O
*8CO75 CO
CO
£o
150
t25
too
0.75
2 050
025
\ I I I I
0,01
Bay Mud Normal Stresses
100 kPa 250 kPa
A 400 kPa
0.1 1.0 10 100 1000
Shear Displacement Rate, mm/minute
Figure 1. Effect of Shear Displacement Rate on the Undrained Residual Strength of Bay Mud
H H H

Oi ON
£o>
ft15
es
o<D
'&
gth
Str
Pea
ai
150
QS
58
Data SourceCurrent Study Skempton (1985)
Displacement Rate * 400 mm/minute Normal Stress « 400 kPa
10 20 30 40 50 60 70 80
Clay Fraction, %
Figure 2. Relationship Between Undrained Residual Strength Ratio and Clay Fraction
H H H

Cn O> ho
D)
CO
75
w
"co
D)
I55"co
CO CD
QC
3.0
25
1.0
0.5
Data Source> Current Study
i Skempton (1985)
Displacement Rate = 400 mm/minute Normal Stress - 400 kPa
10 20 30 40 50 60 70 80
Clay Fraction, %
Figure 3, Relationship Between Undrained and Drained Residual Strengths
H H H

III.l
EXPERIMENTAL AND ANALYTICAL INVESTIGATIONS OFTHREE GRAVELLY SITES WHICH LIQUEFIED
DURING THE 1983 BORAH PEAK, IDAHO EARTHQUAKE
USGS 14-08-0001-G1779
Kenneth H. Stokoe, II, Jos6 M. Roesset and Ronald D. Andrus The University of Texas at Austin Department of Civil Engineering
ECJ 9.227Austin, Texas 78712
(512) 471-4929
Investigation
Gravelly soils have been generally considered in the past to not be susceptible to liquefaction. However, liquefaction of gravelly materials has been generated in several different earthquakes. Little information exists on the characteristics and field performance of these gravelly soils. The purpose of this two year study is to characterize gravelly sediments beneath three sites which liquefied during the 1983 Borah Peak, Idaho earthquake (Stokoe et al., 1988; Harder, 1988). Since there are no generally accepted guidelines for evaluating the susceptibility of soils which contain significant amounts of gravel, we plan to apply simplified liquefaction susceptibility procedures developed for sands to these gravelly sites, evaluate the usefulness of each procedure, and propose guidelines for the future application of these procedures to gravelly soils in other parts of the world. Liquefaction susceptibility of the gravelly sediments beneath each site will be evaluated analytically using both the cyclic stress and cyclic strain approaches.
During the first year of this project, we conducted a variety of field investigations at the Pence Ranch, Goddard Ranch and Larter Ranch liquefaction sites. The field work included drilling, seismic testing, trenching, in situ density testing and sampling. Drilling consisted of several CPT soundings, SPT boreholes, and BPT soundings. Seismic tests were performed by surface wave and downhole techniques. The SASW method requires no boreholes and thus is well-suited for undisturbed testing of gravel. Trenches were excavated across the lateral spread at Pence Ranch and the gravel bar at Goddard Ranch. In test pits, we conducted several 1.2-m (4-ft) ring density and sand cone density tests. Bulk samples were collected with the aid of a backhoe, just below the water table in the loosest zones.
563

III.l
Results
Work during this past period involved the reduction and compilation of much of the field data. Samples collected in boreholes and tests pits reveal that the sediments beneath the Pence and Goddard Ranch sites range from clean gravelly sand to sandy gravel, with less than a few percent fines, while the gravelly sediment beneath the Larter Ranch site contain about 10 percent fines. In the loosest gravelly sediments at each site, measurements of CPT tip resistance and SPT Neo were less than 50 tsf and 10 blows/ft, respectively. Minimal values of shear wave velocities were on the order of 120 m/sec (400 ft/sec).
Several of our findings at Pence Ranch have been summarized in a paper by Andrus et al. (1991), including the log of the trench excavated near the hay yard at Pence Ranch shown in Fig. 1. Sediments in the trench can be divided into silty sand fades (units A and A1) and sandy gravel fades (units B and C). Descriptions of each unit is summarized in Table 1. Units A and A1 form a cap of relative low permeability and varying thickness over the site. Liquefaction of the sediments below the trench and water table during the 1983 earthquake cause part of the ground to move northward, opening the major fissure shown in Fig. 1. Water carrying sand and gravel was ejected up through the major fissure onto the ground surface. As pore water pressures dissipated, the major fissure was filled with some of the ejecting sand and gravel. Minor amounts of water and sand flowed up to the ground surface through much smaller cracks (see Fig. 1). Unit A1, located so close to the water table and lying above very loose gravelly material, appears to have made this area most vulnerable to liquefaction and provides an explanation for the location of the major fissure.
REFERENCES
Andrus, R.D., Stokoe, K.H., II, and Roesset, J.M., (1991), "Liquefaction of Gravelly Soils at Pence Ranch During the 1983 Borah Peak, Idaho Earthquake," Fifth International Conference on Soil Dynamics and Earthquake Engineering, Karlsruhe, Germany, Sept. 23-26.
Harder, Jr., Leslie F., (1988), "Use of Penetration Tests to Determine the Liquefaction Potential of Soils During Earthquake Shaking," Ph.D. Dissertation, University of California, Berkeley, 565 p.
Stokoe, K.H., II, Andrus, R.D., Rix, G.J., Sanchez-Salinero, I., Sheu, J.C., and Mok, H.J., (1988), "Field Investigation of Gravelly Soils Which Did and Did Not Liquefy During the 1983 Borah Peak, Idaho, Earthquake," Geotechnical Engineering Report GR87-1, Civil Engineering Dept., The University of Texas at Austin, 206 p.
564

in ON in
SOUTH I
0Local Elevation Feet Meters
98-1
10 i
20 Feet Meters
30 i
40 i
10
96-
94-
92-
90 J
Major Fissure
n ' NORTH
Local Elevation Meters Feet
-29
-28
Hairline crack; filled with fine to medium sand
Hairline crack; filled with fine to medium sand
29-
SM
SW A1
X^ 7 X GP \v C sp
\"~~~*FC~Gttt -*?-.-- -/->- -
Bottom of Trench «^\/ A1 High angle
sand/siltcrossbeds
^ crossbeds
-98
-96
-94
-92
-90
Explanation
Uthologic contacts and unit designations; contacts dashed where gradational
Internal stratification
Gradation within unit; arrows \ point in direction of sediment
fining
Material type (based on the SM Unified Soil Classification System);
positioned at sample location
Fig. 1 - Log of Trench Excavated Near The Hay Yard At Pence RanchH H H

III.l
Table 1: Description of Trench Sediments at Pence Ranch
Unit A This unit is a dry to slightly damp siltya sand with gravel dispersedthroughout (SM)b. The finer fraction is very dark grayish brown (10 YR 3/2)c, nonplastic, and reacts strong to moderately with HCI. Deposit is largely loess that has been somewhat reworked by surface water and disturbed by burrowing animals. Thickness is about 0.1 to 0.8 m. Contact with lower unit A1 is gradational; Contact with lower units B and C is sharp.
Unit A1 Deposit grades upward from a sand with trace of siit (SW) to a silty sand (SM) with occasional small charcoal fragments. The finer fraction is dark grayish brown (10 YR 4/2), nonplastic, and does not react with HCI. In-place density is about 1.65 g/cm3 (103 Ib/ft3) and moisture is 11 to 16%. This unit is mainly a tow to very low flow regime, planar bed flow depositd . Thickness is about 0 to 0.8 m. Contact with upper unit B is sharp; contact with lower unit C is sharp to gradational.
Unit B This unit is a sandy gravel (GP) consisting of about 60% fine to coarse,hard, subrounded gravel with tow sphericity; 40% fine to coarse, hard, subangular sand; less than 1% dark grayish brown (10 YR 4/2) fines; less than 1% subrounded cobbles, maximum particle size 100 mm. The finer faction in the upper few feet reacts weakly with HCI. In-place density is about 2.19 g/cm3 (137 Ib/ft3) and moisture is 3%. Gravels are clast-supported (stone-on-stone) with a filled framework of sand to sand matrix-supported (gravel floating in sand), and appear to have more than one mode of imbrication. Internal stratification is crude, characterized by beds, less than about 0.3 m thick, of more densely packed gravel and by thin (2 cm), low angle (apparent dips of 0 to 14 degrees), planer forsets having a higher sand content. This unit is a longitudinal bar depositd .
Unit C Deposit grades from a gravelly sand (SP) to sandy gravel (GW-GP).Gravels are hard, subrounded with tow sphericity; sand is hard and subangular; less than 1% dark grayish brown (10 YR 4/2) fines, which react weakly to HCI. In- place density of the gravelly sand is about 1.99 g/cm3 (124 Ib/ft3) and moisture is 5 to 14%. Gravels are sand matrix-supported to clast-supported; between stations 36 and 40 elongated axis of gravels are oriented in an east-west direction. Internal stratification is crude, defined by very low angle (apparent dip of 2 degrees) planar beds with few planar crossbeds. This unit is a linguoid or modified longitudinal bar depositd .
aParticle size defined according to ASTM D2487-83; cobbles are 75 to 300 mm, gravel isfrom 4.75 to 75 mm, sand is from 0.75 to 4.75 mm, and silt and clay (fines) are< 0.75 mm (< 200 mesh).
bUnified Soil Classification System, ASTM D2487-83. cCotor based on wet specimen and Munsell Soil Color Charts; (Hue value/chroma). Color
of dry specimen is generally two value units higher. Interpretation based on Miall 1985, "Architectural-Element Analysis: A New Method of
Facies Analysis Applied to Fluvial Deposits," Earth-Sci. Rev., 22: 261-308.
566

III.l
Computer Graphics Laboratory
9950-04541
A. C. Tarr Branch of Geologic Risk Assessment
U. S. Geological SurveyMS 966, Box 25046, Denver Federal Center
Denver, CO 80225(303) 236-1605
INVESTIGATIONS
The objective of this project is to provide computer graphics services (such as access to Geographic Information System (GIS) software) to USGS geological hazards investigators. These services include (1) consultation on digital spatial data base design and data acquisition, (2) training in the use of GIS methods, (3) assistance in the assembly of large spatial data sets, and (4) research into advanced spatial data analysis topics.
Specific investigations conducted during the reporting period were (1) Mississippi embayment geologic hazards data base, (2) Pacific Northwest geologic hazards data base, (3) Colorado eolian soils map, (4) ARC/INFO user interface development, and (5) Laboratory expansion.
RESULTS
Mississippi Embayment During the reporting period, digital base data layers for eight 30- by 60-minute (l:100,000-scale) topographic quadrangles encompassing the New Madrid seismic zone (Figure 1) were added to the Geologic Hazards Data Base. These layers are hydrography, roads and trails, railroads, airports, pipelines, and power transmission lines. Other thematic data layers include two instrumental earthquake catalogs, shallow reflection and Vibroseis shot lines, and seismotectonic features.
Pacific Northwest During the reporting period, digital data base layers for three 30- by 60-minute (l:100,000-scale) topographic quadrangles encompassing the southern Puget Sound (Figure 2) were assembled and added to the the Geologic Hazards Data Base. These layers are hydrography, roads and trails, railroads, airports, pipelines, and power transmission lines. The surficial geology thematic data layer for the southern Puget Sound is approximately 60% complete as mapping of the northern half of the Tacoma quadrangle has not yet been completed. Other thematic data include the University of Washington catalog of instrumental seismicity, MM intensities for the 1965 Puget Sound earthquake, and seismic response stations in the Olympia area.
Colorado Eolian Soils Map A series of digital Soil Conservation Service soils maps for Colorado were assembled using ARC/INFO. The work is a prototype experiment prior
567

III.l
to acquiring soils and surficial geology data in seismically-active areas such as the Mississippi embayment. Rich Madole is using these digital data to prepare color eolian soils maps of eastern Colorado that will be used in his arid lands research for the Global Change and Climate History Program. Figure 3 shows a monochrome version of one of the maps.
ARC/INFO User Interface MAPX 2.0, a utility for the production of complex thematic maps using ARC/INFO continues in development. Numerous black-and-white illustrations and large-format color maps were composed during the reporting period using MAPX 2.0. Figure 4 shows a monochrome rendition of a large color map of the Sikeston l:100,000-scale quadrangle in Missouri.
Laboratory Expansion The number of projects requesting services of the Computer Graphics Laboratory has increased substantially during the last year, resulting in contention for the available hardware and software resources in the Laboratory. At the beginning of FY90, Laboratory computer resources consisted of one Sun Microsystems 3/60 workstation with a 327 MB hard disk, a single-seat ARC/INFO license, and an Altek AC40 digitizing tablet (36" by 48").
Because strong growth of GIS-related projects was anticipated, a phased expansion plan was developed for FY91. One phase of planned expansion were completed during the reporting period, including the addition of a three-seat ARC/INFO license for a Sun 3/280 file server in the Branch Computer Center, two 650 MB hard disks, acquisition of a Tektronix 4207 terminal, and purchase of terminal emulation software for two Macintoshes.
The second phase includes an additional 5 GB of online storage, an Exabyte 8mm tape drive for data base backups and data exchange, an additional workstation, and an additional ARC/INFO single-seat license.
568

III.l
39.0
38.0
37.0
36.0
35.0
93.0 92.0 91.0 90.0 89.0 88.0 87.0
50 50 100 150 200 KILOMETERS
200 MILES>0 0
-r i
50
1 1
100
1
150 :
Figure 1 ~ Map showing sixty l:100,000-scale quadrangles for which digital line graph (DLG) data have been obtained for earthquake hazards studies in the New Madrid seismic zone and vicinity. Topographic base data layers in the eight shaded quadrangles are stored in ARC/INFO format in the online Geologic Hazards Data Base.
569

III.l
49.0
48.0
47.0
46.0
125.0 124.045.0
0 122.0 121.0
25 0 25 50 75 100 KILOMETERS
25 0 25 50 75 100 MILES
Figure 2 - Map showing 31 l:100,000-scale quadrangles for which digital line graph (DLG) data are planned for earthquake hazards studies in the Pacific Northwest. Topographic base data layers and several thematic data layers in the three shaded quadrangles are stored in ARC/INFO format in the online Geologic Hazards Data Base.
570

III.l
Eolian Soils
25 0 25 50 75 100 KILOMETERS
25 0 25 50 75 100 MILES
Figure 3 Preliminary map of eolian soils in eastern Colorado. Gray shades show three different types of eolian materials; unshaded areas are either unclassified or bedrock areas.
571
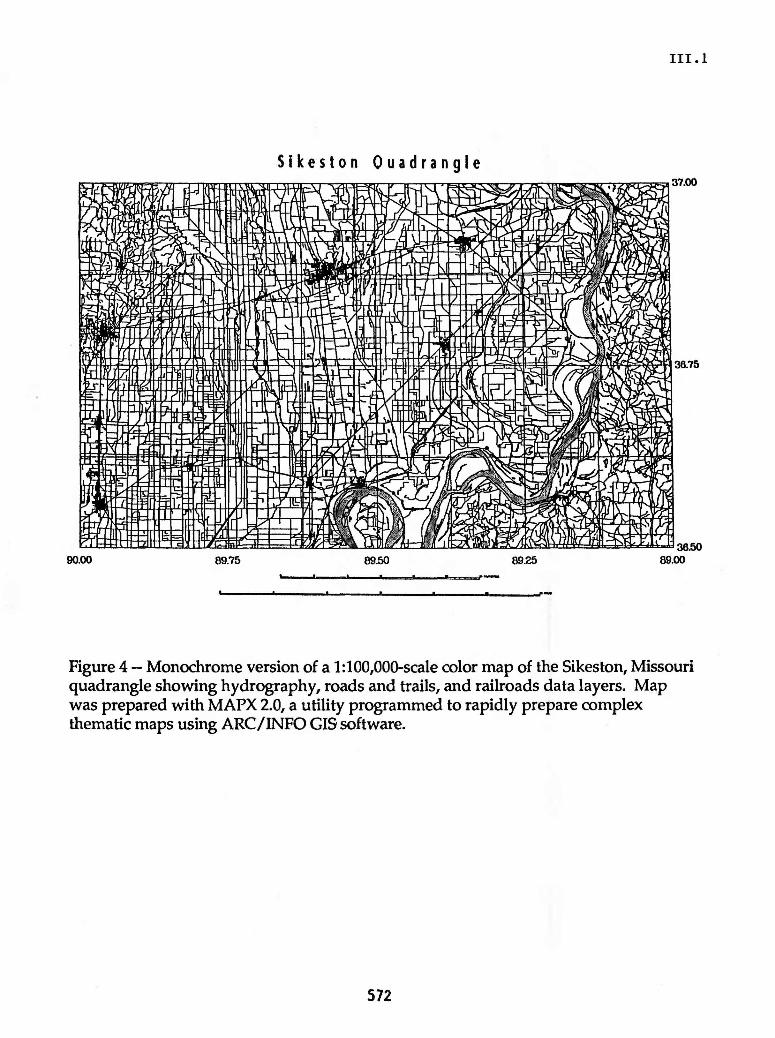
III.l
Sikeston Quadrangle37.00
36.75
90.00 89.75 89.50 89253650
89.00
Figure 4 Monochrome version of a l:100,000-scale color map of the Sikeston, Missouri quadrangle showing hydrography, roads and trails, and railroads data layers. Map was prepared with MAPX 2.0, a utility programmed to rapidly prepare complex thematic maps using ARC/INFO CIS software.
572

III.l
Quaternary Framework for Earthquake Studies Los Angeles, California
9540-01611
John C. Tinsley Branch of Western Regional Geology
U.S. Geological Survey345 Middlefield Road, MS-975Menlo Park, California 94025
(415) 329-4928
Investigations
1. Site Response Studies, Los Angeles and Vicinity, California: As one phase of an on-going USGS study of site-dependent effects on ground shaking, we completed drilling, lithologic logging, and casing of exploratory boreholes at 5 sites in the Whittier Narrows area. The sites are a subset of those locations where aftershocks were recorded using GEOS seismometers co-sited with strong-motion-accelerograph instruments that recorded the main shock of the Whittier Narrows earthquake. Field data collected included interpretation of shallow seismic refraction profiles at selected sites, to help characterize near-surface materials. (Charles Mueller, BEG&S, Menlo Park; John Tinsley, BWRG, Menlo Park)
2. Site Response Studies, Wasatch Region, Utah: Continued analysis of Wasatch Region down-hole shear-wave data in the Salt Lake Valley; preliminary results were presented in April, 1991, at the 27th Annual Symposium on Engineering Geology and Geotechnical Engineering, at Utah State University, Logan, Utah. (John C. Tinsley, BWRG, Menlo Park; Kenneth W. King, BGRA, Golden, Colorado).
3. Regional Studies of Liquefaction-Related Ground Failure, Monterey Bay Area, California: Completed laboratory analysis of samples obtained during field operations during September, 1990. Fieldwork is being planned and access to sites arranged for 1991, emphasizing stratigraphic and geotechnical analyses of 4 additional lateral-spread ground failures.
4. Digital Production of Regional Liquefaction Mapping, City of Los Angeles: Conclusion of a cooperative working agreement was achieved early in FY 1991, a technician was hired, and training commenced in January, 1991, to render the mapping into digital format using USGS software "AlaCarte", in ARCINFO format.
Results
1. Sites drilled to date are Hoover Elementary School (HOO), Olive Junior High School (OLV), Lincoln School (LIN), Santa Anita Golf Course (SAG), and Southwest Academy (SWA); proxy sites for downhole velocity studies were located at Whittier Narrows (NAR),
. 573

III.l
Rose Hills Cemetery (ROS), and Garvey Reservoir (GAR). These sites are awaiting down-hole logging studies, which will be sandwiched into the schedule as time permits, with the comprehensive site-effects studies which are on-going in the SF Bay region, following the Loma Prieta earthquake.
2. Large differences in ground response relative to bedrock, as measured using low-strain, nuclear-explosion ground-motion techniques occur in Salt Lake Valley, Utah, at sites underlain by deposits ranging from unconsolidated conditions to well- consolidated and partly cemented conditions. Spectral variations in site response are distributed, both geologically and geographically, in a largely systematic thus empirically predictable manner, as functions of the thickness and composition of the basin's deposits.
Highest levels of spectral amplification (factors greater than 8, relative to bedrock) occur on the soft silt-and-clay-rich lake beds and alluvium along the Jordan River, in a graben developed between elements of the West Valley fault zone and the East Bench fault zone.
Intermediate levels of spectral amplification (factors between 4 and 8) occur on sandy deposits flanking the lake beds and the Jordan River trough, and include some distal, deltaic and alluvial fan deposits where pre-Lake Bonneville occur at relatively shallow depths.
The lowest levels of spectral amplification (factors of 1 to 4) occur where the deposits are close to their sources, the canyons draining the Wasatch Mountains. These deposits are generally firm and are composed chiefly of gravelly and cobbly sediment that commonly is slightly cemented to well-cemented with calcium carbonate at shallow depths, and are situated around the margins of the valley as deltas and benches. The relatively high shear-wave velocity of these proximal deposits helps result in relative low impedance contrasts and low levels of spectral amplification; the characteristically shallow depth to bedrock limits the periods adversely affected by resonance.
Differences in site response for these Salt Lake Valley data typically correspond to the average shear wave velocity, profiled generally for depths ranging from 0 to 200 feet subsurface.
Site characteristics distinguished by at least 40 ft of soft, clayey soils with a shear-wave velocity not exceeding 500 ft/s (150 m/s) occur in Salt Lake Valley (site CAM, this study). Although the regional geologic distribution of these deposits may in part be controlled by structural and stratigraphic settings, these soil conditions conform to criteria for site condition S4, as defined by the Uniform Building Code (UBC). Several other sites (KSL, AIR, WAP, EAP, DUG) have deep, soft-soil seismic profiles which are close to the upper bound for site condition S3. The soft-soil conditions in Salt Lake Valley, while not quite so extreme as San Francisco Bay Mud and Mexico City's lacustrine beds, nevertheless merit careful consideration of site-dependent effects during the design and construction phases for appropriate classes of structures in parts of Salt Lake Valley (Tinsley and others, 1991).
574

III.l
3. Laboratory analyses of grain-size distribution, moisture content, and stratigraphic description of samples taken during 1989 and 1990 is complete, and the data are being loaded into a geotechnical database management system for further analysis. Radiocarbon samples are submitted for accelerator mass- spectrometer dating, but are not yet in-hand. Preliminary indication is that the location of lateral-spread ground failures and other sites of liquefaction manifest by sand-boil activity during the Loma Prieta earthquake were chiefly restricted to laterally accreted depositional facies along the lower reaches of the Salinas and Pajaro and San Lorenzo rivers in the Monterey Bay area, a coastal setting wherein response by rivers to stable or slowly rising Holocene sea levels has been the deposition of locally extensive areas of point-bar, levee, and channel deposits bounded by vertically accreted floodbasin and floodplain deposits. The latter were largely immune to lateral spread ground failure during the 1989 earthquake.
Facies analysis continues in the coastal zone, where a complex interplay of longshore bars, eolian dune deposits, and historical changes in the location of rivers and bay mouths make a more complicated stratigraphic picture compared to the purely fluvial setting.
4. Six 7.5 1 USGS quadrangles showing surficial geology, distribution of near-surface ground water, and zones of relative susceptibility to liquefaction have been completed and are awaiting rectification with their adjacent quadrangles, to be certain that lines meet properly across map edges.
Publications
1. Tinsley, J.C., King, K.W., Trumm, D.A., Carver, D.L., and Williams, R.A., 1991, Geologic aspects of shear-wave velocity and relative ground response in Salt Lake Valley, Utah in McCalpin, J. P. (ed), Symposium on Engineering Geology and Geotechnical Engineering, Proceedings, 27th, Utah State University, Logan, Utah, p. 25-1 to 25-9.
575

III.l
LANDSLIDES AND ASSOCIATED GROUND FAILURE IN THE EPICENTRAL REGION
OF THE OCTOBER 17, 1989, LOMA PRIETA EARTHQUAKE
14-08-0001-G1861
Gerald E. Weber and Jeffrey M. Nolan Principal Investigators
and Thomas E. Moutoux and Greg S. Vick
WEBER AND ASSOCIATES120 WESTGATE DRIVE
WATSONVILLE, CALIFORNIA 95076(408) 722-3580
INTRODUCTION
The goal of this investigation was to map earthquake induced ground cracking and landslides in the epicentral region of the October, 17,1989 Loma Prieta earthquake. The epicenter of the main shock lies within the Forest of Nisene Marks State Park, 9,600 + acres of largely undeveloped, densely forested mountains. Our field mapping of landslides at a scale of 1 inch = 400 feet (1:4800) is the first effort at reasonably detailed landslide mapping within this heavily forested, mountainous area.
Our initial ground reconnaissance of the Forest of Nisene Marks State Park revealed numerous landslides and extensive ground cracking. Prior to systematic field mapping, we conducted an aerial overflight and analyzed aerial photographs of the park, compiling the landslides mapped from the photos onto the 1:4800 topographic base maps. Except for the obvious areas of sliding along Aptos Creek and several landslides in the Hinckley Creek drainage, ground deformation triggered by the Loma Prieta earthquake was not identifiable from the air or from aerial photographs.
Field work was typically carried out in stretches lasting 2-4 days followed by days of data transfer from field maps to a master compilation map. Field mapping was typically conducted by a team of two geologist who systematically worked both ridge crests and stream bottoms combined with numerous traverses up and down slopes
SLOPE FAILURES AND LANDSLIDES DURING EARLIER EARTHQUAKES
Records of landslides, ground cracking and other types of ground failure triggered by previous earthquakes are rare and incomplete. Location of these areas of ground failure is difficult, at best, since the locations are poorly described. However, it is apparent that a large number of landslides, ground cracks, ridge top spreads and other types of failures were triggered by the April 18,1906 earthquake.
The location of the Hinckley Creek avalanche that destroyed the Loma Prieta Mill has been positively identified (Figure 1). The numerous slope failures that occurred in Aptos Creek can be fairly well constrained on the basis of our mapping of older landslides, and corresponds quite closely with the area affected by large translational slides and avalanches during the Loma Prieta earthquake.
576

III.l
Smaller areas of deformation noted on China Ridge and in Bridge Creek drainage can also be constrained quite closely. Once again, these areas that failed during the April 18,1906 earthquake appear to be the same areas that experienced failure during the Loma Prieta earthquake.
RESULTS OF FIELD MAPPING
The major effort of this project was to map the ground cracking and landslides that occurred in the epicentral area of the 1989, Loma Prieta earthquake. At the same time we mapped the distribution of two age classes of pre-1989 landslides. The general conclusions of the study are summarized below.
1. We found that no large, deep-seated (rotational-type) landslides were triggered by the Loma Prieta earthquake in Nisene Marks. The limited historic record of landsliding in this area suggests that no deep-seated landslides occurred in the present park during the 1906 earthquake.
2. The many large, older landslides in the park were not reactivated by the Loma Prieta earthquake. Most of these large old landslides appear to be some form of deep-seated, rotational block landslide.
3. The majority of the landslides triggered by the Loma Prieta earthquake were relatively shallow debris and rock avalanches, slides and falls. These landslides were most common on steep slopes.
4. Landslides triggered by the Loma Prieta earthquake were often spatially associated with older landslides. The headscarp region and the toe region of landslide masses, where oversteepening by stream channel erosion had occurred, were especially susceptible to landsliding.
5. Loma Prieta earthquake-induced landslides were concentrated in the narrow and steep, V-shaped inner gorges of Aptos Creek and Hinckley Creek. Drainages without steep, V-shaped inner gorges contained few landslides triggered by the earthquake.
6. Ground cracking and fissuring were most common on narrow, steep-sided ridges, although not all ridges of this type were damaged during the earthquake. The narrow ridge north of Hinckley Creek is an example of a ridge that was intensely cracked during the earthquake.
7. Ground cracking was also common at the top of steep slopes, particularly within older landslide deposits, along the crown of older landslide headscarps, and at the top of the inner gorges.
8. A northwest-southeast trending band of failures lies in the middle of the study area along the axis of the Glenwood Syncline. At the present time we do not know if this zone of failure is related to the structure or the spacial relationship with the zone of energy release. If a function of structure, it may be related to either energy focusing within the syncline, or it may represent a general weakness of the rocks near the axis of the syncline due to brittle deformation within the fold.
9. The spacial distribution of Loma Prieta-triggered landslides does not correspond to the spacial distribution of older landslides in the park. Based on very limited information, this spatial relationship also appears to hold true for landsliding from the 1906 earthquake.
10. The number of 'recent* landslides (last several decades) mapped in the study exceeds the number of landslides formed as a result of the Loma Prieta earthquake and includes at least one very large, deep-seated (rotational-type) landslide. This large landslide, seen in the northern portion of the park, was triggered by the heavy rains in the early 1980's. This observation suggests that the primary mechanism driving slope evolution in the park is not seismic shaking, but climatic conditions (precipitation).
577

III.l
In summation, our preliminary interpretation suggests that the pattern of landsliding in the epicentral area during 1989 was probably very similar to the landsliding that occurred during the April 18, 1906 earthquake. Landslides were primarily shallow, debris and rock avalanches and slides formed in the regolrth. Deep-seated landslides were neither formed nor reactivated during the 1989 earthquake and do not appear to have occurred during the 1906 earthquake either.
MAP EXPLANATION
LANDSLIDE
Barbed line delineates main headscarp; arrows indicate general direction of movement. Landslide boundaries are dashed where location is approximate, and queried where uncertain. Landslide masses are left open ended when the toe of the landslide mass cannot be distinguished geomorphically.
els-Loma Prieta Earthquake induced landslides
rls-Relatively young landslides (within the last several decades)
ols-Older landslides
Subscript/superscript numbers represent general landslide types. (If the ground failure type can not be deduced the subscript/superscript is omitted.)
1 Rotational slides
2 Translational slides: debris and rock landslides or falls, exclusive of debris flows, (mostly restricted to weathered bedrock and soils.)
Debris flows
Debris flow scar with associated deposit (debris flow deposit is often absent). Double-barbed arrow indicates debris flow path. Non-debris flow landslides of less than 30* width are also represented by a double-barbed arrow symbol.
Headscarp of landslide (usually ancient) with no recognizable deposit remaining. Near vertical inner-gorge walls may also be represented by this symbol.
Recent ground crack with horizontal and vertical displacement indicated. Hachures are on down dropped block. RX indicates the recent ground crack reactivated an older crack. Crack pattern is diagrammatic where cracks are too numerous and closely spaced to be drawn at this scale.
K-4"
Recent ground crack with no vertical displacement.
Isolated older scarp
Hummocky topography
578

SHADED AREA REPRESENTS THE APPROXIMATE LOCATION OF THE 1906 HINCKLEY CREEK LANDSLIDE
HINCKLEY CREEK BASINSHOWING APPROXIMATE LOCATION OFTHE 1906 HINCKLEY CREEK LANDSLIDE
FOREST OF NISENE MARKS STATE PARK
FIGURE
1
579

III.l
Crustal Deformation of Western Oregon
Agreement No. 14-08-0001-G1980
Ray Weldon and Gene Humphreys Department of Geological Sciences
University of Oregon Eugene, Oregon 97403-1272
(503) 346-4584 Introduction
This project is the continuation of efforts to characterize the active deformation in Western Oregon using geodetic data. Early work is discussed in summaries by Richards and Humphreys under the same title. Our recent work has focused of recognizing errors in the historic leveling data, using loop closure and consistency tests,- and on integrating the results from tidal records along the coast.
Savage et al. [1981], Lisowski et al. [1989], and Savage and Lisowski [in press], have shown that horizontal and vertical strain is accumulating at a rate and with a style consistent with a locked subduction zone off coastal Washington. While there is still some debate about whether these results indicate elastic or anelastic strain accumulation [Byrne et al., 1988; Rogers, 1988; West and McCrumb, 1988; Davis et al., 1990; Heaton, 1990] it is increasingly clear that the historic deformation is substantially different in style and magnitude than the longer-term deformation and therefore primarily represents the interseismic accumulation of elastic strain.
ResultsFigure 1 illustrates the difference between the historical vertical
deformation rate and the longer-term "permanent" deformation rate in a north-south transect along the Cascadia margin. The upper curve is our work, and is a combination of geodetic data from the 1920s, 1930s, 1941, and late 1980s, and tidal records from Neah Bay, Astoria, Newport, Charleston, and Crescent City. East west transects are consistent with these data in that steep slopes are seems in lines originating in regions of high uplift rate at the coast and low slopes in lines from the region of slower uplift. However, EW lines lack the redundancy and the independent check from the tidal data, so are less certain. The lower curve is the long term deformational rate, that spans many seismic cycles, so the difference between them can be inferred to be the rate of accumulation of elastic strain. In principle, a similar comparison could be made for horizontal
580
III.l
strain accumulation, but regional geologic markers for horizontal strain are difficult to find.
For vertical strain, a record of past sea level is used, and the longer-term uplift rate is based on the deformation of a widely traceable marine terrace. The terrace illustrated has been dated at about 82,000 years ago, and is certainly old enough to average deformation through the seismic cycle (if there is one); the data are modified from West and McCrumb [1988] and Kelsey [1990]. There are considerable uncertainties in tracing a single reference datum along the entire coast and it is likely that this curve will change as more data become available, but it is already clear that the average uplift rate is less than 1/2 mm/yr and that local regions of rapid uplift, up to about 1 mm/yr, are associated with local faults and folds [Kelsey, 1990].
The recent uplift rate is based on tidal gauge records and repeated leveling lines along the coast [modified from Vincent et al., in review; Savage and Lisowski, in press; Weldon and Pittock, unpublished data]. Tidal data record the rise or fall of the coast relative to sea level; adjusted for changes in global sea level and isostatic effects, it yields the tectonic uplift rate at individual points along the coast with long tidal records. Repeated surveying of level lines between the isolated tidal gauges provides a consistency test of both the tidal and leveling data, and fills in the uplift record in between. The average uplift rate for the past ~60 years (different areas have longer or shorter records) is 2 to 4 mm/yr and shows broad features not seen in the permanent deformation. This difference in both rate and style strongly supports the hypothesis that most of the deformation is elastic and will be released during large earthquakes.
Also, the magnitude of deformation is crudely consistent with the available paleoseismic records. For example, at Netarts Bay (near Tillamook on Figure 1) where Darienzo and Peter son [1990] determined the recurrence interval and magnitude of coastal swamp subsidence, the interseismic uplift rate is about 1.5 mm/yr greater than the long-term uplift rate. Assuming a simple inverse relationship between elastic and coseismic strain, one would predict from our results coseismic subsidence events of 0.5 m (for a 300 year interval) to 1.5 m (for a 1000 year interval), as seen in the paleoseismic record.
The Netarts Bay record is in a region of slow uplift relative to the regions to the north and south. This may suggest that these other regions could experience subsidence two to three times larger, or comparable events more frequently. This data may therefore allow the Cascadia subduction zone to be subdivided into three, 200+ km segments. However, only more paleoseismic data will allow us to determine whether there are variations in the number or size of events along the subduction zone.
581

III.l
5-
4 -
3-
<4-C O
^j 2 (X
1 -
average uplift rate for -60 years
data not yet analyzed -%tCQ
<D
average uplift rate for -82,000 years
- 5
- 4
- 3
42° 43* 44C 45°
Latitude
46C 47* 48 (
cdV-i
-2
h I
Figure 1. Interseismic versus long-term uplift of the Cascadia coast. Lower curve is derived from a widespread marine terrace, modified from West and McCrumb [1988] and Kelsey [1990], and is representative of the uplift rate averaged over many seismic cycles. The upper curve is derived from tidal gauge records and leveling lines along the coast, modified from Vincent et al. [in review], Savage and Lisowski [in press], and Weldon and Pillock [unpublished]. The difference between the two curves is probably accumulation of elastic strain that will be released during the next earthquake.
582

III.l
Use of ring patterns in buried spruce stumps to test for sudden synchronous submergence of the Washington and Oregon coasts 300 years B.P.
Agreement No. 14-08-0001-G1969
David K. Yamaguchi Mountain Research Station & Institute of Arctic and Alpine Research
University of Colorado Boulder, Colorado 80309-0450
(303) 492-8841
Brief description of projectThis project is aimed at answering the following question: Did abundant
Sitka spruce (Picea sitchensisl stumps entombed in buried Holocene soils along the southern Washington and northern Oregon coasts die synchronously within each soil? Answering this question is important because it provides an important test of the "great earthquake" explanation for the formation of the buried soils (Atwater 1987). If soil burial and tree death were caused by coseismic submergence, then trees within individual soil layers should have died approximately synchronously.
To answer this question, I will collect below-ground stem or root samples from modern spruce and entombed stump remnants at several estuarine sites along the Washington and Oregon coasts. Samples from modern trees will be used to see if the below-ground ring-width patterns of different trees growing at the same sites and at different sites can be used to prove synchronous growth. Samples from higher in the tree stem can be used for such work because individual ring widths reflect year-to-year climate variation (Fritts 1976). Below-ground samples will be emphasized in this study, however, because such samples are all that are typically preserved in buried soil outcrops. If the modern samples can be used to prove synchronous growth and death, then root samples will be collected in parallel from entombed spruce stumps to similarly test for synchrony. Because wood in many buried stumps is commonly preserved to bark, such stumps are potentially ideal for evaluating the relative timing of tree burial and death.
Progress to dateSignificant progress has not been made on this project because the USGS
administratively-set grant start date (Feb. 1991) preceded the requested start date (June 1991) and the summer field season. I thus anticipate requesting a no-cost extension at the end of the current grant period to complete the work. Recently-completed work on related topics, however, includes that by Atwater and Yamaguchi (1991), and Atwater et al. (submitted). I also submitted a related NEHRP proposal, involving collaborative research with Brian Atwater and Eileen Hemphill-Haley of the USGS, to examine the modern analog of spruce forests near Anchorage subsided by the 1964 great Alaska earthquake (Yamaguchi, pending).
Atwater, B.F. 1987. Evidence for great Holocene earthquakes along the outercoast of Washington state. Science 236, 942-944.
Atwater, B.F., Stuiver, M., and Yamaguchi, O.K. Radiocarbon dating andearthquake magnitude along the Washington coast, northwestern UnitedStates. Submitted to Nature r May 1991.
583

III.l
Atwater, B.F., and Yamaguchi, D.K. 1991. Sudden, probably coseismicsubmergence of Holocene trees and grass in coastal Washington state.Geology 19, in press.
Fritts, H.C. 1976. Tree rings and climate. Academic Press, New York. Yamaguchi, D.K. Pending. Collaborative research (USGS and Univ. of Colorado)
Killed-forest record of the great 1964 earthquake in Alaska. NEHRPproposal submitted Jan. 1991.
(May 29, 1991)
584

III.l
Liquefaction Hazard Mapping for the Portland, Oregon Region
Agreement No. 14-09-0001-G1985
T. Leslie YoudDepartment of Civil Engineering
Brigham Young UniversityProvo, Utah 84602
(801)378-6327
lan P. MadinDepartment of Geology and Mineral Industries
910 State Office BuildingPortland, Oregon 97201
(503)229-5580
Objectives:
The objectives of this project are to prepare liquefaction susceptibility and ground failure hazard maps for the Portland quadrangle, Oregon. To accomplish those tasks, geologic and geotechnical data are being collected and analyzed to determine and map the extent and thickness of liquefiable layers. A ground slope map will also be compiled. That map, the data on liquefaction, and correlations with ground displacement will be used to compile ground failure hazard maps that show predicted horizontal and vertical ground displacements for possible earthquakes.
Results:
This project began March 1,1991. To date, geologic maps and preliminary soil information have been collected. We are just beginning the major task of collecting additional geotechnical data from bore-hole logs archived in the files of private consulting firms and public agencies and to analyze those logs to develop the information required for liquefaction susceptibility mapping.
585

III.2
REGIONAL AND LOCAL HAZARDS MAPPING IN THE EASTERN GREAT BASIN
9950-01738
R. Ernest AndersonBranch of Geologic Risk Assessment
U.S. Geological SurveyBox 25046, MS 966, Denver Federal Center
Denver, Colorado 80225(303) 236-1584
INVESTIGATIONS
1. Studied the interrelations between normal faults and associated folds, strike-slip faults, and thrust faults in the southeastern Great Basin.
2. Studied reflection-seismic data in the southeastern Great Basin.
RESULTS
1. Extensive geologic fault-slip data (thousands of faults) indicate that strike-slip faulting is a ubiquitous process accompanying extensional deformation. The fault-slip data can commonly be inverted to obtain a subhorizontal compressive paleostress axis that is conjugate to the extension axis. It is unlikely that the strike-slip faulting generally reflects complex paleostress reorientation as is sometimes inferred. Instead, the strike-slip faulting is an integral part of extensional strain fields that generally include horizontal and vertical contractional elements. In some areas studied, fold patterns that developed synchronously with the strike-slip faults and with extensional deformation support this view.
2. Reflection seismic data from the Virgin River depression in the Nevada-Utah- Arizona tricorner area reveal three subbasins and intervening horsts typical of those buried beneath other large basins in the Basin and Range province. In this area and in areas to the northwest and south, reflection data argue against the high degree of continuity and interconnectedness of low-angle normal faults (detachment faults) commonly inferred from geologic relations alone.
586

III.2
REPORTS
Anderson, R.E., 1989, The Intermontane System (Basin and Range, Colorado Plateau and High Lava Plains): Tectonic evolution, in Pakiser, L.C., and Mooney, W.C., eds., Geophysical framework of the Continental United States: Geological Society of America Memoir 172, p. 163-176.
Anderson, R.E., 1990, West-directed tectonic escape between the northern and southern sectors of the Basin and Range province: Geological Society of America Abstracts with Programs, v. 22, no. 3, p. 2.
Grow, J.A., Bohannon, R.G., Miller, JJ., and Anderson, R.E., 1990, A seismic reflection study of Miocene listric faulting north of Lake Mead, Nevada: Geological Society of America Abstracts with Programs, v. 22, no. 3, p. 67.and interconnectedness of low- angle normal faults (detachment faults) commonly inferred from geologic relationships alone.
Michel-Noel, Gerard, Anderson, R.E., and Angelier, Jacques, 1990, Fault kinematics and estimates of strain partitioning of a Neogene extensional fault system in southeastern Nevada: Geological Society of America Memoir 176, p. 155-180.
Miller, J J., Grow, J.A. Bohannon, R.G., and Anderson, R.E., 1990, Seismic images of Miocene listric faulting north of Lake Mead, Nevada: Geological Society of America Abstracts with Programs, v. 22, no. 3, p. 68.
587

III.2
INTEGRATING EARTHQUAKE CASAULTIES INTO LOSS ESTIMATION
Grant No. 14-08-0001-G1974
Michael E. Durkin Michael E. Durkin and Associates
22922 Leonora Drive Woodland Hills, California 91367
(818) 704-1493
Research Background
The major purpose of our overall project is to develop a comprehensive earthquake casualty estimation process that is useable at the regional level by organizations and individuals involved in earthquake hazard reduction. During the last 10 years, considerable attention has been devoted to the general area of earthquake loss estimation; however, little attention has been devoted to the more specific estimations of earthquake casualties. Yet casualties are of prime concern to those who commission loss estimations - public and private sector organizations whose responsibility is life safety. Those few attempts to include casualty estimations illustrate key problems. First, they lack a significant empirical data base; second, they have not been tested in accordance with what data has been available; and third, improved casualty estimations have not been applied to regional and subregional earthquake loss estimations.
Significantly, we now have a major data base and methods keyed to it, so that we can make injury estimations less speculative. In Phase One, we analyzed existing casualty estimation methods and assessed their utility given our extensive yet still emerging data bases; further, we assessed these models' ability to be integrated into existing loss estimation models. In the current phase, year two, we are developing a prototypical, regional casualty estimation model and testing this model in three regional areas - the central US, the Pacific Northwest, and the San Francisco Bay Area.
Selected Phase One Findings
Our review of previous methods and empirical data from recent US and foreign earthquakes found significant gaps in conceptual approaches that restrict casualty estimates to determination of the building type and degree of damage. This analysis revealed the following specific areas where present models can be extended to enable more comprehensive and meaningful earthquake casualty estimations.
The first need is to actively incorporate a wider range of geotechnical factors in casualty estimation models. Present casualty
588

III.2
estimates are based almost exclusively on structural failure caused by ground shaking to the exclusion of potential casualties from other geological phenomena like landslides. This omission likely evolved from the US having experienced relatively few casualties from situations other than simple ground shaking. Experiences elsewhere suggest the importance of other natural environment phenomena; probably half of the fatalities in the Phillipine earthquake were due to landslides sweeping buses, cars, and pedestrians, and homes off mountainous roads and hillsides. Many fatalities in the San Salvador earthquake occurred when single-family residences collapsed and fell down hillsides. On the other hand, certain types of geological performance may produce high degrees of structural damage at relatively little risk to life safety.
A second need, related to the impact of different geological phenomena, and not currently included in casualty coefficients, is to assess the relative extent to which different types of geotechnical performance and resultant structural failure contribute to earthquake casualties. For instance, liquifaction may cause significant structural damage but lead to few casualties as was the case in the Chile, Loma Prieta and Philippine earthquakes. Alternatively, structural collapse resulting from slope failure, also documented in the Philippines, is potentially lethal.
A third need is to incorporate in casualty estimation the numerous physical setting hazards in addition to complete building collapse. Irrespective of their validity, the casualty coefficients, used in past US casualty estimations, were applied only to occupants of collapsed buildings, to the exclusion of those at risk from other types and degrees of structural failure. These estimates did not give enough attention to other physical setting types and elements that might experience significant structural damage and pose a significant life safety threat. Recent earthquakes have demonstrated that numerous other types of structural failure should be incorporated into casualty estimation. One such type is the complete collapse of structures other then buildings. For example, the 880 viaduct collapse was the major cause of fatalities in the 1989 Loma Prieta earthquake. In the Chile earthquake, numerous residents evacuated their homes only to be killed and injured by collapsing masonry property walls.
Partial building collapse is a second important type of structural failure largely ignored by present casualty estimation methods. The second major cause of Loma Prieta fatalities was falling parapets and sections of masonry exterior walls which fell on those outside the buildings. In the 1985 Chile earthquake, falling pieces of masonry struck and killed those outside the buildings.
A fourth need is to incorporate estimates of mortality and morbidity due to the performance of non-structural elements and building contents. Although, our recent research indicates that nonstructural elements such as ceiling tiles and building contents such as office equipment and household furnishings have a low likelihood of causing fatal injuries, such elements
589
III. 2
are responsible for numerous minor and moderate injuries that tax emergency health services and incapacitate individuals.
A fifth need is to develop better techniques for relating populations at risk with earthquake hazards. The threats posed by the entire physical setting needs to be documented and incorporated, particularly urban design issues. The concept of physical setting is particularly useful in understanding factors that contribute to earthquake injuries because it combines physical elements with occupant behavior patterns. Therefore, it is possible to evaluate the interaction of environment and behavior in terms of normal activity patterns and space utilization, and in terms of emergency actions. The physical setting approach has the advantage of including, in loss estimates, potentially hazardous physical elements outside the building itself, for instance the lethal Chilian property walls. The physical setting approach also allows a more comprehensive and detailed hazard assessment of specific geographic areas. For example, planners can analyze a specific inter-city area in a number of different dimensions including the proximity of specific medical resources to the scene of potential collapses, street width, population density, the probable ability of skilled medical personnel to reach victims, and the size of emergent groups that is likely to be available either as a resource or as a hinderence.
The sixth need is to expand our conceptual framework to include more supply-side issues (issues of the availability and management of health care resources). We know that the rapid provision of appropriate medical care can save lives and reduce injury severity thus reducing casualty magnitudes. Recent research shows that, even in building collapses, many seriously injured occupants are freed very quickly and can benefit from the rapid provision of specialized medical care. However, our research on Santa Cruz County EMS system response in the Loma Prieta earthquake shows that many ambulance trips were wasted because the disaster response system was not set up to adequately deal with injury severity. Unfortunately all these approaches categorize casualties as either fatalities or injuries, with no distinction for severity or degree of medical treatment. Thus, there is no way to know what medical resources will be needed and where. Therefore, if we know what these patterns are likely to be we can reduce actual casualty rates and subsequent estimates. Other supply-side factors that existing estimation processes do not estimate include the impact of loss of transportation and utility systems on casualties. For example, casualties (mostly due to increase in severity) from the inability of emergency medical equipment and personnel to reach injured because of severed transportation arteries is not currently estimated. Similarly, the impact of interrupted utilities on the delivery of health care services is not considered.
The seventh and final need is to redesign and better integrate current loss and casualty estimation processes to more fully assist policy formation and implementation. Many hazard reduction policies and practices aimed at reducing earthquake casualties are already in place. While current US loss estimation methods give planners gross building damage and casualty
590

III.2
estimates (normally expressed in terms of expected numbers of deaths and serious injuries) these methods are not sufficiently developed. They fail to provide policy-makers and emergency responders with an empirical basis for selecting from among alternative policy strategies or for assessing the effectiveness of strategies once in place. For example, more refined methods for estimating the probable location of serious casualties in and around unreinforced masonry buildings would be very useful in selecting selective retrofit policy for such buildings. Similarly, the ability to estimate the relative injury contribution of different nonstructural elements and building contents would be essential in allocating finite resources in hazard reduction.
Phase Two Research Activities
Our Phase One assessment concluded that present casualty estimation methods were not readily adabtable to local situations. It is not enough simply to provide a preparedness organization with a casualty estimation process and expect the group to be able to implement it. In selecting this particular research approach, we are assuming that a "bottom-up" rather than a traditional "top-down" approach is necessary for developing an earthquake casualty estimation process that can incorporate regional and local user needs and requirements. We further assume that an earthquake casualty estimation process needs to be adaptable to local changes in potential supply and demand characteristics. Therefore, the process needs an interactive approach to allow different user groups to change the methods to conform with their changing circumstances.
In Phase Two we are using the prototypical regional casualty estimates as a means of developing an appreciation of the key variables, such as differences in building inventory, that should be included in a regionally sensitive casualty estimation process; and as a means of developing actual preliminary casualty estimates for several subregions. However, simply having casualty estimates is not enough to ensure that the process will actually be implemented. The final casualty estimation process must include the means and flexibility for earthquake hazard reduction practioners to evaluate alternatives. The Phase Three interaction, therefore, will focus on developing and testing those methods that make the process immediately applicable. We have designed a series of case studies at different levels of health care delivery, at various levels of government, and in both the emergency and continuing care areas to provide continuing input and feedback in developing future implementation strategies.
To assist casualty estimation model development, we are continuing to draw on findings from our research program in earthquake injuries and health service response. Since last year, we have added valuable results from the 1989 Loma Prieta and the 1990 Philippines earthquakes to this data base. We are also continuing to evaluate promising casualty estimation techniques, recently developed in Japan and Europe. Our overall research will thus provide a sound basis for development and widespread application
591

III. 2
of a comprehensive earthquake casualty loss estimation methodology - one that combines and further develops the most effective existing casualty estimation techniques, reflects current data, and is sensitive to different US regional contexts.
Additional Project Publications
Durkin, Michael E., "Estimating Casualties in Earthquakes," in the Proceedings of the Fourth International Conference on Seismic Zonation. Expected publication in 1991.
Durkin, Michael E., and Charles C. Thiel, Jr., "Integrating Earthquake Casualty And Loss Estimation," to be published in the Proceedings Of The Workshop On Modelling Earthquake Casualties For Planning And Response (Sacramento, CA: VSP Associates and California Medical Services Authority, co-sponsors) forthcoming.
Durkin, Michael E., Charles C. Thiel Jr., James E. Schneider, and Teri De Vriend, "Injuries And Emergency Medical Response In The Loma Prieta Earthquake," paper submitted to the Bulletin of the Seismological Society of America.
Hiatt, D., J. Schneider, C.C. Thiel, and M. Durkin, 9-1-1 Emergency Response In Santa Cruz County In The Loma Prieta Earthquake Earthquake, submitted to the Journal of Pre-Hospital Care and Disaster Medicine.
Roces, M.C., M.E. White, M.M. Dayrit, and M.E. Durkin, A Case-Control Study Of Injuries Due To The 1990 Earthquake In Luzon, Philippines, submitted to the Bulletin of the World Health Organization.
Roces, M.C., I.L. Gopez, C. Lim-Quizon, R.U. Rayray, R.R. Gavino, E.S. Salva, M.B. Brizuela, F.C. Diza, E.V. Falcon, J.M. Lopez, M.E.G. Miranda, R.A. Sadang, N.S. Zacarias, M.E. Durkin, M.E. White, M.M. Dayrit, "A Case-Control Study Of Injuries Due To The 1990 Earthquake In Luzon, Philippines" (Minila: Philippine Ministry of Health) 1990.
Durkin, Michael, E., and Charles C. Thiel, Jr., "Improving Public Policy To Reduce Earthquake Casualties," selected for the Earthquake Spectra: Public Policy Theme Issue. Expected publication in 1992.
Durkin, Michael E., "Medical And Other Human Aspects," chapter to be published in A.J. Schiff (editor) Philippine Earthquake Reconnaissance Report, Earthquake Spectra (forthcoming).
592

III. 2
Frequency and Survlvabillty Profiles of Highway Bridges Along the 1-5 Corridor Between Everett, Washington and Salem, Oregon
14-08-0001-G1698
Ralph Alan Dusseau, Ph.D., P.E.Assistant Professor
Wayne State University5050 Anthony Wayne DriveDetroit, Michigan 48202
(313) 577-3842
Bridge Spans Analyzed
During the second year of this USGS-NEHRP project, the principal goal was to determine the natural frequencies and, if possible, to estimate the modes of vibration for a representative sample of bridge spans along interstate highways 1-5, 1-205, and 1-405 between Everett, Washington and Salem, Oregon. To this end, field ambient vibration measurements and laboratory data analyses were performed on 54 typical highway bridge spans along 1-5 and 1-405 in Washington State. A summary of these 54 bridge spans was presented by Dusseau (1). The distribution by bridge span type was as follows:
1. 21 (39%) were precast prestressed concrete girder bridge spans2. 19 (35%) were reinforced concrete box-girder bridge spans3. 10 (18%) were reinforced concrete slab bridge spans4. two (4%) were reinforced concrete tee-beam bridge spans5. two (4%) were steel girder bridge spans
The percentages indicated above are approximately the same as the actual distribution of bridge span type along 1-5, 1-205, and 1-405 in western Washington State and northwestern Oregon. In addition, the choice of span lengths within each bridge type approximates the actual distribution.
Transducer Type. Location, and Orientation
The type, location, and orientation of the eight transducers that were used for the field measurements were discussed and illustrated by Dusseau (1). For the precast prestressed concrete girder bridge spans, the eight transducer types, locations, and orientations were as follows:
1. seismometer - midspan location with vertical orientation2. seismometer - midspan location with lateral orientation3. seismometer - midspan location with longitudinal orientation4. seismometer - quarter point location with vertical orientation5. seismometer - quarter point location with lateral orientation6. seismometer - support location with vertical orientation7. accelerometer - midspan location with vertical orientation8. accelerometer - quarter point location with vertical orientation
For the remaining bridge spans (reinforced concrete box-girder bridge spans, reinforced concrete slab bridge spans, reinforced concrete tee-beam bridge spans, and steel girder bridge spans), the eight transducer types, locations,
593

III. 2
and orientations were as follows:
1. seismometer - midspan location with vertical orientation2. seismometer - midspan location with lateral orientation3. seismometer - midspan location with longitudinal orientation4. seismometer - quarter point location with vertical orientation5. seismometer - quarter point location with lateral orientation6. seismometer - support location with vertical orientation7. accelerometer - support location with lateral orientation8. accelerometer - support location with longitudinal orientation
Analysis Results
For each bridge span, a fast fourier transformation was performed on each transducer output and plots of amplitude versus frequency were made. As a sample of the analysis results that were derived for each of the five bridge types listed above, Tables 1 to 5 list the peak amplitude frequencies for each transducer on each bridge span. While the frequencies listed in Tables 1 to 5 are those with the highest amplitude, the lowest frequencies are generally of more interest in determining bridge dynamic responses. Since each plot of amplitude versus frequency is unique and generally contains several local maxima of varying amplitude, developing uniform rules for designating the lowest frequency on each plot would be difficult and highly subjective. Thus, the tables presented here list only the frequencies with the peak amplitudes.
Despite the fact that many of the amplitude versus frequency plots contain local maxima which are only slightly smaller than the peak amplitude, the results presented in Tables 1 to 5 show a great deal of consistency. Transducer #1 (for example), which measured vertical vibrations at midspan, had peak amplitude frequencies that decreased in a generally uniform manner with respect to increasing span length for each bridge type. The principal reason for differences in the peak amplitude frequencies between spans having the same or similar lengths is the close proximity of the local maxima. Thus, while frequency "A" may have a slightly higher amplitude than frequency "B" for a given transducer on a given span, the reverse may be true for the same transducer on another span of the same type and the same or similar length.
One inconsistency in the results was a group of peak amplitude frequen cies of 1.0 to 1.3 Hz that were recorded for many of the shorter reinforced concrete slab bridges and other bridge types. Such low frequencies are not consistent with the higher stiffnesses of these shorter spans. To Investigate this anomaly, we first examined the results for the precast prestressed girder bridge spans. For these spans, Transducers #1 and #7 had the same location and orientation, as did Transducers #2 and #8. By comparing the amplitude versus frequency plots for these two pairs of transducers, we noted consistent low-amplitude local maxima at frequencies of approximately 1.0 to 1.3 Hz for the two seismometers (Transducers #1 and 4)2), but no such local maxima for the two accelerometers (Transducers 07 and 4)8). Since the seismometers are not as accurate for frequencies below 1 Hz and since each seismometer has a natural frequency of about 1 Hz, we concluded that the low-amplitude local maxima at frequencies of 1.0 to 1.3 Hz are a result of the dynamic excitation of the seismometers themselves. To better assess which seismometer frequencies listed in Tables 1 to 5 might be a result of this phenomenon, we used an asterisk to denote all peak amplitude frequencies with amplitudes less than
594
III.2
0.01 mm/sec. With very few exceptions, all of the 1.0 to 1.3 Hz frequencies for the shorter reinforced concrete slab bridges and other bridge types fell into this category. Thus we concluded that these cases with peak amplitude frequencies of 1.0 to 1.3 Hz and peak amplitudes less than 0.01 mm/s represent instances where the seismometers are being excited and not the bridge spans.
The results also indicated a great deal of coupling between the responses in the vertical, lateral, and longitudinal directions for most of the bridge spans that were analyzed. This coupling makes it extremely difficult to discern which frequency is associated with which type of bridge motion. Thus, estimating the mode shape associated with each frequency was not possible. The frequency results that were derived could only be thoroughly analyzed by developing finite element computer models of each bridge that was measured in the field. By comparing the modal responses of the finite element model to the frequencies measured in the field, the source of each frequency could be determined. To facilitate such evaluations, all of the frequency results will be supplied to the Washington State Department of Transportation (WSDOT) for comparison with future finite element modeling and modal analysis results.
Availability of Results
The output generated during the second year of the project will be made available after May 1, 1991. This output will be in the form of three volumes of results (approximately 780 pages total) organized as follows:
1. Volume 1 - Output for 21 Precast Prestress Concrete Girder Spans2. Volume 2 - Output for 19 Reinforced Concrete Girder Bridge Spans3. Volume 3 - Output for 10 Reinforced Concrete Slab Bridge Spans,
Output for Two Reinforced Concrete Tee-Beam Bridge Spans, and Output for Two Steel Girder Bridge Spans
The results obtained for each bridge span include plots of amplitude versus frequency and amplitude versus time for each transducer. Plots of coherence and phase versus frequency are also included for the following five cases:
1. Transducer #1 versus Transducer #4,2. Transducer #1 versus Transducer #6,3. Transducer #4 versus Transducer #6,4. Transducer #2 versus Transducer #5,5. Transducer #7 versus Transducer #8,
The output for each bridge span includes a total of 26 plots on 13 pages plus one page of hand-calculated instrument sensitivities. The three volume set of results can be obtained at a cost of $55 per set (with checks made payable to Wayne State University) from Dr. Ralph Alan Dusseau, Department of Civil Engineering, Wayne State University, Detroit, Michigan 48202. The total cost includes $50.00 for copying plus $5.00 for postage.
References
1. Dusseau, R. A., "Frequency and Survivability Profiles of Highway Bridges Along the 1-5 Corridor Between Everett, Washington and Salem, Oregon," Summaries of Technical Reports, U.S. Geological Survey, Menlo Park, California, Volume XXXI, Open-File Report 90-680, December 1990.
595

III. 2
TABLE 1. FREQUENCIES FOR PRECAST PRESTRESSED CONCRETE GIRDER BRIDGE SPANS
WSDOT BRIDGE NUMBER
5/457
5/630
405/42
5/457
5/615
5/605
5/602
5/615
405/42.5
405/42.5
5/630
5/602
5/605
5/602
405/42
5/615
5/457
5/605
5/656
5/656
405/42
SPAN NO.
1/4
4/4
3/3
4/4
1/4
1/4
4/4
4/4
1/2
2/2
3/4
1/4
4/4
2/4
1/3
2/4
2/4
2/4
1/2
2/2
2/3
SPAN LENGTH, feet
40.91
42.50
52.00
54.84
55.50
55.98
60.00
67.00
68.38
68.38
73.50
74.50
77.97
92.00
93.50
100.00
101.00
101.98
108.50
108.50
114.50
PEAK AMPLITUDE FREQUENCIES FOR EACH TRANSDUCER, HZ
#1
14.1
16.0
14.5
11.1
12.9
12.9
10.2
8.9
8.9
8.7
6.8
7.1
7.4
4.6
4.9
4.2
4.1
4.6
6.8
3.9
4.6
#2
3.9
3.4
4.6*
4.8
15.1
2.7
3.4
3.6
13.0
12.9
49.9
2.7
2.9
2.6
14.9
3.4
3.0
3.0
4.6
4.6
14.6
#3
2.7
8.7
4.6*
3.8
4.2
3.0
8.0
3.4
9.1*
11.0*
5.1
2.9*
2.8
2.6
4.9*
5.9
2.7
3.2
3.9
3.9
14.3
#4
13.6
16.0
14.5
11.1
12.9
12.9
10.2
8.9
9.1
10.8
6.8
7.1
7.4
4.6
4.9
4.2
4.1
4.6
6.8
4.3
4.8
#5
3.9
3.4
1.2*
4.8
3.4
2.7
3.4
3.6
13.0
12.9
5.2
2.7
2.9
2.6
14.9
3.4
3.0
3.0
4.6
4.6
14.6
#6
4.0
16.0
16.0
11.1
12.9*
12.5
1.2*
9.0*
10.9*
11.1*
17.3
7.1
2.8
14.5
13.1*
12.9
3.9
4.6
3.9
16.2
4.6*
#7
14.7
15.9
14.6
11.1
12.7
12.9
10.2
8.9
13.0
15.8
6.8
7.2
7.3
4.6
30.1
4.2
3.9
4.6
3.9
3.9
4.6
#8
14.7
16.0
14.6
11.1
12.7
12.9
10.2
35.0
13.0
13.1
6.9
7.2
7.3
4.6
18.4
15.0
3.9
4.6
3.9
15.7
13.5
* maximum seismometer amplitude Is less than 0.01 mm/s
596

III. 2
TABLE 2. FREQUENCIES FOR REINFORCED CONCRETE BOX-GIRDER BRIDGE SPANS
WSDOT BRIDGE NUMBER
5/596
5/596
5/418
5/418
405/17
5/419
5/596
5/596
405/57 S
405/17
405/17
5/418
5/418
5/419
405/50 N
405/50 S
405/50 N
405/50 S
405/57 S
SPAN NO.
4/4
1/4
1/4
4/4
1/4
4/4
2/4
3/4
4/4
2/4
3/4
2/4
3/4
3/4
3/4
3/4
4/4
4/4
3/4
SPAN LENGTH, feet
45.00
54.00
59.28
59.28
60.46
68.00
75.33
75.33
78.00
78.00
78.00
87.50
87.50
90.50
97.81
102.70
111.00
112.00
143.00
PEAK AMPLITUDE FREQUENCIES FOR EACH TRANSDUCER, HZ
«1
16.2
13.0
11.5
12.8
6.2
5.0
6.2
8.9
10.5
5.8
7.3
5.5
5.6
5.1
3.9
1.4
3.8
4.1
3.4
#2
4.6
4.7
4.4
4.4
3.1
3.1
4.6
4.8
3.7
3.1
3.1
5.5
4.2
3.1
2.3
1.2
3.7
1.2
2.1
#3
4.8*
4.3*
11.5*
12.4*
5.4
3.1*
4.3*
10.2*
4.6
5.2
5.9
5.5*
10.5
3.1
3.6
2.6
2.4
2.6
4.3
#4
16.2
13.1
11.5
12.8
6.2
5.0
15.3
8.9
10.5
5.8
10.6
5.5
5.6
5.1
13.9
6.6
3.8
4.1
3.4
#5
4.6
4.7
4.4
4.4
3.1
3.1
4.6
4.7
3.7
3.1
3.1
5.5
4.2
3.1
3.7
2.4
1.2*
2.3
2.1
#6
15.3*
12.8
21.2
12.9
7.2*
13.4*
9.3
16.9
8.9
3.1
6.2
6.7
5.5
3.1
2.4
2.3
2.4
3.6
1.2
#7
15.9
12.4
12.0
12.9
10.4
14.8
9.0
6.3
11.4
3.1
17.1
14.0
5.5
34.4
5.6
2.3
3.9
3.4
3.3
#8
15.9
12.4
11.4
12.9
5.6
14.2
9.0
6.3
11.4
5.7
23.8
6.7
5.5
8.7
13.9
4.4
8.9
13.6
8.9
* maximum seismometer amplitude is less than 0.01 mm/s
597
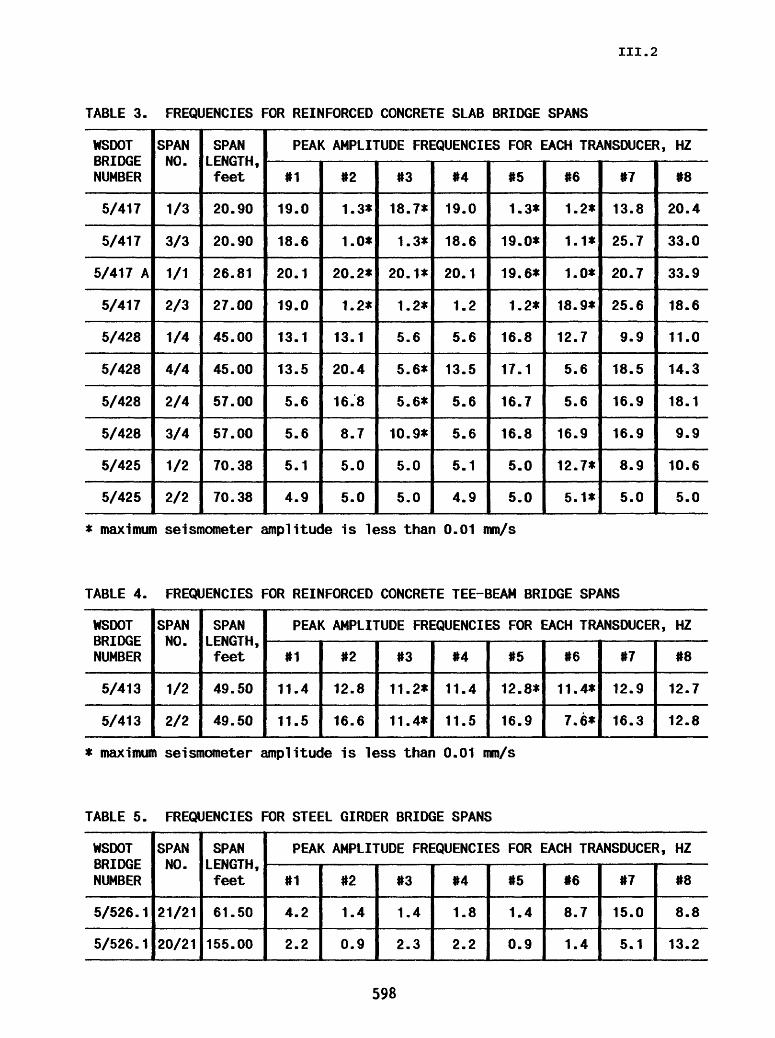
III.2
TABLE 3. FREQUENCIES FOR REINFORCED CONCRETE SLAB BRIDGE SPANS
WSDOT BRIDGE NUMBER
5/417
5/417
5/417 A
5/417
5/428
5/428
5/428
5/428
5/425
5/425
SPAN NO.
1/3
3/3
1/1
2/3
1/4
4/4
2/4
3/4
1/2
2/2
SPAN LENGTH, feet
20.90
20.90
26.81
27.00
45.00
45.00
57.00
57.00
70.38
70.38
PEAK AMPLITUDE FREQUENCIES FOR EACH TRANSDUCER, HZ
#1
19.0
18.6
20.1
19.0
13.1
13.5
5.6
5.6
5.1
4.9
#2
1.3*
1.0*
20.2*
1.2*
13.1
20.4
16.8
8.7
5.0
5.0
#3
18.7*
1.3*
20.1*
1.2*
5.6
5.6*
5.6*
10.9*
5.0
5.0
#4
19.0
18.6
20.1
1.2
5.6
13.5
5.6
5.6
5.1
4.9
#5
1.3*
19.0*
19.6*
1.2*
16.8
17.1
16.7
16.8
5.0
5.0
#6
1.2*
1.1*
1.0*
18.9*
12.7
5.6
5.6
16.9
12.7*
5.1*
#7
13.8
25.7
20.7
25.6
9.9
18.5
16.9
16.9
8.9
5.0
#8
20.4
33.0
33.9
18.6
11.0
14.3
18.1
9.9
10.6
5.0
* maximum seismometer amplitude Is less than 0.01 mm/s
TABLE 4. FREQUENCIES FOR REINFORCED CONCRETE TEE-BEAM BRIDGE SPANS
WSDOT BRIDGE NUMBER
5/413
5/413
SPAN NO.
1/2
2/2
SPAN LENGTH, feet
49.50
49.50
PEAK AMPLITUDE FREQUENCIES FOR EACH TRANSDUCER, HZ
»1
11.4
11.5
«2
12.8
16.6
#3
11.2*
11.4*
#4
11.4
11.5
«5
12.8*
16.9
#6
11.4*
7.6*
#7
12.9
16.3
#8
12.7
12.8
* maximum seismometer amplitude Is less than 0.01 mm/s
TABLE 5. FREQUENCIES FOR STEEL GIRDER BRIDGE SPANS
WSDOT BRIDGE NUMBER
5/526.1
5/526.1
SPAN NO.
21/21
20/21
SPAN LENGTH, feet
61.50
155.00
PEAK AMPLITUDE FREQUENCIES FOR EACH TRANSDUCER, HZ
#1
4.2
2.2
#2
1.4
0.9
»3
1.4
2.3
#4
1.8
2.2
#5
1.4
0.9
«6
8.7
1.4
#7
15.0
5.1
#8
8.8
13.2
598

III.2
Seismic-Induced Landslide Experiments
9950-03391
Edwin L. Harp Branch of Geologic Risk Assessment
U.S. Geological Survey 345 Middlefield Road, MS 998 Menlo Park, California 94025
Randall W. JibsonBranch of Geologic Risk Assessment
U.S. Geological SurveyBox 25046, MS 966
Denver, Colorado 80225
Investigations
Two sites, one in the San Francisco Bay area and one in the greater Los Angeles area will be selected in which instruments will be deployed to collect strong-motion, displacement, and pore-pressure data from active landslides likely to be reactivated in a future earthquake. The strategy will be to emplace surface accelerometers both on and off the landslide mass, pore-pressure transducers (piezometers) within the slide mass below the water table, and extensometers across the headwall scarp or lateral shear surface of the slide. During a future earthquake, surface accelerations, pore-water pressures, and displacements will be recorded simultaneously. The successful recording of such data would greatly enhance the understanding of the physics of the interaction between seismic inertial forces and the landslide-triggering and movement process.
Site selection will be carried out to take advantage of existing landslide sites that are currently instrumented and/or are of high social and economic impact and will have a high probability of movement in a future earthquake. Each landslide site will be instrumented with two surface accelerometers, one on the slide mass and one adjacent to it on stable ground, three to five piezometers at various depths, and one to three extensometers, all to be recorded simultaneously after being triggered by a seismic event. Other piezometers and displacement meters recording on a long term basis will provide displacement and pore- pressure data for several hours or days after shaking stops. Inclinometer casing will be installed to detect subsurface deformation.
Results
Project work has just begun on these experiments. We are presently in the stage of acquiring strong-motion and other instruments to install within the landslide masses eventually selected. Site selection is expected to take place in June and July, 1991.
599

III. 2
Seismic Hazard Reduction Planning Process to Develop Policies and Programs for the City of Seattle
Agreement No. 14-08-0001-G1958
City of Seattle Office for Long-range Planning Room 200 Municipal Building
Seattle, WA 98104
Principal Investigator: Clifford Marks (206) 684-8372
This project will begin the process of developing a Seismic Hazard Reduction Plan. This planning effort could serve as a model for other communities in the Puget Sound region, but is mainly intended to develop and adopt policies and programs to reduce earthquake damage and loss of life within the City of Seattle.
This project will incorporate the research work currently being funded by USGS's National Earthquake Hazard Reduction Program into the City's planning process and translate seismic hazard technical information into terms that are understandable to both the general public and decision makers.
A policy framework for defining acceptable risk will be established and preliminary seismic hazard reduction policies will be prepared. Building code and other land use regulatory changes may be recommended, and input into emergency response planning will be provided. The project is also intended to coordinate the activities of various City departments regarding seismic hazard reduction issues and to establish a uniform seismic information data base.
The work program will consist of the following tasks:
Task 1 Establish City Seismic Hazard Reduction Committee and Consolidate Seismic Hazard Data Used by City Departments
This first task consists of the formation of a Seismic Hazard Reduction Committee to work with the Principal Investigator to ensure communication between departments on this project. At the beginning of the project, each department will submit their priority issues to ensure that these are dealt with during the program. This committee will also give direction to the seismic hazard reduction planning activities carried out under this grant. It will be an objective of this seismic hazard reduction work program to establish a uniform data base concerning seismic information to be used by all City departments.
600

III.2
Task 2 Translate Technical Hazard Based Research Funded Under NEHRP Into Classifications for Risk Reduction Policies
This aspect of the work program will document and incorporate the work currently being done by the USGS and its grantees as part of the National Earthquake Hazards Reduction Program. The objective is to provide information to the general public concerning this data as it applies to Seattle. A Background Report will be prepared that translates seismic hazard technical information into terms that are understandable to both the general public and decision makers.
Task 3 Establish Framework for Acceptable Risk Analysis
The objective of this task is to establish a policy framework for defining acceptable risk. The City needs to address this risk issue in a formal manner based on the type and magnitude of estimated loss. The product of this task will be an Issues Report with a recommended approach to the establishment of acceptable risk.
Task 4 Formulate Preliminary Seismic Planning Policies and Implementation Actions
Based on the review of existing hazard information conducted in Task 2, and the work on acceptable risk analysis conducted in Task 3, preliminary seismic hazard reduction policies will be prepared. The product of this task will be a memo or working paper outlining a preliminary direction for dealing with seismic hazards. It is likely that more detailed recommendations for seismic hazard reduction planning will be undertaken for one type of seismic hazard: liquefaction. This can serve as a model for public policy development concerning other seismic hazards.
Task 5 Establish Technical Advisory Group
This task would provide technical expertise from outside of City government. In addition to ensuring a continuation of the City's seismic hazard reduction effort, the objective is to guide the City's overall planning work and, perhaps, to review specific work products. The committee would be composed of representatives of governmental agencies and research institutions, as well as practitioners, such as geotechnical and structural engineers.
601

III.2
PALEOSEISMIC LIQUEFACTION STUDIES- WABASH VALLEY SEISMIC ZONE
9950-04485
Stephen F. ObermeierBranch of Geologic Risk Assessment
MS 922, U.S. Geological SurveyReston, Virginia 22092
(703) 648-6791
INVESTIGATIONS
A field search for paleoliquefaction features is being conducted throughout the Wabash Valley Seismic Zone. Most of the field sites that have been searched are in actively eroding banks of the largest rivers in the area. Figure 1 shows sites that were searched, and sites where liquefaction features have been discovered.
RESULTS
All large liquefaction features that have been discovered are prehistoric, and probably between 1,500 and 7,500 years old. These large features were caused by an earthquake of 1% 6.2-6.7, based on comparison of the size of prehistoric liquefaction features and their distribution with historic liquefaction in the central and eastern United States. The seismic source for the large liquefaction features was undoubtedly in the Wabash Valley Seismic Zone (fig. 1).
REPORTS
Obermeier, S.F., Bleuer, N.R., Munson, C.A., Munson, P J., Martin, W.S., Me Williams, K.M., Tabaczynski, D.A., Odum, J.K., Rubin, M., and Eggert, D.L., 1991, Evidence of strong earthquake shaking in the lower Wabash Valley from prehistoric liquefaction features: Science, v. 251, pp. 1061-1063.
Obermeier, S.F., 1991, Paleoliquefaction evidence for moderate to strong earthquakes in the earthquakes in the central and eastern U.S.: Geologic Society of America with Programs, v. 23, no. 1, p. Alll.
602

III.2
FIGURE 1. Localities searched having sediment susceptible to liquefaction; dots are sand pits, and rectangles (heavy lines) are stream banks. Sites having dikes are shown in capital letters. Maximum width of dikes shown as L (large, > 15 cm), M (medium, 6-15 cm), or S (small, < 6 cm); question mark indicates uncertain origin or earthquake timing. Blackened area shows the location of vented sand volcanoes induced by liquefaction during the 1811-12 New Madrid earthquake sequence. These small sandblows are the historically reported liquefaction features that were the farthest from the 1811-12 earthquake epicentral region, which is considered to be near New Madrid.
603

III.2
Implementation of Seismic Hazard Mitigation in the Central United States: The Policy - Setting Role of the States
Contract No. 14-08-0001-G1938
Robert B. OlshanskyDepartment of Urban and Regional PlanningUniversity of Illinois at Urbana-Champaign
907 Vi West Nevada StreetUrbana, Illinois 61801
(217)333-8703
Purpose
The purpose of this research has been to examine potential for state-level seismic hazard mitigation policies in the seven member states of the Central United States Earthquake Consortium (CUSEC). The seven states are: Arkansas, Illinois, Indiana, Kentucky, Mississippi, Missouri, and Tennessee. The work has aimed at (1) identifying existing state-level seismic mitigation programs, (2) discovering general trends in the seven states regarding potential for seismic hazard mitigation programs, and (3) identifying potentially effective and feasible policy directions for implementating seismic hazard mitigation.
States are the governmental entities that will be able to set policy and establish funding priorities. This research, therefore, focuses on identifying specific action-oriented policies and programs that states can establish for implementation of seismic hazard mitigation.
Research Approach and Tasks
The research approach has been to examine the laws and institutions of the seven states, in order to assess their suitability as vehicles for implementing seismic hazard mitigation policies. Existing state laws and institutions, even if not directly aimed at mitigation of seismic hazards, can give clues as to the potential success of such efforts in each state. For example, some states have relatively stronger traditions of regulation of land use and construction. Such existing laws establish a potential framework in which to implement seismic hazard mitigation policies.
Research tasks have included review of existing legislation, interviews with key officials, and acquisition and review of relevant government documents. The research has focused on the following questions:
1. What is the current role of each state in seismic hazard mitigation? How might existing laws be used to implement seismic hazard mitigation policies?
2. What are the unique aspects of seismic hazard in each state, requiring customized policy approaches? Liquefaction zones? Unstable river bluffs? Large, economically-significant ports? Important historic resources?
3. Within the existing legal and governmental framework, what is the potential future role of specific state agencies in implementing seismic hazard policy? What agencies are best-equipped to implement seismic hazard policy?
4. What new legislative or policy efforts might be fruitful? Is the state ripe for a new type of program or agency?
604

III. 2
Work Completed
For each state, the following documents have been collected: emergency preparedness acts, planning enabling acts, building code legislation, seismic mitigation work plans, public information documents relating to earthquakes, agency program statements, proposed legislation, and a variety of technical and policy reports.
For each state, we have tried to identify individuals in the following categories: Earthquake Program Manager (Emergency or Disaster Agency) State Geologist or designee Building Code Administratorarchitect/engineer in charge of design of state buildings engineer in charge of dam safety program engineer in charge of highway bridge and embankment design other individuals identified as being active advocates of seismic
mitigation (such as University professors in engineering orgeology)
Thirty-three comprehensive interviews have been conducted, 25 of them in person. These encompass 21 different state agencies in the seven states. These in-depth interviews (averaging two to three hours each) have identified additional issues, which will be investigated via brief telephone conversations with approximately thirty more individuals.
Findings
In-depth analyses of the documents and interview transcripts have not yet been done. However, we offer the following preliminary observations and conclusions.
Preliminary Observations
1. Awareness of the seismic hazard in the Midwest has increased dramatically since 1980. This is due primarily to: the formation and activities of CUSEC; ongoing efforts by FEMA and the USGS under the National Earthquake Hazard Reduction Program, the 1989 Loma Prieta earthquake, and the December 3, 1990 earthquake prediction by Iben Browning.
2. Most states are concerned about mitigating seismic hazards, and are making slow but steady progress. However, virtually all the states are constrained by very tight state budgets (including hiring freezes). Furthermore, mitigation is not an exciting political issue indeed, some mitigation actions are unpopular. Still, many states have used creative and cost-effective techniques to initiate programs to mitigate future earthquake damages.
3. The diffuse nature of the seismic hazard in the Midwest and the relatively level topography imply limited effectiveness of land use regulations, except perhaps along river bluffs and liquefiable alluvial bottomlands. Until the USGS or the states produce specific ground failure and liquefaction hazard maps, land use regulation would not be a very effective means of seismic hazard mitigation.
4. The greatest hazard in the Midwest is the large number of existing unreinforced masonry buildings (URMs), built many years ago with no seismic design considerations.
5. Required rehabilitation/retrofit programs, such as the Unreinforced Masonry Law (SB 547) in California, would be impractical, politically infeasible, and not very cost-effective. Many URMs exist in the Midwest, and, unlike California, the economy does not have enough new development money to help cover the needed repairs.
6. Building codes are not very popular in the Midwest, but are slowly gaining grudging acceptance. New
605

III.2
seismic codes have been introduced in Missouri and Arkansas. Kentucky, Tennessee, and Indiana have had statewide codes for several years, and have been introducing or upgrading seismic requirements. Only Mississippi and Illinois have no statewide code requirements.
7. States can and are requiring seismic standards in construction of publicly-funded buildings and highways. Some states have begun to identify and prioritize bridges in need of seismic retrofit over the next 10 or 20 years.
8. Most states have requirements for seismic design of dams, although almost all these requirements have been introduced in only the last 10 years.
9. Earthquake advisory councils seem to be an extremely effective way of promoting earthquake awareness in state agencies and in providing leadership in mitigating the effects of future earthquakes. The council in Kentucky is an excellent model. Its regular meetings seem to foster steady progress in meeting mitigation goals. It also seems to be successful at facilitating interagency cooperation. Mitigation efforts appear to be much less coordinated in states without such councils (or where the councils have been disbanded).
10. It is known that hazard mitigation efforts are more likely to be successful if they can also address other issues, such as environmental protection or economic development. For example, floodplain protection serves the purposes of hazard reduction, environmental protection, and urban recreation.
Unfortunately, there appears to be no such existing issue that could help carry seismic regulations in the Midwest, particularly much-needed rehabilitation of existing structures. In fact, the converse may be true: existing planning policies serve to discourage URM rehabilitation. This is because the most hazardous URMs tend to be concentrated in decaying central business districts, which often are the focus of planning efforts for physical preservation and economic revitalization. Such revitalization efforts usually are thinly funded, and requirements for seismic rehabilitation would severely strain their budgets. In many ways, requirements to rehabilitate or demolish URMs would run counter to these deeply-rooted existing policies for revitalizing traditional community centers. This dilemma needs to be recognized, policy decisions need to be made, and the implications of these policies must be clearly understood by all parties.
Preliminary Conclusions Recommended State Actions
The most effective state actions for seismic mitigation would require explicit mandates by legislatures and governors. Such actions, all of which appear to be feasible in most of the seven CUSEC states, include:
1. Seismic building codes for new construction, although complete implementation may be limited by funding and enforcement problems.
2. Seismic Advisory Councils, made up of representatives of state agencies, major industries, and universities, with regular meetings (approximately two per year).
3. Tax incentives for seismic rehabilitation.
Even in states where enactment or enforcement of building codes would be difficult, at minimum states could take the following actions:
4. Seismic codes for new schools, hospitals, fire and police stations and utilities (power, water, sewage treatment).
5. Requirements for long-term identification and mitigation of existing hazards in schools, hospitals, fire and police stations, and utilities.
606

III. 2
6. Seismic standards for state-owned structures:
a. Seismic design of all new structures
b. Identification and retrofit of all vulnerable state-owned structures, such as highway bridges and dams.
The following actions could be initiated by individual agencies, without explicit authorization by the legislature or governor. However, all these actions would be facilitated by legislative mandates, particularly if accompanied by funding appropriations (strategies for implementing these actions, even in the face of tight state budgets, will be addressed in the final report).
7. Geologic mapping to identify potential ground failure hazard areas, in order to assist emergency management agencies as well as inform the public.
8. Programs to encourage non-structural mitigation:
Brochures and handbooks
Training of local emergency service personnel and building officials to provide local educational programs
Free kits, for hot water heater strapping, affixing appliances, etc.
9. Cooperation with historic preservation agencies to prepare guidelines for rehabilitation that is sensitive to both cultural resources and seismic safety.
10. Seismic mitigation handbooks and guidelines for local officials, including model local seismic mitigation plans. Contents to include:
How to inventory buildings, and how to prioritize for retrofit.
Funding opportunities for retrofitting funding sources, as well as hints on how to combine retrofit projects with other capital improvement projects.
How to address the historic preservation issues, both before and after an earthquake.
11. Education programs (workshops, handbooks, newsletters) for design professionals, in order to elevate the accepted standard of practice (this has legal implications, which encourage compliance).
12. Model ordinances that can be adopted by local agencies as appropriate.
607
III.2
LATE QUATERNARY FAULTING, SOUTHERN SAN ANDREAS FAULT
9910-04098
Michael J. Rymer
Branch of Engineering Seismology and GeologyU.S. Geological Survey
345 Middlefield Road, MS/977Menlo Park, C A 94025
(415)329-5649
Investigations
1. Continued investigation of the Quaternary history of the San Andreas fault zone in the Coachella Valley, with special emphasis on structure and stratigraphy.
2. Shallow seismic-reflection profiling across strands of the San Andreas fault zone in the Coachella Valley (work in cooperation with K.M. Shedlock, Denver).
Results
1. Geologic mapping in the northwestern part of the Mecca Hills (Thermal Canyon 7 1/2- minute quadrangle) shows newly recognized fault relations within late Cenozoic deposits. Antithetic faults between the San Andreas and Skeleton Canyon faults indicate fault interaction where the two larger faults are closest. Somewhat similar antithetic faults are present between the Skeleton Canyon and Painted Canyon (or Mecca Hills) faults. Measured orientations of slickensides and offset relations indicate dominantly horizontal motion on faults (primary and antithetic) in the Mecca Hills.
2. Shallow seismic-reflection and refraction data were collected along eight lines that cross strands of the San Andreas fault zone in the Coachella Valley. The seismic profiles were located to cross the Banning fault at three sites and the Mission Creek and Garnet Hill faults at two sites each. The lines are from 1 to 4.5 km long. Locations of these lines are along Whitewater Canyon, Indian Avenue, Mt. View Road, Long Canyon Road, and Thousand Palms Canyon. Two of the eight profiles crossed the San Andreas fault southeast of the Banning and Mission Creek strands of the fault zone, at North Shore and Durmid Hill. The profiling technique used is the Mini-Sosie system that has ground tampers (wackers) as the seismic source. Initial results show good first arrivals and local reflectors. These preliminary results are significant improvements over earlier attempts with the same system in the Coachella Valley. Data collected will be processed and analysed in the summer of 1991.
Reports
None.
04/91 608

III.2
Wasatch Front and Intraplate Recurrence
9910-04102
David P. Schwartz Branch of Engineering Seismology anf Geology
U. S. Geological Survey345MiddlefieldRoad,MS977
Menlo Park ,CA 94025(415)329-5651
Investigations
The objective of the project is to define earthquake recurrence models for intraplate extensional environments. Work focuses on evaluating the degree to which recurrence on fault segments is time dependent or Poisson, quantifying periods of quiescence between active cycles on faults, and evaluating temporal clustering on adjacent fault segments during active cycles. This information forms the basis for formulating approaches for long-term forecasting, including probabilistic analysis, of intraplate normal faults.
Results
Available Wasatch fault zone (WFZ) paleoseismologic data for the past 6 ka have been used to estimate 50- and 100-year Poisson and time-dependent probabilities for a M 7 earthquake along the WFZ. Five of the six active fault segments have produced M 7 events during an earthquake sequence that began about 1.4 ka and has continued to about 300 years ago. Only the Brigham City segment, with an elapsed time of 3.6 ka, has not had an event during this most recent temporal cluster. The occurrence of 15 to 17 M 7 events during the past 6 ka, yields 50- and 100-year Poisson probabilities (Pso and Pioo) of 0.12-0.13 and 0.22-0.25, respectively, for an event anywhere along the WFZ. Within the current active sequence the average repeat time of 183-220 years (5-6 events in 1.1 ka) and the 75-400 interval between successive events yields Poisson probabilities of Pso 0.16-0.24 and Pioo 0.29-0.42. Poisson probabilities provide no information on the location of the next WFZ event. Time-dependent conditional probabilities are based on the geologic behavior of individual fault segments. Therefore, no one single recurrence model appears to be appropriate for all segments. The most recent faulting episode on the Brigham City segment occurred as two events, 3.6 +/-0.25 and 4.8 +/-0.25 ka ago,
609
III.2
with 1.5-2 m slip per event. The direct recurrence time estimate is 3-4 ka per episode (3-4m/ (1 mm/yr)) and the 50- and 100-year conditional probabilities are 0.03 and 0.07, respectively. For comparison, 100 year probabilities for the other Wasatch segments, based on their segment-specific recurrence times, are less than 0.02. Rupture of the Brigham City segment would complete the current active sequence along the WFZ.
Reports
Lund, W.R., Schwartz, D.P., Mulvey, W.E., Budding, K.E., and Black, B.D., 1991, Fault behavior and earthquake recurrence on the Provo segment of the Wastch fault zone at Mapleton, Utah County, Utah: Utah Geological And Mineral Survey, Special Studies 75, 41p.
Nishenko, S.P. and Schwartz, D.P., Preliminary estimates of large earthquake probabilities along the Wasatch fault zone, Utah (abs): EOS, v. 71, N0.43, P.1448.
°4 /91610

III.2
Fault Segmentation: San Andreas Fault System
9910-03983
David P. Schwartz, Thomas E. Fumal, and Karin E. Budding Branch of Engineering Seismology and Geology
U. S. Geological Survey345MiddlefieldRoad,MS977
Menlo Park ,CA 94025(415)329-5651
Investigations
The objective of the project is to quantify the behavior of the San Andreas fault between Tejon Pass and San Bernadino, and in the Santa Cruz mountains, and of the Rodgers Creek fault, with regard to segmentation, recurrence, slip rate, and slip per event. These parameters form the basis for long-term earthquake forecasting.
Results
1. San Andreas fault zone-Santa Cruz Mountains. Investigations have been completed on the comparison between 1906 and 1989 surface fracturing. We have systematically reviewed the observations of 1906 surface faulting from the perspective of surface effects associated with the 1989 Loma Prieta earthquake, insights gained from correspondence between some of the principal 1906 investigators, a geomorphic analysis of the fault trace, and new geologic data from trenches. As a result, we have identified major uncertainties regarding the extent and amount of 1906 surface faulting in the Santa Cruz Mountains. We believe that there is a basis for concluding that surface faulting did occur as far south as San Juan Bautista in 1906. However, there is no geologic basis for constraining the amount of 1906 slip. The Wrights tunnel offset, which has been a focal point in the debate over the amount of 1906 slip, is an uncertain measurement and should only be used with strong qualification in earthquake recurrence and forecast models for this segment of the fault zone.
Three trenches were excavated across the San Andreas fault at Grizzly Flat, where the fault is expressed as a shutter ridge in the Purisima Formation and a 1.9m-high scarp in late Holocene alluvium. The trenches expose faulted channel gravels, sands,
611
III.2
silts, and colluvium derived from the scarp and shutter ridge. Within the trenches shearing is distributed across a narrow (1-2m) zone in which the main fault trace dips steeply northeast and the sense of vertical separation is normal. The site has potential to yield a late Holocene slip rate. Preliminary radiocarbon dating of an in place burn indicates at least one surface faulting earthquake during the past 490 ±80 14 C yr B.P.
2. Rodgers Creek fault zone. Ten new charcoal samples from trenches excavated in April 1990 allow us to revise slip rate estimates for the fault zone. Preliminary evaluation suggests a slip rate of >6.4-10.4 mm/yr for the past 550-600 years, a rate comparable to the Hayward fault. The most recent surface faulting earthquake occurred between 1403 and 1808 AD.
Reports
Budding, K.E., Schwartz, D.P., and Oppenheimer, D. H., 1991, Slip, rate, earthquake recurrence, and seismogenic potential of the Rodgers Creek fault zone, northern California: initial results: Geophysical Research Letters, v. 18, p. 447-450.
Prentice, C. S., and Schwartz, D.P., 1991, Reevaluation of 1906 surface faulting and geomorphic expression of the San Andreas fault in the southern Santa Cruz Mountains and implications for seismic hazard in the Loma Prieta area , submitted to Seismological Society of America Bulletin, March 1991.
61204/91
III. 2
EARTHQUAKE LOSS ESTIMATES IN THE STATE OF WASHINGTON FOR INSURANCE REGULATION PURPOSES
C.E. Taylor, C.B. Crouse, C.W. Tillman, and B. Olsen Award No. 14-08-0001-G1983
Background and Methods Proposed
Previous studies have shown that insurance financial incentives can encourage cost- effective earthquake risk-reduction measures (see Kunreuther and Kleffner, 1991). In this study, we examine in the State of Washington earthquake insurance regulatory issues, issues related directly to financial incentives and indirectly to risk-reduction measures. These issues pertain to
the adequacy of current earthquake premiums
effects of deductibles on premiums
loss implications of large catastrophic earthquakes
implications of a mandatory offer among personal lines carriers
implications of hypothetical state programs for coverage of lower-level earthquake losses to residences.
To begin to address these issues, we have developed an earthquake risk and insurance method that permits (a) multiple simulations ("walk-throughs") over time of earthquake losses to a specific aggregation of facilities and (b) assessment of the financial impacts of these simulations on specific insurance structures, whether private or public. (See Beard et al., 1984, for the generic type of models used.)
Implementation of this method requires assets inventory, geological hazards identification and assessment, seismic vulnerability modeling, and risk and financial modeling. For purposes of clarifying uncertainties in seismic risk estimates, we are developing a logic tree which permits the assessment of alternative plausible accounts of earthquake hazards. For the construction of financial and insurance structures, we are working with representatives of the State of Washington Insurance Commissioners Office.
Implementation and Difficulties Encountered So Far
Two major difficulties have arisen so far. First, it is uneconomic to model in detail all possible insurance constructs, public or private. Hence, the range of these possible constructs analyzed will be limited. Second, current inventories of residential construction have so far been developed predominantly in terms of one structural vulnerability category:
613

III. 2
wood frame. Yet investigations of past earthquakes have shown that wood frame structures vary considerably in their seismic performance (McClure, 1973; R.P. Gallagher and Associates, Inc., 1990). Implications of this uncertain inventory of wood-frame structures will need to be analyzed in this project.
REFERENCES
Kunreuther, Howard and Anne E. Klefrher, 1991, "Should Earthquake Mitigation Measures Be Voluntary or Required?" Philadelphia: University of Pennsylvania, The Wharton School, Risk and Decision Process Center Working Paper #91-04-01, April.
Beard, R.E., T. Pentikainen and E. Pesonan, 1984, Risk Theoryr 3rd edition. London: Chapman and Hall.
McClure, F.E., 1973. Studies in Gathering Earthquake Damage Statistics. Washington, B.C.: U.S. Coast and Geodetic Survey.
R.P. Gallagher Associates, Inc., 1990, "Mitigation of Principal Earthquake Hazards to Wood Frame Dwellings and Mobile Homes," San Francisco: for the State of California, Department of Insurance.
614

III.2
Implications for Tectonics, Paleoseismicity, and Ground Failure from Soft- Sediment Deformation in the Marked Tree Area of the New Madrid Seismic Zone
Agreement No. 14-08-0001-G2001
Martitia Tuttle and Leonardo SeeberLamont-Doherty Geological Observatory
Palisades, New York 10964
(914) 359-2900
IntroductionThe 1811-12 earthquakes of the New Madrid Seismic Zone (NMSZ) in the
east-central United States caused some of the most widespread and intense liquefaction and ground deformation ever recorded. The study of this earthquake sequence and its effects is crucial for addressing earthquake hazard issues as well as fundamental questions about intraplate seismogenesis.
This study of earthquakei-induced deformation in the Quaternary sediments of the NMSZ focuses on both primary and secondary ground deformation, geologic factors controlling ground failure, and deformation features, including liquefaction features, that can provide information about the timing, location, and magnitude of prehistoric earthquakes. Although each of these topics is of interest to specific audiences and has its distinct sets of problems, each is clearly related to the other and can be addressed during the same investigation. This study is focussed in the vicinity of Marked Tree, Arkansas in the southern portion of the NMSZ and involves both image analysis as well as subsurface investigation of selected sites (Fig. 1).
Analysis of Remote-Sensing Data and Field InvestigationThis project involves two related efforts: (1) a comparative analysis of remote
sensing data, including LANDSAT and SPOT panachromatic images, and aerial photographs of the southern portion of the NMSZ, and (2) a field investigation of specific deformation features within a 30 km2 area of the NMSZ centered on Marked Tree, Arkansas (Fig. 2). The first phase of the project which has just begun involves the analysis of various types of imagery for identifying structural features and differentiating tectonic and non-tectonic deformation. The second phase scheduled for October 1991 involves checking the results of the image analysis by conducting detailed investigations at selected sites. These two efforts are complementary, the first placing localized deformation into its broader context, and the second providing the ground truth.
LANDSAT and SPOT imagery is currently being ordered and will be analyzed with an International Imaging System prior to fieldwork. The satellite data will be enhanced and printed at Lament using an in-house image processing facility. This facility will make it possible to create custom maps based on satellite data and to
615

III.2
incorporate additional data types already available (topography, geological, and seismicity data) or gathered during this project. Scanned versions of aerial photographs can also be analyzed and merged with the satellite data to provide high resolution spatial detail in areas of special interest. We anticipate that the satellite images will be especially useful in identifying both geological and topographic influences on surface effects of ground failure still remaining from the 1811-1812 earthquakes.
We will attempt to identify from the imagery large-scale including folding, faulting, tilting and warping and small-scale deformation possibly including sandblows, sunklands and fault-block fissures related to liquefaction and ground failure. Based on the analysis and field reconnaissance scheduled for July 1991, sites will be selected for subsurface investigation. These investigations will include (1) topographic surveys, (2) subsurface surveys with ground-penetrating radar where appropriate, and (3) documentation of deformation structure as well as description and analysis of sediments exposed in stream channels, canals, and trenches. The depth, thickness and lateral continuity of soil horizons and sediment layers and facies relationships, grain-size distribution, environment of deposition of subsurface sediments will be evaluated. Any evidence of previous liquefaction events revealed in exposures will also be documented and appropriate samples collected for radiocarbon analysis.
ReferencesFuller, M.L., 1912, The New Madrid earthquake, U.S. Geological Survey
Bulletin, v. 494,119 p.
616
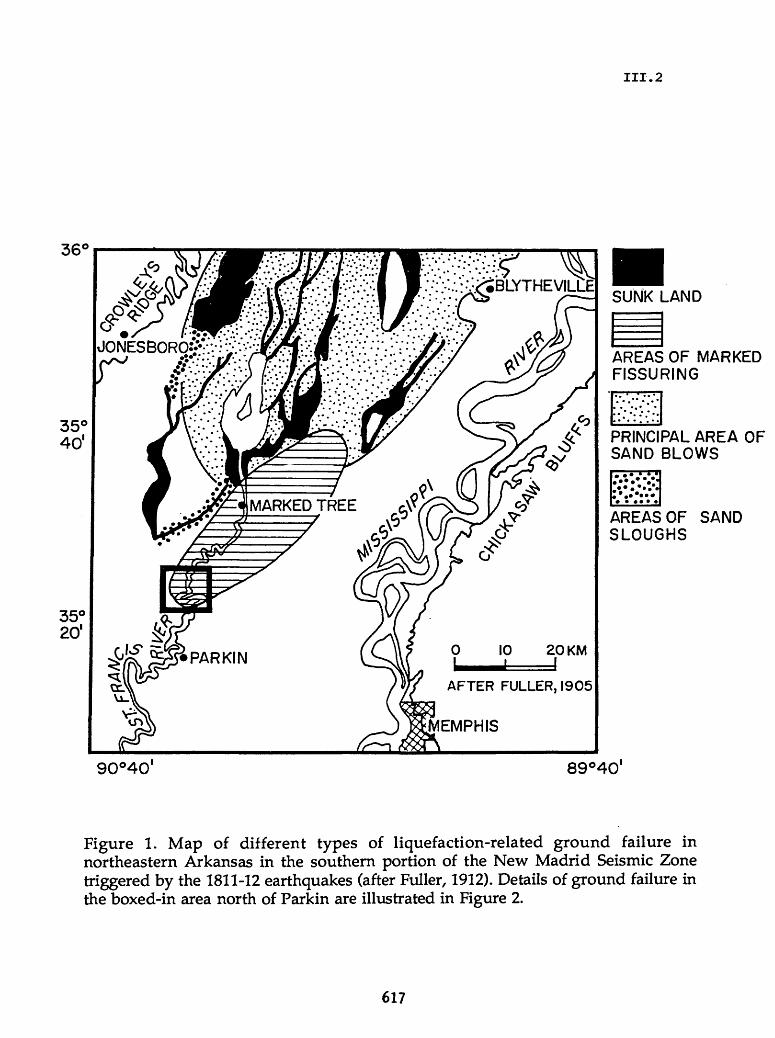
III. 2
36
0 10 20 KM J I
AFTER FULLER, 1905
MEMPHIS
SUNK LAND
AREAS OF MARKED FISSURING
PRINCIPAL AREA OF SAND BLOWS
AREAS OF SAND SLOUGHS
90°40' 89°40'
Figure 1. Map of different types of liquefaction-related ground failure in northeastern Arkansas in the southern portion of the New Madrid Seismic Zone triggered by the 1811-12 earthquakes (after Fuller, 1912). Details of ground failure in the boxed-in area north of Parkin are illustrated in Figure 2.
617

III.2
LOG LAKE
SfMPLE FISSURES PARALLEL
TO RIVER
V\ I
DEEP COMPOUND FISSURES
COMPOUND FISSURES"
Figure 2. Location map of fault-block or compound fissures along the St. Francis River (after Fuller, 1912). These fissures probably resulted from lateral spreading during the 1811-12 earthquakes. Note that most of the compound fissures trend northeast and are parallel to the overall trend of the river but not to local river bends. The location of this area is indicated on Figure 1. For scale, the area is 11 km by 11 km.
618
III.2
Earthquake Hazards Studies, Metropolitan Los Angeles Western Transverse Ranges
9540-02907
R. F. YerkesBranch of Western Regional Geology
345 Middlefield Road - MS 975Menlo Park, CA 94025
Investigations and results
1. Geologic studies: computer-aided (Arc/Info) compilation and mapping of the Los Angeles 1:100,000 quadrangle, Southern California (with P. K. Showalter, R. H. Campbell, and C. M. Wentworth). Submitted for open file release full-color geologic map of the 1:24,000 Thousand Oaks quadrangle, one of eight that make up the SW quarter of the Los Angeles 1:100,000 sheet. Geologic maps of adjoining Calabasas, Canoga Park, and Newbury Park 1:24,000 quads completed ready for review. Each 1:24,000 quad includes all exploratory wells and fossil localities of record, with supporting data. These four quads then composited and reduced to 1:100,000 to test the quality of the reduction process.
Compilation of Malibu Beach 7-1/2* quad (adjoins Calabasas quad on the south) begun. This quad and those adjoining contain most exposures of the middle Miocene Topanga Group, a complex sequence of marine, nonmarine, and volcanic units, not previously mapped in its entirety. They also contain the previously recognized but incompletely mapped regional-scale detachments that underlie much of the Santa Monica Mountains (Campbell and others, 1966, in U. S. Geol. Survey Prof. Paper 550-C, p. C1-C11).
Reports
Yerkes, R. F., and Showalter, P. K., 1991, Preliminary geologic map of the Thousand Oaks 7.5' quadrangle, Southern California: U. S. Geological Survey Open File Report 91-_.
619

III.3
Expert Synthesis and Translation of Earthquake Hazard Results A Book for Non-Scientists in the Wasatch Front Region
14-08-0001-G1671
W. J. Arabasz and D. R. Mabey Department of Geology and Geophysics
University of UtahSalt Lake City, Utah 84112-1183
(801) 581-6274
Investigations
This "implementation" project is part of the culmination of recent NEHRP focus on Utah's Wasatch Front region. The goals of the project have been: (1) to coordinate with the scientific investigators who have worked in the Wasatch Front earthquake-hazards program in order to develop a synthesis of important technical information, (2) to produce intermediate- level summaries from those discussions, and finally, (3) to "translate" the technical information into a book on the earthquake threat in Utah for non-scientists. The book has been designed to appeal to (i) the general public (who must encourage and support elected and appointed officials to make decisions on implementing earthquake-hazard-reduction measures), (ii) teach ers and students, and (iii) decision-makers themselves.
Results (October 1,1990 - March 31,1991)
Ongoing collection of resource materials, preparation of illustrations, and final writing as part of completion of draftscript
( Note The scheduled completion date for this project is June 30,1991. Production and printing of the book by the Utah Geological Survey \villproceed after that date.)
620
III. 3
Implications of the Loma Prieta Earthquake for Local-level Hazard Mitigation Programs
Grant No. BCS-9003598
Patricia A. BoltonBattelle Human Affairs Research Centers,
4000 N.E. 41st StreetSeattle, WA 98105
(206) 528-3310
Research ObjectivesThe Loma Prieta earthquake of October 17,1989 caused billions of dollars in damage
throughout the San Francisco Bay region and counties to the south. Much of the damage incurred involved types of structures and elements of structures for which vulnerability to seismic forces is weU understood
As part of the National Earthquake Hazard Reduction Program (NEHRP) various Federal, state, and regional programs have been carried out in past years to promote the implementation of local-level earthquake preparedness and loss reduction activities. The Loma Prieta earthquake provided an opportunity to examine the specific lessons local agency staff have learned through having their preparedness plans and loss reduction priorities and programs tested by a major earthquake in the region.
The research is currently onging. The principal project objectives are to examine:
local level indicators of the effectiveness of pre-quake mitigation activities as tested by the Loma Prieta earthquake;
the effects of the earthquake as a major regional event on local level mitigation priorities and activities since November 1989.
the utility of hazard mitigation information and assistance provided through regional, state, and Federal programs.
An additional objective is to examine the ways in which the Hazard Grant Mitigation Program, established by the Robert T. Stafford Disaster Relief and Emergency Assistance Act of 1988, may have served as an incentive to local jurisdictions to identify and address specific mitigation opportunities. The grant program is for activities that substantially reduce the risk of future damage, hardship, loss, or suffering resulting from a major natural disaster, and requires a 50% match on the part of the recipient jurisdiction. The Hazard Mitigation Grant Program being implemented by the State of California has established eight priority areas, local jurisdictions have submitted hazard mitigation plans and grant proposals, and as of May 1991, the proposals have been reviewed and jurisdictions notified of the funding status of their various proppsed projects.
621

III. 3
Data CollectionInitial data collection for this project coincides with the notification stage of the grant
program. To date, interviews have been conducted with agencies in several jurisdictions, including The City and County of San Francisco, Portola Valley, Alameda County, City of Oakland, City of Hayward, Santa Clara County, City of San Jose, City of Los Gatos, City of Watsonville, City of Santa Cruz, and Santa Cruz County. Interviews are being conducted with persons in positions related to mitigation planning and programming, including representatives of planning departments, public works and building departments, emergency services, elected officials, and planning consultants. In the initial interviews the central topics examined include: the type of damage the jurisdiction experienced, pre- earthquake efforts to set priorities or establish programs, indicators of damage averted or that could be averted with future programs, current priorities and programs to enhance preparedness and reduce losses in the future, and types of technical assistance that have proved useful or that are needed. The findings from these interviews will be used to develop a very focused instrument that will be used to collect information on these topics from approximately 35 jurisdictions in the counties included in the disaster declaration for Loma Prieta.
622

III.3
NEAR-SURFACE LITHOLOGIC AND SEISMIC PROPERTIES
9910-01168
J.F. GibbsW.B. Joyner
Branch of Engineering Seismology and GeologyU.S. Geological Survey
345 Middlefield Road, MS 977Menlo Park, California 94025415/329-5631 or 415/329-5640
Investigations
Measurements of seismic velocity and attenuation to determine the effect of local geology on strong ground motion and to aid in the interpretation of seismic source parameters.
Results
1. Twenty boreholes have been completed in the San Francisco Bay area at strong-motion recording sites from the Loma Prieta earthquake, M7.1, of 17 October 1989. The boreholes range in depth from 100-350 ft and have been logged for lithology, determined from drill cuttings and samples, and then cased for downhole logging of P- and S-wave velocities. These data are needed by the Structural Engineers Association of Northern California to improve the correlation between earthquake ground motions and local geology for revision of the Uniform Building Code.
In addition, shear velocity, in conjunction with geologic mapping, is used as a parameter to expand the seismic data base to a regional scale for delineating the earthquake shaking hazard for microzonation.
2. The recording of the Loma Prieta earthquake at Gilroy #1 (bedrock) and #2 (alluvium) have been analyzed for spectral decay parameter K for three local earthquakes. The results are shown in table 1.
The values of K in the interval 2-12 Hz show a consistent magnitude dependence, that is, the values increase as the magnitude of the earthquake increases. The distance dependence of K, observed by Anderson and Hough, 1984, can account for only a small percentage of the differences of the observed K values. The tentative conclusion from these data is that the spectral decay parameter K has a strong magnitude dependence where the high spectral frequencies attenuate at a faster rate for the higher magnitude earthquakes.
623

III.3
TABLE 1Spectral Decay Parameters for Accelerograms
Recorded at Gilroy Stations #1 and #2
Date Earthquake Distance (km)
Magnitude K(Kappa) (2-12 Hz) (2-20 Hz)
08/06/78 04/24/84 10/17/89
Coyote Lake Morgan Hill Loma Prieta
15.939.428.6
Gilroy #15.9 6.2 7.1
Gilroy #2
0.023360.038610.06762
0.021170.042280.05758
08/06/7804/24/8410/17/89
Coyote LakeMorgan HillLoma Prieta
14.238.828.6
5.96.27.1
0.057210.061390.08633
0.066200.054310.05714
Reference:
Anderson, John G., and Hough, Susan E., 1984, A model for the shape of the Fourier amplitude spectrum of acceleration at high frequencies: Bulletin of the Seismological Society of America, v. 74, p. 1969-1993.
Reports
No reports this period.
04/91
624

III.3
EARTHQUAKE SOURCE AND EFFECT STUDIES
9950-04560
S. H. Hartzell, A. M. Rogers, J. S. Gomberg Branch of Geologic Risk Assessment
U.S. Geological SurveyBox 25046, MS 966, Denver Federal Center
Denver, CO 80225(303) 236-1600
Investigations
1) The 1989 Loma Prieta earthquake is used to test the ability to predict near-source strong-ground motions using a teleseismically derived rupture model and locally recorded aftershocks. This study has broad application since many seismically active areas do not have strong motion instrumentation and the only ground motion records for larger earthquakes come from teleseismic distances. Digital, world-wide, body-waves for Loma Prieta have been used in an inversion scheme to obtain a detailed picture of the rupture history. This rupture history is used to calculate mainshock ground motion time histories at the strong motion sites. The calculations are done using the entensive aftershock record data set, thereby incorporating the correct propagation path effects. Comparison of the calculated records with the mainshock strong motion records will allow evaluation of the method.
2) A relatively new design concept for buildings calls for the insulation of the structure from earthquake ground motions by base-isolation. Base-isolation is usually accomplished by placing the building on a damped spring system. The objective of this research is to evaluate for what earthquake magnitudes and what distances from the rupture plane such a structure will perform desirably.
3) Regression and exploratory data analysis of peak acceleration data for site effects.
4) Editing of the USGS Professional Paper "Assessing and reducing earthquake haz ards in the Pacific Northwest".
5) Analysis and interpretation of the Whittier Narrows aftershock data for site effects.
6) Research on the Southern Great Basin seismicity has included the development of a model of the spatial variations in detection/ location threshold of the Southern Great Basin Seismic Network (SGBSN) vicinity and a method for interpreting seismicity patterns in terms of variations in the shear strain field. For the latter, strain field models are calculated assuming a uniform background regional strain field is modified by long term behavior of the youngest faults in the region. In addition to providing some insight as to why small earthquakes are distributed in a particular fashion, this also allows inferences about which faults are most likely to generate large earthquakes. Shear strain fields are derived using a 2-dimensional boundary element algorithm. A version of the algorithm that permits finite deformations has been developed and is now being tested.
625

III.3
7) Map view boundary element models of the shear strain field in the New Madrid region are correlated with seismicity patterns and models of the dilational strain field are correlated with morphologic features in order to infer what the likely dimensions and geometry of the major faults in the New Madrid seismic zone are. The algorithm is also being expanded to allow for regions of differing elastic properties and to calculate exact cross-sectional strain fields in a layer over a half-space. The latter is being developed (analytic solution and code) in order to study the effect of the thick sediment layer in the region on surface observations of rupture and other types of deformation occurring at depth.
8) Upgrade of Southern Great Basin Seismic Network.
Results
1) Broadband, digital, teleseismic body-waves (P and SH) have been inverted to obtain the history of slip for the 1989 Loma Prieta earthquake (Hartzell et a/. , 1991). The results of these calculations are summarized in Figure 1. In the top frame of Figure 1 the slip distribution has been integrated to obtain a plot of moment release as a function of time. The best-resolved and major component of moment release takes place in the first 7.5 sec, as indicated by the shaded portion of the plot. The central frame in Figure 1 shows the corresponding distribution of slip on the fault plane for the shaded portion of the moment release function. The contours of slip are in centimeters. The bottom frame shows a vector plot of the rake as a function of position. The size of the arrows is proportional to the amplitude of the slip. In this model the hypocenter is indicated by a star and the best-fitting rupture velocity is 2.5 km/sec.
Given the above model all that is required to calculate the near-source strong-ground motions are the propagation path effects from the source to the local receivers. Adequate knowledge of these effects are often lacking. Therefore we use recordings of aftershock records as Green's functions (Hartzell, 1978). We use the aftershock data set collected by the USGS and compiled on compact disc (Mueller and Glassmoyer, 1990). Several of the strong motion sites which recorded the Loma Prieta mainshock were co-located in the aftershock recording program to facilitate studies like this one. The aftershocks should be well distributed over the fault plane of the mainshock rupture to ensure that variations in propagation effects are properly represented and to minimize interpolation errors. Of the strong motion stations that were co-located, 11 sites within 65 km of the epicenter recorder a sufficient number of aftershocks for our analysis. Before the aftershock records can be utilized in the calculations they must be properly scaled. The magnitude range of the aftershocks used is from 2.7 to 4.0. This range is set by the restrictions of having records of sufficient amplitude but not clipped, and also included enough events to obtain adequate spatial coverage. The aftershock records have all been scaled to have the same rise time as the average magniude 4.0 event by convolution with trianular functions of varying widths. The records are then scaled in amplitude to a common moment. The comparison between the observed mainshock records and those from the aftershock summation will be done over the frequency band of 0.5 to 5.0 Hz. This bandwidth is based on the lower frequency limit to which the instrument response can be successfully removed from the aftershock
626

III.3
records, and the upper frequency limit to which we feel confident in our summmation procedure.
2) The critical feature of base-isolated structures is the limited amount of displacement (typically 0.3 to 0.5 meters) that can be tolerated before significant damage to the building occurs. We have studied the hypothetical response of base-isolated buildings to synthetic near-field ground motions for large Mw > 7.0 strike-slip earthquakes. The slip on large strike-slip earthquakes can average 5 meters or larger. Assuming symmetric deformation on opposite sides of the fault, we calculate fault-parallel ground displacements as large as one-half of the fault slip within 2 km of the fault plane. This displacement occurs as a ramp whose duration depends upon the slip duration on the fault and the distance of the site from the fault. Away from the epicenter and within 10 km of the fault, a large displacement pulse (no net offset) occures on the fault-perpendicular component from SH waves enhanced by directivity effects. Its amplitude is comparable or larger than the ramp displacement on the parallel component. The response of base-isolated structures to these large-amplitude ground displacements depends on the natural period of the damping system and the duration of the large displacement pulses. If the natural period is comparable to the duration of the displacement pulse, which seems to be a case for many structures, the isolation system can be overdriven.
3) We have used exploratory data analysis and regression analysis to analyze 1241 peak accelerations from 180 earthquakes worldwide for magnitude and distance scaling and the effects of geologic site conditions. The site conditions are hard rock, soft rock, Holocene soil, Pleistocene soil, shallow soil (0-10 m), and soft soil (bay mud).
Expecting that changes in predominant period for peak accelerations as a function of attenuation and source size would lead to differences in site-dependent peak accelerations and observing in simple regressions several site conditions with statistically significant dependence on magnitude and/or distance led us to consider a class of regression equations having magnitude- and distance-dependent site effects. We found a regression model that fits the theoretical stochastic estimates of peak accelerations, including site effects for shallow soil and soft soil. Our theoretical model predicts only distance-dependent shallow and soft soil effects, but not magnitude-dependent effects. Peak accelerations on shallow soil, for example, decrease from values 220% higher than those for rock at 10 km to values equal to those for rock at about 100 km. Peak accelerations on soft soil increase from values 150% greater than those for rock at 10 km to values 240% greater than those for rock at 300 km.
A regression model with the same parameters used to fit theoretical values also fits the observations well at significance levels less than 1%. The regression on observed data, however, predicts somewhat greater soft-soil site effects than the regresseion on theoretical values. For example, soft-soil peak accelerations increase from values 200% greater than those for rock at 10 km to values 320% greater at about 300 km. In any case, our results based on either theory or data contrast with those derived from most existing regression equations, which suggest peak acceleration at soil sites is no more than 30% greater than that at rock sites.
627

III.3
4) Revision of the introductory chapter and review and revision of the final 6 chapers is in progress. Altogether about 21 chapters will be included in the Pacific Northwest Professional Paper.
5) It appears that the stations recording Whittier Narrows aftershocks that we are using in the initial examination of the data may be significantly contaminated by source effects. If source effects are involved, the experiment planned will be more difficult. We are attempting to model the source effects to test this interpretation of the data.
6) A model of the spatial variations in detection/location threshold of the Southern Great Basin Network (SGBSN) vicinity has been developed allowing seismicity patterns to be identified. Analysis of these seismicity patterns shows that 1) complex patterns of shear strain imply that off-fault seismicity should be expected and that the relationship of small earthquakes with a distribution of faults is not simple, 2) lobes of high shear strain are associated with fault ends, bends, and intersections and may explain why earthquake clusters cover regions much larger than the surface projections of any of the mapped faults, 3) large amplitude modeled slip coupled with the association of low seismicity and shear strain in the actively deforming region west of the Death Valley/Furnace Creek fault system suggests that the fault configuration in the area is optimal for relaxing regional deformation via the occurrence of large earthquakes or creep, 4) small amplitude modeled slip coupled with the same association of low seismicity and shear strain at Yucca Mountain may be indicative of a lack of accumulated strain and thus, a low potential for a large earthquake there.
7) Map view boundary element modeling indicates that the dimensions of New Madrid seismic zone (and 1811-1812 rupture zone) is no greater than 200 km long. Two major strike-slip fault zones may be coincident with the regions of most concentrated modern microseismicity. The slip on such faults was either focused towards the Lake County uplift or occurred on a system of smaller faults aligned along the axis of the Reelfoot Rift. The Rift boundaries do not appear to be significant in shaping modern seismicity or morphology.
8) The progress of the SGBSN upgrade includes the following; 1) portable seismo graphs have been received and the first testing phase has been completed, 2) accelerome- ters to be used for portable and strong motion stations are being tested in the lab and field, 3) awards for all permanent network equipment are in the final stages of negotiation with all system design essentially completed, 4) field preparations for permanent installations have begun, 5) all computer systems are operational and software is ready for testing with real data.
Reports
Bufe, C. G., A. M. Rogers, M. H. Hopper, M. E. Meremonte, F. R. Singer, J. S. Gomberg, and K. M. Shedlock (1991). Historical and Current Seismicity, DOE Study Plan 8.3.1.17.4.1.
628

III.3
Gomberg, J., K. Shedlock, and S. Roecker (1990). The effect of S wave arrival times on the accuracy of hypocenter estimation, Bull. Seism. Soc. Am., 80, 1605-1628.
Gomberg, J. S. (1991). Seismicity, detection/location threshold, and shear strain in the Southern Great Basin, EOS AGU, 71.
Gomberg, J. S. (1991). Seismicity and shear strain in the Southern Great Basin of Nevada and California, J. Geophys. Res., (in press).
Gomberg, J. S. (1991). Seismicity and detection/location threshold in the Southern Great Basin Seismic Network, J. Geophys, Res., (in press).
Gomberg, J. S. (1991). Seismicity, morphology, and deformation modeling: tools for seismic hazard assessment in intra-plate regions, Front Range American Geophysical Union Meeting, Boulder, Co. (abstract).
Gomberg, J. S. (editor) (1991). Committee for the advancement of science in the Yucca Mountain project symposium on fractures, hydrology, and Yucca Mountain: ab stracts and summary, U.S. Geological Survey Open-File Report, 91-125, 39p.
Hartzell, S., G. Stewart, and C. Mendoza (1991). Comparison of LI and L2 norms in a teleseismic waveform inversion for the slip history of the Loma Prieta, California, earthquake, Bull. Seism. Soc. Am., in press.
Heaton, T., and S. Hartzell (1991). Near-field ground motions in large earthquakes and base-isolated structures, Seism. Res. Let., 62, 49.
Rogers, A. M., D. M. Perkins, D. B. Hampson, and K. W. Campbell (1991). Investigations of peak acceleration data for site effects: Proceedings of the Fourth International Conference on Microzonation, Palo Alto, Ca. (in press).
References
Hartzell, S. (1978). Earthquake aftershocks as Green's functions, Geophys. Res. Let., 5, 1-4.
Muller, C., and S. Glassmoyer (1990). Digital recordings of aftershocks of the 17 October 1989 Loma Prieta, California, earthquake, U.S. Geological Survey Open-File Report, 90-503.
629

III.3
Q. Q
0
5
10
15
20
25
NW
o QO O 0
«.2 5 O
10
15
20
25
i t
' t
11 13
Seconds
SE
L2
Sum
,i ,,L
\
2.5 km/sec-
10 20 30 40Distance Along Strike (km)
so 60
Figure 1
630
III. 3
ENGINEERING GEOLOGIC SITE CHARACTERIZATION OF THEGREATER OAKLAND - ALAMEDA AREA,
ALAMEDA AND SAN FRANCISCO COUNTIES, CALIFORNIA
Grant No. BCS-9003785
J. David Rogers and S. FiguersRogers/Pacific, Inc.
Pleasant Hill, California
A unique aspect of the October 17, 1989 Loma Prieta Earthquake was the extensive structural damage and irregular ground response observed in the greater Oakland-East Bay Area, approximately 95-105 km north of epicenter. Strong motion recorders on Yerba Buena and Treasure Islands registered motions with 250% variance over a distance of 900 meters. Three-thousand m east of Buena Island, the center portion of the Oakland Container Wharf received shaking levels of 0.27g to 0.29g (horizontal) with up to 0.084g vertical motion.
Twenty-one-hundred m east of the Wharf, the northern half of the double-decked 1-880 Cypress Street Viaduct experienced an extensive par tial collapse. Portable seismograph arrays placed adjacent to remaining and collapsed portions of the Cypress Viaduct recorded variances of strong motion arrivals (up to M 4.4 after shocks) on the order of 400% to 900% between stations (at 2 to 6 Hz frequencies, the main shock being closer to a 1 Hz frequency).
The strong motion variations are directly related to changes in sub surface geometry and lithology. To understand the strong motion varia tions, one must understand the subsurface geologic details of the greater Oakland area. The most recent subsurface compilations of the Bay area were done in the late 1940's and early 1950's. However, little deep sub surface information was available in the Oakland area at the time. A sub stantial number of deep borings have been drilled since that time, but they have never been compiled or correlated. They were rarely used in regional studies because they were site specific (such as foundation inves tigations or aquifer analyses), widely scattered, and difficult to gain access to.
This study begins the next phase of the compilation process. It has two primary goals: 1) To collect and assemble the deep well data in the greater Oakland area onto a computerized data base; and 2) Determine the subcrop geometry of the basement. A secondary goal was to refine the geometry/relationships between the late Pleistocene units. Hopefully, fu ture studies will cover the rest of the East Bay.
We have compiled a majority of the deep wells in the greater Oakland area. The wells range in age from 1927 to 1991 and are from 30 to 316 meters deep. The wells were drilled for many different purposes and the well data are quite variable in data quality. All well data were transcribed into a uniform format and entered into a PC computer data base. The wells are located via the California State Plane Coordinates System. We have attempted to maintain as wide a cross-referencing system
631
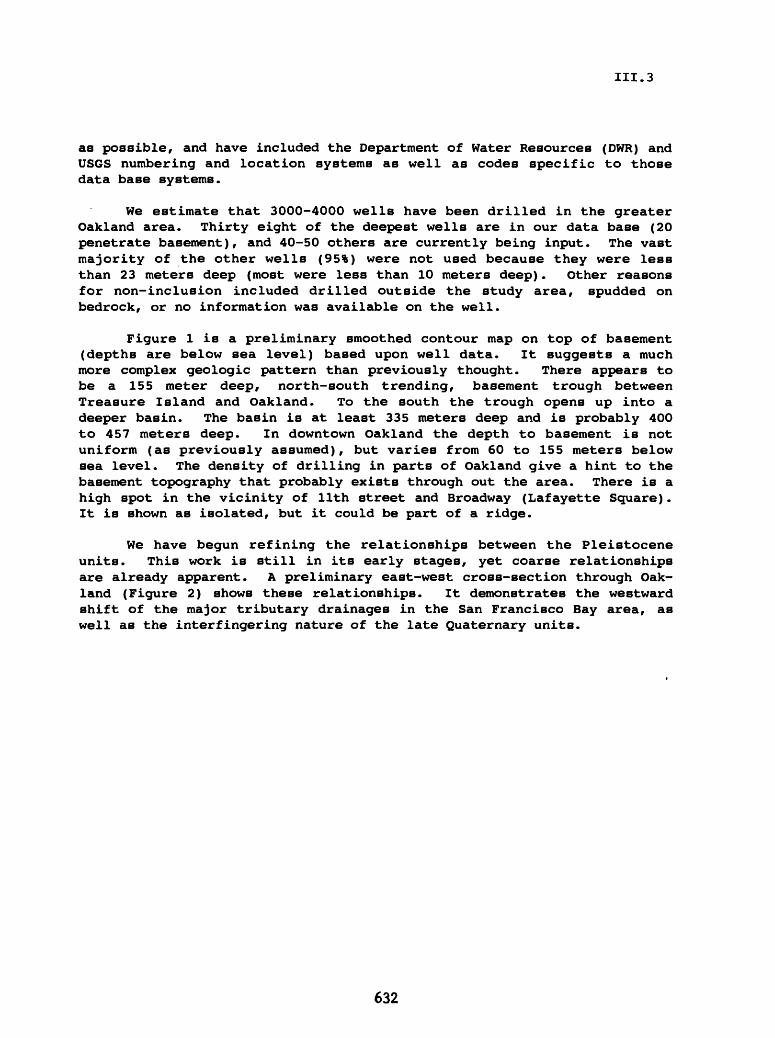
III. 3
as possible, and have included the Department of Water Resources (DWR) and USGS numbering and location systems as well as codes specific to those data base systems.
We estimate that 3000-4000 wells have been drilled in the greater Oakland area. Thirty eight of the deepest wells are in our data base (20 penetrate basement), and 40-50 others are currently being input. The vast majority of the other wells (95%) were not used because they were less than 23 meters deep (most were less than 10 meters deep). Other reasons for non-inclusion included drilled outside the study area, spudded on bedrock, or no information was available on the well.
Figure 1 is a preliminary smoothed contour map on top of basement (depths are below sea level) based upon well data. It suggests a much more complex geologic pattern than previously thought. There appears to be a 155 meter deep, north-south trending, basement trough between Treasure Island and Oakland. To the south the trough opens up into a deeper basin. The basin is at least 335 meters deep and is probably 400 to 457 meters deep. In downtown Oakland the depth to basement is not uniform (as previously assumed), but varies from 60 to 155 meters below sea level. The density of drilling in parts of Oakland give a hint to the basement topography that probably exists through out the area. There is a high spot in the vicinity of llth street and Broadway (Lafayette Square). It is shown as isolated, but it could be part of a ridge.
We have begun refining the relationships between the Pleistocene units. This work is still in its early stages, yet coarse relationships are already apparent. A preliminary east-west cross-section through Oak land (Figure 2) shows these relationships. It demonstrates the westward shift of the major tributary drainages in the San Francisco Bay area, as well as the interfingering nature of the late Quaternary units.
632

Bay Firm Ulind -1»°° lo - 1500T
Angel lalindC.I. = 100'
DATUM = SEA LEVEL
\.PRELIMINARY SMOOTHED SUBSURFACE
CONTOUR MAP ON TOP OF BASEMENT
WELL PENETRATED BASEMENT
Figure 1M H H.
LO

ON
CO
DO
WN
TO
WN
O
AK
LAN
D
FR
AN
CIS
CA
N
BA
SE
ME
NT
(B
AY
BLO
CK
)H
H
H W
IV. 1
Global Digital Network Operations
9920-02398
Howell M. Butler Branch of Global Seismology and Geomagnetism
U.S. Geological Survey Albuquerque Seismological LaboratoryBuilding 10002, Kirtland AFB-East
Albuquerque, New Mexico 87115-5000(505) 844-4637
Investigations
The Global Seismograph Network (GSN) presently consists of 11 SRO/ASRO, 10 DWWSSN stations, 81 WWSSN, 6 IRIS-I, and 2 IRIS-2 type recording stations located in 58 countries and islands throughout the world. The primary objective is to provide high-quality digital and analog seismic data for fundamental earthquake investigations and research, enhancing the United States capabilities to detect, locate, and identify earthquakes and underground nuclear explosions in support of test ban issues. Technical and operational support is provided as funds permit to keep the GSN operating at the highest percentage of recording time possible. This support includes operational supplies, replacement parts, repair service, modifications of existing equipment, installation of systems and on-site maintenance, training, and calibration. A service contract provides technicians to perform the support requirements as well as special projects such as on-site noise surveys, site preparations, and evaluation and testing of seismological and related instrumentation.
On-site Station Maintenance
1. ANMO - Albuquerque, New Mexico - Five maintenance visits.2. COR - Corvallis, Oregon - One maintenance visit.3. COL - College, Alaska - IRIS-2 installed.4. Due to reduced project funding considerations, maintenance visits have been curtailed during this period. The systems at Bogota (BOCO), Colombia, and Lembang (LEM), Indonesia, have had catastrophic failures and will remain inoperative until funding is available for maintenance or replacement of the current system at those locations.
Results
The Global Seismograph Network continues with a combined total of 110 WWSSN/ SRO/ASRO/DWWSSN/IRIS-1/IRIS-2 stations. The main effort of this project, as funding permits, is to furnish the" types of support at a level needed to keep the GSN at the highest percentage of operational time in order to provide the improved geographical coverage with analog and digital data from highly sensitive short-period and broadband seismic sensor seismograph systems.
635

IV. 1
INSTRUMENTATION OF STRUCTURES
9910-04099
Mehmet Branch of Engineering Seismology and Geology
U.S. Geological Survey345 Middlefield Road, MS 977Menlo Park, California 94025
415/329-5623 or FTS/459-5623
Investigations
1. The process of selection of structures to recommended for strong-motion instrumenta tion has continued in Hawaii, Puget Sound (Seattle), Reno (Nevada), and Puerto Rico. This effort has also been extended to Salt Lake City.
2. The process to design instrumentation schemes has continued. Permits for a structure in Orange County, California, have been obtained. Permits for a structure in each of Orange County, California, Hawaii, and Seattle (Washington) have been obtained. A base isolated structure in Los Angeles and in the Marina District of San Francisco have been permitted. Also, permit efforts have been made for a structure in New Madrid area as a result of new EHRP funding.
3. The process of implementation of instrumentation for those structures for which instrumentation schemes have been designed has been completed in Anchorage, Alaska, and Orange County, California. The strong-motion recording systems in these buildings are now operational.
4. Non-destructive dynamic testing of Salt Lake City and County Building is to be carried out progressively to evaluate the dynamic characteristics of the building before and after rehabilitated by base isolation.
5. The minimal instrumentation in a building in Alhambra, Southern California, has been upgraded to contain extensive instrumentation to acquire sufficient data to study com plete response models of the building. A set of records is obtained during the Uplands earthquake. This will be compared with the Whittier (October 1, 1987) earthquake data which was code-type.
6. Agreements have been made with UCLA to convert the wind-monitoring system in the Theme Building in Los Angeles (previously financed by NSF) into a strong-motion monitoring system. Plans are being made to implement the conversion.
636
IV.1
7. Studies of records obtained from instrumented structures are carried out. In particular, the records obtained during the October 21, 1987 Whittier Narrows earthquake from 1100 Wilshire Finance Building (Los Angeles), the Bechtel Building (Norwalk), and the Santa Ana River Bridge (base-isolated) are being investigated. Data obtained during the October 17, 1989 Loma Prieta earthquake from the Transamerica Building (San Francisco) and Pacific Park Plaza Building (Emeryville) have been studied.
8. Studies of records obtained from instrumented structures during the October 17,1989, Loma Prieta earthquake are carried out. In particular, Transamerica Building in San Francisco and Pacific Park Plaza in Emeryville have been investigated. Papers are prepared.
9. Cooperative project with NIST on low-level amplitude tests of instrumented structures carried out.
Results
1. The Hawaii Committee on strong-motion instrumentation of structures has completed its deliberations and a draft report is being prepared.
2. As final report of the Puget Sound (Seattle) advisory committee for strong-motion instrumentation has been completed.
3. Papers resulting from study of records obtained from structures are prepared.
4. An invited talk given on "Responses of structures during the Loma Prieta earthquake 11 at ASCE Structures Congress in San Francisco, California (November, 1990).
5. Invited talk on "Response of structures during the Loma Prieta earthquake" at ASCE Structures Congress in Indianapolis, Indiana (April, 1991).
Reports
Celebi, M., 1991, Seismic monitoring of structures objectives and analyses of records from structures: U.S. Japan Panel on Wind and Seismic Effects, May 1989.
Celebi, M., §afek, E., and Youssef, N., 1991, Torsional response of a unique building: ASCE, STD, May 1991.
Celebi, M., and §afak, E., 1990, Recorded seismic response of Transamerica Building Part I: Data and preliminary analysis: in print, ASCE, August 1991.
Safak, E., and Celebi, M., 1990, Recorded seismic response of Transamerica Building Part II: System identification: in print, ASCE, August 1991.
637

IV. 1
Celebi, M., and §afak, E., 1990, Recorded seismic response of Pacific Park Plaza Part I: Data and preliminary analysis: paper in review.
Marshall, R.D., Phan, L.T., and Celebi, M., 1990, Measurement of structural response characteristics of full-scale buildings: Selection of structures: U.S. Geological Survey Open-File Report 90-667. [Also Interagency NIST Report.]
Safak, E., and Celebi, M., 1990, Recorded seismic response of Pacific Park Plaza Part II: System identification: paper in review.
Celebi, M., and Safak, E., 1991, Recorded responses of two tall buildings during the 10/17/89 Loma Prieta (California) earthquake: ASCE Structures Congress, April 29- May, 1991, Indianapolis, Indiana, invited paper.
§afak, E., and Celebi, M., 1990, Analyses of recorded responses of two high-rise buildings to Loma Prieta mainshock, BSSA, paper in review.
Celebi, M., Phan, L.T., and Marshall, R.D., 1991, Comparison of responses of a select number of buildings to the 10/17/89 Loma Prieta (California) earthquake and low-level amplitude test results: UJNR Proceedings, May 1991.
04/91
638
IV. 1
Earth Structure and Source Parameters
9920-01736
George L. ChoyBranch of Global Seismology and Geomagnetism
U.S. Geological SurveyDenver Federal Center
Box 25046, Mail Stop 967Denver, Colorado 80225
(303) 236-1506
Investigations
1. NEIC reporting services. The NEIC now uses broadband data to routinely compute parameters such as depth from differential arrival times, radiated energy of an earthquake, and arrival times of late-arriving phases. These parameters are published in the Monthly Listing of the Preliminary Determin ation of Epicenters and in the Earthquake Data Report.
2. Effects of Earth structure on source parameters. To assure the accuracy of source parameters derived from waveform analysis, we are developing corrections for the effects of wave propagation in the Earth.
A. Effects of pulse distortion on reading arrival times of non- minimum travel-time phases. From both theory and observation it has been we11-documented that waveforms of body waves that propa gate past internal caustics suffer severe phase distortion. The accuracy and/or resolution of tomographic inversions involving such phases may be affected by the accuracy with which arrival times of these phases are read.
B. Effects of attenuation on the computation of source parameters. We are developing techniques to determine the depth- and frequency-dependence of attenuation in the Earth. Resolution of this frequency dependence requires analysis of a continuous frequency band from several Hz to tens of seconds. It also requires consideration of the contributions of scatering and slab diffraction to apparent broadening of a pulse.
C» Use of differential travel-time anomalies to infer lateral heter ogeneity. We are investigating lateral heterogeneity in the Earth by analyzing differential travel times of phases that differ in ray path only in very narrow regions of the Earth. Because such phases often are associated with complications near a cusp or caustic, their arrival times can not be accurately read without special consideration of the effects of propagation in the Earth as well as additional processing to enhance arrivals.
3. Rupture process of large- and moderate-sized earthquakes. We are using digitally recorded broadband waveforms to characterize the rupture process of selected intraplate and subduction-zone earthquakes. The rupture processes thus delineated are used to complement seismicity patterns to formulate a tectonic interpretation of the epicentral regions.
639

IV. 1
4. Teleseismic estimates of radiated energy and strong ground motion. On a world-wide basis, the relative paucity of near-field recording instruments hinders the prediction of strong ground motion radiated by earthquakes. We are developing a method of computing radiated energy and acceleration spec trum from direct measurements of teleseismically recorded broadband body waves. From our method, the maximum expectable spectral level of accelera tion and lower bounds of stress drops can be made for any event large enough to be teleseismically recorded.
Results
1. Reporting Services. The NEIC now uses broadband waveforms to routinely: (1) resolve depths of all earthquakes with m^ > 5.8; (2) resolve polarities of depth phases to help constrain first-motion solutions; (3) present as representative digital waveforms in the monthly PDE's; and (4) compute the energy radiated by earthquakes. In the Monthly Listings of the PDE covering the interval May 1990 to September 1990, depths using differential arrival times from broadband waveforms were computed for 48 earthquakes; radiated energies were computed for 52 earthquakes.
2. Effects of Earth structure on source parameters.A. Arrival times of pulse-distorted body waves. Body waves that
touch internal caustics in the Earth are distorted in a way that can be mathematically corrected by Hilbert transformation. As a significant amount of teleseismic data used by the NEIC is in digital form, this correction can now be routinely performed. An automated processing package combining the methods of Choy and Richards (1975) and Harvey and Choy (1982) is now being imple mented to obtain distortion free broadband waveforms for process ing by NEIC analysts.
B. Attenuation in the Earth. We are attempting to separate intrinsic attenuation from scattering in waveforms. We synthesize waveforms using a method that simultaneously models causal attenuation and source finiteness. Under the assumption that intrinsic attenua tion can be described by minimum phase operators, we can attribute discrepancies in the waveforms to scattering.
C. Lateral heterogeneity from differential travel times. We have developed a source-deconvolution technique that resolves differ ential travel times of body waves near cusps and caustics. Appli cation of this algorithm to PKP waves sampling the inner core suggests that regional velocity variations exist within the upper 200 km of the inner core. The regional variations are consistent with those obtained from global inversions of absolute PKP times. We are reading high quality arrival times of PcP and branches of PKP, corrected for propagation effects. This accumulation of data can be used to determine if propagation phenomena have biased the catalog data which have been used to derive models of lateral heterogeneity.
3. Rupture processes. Source characteristics of the Loma Prieta, California earthquake of 18 October 1989 were studied with global digitally recorded broadband data. Besides the static parmeters such as focal
640
IV. 1
mechanism and depth, we have derived the rupture history, radiated energy and associated stress drops. The stress release of the earthquake was spatially heterogeneous. The moment release occurred in four identifiable subevents. The teleseismically derived acceleration spectral level of 1.6 cm2 /s implies a stress drop of 51 bars. We are currently deriving the acceleration level from near-field recordings for comparison with the teleseismic estimate.
A study of the Armenian earthquake of 7 December 1988 in collaboration with the German Geological Survey has been finished. The earthquake was a complex rupture consisting of at least three major subevents. From the distribution of aftershocks and the derived focal mechanisms, we infer that the causative faults have different strikes. The relative locations of these subevents indicate a fault zone that has a bend.
4. Strong ground motion of intraplate events. We have applied our algorithm for the computation of acceleration spectra to a series of shallow intraplate earthquakes that serve as earthquake analogs to earthquakes that might occur in northeastern North America. The largest earthquakes are characterized by a flat spectral level at high frequencies but an inter mediate slope before an to* falloff at low frequencies. The source spectra of smaller and intermediate sized earthquakes are consistent with an a)2 source model.
Reports
Boatwright, J., and Choy, G. L., 1991, Acceleration source spectra antici pated for large earthquakes in northeastern North America: Journal of Geophysical Research (submitted).
Bowman, J. R., Choy, G. L. and Dewey, J. W., 1991, Source process of the 1988 Tennant Creek, Australia earthquakes from teleseismic and local observations [abs.]: Abstracts of the 26th General Assembly of IUGG (in press).
Choy, G. L., 1990, Source parameters of the earthquake, as inferred frombroadband body waves, _in_ Rymer, M. J., and Ellsworth, W. L., eds., The Coalinga, California of May 2, 1983: U.S. Geological Survey Profes sional Paper 1487, p. 193-205.
Choy, G. L. and Boatwright, J., 1990, Source characteristics of the LomaPrieta, California, earthquake of October 18, 1989 from global digital seismic data: Geophysical Research Letters, v. 17, p. 1183-1186.
Choy, G. L., Boatwright, J., and Lavonne, C. K., 1991, Estimates of radiated energy from global digital seismic data Global seismicity of 1986-1990 [abs.]: Abstracts of the 20th General Assembly of IUGG (in press).
Choy, G. L., and Kind, R., 1990, A preliminary broadband body-wave analysis of the Armenia S. S. R. earthquake of 7 December 1988: Geologisches Jahrbuch, v. 44, p. 37-48.
Choy, G. L., and Presgrave, B. W., 1991, On the use of pulse-distorted body waves in observatory practice [abs.]: Abstracts of the 20th General Assembly of IUGG (in press).
641

IV. 1
Reanalysis of Instrumentally Recorded United States Earthquakes
9920-01901
J. W. Deweyand
William SpenceBranch of Global Seismology and Geomagnetism
U.S. Geological SurveyDenver Federal Center
Box 25046, Mail Stop 967Denver, Colorado 80225
(303) 236-1506
Investigations
1. Describe the seismicity before and after the ^ 8.7, 1957 Aleutian arc earthquake to better understand the earthquake cycle in subduction zones. This major undertaking also will answer numerous questions concerning the size and probable rupture characteristics of this important earthquake (William Spence with T. Boyd and E. R. Engdahl).2. Interpret the seismicity before and after the M 7.8, 1974 Peru earth-squake to clarify the nature of subduction at this complex convergence zone (William Spence with C. J. Langer).3. Prepare report on public response to Iben Browning's prediction of an earthquake to occur in the region of New Madrid, Missouri on about December4. 1990 (William Spence with F. Baldwin, L. Brewer, G. Reagor, R. B. Herrmann, B. J. Mitchell, A. C. Johnston, and D. A. Wiens).4. Determine the tectonic consequences of a stalled Farallon plate that is heated by the underlying asthenosphere, as an explanation for the regional tectonic origins of modern western North America (William Spence).5. Use the method of joint hypocenter determination (JHD) to relocate all teleseismically recorded earthquakes from the region of the three M > 6 Tennant Creek, Australia, earthquakes of January 22, 1988, for up to two and a half years following the main shocks. Evaluate how effectively these seismicity data, and other geological and geophysical data, are explained by current theories of midplate seismogenesis. Evaluate the occurrence of seismicity prior to the main shocks in light of hypotheses on earthquake precursors (James W. Dewey and J. Roger Bowman).
Results
1. Magnitudes and relocations are being determined for earthquakes in the region of the great 1957 Aleutian arc earthquake for the period 1950- present.2. Aftershocks of the 1974 Peru earthquake are being relocated to verify focal depths and space-time development of the aftershock series, as earlier done with another velocity model and another location algorithm. This aftershock data set remains one of the most detailed and precise for any great subduction earthquake and thus is of particular significance in interpretation of the earthquake cycle in subduction zones.
642

IV. 1
3. Photos and newspaper clippings are being assembled into a source docu ment for researchers on the sociological impact of this failed earthquake prediction.4. Spence's model postulates that a large subhorizontal segment of the subducting Farallon plate stalled beneath western North America at the end of the Laramide orogeny (50-45 Ma). Subsequently, the plate has translated southwestward with the North American plate, the former being continually heated by the underlying asthenosphere. For the Laramide region from central Idaho through New Mexico, the mean thickness of the Farallon plate at the time of stalled subduction was about 90 km, indicating a mean plate age of about 65 m.y. Partial melting of this plate caused it to heat more quickly than by simple conduction. The low velocity zone that underlies much of the western United States is the partially melted relic Farallon plate. Post-Laramide volcanism began at about 37 Ma, evolving towards higher melting temperature melts and updip with regard to the stalled plate section. Subsequent heating of the overlying lithosphere has resulted in very high heat flow for much of the western U.S., although the high- temperature front still is deep beneath the Colorado Plateau. Density reductions due to the heating of the Farallon plate and the overlying lithosphere caused isostatic uplift of the Rocky Mountains and Basin and Range province during the last 17 Ma, whereas this uplift was delayed beneath the Colorado Plateau until the last 7 Ma. This density reduction corresponds to the very long period gravity low of this region, that reaches a minimum of about -190 mGal beneath the Colorado Plateau. Each uplift episode has had corresponding gravitational spreading. Non-isostatic rebound of the steeply-dipping Farallon plate, at the eastern crescent of the subhorizontal Farallon plate, contributed about 2 km of additional uplift of the Rocky Mountains, perhaps at about 35 Ma, explaining the greatest uplifts above the deepest part of the subhorizontal plate.5. Relocation of the Tennant Creek shocks shows that pre-1988 seismicity was concentrated beneath the principal discontinuity within the zone of surface fault-scarps associated with the main shocks of January 1988. The three main shocks themselves nucleated in the same region. The pre-1988 seismicity and the 1988 main-shock epicenters are, in addition, situated on a gravity anomaly that was of sufficient regional prominence to have been subject to special study prior to the onset of seismicity in the Tennant Creek region.
The location of the pre-1988 activity with respect to the surface scarps and with respect to the local gravity anomaly suggested two possible inter pretations to Bowman and Dewey. The surface scarps may correspond to a pre existing fault zone, the geometry of which still controls the distribution of small and moderate earthquakes such as those occurring prior to the January 1988 main shocks. This interpretation is consistent with the hypo thesis that midplate seismicity in general is localized on pre-existing faults. Alternatively or in addition, heterogeneity in the crust, corres ponding to the gravity anomaly, may have determined the site of the pre-1988 activity and the nucleation points of the main shocks by concentrating crustal stress in this region. The pre-existing fault and stress-concentra tion hypotheses emphasize different characteristics of the Earth's crust, but they are not mutually exclusive from a mechanical standpoint, and
643

IV. 1
Bowman and Dewey leave open the possibility that both pre-existing faults and bulk rheological heterogeneities played a role in localizing Tennant Creek seismicity.
The teleseismically recorded seismicity of the Tennant Creek region prior to January 22, 1988, has the temporal form of a seismic swarm followed by a lull. Fre-1988 moment-release was concentrated in a seismic swarm that occurred from January 5, 1987, through January 9, 1987. Two events in the swarm were the first of magnitude 5.0 or greater known to have occurred within 500 km of the 1988 fault scarps. Broadly similar patterns have been observed in other regions, so that an earthquake swarm followed by a lull has been hypothesized to be a typical, though by no means inevitable, pre cursor to a strong earthquake. The 1987 Tennant Creek swarm occurred on the margins of what were to be the sites of maximum main-shock moment release in 1988, which is consistent with models in which precursory-swarm earthquakes correspond to faulting that is close to, but spatially distinct from, the site of subsequent primary main-shock faulting. The time interval between the 1987 swarm and the 1988 main shocks is similar to swarm-main shock time intervals in regions of much higher rates of tectonism; this suggests that swarm-main shock time intervals in general are determined by a time- dependence intrinsic to the failure process rather than by rates of tectonic loading.
Reports
Bowman, J. R., and Dewey, J. W., Relocation of teleseismically recordedearthquakes near Tennant Creek, Australia Implications for midplate seismogenesis: Journal of Geophysical Research (in press).
Boyd, T., Engdahl, E. R., and Spence, W., 1990, Aftershock distribution ofthe 1957 Aleutian Islands earthquake [abs.]: EOS (American Geophysical Union, Transactions), v. 71, p. 1469.
Dewey, J. W. (submitted), The 1954 and 1980 Algerian earthquakes Implica tions for the characteristic-earthquake model of seismicity: Bulletin of the Seismological Society of America, v. 81, p. 446-467.
Slack, P. D., Spence, W., and others, 1991, Teleseismic investigations ofthe velocity structure beneath the Rio Grande rift [abs.]: Geological Society of America, Abstracts with Programs, v. 23, p. 95.
Spence, W., 1990, A model linking post-Laramide tectonics to the thermal evolution of the subducted (and subhorizontal) Farallon plate [abs.]: Geological Society of America, Abstracts with Programs, v. 22, p. A328.
Spence, W., 1991, Tectonic origins of the modern American West [abs.]: EOS (American Geophysical Union, Transactions), v. 72 (in press).
Spence, W., 1991, Post-Laramide tectonics and the relict Farallon plate: Nature (submitted).
644

IV. 1
Global Seismology
9920-03684
E. R. Engdahland
E. A. BergmanBranch of Global Seismology and Geomagnetism
U.S. Geological SurveyDenver Federal Center
Box 25046, Mail Stop 967Denver, Colorado 80225
(303) 236-1506
Investigations
1. Travel-Time Tables. Develop new standard global travel-time tables to locate earthquakes.
2. Arrival-Time Data. Coordinate planning for an International Seismo-logical Observing Period (ISOP) a time interval during which there would beenhanced reporting of arrival-time data.
3. Earthquake Location in Island Arcs. Develop practical methods to accur ately locate earthquakes in island arcs.
4. Subduction Zone Structure. Develop techniques to invert seismic travel times simultaneously for earthquake locations and subduction zone structure.
Results
1. Travel-Time Tables. Over the period 1987-1990, a major international effort has been made by the Sub-Commission on Earthquake Algorithms of the International Association of Seismology and the Physics of the Earth's Interior (IASPEI) to generate new global travel-time tables to replace the tables of Jeffreys & Bullen (1940). This project is the first stage in developing travel-time calculation and location schemes to allow for regional variations in the outer parts of the Earth.
The new iasp91 travel-time tables (Kennett, 1991) are derived from a radially stratified model which has been constructed so that the times for the major seismic phases are consistent with the times for events in the ISC catalogue for the period 1984-1987. The baseline for the P wave travel times in the iasp91 model has been adjusted to provide only a small bias in estimated origin time for well-constrained events at the main nuclear test ing sites around the world.
For P waves at teleseismic distances, the new tables are about 0.7 seconds slower than the 1968 P-tables (Herrin 1968) and on average about 1.8 seconds faster than the Jeffreys & Bullen (1940) tables. For S waves, the tele- seismic times lie between those of the JB tables and the results of Randall
645

IV. 1
(1971). Kennett & Engdahl (1991) describe the process of constructing the travel-time tables and tests using a world-wide distribution of well-located events.
Because the times for all phases are derived from the same velocity model, there is complete consistency between the travel times for different branches at different hypocentral depths. The calculation scheme adopted for the new iasp91 tables is that proposed by Buland & Chapman (1983). Tables of delay time as a function of slowness are stored and interpolated using a specially designed tau-spline system which takes care of square-root singularities in the derivatives of the travel times curves at certain critical slownesses. With this representation, it is straightforward to find the travel time explicitly for a given epicentral distance. The computational cost is no higher than a conventional look-up table, but there is increased accuracy in constructing the travel times for a source at arbitrary depth. A further advantage over standard tables is that exactly the same procedure can be used for each phase. It is therefore possible to generate extremely rapidly a comprehensive list of travel times for the main seismic phases which could be observed at a given epicentral distance.
The software for the calculation of the travel times is being made publicly available through the National Earthquake Information Center, Golden, Colorado, U.S.A.
2. Arrival-Time Data. As part of the International Seismological Observing Period (ISOP) project, a workshop, the "ISOP International Workshop on Observatory-Based Processing of Digital Seismic Data," was organized and held in Denver, Colorado, on March 19-22, 1991. The workshop is summarized as follows:
Purpose: The purpose of this workshop is to survey the current status of hardware and software appropriate for observatory-based digital processing and establish standards for data measurements and analysis which can be introduced at future ISOP workshops for observatory analysts. A topic of special importance is the problem of establishing the interface between the digital data stream and the seismic analyst at the observatory; this appears to be a major factor hindering widespread adoption of digital processing techniques at many seismic observatories.
Sponsorship; The workshop was sponsored by the National Earthquake Information Center (NEIC) of the USGS and the Federation of Digital Broad-Band Seismograph Networks (FDSN).
Organizers: The workshop was organized by E. A. Bergman, E.R. Engdahl, and S. A. Sipkin of the NEIC. In addition to their NEIC affiliation, Bergman represented the ISOP project and Engdahl represented the FDSN and IASPEI.
Participants: The workshop was attended by 50 persons, from the USGS, universities, major digital seismograph networks, and private companies involved in seismic instrumentation. Attendees are experts in the fields of : (1) analysis of broad-band digitally recorded seismic data;
646

IV. 1
(2) seismic instrumentation and data storage; (3) seismic data exchange formats; (4) software packages for processing seismic data; or (5) seis mic network management; and they have in common an interest in the collection, processing, and analysis of digitally recorded seismic data at permanent seismic observatories for studies of global seismicity and Earth structure.
Workshop Format: The first day of the workshop was devoted to short reports by network representatives, focusing on the provisions for routine processing of digital data. There were also several talks on aspects of data acquisition and processing which are broadly relevant to the operation of a digital seismic network. At the end of these sessions, Dr. D. Simpson led an informal discussion of the role of local networks in the infrastructure of global seismology, in particular the advantages of integrating them with advanced satellite-linked systems being developed and deployed as national and regional networks. After dinner, Prof. T. H. Jordan, originator of the ISOP concept, spoke about the broader goals and implications of the ISOP project.
On the second day, persons who would be demonstrating computer systems and software for seismic processing and analysis gave short introductory presentations. The demonstrations continued throughout the day and into the evening.
On the third day, the workshop divided into two working groups, WG1 focusing on issues of observatory practice, including parameterization and measurement protocols appropriate for the ISOP project, WG2, concerned with more technical considerations of data acquisition and processing of digital data on personal computers and workstations.
On the final day of the workshop, the two working groups came together to exchange ideas, and then met separately to finalize their recommenda tions. Given the recommendations of WG1, WG2 began the task of estab lishing detailed design goals for a specialized software package to be used by seismic analysts for routine analysis of digital data.
Workshop Results: A written report of the workshop is being prepared for wide distribution to the international seismological community. In particular, this report will be presented at the XX General Assembly of the IUGG in Vienna in August 1991. This report will be a major resource for ISOP presentations and training workshops in many countries. A steering committee was formed at the Denver workshop to guide develop ment of the ISOP software for routine processing, and funds are being sought to support a professional-quality programming effort aimed at integrating desirable features of the software demonstrated at the workshop into a robust and widely compatible software package. This software will be made available to the international community through the existing publication route of the IASPEI Software Library series.
647

IV.1
3. Earthquake Location in Island Arcs and4. Subduction Zone Structure. Tomographic inversions usually solve for variations in seismic velocity and earthquake location relative to a refer ence velocity model and reported source locations. Ideally, the reported earthquake locations are well determined in the adopted reference model, and the relocation upon inversion only accounts for effects of near-source heterogeneity. However, Van der Hilst and Engdahl (1991) showed from the inconsistency between ISC pP data and ISC hypocenters that the locations of subduction zone earthquakes may be biased. In that case, relocation upon tomographic inversion either corrects only for lateral heterogeneity, leaving the locations in error, or reduces biases by trading-off with amplitudes of velocity perturbations. In addition, ray paths are computed from biased locations.
In large-scale tomographic studies, typically thousands of earthquakes are used. The accuracy of individual earthquake locations cannot be assessed, and (simple) criteria, such as a minimum number of stations that reported an earthquake, are used to select events. With such criteria, however, earth quakes with biased locations are not necessarily removed from the data set. For example, a subduction zone earthquake may be recorded at hundreds of stations but still be poorly located if only few data from near-by stations are available.
We used both P and pP arrival times to relocate earthquakes prior to inver sion for 3-D structure. Upon relocation in the iasp91 velocity model (Kennett and Engdahl, 1991), the scatter of the ISC P and pP data is reduced by respectively 35% and 20%. The use of better source locations has important implications for the tomographic inversion: (1) the trade-off between relocation upon inversion and Earth's structure is better controlled, resulting in higher amplitudes of variations of wave speed relative to the reference model; (2) Earth's signal absorbed by biases in earthquake location, and lost from the seismic data, an now be revealed from the recomputed travel-time residuals; (3) relocation upon inversion truly accounts for near-source heterogeneity.
Reports
Kennett, B.L.N., IASPEI 1991 Seismological Tables, Research School of Earth Sciences, Australian National University, Canberra, 1991.
Kennett, B.L.N., and Engdahl, E. R., 1991, Travel times for global earth quake location: Geophysical Journal International (in press).
Van der Hilst, R. D., and Engdahl, E. R., 1991, On the use of PP and pP data in delay time tomography: Geophysical Journal International (in press).
648

IV. 1
Systems Engineering
9920-01262
Gary Hoi comb Branch of Global Seismology and Geomagnetism
U.S. Geological SurveyAlbuquerque Seismological Laboratory
Building 10002, Kirtland AFB-EastAlbuquerque, New Mexico 87115
(505) 844-4637
Investigations
Engineering development to improve the quality of seismic instrumentation.
Results
As part of a contract with Sandia National Laboratories, a series of evaluation tests was conducted on the Guralp CMG-3S borehole sensor system. This study is aimed at identifying noise levels and the sources of noise within this instrument system. The data has been analyzed and an Open-File Report of the results has been released.
A set of Teledyne BB-13 sensors is undergoing evaluation in the Albuquerque Seismological Laboratory (ASL) vault. These measurements have revealed excessive noise in the system amplifiers, which the manufacturer intends to reduce as soon as company funds become available.
Acceptance testing of the NSN seismic sensors commenced during this reporting period and will probably continue over the next several reporting periods. Four complete sets of CMG-3NSN sensors arrived at the ASL for testing during this reporting period. The first two sets underwent noise floor testing and were rejected because instrument noise levels exceeded specified upper limits. In addition, the flexures in these instruments had been bent during shipping. The second two sets were inoperable on arrival at ASL due to shipping damage. The factory representative visited ASL to perform onsite repairs. The instruments were then installed in the field without acceptance testing.
Acceptance testing of the NSN 24-bit digitizers commenced during this reporting period and will probably continue over the next several reporting periods. These digitizers are performing quite well and all results to date have been well within system specifications.
A set of CMG-3ESP sensors, which were purchased by IRIS, is currently undergoing a hasty evaluation in the ASL vault to determine their high-frequency noise levels. Initial results indicate that the instruments are relatively quiet up to about 40 Hz and possibly higher.
649

IV. 1
Probabilistic Earthquake Assessment
9920-01506
Stuart P. NishenkoBranch of Global Seismology and Geomagnetism
U.S. Geological SurveyDenver Federal Center
Box 25046, Mail Stop 967Denver, Colorado 80225
(303) 236-1500
Inves tiga ti ons
1. Improve current probabilistic estimates for earthquakes within the United States and the circum-Pacific region.
2. Development of an operational methodology to provide rapid and reliable estimates of damage caused by moderate and large United States earthquakes.
Results
la. Paleoseismologic data for the past 6 ka are used to estimate 50- and 100 yr Poisson and time-dependent probabilities for a M 7 earthquake along the Wasatch fault zone (WFZ) (Nishenko and Schwartz, 1990; Schwartz and Nishenko, 1991). Five of the six active fault segments have produced M 7 events during an earthquake sequence that began about 1.4 ka and that has continued to about 300 yr ago. Only the Brigham City segment, with an elapsed time of 3.6 ka, has not had an event during this most recent temporal cluster. The occurrence of 15-17 M > 7 events during the past 6 ka, yield 50- and 100-year Poisson probabilities (P50 and PlOO) of 0.12-0.13 and 0.22-0.25, respectively, for an event anywhere along the WFZ. Within the current active sequence, the average repeat time of 183-220 years (5-6 events in 1100 yrs) and the 75-400 yr interval between successive events yields Poisson probabilities of P50 0.16-0.24 and PlOO 0.29-0.42. Poisson probabilities provide no information on the location of the next WFZ event. Time-dependent conditional probabilities are based on the geologic behavior of individual fault segments. For some segments (Salt Lake, Provo) ^**C estimates of repeat times are quasi-periodic and proportional to the slip per event and the long-term slip rate (about 1.0 mm/yr). Other segments (Brigham City, Nephi, Weber(?)) appear to release accumulated slip in two relatively closely spaced « 1 ka) earthquakes followed longer intervals. Hence, no one single recurrence model appears to be appropriate for all segments. The most recent faulting episode on the Brigham City segment occurred as 2 events, 3.6 +_ 0.25 and 4.8 +^ 0.25 ka yr ago, with 1.5-2 m slip per event. The direct recurrence time estimate is 3-4 ka per episode (3-4 m/ (1 mm/yr) and the 50- and 100-yr conditional probabilities are 0.03 and 0.07, respectively. For comparison, 100 yr probabilities for the other Wasatch segments, based on their segment-specific recurrence times, are less than 0.02. Rupture of the Brigham City segment would complete the current active sequence along the Wasatch fault zone.
650

IV. 1
Ib. The high likelihood of a gap-filling thrust earthquake in the Alaska subduction zone within this decade is indicated by two independent methods probabilistic analysis of historic data and time-to-failure analysis applied to recent decades of instrumental data, in a recent study by Bufe et al. (1990).
Historic records suggest that the Shumagin and Alaska Peninsula gaps ruptured together during great earthquakes in 1788 and in 1847-1848 and independently in 1917 (1^ 7.5) and 1938 (U^ 8.3), respectively. The joint probability of a gap-filling event in the Shumagin or Alaska Peninsula gaps in the next 10 years is estimated at 0.58-0.66.
Moment release of thrust and reverse mechanism earthquakes in the combined rupture zones of the 1938 Alaska Peninsula earthquake and the 1917 Shumagin Island earthquake has accelerated in the past 15 years. Varnes (Pageoph, v. 130, p. 661, 1989) has shown that quantitative aspects of such acceler ating moment release sequences can be used to predict the time of occurrence of subsequent main shocks. We have found that moment (and strain energy) release, computed from magnitudes (M 5 or greater) of earthquakes in the Shumagin-Alaskan Peninsula gaps, decelerated following the great 1938 earth quake and has been accelerating since around 1975-1980. We model this accelerating sequence as a possible precursor to a gap-filling thrust earth quake, computing time-to-failure using a relationship developed by Varnes (1989). This technique indicates that one or more earthquakes of MW 7.5 or greater could be expected in the Shumagin-Alaska Peninsula gap region by the year 2000.
Ic. Bufe and Varnes (1991) have found that seismicity in northern California shows a long-term regional pattern of accelerating seismic-energy release leading up to the October 18, 1989 Loma Prieta earthquake. This pattern is apparent in cumulative sums of both seismicmoment and square root of energy or moment. More than a year before the Loma Prieta earthquake, the integrated form of the INPORT relation (Varnes, 1989) was applied to cumulative sum of square root of energy, which was estimated from magnitude: this analysis indicated a failure time of 1996. Post-earthquake refinements to this time-to-failure analysis of seismicity, utilizing seismic-moment release, Benioff strain-energy release, and event counts, indicate that a large earthquake (Loma Prieta) in the southern San Francisco Bay region could have been anticipated to occur within a year or two after June 1989. Simulations of the evolution of time-to-failure forecasts for the 1906 San Francisco and 1989 Loma Prieta earthquakes illustrate the potential useful ness and limitations of such forecasts. The error in the forecast generally decreases as the time of the ma inshock approaches. The inversion for time of failure for the Loma Prieta earthquake can be stabilized by constraining the exponent of time to failure on the basis of foreshock (and aftershock) data for other main shocks from the same region (i.e., 1906) or on the basis of b-value (slope of log frequency of occurrence as a function of magnitude) for the data set. Uncertainties surrounding the selection of the time window for analysis can be overcome by superposing accelerating (foreshock) and decelerating (1906 aftershock) sequences. The prediction of the prior occurrence of the 1836 earthquake through analysis of the decelerating 1855- 1890 seismicity indicates that these analysis techniques may also have the
651

IV. 1
potential to provide, for some regions, useful information on the occurrence of large earthquakes predating the historical record.
Id. D. W. Gordon is investigating the relationship between historic seis- micity and basement tectonics in the Northern Great Plains region. Although epicenter uncertainty and unknown fault geometry generally preclude confirm ation of a one-to-one correspondence between individual earthquake and faults, the proximity of the epicenters to known faults and the distribution of relatively high intensities can be used to identify possible causative faults. Review of macroseismic data indicates that communities close to concealed basement faults typically experience the maximum intensity associ ated with a given earthquake and, in some cases, well-delineated epicentral zones coincide with the hanging wall block of nearby faults.
Nearly all of the epicenters of strong, historic earthquakes (4.5 < m < 5.5) in the region correlate spatially with major basement structures, such as the border faults of the Midcontinent Rift System or the Great Lakes tec tonic zone. Moreover, minor, locally felt shocks exhibit excellent agree ment with basement tectonics. In particular, such shocks, which are in many instances reported felt at only one locality, correlate well with elements of a system of northwest- and northeast-trending basement shear zones that crisscross the region.
Precambrian suture zones and regional-scale shear zones also exert signifi cant structural control on isoseismal patterns. In some cases, meizoseismal zones coincide with areas between parallel basement faults, and the charac teristically anomalous isoseismals of widely felt shocks are apparently heavily influenced by suture zones that border Precambrian terranes.
During the last quarter, Gordon's investigation of seismotectonics in the NGP region has focused on a zone of relatively high seismicity that parti ally surrounds the Sioux Uplift in southeastern South Dakota and north eastern Nebraska. The majority of 30 historic epicenters in this zone are located less than 15 km from individual basement faults that belong to a family of northwest-trending, high-angle faults on the flanks of the uplift. The apparent association with contemporary earthquakes suggests that these faults are moderately active.
2a. Bernknopf et al. (1991) have estimated the probability of earthquake- induced landslides resulting from the 17 October 1989 Loma Prieta earthquake in Santa Cruz County, California.
The Bayesian probability estimate is combined with housing values to estimate the cost effectiveness of various mitigation measures.
2b. The National Earthquake Information Center (NEIC) has developed a questionnaire to document unusual wave activity in coastal areas related to earthquakes (Nishenko, 1987, 1990). This questionnaire was patterned after the NEIC Earthquake Questionnaire, which has been used for the last 50 years to document the effects of earthquakes on land (Stover, 1989). Usual wave activity (including tsunamis, tidal waves, seiches, etc.) are caused by submarine landslides, tectonic displacement, lateral spreading, compaction,
652

IV. 1
and other types of subsidence which can occur in conjunction with earth quakes. Data obtained through distribution of the questionnaire can contri bute to a balanced description of the earthquakes 1 effects at the land-water interface and can result in improved hazard mitigation strategies for coastal areas.
The occurrence of the 1989 Ms 7.1 Loma Prieta earthquake provided an unique opportunity to: (1) test the effectiveness of the prototype NEIC question naire prior to printing and widespread distribution, and (2) to systemati cally compile data pertaining to the coastal effects of the earthquake in the Monterey Bay area. Nishenko and Preuss (1991) conducted a survey in the Monterey Bay area during November-December 1990 to test the questionnaire and document the effects of the Loma Prieta earthquake.
3. The NEIC presented a training course on Understanding Earthquakes and Mitigating Their Effects during April 8-24, 1991, in Golden, Colorado. The course is intended for international geoscientists, engineers, planners, and emergency response personnel who are active in the acquisition, analysis, interpretation, dissemination, or utilization of earthquake-related informa tion. The course provided an overview of applied earthquake seismology and engineering, through a series of lectures and discussion groups. Partici pants received additional specialized training through one of several con current three-day workshops on topics including seismological instrumenta tion, processing and interpretation of raw earthquake data, computer analysis of seismicity data, and the application of earthquake hazard, vulnerability, and risk assessment to earthquake mitigation and response.
Reports
Bernknopf, R.L., Gori, P. L., Campbell, R. H., Nishenko, S. P., andSeller, D., 1991, Time-dependent earthquake-induced hazard mitigation:Submitted to Fourth International Conference on Seismic Zonation,Stanford University, August 26-29, 1991.
Bufe, C. G., Jaume, S. C., Nishenko, S. P., Sykes, L. R., and Varnes, D. J.,1990, Accelerating moment release in the Alaska subduction zone Precursor to a great thrust earthquake?: EOS (American GeophysicalUnion, Transactions), v. 71, p. 1451-1452.
Bufe, C. G., and Varnes, D. J., 1991, Time-to-failure analysis of seismicitypreceeding the 1989 Loma Prieta earthquake: U.S. Geological SurveyOpen-File Report (in preparation).
Nishenko, S. P., 1987, A questionnaire for rapid tsunami damage assessment,in_ Bernard, E. N., ed., Proceedings of the International TsunamiSymposium, IUGG, August 18 to 19, 1987: NOAA/PMEL Contribution 1041,United States Department of Commerce, p. 36-48.
Nishenko, S. P., 1990, Tsunami Questionnaire,: 0MB No. 1028-0049, 4 p. Nishenko, S. P., and Preuss, J., 1991, Post-Loma Prieta earthquake tsunami
evaluation and tsunami questionnaire evaluation (in preparation). Nishenko, S. P., and Schwartz, D. P., 1990, Preliminary estimates of large
earthquake probabilities along the Wasatch fault zone, Utah: EOS(American Geophysical Union, Transactions), v. 71, p. 1778.
Schwartz, D. P., and Nishenko, S. P., 1991, Probabilities of largeearthquakes along the Wasatch fault zone, Utah (in preparation).
Stover, C. W., 1989, Evaluating the intensity of United States earthquakes:Earthquakes and Volcanoes, v. 21, p. 45-53.
653

IV. 1
Digital Data Analysis
9920-01788
Stuart A. SipkinBranch of Global Seismology and Geomagnetism
U.S. Geological SurveyDenver Federal Center
Box 25046, Mail Stop 967Denver, Colorado 80225
(303) 236-1506
Investigations
1. Moment Tensor Inversion. Apply methods for inverting body phase wave forms for the best point-source description to research problems.
2. Other Source Parameter Studies. Apply methods for inverting body phase waveforms for distributed kinematic and dynamic source properties.
3. Aftershock Source Properties. Examine mainshock and aftershock source properties to study the mechanics of aftershock occurrence.
4. Broadband Body-Wave Studies. Use broadband body phases to study lateral heterogeneity, attenuation, and scattering in the crust and mantle.
5. Earthquake Recurrence Statistics. Use earthquake recurrence statistics and related parameters to better understand the earthquake cycle and study how they can be used for prediction and forecasting purposes.
6. Earthquake Location Studies. Study techniques for improving the robust ness, honesty, and portability of earthquake location algorithms, and participate in the construction and implementation of new standard travel- times for routine earthquake location.
7. Data Services. Provide seismological data and information services to the public and to the seismological research community, particularly data from the Global Digital Seismograph Network (GDSN) on SEED tapes, Network- Day tapes, Network-Event tapes, and Network-Event CD-ROM's.
8. NEIC Monthly Listing. Contribute both fault-plane solutions (using f irsT-motion polarity) and moment tensors (using long-period body-phase waveforms) for all events of magnitude 5.8 or greater when sufficient data exists. Contribute waveform/focal-sphere figures of selected events.
Results
1. Moment Tensor Inversion. A paper listing moment-tensor solutions for 210 moderate-to-large size earthquakes occurring in 1988 and 1989 was sub mitted for publication and is now in press. May 1990 was notable for the large number of unusual earthquakes. We have studied several of these earthquakes (in the Alaska Peninsula, Sakhalin Is., southern Sudan, and
654

IV.1
Romania) using the digitally recorded long-period and broad-band body waves. A report was presented at the 1990 Fall AGU Meeting. A study of structural complexity in seismogenic zones using earthquake mechanism catalogs is con tinuing. The differences in mechanism for nearby earthquakes are quantified and compared to the differences expected based on the uncertainties in the moment-tensor solutions. In areas where the differences'exceed those expected we hypothesize that these differences are due to variations in the orientation of the fault surface(s).
2. Other Source Parameter Studies. Linear and nonlinear methods of wave form inversion are being implemented to determine the fault-rupture history of large earthquakes. The application of a nonlinear iterative inversion scheme to teleseismic P-waveforms and strong-motion data recorded for the 1978 Tabas, Iran, earthquake is described in a recently published article. This method inverts for both rupture time and slip amplitude as a function of position on a finite fault. In addition, a linear method that inverts for the total slip on the fault is being used to study several large earth quakes, including the 1989 Loma Prieta, California, earthquake and several large thrust earthquakes along the Mexico subduction zone. In these studies, digital broadband waveforms are employed whenever possible to recover significant details of the rupture pattern.
3. Aftershock Source Properties. Work is continuing on the comparison of aftershock locations with distribution of fault slip derived from observed waveform data, especially for interplate thrust events.
4. Broadband Body-Wave Studies. A data set of relatively broadband shear- wave data has been assembled for the purpose of studying deep discontinuit ies in the Earth. Another data set has being assembled for the purpose of identifying near-receiver scattering of seismic waves. Software for both studies is being developed. While trying to recover broadband ground dis placement we discovered that, when deconvolving an instrument response, unless one explicitly takes into account the properties of the filters being used, either bias or increased uncertainty in the results can be introduced, especially when taking integral measures of the displacement pulse. A new optimal method for deconvolving the instrument response has been developed that avoids the pitfalls inherent in the methods currently used. A paper quantifying the bias introduced and presenting this new deconvolution method has been submitted for publication.
5. Earthquake Recurrence Statistics. A paper has been submitted for publication in which the "generic," characteristic earthquake, recurrence interval, probability density function model has been extended to provide a marginal distribution for recurrence intervals which is independent of the uncertainty in the median recurrence interval. This permits the estimation of a single preferred value for the conditional earthquake forecast prob ability.
6. Earthquake Location Studies. As a result of participation in an IASPEI working group, tau-p travel time programs were provided on UNIX and VMS platforms. Subsequently, the tau-p package was modified to support the generation of a reference Earth model. The software has been updated to
655

IV. 1
include the most current proposed IASPEI Earth model, and the number of travel-time branches has been doubled. Work has been done on making this code more accessible (ie. cleaner user interface, graphics output, documen tation, specialized code to run on various computers). A journal article on the statistics of teleseismic body-wave travel-time residuals has been submitted for publication. The results are leading to the development of new algorithms using robust estimation techniques. In this work the statistics of travel-time residuals, which are well known, are being applied directly in the location algorithm. This has lead to improving the meaning- fulness of the estimated errors in the locations and in earthquake magni tude. The estimated errors in the earthquake origin time are now being examined. A study of the statistics of later arriving phases will also be undertaken.
7. Data Services. FORTRAN software to read and extract digital data from station tapes (1976-1979) and network day tapes (1980-1987) has been developed and distributed to the research community worldwide. Users are supported on a variety of computers. A new Standard for the Exchange of Earthquake Data (SEED) has been created and tapes are now being produced (1988 to present) and distributed by the Albuquerque Seismic Laboratory. FORTRAN software has been developed to read and extract the digital data from the SEED tapes and this software is being made available to the research community. Event tapes have been produced from network day tapes for data from 1980 through February 1987 for all events with magnitude 5.5 or greater. These tapes are distributed to 25 institutions worldwide, along with a waveform catalog that provides a visual display of the data available for each event. Data from the event tapes are reformatted and sent to a CD- ROM mastering facility for replication. Eight volumes have been produced covering 1980 through 1986. The CD-ROM's are being distributed to over 200 universities across the United States and geophysical research institutes worldwide. Retrieval software SONIC (C) and CDRETRV (FORTRAN), has been developed for the IBM/PC/AT/386 compatibles and distributed, allowing easy access to the digital data.
8. NEIC Monthly Listing. Since January 1981, first-motion fault-plane solutions for all events of magnitude 5.8 or greater have been contributed to the Monthly Listings. Since July 1982, moment-tensor solutions and waveform/focal-sphere plots have also been contributed. In the last six months, solutions for approximately 76 events have been published. An atlas of European seismicity is in preparation. A complete compilation of Mediterranean Sea seismicity is being prepared.
Reports
Buland, R. P., 1991, Residual statistics: Bulletin Seismological Society of America (submitted).
Buland, R. P., and Nishenko, S. P., 1991, Preferred earthquake forecasts and conditional earthquake prediction: Bulletin Seismological Society of America (submitted).
Hartzell, S. H., and Mendoza, C., 1991, Application of an iterative least- squares waveform inversion of strong motion and teleseismic records to
656

IV. 1
the 1978 Tabas, Iran, earthquake: Bulletin of the Seismological Society of America, v. 81, no. 2, p. 305-331.
Hartzell, S. H., Stewart, G. S., and Mendoza, C., 1991, Comparison of LI and L2 norms in a teleseismic wave form inversion for the slip history of the Loma Prieta, California, earthquake, Bulletin Seismological Society of America (in press).
Sipkin, S. A., 1990, Moment-tensor solutions for several unusual earthquakes in May 1990 [abs.]: EOS (American Geophysical Union, Transactions), v. 71, no. 43, p. 1438.
Sipkin, S. A., and Lerner-Lam, A. L., 1990, Pulse-shape distortion intro duced by broadband deconvolution [abs.]: EOS (American Geophysical Union, Transactions), v, 71, no. 43, p. 1476.
Sipkin, S. A., and Lerner-Lam, A. L., 1991, Pulse-shape distortion intro duced by broadband deconvolution: Bulletin Seismological Society of America (submitted).
Sipkin, S. A., and Lerner-Lam, A. L., 1991, Instrument deconvolution using regularization methods [abs.]: Abstracts, 20th IUGG General Assembly, Vienna, Austria (in press).
Sipkin, S. A., and Needham, R. E., 1991, Moment tensor solutions estimated using optimal filter theory Global seismicity, 1988-1989: Physics of the Earth and Planetary Interiors (in press).
657

IV. 1
United States Earthquakes
9920-01222
Carl W. StoverBranch of Global Seismology and Geomagnetism
U.S. Geological SurveyDenver Federal Center
Box 25046, Mail Stop 967Denver, Colorado 80225
(303) 236-1500
Investigations
One hundred and ninety-six earthquakes in the United States and Puerto Rico, were canvassed by a mail questionnaire for felt and damage data during the period October 1, 1990 to March 31, 1991. Seventy-five of these earthquakes occurred in Alaska, 52 in California, 68 in twenty-two other states, and one in Puerto Rico.
Compilation of the Professional Paper "Seismicity of the United States, 1568-1989" has been completed and is under review.
A project field team studied the effects of the December 2-5, 1990 earth quake prediction, by I. Browning, on the populace in the New Madrid, Missouri area.
Results
Only two earthquakes caused damage (intensity VI) during this period both in California. The first was a magnitude 3.6 ML event on October 18, 1990 UTC that broke some windows at Costa Mesa; the second was a magnitude 5.7 ML event on October 24, 1990 UTC that cracked interior walls at Lee Vining.
The Earthquake Data Base (DBS) has been updated through the current PDE and through October 1990, Monthly Listing. The EDBS has been accessed for a fee by 131 non-government users. The government users are too numerous to count.
Seismicity of the United States 1569-1989 is a history of damaging (intensity VI) or magnitude 4.5 or larger earthquakes in 49 states and magnitude 5.0 or larger in Alaska. It consists of seismicity maps, isoseismal maps, lists of earthquakes, descriptions of damage, photographs, and a list of data sources.
United States Earthquakes, 1986 (Bulletin) in near completion and United States Earthquakes, 1987 is being compiled.
The response of the New Madrid, Missouri community was documented and a Branch report compiled. This report contains four sections: (1) the
658

IV.1
introduction (which describes the public response); (2) a collection of slidez; (3) a scrapbook containing pictures and newspaper articles; and (4) an 11-minute video tape.
Reports
Baldwin, Francis, Brewer, Lindie, Reagor, Glen, and Spence, William, 1991, New Madrid, Missouri-December 3, 1990 earthquake prediction The earthquake that never happened: Branch of Global Seismology and Geomagnetism Internal Report.
Stover, C. W., and Brewer, L. R., 1991, United States Earthquakes, 1985: U.S. Geological Survey Bulletin 1954, 170 p.
659

IV.2
Global Seismicity Mapping
9920-04321
Susan K. GoterBranch of Global Seismology and Geomagnetism
U.S. Geological SurveyDenver Federal Center
Box 25046, Mail Stop 969Denver, Colorado 80225
(303) 236-1506
Investigations
1. State Seismicity Maps. Produce and distribute seismicity maps on shaded, elevation-tinted state map bases.
2. U.S. Seismicity Map. Produce and distribute a full-color map showing earthquakes plotted on a shaded, elevation-tinted base map of the U.S.
Results
1. State Seismicity Maps. The aim of the state seismicity maps is to pro vide the most complete picture possible of where earthquakes have occurred historically in relation to geographic, geomorphic, and cultural features. This is accomplished by selecting or compiling an earthquake database that is then plotted and printed on a shaded, elevation-tinted base map.
Since this project began in 1988, state seismicity maps have been completed for California, Hawaii, and Alaska. A similar map has been recently com pleted for the state of Utah. This map displays earthquakes that occurred between 1884 and 1989. Although the magnitude threshold for earthquakes plotted on the map varies throughout the historical record, the lower magni tude cut-off for earthquakes that occurred after 1962 is 2.0. Epicenter symbol sizes plotted on the map are scaled into four magnitude categories. Earthquakes that occurred since 1975 are distinguished on this map from earlier events by the intensity of color of the epicentral symbol. Quater nary faults are also plotted on this map.
The resulting full-color maps are distributed to the research community worldwide, as well as to each high school in the state covered by the map.
2. U.S. Seismicity Map. Work is currently underway to produce a large (approximately 37" x 58") full-color map showing earthquakes in the U.S. from 1534 to 1990. Symbols are plotted at epicentral locations and symbol sizes are scaled into four magnitude categories. Earthquakes that occurred since 1975 are distinguished from earlier events by the intensity of color of the epicenter symbol. Nearly 60,000 earthquakes are represented on this map.
The resulting maps are distributed to the research community worldwide and will be available for purchase.
660

IV.2
Reports
Goter, S. K. , 1991, Earthquakes in Utah, 1884-1989: U.S. Geological SurveyOpen-File Report 91-128.
Goter, S. K., 1991, Earthquakes in the United States, 1534-1990 (inpreparation).
661

IV.2
Data Processing Section
9920-02217
Charles R. Hutt Branch of Global Seismology and Geomagnetism
U.S. Geological SurveyAlbuquerque Seismological Laboratory
Building 10002, Kirtland AFB-EastAlbuquerque, New Mexico 87115
(505) 844-4637
Investigations
1. IRIS/USGS Data Collection Center. The Incorporated Research Institutions for Seismology (IRIS) have designated the Albuquerque Seismological Laboratory (ASL) to be the data collection center (DCC) for a new global network of digitally recording seismograph stations. A new data processing system has been installed at the ASL and a new data format has been developed which is becoming the international standard for seismic data recording and distribution.
2. Data Processing for the Global Digital Seismograph Network. All of the data received from the Global Digital Seismograph Network (GDSN) and other contributing stations is regularly reviewed, checked for quality, and archived at the ASL.
3. Network Volume Program. Data from the GDSN stations and other contrib uting networks are assembled into network volumes which are distributed to regional data centers and other government agencies.
Results
1. IRIS/USGS Data Collection Center. IRIS has developed the instrumen tation for a network of 50 or more digital recording seismograph stations which will be primarily installed by USGS personnel over the next several years. All of the data from this network will be forwarded to the DCC located at the ASL. As part of this program, IRIS funded much of the new hardware required by the DCC to process this large amount of data. A new digital format known as the Standard for the Exchange of Earthquake Data (SEED) was developed by the USGS in cooperation with both IRIS and the Federation of Digital Broadband Seismograph Networks. The SEED format has been well received by the seismic community and is rapidly becoming a standard for both recording and distributing seismic data around the world. During the past year all of the digital data archived at the ASL on magnetic tape has been transferred to an optical jukebox memory system which can automatically select any of 50 optical platters each of which can store up to 3.2 gigabytes of seismic data. This amounts to approximately 175 gigabytes of data on 60 optical platters. All of this data can be considered to be online and available for immediate recall.
662
IV.2
2. Data Processing for the Global Digital Seismograph Network. During the past 6 months, approximately 20 gigabytes of digital data from the GDSN and other contributing stations were edited, checked for quality, corrected when feasible and archived at the ASL. The Global Digital Seismograph Network supported by the USGS consists of 12 SRO/ASRO stations, 11 DWWSSN stations and two IRIS-2 stations. The contributing stations include five from the China Digital Seismograph Network (CDSN), five IRIS-1 stations, five stations from the Terrascope Network in Southern California, and eight IRIS/IDA stations, four of which are located in the Soviet Union. Data from all stations in the IRIS/IDA network are temporarily on hold due to software problems in the conversion from station format to SEED format. All data from the IRIS/IDA stations, which was previously distributed in SEED format, may contain erroneous data and should be considered suspect.
3. Network Volume Program. The network volume program is a continuing program which assembles all of the data recorded by the Global Digital Seismograph Network, plus all the various contributing stations mentioned in previous paragraph, for a specific calendar day or days onto one magnetic tape. This tape includes all the necessary station parameters, calibration data, transfer functions, and time-correction information for each station in the network. All of the data in these network volumes are recorded in the new SEED format and copies are distributed to IRIS and to several university and government research groups for detailed analysis and further distribution. These tapes are assembled approximately 60 days after real time in order to provide a sufficient time frame for recording the data at the stations, forwarding this data to the ASL and processing the data at the DCC. The amount of data produced by the various networks each day varies from 80 to 120 megabytes.
663

IV.2
Data Processing, Golden
9950-02088
Robert B. Park Branch of Geologic Risk Assessment
U.S. Geological SurveyBox 25046, MS 966, Denver Federal Center
Denver, CO 80225(303) 236-1638
Investigations
The purpose of this project is to provide the day-to-day management and systems maintenance and development for the Golden Data Processing Center. The center supports Branch of Geologic Risk Assessment with a variety of computer services. The systems include a POP 11/70, a VAX/750, a VAX/780, two MicroVAX's, two SUN servers, 5 SUN workstations, and a PDP 11/34. Total memory is 40 mbytes and disk space is approximately 7 G bytes. Peripherals include four plotters, ten mag-tape units, an analog tape unit, two line printers, 5 CRT terminals with graphics, and a Summagraphic digitizing table. Dial-up is available on all the major systems and hardwire lines are available for user terminals on the upper floors of the building. Users may access any of the systems through a Gandalf terminal switch. Operating systems used are RSX11 (11/34's), Unix (11/70), RTll(LSPs) and VMS (VAX's).
Results
Computation performed is primarily related to the Hazards program; however, work is also done for the Induced Seismicity and Prediction programs, as well as for DARPA, ACDA, and U.S. Bureau of Reclamation, among others.
The data center supports research in assessing seismic risk and the construction of national risk maps. It also provides capability for digitizing analog chart recordings and maps. Also, most, if not all, of the research computing related to the hazards program are supported by the data center.
The data center also supports equipment for online digital monitoring of Nevada and Colorado Western Slope seismicity. Also, it provides capability for processing seismic data recorded on digital cassette tape in various formats.
The computer center manages the local area network (LAN) providing central backup facilities, file services, and peripheral access for about 75 personal computers. This LAN management is accomplished with Path Works software.
664

IV.2
National Earthquake Information Service
9920-01194
Waverly J. PersonBranch of Global Seismology and Geomagnetism
U.S. Geological SurveyDenver Federal Center
Box 25046, Mail Stop 967Denver, Colorado 80225
(303) 236-1500
Investigations and Results
The Quick Epicenter Determinations (QED) continues to be available to individuals and groups having access to a 300- or 1200-baud terminal with dial-up capabilities to a toll-free WATS number or a commercial telephone number in Golden, Colorado. It is also accessible via GEONET and public TYMNET. The time period of data available in the QED is approximately 3 weeks (from about 2 days behind real time to the current PDE in production). The QED program is available on a 24-hour basis, 7 days a week. From October 1, 1990 through March 31, 1991 there were 16,145 logins to the QED program, nearly double the amount for the previous six months. A daily QED message, 7 days behind real time, is transmitted to 38 different agencies in the U.S. and throughout the world via electronic mail, including a scien tific bulletin board operated by Dr. Francis Wu at the State University of New York at Binghamton. This bulletin board is accessible by anyone who is connected to BITNET. The daily QED message is also distributed to another 13 agencies via U.S. government communications (VADATS/DTS/AUTODIN), including worldwide distribution on the communications system of the World Meteorological Organization.
NEIS is making extensive use of electronic mail for data acquisition. Data are now being received via GEONET, TYMNET, internet, BITnet, DECNET/SPAN and uucp on a regular basis. Agencies sending data to NEIS via electronic mail include the following:
U.S. Bureau of Reclamation, DenverGeological Survey of Canada, OttawaGeological Survey of Canada, Sidney, BCUniversidad Autonoma de Mexico, Mexico CityUniversidade de Sao Paulo, BrazilUniversity of Bergen, NorwayInstitute Nazionale di Geofisica, Rome, ItalyCentro Cultura Scientifica Ettore Majorana, Erice, SicilyCentre Seismologique Euro-Mediterraneen, Strasbourg, FranceUniversity of Thessaloniki, GreeceKandilli Observatory, Istanbul, TurkeyHarvard University, Cambridge, MA (Centroid, Moment Tensor Solutions)Graefenberg Observatory, GermanyUniversity of Geneva, Italy
665

IV.2
Icelandic Meteorological Institute, Reykjavik, Iceland Universidad Nacional de la Plata, Argentina Project GEOSCOPE, Paris, France
In addition, the following agencies contribute data to the PDE program by computer file transfer or remote login via the computer networks:
USGS Alaska Seismic Project, Menlo ParkUSGS/California Institute of Technology, PasadenaUSGS Fredericksburg Observatory, Corbin, VirginiaUSGS Guam Observatory, Mariana IslandsUniversity of California, BerkeleyUniversity of Southern California, Los AngelesUniversity of Washington, SeattleJohn Carroll University, Cleveland, OhioNorthern Illinois University, DeKalbOklahoma Geophysical Observatory, Leonard
Data acquisition by electronic mail is in the process of being established with the Bureau Central Seismologique Francaise in France.
Telegraphic data are now being exchanged with the USSR on most larger earth quakes. The Soviet data are being received from the Central Seismological Observatory, Obninsk, under the auspices of the World Data Center system. Our designation as World Data Center A for Seismology played a key role in permitting this exchange to be established.
Data from the People's Republic of China via the American Embassy continue to be received in a very timely manner and in time for the PDE publication. We continue to receive four stations on a weekly basis from the State Seis mological Bureau of the People's Republic of China. The Bulletins with additional data are now being received by floppy disk in time for the Monthly.
Special efforts are being made to receive more data from the Latin American countries on a more timely basis. The increased availability of telefax is permitting much more interaction with Latin American countries than in the past.
We have rapid data exchange (alarm quakes) with Centre Seismologique European-Mediterranean (CSEM), Strasbourg, France, and Institute Nazionale de Geofisica, Rome, Italy, and Sicily, and data by telephone from Mundaring Geophysical Observatory, Mundaring, Western Australia and Pacific Tsunami Warning Center in Honolulu. The geophysical laboratory in Papeete, French Polynesia contributes a single-station estimate of seismic moment within about 24 hours of a large event in the Pacific region.
The Monthly Listing of Earthquakes is up to date. As of March 31, 1991, the Monthly Listing and Earthquake Data Report (EDR) have been completed through November 1990. The total number of events published for the period June through November 1990 was 8,286. The month of July 1989 produced a record umber of 1716 events. Radiated energy, moment tensor, P-wave first-motion
666

IV.2
and broadband depth solutions continue to be determined by the USGS when possible and published in the Monthly Listing and EDR for any earthquake having an m^ magnitude j>_ 5.8. Centroid moment tensor solutions contributed by Harvard University continue to be published in the Monthly Listing and EDR. Waveform plots are being published for selected events having m^ magnitudes j>_ 5.8.
The Earthquake Early Alerting Service (EEAS) continues to provide informa tion on recent earthquakes on a 24-hour basis to the Office of Earthquakes, Volcanoes and Engineering, scientists, news media, other government agenc ies, foreign countries, and the general public.
Sixty releases were made from October 1, 1990, through March 31, 1991. The largest earthquake that was felt in the United States was a magnitude 6.5 in the Bering Sea on February 7. This earthquake was felt on St. Paul in the Pribilof Islands, Alaska and generated a small tsunami at Adak and Dutch Harbor. It is believed to be the largest earthquake ever located in this area.
The most newsworthy earthquake was the one that never happened in the New Madrid, Missouri area (the Browning Prediction for December 3 or 4, 1990).
The most significant foreign earthquakes were:-a magnitude 5.4 in Sicily on December 13, 1990 which killed at least 19 people and caused extensive damage,
-a magnitude 7.0 in the New Brition region on December 30, 1990 which caused damage in the Hoskins area,
-a magnitude 7.1 in Burma on January 5, 1991 with some landslides reported,
-a magnitude 6.4 in the Hindu Rush region on January 31 (depth 152 km) which killed 200-400 people in Afghanistan and at least 300 in Pakistan and the USSR,
-a magnitude 6.9 in the Solomon Islands on February 9 which caused some damage.
Reports
Monthly Listing of Earthquakes and Earthquake Data Reports (EDR); six publications from June 1990 through November 1990. Compilers: W. Jacobs, P. Chang, J. Minsch, R. Needham, W. Person, B. Presgrave, W. Schmieder.
Preliminary Determination of Epicenters (PDE); 27 weekly publicationsfrom October 4, 1990 through March 28, 1991, numbers 37-90 through 10-91. Compilers: W. Jacobs, P. Chang, J. Minsch, R. Needham, W. Person, B. Presgrave, W. Schmieder.
Quick Epicenter Determination (QED) (daily): Distributed only by electronic media.
Person, Waverly J., Seismological Notes: Bulletin of the SeismologicalSociety of America, v. 80, no. 5, November-December 1989; v. 80, no. 6, January-February 1990; v. 81, no. 1, March-April, 1990; v. 81, no. 2, May-June 1990.
667

IV.2
Masse, R. P., and Person, W., Seismograph Networks and the NationalEarthquake Information Center, I Workshop on MEDNET The Broad-band Seismic Network for the Mediterranean.
Monthly Listing of Earthquakes, in Seismological Research Letters, Eastern Section, SSA, v. 61, no. 3-4, July through December 1989; v. 62, no. 1, January through March 1990: Compilers: W. Jacobs, P. Chang, J. Minsch, R. Needham, W. Person, B. Presgrave, W. Schmieder.
668

IV.2
Seismic Review and Data Services
9920-01204
James N. TaggartBranch of Global Seismology and Geomagnetism
U.S. Geological SurveyDenver Federal Center
Box 25046, Mail Stop 969Denver, Colorado 80225
(303) 236-1506
Investigations
This project distributes copies at cost of filmed seismograms from the Worldwide Standardized Seismograph Network (WWSSN), the Canadian Standard Network (CSN), and various stations with historical (pre-1963) records. In addition, the project receives and processes the original WWSSN analogue seismograms for photography, and afterward returns them to the stations.
Results
A contract for photography of original WWSSN seismograms and duplication of filmed seismograms covers fiscal years 1990-1992. Problems with alignment of the government-owned flatbed camera have delayed photography until recent months. As a result, only 140 station-months of WWSSN seismograms had been photographed through the end of this reporting period. We expect to photograph at least 600 station-months of seismograms by the end of the fiscal year. The standing orders for fiscal year 1990 included only 540 station-months of seismograms. Purchase of a new flatbed camera is not contemplated.
Seven standing orders for WWSSN and one standing order for CSN fiscal year 1990 filmed seismograms have been received. The number of active stations in both networks continues to decrease slightly each year. As a result, the cost of the standing orders was reduced for the fourth successive year. CSN films through September 1990 have been received from Ottawa.
Ten special orders for filmed WWSSN and CSN seismograms have been filled during this reporting period. Another order for nearly 100,000 films will require nearly the entire fiscal year to complete. Six special orders for historical seismograms suggest a renewal of interest in evaluation of some pre-1963 earthquakes.
This project is the principal source of filmed analogue seismograms for distribution through World Data Center A for Seismology, which was desig nated a part of the Branch structure in October 1986. The World Data Centers commonly exchange data for later distribution in their own regions of coverage.
669

V.I
GENERAL EARTHQUAKE OBSERVATION SYSTEM (GEOS) GENERAL ANALYSIS AND PLAYBACK SYSTEMS (GAPS)
9910-03009
Roger D. Borcherdt Branch of Engineering Seismology and Geology
U.S. Geological Survey345 Middlefield Road, MS 977Menlo Park, California 94025
415/329-5619 or FTS 459-5619
Investigations
1. Complete construction and development of 100 portable, broad-band, high-resolution digital data acquisition systems for use in a wide variety of active and passive seismic experiments.
2. Develop PC-based capabilities for field retrieval, processing, and archival of large volumes of GEOS data.
3. Conduct Eurasian Seismic Studies Program.
Results
1.) The following design modifications for new GEOS systems have been tested and implemented in construction of 55 new systems:a) Expanded data buffer (1 M/sample) design by M. Kennedy.b) Extended gain with improved noise for amplifier/board by J. Van Schaack and
G. Jensen.c) New tape controller for new 16 Mbyte tape cartridges by Phoenix Data, Inc.d) Software drivers for mag tape controller by G. Maxwell.e) Software for RS 232 for use in the satellite, radio, and telephone telemetry and
data transfer to field computer by G. Maxwell.f) Software for incorporating design modifications, teleseismic trigger, and field
playback by G. Maxwell.g) Completion of the 55 new GEOS units is in final stages pending contract
negotiations initiated by two transfers of contractor ownership.
2. GEOS maintenance laboratory under direction of J. Sena together with field support of G. Sembera and C. Dietel has facilitated the execution of several experiments within the last year, including experiments at parkfield, Anza, Armenia, and ground response investigations in the Marina District, San Francisco. PC-playback and processing capabilities have been developed. Work is underway to improve speed.
670

V.I
A portable, high-resolution, dense three-dimensional array consisting of 12 sites with three-component, 1.0 Hz seismometers has been installed in and around a two- dimensional tunnel with its longest dimensions being 200 m at the Garni Observatory, Armenia. The sites are arranged in a nested tripartite configuration with expanding interstation spacings near 60,120,240, and 480 meters. Signals are routinely recorded at 200 sps on time-synchronized GEOS recorders with maximum signal resolution of 96 dB. Simultaneous recording via pc-based data acquisition system is coupled to GEOS recorders and permits synchronized digitization and simultaneous tape playback and analysis capability. Array continues to operate successfully with data playback conducted by G. Glassmoyer as tapes are received from USSR.
Reports
Borcherdt, R., Cranswick, E., Hakhuerdian, L., Amirvekian, R., Aharonian, V., Safarian, K., Galagian, H., Hapoian, G., and Mori, J., 1990, Installation and first results of a dense 3-dimensional array at Garni, Armenia: EOS, (Transactions of the American Geophysical Union), v. 71, p. 1479.
(See other projects, e.g. Borcherdt et alt 9910-02089, 9910-02689;lyer; McGarr; Fletcher; Boatwright; Mueller; and Liu
for additional reports based on GEOS data sets.)
04/91
671

V.I
NATIONAL STRONG-MOTION NETWORK: DATA PROCESSING
9910-02757
A.G. Brady Branch of Engineering Seismology and Geology
U.S. Geological Survey345 Middlefield Road, MS 977Menlo Park, California 94025
415/329-5664 or FTS/459-5664
Investigations
1) Processing data from the Loma Prieta earthquake, including the determination of long- period limits, and the analysis of strong ground motion.
2) Software improvements for the processing program and for the PC network in various staff offices.
3) Cataloging all strong-motion records from the cooperative network operated by the USGS for 1988 and 1989.
Results
1) Processing of the records form the Loma Prieta earthquake continues. Digitization is complete on records from 38 stations, and the first volume of processed data, and three accompanying tapes, are available for distribution. Within the USGS, investigations have shown the contribution to damage of the Bay Bridge from ground resonances in the vicinity of the Oakland abutment and the contribution to the collapse of the Cypress Street viaduct. Recorded ground motion at Treasure Island up to the occurrence of liquefaction, is shown to be a suitable substitute for the ground motion in the Marina.
2) The Basic Strong-Motion Accelerogram Processing Program is at the second-draft stage. A limited PC version to be attached to a CD-ROM of strong motion uncorrected data is in preparation.
3) The annual report describing all strong-motion records recovered in a single year is called a Catalog of U.S. Geological Survey Strong-Motion Records, 19- and its Table 1 lists all important parameters obtainable from the original record: earthquake epicenter and magnitude, station name and location, trigger and S-T times, and component directions, peak acceleration and duration. The 1988 catalog has been distributed, and the 1989 catalog is in preparation. The Station List of the Cooperative National Strong-Motion Instrumentation Program is in preparation for publication, to supersede the 1980 listing.
672

V.I
Reports/Tapes
Brady, A.G., and Mork, P.N., 1990, Loma Prieta, California, earthquake October 18 (GMT) 1989, processed strong-motion records, volume 3: a tape available from NGDC, NOAA, Boulder, Colorado.
Switzer, Josephine C., and Porcella, R.L., 1990, Catalog of U.S. Geological Survey Strong-Motion Records, 1988: U.S. Geological Survey Circular 1057.
Brady, A.G., 1991, The USGS Cooperative Permanent Strong-Motion Accelerograph Network and its products [abs.]: Pacific Conference on Earthquake Engineering, November, 1991.
Hanks, T.C., and Brady, A.G., 1991, The Loma Prieta earthquake, ground motion, and damage in Oakland, Treasure Island, and San Francisco: Bulletin of the Seismo- logical Society of America, accepted for publication.
04/91
673

V.I
NATIONAL STRONG-MOTION NETWORK: ENGINEERING DATA ANALYSIS
9910-02760
A.G. Brady Branch of Engineering Seismology and Geology
U.S. Geological Survey345 Middlefield Road, MS 977Menlo Park, California 94025
415/329-5664 or FTS/459-5664
Investigations
1) The collapse of the Cypress Street viaduct during the Loma Prieta earthquake has been studied from the viewpoint of the three records in Oakland (and Emeryville) which surround the nearby viaduct in a nearly equilateral triangle.
2) The Treasure Island record, from the CDMG network CSMIP, contains steps in the horizontal acceleration time series which have seldom been recorded before, and which are not amenable to the processing that we can currently apply.
Results
Integrated displacements having 1-1/2 seconds period provide the dominant ground motion, coherent across all three sites, and therefore very likely to be representative of the damaging motion at the Cypress Street viaduct. That the damaged part of the viaduct was founded on fill overlying Bay mud appears fortuitous the entire area suffered coherent 1-1/2 second motion. Inability to handle a higher frequency arriving pulse would be a reason for the more southern section to fail, founded on firmer material.
Reports/Tapes
Hanks, T.C., and Brady, A.G., 1991, The Loma Prieta earthquake, ground motion, and damage in Oakland, Treasure Island, and San Francisco: Bulletin of the Seismo- logical Society of America, accepted for publication.
04/91
674

V.I
Branch of Engineering Seismology and Geology Computer Project9910-02085
Howard BundockBranch of Engineering Seismology and Geology
U. S. Geological Survey 345 Middlefield Road, MS 977Menlo Park, California 94025(415) 329-5621, FTS 459-5621
INVESTIGATIONS
The objectives of the Branch of Engineering Seismology and Geology Computer Project are to:
Maintain a strong capability for the processing, analysis and dissemination of all strong motion data collected on the National Strong Motion Network and data collected on portable arrays;
Support research projects in the Branch of Engineering Seismology and Geology by providing programming and computer support including digitizing, graphics, processing and plotting capabilities as an aid to earthquake investigations;
Manage and maintain computer hardware and software so that it is ready to process data rapidly in the event of an earthquake.
The Branch facilities, after a major reconfiguration of Branch computers, include two VAX 3300 minicomputers in a dual-host, clustered system, a diskless VAXstation 3100, also clustered, all running VMS version 5.4. We still run our VAX 8250, VMS version 5.02 and have replaced our PDP 11/70 with a POP 11/73 running RSX-11M+ for GEOS playback. The Branch computers are part of a local area network with other Branch, OEVE, Geologic Division, and ISD computers, and we have access to computers Survey-wide over Geonet. Project personnel join other office branches in the support of the local area network which now includes sub-LANs for desktop workstations, PC's and Macs.
Investigations during the first six months of FY91 included installation and changeover to the new systems, which went relatively smoothly. We are now working to clear the Building 7 computer room of all of our old equipment through storage, trade-in, etc. of obsolete equipment. The project hired a new employee to oversee BESG microcomputer resources. We are resuming the installation of network hardware and software for linking Branch members' PCs and Macintosh microcomputers to the VAXes. This work is being done for terminal emulation, file transfer and shared disk and plotter capabilities. Work was done in conjunction with Office scientists to collect and map seismic and other earth science instrumentation and marker stations in the Bay Area. The project joined in undertaking the reorganization of Office computer facilities and joined in the reorganization and upgrade of computer systems within the Branch. Further resources planned for the Branch include a new DSSI disk subsystem, read/write optical disk drives, CD-ROM, and providing a system for making color slides of computer graphics. As an ongoing policy, we have kept our hardware up to current revision levels, and operating system, network, and other software at the most recent versions possible.
675

V.I
RESULTS
As a result of these and previous investigations, the project has:
Installed new BESG computers, taken the VAX 11/750 and 11/70 minis off line, connected Branch members' microcomputers to the Local Appletalk network for access to VAXes and shared resources,
Compiled maps of data from a newly formed database of USGS and state seismi stations in the Bay Area and California, and
Reinstalled all software on Branch computers for use of scientists needing access to Internet and electronic mail, NCAR graphics, statistical libraries, etc. and access to VAX resources from Unix machines,
Completed reorganization of Office computing, including transferring ownership of the Office VAX 11/785 to Seismology Branch, and insuring that all Office scientists will have access to computer resources, which includes management of compute resources for Branch of Tectonophysics and certain other resources for other OEVE scientists. (CalComp plotter, laser printers, temporary computer accounts, etc.)
Joined with OEVE members in the completion of plans for removal of all hardware from space in the Building 7 computer room.
Managed, maintained, updated Branch computer system hardware and software, and managed computer resources for other OEVE scientists.
REPORTS
None
676

V.I
STRONG-MOTION INSTRUMENTATION NETWORK DESIGN, DEVELOPMENT, AND OPERATIONS
9910-02764. 9910-02765
Ed Etheredge, Ron Porcella, and Dick Maley
Branch of Engineering Seismology and Geology345 Middlefield Road, MS 977Menlo Park, California 94025
(415) 329-5667
Investigations
The Strong-Motion laboratory, in cooperation with federal, state, and local agencies and advisory engineering committees, designs, develops, and operates an instrumentation program in 41 states and Puerto Rico. Program goals include: (1) recording of potentially damaging ground motion in regional networks, and in closely spaced sensor arrays; and (2) monitoring the structural response of buildings, bridges and dams using sensors placed in critical locations. The present coordinated network consists of approximately 1,000 recording units installed at 600 ground sites, 28 buildings, 5 bridges. 56 dams, and 2 pumping plants.
New Instrumentation
Structures
1) Extensive instrumentation system (15 channels) in a 13 story steel frame building in Irvine, California.
2) Moderate instrumentation system (9 channels) in a 10 story steel frame building in St. Louis, Missouri.
Both structures were instrumented in line with regional structural instrumentation advisory committee recommendations.
Ground sites
CaliforniaSMA-1 Analog Accelrographs
1) Alhambra. Norwich2) Foster City, Niantic3) Fresno, USGS Office4) Menlo Park, USGS Office5) MWD West Portal Tunnel, near San Jacinto6) Monterey Park, USGS Office
7)-10) Orange County GroupCosta MesaHuntlngton BeachJohn Wayne AirportNewport Beach
11)-13) San Andreas Fault, northern end of the Loma Prieta earthquake fault zone 14)-15) Stanford Linear Accelerator
677

V.I
SSA-1 Digital Accelerographs
1) Fresno, USGS2) Menlo Park, USGS3) Menlo Park, 14th Av.4) Monterey Park, USGS5) Redwood City, Redwood Shores6) Salton Sea7) Tripp Flats
8)-9) Warm Springs Dam, Corps of Engineers
Illinois: (SMA-1)
Chicago. AMOCO
Kansas (SMA-1)
Overland Park (Kansas City)
New Madrid Seismic Zone
SSA-1 Sites Lepanto, ARBlytheville, AR (SMA removed) Poplar Bluff, MO Paris, TN Union City, TN (SMA removed)
SMA-1 SitesForest City, AR Newport, AR
In addition 21 WWVB radio receivers were installed at strong-motion stations in the New Madrid seismic zone.
New York (SMA-1)
Great Neck (New York City Area)
Washington (SMA-l's)
Seattle, downtown (future structural site)
North Toutle River Dam, Corps of Engineers 5 accelerographs
Stations removed
California
Coalinga dog houseColton interchangeFremontLos Angeles, JasperSan Francisco, Thorton HallStanford, Quad
Both the Hollister and El Centre digital differential arrays have been closed down because of permanently defective equipment. Eventual fate of these arrays is
678

V.I
unknown. Single SMA-l's are operating at each array, with 39 digital channels now inoperative.
Earthquake Records
1) Upland, California, ML=5.5, 2/28/91
82 strong-motion records
Peak acceleration >.O5 g at San Antonio Dam
2) Numerous records from small earthquakes in California and Hawaii
Report:STRONG-MOTION RECORDINGS FROM THE ML 5.5 UPLAND. CALIFORNIA EARTHQUAKE OF FEBRUARY 28, 1990, USGS Open-File Report 90-311, E. C. Etheredge and others
STRONG-MOTION RECORDS FROM EARTHQUAKES OF JUNE 13, 1988, NOVEMBER 1O, 1988. AND APRIL 3, 1989, ON THE CALAVERAS FAULT, CENTRAL CALIFORNIA, USGS Open-File Report 90-481, M. J. Salsman and J. C. Switzer
04/91
679

V.I
ANALYSES OF STRUCTURAL RESPONSE TO EARTHQUAKES
9910-02759
Erdal §afak and Mehmet Branch of Engineering Seismology and Geology
U.S. Geological Survey345 Middlefield Road, MS 977Menlo Park, California 94025
703/648-6534 or FTS/959-6534
Investigations
1) Analyses of seismic recordings obtained from instrumented structures during the October 17, 1989, Loma Prieta earthquake.
Results
1) Full set of records from six extensively instrumented structures (five buildings and one dam) have been obtained during the October 17,1989, Loma Prieta earthquake. The analyses of data from three of the buildings, the pyramid-shaped 60-story Transamerica Building, the three-winged (Y-shaped) 30-story Pacific Park Plaza building, and the 42- story Chevron building, have been completed. Analyses for the remaining structures are in progress.
Reports
Celebi, M, and §afak, E., 1991, Recorded seismic response of Transamerica Building Part I: Data and preliminary analysis: Journal of Structural Engineering, ASCE, (will appear in August 1991 issue).
Safak, E., and Celebi, M., 1991, Recorded seismic response of Transamerica Building Part II: System identification: Journal of Structural Engineering, ASCE, (will appear in August 1991 issue).
Celebi, M., and §afak, E., 1991, Recorded seismic response of Pacific Park Plaza Part I: Data and preliminary analysis: Journal of Structural Engineering, ASCE, (submitted for publication).
680

V.I
§afak, E., and Celebi, M., 1990, Recorded seismic response of Pacific Park Plaza Part II: System identification: Journal of Structural Engineering, ASCE, (submitted for publication).
§afak, E., and Celebi, M., 1991, Analyses of recorded responses of two high-rise buildings to Loma Prieta mainshock: Special Issue, Bulletin of the Seismological Society of America, submitted for publication)
§afek, E., 1991, Response of a 42-story steel-frame building to the Ms =7.1 Loma Prieta earthquake, Journal of Structural Engineering, ASCE, (submitted for publication).
04/91681

V.2
PHYSICS OF THE EARTHQUAKE PROCESS
9910-01915
D.J. Andrews Branch of Engineering Seismology and Geology
U.S. Geological Survey345 Middlefield Road, MS 977Menlo Park, California 94025
415/329-5606 or FTS/329-5606
Investigations
Tectonic modeling of the San Francisco Bay Region.
Results
A numerical method to solve the coupled problem of heat flow and material flow with nonlinear temperature-dependent rheology has been developed for two-dimensional out-of-plane deformation. This geometry applies to a cross section through a strike-slip fault. Velocity is adjusted iteratively toward stress equilibrium. Work done in shear deformation is a source term in the heat flow calculation. In each element stress is the minimum of that given by a creep rheology and a friction rheology. The creep rheology is a power-law stress-strain relation with a thermal activation factor. Parameters chosen, following Sibson, are appropriate to wet quartzite. The friction rheology imposes a limit on the magnitude of the shear stress. Outside the fault zone the frictional strength is chosen to increase with depth at a rate of 16.7 MPa per km. In order to get a heat flow anomaly at the fault within the scatter of measurements near the San Andreas, frictional strength inside the fault zone is chosen to be only 1/5 as large, increasing with depth at 3.3 MPa per km. Lateral boundaries are driven at 3 cm per year. A steady-state solution was found in a grid extending to 25 km depth and 25 km away from the fault. The lower crust is weak enough that the crust is decoupled from the mantle over distances this small. The peak shear stress found on the fault is 38 MPa at 12 km depth. The force transmitted through the crust that drives fault slip at crustal depths is concentrated at a very shallow level. Away from the fault the peak shear stress is 83 MPa at 5 km depth. The transition to deeper peak stress on the fault occurs within a few kilometers of the fault.
Reports
Andrews, D.J., 1991, Stress in the upper crust near a weak strike-slip fault [abs.]: Seismological Research Letters, v. 62, p. 44
04/91
682

V.2
GROUND MOTION PREDICTION FOR CRITICAL STRUCTURES
9910-01913
D.M. BooreW.B. Joyner
Branch of Engineering Seismology and GeologyU.S. Geological Survey
345 Middlefield Road, MS 977Menlo Park, California 94025415/329-5616 or 415/329-5640
Investigations
1. Develop equations for the ground motion at soil sites in ENA.
Results
1. Equations giving ground motion as a function of magnitude and distance at rock sites in the central and eastern United States were recently published by Atkinson and Boore (1990). We have extended their work to a generic, deep-soil site (soil thickness greater than 60 m). We first used a "quarter-wavelength" approximation first proposed by Joyner and Fumal to derive frequency-dependent amplification factors. We then computed theoretical ground motions for a suite of distances and magnitudes, using the stochastic model (e.g., Joyner and Boore, 1988). Finally, we used a two-stage regression to determine coefficients of the attenuation relation. We anticipate that these equations will find use in constructing probabilistic ground-shaking maps.
Reports
1. Boore, D.M., and Joyner, W.B., 1991, Estimation of ground motion at deep soil sites in eastern North America: Bulletin of the Seismological Society of America [submitted].
2. Joyner, W.B., and Boore, D.M., 1991, Strong earthquake ground motion and engineer ing design: Geotechnical News, v. 9, p. 21-26.
04/91
683

V.2
ANELASTIC WAVE PROPAGATION
9910-02689
Roger D. Borcherdt Branch of Engineering Seismology and Geology
U.S. Geological Survey345 Middlefield Road, MS 977Menlo Park, California 94025
415/329-5619 or FTS 459-5619
Investigations
Development of methodologies for predictive mapping of potential hazards due to strong ground shaking using GIS technology.
Results
The amount of damage to vulnerable structures in the San Francisco Bay region from the 1989 Loma Prieta and 1906 California earthquakes depend chiefly on the geological char acter of the ground and distance from the causative source. Correlations between measured weak- and strong-motion amplifications, mean shear velocity to depths of 30 m, and geologic characteristics are used to classify geologic units according to amplification capability. Geologic maps in a GIS data base are used to prepare maps of amplification capability^ intensity, excedent opportunity, and intensity excedent potential. A methodology for definition of spectral study zones for strong ground shaking in terms of a specified critical level for excedent potential has been developed. Such maps provide a rigorous basis for seismic zonation to economically mitigate future earthquake hazards.
Reports
Hough, S.E., Borcherdt, R.D., Friberg, PA., Busby, R., Field, E.F., and Jacob, K.H., 1990, The role of soil conditions and ground motion amplification in the collapse of the Nimitz freeway during the October 17, 1989 Loma Prieta earthquake: Transactions of the American Geophysical Union, EOS, v. 71, p. 228.
Kameda, H., £elebi, M., Borcherdt, R.D., Akamatsu, J., and Fujita, M., 1991, Comparative observation of soil amplification from long-period microtremor and earthquake recordings for seismic microzonation [abs. accepted]: Fourth International Conference on Seismic Zonation, Stanford, California.
Borcherdt, R.D., Wentworth, C.M., Glassmoyer, G., Fumal, T., Mork, P., and Gibbs, J., 1990, On the observation and predictive GIS mapping of ground response in the San Francisco Bay region, California [accepted]: Fourth International Conference on Seismic Zonation, Stanford, California.
Wentworth, CM., Borcherdt, R.D., Fitzgibbon, T.T., Mork, P., and Tarr, A.C., 1990, Application of GIS technology to seismic zonation of the San Francisco Bay region [accepted]: Fourth International Conference on Seismic Zonation, Stanford, California.
04/91
684

V.2
Prediction of Strong Ground Motion in Sedimentary Basins Using Numerical Simulations
9910-04482
A. Frankel
Branch of Engineering Seismology and GeologyU.S. Geological Survey
345 Middlefield Rd., MS 977Menlo Park, CA 94025
(703)648-4119
Investigations
Study seismic wave propagation in realistic, three-dimensional models of sedi mentary basins using numerical simulations, to evaluate seismic shaking in such basins from future large earthquakes.
Results
I used a three-dimensional finite difference program to simulate the seismic wavefield in the Santa Clara Valley generated by a Loma Prieta aftershock. The pro gram propagates complete elastic wavefields through three-dimensional models with arbitrarily-complicated geometry. A 3-D model for the alluvium-filled Santa Clara Valley was made based on water well data. The simulations were computed on a Cray YMP supercomputer. Each simulation of 4000 time steps took about 7 hours of CPU time. The grid covered 30 km by 22 km by 6 km in depth and consisted of about 4 million grid points. The grid spacing was 100m and the simulation is accurate for fre quencies up to 1 Hz. With the help of G. Coats (USGS, Reston), a videotape was made showing the simulated wavefield propagating across the valley.
The synthetic seismograms show large surface waves (Ix>ve and Rayleigh) pro duced at the southern edge of the basin by the conversion of incident S waves. Such surface waves were observed on the Sunnyvale dense array for aftershocks of the Loma Prieta earthquake. These surface waves increase the duration and amplitude of shaking at long periods (> Isec). 2-D simulations show that significant surface waves are produced even for steeply incident S-waves.
685

V.2
Reports
Frankel, A., S. Hough, P. Friberg, and R. Busby, Analysis and modeling of waveforms of Loma Prieta aftershocks recorded on a dense array in Sunnyvale, California, EOS Trans. Amer. Geophys. Union, v. 71, p. 1456, 1990.
Frankel, A., S. Hough, P. Friberg, and R. Busby, Observations of Loma Prieta aft ershocks from a dense array in Sunnyvale, California, Bull. Seism. Soc. Am., accepted for publication.
Frankel, A., A. McGarr, J. Bicknell, J. Mori, L. Seeber, and E. Cranswick, Attenuation of high-frequency shear waves in the crust: measurements from New York State, South Africa, and southern California, /. Geophys. Res., v. 95, pp. 17,441-17,457, 1990.
Frankel, A., Mechanisms of seismic attenuation in the crust: scattering and anelasticity in New York State, South Africa, and southern California, /. Geophys. Res., v. 96, pp. 6269-6289, 1991.
Frankel, A., High-frequency spectral falloff of earthquakes, fractal dimension of com plex rupture, b-value, and the scaling of strength on faults, /. Geophys. Res., v. 96, pp. 6291-6302, 1991
68604/91

V.2
VELOCITY AND ATTENUATION MEASUREMENTS IN ENGINEERING SEISMOLOGY
9910-02413
Hsi-Ping Liu Branch of Engineering Seismology and Geology
U.S. Geological Survey345 Middlefield Road, MS 977Menlo Park, California 94025
415/329-5643 or FTS/459-5643
Investigations
Analysis of surface and downhole seismic records at a station in the Marina District of San Francisco. Following the 1989 Loma Prieta earthquake, the U.S. Geological Survey drilled a hole to 91-m depth at Winfield Scott School at Beach and Divisidero Streets. The strati graphy determined from soil samples is as follows: hydraulic-filled sand (0-4.3 m), natural sand deposits (4.3-7.6 m), interbedded sand and clay (Holocene) (7.6-11.6 m), dense fine sand (11.6-22.9 m), clay (Pleistocene) (22.9-79.5 m) and bedrock (hydrothermally altered serpentine) (79.5 m and deeper). Two three-component seismometers, one in bedrock at 88-m depth and one located at the surface, have been installed at the site. Each seismo meter consists of one vertical and two orthogonally oriented horizontal geophones having a natural period of 0.5 s. Between August, 1990 and January, 1991, more than 50 earth quakes have been recorded digitally at 200 samples/s. Eight among these, ranging in mag nitude from between 2.8 and 3.6 and occurring on Calaveras, Franklin, Greenville, and Hay- ward faults and on faults parallel and close to the San Andreas fault, have been recorded with high signal-to-noise ratio. Horizontal ground-motion amplification, expressed as the spectral ratio between motion at the surface and that in the bedrock, has been calculated from records of these earthquakes for motions parallel to Beach and Divisidero Street re spectively.
Results
The lowest frequency spectral-ratio peak, calculated for all eight earthquakes and for motions parallel to both Beach and Divisidero Streets, occur coherently at ~ 1 Hz; its amplitude varies from 7.2 to 12.7. Locations of the higher-frequency spectral-ratio peaks are different for different earthquakes. However, when the spectral rations calculated for the east-bay earthquakes only are plotted, the second and third lowest-frequency peak for motions parallel to Beach Street becomes coherent. When the spectral ratios calculated for the south-bay earthquakes only are plotted, the second lowest-frequency peak for motions parallel to Beach Street becomes coherent. These results suggest that in a three- dimensional sedimentary basin, different modes of vibration are excited depending on the location of the earthquake source. The spectral ration is generally greater than 1 from 0.5 to 20 Hz.
687
V.2
Reports
Liu, H.-P., Warrick, R.E., Westerlund, R.E., Sembera, E.D., and Wennerberg, L., 1990, Ground-motion amplification by sediment from small earthquakes (M< 3.6) in the Marina District of San Francisco: submitted to the Fourth International Conference on Seismic Zonation.
04/91688

V.2
SCALING OF SEISMIC SOURCES
9910-04488
Art McGarr and John Bicknell Branch of Engineering Seismology and Geology
U.S. Geological Survey345 Middlefield Road, MS 977Menlo Park, California 94025
415/329-5645 or FTS/329-5645
Investigations
1. Seismic data recorded locally, both on the surface and underground, are analyzed and modeled to gain insight into the seismic source process, especially with regard to source scaling.
2. Following the October 1989 Loma Prieta earthquake a four-station network of GEOS digital event recorders was operated at the San Francisco International Airport (SFO) to determine the response of various sites there to strong ground motion, especially that of the Loma Prieta mainshock.
Results
1. Progress was made in understanding how natural crustal earthquakes relate to their counterparts in laboratory strick-slip friction experiments. A long-standing problem in this regard involves understanding why stress drops in laboratory events increase with confining stress across the fault whereas stress estimates for crustal earthquake show no apparent dependence on depth (e.g., O'Neill, 1984; McGarr, 1984). The problem may be with how stress drops are estimated for earthquakes inasmuch as if the peak acceleration £ for an earthquake is used to estimate the stress drop Acra of the largest asperity within the earthquake source volume according to Acra = 2.5 pR& (McGarr, 1991), where p is density and R is hypocentral distance, then one observes (McGarr, 1984) that the asperity stress drop so measured increases with earthquake focal depth.
2. Analysis of ground motion site response variation at SFO was completed and a report written (McGarr et dL, 1991). The two most important conclusions are: (1) Non-bedrock sites at SFO showed peak velocities amplified by a factor of about 2.5 relative to the bedrock site, and (2) The moho reflected phases SmS and PmP account for the largest amplitude ground motion of the S and P wave trains at SFO as well as elsewhere along the San Francisco peninsula.
689

V.2
References
McGarr, A., 1991, Observations constraining near-source ground motion estimated from locally recorded seismograms: submitted for publication.
McGarr, A., 1984, Scaling of ground motion parameters, state of stress, and focal depth: Journal of Geophysical Research, v. 89, p. 6969-6979.
O' Neill, M., 1984, Source dimensions and stress drops of small earthquakes near Parkfield, California: Bulletin of the Seismological Society of America, v. 74, p. 27-40.
Reports
McGarr, A., 1991, Observations constraining near-source ground motion estimated from locally recorded seismograms: revised for publication.
McGarr, A., Celebi, M., Sembera, E., Noce, T., and Mueller, C., 1991, Ground motion at the San Francisco International Airport from the Loma Prieta earthquake sequence, 1989: Bulletin of the Seismological Society of America, in press.
04/91
690

Loma Prieta
Post-Loma Prieta Earthquake Investigations:Geology and Tectonic Framework of Southwestern
San Francisco Bay Region
9910-04428
R. J. McLaughlin, J. C. Clark, E. E. Brabb, E. J. HelleyBranch of Western Regional Geology
345 Middlefield Road, MS 975Menlo Park, California 94025FTS: 459-4945 - McLaughlin
459-5140 - Brabb, 459-4947 - Helley(412) 357-5622 - Clark
Investigations
1. Geologic mapping investigations during this time period have focused on the Los Gatos and Santa Teresa Hills 7-1/2' quadrangles. Field mapping in Los Gatos quadrangle is to be completed by July 1991. Compilation of geology in the Santa Teresa Hills quadrangle is well underway and may be nearly completed by September 1991.
2. In cooperation with M. C. Blake, C. M. Wentworth, D. L. Jones, A. Griscom, and R. Jachens, a deep crustal cross section from the east margin of the Great Valley, southwestward across the San Andreas fault was constructed, integrating surface geology, deep seismic reflection and refraction data, gravity, and aero magnetic surveys.
3. Cooperative efforts are also underway with Griscom and Jachens to model shallow and deep magnetic anomalies northeast and southwest of the San Andreas fault to determine the geometry and depths to magnetic basement rocks and the displacement of these basement rocks across major faults. Used in conjunction with offsets determined from the surface geology, these data should lead to a better understanding of the local and regional structural relations.
4. Geochemical discrimination plots have been made of ultramafic, mafic, and silicic igneous rocks of the Coast Range ophiolite and Franciscan Complex of the Sierra Azul area northeast of the San Andreas fault, and of mafic igneous rocks locally exposed in fault slivers southwest of, and along the San Andreas fault Rb-Sr isotopic data have also been obtained for most of these rocks in cooperation with R. W. Kistler and D. Champion.
5. Pb-U and K-Ar radiometric dating of Plagiogranitic rocks in the Coast Range ophiolite of the Sierra Azul area are also in progress (cooperation with J. Wooden and J. Nakata).
Results
Some preliminary results of the mapping investigations undertaken for this project have been published in Abstracts with Programs and presented at a poster session at the 1991 Cordilleran Section meeting of the Geological Society of America in San Francisco, California. A field trip guidebook published by the California Division of Mines and Geology in conjunction with this meeting contains an article summarizing the geology of the Loma Prieta region along with a field trip road log. Other preliminary interpretive findings are summarized below:
1. The main bedrock trace of the San Andreas fault in Los Gatos quadrangle as we discussed in NEHRP Open File Report 90-680, is mapped mainly northeast of geomorphologically youthful fault traces along, or high on the slopes of the ridge southwest of the main San Andreas fault The main San Andreas fault is also northeast of most extensional and sinistral-slip surface deformation
691

Loma Prieta
which accompanied the 1906 and 1989 earthquakes on the San Andrcas fault. The main bedrock trace of the San Andreas fault follows an uncharacteristically sinuous course along the lower southwest side of Los Gatos Creek Canyon, below the 1989 and 1906 zones of surface cracking. Large landslides have been mapped on this northeast-facing slope, and the heads off these slides have been considered to be below the ridge crest. However, R. Wells and D. Ponti (this volume) have demonstrated that the amount of extension that occurred across the ridge-top crack zone dur ing the 1989 earthquake is far in excess of the amount predicted from the first motion mechanism for the Loma Prieta earthquake main shock. They propose that most of the observed extension and sinistral slippage is best accounted for by slope-related processes. When considered with the position and surface pattern of the main bedrock trace of the San Andreas fault, this data suggests that the ridge-top crack zone may define the headwall region of giant intact rotational landslide blocks. These rotational block slides have apparently over-ridden the main San Andreas fault in places, probably have experienced repeated rotational movement induced by seismic shaking, and they may owe their origins to repeated earthquakes and uplift along this part of the San Andreas fault The configuration of the ridge top crack zone in the headwall area seems structurally con trolled by bedding, fractures parallel to the San Andreas and Butano faults, and to the amount and orientation of slope, as proposed by Wells and Ponti. The lower-limits of these slide blocks can not be located with certainty due to limited exposures and the intact character of the slide blocks. Presumably the toes of the slide blocks extend into, or are along the southwest side of Los Gatos Creek Canyon. A relatively well-defined giant rotational landslide along the northeast side of Soquel Creek Canyon and San Andreas fault is present to the southeast, in Laurel and Loma Prieta quadrangles. This block slide appears to have an origin similar to the intact block slides in Los Gatos quadrangle.
2. Prominent positive aeromagnetic anomalies are associated with mafic and ultramafic rocks that occur along most of the major faults northeast of the San Andreas fault in Los Gatos, Santa Teresa Hills, and Loma Prieta quadrangles. The Sierra Azul structural block, which is composed of a thick slab of Jurassic Coast Range ophiolite overlain by Upper Jurassic to lower Miocene Marine strata, structurally overlies the Franciscan Complex, and is internally imbricated by several south west-dipping reverse faults, including the Sargent and Hooker Gulch faults. The magnetic anoma lies associated with cumulate ultramafics and gabbro of the Coast Range ophiolite clearly delineate the dips of these faults and their southwest-side-up displacements of the ophiolitic basement of the Sierra Azul block.
Near-surface magnetic anomalies associated with ultramafic rocks in Franciscan terranes north east of the Sierra Azul block also delineate southwest dips for the Sierra Azul, Soda Springs, Lime Kiln and Berrocal fault zones. Structural reversals evident from the magnetic anomaly pattern northeast of the Berrocal fault and in the Santa Teresa Hills, suggest that complexly folded tabular bodies of serpentinite are interleaved with the Franciscan Complex in this area. Field mapping and a recently discovered fossil locality indicate that many of these serpentinite bodies are sheared into the Franciscan Central belt along low-angle-faults, and that the Serpentinite masses locally enclose lenticular bodies of lower Great Valley sequence strata. At least some of the serpentinite bodies interleaved with the Franciscan Complex Central belt, therefore, were probably derived from the Coast Range ophiolite.
3. A thin body of tuffaceous to siliceous slate and phyllite occurs in the sole of a southwest- dipping thrust beneath Loma Prieta Peak, within a few kilometers of the San Andreas fault. The thrust fault emplaces the slaty rocks and the Coast Range ophiolite over marine rocks of Eocene age, and the timing of thrusting has been shown to be 10-18 Ma (Miocene). The slate unit is lithologically similar to metamorphic rocks in the western Sierra foothills terrane (i.e. Mariposa slate), and is tentatively assigned to the western Sierras metamorphic terrane. The occurrence of this unit beneath Loma Prieta Peak supports the interpretation that Sierran basement slopes west ward beneath the Coast Ranges to the San Andreas fault Hypothetical Sierran basement may un derlie the basal thrust (depth 15-17 km) of an east-directed tectonic wedge (interpreted from
692

Loma Prieta
siesmic reflection and refraction data, thought to be composed of Franciscan Complex rocks, rocks of the Great Valley sequence, and the Coast Range ophiolite (Fuis and Mooney, 1990, Wentworth and Zoback, 1990). The slate and phyllite of the Loma Prieta area may have been lifted from the underlying basement along a roof thrust of this wedge, as implied from the seismic reflection and refraction data (Wentworth and Zoback, 1990; Fuis and Mooney, 1990; Blake and others, 1991). This interpretation of the deep structure of the crust beneath Loma Prieta further implies that the basal thrust of the east-directed tectonic wedge partly coincides with the brittle-ductile transition, so that major faults, including the San Andreas, Sargent, Hayward, and Calaveras, must root into, or terminate downward into this low-angle transition boundary. If the interpretation is valid, then dextral slip and compression across major strike-slip and thrust faults that cut the tectonic wedge may be accommodated by low-angle oblique north-northeastward translation along the basal thrust of the tectonic wedge or along the brittle-ductile boundary transition.
References cited
Blake, M.C., Jr., Jones, D.L., McLaughlin, R.J., and Wentworth, C.M., 1991, Tectonic signifi cance of fragments of Sierran basement in the northern Coast Ranges, CA: Geological Society of America Abstracts with Programs, v. 23, no. 2, p. 7.
Fuis, G.S., and Mooney, W.D., 1990, Lithospheric structure and tectonics from siesmic- refraction and other data, in R. E. Wallace, ed., The San Andreas fault system, U.S. Geological Survey Professional Paper 7575, p. 207-236.
Wentworth, C.M., and Zoback, M.D., 1990, Structure of the Coalinga area and thrust origin of the earthquake, in Rymer, M. J., and W. L. Ellsworth, eds., The Coalinga, California, earthquake of May 2,1983: U.S. Geological Survey Professional Paper 1487, p. 41-68.
Reports
McLaughlin, R.J., Sorg, D.H., Russell, P.C., and Lester, R., Uplift of the Coast Ranges along thrusts east of the San Andreas Fault, San Francisco Bay Region, California: Transform propagation structures?, 28 mscpt. p., 6 figures, 1 table; to be submitted to Tectonics, in Branch review.
McLaughlin, R.J., Elder, W.P., and McDougall, Kristin, 1991, Tectonic framework of the Loma Prieta area: in Sloan, Doris, and D.L. Wagner, eds., Geologic Excursions in northern California: San Francisco to the Sierran Nevada, California Division of Mines and Geology Special Publication 109, p. 45-54.
McLaughlin, R.J., Kistler, R.W., Sliter, W.V., Murchey, B.L., and Franck, C.R., 1991,Structure and character of Coast Range ophiolite and oceanic Franciscan terranes, Loma Prieta, Laurel, and Los Gatos quadrangles, CA: Geological Society of America Abstracts with Programs, v. 23, no. 2, p. 77.
Clark, J.C., McLaughlin, R.J., Kistler, R.W., Champion, D.E., and Franck, C.R., 1991, Basement structure southwest of the San Andreas fault, Loma Prieta, Laurel, and Los Gatos quadrangles, CA: Geological Society of America Abstracts with Programs, v. 23, no. 2, p. 13.
Blake, M.C., Jr., James, D.L., McLaughlin, R.J. and Wentworth, CM., 1991, Tectonic signifi cance of fragments of Sierran basement in the northern Coast Ranges, CA: Geological Society of America Abstracts with Programs, v. 23, no. 2, p. 7.
Underwood, M., Shelton, K., Laughland, M., Solomon, R., McLaughlin, R., Russell, P., and Sorg, D., 1991, Miocene thermal-maturity anomalies at Loma Prieta, Mt San Bruno, and Bolinas, central California Coast: Geological Society of America Abstracts with Programs, V. 23, no. 2, P. 105.
Sliter, W.V., Murchey, B.L., McLaughlin, R.J., and Kistler, R.W., 1991, Permanente Terrane: History of Early Cretaceous Seamount Formation in the eastern Pacific: Geological Society of America Abstracts with Programs, v. 23, no. 2,.p. 98.
693

Loma Prieta
GROUND MOTION PREDICTION AND INVERSION IN REALISTIC EARTH STRUCTURES
9910-03010
Paul Spudich Branch of Engineering Seismology and Geology
U.S. Geological Survey345 Middlefield Road, MS 977Menlo Park, California 94025
415/329-5654 or FTS 459-5654
Investigations
1. Development of a new method for inverting earthquake ground motion data to infer rupture behavior.
2. Investigation of the feasibility of recovering absolute Stress levels from seismic radiation.
Results
1. In collaboration with John Boatwright of the USGS, we are developing a new method for inverting earthquake ground motions. In order to achieve better resolution of the earthquake rupture process, investigators have introduced progressively more realistic constraints on the solution obtained from ground motion inversion. Solutions have been sought having propagating features (Mendez and others, 1990), for example. In our work we seek to introduce causality rigorously as a dynamic constraint. In particular, we wish to obtain earthquake rupture models parameterized in terms of stress distributions on the fault and fault constitutive laws, such that if these derived quantities are used in an initial-value simulation of dynamic rupture (using, for example, the method of Das, 1981), the initial-value simulation produces ground motions that agree with the observed motions from which the stress distribution and constitutive laws were derived. We accomplish this in the following manner. We use Das' s algorithm, with a modification to allow slip-weakening of the fault material, as a time-stepping data modeling program. The usual procedure in such a simulation is, at a particular time step and point on the fault, to calculate the load on that point due to the waves radiated from all other points at all previous times. This load and the known fault compliance specify a linear relation between stress change and slip that must be satisfied at the point. Usually, a particular point on this linear curve is selected by specifying a slip-weakening relation, and solving for the single point in the stress-slip domain that satisfies both the unloading curve and the slip-weakening law.
694

Loma Prieta
In our method, we do not impose a slip-weakening law; rather, we determine how far the point on the fault slips based on the requirement that the radiated motions fit the observed ground motion data. From this requirement we can derive (rather than assume) a slip-weakening curve for the fault material.
2. It is possible to learn the absolute stress level at a subset of points on a fault from observation of the fault kinematics. Specifically, the points on a rupturing fault can be divided into two groups, those points at which the rake rotates during the rupture process, and those points at which the rake does not rotate. If it is true that sliding frictional traction is colinear with the instantaneous velocity of one side of a fault, then at the former group of points (having rotating rake) there is a unique absolute stress consistent with the motion, while at the latter group of points (having rakes that do not rotate) the absolute stress is unspecified by the motion. It is hypothesized that it will be easiest to observe rotations of rake by examining seismic waves radiated from the rupture and healing of spatially isolated asperities on a fault.
References
Das, S., 1981, Three dimensional spontaneous rupture propagation and implications for the earthquake source mechanism: Geophys. J.R. Astron. Soc., v. 67, p. 375-393.
Mendez, A., Olson, A., and Anderson, J, 1990, A norm-minimization criterion for the inversion of earthquake ground motions: Geophys. J. fnternat., v. 109, p. 99-104.
Reports
Spudich, P., and Boatwright, J., 1990, Dynamically consistent inversion of ground motion data to infer fault constitutive laws, [abs.]: EOS, Transactions of the American Geophysical Union, v. 71, p. 1439.
Spudich, P., and Miller, D., 1990, Seismic site effects and the spatial interpolation of earthquake seismograms: results using aftershocks of the 1986 North Palm Springs, California, earthquake, Bulletin of the Seismological Society of America, v. 80, p. 1504- 1532.
04/91
695

Loma Prieta
Liquefaction in the Monterey Bay Region
9910-01629
John C. TinsleyBranch of Western Regional Geology
345 Middlefield Road MS-975Menlo Park, California 94025
415-329-4928
Thomas L» Holzer and Michael J. BennettBranch of Engineering Geology and Seismology
345 Middlefield Road MS-975Menlo Park, California 94025415-329-5613 or 415/329-4890
William R. DupreDepartment of GeologyUniversity of HoustonHouston, TX 77004
713-749-3710
Investigations
1. Liquefaction instrumental arrays, Marina District: The USGS would like to install two downhole piezometers and two SMA-1 accelerographs at Marina Middle School, San Francisco, California, adjacent to the USGS Deep Borehole (Kayen and others, 1990). Alternative sites include Marina Green.
2. Liquefaction instrumental arrays, southern California: Installation of two downhole piezometers and two SMA-1 accelerographs at a suitable site in southern California is being planned. The present leading contender for the array is located in the San Bernardino area, although final selections are yet to be made.
3. Regional Studies of Liquefaction-Related Ground Failure, Monterey Bay Area, California: Completed laboratory analysis of 200 samples obtained during field operations during summer and autumn of 1990. Additional fieldwork is being planned and access to sites is being arranged for the 1991, emphasizing stratigraphic and geotechnical analyses of 4 additional lateral-spread ground failures, and studies to determine threshold accelerations for several geologic map units of Dupre and Tinsley (1980) to determine how close these deposits may have been to liquefaction during the 1989 earthquake.
696

Loma Prieta
Results
1. Permits and conditions of access are currently under negotiation for the Marina District (near the Winfield Scott School site). No further results to report at this time.
2. Feasibility of installing a liquefaction array is being explored for several sites in the San Bernardino area. Arrangements for this installation are incomplete at this time.
3. Laboratory analyses of 200 geotechnical samples, including Standard Penetrometer Testing, grain-size distribution, Atterberg limits, moisture content, and detailed stratigraphic description of samples taken during 1989 and 1990 is complete; these data are being installed into a geotechnical database management system (GTGS) with further analyses pending. Radiocarbon samples are submitted for accelerator mass-spectrometer dating, but are not yet in-hand. The preliminary indication is that the location of lateral-spread ground failures and other sites of liquefaction manifest by sand-boil activity during the Loma Prieta earthquake were chiefly restricted to laterally accreted depositional fades along the lower reaches of the Salinas and Pajaro and San Lorenzo rivers in the Monterey Bay area, a coastal setting wherein response by rivers to stable or slowly rising Holocene sea levels has been the deposition of locally extensive areas of point-bar, levee, and channel deposits bounded by vertically accreted floodbasin and floodplain deposits. The latter were largely immune to lateral spread ground failure during the 1989 earthquake. Facies analysis of zones of failure continues in the coastal zone, where a complex interplay of longshore bars, eolian dune deposits, and historical changes in the location of rivers and bay mouths make a more complicated stratigraphic picture compared to the purely fluvial setting.
References cited
Kayen, R.E., Liu, H-P., Fumal, T.E., Westerlund, R.E., Warrick, R.E., Gibbs, J.F., and Lee, H.J., 1990, Engineering and seismic properties of the soil column at Winfield Scott School, San Francisco in Effects of the Loma Prieta earthquake on the Marina District, San Francisco, California: U.S. Geological Survey Open-File Report 90-253, p. G1-G18.
Dupre, W.R. and Tinsley, J.C., 1980, Geology and liquefaction potential, northern Monterey and southern Santa Cruz Counties, California: U.S. Geological Survey Miscellaneous Field Studies Map MF-1199, 1:62,500.
Reports
None at this time.04/91
697

NO REPORTS RECEIVED
Investigators Institutions
Berger, J. Bilham, R. Brune, J. Day, S. Evernden, J Frohlick, C. Grant, W. Hanks, T. Healy, J. Helliwell, R. Holmes, W. Jackson, D. Johnson, D. Klein, F. Lasmanis, R. Linde, A. Malone, S. May, P. McEvilly, T Okal, E. Prentice, C. Scawthorn, C. Shearer, P.
U.C. San DiegoColorado, University ofNevada, University of, RenoSan Diego State UniversityU.S. Geological SurveyTexas, University of, AustinShannon & WilsonU.S. Geological SurveyU.S. Geological SurveyStanford UniversityRutherford & ChekeneCalif., University of, Los AngelesLamont-Doherty Geological ObservatoryU.S. Geological SurveyState of WashingtonCarnegie of WashingtonWashington, University ofWashington, University ofCalifornia, University of, BerkeleyNorthwestern UniversityU.S. Geological SurveyEQE EngineeringCalifornia, University of, San Diego
698

INDEX 1
INDEX ALPHABETIZED BY PRINCIPAL INVESTIGATOR
Abers, G. A. Abers, G. A. Aki, K.Algermissen, S. T. Alien, C. R. Alien, G. Alien, R. V. Anderson, R. E. Andrews, D. J. Arabasz, W. J. Arabasz, W. J. Atwater, B. F. Aydin, A.
Beavan, J. Beavan, J. Beavan, J. Biegel, R. L. Bierman, P. Bird, P. Boatwright, J. Bock, Y. Bolton, P. A. Bonilla, M. G. Boore, D. M. Borcherdt, R. D. Borcherdt, R. D. Borcherdt, R. D. Boyd, T. M. Brady, A. G. Brady, A. G. Breckinridge, K. S Brown, R. D. Bucknam, R. C. Bullard, T. F. Bundock, H. Butler, H. M.
Campbell, R. H. Celebi, M. Chester, F. M. Choy, G. L. Clark, M. M. Clayton, R. W. Combellick, R. A. Crone, A. J. Crosson, R. S. Crosson, R. S.
Darienzo, M. Davis, T. L. Dewey, J. W.
Page
Lamont-Doherty Geological Observatory 1Lamont-Doherty Geological Observatory 70Southern California, University of 219U.S. Geological Survey 520California Institute of Technology 359U.S. Geological Survey 5U.S. Geological Survey 224U.S. Geological Survey 586U.S. Geological Survey 682Utah, University of 7Utah, University of 620U.S. Geological Survey 524Purdue University 362
Lamont-Doherty Geological Observatory 225Lamont-Doherty Geological Observatory 229Lamont-Doherty Geological Observatory 364Lamont-Doherty Geological Observatory 463Washington, University of 153California, University, Los Angeles 230U.S. Geological Survey 74California, University of, San Diego 232Battelle Seattle Research Center 621U.S. Geological Survey 155U.S. Geological Survey 683U.S. Geological Survey 366U.S. Geological Survey 670U.S. Geological Survey 684Colorado School of Mines 76U.S. Geological Survey 672U.S. Geological Survey 674U.S. Geological Survey 243U.S. Geological Survey 156U.S. Geological Survey 526Geomatrix Consultants 158U.S. Geological Survey 675U.S. Geological Survey 635
U.S. Geological Survey 528U.S. Geological Survey 636Lamont-Doherty Geological Observatory 466U.S. Geological Survey 639U.S. Geological Survey 160California Institute of Technology 9Alaska Geological Survey 162U.S. Geological Survey 529Washington, University of 13Washington, University of 86
Portland State University 164Davis and Namson Consultants 166U.S. Geological Survey 642
699

Dieterich. J. Dmowska, R. Doser, D. I. Durkin, M. E. Dusseau, R. A.
Ebel, J. E. Ellis, M. Ellis, M. Ellsworth, W. L. Engdahl, E. R. Espinosa, A. F. Evans, B.
Fletcher, J. B. Frankel, A.
Galehouse, J. S. Gibbs, J. F. Gilbert, L. Gladwin, M. T. Goter, S. K.
Habermann, R. E. Hall. N. T. Hall, W.Hamburger, M. W. Harp, E. L. Hartzell, S. H. Hauksson, E. Heaton, T. H. Hellweg, M. Helmberger, D. V. Hermann, R. B. Hermann, R. B. Hickman, S. H. Hoicomb, G. Humphreys, E. Humphreys, E. Hutt, C. R.
Irwin, W. P.
Jackson, M. D. Jensen, E. G. Johnson, H. O. Johnston, A. C. Johnston, M. J. S.
King, C.-Y. King, K. W. Kirby, S. H. Kisslinger, C. Kisslinger, C. Kulm, L. D.
Lahr, J. C. Lajoie, K. R. Lam-Lerner, A. Langbein, J.
U.S. Geological Survey 470Harvard University 474Texas, University of, El Paso 88 Michael E. Durkin and Associates 588Wayne State University 593
Boston College 90Nevada, University of, Reno 251Nevada, University of, Reno 255U.S. Geological Survey 371U.S. Geological Survey 645U.S. Geological Survey 534 Massachusetts Institute of Technology 478
U.S. Geological Survey 257U.S. Geological Survey 685
San Francisco State University 375U.S. Geological Survey 623 Lamont-Doherty Geological Observatory 261Queensland, University of 385U.S. Geological Survey 660
Colorado, University of 265Earth Sciences Associates 169U.S. Geological Survey 17Indiana University 97U.S. Geological Surveyity 599U.S. Geological Survey 625 California Institute of Technology 102U.S. Geological Survey 268U.S. Geological Survey 388 California Institute of Technology 106Saint Louis University 18Saint Louis University 538U.S. Geological Survey 482U.S. Geological Survey 649Oregon, University of 108Oregon, University of 276U.S. Geological Survey 662
U.S. Geological Survey 171
U.S. Geological Survey 112U.S. Geological Survey 280 California, University of, San Diego 390Memphis State University 20U.S. Geological Survey 394
U.S. Geological Survey 281U.S. Geological Survey 539U.S. Geological Survey 484Colorado, University of 24Colorado, University of 115Oregon State University 543
U.S. Geological Survey 28U.S. Geological Survey 172 Lamont-Doherty Geological Observatory 121U.S. Geological Survey 399
700

Larson, K. Leary, P. Lee, W. H. K. Lester, F. W. Lett is, W. R. Levine, J. Lienkaemper, J. J, Lisowski, M. Liu, H. -P. Lockner, D. Lowe, M.
Machette, M. N. Malin, P. E. Marks, C. Mason R. G. McCrory, P. A. McGarr, A. McLaughlin, R. J. Meyer, R. P. Minster, J. B. Michael, A. Mortensen, C. E. Mueller, C. S.
Nelson, A. R. Nicholson, G. Nishenko, S. P.
Obermeier, S. F. Olshansky, R. B. Oppenhe imer, D. H,
Park, R. B. Park, S. K. Person, W. J. Peppin, W. A. Peppin, W. A. Ponti, D. J.
Qamar, A. I.
Reasenberg, P. A. Reilinger, R. E. Roecker, S. W. Rockwell, T. Rockwell, T. Roeloffs, E. Rogers, J. D. Rudnicki, J. W. Rudnicki, J. W. Rudnicki, J. W. Rymer, M. J.
Sacks, I. S. Safak, E. Sass, J* H Sato, M. Scholz, C. H.
Colorado, University of 287 Southern California, University of 289U.S. Geological Survey 408U.S. Geological Survey 35William Lettis and Associates 176Colorado, University of 293U.S. Geological Survey 127U.S. Geological Survey 295U.S. Geological Survey 687U.S. Geological Survey 488Utah, Geological Survey 549
U.S. Geological Survey 550Duke University 410Seattle, City of, Washington 600Imperial College 417U.S. Geological Survey 178U.S. Geological Survey 689U.S. Geological Survey 691Wisconsin-Madison, University of 128 California, University of, San Diego 305U.S. Geological Survey 419U.S. Geological Survey 421U.S. Geological Survey 553
U.S. Geological Survey 554 California, University of, Santa Barbaral32U.S. Geological Survey 650
U.S. Geological Survey 602 Illinois, University of Urbana-Champaign604U.S. Geological Survey 307
U.S. Geological Survey 664 California, University of, Riverside 309U.S. Geological Survey 665Nevada, University of, Reno 38Nevada, University of, Reno 134U.S. Geological Survey 179
Washington, University of 557
U.S. Geological Survey 318 Massachusetts Institute of Technology 423Rensselaer Polytechnic Institute 139San Diego State University 182San Diego State University 426U.S. Geological Survey 321Rogers/Pacific, Inc. 631Northwestern University 330Northwestern University 333Northwestern University 492U.S. Geological Survey 608
Carnegie Institute of Washington 427U.S. Geological Survey 680U.S. Geological Survey 494U.S. Geological Survey 337 Lamont-Doherty Geological Observatory 499
701

Schwartz, D. P. Schwartz, D. P. Schweig, E. S. Schweig, E. S. Segall, P. Sharp, R. V. Shaw, H. R. Sieh, K. Sieh, K. Silverman, S. Simpson, R. W. Sims, J. D. Sipkin, S. A. Smith, R. B. Spudich, P. Stark, T. D. Stauder, W. V. Stauder, W. V. Stein, R. S. Stewart, S. W. Stokoe, K. H. Stover, C. W. Stuart, W. D. Suppe, J. Sykes, L. R. Sylvester, A. G. Sylvester, A. G.
Taggart, J. N. Talwani, P. Tarr, A. L. Taylor, C. E. Teng, T. Tinsley, J. C. Tinsley, J. C. Tullis, T. E. Tuttle, M.
Unruh, J. R.
VanArsdale, R. B, Van Schaack, J. Vaughn, J. D. Verosub, K. L.
Weaver, C. S. Weber, G. E. Weldon, R. Weldon, R. Wells, R. E. Wentworth, C. M. Wyatt, F. Wyatt, F. Wyatt, F. Wyss, M.
Yamaguch i, D. K. Yeats, R. S. Yeats, R. S. Yerkes, R. F. Youd, T. L.
U.S. Geological Survey 609U.S. Geological Survey 611Memphis State University 42Memphis State University 184U.S. Geological Survey 437U.S. Geological Survey 140U.S. Geological Survey 503California Institute of Technology 188California Institute of Technology 441U.S. Geological Survey 445U.S. Geological Survey 508U.S. Geological Survey 447U.S. Geological Survey 654Utah, University of 142U.S. Geological Survey 694Illinois, University of 558Saint Louis University 46Saint Louis University 147U.S. Geological Survey 450U.S. Geological Survey 52Texas, University of, Austin 563U.S. Geological Survey 658U.S. Geological Survey 510Princeton University 192Lamont-Doherty Geological Observatory 453 California, University of, Santa Barbara347 California, University of, Santa Barbara456
U.S. Geological Survey 669South Carolina, University of 512U.S. Geological Survey 567Dames & Moore, Inc. 613Southern California, University of 54U.S. Geological Survey 573U.S. Geological Survey 696Brown University 458Lamont-Doherty Geological Observatory 615
California, University of, Davis 149
Arkansas, University of 61U.S. Geological Survey 65Missouri Department of Natural Res. 196California, University of, Davis 200
U.S. Geological Survey 67Weber and Associates 576Oregon, University of 202Oregon, University of 580U.S. Geological Survey 206U.S. Geological Survey 207California, University of, San Diego 348California, University of, San Diego 352California, University of, San Diego 355Colorado, University of 358
Colorado, University of 583Oregon State University 209Oregon State University 211U.S. Geological Survey 619Brigham Young University 585
702

INDEX 2
INDEX ALPHABETIZED BY INSTITUTION
Alaska Geological Survey
Arkansas, University of
Battelle Seattle Research Center
Boston College
Brigham Young University
Brown University
California California California California California California
Institute Institute Institute Institute Institute Institute
of Technology of Technology of Technology of Technology of Technology of Technology
California, University of, DavisCalifornia, University of, Davis
California, University of, Los Angeles
California, California, California, California, California, California,
University of, University of, University of, University of, University of, University of,
San Diego San Diego San Diego San Diego San Diego San Diego
California, University of, Santa BarbaraCalifornia, University of, Santa BarbaraCalifornia, University of, Santa Barbara
California, University of, Riverside
Carnegie Institute of Washington
Colorado School of Mines
Colorado, University ofColorado, University ofColorado, University ofColorado, University ofColorado, University ofColorado, University ofColorado, University of
Dames & Moore
Davis and Namson Consultants703
Page
Combellick, R. A. 162
VanArsdale, R. B. 61
Bolton, P. A. 621
Ebel, J. E. 90
Youd, T. L. 585
Tullis, T. E. 458
Alien, C. R. 359Clayton, R. W. 9Hauksson, E. 102Helmberger, D. V. 106Sieh, K. 188Sieh, K. 441
Unruh, J. R. 149Verosub, K. L. 200
Bird, P. 230
Bock, Y. 232Johnson, H. O. 390Minster, J. B. 305Wyatt, F. 348Wyatt, F. 352Wyatt, F. 355
Nicholson, G. 132Sylvester, A. G. 347Sylvester, A. G. 456
Park, S. K. 309
Sacks, I. S. 427
Boyd, T. M. 76
Habermann, R. E. 265Kisslinger, C. 24Kisslinger, C. 115Larson, K. 287Levine, J. 293Wyss, M. 358Yamaguchi, D. K. 583
Taylor, C. E. 613
Davis, T. L. 166

Duke University
Michael E. Durkin and Associates
Earth Sciences Associates
Geomatrix Consultants
Harvard University
Illinois, University of
Illinois, University of, Urbana-Champaign
Indiana University
Imperial College
Lamont- Lamont- Lamont- Lamont- Lamont- Lamont- Lamont- Lamont- Lamont- Lamont- Lamont- Lamont-
Doherty Doherty Doherty Doherty Doherty Doherty Doherty Doherty Doherty Doherty Doherty Doherty
Geological Geological Geological Geological Geological Geological Geological Geological Geological Geological Geological Geological
Observatory Observatory Observatory Observatory Observatory Observatory Observatory Observatory Observatory Observatory Observatory Observatory
William Lettis & Associates
Massachusetts Institute of Technology Massachusetts Institute of Technology
Malin, P. E. 410
Durkin, M. E. 588
Hall, N. T. 169
Bullard, T. F. 158
Dmowska, R. 474
Stark, T. D. 558
Olshansky, R. B. 604
Hamburger, M. W. 97
Mason, R. G. 417
Abers, G. A. 1Abers, G. A. 70Beavan, J. 225Beavan, J. 229Beavan, J. 364Biegel, R. L. 463 Chester, F. M. 466Gilbert, L. 261 Lam-Lerner, A. 121Scholz, C. H. 499Sykes, L. R. 453Tuttle, M. 615
Lettis, W. R. 176
Evans, B. 478 Reilinger, R. E. 423
Memphis State University Memphis State University Memphis State University
Missouri Department of Natural Res.
Johnston, A. C Schweig, E. S. Schweig, E. S.
Vaughn, J. D.
2042
184
196
Nevada, University of, RenoNevada, University of, RenoNevada, University of, RenoNevada, University of, Reno
Northwestern University Northwestern University Northwestern University
Oregon State University Oregon State University Oregon State University
Ellis, M. Ellis, M. Peppin, W. A. Peppin, W. A.
Rudnicki, J. W Rudnicki, J. W, Rudnicki, J. W,
Kulm, L. D. Yeats, R. S. Yeats, R. S.
25125538
134
330333492
543209211
Oregon, University of 704 Humphreys, E. 108

Oregon, University ofOregon, University ofOregon, University of
Portland State University
Princeton University
Purdue University
Queensland, University of
Rensselaer Polytechnic Institute
Rogers/Pacific, Inc.
Saint Louis, University of Saint Louis, University of Saint Louis, University of Saint Louis , University of
San Diego State University San Diego State University
San Francisco State University
Seattle, City of, Washington
Southern California, University of Southern California, University of Southern California, University of
South Carolina, University of
Texas, University of, Austin
Texas, University of, El Paso
U.S. Geological SurveyU.S. Geological SurveyU.S. Geological SurveyU.S. Geological SurveyU.S. Geological SurveyU.S. Geological SurveyU.S. Geological SurveyU.S. Geological SurveyU.S. Geological SurveyU.S. Geological SurveyU.S. Geological SurveyU.S. Geological SurveyU.S. Geological SurveyU.S. Geological SurveyU.S. Geological SurveyU.S. Geological SurveyU.S. Geological SurveyU.S. Geological SurveyU.S. Geological SurveyU.S. Geological Survey 705
Humphreys, E. 276Weldon, R. 202Weldon, R. 580
Darienzo, M. 164
Suppe, J. 192
Aydin, A. 362
Gladwin, M. T. 385
Roecker, S. W. 139
Rogers, J. D. 631
Herrmann, R. B. 18Herrmann, R. B. 538Stauder, W. V. 46Stauder, W. V. 147
Rockwell, T. 182Rockwell, Y. 426
Galehouse, J. S. 375
Marks, C. 600
Aki, K. 219Leary, P. 289Teng, T. 54
Talwani, K. H. 512
Stokoe, K. H. 563
Doser, D. I. 88
Algermissen, S. T. 520Alien, G. 5Alien, R. V. 224Anderson, R. E. 586Andrews, D. J. 682Atwater, B. F. 524Boatwright, J. 74Bonilla, M. G. 155Boore, D. M. 683Borcherdt, R. D. 366Borcherdt, R. D. 670Borcherdt, R. D. 684Brady, A. G. 672Brady, A. G. 674 Breckenridge, K. S. 243Brown, R. D. 156Bucknam, R. C. 526Bundock, H. 675Butler, H. M. 635Campbell, R. H. 528
U.S. Geological Survey U.S. Geological Survey U.S. Geological Survey U.S. Geological Survey U.S. Geological Survey U.S. Geological Survey U.S. Geological Survey U.S. Geological Survey U.S. Geological Survey U.S. Geological Survey U.S. Geological Survey U.S. Geological Survey U.S. Geological Survey U.S. Geological Survey U.S. Geological Survey U.S. Geological Survey U.S. Geological Survey U.S. Geological Survey U.S. Geological Survey U.S. Geological Survey U.S. Geological Survey U.S. Geological Survey U.S. Geological Survey U.S. Geological Survey U.S. Geological Survey U.S. Geological Survey U.S. Geological Survey U.S. Geological Survey U.S. Geological Survey U.S. Geological Survey U.S. Geological Survey U.S. Geological Survey U.S. Geological Survey U.S. Geological Survey U.S. Geological Survey U.S. Geological Survey U.S. Geological Survey U.S. Geological Survey U.S. Geological Survey U.S. Geological Survey U.S. Geological Survey U.S. Geological Survey U.S. Geological Survey U.S. Geological Survey U.S. Geological Survey U.S. Geological Survey U.S. Geological Survey U.S. Geological Survey U.S. Geological Survey U.S. Geological Survey U.S. Geological Survey U.S. Geological Survey U.S. Geological Survey U.S. Geological Survey U.S. Geological Survey U.S. Geological Survey U.S. Geological Survey U.S. Geological Survey U.S. Geological Survey 706
Celebi, M. 636Choy, G. L. 639Clark, M. M. 160Crone, A. J. 529Dewey, J. W. 642Dieterich, J. H. 470Ellsworth, W. L. 371Engdahl, E. R. 645Espinosa, A. F. 534Etheredge, E. 677Fletcher, J. B. 257Frankel, A. 685Gibbs, J. F. 623Goter, S. K. 660Hall, W. 17Harp, E. L. 599Hartzell, S. H. 625Heaton, T. H. 268Hellweg, M. 388Hickman, S. H. 482Holcomb, G. 649Hutt, C. R. 662Irwin, W. P. 171Jackson, M. D. 112Jensen, E. G. 280Johnston, M.J.S. 394King, C. -Y. 281King, K. W. 539Kirby, S. H. 484Lahr, J. C. 28Lajoie, K. R. 172Langbein, J. 399Lee, W. H. K. 408Lester, F. W. 35 Lienkaemper, J. J. 127Lisowski, M. 295Liu, H. -P. 687Lockner, D. 488Machette, M. N. 550McCrory, P. A. 178McGarr, A. 689McLaughlin, R. J. 691Michael, A. 419Mortensen, C. E. 421Mueller, C. S. 553Nelson, A. R. 554Nishenko, S. P. 650Obermeier, S. F. 602 Oppenheimer, D. H. 307Park, R. B. 664Person, W. J. 665Ponti, D. J. 179Reasenberg, P. A. 318Roeloffs, E. 321Rymer, M. J. 608Safak, E. 680Sass, J. H. 494Sato, M. 337Schwartz, D. P. 609

U.S. Geological Survey U.S. Geological Survey U.S. Geological Survey U.S. Geological Survey U.S. Geological Survey U.S. Geological Survey U.S. Geological Survey U.S. Geological Survey U.S. Geological Survey U.S. Geological Survey U.S. Geological Survey U.S. Geological Survey U.S. Geological Survey U.S. Geological Survey U.S. Geological Survey U.S. Geological Survey U.S. Geological Survey U.S. Geological Survey U.S. Geological Survey U.S. Geological Survey U.S. Geological Survey U.S. Geological Survey
Utah Geological Survey
Schwartz, D. P. 611Segall, P. 437Sharp, R. V. 140Shaw, H. R. 503Silverman, S. 445Simpson, R. W. 508Sims, J. D. 447Sipkin, S. A. 654Spudick, P. 694Stein, R. S. 450Stewart, S. W. 52Stover, C. W. 658Stuart, W. D. 510Taggart, J. N. 669Tarr, A. L. 567Tinsley, J. C. 573Tinsley, J. C. 696Van Schaack, J. 65Weaver, C. S. 67Wells, R. E. 206Wentworth, C. M. 207Yerkes, R. F. 619
Lowe, M. 549
Utah, University ofUtah, University ofUtah, University of
Washington, University ofWashington, University ofWashington, University ofWashington, University of
Wayne State University
Weber and Associates
Wisconsin-Madison, University of
Arabasz, W. J. Arabasz, W. J. Smith, R. B.
Bierman, P. Crosson, R. S. Crosson, R. S. Qamar, A. I.
Dusseau, R. L.
Weber, G. E.
Meyer, R. P.
7620142
1531386
557
593
576
128
707 *U.S. GOVERNMENT PRINTING OFFICE: 1991 -588-193/59303