onset, development, and prevention of drinking and driving among adolescents
TRANSCRIPT

European Journal of Psychology of Education1987, vol. II, n? 4, 421-441© 1987, I.S.P.A.
Onset, Development, and Preventionof Drinking and DrivingAmong Adolescents
Knut-Inge KleppCheryl L. PerryDavid R. JacobsUniversity of Minnesota, US.A.
An etiological study was designed to investigate the onset and development oj drinking and driving among adolescents who recently received their driver's license. A theoreticalframework, derived from Problem .Behavior Theory, was applied in order to identify environmental, personality and behavioral factors associated with drinking and driving.Among students who reported that they had driven a motor vehicle inthe past three months (N=1416), 33 percent oj the males and 22 percent of the females (who averaged 16.7years) reported «drinking at leasttwo drinks on a single occasion prior to driving» at least once in theprevious three months. Personality factors (including perceived abilityto drive after drinking, tolerance of drinking and driving, and lack ofself-confidence in avoiding drinking and driving situations), perceivedenvironmental factors (perceived car availability and friends modellingofdrinking and driving) and behavioral factors (riding with a drinkingdriver and marijuana use) accounted jor a large proportion (49%) ofthe variance in reported drinking and driving. It is recommended thatschool-based, peer-led educational programs be designed which targetyoung adolescents prior to the age at which legal driver license is obtained. The programs should be broad-based and consider drinking anddriving within the larger context of drinking and driving related behaviors and traffic safety in general.
Introduction
Even though there has been an encouraging decline in the number of young people involved in fatal traffic crashes in the United States over the past few years, traffic crashes remainthe number one cause of death in the age group 15 to 24 (USDHHS, 1983; Zobeck, Williams, & Bertolucci, 1986). Alcohol use is one behavior consistently and strongly associatedwith such crashes (Douglass, 1982; Roizen, 1982; Simpson, 1985; Council on Scientific Affairs,1986), and it has been estimated that eliminating all drinking and driving - across all ages- could reduce fatal motor vehicle accidents by at least 25 percent (Thrner, Borkenstein,Jones, & Santara, 1985).
Few theory-based attempts to identify factors associated with drinking and driving and no cohesive theory on drinking and driving behavior - have yet been presented. To
This project was supported in part by BRSG S07 RR 055448awarded by the Biomedical Research Support GrantProgram, Division of Research Resources, National Institute of Health, and in part by a grant from the Office ofAlcohol and Other Drug Abuse Prevention, SChool of Public Health, University of Minnesota. The authors want togratefully acknowledge the assistance of Dr. Richard Jessor in helping to develop the questionnaire.
422 K.-I. KLEPP, C. L. PERRY & D. R. JACOBS
the extent that more comprehensive theoretical approaches to study drinking and drivinghave been suggested, they have not yet been fully operationalized and tested for their predictability (Donovan, Marlatt, & Salzberg, 1983; Snortum, 1984; Vingilis & Mann, 1986).Furthermore, none of the proposed models have focused specifically on the onset and development of drinking and driving among adolescents receiving their driver's license. This lackof etiological and theoretical guidance has led to an absence of a rational basis for preventive efforts regarding drinking and driving (Ross, 1985). With few exceptions (Duryea, 1983;Albert & Simpson, 1985), educational programs addressing drinking and driving and related behaviors (i.e. riding with a drinking driver or skills to avoid drinking and driving situations) lack a conceptual foundation, and none of them have reported any success in reducingself-reported drinking and driving among adolescents (Malfetti, 1985; Mann, Vingilis, Leigh,Anglein, & Blefgen, 1986; McKnight, 1986).
An etiological study, entitled «Onset and Development of Drinking and Driving AmongAdolescents», was designed to investigate what factors are associated with drinking and drivingamong adolescents who recently received their driver's license. The study employs a theoretical framework derived from Problem Behavior Theory (Jessor & Jessor, 1977), and assumes that automobile driving, alcohol consumption as well as drinking and driving are socialbehaviors, part of a larger syndrome of problem behaviors, that may be functional and purposeful behaviors for this population. Problem Behavior Theory was selected for this investigation because of its comprehensiveness and repeated predictability of adolescent behavior.In particular, environmental, personality, and behavioral factors extrapolated from ProblemBehavior Theory were identified and tested for their association with drinking and drivingamong adolescents.
The purpose of this paper is to review the available etiological data on adolescent drinking and driving and to present the study's theoretical framework and outcomes. Outcomesinclude the frequency of reported drinking and driving and related behaviors in the studypopulation as well as factors associated with drinking and driving. Based on these results,a discussion of the implications for educational strategies to prevent drinking and drivingamong adolescents will be presented.
Drinking and driving among adolescents
Random roadside surveys have shown that adolescent drivers have the lowest prevalence rate of drinking and driving, and when they do drink and drive, adolescents tend tohave lower blood alcohol concentration than older drivers (Simpson, 1985; Palmer & Tix,1986). However, self-reported data indicate that the majority of high-school students drinkalcohol regularly (Johnston, O'Malley, & Bachman, 1985; Pandina, 1985) and that a substantial proportion of adolescents do engage in drinking and driving. As expected, the practice is more common among males than females, increases as a function of age (in theage-group 15 to 24) and increases as alcohol consumption and mileage driven increase (Cameron, 1982; Simpson, 1985; Williams, Lund, & Preusser, 1986). Furthermore, among highschool students, less time spent on homework, poorer academic performance, working parttime, greater participation in social activities, less perceived parental influence regarding theirtravel, owning a car, speeding, and having crashes and violations all are factors found tobe associated with drinking and driving (Williams, Lund, & Preusser, 1986). Whereas theonset of drinking and driving primarily takes place after reaching legal driver license age(16 years old in most U.S. states), a smaller group of underaged, unlicensed drivers alsoreport engaging in drinking and driving (Atkin, Neuendorf, & McDermott, 1983; SearchInstitute, 1983). Finally, riding with a drunk driver, drinking when riding in someone else'scar as well as drinking in a parked car are all highly prevalent behaviors by the time students enter high school (Atkin, Neuendorf, & McDermott, 1983; Wechsler, Rohman, Kotch,& Idelson, 1984; Finley, 1985). Thus, in a society where cars are readily available, and where
DRINKING AND DRIVING AMONG ADOLESCENTS 423
legal access to alcohol for adolescents is restricted (most U.S. states enforce a 21 year oldminimum legal drinking age), cars become one of the places where alcohol is frequentlyconsumed by adolescents. As a result, young adolescents are exposed to drinking and driving even before they start driving themselves, and expectations regarding their own drinking and driving are likely to develop prior to driving. Consistent with the predictions ofthe Fishbein and Ajzen Model (1975), Beck (1981) found that behavioral intention to drinkand drive was the best predictor of subsequent drinking and driving.
Despite the cost in terms of morbidity and mortality of drinking and driving amongadolescents, our understanding of how this behavior is initiated and developed in adolescence is limited. With few exceptions (Beck, 1981), studies to identify factors associated with,or predictive of drinking and driving, lack a theoretical guidance and they have not takenadolescent developmental stages into account.
Psychosocial research on adolescent drug use has over the past decades shifted fromhigh-risk youth to the study of drug use and its correlates in normal populations. A largenumber of factors have been identified as antecedents of the onset and development of druguse, factors which have been synthesized into etiological models which again have providedimportant guidance for prevention research (Jessor & Jessor, 1977; Huba & Bentler, 1980;Braucht, 1982; Flay, d'Avernas, Best, Kersell, & Ryan, 1983; Bachman & O'Malley, 1984;Baumrind, 1985; Hawkins, Lishner, & Catalano, 1985; Kandel & Yamaguchi, 1985; Perry& Murray, 1985). An extension of this approach to drinking and driving is novel, but shouldbe appropriate and efficacious.
Problem behavior theory
Problem Behavior Theory (Jessor & Jessor, 1977; Perry & Jessor, 1985) is one of thepsychosocial theoretical frameworks which has proven useful in identifying factors predictive of a large variety of health-compromising behaviors, and which suggest interventiontargets in school and community-based intervention research. Problem Behavior Theory placeshealth-compromising behaviors within the context of other so-called problem behaviors suchas alcohol and drug use, sexual activity, aggression and delinquency (Jesser, Graves, Hanson, & Jessor, 1968; Jessor & Jessor, 1977; Jessor, 1984). Problem behaviors are definedas «behaviors that constitute transgressions of societal and/or legal norms and that tendto elicit some sort of social control response» (Jesser, 1984). The theory rests on the socialpsychological relationships that exists within and between three major systems of predictorvariables: the personality system, the perceived environment system, and the behavior system.The variables within each of the systems comprise a «dynamic state» called proneness toproblem behavior, defined as the likelihood of problem behavior to occur. Thus personalityproneness, environmental proneness and behavioral proneness combine to psychosocial proneness toward problem behavior and is the critical basis for predicting and explaining variationin youthful behavior (Jessor, 1984). The definition of problem behavior is not static. Societal and legal norms differ from one culture to another, they differ over time and with respect to individual human development. Adolescents represents the transition period fromchildhood to adulthood. Many of the important transition markers, such as alcohol consumption, sexual intercourse, and driving a motor vehicle, become «problem behaviors» whenthey depart from the regulatory age norms that define appropriate or expected behaviorfor that age or stage in life.
Problem Behavior Theory has been able to account for between a third and a half ofthe variance in adolescent problem behavior, and has demonstrated that the identified relationships hold up when applied to different populations, over time and for other healthcompromising behaviors such as non-seat-belt use (Jessor & Jessor, 1977; Donovan, Jesser& Jessor, 1983; Donovan & Jessor, 1985; Maron, 'Ielch, Killen, Vranizan, Saylor, & Robinson, 1986; Hays, Stacy, & Dimatteo, 1987). The theory is seen as applicable to both genders, and even though there are important sex differences in the degree of involvement with
424 K.-I. KLEPP, C. L. PERRY & D. R. JACOBS
problem behavior, the similarities between genders is evident in similar predictive models.Furthermore, the implications of Problem Behavior Theory for prevention efforts are welldemonstrated (Jessor, 1982, 1985; Perry & Jessor, 1985).
Alcohol use among adolescents is legally sanctioned by society, and adolescents demonstrate markedly higher risk for traffic crash involvement even at lower blood alcohol concentration levels (Simpson, 1985). Thus, any alcohol consumption prior to driving a motor vehiclecan be considered a «problem behavior» (not only legally defined intoxication) for adolescents. Applying Problem Behavior Theory to the problem of drinking and driving amongadolescents has the potential of identifying factors associated with onset and developmentof drinking and driving, and to provide important guidance regarding strategies to reducethe prevalence of this behavior.
Methods
Subjects and procedures
Subjects for the study were students in three participating high schools in the Minneapolis-St. Paul metropolitan area. A total of 1700 tenth and eleventh grade students were administered questionnaires by trained research staff in Spring, 1986. The respondents were 51.5percent male (n=875) and 48.5 percent female (n=825) and the mean age was 16.6 years.The questionnaires were administered during a regular class period. Consent to participatein the study was obtained from both parents and students. Although participation was voluntary, less than 0.5 percent of the students refused to cooperate. The study protocol was approved by the University of Minnesota Committee on the Use of Human Subjects in Research.
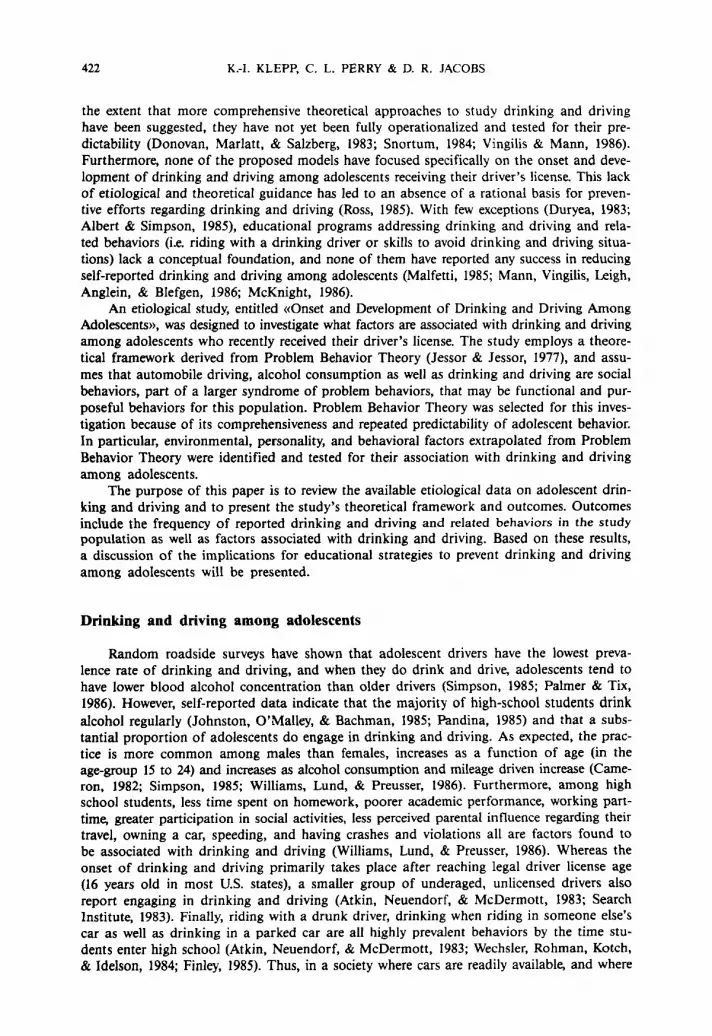
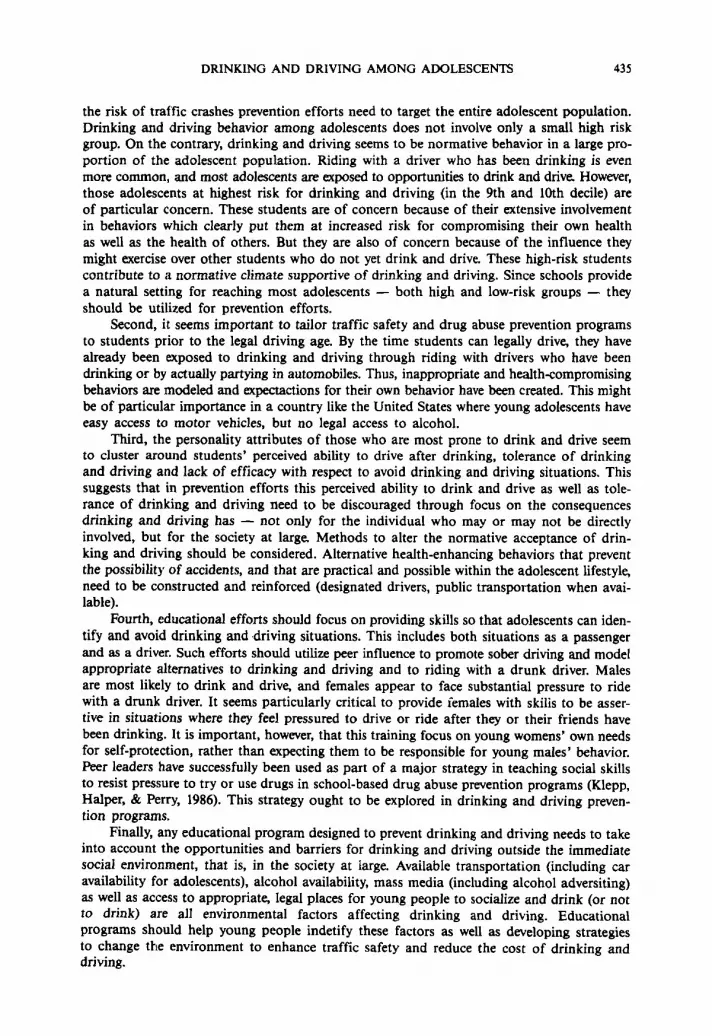
Figure I depicts a theoretical model of factors believed to influence drinking and driving. The model is derived from Problem Behavior Theory. Variables included in the distalstructure of the Personality and Perceived Environment systems as well as the variables included in the Conventional and Problem Behavior structures have been adopted from the HealthQuestionnaire for Senior High School (Jessor & Donovan, 1985). Environmental, personality and behavioral factors more proximal to drinking and driving behavior were developedthrough the use of focus-groups (group discussions with 9-12th graders), expert peer review,and classroom pilot-testing.
The independent variables assessed in this study are listed in Appendix I. Each independent variable is an index, the sum of one or more equally weighted items from the questionnaire. Indices for each of the structures in the model were tested for their predictabilityof drinking and driving behavior. The distal personality structure includes items on the valueon academic achievement, value on independence (both five item scales), value on religion(three items), self-concept and tolerance of deviance (nine items). The personality factorsdirectly related to drinking and driving behavior, the proximal structure, includes items onthe value of driving and owning a car (two items), confidence to avoid drinking and driving, the perceived ability to drive after drinking, tolerance of riding with a drinking driver(all one item only), and the perceived risk of experiencing negative consequences from drinking and driving.
The distal structure of the perceived environment system included parents and friendscompatibility on life values (three items) and influence in decision making (three item scale).The proximal structure included parents' and friends' approval of adolescent drinking anddriving, friends' modeling of drinking and driving, and perceived pressure from friendsto drink and drive (each construct represented by a single item). Students were also askedabout ease of access to cars and alcohol, and if their parents or a friend's parents everprovided alcohol for one of their parties (yes, no). Finally, students were asked to rate howeffective punitive measures - such as tougher enforcement of drinking and driving laws,losing their driver's license or going to jail - were in deterring drinking and driving (threeitems).
DRINKING AND DRIVING AMONG ADOLESCENTS
Figure 1. Facteurs influencant la boisson au volant chez des adolescents
425
DI...' Sf1Vctur.Valueon 8C8demlcach~Value on IndependenceValueon religionToleranceof devianceSeII-eItHm
Proxlmel Slrueture
Valul on driving .nd 0W00g11_Toleranceof rid~ will II drNwr whohasbeen~P.-Md rtIk lor IleQIIIM ClllflMqUenCM wIMndItnIdng .nd drMng
S.konlldlluc» to awId drtnkilg and drivingP.-Md ablIIy to dMIIIllIr drtnkilgFunclloneJ IlIlIaI1Ing of drtnkilg .nd driving
DI...'Sf1Vctu,.P.ent - lrilIndlI'0llIllPIdlI1IyParent -lIIlIncla' Influllncll
Pro1t'me' SfrvCfure
ParentlCJPCOVlll of drtnki1g linddrMngFrilInda'lIpplOVlII of drtnldng and drMngFrIlInda' modeleof drtnkilg .nd drivingFrIlIncla' prlINUl'lI 1ocImk linddMPlIrClIlYlId _ avlillbllly
P~ aIcohollYdllbRyPlIrClIivlId lIffllClivllnella of berrilInI to d••drinkilg linddrfvfng
IadlImlc plIIformanclIChurchlIIlendancll
Problem "heriot eI1IIt:tIn
5moldngAlcohol _mpllonPrabIlIm drinldng......UlIlI
..-... "RiIklllklng"behlIvior
DrInking and drNlng ,.,..." ..limon
DrIvIng blIhavIorSkIll NIaIlId to dmkIng .nd drtvlngRldi1g will II c*Mrwhohallbeen drtnkilg~iI._
Parerh WOIIcParwnl'1I edUCllllonFamily IlrUClUnIAgIIGendllr
Figure 1. Factors influencing drinking and driving among adolescents
Included in the behavioral structure were measures of conventional behaviors such aschurch attendance and student's grade point average, and general problem behaviors suchas smoking and marijuana use in the past three months. «Risk taking» behavior was assessed by asking questions such as «Have you done something dangerous just for the thrillof it?», or «Have you taken some risks when driving in traffic because it makes drivingmore fun?» (eight items). Driving behavior was assessed, including how long they had hada driver's license (driving experience), days driven in the past month, seat-belt use, speeding, and traffic violation tickets. Alcohol consumption included measures of frequency andamount of c:onsumed alcohol. «Problem drinking» was assessed by asking how frequently
426 K.-l. KLEPP, C. L. PERRY & D. R. JACOBS
the students had experienced problems with friends, or school because of their drinking(four items). Behavioral skills related to avoiding drinking and driving situations includedappropriate coping skills when a driver was drunk, deciding not to drive after drinking,and asking someone else not do drive after drinking. Finally, the students were asked howoften, in the past three months, they had driven after drinking two or five drinks, whetheror not they had driven after smoking marijuana, ridden with a drinking driver, or had beenpartying in a car. Demographic variables included student's age, gender, socio-economic status,and family structure (two parent vs. single parent families).
The dependent variable, drinking and driving, used in this study is a combined scaleranging from I for no drinking and driving to 6 for those who often drink and drive (seeTable 2 for categories). This drinking and driving scale had a test-retest reliability of .82(test interval was 7 days and n = 89). All the variables reported in this paper have satisfactory retest reliability and scale properties (Cronbach alpha coefficients) averaging .76 forreliability and .76 for internal consistency.
Data analysis
The data presented in this paper have been analyzed using the Statistical Analysis System(SAS) package. Chi-square and student's t-tests are used to compare responses between drivers and non-drivers, and between males and females on demographic variables as well ason reported frequency of drinking and driving and related behaviors. Multiple linear regression analysis was conducted including all the students who reported to drive a motor vehicle at least once in the previous three months. Initially, variables within each theoreticalconstruct with particularly high inter-correlations (>.40) were identified, and the variablepool was reduced in order to avoid synonymous variables. Furthermore, variables which werehighly correlated with, and which conceptually overlapped the dependent measure of drinking and driving, were not used in the regression analysis (this included driving exposure,alcohol consumption and driving after smoking marijuana). All variables within each theoretical structure were entered into an R-square analysis. The «best model» within each structure was selected based on the multiple R-square and Cp (measure of total squared error).Those predictor variables whose addition did not improve the model for explained varianceof drinking and driving were eliminated. The remaining variables were entered into a linearregression model. Results are presented for the combined set including variables from allthe theoretical structures. Based on this combined model, a predicted value of drinking anddriving was computed for each student. The observed drinking and driving behavior compared within each decile of predicted drinking and driving is presented along with meanvalues of the independent predictor variables for high, low and medium levels of predicteddrinking and driving. Again, all the independent variables mentioned here are presented inAppendix 1 along with their range, sample size (n), mean, standard deviation, and Pearsoncorrelation coefficients with drinking and driving for students who reported to drive. Thedisposition of each variable, whether it was included in the model or at which stage it wasexcluded, is also given.
Results
Frequency of reported driving, drinking and drinking and driving
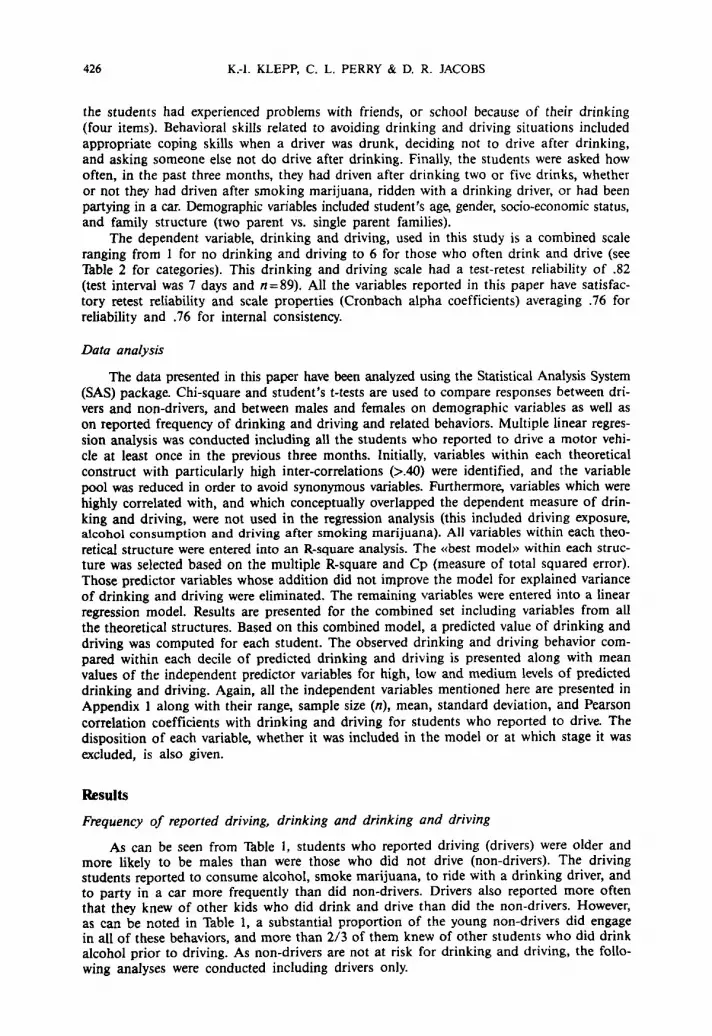
As can be seen from Table I, students who reported driving (drivers) were older andmore likely to be males than were those who did not drive (non-drivers). The drivingstudents reported to consume alcohol, smoke marijuana, to ride with a drinking driver, andto party in a car more frequently than did non-drivers. Drivers also reported more oftenthat they knew of other kids who did drink and drive than did the non-drivers. However,as can be noted in Table 1, a substantial proportion of the young non-drivers did engagein all of these behaviors, and more than 2/3 of them knew of other students who did drinkalcohol prior to driving. As non-drivers are not at risk for drinking and driving, the following analyses were conducted including drivers only.
DRINKING AND DRIVING AMONG ADOLESCENTS
Thble 1Age and sex distribution and frequency of reported drinking and drivingrelated behaviors among driving and non-driving students a
427
Sex": MaleFemale
Age (Mean ± SO)··
Alcohol-consumption (past 3 months)··Drank no alcoholDrank alcohol; usually I drink or less on anyone occasionDrank alcohol; usually 2 drinks or more on anyone
occasion
Rode with a drinking driver at least once in past 6 months"Partied in a car at least once in past 6 months··Friends modelling of drinking and driving:
Know at least 1-2 kids who drink and drive··
Marijuana use (past 3 months):Used marijuana at least once"Used marijuana at least once a week
Had a driver's license (including learner's permit)
Drivers Non-Driversn= 1416 n=284
54.0010 38.701046.0010 61.3010
16.7±.6 16.3±.6
26.6010 43.501013.2010 13.0010
60.2010 43.5010
38.2010 29.901041.8010 28.4010
80.9010 69.0010
30.0010 22.701010.1010 7.6"70
88.7% 15.0%
Note. • «Driving students » are defined as students who reported to have driven a motor vehicle during the pastthree months.Test of differences between drivers and non-drivers: • p<.os; •• p<:.001.
Tableau IAge, sexe et comportements associes iJ /a consommation d'alcoolau volant, d'adolescents conducteurs et non-conducteurs. I
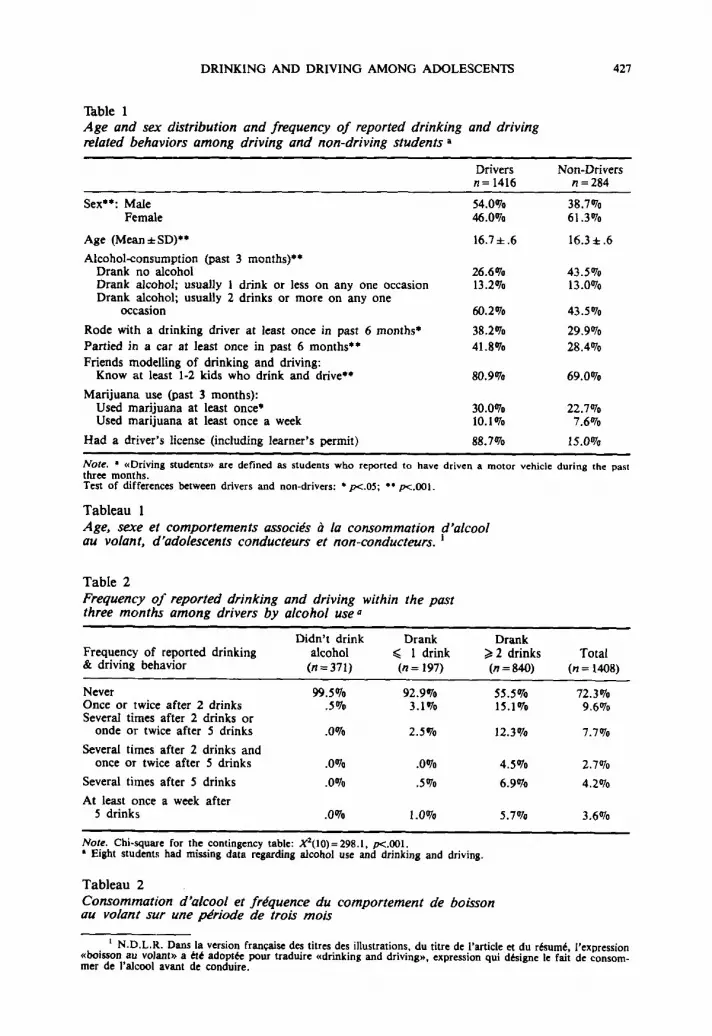
Table 2Frequency 0/ reported drinking and driving within the pastthree months among drivers by alcohol use Q
Didn't drink Drank DrankFrequency of reported drinking alcohol ~ I drink ~ 2 drinks Total& driving behavior (n=371) (n = 197) (n = 840) (n = 1408)
Never 99.5010 92.9'70 55.50/0 72.3"70Once or twice after 2 drinks .5"70 3.1 '70 15.1"70 9.6"70Several times after 2 drinks or
onde or twice after 5 drinks .0% 2.5'70 12.3% 7.7010
Several times after 2 drinks andonce or twice after 5 drinks .0010 .0010 4.5% 2.7010
Several times after 5 drinks .0010 .5010 6.9010 4.2010
At least once a week after5 drinks .00/0 1.0% 5.70/0 3.6010
Note. Chi-square for the contingency table: X'(I0) = 298.1, p<.001.• Eight students had missing data regarding alcohol use and drinking and driving.
Tableau 2Consommation d'alcool et frequence du comportement de boissonau volant sur une periode de trois mois
I N.D.L.R. Dans la version francaise des titres des illustrations, du titre de I'article et du resume, I'exnression«boisson au volant .. a ete adoptee pour traduire «drinking and driving», expression qui designe le fait de consommer de l'alcool avant de conduire.
428 K.-I. KLEPP, C. L. PERRY & D. R. JACOBS
As can be seen in Table 2, the prevalence of drinking and driving in this populationof driving 10th and 11th graders was 28 percent. Eighteen percent reported to drive afterdrinking at least two drinks several times in the past three months. Only two of the non-drinking drivers reported drinking and driving and seven percent of those who usually drinkone or less drinks per occasion reported any drinking and driving. Among drivers who dodrink two or more drinks at anyone occasion, 45 percent reported drinking and driving atleast once in the previous three months, and 13 percent did so at least several times after5 drinks. More than half of the students who drive and who drink more heavily did notdrink and drive, indicating that the combined behavior of drinking and driving does notoccur in all students who do drink and also drive. The following analyses were conductedto investigate what factors do differentiate the drinking and driving student versus the non-drinking and driving student.
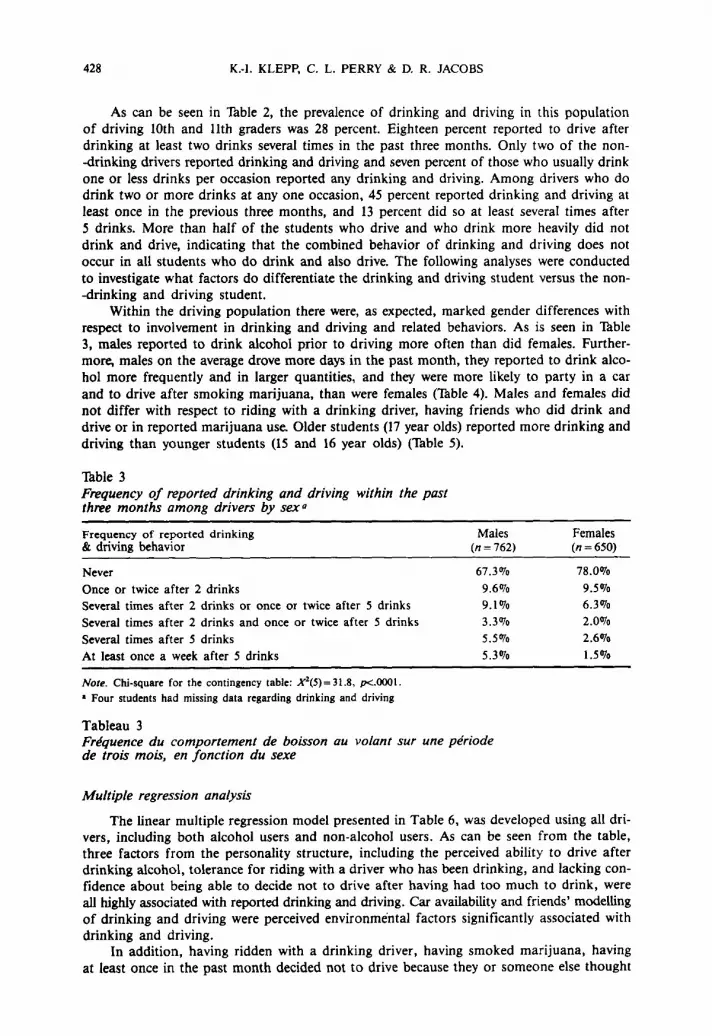
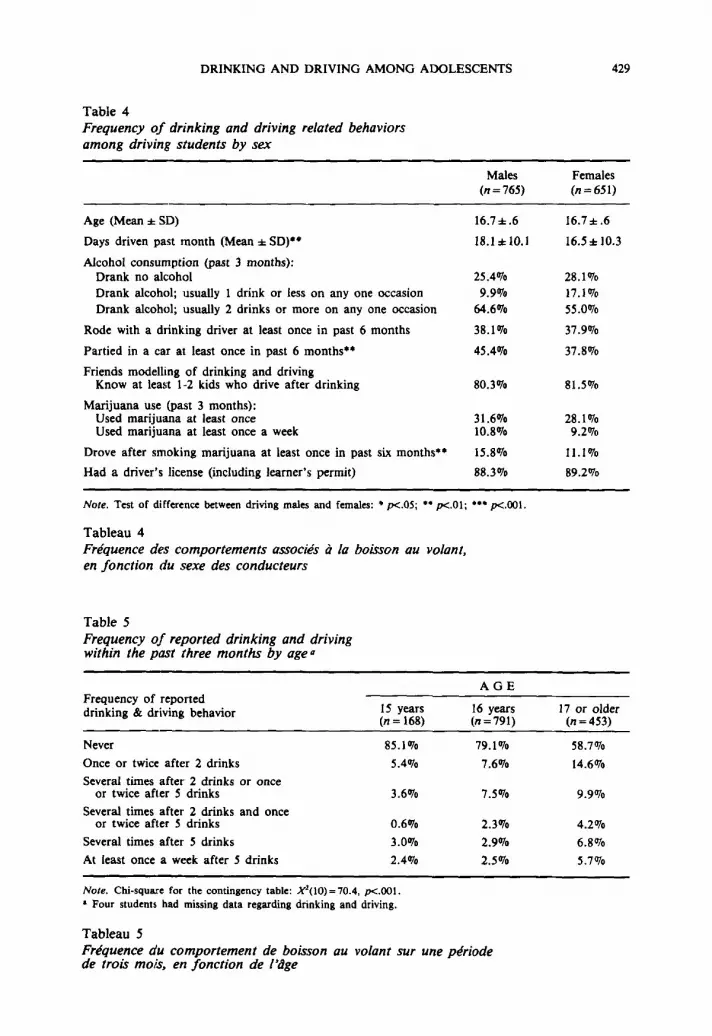
Within the driving population there were, as expected, marked gender differences withrespect to involvement in drinking and driving and related behaviors. As is seen in Table3, males reported to drink alcohol prior to driving more often than did females. Furthermore, males on the average drove more days in the past month, they reported to drink alcohol more frequently and in larger quantities, and they were more likely to party in a carand to drive after smoking marijuana, than were females (Thble 4). Males and females didnot differ with respect to riding with a drinking driver, having friends who did drink anddrive or in reported marijuana use. Older students (17 year olds) reported more drinking anddriving than younger students (15 and 16 year olds) (Table 5).
Table 3Frequency of reported drinking and driving within the pastthree months among drivers by sex»
Frequency of reported drinking& driving behavior
NeverOnce or twice after 2 drinksSeveral times after 2 drinks or once or twice after 5 drinksSeveral times after 2 drinks and once or twice after 5 drinksSeveral times after 5 drinksAt least once a week after 5 drinks
Note. Chi-square for the contingency table: X'(5) = 31.8, p<.OOOI.
• Four students had missing data regarding drinking and driving
Males(n = 762)
67.3010
9.60109.10103.3010
5.5010
5.3010
Females(n =650)
78.0010
9.50106.30102.0010
2.6010
1.5010
Tableau 3Frequence du comportement de boisson au volant sur une periodede trois mois, en fonction du sexe
Multiple regression analysis
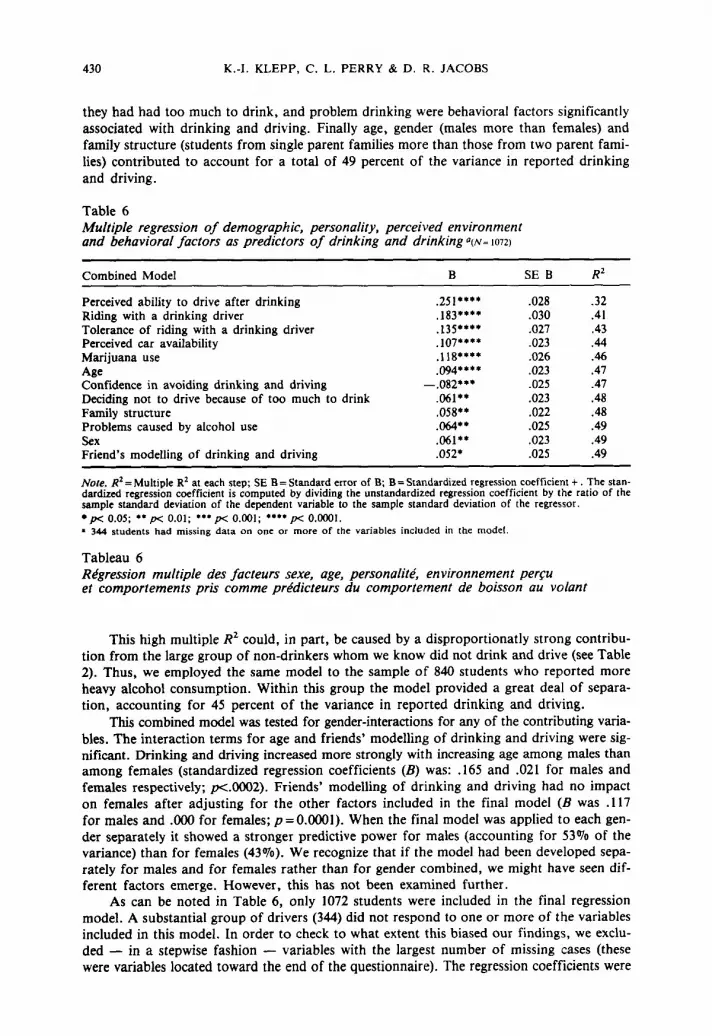
The linear multiple regression model presented in Table 6, was developed using all drivers, including both alcohol users and non-alcohol users. As can be seen from the table,three factors from the personality structure, including the perceived ability to drive afterdrinking alcohol, tolerance for riding with a driver who has been drinking, and lacking confidence about being able to decide not to drive after having had too much to drink, wereall highly associated with reported drinking and driving. Car availability and friends' modellingof drinking and driving were perceived environmental factors significantly associated withdrinking and driving.
In addition, having ridden with a drinking driver, having smoked marijuana, havingat least once in the past month decided not to drive because they or someone else thought
DRINKING AND DRIVING AMONG ADOLESCENTS
Table 4Frequency oj drinking and driving related behaviorsamong driving students by sex
Males(n=765)
429
Females(n=651)
Age (Mean * SD)
Days driven past month (Mean * SO)...
Alcohol consumption (past 3 months);Drank no alcoholDrank alcohol; usually 1 drink or less on anyone occasionDrank alcohol; usually 2 drinks or more on anyone occasion
Rode with a drinking driver at least once in past 6 months
Partied in a car at least once in past 6 months"
Friends modelling of drinking and drivingKnow at least 1-2 kids who drive after drinking
Marijuana use (past 3 months):Used marijuana at least onceUsed marijuana at least once a week
Drove after smoking marijuana at least once in past six months-e
Had a driver's license (including learner's permit)
16.7*.6
18.1*10.1
25.40709.9070
64.6070
38.1070
45.4070
80.3070
31.607010.8070
15.8070
88.3070
16.7*.6
16.5± 10.3
28.107017.107055.0070
37.9070
37.8070
81.5070
28.10709.2070
11.1 0J0
89.2070
Note. Test of difference between driving males and females: • p<.OS; •• p<.01; ••• p<.OOI.
Tableau 4Frequence des comportements associes ala boisson au volant,en fonction du sexe des conducteurs
Table 5Frequency oj reported drinking and drivingwithin the past three months by age11
Frequency of reporteddrinking & driving behavior
Never
Once or twice after 2 drinks
Several times after 2 drinks or onceor twice after 5 drinks
Several times after 2 drinks and onceor twice after 5 drinks
Several times after 5 drinks
At least once a week after 5 drinks
IS years(n = 168)
85.1070
5.4070
3.6070
0.6070
3.0070
2.4070
AGE
16 years(n=791)
79.1070
7.6070
7.5070
2.3070
2.9070
2.5070
17 or older(n=453)
58.7070
14.6070
9.9070
4.2070
6.8070
5.7070
Note. Chi-square for the contingency table: X'(10) = 70.4, p<.OOI.• Four students had missing data regarding drinking and driving.
Tableau 5Frequence du comportement de boisson au volant sur une periodede trois mots, en fonction de I'dge
430 K.-I. KLEPP, C. L. PERRY & D. R. JACOBS
they had had too much to drink, and problem drinking were behavioral factors significantlyassociated with drinking and driving. Finally age, gender (males more than females) andfamily structure (students from single parent families more than those from two parent families) contributed to account for a total of 49 percent of the variance in reported drinkingand driving.
Table 6Multiple regression of demographic, personality, perceived environmentand behavioral factors as predictors of drinking and drinking a(N~ 1072)
Combined Model
Perceived ability to drive after drinkingRiding with a drinking driverTolerance of riding with a drinking driverPerceived car availabilityMarijuana useAgeConfidence in avoiding drinking and drivingDeciding not to drive because of too much to drinkFamily structureProblems caused by alcohol useSexFriend's modelling of drinking and driving
B
.251····
.183····
.135....
.107····
.118....
.094····-.082···
.061··
.058"
.064··
.061··
.052·
SE B
.028
.030
.027
.023
.026
.023
.025
.023
.022
.025
.023
.025
.32
.41
.43
.44
.46
.47
.47
.48
.48
.49
.49
.49
Note. R2 = Multiple R2 at each step; SE B = Standard error of B; B = Standardized regression coefficient +. The standardized regression coefficient is computed by dividing the unstandardized regression coefficient by the ratio of thesample standard deviation of the dependent variable to the sample standard deviation of the regressor.• p< 0.05; •• p< 0.01; ••• p< 0.001; •••• p< 0.0001.• 344 students had missing data on one or more of the variables included in the model.
Tableau 6Regression multiple des facteurs sexe, age, personalite, environnement percuet comportements pris comme predicteurs du comportement de boisson au volant
This high multiple R2 could, in part, be caused by a disproportionatly strong contribution from the large group of non-drinkers whom we know did not drink and drive (see Table2). Thus, we employed the same model to the sample of 840 students who reported moreheavy alcohol consumption. Within this group the model provided a great deal of separation, accounting for 45 percent of the variance in reported drinking and driving.
This combined model was tested for gender-interactions for any of the contributing variables. The interaction terms for age and friends' modelling of drinking and driving were significant. Drinking and driving increased more strongly with increasing age among males thanamong females (standardized regression coefficients (B) was: .165 and .021 for males andfemales respectively; p<.0002). Friends' modelling of drinking and driving had no impacton females after adjusting for the other factors included in the final model (B was .117for males and .000 for females; p = 0.0001). When the final model was applied to each gender separately it showed a stronger predictive power for males (accounting for 53% of thevariance) than for females (43%). We recognize that if the model had been developed separately for males and for females rather than for gender combined, we might have seen different factors emerge. However, this has not been examined further.
As can be noted in Table 6, only 1072 students were included in the final regressionmodel. A substantial group of drivers (344) did not respond to one or more of the variablesincluded in this model. In order to check to what extent this biased our findings, we excluded - in a stepwise fashion - variables with the largest number of missing cases (thesewere variables located toward the end of the questionnaire). The regression coefficients were

DRINKING AND DRIVING AMONG ADOLESCENTS 431
then compared between the larger sample (n = 1301; 92070 of all drivers) and the group of1072 students with complete data. These analyses showed that we did not introduce anylarger bias by excluding students who could not work their way through the entire questionnaire. Thus, we decided to use the smaller sample so that we could include important variables at the end of the questionnnaire (including marijuana use), even though we then lostsome statistical power.
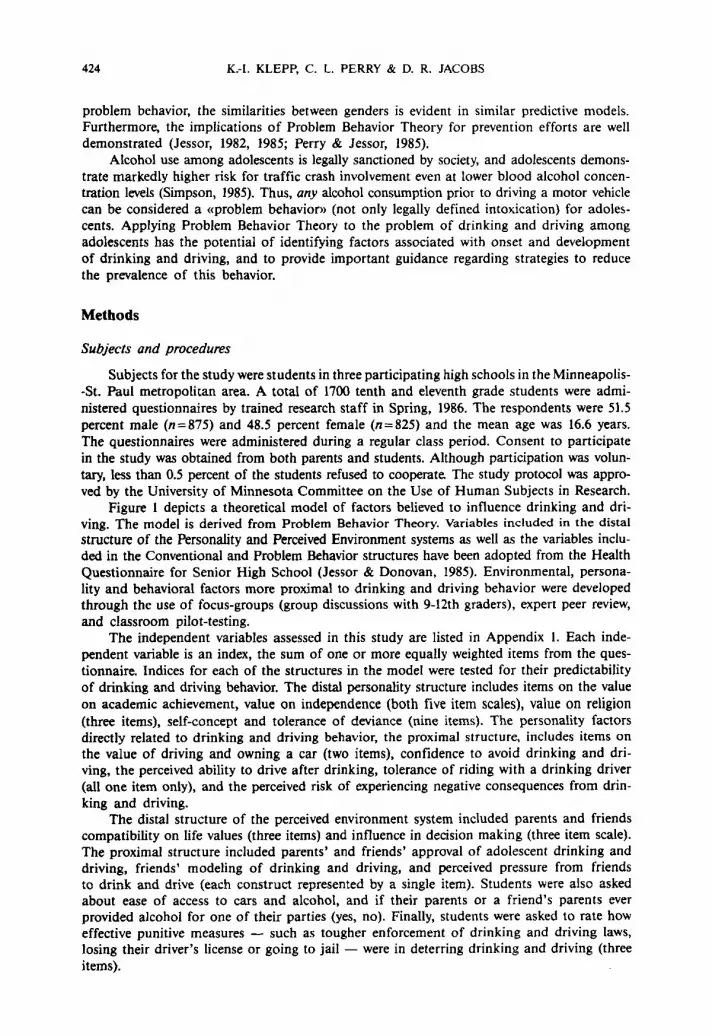
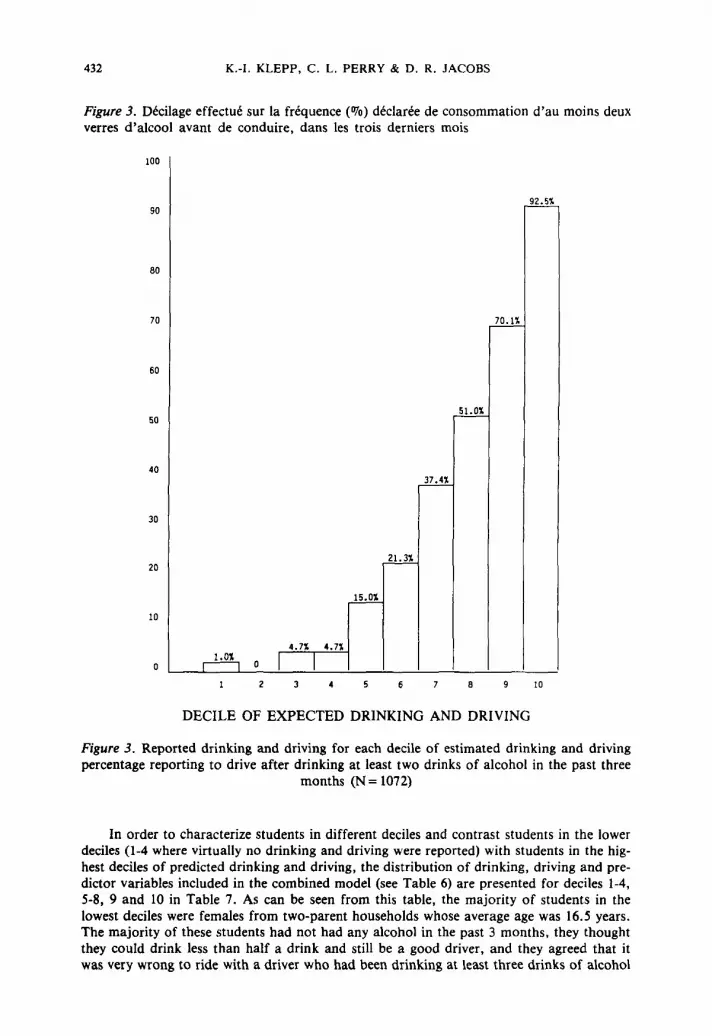
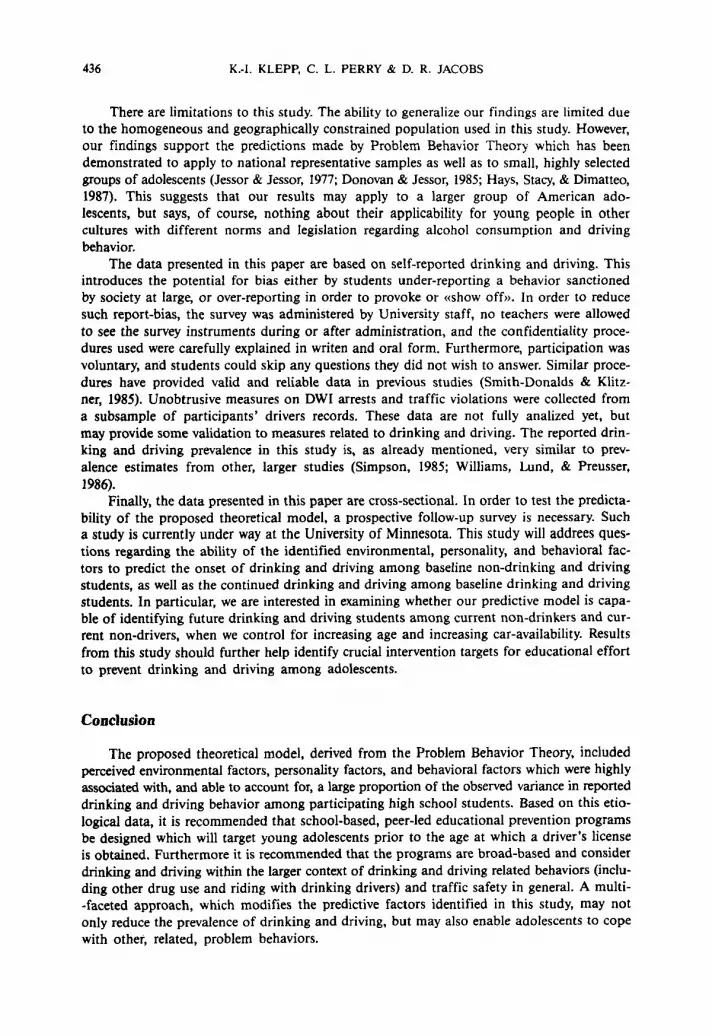
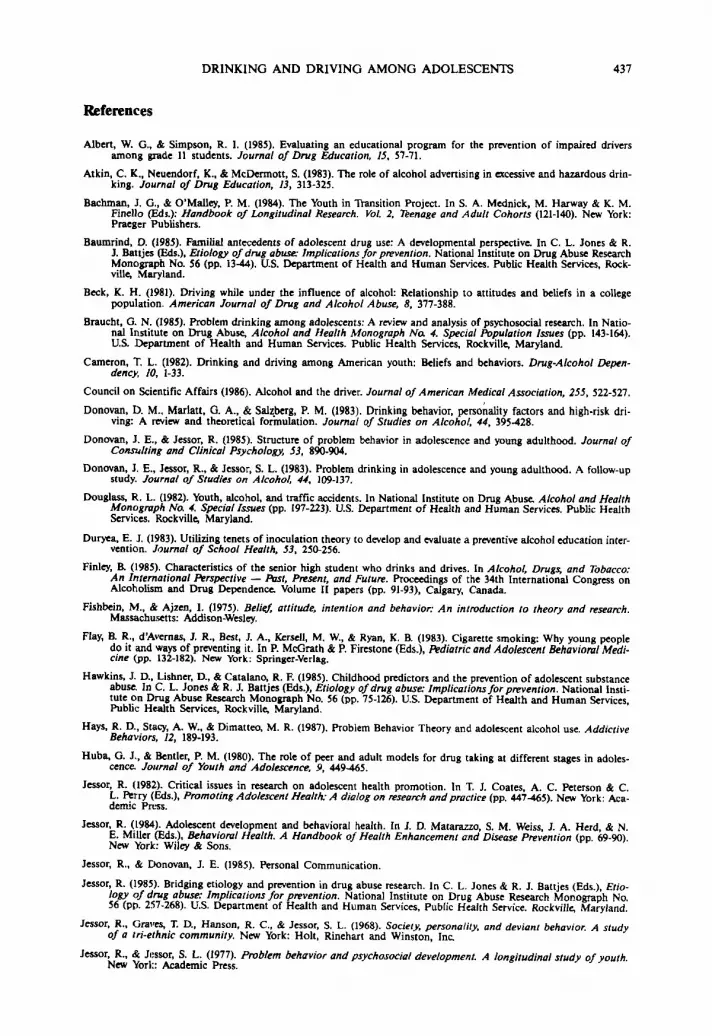
Using this combined model (Table 6) to predict drinking and driving among the drivingstudents, we find that there is a large difference in mean reported drinking and driving between students in the predicted lower decile and students in the predicted upper decile (Figure2). Furthermore, if drinking and driving is dichotomized into never-drinking and drivingstudents versus drinking and driving students (at least once in past 3 months after drinkingat least 2 drinks) we find 1% reported drinking and driving in the lowest decile and 93%in the highest decile (Figure 3). If the linear model applied here represented the best fit forthe reported behavior, we would have observed an equal increase in drinking and drivingfrom one decile to the other. However, even though a more precise model can be fittedto the data, the linear model is useful and provides a great deal of separation between thestudents. More than 2/3 of all students in decile 10 report heavy drinking and driving (frequently drive after S or more drinks), while students in deciles 5 through 9 show increasinglevels of predominately moderate drinking and driving. Students in deciles 1 through 4 hardlydrink and drive at all.
Figure 2. Decilage effectue sur la frequence declaree du comportement de boisson au volant.Moyennes par decile
6
4
MEAN VALUES
~
,b..L
~
,.--hL,.l:L.
1.1 1.1 ~1.0 1.0
1 2 3 4 6 7 8 9 10
DECILE OF EXPECTED DRINKING AND DRIVING
Figure 2. Reported drinking and driving for each decile of estimated drinking and driving(N= 1072)
432 K.-I. KLEPP, C. L. PERRY & D. R. JACOBS
Figure 3. Decilage effectue sur la frequence (070) declaree de consommation d'au moins deuxverres d'alcool avant de conduire, dans les trois derniers mois
100
90
80
70
60
50
40
30
20
10
~
~
~
~
~
~
4.71: 4.71:
~ 0 I I8
DECILE OF EXPECTED DRINKING AND DRIVING
10
Figure 3. Reported drinking and driving for each decile of estimated drinking and drivingpercentage reporting to drive after drinking at least two drinks of alcohol in the past three
months (N = 1072)
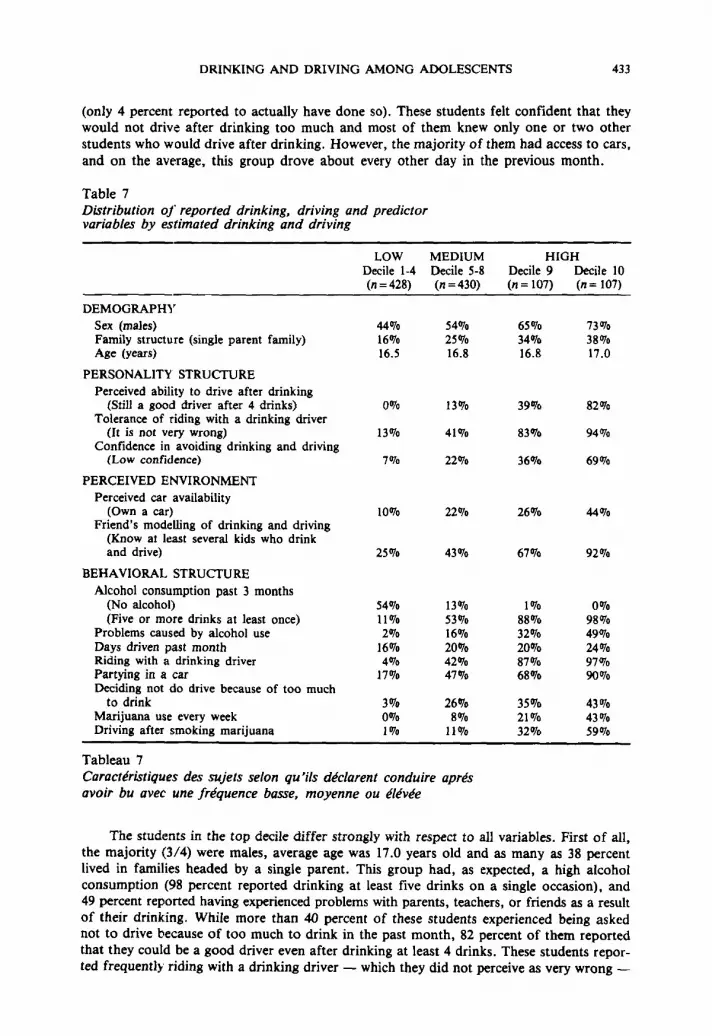
In order to characterize students in different deciles and contrast students in the lowerdeciles (1-4 where virtually no drinking and driving were reported) with students in the highest deciles of predicted drinking and driving, the distribution of drinking, driving and predictor variables included in the combined model (see Table 6) are presented for deciles 1-4,5-8, 9 and 10 in Table 7. As can be seen from this table, the majority of students in thelowest deciles were females from two-parent households whose average age was 16.5 years.The majority of these students had not had any alcohol in the past 3 months, they thoughtthey could drink less than half a drink and still be a good driver, and they agreed that itwas very wrong to ride with a driver who had been drinking at least three drinks of alcohol
DRINKING AND DRIVING AMONG ADOLESCENTS 433
(only 4 percent reported to actually have done so). These students felt confident that theywould not drive after drinking too much and most of them knew only one or two otherstudents who would drive after drinking. However, the majority of them had access to cars,and on the average, this group drove about every other day in the previous month.
Table 7Distribution of reported drinking, driving and predictorvariables by estimated drinking and driving
LOW MEDIUM HIGHDecile 1-4 Decile 5-8 Decile 9 Decile 10(n = 428) (n =430) (n = 107) (n = 107)
DEMOGRAPHYSex (males) 44070 54% 65% 73%Family structure (single parent family) 16% 25% 34% 38%Age (years) 16.5 16.8 16.8 17.0
PERSONALITY STRUCTUREPerceived ability to drive after drinking
(Still a good driver after 4 drinks) 0% 13% 39010 82070Tolerance of riding with a drinking driver
(It is not very wrong) 13% 41Clfo 83Clfo 94070Confidence in avoiding drinking and driving
(Low confidence) 7Clfo 22Clfo 36% 69070
PERCEIVED ENVIRONMENTPerceived car availability
(Own a car) 10% 22% 26% 44ClfoFriend's modelling of drinking and driving
(Know at least several kids who drinkand drive) 25Clfo 43070 67010 92070
BEHAVIORAL STRUCTUREAlcohol consumption past 3 months
(No alcohol) 54070 13Clfo 1% 0%(Five or more drinks at least once) 11% 53Clfo 88% 98Clfo
Problems caused by alcohol use 2% 16Clfo 32Clfo 49ClfoDays driven past month 16% 20010 20% 24010Riding with a drinking driver 4Clfo 42Clfo 87Clfo 97ClfoPartying in a car 17010 47010 68Clfo 9OClfoDeciding not do drive because of too much
to drink 3010 26010 35010 43070Marijuana use every week 0070 8010 21070 43070Driving after smoking marijuana 1% 11010 32% 59070
Tableau 7Carocteristiques des sujets selon qu'ils declarent conduire apresavoir bu avec une frequence basse, moyenne ou elevee
The students in the top decile differ strongly with respect to all variables. First of all,the majority (3/4) were males, average age was 17.0 years old and as many as 38 percentlived in families headed by a single parent. This group had, as expected, a high alcoholconsumption (98 percent reported drinking at least five drinks on a single occasion), and49 percent reported having experienced problems with parents, teachers, or friends as a resultof their drinking. While more than 40 percent of these students experienced being askednot to drive because of too much to drink in the past month, 82 percent of them reportedthat they could be a good driver even after drinking at least 4 drinks. These students reported frequently riding with a drinking driver - which they did not perceive as very wrong -
434 K.-I. KLEPP, C. L. PERRY & D. R. JACOBS
and they had low confidence in their own ability to decide not to drive after drinking toomuch. More than 40 percent of these students reported having used marijuana at least oncea week over the past three months, and 59 percent had been driving after smoking marijuana in the past six months. They (92010) reported knowing at least several students theirage who drove after drinking. Finally, they reported easy access to cars; forty-three percentowned their own car (compared to 10010 of the students in decile 1-4), and on the averagethey reported driving 24 out of 30 days in the previous month. As can be seen from Table7, students in deciles 5-8 and in decile 9 reported intermediate levels compared to these lowand high risk groups.
Discussion
This study was designed to investigate what factors are associated with drinking anddriving among adolescents who just recently started driving. The study participants, whowere students at participating high schools in an upper midwest metropolitan area of theUnited States, reported drinking and driving consistent with findings from other more representative U.S. samples (Simpson, 1985; Williams, Lund, & Preusser, 1986).
As predicted by the Problem Behavior Theory, perceived environmental factors, personality factors, and behavioral factors were able to account for a large proportion of the observed variance in reported drinking and driving behavior among both males (53010) and females(43010) in this high school student population. Consistent with earlier findings, alcohol consumption and driving exposure correlated highly with drinking and driving behavior.These behaviors are seen as overlapping with drinking and driving and were not includedin the regression analysis.
Behavioral variables that were predictive of reported drinking and driving included experiences with riding with a drinking driver, marijuana use and having experienced problemswith parents, friends or school because of drinking. The first shows direct experience inobservance of the behavior in question, whereas marijuana use and other problems causedby alcohol indicate more proneness to deviant behavior. Since actual probability of beingin a traffic accident is fairly low, the observation of drinking and driving without negativeoutcomes may serve to reinforce the normative acceptance of drinking and driving.
In the personality structure, the perceived ability to be a good driver after drinking,tolerance of riding with a drinking driver, and lack of confidence (efficacy) in avoiding drinking and driving situations emerged. These factors form a picture of an adolescent who isnot only tolerant of drinking and driving, but one who thinks he or she could drive afterdrinking without untoward effects and who rates his/her skills to avoid drinking and driving as low. The picture formed is of an adolescent who does not acknowledge the riskassociated with his/her drinking and driving and who is without ability to avoid potentialdangeL '
In the perceived environment structure, car availability and friends modelling emergeas the most significant factors. Thus, the environment includes other peers who also drinkand drive and access to automobiles to enact these behaviors. Additionally, if the adolescent is older, male, and from a one-parent-only family, the risk of drinking and drivingincreases. Cause and effect can not be determined from this cross-sectional data. Studentswho perceive that they can be good drivers even after drinking 4-5 drinks might do so basedon their own experience of driving after drinking. Alternatively, they might think they candrive after drinking because they frequently see other people doing so without any untoward effects. Thus, they are more likely to drink and drive themselves. However, whetheradolescents learn that they can be good drivers even after drinking, from their own experience or vicariously, they are wrong. Independent of causality, by pointing to theoreticalfactors associated with drinking and driving, these data have several implications for educational efforts to prevent drinking and driving among adolescents. First, in order to reduce
DRINKING AND DRIVING AMONG ADOLESCENTS 435
the risk of traffic crashes prevention efforts need to target the entire adolescent population.Drinking and driving behavior among adolescents does not involve only a small high riskgroup. On the contrary, drinking and driving seems to be normative behavior in a large proportion of the adolescent population. Riding with a driver who has been drinking is evenmore common, and most adolescents are exposed to opportunities to drink and drive. However,those adolescents at highest risk for drinking and driving (in the 9th and 10th decile) areof particular concern. These students are of concern because of their extensive involvementin behaviors which clearly put them at increased risk for compromising their own healthas well as the health of others. But they are also of concern because of the influence theymight exercise over other students who do not yet drink and drive. These high-risk studentscontribute to a normative climate supportive of drinking and driving. Since schools providea natural setting for reaching most adolescents - both high and low-risk groups - theyshould be utilized for prevention efforts.
Second, it seems important to tailor traffic safety and drug abuse prevention programsto students prior to the legal driving age. By the time students can legally drive, they havealready been exposed to drinking and driving through riding with drivers who have beendrinking or by actually partying in automobiles. Thus, inappropriate and health-compromisingbehaviors are modeled and expectactions for their own behavior have been created. This mightbe of particular importance in a country like the United States where young adolescents haveeasy access to motor vehicles, but no legal access to alcohol.
Third, the personality attributes of those who are most prone to drink and drive seemto cluster around students' perceived ability to drive after drinking, tolerance of drinkingand driving and lack of efficacy with respect to avoid drinking and driving situations. Thissuggests that in prevention efforts this perceived ability to drink and drive as well as tolerance of drinking and driving need to be discouraged through focus on the consequencesdrinking and driving has - not only for the individual who mayor may not be directlyinvolved, but for the society at large. Methods to alter the normative acceptance of drinking and driving should be considered. Alternative health-enhancing behaviors that preventthe possibility of accidents, and that are practical and possible within the adolescent lifestyle,need to be constructed and reinforced (designated drivers, public transportation when available).
Fourth, educational efforts should focus on providing skills so that adolescents can identify and avoid drinking and driving situations. This includes both situations as a passengerand as a driver. Such efforts should utilize peer influence to promote sober driving and modelappropriate alternatives to drinking and driving and to riding with a drunk driver. Malesare most likely to drink and drive, and females appear to face substantial pressure to ridewith a drunk driver. It seems particularly critical to provide females with skilis to be assertive in situations where they feel pressured to drive or ride after they or their friends havebeen drinking. It is important, however, that this training focus on young womens' own needsfor self-protection, rather than expecting them to be responsible for young males' behavior.Peer leaders have successfully been used as part of a major strategy in teaching social skillsto resist pressure to try or use drugs in school-based drug abuse prevention programs (Klepp,Halper, & Perry, 1986). This strategy ought to be explored in drinking and driving prevention programs.
Finally, any educational program designed to prevent drinking and driving needs to takeinto account the opportunities and barriers for drinking and driving outside the immediatesocial environment, that is, in the society at large. Available transportation (including caravailability for adolescents), alcohol availability, mass media (including alcohol adversiting)as well as access to appropriate, legal places for young people to socialize and drink (or notto drink) are all environmental factors affecting drinking and driving. Educationalprograms should help young people indetify these factors as well as developing strategiesto change the environment to enhance traffic safety and reduce the cost of drinking anddriving.
436 K.-l. KLEPP, C. L. PERRY & D. R. JACOBS
There are limitations to this study. The ability to generalize our findings are limited dueto the homogeneous and geographically constrained population used in this study. However,our findings support the predictions made by Problem Behavior Theory which has beendemonstrated to apply to national representative samples as well as to small, highly selectedgroups of adolescents (Jessor & lessor, 1977; Donovan & lessor, 1985; Hays, Stacy, & Dimatteo,1987). This suggests that our results may apply to a larger group of American adolescents, but says, of course, nothing about their applicability for young people in othercultures with different norms and legislation regarding alcohol consumption and drivingbehavior.
The data presented in this paper are based on self-reported drinking and driving. Thisintroduces the potential for bias either by students under-reporting a behavior sanctionedby society at large, or over-reporting in order to provoke or «show off». In order to reducesuch report-bias, the survey was administered by University staff, no teachers were allowedto see the survey instruments during or after administration, and the confidentiality procedures used were carefully explained in writen and oral form. Furthermore, participation wasvoluntary, and students could skip any questions they did not wish to answer. Similar procedures have provided valid and reliable data in previous studies (Smith-Donalds & Klitzner, 1985). Unobtrusive measures on DWI arrests and traffic violations were collected froma subsample of participants' drivers records. These data are not fully analized yet, butmay provide some validation to measures related to drinking and driving. The reported drinking and driving prevalence in this study is, as already mentioned, very similar to prevalence estimates from other, larger studies (Simpson, 1985; Williams, Lund, & Preusser,1986).
Finally, the data presented in this paper are cross-sectional. In order to test the predictability of the proposed theoretical model, a prospective follow-up survey is necessary. Sucha study is currently under way at the University of Minnesota. This study will addrees questions regarding the ability of the identified environmental, personality, and behavioral factors to predict the onset of drinking and driving among baseline non-drinking and drivingstudents, as well as the continued drinking and driving among baseline drinking and drivingstudents. In particular, we are interested in examining whether our predictive model is capable of identifying future drinking and driving students among current non-drinkers and current non-drivers, when we control for increasing age and increasing car-availability. Resultsfrom this study should further help identify crucial intervention targets for educational effortto prevent drinking and driving among adolescents.
Conclusion
The proposed theoretical model, derived from the Problem Behavior Theory, includedperceived environmental factors, personality factors, and behavioral factors which were highlyassociated with, and able to account for, a large proportion of the observed variance in reporteddrinking and driving behavior among participating high school students. Based on this etiological data, it is recommended that school-based, peer-led educational prevention programsbe designed which will target young adolescents prior to the age at which a driver's licenseis obtained. Furthermore it is recommended that the programs are broad-based and considerdrinking and driving within the larger context of drinking and driving related behaviors (including other drug use and riding with drinking drivers) and traffic safety in general. A multi-faceted approach, which modifies the predictive factors identified in this study, may notonly reduce the prevalence of drinking and driving, but may also enable adolescents to copewith other, related, problem behaviors.
References
DRINKING AND DRIVING AMONG ADOLESCENTS 437
Albert, W. G., & Simpson, R. I. (1985). Evaluating an educational program for the prevention of impaired driversamong grade II students. Journal of Drug Education, 15, 57-71.
Atkin, C. Ie., Neuendorf, K, & McDermott, S. (1983). The role of alcohol advertising in excessiveand hazardous drinking. Journal of Drug Education, 13, 313-325.
Bachman, J. G., & O'Malley, P. M. (1984). The Youth in Transition Project. In S. A. Mednick, M. Harway & K. M.Finella (Eds.): Handbook of Longitudinal Research. Vol. 2, Teenage and Adult Cohorts (121-140). New York:Praeger Publishers.
Baumrind, D. (1985). Familial antecedents of adolescent drug use: A developmental perspective. In C. L. Jones & R.J. Battjes (Eds.), Etiology of drug abuse: Implications for prevention. National Institute on Drug Abuse ResearchMonograph No. 56 (PI'. 13-44). U.S. Department of Health and Human Services. Public Health Services, Rockville, Maryland.
Beck, K. H. (1981). Driving while under the influence of alcohol: Relationship to attitudes and beliefs in a collegepopulation. American Journal of Drug and Alcohol Abuse, 8, 377-388.
Braucht, G. N. (1985). Problem drinking among adolescents: A review and analysis of psychosocial research. In National Institute on Drug Abuse, Alcohol and Health Monograph No. 4. Special Population Issues (PI'. 143-164).u.s. Department of Health and Human Services. Public Health Services, Rockville, Maryland.
Cameron, T. L. (1982). Drinking and driving among American youth: Beliefs and behaviors. Drug-Alcohol Dependency, 10, 1-33.
Council on Scientific Affairs (1986). Alcohol and the driver. Journal of American Medical Association, 255, 522-527.
Donovan, D. M.• Marlatt, G. A., & Salzberg, P. M. (1983). Drinking behavior, personality factors and high-risk driving: A review and theoretical formulation, Journal of Studies on Alcohol, 44, 395-428.
Donovan, J. E., & Jesser, R. (1985). Structure of problem behavior in adolescence and young adulthood. Journal ofC01lS2Jlting and Clinical Psychology, 53, 890-904.
Donovan, J. E., Jesser, R., & Jesser, S. L. (1983). Problem drinking in adolescence and young adulthood. A follow-upstudy. Journal of Studies on Alcohol, 44, 109-137.
Douglass, R. L. (1982). Youth, alcohol, and traffic accidents. In National Institute on Drug Abuse. Alcohol and HealthMonograph No. 4. Special Issues (PI'. 197-223). U.S. Department of Health and Human Services. Public HealthServices. Rockville, Maryland.
Duryea, E. J. (1983).Utilizing tenets of inoculation theory to develop and evaluate a preventive alcohol education intervention. Journal of School Health, 53, 2S(}.256.
Finley, B. (1985). Characteristics of the senior high student who drinks and drives. In Alcohol, Drugs, and Tobacco:An International Perspective - Past, Present, and Future. Proceedings of the 34th International Congress onAlcoholism and Drug Dependence. Volume II papers (PI'. 91-93), Calgary, Canada.
Fishbein, M., & Ajzen, I. (1975). Belief, attitude, intention and behavior: An introduction to theory and research.Massachusetts: Addison-Wesley.
Flay, B. R., d'Avernas, J. R., Best, J. A., Kersell, M. W., & Ryan, K. B. (1983). Cigarette smoking: Why young peopledo it and ways of preventing it. In P. McGrath & P. Firestone (Eds.], Pediatric and Adolescent Behavioral Medicine (PI'. 132-182). New York: Springer-Verlag.
Hawkins, J. D., Lishner, D., & Catalano, R. F. (1985). Childhood predictors and the prevention of adolescent substanceabuse. In C. L. Jones & R. J. Battles (Eds.), Etiology of drug abuse: Implications for prevention. National Institute on Drug Abuse Research Monograph No. 56 (PI'. 75-126). U.S. Department of Health and Human Services,Public Health Services, Rockville, Maryland.
Hays, R. D., Stacy, A. W., & Dimatteo, M. R. (1987). Problem Behavior Theory and adolescent alcohol use. AddictiveBehaviors, 12, 189-193.
Huba, G. J., & Bentler, P. M. (1980). The role of peer and adult models for drug taking at different stages in adolescence. Journal of Youth and Adolescence, 9, 449-465.
Jesser, R. (1982). Critical issues in research on adolescent health promotion. In T. J. Coates, A. C. Peterson & C.L. Perry (Eds.), Promoting Adolescent Health: A dialog on research and practice (1'1'.447-465). New York: Academic Press,
Jesser, R. (1984). Adolescent development and behavioral Ilealth. In 1. D. Matarazzo, S. M. Weiss, J. A. Herd, & N.E. Miller (Eds.), Behavioral Health. A Handbook of Health Enhancement and Disease Prevention (PI'. 69-90).New York: Wiley & Sons.
Jesser, R., & Donovan, J. E. (1985). Personal Communication.
Jesser, R. (1985). Bridging etiology and prevention in drug abuse research. In C. L. Jones & R. J. Battjes (Eds.), Etiology of drug abuse: Implications for prevention. National Institute on Drug Abuse Research Monograph No.56 (pp. 257-268). U.S. Department of Health and Human Services, Public Health Service. Rockville, Maryland.
lessor, R., Graves, T. D., Hanson, R. C, & Jessor, S. L. (1968). Society, personality, and deviant behavior. A studyof a tri-ethnic community. New York: Holt, Rinehart and Winston, Inc.
lessor, R., & Jesser, S. L. (1977). Problem behavior and psychosocial development. A longitudina! study of youth.New Yorl:: Academic Press.
438 K.-I. KLEPP, C. L. PERRY & D. R. JACOBS
Johnston, L. D., O'Malley, P. M., & Bachman, 1. G. (1985). Use of licit and illicit drugs by America's high schoolstudents /975-/984. National Institute on Drug Abuse, U.S. Department of Health and Human Services. Rockville, Maryland.
Kandel, D. 8., & Yamaguchi. K. (1985). Developmental patterns of the use of legal. illegal. and medically prescribedpsychotropic drugs from adolescence to young adulthood. In C. L. Jones & R. J. Battjes (Eds.), Etiologyof drug abuse: Implications for prevention. National Institute on Drug Abuse, Research Monograph No. S6(pp. 193-235). U.S. Department of Health and Human Services, Public Health Services. Rockville, Maryland.
Klepp, K. I., Halper, A., & Perry, C. L. (1986). The efficacy of peer leaders in drug abuse prevention. Journal of SchoolHealth, 56, 407-411.
Malfetti, J. L. (1985). Public information and education sections of the Report of the Presidential Commission onDrunk Driving: A critique and a discussion of research implications. Accidents Analysis & Prevention, /7, 347-353.
Mann, R. E., Vingilis, E. R., Leigh, G., Anglin, L., & Blefgen, H. (1986). School-based programs for the preventionof drinking and driving: Issues and results. Accidents Analysis & Prevention, 18, 325-337.
Maron, D. J., Teich, M. J., Killen, J. D., Vranizan, K. M., Saylor, K. E., & Robinson, T. N. (1986). Correlates of seat--belt use by adolescents: Implications for health promotion. Preventive Medicine, 15, 614-623.
McKnight, A. J. (1986). Intervention in teenage drunk driving. Alcohol, Drugs, and Driving, 2. 17-28.
Palmer, J. W., & Tix, P. E. (1986). Minnesota alcohol roadside survey. Results from 1986. SI. Cloud State University.
Pandina, R. 1. (1985). Methods, problems. and trends in studies of adolescent drinking practices. Annals of BehavioralMedicine, 8. 20-26.
Perry, C. L., & Jesser, R. (1985). The concept of health promotion and the prevention of adolescent drug abuse. HealthEducation Quarterly, 12. 169-184.
Perry, C. L., & Murray, D. M. (1985). The prevention of adolescent drug abuse: Implications from etiological, developmental, behavioral, and environmental models. Journal of Primary Prevention, 6. 31-52.
Roizen, J. (1982). Estimating alcohol involvement in serious events. In National Institute on Drug Abuse, Alcohol andHealth Monograph No. 1: Alcohol consumption and related problems (pp. 192-219). Department of Health andHuman Services. Rockville, Maryland.
Ross, H. L. (1985). Summary ot topic C - countermeasures. In T. 8. Turner, R. E Borkenstein, R. K. Jones, & P.B. Santara (Eds.), Alcohol and Highway Safety: Proceedings of the North American Conference on Alcohol andHighway Safety, Baltimore, MD. 1984. Journal of Studies on Alcohol. Supplement No. 10: 207-209.
Search Institute (1983). Report on 1983 Minnesota survey on drug use and drug-related attitudes. Search Institute, Minneapolis. Minnesota.
Simpson, H. M. (1985). Polydrug effects and traffic safety. Alcohol, Drugs and Driving, I, 17-44.
Smith-Donalds, L. G., & Klitzner, M. D. (1985). Self-reports of youthful drinking and driving: Sensitivity analyses ofsensitive data. Journal of Psychoactive Drugs, 17, 179-190.
Snortum, J. R. (1984). Controlling the alcohol-impaired driver in Scandinavia and the United Stales: Simple deterrenceand beyond. Journal of Criminal Justice, 12, 131-148.
Thrner, T. B., Borkenstein, R. E, Jones, R. K., & Santara, P. B. (1985). Human-related risk factors, with special reference to the driver and alcohol use. Editorial Comment. Alcohol and Highway Safety: Proceedings of the NorthAmerican Conference on Alcohol and Highway Safety, Baltimore, MD. 1984. Journal of Studies on Alcohol.Supplement No. 10, 19-20.
U.S. Department of Health and Human Services (1983). Fifth Special Report 10 the U.S. Congress on Alcohol andHealth. From the Secretary of Health and Human Services. Public Health Service, Alcohol, Drug Abuse, andMental Health Administration, National Institute of Alcohol Abuse and Alcoholism, Rockville, Maryland.
Vingilis, E. R., & Mann. R. E. (1986). 10wards an interactionist approach to drinking-driving behavior: Implicationsfor prevention and research. Health Education Research: Theory and Practice, I, 273-288.
Wechsler, H., Rohman, M., Kotch, J. B., & Idelson, R. K. (1984). Alcohol and other drug and automobile safety: Asurvey of Boston-area teenagers. Journal of School Health, 54, 201-203.
Williams, A. F., Lund. A. K., & Preusser, D. F. (1986). Drinking and driving among high school students. The Internationa/ Journal of the Addictions, 21, 643-655.
Zobeck, T. S., Williams. G. D., & Bertolucci, D. (1986). Trends in Alcohol-related fatal traffic accidents, United States,1977-1984. Alcohol Health and Research World, 10, 60-63.
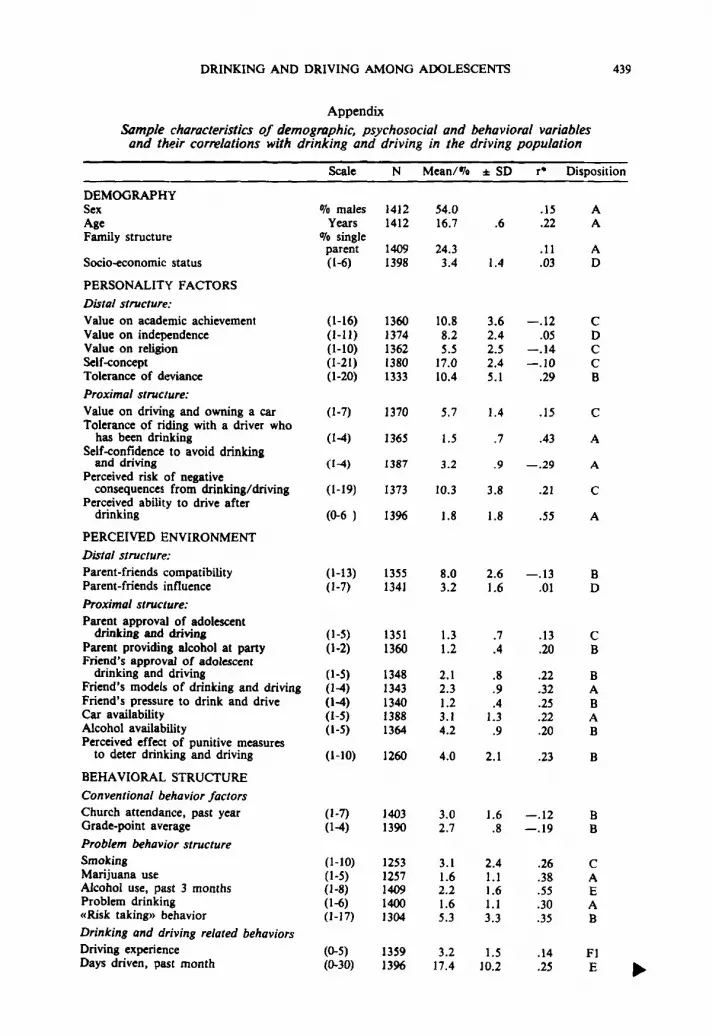
DRINKING AND DRIVING AMONG AOOLESCENTS 439
AppendixSample characteristics of demographic, psychosocial and behavioral variables
and their correlations with drinking and driving in the driving population
Scale N Mean/OJo :t: SD r· Disposition
DEMOGRAPHYSex 0/0 males 1412 54.0 .15 AAge Years 1412 16.7 .6 .22 AFamily structure % single
parent 1409 24.3 .Il ASocio-economic status (1-6) 1398 3.4 1.4 .03 D
PERSONALITY FACTORS
Distal structure:Value on academic achievement (1-16) 1360 10.8 3.6 -.12 CValue on independence (I-ll) 1374 8.2 2.4 .05 DValue on religion (1-10) 1362 S.S 2.5 -.14 CSelf-concept (1-21) 1380 17.0 2.4 -.10 CTolerance of deviance (1-20) 1333 10.4 5.1 .29 BProximal structure:Value on driving and owning a car (1-7) 1370 S.7 1.4 .15 CTolerance of riding with a driver who
has been drinking (1-4) 136S I.S .7 .43 ASelf-confidence to avoid drinking
and driving (1-4) 1387 3.2 .9 -.29 APerceived risk of negative
consequences from drinking/driving (1-19) 1373 10.3 3.8 .21 CPerceived ability to drive after
drinking (D-6 ) 1396 1.8 1.8 .55 A
PERCEIVED ENVIRONMENT
Distal structure:Parent-friends compatibility (1-13) 1355 8.0 2.6 -.13 BParent-friends influence (1-7) 1341 3.2 1.6 .01 DProximal structure:Parent approval of adolescent
drinking and driving (I-S) 1351 J.3 .7 .13 CParent providing alcohol at party (1-2) 1360 1.2 .4 .20 BFriend's approval of adolescent
drinking and driving (I-S) 1348 2.1 .8 .22 BFriend's models of drinking and driving (1-4) 1343 2.3 .9 .32 AFriend's pressure to drink and drive (1-4) 1340 1.2 .4 .25 BCar availability (1-5) 1388 3.1 J.3 .22 AAlcohol availability (1-5) 1364 4.2 .9 .20 BPerceived effect of punitive measures
to deter drinking and driving (1-10) 1260 4.0 2.1 .23 B
BEHAVIORAL STRUCTURE
Conventional behavior factorsChurch attendance, past year (1-7) 1403 3.0 1.6 -.12 BGrade-point average (1-4) 1390 2.7 .8 -.19 BProblem behavior structureSmoking (1-10) 1253 3.1 2.4 .26 CMarijuana use (I-S) 12S7 1.6 1.1 .38 AAlcohol use, past 3 months (1-8) 1409 2.2 1.6 .55 EProblem drinking (1-6) 1400 1.6 1.1 .30 A«Risk taking» behavior (1-17) 1304 5.3 3.3 .35 BDrinking and driving related behaviorsDriving experience (D-5) 1359 3.2 i.s .14 FIDays driven, past month (D-30) 1396 17.4 JO.2 .25 E ~
440 K.-I. KLEPP, C. L. PERRY & D. R. JACOBS
Appendix (cont.)
Scale N Mean 070 ± SD r· Disposition
Seat-belt use (1-5) 1389 3.0 1.6 -.30 BSpeeding (1-3) 1335 2.4 .8 .19 BTraffic violation tickets (1-4) 1278 I.I .4 .23 BRiding with a drinking driver (1-3) 1326 1.5 .7 .49 APartying in a car (1-3) 1321 1.6 .7 .39 F2Driving after smoking marijuana (1-3) 1328 1.2 .5 .46 EIdentify strategies to avoid
drinking and driving (1-2) 1345 1.2 .4 .25 BDeciding not to drive because of
too much to drink (1-2) 1270 1.2 .4 .27 AAsking someone who has been
drinking, not to drive (1-2) 1371 1.4 .5 .14 C
DISPOSITION CODES
A = Factors included in the final combined model.B = Factors included in intermediate model with factors from same theoretical structure, but not in
final model.C = Factors correlated with drinking and drinving (p<.OOl), but not included in intermediate models.D = Factors not significantly associated with drinking and driving.E = Factors not included in regression analysis because of overlap with dependent measure.FI = Not included in regression analysis because of high correlation with Age (r = .55).F2 = Not included in regression analysis because of high correlation with «Riding with a drinking dri
ver» (r = .54).• Pearson's correlation coefficient.
Origine, developpement et prevention de la boissonau volant chez les adolescents
Une etude etiologiquea ete redlisee pour decrire l'origine et Ie developpement de l'habitude de boire avant de conduire parmi des adolescents venant d'obtenir leur permis de conduire. Un cadre theorique,issu de la theorie de lessor (Problem Behavior Theory), a ete mis enoeuvre dans Ie but d'identifier les facteurs environnementaux, comportementaux et de personnalite intervenant dans l'usage de boissons alcoolisees associe au fait de conduire. Parmi des etudiants declarant avoirconduit un vehicule amoteur dans /es trois mois precedents (N= 1416),33% des garcons et 22% des filles (age moyen 16.7 ans) declarerentavoir au moins une fois pendant cette periode bu deux verres ou plusd'alcool avant de prendre Ie volant. Des facteurs concernant la personnalite des sujets (comprenant la capacite auto-percue de conduireapres avoir bu, manque de confiance en soi associe au fait d'eviter cessituations...l. so perception de l'environnement (confiance dans Ie vehicule, influence des camarades) et ses comportements (rouler en compagnie d'un conducteur qui boit, usagede la marijuana), rendent compted'une part importante de 10 variance (49%) des comportements de boisson associes au fait de conduire. On recommande 10 realisation de programmes sco/aires de co-education et de prevention destines auxadolescents avant qu'ils atteignent I'age du permis de conduire. Le probleme de la boisson au volant devrait y etre aborde dans toutes sesconsequences comportementa/es ainsi que pour la securite routiere.
Key words: Drinking and driving behavior, Adolescents, Problem behavior theory.
Received: July 1987Revision received: Novem ber 1987
DRINKING AND DRIVING AMONG ADOLESCENTS 441
Kaut.Ill(le K1epp. Department of Social and Organizational Psychology, University of Bergen, aisteinsgate 3, SOO7Bergen, Norway.
Current theme oj research:
Health promotion among adolescents.
Most relevant publications in the field of Educational Psychology:
Klepp, K. I., Halper, A., & Perry, C. L. (1986). The efficacy of peer leaders in drug abuse prevention. Journal ofSchool Health. 56, 93-103.
Perry, C. L., Klepp, K. I., Halper, A., Dudovitz, B., Golden, D., & Smyth, M. (1987). Promoting healthy eatingand physical activity patterns among adolescents. Health Education Research. 2, 93-103.
Perry, C. L., Klepp, K. I.. & Shultz, J. (in press). Primary prevention of cardiovascular disease: Community-widestrategies for youth. Journal of Consulting and Clinical Psychology.
Cberyl L. Perry. Division of Epidemiology, School of Public Health, Stadium Gate 27, 611 Beacon St. S. E., Minneapolis, MN SS4SS.
Current theme of research:
Child and adolescent development, Psychosocial aspects of health promotion and disease prevention, Intervention andevaluation, Theory of health behavior.
Most relevant pubtications in the field of Educational Psychology:
Perry, C. l. (1987). Results of prevention programs with adolescents. Drug and Alcohol Dependence. 20, 13-19.
Perry, C. L., Klepp, K. /., Halper, A., Dudovitz, B., Golden, D., & Smyth, M. (1987). Promoting healthy eatingand physical activity patterns among adolescents. Health Education Research. 2, 93-103.
Perry, C. l., Crockett, S. J., & Pirie, P. (1987). Influencing parental health behavior: Implications of communityassessments. Health Education, 18, 68-77.
Perry, C. L., Klepp, K. I., & Shultz, J. (in press). Primary prevention of cardiovascular disease: Community-widestrategies for youth. Journal of Consulting and Clinical Psychology.
David R. Jr. Jacobs. Division of Epidemiology, School of Public Health, Universiy of Minnesota, Stadium Gate27, 611 Beacon St. S. E., Minneapolis, MN SS4SS.
Current theme of research:
Epidemiology, Biostatistics.
Most relevant publications in the field of Educational Psychology:
Blackburn, H., Trapp, E., Prineas, R., & Jacobs, D. (197S). Coronary risk screening and evaluation: A learning exercise for medical students. Pre)'I!lttive Medicilte. 4, 579-590.
Schucker, B. & Jacobs, D. (1977). Assessment of behavioral risk for coronary disease by voice characteristics. Psychosomatic Medicine. 39, 219-228.
Luepker, R. V., Pechacek, T. F., Murray, D. M., Johnson, C. A., Hund, F., & Jacobs, D. R. (1981). Saliva thiocyanate: A chemical indicator of cigarette smoking in adolescents. American Journal ofPublic Health. 71, 1320-1324.
Pirie, P. L., Elias. W. S., Wackman, D. B., Jacobs, D. R., Jr., Murray, D. M., Mittelmark, M. B., Luepker, R.V., & Blackburn H. (1986). Characteristics of participants and nonparticipants in a community cardiovasculardisease risk factor screening: The Minnesota Heart Health Program. American Journal of Preventive Medicine,1, 20-25.