online appendix for chapter 2 of why regional parties
TRANSCRIPT

Online appendix for Chapter 2 of Why Regional Parties
Table of Contents The “text reference” column lists locations in Chapter 2 that refer to the online appendix. The “description of content” column explains to what supplemental material each of these references alludes, with further details on the specific material included in the appendix listed in the “material presented in the appendix” column. Text reference Description of content Material presented in the appendix p. 27 Sample calculation of how to
classify parties as regional or national
Discussion A1. Sample calculation of how to classify parties as regional or national
Table A1. Sample VFI Calculation 1: Hypothetical Vote Totals
Table A2. Sample VFI Calculation 2: Reweighted Vote Totals
Table A3. Sample VFI Calculation 3: Normalized HHI
p. 28 Details on observations included in the cross-national dataset of regional party vote shares
Table A4. Observations included in the cross-national dataset of regional parties
Table A5. Country-specific notes on calculating regional party vote shares
Table A6. Data sources for cross-national regional party data
p. 30 Distribution of regional party vote shares across the 111 countries using different VFI scores as thresholds for classifying parties as regional or national
Figure A1. Cross-national distribution of regional party vote shares using a 0.10 VFI cut-off
Figure A2. Cross-national distribution of regional party vote shares using a 0.25 VFI cut-off
Figure A3. Cross-national distribution of regional party vote shares using a 1.00 VFI cut-off
Figure A4. Kernel density plot of cross-national regional party vote shares using various VFI cut-offs
p. 31 (fn 8)
Discussion of subnational variation in regional party vote shares using different thresholds for classifying parties as regional or national
Discussion A2. How subnational regional party vote shares in India vary using different VFI cut-offs
Figure A5. Regional party vote shares by Indian state using different VFI cut-offs
Table A7. Subnational variation in the 1984 election using different VFI cut-offs
p. 36 (fn 13)
Correlation in the cross-national data among alternative measures to regional party success
Table A8. Correlations between regional party vote shares and inflation measures
Table A9. Correlations between regional party vote shares and party system nationalization measures
p. 37 (fn 15)
Indian parties by type of regional party
Table A10. Regional parties by type of regional party in the 2014 Indian national election

1
Discussion A1. Sample calculation of how to classify parties as regional or national Assume that elections take place in a country with three regions—A, B, and C—and the number of voters in each region is 200, 100, and 100, respectively. Election results are below in Table A1. Note that Party 1 wins an equal percentage of votes across all regions while Party 2 wins an equal number of votes in each region. Party 3 wins votes everywhere, but disproportionately from Region A. Party 4 wins most of its votes in one region, while Party 5 wins all of its votes in a single region.
Table A1. Sample VFI Calculation 1: Hypothetical Vote Totals
Region A Region B Region C Party Total Party 1 50 25 25 100 Party 2 25 25 25 75 Party 3 125 20 30 125 Party 4 0 5 20 25 Party 5 0 25 0 25 Region Total 200 100 100
Since the regions are of different sizes, the votes must be reweighted by the size of the region. This means dividing a party’s votes in a region by the share of the electorate that comes from the region. For example, I divide Party 1’s 100 votes in Region A by 50% since Region A’s 200 voters represent 50% of the country’s total electorate. Reweighted votes are below, in Table A2.
Table A2. Sample VFI Calculation 2: Reweighted Vote Totals
Region A Region B Region C Party Total Party 1 100 100 100 300 Party 2 50 100 100 250 Party 3 250 80 120 450 Party 4 0 20 80 100 Party 5 0 100 0 100
Based on these reweighted vote totals, I next calculate a Herfindahl-Hirschman Index (HHI), which means first dividing the reweighted votes for a party in a region by the party’s total vote and then squaring the result. In other words, for Party 1, for each region the calculation is (100/300)2. The results of these calculations appear in columns (1)-(3) of Table A3. The raw HHI, in column (4), is the sum of columns (1)-(3). To adjust the raw HHI to take account of the number of regions, the calculation is: (HHI - (1/N) / (1 – (1/N). Since N=3, the calculation is: (HHI – (1/3) / (2/3)). This yields the scores listed in column (5). Since 0.18 is the cut-off, Parties 1, 2, and 3 are national parties, while Parties 4 and 5 are regional parties.

2
Table A3. Sample VFI Calculation 3: Normalized HHI
(1) (2) (3) (4) (5) (6) Region A Region B Region C Party Total=HHI Normalized HHI Vote % Party 1 0.11 0.11 0.11 0.33 0.00 25.00 Party 2 0.04 0.16 0.16 0.36 0.04 18.75 Party 3 0.31 0.03 0.07 0.41 0.12 43.75 Party 4 0.00 0.04 0.64 0.68 0.52 6.25 Party 5 0.00 1.00 0.00 1.00 1.00 6.25
Thus, the regional vote share is the sum of the total vote share, in column (6), for parties 4 and 5, or 12.5%. The national vote share is 87.5%.

3
Table A4. Observations included in the cross-national dataset of regional parties
The regional party vote is the vote share won by regional parties. For all countries for which “Unknown vote share” is 0.0%, the remaining votes went to national parties. For example, the regional party vote in Albania is 2.4%. Since the unknown vote is 0%, the national party vote is 97.6%. The independent vote is the vote share won by independent candidates. Independents count as regional parties, since they are, in effect, regional parties whose party labels are the candidate’s name. The independent vote share is therefore always less than or equal to the regional party vote share. The unknown vote share is the vote share for which I could not calculate a VFI score. In most cases, the unknown vote consists of votes for parties for which I could not obtain region-level vote shares, often because multiple parties’ vote shares were combined into an “other” category. The number of regions refers to the number of regions I use for calculating the regional party vote share.
Country Election
Year Regional
Party Vote Independent
Vote Unknown
Vote # of
Regions Albania 2005 2.4% 1.2% 0.0% 12 Algeria 2007 9.8% 9.8% 0.0% 49 Argentina 2007 42.4% 0.0% 0.0% 24 Armenia 2012 0.0% 0.0% 0.0% 11 Australia 2010 18.0% 2.5% 0.0% 8 Austria 2008 0.1% 0.0% 0.0% 9 Bangladesh 2008 6.2% 3.1% 0.0% 7 Belgium 2007 99.7% 0.0% 0.0% 3 Benin 2011 2.7% 0.0% 0.0% 12 Bhutan 2008 0.0% 0.0% 0.0% 20 Bolivia 2005 0.0% 0.0% 0.0% 9 Bosnia-Herzegovina 2006 99.9% 0.0% 0.0% 2 Botswana 2009 5.6% 1.9% 0.0% 13 Brazil 2006 0.0% 0.0% 0.0% 26 Bulgaria 2009 0.1% 0.0% 0.0% 29 Cambodia 2008 0.0% 0.0% 0.0% 24 Canada 2011 6.7% 0.5% 0.0% 13 Cape Verde 2001 0.0% 0.0% 0.0% 20 Chile 2009 13.1% 10.4% 0.0% 15 Colombia 2006 13.2% 0.0% 0.0% 33 Comoros 2009 66.8% 66.8% 0.0% 3 Costa Rica 2006 7.7% 0.0% 0.0% 7 Croatia 2007 8.0% 0.0% 0.0% 11 Cyprus 2011 0.1% 0.1% 0.0% 6

4
Czech Republic 2006 0.1% 0.0% 0.0% 14 Denmark 2011 1.3% 0.1% 0.0% 7 Djibouti 2003 0.0% 0.0% 0.0% 5 Dominican Republic 2006 0.5% 0.0% 0.0% 32 Ecuador 2009 2.5% 0.0% 10.7% 27 El Salvador 2012 2.0% 0.0% 0.0% 14 Estonia 2011 3.6% 2.8% 0.0% 10 Ethiopia 2005 15.4% 1.8% 0.0% 10 Finland 2007 5.5% 0.0% 0.1% 14 France 2012 3.3% 0.5% 9.0% 33 Gabon 2011 3.0% 0.0% 13.5% 9 Georgia 2012 0.0% 0.0% 0.0% 12 Germany 2009 7.7% 0.0% 0.0% 16 Ghana 2008 5.2% 3.8% 0.2% 10 Greece 2012 0.0% 0.0% 0.0% 13 Guatemala 2011 9.4% 0.0% 0.0% 22 Guinea-Bissau 2004 0.0% 0.0% 0.0% 9 Guyana 2006 2.1% 0.0% 0.0% 10 Haiti 2006 14.6% 1.2% 0.0% 10 Honduras 2005 0.0% 0.0% 0.0% 18 Hungary 2010 1.0% 0.3% 0.0% 7 India 2009 44.9% 5.2% 0.0% 35 Indonesia 2004 0.0% 0.0% 4.9% 32 Iraq 2005 6.5% 0.0% 0.0% 18 Ireland 2011 15.2% 10.8% 0.0% 22 Israel 2009 9.3% 0.0% 0.0% 7 Italy 2006 1.9% 0.0% 0.0% 20 Jamaica 2007 0.1% 0.1% 0.0% 14 Japan 2012 4.0% 1.7% 0.2% 47 Kenya 2007 12.9% 0.0% 9.6% 8 Kosovo 2010 7.2% 0.0% 0.0% 7 Latvia 2011 0.2% 0.0% 0.0% 5 Lebanon 2009 4.7% 4.0% 0.0% 6 Lesotho 2012 4.9% 3.3% 0.0% 10 Liberia 2005 15.1% 7.3% 0.0% 15 Lithuania 2008 4.8% 0.0% 0.0% 10 Macedonia 2011 9.2% 0.0% 0.0% 7 Malawi 2004 91.7% 24.4% 0.0% 3 Malaysia 2004 14.8% 2.1% 0.0% 16 Mauritius 2010 7.3% 1.5% 0.0% 10 Mexico 2009 0.0% 0.0% 0.0% 32 Moldova 2010 0.0% 0.0% 0.0% 35 Montenegro 2009 4.3% 0.0% 0.0% 22 Mozambique 2009 5.9% 0.0% 0.0% 13 Namibia 2004 4.1% 0.0% 0.0% 13 Nepal 2008 7.4% 1.2% 0.0% 5

5
Netherlands 2010 0.0% 0.0% 0.0% 19 New Zealand 2011 0.0% 0.0% 0.0% 15 Nicaragua 2011 0.0% 0.0% 0.0% 17 Niger 1999 7.2% 0.4% 0.0% 16 Nigeria 2007 6.1% 0.0% 0.0% 36 Norway 2009 0.3% 0.0% 0.0% 19 Pakistan 2008 45.8% 9.8% 0.0% 5 Panama 2009 2.4% 0.0% 0.0% 11 Papua New Guinea 2007 46.6% 37.3% 0.0% 20 Paraguay 2008 9.9% 0.0% 0.0% 18 Peru 2011 0.4% 0.0% 0.0% 26 Philippines 2010 12.8% 7.3% 0.0% 17 Poland 2005 0.4% 0.0% 0.0% 16 Portugal 2005 0.0% 0.0% 0.0% 20 Romania 2008 0.4% 0.4% 0.0% 43 Russia 2011 0.0% 0.0% 0.0% 85 Senegal 2012 0.0% 0.0% 0.0% 15 Serbia 2012 3.6% 0.0% 0.0% 31 Sierra Leone 2007 15.4% 0.6% 0.0% 4 Slovakia 2012 0.0% 0.0% 0.0% 8 Slovenia 2011 0.1% 0.0% 0.0% 8 Solomon Islands 2010 82.0% 66.1% 0.0% 10 South Africa 2009 7.0% 0.0% 0.0% 9 South Korea 2012 11.8% 9.4% 0.0% 17 Spain 2008 9.0% 0.0% 0.0% 19 Sri Lanka 2010 4.6% 0.5% 0.0% 9 Suriname 2010 5.0% 0.0% 0.0% 10 Sweden 2010 0.0% 0.0% 0.2% 29 Switzerland 2011 8.5% 0.0% 2.2% 26 Taiwan 2012 7.3% 3.9% 0.0% 22 Thailand 2011 1.3% 0.5% 0.4% 77 Timor-Leste 2012 0.0% 0.0% 0.0% 13 Trinidad & Tobago 2010 2.2% 0.0% 0.0% 15 Turkey 2002 1.0% 1.0% 0.0% 82 Ukraine 2007 0.0% 0.0% 0.0% 28 United Kingdom 2005 9.3% 0.5% 0.0% 4 United States 2010 2.3% 1.3% 0.0% 50 Uruguay 2009 0.0% 0.0% 0.0% 19 Venezuela 2005 18.4% 0.0% 0.0% 24 Zambia 2006 15.8% 9.5% 0.0% 9 Zimbabwe 2008 2.7% 2.4% 0.0% 10

6
Table A5. Country-specific notes on calculating regional party vote shares
Table A5 includes additional notes in cases where I dealt with missing data or instances where some type of judgement call was necessary in calculating the regional party vote share.
Country Notes Argentina The same parties form different alliances from province to province and, in
many cases, these alliances compete as party lists with names that also vary from province to province. I treat each of these fused lists as a distinct party, since they represent a unique merger of different parties that may not be replicated in other provinces.
Armenia I use the PR tier for calculating regional party vote shares. Australia The Liberal National Party of Queensland--which formed as a merger of the
Liberal Party and the National Party in Queensland—is treated as a separate party since it competes under a distinct party label.
Benin Election results are missing for one electoral district. The results for Donga region are therefore incomplete.
Bolivia I use the PR tier for calculating regional party vote shares. Chile I use party labels to calculate the regional party vote share, not the larger
electoral pacts. Both the pact and the party label appear on ballots. Ecuador I use the SMD tier for calculating regional party vote shares. Ethiopia The data for 2005 are incomplete. This is the note about the data on the
Psephos website: “These results are incomplete, and do not always tally exactly with the provincial figures below. They should be seen as giving a general indication only.” I could not find a better data source for this election.
France Official election results do not disaggregate minor-party candidates by party label. I treat those listed as “Autres” and “Regionalistes” as those from a single region, since these are either regionalists (likely competing in one region) or very small parties that may consist of just a handful of candidates. I treat those listed as divers gauche (various left), divers droite (various right), extrême gauche (extreme left), extréme droite (extreme right), and écologiste (ecologist) as “Unknown.”
Georgia I use the PR tier for calculating regional party vote shares. Germany The CSU is treated as a distinct party from the CDU. I use the PR tier for
calculating regional party vote shares. Guatemala Most of the regional parties are mergers of various parties that elsewhere
contested alone. (See note on Argentina, a similar case). Hungary I use the PR tier for calculating regional party vote shares. Ireland I mapped the electoral constituencies onto administrative countries by hand as
best I could. Some constituencies include multiple counties, in which case I treat the constituency as its own multi-county region. Thus, the number of counties (27) is somewhat larger than the number of regions (22) used to calculate the regional party vote share.
Japan I use the SMD tier for calculating regional party vote shares. Kosovo Excludes mail ballots because I cannot attribute these to a particular region.

7
Lebanon I treat the various movements (e.g., March 14 or March 8) as parties. IFES (International Foundation for Electoral Systems) published a list of candidates affiliated with various lists. The election authority in Lebanon provided election results for the various candidates, but without affiliations. I match the candidates and their vote shares (from the election results) to the list of candidates within the movements (from IFES). I am very conservative about matching names, and only includes those that are identical or nearly identical. Note that if I used the specific party affiliations of candidates within the major lists (which are provided for some candidates in the IFES publication) and did not treat the movements as the parties, then the regional party vote share for Lebanon would be extremely high because most of the candidates would be independent. My presumption is that the IFES publication may not be exhaustive in providing party affiliations. Moreover, it seems that the party lists are what people are voting on, and it is not at all clear that additional information on party affiliations within the party lists is provided to voters on ballots. Hence, I use the party lists/movements as the basis for calculating regional party vote shares.
Lesotho I use the SMD tier for calculating regional party vote shares. Lithuania I mapped constituency boundaries to counties by hand. I use the PR tier for
calculating regional party vote shares. Mexico I use the PR tier for calculating regional party vote shares. New Zealand I mapped constituency boundaries to administrative regions by hand. The
matches are not perfect. Because the Maori constituencies are completely different, including many administrative regions, I exclude these votes. They account for less than 6% of total votes. I use the PR tier for calculating regional party votes.
Niger I use the PR tier for calculating regional party vote shares. Nigeria Data are not complete. Several seats are missing. Panama I use the PR tier for calculating regional party vote shares. Philippines I use the SMD tier for calculating regional party vote shares. Romania I use the SMD tier for calculating regional party vote shares. Senegal I use the PR tier for calculating regional party vote shares. South Korea I use the SMD tier for calculating regional party vote shares. Taiwan I use the SMD tier for calculating regional party vote shares. Thailand I use the SMD tier for calculating regional party vote shares. Trinidad and Tobago
Electoral districts and administrative units are matched by hand, albeit not matched perfectly. Using SMDs as regions would not change the regional party vote using a VFI threshold of 0.18, but it would change the regional party vote with some other thresholds.
Venezuela I use the PR tier for calculating regional party vote shares.

8
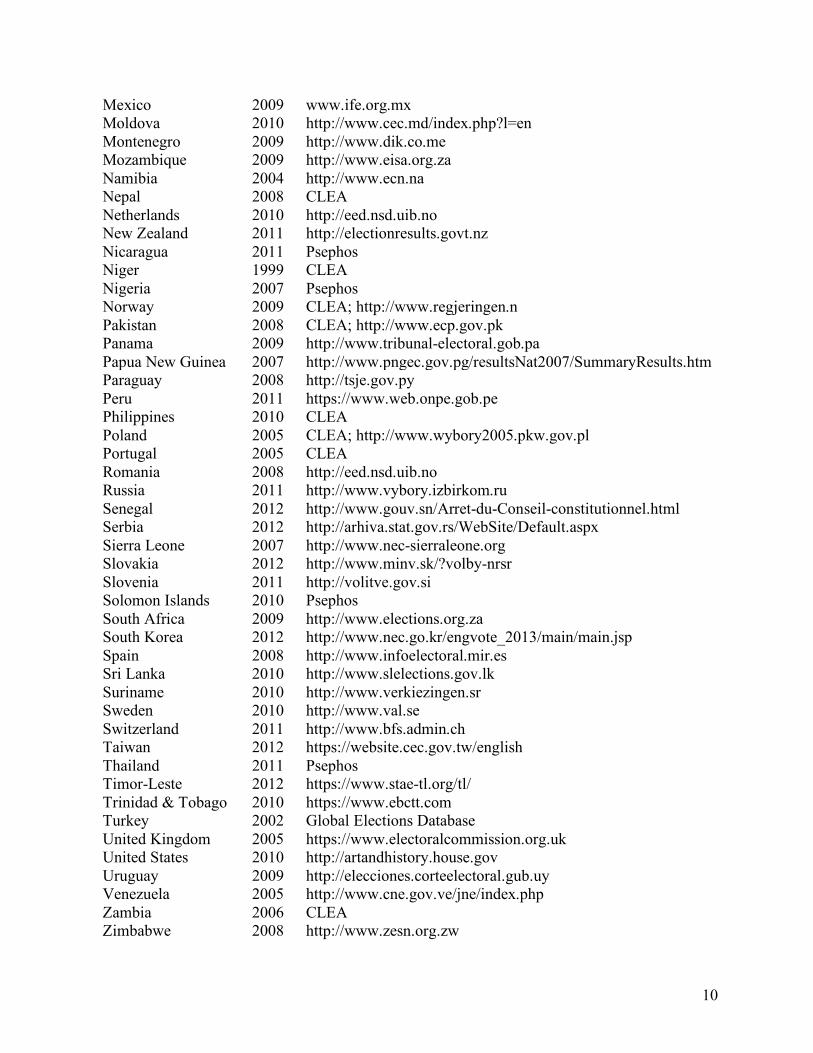
Table A6. Data sources for cross-national regional party data
Online data sources typically provide the link to the general data sources (such as a national election commission’s homepage), rather than to the specific page listing results for a particular election. I do so because the web addresses for election-specific results frequently change. CLEA refers to the January 19, 2012 release of the Constituency-Level Elections Archive (CLEA), found at http://www.electiondataarchive.org. Psephos refers to Adam Carr’s Election Archive, found at http://psephos.adam-carr.net. Global Elections Database refers to Dawn Brancati’s archive of election results, found at http://www.dawnbrancati.com/CLE.htm. Country Year Source Albania 2005 http://www.cec.org.al; CLEA Algeria 2007 http://www.rnd-dz.org Argentina 2007 https://www.argentina.gob.ar/dine Armenia 2012 http://www.elections.am Australia 2010 http://results.aec.gov.au Austria 2008 http://www.bmi.gv.at Bangladesh 2008 CLEA Belgium 2007 http://polling2007.belgium.be/en/cha/results/results_start.html Benin1 2011 http://www.beninelections.com Bhutan 2008 Psephos Bolivia 2005 CLEA Bosnia-Herzegovina 2006 CLEA Botswana 2009 http://www.iec.gov.bw2 Brazil 2006 CLEA Bulgaria 2009 http://eed.nsd.uib.no Cambodia 2008 European Parliament election observation report3 Canada 2011 http://www.elections.ca Cape Verde 2001 CLEA Chile 2009 https://historico.servel.cl Colombia 2006 CLEA Comoros 2009 Psephos Costa Rica 2006 CLEA Croatia 2007 CLEA Cyprus 2011 http://eed.nsd.uib.no Czech Republic 2006 CLEA Denmark 2011 http://eed.nsd.uib.no; http://www.dst.dk/valg
1 This link is dead. The pdfs I downloaded from this site, which were originally created by Benin’s Commission électorale nationale autonome (CENA) and contain the election results, are available upon request. 2 This link is dead. The document downloaded from the website of the Independent Electoral Commission of Botswana that contains the election results is available upon request. 3 Authored by Glyn Ford, chairman of the delegation. Available upon request.

9
Djibouti 2003 http://africanelections.tripod.com; Psephos Dominican Republic 2006 CLEA Ecuador 2009 Psephos El Salvador 2012 http://elecciones2012.tse.gob.sv Estonia 2011 https://www.valimised.ee/et Ethiopia 2005 Psephos Finland 2007 CLEA France 2012 https://www.interieur.gouv.fr/Elections/ Gabon 2011 Psephos Georgia 2012 http://www.results.cec.gov.ge/ Germany 2009 http://www.bundeswahlleiter.de Ghana 2008 Psephos; http://www.ec.gov.gh Greece 2012 http://www.ypes.gr/en/ Guatemala 2011 http://www.tse.org.gt/index.php Guinea-Bissau 2004 CLEA Guyana 2006 CLEA Haiti 2006 Psephos Honduras 2005 CLEA Hungary 2010 CLEA India 2009 http://eci.nic.in/eci/eci.html Indonesia 2004 CLEA Iraq 2005 http://www.ihec.iq4 Ireland 2011 http://electionsireland.org/ Israel 2009 http://www.knesset.gov.il/main/eng/home.asp5 Italy 2006 http://elezionistorico.interno.it Jamaica 2007 CLEA Japan 2012 http://politicalscience.unt.edu/~maeda/ Kenya 2007 Psephos Kosovo 2010 http://www.kqz-ks.org/an/ Latvia 2011 http://eed.nsd.uib.no Lebanon 2009 http://elections.gov.lb6 Lesotho 2012 Psephos Liberia 2005 CLEA Lithuania 2008 http://eed.nsd.uib.no Macedonia 2011 http://eed.nsd.uib.no Malawi 2004 CLEA Malaysia 2004 Psephos Mauritius 2010 http://www.gov.mu
4 This site no longer appears to have the 2005 election results available. The documents that I downloaded that contain the election results are available upon request. 5 Election results broken down by region no longer appear to be available. Region-wise results are available upon request. 6 These results were used in combination with a document compiled by the International Foundation for Electoral Systems (IFES), which is available upon request, as are the documents with the election results downloaded from the site indicated in the entry for Lebanon.
10
Mexico 2009 www.ife.org.mx Moldova 2010 http://www.cec.md/index.php?l=en Montenegro 2009 http://www.dik.co.me Mozambique 2009 http://www.eisa.org.za Namibia 2004 http://www.ecn.na Nepal 2008 CLEA Netherlands 2010 http://eed.nsd.uib.no New Zealand 2011 http://electionresults.govt.nz Nicaragua 2011 Psephos Niger 1999 CLEA Nigeria 2007 Psephos Norway 2009 CLEA; http://www.regjeringen.n Pakistan 2008 CLEA; http://www.ecp.gov.pk Panama 2009 http://www.tribunal-electoral.gob.pa Papua New Guinea 2007 http://www.pngec.gov.pg/resultsNat2007/SummaryResults.htm Paraguay 2008 http://tsje.gov.py Peru 2011 https://www.web.onpe.gob.pe Philippines 2010 CLEA Poland 2005 CLEA; http://www.wybory2005.pkw.gov.pl Portugal 2005 CLEA Romania 2008 http://eed.nsd.uib.no Russia 2011 http://www.vybory.izbirkom.ru Senegal 2012 http://www.gouv.sn/Arret-du-Conseil-constitutionnel.html Serbia 2012 http://arhiva.stat.gov.rs/WebSite/Default.aspx Sierra Leone 2007 http://www.nec-sierraleone.org Slovakia 2012 http://www.minv.sk/?volby-nrsr Slovenia 2011 http://volitve.gov.si Solomon Islands 2010 Psephos South Africa 2009 http://www.elections.org.za South Korea 2012 http://www.nec.go.kr/engvote_2013/main/main.jsp Spain 2008 http://www.infoelectoral.mir.es Sri Lanka 2010 http://www.slelections.gov.lk Suriname 2010 http://www.verkiezingen.sr Sweden 2010 http://www.val.se Switzerland 2011 http://www.bfs.admin.ch Taiwan 2012 https://website.cec.gov.tw/english Thailand 2011 Psephos Timor-Leste 2012 https://www.stae-tl.org/tl/ Trinidad & Tobago 2010 https://www.ebctt.com Turkey 2002 Global Elections Database United Kingdom 2005 https://www.electoralcommission.org.uk United States 2010 http://artandhistory.house.gov Uruguay 2009 http://elecciones.corteelectoral.gub.uy Venezuela 2005 http://www.cne.gov.ve/jne/index.php Zambia 2006 CLEA Zimbabwe 2008 http://www.zesn.org.zw

11
Figure A1. Cross-national distribution of regional party vote shares using a 0.10 VFI cut-off
Figure A1 replicates Figure 2.1, on page 28 of the book, but instead of using a VFI cut-off of 0.18 to classify a party as regional or national, it uses a cut-off of 0.10.
020
4060
80Fr
eque
ncy
0 50 100Regional Party Vote (%) with 0.10 VFI Threshold

12
Figure A2. Cross-national distribution of regional party vote shares using a 0.25 VFI cut-
off
Figure A2 replicates Figure 2.1, on page 28 of the book, but instead of using a VFI cut-off of 0.18 to classify a party as regional or national, it uses a cut-off of 0.25.
020
4060
80Fr
eque
ncy
0 50 100Regional Party Vote (%) with 0.25 VFI Threshold

13
Figure A3. Cross-national distribution of regional party vote shares using a 1.00 VFI cut-
off
Figure A3 replicates Figure 2.1, on page 28 of the book, but instead of using a VFI cut-off of 0.18 to classify a party as regional or national, it uses a cut-off of 1.00.
020
4060
80Fr
eque
ncy
0 50 100Regional Party Vote (%) with 1.00 VFI Threshold

14
Figure A4. Kernel density plot of cross-national regional party vote shares using various VFI cut-offs
To compare the distributions of regional party vote shares across countries using different VFI cut-offs, Figure A4 presents kernel density plots of the distributions of regional party vote shares across the 111 countries for which I have regional party vote shares. The red, blue, and green lines (cut-offs of 0.10, 0.18, and 0.25, respectively) are fairly similar. The gray line, using a VFI cut-off of 1.00—meaning that I only treat a party as regional if it contests in a single region—is somewhat different, indicating a much larger number of countries with no votes or very few votes for regional parties.
0.0
5.1
.15
.2
0 20 40 60 80 100Regional Party Vote (%)
VFI 0.10 VFI 0.18 VFI 0.25 VFI 1.00
15
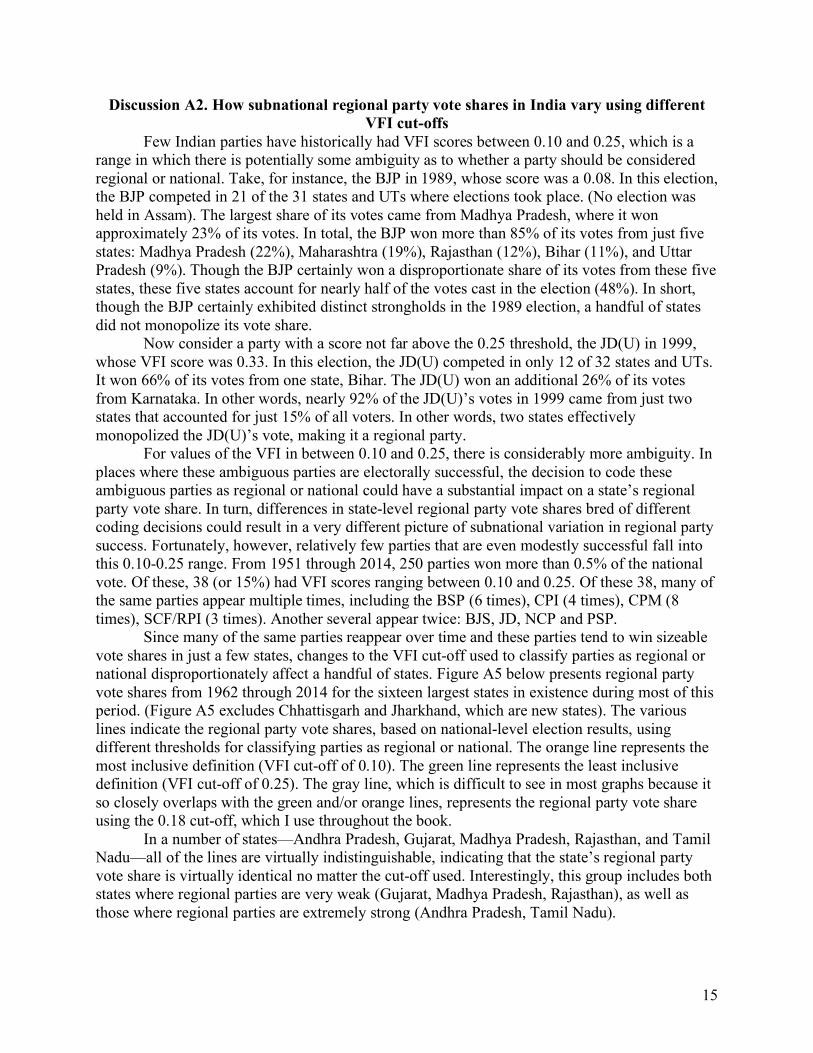
Discussion A2. How subnational regional party vote shares in India vary using different VFI cut-offs
Few Indian parties have historically had VFI scores between 0.10 and 0.25, which is a range in which there is potentially some ambiguity as to whether a party should be considered regional or national. Take, for instance, the BJP in 1989, whose score was a 0.08. In this election, the BJP competed in 21 of the 31 states and UTs where elections took place. (No election was held in Assam). The largest share of its votes came from Madhya Pradesh, where it won approximately 23% of its votes. In total, the BJP won more than 85% of its votes from just five states: Madhya Pradesh (22%), Maharashtra (19%), Rajasthan (12%), Bihar (11%), and Uttar Pradesh (9%). Though the BJP certainly won a disproportionate share of its votes from these five states, these five states account for nearly half of the votes cast in the election (48%). In short, though the BJP certainly exhibited distinct strongholds in the 1989 election, a handful of states did not monopolize its vote share. Now consider a party with a score not far above the 0.25 threshold, the JD(U) in 1999, whose VFI score was 0.33. In this election, the JD(U) competed in only 12 of 32 states and UTs. It won 66% of its votes from one state, Bihar. The JD(U) won an additional 26% of its votes from Karnataka. In other words, nearly 92% of the JD(U)’s votes in 1999 came from just two states that accounted for just 15% of all voters. In other words, two states effectively monopolized the JD(U)’s vote, making it a regional party. For values of the VFI in between 0.10 and 0.25, there is considerably more ambiguity. In places where these ambiguous parties are electorally successful, the decision to code these ambiguous parties as regional or national could have a substantial impact on a state’s regional party vote share. In turn, differences in state-level regional party vote shares bred of different coding decisions could result in a very different picture of subnational variation in regional party success. Fortunately, however, relatively few parties that are even modestly successful fall into this 0.10-0.25 range. From 1951 through 2014, 250 parties won more than 0.5% of the national vote. Of these, 38 (or 15%) had VFI scores ranging between 0.10 and 0.25. Of these 38, many of the same parties appear multiple times, including the BSP (6 times), CPI (4 times), CPM (8 times), SCF/RPI (3 times). Another several appear twice: BJS, JD, NCP and PSP. Since many of the same parties reappear over time and these parties tend to win sizeable vote shares in just a few states, changes to the VFI cut-off used to classify parties as regional or national disproportionately affect a handful of states. Figure A5 below presents regional party vote shares from 1962 through 2014 for the sixteen largest states in existence during most of this period. (Figure A5 excludes Chhattisgarh and Jharkhand, which are new states). The various lines indicate the regional party vote shares, based on national-level election results, using different thresholds for classifying parties as regional or national. The orange line represents the most inclusive definition (VFI cut-off of 0.10). The green line represents the least inclusive definition (VFI cut-off of 0.25). The gray line, which is difficult to see in most graphs because it so closely overlaps with the green and/or orange lines, represents the regional party vote share using the 0.18 cut-off, which I use throughout the book.
In a number of states—Andhra Pradesh, Gujarat, Madhya Pradesh, Rajasthan, and Tamil Nadu—all of the lines are virtually indistinguishable, indicating that the state’s regional party vote share is virtually identical no matter the cut-off used. Interestingly, this group includes both states where regional parties are very weak (Gujarat, Madhya Pradesh, Rajasthan), as well as those where regional parties are extremely strong (Andhra Pradesh, Tamil Nadu).

16
In another group of states, the lines mainly overlap except for a couple of elections. Assam, Bihar, Delhi, Haryana, Karnataka, Maharashtra, Odisha, and Punjab fall into this category. In these states, a party winning a sizeable vote share in a handful of elections had a VFI score in this ambiguous range. For instance, in 1962 the Jana Sangh (VFI = 0.12) won nearly 33% of the vote in Delhi, and in 2014, AAP (VFI = 0.15) similarly won about a third of the vote in Delhi. In these elections, using a VFI cut-off of 0.10, instead of 0.18, would indicate significantly higher vote shares for regional parties in Delhi in these elections. Consequently, Delhi’s place within the field of subnational variation in regional party vote shares in 1962 and 2014 would be very different depending on the cut-off. However, in all other elections, the use of different cut-offs would not change one’s appraisal of the relative strength of regional party votes shares in Delhi. So, too, with the other states where the green and orange lines noticeably diverge in only a handful of elections. Recall, however, that Chapter 8’s analysis of subnational variation focuses more on state’s overall trajectories of regional party success rather than explaining subnational variation in any given election.
Figure A5. Regional party vote shares by Indian state using different VFI cut-offs
Finally, in three states, Kerala, Uttar Pradesh, and West Bengal, the use of different VFI thresholds would significantly alter whether one perceives regional parties as being strong or weak. In the cases of Kerala and West Bengal, the divergent trends stem largely from the CPM and, to a lesser extent, CPI. For decades, the CPM was one of the largest parties in both states, meaning that the CPM’s coding as a regional party (or not) dramatically affects the regional party vote share in these two states. From the party’s first national election in 1967 through 1996,
0.5
10
.51
0.5
10
.51
1962 2014 1962 2014 1962 2014 1962 2014
Andhra Pradesh Assam Bihar Delhi
Gujarat Haryana Karnataka Kerala
Madhya Pradesh Maharashtra Odisha Punjab
Rajasthan Tamil Nadu Uttar Pradesh West Bengal
VFI 0.10 VFI 0.18 VFI 0.25

17
the CPM’s VFI score fell in the ambiguous range. Since the late 1990s, its support base has contracted, and its VFI score no longer falls in the ambiguous range. Consequently, the orange and green lines converge from the late 1990s onward in Kerala and West Bengal. In Uttar Pradesh, several parties account for the divergence in regional party vote shares based on the different thresholds: the Jana Sangh in 1957 and 1962, PSP in 1967 and 1971, Lok Dal in 1984, and BSP from 1991 onward. The lines converge in 2004 and 2009, when the BSP’s VFI score fell below 0.10 and it was less ambiguously a national party. In sum, using a more restrictive definition of a regional party (that is, treating more parties as national and fewer as regional) means that Kerala and West Bengal in the 1960s through late 1990s and Uttar Pradesh in the 1960s and again in the 1980s through 1990s have significantly lower regional party vote shares than they would using a more expansive definition of a regional party (treating more parties are regional). In a handful of elections, several other states would have somewhat higher or lower regional party vote shares, while in a number of other states the use of different thresholds does not change the absolute or relative strength of regional parties.
Table A7. Subnational variation in the 1984 election using different VFI cut-offs VFI cut-off = 0.10 VFI cut-off = 0.18 VFI cut-off = 0.25
Extremely successful regional parties (> 60%) Assam 71% Assam 71%
Assam 61%
Very successful regional parties (40-60%) Kerala 55% Kerala 54% Andhra Pradesh 50% Andhra Pradesh 53% Andhra Pradesh 53% Tamil Nadu 49% Tamil Nadu 52% Tamil Nadu 52% Punjab 46% Punjab 49% Punjab 49% West Bengal 48% West Bengal 48%
Moderately successful regional parties (20-40%) Uttar Pradesh 37% Maharashtra 30% Kerala 27% Haryana 35% Maharashtra 30% Bihar 26%
Relatively unsuccessful regional parties (< 20%) Rajasthan 19% Haryana 16% Maharashtra 16% Gujarat 11% Uttar Pradesh 16% Haryana 16% Madhya Pradesh 9% Bihar 13% Uttar Pradesh 16% Delhi 9% Gujarat 9% West Bengal 12% Odisha 8% Madhya Pradesh 8% Bihar 11% Karnataka 8% Rajasthan 8% Gujarat 9% Karnataka 7% Madhya Pradesh 8% Odisha 7% Rajasthan 8% Delhi 4% Karnataka 7% Odisha 5% Delhi 4%

18
Table A7 list the major states in descending order of regional party vote shares in the 1984 election, based on different thresholds. I chose the 1984 election because this is one in which almost 13% of the national vote went to parties with VFI scores between 0.10 and 0.25, resulting in the possibility of very different regional party vote shares across states, depending on the VFI cut-off used for classification. In other words, subnational variation should be greater across the different VFI cut-offs in 1984 than in most other elections. Yet, across all thresholds, Assam had extremely successful regional parties (winning more than 60% of the vote); Andhra Pradesh, Tamil Nadu, and Punjab all had very successful regional parties (winning 40-60% of the vote); and Rajasthan, Gujarat, Madhya Pradesh, Delhi, Odisha, and Karnataka had relatively unsuccessful regional parties (winning less than 20%). Between the 0.10 and 0.18 cut-offs, the main differences are that the regional party vote shares in Uttar Pradesh, Haryana, and Bihar are noticeably higher using the more expansive definition of regional parties (VFI = 0.10) because these states had high vote shares for the Lok Dal, whose VFI score was 0.14. And, between the 0.18 and 0.25 cut-offs, regional party vote shares are noticeably lower in Kerala, West Bengal, and Maharashtra using the more restrictive definition of regional parties (VFI = 0.25) because the CPM (which did well in Kerala and West Bengal) and Congress (Socialist) (which won a sizeable vote in Maharashtra) had VFIs between 0.18 and 0.25. Thus, even in an election where a comparatively large share of the vote went to parties with VFI scores between 0.10 and 0.25, the pictures of subnational variation that emerge from the different cut-offs are not radically different.

19
Table A8. Correlations between regional party vote shares and inflation measures VFI
0.10 VFI 0.18
VFI 0.25
VFI 1.00 Inflation1 Inflation2 Inflation3 Inflation4
VFI 0.10 1.0000 VFI 0.18 0.8506 1.0000 VFI 0.25 0.8300 0.9706 1.0000 VFI 1.00 0.6439 0.6641 0.5908 1.0000 Inflation1 0.5330 0.5711 0.5414 0.5254 1.0000 Inflation2 0.4904 0.5350 0.5175 0.5359 0.9523 1.0000 Inflation3 0.2597 0.2820 0.2753 0.2987 0.4480 0.5522 1.0000 Inflation4 0.3509 0.3665 0.3223 0.3353 0.8623 0.8537 0.4702 1.0000
VFI refers to the threshold used to calculate regional party vote shares. For example, VFI 0.10 calculates regional party vote shares using a 0.10 cut-off. These four VFI entries therefore represent regional party vote shares using four different cut-offs. The 0.18 threshold is the one used throughout the book. The Constituency Level Election Archive (CLEA) January 19, 2012 release includes four measures of party system inflation. Inflation1 is the Cox (1999) Inflation Score described in Chapter 2. The CLEA data also include three other variants. Inflation2 is the Moenius and Kasuya (2004) Inflation Score. Inflation3 is the Moenius and Kasuya (2004) Weighted Inflation Score. Inflation4 is the Kasuya and Moenius (2008) Inflation and Dispersion Score. Table A8 presents the correlation coefficients between the different variables. Because the CLEA data are available only for certain countries, the number of observations is 53, as opposed to the 111 countries in the regional party vote share dataset. The entries in red are the correlations between the inflation measure described in the book and the regional party vote shares. The entry in red bold is the correlation between the regional party vote share measure used throughout the book and the Cox inflation measure used in Figure 2.3 of the book. The various regional party vote shares are fairly strongly correlated with Inflation1 and Inflation2 and still positively correlated, though somewhat less strongly, with Inflation3 and Inflation4.

20
Table A9. Correlations between regional party vote shares and party system nationalization measures
VFI
0.10 VFI 0.18
VFI 0.25
VFI 1.00 PSNS
PSNS-S
PSNS-W
PSNS-SW
VFI 0.10 1.0000 VFI 0.18 0.8508 1.0000 VFI 0.25 0.8301 0.9706 1.0000 VFI 1.00 0.6453 0.6651 0.5913 1.0000 PSNS -0.4540 -0.4960 -0.4575 -0.3515 1.0000 PSNS-S -0.2946 -0.3640 -0.3655 -0.1541 0.8706 1.0000 PSNS-W -0.5312 -0.5460 -0.5034 -0.5551 0.8971 0.6668 1.0000 PSNS-SW -0.4746 -0.5211 -0.5072 -0.4926 0.8532 0.8457 0.8778 1.0000
VFI refers to the threshold used to calculate regional party vote shares. For example, VFI 0.10 calculates regional party vote shares using a 0.10 cut-off. These four VFI entries therefore represent regional party vote shares using four different cut-offs. The 0.18 threshold is the one used throughout the book. The Constituency Level Election Archive (CLEA) January 19, 2012 release includes four measures of party system nationalization. PSNS is the Jones and Mainwaring (2003) party system nationalization score described in Chapter 2. The CLEA data also include three other variants. PSNS-S is the standardized party system nationalization score, described by Bochsler (2008). PSNS-W is the weighed party system nationalization score described by Bochsler (2010). PSNS-SW is the standardized and weighted party system nationalization score described by Bochsler (2010). Table A9 presents the correlation coefficients between the different variables. Because the CLEA data are available only for certain countries, the number of observations is 53, as opposed to the 111 countries in the regional party vote share dataset. The entries in red are the correlations between the party system nationalization measure described in the book and the regional party vote shares. The entry in red bold is the correlation between the regional party vote share measure used throughout the book and the Jones and Mainwaring party system nationalization measure used in Figure 2.3 of the book. Because the regional party vote and party system nationalization measures are inversely related, Figure 2.3 subtracts the PSNS from 1. In Table A9, I use the raw party system nationalization measures, which are therefore negatively correlated with the regional party vote shares. The various regional party vote shares are negatively correlated with the Jones and Mainwaring PSNS and even more strongly negatively correlated with Bochsler’s PSNS-W and PSNS-SW.

21
Table A10. Regional parties by type of regional party in the 2014 Indian national election Regional party type Party (2014 vote share) Regionalist 1. All India Anna Dravida Munnetra Kazhagam (3.3%)
2. Asom Gana Parishad (0.1%) 3. Dravida Munnetra Kazhagam (1.8%) 4. Jammu & Kashmir People’s Democratic Party (0.1%) 5. Jharkhand Mukti Morcha (0.3%) 6. Marumalarchi Dravida Munnetra Kazhagam (0.3%) 7. Maharashtra Navnirman Sena (0.1%) 8. Nagaland People’s Front (0.2%) 9. Shiromani Akali Dal (0.7%) 10. Shiv Sena (1.9%) 11. Telugu Desam Party (2.6%) 12. Telangana Rashtra Samithi (1.2%)
Janata Dal remnants 1. Biju Janata Dal (1.7%) 2. Indian National Lok Dal (0.5%) 3. Janata Dal (Secular) (0.7%) 4. Janata Dal (United) (1.1%) 5. Lok Jan Shakti Party (0.4%) 6. Rashtriya Janata Dal (1.4%) 7. Rashtriya Lok Dal (0.1%) 8. Samajwadi Party (3.4%)
Congress splinters 1. All India Trinamool Congress (3.9%) 2. Haryana Janhit Congress (Bhajan Lal) (0.1%) 3. Nationalist Congress Party (1.6%) 4. YSR Congress Party (2.6%)
Left 1. All India Forward Bloc (0.2%) 2. Communist Party of India (0.8%) 3. Communist Party of India (Marxist) (3.3%) 4. Communist Party of India (Marxist-Leninist)(Liberation) (0.2%) 5. Revolutionary Socialist Party (0.3%)
Other Major 1. Apna Dal (0.2%) 2. All India Majlis-e-Ittehadul Muslimeen (0.1%) 3. All India United Democratic Front (0.4%) 4. Desiya Murpokku Dravida Kazhagam (0.4%) 5. Indian Union Muslim League (0.2%) 6. Jharkhand Vikas Morcha (Prajatantrik) (0.3%) 7. National People’s Party (0.1%) 8. Pattali Makkal Katchi (0.3%) 9. Rashtriya Lok Samata Party (0.2%) 10. Swabhimani Paksha (0.2%) 11. Viduthalai Chiruthaigal Katchi (0.1%)
Micro-parties See note below

22
Regional parties coded as micro-parties are regional parties winning less than 0.1% of the vote. In the 2014 national election, 464 parties competed. Table A8 above lists 40 regional parties. Additionally, there were eight parties coded as national (vote shares in parentheses): Aam Aadmi Party (2.1%), Bahujan Mukti Party (0.1%), Bahujan Samaj Party (4.2%), Bharatiya Janata Party (31.3%), Communist Party of India (Marxist-Leninist) Red Star (< 0.1%), Indian National Congress (19.5%), Republican Party of India (A) (< 0.1%), Socialist Unity Centre of India (Communist) (0.1%). The remaining 416 parties are regional parties coded as micro-parties.