one-pot synthesis of carbon nanofibers from co2
TRANSCRIPT
Included are Technical Write-ups of:
1) STEP CO2 converted to carbon nanofibers 2015
2) STEP Fertilizer 2014
3) STEP Fuels 2014/15
4) STEP Iron 2013
5) STEP Cement 2012
6) STEP 2011 -Includes theory, solar efficiency, and individual STEP processes for Fuels, Metals, Bleach and Desalinization.
7) The import of electrochemistry in solar energy conversion Nature cover article 1987
Further information available at Licht research group sites: http://home.gwu.edu/~slicht/index.html http://chemistry.columbian.gwu.edu/stuart-licht
One-Pot Synthesis of Carbon Nanofibers from CO2Jiawen Ren,† Fang-Fang Li,† Jason Lau,† Luis Gonzalez-Urbina,† and Stuart Licht*,†
†Department of Chemistry, The George Washington University, Washington, DC 20052, United States
*S Supporting Information
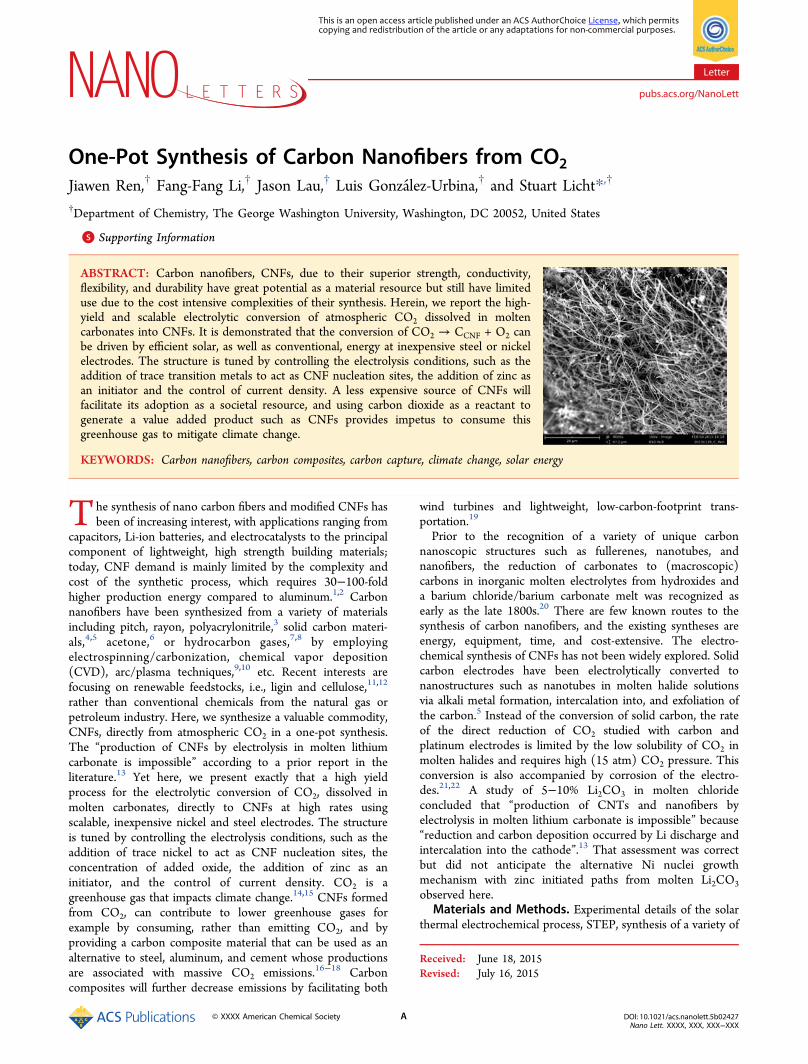
ABSTRACT: Carbon nanofibers, CNFs, due to their superior strength, conductivity,flexibility, and durability have great potential as a material resource but still have limiteduse due to the cost intensive complexities of their synthesis. Herein, we report the high-yield and scalable electrolytic conversion of atmospheric CO2 dissolved in moltencarbonates into CNFs. It is demonstrated that the conversion of CO2 → CCNF + O2 canbe driven by efficient solar, as well as conventional, energy at inexpensive steel or nickelelectrodes. The structure is tuned by controlling the electrolysis conditions, such as theaddition of trace transition metals to act as CNF nucleation sites, the addition of zinc asan initiator and the control of current density. A less expensive source of CNFs willfacilitate its adoption as a societal resource, and using carbon dioxide as a reactant togenerate a value added product such as CNFs provides impetus to consume thisgreenhouse gas to mitigate climate change.
KEYWORDS: Carbon nanofibers, carbon composites, carbon capture, climate change, solar energy
The synthesis of nano carbon fibers and modified CNFs hasbeen of increasing interest, with applications ranging from
capacitors, Li-ion batteries, and electrocatalysts to the principalcomponent of lightweight, high strength building materials;today, CNF demand is mainly limited by the complexity andcost of the synthetic process, which requires 30−100-foldhigher production energy compared to aluminum.1,2 Carbonnanofibers have been synthesized from a variety of materialsincluding pitch, rayon, polyacrylonitrile,3 solid carbon materi-als,4,5 acetone,6 or hydrocarbon gases,7,8 by employingelectrospinning/carbonization, chemical vapor deposition(CVD), arc/plasma techniques,9,10 etc. Recent interests arefocusing on renewable feedstocks, i.e., ligin and cellulose,11,12
rather than conventional chemicals from the natural gas orpetroleum industry. Here, we synthesize a valuable commodity,CNFs, directly from atmospheric CO2 in a one-pot synthesis.The “production of CNFs by electrolysis in molten lithiumcarbonate is impossible” according to a prior report in theliterature.13 Yet here, we present exactly that a high yieldprocess for the electrolytic conversion of CO2, dissolved inmolten carbonates, directly to CNFs at high rates usingscalable, inexpensive nickel and steel electrodes. The structureis tuned by controlling the electrolysis conditions, such as theaddition of trace nickel to act as CNF nucleation sites, theconcentration of added oxide, the addition of zinc as aninitiator, and the control of current density. CO2 is agreenhouse gas that impacts climate change.14,15 CNFs formedfrom CO2, can contribute to lower greenhouse gases forexample by consuming, rather than emitting CO2, and byproviding a carbon composite material that can be used as analternative to steel, aluminum, and cement whose productionsare associated with massive CO2 emissions.16−18 Carboncomposites will further decrease emissions by facilitating both
wind turbines and lightweight, low-carbon-footprint trans-portation.19
Prior to the recognition of a variety of unique carbonnanoscopic structures such as fullerenes, nanotubes, andnanofibers, the reduction of carbonates to (macroscopic)carbons in inorganic molten electrolytes from hydroxides anda barium chloride/barium carbonate melt was recognized asearly as the late 1800s.20 There are few known routes to thesynthesis of carbon nanofibers, and the existing syntheses areenergy, equipment, time, and cost-extensive. The electro-chemical synthesis of CNFs has not been widely explored. Solidcarbon electrodes have been electrolytically converted tonanostructures such as nanotubes in molten halide solutionsvia alkali metal formation, intercalation into, and exfoliation ofthe carbon.5 Instead of the conversion of solid carbon, the rateof the direct reduction of CO2 studied with carbon andplatinum electrodes is limited by the low solubility of CO2 inmolten halides and requires high (15 atm) CO2 pressure. Thisconversion is also accompanied by corrosion of the electro-des.21,22 A study of 5−10% Li2CO3 in molten chlorideconcluded that “production of CNTs and nanofibers byelectrolysis in molten lithium carbonate is impossible” because“reduction and carbon deposition occurred by Li discharge andintercalation into the cathode”.13 That assessment was correctbut did not anticipate the alternative Ni nuclei growthmechanism with zinc initiated paths from molten Li2CO3observed here.
Materials and Methods. Experimental details of the solarthermal electrochemical process, STEP, synthesis of a variety of
Received: June 18, 2015Revised: July 16, 2015
Letter
pubs.acs.org/NanoLett
© XXXX American Chemical Society A DOI: 10.1021/acs.nanolett.5b02427Nano Lett. XXXX, XXX, XXX−XXX
This is an open access article published under an ACS AuthorChoice License, which permitscopying and redistribution of the article or any adaptations for non-commercial purposes.
societal staples and carbon capture have been detailed inprevious publications.16−18,23−29 This study focuses primarilyon the STEP for carbon electrochemical reactor component toform a high-yield CNF component. Barium carbonate (AlfaAesar, 99.5%), lithium carbonate (Alfa Aesar, 99%), lithiumoxide (Alfa Aesar, 99.5%), and calcium carbonate (Alfa Aesar,98%) are combined to form various molten electrolytes.Copper(II) and cobalt(II) oxides are from Alfa Aesar, andzinc(II) oxide is from Nanotec.Electrolyses are driven at a 2.3 A (amp) at the maximum
power point of the illuminated concentrator photovoltaic (asshown in Figure S8) or galvanostatically at a set constantcurrent as described in the text. The electrolysis is contained ina pure alumina (AdValue, 99.6%) crucible or pure nickelcrucible (Alfa Aesar). Alumina crucible electrolyses used coiledNi wire (Alfa Aesar, 99.5%) as the (oxygen generating) anodeor in scale-up experiments cylinders formed from pure Ni shim(McMaster 9707K5), while electrolyses in the Ni crucibles usedthe inner walls of the crucible as the anode. Ir anodes werecomposed of 25 mm × 25 mm × 1 mm 99.7% iridium foil AlfaAesar 11432 and platinum from Surepure. A wide variety ofsteel wires for coiled cathodes are effective, an economic form(used in this study) is Fi-Shock 14 gauge, galvanized steel wiremodel BWC-14200. During electrolysis, the carbon productaccumulates at the cathode, which is subsequently removed andcooled. Details of solar (STEP methodology) electrolyses areprovided in refs 16, 23, and 25. Subsequent to electrolysis, theproduct remains on the cathode but falls off when the cathodeis extracted, cooled, and uncoiled. The product is washed witheither DI water or up to 6 m HCl (both yield similar product,but the latter solution accelerates the washing process) andseparated from the washing solution by either paper filtration orcentrifugation (both yield similar product, but the latteraccelerates the separation process).The carbon product is washed and analyzed by PHENOM
Pro-X energy dispersive spectroscopy on the PHENOM Pro-XSEM; by XRD analysis conducted at a sweep rate of 0.12degree per minute on a Rigaku Miniflex diffractometer with a0.01 degree slit width, analyzed using the Jade software package(JADE, 6:1; Materials Data, Inc. Livermore, CA, 2002) and byhigher resolution with a Carl Zeiss Sigma VP field emission
scanning electron microscope with energy dispersive X-raydetector. Raman spectroscopy was measured with a LabRAMHR800 Raman microscope (HORIBA) with 532.14 wavelengthincident laser light, with a high resolution of 0.6 cm−1.
Results and Discussion. Here, we show a facile high yieldroute of carbon nanostructure formation on inexpensiveelectrodes via molten carbonate electrolysis. The consumedcarbonate is directly replaced by absorbed CO2. Hence, weshow the first demonstration in which this atmospheric carbondioxide generates carbon nanofibers. Molten carbonates, suchas pure Li2CO3 (mp 723 °C) or low melting eutectics such asLiNaKCO3 (mp 399 °C) or LiBaCaCO3 (mp 620 °C), mixedwith highly soluble oxides, such Li2O and BaO, can sustainrapid absorption of CO2 from atmospheric or stack-exhaustCO2. Equilibrium constraining lithium or lithium/barium oxideabsorption has been presented, and in the context ofatmospheric or smoke stack CO2 the lithium case is describedas16−18,23
+ ⇌CO Li O Li CO2(atmospheric or stack) 2 (dissolved) 2 3(molten)
(1)
Scheme 1 presents the successive synthetic variationsdescribed in this study that led to the high yield electrolysisof straight uniform CNFs from CO2 in molten carbonate. Aircontains 0.04% CO2; this is only 1.7 × 10⁻⁵ mol of tetravalentcarbon per liter, whereas molten carbonate contains ∼20 mol ofreducible tetravalent carbon per liter. A separate process toconcentrate atmospheric CO2 is not needed in electrolytic CO2to CNF conversion. By absorbing CO2 from the air, moltencarbonates provide a million-fold concentration increase ofreducible tetravalent carbon available for splitting (to carbon)in the electrolysis chamber. Carbonate’s higher concentration ofactive, reducible tetravalent carbon sites logarithmicallydecreases the electrolysis potential and can facilitate chargetransfer at low electrolysis potentials. CO2 is bubbled into themolten carbonate, and during electrolysis, oxygen is evolved atthe anode, while a thick solid carbon builds at the cathode(Figure 1).We observe that carbonate is readily split to carbon
approaching 100% Coulombic efficiency (Coulombic efficiencyis determined by comparing the moles of applied charge to the
Scheme 1. Molten Carbonate Electrolysis Pathways Converting CO2 Leading to a High Yield, Uniform CNF Product
Nano Letters Letter
DOI: 10.1021/acs.nanolett.5b02427Nano Lett. XXXX, XXX, XXX−XXX
B
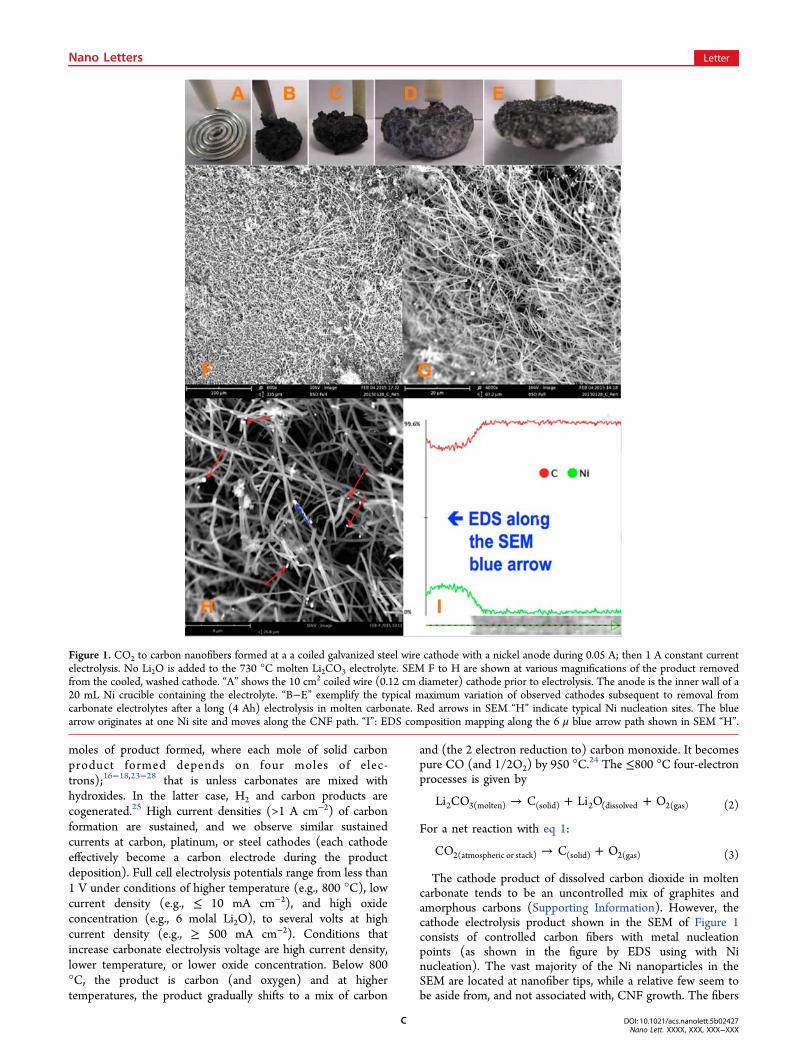
moles of product formed, where each mole of solid carbonproduct formed depends on four moles of elec-trons);16−18,23−28 that is unless carbonates are mixed withhydroxides. In the latter case, H2 and carbon products arecogenerated.25 High current densities (>1 A cm−2) of carbonformation are sustained, and we observe similar sustainedcurrents at carbon, platinum, or steel cathodes (each cathodeeffectively become a carbon electrode during the productdeposition). Full cell electrolysis potentials range from less than1 V under conditions of higher temperature (e.g., 800 °C), lowcurrent density (e.g., ≤ 10 mA cm−2), and high oxideconcentration (e.g., 6 molal Li2O), to several volts at highcurrent density (e.g., ≥ 500 mA cm−2). Conditions thatincrease carbonate electrolysis voltage are high current density,lower temperature, or lower oxide concentration. Below 800°C, the product is carbon (and oxygen) and at highertemperatures, the product gradually shifts to a mix of carbon
and (the 2 electron reduction to) carbon monoxide. It becomespure CO (and 1/2O2) by 950 °C.
24 The ≤800 °C four-electronprocesses is given by
→ + +Li CO C Li O O2 3(molten) (solid) 2 (dissolved 2(gas) (2)
For a net reaction with eq 1:
→ +CO C O2(atmospheric or stack) (solid) 2(gas) (3)
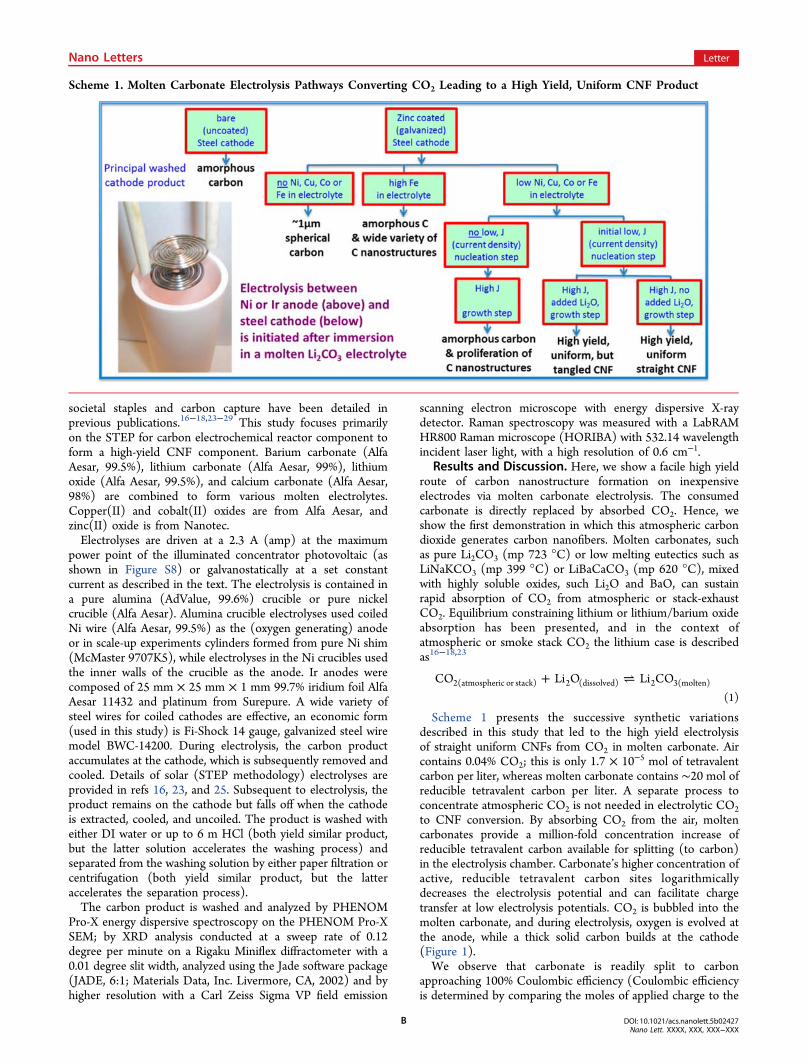
The cathode product of dissolved carbon dioxide in moltencarbonate tends to be an uncontrolled mix of graphites andamorphous carbons (Supporting Information). However, thecathode electrolysis product shown in the SEM of Figure 1consists of controlled carbon fibers with metal nucleationpoints (as shown in the figure by EDS using with Ninucleation). The vast majority of the Ni nanoparticles in theSEM are located at nanofiber tips, while a relative few seem tobe aside from, and not associated with, CNF growth. The fibers
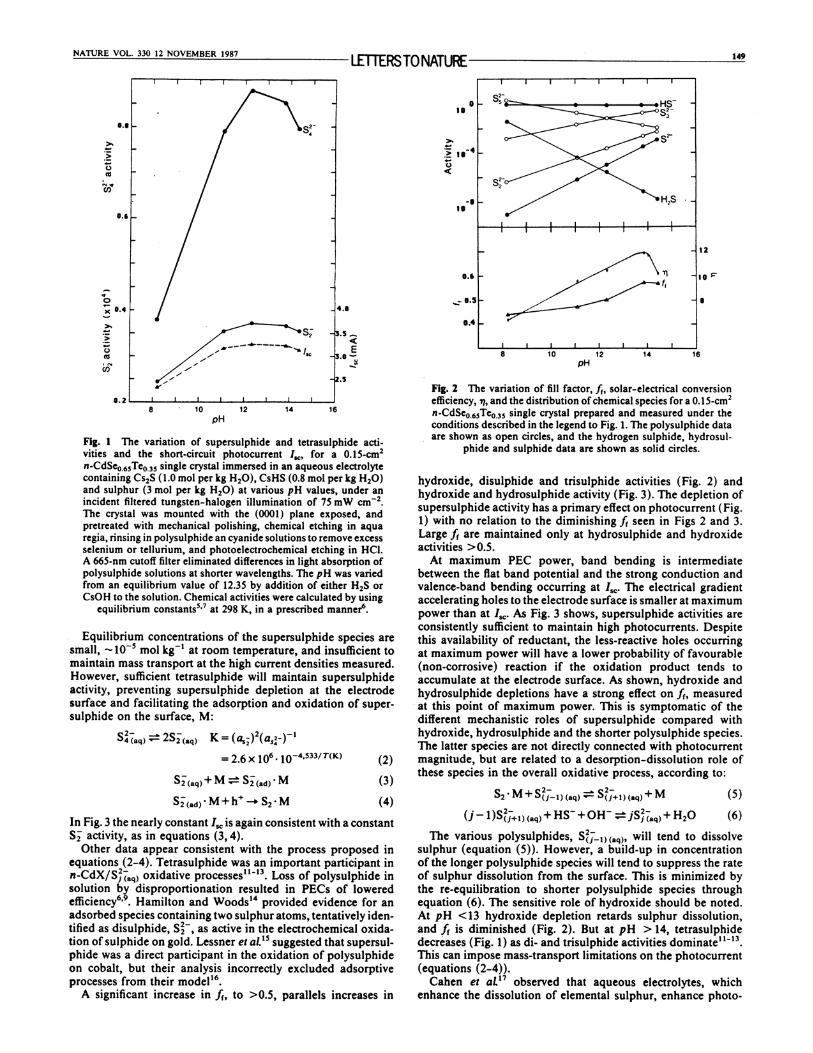
Figure 1. CO2 to carbon nanofibers formed at a a coiled galvanized steel wire cathode with a nickel anode during 0.05 A; then 1 A constant currentelectrolysis. No Li2O is added to the 730 °C molten Li2CO3 electrolyte. SEM F to H are shown at various magnifications of the product removedfrom the cooled, washed cathode. “A” shows the 10 cm2 coiled wire (0.12 cm diameter) cathode prior to electrolysis. The anode is the inner wall of a20 mL Ni crucible containing the electrolyte. “B−E” exemplify the typical maximum variation of observed cathodes subsequent to removal fromcarbonate electrolytes after a long (4 Ah) electrolysis in molten carbonate. Red arrows in SEM “H” indicate typical Ni nucleation sites. The bluearrow originates at one Ni site and moves along the CNF path. “I”: EDS composition mapping along the 6 μ blue arrow path shown in SEM “H”.
Nano Letters Letter
DOI: 10.1021/acs.nanolett.5b02427Nano Lett. XXXX, XXX, XXX−XXX
C
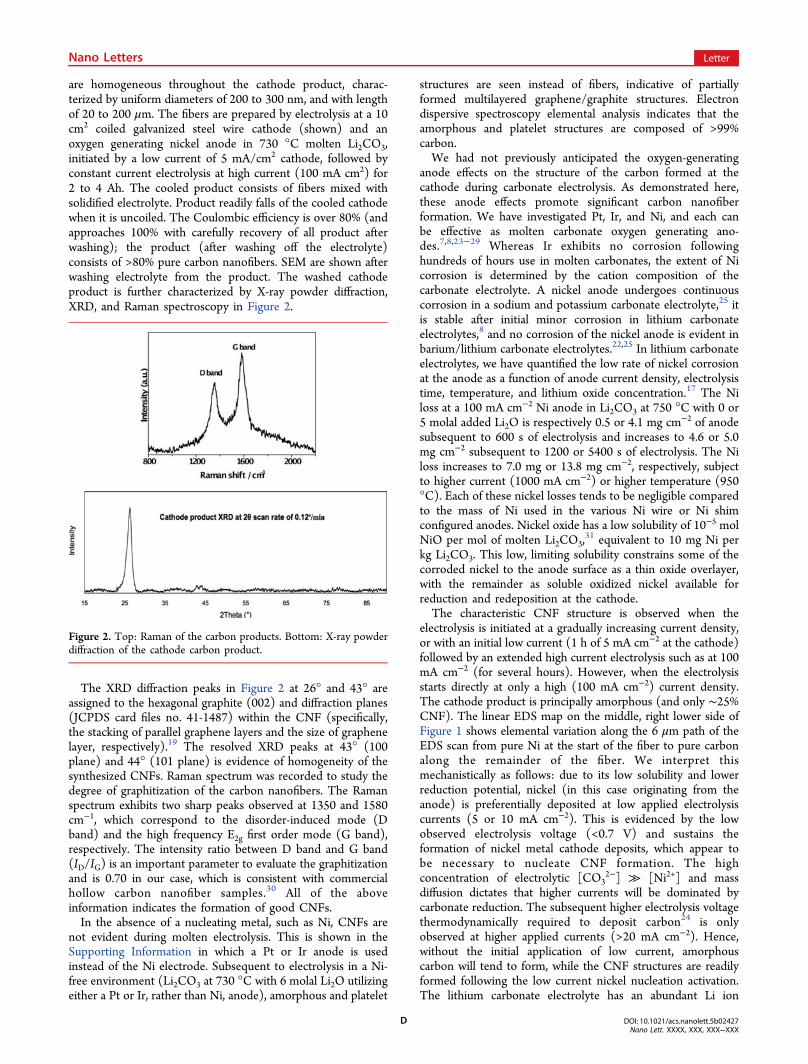
are homogeneous throughout the cathode product, charac-terized by uniform diameters of 200 to 300 nm, and with lengthof 20 to 200 μm. The fibers are prepared by electrolysis at a 10cm2 coiled galvanized steel wire cathode (shown) and anoxygen generating nickel anode in 730 °C molten Li2CO3,initiated by a low current of 5 mA/cm2 cathode, followed byconstant current electrolysis at high current (100 mA cm2) for2 to 4 Ah. The cooled product consists of fibers mixed withsolidified electrolyte. Product readily falls of the cooled cathodewhen it is uncoiled. The Coulombic efficiency is over 80% (andapproaches 100% with carefully recovery of all product afterwashing); the product (after washing off the electrolyte)consists of >80% pure carbon nanofibers. SEM are shown afterwashing electrolyte from the product. The washed cathodeproduct is further characterized by X-ray powder diffraction,XRD, and Raman spectroscopy in Figure 2.
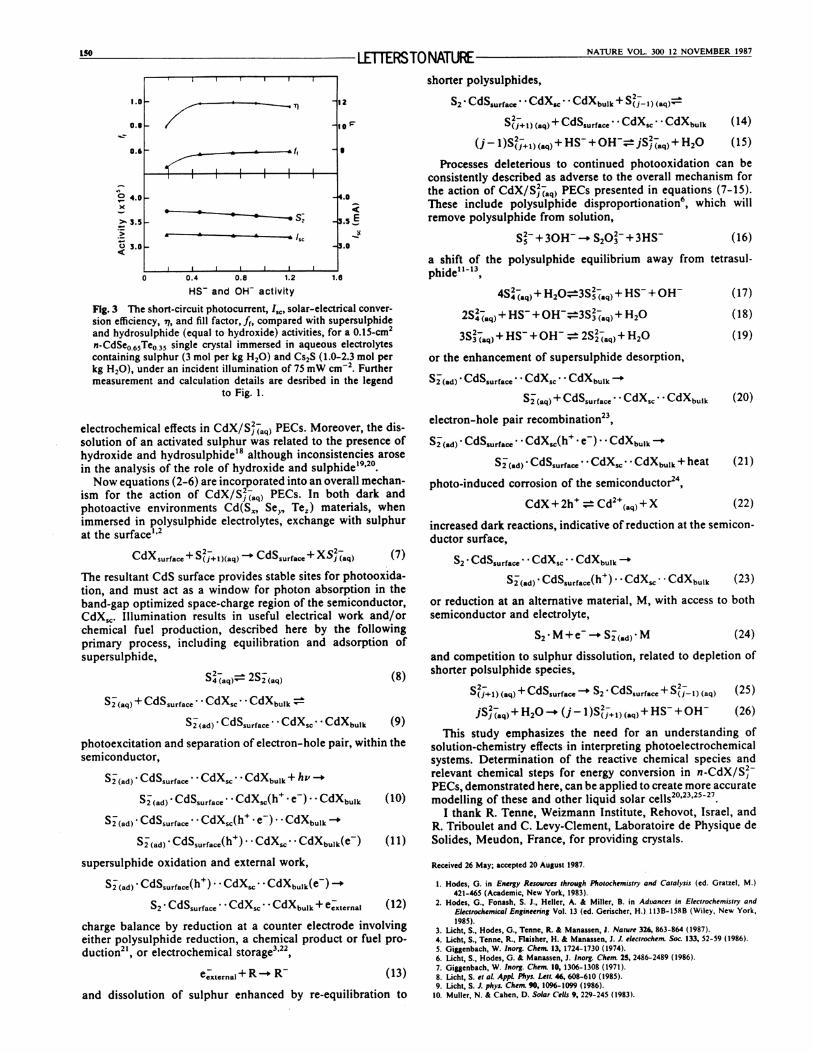
The XRD diffraction peaks in Figure 2 at 26° and 43° areassigned to the hexagonal graphite (002) and diffraction planes(JCPDS card files no. 41-1487) within the CNF (specifically,the stacking of parallel graphene layers and the size of graphenelayer, respectively).19 The resolved XRD peaks at 43° (100plane) and 44° (101 plane) is evidence of homogeneity of thesynthesized CNFs. Raman spectrum was recorded to study thedegree of graphitization of the carbon nanofibers. The Ramanspectrum exhibits two sharp peaks observed at 1350 and 1580cm−1, which correspond to the disorder-induced mode (Dband) and the high frequency E2g first order mode (G band),respectively. The intensity ratio between D band and G band(ID/IG) is an important parameter to evaluate the graphitizationand is 0.70 in our case, which is consistent with commercialhollow carbon nanofiber samples.30 All of the aboveinformation indicates the formation of good CNFs.In the absence of a nucleating metal, such as Ni, CNFs are
not evident during molten electrolysis. This is shown in theSupporting Information in which a Pt or Ir anode is usedinstead of the Ni electrode. Subsequent to electrolysis in a Ni-free environment (Li2CO3 at 730 °C with 6 molal Li2O utilizingeither a Pt or Ir, rather than Ni, anode), amorphous and platelet
structures are seen instead of fibers, indicative of partiallyformed multilayered graphene/graphite structures. Electrondispersive spectroscopy elemental analysis indicates that theamorphous and platelet structures are composed of >99%carbon.We had not previously anticipated the oxygen-generating
anode effects on the structure of the carbon formed at thecathode during carbonate electrolysis. As demonstrated here,these anode effects promote significant carbon nanofiberformation. We have investigated Pt, Ir, and Ni, and each canbe effective as molten carbonate oxygen generating ano-des.7,8,23−29 Whereas Ir exhibits no corrosion followinghundreds of hours use in molten carbonates, the extent of Nicorrosion is determined by the cation composition of thecarbonate electrolyte. A nickel anode undergoes continuouscorrosion in a sodium and potassium carbonate electrolyte,25 itis stable after initial minor corrosion in lithium carbonateelectrolytes,8 and no corrosion of the nickel anode is evident inbarium/lithium carbonate electrolytes.22,25 In lithium carbonateelectrolytes, we have quantified the low rate of nickel corrosionat the anode as a function of anode current density, electrolysistime, temperature, and lithium oxide concentration.17 The Niloss at a 100 mA cm−2 Ni anode in Li2CO3 at 750 °C with 0 or5 molal added Li2O is respectively 0.5 or 4.1 mg cm−2 of anodesubsequent to 600 s of electrolysis and increases to 4.6 or 5.0mg cm−2 subsequent to 1200 or 5400 s of electrolysis. The Niloss increases to 7.0 mg or 13.8 mg cm−2, respectively, subjectto higher current (1000 mA cm−2) or higher temperature (950°C). Each of these nickel losses tends to be negligible comparedto the mass of Ni used in the various Ni wire or Ni shimconfigured anodes. Nickel oxide has a low solubility of 10−5 molNiO per mol of molten Li2CO3,
31 equivalent to 10 mg Ni perkg Li2CO3. This low, limiting solubility constrains some of thecorroded nickel to the anode surface as a thin oxide overlayer,with the remainder as soluble oxidized nickel available forreduction and redeposition at the cathode.The characteristic CNF structure is observed when the
electrolysis is initiated at a gradually increasing current density,or with an initial low current (1 h of 5 mA cm−2 at the cathode)followed by an extended high current electrolysis such as at 100mA cm−2 (for several hours). However, when the electrolysisstarts directly at only a high (100 mA cm−2) current density.The cathode product is principally amorphous (and only ∼25%CNF). The linear EDS map on the middle, right lower side ofFigure 1 shows elemental variation along the 6 μm path of theEDS scan from pure Ni at the start of the fiber to pure carbonalong the remainder of the fiber. We interpret thismechanistically as follows: due to its low solubility and lowerreduction potential, nickel (in this case originating from theanode) is preferentially deposited at low applied electrolysiscurrents (5 or 10 mA cm−2). This is evidenced by the lowobserved electrolysis voltage (<0.7 V) and sustains theformation of nickel metal cathode deposits, which appear tobe necessary to nucleate CNF formation. The highconcentration of electrolytic [CO3
2−] ≫ [Ni2+] and massdiffusion dictates that higher currents will be dominated bycarbonate reduction. The subsequent higher electrolysis voltagethermodynamically required to deposit carbon24 is onlyobserved at higher applied currents (>20 mA cm−2). Hence,without the initial application of low current, amorphouscarbon will tend to form, while the CNF structures are readilyformed following the low current nickel nucleation activation.The lithium carbonate electrolyte has an abundant Li ion
Figure 2. Top: Raman of the carbon products. Bottom: X-ray powderdiffraction of the cathode carbon product.
Nano Letters Letter
DOI: 10.1021/acs.nanolett.5b02427Nano Lett. XXXX, XXX, XXX−XXX
D
concentration, and we see no evidence that Li ion intercalationinterferes with the CNF growth. Li intercalation can still occur,but not the explosive exfoliation of the graphite associated withlithium metal deposition (the applied potential is too low toallow Li metal growth).Rather than the straight, uniform diameter CNFs observed in
Figure 1, when Li2O is added to the molten Li2CO3 electrolytethe electrolysis product is a proliferation of tangled CNFs of awide variety of diameters as shown in the SupportingInformation. Evidently, high concentrations of oxide localizedin the CNF formation region leads to torsional effects(tangling).The cathode consists of galvanized (zinc coated steel. This
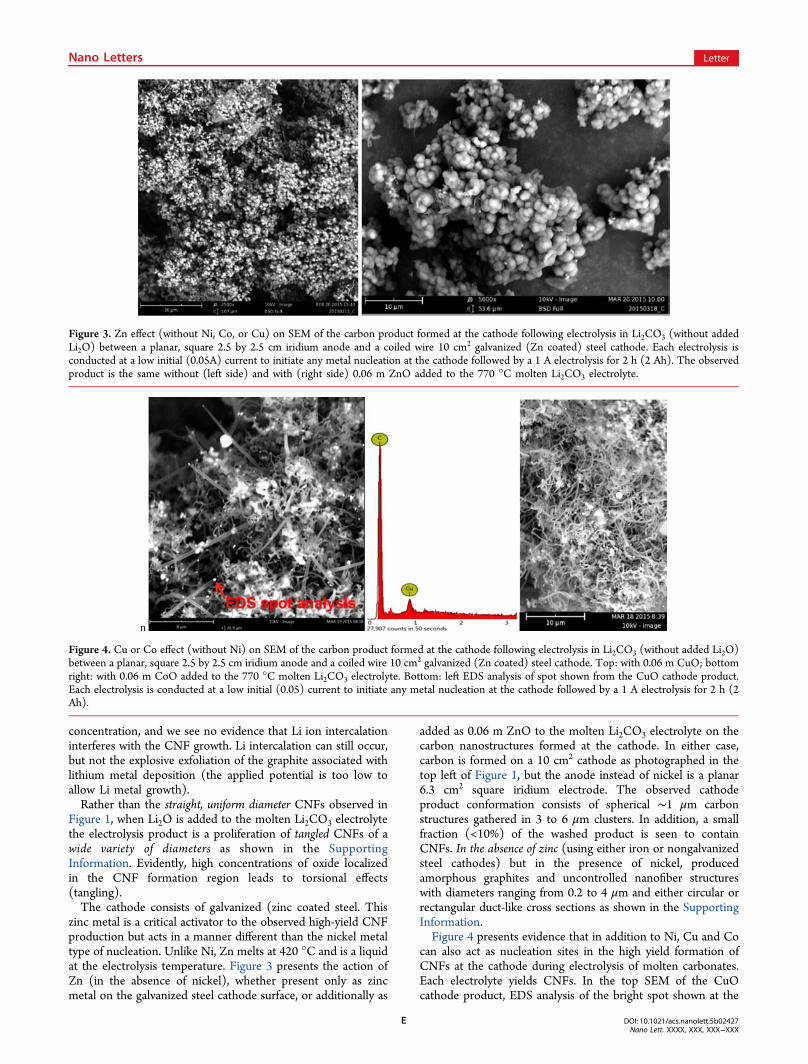
zinc metal is a critical activator to the observed high-yield CNFproduction but acts in a manner different than the nickel metaltype of nucleation. Unlike Ni, Zn melts at 420 °C and is a liquidat the electrolysis temperature. Figure 3 presents the action ofZn (in the absence of nickel), whether present only as zincmetal on the galvanized steel cathode surface, or additionally as
added as 0.06 m ZnO to the molten Li2CO3 electrolyte on thecarbon nanostructures formed at the cathode. In either case,carbon is formed on a 10 cm2 cathode as photographed in thetop left of Figure 1, but the anode instead of nickel is a planar6.3 cm2 square iridium electrode. The observed cathodeproduct conformation consists of spherical ∼1 μm carbonstructures gathered in 3 to 6 μm clusters. In addition, a smallfraction (<10%) of the washed product is seen to containCNFs. In the absence of zinc (using either iron or nongalvanizedsteel cathodes) but in the presence of nickel, producedamorphous graphites and uncontrolled nanofiber structureswith diameters ranging from 0.2 to 4 μm and either circular orrectangular duct-like cross sections as shown in the SupportingInformation.Figure 4 presents evidence that in addition to Ni, Cu and Co
can also act as nucleation sites in the high yield formation ofCNFs at the cathode during electrolysis of molten carbonates.Each electrolyte yields CNFs. In the top SEM of the CuOcathode product, EDS analysis of the bright spot shown at the
Figure 3. Zn effect (without Ni, Co, or Cu) on SEM of the carbon product formed at the cathode following electrolysis in Li2CO3 (without addedLi2O) between a planar, square 2.5 by 2.5 cm iridium anode and a coiled wire 10 cm2 galvanized (Zn coated) steel cathode. Each electrolysis isconducted at a low initial (0.05A) current to initiate any metal nucleation at the cathode followed by a 1 A electrolysis for 2 h (2 Ah). The observedproduct is the same without (left side) and with (right side) 0.06 m ZnO added to the 770 °C molten Li2CO3 electrolyte.
Figure 4. Cu or Co effect (without Ni) on SEM of the carbon product formed at the cathode following electrolysis in Li2CO3 (without added Li2O)between a planar, square 2.5 by 2.5 cm iridium anode and a coiled wire 10 cm2 galvanized (Zn coated) steel cathode. Top: with 0.06 m CuO; bottomright: with 0.06 m CoO added to the 770 °C molten Li2CO3 electrolyte. Bottom: left EDS analysis of spot shown from the CuO cathode product.Each electrolysis is conducted at a low initial (0.05) current to initiate any metal nucleation at the cathode followed by a 1 A electrolysis for 2 h (2Ah).
Nano Letters Letter
DOI: 10.1021/acs.nanolett.5b02427Nano Lett. XXXX, XXX, XXX−XXX
E
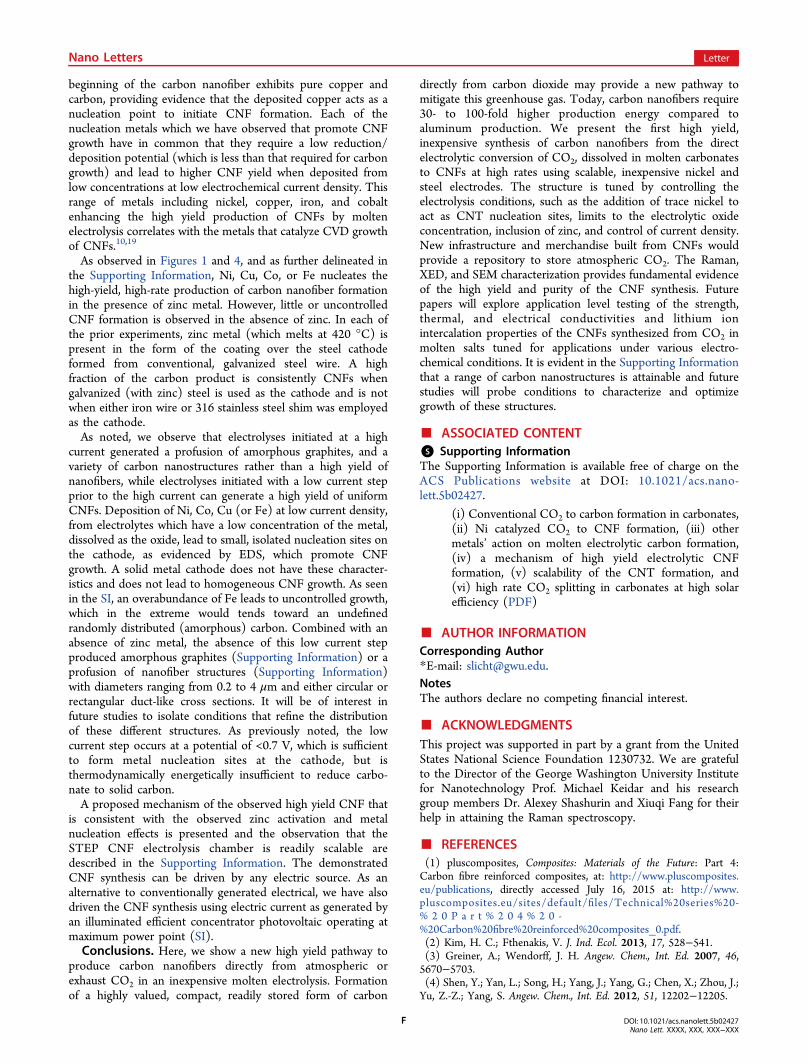
beginning of the carbon nanofiber exhibits pure copper andcarbon, providing evidence that the deposited copper acts as anucleation point to initiate CNF formation. Each of thenucleation metals which we have observed that promote CNFgrowth have in common that they require a low reduction/deposition potential (which is less than that required for carbongrowth) and lead to higher CNF yield when deposited fromlow concentrations at low electrochemical current density. Thisrange of metals including nickel, copper, iron, and cobaltenhancing the high yield production of CNFs by moltenelectrolysis correlates with the metals that catalyze CVD growthof CNFs.10,19
As observed in Figures 1 and 4, and as further delineated inthe Supporting Information, Ni, Cu, Co, or Fe nucleates thehigh-yield, high-rate production of carbon nanofiber formationin the presence of zinc metal. However, little or uncontrolledCNF formation is observed in the absence of zinc. In each ofthe prior experiments, zinc metal (which melts at 420 °C) ispresent in the form of the coating over the steel cathodeformed from conventional, galvanized steel wire. A highfraction of the carbon product is consistently CNFs whengalvanized (with zinc) steel is used as the cathode and is notwhen either iron wire or 316 stainless steel shim was employedas the cathode.As noted, we observe that electrolyses initiated at a high
current generated a profusion of amorphous graphites, and avariety of carbon nanostructures rather than a high yield ofnanofibers, while electrolyses initiated with a low current stepprior to the high current can generate a high yield of uniformCNFs. Deposition of Ni, Co, Cu (or Fe) at low current density,from electrolytes which have a low concentration of the metal,dissolved as the oxide, lead to small, isolated nucleation sites onthe cathode, as evidenced by EDS, which promote CNFgrowth. A solid metal cathode does not have these character-istics and does not lead to homogeneous CNF growth. As seenin the SI, an overabundance of Fe leads to uncontrolled growth,which in the extreme would tends toward an undefinedrandomly distributed (amorphous) carbon. Combined with anabsence of zinc metal, the absence of this low current stepproduced amorphous graphites (Supporting Information) or aprofusion of nanofiber structures (Supporting Information)with diameters ranging from 0.2 to 4 μm and either circular orrectangular duct-like cross sections. It will be of interest infuture studies to isolate conditions that refine the distributionof these different structures. As previously noted, the lowcurrent step occurs at a potential of <0.7 V, which is sufficientto form metal nucleation sites at the cathode, but isthermodynamically energetically insufficient to reduce carbo-nate to solid carbon.A proposed mechanism of the observed high yield CNF that
is consistent with the observed zinc activation and metalnucleation effects is presented and the observation that theSTEP CNF electrolysis chamber is readily scalable aredescribed in the Supporting Information. The demonstratedCNF synthesis can be driven by any electric source. As analternative to conventionally generated electrical, we have alsodriven the CNF synthesis using electric current as generated byan illuminated efficient concentrator photovoltaic operating atmaximum power point (SI).Conclusions. Here, we show a new high yield pathway to
produce carbon nanofibers directly from atmospheric orexhaust CO2 in an inexpensive molten electrolysis. Formationof a highly valued, compact, readily stored form of carbon
directly from carbon dioxide may provide a new pathway tomitigate this greenhouse gas. Today, carbon nanofibers require30- to 100-fold higher production energy compared toaluminum production. We present the first high yield,inexpensive synthesis of carbon nanofibers from the directelectrolytic conversion of CO2, dissolved in molten carbonatesto CNFs at high rates using scalable, inexpensive nickel andsteel electrodes. The structure is tuned by controlling theelectrolysis conditions, such as the addition of trace nickel toact as CNT nucleation sites, limits to the electrolytic oxideconcentration, inclusion of zinc, and control of current density.New infrastructure and merchandise built from CNFs wouldprovide a repository to store atmospheric CO2. The Raman,XED, and SEM characterization provides fundamental evidenceof the high yield and purity of the CNF synthesis. Futurepapers will explore application level testing of the strength,thermal, and electrical conductivities and lithium ionintercalation properties of the CNFs synthesized from CO2 inmolten salts tuned for applications under various electro-chemical conditions. It is evident in the Supporting Informationthat a range of carbon nanostructures is attainable and futurestudies will probe conditions to characterize and optimizegrowth of these structures.
■ ASSOCIATED CONTENT*S Supporting InformationThe Supporting Information is available free of charge on theACS Publications website at DOI: 10.1021/acs.nano-lett.5b02427.
(i) Conventional CO2 to carbon formation in carbonates,(ii) Ni catalyzed CO2 to CNF formation, (iii) othermetals’ action on molten electrolytic carbon formation,(iv) a mechanism of high yield electrolytic CNFformation, (v) scalability of the CNT formation, and(vi) high rate CO2 splitting in carbonates at high solarefficiency (PDF)
■ AUTHOR INFORMATIONCorresponding Author*E-mail: [email protected] authors declare no competing financial interest.
■ ACKNOWLEDGMENTSThis project was supported in part by a grant from the UnitedStates National Science Foundation 1230732. We are gratefulto the Director of the George Washington University Institutefor Nanotechnology Prof. Michael Keidar and his researchgroup members Dr. Alexey Shashurin and Xiuqi Fang for theirhelp in attaining the Raman spectroscopy.
■ REFERENCES(1) pluscomposites, Composites: Materials of the Future: Part 4:Carbon fibre reinforced composites, at: http://www.pluscomposites.eu/publications, directly accessed July 16, 2015 at: http://www.pluscomposites.eu/sites/default/files/Technical%20series%20-% 2 0 P a r t % 2 0 4 % 2 0 -%20Carbon%20fibre%20reinforced%20composites_0.pdf.(2) Kim, H. C.; Fthenakis, V. J. Ind. Ecol. 2013, 17, 528−541.(3) Greiner, A.; Wendorff, J. H. Angew. Chem., Int. Ed. 2007, 46,5670−5703.(4) Shen, Y.; Yan, L.; Song, H.; Yang, J.; Yang, G.; Chen, X.; Zhou, J.;Yu, Z.-Z.; Yang, S. Angew. Chem., Int. Ed. 2012, 51, 12202−12205.
Nano Letters Letter
DOI: 10.1021/acs.nanolett.5b02427Nano Lett. XXXX, XXX, XXX−XXX
F
(5) Hsu, W. K.; Hare, J. P.; Terrones, H. W.; Kroto; Walton, D. R. M.Nature 1995, 377, 687.(6) Kodumagulla, A.; Varanasi, V.; Perace, R. C.; Wu, W. C.; Hensley,D. K.; Tracey, J. B.; McKnight, T. E.; Melechko, A. V. Nanomater.Nanotechnol. 2014, 115, 1464−1473.(7) Vander Wal, R. L.; Hall, L. J. Chem. Phys. Lett. 2001, 349, 178−184.(8) Mahammadunnisa, S.; Reddy, E. L.; Ray, D.; Subrahmanyam, C.;Whitehead, J. C. Int. J. Greenhouse Gas Control 2013, 16, 361−363.(9) Iijima, S. Nature 1991, 354, 56−58.(10) Ebbesen, T. W.; Ajayan, P. M. Nature 1992, 358, 220−222.(11) Lallave, M.; Bedia, J.; Ruiz-Rosas, R.; Rodríguez-Mirasol, J.;Cordero, T.; Otero, J. C.; Marquez, M.; Barrero, A.; Loscertales, I. G.Adv. Mater. 2007, 19, 4292−4296.(12) Wu, A.-Y.; Li, C.; Liang, H.-W.; Chen, J.-F.; Yu, S.-H. Angew.Chem., Int. Ed. 2013, 52, 2925−2929.(13) Dimitrov, A. T. Maced. J. Chem. Chem. Eng. 2009, 28, 111−118.(14) Bardgett, R. D.; Putten, W. H. Nature 2014, 515, 505−511.(15) Giosan, L.; Syvitski, J.; Constantinescu, J.; Day, J. Nature 2014,516, 31−33.(16) Licht, S. Adv. Mater. 2011, 23, 5592−5612.(17) Licht, S.; Wu, H. J. Phys. Chem. C 2011, 115, 25138−25157.(18) Licht, S.; Wu, H.; Hettige, C.; Wang, B.; Lau, J.; Asercion, J.;Stuart, J. Chem. Commun. 2012, 48, 6019−6021.(19) Song, Y.; Youn, J.; Gutowski, T. Composites, Part A 2009, 40,1257−1265.(20) Burkhardt, Z. Chem. 1870, 13, 213. as referenced in Haber, F.;Tolloczko, St. Z. Anorg. Chem. 1904, 41, 407.(21) Dimitrov, A.; Tomova, A.; Grozdanov, A.; Popovski, O.;Paunovic, P. J. Solid State Electrochem. 2013, 17, 399−407.(22) Novoselova, I.; Oliinyk, N.; Voronina, F.; Volkov, S.; Konchits,A.; Yanchuk, I.; Yefanov, V.; Kolesnik, S.; Darpets, M. Phys. E 2008,40, 2231−2237.(23) Licht, S.; Cui, B.; Wang, B. J. CO2 Utilization 2013, 2, 58−63.(24) Licht, S.; Wang, B.; Ghosh, S.; Ayub, H.; Jiang, D.; Ganley, J. J.Phys. Chem. Lett. 2010, 1, 2363−2368.(25) Li, F.-F.; Liu, S.; Cui, B.; Lau, J.; Stuart, J.; Wang, B.; Licht, S.Adv. Energy Materials 2015, 5, 1−7.(26) Licht, S. J. Phys. Chem. C 2009, 113, 16283−16292.(27) Cui, B.; Licht, S. Green Chem. 2013, 15, 881−884.(28) Licht, S.; Wang, B. Chem. Commun. 2010, 46, 7004−7006;2011, 47, 3081−3083.(29) Licht, S.; Cui, B.; Wang, B.; Li, F.-F.; Lau, J.; Liu, S. Science2014, 345, 637−640.(30) Saravanan, M.; Sennu, P.; Ganesan, M.; Ambalavan, S. J.Electrochem. Soc. 2012, 160, A70−A76.(31) Ota, K.; Mitshuima, S.; Kato, S.; Asano, S.; Yoshitake, H.;Kaymiya, N. J. Electrochem. Soc. 1992, 139, 667−671.
Nano Letters Letter
DOI: 10.1021/acs.nanolett.5b02427Nano Lett. XXXX, XXX, XXX−XXX
G
1
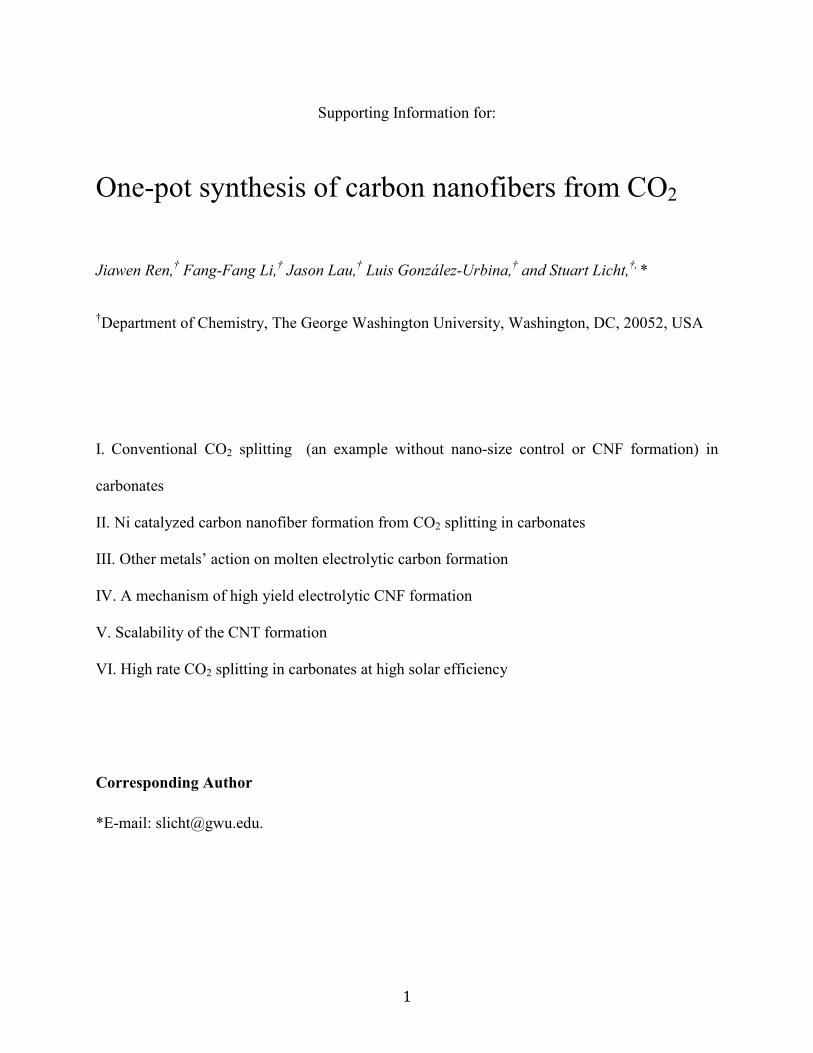
Supporting Information for:
One-pot synthesis of carbon nanofibers from CO2
Jiawen Ren,† Fang-Fang Li,† Jason Lau,† Luis González-Urbina,† and Stuart Licht,†, *
†Department of Chemistry, The George Washington University, Washington, DC, 20052, USA
I. Conventional CO2 splitting (an example without nano-size control or CNF formation) in
carbonates
II. Ni catalyzed carbon nanofiber formation from CO2 splitting in carbonates
III. Other metals’ action on molten electrolytic carbon formation
IV. A mechanism of high yield electrolytic CNF formation
V. Scalability of the CNT formation
VI. High rate CO2 splitting in carbonates at high solar efficiency
Corresponding Author
*E-mail: [email protected].
2
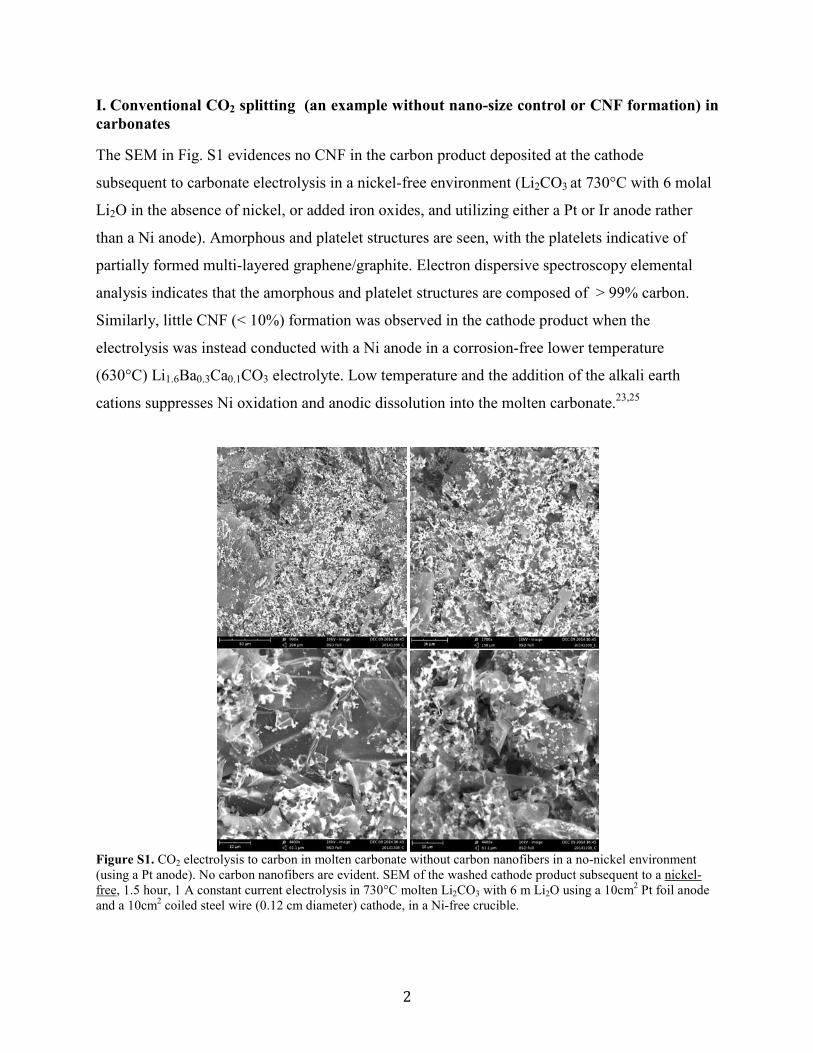
I. Conventional CO2 splitting (an example without nano-size control or CNF formation) in carbonates
The SEM in Fig. S1 evidences no CNF in the carbon product deposited at the cathode
subsequent to carbonate electrolysis in a nickel-free environment (Li2CO3 at 730°C with 6 molal
Li2O in the absence of nickel, or added iron oxides, and utilizing either a Pt or Ir anode rather
than a Ni anode). Amorphous and platelet structures are seen, with the platelets indicative of
partially formed multi-layered graphene/graphite. Electron dispersive spectroscopy elemental
analysis indicates that the amorphous and platelet structures are composed of > 99% carbon.
Similarly, little CNF (< 10%) formation was observed in the cathode product when the
electrolysis was instead conducted with a Ni anode in a corrosion-free lower temperature
(630°C) Li1.6Ba0.3Ca0.1CO3 electrolyte. Low temperature and the addition of the alkali earth
cations suppresses Ni oxidation and anodic dissolution into the molten carbonate.23,25
Figure S1. CO2 electrolysis to carbon in molten carbonate without carbon nanofibers in a no-nickel environment (using a Pt anode). No carbon nanofibers are evident. SEM of the washed cathode product subsequent to a nickel-free, 1.5 hour, 1 A constant current electrolysis in 730°C molten Li2CO3 with 6 m Li2O using a 10cm2 Pt foil anode and a 10cm2 coiled steel wire (0.12 cm diameter) cathode, in a Ni-free crucible.
3
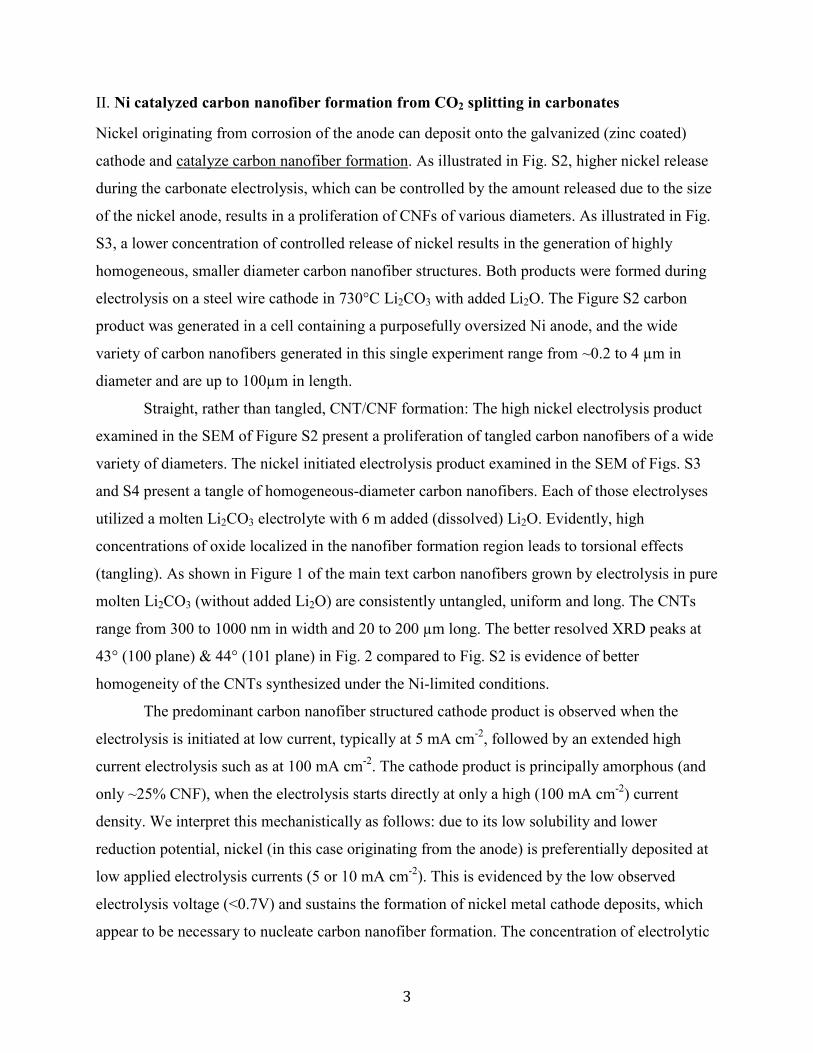
II. Ni catalyzed carbon nanofiber formation from CO2 splitting in carbonates
Nickel originating from corrosion of the anode can deposit onto the galvanized (zinc coated)
cathode and catalyze carbon nanofiber formation. As illustrated in Fig. S2, higher nickel release
during the carbonate electrolysis, which can be controlled by the amount released due to the size
of the nickel anode, results in a proliferation of CNFs of various diameters. As illustrated in Fig.
S3, a lower concentration of controlled release of nickel results in the generation of highly
homogeneous, smaller diameter carbon nanofiber structures. Both products were formed during
electrolysis on a steel wire cathode in 730°C Li2CO3 with added Li2O. The Figure S2 carbon
product was generated in a cell containing a purposefully oversized Ni anode, and the wide
variety of carbon nanofibers generated in this single experiment range from ~0.2 to 4 µm in
diameter and are up to 100µm in length.
Straight, rather than tangled, CNT/CNF formation: The high nickel electrolysis product
examined in the SEM of Figure S2 present a proliferation of tangled carbon nanofibers of a wide
variety of diameters. The nickel initiated electrolysis product examined in the SEM of Figs. S3
and S4 present a tangle of homogeneous-diameter carbon nanofibers. Each of those electrolyses
utilized a molten Li2CO3 electrolyte with 6 m added (dissolved) Li2O. Evidently, high
concentrations of oxide localized in the nanofiber formation region leads to torsional effects
(tangling). As shown in Figure 1 of the main text carbon nanofibers grown by electrolysis in pure
molten Li2CO3 (without added Li2O) are consistently untangled, uniform and long. The CNTs
range from 300 to 1000 nm in width and 20 to 200 µm long. The better resolved XRD peaks at
43° (100 plane) & 44° (101 plane) in Fig. 2 compared to Fig. S2 is evidence of better
homogeneity of the CNTs synthesized under the Ni-limited conditions.
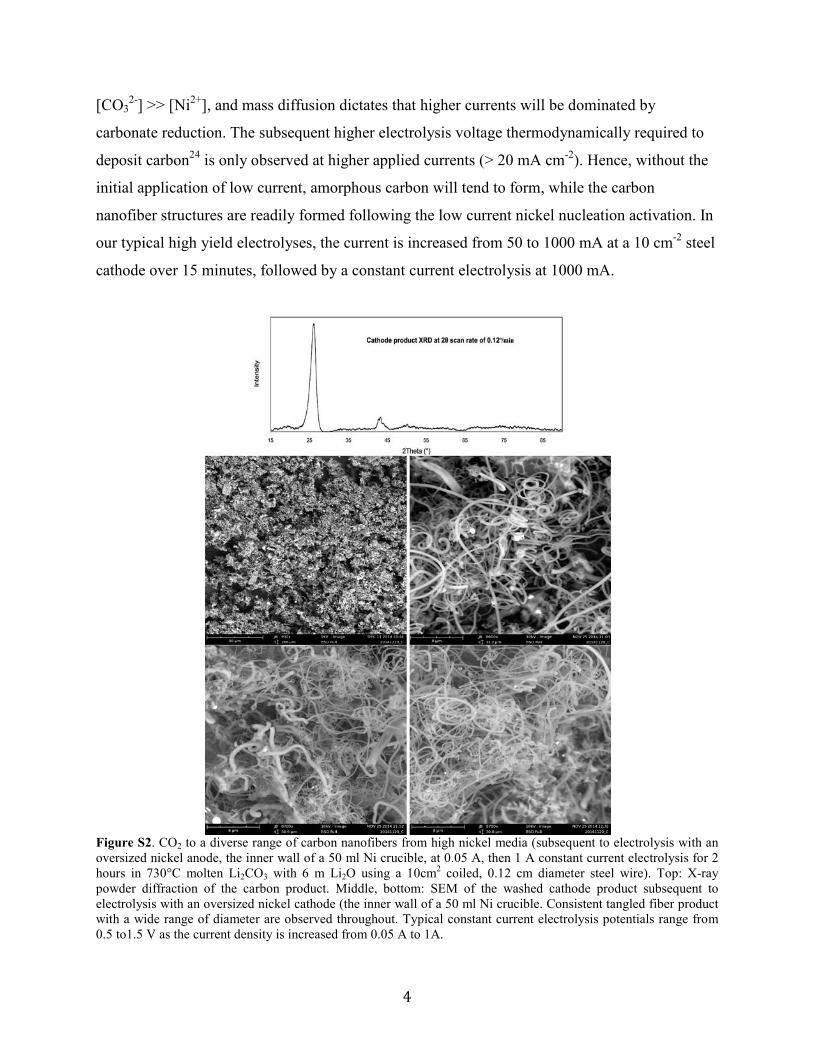
The predominant carbon nanofiber structured cathode product is observed when the
electrolysis is initiated at low current, typically at 5 mA cm-2, followed by an extended high
current electrolysis such as at 100 mA cm-2. The cathode product is principally amorphous (and
only ~25% CNF), when the electrolysis starts directly at only a high (100 mA cm-2) current
density. We interpret this mechanistically as follows: due to its low solubility and lower
reduction potential, nickel (in this case originating from the anode) is preferentially deposited at
low applied electrolysis currents (5 or 10 mA cm-2). This is evidenced by the low observed
electrolysis voltage (<0.7V) and sustains the formation of nickel metal cathode deposits, which
appear to be necessary to nucleate carbon nanofiber formation. The concentration of electrolytic
4
[CO32-] >> [Ni2+], and mass diffusion dictates that higher currents will be dominated by
carbonate reduction. The subsequent higher electrolysis voltage thermodynamically required to
deposit carbon24 is only observed at higher applied currents (> 20 mA cm-2). Hence, without the
initial application of low current, amorphous carbon will tend to form, while the carbon
nanofiber structures are readily formed following the low current nickel nucleation activation. In
our typical high yield electrolyses, the current is increased from 50 to 1000 mA at a 10 cm-2 steel
cathode over 15 minutes, followed by a constant current electrolysis at 1000 mA.
Figure S2. CO2 to a diverse range of carbon nanofibers from high nickel media (subsequent to electrolysis with an oversized nickel anode, the inner wall of a 50 ml Ni crucible, at 0.05 A, then 1 A constant current electrolysis for 2 hours in 730°C molten Li2CO3 with 6 m Li2O using a 10cm2 coiled, 0.12 cm diameter steel wire). Top: X-ray powder diffraction of the carbon product. Middle, bottom: SEM of the washed cathode product subsequent to electrolysis with an oversized nickel cathode (the inner wall of a 50 ml Ni crucible. Consistent tangled fiber product with a wide range of diameter are observed throughout. Typical constant current electrolysis potentials range from 0.5 to1.5 V as the current density is increased from 0.05 A to 1A.
5
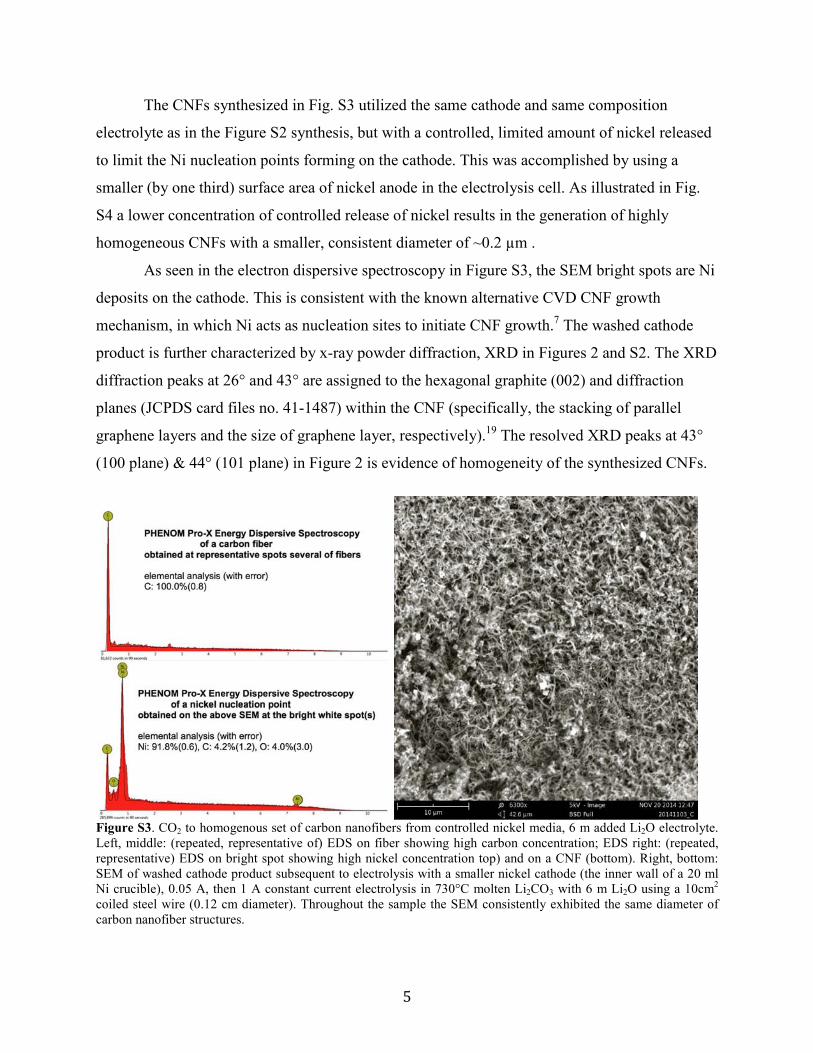
The CNFs synthesized in Fig. S3 utilized the same cathode and same composition
electrolyte as in the Figure S2 synthesis, but with a controlled, limited amount of nickel released
to limit the Ni nucleation points forming on the cathode. This was accomplished by using a
smaller (by one third) surface area of nickel anode in the electrolysis cell. As illustrated in Fig.
S4 a lower concentration of controlled release of nickel results in the generation of highly
homogeneous CNFs with a smaller, consistent diameter of ~0.2 µm .
As seen in the electron dispersive spectroscopy in Figure S3, the SEM bright spots are Ni
deposits on the cathode. This is consistent with the known alternative CVD CNF growth
mechanism, in which Ni acts as nucleation sites to initiate CNF growth.7 The washed cathode
product is further characterized by x-ray powder diffraction, XRD in Figures 2 and S2. The XRD
diffraction peaks at 26° and 43° are assigned to the hexagonal graphite (002) and diffraction
planes (JCPDS card files no. 41-1487) within the CNF (specifically, the stacking of parallel
graphene layers and the size of graphene layer, respectively).19 The resolved XRD peaks at 43°
(100 plane) & 44° (101 plane) in Figure 2 is evidence of homogeneity of the synthesized CNFs.
Figure S3. CO2 to homogenous set of carbon nanofibers from controlled nickel media, 6 m added Li2O electrolyte. Left, middle: (repeated, representative of) EDS on fiber showing high carbon concentration; EDS right: (repeated, representative) EDS on bright spot showing high nickel concentration top) and on a CNF (bottom). Right, bottom: SEM of washed cathode product subsequent to electrolysis with a smaller nickel cathode (the inner wall of a 20 ml Ni crucible), 0.05 A, then 1 A constant current electrolysis in 730°C molten Li2CO3 with 6 m Li2O using a 10cm2 coiled steel wire (0.12 cm diameter). Throughout the sample the SEM consistently exhibited the same diameter of carbon nanofiber structures.
6
III. Other metals’ action on molten electrolytic carbon formation
The action of metals other than nickel on carbon nanostructures formed in the cathode product
during electrolysis in molten carbonate is probed by (i) adding no Li2O to the molten carbonate
(ii) replacing the nickel anode with an iridium anode, and (iii) adding metal oxide to the
electrolyte. As previously described17 the iridium, while expensive, is extremely stable and
exhibits no evidence of corrosion, dissolution or cathodic redeposition (as measured by EDS of
the cathode) during extended use (hundreds of hours) as an anode in molten lithium carbonates
without added lithium oxide.
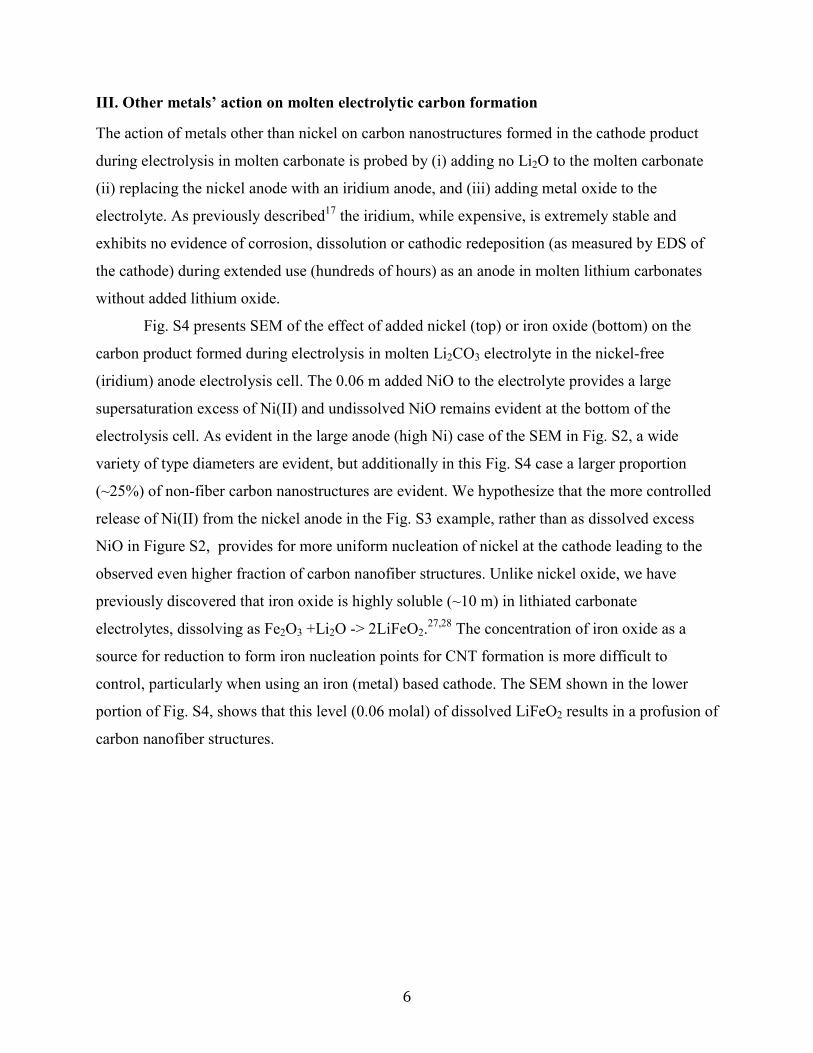
Fig. S4 presents SEM of the effect of added nickel (top) or iron oxide (bottom) on the
carbon product formed during electrolysis in molten Li2CO3 electrolyte in the nickel-free
(iridium) anode electrolysis cell. The 0.06 m added NiO to the electrolyte provides a large
supersaturation excess of Ni(II) and undissolved NiO remains evident at the bottom of the
electrolysis cell. As evident in the large anode (high Ni) case of the SEM in Fig. S2, a wide
variety of type diameters are evident, but additionally in this Fig. S4 case a larger proportion
(~25%) of non-fiber carbon nanostructures are evident. We hypothesize that the more controlled
release of Ni(II) from the nickel anode in the Fig. S3 example, rather than as dissolved excess
NiO in Figure S2, provides for more uniform nucleation of nickel at the cathode leading to the
observed even higher fraction of carbon nanofiber structures. Unlike nickel oxide, we have
previously discovered that iron oxide is highly soluble (~10 m) in lithiated carbonate
electrolytes, dissolving as Fe2O3 +Li2O -> 2LiFeO2.27,28 The concentration of iron oxide as a
source for reduction to form iron nucleation points for CNT formation is more difficult to
control, particularly when using an iron (metal) based cathode. The SEM shown in the lower
portion of Fig. S4, shows that this level (0.06 molal) of dissolved LiFeO2 results in a profusion of
carbon nanofiber structures.
7
Figure S4. Fe or Ni effect, added as the oxide to the electrolyte, on the SEM of the carbon product formed at the cathode following electrolysis in Li2CO3 (without added Li2O) between a planar, square 2.5 by 2.5 cm iridium anode and a coiled wire 10 cm2 galvanized (Zn coated) steel cathode. Top: with 0.06 m NiO; bottom: with 0.05 m LiFeO2 added to the 770°C molten Li2CO3 electrolyte. Each electrolysis is conducted at a low initial (0.05) current to initiate any metal nucleation at the cathode followed by a 1A electrolysis for 2 hours (2Ah).
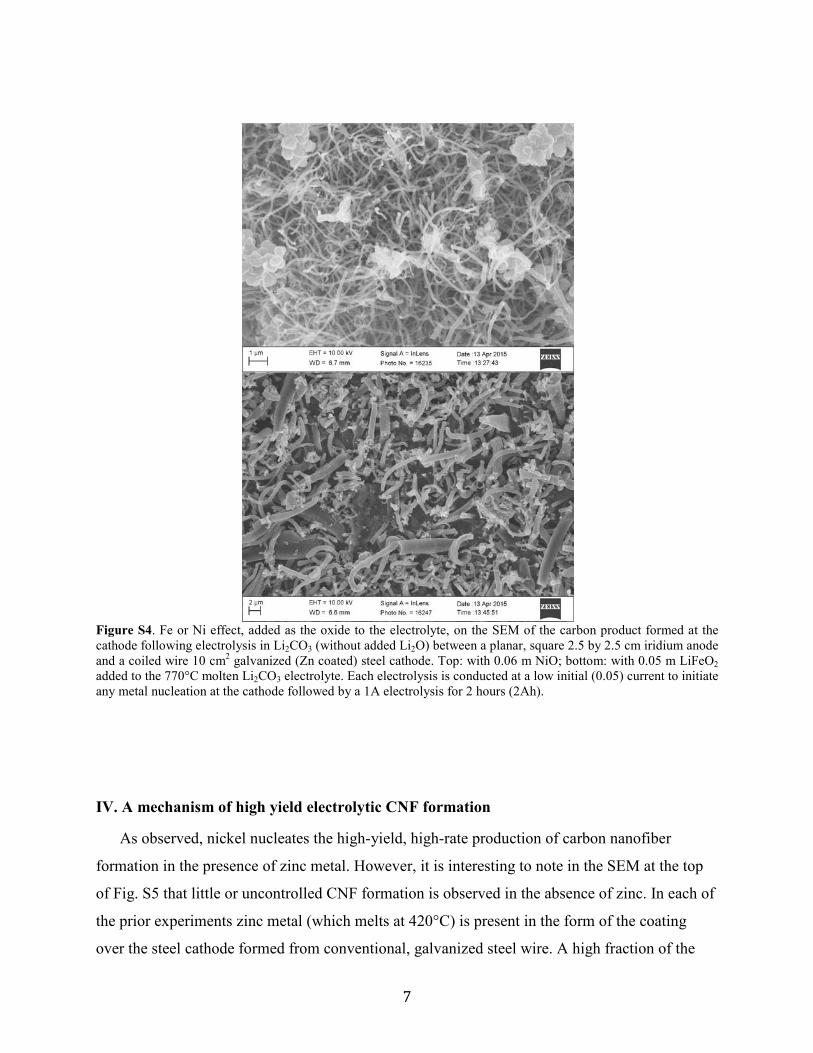
IV. A mechanism of high yield electrolytic CNF formation
As observed, nickel nucleates the high-yield, high-rate production of carbon nanofiber
formation in the presence of zinc metal. However, it is interesting to note in the SEM at the top
of Fig. S5 that little or uncontrolled CNF formation is observed in the absence of zinc. In each of
the prior experiments zinc metal (which melts at 420°C) is present in the form of the coating
over the steel cathode formed from conventional, galvanized steel wire. A high fraction of the
8
carbon product is consistently CNFs when galvanized (with zinc) steel is used as the cathode,
and is not when either iron wire, or 316 stainless steel shim was employed as the cathode.
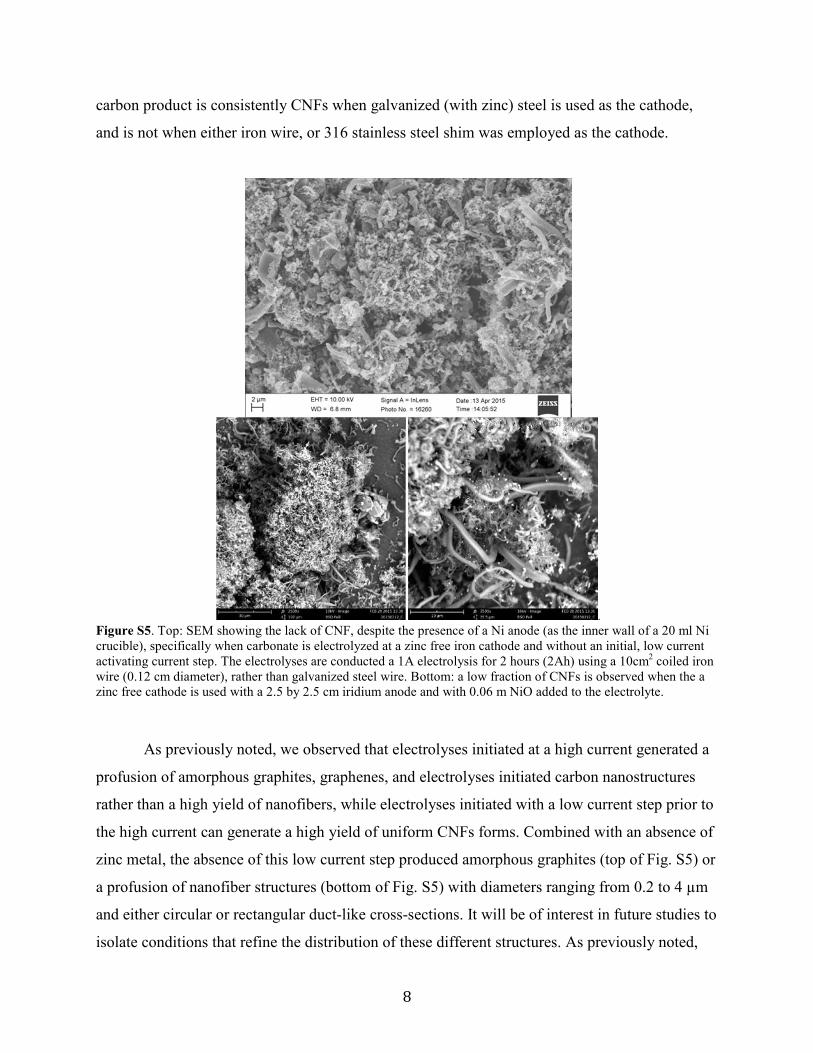
. Figure S5. Top: SEM showing the lack of CNF, despite the presence of a Ni anode (as the inner wall of a 20 ml Ni crucible), specifically when carbonate is electrolyzed at a zinc free iron cathode and without an initial, low current activating current step. The electrolyses are conducted a 1A electrolysis for 2 hours (2Ah) using a 10cm2 coiled iron wire (0.12 cm diameter), rather than galvanized steel wire. Bottom: a low fraction of CNFs is observed when the a zinc free cathode is used with a 2.5 by 2.5 cm iridium anode and with 0.06 m NiO added to the electrolyte.
As previously noted, we observed that electrolyses initiated at a high current generated a
profusion of amorphous graphites, graphenes, and electrolyses initiated carbon nanostructures
rather than a high yield of nanofibers, while electrolyses initiated with a low current step prior to
the high current can generate a high yield of uniform CNFs forms. Combined with an absence of
zinc metal, the absence of this low current step produced amorphous graphites (top of Fig. S5) or
a profusion of nanofiber structures (bottom of Fig. S5) with diameters ranging from 0.2 to 4 µm
and either circular or rectangular duct-like cross-sections. It will be of interest in future studies to
isolate conditions that refine the distribution of these different structures. As previously noted,
9
the low current step occurs at a potential of < 0.7V, which is sufficient to form metal nucleation
sites at the cathode, but is thermodynamically energetically insufficient to reduce carbonate to
solid carbon.
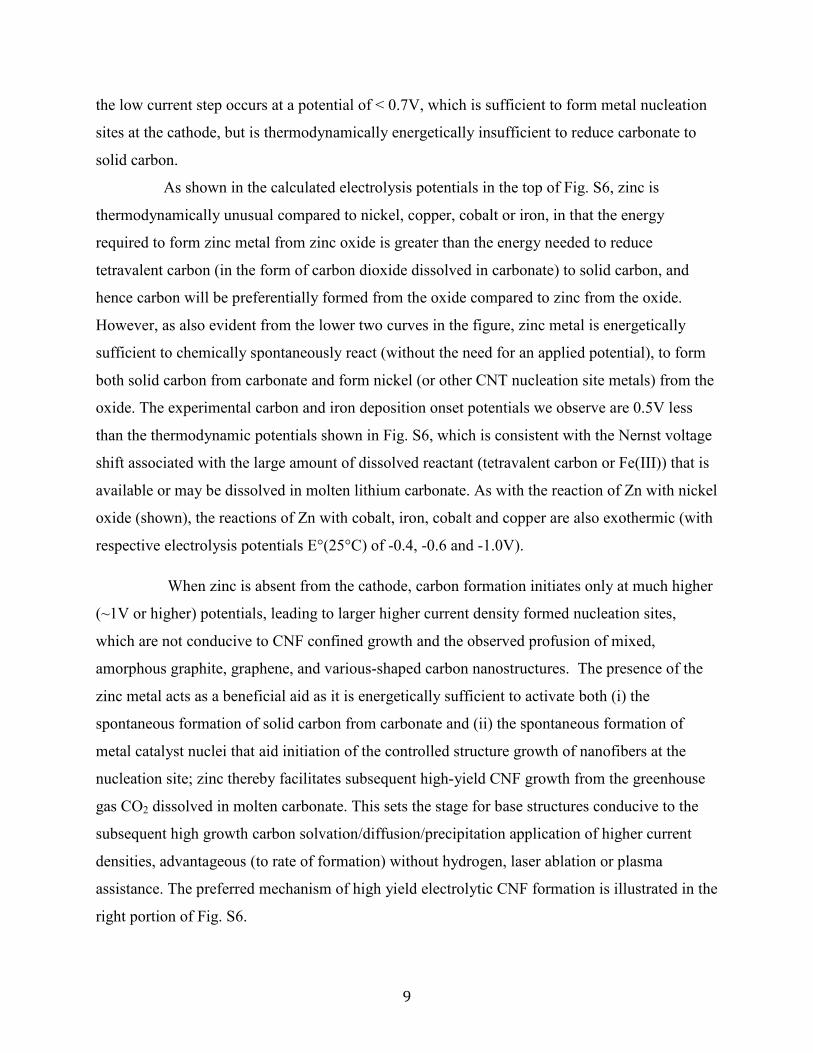
As shown in the calculated electrolysis potentials in the top of Fig. S6, zinc is
thermodynamically unusual compared to nickel, copper, cobalt or iron, in that the energy
required to form zinc metal from zinc oxide is greater than the energy needed to reduce
tetravalent carbon (in the form of carbon dioxide dissolved in carbonate) to solid carbon, and
hence carbon will be preferentially formed from the oxide compared to zinc from the oxide.
However, as also evident from the lower two curves in the figure, zinc metal is energetically
sufficient to chemically spontaneously react (without the need for an applied potential), to form
both solid carbon from carbonate and form nickel (or other CNT nucleation site metals) from the
oxide. The experimental carbon and iron deposition onset potentials we observe are 0.5V less
than the thermodynamic potentials shown in Fig. S6, which is consistent with the Nernst voltage
shift associated with the large amount of dissolved reactant (tetravalent carbon or Fe(III)) that is
available or may be dissolved in molten lithium carbonate. As with the reaction of Zn with nickel
oxide (shown), the reactions of Zn with cobalt, iron, cobalt and copper are also exothermic (with
respective electrolysis potentials E°(25°C) of -0.4, -0.6 and -1.0V). When zinc is absent from the cathode, carbon formation initiates only at much higher
(~1V or higher) potentials, leading to larger higher current density formed nucleation sites,
which are not conducive to CNF confined growth and the observed profusion of mixed,
amorphous graphite, graphene, and various-shaped carbon nanostructures. The presence of the
zinc metal acts as a beneficial aid as it is energetically sufficient to activate both (i) the
spontaneous formation of solid carbon from carbonate and (ii) the spontaneous formation of
metal catalyst nuclei that aid initiation of the controlled structure growth of nanofibers at the
nucleation site; zinc thereby facilitates subsequent high-yield CNF growth from the greenhouse
gas CO2 dissolved in molten carbonate. This sets the stage for base structures conducive to the
subsequent high growth carbon solvation/diffusion/precipitation application of higher current
densities, advantageous (to rate of formation) without hydrogen, laser ablation or plasma
assistance. The preferred mechanism of high yield electrolytic CNF formation is illustrated in the
right portion of Fig. S6.
10
Figure S6. Left: Calculated (using thermochemical data from: reference I. Barin, Thermochemical Data of Pure Substances, part II, VCH publishers, New York, 1989; ibid, part I, 3rd edition, 1995.) electrolysis potentials relevant to the high yield electrolytic formation of CNTs from molten carbonates. The reduction of iron is shown as calculated from conventional hematite, Fe2O3; calculated rest potentials for the lithium soluble form, LiFeO2 or magnetite Fe3O4 of iron oxide are similar (1.4V and 1.3V respectively at 25°C) and exhibit similar endothermic trends with increasing temperature. Right: Electrolytic CNT growth mechanisms; A: High voltage electrolysis of alkali metals followed by exfoliation and alkali intercalation into a solid carbon electrode; B: in lieu of solid carbon, spontaneous absorption of CO2 into molten carbonate as a low voltage & greenhouse gas source of carbon; C: Lower voltage reduction of lithium carbonate; D: metal catalyst, such as nickel (shown), cobalt or iron nucleation of an assortment of carbons (including CNTs) at the cathode. E: Zn metal assisted deposition of catalyst and initial carbon to generate a high-yield of electrolytic CNTs.
11
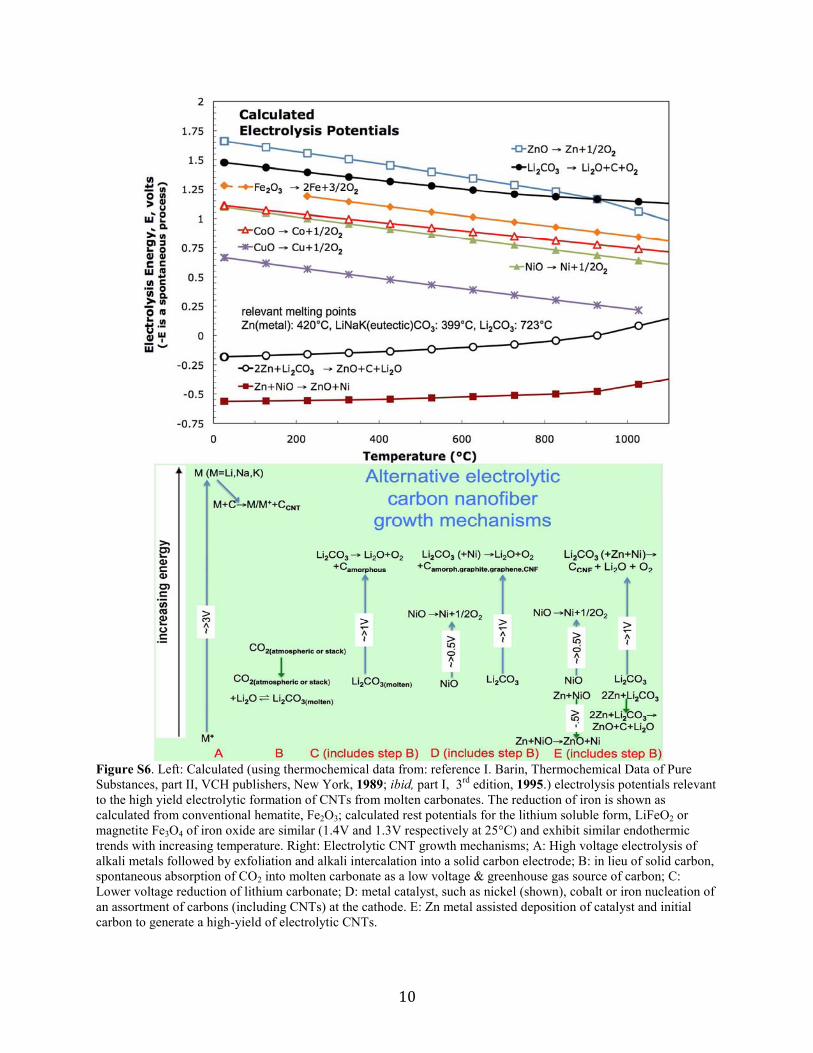
V. Scalability of the CNT formation
The STEP CNF electrolysis chamber is readily scalable (Fig. S7); we have scaled from 1A to
100A using 300 cm2 (shown) and electrode cells driven with a Xantrex XTR 0-100 A DC power
supply, which scale the smaller cells both in lower carbon splitting potentials (1-1.5 V) and high
(80-100 %) 4 electron coulombic efficiency of carbon product formation. The larger cells use a
cylindrical galvanized steel cylinder as a cathode sandwiched within concentric, cylindrical
nickel anode anodes, and as shown a hammer to separate the product from the cathode. Note
that whereas 1A generates 0.1 gram of carbon per hour, the 100 A generates 10 g/h. We are
currently preparing for a 660A test of a further scaled up 800 cm2 cell.
Figure S7. Scaled-up electrolysis chamber splitting CO2 operated at 100 amp. Driven with a Xantrex XTR 0-100 A DC power supply, 1.5V, and approaching 100% coulombic efficiency of the 4 electron reduction to carbon.
12
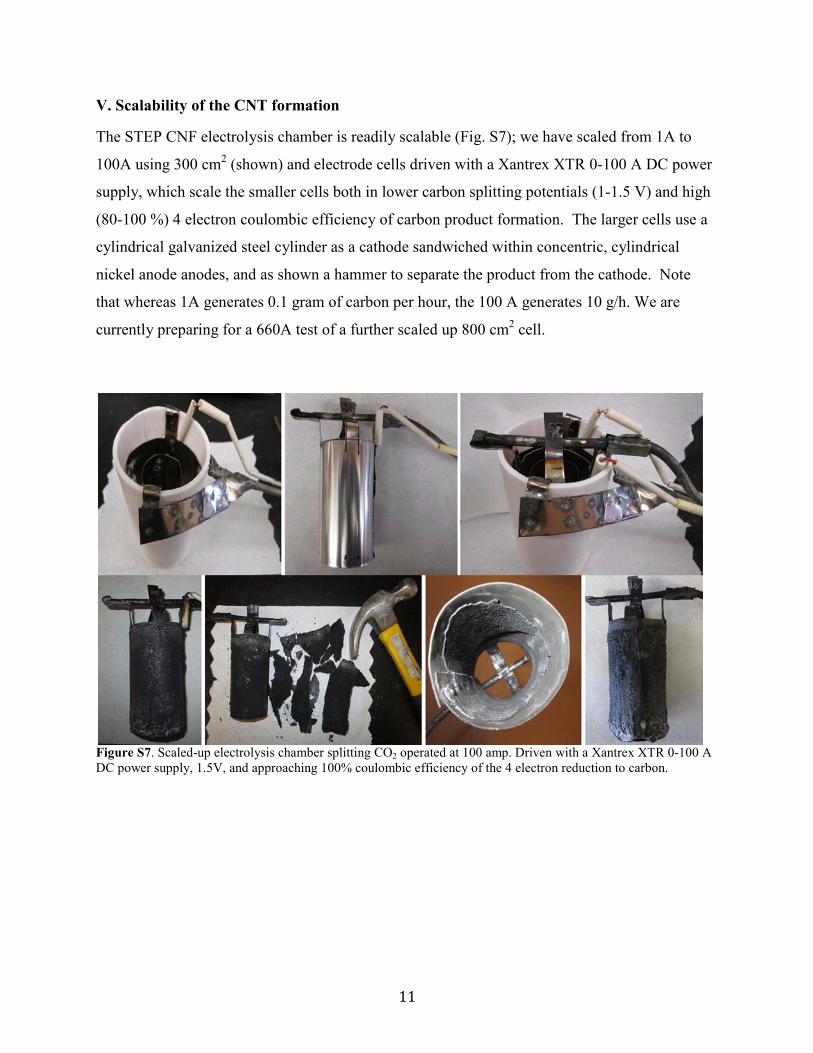
VI. High rate CO2 splitting in carbonates at high solar efficiency
Figure S8. Concentrator photovoltaic driving CNF synthesis. Driven with a Xantrex XTR 0-100 A DC power supply, 1.5V, and approaching 100% coulombic efficiency of the 4 electron reduction to carbon.
The demonstrated CNF synthesis can be driven by any electric source. As an alternative
to conventionally generated electrical, we have also driven the synthesis using electric current as
generated by an illuminated efficient concentrator photovoltaic (CPV) operating at maximum
power point. We have previously heated CO2 as a reactant for the electrolysis cell by (i) initially
13
passing it over and under the CPV, and then (ii) heating it to the electrolysis temperature using
sub-band gap (infrared) thermal light split from concentrated sunlight (via a hot mirror) prior to
absorption by the CPV.16,24 In this study, to demonstrate the efficient solar synthesis of CNFs, we
use a previously characterized indoor solar simulator,29 and a 39% solar efficient CPV operating
at 550 suns concentration (Figure S8), which has a maximum power point voltage of 2.7 V to
drive two in-series (1.35V x 2) CNF electrolyzers at 2.3A. STEP CNFs are efficiently formed
from CO2 in air, using inexpensive Ni and steel electrodes at high solar efficiency.
Here, we show a new high yield pathway to produce carbon nanofibers directly from
atmospheric or exhaust CO2 in an inexpensive process. Such formation of a highly valued,
compact, readily stored form of carbon directly from carbon dioxide may provide a new pathway
to mitigate this greenhouse gas. Today, carbon nanofibers require 30- to 100-fold higher
production energy compared to aluminum production. We present the first high yield,
inexpensive synthesis of carbon nanofibers from the direct electrolytic conversion of CO2,
dissolved in molten carbonates to CNTs at high rates using scalable, inexpensive nickel and steel
electrodes. The structure is tuned by controlling the electrolysis conditions, such as the addition
of trace nickel to act as CNT nucleation sites, limits to the electrolytic oxide concentration,
inclusion of zinc, and control of current density. New infrastructure and merchandise built from
CNFs would provide a repository to store atmospheric CO2.
www.sciencemag.org/content/345/6197/637/suppl/DC1
Supplementary Materials for
Ammonia synthesis by N2 and steam electrolysis in molten hydroxide suspensions of nanoscale Fe2O3
S. Licht,* B. Cui, B. Wang, F.-F Li, J. Lau, S. Liu
*Corresponding author. E-mail: [email protected]
Published 8 August 2014, Science 345, 637 (2014) DOI: 10.1126/science.1254234
This PDF file includes
Materials and Methods Supplementary Text Figs. S1 to S5 Table S1 References
2
Supplementary Materials
Ammonia synthesis by N2 and steam electrolysis in molten hydroxide suspensions of nanoscale Fe2O3
Stuart Licht,1* Baochen Cui,1 Baohui Wang,1 Fang-Fang Li,1 Jason Lau,1 Shuzhi Liu1
Materials Anhydrous sodium hydroxide (Sigma-Aldrich S5881), potassium hydroxide (sigma-aldrich P1767, KOH•½H2O), cesium hydroxide (99.9% CsOH•1-2H2O Alfa-Aesar 13233) and lithium hydroxide (anhydrous, 98%, Acros Organics 37918) are combined to form various eutectic molten hydroxide electrolytes each with melting points < 300°. The pure anhydrous akali hydroxides each melt only at temperatures > 300°C; LiOH (Tmp = 462°C), NaOH (Tmp = 318°C), KOH (Tmp = 406°C), CsOH (Tmp = 339°C). Whereas, molar ratios of 0.3:0.7 LiOH/NaOH, 0.3:0.7 LiOH/KOH, 0.5:0.5 NaOH/KOH, 0.44:0.56 KOH/CsOH, respectively melt at 215°C, 225°C, 170°C and 195°C (22), and are even lower when hydrated hydroxide salts are used. Conventional microscopic (99.4%, JT Baker) or high surface area nanoscopic (20-40 nm particle, 30-60 m2/g AlfaAesar 45007, NanoArc; used lot L20Y042: Alfa Aesar Certificate of analysis, 99.9% iron oxide, 35 nm average particle size, 33 m2 g-1 BET) Fe2O3 are added to the molten hydroxide electrolyte to promote ammonia formation.
Gas input to the electrolysis chamber consisted of either A: wet (1) 99.999% nitrogen (ultra high purity nitrogen generator 3000 cc/min Dominick Hunter G2-110W), or (2) Ar, bubbled through double deionized water to water saturation at room temperature (2.6% water at 22°C), or (3) air bubbled through a 1 M KOH solution to remove carbon dioxide and saturate with water at room temperature, B: the dry gases. Gas flow was maintained at 4.1 ml min-1 in the 20 mA electrolyses and 111 ml min-1 in the 250 mA electrolyses. For mass balance the wet (water saturated) gases provide sufficient water (8x10⁻⁸ or 2x10⁻⁶ mol H2O/s, respectively) for the hydrogen generation component of the electrolysis and excess nitrogen. It is a challenge to design higher input gas flow rates into the current cell design, and the 2000 mA experiment is conducted with flow of 222 (and also a slow flow experiment of 2.2) ml min-1. The latter, 2000 mA slow flow 2.2 ml min-1 experiment constrains steam and nitrogen entering the cell and yields only 0.62 of the initial ammonia production rate of the fast flow experiment, and respectively after 4 or 6 hours exhibited an ammonia rate of only 13% or 5% of the initial two hour average rate. As described in the text, excluding either nitrogen or water from the cell decreased (zeroed) the ammonia output from the electrolysis cell. The electrolysis is conducted in a pure alumina crucible (AdValue, 99.6%). In the alumina crucible cell, the anode consists of a pure Ni (McMaster 200) shim cut to 10 cm2, the 10 cm2 Ni cathode consists of 200 mesh woven wire cloth (Alloy 400, Monel, McMaster 9225T361). This Monel cathode mesh is stable in the molten 200°C hydroxide, whereas 316 stainless steel mesh is observed to (slowly) react forming hydrogen. The electrodes are connected externally by spot welded Ni wire (99.5% Alfa Aesar 41361).
3
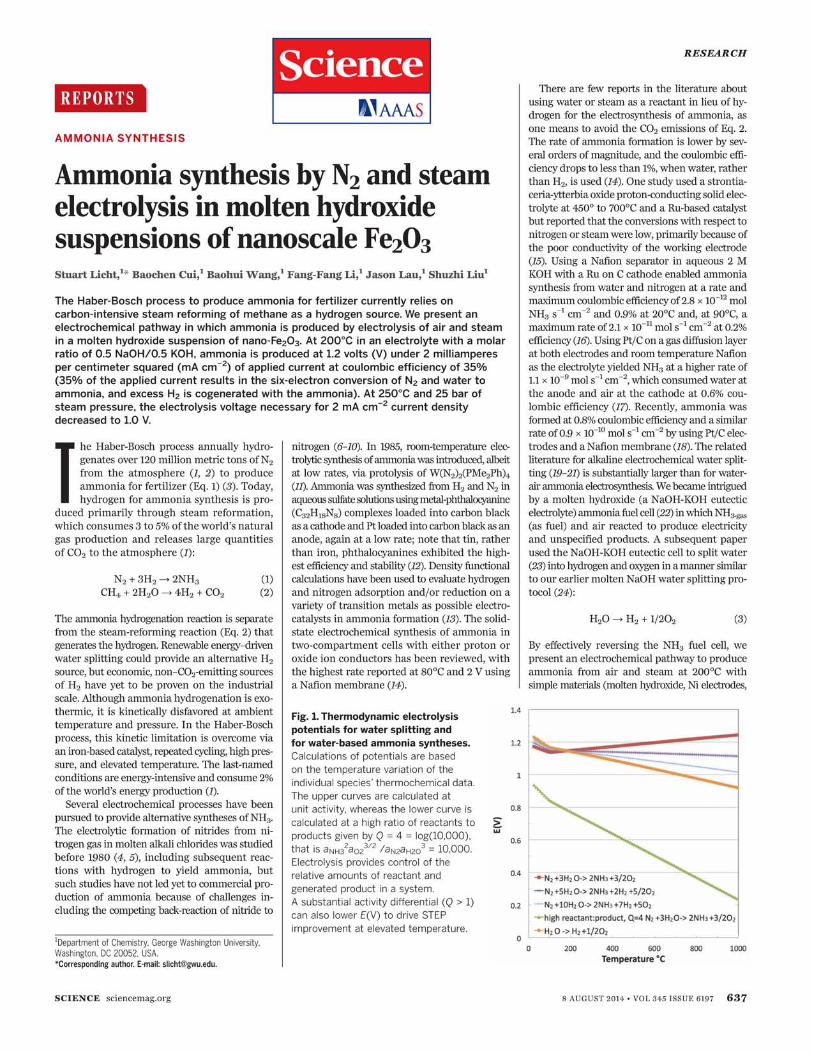
Calculations Thermodynamic electrolysis potentials for water splitting and ammonia synthesis with water are calculated from the unit activity thermochemical data for the individual species, using the convention to describe the positive potential necessary to drove a non spontaneous potential (19-21), from the reactions: ∑i=1 to x
riRi → ∑i=1 to y ciCi; using
ET = ∆G(T)/nF
and ∆G°(T) =∑i=1 to y ci(H°(Ci,T)-TS°(Ci,T)) - ∑i=1 to x
ri(H°(Ri,T)-TS°(Ri,T)).
Electrolysis provides control of the relative amounts of reactant and generated product in a system. A substantial activity differential can also drive STEP improvement at elevated temperature. The free energy and hence potential variation with activity, a, of the reaction is, ∆G(T,a)= ∆G°( T)+RTln(( ∏i=1 to x a(Ri)ri / ∏i=1 to y a(Ci)ci )
= ∆G°( T)+2.303RTQ; where Q = log(( ∏i=1 to x a(Ri)ri / ∏i=1 to y a(Ci)ci)
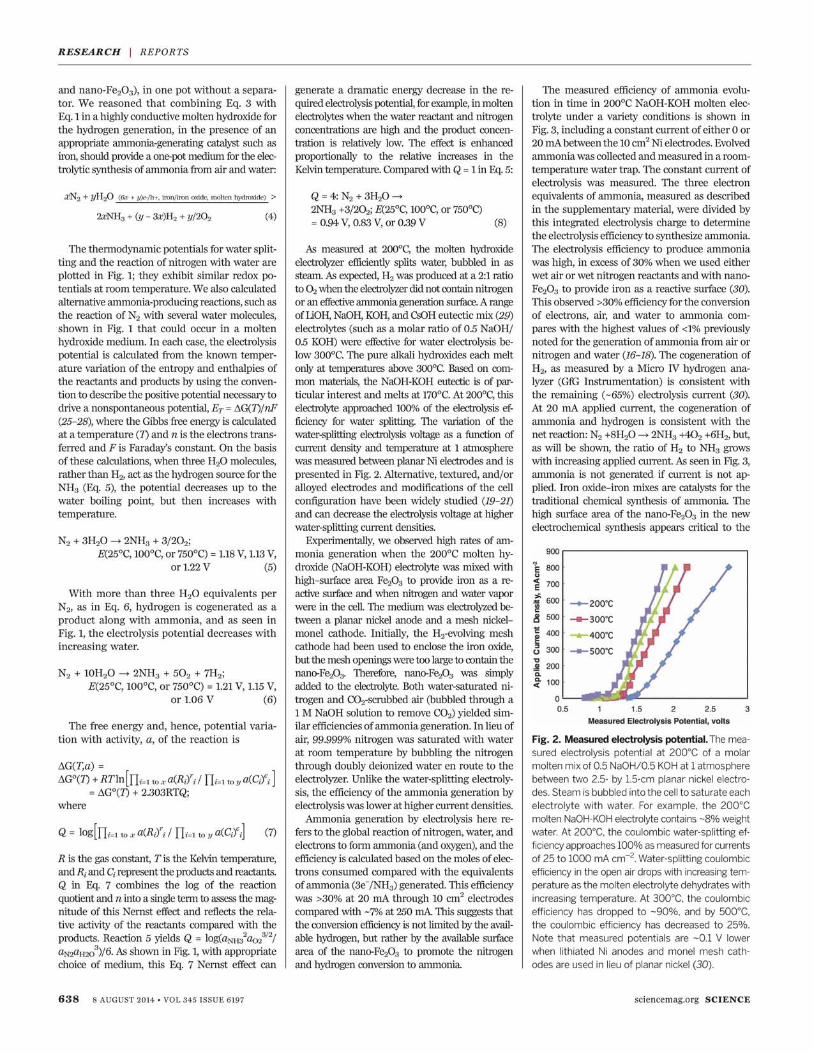
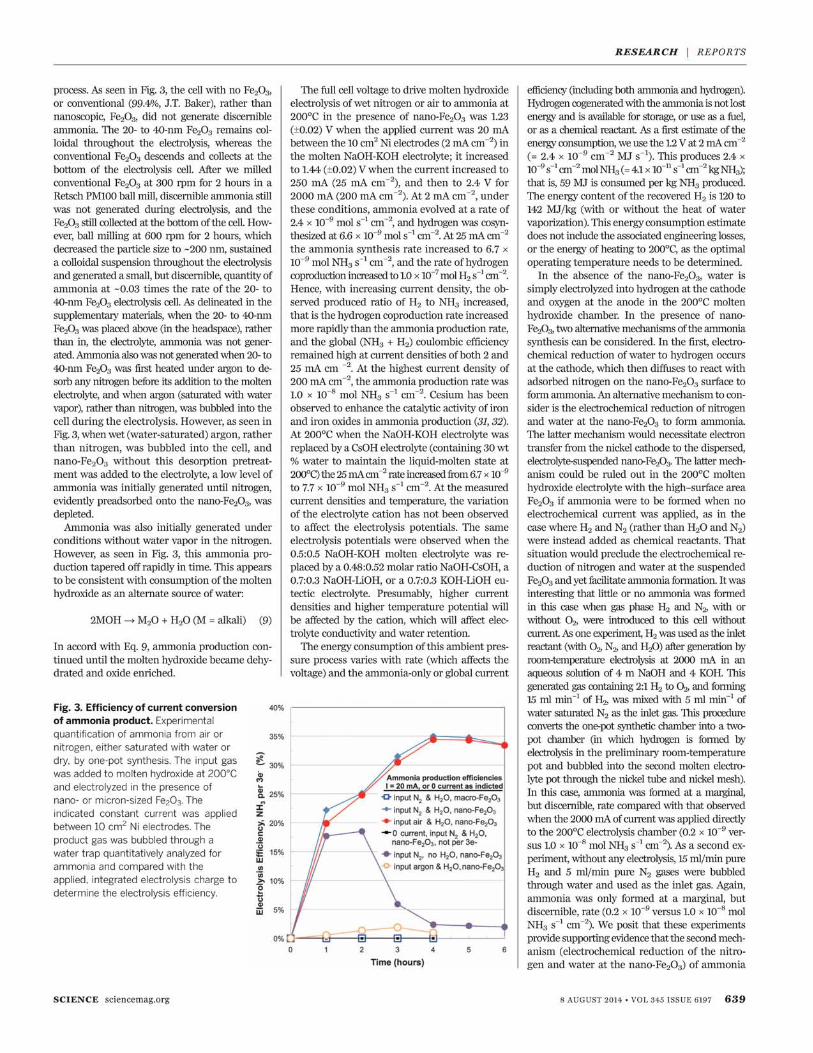
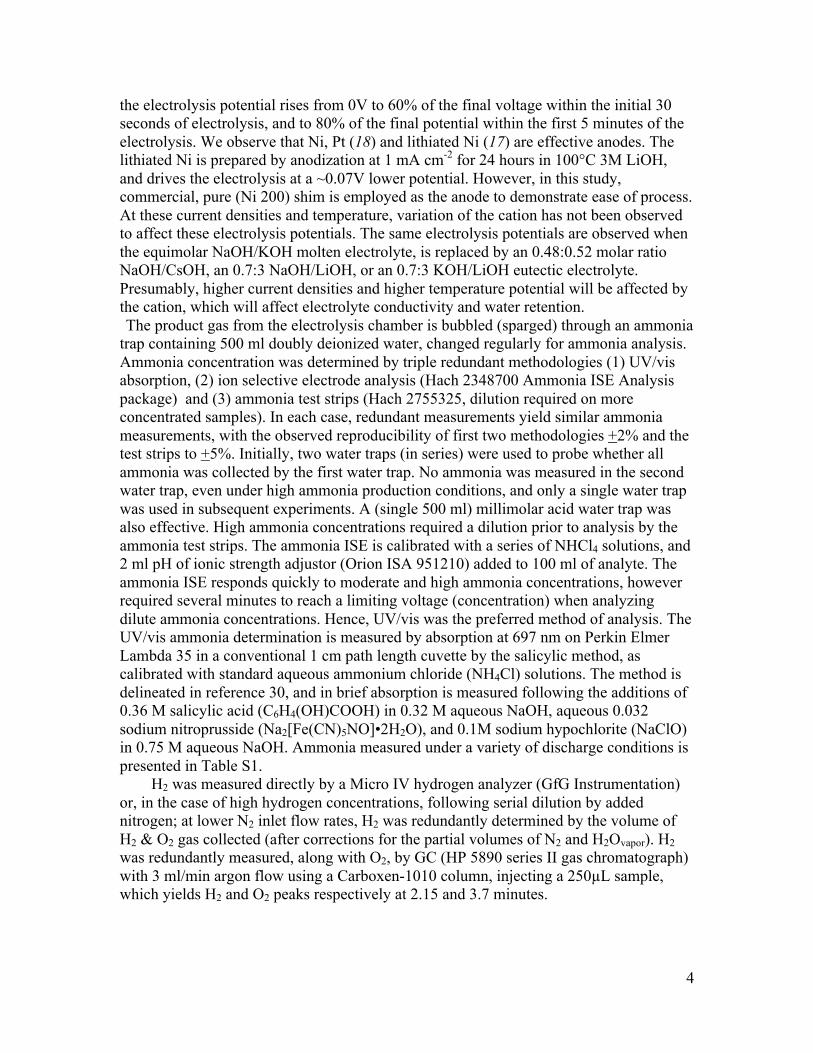
Methods A single chamber electrolysis configurations was used to electrolyze water saturated air or N2 to NH3. In addition a double chamber cell configuration was only used to confirm that ammonia was separately generated at the cathode and oxygen at the anode. The latter configuration is described in the subsequent paragraph. The single chamber configuration is photographed in Fig. S1. A stainless steel (316 alloy) cover is cut with a groove on the lower side that matches the circumference of the alumina crucible (100 ml alumina crucible Advent AL-2100). The cover to crucible seal is gas-leak free when the groove is filled with a high temperature adhesive (Resbond 907 heavy grade adhesive) and the cover is compressed to the crucible by four outer bolts through the cover and a bottom plate as seen in the figure. 0.25” Inconel (McMaster 89865K) or alumina tubes (McMaster 8746K) pass through the cover into the electrolyzer, and are gas-leak free when sealed with the Resbond 907. The middle alumina tube becomes the outlet gas exit, which is bubbled through an ammonia trap (described below). The anode connecting wire seen on the left is in an alumina tube. The inconnel tube, seen on the right side, functions as both the cathode electrical connection and as the gas inlet. Either N2 or air, and water vapor enters through this inlet The anode and cathode tubes are also sealed at the cover with Resbond 907 adhesive In addition the cathode tube is connected to the inlet gas (either N2 or air and water vapor). The cell is situated within a 1700 W Band Heater (McMaster 8160T21), and insulated by (1) alumina silica ceramic fiber ultra high insulation with an aluminum facing on one side (McMaster 9379K93) and (2) rigid thermal shock resistant ceramic insulation without binder (McMaster 9359K75). Temperature is monitored by thermocouple and controlled by DIN Compact Temperature Controller (Omega CN2100-R20). The full cell voltage to drive molten hydroxide electrolysis of wet N2 or air to ammonia at 200°C in the presence of nanoscopic Fe2O3 is 1.2V when the applied current is 20 mA between the 10 cm2 Ni electrodes, and increases to 1.4 V when the current is increased to 250 mA. In each case, when current is applied
4
the electrolysis potential rises from 0V to 60% of the final voltage within the initial 30 seconds of electrolysis, and to 80% of the final potential within the first 5 minutes of the electrolysis. We observe that Ni, Pt (18) and lithiated Ni (17) are effective anodes. The lithiated Ni is prepared by anodization at 1 mA cm-2 for 24 hours in 100°C 3M LiOH, and drives the electrolysis at a ~0.07V lower potential. However, in this study, commercial, pure (Ni 200) shim is employed as the anode to demonstrate ease of process. At these current densities and temperature, variation of the cation has not been observed to affect these electrolysis potentials. The same electrolysis potentials are observed when the equimolar NaOH/KOH molten electrolyte, is replaced by an 0.48:0.52 molar ratio NaOH/CsOH, an 0.7:3 NaOH/LiOH, or an 0.7:3 KOH/LiOH eutectic electrolyte. Presumably, higher current densities and higher temperature potential will be affected by the cation, which will affect electrolyte conductivity and water retention. The product gas from the electrolysis chamber is bubbled (sparged) through an ammonia
trap containing 500 ml doubly deionized water, changed regularly for ammonia analysis. Ammonia concentration was determined by triple redundant methodologies (1) UV/vis absorption, (2) ion selective electrode analysis (Hach 2348700 Ammonia ISE Analysis package) and (3) ammonia test strips (Hach 2755325, dilution required on more concentrated samples). In each case, redundant measurements yield similar ammonia measurements, with the observed reproducibility of first two methodologies +2% and the test strips to +5%. Initially, two water traps (in series) were used to probe whether all ammonia was collected by the first water trap. No ammonia was measured in the second water trap, even under high ammonia production conditions, and only a single water trap was used in subsequent experiments. A (single 500 ml) millimolar acid water trap was also effective. High ammonia concentrations required a dilution prior to analysis by the ammonia test strips. The ammonia ISE is calibrated with a series of NHCl4 solutions, and 2 ml pH of ionic strength adjustor (Orion ISA 951210) added to 100 ml of analyte. The ammonia ISE responds quickly to moderate and high ammonia concentrations, however required several minutes to reach a limiting voltage (concentration) when analyzing dilute ammonia concentrations. Hence, UV/vis was the preferred method of analysis. The UV/vis ammonia determination is measured by absorption at 697 nm on Perkin Elmer Lambda 35 in a conventional 1 cm path length cuvette by the salicylic method, as calibrated with standard aqueous ammonium chloride (NH4Cl) solutions. The method is delineated in reference 30, and in brief absorption is measured following the additions of 0.36 M salicylic acid (C6H4(OH)COOH) in 0.32 M aqueous NaOH, aqueous 0.032 sodium nitroprusside (Na2[Fe(CN)5NO]•2H2O), and 0.1M sodium hypochlorite (NaClO) in 0.75 M aqueous NaOH. Ammonia measured under a variety of discharge conditions is presented in Table S1.
H2 was measured directly by a Micro IV hydrogen analyzer (GfG Instrumentation) or, in the case of high hydrogen concentrations, following serial dilution by added nitrogen; at lower N2 inlet flow rates, H2 was redundantly determined by the volume of H2 & O2 gas collected (after corrections for the partial volumes of N2 and H2Ovapor). H2 was redundantly measured, along with O2, by GC (HP 5890 series II gas chromatograph) with 3 ml/min argon flow using a Carboxen-1010 column, injecting a 250µL sample, which yields H2 and O2 peaks respectively at 2.15 and 3.7 minutes.
5
Fig. S1. The single chamber electrolysis cell configuration as described in the text and used to confirm that ammonia was produced at the cathode and oxygen at the electrode. Top left and right photos: underside and top of cell cover. Bottom left: alumina crucible situated in the cover groove and bolted closed. Above the cell, from left to right is the electrical connection of the anode that is sheathed in alumina, the alumina gas outlet, and on the right side an Inconnel tube functioning as both the gas inlet & the cathode electrical connection. Bottom, right: the electrolyzer sitting within the band heater (not visible) and surrounded by insulation.
6
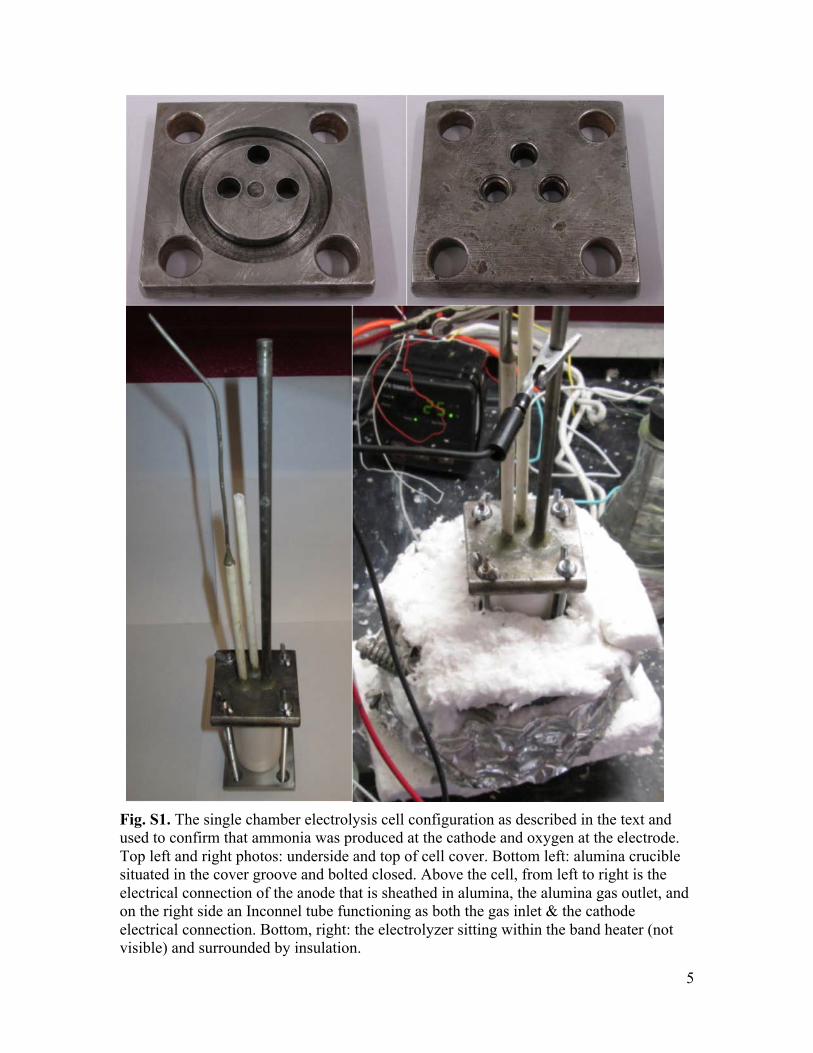
Table S1. Measured ammonia produced as a function of time in the Fig. S1 electrolysis cell at either 0 or 20 mA applied current and at 200°C in a molten Na/KOH electrolyte. In the table NH3 is the mg of measured NH3 analyzed as detailed in the text. EE is the electrolysis efficiency, that is NH3/3e- (%) calculated from the charge, q, and measured ammonia as: 100%*mol NH3/( q /3). In the case of q =0, EE =NH3 (measured). Nano-Fe2O3 above the electrolyte (columns 14 & 15) is maintained in the headspace, and kept separate from the electrolyte by fiber alumina wool. Specifically, three cm above the molten electrolyte a platform was formed in the headspace of the electrolysis chamber which consisted of (i) Ni shim pierced with holes and covering the diameter of the alumina crucible, (ii) fine (400) 316 stainless mesh, and (iii) Cotronics 300 porous alumina paper with through holes for the alumina tubes covering the electrodes, (iv) then the nano-Fe2O3, (v) a top layer of Cotronics 300 porous alumina paper, and finally packed with (vi) high temperature fiber alumina wool (McMaster 9379K93 with foil-face removed).
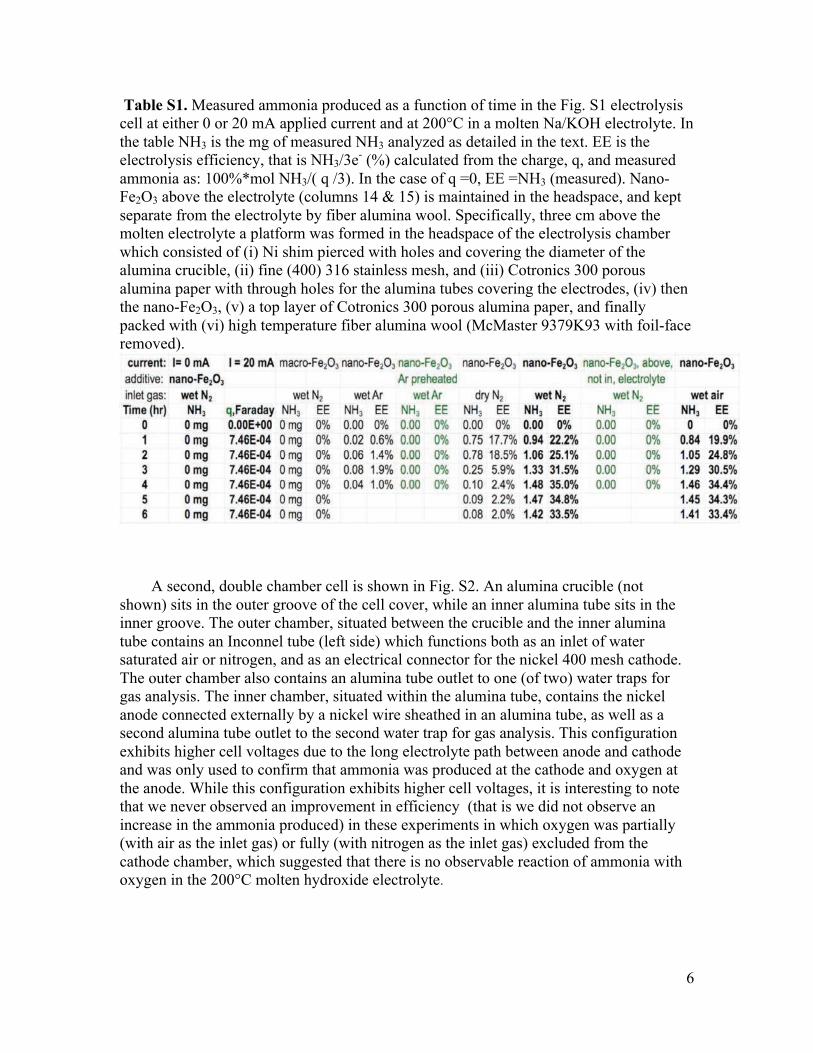
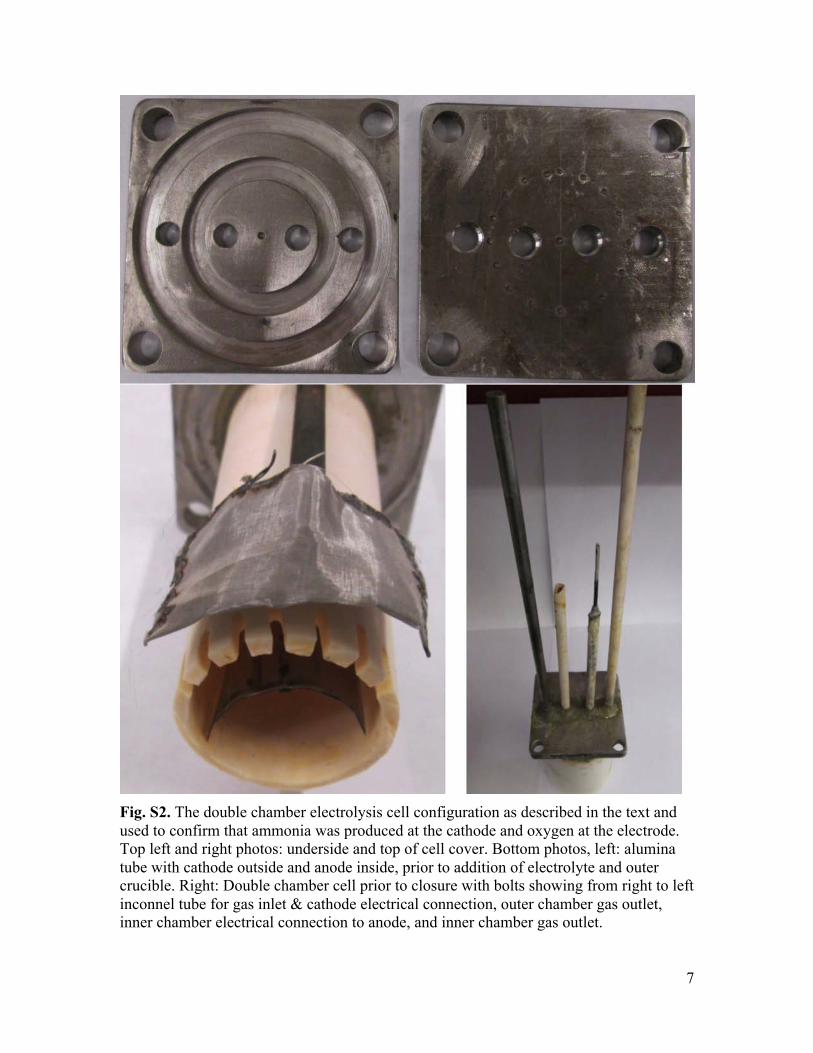
A second, double chamber cell is shown in Fig. S2. An alumina crucible (not
shown) sits in the outer groove of the cell cover, while an inner alumina tube sits in the inner groove. The outer chamber, situated between the crucible and the inner alumina tube contains an Inconnel tube (left side) which functions both as an inlet of water saturated air or nitrogen, and as an electrical connector for the nickel 400 mesh cathode. The outer chamber also contains an alumina tube outlet to one (of two) water traps for gas analysis. The inner chamber, situated within the alumina tube, contains the nickel anode connected externally by a nickel wire sheathed in an alumina tube, as well as a second alumina tube outlet to the second water trap for gas analysis. This configuration exhibits higher cell voltages due to the long electrolyte path between anode and cathode and was only used to confirm that ammonia was produced at the cathode and oxygen at the anode. While this configuration exhibits higher cell voltages, it is interesting to note that we never observed an improvement in efficiency (that is we did not observe an increase in the ammonia produced) in these experiments in which oxygen was partially (with air as the inlet gas) or fully (with nitrogen as the inlet gas) excluded from the cathode chamber, which suggested that there is no observable reaction of ammonia with oxygen in the 200°C molten hydroxide electrolyte.
7
Fig. S2. The double chamber electrolysis cell configuration as described in the text and used to confirm that ammonia was produced at the cathode and oxygen at the electrode. Top left and right photos: underside and top of cell cover. Bottom photos, left: alumina tube with cathode outside and anode inside, prior to addition of electrolyte and outer crucible. Right: Double chamber cell prior to closure with bolts showing from right to left inconnel tube for gas inlet & cathode electrical connection, outer chamber gas outlet, inner chamber electrical connection to anode, and inner chamber gas outlet.
8
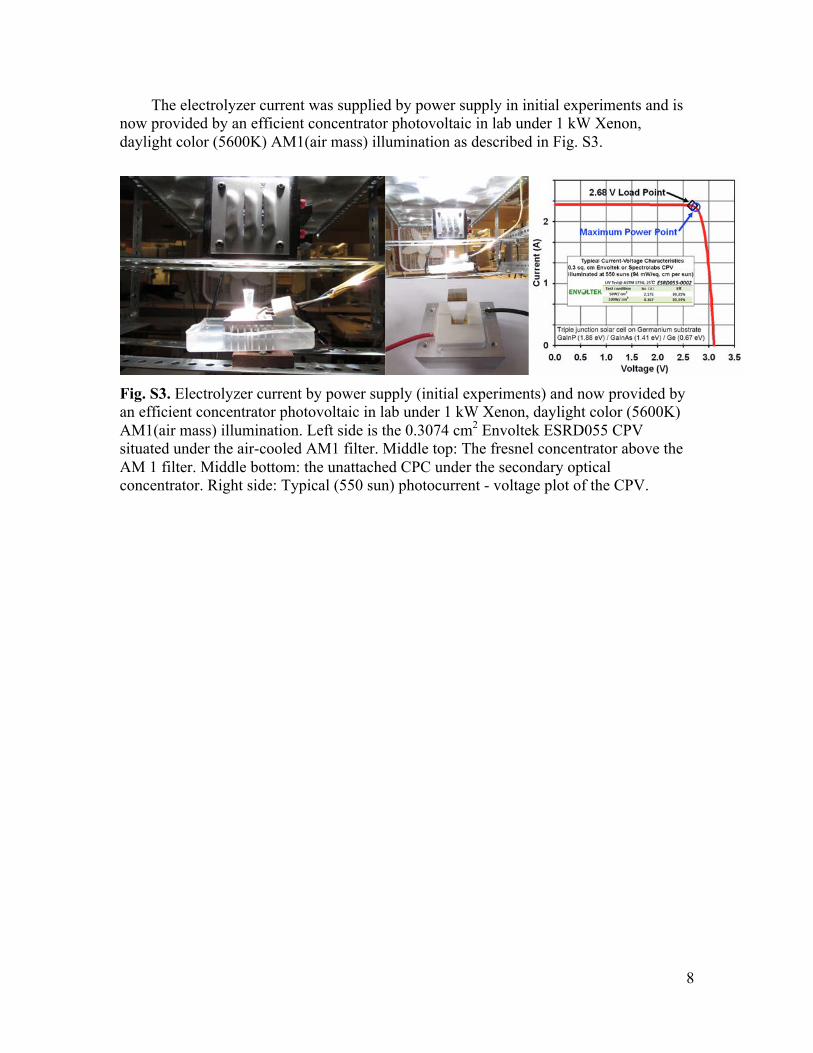
The electrolyzer current was supplied by power supply in initial experiments and is now provided by an efficient concentrator photovoltaic in lab under 1 kW Xenon, daylight color (5600K) AM1(air mass) illumination as described in Fig. S3.
Fig. S3. Electrolyzer current by power supply (initial experiments) and now provided by an efficient concentrator photovoltaic in lab under 1 kW Xenon, daylight color (5600K) AM1(air mass) illumination. Left side is the 0.3074 cm2 Envoltek ESRD055 CPV situated under the air-cooled AM1 filter. Middle top: The fresnel concentrator above the AM 1 filter. Middle bottom: the unattached CPC under the secondary optical concentrator. Right side: Typical (550 sun) photocurrent - voltage plot of the CPV.
9
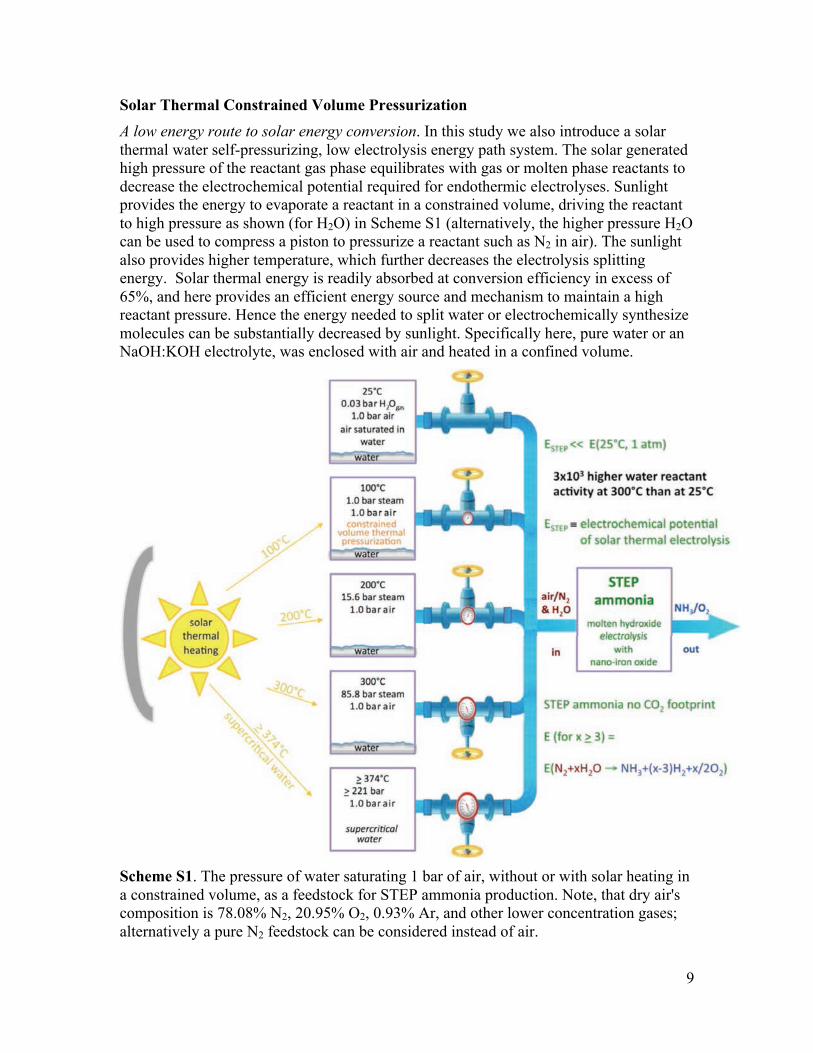
Solar Thermal Constrained Volume Pressurization A low energy route to solar energy conversion. In this study we also introduce a solar thermal water self-pressurizing, low electrolysis energy path system. The solar generated high pressure of the reactant gas phase equilibrates with gas or molten phase reactants to decrease the electrochemical potential required for endothermic electrolyses. Sunlight provides the energy to evaporate a reactant in a constrained volume, driving the reactant to high pressure as shown (for H2O) in Scheme S1 (alternatively, the higher pressure H2O can be used to compress a piston to pressurize a reactant such as N2 in air). The sunlight also provides higher temperature, which further decreases the electrolysis splitting energy. Solar thermal energy is readily absorbed at conversion efficiency in excess of 65%, and here provides an efficient energy source and mechanism to maintain a high reactant pressure. Hence the energy needed to split water or electrochemically synthesize molecules can be substantially decreased by sunlight. Specifically here, pure water or an NaOH:KOH electrolyte, was enclosed with air and heated in a confined volume.
Scheme S1. The pressure of water saturating 1 bar of air, without or with solar heating in a constrained volume, as a feedstock for STEP ammonia production. Note, that dry air's composition is 78.08% N2, 20.95% O2, 0.93% Ar, and other lower concentration gases; alternatively a pure N2 feedstock can be considered instead of air.
10
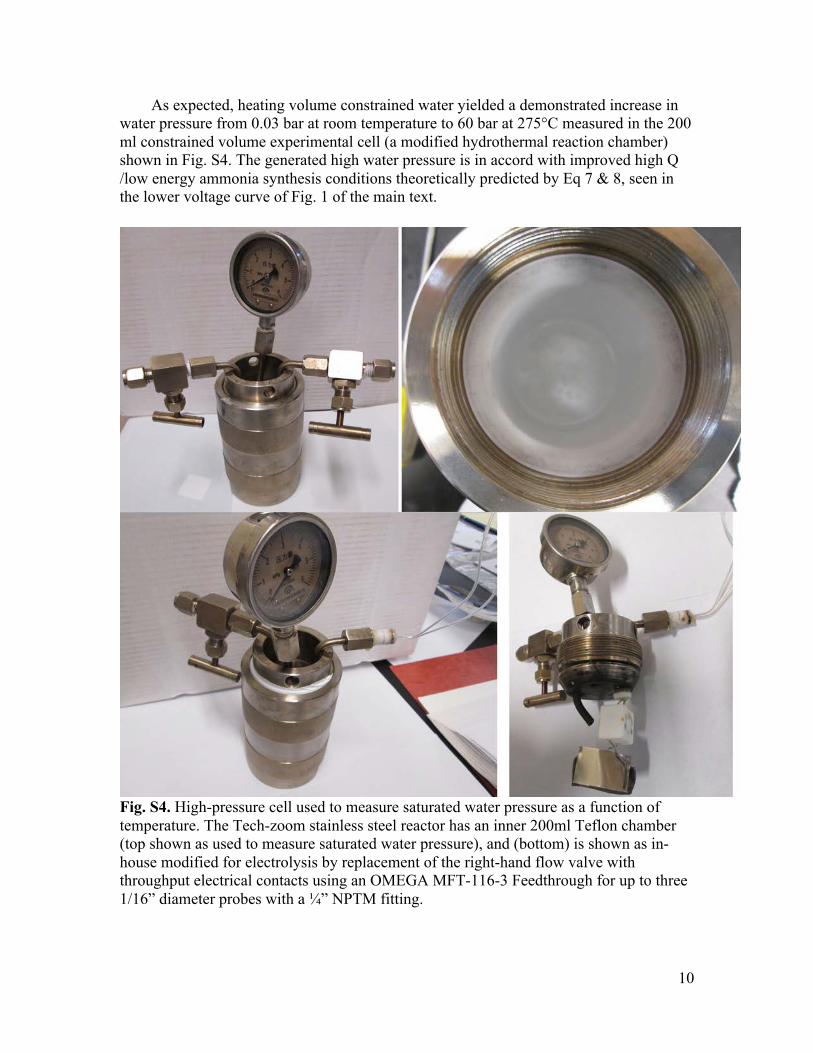
As expected, heating volume constrained water yielded a demonstrated increase in water pressure from 0.03 bar at room temperature to 60 bar at 275°C measured in the 200 ml constrained volume experimental cell (a modified hydrothermal reaction chamber) shown in Fig. S4. The generated high water pressure is in accord with improved high Q /low energy ammonia synthesis conditions theoretically predicted by Eq 7 & 8, seen in the lower voltage curve of Fig. 1 of the main text.
Fig. S4. High-pressure cell used to measure saturated water pressure as a function of temperature. The Tech-zoom stainless steel reactor has an inner 200ml Teflon chamber (top shown as used to measure saturated water pressure), and (bottom) is shown as in-house modified for electrolysis by replacement of the right-hand flow valve with throughput electrical contacts using an OMEGA MFT-116-3 Feedthrough for up to three 1/16” diameter probes with a ¼” NPTM fitting.
11
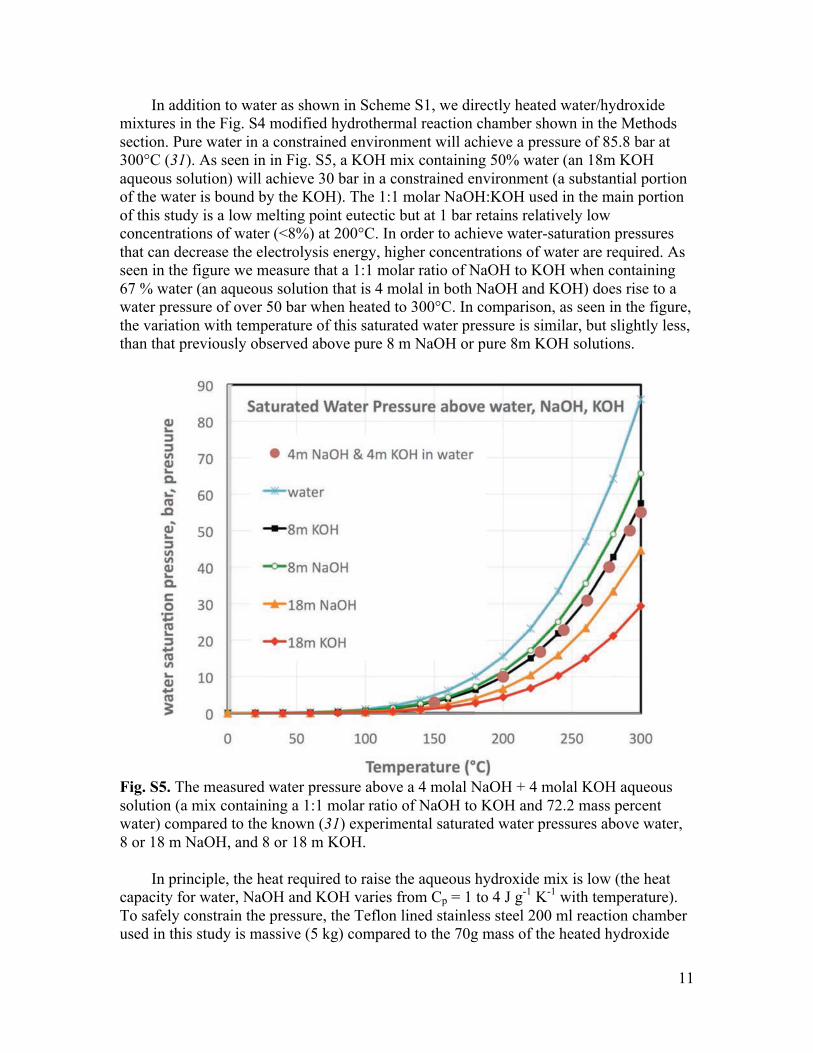
In addition to water as shown in Scheme S1, we directly heated water/hydroxide mixtures in the Fig. S4 modified hydrothermal reaction chamber shown in the Methods section. Pure water in a constrained environment will achieve a pressure of 85.8 bar at 300°C (31). As seen in in Fig. S5, a KOH mix containing 50% water (an 18m KOH aqueous solution) will achieve 30 bar in a constrained environment (a substantial portion of the water is bound by the KOH). The 1:1 molar NaOH:KOH used in the main portion of this study is a low melting point eutectic but at 1 bar retains relatively low concentrations of water (<8%) at 200°C. In order to achieve water-saturation pressures that can decrease the electrolysis energy, higher concentrations of water are required. As seen in the figure we measure that a 1:1 molar ratio of NaOH to KOH when containing 67 % water (an aqueous solution that is 4 molal in both NaOH and KOH) does rise to a water pressure of over 50 bar when heated to 300°C. In comparison, as seen in the figure, the variation with temperature of this saturated water pressure is similar, but slightly less, than that previously observed above pure 8 m NaOH or pure 8m KOH solutions.
Fig. S5. The measured water pressure above a 4 molal NaOH + 4 molal KOH aqueous solution (a mix containing a 1:1 molar ratio of NaOH to KOH and 72.2 mass percent water) compared to the known (31) experimental saturated water pressures above water, 8 or 18 m NaOH, and 8 or 18 m KOH.
In principle, the heat required to raise the aqueous hydroxide mix is low (the heat capacity for water, NaOH and KOH varies from Cp = 1 to 4 J g-1 K-1 with temperature). To safely constrain the pressure, the Teflon lined stainless steel 200 ml reaction chamber used in this study is massive (5 kg) compared to the 70g mass of the heated hydroxide
12
solution, which provides a challenge to heating the chamber solely with solar energy. However demonstrating that solar thermal is sufficient, is that outdoors 60 to 70 g of an alkali eutectic salt consistently reaches and sustains temperatures of 500°-700°C, and 30 g reaches over 700°C, with (Edmund Optics) Fresnel lens concentrator under Washington DC sunlight.
We kept the temperature of Fig. S4 high-pressure cell at or below 300°C, as the decomposition temperature of Teflon is 325°C. We observe that the Teflon lining began to soften or deform at temperatures over 300°C. In accord with Scheme S1, high water content, closed contained electrolyses provide an opportunity to increase the saturated water pressure above the mNolten phase reaction by three orders of magnitude by increasing the temperature from 25°C to 300°C. These conditions provide the opportunity to explore the capability of solar thermal energy to decrease the electrolysis potential needed to drive water reactant electrolyses such in the ammonia synthesis reactions Eqs. 4-8.
In experiments in the volume constrained cell with externally connected electrodes shown on the right side of Fig. S4, the potential between Ni electrodes in an 8 m hydroxide ammonia synthesis electrolyte (4m NaOH, 4 m KOH, nano-Fe2O3) decreased with increasing temperature providing initial supporting evidence of the predicted high Q, low potential ammonia synthesis potential calculated in Fig. 1 of the main text. Specifically at 250°C and 25 bar under volume constrained conditions using the Fig. S4 cell, measured electrolysis potentials are lower than those measured at atmospheric pressure and lower temperature, and the ammonia generation rate and current efficiency is higher. Measured potentials over the 10 cm2 electrodes at higher temperature and pressure were 0.78V at 1 mA, 1.01V at 20 mA (compared to 1.23V at ambient pressure and 200°C), and 1.31V at 250 mA (compared to 1.44V at ambient pressure and 200°C). The cell was then maintained at 20 mA (2 mA cm-2) for 10 hours, and regularly (every ~2 hours) vented through a sparger/water trap to analyze for ammonia and the gas analyzed for hydrogen. Compared to the 200°C, 1 atm experimental results, the 250°C, 25 bar results require significantly lower electrolysis voltage, while coulombic efficiency and peak ammonia rate are the same 35% and 2.4 x 10⁻⁹ mol NH3 cm-2 s-1. Interestingly however, no hydrogen co-product was detected during the course of the experiment. At 250°C and 25 bar the ammonia production rate varied with time as 2.1 x 10⁻⁹ (hours 0 to 2.5), 2.2 x 10⁻⁹ (hours 2.5 to 5), 2.4 x 10⁻⁹ (hours 5 to 8), and then dropped to 1.6 x 10⁻⁹ (hours 8 to 10). In each case the pressure increased from 25 bar prior to venting. The cell was allowed to increase in pressure to 39 bar subsequent to the first vent/ammonia analysis, and then vented at 35 to 36 bar subsequently through 8 hours of electrolysis time. During hours 8 to 10, the rate of pressure build-up in the cell slowed and only increased from 25 to 28 bar during this two hour interval. Concurrent with the measured decrease in ammonia rate during this time interval was an increase in voltage (from 1.01 V to 1.11V).
As expected, we observe that using water evaporation in a closed container increases the electrolysis cell pressure, and in addition we observe that this induces a significant decrease in the energy (electrolysis voltage) measured to drive ammonia production. It should be noted that the lack of an observed hydrogen co-product at high pressure during ammonia synthesis at 2 mA cm-2 represents a loss of this fuel as a co-product.
References 1. V. Smil, Enriching the Earth: Fritz Haber, Carl Bosch, and the Transformation of
World Food Production (MIT Press, Cambridge, MA, 2004).
2. J. Rockström, W. Steffen, K. Noone, A. Persson, F. S. Chapin 3rd, E. F. Lambin, T. M. Lenton, M. Scheffer, C. Folke, H. J. Schellnhuber, B. Nykvist, C. A. de Wit, T. Hughes, S. van der Leeuw, H. Rodhe, S. Sörlin, P. K. Snyder, R. Costanza, U. Svedin, M. Falkenmark, L. Karlberg, R. W. Corell, V. J. Fabry, J. Hansen, B. Walker, D. Liverman, K. Richardson, P. Crutzen, J. A. Foley, A safe operating space for humanity. Nature 461, 472–475 (2009). Medline doi:10.1038/461472a
3. R. Strait, M. Nagvekar, Carbon dioxide capture and storage in the nitrogen and syngas industries. Nitrogen+Syngas 303 (Jan.-Feb.), 1–3 (2010); www.kbr.com/Newsroom/Publications/Articles/Carbon-Dioxide-Capture-and-Storage-in-the-Nitrogen-Syngas-Industries.pdf.
4. A. Bonomi, M. Hadat, C. Gentaz, Galvanic cell studies on ionic carbide and nitride solutions in molten salts. J. Electrochem. Soc. 124, 982–986 (1977). doi:10.1149/1.2133513
5. A. Bonomi, M. Hadat, F. Breda, Electrochemical studies on ionic nitride solutions in molten salts. J. Electrochem. Soc. 126, 248–251 (1979). doi:10.1149/1.2129013
6. T. Murakami, T. Nishikiori, T. Nohira, Y. Ito, Electrolytic synthesis of ammonia in molten salts under atmospheric pressure. J. Am. Chem. Soc. 125, 334–335 (2003). Medline doi:10.1021/ja028891t
7. Y. Ito, T. Goto, Electrochemistry of nitrogen and nitrides in molten salts. J. Nucl. Energy 344, 128–135 (2005).
8. T. Murakami, T. Nohira, Y. H. Ogata, Y. Ito, Electrolytic ammonia synthesis in molten salts under atmospheric pressure using methane as a hydrogen source. Electrochem. Solid-State Lett. 8, D12–D14 (2005). doi:10.1149/1.1870633
9. T. Murakami, T. Nohira, Y. Araki, T. Goto, R. Hagiwara, Y. H. Ogata, Electrolytic synthesis of ammonia from water and nitrogen under atmospheric pressure using a boron-doped diamond electrode. Electrochem. Solid-State Lett. 10, E4–E6 (2007). doi:10.1149/1.2437674
10. N. Serizawa, H. Miyashiro, K. Takei, T. Ikezumi, T. Nishikiori, Y. Ito, Dissolution behavior of ammonia electrosynthesized in molten LiCl–KCl–CsCl system. J. Electrochem. Soc. 159, E87–E91 (2012). doi:10.1149/2.099204jes
11. C. J. Pickett, J. Talarmin, Electrosynthesis of ammonia. Nature 317, 652–653 (1985). doi:10.1038/317652a0
12. N. Furuya, H. Yoshiba, Electroreduction of nitrogen to ammonia on gas diffusion electrodes loaded with inorganic catalysts. J. Electroanal. Chem. 291, 269–272 (1990). doi:10.1016/0022-0728(90)87195-P
13. E. Skúlason, T. Bligaard, S. Gudmundsdóttir, F. Studt, J. Rossmeisl, F. Abild-Pedersen, T. Vegge, H. Jónsson, J. K. Nørskov, A theoretical evaluation of
13
possible transition metal electro-catalysts for N2 reduction. Phys. Chem. Chem. Phys. 14, 1235–1245 (2012). Medline doi:10.1039/c1cp22271f
14. I. Amar, R. Lan, C. Petit, S. Tao, Solid-state electrochemical synthesis of ammonia: A review. J. Solid State Electrochem. 15, 1845–1860 (2011). doi:10.1007/s10008-011-1376-x
15. A. Skodra, M. Stoukides, Electrocatalytic synthesis of ammonia from steam and nitrogen at atmospheric pressure. Solid State Ion. 180, 1332–1336 (2009). doi:10.1016/j.ssi.2009.08.001
16. V. Kordali, G. Kyriacou, C. Lambrou, Electrochemical synthesis of ammonia at atmospheric pressure and low temperature in a solid polymer electrolyte cell. Chem. Commun. (Camb.) 2000, 1673–1674 (2000). doi:10.1039/b004885m
17. R. Lan, J. T. S. Irvine, S. Tao, Synthesis of ammonia directly from air and water at ambient temperature and pressure. Sci. Rep. 3, 1145 (2013). Medline doi:10.1038/srep01145
18. R. Lan, S. Tao, Electrochemical synthesis of ammonia directly from air and water using a Li+/H+/NH4+ mixed conducting electrolyte. RSC Adv. 3, 18016–18021 (2013). doi:10.1039/c3ra43432j
19. J. R. McKone, S. C. Marinescu, B. S. Bruneschwig, J. R. Winkler, H. B. Gray, Earth-abundant hydrogen evolution electrocatalysts. Chem. Sci. 5, 865–878 (2014). doi:10.1039/c3sc51711j
20. D. Santos, C. A. C. Sequeira, J. L. Figueiredo, Hydrogen production by alkaline water electrolysis. Quím. Nova 8, 1176–1193 (2013). doi:10.1590/S0100-40422013000800017
21. K. Zeng, D. Zhang, Recent progress in alkaline water electrolysis for hydrogen production and applications. Progr. Energy Combust. Sci. 36, 307–326 (2010). doi:10.1016/j.pecs.2009.11.002
22. J. Ganley, An intermediate-temperature direct ammonia fuel cell with a molten alkaline hydroxide electrolyte. J. Power Sources 178, 44–47 (2008). doi:10.1016/j.jpowsour.2007.11.093
23. J. Ganley, High temperature and pressure alkaline electrolysis. Int. J. Hydrogen Energy 34, 3604–3611 (2009). doi:10.1016/j.ijhydene.2009.02.083
24. S. Licht, L. Halperin, M. Kalina, M. Zidman, N. Halperin, Electrochemical potential tuned solar water splitting. Chem. Commun. (Camb.) 2003, 3006–3007 (2003). Medline doi:10.1039/b309397b
25. M. W. Chase, J. Phys. Chem. Ref. Data 9, 1 (1998).
26. Thermochemical data from (25) are available online at U.S. National Institute of Standards and Technology ChemWeb: http://webbook.nist.gov/chemistry/form-ser.html.
14
27. Glenn Research Center, National Aeronautics and Space Administration (NASA), ThermoBuild access to NASA Glenn thermodynamic CEA database (2006); data available at www.grc.nasa.gov/WWW/CEAWeb/ceaThermoBuild.htm.
28. S. Licht, STEP (solar thermal electrochemical photo) generation of energetic molecules: A solar chemical process to end anthropogenic global warming. J. Phys. Chem. C 113, 16283–16292 (2009). doi:10.1021/jp9044644
29. A. Pelton, K. Hack (and codevelopers), 283 binary salt phase diagram, [Facility for the Analysis of Chemical Thermodynamics (FACT), Centre for Research in Computational Thermochemistry (CRCT), University of Montreal, rev. ed., 2012]; www.crct.polymtl.ca/FACT/documentation/FTsalt/FTsalt_Figs.htm.
30. Materials and methods are detailed in the supplementary materials on Science Online.
31. A. Hellman, E. J. Baerends, M. Biczysko, T. Bligaard, C. H. Christensen, D. C. Clary, S. Dahl, R. van Harrevelt, K. Honkala, H. Jonsson, G. J. Kroes, M. Luppi, U. Manthe, J. K. Nørskov, R. A. Olsen, J. Rossmeisl, E. Skúlason, C. S. Tautermann, A. J. Varandas, J. K. Vincent, Predicting catalysis: Understanding ammonia synthesis from first-principles calculations. J. Phys. Chem. B 110, 17719–17735 (2006). Medline doi:10.1021/jp056982h
32. M. Appl, Ammonia 2 production processes, Ullman’s Encyclopedia of Industrial Chemistry (Wiley-Verlag, Weinheim, Germany, ed. 7, 2012), pp. 139–210; doi: 10.1002/14356007.
33. S. Licht, Efficient solar-driven synthesis, carbon capture, and desalinization, STEP: Solar thermal electrochemical production of fuels, metals, bleach. Adv. Mater. 47, 5592–5612 (2011). Medline doi:10.1002/adma.201103198
34. R. Pitz-Paal, in Solar Energy Conversion and Photoenergy Systems, J. B. Galvez, S. M. Rodriguez, Eds. (EOLSS Publishers, Oxford, 2007).
35. T. Hahm, H. Schmidt-Traub, B. Leßmann, A cone concentrator for high-temperature solar cavity-receivers. Sol. Energy 65, 33–41 (1999). doi:10.1016/S0038-092X(98)00119-4
36. W. Ziqing, Z. Kiuming, L. Jianxin, W. Rong, W. Kemei, Preparation and application of nanometer materials supported ruthenium catalysts. J. Catal. 33, 377–378 (2013).
15
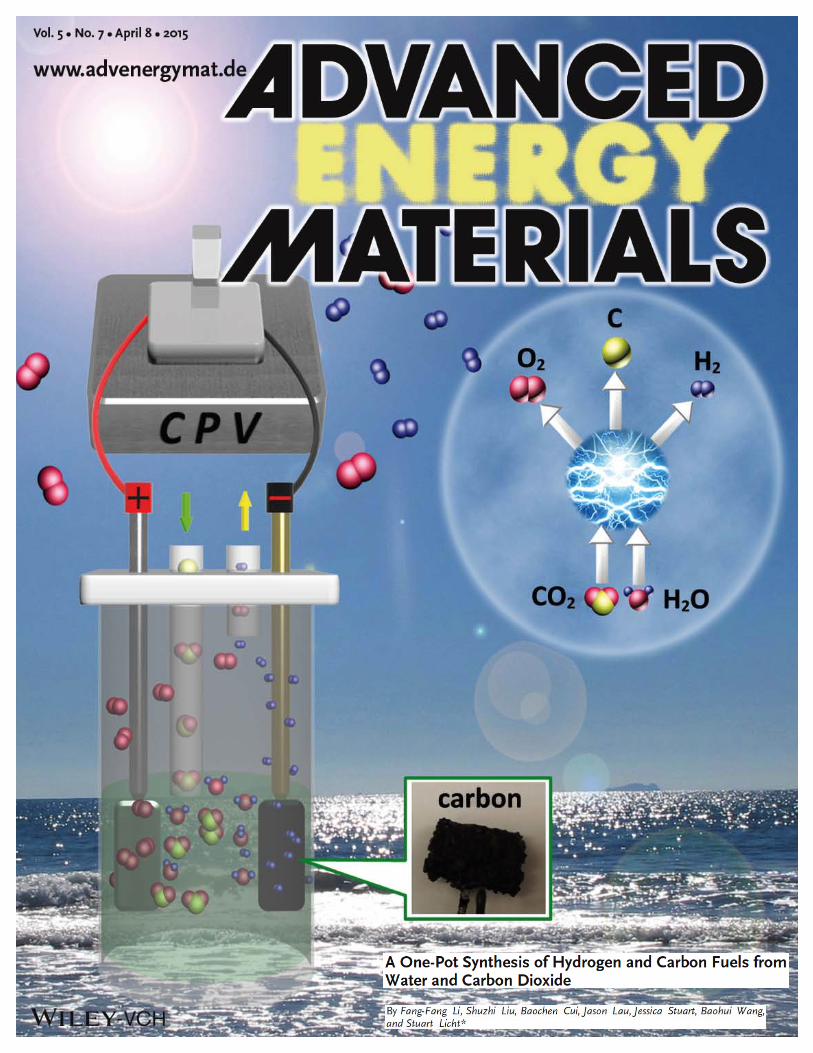
COM
MUN
ICATIO
N
© 2014 WILEY-VCH Verlag GmbH & Co. KGaA, Weinheim (1 of 7) 1401791wileyonlinelibrary.com
A One-Pot Synthesis of Hydrogen and Carbon Fuels from Water and Carbon Dioxide
Fang-Fang Li , Shuzhi Liu , Baochen Cui , Jason Lau , Jessica Stuart , Baohui Wang , and Stuart Licht *
Dr. F.-F. Li, Prof. S. Liu, Prof. B. Cui, J. Lau, J. Stuart, Prof. B. Wang, Prof. S. Licht Department of Chemistry George Washington University Washington , DC 20052 , USA E-mail: [email protected]
DOI: 10.1002/aenm.201401791
fuels. [ 5–7 ] Lubomirsky and co-workers [ 16 ] have also probed the electrolysis of lithium molten carbonates to produce carbon monoxide, and Chen and co-workers [ 17 ] have also probed elec-trolysis of mixed lithium, potassium molten carbonates to carbon.
We have previously delineated the solar, optical, and elec-tronic components of STEP. [ 6,13 ] In this study, we focus on the electrolysis component for STEP fuel. Specifi cally, we present the fi rst molten electrolyte sustaining electrolytic co-production of both hydrogen and carbon products in a single cell. Solid carbon (as coal) is used as the starting point to generate CO and hydrogen for the Fischer–Tropsch generation of a variety of fuels, such as synthetic diesel. [ 18 ] However, that process is carbon dioxide emitting intensive. Here, hydrogen and gra-phitic carbon are produced without carbon dioxide emissions and instead produced from water and carbon dioxide.
This communication recounts our successful attempt to simultaneously co-generate hydrogen and solid carbon fuels from a mixed hydroxide/carbonate electrolyte in a “single-pot” electrolytic synthesis at temperatures below 650 °C. The alter-native co-generated hydrogen and gaseous carbon monoxide fuel synthesis will be pursued in a later study as the high tem-perature (over 900 °C) currently required to form CO in molten carbonates is a challenge to make compatible with the lower temperature range we have succeeded for hydrogen in the hydroxide electrolyses. We demonstrate here the functionality of new lithium–barium–calcium hydroxide carbonate electro-lytes to co-generate hydrogen and carbon fuel in a single elec-trolysis chamber at high current densities of several hundreds of mA/cm 2 , at low electrolysis potentials, and from water and CO 2 starting points, which provides a signifi cant step towards the development of renewable fuels.
Molten hydroxides are important as conductive, high-cur-rent, low-electrolysis-potential electrolytes for water splitting to generate hydrogen that have not been widely explored. [ 3,6,19,20 ] The pure anhydrous akali hydroxides melt only at temperatures >300 °C: LiOH ( T mp = 462 °C), NaOH ( T mp = 318 °C), KOH ( T mp = 406 °C), CsOH ( T mp = 339 °C). The mixed hydroxides have lower melting point. With molar ratios of 0.3:0.7 LiOH/NaOH, 0.3:0.7 LiOH/KOH, 0.5:0.5 NaOH/KOH, 0.44:0.56 KOH/CsOH, respectively, these melt at 215 °C, 225 °C, 170 °C, and 195°C, and the melting point is even lower when hydrated hydroxide salts are used. A eutectic 0.45:0.55 mix of LiOH/Ba(OH) 2 melts at 320 °C, compared to 407 °C for anhydrous Ba(OH) 2 , and 300 °C for the monohydrate Ba(OH) 2 ·H 2 O. [ 21 ]
Low temperature enhances electrolytic H 2 formation in molten hydroxides. The coulombic effi ciency of electrolytic water split-ting, η H2 (moles H 2 generated per 2 Faraday of applied charge),
Nonfossil fuel-based, low carbon footprint fuels are needed to ameliorate the effects of anthropogenic climate change. In 2002, we presented a solar electrochemical theory that the full spectrum of sunlight was suffi cient to split water to hydrogen fuel at over 50% solar conversion effi ciency. [ 1,2 ] The water split-ting electrolysis is endothermic, requiring a smaller potential at higher temperature. The rest potential of common electrolyses, such as E (H 2 O → H 2 +1/2O 2 ) = 1.23 V, is often considerably greater than the photopotential of visible light semiconduc-tors. Thermal sunlight can provide an effi cient heat source to lower the electrolysis potential, opening a pathway to these otherwise potential-forbidden pathways of charge transfer. We demonstrated this theory in 2003 showing that even a small bandgap semiconductor, such as silicon, was energetically suf-fi cient to split water when sub-bandgap sunlight, not used by the semiconductor, was directed to heating the water. [ 3 ] In 2009, this theory was renamed STEP (the s olar t hermal e lectrochem-ical p rocess) and generalized to all endothermic reactions. [ 4 ] From 2010 this has been demonstrated for the direct removal of atmospheric carbon dioxide (STEP carbon), [ 5–7 ] water treat-ment [ 8,9 ] and organics, [ 10 ] and the CO 2 -free production of iron (STEP iron), [ 6,11,12 ] magnesium and bleach, [ 6 ] calcium oxide (STEP cement), [ 13 ] and ammonia (STEP fertilizer). [ 14 ]
The general use of solar thermal energy to lower the poten-tial of useful electrolyses can be applied to liquid, gas, or solid phase electrolyte cells. In general, we have found an energy advantage in applying STEP to liquid, molten electrolyte cells. Such cells can be driven by thermal sunlight to high tempera-ture accommodating both facile kinetics at high current den-sity and a lower endothermic electrolysis potential. Importantly, molten salt cells can often accommodate high reactant con-centrations, which lead to a further decrease in the electrolysis potential (as driven by the Nernst equation). For example, a molten carbonate containing dissolved oxide readily absorbs atmospheric CO 2 , and has the advantage that the reducible tetravalent carbon concentration (as carbonate) is 10 6 -fold higher than that in air (as CO 2 ). [ 4,5 ] We have previously dem-onstrated molten hydroxide electrolytes for solar water splitting to hydrogen fuel, [ 3,6,15 ] and molten carbonate electrolytes for solar carbon dioxide splitting to carbon and carbon monoxide
Adv. Energy Mater. 2015, 5, 1401791
www.MaterialsViews.comwww.advenergymat.de
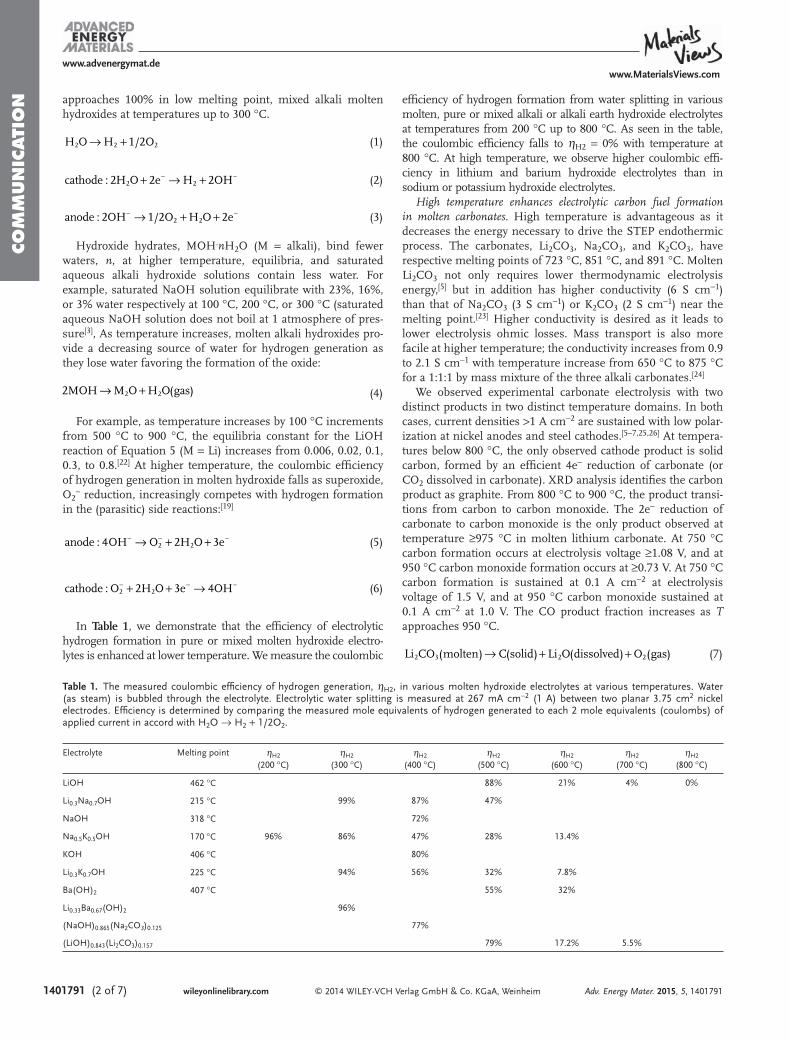
COM
MUN
ICATI
ON
© 2014 WILEY-VCH Verlag GmbH & Co. KGaA, Weinheim1401791 (2 of 7) wileyonlinelibrary.com
approaches 100% in low melting point, mixed alkali molten hydroxides at temperatures up to 300 °C.
→ +H O H 1/2O2 2 2 (1)
+ → +− −cathode : 2H O 2e H 2OH2 2 (2)
→ + +− −anode : 2OH 1/2O H O 2e2 2 (3)
Hydroxide hydrates, MOH . n H 2 O (M = alkali), bind fewer waters, n , at higher temperature, equilibria, and saturated aqueous alkali hydroxide solutions contain less water. For example, saturated NaOH solution equilibrate with 23%, 16%, or 3% water respectively at 100 °C, 200 °C, or 300 °C (saturated aqueous NaOH solution does not boil at 1 atmosphere of pres-sure [ 3 ] , As temperature increases, molten alkali hydroxides pro-vide a decreasing source of water for hydrogen generation as they lose water favoring the formation of the oxide:
→ +2MOH M O H O(gas)2 2 (4)
For example, as temperature increases by 100 °C increments from 500 °C to 900 °C, the equilibria constant for the LiOH reaction of Equation 5 (M = Li) increases from 0.006, 0.02, 0.1, 0.3, to 0.8. [ 22 ] At higher temperature, the coulombic effi ciency of hydrogen generation in molten hydroxide falls as superoxide, O 2 − reduction, increasingly competes with hydrogen formation in the (parasitic) side reactions: [ 19 ]
→ + +− − −anode : 4OH O 2H O 3e2 2 (5)
+ + →− − −cathode : O 2H O 3e 4OH2 2 (6)
In Table 1 , we demonstrate that the effi ciency of electrolytic hydrogen formation in pure or mixed molten hydroxide electro-lytes is enhanced at lower temperature. We measure the coulombic
effi ciency of hydrogen formation from water splitting in various molten, pure or mixed alkali or alkali earth hydroxide electrolytes at temperatures from 200 °C up to 800 °C. As seen in the table, the coulombic effi ciency falls to η H2 = 0% with temperature at 800 °C. At high temperature, we observe higher coulombic effi -ciency in lithium and barium hydroxide electrolytes than in sodium or potassium hydroxide electrolytes.
High temperature enhances electrolytic carbon fuel formation in molten carbonates. High temperature is advantageous as it decreases the energy necessary to drive the STEP endothermic process. The carbonates, Li 2 CO 3 , Na 2 CO 3 , and K 2 CO 3 , have respective melting points of 723 °C, 851 °C, and 891 °C. Molten Li 2 CO 3 not only requires lower thermodynamic electrolysis energy, [ 5 ] but in addition has higher conductivity (6 S cm −1 ) than that of Na 2 CO 3 (3 S cm −1 ) or K 2 CO 3 (2 S cm −1 ) near the melting point. [ 23 ] Higher conductivity is desired as it leads to lower electrolysis ohmic losses. Mass transport is also more facile at higher temperature; the conductivity increases from 0.9 to 2.1 S cm −1 with temperature increase from 650 °C to 875 °C for a 1:1:1 by mass mixture of the three alkali carbonates. [ 24 ]
We observed experimental carbonate electrolysis with two distinct products in two distinct temperature domains. In both cases, current densities >1 A cm −2 are sustained with low polar-ization at nickel anodes and steel cathodes. [ 5–7,25,26 ] At tempera-tures below 800 °C, the only observed cathode product is solid carbon, formed by an effi cient 4e − reduction of carbonate (or CO 2 dissolved in carbonate). XRD analysis identifi es the carbon product as graphite. From 800 °C to 900 °C, the product transi-tions from carbon to carbon monoxide. The 2e − reduction of carbonate to carbon monoxide is the only product observed at temperature ≥975 °C in molten lithium carbonate. At 750 °C carbon formation occurs at electrolysis voltage ≥1.08 V, and at 950 °C carbon monoxide formation occurs at ≥0.73 V. At 750 °C carbon formation is sustained at 0.1 A cm −2 at electrolysis voltage of 1.5 V, and at 950 °C carbon monoxide sustained at 0.1 A cm −2 at 1.0 V. The CO product fraction increases as T approaches 950 °C.
→ + +Li CO (molten) C(solid) Li O(dissolved) O (gas)2 3 2 2 (7)
Adv. Energy Mater. 2015, 5, 1401791
www.MaterialsViews.comwww.advenergymat.de
Table 1. The measured coulombic effi ciency of hydrogen generation, η H2 , in various molten hydroxide electrolytes at various temperatures. Water (as steam) is bubbled through the electrolyte. Electrolytic water splitting is measured at 267 mA cm −2 (1 A) between two planar 3.75 cm 2 nickel electrodes. Effi ciency is determined by comparing the measured mole equivalents of hydrogen generated to each 2 mole equivalents (coulombs) of applied current in accord with H 2 O → H 2 + 1/2O 2 .
Electrolyte Melting point η H2 (200 °C)
η H2 (300 °C)
η H2 (400 °C)
η H2 (500 °C)
η H2 (600 °C)
η H2 (700 °C)
η H2 (800 °C)
LiOH 462 °C 88% 21% 4% 0%
Li 0.3 Na 0.7 OH 215 °C 99% 87% 47%
NaOH 318 °C 72%
Na 0.5 K 0.5 OH 170 °C 96% 86% 47% 28% 13.4%
KOH 406 °C 80%
Li 0.3 K 0.7 OH 225 °C 94% 56% 32% 7.8%
Ba(OH) 2 407 °C 55% 32%
Li 0.33 Ba 0.67 (OH) 2 96%
(NaOH) 0.865 (Na 2 CO 3 ) 0.125 77%
(LiOH) 0.843 (Li 2 CO 3 ) 0.157 79% 17.2% 5.5%
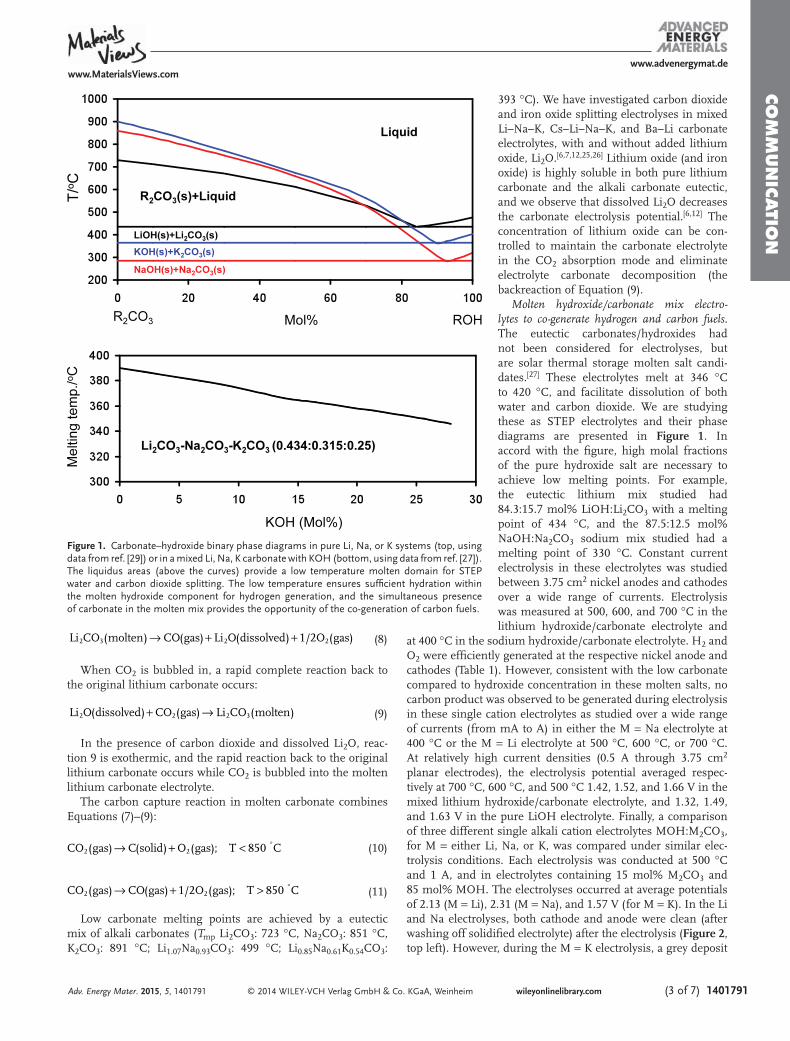
COM
MUN
ICATIO
N
© 2014 WILEY-VCH Verlag GmbH & Co. KGaA, Weinheim (3 of 7) 1401791wileyonlinelibrary.com
→ + +Li CO (molten) CO(gas) Li O(dissolved) 1/2O (gas)2 3 2 2 (8)
When CO 2 is bubbled in, a rapid complete reaction back to the original lithium carbonate occurs:
+ →Li O(dissolved) CO (gas) Li CO (molten)2 2 2 3 (9)
In the presence of carbon dioxide and dissolved Li 2 O, reac-tion 9 is exothermic, and the rapid reaction back to the original lithium carbonate occurs while CO 2 is bubbled into the molten lithium carbonate electrolyte.
The carbon capture reaction in molten carbonate combines Equations ( 7) – ( 9) :
→ + < °CO (gas) C(solid) O (gas); T 850 C2 2 (10)
→ + > °CO (gas) CO(gas) 1/2O (gas); T 850 C2 2 (11)
Low carbonate melting points are achieved by a eutectic mix of alkali carbonates ( T mp Li 2 CO 3 : 723 °C, Na 2 CO 3 : 851 °C, K 2 CO 3 : 891 °C; Li 1.07 Na 0.93 CO 3 : 499 °C; Li 0.85 Na 0.61 K 0.54 CO 3 :
393 °C). We have investigated carbon dioxide and iron oxide splitting electrolyses in mixed Li–Na–K, Cs–Li–Na–K, and Ba–Li carbonate electrolytes, with and without added lithium oxide, Li 2 O. [ 6,7,12,25,26 ] Lithium oxide (and iron oxide) is highly soluble in both pure lithium carbonate and the alkali carbonate eutectic, and we observe that dissolved Li 2 O decreases the carbonate electrolysis potential. [ 6,12 ] The concentration of lithium oxide can be con-trolled to maintain the carbonate electrolyte in the CO 2 absorption mode and eliminate electrolyte carbonate decomposition (the backreaction of Equation ( 9) .
Molten hydroxide/carbonate mix electro-lytes to co-generate hydrogen and carbon fuels. The eutectic carbonates/hydroxides had not been considered for electrolyses, but are solar thermal storage molten salt candi-dates. [ 27 ] These electrolytes melt at 346 °C to 420 °C, and facilitate dissolution of both water and carbon dioxide. We are studying these as STEP electrolytes and their phase diagrams are presented in Figure 1 . In accord with the fi gure, high molal fractions of the pure hydroxide salt are necessary to achieve low melting points. For example, the eutectic lithium mix studied had 84.3:15.7 mol% LiOH:Li 2 CO 3 with a melting point of 434 °C, and the 87.5:12.5 mol% NaOH:Na 2 CO 3 sodium mix studied had a melting point of 330 °C. Constant current electrolysis in these electrolytes was studied between 3.75 cm 2 nickel anodes and cathodes over a wide range of currents. Electrolysis was measured at 500, 600, and 700 °C in the lithium hydroxide/carbonate electrolyte and
at 400 °C in the sodium hydroxide/carbonate electrolyte. H 2 and O 2 were effi ciently generated at the respective nickel anode and cathodes (Table 1 ). However, consistent with the low carbonate compared to hydroxide concentration in these molten salts, no carbon product was observed to be generated during electrolysis in these single cation electrolytes as studied over a wide range of currents (from mA to A) in either the M = Na electrolyte at 400 °C or the M = Li electrolyte at 500 °C, 600 °C, or 700 °C. At relatively high current densities (0.5 A through 3.75 cm 2 planar electrodes), the electrolysis potential averaged respec-tively at 700 °C, 600 °C, and 500 °C 1.42, 1.52, and 1.66 V in the mixed lithium hydroxide/carbonate electrolyte, and 1.32, 1.49, and 1.63 V in the pure LiOH electrolyte. Finally, a comparison of three different single alkali cation electrolytes MOH:M 2 CO 3 , for M = either Li, Na, or K, was compared under similar elec-trolysis conditions. Each electrolysis was conducted at 500 °C and 1 A, and in electrolytes containing 15 mol% M 2 CO 3 and 85 mol% MOH. The electrolyses occurred at average potentials of 2.13 (M = Li), 2.31 (M = Na), and 1.57 V (for M = K). In the Li and Na electrolyses, both cathode and anode were clean (after washing off solidifi ed electrolyte) after the electrolysis ( Figure 2 , top left). However, during the M = K electrolysis, a grey deposit
Adv. Energy Mater. 2015, 5, 1401791
www.MaterialsViews.comwww.advenergymat.de
Figure 1. Carbonate–hydroxide binary phase diagrams in pure Li, Na, or K systems (top, using data from ref. [ 29 ] ) or in a mixed Li, Na, K carbonate with KOH (bottom, using data from ref. [ 27 ] ). The liquidus areas (above the curves) provide a low temperature molten domain for STEP water and carbon dioxide splitting. The low temperature ensures suffi cient hydration within the molten hydroxide component for hydrogen generation, and the simultaneous presence of carbonate in the molten mix provides the opportunity of the co-generation of carbon fuels.
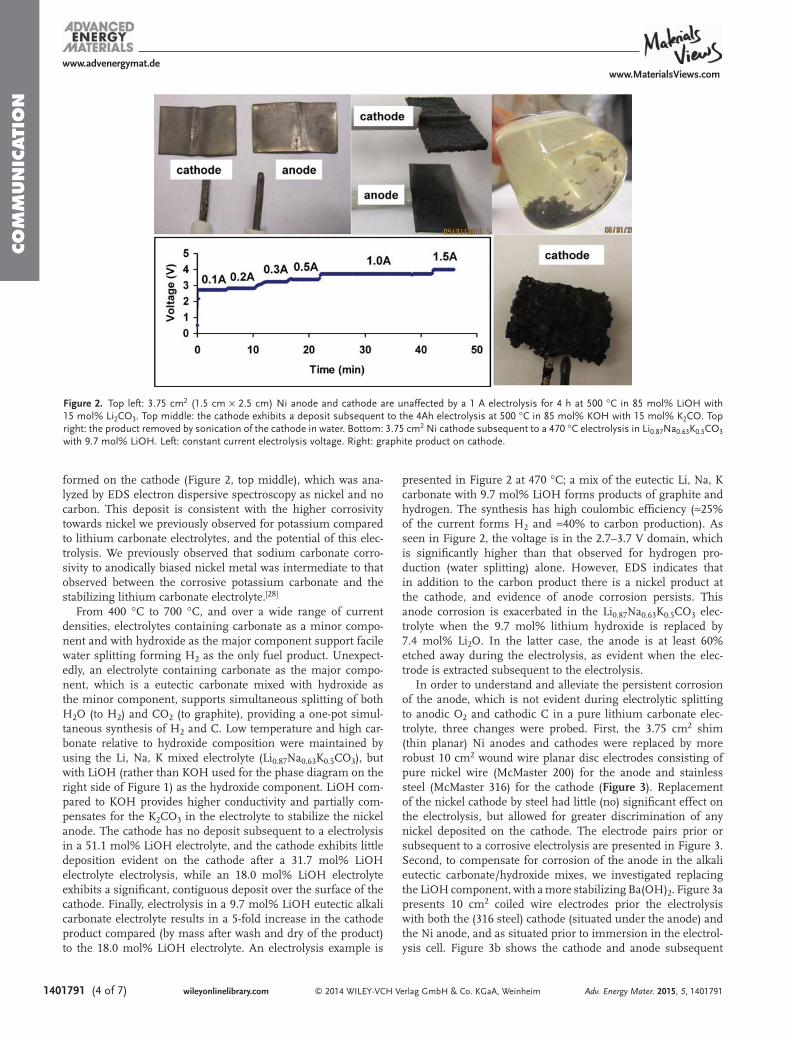
COM
MUN
ICATI
ON
© 2014 WILEY-VCH Verlag GmbH & Co. KGaA, Weinheim1401791 (4 of 7) wileyonlinelibrary.com
formed on the cathode (Figure 2 , top middle), which was ana-lyzed by EDS electron dispersive spectroscopy as nickel and no carbon. This deposit is consistent with the higher corrosivity towards nickel we previously observed for potassium compared to lithium carbonate electrolytes, and the potential of this elec-trolysis. We previously observed that sodium carbonate corro-sivity to anodically biased nickel metal was intermediate to that observed between the corrosive potassium carbonate and the stabilizing lithium carbonate electrolyte. [ 28 ]
From 400 °C to 700 °C, and over a wide range of current densities, electrolytes containing carbonate as a minor compo-nent and with hydroxide as the major component support facile water splitting forming H 2 as the only fuel product. Unexpect-edly, an electrolyte containing carbonate as the major compo-nent, which is a eutectic carbonate mixed with hydroxide as the minor component, supports simultaneous splitting of both H 2 O (to H 2 ) and CO 2 (to graphite), providing a one-pot simul-taneous synthesis of H 2 and C. Low temperature and high car-bonate relative to hydroxide composition were maintained by using the Li, Na, K mixed electrolyte (Li 0.87 Na 0.63 K 0.5 CO 3 ), but with LiOH (rather than KOH used for the phase diagram on the right side of Figure 1 ) as the hydroxide component. LiOH com-pared to KOH provides higher conductivity and partially com-pensates for the K 2 CO 3 in the electrolyte to stabilize the nickel anode. The cathode has no deposit subsequent to a electrolysis in a 51.1 mol% LiOH electrolyte, and the cathode exhibits little deposition evident on the cathode after a 31.7 mol% LiOH electrolyte electrolysis, while an 18.0 mol% LiOH electrolyte exhibits a signifi cant, contiguous deposit over the surface of the cathode. Finally, electrolysis in a 9.7 mol% LiOH eutectic alkali carbonate electrolyte results in a 5-fold increase in the cathode product compared (by mass after wash and dry of the product) to the 18.0 mol% LiOH electrolyte. An electrolysis example is
presented in Figure 2 at 470 °C; a mix of the eutectic Li, Na, K carbonate with 9.7 mol% LiOH forms products of graphite and hydrogen. The synthesis has high coulombic effi ciency (≈25% of the current forms H 2 and ≈40% to carbon production). As seen in Figure 2 , the voltage is in the 2.7–3.7 V domain, which is signifi cantly higher than that observed for hydrogen pro-duction (water splitting) alone. However, EDS indicates that in addition to the carbon product there is a nickel product at the cathode, and evidence of anode corrosion persists. This anode corrosion is exacerbated in the Li 0.87 Na 0.63 K 0.5 CO 3 elec-trolyte when the 9.7 mol% lithium hydroxide is replaced by 7.4 mol% Li 2 O. In the latter case, the anode is at least 60% etched away during the electrolysis, as evident when the elec-trode is extracted subsequent to the electrolysis.
In order to understand and alleviate the persistent corrosion of the anode, which is not evident during electrolytic splitting to anodic O 2 and cathodic C in a pure lithium carbonate elec-trolyte, three changes were probed. First, the 3.75 cm 2 shim (thin planar) Ni anodes and cathodes were replaced by more robust 10 cm 2 wound wire planar disc electrodes consisting of pure nickel wire (McMaster 200) for the anode and stainless steel (McMaster 316) for the cathode ( Figure 3 ). Replacement of the nickel cathode by steel had little (no) signifi cant effect on the electrolysis, but allowed for greater discrimination of any nickel deposited on the cathode. The electrode pairs prior or subsequent to a corrosive electrolysis are presented in Figure 3 . Second, to compensate for corrosion of the anode in the alkali eutectic carbonate/hydroxide mixes, we investigated replacing the LiOH component, with a more stabilizing Ba(OH) 2 . Figure 3 a presents 10 cm 2 coiled wire electrodes prior the electrolysis with both the (316 steel) cathode (situated under the anode) and the Ni anode, and as situated prior to immersion in the electrol-ysis cell. Figure 3 b shows the cathode and anode subsequent
Adv. Energy Mater. 2015, 5, 1401791
www.MaterialsViews.comwww.advenergymat.de
Figure 2. Top left: 3.75 cm 2 (1.5 cm × 2.5 cm) Ni anode and cathode are unaffected by a 1 A electrolysis for 4 h at 500 °C in 85 mol% LiOH with 15 mol% Li 2 CO 3 . Top middle: the cathode exhibits a deposit subsequent to the 4Ah electrolysis at 500 °C in 85 mol% KOH with 15 mol% K 2 CO. Top right: the product removed by sonication of the cathode in water. Bottom: 3.75 cm 2 Ni cathode subsequent to a 470 °C electrolysis in Li 0.87 Na 0.63 K 0.5 CO 3 with 9.7 mol% LiOH. Left: constant current electrolysis voltage. Right: graphite product on cathode.
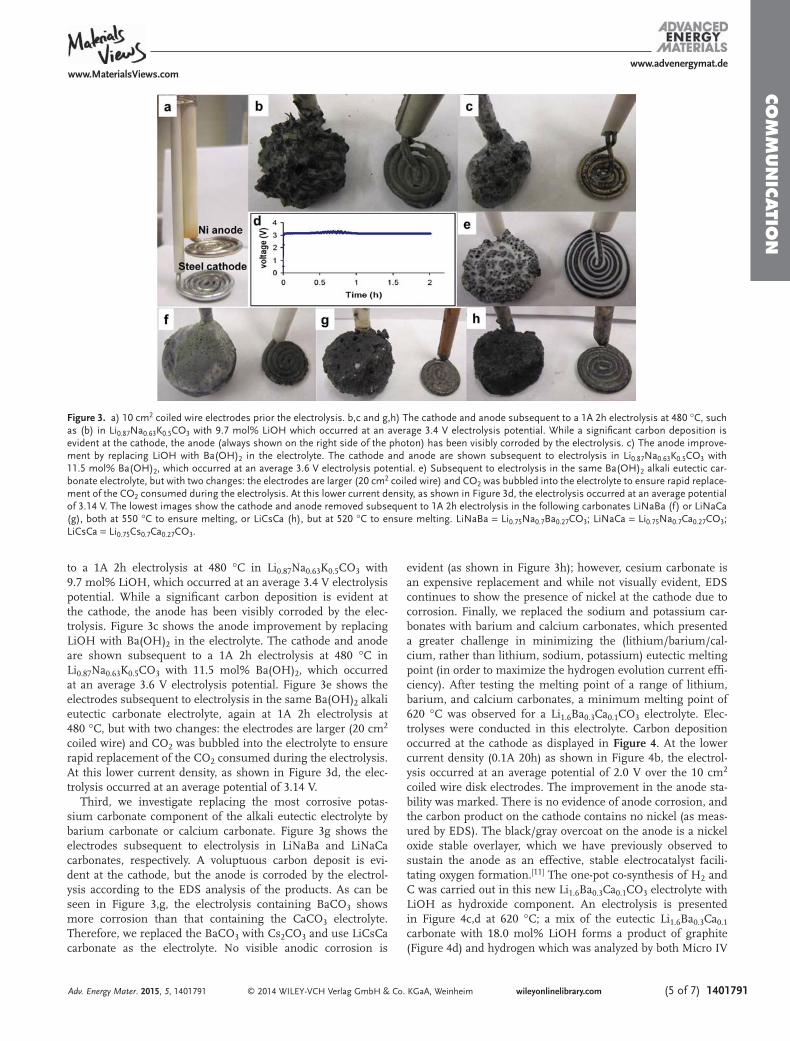
COM
MUN
ICATIO
N
© 2014 WILEY-VCH Verlag GmbH & Co. KGaA, Weinheim (5 of 7) 1401791wileyonlinelibrary.com
to a 1A 2h electrolysis at 480 °C in Li 0.87 Na 0.63 K 0.5 CO 3 with 9.7 mol% LiOH, which occurred at an average 3.4 V electrolysis potential. While a signifi cant carbon deposition is evident at the cathode, the anode has been visibly corroded by the elec-trolysis. Figure 3 c shows the anode improvement by replacing LiOH with Ba(OH) 2 in the electrolyte. The cathode and anode are shown subsequent to a 1A 2h electrolysis at 480 °C in Li 0.87 Na 0.63 K 0.5 CO 3 with 11.5 mol% Ba(OH) 2 , which occurred at an average 3.6 V electrolysis potential. Figure 3 e shows the electrodes subsequent to electrolysis in the same Ba(OH) 2 alkali eutectic carbonate electrolyte, again at 1A 2h electrolysis at 480 °C, but with two changes: the electrodes are larger (20 cm 2 coiled wire) and CO 2 was bubbled into the electrolyte to ensure rapid replacement of the CO 2 consumed during the electrolysis. At this lower current density, as shown in Figure 3 d, the elec-trolysis occurred at an average potential of 3.14 V.
Third, we investigate replacing the most corrosive potas-sium carbonate component of the alkali eutectic electrolyte by barium carbonate or calcium carbonate. Figure 3 g shows the electrodes subsequent to electrolysis in LiNaBa and LiNaCa carbonates, respectively. A voluptuous carbon deposit is evi-dent at the cathode, but the anode is corroded by the electrol-ysis according to the EDS analysis of the products. As can be seen in Figure 3 ,g, the electrolysis containing BaCO 3 shows more corrosion than that containing the CaCO 3 electrolyte. Therefore, we replaced the BaCO 3 with Cs 2 CO 3 and use LiCsCa carbonate as the electrolyte. No visible anodic corrosion is
evident (as shown in Figure 3 h); however, cesium carbonate is an expensive replacement and while not visually evident, EDS continues to show the presence of nickel at the cathode due to corrosion. Finally, we replaced the sodium and potassium car-bonates with barium and calcium carbonates, which presented a greater challenge in minimizing the (lithium/barium/cal-cium, rather than lithium, sodium, potassium) eutectic melting point (in order to maximize the hydrogen evolution current effi -ciency). After testing the melting point of a range of lithium, barium, and calcium carbonates, a minimum melting point of 620 °C was observed for a Li 1.6 Ba 0.3 Ca 0.1 CO 3 electrolyte. Elec-trolyses were conducted in this electrolyte. Carbon deposition occurred at the cathode as displayed in Figure 4 . At the lower current density (0.1A 20h) as shown in Figure 4 b, the electrol-ysis occurred at an average potential of 2.0 V over the 10 cm 2 coiled wire disk electrodes. The improvement in the anode sta-bility was marked. There is no evidence of anode corrosion, and the carbon product on the cathode contains no nickel (as meas-ured by EDS). The black/gray overcoat on the anode is a nickel oxide stable overlayer, which we have previously observed to sustain the anode as an effective, stable electrocatalyst facili-tating oxygen formation. [ 11 ] The one-pot co-synthesis of H 2 and C was carried out in this new Li 1.6 Ba 0.3 Ca 0.1 CO 3 electrolyte with LiOH as hydroxide component. An electrolysis is presented in Figure 4 c,d at 620 °C; a mix of the eutectic Li 1.6 Ba 0.3 Ca 0.1 carbonate with 18.0 mol% LiOH forms a product of graphite (Figure 4 d) and hydrogen which was analyzed by both Micro IV
Adv. Energy Mater. 2015, 5, 1401791
www.MaterialsViews.comwww.advenergymat.de
Figure 3. a) 10 cm 2 coiled wire electrodes prior the electrolysis. b,c and g,h) The cathode and anode subsequent to a 1A 2h electrolysis at 480 °C, such as (b) in Li 0.87 Na 0.63 K 0.5 CO 3 with 9.7 mol% LiOH which occurred at an average 3.4 V electrolysis potential. While a signifi cant carbon deposition is evident at the cathode, the anode (always shown on the right side of the photon) has been visibly corroded by the electrolysis. c) The anode improve-ment by replacing LiOH with Ba(OH) 2 in the electrolyte. The cathode and anode are shown subsequent to electrolysis in Li 0.87 Na 0.63 K 0.5 CO 3 with 11.5 mol% Ba(OH) 2 , which occurred at an average 3.6 V electrolysis potential. e) Subsequent to electrolysis in the same Ba(OH) 2 alkali eutectic car-bonate electrolyte, but with two changes: the electrodes are larger (20 cm 2 coiled wire) and CO 2 was bubbled into the electrolyte to ensure rapid replace-ment of the CO 2 consumed during the electrolysis. At this lower current density, as shown in Figure 3 d, the electrolysis occurred at an average potential of 3.14 V. The lowest images show the cathode and anode removed subsequent to 1A 2h electrolysis in the following carbonates LiNaBa (f) or LiNaCa (g), both at 550 °C to ensure melting, or LiCsCa (h), but at 520 °C to ensure melting. LiNaBa = Li 0.75 Na 0.7 Ba 0.27 CO 3 ; LiNaCa = Li 0.75 Na 0.7 Ca 0.27 CO 3 ; LiCsCa = Li 0.75 Cs 0.7 Ca 0.27 CO 3 .
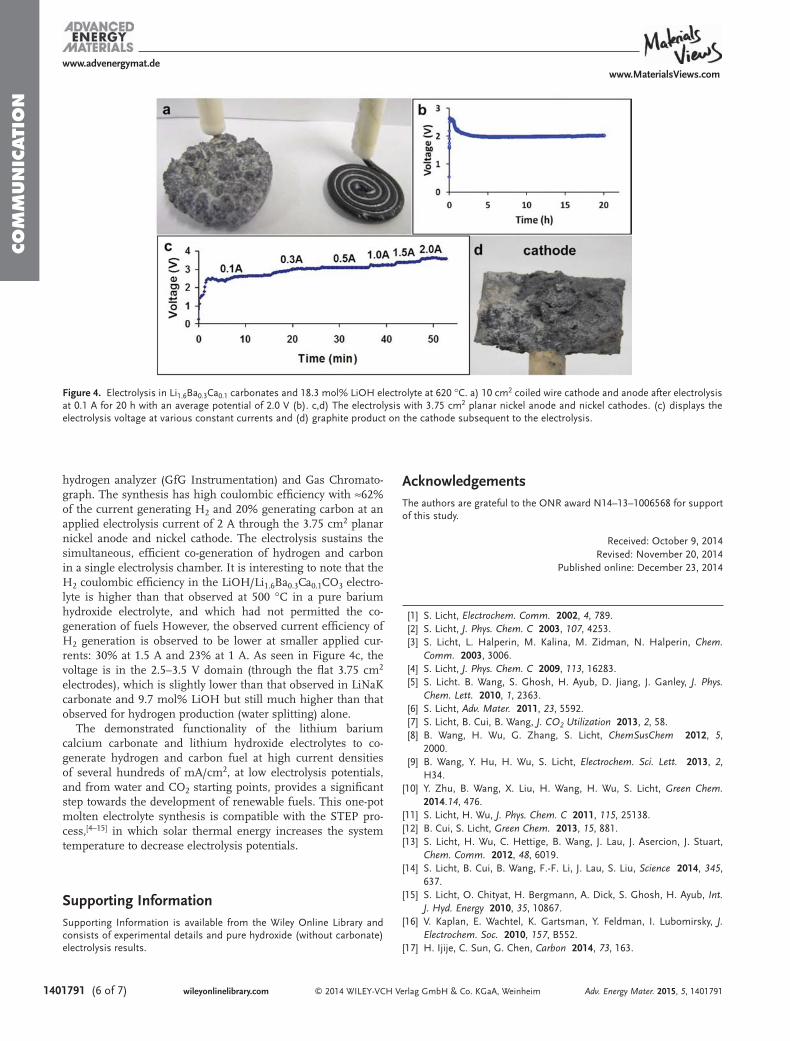
COM
MUN
ICATI
ON
© 2014 WILEY-VCH Verlag GmbH & Co. KGaA, Weinheim1401791 (6 of 7) wileyonlinelibrary.com Adv. Energy Mater. 2015, 5, 1401791
www.MaterialsViews.comwww.advenergymat.de
hydrogen analyzer (GfG Instrumentation) and Gas Chromato-graph. The synthesis has high coulombic effi ciency with ≈62% of the current generating H 2 and 20% generating carbon at an applied electrolysis current of 2 A through the 3.75 cm 2 planar nickel anode and nickel cathode. The electrolysis sustains the simultaneous, effi cient co-generation of hydrogen and carbon in a single electrolysis chamber. It is interesting to note that the H 2 coulombic effi ciency in the LiOH/Li 1.6 Ba 0.3 Ca 0.1 CO 3 electro-lyte is higher than that observed at 500 °C in a pure barium hydroxide electrolyte, and which had not permitted the co-generation of fuels However, the observed current effi ciency of H 2 generation is observed to be lower at smaller applied cur-rents: 30% at 1.5 A and 23% at 1 A. As seen in Figure 4 c, the voltage is in the 2.5–3.5 V domain (through the fl at 3.75 cm 2 electrodes), which is slightly lower than that observed in LiNaK carbonate and 9.7 mol% LiOH but still much higher than that observed for hydrogen production (water splitting) alone.
The demonstrated functionality of the lithium barium calcium carbonate and lithium hydroxide electrolytes to co-generate hydrogen and carbon fuel at high current densities of several hundreds of mA/cm 2 , at low electrolysis potentials, and from water and CO 2 starting points, provides a signifi cant step towards the development of renewable fuels. This one-pot molten electrolyte synthesis is compatible with the STEP pro-cess, [ 4–15 ] in which solar thermal energy increases the system temperature to decrease electrolysis potentials.
Supporting Information Supporting Information is available from the Wiley Online Library and consists of experimental details and pure hydroxide (without carbonate) electrolysis results.
Acknowledgements The authors are grateful to the ONR award N14–13–1006568 for support of this study.
Received: October 9, 2014 Revised: November 20, 2014
Published online: December 23, 2014
[1] S. Licht , Electrochem. Comm. 2002 , 4 , 789 . [2] S. Licht , J. Phys. Chem. C 2003 , 107 , 4253 . [3] S. Licht , L. Halperin , M. Kalina , M. Zidman , N. Halperin , Chem.
Comm. 2003 , 3006 . [4] S. Licht , J. Phys. Chem. C 2009 , 113 , 16283 . [5] S. Licht . B. Wang , S. Ghosh , H. Ayub , D. Jiang , J. Ganley , J. Phys.
Chem. Lett. 2010 , 1 , 2363 . [6] S. Licht , Adv. Mater. 2011 , 23 , 5592 . [7] S. Licht , B. Cui , B. Wang , J. CO2 Utilization 2013 , 2 , 58 . [8] B. Wang , H. Wu , G. Zhang , S. Licht , ChemSusChem 2012 , 5 ,
2000 . [9] B. Wang , Y. Hu , H. Wu , S. Licht , Electrochem. Sci. Lett. 2013 , 2 ,
H34 . [10] Y. Zhu , B. Wang , X. Liu , H. Wang , H. Wu , S. Licht , Green Chem.
2014 . 14 , 476 . [11] S. Licht , H . Wu , J. Phys. Chem. C 2011 , 115 , 25138 . [12] B. Cui , S. Licht , Green Chem. 2013 , 15 , 881 . [13] S. Licht , H. Wu , C. Hettige , B. Wang , J. Lau , J. Asercion , J. Stuart ,
Chem. Comm. 2012 , 48 , 6019 . [14] S. Licht , B. Cui , B. Wang , F.-F. Li , J. Lau , S. Liu , Science 2014 , 345 ,
637 . [15] S. Licht , O. Chityat , H. Bergmann , A. Dick , S. Ghosh , H. Ayub , Int.
J. Hyd. Energy 2010 , 35 , 10867 . [16] V. Kaplan , E. Wachtel , K. Gartsman , Y. Feldman , I. Lubomirsky , J.
Electrochem. Soc. 2010 , 157 , B552 . [17] H. Ijije , C . Sun , G. Chen , Carbon 2014 , 73 , 163 .
Figure 4. Electrolysis in Li 1.6 Ba 0.3 Ca 0.1 carbonates and 18.3 mol% LiOH electrolyte at 620 °C. a) 10 cm 2 coiled wire cathode and anode after electrolysis at 0.1 A for 20 h with an average potential of 2.0 V (b). c,d) The electrolysis with 3.75 cm 2 planar nickel anode and nickel cathodes. (c) displays the electrolysis voltage at various constant currents and (d) graphite product on the cathode subsequent to the electrolysis.

COM
MUN
ICATIO
N
© 2014 WILEY-VCH Verlag GmbH & Co. KGaA, Weinheim (7 of 7) 1401791wileyonlinelibrary.comAdv. Energy Mater. 2015, 5, 1401791
www.MaterialsViews.comwww.advenergymat.de
[18] A. Andrews , J. Logan , Fischer-Tropsch Fuels from Coal, Natural Gas, and Biomass: Background and Policy. Congressional Research Service Report for Congress 2008 , RL34133, (March 27, 2008); available at: http://assets.opencrs.com/rpts/RL34133_20080327.pdf; http://www.congressionalresearch.com/RL34133/document. php?study = Fischer-Tropsch+Fuels+from+Coal+Natural+ Gas+and+Biomass+Background+and+Policy .
[19] J. Divisek , J. Mergel , H. F. Nissen , Int. J. Hyd. Energy 1980 , 5 , 151 . [20] J. Ganley , Int. J. Hyd. Energy 2009 , 4 , 3604 . [21] M. Maurice , A. Erb , G. Ado , C. R. Acad. Sci. Paris 1971 , 272 , 842 . [22] L. V. Gurvich , G. A. Bergman , L. N. Gorokhov , J. Phys. Chem.
Ref. Data 1996 , 25 , 1225 .
[23] Z. Zhang , Z. Wang , Z. , eds, Principles and Applications of Molten Salt Electrochemistry , 2006 , Chemical Industry Press , Beijing , p. 191 .
[24] T. Kojima , Y. Miyazaki , K. Nomura , K. Tanimoto , J. Electrochem. Soc. 2008 , 155 , F150 .
[25] S. Licht , B. Cui , J. Stuart , B. Wang , J. Lau , Energy Env. Sci. 2013 , 6 , 3646 . [26] B. Cui , S. Licht , J. Mat. Chem. A 2014 , 2 , 10577 . [27] R. I. Olivares , C. Chen , S. Wright , J. Solar Energy Eng. 2012 , 134 ,
41002 . [28] S. Licht , Stabilization of STEP electrolytes 2012 (accessed: Dec
2014) , http://arxiv.org/pdf/1209.3512.pdf . [29] FACT Salt Phase Diagrams (accessed: De. 2104) , http://www.crct.
polymtl.ca/fact/documentation/FTsalt/FTsalt_Figs.htm
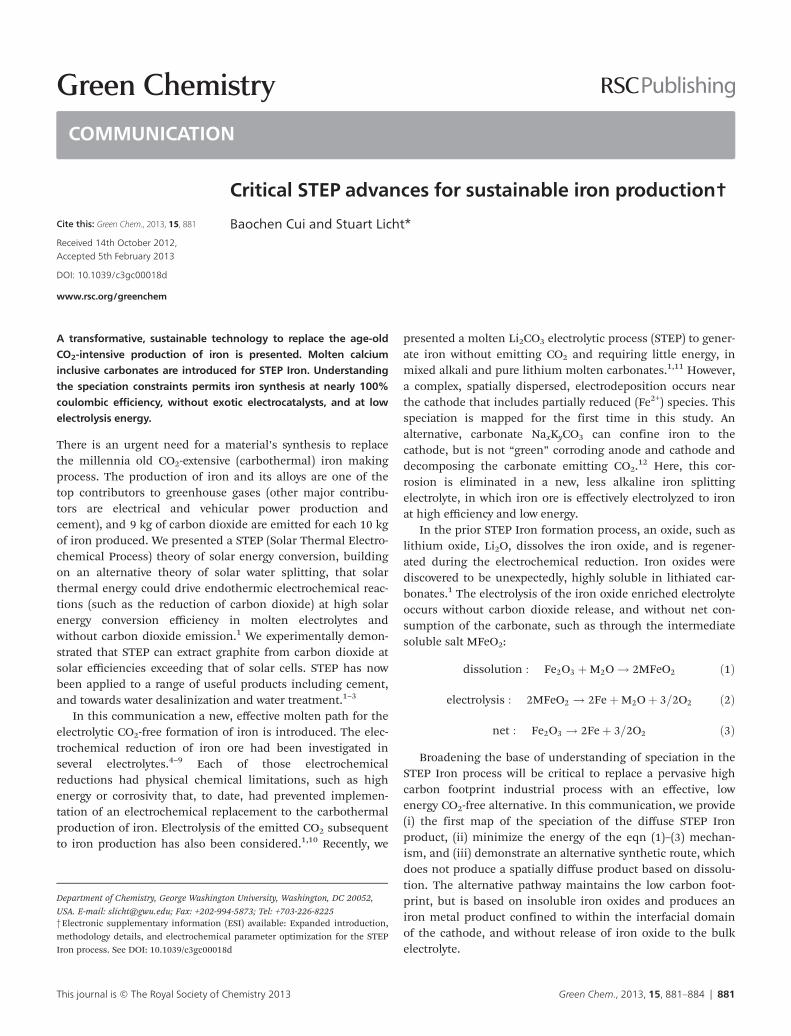
Green ChemistryCOMMUNICATION
Cite this: Green Chem., 2013, 15, 881
Received 14th October 2012,Accepted 5th February 2013
DOI: 10.1039/c3gc00018d
www.rsc.org/greenchem
Critical STEP advances for sustainable iron production†
Baochen Cui and Stuart Licht*
A transformative, sustainable technology to replace the age-oldCO2-intensive production of iron is presented. Molten calciuminclusive carbonates are introduced for STEP Iron. Understandingthe speciation constraints permits iron synthesis at nearly 100%coulombic efficiency, without exotic electrocatalysts, and at lowelectrolysis energy.
There is an urgent need for a material’s synthesis to replacethe millennia old CO2-extensive (carbothermal) iron makingprocess. The production of iron and its alloys are one of thetop contributors to greenhouse gases (other major contribu-tors are electrical and vehicular power production andcement), and 9 kg of carbon dioxide are emitted for each 10 kgof iron produced. We presented a STEP (Solar Thermal Electro-chemical Process) theory of solar energy conversion, buildingon an alternative theory of solar water splitting, that solarthermal energy could drive endothermic electrochemical reac-tions (such as the reduction of carbon dioxide) at high solarenergy conversion efficiency in molten electrolytes andwithout carbon dioxide emission.1 We experimentally demon-strated that STEP can extract graphite from carbon dioxide atsolar efficiencies exceeding that of solar cells. STEP has nowbeen applied to a range of useful products including cement,and towards water desalinization and water treatment.1–3
In this communication a new, effective molten path for theelectrolytic CO2-free formation of iron is introduced. The elec-trochemical reduction of iron ore had been investigated inseveral electrolytes.4–9 Each of those electrochemicalreductions had physical chemical limitations, such as highenergy or corrosivity that, to date, had prevented implemen-tation of an electrochemical replacement to the carbothermalproduction of iron. Electrolysis of the emitted CO2 subsequentto iron production has also been considered.1,10 Recently, we
presented a molten Li2CO3 electrolytic process (STEP) to gener-ate iron without emitting CO2 and requiring little energy, inmixed alkali and pure lithium molten carbonates.1,11 However,a complex, spatially dispersed, electrodeposition occurs nearthe cathode that includes partially reduced (Fe2+) species. Thisspeciation is mapped for the first time in this study. Analternative, carbonate NaxKyCO3 can confine iron to thecathode, but is not “green” corroding anode and cathode anddecomposing the carbonate emitting CO2.12 Here, this cor-rosion is eliminated in a new, less alkaline iron splittingelectrolyte, in which iron ore is effectively electrolyzed to ironat high efficiency and low energy.
In the prior STEP Iron formation process, an oxide, such aslithium oxide, Li2O, dissolves the iron oxide, and is regener-ated during the electrochemical reduction. Iron oxides werediscovered to be unexpectedly, highly soluble in lithiated car-bonates.1 The electrolysis of the iron oxide enriched electrolyteoccurs without carbon dioxide release, and without net con-sumption of the carbonate, such as through the intermediatesoluble salt MFeO2:
dissolution : Fe2O3 þM2O ! 2MFeO2 ð1Þ
electrolysis : 2MFeO2 ! 2FeþM2Oþ 3=2O2 ð2Þ
net : Fe2O3 ! 2Feþ 3=2O2 ð3Þ
Broadening the base of understanding of speciation in theSTEP Iron process will be critical to replace a pervasive highcarbon footprint industrial process with an effective, lowenergy CO2-free alternative. In this communication, we provide(i) the first map of the speciation of the diffuse STEP Ironproduct, (ii) minimize the energy of the eqn (1)–(3) mechan-ism, and (iii) demonstrate an alternative synthetic route, whichdoes not produce a spatially diffuse product based on dissolu-tion. The alternative pathway maintains the low carbon foot-print, but is based on insoluble iron oxides and produces aniron metal product confined to within the interfacial domainof the cathode, and without release of iron oxide to the bulkelectrolyte.
†Electronic supplementary information (ESI) available: Expanded introduction,methodology details, and electrochemical parameter optimization for the STEPIron process. See DOI: 10.1039/c3gc00018d
Department of Chemistry, George Washington University, Washington, DC 20052,USA. E-mail: [email protected]; Fax: +202-994-5873; Tel: +703-226-8225
This journal is © The Royal Society of Chemistry 2013 Green Chem., 2013, 15, 881–884 | 881
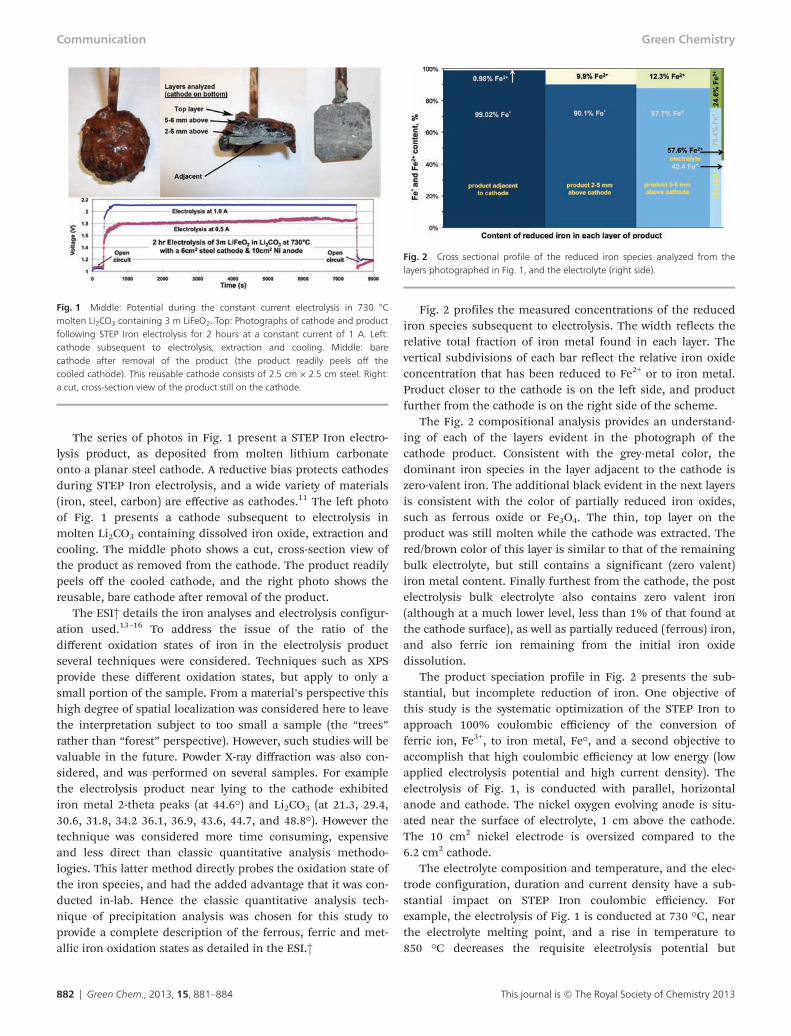
The series of photos in Fig. 1 present a STEP Iron electro-lysis product, as deposited from molten lithium carbonateonto a planar steel cathode. A reductive bias protects cathodesduring STEP Iron electrolysis, and a wide variety of materials(iron, steel, carbon) are effective as cathodes.11 The left photoof Fig. 1 presents a cathode subsequent to electrolysis inmolten Li2CO3 containing dissolved iron oxide, extraction andcooling. The middle photo shows a cut, cross-section view ofthe product as removed from the cathode. The product readilypeels off the cooled cathode, and the right photo shows thereusable, bare cathode after removal of the product.
The ESI† details the iron analyses and electrolysis configur-ation used.13–16 To address the issue of the ratio of thedifferent oxidation states of iron in the electrolysis productseveral techniques were considered. Techniques such as XPSprovide these different oxidation states, but apply to only asmall portion of the sample. From a material’s perspective thishigh degree of spatial localization was considered here to leavethe interpretation subject to too small a sample (the “trees”rather than “forest” perspective). However, such studies will bevaluable in the future. Powder X-ray diffraction was also con-sidered, and was performed on several samples. For examplethe electrolysis product near lying to the cathode exhibitediron metal 2-theta peaks (at 44.6°) and Li2CO3 (at 21.3, 29.4,30.6, 31.8, 34.2 36.1, 36.9, 43.6, 44.7, and 48.8°). However thetechnique was considered more time consuming, expensiveand less direct than classic quantitative analysis methodo-logies. This latter method directly probes the oxidation state ofthe iron species, and had the added advantage that it was con-ducted in-lab. Hence the classic quantitative analysis tech-nique of precipitation analysis was chosen for this study toprovide a complete description of the ferrous, ferric and met-allic iron oxidation states as detailed in the ESI.†
Fig. 2 profiles the measured concentrations of the reducediron species subsequent to electrolysis. The width reflects therelative total fraction of iron metal found in each layer. Thevertical subdivisions of each bar reflect the relative iron oxideconcentration that has been reduced to Fe2+ or to iron metal.Product closer to the cathode is on the left side, and productfurther from the cathode is on the right side of the scheme.
The Fig. 2 compositional analysis provides an understand-ing of each of the layers evident in the photograph of thecathode product. Consistent with the grey-metal color, thedominant iron species in the layer adjacent to the cathode iszero-valent iron. The additional black evident in the next layersis consistent with the color of partially reduced iron oxides,such as ferrous oxide or Fe3O4. The thin, top layer on theproduct was still molten while the cathode was extracted. Thered/brown color of this layer is similar to that of the remainingbulk electrolyte, but still contains a significant (zero valent)iron metal content. Finally furthest from the cathode, the postelectrolysis bulk electrolyte also contains zero valent iron(although at a much lower level, less than 1% of that found atthe cathode surface), as well as partially reduced (ferrous) iron,and also ferric ion remaining from the initial iron oxidedissolution.
The product speciation profile in Fig. 2 presents the sub-stantial, but incomplete reduction of iron. One objective ofthis study is the systematic optimization of the STEP Iron toapproach 100% coulombic efficiency of the conversion offerric ion, Fe3+, to iron metal, Fe°, and a second objective toaccomplish that high coulombic efficiency at low energy (lowapplied electrolysis potential and high current density). Theelectrolysis of Fig. 1, is conducted with parallel, horizontalanode and cathode. The nickel oxygen evolving anode is situ-ated near the surface of electrolyte, 1 cm above the cathode.The 10 cm2 nickel electrode is oversized compared to the6.2 cm2 cathode.
The electrolyte composition and temperature, and the elec-trode configuration, duration and current density have a sub-stantial impact on STEP Iron coulombic efficiency. Forexample, the electrolysis of Fig. 1 is conducted at 730 °C, nearthe electrolyte melting point, and a rise in temperature to850 °C decreases the requisite electrolysis potential but
Fig. 1 Middle: Potential during the constant current electrolysis in 730 °Cmolten Li2CO3 containing 3 m LiFeO2. Top: Photographs of cathode and productfollowing STEP Iron electrolysis for 2 hours at a constant current of 1 A. Left:cathode subsequent to electrolysis, extraction and cooling. Middle: barecathode after removal of the product (the product readily peels off thecooled cathode). This reusable cathode consists of 2.5 cm × 2.5 cm steel. Right:a cut, cross-section view of the product still on the cathode.
Fig. 2 Cross sectional profile of the reduced iron species analyzed from thelayers photographed in Fig. 1, and the electrolyte (right side).
Communication Green Chemistry
882 | Green Chem., 2013, 15, 881–884 This journal is © The Royal Society of Chemistry 2013
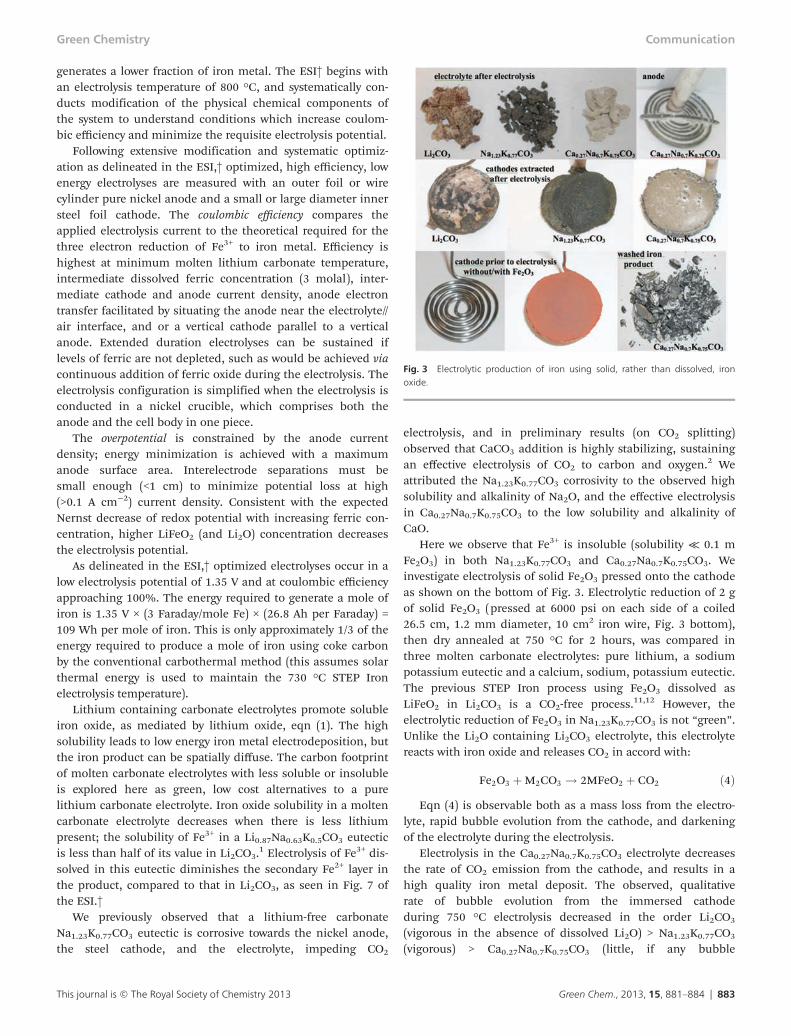
generates a lower fraction of iron metal. The ESI† begins withan electrolysis temperature of 800 °C, and systematically con-ducts modification of the physical chemical components ofthe system to understand conditions which increase coulom-bic efficiency and minimize the requisite electrolysis potential.
Following extensive modification and systematic optimiz-ation as delineated in the ESI,† optimized, high efficiency, lowenergy electrolyses are measured with an outer foil or wirecylinder pure nickel anode and a small or large diameter innersteel foil cathode. The coulombic efficiency compares theapplied electrolysis current to the theoretical required for thethree electron reduction of Fe3+ to iron metal. Efficiency ishighest at minimum molten lithium carbonate temperature,intermediate dissolved ferric concentration (3 molal), inter-mediate cathode and anode current density, anode electrontransfer facilitated by situating the anode near the electrolyte//air interface, and or a vertical cathode parallel to a verticalanode. Extended duration electrolyses can be sustained iflevels of ferric are not depleted, such as would be achieved viacontinuous addition of ferric oxide during the electrolysis. Theelectrolysis configuration is simplified when the electrolysis isconducted in a nickel crucible, which comprises both theanode and the cell body in one piece.
The overpotential is constrained by the anode currentdensity; energy minimization is achieved with a maximumanode surface area. Interelectrode separations must besmall enough (<1 cm) to minimize potential loss at high(>0.1 A cm−2) current density. Consistent with the expectedNernst decrease of redox potential with increasing ferric con-centration, higher LiFeO2 (and Li2O) concentration decreasesthe electrolysis potential.
As delineated in the ESI,† optimized electrolyses occur in alow electrolysis potential of 1.35 V and at coulombic efficiencyapproaching 100%. The energy required to generate a mole ofiron is 1.35 V × (3 Faraday/mole Fe) × (26.8 Ah per Faraday) =109 Wh per mole of iron. This is only approximately 1/3 of theenergy required to produce a mole of iron using coke carbonby the conventional carbothermal method (this assumes solarthermal energy is used to maintain the 730 °C STEP Ironelectrolysis temperature).
Lithium containing carbonate electrolytes promote solubleiron oxide, as mediated by lithium oxide, eqn (1). The highsolubility leads to low energy iron metal electrodeposition, butthe iron product can be spatially diffuse. The carbon footprintof molten carbonate electrolytes with less soluble or insolubleis explored here as green, low cost alternatives to a purelithium carbonate electrolyte. Iron oxide solubility in a moltencarbonate electrolyte decreases when there is less lithiumpresent; the solubility of Fe3+ in a Li0.87Na0.63K0.5CO3 eutecticis less than half of its value in Li2CO3.1 Electrolysis of Fe3+ dis-solved in this eutectic diminishes the secondary Fe2+ layer inthe product, compared to that in Li2CO3, as seen in Fig. 7 ofthe ESI.†
We previously observed that a lithium-free carbonateNa1.23K0.77CO3 eutectic is corrosive towards the nickel anode,the steel cathode, and the electrolyte, impeding CO2
electrolysis, and in preliminary results (on CO2 splitting)observed that CaCO3 addition is highly stabilizing, sustainingan effective electrolysis of CO2 to carbon and oxygen.2 Weattributed the Na1.23K0.77CO3 corrosivity to the observed highsolubility and alkalinity of Na2O, and the effective electrolysisin Ca0.27Na0.7K0.75CO3 to the low solubility and alkalinity ofCaO.
Here we observe that Fe3+ is insoluble (solubility ≪ 0.1 mFe2O3) in both Na1.23K0.77CO3 and Ca0.27Na0.7K0.75CO3. Weinvestigate electrolysis of solid Fe2O3 pressed onto the cathodeas shown on the bottom of Fig. 3. Electrolytic reduction of 2 gof solid Fe2O3 (pressed at 6000 psi on each side of a coiled26.5 cm, 1.2 mm diameter, 10 cm2 iron wire, Fig. 3 bottom),then dry annealed at 750 °C for 2 hours, was compared inthree molten carbonate electrolytes: pure lithium, a sodiumpotassium eutectic and a calcium, sodium, potassium eutectic.The previous STEP Iron process using Fe2O3 dissolved asLiFeO2 in Li2CO3 is a CO2-free process.11,12 However, theelectrolytic reduction of Fe2O3 in Na1.23K0.77CO3 is not “green”.Unlike the Li2O containing Li2CO3 electrolyte, this electrolytereacts with iron oxide and releases CO2 in accord with:
Fe2O3 þM2CO3 ! 2MFeO2 þ CO2 ð4Þ
Eqn (4) is observable both as a mass loss from the electro-lyte, rapid bubble evolution from the cathode, and darkeningof the electrolyte during the electrolysis.
Electrolysis in the Ca0.27Na0.7K0.75CO3 electrolyte decreasesthe rate of CO2 emission from the cathode, and results in ahigh quality iron metal deposit. The observed, qualitativerate of bubble evolution from the immersed cathodeduring 750 °C electrolysis decreased in the order Li2CO3
(vigorous in the absence of dissolved Li2O) > Na1.23K0.77CO3
(vigorous) > Ca0.27Na0.7K0.75CO3 (little, if any bubble
Fig. 3 Electrolytic production of iron using solid, rather than dissolved, ironoxide.
Green Chemistry Communication
This journal is © The Royal Society of Chemistry 2013 Green Chem., 2013, 15, 881–884 | 883
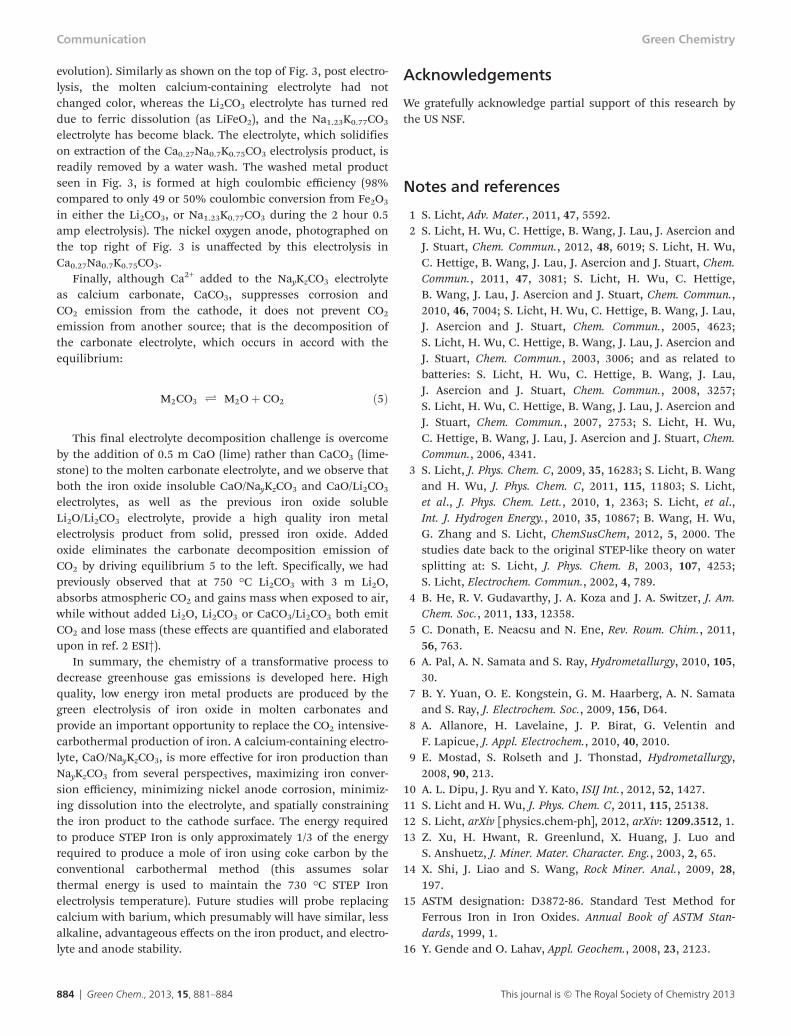
evolution). Similarly as shown on the top of Fig. 3, post electro-lysis, the molten calcium-containing electrolyte had notchanged color, whereas the Li2CO3 electrolyte has turned reddue to ferric dissolution (as LiFeO2), and the Na1.23K0.77CO3
electrolyte has become black. The electrolyte, which solidifieson extraction of the Ca0.27Na0.7K0.75CO3 electrolysis product, isreadily removed by a water wash. The washed metal productseen in Fig. 3, is formed at high coulombic efficiency (98%compared to only 49 or 50% coulombic conversion from Fe2O3
in either the Li2CO3, or Na1.23K0.77CO3 during the 2 hour 0.5amp electrolysis). The nickel oxygen anode, photographed onthe top right of Fig. 3 is unaffected by this electrolysis inCa0.27Na0.7K0.75CO3.
Finally, although Ca2+ added to the NayKzCO3 electrolyteas calcium carbonate, CaCO3, suppresses corrosion andCO2 emission from the cathode, it does not prevent CO2
emission from another source; that is the decomposition ofthe carbonate electrolyte, which occurs in accord with theequilibrium:
M2CO3 Ð M2Oþ CO2 ð5Þ
This final electrolyte decomposition challenge is overcomeby the addition of 0.5 m CaO (lime) rather than CaCO3 (lime-stone) to the molten carbonate electrolyte, and we observe thatboth the iron oxide insoluble CaO/NayKzCO3 and CaO/Li2CO3
electrolytes, as well as the previous iron oxide solubleLi2O/Li2CO3 electrolyte, provide a high quality iron metalelectrolysis product from solid, pressed iron oxide. Addedoxide eliminates the carbonate decomposition emission ofCO2 by driving equilibrium 5 to the left. Specifically, we hadpreviously observed that at 750 °C Li2CO3 with 3 m Li2O,absorbs atmospheric CO2 and gains mass when exposed to air,while without added Li2O, Li2CO3 or CaCO3/Li2CO3 both emitCO2 and lose mass (these effects are quantified and elaboratedupon in ref. 2 ESI†).
In summary, the chemistry of a transformative process todecrease greenhouse gas emissions is developed here. Highquality, low energy iron metal products are produced by thegreen electrolysis of iron oxide in molten carbonates andprovide an important opportunity to replace the CO2 intensive-carbothermal production of iron. A calcium-containing electro-lyte, CaO/NayKzCO3, is more effective for iron production thanNayKzCO3 from several perspectives, maximizing iron conver-sion efficiency, minimizing nickel anode corrosion, minimiz-ing dissolution into the electrolyte, and spatially constrainingthe iron product to the cathode surface. The energy requiredto produce STEP Iron is only approximately 1/3 of the energyrequired to produce a mole of iron using coke carbon by theconventional carbothermal method (this assumes solarthermal energy is used to maintain the 730 °C STEP Ironelectrolysis temperature). Future studies will probe replacingcalcium with barium, which presumably will have similar, lessalkaline, advantageous effects on the iron product, and electro-lyte and anode stability.
Acknowledgements
We gratefully acknowledge partial support of this research bythe US NSF.
Notes and references
1 S. Licht, Adv. Mater., 2011, 47, 5592.2 S. Licht, H. Wu, C. Hettige, B. Wang, J. Lau, J. Asercion and
J. Stuart, Chem. Commun., 2012, 48, 6019; S. Licht, H. Wu,C. Hettige, B. Wang, J. Lau, J. Asercion and J. Stuart, Chem.Commun., 2011, 47, 3081; S. Licht, H. Wu, C. Hettige,B. Wang, J. Lau, J. Asercion and J. Stuart, Chem. Commun.,2010, 46, 7004; S. Licht, H. Wu, C. Hettige, B. Wang, J. Lau,J. Asercion and J. Stuart, Chem. Commun., 2005, 4623;S. Licht, H. Wu, C. Hettige, B. Wang, J. Lau, J. Asercion andJ. Stuart, Chem. Commun., 2003, 3006; and as related tobatteries: S. Licht, H. Wu, C. Hettige, B. Wang, J. Lau,J. Asercion and J. Stuart, Chem. Commun., 2008, 3257;S. Licht, H. Wu, C. Hettige, B. Wang, J. Lau, J. Asercion andJ. Stuart, Chem. Commun., 2007, 2753; S. Licht, H. Wu,C. Hettige, B. Wang, J. Lau, J. Asercion and J. Stuart, Chem.Commun., 2006, 4341.
3 S. Licht, J. Phys. Chem. C, 2009, 35, 16283; S. Licht, B. Wangand H. Wu, J. Phys. Chem. C, 2011, 115, 11803; S. Licht,et al., J. Phys. Chem. Lett., 2010, 1, 2363; S. Licht, et al.,Int. J. Hydrogen Energy., 2010, 35, 10867; B. Wang, H. Wu,G. Zhang and S. Licht, ChemSusChem, 2012, 5, 2000. Thestudies date back to the original STEP-like theory on watersplitting at: S. Licht, J. Phys. Chem. B, 2003, 107, 4253;S. Licht, Electrochem. Commun., 2002, 4, 789.
4 B. He, R. V. Gudavarthy, J. A. Koza and J. A. Switzer, J. Am.Chem. Soc., 2011, 133, 12358.
5 C. Donath, E. Neacsu and N. Ene, Rev. Roum. Chim., 2011,56, 763.
6 A. Pal, A. N. Samata and S. Ray, Hydrometallurgy, 2010, 105,30.
7 B. Y. Yuan, O. E. Kongstein, G. M. Haarberg, A. N. Samataand S. Ray, J. Electrochem. Soc., 2009, 156, D64.
8 A. Allanore, H. Lavelaine, J. P. Birat, G. Velentin andF. Lapicue, J. Appl. Electrochem., 2010, 40, 2010.
9 E. Mostad, S. Rolseth and J. Thonstad, Hydrometallurgy,2008, 90, 213.
10 A. L. Dipu, J. Ryu and Y. Kato, ISIJ Int., 2012, 52, 1427.11 S. Licht and H. Wu, J. Phys. Chem. C, 2011, 115, 25138.12 S. Licht, arXiv [physics.chem-ph], 2012, arXiv: 1209.3512, 1.13 Z. Xu, H. Hwant, R. Greenlund, X. Huang, J. Luo and
S. Anshuetz, J. Miner. Mater. Character. Eng., 2003, 2, 65.14 X. Shi, J. Liao and S. Wang, Rock Miner. Anal., 2009, 28,
197.15 ASTM designation: D3872-86. Standard Test Method for
Ferrous Iron in Iron Oxides. Annual Book of ASTM Stan-dards, 1999, 1.
16 Y. Gende and O. Lahav, Appl. Geochem., 2008, 23, 2123.
Communication Green Chemistry
884 | Green Chem., 2013, 15, 881–884 This journal is © The Royal Society of Chemistry 2013
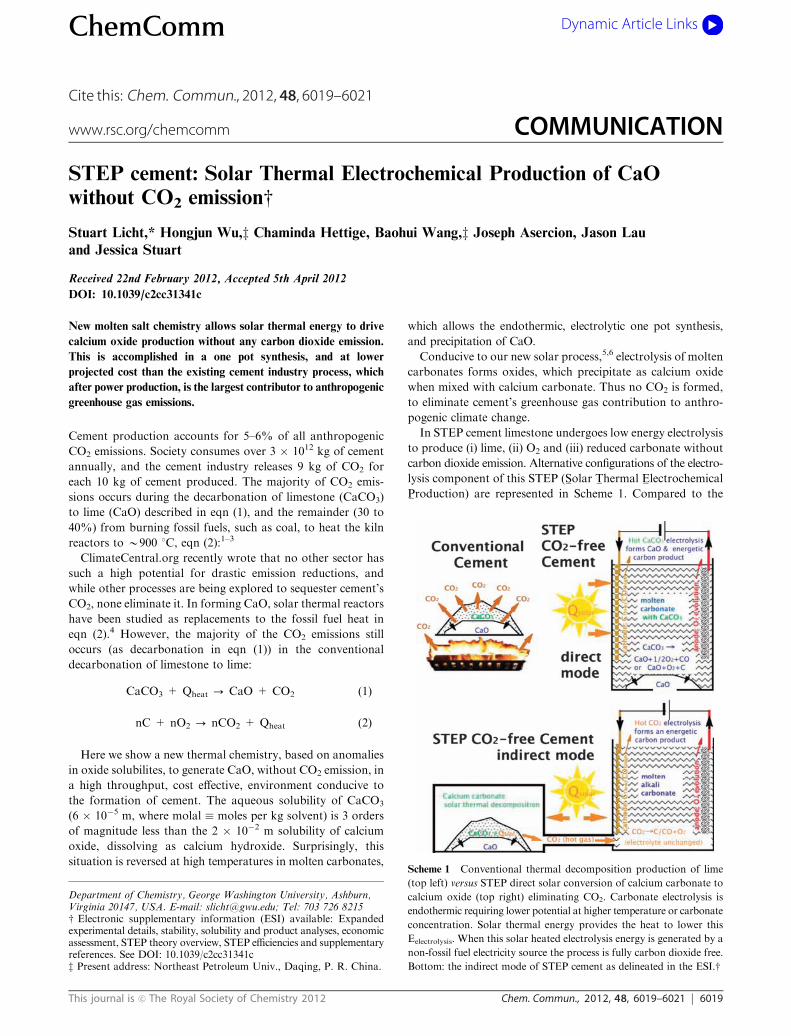
This journal is c The Royal Society of Chemistry 2012 Chem. Commun., 2012, 48, 6019–6021 6019
Cite this: Chem. Commun., 2012, 48, 6019–6021
STEP cement: Solar Thermal Electrochemical Production of CaOwithout CO2 emissionw
Stuart Licht,* Hongjun Wu,z Chaminda Hettige, Baohui Wang,z Joseph Asercion, Jason Lauand Jessica Stuart
Received 22nd February 2012, Accepted 5th April 2012
DOI: 10.1039/c2cc31341c
New molten salt chemistry allows solar thermal energy to drivecalcium oxide production without any carbon dioxide emission.This is accomplished in a one pot synthesis, and at lowerprojected cost than the existing cement industry process, whichafter power production, is the largest contributor to anthropogenicgreenhouse gas emissions.
Cement production accounts for 5–6% of all anthropogenicCO2 emissions. Society consumes over 3 ! 1012 kg of cementannually, and the cement industry releases 9 kg of CO2 foreach 10 kg of cement produced. The majority of CO2 emis-sions occurs during the decarbonation of limestone (CaCO3)to lime (CaO) described in eqn (1), and the remainder (30 to40%) from burning fossil fuels, such as coal, to heat the kilnreactors to B900 1C, eqn (2):1–3
ClimateCentral.org recently wrote that no other sector hassuch a high potential for drastic emission reductions, andwhile other processes are being explored to sequester cement’sCO2, none eliminate it. In forming CaO, solar thermal reactorshave been studied as replacements to the fossil fuel heat ineqn (2).4 However, the majority of the CO2 emissions stilloccurs (as decarbonation in eqn (1)) in the conventionaldecarbonation of limestone to lime:
CaCO3 + Qheat - CaO + CO2 (1)
nC + nO2 - nCO2 + Qheat (2)
Here we show a new thermal chemistry, based on anomaliesin oxide solubilites, to generate CaO, without CO2 emission, ina high throughput, cost effective, environment conducive tothe formation of cement. The aqueous solubility of CaCO3
(6 ! 10"5 m, where molal # moles per kg solvent) is 3 ordersof magnitude less than the 2 ! 10"2 m solubility of calciumoxide, dissolving as calcium hydroxide. Surprisingly, thissituation is reversed at high temperatures in molten carbonates,
which allows the endothermic, electrolytic one pot synthesis,and precipitation of CaO.Conducive to our new solar process,5,6 electrolysis of molten
carbonates forms oxides, which precipitate as calcium oxidewhen mixed with calcium carbonate. Thus no CO2 is formed,to eliminate cement’s greenhouse gas contribution to anthro-pogenic climate change.In STEP cement limestone undergoes low energy electrolysis
to produce (i) lime, (ii) O2 and (iii) reduced carbonate withoutcarbon dioxide emission. Alternative configurations of the electro-lysis component of this STEP ("Solar "Thermal "Electrochemical
"Production) are represented in Scheme 1. Compared to the
Scheme 1 Conventional thermal decomposition production of lime
(top left) versus STEP direct solar conversion of calcium carbonate to
calcium oxide (top right) eliminating CO2. Carbonate electrolysis is
endothermic requiring lower potential at higher temperature or carbonate
concentration. Solar thermal energy provides the heat to lower this
Eelectrolysis. When this solar heated electrolysis energy is generated by a
non-fossil fuel electricity source the process is fully carbon dioxide free.
Bottom: the indirect mode of STEP cement as delineated in the ESI.w
Department of Chemistry, George Washington University, Ashburn,Virginia 20147, USA. E-mail: [email protected]; Tel: 703 726 8215w Electronic supplementary information (ESI) available: Expandedexperimental details, stability, solubility and product analyses, economicassessment, STEP theory overview, STEP efficiencies and supplementaryreferences. See DOI: 10.1039/c2cc31341cz Present address: Northeast Petroleum Univ., Daqing, P. R. China.
ChemComm Dynamic Article Links
www.rsc.org/chemcomm COMMUNICATION
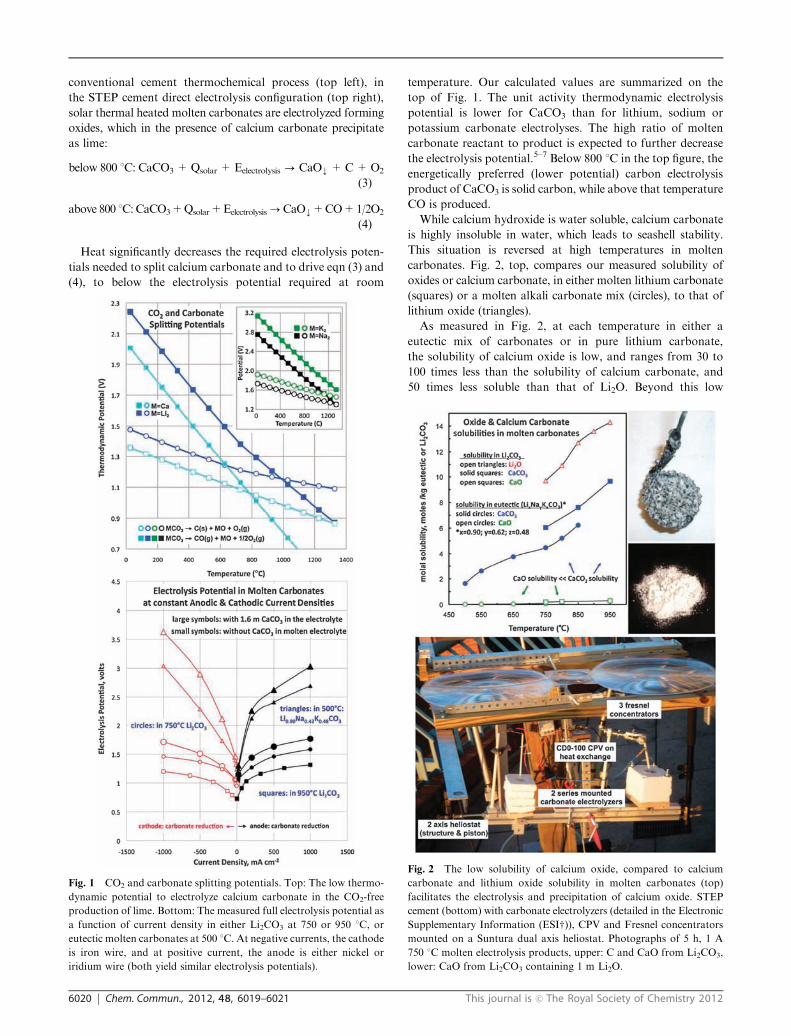
6020 Chem. Commun., 2012, 48, 6019–6021 This journal is c The Royal Society of Chemistry 2012
conventional cement thermochemical process (top left), inthe STEP cement direct electrolysis configuration (top right),solar thermal heated molten carbonates are electrolyzed formingoxides, which in the presence of calcium carbonate precipitateas lime:
below 800 1C: CaCO3+Qsolar + Eelectrolysis-CaOk+C+O2
(3)
above 800 1C:CaCO3+Qsolar+Eelectrolysis-CaOk+CO+1/2O2
(4)
Heat significantly decreases the required electrolysis poten-tials needed to split calcium carbonate and to drive eqn (3) and(4), to below the electrolysis potential required at room
temperature. Our calculated values are summarized on thetop of Fig. 1. The unit activity thermodynamic electrolysispotential is lower for CaCO3 than for lithium, sodium orpotassium carbonate electrolyses. The high ratio of moltencarbonate reactant to product is expected to further decreasethe electrolysis potential.5–7 Below 800 1C in the top figure, theenergetically preferred (lower potential) carbon electrolysisproduct of CaCO3 is solid carbon, while above that temperatureCO is produced.While calcium hydroxide is water soluble, calcium carbonate
is highly insoluble in water, which leads to seashell stability.This situation is reversed at high temperatures in moltencarbonates. Fig. 2, top, compares our measured solubility ofoxides or calcium carbonate, in either molten lithium carbonate(squares) or a molten alkali carbonate mix (circles), to that oflithium oxide (triangles).As measured in Fig. 2, at each temperature in either a
eutectic mix of carbonates or in pure lithium carbonate,the solubility of calcium oxide is low, and ranges from 30 to100 times less than the solubility of calcium carbonate, and50 times less soluble than that of Li2O. Beyond this low
Fig. 1 CO2 and carbonate splitting potentials. Top: The low thermo-
dynamic potential to electrolyze calcium carbonate in the CO2-free
production of lime. Bottom: The measured full electrolysis potential as
a function of current density in either Li2CO3 at 750 or 950 1C, oreutectic molten carbonates at 500 1C. At negative currents, the cathode
is iron wire, and at positive current, the anode is either nickel or
iridium wire (both yield similar electrolysis potentials).
Fig. 2 The low solubility of calcium oxide, compared to calcium
carbonate and lithium oxide solubility in molten carbonates (top)
facilitates the electrolysis and precipitation of calcium oxide. STEP
cement (bottom) with carbonate electrolyzers (detailed in the Electronic
Supplementary Information (ESIw)), CPV and Fresnel concentrators
mounted on a Suntura dual axis heliostat. Photographs of 5 h, 1 A
750 1C molten electrolysis products, upper: C and CaO from Li2CO3,
lower: CaO from Li2CO3 containing 1 m Li2O.
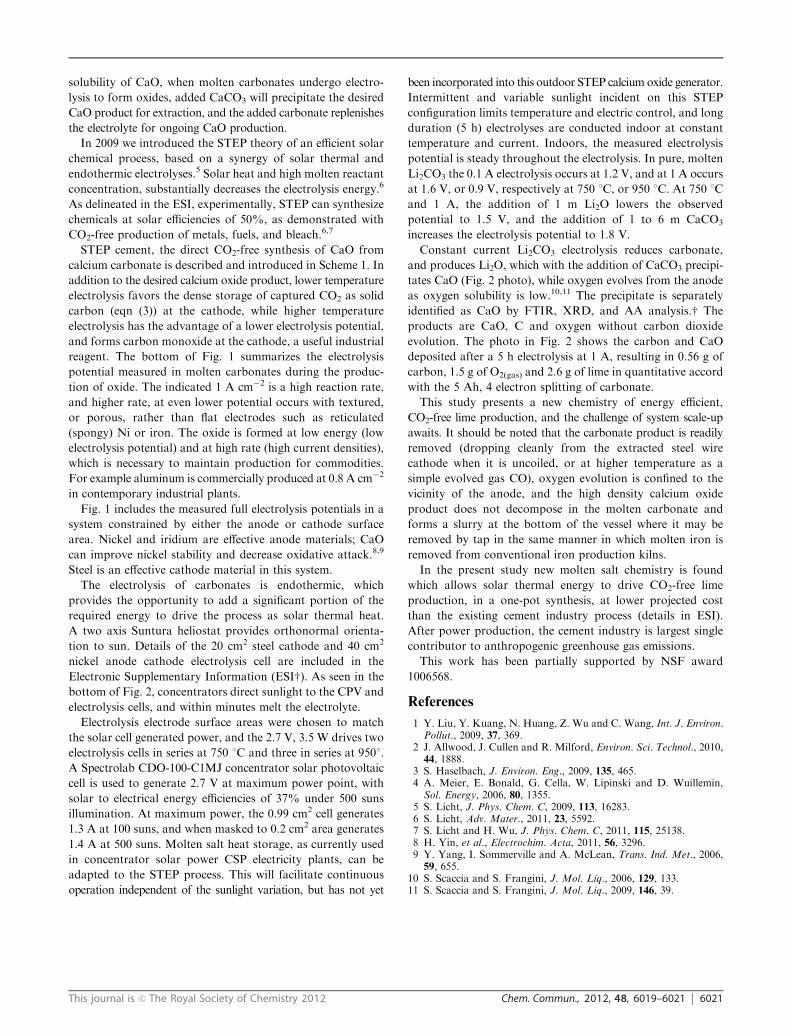
This journal is c The Royal Society of Chemistry 2012 Chem. Commun., 2012, 48, 6019–6021 6021
solubility of CaO, when molten carbonates undergo electro-lysis to form oxides, added CaCO3 will precipitate the desiredCaO product for extraction, and the added carbonate replenishesthe electrolyte for ongoing CaO production.
In 2009 we introduced the STEP theory of an efficient solarchemical process, based on a synergy of solar thermal andendothermic electrolyses.5 Solar heat and high molten reactantconcentration, substantially decreases the electrolysis energy.6
As delineated in the ESI, experimentally, STEP can synthesizechemicals at solar efficiencies of 50%, as demonstrated withCO2-free production of metals, fuels, and bleach.6,7
STEP cement, the direct CO2-free synthesis of CaO fromcalcium carbonate is described and introduced in Scheme 1. Inaddition to the desired calcium oxide product, lower temperatureelectrolysis favors the dense storage of captured CO2 as solidcarbon (eqn (3)) at the cathode, while higher temperatureelectrolysis has the advantage of a lower electrolysis potential,and forms carbon monoxide at the cathode, a useful industrialreagent. The bottom of Fig. 1 summarizes the electrolysispotential measured in molten carbonates during the produc-tion of oxide. The indicated 1 A cm"2 is a high reaction rate,and higher rate, at even lower potential occurs with textured,or porous, rather than flat electrodes such as reticulated(spongy) Ni or iron. The oxide is formed at low energy (lowelectrolysis potential) and at high rate (high current densities),which is necessary to maintain production for commodities.For example aluminum is commercially produced at 0.8 A cm"2
in contemporary industrial plants.Fig. 1 includes the measured full electrolysis potentials in a
system constrained by either the anode or cathode surfacearea. Nickel and iridium are effective anode materials; CaOcan improve nickel stability and decrease oxidative attack.8,9
Steel is an effective cathode material in this system.The electrolysis of carbonates is endothermic, which
provides the opportunity to add a significant portion of therequired energy to drive the process as solar thermal heat.A two axis Suntura heliostat provides orthonormal orienta-tion to sun. Details of the 20 cm2 steel cathode and 40 cm2
nickel anode cathode electrolysis cell are included in theElectronic Supplementary Information (ESIw). As seen in thebottom of Fig. 2, concentrators direct sunlight to the CPV andelectrolysis cells, and within minutes melt the electrolyte.
Electrolysis electrode surface areas were chosen to matchthe solar cell generated power, and the 2.7 V, 3.5 W drives twoelectrolysis cells in series at 750 1C and three in series at 9501.A Spectrolab CDO-100-C1MJ concentrator solar photovoltaiccell is used to generate 2.7 V at maximum power point, withsolar to electrical energy efficiencies of 37% under 500 sunsillumination. At maximum power, the 0.99 cm2 cell generates1.3 A at 100 suns, and when masked to 0.2 cm2 area generates1.4 A at 500 suns. Molten salt heat storage, as currently usedin concentrator solar power CSP electricity plants, can beadapted to the STEP process. This will facilitate continuousoperation independent of the sunlight variation, but has not yet
been incorporated into this outdoor STEP calcium oxide generator.Intermittent and variable sunlight incident on this STEPconfiguration limits temperature and electric control, and longduration (5 h) electrolyses are conducted indoor at constanttemperature and current. Indoors, the measured electrolysispotential is steady throughout the electrolysis. In pure, moltenLi2CO3 the 0.1 A electrolysis occurs at 1.2 V, and at 1 A occursat 1.6 V, or 0.9 V, respectively at 750 1C, or 950 1C. At 750 1Cand 1 A, the addition of 1 m Li2O lowers the observedpotential to 1.5 V, and the addition of 1 to 6 m CaCO3
increases the electrolysis potential to 1.8 V.Constant current Li2CO3 electrolysis reduces carbonate,
and produces Li2O, which with the addition of CaCO3 precipi-tates CaO (Fig. 2 photo), while oxygen evolves from the anodeas oxygen solubility is low.10,11 The precipitate is separatelyidentified as CaO by FTIR, XRD, and AA analysis.w Theproducts are CaO, C and oxygen without carbon dioxideevolution. The photo in Fig. 2 shows the carbon and CaOdeposited after a 5 h electrolysis at 1 A, resulting in 0.56 g ofcarbon, 1.5 g of O2(gas) and 2.6 g of lime in quantitative accordwith the 5 Ah, 4 electron splitting of carbonate.This study presents a new chemistry of energy efficient,
CO2-free lime production, and the challenge of system scale-upawaits. It should be noted that the carbonate product is readilyremoved (dropping cleanly from the extracted steel wirecathode when it is uncoiled, or at higher temperature as asimple evolved gas CO), oxygen evolution is confined to thevicinity of the anode, and the high density calcium oxideproduct does not decompose in the molten carbonate andforms a slurry at the bottom of the vessel where it may beremoved by tap in the same manner in which molten iron isremoved from conventional iron production kilns.In the present study new molten salt chemistry is found
which allows solar thermal energy to drive CO2-free limeproduction, in a one-pot synthesis, at lower projected costthan the existing cement industry process (details in ESI).After power production, the cement industry is largest singlecontributor to anthropogenic greenhouse gas emissions.This work has been partially supported by NSF award
1006568.
References
1 Y. Liu, Y. Kuang, N. Huang, Z. Wu and C. Wang, Int. J. Environ.Pollut., 2009, 37, 369.
2 J. Allwood, J. Cullen and R. Milford, Environ. Sci. Technol., 2010,44, 1888.
3 S. Haselbach, J. Environ. Eng., 2009, 135, 465.4 A. Meier, E. Bonald, G. Cella, W. Lipinski and D. Wuillemin,Sol. Energy, 2006, 80, 1355.
5 S. Licht, J. Phys. Chem. C, 2009, 113, 16283.6 S. Licht, Adv. Mater., 2011, 23, 5592.7 S. Licht and H. Wu, J. Phys. Chem. C, 2011, 115, 25138.8 H. Yin, et al., Electrochim. Acta, 2011, 56, 3296.9 Y. Yang, I. Sommerville and A. McLean, Trans. Ind. Met., 2006,59, 655.
10 S. Scaccia and S. Frangini, J. Mol. Liq., 2006, 129, 133.11 S. Scaccia and S. Frangini, J. Mol. Liq., 2009, 146, 39.
© 2011 WILEY-VCH Verlag GmbH & Co. KGaA, WeinheimAdv. Mater. 2011, XX, 1–21 1
www.advmat.dewww.MaterialsViews.com
PRO
GRES
S R
EPO
RT
wileyonlinelibrary.com
S. Licht*
Efficient Solar-Driven Synthesis, Carbon Capture, and Desalinization, STEP: Solar Thermal Electrochemical Production of Fuels, Metals, Bleach
Prof. S. LichtDepartment of Chemistry George Washington University Washington, DC 20052, USA E-mail: [email protected]
DOI: 10.1002/adma.201103198
1. IntroductionThe anthropogenic release of carbon dioxide and atmospheric carbon dioxide have reached record levels. One path towards CO2 reduction is to utilize renewable energy to produce elec-tricity. Another, less explored path is to utilize renewable energy to produce societal staples such as metals, bleach, and fuels (including carbonaceous fuels) directly. Whereas solar-driven water splitting to generate hydrogen fuels has been extensively studied,[1,2] there have been few studies of solar-driven carbon dioxide splitting, although recently we introduced a global process for solar thermal electrochemical production (STEP) of energetic molecules, including CO2 splitting.[3–8] “CO2 is a highly stable, noncombustible molecule, and its thermody-namic stability makes its activation energy demanding and challenging.”[9] In search of a solution for climate change asso-ciated with increasing levels of atmospheric CO2, the field of carbon dioxide splitting (solar or otherwise), while young, is growing rapidly, and as with water splitting, includes the study
of photoelectrochemical, biomimetic, elec-trolytic, and thermal pathways of carbon dioxide splitting.[10,11]
The direct thermal splitting of CO2 requires excessive temperatures to drive any significant dissociation. As a result, lower temperature thermochemical processes using coupled reactions have recently been studied.[12–16] The coupling of multi ple reactions steps decreases the system efficiency. To date, such challenges, and the associated efficiency losses, have been an impediment to the implementa-tion of the related, extensively studied field of thermochemical splitting of water.[2] Photo-electrochemistry probes the ener-getics of illuminated semiconductors in an electrolyte, and provides an alternative path to solar fuel formation. Photoelec-trochemical solar cells (PECs) can convert
solar energy to electricity,[17–21] and with inclusion of an elec-trochemical storage couple, have the capability for internal energy storage to provide a level output despite variations in sunlight.[22,23] Solar to photo-electrochemical energy can also be stored externally in chemical form, when it is used to drive the formation of energetically rich chemicals. With photochemical and photo-electrochemical splitting of carbon dioxide[24–29] the selective production of specific fuel products has been demon-strated. Such systems function at low current density and effi-ciencies of 1 percent, and as with photoelectrochemical water splitting face stability and bandgap challenges related to effec-tive operation with visible light.[21,30,31]
The electrically driven (nonsolar) electrolysis of dissolved carbon dioxide is under investigation at or near room tempera-ture in aqueous, non-aqueous, and PEM media.[32–41] These are constrained by the thermodynamic and kinetic challenges associated with ambient temperature, endothermic processes, of a high electrolysis potential, large overpotential, low rate and low electrolysis efficiency. High-temperature, solid-oxide elec-trolysis of carbon dioxide dates back to suggestions from the 1960s to use such cells to renew air for a space habitat,[42–44] and the sustainable rate of the solid oxide reduction of carbon dioxide is improving rapidly.[45–51] Molten-carbonate rather than solid-oxide fuel cells running in the reverse mode had also been studied to renew air in 2002.[52] In a manner analogous to our 2002 high-temperature solar water-splitting studies (described below),[53–55] we showed in 2009 that molten-carbonate cells
STEP (solar thermal electrochemical production) theory is derived and experimentally verified for the electrosynthesis of energetic molecules at solar energy efficiency greater than any photovoltaic conversion efficiency. In STEP the efficient formation of metals, fuels, chlorine, and carbon capture is driven by solar thermal heated endothermic electrolyses of concentrated reactants occuring at a voltage below that of the room temperature energy stored in the products. One example is CO2, which is reduced to either fuels or storable carbon at a solar efficiency of over 50% due to a synergy of efficient solar thermal absorption and electrochemical conversion at high temperature and reactant concentration. CO2-free production of iron by STEP, from iron ore, occurs via Fe(III) in molten carbonate. Water is efficiently split to hydrogen by molten hydroxide electrolysis, and chlorine, sodium, and magnesium from molten chlorides. A pathway is provided for the STEP decrease of atmos-pheric carbon dioxide levels to pre-industial age levels in 10 years.
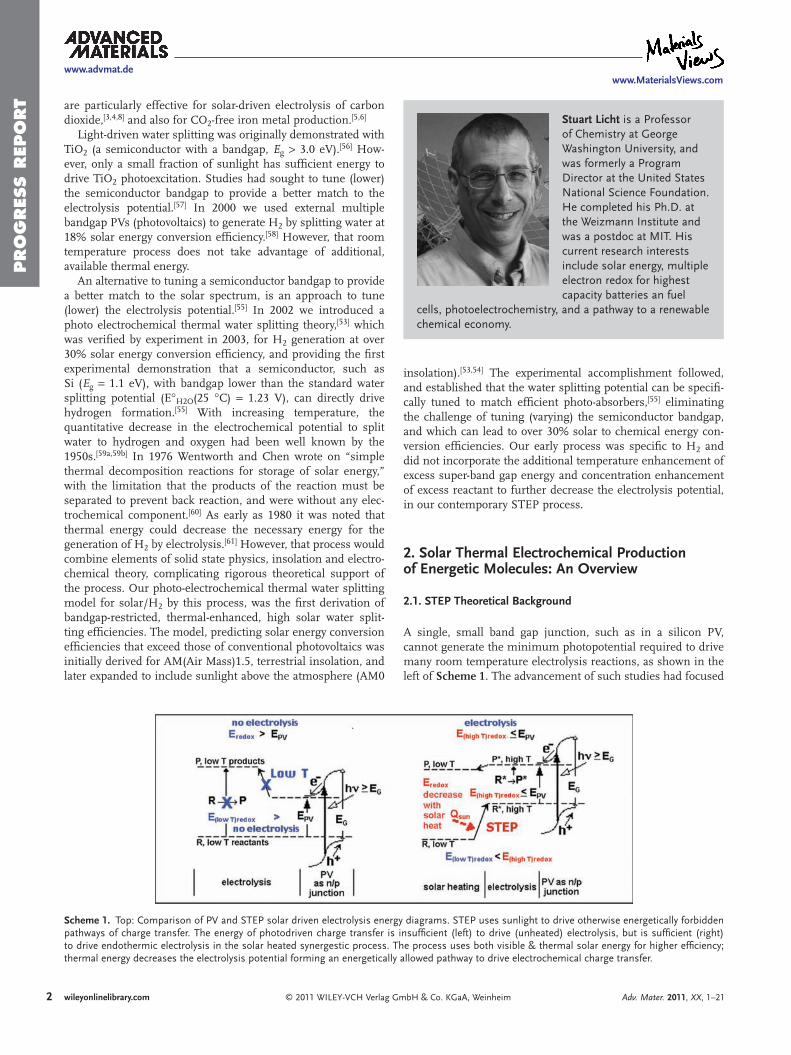
2
www.advmat.dewww.MaterialsViews.com
© 2011 WILEY-VCH Verlag GmbH & Co. KGaA, Weinheim Adv. Mater. 2011, XX, 1–21wileyonlinelibrary.com
PRO
GRES
S R
EPO
RT
insolation).[53,54] The experimental accomplishment followed, and established that the water splitting potential can be specifi-cally tuned to match efficient photo-absorbers,[55] eliminating the challenge of tuning (varying) the semiconductor bandgap, and which can lead to over 30% solar to chemical energy con-version efficiencies. Our early process was specific to H2 and did not incorporate the additional temperature enhancement of excess super-band gap energy and concentration enhancement of excess reactant to further decrease the electrolysis potential, in our contemporary STEP process.
2. Solar Thermal Electrochemical Production of Energetic Molecules: An Overview
2.1. STEP Theoretical Background
A single, small band gap junction, such as in a silicon PV, cannot generate the minimum photopotential required to drive many room temperature electrolysis reactions, as shown in the left of Scheme 1. The advancement of such studies had focused
are particularly effective for solar-driven electrolysis of carbon dioxide,[3,4,8] and also for CO2-free iron metal production.[5,6]
Light-driven water splitting was originally demonstrated with TiO2 (a semiconductor with a bandgap, Eg 3.0 eV).[56] How-ever, only a small fraction of sunlight has sufficient energy to drive TiO2 photoexcitation. Studies had sought to tune (lower) the semiconductor bandgap to provide a better match to the electrolysis potential.[57] In 2000 we used external multiple bandgap PVs (photovoltaics) to generate H2 by splitting water at 18% solar energy conversion efficiency.[58] However, that room temperature process does not take advantage of additional, available thermal energy.
An alternative to tuning a semiconductor bandgap to provide a better match to the solar spectrum, is an approach to tune (lower) the electrolysis potential.[55] In 2002 we introduced a photo electrochemical thermal water splitting theory,[53] which was verified by experiment in 2003, for H2 generation at over 30% solar energy conversion efficiency, and providing the first experimental demonstration that a semiconductor, such as Si (Eg 1.1 eV), with bandgap lower than the standard water splitting potential (E H2O(25 C) 1.23 V), can directly drive hydrogen formation.[55] With increasing temperature, the quantitative decrease in the electrochemical potential to split water to hydrogen and oxygen had been well known by the 1950s.[59a,59b] In 1976 Wentworth and Chen wrote on “simple thermal decomposition reactions for storage of solar energy,” with the limitation that the products of the reaction must be separated to prevent back reaction, and were without any elec-trochemical component.[60] As early as 1980 it was noted that thermal energy could decrease the necessary energy for the generation of H2 by electrolysis.[61] However, that process would combine elements of solid state physics, insolation and electro-chemical theory, complicating rigorous theoretical support of the process. Our photo-electrochemical thermal water splitting model for solar/H2 by this process, was the first derivation of bandgap-restricted, thermal-enhanced, high solar water split-ting efficiencies. The model, predicting solar energy conversion efficiencies that exceed those of conventional photovoltaics was initially derived for AM(Air Mass)1.5, terrestrial insolation, and later expanded to include sunlight above the atmosphere (AM0
Stuart Licht is a Professor of Chemistry at George Washington University, and was formerly a Program Director at the United States National Science Foundation. He completed his Ph.D. at the Weizmann Institute and was a postdoc at MIT. His current research interests include solar energy, multiple electron redox for highest capacity batteries an fuel
cells, photoelectrochemistry, and a pathway to a renewable chemical economy.
Scheme 1. Top: Comparison of PV and STEP solar driven electrolysis energy diagrams. STEP uses sunlight to drive otherwise energetically forbidden pathways of charge transfer. The energy of photodriven charge transfer is insufficient (left) to drive (unheated) electrolysis, but is sufficient (right) to drive endothermic electrolysis in the solar heated synergestic process. The process uses both visible & thermal solar energy for higher efficiency; thermal energy decreases the electrolysis potential forming an energetically allowed pathway to drive electrochemical charge transfer.
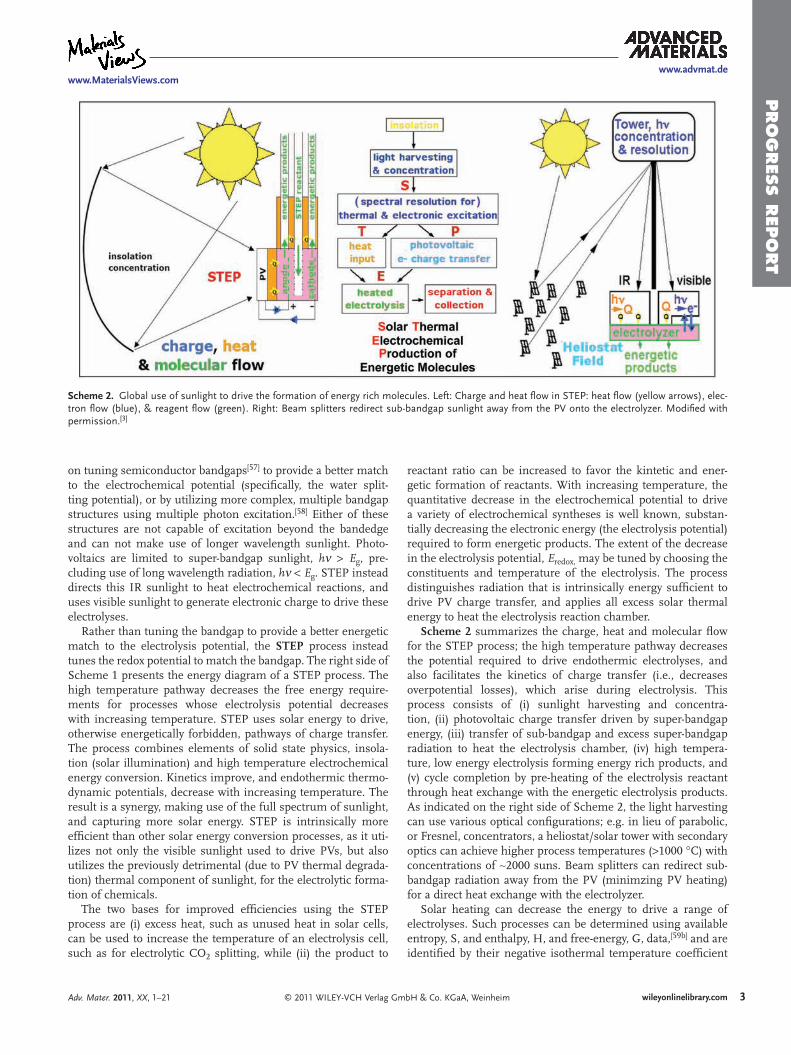
3
www.advmat.dewww.MaterialsViews.com
© 2011 WILEY-VCH Verlag GmbH & Co. KGaA, WeinheimAdv. Mater. 2011, XX, 1–21 wileyonlinelibrary.com
PRO
GRES
S R
EPO
RT
reactant ratio can be increased to favor the kintetic and ener-getic formation of reactants. With increasing temperature, the quantitative decrease in the electrochemical potential to drive a variety of electrochemical syntheses is well known, substan-tially decreasing the electronic energy (the electrolysis potential) required to form energetic products. The extent of the decrease in the electrolysis potential, Eredox, may be tuned by choosing the constituents and temperature of the electrolysis. The process distinguishes radiation that is intrinsically energy sufficient to drive PV charge transfer, and applies all excess solar thermal energy to heat the electrolysis reaction chamber.
Scheme 2 summarizes the charge, heat and molecular flow for the STEP process; the high temperature pathway decreases the potential required to drive endothermic electrolyses, and also facilitates the kinetics of charge transfer (i.e., decreases overpotential losses), which arise during electrolysis. This process consists of (i) sunlight harvesting and concentra-tion, (ii) photovoltaic charge transfer driven by super-bandgap energy, (iii) transfer of sub-bandgap and excess super-bandgap radiation to heat the electrolysis chamber, (iv) high tempera-ture, low energy electrolysis forming energy rich products, and (v) cycle completion by pre-heating of the electrolysis reactant through heat exchange with the energetic electrolysis products. As indicated on the right side of Scheme 2, the light harvesting can use various optical configurations; e.g. in lieu of parabolic, or Fresnel, concentrators, a heliostat/solar tower with secondary optics can achieve higher process temperatures ( 1000 C) with concentrations of 2000 suns. Beam splitters can redirect sub-bandgap radiation away from the PV (minimzing PV heating) for a direct heat exchange with the electrolyzer.
Solar heating can decrease the energy to drive a range of electrolyses. Such processes can be determined using available entropy, S, and enthalpy, H, and free-energy, G, data,[59b] and are identified by their negative isothermal temperature coefficient
on tuning semiconductor bandgaps[57] to provide a better match to the electrochemical potential (specifically, the water split-ting potential), or by utilizing more complex, multiple bandgap structures using multiple photon excitation.[58] Either of these structures are not capable of excitation beyond the bandedge and can not make use of longer wavelength sunlight. Photo-voltaics are limited to super-bandgap sunlight, h Eg, pre-cluding use of long wavelength radiation, h Eg. STEP instead directs this IR sunlight to heat electrochemical reactions, and uses visible sunlight to generate electronic charge to drive these electrolyses.
Rather than tuning the bandgap to provide a better energetic match to the electrolysis potential, the STEP process instead tunes the redox potential to match the bandgap. The right side of Scheme 1 presents the energy diagram of a STEP process. The high temperature pathway decreases the free energy require-ments for processes whose electrolysis potential decreases with increasing temperature. STEP uses solar energy to drive, otherwise energetically forbidden, pathways of charge transfer. The process combines elements of solid state physics, insola-tion (solar illumination) and high temperature electrochemical energy conversion. Kinetics improve, and endothermic thermo-dynamic potentials, decrease with increasing temperature. The result is a synergy, making use of the full spectrum of sunlight, and capturing more solar energy. STEP is intrinsically more efficient than other solar energy conversion processes, as it uti-lizes not only the visible sunlight used to drive PVs, but also utilizes the previously detrimental (due to PV thermal degrada-tion) thermal component of sunlight, for the electrolytic forma-tion of chemicals.
The two bases for improved efficiencies using the STEP process are (i) excess heat, such as unused heat in solar cells, can be used to increase the temperature of an electrolysis cell, such as for electrolytic CO2 splitting, while (ii) the product to
Scheme 2. Global use of sunlight to drive the formation of energy rich molecules. Left: Charge and heat flow in STEP: heat flow (yellow arrows), elec-tron flow (blue), & reagent flow (green). Right: Beam splitters redirect sub-bandgap sunlight away from the PV onto the electrolyzer. Modified with permission.[3]
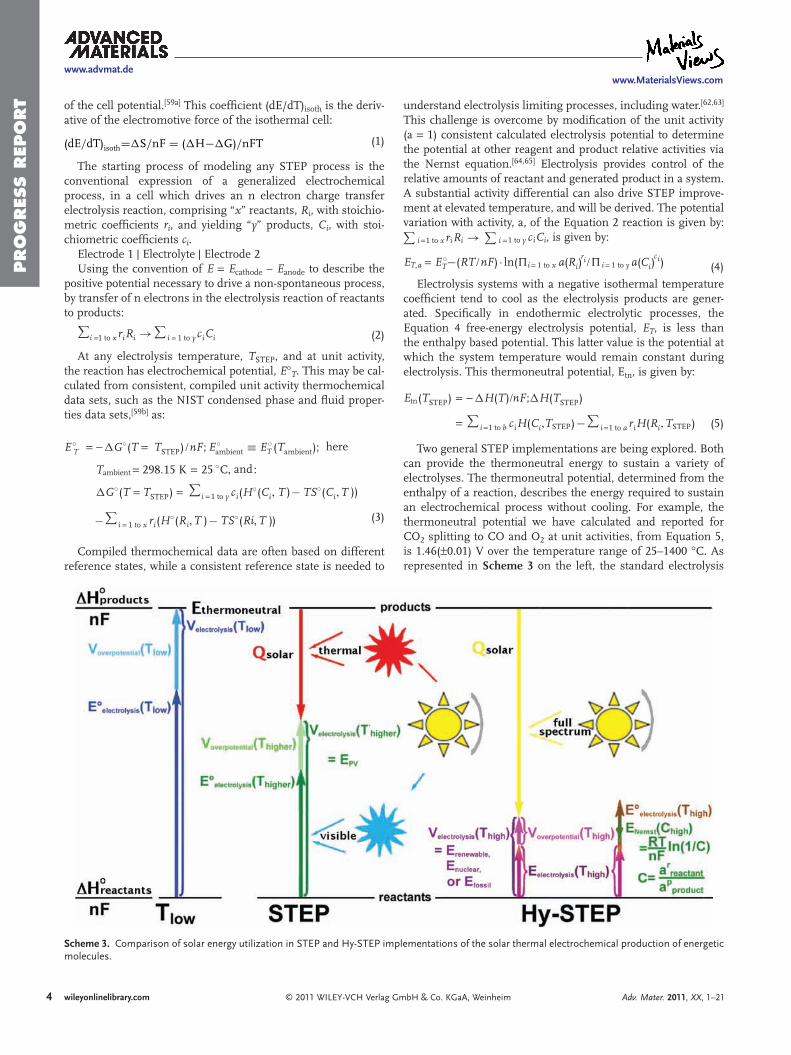
4
www.advmat.dewww.MaterialsViews.com
© 2011 WILEY-VCH Verlag GmbH & Co. KGaA, Weinheim Adv. Mater. 2011, XX, 1–21wileyonlinelibrary.com
PRO
GRES
S R
EPO
RT understand electrolysis limiting processes, including water.[62,63]
This challenge is overcome by modification of the unit activity (a 1) consistent calculated electrolysis potential to determine the potential at other reagent and product relative activities via the Nernst equation.[64,65] Electrolysis provides control of the relative amounts of reactant and generated product in a system. A substantial activity differential can also drive STEP improve-ment at elevated temperature, and will be derived. The potential variation with activity, a, of the Equation 2 reaction is given by:
i 1 to x riRi i 1 to y ciCi, is given by:
ET a ET (RT nF) ln( i 1 to x a(Ri) ii 1 to y a(Ci)
i)cr
(4)Electrolysis systems with a negative isothermal temperature
coefficient tend to cool as the electrolysis products are gener-ated. Specifically in endothermic electrolytic processes, the Equation 4 free-energy electrolysis potential, ET, is less than the enthalpy based potential. This latter value is the potential at which the system temperature would remain constant during electrolysis. This thermoneutral potential, Etn, is given by:
Etn(TSTEP) H(T nF; H(TSTEP)
i 1 to b ciH(Ci TSTEP) i 1 to a riH(Ri TSTEP)
)
(5)
Two general STEP implementations are being explored. Both can provide the thermoneutral energy to sustain a variety of electrolyses. The thermoneutral potential, determined from the enthalpy of a reaction, describes the energy required to sustain an electrochemical process without cooling. For example, the thermoneutral potential we have calculated and reported for CO2 splitting to CO and O2 at unit activities, from Equation 5, is 1.46( 0.01) V over the temperature range of 25–1400 C. As represented in Scheme 3 on the left, the standard electrolysis
of the cell potential.[59a] This coefficient (dE/dT)isoth is the deriv-ative of the electromotive force of the isothermal cell:
(dE dT)isoth S nF ( H G) nFT (1)
The starting process of modeling any STEP process is the conventional expression of a generalized electrochemical process, in a cell which drives an n electron charge transfer electrolysis reaction, comprising “x” reactants, Ri, with stoichio-metric coefficients ri, and yielding “y” products, Ci, with stoi-chiometric coefficients ci.
Electrode 1 Electrolyte Electrode 2Using the convention of E Ecathode – Eanode to describe the
positive potential necessary to drive a non-spontaneous process, by transfer of n electrons in the electrolysis reaction of reactants to products:
i 1 to x riRi i 1 to y ciCi (2)
At any electrolysis temperature, TSTEP, and at unit activity, the reaction has electrochemical potential, E T. This may be cal-culated from consistent, compiled unit activity thermochemical data sets, such as the NIST condensed phase and fluid proper-ties data sets,[59b] as:
E G (T TSTEPT ) nF; Eambient ET (Tambient); here
Tambient 298 15 K 25 C and
G (T TSTEP) i 1 to y ci(H (Ci T TS (Ci T
i 1 to x ri(H (Ri T TS (Ri T
)
)) )
))
:
(3)
Compiled thermochemical data are often based on different reference states, while a consistent reference state is needed to
Scheme 3. Comparison of solar energy utilization in STEP and Hy-STEP implementations of the solar thermal electrochemical production of energetic molecules.
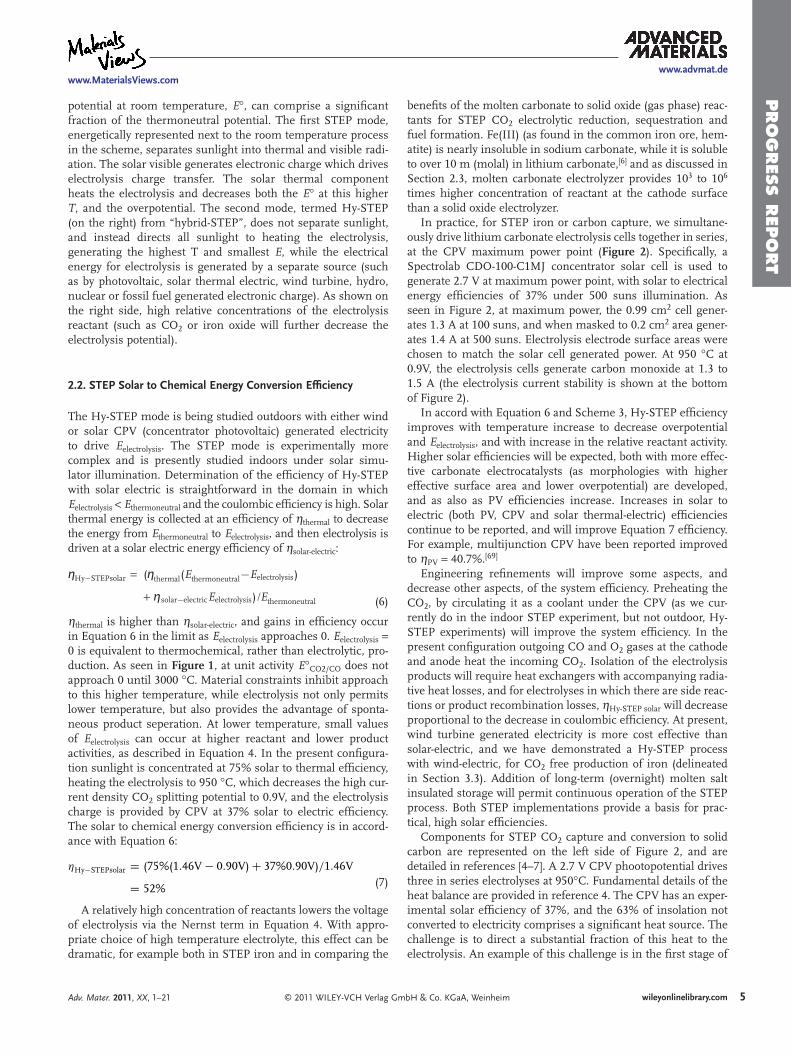
5
www.advmat.dewww.MaterialsViews.com
© 2011 WILEY-VCH Verlag GmbH & Co. KGaA, WeinheimAdv. Mater. 2011, XX, 1–21 wileyonlinelibrary.com
PRO
GRES
S R
EPO
RT
benefits of the molten carbonate to solid oxide (gas phase) reac-tants for STEP CO2 electrolytic reduction, sequestration and fuel formation. Fe(III) (as found in the common iron ore, hem-atite) is nearly insoluble in sodium carbonate, while it is soluble to over 10 m (molal) in lithium carbonate,[6] and as discussed in Section 2.3, molten carbonate electrolyzer provides 103 to 106 times higher concentration of reactant at the cathode surface than a solid oxide electrolyzer.
In practice, for STEP iron or carbon capture, we simultane-ously drive lithium carbonate electrolysis cells together in series, at the CPV maximum power point (Figure 2). Specifically, a Spectrolab CDO-100-C1MJ concentrator solar cell is used to generate 2.7 V at maximum power point, with solar to electrical energy efficiencies of 37% under 500 suns illumination. As seen in Figure 2, at maximum power, the 0.99 cm2 cell gener-ates 1.3 A at 100 suns, and when masked to 0.2 cm2 area gener-ates 1.4 A at 500 suns. Electrolysis electrode surface areas were chosen to match the solar cell generated power. At 950 C at 0.9V, the electrolysis cells generate carbon monoxide at 1.3 to 1.5 A (the electrolysis current stability is shown at the bottom of Figure 2).
In accord with Equation 6 and Scheme 3, Hy-STEP efficiency improves with temperature increase to decrease overpotential and Eelectrolysis, and with increase in the relative reactant activity. Higher solar efficiencies will be expected, both with more effec-tive carbonate electrocatalysts (as morphologies with higher effective surface area and lower overpotential) are developed, and as also as PV efficiencies increase. Increases in solar to electric (both PV, CPV and solar thermal-electric) efficiencies continue to be reported, and will improve Equation 7 efficiency. For example, multijunction CPV have been reported improved to PV 40.7%.[69]
Engineering refinements will improve some aspects, and decrease other aspects, of the system efficiency. Preheating the CO2, by circulating it as a coolant under the CPV (as we cur-rently do in the indoor STEP experiment, but not outdoor, Hy-STEP experiments) will improve the system efficiency. In the present configuration outgoing CO and O2 gases at the cathode and anode heat the incoming CO2. Isolation of the electrolysis products will require heat exchangers with accompanying radia-tive heat losses, and for electrolyses in which there are side reac-tions or product recombination losses, Hy-STEP solar will decrease proportional to the decrease in coulombic efficiency. At present, wind turbine generated electricity is more cost effective than solar-electric, and we have demonstrated a Hy-STEP process with wind-electric, for CO2 free production of iron (delineated in Section 3.3). Addition of long-term (overnight) molten salt insulated storage will permit continuous operation of the STEP process. Both STEP implementations provide a basis for prac-tical, high solar efficiencies.
Components for STEP CO2 capture and conversion to solid carbon are represented on the left side of Figure 2, and are detailed in references [4–7]. A 2.7 V CPV phootopotential drives three in series electrolyses at 950 C. Fundamental details of the heat balance are provided in reference 4. The CPV has an exper-imental solar efficiency of 37%, and the 63% of insolation not converted to electricity comprises a significant heat source. The challenge is to direct a substantial fraction of this heat to the electrolysis. An example of this challenge is in the first stage of
potential at room temperature, E , can comprise a significant fraction of the thermoneutral potential. The first STEP mode, energetically represented next to the room temperature process in the scheme, separates sunlight into thermal and visible radi-ation. The solar visible generates electronic charge which drives electrolysis charge transfer. The solar thermal component heats the electrolysis and decreases both the E at this higher T, and the overpotential. The second mode, termed Hy-STEP (on the right) from “hybrid-STEP”, does not separate sunlight, and instead directs all sunlight to heating the electrolysis, generating the highest T and smallest E, while the electrical energy for electrolysis is generated by a separate source (such as by photovoltaic, solar thermal electric, wind turbine, hydro, nuclear or fossil fuel generated electronic charge). As shown on the right side, high relative concentrations of the electrolysis reactant (such as CO2 or iron oxide will further decrease the electrolysis potential).
2.2. STEP Solar to Chemical Energy Conversion Efficiency
The Hy-STEP mode is being studied outdoors with either wind or solar CPV (concentrator photovoltaic) generated electricity to drive Eelectrolysis. The STEP mode is experimentally more complex and is presently studied indoors under solar simu-lator illumination. Determination of the efficiency of Hy-STEP with solar electric is straightforward in the domain in which Eelectrolysis Ethermoneutral and the coulombic efficiency is high. Solar thermal energy is collected at an efficiency of thermal to decrease the energy from Ethermoneutral to Eelectrolysis, and then electrolysis is driven at a solar electric energy efficiency of solar-electric:
Hy STEPsolar ( thermal(Ethermoneutral Eelectrolysis)
solar electricEelectrolysis) Ethermoneutral (6)
thermal is higher than solar-electric, and gains in efficiency occur in Equation 6 in the limit as Eelectrolysis approaches 0. Eelectrolysis 0 is equivalent to thermochemical, rather than electrolytic, pro-duction. As seen in Figure 1, at unit activity E CO2/CO does not approach 0 until 3000 C. Material constraints inhibit approach to this higher temperature, while electrolysis not only permits lower temperature, but also provides the advantage of sponta-neous product seperation. At lower temperature, small values of Eelectrolysis can occur at higher reactant and lower product activities, as described in Equation 4. In the present configura-tion sunlight is concentrated at 75% solar to thermal efficiency, heating the electrolysis to 950 C, which decreases the high cur-rent density CO2 splitting potential to 0.9V, and the electrolysis charge is provided by CPV at 37% solar to electric efficiency. The solar to chemical energy conversion efficiency is in accord-ance with Equation 6:
Hy STEPsolar (75%(1 46V 0 90V) 37%0 90V) 1 46V
52% (7)
A relatively high concentration of reactants lowers the voltage of electrolysis via the Nernst term in Equation 4. With appro-priate choice of high temperature electrolyte, this effect can be dramatic, for example both in STEP iron and in comparing the
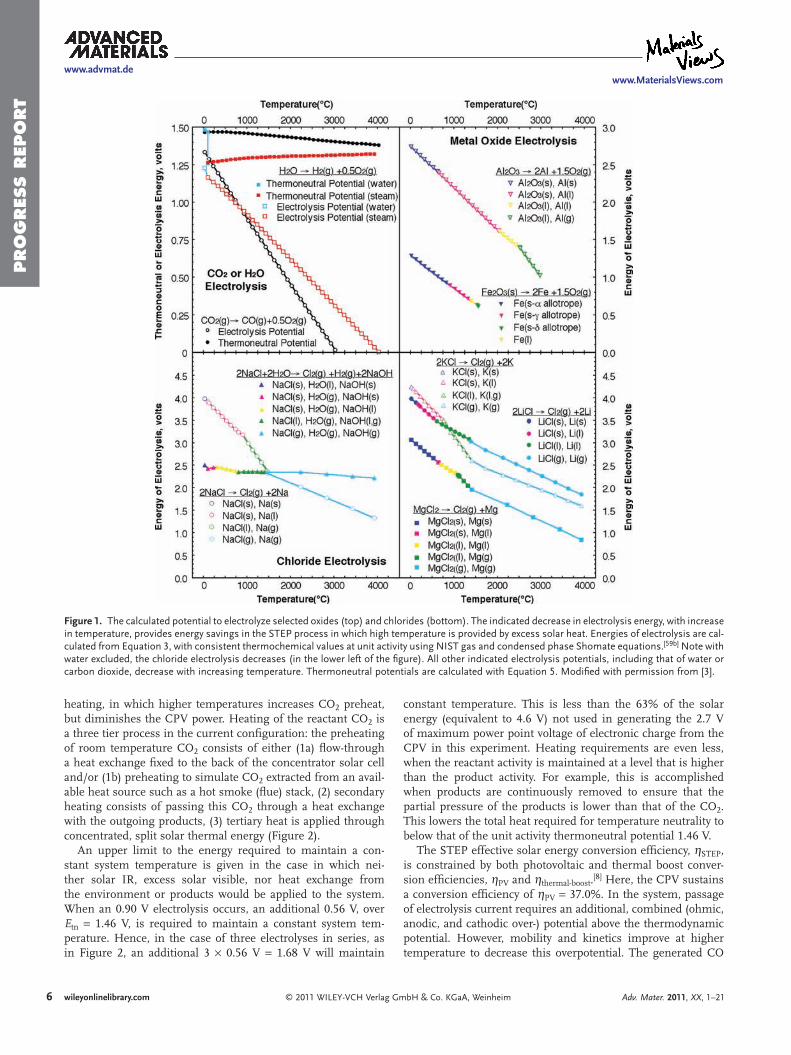
6
www.advmat.dewww.MaterialsViews.com
© 2011 WILEY-VCH Verlag GmbH & Co. KGaA, Weinheim Adv. Mater. 2011, XX, 1–21wileyonlinelibrary.com
PRO
GRES
S R
EPO
RT
heating, in which higher temperatures increases CO2 preheat, but diminishes the CPV power. Heating of the reactant CO2 is a three tier process in the current configuration: the preheating of room temperature CO2 consists of either (1a) flow-through a heat exchange fixed to the back of the concentrator solar cell and/or (1b) preheating to simulate CO2 extracted from an avail-able heat source such as a hot smoke (flue) stack, (2) secondary heating consists of passing this CO2 through a heat exchange with the outgoing products, (3) tertiary heat is applied through concentrated, split solar thermal energy (Figure 2).
An upper limit to the energy required to maintain a con-stant system temperature is given in the case in which nei-ther solar IR, excess solar visible, nor heat exchange from the environment or products would be applied to the system. When an 0.90 V electrolysis occurs, an additional 0.56 V, over Etn 1.46 V, is required to maintain a constant system tem-perature. Hence, in the case of three electrolyses in series, as in Figure 2, an additional 3 0.56 V 1.68 V will maintain
constant temperature. This is less than the 63% of the solar energy (equivalent to 4.6 V) not used in generating the 2.7 V of maximum power point voltage of electronic charge from the CPV in this experiment. Heating requirements are even less, when the reactant activity is maintained at a level that is higher than the product activity. For example, this is accomplished when products are continuously removed to ensure that the partial pressure of the products is lower than that of the CO2. This lowers the total heat required for temperature neutrality to below that of the unit activity thermoneutral potential 1.46 V.
The STEP effective solar energy conversion efficiency, STEP, is constrained by both photovoltaic and thermal boost conver-sion efficiencies, PV and thermal-boost.[8] Here, the CPV sustains a conversion efficiency of PV 37.0%. In the system, passage of electrolysis current requires an additional, combined (ohmic, anodic, and cathodic over-) potential above the thermodynamic potential. However, mobility and kinetics improve at higher temperature to decrease this overpotential. The generated CO
Figure 1. The calculated potential to electrolyze selected oxides (top) and chlorides (bottom). The indicated decrease in electrolysis energy, with increase in temperature, provides energy savings in the STEP process in which high temperature is provided by excess solar heat. Energies of electrolysis are cal-culated from Equation 3, with consistent thermochemical values at unit activity using NIST gas and condensed phase Shomate equations.[59b] Note with water excluded, the chloride electrolysis decreases (in the lower left of the figure). All other indicated electrolysis potentials, including that of water or carbon dioxide, decrease with increasing temperature. Thermoneutral potentials are calculated with Equation 5. Modified with permission from [3].
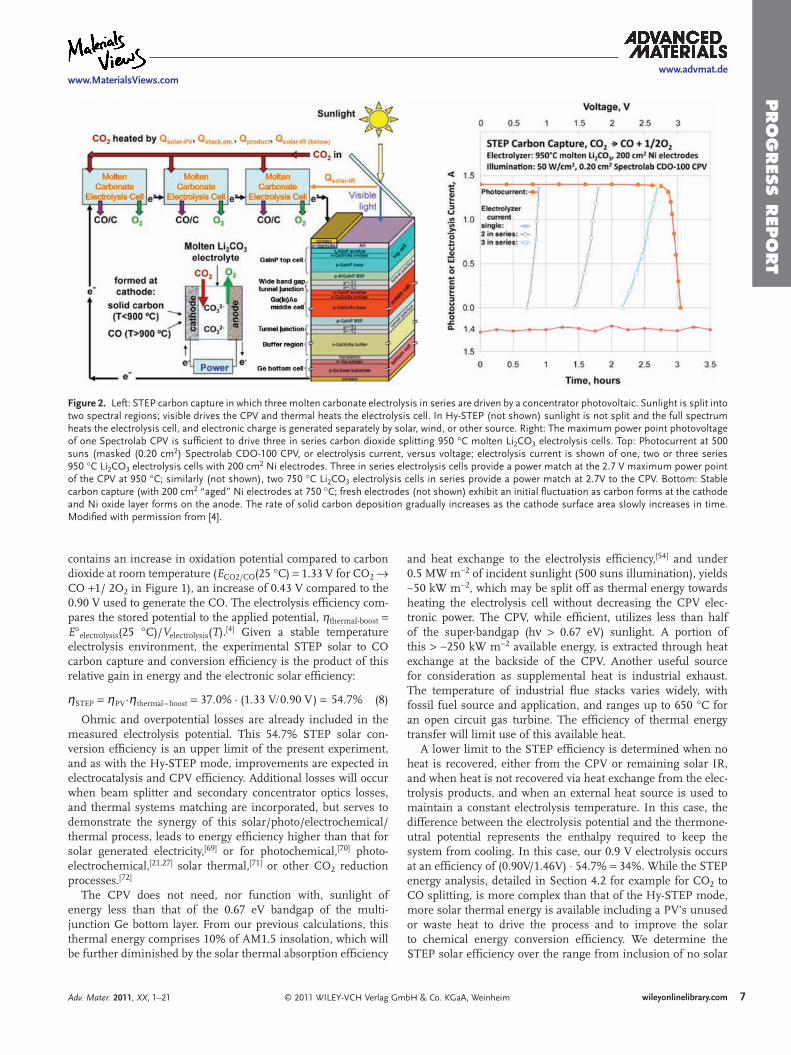
7
www.advmat.dewww.MaterialsViews.com
© 2011 WILEY-VCH Verlag GmbH & Co. KGaA, WeinheimAdv. Mater. 2011, XX, 1–21 wileyonlinelibrary.com
PRO
GRES
S R
EPO
RT
and heat exchange to the electrolysis efficiency,[54] and under 0.5 MW m 2 of incident sunlight (500 suns illumination), yields
50 kW m 2, which may be split off as thermal energy towards heating the electrolysis cell without decreasing the CPV elec-tronic power. The CPV, while efficient, utilizes less than half of the super-bandgap (h 0.67 eV) sunlight. A portion of this 250 kW m 2 available energy, is extracted through heat exchange at the backside of the CPV. Another useful source for consideration as supplemental heat is industrial exhaust. The temperature of industrial flue stacks varies widely, with fossil fuel source and application, and ranges up to 650 C for an open circuit gas turbine. The efficiency of thermal energy transfer will limit use of this available heat.
A lower limit to the STEP efficiency is determined when no heat is recovered, either from the CPV or remaining solar IR, and when heat is not recovered via heat exchange from the elec-trolysis products, and when an external heat source is used to maintain a constant electrolysis temperature. In this case, the difference between the electrolysis potential and the thermone-utral potential represents the enthalpy required to keep the system from cooling. In this case, our 0.9 V electrolysis occurs at an efficiency of (0.90V/1.46V) 54.7% 34%. While the STEP energy analysis, detailed in Section 4.2 for example for CO2 to CO splitting, is more complex than that of the Hy-STEP mode, more solar thermal energy is available including a PV’s unused or waste heat to drive the process and to improve the solar to chemical energy conversion efficiency. We determine the STEP solar efficiency over the range from inclusion of no solar
contains an increase in oxidation potential compared to carbon dioxide at room temperature (ECO2/CO(25 C) 1.33 V for CO2 CO 1/ 2O2 in Figure 1), an increase of 0.43 V compared to the 0.90 V used to generate the CO. The electrolysis efficiency com-pares the stored potential to the applied potential, thermal-boost E electrolysis(25 C)/Velectrolysis(T).[4] Given a stable temperature electrolysis environment, the experimental STEP solar to CO carbon capture and conversion efficiency is the product of this relative gain in energy and the electronic solar efficiency:
STEP PV thermal boost 37 0% (1 33 V 0 90 V) 54 7% (8)
Ohmic and overpotential losses are already included in the measured electrolysis potential. This 54.7% STEP solar con-version efficiency is an upper limit of the present experiment, and as with the Hy-STEP mode, improvements are expected in electrocatalysis and CPV efficiency. Additional losses will occur when beam splitter and secondary concentrator optics losses, and thermal systems matching are incorporated, but serves to demonstrate the synergy of this solar/photo/electrochemical/thermal process, leads to energy efficiency higher than that for solar generated electricity,[69] or for photochemical,[70] photo-electrochemical,[21,27] solar thermal,[71] or other CO2 reduction processes.[72]
The CPV does not need, nor function with, sunlight of energy less than that of the 0.67 eV bandgap of the multi-junction Ge bottom layer. From our previous calculations, this thermal energy comprises 10% of AM1.5 insolation, which will be further diminished by the solar thermal absorption efficiency
Figure 2. Left: STEP carbon capture in which three molten carbonate electrolysis in series are driven by a concentrator photovoltaic. Sunlight is split into two spectral regions; visible drives the CPV and thermal heats the electrolysis cell. In Hy-STEP (not shown) sunlight is not split and the full spectrum heats the electrolysis cell, and electronic charge is generated separately by solar, wind, or other source. Right: The maximum power point photovoltage of one Spectrolab CPV is sufficient to drive three in series carbon dioxide splitting 950 C molten Li2CO3 electrolysis cells. Top: Photocurrent at 500 suns (masked (0.20 cm2) Spectrolab CDO-100 CPV, or electrolysis current, versus voltage; electrolysis current is shown of one, two or three series 950 C Li2CO3 electrolysis cells with 200 cm2 Ni electrodes. Three in series electrolysis cells provide a power match at the 2.7 V maximum power point of the CPV at 950 C; similarly (not shown), two 750 C Li2CO3 electrolysis cells in series provide a power match at 2.7V to the CPV. Bottom: Stable carbon capture (with 200 cm2 “aged” Ni electrodes at 750 C; fresh electrodes (not shown) exhibit an initial fluctuation as carbon forms at the cathode and Ni oxide layer forms on the anode. The rate of solid carbon deposition gradually increases as the cathode surface area slowly increases in time. Modified with permission from [4].
8
www.advmat.dewww.MaterialsViews.com
© 2011 WILEY-VCH Verlag GmbH & Co. KGaA, Weinheim Adv. Mater. 2011, XX, 1–21wileyonlinelibrary.com
PRO
GRES
S R
EPO
RT thermal heat (based on the enthalpy, rather than free energy, of
reaction) to the case where the solar thermal heat is sufficient to sustain the reaction (based on the free energy of reaction). This determines the efficiency range, as chemical flow out to the solar flow in (as measured by the increase in chemical energy of the products compared to the reactants), from 34% to over 50%.
2.3. Identification of STEP Consistent Endothermic Processes
The electrochemical driving force for a variety of chemicals of widespread use by society will be shown to significantly decrease with increasing temperature. As calculated and sum-marized in the top left of Figure 1, the electrochemical driving force for electrolysis of either carbon dioxide or water, signifi-cantly decreases with increasing temperature. The ability to remove CO2 from exhaust stacks or atmospheric sources, pro-vides a response to linked environmental impacts, including global warming due to anthropogenic CO2 emission. From the known thermochemical data for CO2, CO and O2, and in accord with Equation 1, CO2 splitting can be described by:
CO2(g) CO(g) 1 2O2(g);
E CO2split (G CO 0 5G O2 G CO2) 2F; E (25 C)
1 333 V (9)
As an example of the solar energy efficiency gains, this progress report focuses on CO2 splitting potentials, and pro-vides examples of other useful STEP processes. As seen in Figure 1, CO2 splitting potentials decrease more rapidly with temperature than those for water splitting, signifying that the STEP process may be readily applied to CO2 electrolysis. Effi-cient, renewable, non-fossil fuel energy rich carbon sources are needed, and the product of Equation 9, carbon monoxide is a significant industrial gas with a myriad of uses, including the bulk manufacturing of hydrocarbon fuels, acetic acid and aldehydes (and detergent precursors), and for use in indus-trial nickel purification.[66] To alleviate challenges of fossil-fuel resource depletion, CO is an important syngas component and methanol is formed through the reaction with H2. The ability to remove CO2 from exhaust stacks or atmospheric sources, also limits CO2 emission. Based on our original analogous experimental photo-thermal electrochemical water electrolysis design,[55] the first CO2 STEP process consists of solar driven and solar thermal assisted CO2 electrolysis. In particular, in a molten carbonate bath electrolysis cell, fed by CO2.
cathode : 2CO2(g) 2e CO3 (molten) CO(g)
anode : CO3 (molten) CO2(g) 1 2O2(g) 2e
cell CO2(g) CO(g) 1 2O2(g): (10)
Molten alkali carbonate electrolyte fuel cells typically operate at 650 C. Li, Na or K cation variation can affect charge mobility and operational temperatures. Sintered nickel often serves as the anode, porous lithium doped nickel oxide often as the cathode, while the electrolyte is suspended in a porous, insu-lating, chemically inert LiAlO2 ceramic matrix.[67]
Solar thermal energy can be used to favor the formation of products for electrolyses characterized by a negative isothermal temperature coefficient, but will not improve the efficiency of heat neutral or exothermic reactions. An example of this restriction occurs for the electrolysis reaction currently used by industry to generate chlorine. During 2008, the generation of chlorine gas (principally for use as bleach and in the chlor-alkali industry) consumed approximately 1% of the world’s electricity,[68] prepared in accord with the industrial electrolytic process:
2NaCl 2H2O Cl2 H2 2NaOH; E (25 C) 2 502 V (11)
In the lower left portion of Figure 1, the calculated electrol-ysis potential for this industrial chlor-alkali reaction exhibits little variation with temperature, and hence the conventional generation of chlorine by electrolysis would not benefit from the inclusion of solar heating. This potential is relatively invariant, despite a number of phase changes of the components (indi-cated on the figure and which include the melting of NaOH or NaCl). However, as seen in the figure, the calculated potential for the anhydrous electrolysis of chloride salts is endothermic, including the electrolyses to generate not only chlorine, but also metallic lithium, sodium and magnesium, and can be greatly improved through the STEP process:
MCln n 2Cl2 M;
E MCln split(25 C) 3 98 V M
for M = K; 3.07 V for M = Mg
for M = Li or Na;
4.24 V (12)
The calculated decrease for the anhydrous chloride electrol-ysis potentials are on the order of volts per 1000 C tempera-ture change. For example, from 25 C up to the MgCl2 boiling point of 1412 C, the MgCl2 electrolysis potential decreases from 3.07 V to 1.86 V. This decrease provides a theoretical basis for significant, non CO2 emitting, non-fossil fuel consuming processes for the generation of chlorine and magnesium, to be delineated in Section 3.4, and occurring at high solar efficiency analogous to the similar CO2 STEP process.
In Section 3.2 the STEP process will be derived for the effi-cient solar removal/ recycling of CO2. In addition, thermody-namic calculation of metal and chloride electrolysis rest poten-tials identifies electrolytic processes which are consistent with endothermic processes for the formation of iron, chlorine, aluminum, lithium, sodium and magnesium, via CO2-free pathways. As shown, the conversion and replacement of the conventional, aqueous, industrial alkali-chlor process, with an anhydrous electrosynthesis, results in a redox potential with a calculated decrease of 1.1 V from 25 to 1000 C.
As seen in the top right of Figure 1, the calculated elec-trochemical reduction of metal oxides can exhibit a sharp, smooth decrease in redox potential over a wide range of phase changes. These endothermic process provide an opportunity for the replacement of conventional industrial processes by the STEP formation of these metals. In 2008, industrial elec-trolytic processes consumed 5% of the world’s electricity, including for aluminum (3%), chlorine (1%), and lithium, mag-nesium and sodium production. This 5% of the global 19 1012 kWh of electrical production, is equivalent to the emission
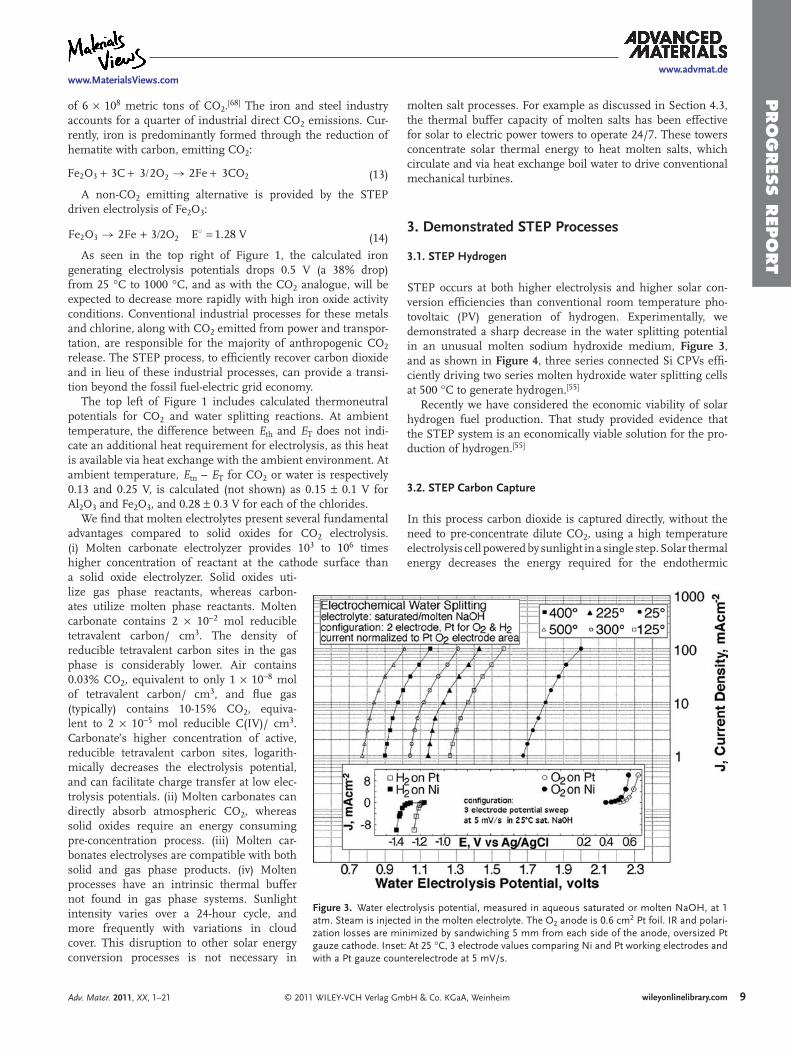
9
www.advmat.dewww.MaterialsViews.com
© 2011 WILEY-VCH Verlag GmbH & Co. KGaA, WeinheimAdv. Mater. 2011, XX, 1–21 wileyonlinelibrary.com
PRO
GRES
S R
EPO
RT
molten salt processes. For example as discussed in Section 4.3, the thermal buffer capacity of molten salts has been effective for solar to electric power towers to operate 24/7. These towers concentrate solar thermal energy to heat molten salts, which circulate and via heat exchange boil water to drive conventional mechanical turbines.
3. Demonstrated STEP Processes
3.1. STEP Hydrogen
STEP occurs at both higher electrolysis and higher solar con-version efficiencies than conventional room temperature pho-tovoltaic (PV) generation of hydrogen. Experimentally, we demonstrated a sharp decrease in the water splitting potential in an unusual molten sodium hydroxide medium, Figure 3, and as shown in Figure 4, three series connected Si CPVs effi-ciently driving two series molten hydroxide water splitting cells at 500 C to generate hydrogen.[55]
Recently we have considered the economic viability of solar hydrogen fuel production. That study provided evidence that the STEP system is an economically viable solution for the pro-duction of hydrogen.[55]
3.2. STEP Carbon Capture
In this process carbon dioxide is captured directly, without the need to pre-concentrate dilute CO2, using a high temperature electrolysis cell powered by sunlight in a single step. Solar thermal energy decreases the energy required for the endothermic
of 6 108 metric tons of CO2.[68] The iron and steel industry accounts for a quarter of industrial direct CO2 emissions. Cur-rently, iron is predominantly formed through the reduction of hematite with carbon, emitting CO2:
Fe2O3 3C 3 2O2 2Fe 3CO2 (13)
A non-CO2 emitting alternative is provided by the STEP driven electrolysis of Fe2O3:
Fe2O3 2Fe 3 2O2 E 1 28 V (14)As seen in the top right of Figure 1, the calculated iron
generating electrolysis potentials drops 0.5 V (a 38% drop) from 25 C to 1000 C, and as with the CO2 analogue, will be expected to decrease more rapidly with high iron oxide activity conditions. Conventional industrial processes for these metals and chlorine, along with CO2 emitted from power and transpor-tation, are responsible for the majority of anthropogenic CO2 release. The STEP process, to efficiently recover carbon dioxide and in lieu of these industrial processes, can provide a transi-tion beyond the fossil fuel-electric grid economy.
The top left of Figure 1 includes calculated thermoneutral potentials for CO2 and water splitting reactions. At ambient temperature, the difference between Eth and ET does not indi-cate an additional heat requirement for electrolysis, as this heat is available via heat exchange with the ambient environment. At ambient temperature, Etn – ET for CO2 or water is respectively 0.13 and 0.25 V, is calculated (not shown) as 0.15 0.1 V for Al2O3 and Fe2O3, and 0.28 0.3 V for each of the chlorides.
We find that molten electrolytes present several fundamental advantages compared to solid oxides for CO2 electrolysis. (i) Molten carbonate electrolyzer provides 103 to 106 times higher concentration of reactant at the cathode surface than a solid oxide electrolyzer. Solid oxides uti-lize gas phase reactants, whereas carbon-ates utilize molten phase reactants. Molten carbonate contains 2 10 2 mol reducible tetravalent carbon/ cm3. The density of reducible tetravalent carbon sites in the gas phase is considerably lower. Air contains 0.03% CO2, equivalent to only 1 10 8 mol of tetravalent carbon/ cm3, and flue gas (typically) contains 10-15% CO2, equiva-lent to 2 10 5 mol reducible C(IV)/ cm3. Carbonate’s higher concentration of active, reducible tetravalent carbon sites, logarith-mically decreases the electrolysis potential, and can facilitate charge transfer at low elec-trolysis potentials. (ii) Molten carbonates can directly absorb atmospheric CO2, whereas solid oxides require an energy consuming pre-concentration process. (iii) Molten car-bonates electrolyses are compatible with both solid and gas phase products. (iv) Molten processes have an intrinsic thermal buffer not found in gas phase systems. Sunlight intensity varies over a 24-hour cycle, and more frequently with variations in cloud cover. This disruption to other solar energy conversion processes is not necessary in
Figure 3. Water electrolysis potential, measured in aqueous saturated or molten NaOH, at 1 atm. Steam is injected in the molten electrolyte. The O2 anode is 0.6 cm2 Pt foil. IR and polari-zation losses are minimized by sandwiching 5 mm from each side of the anode, oversized Pt gauze cathode. Inset: At 25 C, 3 electrode values comparing Ni and Pt working electrodes and with a Pt gauze counterelectrode at 5 mV/s.
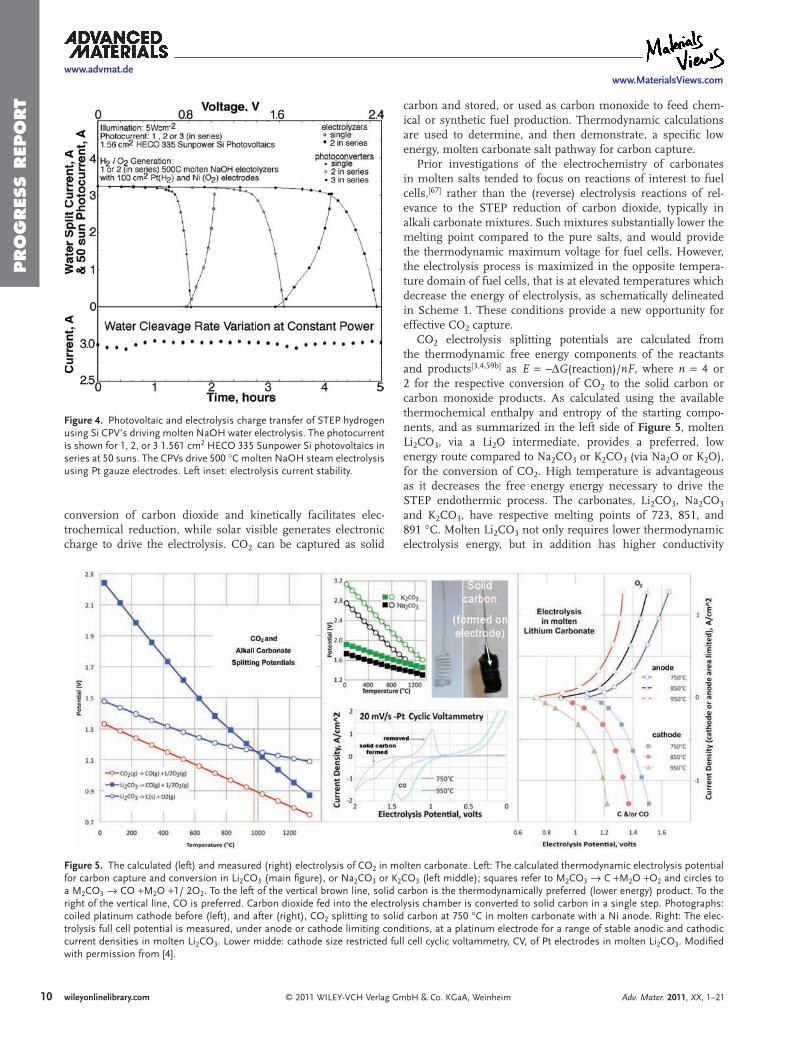
10
www.advmat.dewww.MaterialsViews.com
© 2011 WILEY-VCH Verlag GmbH & Co. KGaA, Weinheim Adv. Mater. 2011, XX, 1–21wileyonlinelibrary.com
PRO
GRES
S R
EPO
RT carbon and stored, or used as carbon monoxide to feed chem-
ical or synthetic fuel production. Thermodynamic calculations are used to determine, and then demonstrate, a specific low energy, molten carbonate salt pathway for carbon capture.
Prior investigations of the electrochemistry of carbonates in molten salts tended to focus on reactions of interest to fuel cells,[67] rather than the (reverse) electrolysis reactions of rel-evance to the STEP reduction of carbon dioxide, typically in alkali carbonate mixtures. Such mixtures substantially lower the melting point compared to the pure salts, and would provide the thermodynamic maximum voltage for fuel cells. However, the electrolysis process is maximized in the opposite tempera-ture domain of fuel cells, that is at elevated temperatures which decrease the energy of electrolysis, as schematically delineated in Scheme 1. These conditions provide a new opportunity for effective CO2 capture.
CO2 electrolysis splitting potentials are calculated from the thermodynamic free energy components of the reactants and products[3,4,59b] as E – G(reaction)/nF, where n 4 or 2 for the respective conversion of CO2 to the solid carbon or carbon monoxide products. As calculated using the available thermochemical enthalpy and entropy of the starting compo-nents, and as summarized in the left side of Figure 5, molten Li2CO3, via a Li2O intermediate, provides a preferred, low energy route compared to Na2CO3 or K2CO3 (via Na2O or K2O), for the conversion of CO2. High temperature is advantageous as it decreases the free energy energy necessary to drive the STEP endothermic process. The carbonates, Li2CO3, Na2CO3 and K2CO3, have respective melting points of 723, 851, and 891 C. Molten Li2CO3 not only requires lower thermodynamic electrolysis energy, but in addition has higher conductivity
conversion of carbon dioxide and kinetically facilitates elec-trochemical reduction, while solar visible generates electronic charge to drive the electrolysis. CO2 can be captured as solid
Figure 4. Photovoltaic and electrolysis charge transfer of STEP hydrogen using Si CPV’s driving molten NaOH water electrolysis. The photocurrent is shown for 1, 2, or 3 1.561 cm2 HECO 335 Sunpower Si photovoltaics in series at 50 suns. The CPVs drive 500 C molten NaOH steam electrolysis using Pt gauze electrodes. Left inset: electrolysis current stability.
Figure 5. The calculated (left) and measured (right) electrolysis of CO2 in molten carbonate. Left: The calculated thermodynamic electrolysis potential for carbon capture and conversion in Li2CO3 (main figure), or Na2CO3 or K2CO3 (left middle); squares refer to M2CO3 C M2O O2 and circles to a M2CO3 CO M2O 1/ 2O2. To the left of the vertical brown line, solid carbon is the thermodynamically preferred (lower energy) product. To the right of the vertical line, CO is preferred. Carbon dioxide fed into the electrolysis chamber is converted to solid carbon in a single step. Photographs: coiled platinum cathode before (left), and after (right), CO2 splitting to solid carbon at 750 C in molten carbonate with a Ni anode. Right: The elec-trolysis full cell potential is measured, under anode or cathode limiting conditions, at a platinum electrode for a range of stable anodic and cathodic current densities in molten Li2CO3. Lower midde: cathode size restricted full cell cyclic voltammetry, CV, of Pt electrodes in molten Li2CO3. Modified with permission from [4].
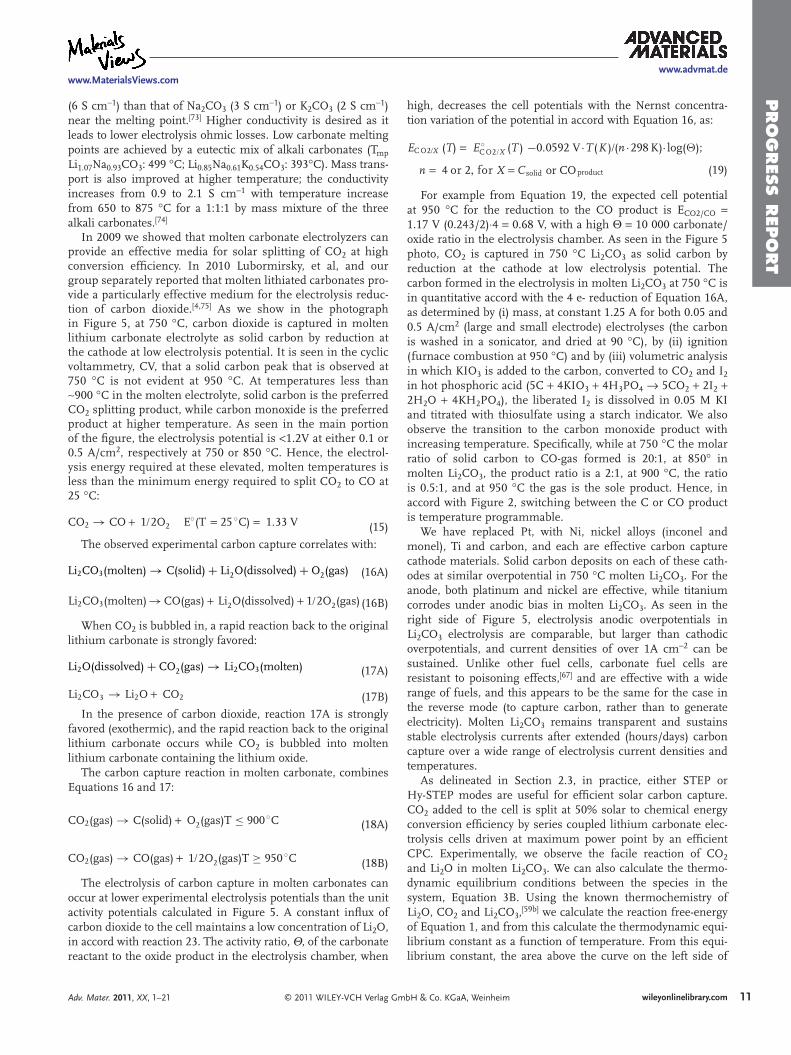
11
www.advmat.dewww.MaterialsViews.com
© 2011 WILEY-VCH Verlag GmbH & Co. KGaA, WeinheimAdv. Mater. 2011, XX, 1–21 wileyonlinelibrary.com
PRO
GRES
S R
EPO
RT
high, decreases the cell potentials with the Nernst concentra-tion variation of the potential in accord with Equation 16, as:
EC O2 X (T) EC O2 X (T T0 0592 V (K ) (n 298 K) log( );
n 4 or 2 or X Csolid
)
f or COproduct (19)
For example from Equation 19, the expected cell potential at 950 C for the reduction to the CO product is ECO2/CO 1.17 V (0.243/2) 4 0.68 V, with a high 10 000 carbonate/oxide ratio in the electrolysis chamber. As seen in the Figure 5 photo, CO2 is captured in 750 C Li2CO3 as solid carbon by reduction at the cathode at low electrolysis potential. The carbon formed in the electrolysis in molten Li2CO3 at 750 C is in quantitative accord with the 4 e- reduction of Equation 16A, as determined by (i) mass, at constant 1.25 A for both 0.05 and 0.5 A/cm2 (large and small electrode) electrolyses (the carbon is washed in a sonicator, and dried at 90 C), by (ii) ignition (furnace combustion at 950 C) and by (iii) volumetric analysis in which KIO3 is added to the carbon, converted to CO2 and I2 in hot phosphoric acid (5C 4KIO3 4H3PO4 5CO2 2I2 2H2O 4KH2PO4), the liberated I2 is dissolved in 0.05 M KI and titrated with thiosulfate using a starch indicator. We also observe the transition to the carbon monoxide product with increasing temperature. Specifically, while at 750 C the molar ratio of solid carbon to CO-gas formed is 20:1, at 850 in molten Li2CO3, the product ratio is a 2:1, at 900 C, the ratio is 0.5:1, and at 950 C the gas is the sole product. Hence, in accord with Figure 2, switching between the C or CO product is temperature programmable.
We have replaced Pt, with Ni, nickel alloys (inconel and monel), Ti and carbon, and each are effective carbon capture cathode materials. Solid carbon deposits on each of these cath-odes at similar overpotential in 750 C molten Li2CO3. For the anode, both platinum and nickel are effective, while titanium corrodes under anodic bias in molten Li2CO3. As seen in the right side of Figure 5, electrolysis anodic overpotentials in Li2CO3 electrolysis are comparable, but larger than cathodic overpotentials, and current densities of over 1A cm 2 can be sustained. Unlike other fuel cells, carbonate fuel cells are resistant to poisoning effects,[67] and are effective with a wide range of fuels, and this appears to be the same for the case in the reverse mode (to capture carbon, rather than to generate electricity). Molten Li2CO3 remains transparent and sustains stable electrolysis currents after extended (hours/days) carbon capture over a wide range of electrolysis current densities and temperatures.
As delineated in Section 2.3, in practice, either STEP or Hy-STEP modes are useful for efficient solar carbon capture. CO2 added to the cell is split at 50% solar to chemical energy conversion efficiency by series coupled lithium carbonate elec-trolysis cells driven at maximum power point by an efficient CPC. Experimentally, we observe the facile reaction of CO2 and Li2O in molten Li2CO3. We can also calculate the thermo-dynamic equilibrium conditions between the species in the system, Equation 3B. Using the known thermochemistry of Li2O, CO2 and Li2CO3,[59b] we calculate the reaction free-energy of Equation 1, and from this calculate the thermodynamic equi-librium constant as a function of temperature. From this equi-librium constant, the area above the curve on the left side of
(6 S cm 1) than that of Na2CO3 (3 S cm 1) or K2CO3 (2 S cm 1) near the melting point.[73] Higher conductivity is desired as it leads to lower electrolysis ohmic losses. Low carbonate melting points are achieved by a eutectic mix of alkali carbonates (Tmp Li1.07Na0.93CO3: 499 C; Li0.85Na0.61K0.54CO3: 393 C). Mass trans-port is also improved at higher temperature; the conductivity increases from 0.9 to 2.1 S cm 1 with temperature increase from 650 to 875 C for a 1:1:1 by mass mixture of the three alkali carbonates.[74]
In 2009 we showed that molten carbonate electrolyzers can provide an effective media for solar splitting of CO2 at high conversion efficiency. In 2010 Lubormirsky, et al, and our group separately reported that molten lithiated carbonates pro-vide a particularly effective medium for the electrolysis reduc-tion of carbon dioxide.[4,75] As we show in the photograph in Figure 5, at 750 C, carbon dioxide is captured in molten lithium carbonate electrolyte as solid carbon by reduction at the cathode at low electrolysis potential. It is seen in the cyclic voltammetry, CV, that a solid carbon peak that is observed at 750 C is not evident at 950 C. At temperatures less than
900 C in the molten electrolyte, solid carbon is the preferred CO2 splitting product, while carbon monoxide is the preferred product at higher temperature. As seen in the main portion of the figure, the electrolysis potential is 1.2V at either 0.1 or 0.5 A/cm2, respectively at 750 or 850 C. Hence, the electrol-ysis energy required at these elevated, molten temperatures is less than the minimum energy required to split CO2 to CO at 25 C:
CO2 CO 1 2O2 E (T 25 C) 1 33 V (15)The observed experimental carbon capture correlates with:
Li2CO3(molten) C(solid) Li2O(dissolved) O2(gas) (16A)
Li2CO3(molten) CO(gas) Li2O(dissolved) 1 2O2(gas) (16B)
When CO2 is bubbled in, a rapid reaction back to the original lithium carbonate is strongly favored:
Li2O(dissolved) CO2(gas) Li2CO3(molten) (17A)
Li2 3CO Li2O CO2 (17B)In the presence of carbon dioxide, reaction 17A is strongly
favored (exothermic), and the rapid reaction back to the original lithium carbonate occurs while CO2 is bubbled into molten lithium carbonate containing the lithium oxide.
The carbon capture reaction in molten carbonate, combines Equations 16 and 17:
CO2(gas) C(solid) O2(gas)T 900 C (18A)
CO2(gas) CO(gas) 1 2O2(gas)T 950 C (18B)
The electrolysis of carbon capture in molten carbonates can occur at lower experimental electrolysis potentials than the unit activity potentials calculated in Figure 5. A constant influx of carbon dioxide to the cell maintains a low concentration of Li2O, in accord with reaction 23. The activity ratio, , of the carbonate reactant to the oxide product in the electrolysis chamber, when
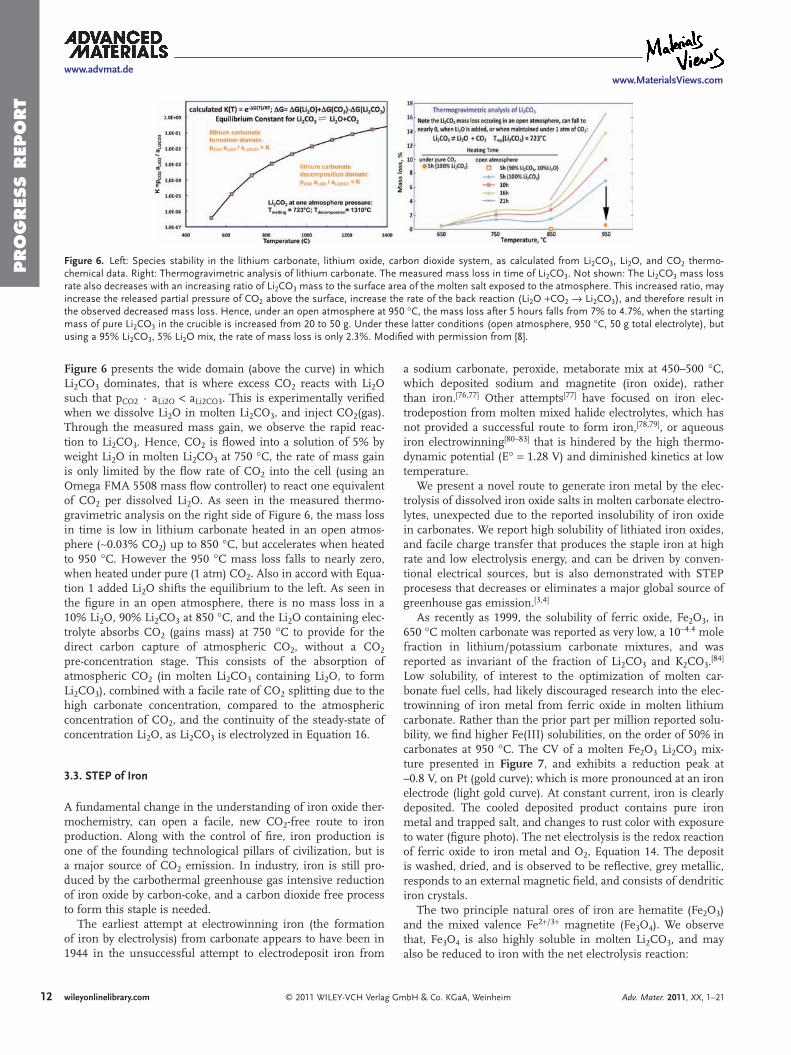
12
www.advmat.dewww.MaterialsViews.com
© 2011 WILEY-VCH Verlag GmbH & Co. KGaA, Weinheim Adv. Mater. 2011, XX, 1–21wileyonlinelibrary.com
PRO
GRES
S R
EPO
RT
Figure 6 presents the wide domain (above the curve) in which Li2CO3 dominates, that is where excess CO2 reacts with Li2O such that pCO2 · aLi2O aLi2CO3. This is experimentally verified when we dissolve Li2O in molten Li2CO3, and inject CO2(gas). Through the measured mass gain, we observe the rapid reac-tion to Li2CO3. Hence, CO2 is flowed into a solution of 5% by weight Li2O in molten Li2CO3 at 750 C, the rate of mass gain is only limited by the flow rate of CO2 into the cell (using an Omega FMA 5508 mass flow controller) to react one equivalent of CO2 per dissolved Li2O. As seen in the measured thermo-gravimetric analysis on the right side of Figure 6, the mass loss in time is low in lithium carbonate heated in an open atmos-phere ( 0.03% CO2) up to 850 C, but accelerates when heated to 950 C. However the 950 C mass loss falls to nearly zero, when heated under pure (1 atm) CO2. Also in accord with Equa-tion 1 added Li2O shifts the equilibrium to the left. As seen in the figure in an open atmosphere, there is no mass loss in a 10% Li2O, 90% Li2CO3 at 850 C, and the Li2O containing elec-trolyte absorbs CO2 (gains mass) at 750 C to provide for the direct carbon capture of atmospheric CO2, without a CO2 pre-concentration stage. This consists of the absorption of atmospheric CO2 (in molten Li2CO3 containing Li2O, to form Li2CO3), combined with a facile rate of CO2 splitting due to the high carbonate concentration, compared to the atmospheric concentration of CO2, and the continuity of the steady-state of concentration Li2O, as Li2CO3 is electrolyzed in Equation 16.
3.3. STEP of Iron
A fundamental change in the understanding of iron oxide ther-mochemistry, can open a facile, new CO2-free route to iron production. Along with the control of fire, iron production is one of the founding technological pillars of civilization, but is a major source of CO2 emission. In industry, iron is still pro-duced by the carbothermal greenhouse gas intensive reduction of iron oxide by carbon-coke, and a carbon dioxide free process to form this staple is needed.
The earliest attempt at electrowinning iron (the formation of iron by electrolysis) from carbonate appears to have been in 1944 in the unsuccessful attempt to electrodeposit iron from
a sodium carbonate, peroxide, metaborate mix at 450–500 C, which deposited sodium and magnetite (iron oxide), rather than iron.[76,77] Other attempts[77] have focused on iron elec-trodepostion from molten mixed halide electrolytes, which has not provided a successful route to form iron,[78,79], or aqueous iron electrowinning[80–83] that is hindered by the high thermo-dynamic potential (E 1.28 V) and diminished kinetics at low temperature.
We present a novel route to generate iron metal by the elec-trolysis of dissolved iron oxide salts in molten carbonate electro-lytes, unexpected due to the reported insolubility of iron oxide in carbonates. We report high solubility of lithiated iron oxides, and facile charge transfer that produces the staple iron at high rate and low electrolysis energy, and can be driven by conven-tional electrical sources, but is also demonstrated with STEP procesess that decreases or eliminates a major global source of greenhouse gas emission.[3,4]
As recently as 1999, the solubility of ferric oxide, Fe2O3, in 650 C molten carbonate was reported as very low, a 10 4.4 mole fraction in lithium/potassium carbonate mixtures, and was reported as invariant of the fraction of Li2CO3 and K2CO3.[84] Low solubility, of interest to the optimization of molten car-bonate fuel cells, had likely discouraged research into the elec-trowinning of iron metal from ferric oxide in molten lithium carbonate. Rather than the prior part per million reported solu-bility, we find higher Fe(III) solubilities, on the order of 50% in carbonates at 950 C. The CV of a molten Fe2O3 Li2CO3 mix-ture presented in Figure 7, and exhibits a reduction peak at –0.8 V, on Pt (gold curve); which is more pronounced at an iron electrode (light gold curve). At constant current, iron is clearly deposited. The cooled deposited product contains pure iron metal and trapped salt, and changes to rust color with exposure to water (figure photo). The net electrolysis is the redox reaction of ferric oxide to iron metal and O2, Equation 14. The deposit is washed, dried, and is observed to be reflective, grey metallic, responds to an external magnetic field, and consists of dendritic iron crystals.
The two principle natural ores of iron are hematite (Fe2O3) and the mixed valence Fe2 /3 magnetite (Fe3O4). We observe that, Fe3O4 is also highly soluble in molten Li2CO3, and may also be reduced to iron with the net electrolysis reaction:
Figure 6. Left: Species stability in the lithium carbonate, lithium oxide, carbon dioxide system, as calculated from Li2CO3, Li2O, and CO2 thermo-chemical data. Right: Thermogravimetric analysis of lithium carbonate. The measured mass loss in time of Li2CO3. Not shown: The Li2CO3 mass loss rate also decreases with an increasing ratio of Li2CO3 mass to the surface area of the molten salt exposed to the atmosphere. This increased ratio, may increase the released partial pressure of CO2 above the surface, increase the rate of the back reaction (Li2O CO2 Li2CO3), and therefore result in the observed decreased mass loss. Hence, under an open atmosphere at 950 C, the mass loss after 5 hours falls from 7% to 4.7%, when the starting mass of pure Li2CO3 in the crucible is increased from 20 to 50 g. Under these latter conditions (open atmosphere, 950 C, 50 g total electrolyte), but using a 95% Li2CO3, 5% Li2O mix, the rate of mass loss is only 2.3%. Modified with permission from [8].
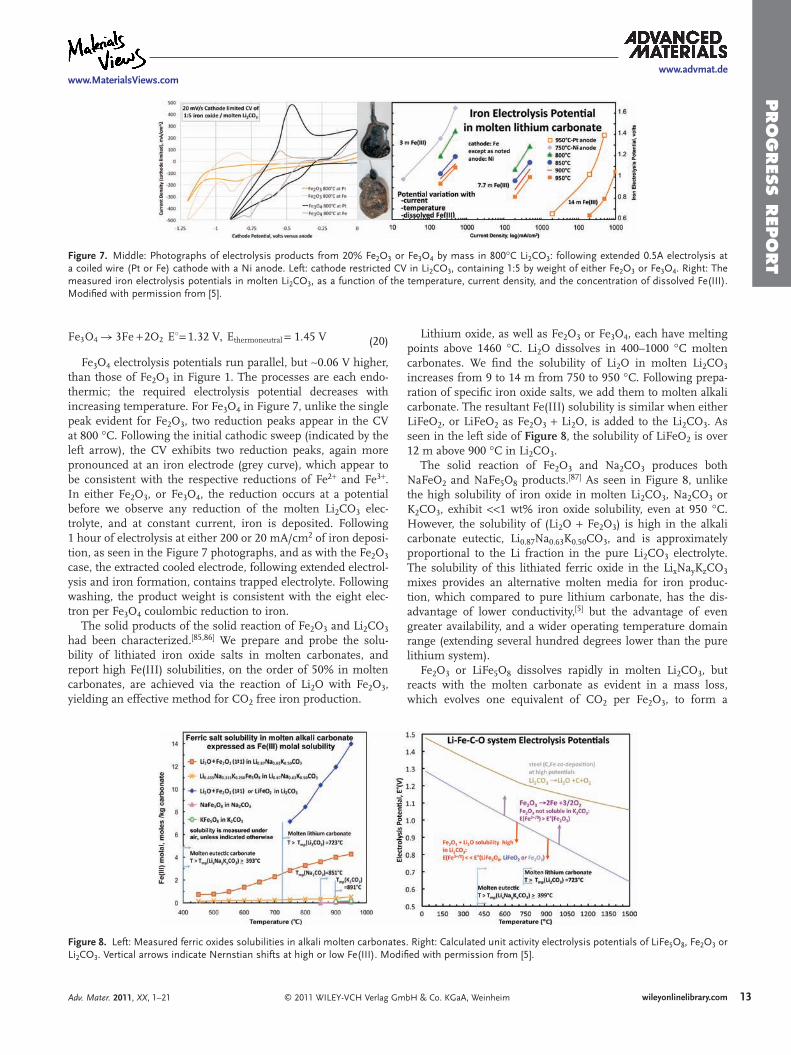
13
www.advmat.dewww.MaterialsViews.com
© 2011 WILEY-VCH Verlag GmbH & Co. KGaA, WeinheimAdv. Mater. 2011, XX, 1–21 wileyonlinelibrary.com
PRO
GRES
S R
EPO
RT
Lithium oxide, as well as Fe2O3 or Fe3O4, each have melting points above 1460 C. Li2O dissolves in 400–1000 C molten carbonates. We find the solubility of Li2O in molten Li2CO3 increases from 9 to 14 m from 750 to 950 C. Following prepa-ration of specific iron oxide salts, we add them to molten alkali carbonate. The resultant Fe(III) solubility is similar when either LiFeO2, or LiFeO2 as Fe2O3 Li2O, is added to the Li2CO3. As seen in the left side of Figure 8, the solubility of LiFeO2 is over 12 m above 900 C in Li2CO3.
The solid reaction of Fe2O3 and Na2CO3 produces both NaFeO2 and NaFe5O8 products.[87] As seen in Figure 8, unlike the high solubility of iron oxide in molten Li2CO3, Na2CO3 or K2CO3, exhibit 1 wt% iron oxide solubility, even at 950 C. However, the solubility of (Li2O Fe2O3) is high in the alkali carbonate eutectic, Li0.87Na0.63K0.50CO3, and is approximately proportional to the Li fraction in the pure Li2CO3 electrolyte. The solubility of this lithiated ferric oxide in the LixNayKzCO3 mixes provides an alternative molten media for iron produc-tion, which compared to pure lithium carbonate, has the dis-advantage of lower conductivity,[5] but the advantage of even greater availability, and a wider operating temperature domain range (extending several hundred degrees lower than the pure lithium system).
Fe2O3 or LiFe5O8 dissolves rapidly in molten Li2CO3, but reacts with the molten carbonate as evident in a mass loss, which evolves one equivalent of CO2 per Fe2O3, to form a
Fe3O4 3Fe 2O2 E 1 32 V Ethermoneutral 1 45 V (20)
Fe3O4 electrolysis potentials run parallel, but 0.06 V higher, than those of Fe2O3 in Figure 1. The processes are each endo-thermic; the required electrolysis potential decreases with increasing temperature. For Fe3O4 in Figure 7, unlike the single peak evident for Fe2O3, two reduction peaks appear in the CV at 800 C. Following the initial cathodic sweep (indicated by the left arrow), the CV exhibits two reduction peaks, again more pronounced at an iron electrode (grey curve), which appear to be consistent with the respective reductions of Fe2 and Fe3 . In either Fe2O3, or Fe3O4, the reduction occurs at a potential before we observe any reduction of the molten Li2CO3 elec-trolyte, and at constant current, iron is deposited. Following 1 hour of electrolysis at either 200 or 20 mA/cm2 of iron deposi-tion, as seen in the Figure 7 photographs, and as with the Fe2O3 case, the extracted cooled electrode, following extended electrol-ysis and iron formation, contains trapped electrolyte. Following washing, the product weight is consistent with the eight elec-tron per Fe3O4 coulombic reduction to iron.
The solid products of the solid reaction of Fe2O3 and Li2CO3 had been characterized.[85,86] We prepare and probe the solu-bility of lithiated iron oxide salts in molten carbonates, and report high Fe(III) solubilities, on the order of 50% in molten carbonates, are achieved via the reaction of Li2O with Fe2O3, yielding an effective method for CO2 free iron production.
Figure 7. Middle: Photographs of electrolysis products from 20% Fe2O3 or Fe3O4 by mass in 800 C Li2CO3: following extended 0.5A electrolysis at a coiled wire (Pt or Fe) cathode with a Ni anode. Left: cathode restricted CV in Li2CO3, containing 1:5 by weight of either Fe2O3 or Fe3O4. Right: The measured iron electrolysis potentials in molten Li2CO3, as a function of the temperature, current density, and the concentration of dissolved Fe(III). Modified with permission from [5].
Figure 8. Left: Measured ferric oxides solubilities in alkali molten carbonates. Right: Calculated unit activity electrolysis potentials of LiFe5O8, Fe2O3 or Li2CO3. Vertical arrows indicate Nernstian shifts at high or low Fe(III). Modified with permission from [5].
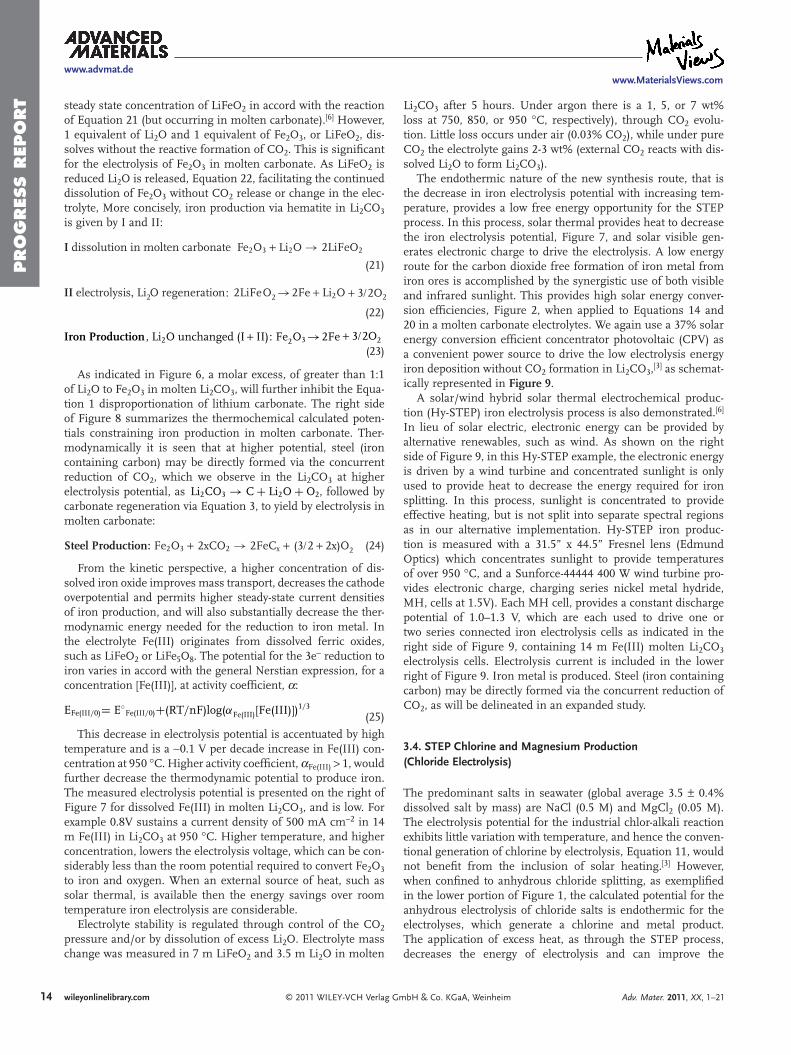
14
www.advmat.dewww.MaterialsViews.com
© 2011 WILEY-VCH Verlag GmbH & Co. KGaA, Weinheim Adv. Mater. 2011, XX, 1–21wileyonlinelibrary.com
PRO
GRES
S R
EPO
RT steady state concentration of LiFeO2 in accord with the reaction
of Equation 21 (but occurring in molten carbonate).[6] However, 1 equivalent of Li2O and 1 equivalent of Fe2O3, or LiFeO2, dis-solves without the reactive formation of CO2. This is significant for the electrolysis of Fe2O3 in molten carbonate. As LiFeO2 is reduced Li2O is released, Equation 22, facilitating the continued dissolution of Fe2O3 without CO2 release or change in the elec-trolyte, More concisely, iron production via hematite in Li2CO3 is given by I and II:
I dissolution in molten carbonate Fe2O3 Li2O 2LiFeO2 (21)
II electrolysis Li2O regeneration 2LiFeO2 2Fe Li2O 3 2O2:
(22)
Iron Production , Li2O unchanged (I II): Fe2O3 2Fe 3 2O2
(23)
As indicated in Figure 6, a molar excess, of greater than 1:1 of Li2O to Fe2O3 in molten Li2CO3, will further inhibit the Equa-tion 1 disproportionation of lithium carbonate. The right side of Figure 8 summarizes the thermochemical calculated poten-tials constraining iron production in molten carbonate. Ther-modynamically it is seen that at higher potential, steel (iron containing carbon) may be directly formed via the concurrent reduction of CO2, which we observe in the Li2CO3 at higher electrolysis potential, as Li2CO3 C Li2O O2, followed by carbonate regeneration via Equation 3, to yield by electrolysis in molten carbonate:
Steel Production: Fe2O3 2xCO2 2FeCx (3 2 2x)O2 (24)
From the kinetic perspective, a higher concentration of dis-solved iron oxide improves mass transport, decreases the cathode overpotential and permits higher steady-state current densities of iron production, and will also substantially decrease the ther-modynamic energy needed for the reduction to iron metal. In the electrolyte Fe(III) originates from dissolved ferric oxides, such as LiFeO2 or LiFe5O8. The potential for the 3e reduction to iron varies in accord with the general Nerstian expression, for a concentration [Fe(III)], at activity coefficient, :
EFe(III 0) E Fe(III 0) (RT nF)log( Fe(III)[Fe(III)])1 3
(25)This decrease in electrolysis potential is accentuated by high
temperature and is a 0.1 V per decade increase in Fe(III) con-centration at 950 C. Higher activity coefficient, Fe(III) 1, would further decrease the thermodynamic potential to produce iron. The measured electrolysis potential is presented on the right of Figure 7 for dissolved Fe(III) in molten Li2CO3, and is low. For example 0.8V sustains a current density of 500 mA cm 2 in 14 m Fe(III) in Li2CO3 at 950 C. Higher temperature, and higher concentration, lowers the electrolysis voltage, which can be con-siderably less than the room potential required to convert Fe2O3 to iron and oxygen. When an external source of heat, such as solar thermal, is available then the energy savings over room temperature iron electrolysis are considerable.
Electrolyte stability is regulated through control of the CO2 pressure and/or by dissolution of excess Li2O. Electrolyte mass change was measured in 7 m LiFeO2 and 3.5 m Li2O in molten
Li2CO3 after 5 hours. Under argon there is a 1, 5, or 7 wt% loss at 750, 850, or 950 C, respectively), through CO2 evolu-tion. Little loss occurs under air (0.03% CO2), while under pure CO2 the electrolyte gains 2-3 wt% (external CO2 reacts with dis-solved Li2O to form Li2CO3).
The endothermic nature of the new synthesis route, that is the decrease in iron electrolysis potential with increasing tem-perature, provides a low free energy opportunity for the STEP process. In this process, solar thermal provides heat to decrease the iron electrolysis potential, Figure 7, and solar visible gen-erates electronic charge to drive the electrolysis. A low energy route for the carbon dioxide free formation of iron metal from iron ores is accomplished by the synergistic use of both visible and infrared sunlight. This provides high solar energy conver-sion efficiencies, Figure 2, when applied to Equations 14 and 20 in a molten carbonate electrolytes. We again use a 37% solar energy conversion efficient concentrator photovoltaic (CPV) as a convenient power source to drive the low electrolysis energy iron deposition without CO2 formation in Li2CO3,[3] as schemat-ically represented in Figure 9.
A solar/wind hybrid solar thermal electrochemical produc-tion (Hy-STEP) iron electrolysis process is also demonstrated.[6] In lieu of solar electric, electronic energy can be provided by alternative renewables, such as wind. As shown on the right side of Figure 9, in this Hy-STEP example, the electronic energy is driven by a wind turbine and concentrated sunlight is only used to provide heat to decrease the energy required for iron splitting. In this process, sunlight is concentrated to provide effective heating, but is not split into separate spectral regions as in our alternative implementation. Hy-STEP iron produc-tion is measured with a 31.5” x 44.5” Fresnel lens (Edmund Optics) which concentrates sunlight to provide temperatures of over 950 C, and a Sunforce-44444 400 W wind turbine pro-vides electronic charge, charging series nickel metal hydride, MH, cells at 1.5V). Each MH cell, provides a constant discharge potential of 1.0–1.3 V, which are each used to drive one or two series connected iron electrolysis cells as indicated in the right side of Figure 9, containing 14 m Fe(III) molten Li2CO3 electrolysis cells. Electrolysis current is included in the lower right of Figure 9. Iron metal is produced. Steel (iron containing carbon) may be directly formed via the concurrent reduction of CO2, as will be delineated in an expanded study.
3.4. STEP Chlorine and Magnesium Production (Chloride Electrolysis)
The predominant salts in seawater (global average 3.5 0.4% dissolved salt by mass) are NaCl (0.5 M) and MgCl2 (0.05 M). The electrolysis potential for the industrial chlor-alkali reaction exhibits little variation with temperature, and hence the conven-tional generation of chlorine by electrolysis, Equation 11, would not benefit from the inclusion of solar heating.[3] However, when confined to anhydrous chloride splitting, as exemplified in the lower portion of Figure 1, the calculated potential for the anhydrous electrolysis of chloride salts is endothermic for the electrolyses, which generate a chlorine and metal product. The application of excess heat, as through the STEP process, decreases the energy of electrolysis and can improve the
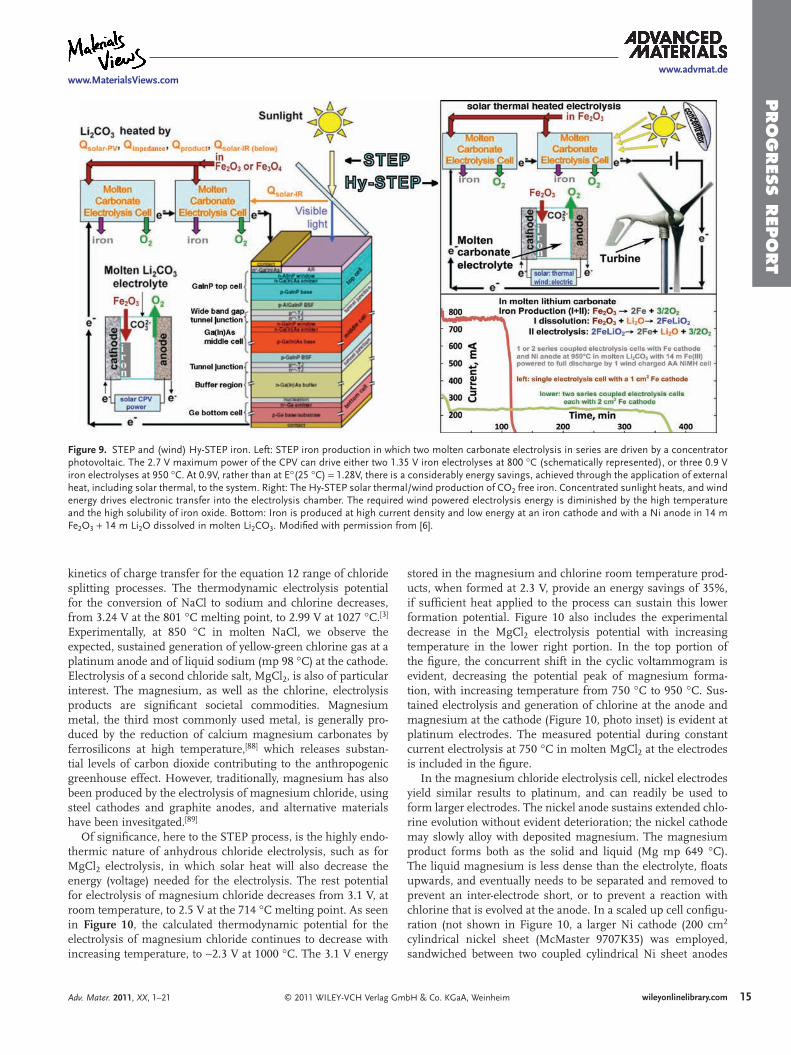
15
www.advmat.dewww.MaterialsViews.com
© 2011 WILEY-VCH Verlag GmbH & Co. KGaA, WeinheimAdv. Mater. 2011, XX, 1–21 wileyonlinelibrary.com
PRO
GRES
S R
EPO
RT
kinetics of charge transfer for the equation 12 range of chloride splitting processes. The thermodynamic electrolysis potential for the conversion of NaCl to sodium and chlorine decreases, from 3.24 V at the 801 C melting point, to 2.99 V at 1027 C.[3] Experimentally, at 850 C in molten NaCl, we observe the expected, sustained generation of yellow-green chlorine gas at a platinum anode and of liquid sodium (mp 98 C) at the cathode. Electrolysis of a second chloride salt, MgCl2, is also of particular interest. The magnesium, as well as the chlorine, electrolysis products are significant societal commodities. Magnesium metal, the third most commonly used metal, is generally pro-duced by the reduction of calcium magnesium carbonates by ferrosilicons at high temperature,[88] which releases substan-tial levels of carbon dioxide contributing to the anthropogenic greenhouse effect. However, traditionally, magnesium has also been produced by the electrolysis of magnesium chloride, using steel cathodes and graphite anodes, and alternative materials have been invesitgated.[89]
Of significance, here to the STEP process, is the highly endo-thermic nature of anhydrous chloride electrolysis, such as for MgCl2 electrolysis, in which solar heat will also decrease the energy (voltage) needed for the electrolysis. The rest potential for electrolysis of magnesium chloride decreases from 3.1 V, at room temperature, to 2.5 V at the 714 C melting point. As seen in Figure 10, the calculated thermodynamic potential for the electrolysis of magnesium chloride continues to decrease with increasing temperature, to 2.3 V at 1000 C. The 3.1 V energy
stored in the magnesium and chlorine room temperature prod-ucts, when formed at 2.3 V, provide an energy savings of 35%, if sufficient heat applied to the process can sustain this lower formation potential. Figure 10 also includes the experimental decrease in the MgCl2 electrolysis potential with increasing temperature in the lower right portion. In the top portion of the figure, the concurrent shift in the cyclic voltammogram is evident, decreasing the potential peak of magnesium forma-tion, with increasing temperature from 750 C to 950 C. Sus-tained electrolysis and generation of chlorine at the anode and magnesium at the cathode (Figure 10, photo inset) is evident at platinum electrodes. The measured potential during constant current electrolysis at 750 C in molten MgCl2 at the electrodes is included in the figure.
In the magnesium chloride electrolysis cell, nickel electrodes yield similar results to platinum, and can readily be used to form larger electrodes. The nickel anode sustains extended chlo-rine evolution without evident deterioration; the nickel cathode may slowly alloy with deposited magnesium. The magnesium product forms both as the solid and liquid (Mg mp 649 C). The liquid magnesium is less dense than the electrolyte, floats upwards, and eventually needs to be separated and removed to prevent an inter-electrode short, or to prevent a reaction with chlorine that is evolved at the anode. In a scaled up cell configu-ration (not shown in Figure 10, a larger Ni cathode (200 cm2 cylindrical nickel sheet (McMaster 9707K35) was employed, sandwiched between two coupled cylindrical Ni sheet anodes
Figure 9. STEP and (wind) Hy-STEP iron. Left: STEP iron production in which two molten carbonate electrolysis in series are driven by a concentrator photovoltaic. The 2.7 V maximum power of the CPV can drive either two 1.35 V iron electrolyses at 800 C (schematically represented), or three 0.9 V iron electrolyses at 950 C. At 0.9V, rather than at E (25 C) 1.28V, there is a considerably energy savings, achieved through the application of external heat, including solar thermal, to the system. Right: The Hy-STEP solar thermal/wind production of CO2 free iron. Concentrated sunlight heats, and wind energy drives electronic transfer into the electrolysis chamber. The required wind powered electrolysis energy is diminished by the high temperature and the high solubility of iron oxide. Bottom: Iron is produced at high current density and low energy at an iron cathode and with a Ni anode in 14 m Fe2O3 14 m Li2O dissolved in molten Li2CO3. Modified with permission from [6].
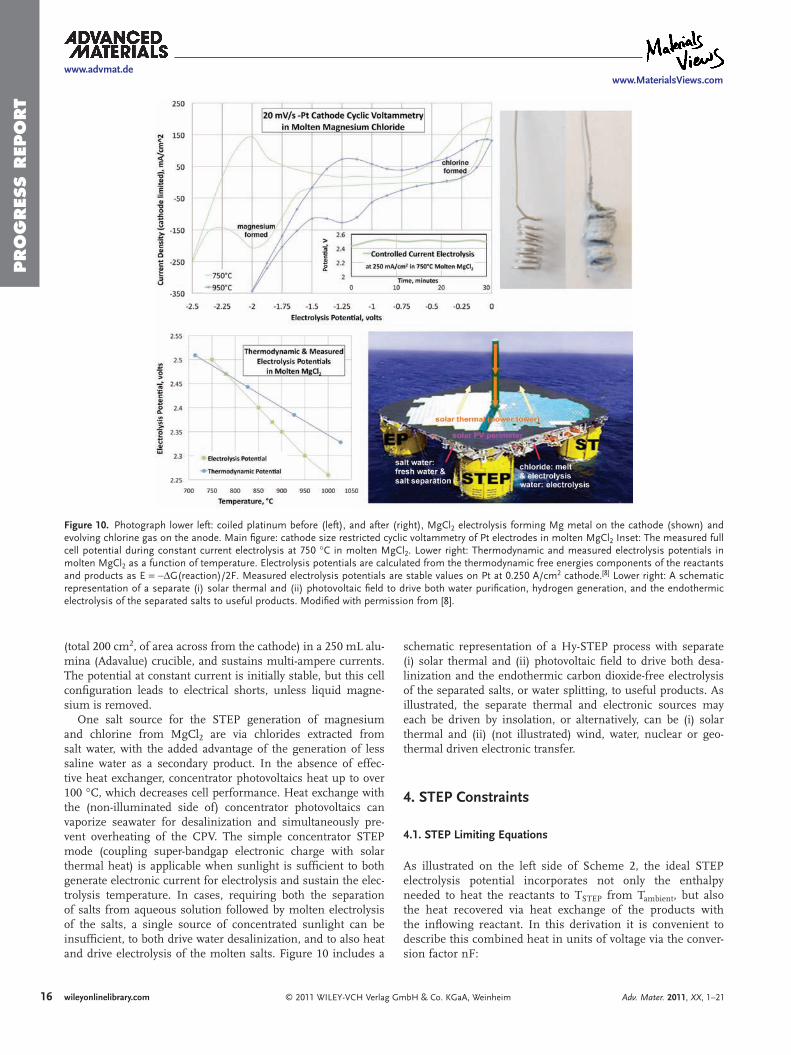
16
www.advmat.dewww.MaterialsViews.com
© 2011 WILEY-VCH Verlag GmbH & Co. KGaA, Weinheim Adv. Mater. 2011, XX, 1–21wileyonlinelibrary.com
PRO
GRES
S R
EPO
RT
schematic representation of a Hy-STEP process with separate (i) solar thermal and (ii) photovoltaic field to drive both desa-linization and the endothermic carbon dioxide-free electrolysis of the separated salts, or water splitting, to useful products. As illustrated, the separate thermal and electronic sources may each be driven by insolation, or alternatively, can be (i) solar thermal and (ii) (not illustrated) wind, water, nuclear or geo-thermal driven electronic transfer.
4. STEP Constraints
4.1. STEP Limiting Equations
As illustrated on the left side of Scheme 2, the ideal STEP electrolysis potential incorporates not only the enthalpy needed to heat the reactants to TSTEP from Tambient, but also the heat recovered via heat exchange of the products with the inflowing reactant. In this derivation it is convenient to describe this combined heat in units of voltage via the conver-sion factor nF:
(total 200 cm2, of area across from the cathode) in a 250 mL alu-mina (Adavalue) crucible, and sustains multi-ampere currents. The potential at constant current is initially stable, but this cell configuration leads to electrical shorts, unless liquid magne-sium is removed.
One salt source for the STEP generation of magnesium and chlorine from MgCl2 are via chlorides extracted from salt water, with the added advantage of the generation of less saline water as a secondary product. In the absence of effec-tive heat exchanger, concentrator photovoltaics heat up to over 100 C, which decreases cell performance. Heat exchange with the (non-illuminated side of) concentrator photovoltaics can vaporize seawater for desalinization and simultaneously pre-vent overheating of the CPV. The simple concentrator STEP mode (coupling super-bandgap electronic charge with solar thermal heat) is applicable when sunlight is sufficient to both generate electronic current for electrolysis and sustain the elec-trolysis temperature. In cases, requiring both the separation of salts from aqueous solution followed by molten electrolysis of the salts, a single source of concentrated sunlight can be insufficient, to both drive water desalinization, and to also heat and drive electrolysis of the molten salts. Figure 10 includes a
Figure 10. Photograph lower left: coiled platinum before (left), and after (right), MgCl2 electrolysis forming Mg metal on the cathode (shown) and evolving chlorine gas on the anode. Main figure: cathode size restricted cyclic voltammetry of Pt electrodes in molten MgCl2 Inset: The measured full cell potential during constant current electrolysis at 750 C in molten MgCl2. Lower right: Thermodynamic and measured electrolysis potentials in molten MgCl2 as a function of temperature. Electrolysis potentials are calculated from the thermodynamic free energies components of the reactants and products as E G(reaction)/2F. Measured electrolysis potentials are stable values on Pt at 0.250 A/cm2 cathode.[8] Lower right: A schematic representation of a separate (i) solar thermal and (ii) photovoltaic field to drive both water purification, hydrogen generation, and the endothermic electrolysis of the separated salts to useful products. Modified with permission from [8].
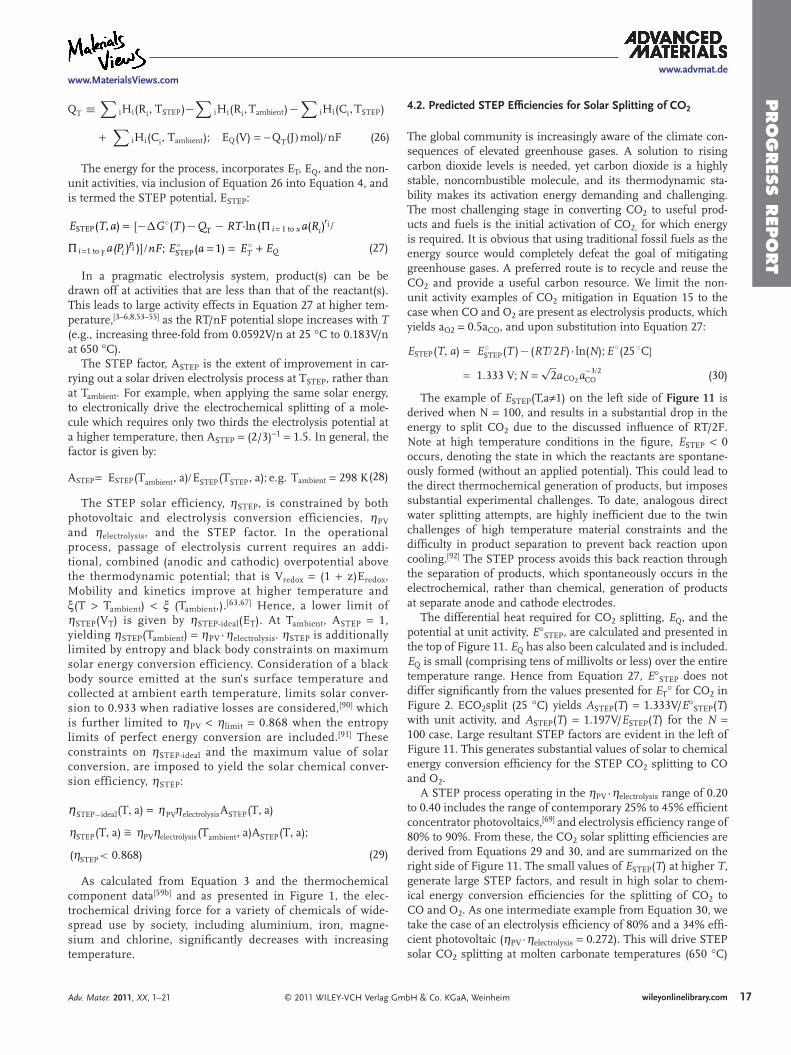
17
www.advmat.dewww.MaterialsViews.com
© 2011 WILEY-VCH Verlag GmbH & Co. KGaA, WeinheimAdv. Mater. 2011, XX, 1–21 wileyonlinelibrary.com
PRO
GRES
S R
EPO
RT
4.2. Predicted STEP Efficiencies for Solar Splitting of CO2
The global community is increasingly aware of the climate con-sequences of elevated greenhouse gases. A solution to rising carbon dioxide levels is needed, yet carbon dioxide is a highly stable, noncombustible molecule, and its thermodynamic sta-bility makes its activation energy demanding and challenging. The most challenging stage in converting CO2 to useful prod-ucts and fuels is the initial activation of CO2, for which energy is required. It is obvious that using traditional fossil fuels as the energy source would completely defeat the goal of mitigating greenhouse gases. A preferred route is to recycle and reuse the CO2 and provide a useful carbon resource. We limit the non-unit activity examples of CO2 mitigation in Equation 15 to the case when CO and O2 are present as electrolysis products, which yields aO2 0.5aCO, and upon substitution into Equation 27:
ESTEP(T a) ESTEP(T (RT 2F)·ln(N); E (25 C)
1 333 V; N 2aCO2 a 3 2CO
)
(30)
The example of ESTEP(T,a 1) on the left side of Figure 11 is derived when N 100, and results in a substantial drop in the energy to split CO2 due to the discussed influence of RT/2F. Note at high temperature conditions in the figure, ESTEP 0 occurs, denoting the state in which the reactants are spontane-ously formed (without an applied potential). This could lead to the direct thermochemical generation of products, but imposes substantial experimental challenges. To date, analogous direct water splitting attempts, are highly inefficient due to the twin challenges of high temperature material constraints and the difficulty in product separation to prevent back reaction upon cooling.[92] The STEP process avoids this back reaction through the separation of products, which spontaneously occurs in the electrochemical, rather than chemical, generation of products at separate anode and cathode electrodes.
The differential heat required for CO2 splitting, EQ, and the potential at unit activity, E STEP, are calculated and presented in the top of Figure 11. EQ has also been calculated and is included. EQ is small (comprising tens of millivolts or less) over the entire temperature range. Hence from Equation 27, E STEP does not differ significantly from the values presented for ET for CO2 in Figure 2. ECO2split (25 C) yields ASTEP(T) 1.333V/E STEP(T) with unit activity, and ASTEP(T) 1.197V/ESTEP(T) for the N 100 case. Large resultant STEP factors are evident in the left of Figure 11. This generates substantial values of solar to chemical energy conversion efficiency for the STEP CO2 splitting to CO and O2.
A STEP process operating in the PV· electrolysis range of 0.20 to 0.40 includes the range of contemporary 25% to 45% efficient concentrator photovoltaics,[69] and electrolysis efficiency range of 80% to 90%. From these, the CO2 solar splitting efficiencies are derived from Equations 29 and 30, and are summarized on the right side of Figure 11. The small values of ESTEP(T) at higher T, generate large STEP factors, and result in high solar to chem-ical energy conversion efficiencies for the splitting of CO2 to CO and O2. As one intermediate example from Equation 30, we take the case of an electrolysis efficiency of 80% and a 34% effi-cient photovoltaic ( PV· electrolysis 0.272). This will drive STEP solar CO2 splitting at molten carbonate temperatures (650 C)
QT iH
(26)
i(Ri TSTEP) iHi(Ri Tambient) iHi(Ci TSTEP)
iHi(Ci Tambient); EQ(V) QT(J mol) nF
The energy for the process, incorporates ET, EQ, and the non-unit activities, via inclusion of Equation 26 into Equation 4, and is termed the STEP potential, ESTEP:
ESTEP(T a) [ G (T QT RT·ln ( i 1 to x a(Ri) i
i 1 to y a(Pi ) )] nF; ESTEP(a 1) ET EQ
r
ip
)
(27)
In a pragmatic electrolysis system, product(s) can be be drawn off at activities that are less than that of the reactant(s). This leads to large activity effects in Equation 27 at higher tem-perature,[3–6,8,53–55] as the RT/nF potential slope increases with T (e.g., increasing three-fold from 0.0592V/n at 25 C to 0.183V/n at 650 C).
The STEP factor, ASTEP is the extent of improvement in car-rying out a solar driven electrolysis process at TSTEP, rather than at Tambient. For example, when applying the same solar energy, to electronically drive the electrochemical splitting of a mole-cule which requires only two thirds the electrolysis potential at a higher temperature, then ASTEP (2/3) 1 1.5. In general, the factor is given by:
ASTEP ESTEP(Tambient a) ESTEP(TSTEP a); e g Tambient 298 K (28)
The STEP solar efficiency, STEP, is constrained by both photovoltaic and electrolysis conversion efficiencies, PV and electrolysis, and the STEP factor. In the operational process, passage of electrolysis current requires an addi-tional, combined (anodic and cathodic) overpotential above the thermodynamic potential; that is Vredox (1 z)Eredox, Mobility and kinetics improve at higher temperature and
(T Tambient) (Tambient,).[63,67] Hence, a lower limit of STEP(VT) is given by STEP-ideal(ET). At Tambient, ASTEP 1,
yielding STEP(Tambient) PV· electrolysis. STEP is additionally limited by entropy and black body constraints on maximum solar energy conversion efficiency. Consideration of a black body source emitted at the sun’s surface temperature and collected at ambient earth temperature, limits solar conver-sion to 0.933 when radiative losses are considered,[90] which is further limited to PV limit 0.868 when the entropy limits of perfect energy conversion are included.[91] These constraints on STEP-ideal and the maximum value of solar conversion, are imposed to yield the solar chemical conver-sion efficiency, STEP:
STEP ideal(T a) PV electrolysisASTEP(T a)
STEP(T a) PV electrolysis(Tambient a)ASTEP(T a);
( STEP 0 868) (29)
As calculated from Equation 3 and the thermochemical component data[59b] and as presented in Figure 1, the elec-trochemical driving force for a variety of chemicals of wide-spread use by society, including aluminium, iron, magne-sium and chlorine, significantly decreases with increasing temperature.
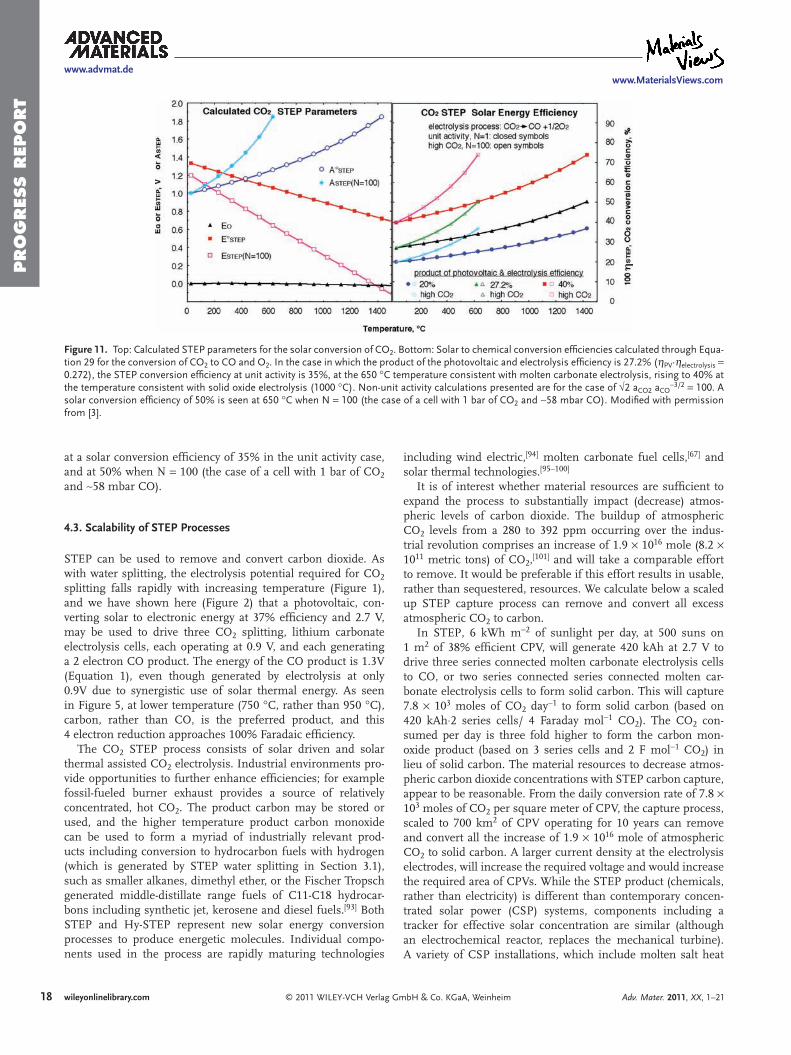
18
www.advmat.dewww.MaterialsViews.com
© 2011 WILEY-VCH Verlag GmbH & Co. KGaA, Weinheim Adv. Mater. 2011, XX, 1–21wileyonlinelibrary.com
PRO
GRES
S R
EPO
RT
including wind electric,[94] molten carbonate fuel cells,[67] and solar thermal technologies.[95–100]
It is of interest whether material resources are sufficient to expand the process to substantially impact (decrease) atmos-pheric levels of carbon dioxide. The buildup of atmospheric CO2 levels from a 280 to 392 ppm occurring over the indus-trial revolution comprises an increase of 1.9 1016 mole (8.2 1011 metric tons) of CO2,[101] and will take a comparable effort to remove. It would be preferable if this effort results in usable, rather than sequestered, resources. We calculate below a scaled up STEP capture process can remove and convert all excess atmospheric CO2 to carbon.
In STEP, 6 kWh m 2 of sunlight per day, at 500 suns on 1 m2 of 38% efficient CPV, will generate 420 kAh at 2.7 V to drive three series connected molten carbonate electrolysis cells to CO, or two series connected series connected molten car-bonate electrolysis cells to form solid carbon. This will capture 7.8 103 moles of CO2 day 1 to form solid carbon (based on 420 kAh 2 series cells/ 4 Faraday mol 1 CO2). The CO2 con-sumed per day is three fold higher to form the carbon mon-oxide product (based on 3 series cells and 2 F mol 1 CO2) in lieu of solid carbon. The material resources to decrease atmos-pheric carbon dioxide concentrations with STEP carbon capture, appear to be reasonable. From the daily conversion rate of 7.8 103 moles of CO2 per square meter of CPV, the capture process, scaled to 700 km2 of CPV operating for 10 years can remove and convert all the increase of 1.9 1016 mole of atmospheric CO2 to solid carbon. A larger current density at the electrolysis electrodes, will increase the required voltage and would increase the required area of CPVs. While the STEP product (chemicals, rather than electricity) is different than contemporary concen-trated solar power (CSP) systems, components including a tracker for effective solar concentration are similar (although an electrochemical reactor, replaces the mechanical turbine). A variety of CSP installations, which include molten salt heat
at a solar conversion efficiency of 35% in the unit activity case, and at 50% when N 100 (the case of a cell with 1 bar of CO2 and 58 mbar CO).
4.3. Scalability of STEP Processes
STEP can be used to remove and convert carbon dioxide. As with water splitting, the electrolysis potential required for CO2 splitting falls rapidly with increasing temperature (Figure 1), and we have shown here (Figure 2) that a photovoltaic, con-verting solar to electronic energy at 37% efficiency and 2.7 V, may be used to drive three CO2 splitting, lithium carbonate electrolysis cells, each operating at 0.9 V, and each generating a 2 electron CO product. The energy of the CO product is 1.3V (Equation 1), even though generated by electrolysis at only 0.9V due to synergistic use of solar thermal energy. As seen in Figure 5, at lower temperature (750 C, rather than 950 C), carbon, rather than CO, is the preferred product, and this 4 electron reduction approaches 100% Faradaic efficiency.
The CO2 STEP process consists of solar driven and solar thermal assisted CO2 electrolysis. Industrial environments pro-vide opportunities to further enhance efficiencies; for example fossil-fueled burner exhaust provides a source of relatively concentrated, hot CO2. The product carbon may be stored or used, and the higher temperature product carbon monoxide can be used to form a myriad of industrially relevant prod-ucts including conversion to hydrocarbon fuels with hydrogen (which is generated by STEP water splitting in Section 3.1), such as smaller alkanes, dimethyl ether, or the Fischer Tropsch generated middle-distillate range fuels of C11-C18 hydrocar-bons including synthetic jet, kerosene and diesel fuels.[93] Both STEP and Hy-STEP represent new solar energy conversion processes to produce energetic molecules. Individual compo-nents used in the process are rapidly maturing technologies
Figure 11. Top: Calculated STEP parameters for the solar conversion of CO2. Bottom: Solar to chemical conversion efficiencies calculated through Equa-tion 29 for the conversion of CO2 to CO and O2. In the case in which the product of the photovoltaic and electrolysis efficiency is 27.2% ( PV· electrolysis 0.272), the STEP conversion efficiency at unit activity is 35%, at the 650 C temperature consistent with molten carbonate electrolysis, rising to 40% at the temperature consistent with solid oxide electrolysis (1000 C). Non-unit activity calculations presented are for the case of 2 aCO2 aCO
3/2 100. A solar conversion efficiency of 50% is seen at 650 C when N 100 (the case of a cell with 1 bar of CO2 and 58 mbar CO). Modified with permission from [3].
19
www.advmat.dewww.MaterialsViews.com
© 2011 WILEY-VCH Verlag GmbH & Co. KGaA, WeinheimAdv. Mater. 2011, XX, 1–21 wileyonlinelibrary.com
PRO
GRES
S R
EPO
RT
In addition to the removal of CO2, the STEP process is shown to be consistent with efficient solar generation from a variety of metals, as well as chlorine via endothermic electrolyses. Com-modity production and fuel consumption processes are respon-sible for the majority of industry based CO2 release, and their replacement by STEP processes provides a path to end the root cause of anthropogenic global warming, as a transition beyond the fossil fuel, electrical, or hydrogen economy, to a renewable chemical economy based on the direct formulation of the mate-rials needed by society. An expanded understanding of electro-catalysis and materials will advance the efficient electrolysis of STEP’s growing portfolio of energetic products.
AcknowledgementsThe author is grateful to Baouhui Wang and Hongun Wu for excellent experimental contributions to references 4 and 5.
Received: August 18, 2011 Revised: September 13, 2011
Published online:
storage, are being commercialized, and costs are decreasing. STEP provides higher solar energy conversion efficiencies than CSP, and secondary losses can be lower (for example, there are no grid-related transmission losses). Contemporary concentra-tors, such as based on plastic Fresnel or flat mirror technolo-gies, are relatively inexpensive, but may become a growing frac-tion of cost as concentration increases.[100] A greater degree of solar concentration, for example 2000 suns, rather than 500 suns, will proportionally decrease the quantity of required CPV to 175 km2, while the concentrator area will remain the same at 350 000 km2, equivalent to 4% of the area of the Sahara desert (which averages 6 kWh m 2 of sunlight per day), to remove anthropogenic carbon dioxide in ten years.
A related resource question is whether there is sufficient lithium carbonate, as an electrolyte of choice for the STEP carbon capture process, to decrease atmospheric levels of carbon dioxide. 700 km2 of CPV plant will generate 5 1013 A of electrolysis current, and require 2 million metric tonnes of lithium carbonate, as calculated from a 2 kg/l density of lithium carbonate, and assuming that improved, rather than flat, mor-phology electrodes will operate at 5 A/cm2 (1000 km2) in a cell of 1 mm thick. Thicker, or lower current density, cells will require proportionally more lithium carbonate. Fifty, rather than ten, years to return the atmosphere to pre-industrial carbon dioxide levels will require proportionally less lithium carbonate. These values are viable within the current production of lithium car-bonate. Lithium carbonate availability as a global resource has been under recent scrutiny to meet the growing lithium battery market. It has been estimated that the current global annual production of 0.13 million tonnes of LCE (lithium carbonate equivalents) will increase to 0.24 million tonnes by 2015.[102] Potassium carbonate is substantially more available, but as noted in the main portion of the paper can require higher carbon capture electrolysis potentials than lithium carbonate.
5. ConclusionsTo mitigate the consequences of rising atmospheric carbon dioxide levels and its effect on global climate change, there is a drive to replace conventional fossil fuel driven electrical production by renewable energy driven electrical production. In addition to the replacement of the fossil fuel economy by a renewable electrical economy, we suggest that a renewable chemical economy is also warranted. Solar energy can effi-ciently ube sed, as demonstrated with the STEP process, to form the chemicals needed by society without carbon dioxide emission directly and efficiently. Iron, a basic commodity, cur-rently accounts for the release of one quarter of worldwide CO2 emissions by industry, which may be eliminated by replace-ment with the STEP iron process. The unexpected solubility of iron oxides in lithium carbonate electrolytes, coupled with facile charge transfer and a sharp decrease in iron electrolysis potentials with increasing temperature, provides a new route for iron production. Iron is formed without an extensive release of CO2 in a process compatible with the predominant naturally occurring iron oxide ores, hematite, Fe2O3, and magnetite, Fe3O4. STEP can also be used in direct carbon capture, and the efficient solar generation of hydrogen and other fuels.
[1] On Solar Hydrogen & Nanotechnology, (Ed: L. Vayssieres), John Wiley and Sons, Weinheim, Germany 2009.
[2] The Solar Generation of Hydrogen: Towards a Renewable Energy Future (Eds: K. Rajeshwar, S. Licht, R. McConnell), Springer, New York, USA 2008.
[3] S. Licht, J. Phys. Chem. C 2009, 113, 16283. [4] S. Licht, B. Wang, S. Ghosh, H. Ayub, D. Jiang, J. Ganely, J. Phys.
Chem. Lett. 2010, 1, 2363. [5] S. Licht, B. Wang, Chem. Commun. 2010, 46, 7004. [6] S. Licht, H. Wu, Z. Zhang, H. Ayub, Chem. Commun. 2011, 47, 3081. [7] S. Licht, O. Chityat, H Bergmann, A. Dick, S. Ghosh, H. Ayub, Int.
J. Hyd. Energy 2010, 35, 10867. [8] S. Licht, B. Wang, H. Wu, J. Phys. Chem. C 2011, 115, 11803. [9] G. Ohla, P. Surya, S. Licht, N. Jackson, Reversing Global Warming:
Chemical Recycling and Utilization of CO2. Report of the National Science Foundation sponsored 7-2008 Workshop, 17 pages 2009; full report available at: http://www.usc.edu/dept/chemistry/loker/ReversingGlobalWarming.pdf
[10] C. Graves, S. Ebbsen, M. Mogensen, K. Lackner, Renewable Sus-tainble Energy Rev. 2011, 15, 1.
[11] J. Barber, Chem. Soc. Rev. 2009, 38, 185. [12] A. Stamatiou, P. G. Loutzenhiser, A. Steinfeld, Energy Fuels 2010,
24, 2716. [13] S. Abanades, M. Chambon, Energy Fuels 2010, 24, 6677. [14] L. J. Venstrom, J. H. Davidson, J. Solar Energy Eng. Chem. 2010,
133, 011017–011021. [15] W. Chueh, S. Haile, Phil. Trans. Roy. Soc. A 2010, 368, 3269. [16] J. Miller, M. Allendorf, R. Diver, L. Evans, N. Siegel, J. Stueker, J.
Mater. Sci. 2008, 43, 4714. [17] S. Licht, Nature 1987, 330, 148. [18] S. Licht, D. Peramunage, Nature 1990, 345, 330. [19] B. Oregan, M. Gratzel, Nature 1991, 353, 737. [20] S. Licht, J. Phys. Chem. 1998, 90, 1096. [21] Semiconductor Electrodes and Photoelectrochemistry, (Ed: S. Licht),
Wiley-VCH, Weinheim, Germany 2002. [22] S. Licht, G. Hodes, R. Tenne, J. Manassen, Nature 1987, 326, 863. [23] S. Licht, B. Wang, T. Soga, M. Umeno, Appl. Phys. Lett. 1999, 74,
4055. [24] S. Yan, L. Wan, Z. Li, Z. Zou, Chem. Commun. 2011, 47, 5632.
20
www.advmat.dewww.MaterialsViews.com
© 2011 WILEY-VCH Verlag GmbH & Co. KGaA, Weinheim Adv. Mater. 2011, XX, 1–21wileyonlinelibrary.com
PRO
GRES
S R
EPO
RT [59] a) A. J. deBethune, T. S. Licht, J. Electrochem. Soc. 1959, 106, 616;
b) M. W. Chase, J. Phys. Chem. Ref. Data 1998, 9, 1; data available at: http://webbook.nist.gov/chemistry/form-ser.html
[60] W. E. Wentworth, E. Chen, Solar Energy 1976, 18, 205. [61] J. O’M. Bockris, Energy Options, Halsted Press, NY 1980. [62] T. S. Light, S. Licht, A. C. Bevilacqua, Electrochem. Solid State Lett.
2005, 8, E16. [63] T. S. Light, S. Licht, Anal. Chem. 1987, 59, 2327. [64] S. Licht, Anal. Chem. 1985, 57, 514. [65] S. Licht, K. Longo, D. Peramunage, F. Forouzan, J. Electroanal.
Chem. 1991, 318, 119. [66] C. Elschenbroich, A. SalzerOrganometallics. 2nd Ed., Wiley-VCH,
Weinheim,) Germany 1992. [67] K. Sunmacher, Molten Carbonate Fuel Cells, Wiley-VCH, Weinheim,
Germany 2007. [68] J. L. Pellegrino, Energy & Environmental Profile of the U.S. Chemical
Industry 2000, available online at: http://www1.eere.energy.gov/industry/chemicals/tools_profile.html
[69] a) R. R. King, D. C. Law, K. M. Edmonson, C. M. Fetzer, G. S. Kinsey, H. Yoon, R. A. Sherif, N. H. Karam, Appl. Phys. Lett. 2007, 90, 183516; b) M. Green, K. Emery, Y. Hishikawa, W. Warata, Prog. Photo voltaics 2011, 19, 84.
[70] J. E. Miller, M. D. Allendorf, R. B. Diver, L. R. Evans, N. P. Siegel, J. N. Stuecker, J. Mater. Sci. 2008, 43, 4714.
[71] Y. Woolerton, Y. W. Sheard, S. Reisner, E. Pierce, S. W. Ragsdale, F. A. Armstrong, J. Am. Chem. Soc. 2010, 132, 2132.
[72] E. Benson, C. P. Kubiak, A. J Sathrum, J. M. N. Smieja, Chem. Soc. Rev. 2009, 38, 89.
[73] Principles and Applications of Molten Salt Electrochemistry, (Eds: Z. Zhang, Z. Wang) Chemical Industry Press, Beijing 2006, p. 191.
[74] T. Kojima, Y. Miyazaki, K. Nomura, K. Tanimoto, K. Density, J. Elec-trochem. Soc. 2008, 155, F150.
[75] V. Kaplan, E. Wachtel, K. Gartsman, Y. Feldman, I. Lubormirsky, J. Electrochem. Soc. 2010, 157, B552.
[76] L. Andrieux, G. Weiss, Comptes Rendu 1944, 217, 615. [77] G. M. Haarberg, E. Kvalheim, S. Rolseth, T. Murakami, S. Pietrzyk,
S. Wang, ECS Transactions 2007, 3, 341. [78] S. Wang, G. M. Haarberg, E. Kvalheim, J. Iron Res. Int. 2008, 15,
48. [79] G. M. Li, D. H. Wang, Z. Chen, J. Mater. Sci. Tech. 2009, 25, 767. [80] B. Y. Yuan, O. E. Kongstein, G. M. Haarberg, J. Electrochem. Soc.
2009, 156, D64. [81] W. Palmaer, J. A. Brinell, Chem. Metall. Eng. 1913, 11, 197. [82] F. A. Eustis, Chem. Metall. Eng. 1922, 27, 684. [83] E. Mostad, S. Rolseth, S. Thonstad, J. Hydrometallurgy 2008, 90, 213. [84] L. Qingeng, F. Borum, I. Petrushina, N. J. Bjerrum, J. Electrochem,
Soc. 1999, 146, 2449. [85] R. Collongues, G. Chaudron, Compt. Rend. 1950, 124, 143. [86] A. Wijayasinghe, B. Bergman, C. Lagergren, J. Electrochem. Soc.
2003, 150, A558. [87] A. Lykasov, M. Pavlovskaya, Inorg. Mater. 2003, 39, 1088. [88] H. Q. Li, S. S. Xie, J. Rare Earths 2005, 23, 606. [89] G. Demirci, I. Karakaya, J. Alloys Compd. 2008, 465, 255. [90] C. S. Solanki, G. Beaucarne, Advanced Solar Cell Concepts, AER
India-2006, 2006, 256. [91] A. Luque, A. Marti, Handbook of Photovoltaic Sci. & Eng., (Eds.
A. Luque, S. Haegedus), Wiley-VCH, Weinheim, Germany 2003, 113. [92] A. Kogan, Int. J. Hydrogen Energy 1998, 23, 89. [93] A. Andrews, J. Logan, Fischer-Tropsch Fuels from Coal, Natural
Gas, and Biomass: Background and Policy. Congressional Research Service Report for Congress 2008, RL34133, (March 27, 2008); avail-able at: http://assets.opencrs.com/rpts/RL34133_20080327.pdf.
[94] E. Barbier, Nature 2010, 464, 832.
[25] H. Zhou, T. Fan, D. Zhang, ChemCatChem 2011, 3, 513. [26] R. Huchinson, E. Holland, B. Carpenter, Nat. Chem. 2011, 3, 301. [27] E. E. Barton, D. M. Rampulla, A. B. Bocarsly, J. Am. Chem. Soc.
2008, 130, 6342. [28] S. Kaneco, H. Katsumata, T. Suzuki, K. Ohta, Chem Eng. J. 2006,
92, 363. [29] P. Pan, Y. Chen, Catal. Commun. 2007, 8, 1546. [30] A. B. Murphy, Solar Energy Mater. 2008, 116, 227. [31] A. Currao, Chimia 2007, 61, 815. [32] a) S. R. Narayanan, B. Haines, J. Soler, T. I. Valdez, J. Electrochem.
Soc. 2011, 158, A167; b) C. Delacourt, J. Newman, J. Electrochem. Soc. 2010, 157, B1911.
[33] E. Dufek, T. Lister, M. McIlwain, J. Appl. Electrochem. 2011, 41, 623. [34] M. Gangeri, S. Perathoner, S. Caudo, G. Centi, J. Amadou, D. Begin,
C. Pham-Huu, M. Ledoux, J. Tessonnier, D. Su, R. Schlogl, Catalysis Today 2009, 143, 4714.
[35] B. Innocent, D. Liaigre, D. Pasquier, F. Ropital, J. Leger, K. Kokoh, J. Appl. Electrochem. 2009, 39, 227.
[36] A. Wang, W. Liu, S. Cheng, D. Xing, J. Zhou, B. Logan, Int. J. Hydrogen Energy 2009, 39, 3653.
[37] N. Dong-fang, X. Cheng-tian, L. Yi-wen, Z. Li, L. Jiz-xing, Chem. Res. Chinese U. 2009, 34, 708.
[38] D. Chu, G. Qin, X. Yuan, M. Xu, P. Zheng, J. Lu, ChemSusChem 2008, 1, 205.
[39] J. Yano, T. Morita, K. Shimano, Y. Nanmi, S. Yamsaki, J. Sol. State Electrochem. 2007, 11, 554.
[40] Y. Hori, H. Konishi, T. Futamura, A. Murata, O. Koga, H. Sakuri, K. Oguma, Electrochim. Acta 2005, 50, 5354.
[41] K. Ogura, H. Yano, T. Tanaka, Catalysis Today 2004, 98, 414. [42] a) H. Chandler, F. Pollara, AICHE Chem. Eng. Prog. Ser.: Aerospace
Life Support 1966, 62, 38; b) L. Elikan, D. Archer, R. Zahradnik, ibid 28. [43] a) M. Stancati, J. Niehoff, W. Wells, R. Ash, AIAA 1979, 79-0906,
262; b) R. Richter, ibid 1981, 82-2275, 1. [44] a) J. Mizusaki, H. Tagawa, Y. Miyaki, S. Yamauchi, K. Fueki,
I. Koshiro, Solid State Ionics 1992, 126, 53; b) G. Tao, K. Sridhar, C. Chan, ibid 2004, 175, 615; c) R. Green, C. Liu, S. Adler, ibid 621; d) ibid 2008, 179, 647.
[45] C. Meyers, N. Sullivan, H. Zhu, R. Kee, J. Electrochem. Soc. 2011, 158, B117.
[46] P. Kim-Lohsoontorn, N. Laosiripojana, J. Bae, Current Appl. Phys. 2011, 11, 5223.
[47] S. Ebbesen, C. Graves, A. Hausch, S. Jensen, M. Mogensen, J. Elec-trochem. Soc. 2010, 157, B1419.
[48] S. Jensen, X. Sun, S. Ebbesen, R. Knibbe, M. Mogensen, Int. J. Hydrogen Energy 2010, 35, 9544.
[49] Q. Fu, C. Mabilat, M. Zahid, A. Brisse, L. Gautier, Energy Environ. Sci. 2010, 3, 1382.
[50] C. M. Stoots, J. E. O’Brien, K. G. Condie, J. Hartvigsen, Int. J. Hydrogen Energy 2010, 35, 4861.
[51] Q. Fu, C. Mabilat, M. Zahid, A. Brisse, L. Gautier, Energy Environ. Sci. 2010, 3, 1382.
[52] D. Lueck, W. Buttner, J. Surma, Fluid System Technologies 2002, at:http://rtreport.ksc.nasa.gov/techreports/2002report/600% 20Fluid%20Systems/609.html.
[53] S. Licht, Electrochem. Commun. 2002, 4, 789. [54] S. Licht, J. Phys. Chem. B 2003, 107, 4253. [55] S. Licht, L. Halperin, M. Kalina, M. Zidman, N. Halperin, Chem.
Commun. 2003, 2003, 3006; S. Licht, Chem. Commun. 2005, 2005, 4623.
[56] A. Fujishima, K. Honda, Nature 1972, 238, 37. [57] Z. Zou, Y. Ye, K. Sayama, H. Arakawa, Nature 2001, 414, 625. [58] a) S. Licht, B. Wang, S. Mukerji, T. Soga, M. Umento, H. Tributsh,
J. Phys. Chem. B 2000, 104, 8920; b) S. Licht, J. Phys. Chem. B 2001, 105, 6281.

21
www.advmat.dewww.MaterialsViews.com
© 2011 WILEY-VCH Verlag GmbH & Co. KGaA, WeinheimAdv. Mater. 2011, XX, 1–21 wileyonlinelibrary.com
PRO
GRES
S R
EPO
RT
[99] Fresnel solar concentrator technologies are described at: amonix.com, energy innovations.com/sunflower.
[100] R. Pitz-Paal, in Solar Energy Conversion and Photoenergy Systems, (Eds. J. B. Galvez, S. M. Rodriguez) EOLSS Publishers, Oxford, UK 2007.
[101] P. Tans, An accounting of the observed increase in oceanic and atmospheric CO2 and an outlook for the future. Oceanography 2009, 22, 26.
[102] W. Tahil, “The Trouble with Lithium 2; Under the Micro-scope”, Meridan International Research, Martainsville, France, 2008, 54.
[95] Power tower solar technologies are described at: brightsourceen-ergy.com; ausra.com, esolar.com; bengoasolar.com/corp/web/en/our_projects/solana/.
[96] Siemens to build molten salt solar thermal test facility in Por-tugal, siemens.com, 2011, at: http://www.siemens.com/press/pool/de/pressemitteilungen/2011/renewable_energy/ERE201102037e.pdf.
[97] See: solarreserve.com, 2011, at: http://www.solarreserve.com/projects.html.
[98] Parabolic solar concentrator technologies are described at: stirlin-genergy.com.