on and off pathway contributions to apparent motion perception
TRANSCRIPT

ON AND OFF PATHWAY COKTRIBUTIONE 7-G
APPARENT MOTION PERCEPTION
SIMA SHECHTER and SHAUL HOCHSTEI?\’
Department of Neurobiology. Institute of Life Sciences. Hebrew University. .lerusalem. Israel
Abstract-We studied the separability and/or interaction of the On and Off pathwzays in their role as inputs
to visual motion perception. Using the long-range motion perception system, we asked if the motion
system can use brightness polarity information. by testing whether correspondence is preferred between
elements for which brightness polarity is preserved. We found such a preference, suggesting that brightness
polarity information is indeed available to the motion system. However. under certain conditions motion
is perceived even though the brightness polarity of apparent motion stimulus elements is reversed,
indicating that the apparent motion system does integrate information from these two pathways. The
source of the preference for maintaining polarity seems not to be the different brightnesses of the dark
and bright stimulus elements. but the very fact that information must be integrated from different
pathways. We relate the characteristics of the dependence of the motion perception on element contrast
and contrast sign to those of previously reported visual evoked potential responses to brightness
increments and decrements.
Apparent motion Correspondence process
Off Visual psychophysics
Motionperception Brightness Contrast On
INTRODUCTION
Parallel processing is recognized today as a fundamental paradigm employed by biological visual systems. The division of the brain into separate processing modules, often related to different anatomical cortical areas, has been elegantly demonstrated by both psychophysical and physiological techniques (Treisman & Gelade, 1980; Bergen & Julesz, 1983; Zeki, 1983; Mishkin, Ungerleider & Macko, 1983; Van Essen & Maunsell, 1983; Livingstone & Hubel, 1987; De Yoe & Van Essen, 1988). One process which is a primary candidate for separability is visual motion perception (Nakayama, 1985; Nakayama & Silverman, 1986; Newsome, Mikami & Wurtz. 1986). It has been reported that motion detection is color blind (Ramachan- dran & Gregory, 1978) and disregards form or high spatial frequency content (Kolers, 1972; Navon, 1976; Burt & Sperling, 1981; Ra- machandran, Ginsburg & Anstis, 1983). How- ever, we have recently shown that the long range apparent motion correspondence process may indeed utilize information from the dimensions of shape (Shechter, Hochstein & Hillman, 1988) as well as size and luminous flux (Shechter & Hochstein, 1989).
Recording from retinal ganglion cells or their fibers which carry visual information from the eye to the brain, one finds receptive fields with circular symmetry and center-surround antago- nism. These fields were classified by Kuffler (1953) as On-center or Off-center on the basis of whether they respond with an increase in firing rate to introduction of a bright stimulus on a dark surround or to a dark stimulus on a bright surround, respectively. This division is main- tained at the thalamic level (Hubel & Wiesel, 1961) and perhaps at the striate cortex, as well (Schiller, 1982). Psychophysical studies (Shapley, 1986) have shown that the bright and dark pathways are separable in their responding to adaptation (De Valois, 1977) and to particu- lar brain deficits (Uhlin & Dickson, 1970; May, 1978; Marozas & May, 1985). Furthermore, recent evoked potential studies have shown a differential response to light increments and decrements (Zemon, Gordon & Welch, 1988).
The purpose of the present research was to study the separability and/or interaction of the On and Off pathways in their role as inputs to visual motion perception. We studied the long- range apparent motion system (Wertheimer, 1912; Ullman, 1979; Braddick, 1974, 1980) and
1189

first asked if brightness polarity information is available to the motion system fExperiment I). There are three possibilities: (!I brightness polarity information is not available to the motion system, and we will expect motion to be reported equally for correspondence between elements with the same polarity or with opposite polarities. (2) Information from the two polarity pathways is totally segregated in the motion system, so that apparent motion can only be perceived when the brightness polarity of the elements is maintained. (3) Information from the two pathways is integrated in the motion system but the brightness polarity information is not lost. Thus, the motion system can perceive motion despite a reversal of the polarity of the elements between the two stimulus frames. but will preferentially perceive motion for which correspondence is between elements with the same polarity.
For the case that a preference is shown for perceiving motion between elements with the same polarity, an additional question is raised: what is the source of this preference? The pref- erence may be for motion which depends on elements seen by a single pathway (either the On or the Off pathway). Alternatively, the prefer- ence may derive simply from the similar bright- nesses of the elements and not be related to their pathway origins at all. We deal with this ques- tion in Experiment II. In Experiment III we add flux and size cues to the polarity cue stimulus and study the integration of these different correspondence cues by the motion system.
EXPERIMENT I
Subjects
Six subjects were tested in this and the follow- ing experiment. These included paid undergrad- uate students and one of the authors (S.S.). They had normal vision with corrective lenses, as needed. Subjects were naive to the purpose of the experiments except for the author, whose results were similar to those of the other subjects.
Apparatus
Subjects sat in a darkened room 1.2 m from a CRT (Tektronix 606A monitor) which had a P31 phosphor screen. and was masked to a circle of 6.5 cm diameter. Background illumina- tion was 24cdim’ in this and in the following
experiments. ,L. specia;i& eiectronic c:rcui;
(Shapiey Bi Rossetrc. !976: Miikmzr:. Schick. Rossetto. RatliE’. Shapley &L Victor. i%O) pro-
duced an electronicaltl rotatable T.‘v’.-type raster with a frame rate of270 Hz. .A. PDP-1 i ;7j computer controlled the monitor electronics by DMA transfer. allowing arbitrariiy defined
regions on the 256 x 256 pixel raster io be assigned any one of four spatio-temporal func- tions, In this way a computer program con- trolled the display of different visual stimulus elements with various intensities and sizes. in various locations on the screen, and for very brief and precisely controlled durations.
Stimfli
Each motion stimulus consisted of two frames presented in succession. Each frame consisted of 4 filled disk elements as seen in Fig. I. The elements were placed 90’- apart on an imaginary circular ring with a diameter of 1.75” of visual angle. The absolute location of the elements in the first frame was randomized for each trial
frame 1 frame 2
Fig. 1. The visual stimuli. Each row displays the two frames
of a motion stimulus (the left diagram shows the first frame
and the adjacent diagram the second frame). Frame dura- tion was 1OOmsec and the inter-stimulus interval (ISI) was
4 I msec. The top row demonstrates the polarity cue stimulus
and the second and third rows demonstrate the distance cue
stimuli in which all the elements are brighter or darker than the background. respectively. The schematic representation
of the luminances or contrasts of two neighboring elements appears at the right of each row

On and Off pathways to apparent motion 1191
over six possible locations (15’ apart) so that the subject had to judge apparent motion rather than the absolute position of a particular ele- ment in the second frame. The relative positions of the elements in each frame were constant and the second frame was rotated with respect to the first one. Thus, the coherent apparent motion perceived from presentation of the two succes- sive frames was a clockwise or a counter- clockwise rotation. We used 11 rotations between 35 and 55” (in steps of 2”). A rotation of 45” was equivalent to a motion through 40’ of visual angle. The range of motion distances for these experiments (30’ to 50’ for disk of 9’ radius) clearly matches that of the long range motion system (Braddick, 1974; Chang & Julesz, 1983). Frame duration was 100 msec and the inter-stimulus-frame-interval (ISI) was 41 msec. During the IS1 the screen was uniform in luminance (24cd/m2) with the exception of a central spot (3’ in diameter) provided for fixation.
Each row of Fig. 1 displays the two frames of a motion stimulus. All the elements are equal in shape (circular disks) and in size (255 square minutes of arc). In each frame of the polarity cue stimulus (shown in the top row) any two elements facing each other have the same bright- ness polarity and any two neighboring elements have different polarities. The luminance of the bright elements is 30 cd/m2 and the luminance of the dark elements is 18 cd/m2. Since the back- ground luminance is 24cd/m2, the elements’ contrasts are +25% and -25%, respectively. The right diagram in each row of Fig. 1 displays a schematic representation of the luminance profile of two neighboring elements. The stimu- lus contrast will be defined as
c, = L m=: - Lmin
(1)
Lback
where L,,, and L,, are the luminances of the brightest and the dimmest elements and Lb& is the luminance of the background.*
The middle and bottom rows of Fig. 1 repre- sent motion stimuli where all the elements are
*By studying the effect of varying element size we showed
that the relevant parameter for apparent motion corre-
spondence is element flux rather than its luminance
(Shechter & Hochstein. 1989). When the background is
nonzero, it is the relative flux that is important (Shechter
& Hochstein. in preparation). Since here the size was
kept fixed, we may equally refer to luminance or flux in
equation (1) without affecting the magnitude of C, which is dimensionless.
identical and the only cue for correspondence is the spatial separation between the two frames (i.e. the distance cue). In the stimulus shown in the second row all the elements are brighter than the background (30 cd/m2) and in the stimulus shown in the third row all the elements are darker than the background (18 cd/m’).
Experimental procedure
An experimental session for each subject lasted up to an hour and contained 726 data trials (11 rotations by 22 repetitions for each of the 3 stimulus types depicted in Fig. 1). The trials were pseudo-randomly presented with re- spect to clockwise or counter-clockwise distance disparity bias, with respect to the different rota- tion amplitudes, and with respect to the 3 stimulus types (Fig. 1). After viewing each trial, the subject made a two-alternative-forced- choice (ZAFC) response by typing “1” or “2” to identify perceived motion-direction as coun- ter-clockwise or clockwise, respectively. The subject then had to press the “enter” key to allow the next trial to be initiated (following a 300 msec delay).
Preliminary tests showed that subjects some- times locked into perceiving motions in one direction when the distance disparities were small. Therefore, whenever the subject re- sponded with the same response on 4 consecu- tive trials, regardless of the stimulus conditions, a correction trial was introduced. In this trial the distance disparity was 1.5 times the maximal distance disparity used in the data trials, and the shorter distance was in the direction opposite to that of the previously reported motions. This successfully prevented the subjects from locking into perceiving motion in a single direction.
Results
Brightness polarity as the only cue for correspon - dence
The only information regarding the direction of motion present in the stimulus shown in the top row of Fig. 1 is the similarity of the ele- ments’ contrast sign. All the other attributes of the elements are fixed. The elements in the stimulus are equal in shape, size and contrast magnitude, and when the rotation angle is 45” there is no information from the distance cue either.
If there were no effect of brightness polarity similarity, one would expect that the responses would be random. However, we found that for
6 subjects (44 repetitions per subject: 86 2 5$( of the responses were in accordance with brigh?- ness polarity similarit:,. Tha; is. in 86% of the trials the motion reported was in that direction for which the bright elements in the first frame were perceived to move to the location of the bright elements in the second frame. and the dark elements were seen to move to the location of the dark elements. In the example shown in the top row of Fig. 1. 86% of the responses were clockwise rotations. This result suggests that brightness polarity similarity may be used by the apparent motion correspondence process,
The fact that 14% of the responses neverthe- less were in the direction for which the elements changed their contrast sign (i.e. a dark element was perceived to move to the location of a bright element and vice versa) indicates that although brightness polarity seems to be a strong cue for correspondence, the visual system is able to overcome this cue and perceive motion between elements with different brightness polarities.
A number of studies have shown that the spatial proximity between the elements in the two frames of an apparent motion stimulus affects the correspondence process (Kolers, 1972: Ullman, 1979; Shechter et al., 1988; Shechter & Hochstein, 1989). We have re- examined this phenomenon with two purposes in mind: we wished to measure the effect of polarity similarity in the presence of a distance cue in order to study interactions between these correspondence cues, and to find their relative equivalence scale. Thus, we needed to measure the effect of the distance cue alone as a base-line for the two-cue measurements. using the same subjects and experimental conditions. In addi- tion. since the polarity stimulus has both bright and dark elements, we wished to perform the distance cue measurements using either bright or dark elements to determine whether the sign of the contrast is important.
We used 11 spatial displacements ranging from 35 to 55’ rotations. The results are dis- played in Fig. 2. The abscissa is the angle of the rotation reported by the subject and the ordi- nate is the frequency of reporting this rotation. The open circles represent data of trials where all the elements were brighter than the back- ground and the solid circles represent data of trials where all the elements were darker than
0.1 i 0.0 _I
I t I, I I / / , , ,
35 37 39 47 43 45 47 49 57 53 55
distance (degrees)
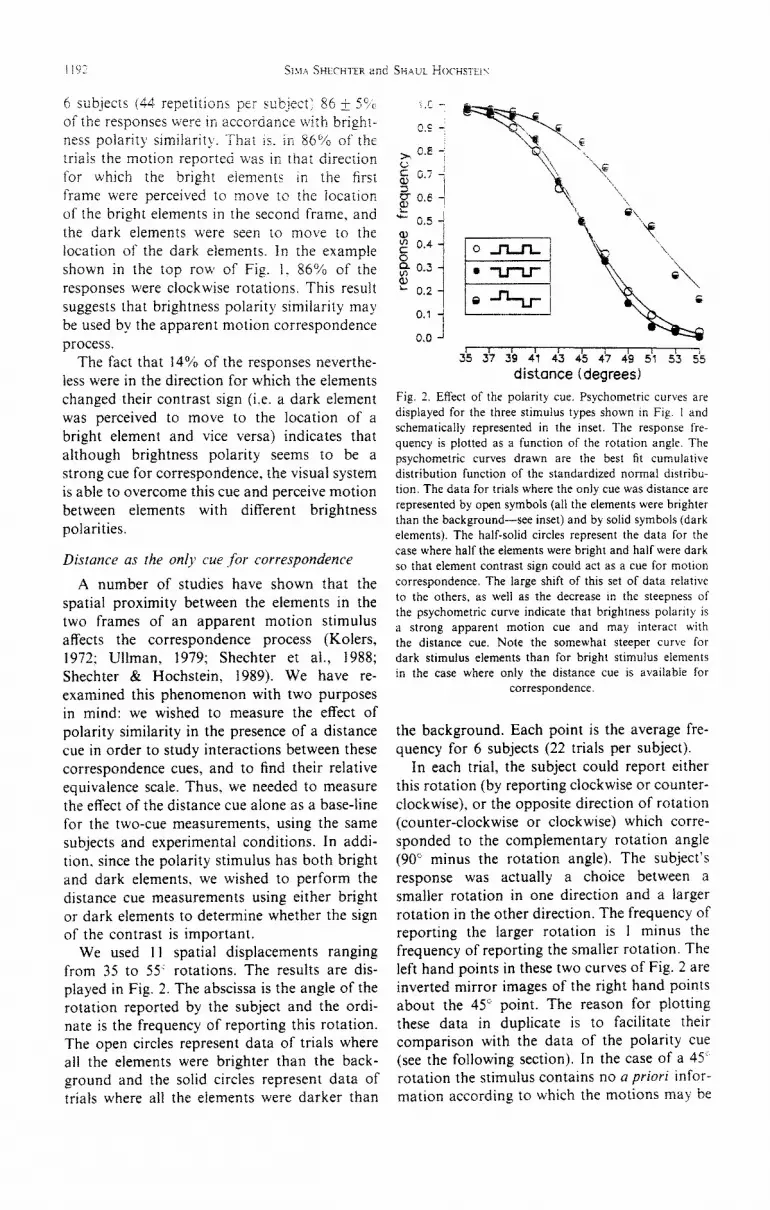
Fig. 2. Effect of the polarity cue. Psychometric curves are
displayed for the three stimulus types shown in Fig. I and
schematically represented in the tnset. The response fre-
quency is plotted as a function of the rotation angle. The
psychometric curves drawn are the best fit cumulative
distribution function of the standardized normal distribu-
tion. The data for trials where the only cue was distance are
represented by open symbols (all the elements were brighter
than the background-see inset) and by solid symbols (dark
elements). The half-solid circles represent the data for the
case where half the elements were bright and half were dark
so that element contrast sign could act as a cue for motion
correspondence, The large shift of this set of data relattve
to the others, as well as the decrease in the steepness of
the psychometric curve indicate that brightness polarity is
a strong apparent motion cue and may interact with
the distance cue. Note the somewhat steeper curve for
dark stimulus elements than for bright stimulus elements
in the case where only the distance cue is available for
correspondence.
the background. Each point is the average fre- quency for 6 subjects (22 trials per subject).
In each trial, the subject could report either this rotation (by reporting clockwise or counter- clockwise), or the opposite direction of rotation (counter-clockwise or clockwise) which corre- sponded to the complementary rotation angle (90c minus the rotation angle). The subject’s response was actually a choice between a smaller rotation in one direction and a larger rotation in the other direction. The frequency of reporting the larger rotation is 1 minus the frequency of reporting the smaller rotation. The left hand points in these two curves of Fig. 2 are inverted mirror images of the right hand points about the 45” point. The reason for plotting these data in duplicate is to facilitate their comparison with the data of the polarity cue (see the following section). In the case of a 45’: rotation the stimulus contains no a priori infor- mation according to which the motions may be
categorized as clockwise or counter-clockwise. For this case we may expect random responses and we have plotted this point as 50% in the two curves of Fig. 2.
brightness polarity as a cue for correspondence. or both these cues jointly.
Our results. in agreement with those of others in related experiments (see Shechter et al., 1988) show that the smaller rotation is always reported more frequently than the larger rotation. Furthermore, as we depart from 45.. the frequency of responses re- porting the smaller rotation also increases, indicating that the ability to utilize the distance cue information increases steadily with its magnitude.
The psychometric function which best fits each data set is sigmoidal in nature. We have plotted such curves by fitting the cumulative distribution function of the standardized nor- mal distribution (see Shechter et al., 1988 for details). Two free parameters define the distri- bution: C, the mean, and (T, the standard devia- tion. These are related respectively to the point where the response frequency is 50% (the deci- sion criterion point) and to the steepness of the psychometric function (- l/a, the sensitivity to changes in rotation angle). We fit such a curve to the data of each subject separately and measured C and 0. The fit was very good in each case. The correlation coefficient, r, of the average linearized data for the 6 subjects was >0.995 for both bright and dark stimuli (range for individual subjects 0.97-0.99 for bright stimuli, and 0.99%>0.995 for dark stimuli).
The third curve in Fig. 2 displays the results of these trials. Each point (marked with a half-solid circle) is the average response fre- quency for the same 6 subjects as the other points in the figure (22 trials per point per subject). We plot the frequency of reporting that direction which maintains the contrast sign (the frequency of reporting the alternate direction is 1 minus this frequency). Thus, this curve has 11 dferent data points, unlike the other two curves in Fig. 2 where 5 of the data points (in each curve) are an inverse mirror-image replotting of 5 of the others.
The curve is shifted to the right with respect to the other two curves and the new criterion point, the C parameter of the psychometric curve, is 50.2” (the range for the 6 subjects was 48.0.-52.3’). This means that the subjects were just as likely to report perceiving a motion which was 50.2” and maintained brightness polarity as reporting a 39.8” motion for which the elements changed polarity from bright to dark and vice versa. This measure provides an equivalence scale for these two dimensions. Brightness polarity similarity has the same effect on the correspondence process as a 50.2 vs 39.8” rotation distance disparity.
The criterion rotation angle of both curves is of course 45’. The average u for the bright stimuli curve was 4.9’ (range 4.1-5.7”), and for the dark stimuli curve u was 4.2’ (range 3.8-5.0’). The smaller 0 for the dark stimuli reflects a steeper psychometric curve which sig- nifies a somewhat greater sensitivity to distance for dark stimuli than for bright stimuli. This difference is statistically significant (t = 2.90, P < 0.025).
The polarity cue curve is not just shifted with respect to the distance curves but also its steepness is reduced. This steepness re- duction is reflected in the increased value of (T to 6.2”, in comparison with those of the two distance curves (4.2 and 4.9”). The range for the 6 subjects was 4.7-7.2’. This shift in (T is statistically significant (t = 5.36, P < 0.005
and t = 3.83, P < 0.01) indicating that the po- larity cue interacts with the processing of the distance dimension, reducing the sensitivity to distance.
Conclusions Distance and brightness polarit]! as joint cues for correspondence
In this section we report the results of trials where both cues, distance and brightness polar- ity were present in the stimuli. The luminance (or contrast) profile of the elements is as shown in the top row of Fig. 1 and the distance displacements varied between 35 and 55” rota- tions as described in the preceding section. Thus, the subiect could use either distance or
1. Brightness polarity similarity serves as a cue for the correspondence process of apparent motion.
2. Distance disparity serves as a correspon- dence cue, for bright or dark elements. The sensitivity to this cue for dark elements is greater than for bright elements.
3. The effects of the polarity and the distance cues are summed, yielding a 5.2’ shift in the
_. criterion point.
On and Off pathways to apparenr motion 1193
; ! $ : SIMA SHECHTER and SHAUL HOCHSTEIK
7 I_i:e sen<;+i+t\’ rli b _ ic the distance cue de-
creases i:: the presence of the polarity cue.
EXPERIMENT II
The stimulus presented in Experiment I and
demonstrated in the top row of Fig. 1 is called the polarity cue stimulus, since its most salient
feature is that it contains both bright and dark
elements. However, a bright element differs from a dark element in two aspects: the elements
differ in their contrast sign, and they have
different intensities.* The purpose of this exper- iment was to find whether the effect of the
brightness polarity cue on the correspondence process, as found in Experiment I, derives from one of these two aspects or from both of them.
Methods
The same 6 subjects participated in this exper-
iment as in Experiment I. (One subject did not participate in the last set of tests.) We used the same apparatus and the same procedures. How-
ever. in addition to the stimuli described above, we introduced two new stimulus types. In both these types, the elements in the stimuli differed in their intensities but all the elements had the same polarity sign in any one stimulus. In one type. all the elements in the stimuli were brighter
than the background and in the other, all the elements were darker than the background. This is shown in the inset to Fig. 3, where a schematic
representation of the contrast profile of these
stimulus types is displayed. The top three dia- grams represent the distance alone stimuli and the brightness polarity stimulus as shown in
Figs 1 and 2, while the bottom two diagrams
show the intensity cue stimuli where all the elements are brighter or darker than the back- ground, respectively. Note that the three bottom stimuli represented in the inset of Fig. 3 have the same stimulus contrast. namely 50% (see
Experiment I). The luminances of the element pairs for the data of these three stimulus types for Fig. 3 were 30 and 18 cd/m’ (the contrasts are k 25%): 30 and 42 cd/m’ (+25%, + 75%); and 18 and 6 cd/m’ (- 25%. - 75%), where the
background luminance was always 24 cd/m’. In additional trials of Experiment II we also varied the stimulus contrast for these three stimulus
types.
*B> intrnslr! ue mean luminance or flux. See footnote on
p 110:
I I I I I I1 I I I I 35 37 39 41 43 45 47 49 51 53 55
distance (degrees)
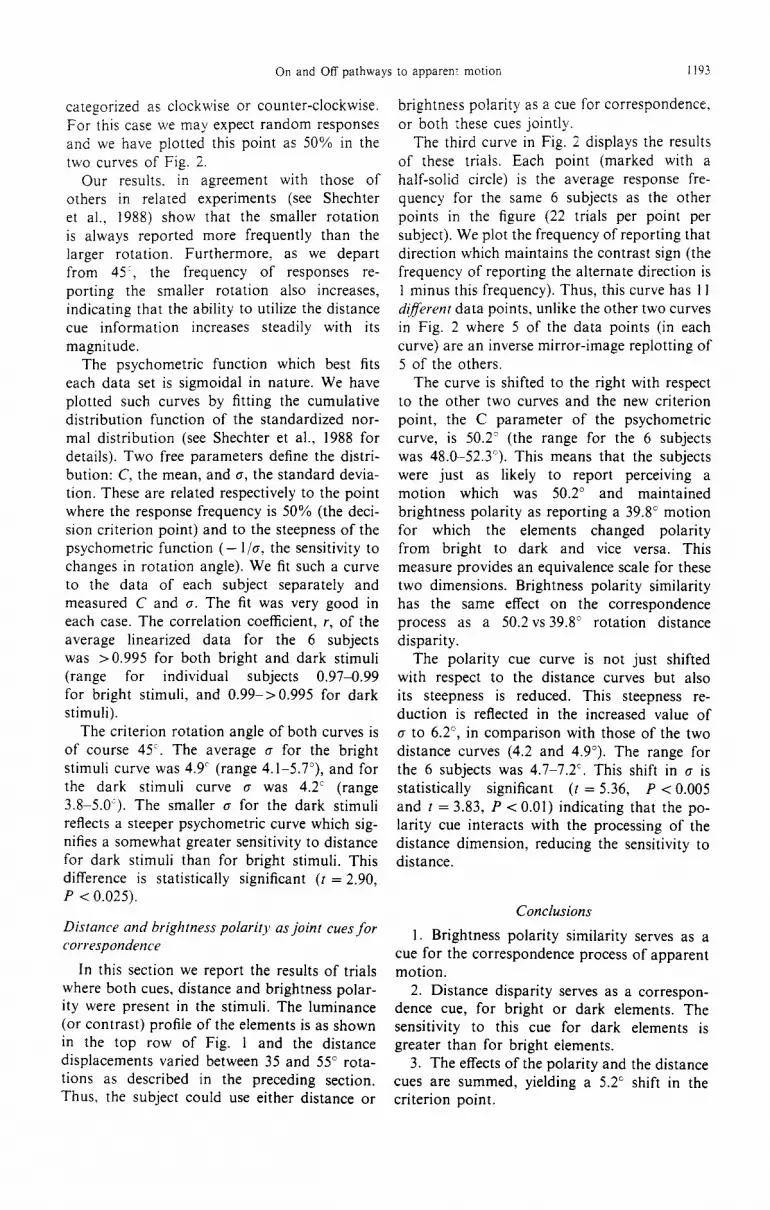
Fig. 3. Comparison of polarity and Intensity cue effects. The
response frequency in the presence of a difference in inten-
sity between neighboring bright elements (open squares) or
dark elements (solid squares) is displayed as a function of
rotation angle. For comparison, the data and curves of Fig.
2 are replotted here. The shift of the data due to the polarity
cue is greater than that due to an intensity cue where the
difference in intensities for these cues is matched (see inset),
suggesting that the polarity cue effect does not derive solely
from the difference in intensity of the elements.
Results
Polarity cue and intensity cue efects
Figure 3 displays the response frequencies for the five stimulus types described above (and demonstrated in the figure inset), as functions of
the rotation angle. The graphs for the data where the correspondence cue was an intensity difference between the elements without polarity difference (open and solid squares for bright and
dark elements, respectively) are shifted to the right with respect to the distance alone curves. For the bright stimuli curve C = 47.7’ and for the dark stimuli curve C = 47.0’. The fact that
the shift parameter, C. of these curves is greater than 45” indicates that intensity differences may
be used as a correspondence cue by the apparent motion system (see Shechter & Hochstein, 1989). This effect is demonstrated here for both bright and dark elements. The intensity differ- ence, or the stimulus contrast, in the brightness polarity stimulus is the same as that of the two intensity cue curves, namely 50%. However, the shift of the brightness polarity curve where C = 50.2’. is significantly larger than the shifts
of the intensity cue graphs (t = 6.21, P < 0.005, bright elements; t = 5.16, P < 0.005, dark ele- ments). This suggests that the shift in the C parameter of the brightness polarity curve is not
On and Off pathways to apparent motion
due only to the intensity difference within the stimulus. but derives al least in part from an &iitional aspect of the polarity stimulus, pre- sumably the polarity difference itself.
The steepnesses of the intensity cue curves are slightly smaller than the steepnesses of the dis- tance alone curves. For the bright stimuli CT changes from 4.9 to 5.3’ and for the dark stimuli, from 4.2 to 4.6”. These changes are statistically nonsignificant (f = 1.98, P > 0.05; I = i .67, P > 0,05), while the decrease in the steepness of the polarity curve is significant (G equals 6.2’, as described in Experiment I above). This effect of the polarity cue on the sensitivity to distance, which is absent in the intensity cue cases, supports the conclusion that the brightness polarity apparent motion effects do not derive only from the differences in intensity of the stimulus. It is the polarity difference itself which seems to serve as a corre- spondence cue. In the following section we will test whether the intensity difference makes any contribution at all to the polarity cue effects.
To determine whether the polarity cue effects derive at least in part from the contrast differ- ences between the stimulus elements, we varied the stimulus contrast for the polarity cue test and measured the contrast dependence. The stimuli were as displayed in the top row of Fig. I, or in the middle row of the inset of Fig. 3, The stimulus contrast, denoted by the bars in the Fig. 3 inset. was varied from 50 to 200%. For each stimulus. the contrast magnitude of the dark elements equaled that of the bright elements. For example, a stimulus contrast of 100% was achieved by luminances of 12 and 36 cd/m’ with a background of 24 cd/m2, so that the bright elements had a contrast of +50% and the dark elements had a contrast of - 50% f The maximal stimulus contrast achievable was thus 200%, since a dark element cannot have a contrast beyond - 100%.
For each stimulus contrast we performed a complete experiment set varying the distance parameter between 35 and 55” rotations. We then plotted the data as a function of distance and fitted a psychometric curve to these data points. One example (50%) is shown in Figs 2 and 3. The shift parameter C and the steepness parameter cr for each of these curves are plotted in Fig. 4 as functions of the stimulus contrast. For comparison, the values of these parameters
6.0 =v
‘3;
8 5.5 - &
5 5.0 -
z a
.P 4.5 i
m
4.0
1195
I 50
, k 1 1 I 1 75, 100 125 150 175 200
7% contrast
I 50
I 75
I I I 100
, 8 125 150 175 200
% contrast
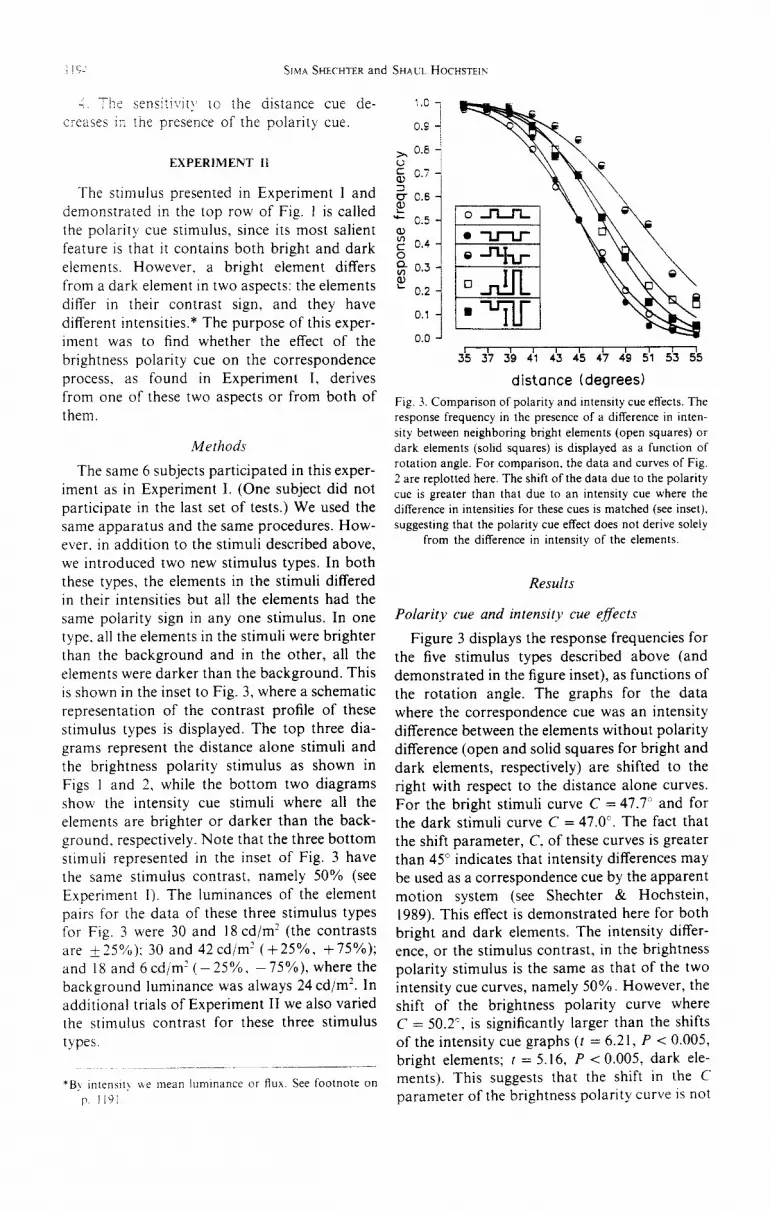
Fig. 4. Polarity cue inde~ndence of stimulus contrast. Psychometric curves were derived (as in Figs 2-3) for various stimulus contrasts and the criterion (C) and steep ness (-l/e) parameters were measured and plotted as functions of contrast in the top and bottom graphs, respeca tively. For comparison, the parameters for the case with only a distance cue are plotted at the kft (bright stimuli- open square; dark stimuli-sobd square). The slopes of the regression lines are neady zero, indicating that the polarity
cue effects are independent of stimulus contrast.
for the distance alone cases are plotted at the left.
Both the criterion parameter C and the steep- ness parameter cr are much larger for stimuli with a brightness polarity cue than for the distance alone cases. The dependence of these parameters on the stimulus contrast is very shallow, and appears as a slight decrease in vatue with increasing stimulus contrast. The slopes of the regression lines drawn in Fig. 4 are respectively -O.O05”/%contrast for the C parameter and -O.OOfY/%contrast for CT. These slopes do not deviate signi~cantly from zero, especiaily when compared with the 5” shift in C due to the mere presence of a polarity cue.
We conclude that the effects of the brightness polarity cue are independent of stimulus con- trast and that the presence of the polarity cue itself is the dete~inant of the dramatic effect on the correspondence process. Though it is impos- sible to produce a polarity cue stimulus without a contrast difference, it appears that the polarity

1196 SIMA SHECHTER and SHAUL HOCHSTEIN
cue effect does net derive from the contrast difference itself. We will examine below whether a contrast difference can contribute to the polarity cue correspondence effect, under other conditions.
Equiz:alence scale betlrqeen po1arir.r and intensitj- cues
The goal of this part of the experiment was to find the equivalence scale between the two di- mensions, brightness polarity and intensity. In the preceding section we saw that the effect of brightness polarity is independent of the stimu- lus contrast. On the other hand, when all the elements are either brighter or darker than the background, the effect of the intensity cue de- pends on the stimulus contrast (see Shechter & Hochstein, 1989; where the intensity cue stimuli were named flux/luminance stimuli).
Though the equivalence scale between these two dimensions cannot be found directly, one can deduce it by comparing the equivalence scales between each of these dimensions and the distance dimension. These latter equivalence scales are expressed by the shift parameter C of the psychometric curves. Thus, the polarity cue effect is approximately equivalent to a distance disparity of 50 vs 40’ (see Figs 2 and 4). We now measure which contrast of the intensity cue yields the same effect.
We varied the stimulus contrast of the inten- sity cue stimuli by varying the contrast of the element with the larger contrast magnitude. For each set of data, we found the best fit psycho- metric curve and measured its parameters, as above. Figure 5 displays the shift parameter C as a function of the stimulus contrast for three stimulus types: the polarity cue stimuli (replot- ted from Fig. 4), the intensity cue stimuli with bright elements (open squares) and the intensity cue stimuli with dark elements (solid squares). A best fit regression line is drawn for the data of each stimulus type.
The maximal stimulus contrast used for the intensity cue stimuli was 75%. The values of the criterion parameter C for these stimuli are smaller than the value of C for the polarity cue. Extrapolations of the intensity regression lines (denoted by the dashed lines in Fig. 5) cross the polarity regression line at approximately 100% contrast. For the parameters used in this study (where one element always had +25% con- trast), a stimulus with 100% contrast is achieved by a factor of 5 difference between the lumi- nance (or flux) of the elements, relative to the
5’ -!
50 i
b 46
I I I I I I 1 1 b 25 50 75 100 125 150 175 200
% contrast Fig. 5. Polarity-intensity equivalence scale. The criterion shift parameter, is plotted as a function of contrast for trials where intensity served as a correspondence cue and all the elements were bright (open squares) or dark (solid squares), together with the criterion when the polarity cue was present (see Fig. 4). Note that the intensity curves have a strong contrast dependence while the polarity curve does not. The meeting point of the two extrapolated regression lines (at about 100% contrast) with the polarity cue data serves as an approximate measure of the equivalence scale between
the polarity and intensity cues.
background. (The second element would have to have a + 125% contrast, which is in fact impossible for dark elements.) For other parameters, the translation between stimulus contrast and the ratio between the luminances or fluxes of the elements would be different, and it is not clear which measure would be constant for the equivalence scale.
Adding an intensity cue to the polarity cue
We saw above that when the elements have the same brightness polarity, the correspon- dence effect depends on the contrast magnitude differences. However, when the elements have different polarities, there is almost no effect of contrast magnitude. Does this mean that in the presence of a polarity cue the contrast magnitude information is lost? This part of the experiment was designed to test whether the correspondence process is blind to the contrast magnitudes of elements of different brightness signs, In each polarity cue stimulus tested above the contrast magnitude of the dark elements equaled that of the bright ele- ments. Here we manipulated this factor, allowing the bright and dark elements in the same stimulus to have different contrast magnitudes.
On and Off pathways to apparent motion
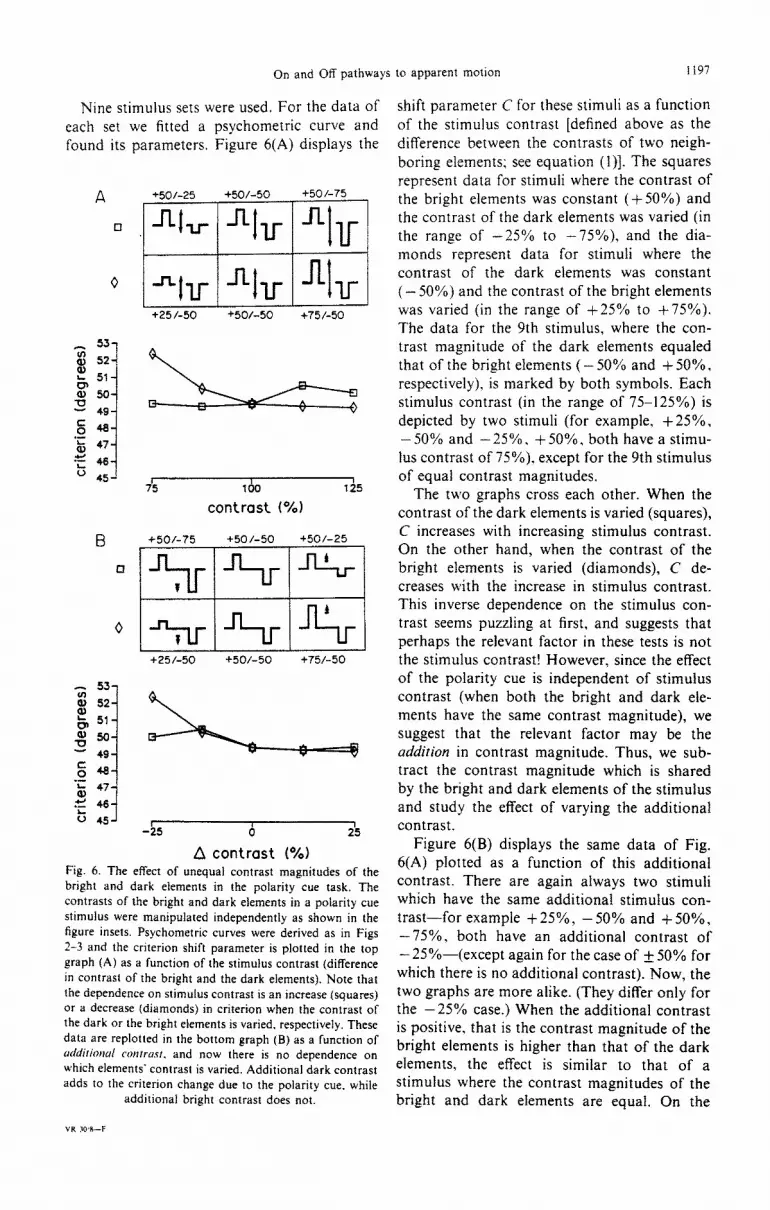
Nine stimulus sets were used. For the data of each set we fitted a psychometric curve and found its parameters, Figure 6(A) displays the
+25 I-50 +50/-50 +75/-50
+50/-75 +50 l-50 +50/-25
~
+25/-50 +50/-50 +75/-50
-25 0 25
A contrast (*A) Fig. 6. The effect of unequal contrast magnitudes of the bright and dark elements in the polarity cue task. The contrasts of the bright and dark elements in a polarity cue stimulus were manipulated independently as shown in the figure insets. Psychometric curves were derived as in Figs 2-3 and the criterion shift parameter is plotted in the top graph (A) as a function of the stimulus contrast (difference in contrast of the bright and the dark elements). Note that the dependence on stimulus contrast is an increase (squares) or a decrease (diamonds) in criterion when the contrast of the dark or the bright elements is varied, respectively. These data are replotted in the bottom graph (B) as a function of crrM/dilionul COIII~LISI. and now there is no dependence on which elements’ contrast is varied. Additional dark contrast adds to the criterion change due to the polarity cue. while
additional bright contrast does not.
1197
shift parameter C for these stimuli as a function of the stimulus contrast [defined above as the difference between the contrasts of two neigh- boring elements; see equation (l)]. The squares represent data for stimuli where the contrast of the bright elements was constant (+ 50%) and the contrast of the dark elements was varied (in the range of -25% to -75%). and the dia- monds represent data for stimuli where the contrast of the dark elements was constant (- 50%) and the contrast of the bright elements was varied (in the range of +25% to +75%). The data for the 9th stimulus, where the con- trast magnitude of the dark elements equaled that of the bright elements ( - 50% and + 50%, respectively). is marked by both symbols. Each stimulus contrast (in the range of 75-125%) is depicted by two stimuli (for example, +25%, - 50% and -25%. +50%, both have a stimu- lus contrast of 75%), except for the 9th stimulus of equal contrast magnitudes.
The two graphs cross each other. When the contrast of the dark elements is varied (squares), C increases with increasing stimulus contrast. On the other hand, when the contrast of the bright elements is varied (diamonds). C de- creases with the increase in stimulus contrast. This inverse dependence on the stimulus con- trast seems puzzling at first, and suggests that perhaps the relevant factor in these tests is not the stimulus contrast! However, since the effect of the polarity cue is independent of stimulus contrast (when both the bright and dark ele- ments have the same contrast magnitude), we suggest that the relevant factor may be the addition in contrast magnitude. Thus, we sub- tract the contrast magnitude which is shared by the bright and dark elements of the stimulus and study the effect of varying the additional contrast.
Figure 6(B) displays the same data of Fig. 6(A) plotted as a function of this additional contrast. There are again always two stimuli which have the same additional stimulus con- trast-for example + 25%) - 50% and + 50%, -75%, both have an additional contrast of - 25%~(except again for the case of + 50% for which there is no additional contrast). Now, the two graphs are more alike. (They differ only for the -25% case.) When the additional contrast is positive, that is the contrast magnitude of the bright elements is higher than that of the dark elements, the effect is similar to that of a stimulus where the contrast magnitudes of the bright and dark elements are equal. On the

: 194, Smn SHECHTER and &AIL HOCHSWN
other hand. when the additional contrast is negative. that is the contrast magnitude of the dark elements is greater than that of the bright
elements. the effect is larger than that for the equal contrast magnitude stimulus.
These results indicate that the effect of addi-
tional contrast depends on the sign of the
addition. A negative contrast addition to the polarity cue affects the correspondence process so that there is an additional effect beyond that
of the polarity cue itself, while a positive con-
trast addition does not. We shall refer to this difference in the effects of positive and negative
additions in the Discussion section.
Conclusions
1. Intensity (or flux) similarity serves as a correspondence cue for bright or dark elements.
Its effect depends on stimulus contrast. 2. The polarity cue effect is independent of
stimulus contrast and does not depend on the intensity cue.
3. The polarity cue is equivalent to the inten- sity cue effect for a 100% stimulus contrast.
4. Adding the intensity cue to the polarity cue increases the correspondence effect only when the additional contrast is for the dark elements.
EXPERIMENT III
We have shown elsewhere that the dimension of the size of the elements in an apparent motion
stimulus affects the correspondence process (Shechter & Hochstein, 1989). Motion is re- ported more frequently in the direction which maintains element size similarity than in the
direction in which the elements’ size changes.
However, size cannot be varied alone. When varying the size of an element and keeping its luminance fixed, its luminous flux changes as
well. On the other hand, one can induce size changes without flux changes by varying the luminance inversely with the area of the ele- ment. We found that there was an effect due to
size in both of these cases, size changes with constant luminance or with constant flux. The effect when the pair of dimensions size/flux was varied was about equal to the sum of the effects when the pair size/luminance varied and when the pair flux/luminance varied. We concluded that size and flux each has an effect on the correspondence process while luminance does
not. In the last section of Experiment II we saw
that additional negative contrast to the polarity
cue introduces an additional effect beyond that of the polarity cue itself. Since the elements ir,
the stimuli of that experiment were all the same size. a change in luminance of an element auto-
matically changes its total luminous flux. Thus. the additional effect found may derive from an
additional difference in either luminance or flux.
In order to separate these two illumination dimensions. and to determine which dimension is the source of the additional effect, we intro- duced the dimension of size. We varied size and
luminance (keeping flux constant) or varied size
and flux (keeping luminance constant).
Methods
Figure 7 displays a schematic representation of the 10 different stimulus types used in this experiment. In the top row two polarity cue
stimuli are shown. The contrast magnitude of the bright elements (100%) equals that of the dark elements (- 100%). In each of these stim- uli, all the elements have the same size. How-
ever, for the right stimulus, the elements’ size is about twice as great as for the left stimulus (552 and 255 square minutes of arc, respectively). While in the top row stimuli the size dimension varies between stimuli, in the two bottom rows the size of the elements varies within each
stimulus. In the middle row stimuli there is no polarity
cue, as the polarity is fixed within each stimulus. All the elements in each stimulus are either brighter or darker than the background. The two left diagrams demonstrate the case where the pair of dimensions varied is size and flux, while for the two right diagrams the varied
dimensions are size and luminance. In the bot- tom row, the diagrams demonstrate stimuli where both polarity and size/flux (left diagrams) or polarity and size/luminance (right diagrams) are varied. Note that when we talk of luminance or flux, we refer to the luminance or flux relative to that of the background, and not to the
absolute luminance or flux (relative to zero). As in the preceding experiments, the distance
was varied between 35 and 55”. Four of the subjects from the preceding experiments also participated in this experiment.
Results
The parametric efSects of size and polarit?
Before examining the effects of adding size variations to the polarity cue stimulus, we stud- ied the role of size as a parameter in the polarity

On and Off pathways to apparent motion 1199
Fig. 7. The visual stimuli for Experiment III. A schematic representation of the sizes and iuminances of two neighboring elements is shown for each stimulus iype. Top row: polarity cue with smalf or Iarge elements to measure the dependence of the polarity cue effect on element size. Middle row: size and flux (left) or size and luminance (right) dimension pair cues with bright or dark elements to measure the dependence of the size effect on contrast polarity. Bottom row: polarity and size cues together, where size is paired with Rux (left) or fuminance (right), and the larger element is dark or bright. tu study summation
of the effects of these cues.
cue tests and the role of polarity as a parameter in the size cue tests. We plot in Fig. 8 the shift parameter C of the psychometric curves ob- tained for the different stimuli demonstrated in the top and middle rows of Fig. 7.
The polarity cue effects were measured using elements of two sizes: 255 and 552 square minutes of arc. The leftmost data bars of Fig. 8 are nearly equal, indicating that there is nearly no effect of element size on the polarity cue
45
effect. The correspondence effect of the polarity cue seems to be independent of the flux or luminance contrast magnitude of the stimulus elements (see Fig. 5) as well as of the size of the elements (Fig. 8).
We measured the effects of size for the two cases mentioned above (size changes accompa- nied by flux changes and size changes accompa- nied by luminance changes) using stimuli in which all the elements were either brighter or
S/FI, S/F,
m S/F SIL
Fig. 8. Size and the correspondence process. The psychometric curve criterion parameter is plotted for six different stimulus types with different correspondence cues: the polarity cue (P) for small (Ps,) or large (Ps,) elements: the size and flux dhnension pair cue (S/F) for bright (S/F,,) or dark (S/F,) elements; and the size and luminance dimension pair cue (S/L.) for bright (S/Lb) or dark (S/L,,) elements. The polarity cue effect is independent of the size of the efements, and the size (plus Rux or luminance) effect is
independent of the polarity of the contrast of the elements.

darker than the background. in this way we
wished to test the dependence of size effects on
the sign of the element contrast. The results are
displayed in the middle and right pairs of data bars of Fig. 8. The effect of varying the dimen-
sion pair size/flux was larger than the effect of varying the pair size:luminance. However. there
is no clear difference between the effects for bright or dark elements in either of these two
cases. The effect of size when linked with either
flux or luminance seems to be independent of the polarity of the stimulus elements.
We conclude that the dimensions. size and polarity, do not have parametric effects on each
other’s correspondence effects. Note that for the
parameters used here (a factor 2 change in size) the effect of polarity is much stronger than that of size.
Adding size, flux and luminance cues to the
polarit?! cue
Now that we have shown that neither size nor polarity has parametric effects on the other dimension, we can turn to the main questions of Experiment III. What is the effect of adding
size information to the polarity cue and which dimension, luminance or flux, causes the additional effect seen (in Fig. 6) when contrast is added to the dark elements of a polarity cue stimulus? Schematic representation of the
P -
-
P,S/Fb
I
P,S/i
-
P,S/F
SHAUL. HOCHSTEI~
stimuli tested in this section are shown in the
bottom row) of Fig. ‘7. The shift parameter C of the psychometric curves for these stimuli are displayed in Fig. 9.
The polarity cue effect is shown as the left-
most data bar in Fig. 9. It is the averaged C parameter of the two leftmost data bars of Fig. 8. re-plotted here for comparison with data
from trials where there are cues from polarity and another pair of dimensions. When the
bright elements’ size is larger than that of the dark elements (left and right bars of the second
and third sets of bars, respectively), the effect is similar to that of a polarity cue stimulus where
all the elements have equal sizes (leftmost bar - P). This similarity of effect is found for both cases, when size is coupled with flux (P. S/F,) or with luminance (P, Sb/Ld).
On the other hand, when the size of the dark
elements is larger than that of the bright ele-
ments, there is an additional effect whose pres- ence depends on which dimension is coupled with size. When the pair of dimensions size/flux is added to the polarity cue (P, S/Fd), there is an additional effect beyond that obtained for the polarity cue stimulus (P). However, when the pair of dimensions size/luminance is added to the polarity cue (P, &/Lb), the effect is similar to that of the polarity cue alone. These results
suggest that the additional effect found in the
-
3
P,S/L
Ld P,F/L,,
P.F/L d -
P,F/L
Fig. 9. The effects of srze. flux and luminance in the presence of the polarity cue. The criterion parameter
is plotted for the polarity cue (P) and when polarity is added to size and flux (P. S/F), size and luminance
(P. S’L) or flux and luminance (P. f !L). These dimensions are varied so that the bright (b) or dark
(d) elements have the greater size and/or relative luminance and/or relative flux as noted by the
subscripts. Note that additional information from these dimensions does not affect the criterion parameter
except when the dark elements have a greater relative flux. Luminance is not a relevant dimension
for correspondence and the size cue (which is effective alone. Fig. 8) may be overshadowed by the polarity cue

On and Off pathways to apparent motion 1201
last section of Experiment II for added negative contrast stimuli is due to the addition in relative flux to the dark elements and not to an addition in relative luminance.
For comparison, we have plotted in Fig. 9 (the two rightmost data bars) the C parameter of the curves for the cases where all the elements had the same size but the contrast magnitude (that is, the relative flux/luminance) of the dark and bright elements was unequal. Each of these data bars is an average of the two data points at one of the extremes of Fig. 6(B). Note that in Fig. 9 the criterion C for all cases is about equal to that for the polarity cue alone, except when additional relative flux is introduced in the dark elements (P, S/F, and P, F/L,). Neither the size/luminance cases nor the cases when the bright elements have the additional relative flux, show any additional effect beyond that of the polarity cue effect.
The triple comparison of the additional effects of the three pairs of dimensions size/flux, size/luminance and flux/luminance for the bright or dark elements is made with the follow- ing reservations. The effect of adding flux/luminance was examined in a different ex- periment block than were the other two pairs of dimensions (Experiment II and III, respec- tively). The four subjects who participated in Experiment III were joined by a fifth in Exper- iment II. The stimulus contrast used in Experi- ment II was 75% and 125% rather than 150%, used in Experiment III.
We conclude that flux rather than luminance appears to be the dimension determining the additional effect in the presence of polarity. This effect is seen only when the additional relative flux is added to the dark elements. Luminance is not effective as an additional cue, as it is also not effective alone. Size which was shown to be an effective cue in the absence of polarity for either bright or dark elements is not effective in the presence of polarity.
I
Conclusions
1. The polarity cue effect is independent of element size and the effect of size (when coupled with flux or luminance) is independent of con- trast sign.
2. The effect of adding the flux cue to the polarity cue depends on the sign of the addition. Only when the relative flux is added to the dark elements is there an additional effect beyond that of the polarity cue effect.
3. Adding a size cue (with a factor 2 differ- ence) to the polarity cue has no additional correspondence effect.
GENERAL DlSCUSSlON
The experiments described above show that similarity of brightness polarity serves as a cue for the correspondence process of the long range apparent motion system. In a competition situ- ation, when the only cue for correspondence is the brightness polarity similarity, there is a clear preference for perceiving motion in the direction which maintains element polarity (86%) to per- ceiving motion in the direction in which the elements’ polarity is changed (14%). Although this finding differs from the conclusion drawn by Anstis and Mather (1985), it is qualitatively in agreement with their data. Their results show that the brightness polarity cue does affect the long range motion system, though to a lesser extent than it affects the short range motion system. The results of Georgeson and Shackle- ton (1989) also support our conclusion.
When both cues, distance and brightness po- larity, are present in the motion stimuli, their effects on the correspondence process are summed. This summation is expressed by the shift of the criterion rotation angle: the decision criterion point as to whether the direction of motion was clockwise or counter-clockwise is shifted from 45” (in the case where the only cue for correspondence is distance) to 50”. There is an additional interaction between the dimen- sions of distance and polarity: the sensitivity to distance is reduced in the presence of the bright- ness polarity cue. The D parameter increases from 4.2” (for dark elements) or 4.9” (for bright elements) to 6.2”. These two effects are nearly independent of stimulus contrast.
Although it is impossible to create an appar- ent motion stimulus with a polarity cue but without a difference in contrast of the stimulus elements, the magnitude of this contrast differ- ence is not a strong determinant of the strength of the polarity cue effect (as long as the contrast magnitudes of the bright and the dark elements are equal).
What is the source of the polarity effects? The independence on stimulus contrast suggests that the difference in intensities of the elements is not the primary source. This suggestion is supported by the finding that the effects due to differences in intensity alone without a polarity cue are linearly dependent on the intensity difference
120: SIMA SHECHTER and SHALL HOCHSTEIK
between the elements. and are in general weaker
than the effects when the polarity cue is present. (Extrapolation of the curves in Fig. 5 indicates
that only at about 100% contrast do the
effects due to intensity alone reach those due to polarity.)
There is. however. a way of adding intensity
information to the polarity cue stimulus, namely, by using a nonsymmetric stimulus in which the contrast magnitudes of the bright and the dark elements are not equal. We find that
only adding contrast magnitude to the dark
elements enhances the effects due to polarity. The same findings hold true when we use addi-
tional size rather than additional contrast mag-
nitude: only when the dark elements are larger
than the bright elements is there a greater shift in the criterion than when the elements are all
the same size. Both the contrast and the size effects seem to derive from additional flux differ-
ences (from background) of the dark elements.
Thus, the effects of the two cues, polarity and relative flux sum under certain conditions.
Size itself (even when not combined with flux) has been shown to be an effective cue for correspondence in the absence of a polarity cue
(Fig. 8; see also Shechter & Hochstein, 1989). However, no additional effect is seen when size
differences (without flux differences) are added to polarity. It would appear that the size cue
effect is absorbed in the much larger effect due to polarity. The similarly small effect of the flux cue is not absorbed in the effect of the polarity cue perhaps because polarity and flux are re-
lated to element contrast.
On and Of pathways
As outlined in the Introduction, the visual system contains separate pathways for detection of stimulus elements which are brighter or
darker than their backgrounds. How is informa- tion originating from these pathways integrated in the apparent motion system? How does the
motion system differentiate between informa- tion deriving from the two pathways?
Clearly, information from either pathway may be used by the motion system: apparent motion is perceived for stimuli containing ele- ments which are either brighter or darker than the background. Furthermore, the motion sys- tem is able to integrate information from both these systems: under certain conditions, motion is seen in the direction for which the polarity of the elements is reversed during the motion. Still, the polarity of the elements is not forgotten by
the motion system. and there is a preference to perceiving motion in the direction for which the
elements maintain their contrast polarity. This
preference may be due to a labeled-line mecha- nism (Miller, 1833) since it is not due to a
difference in intensity of the bright and dark
elements. as discussed above. However, the in-
tensity of the elements is also not forgotten by the motion system. even when the elements are
detected by separate pathways, since additional
relative flux may affect the correspondence process.
The pathways processing bright and dark
elements are not only separate but have different
characteristics. The differences we found be-
tween the apparent motion effects for bright and
dark elements join a list of differences between
the On and Off pathways which have been
reported on the basis of physiological or psy-
chophysical studies. The average size of the
receptive fields of the On-center cells is smaller
than that of the Off-center cells (Hammond,
1974) and On-cells seem to have a higher threshold (Wiesel, 1960). A stimulus which is
brighter than the background appears larger
than a stimulus which is darker than the back-
ground (Weale, 1975; Gelb & Wilson, 1983; Van
Erning, Gerrits & Eijkman, 1988). In addition,
using flicker stimuli, the darkness enhancement is greater than the brightness enhancement
(Magnussen & Glad, 1975). Zemon et al. (1988) measured the visual
evoked potentials (VEPs) due to contrast incre-
ments (presumably exciting neurons of the On- pathway) and due to contrast decrements
(exciting the Off-pathway). Figure IO displays
their results for the two stimulus types as a
function of contrast. Note the following charac- teristics of the On and Off pathways evoked
potentials.
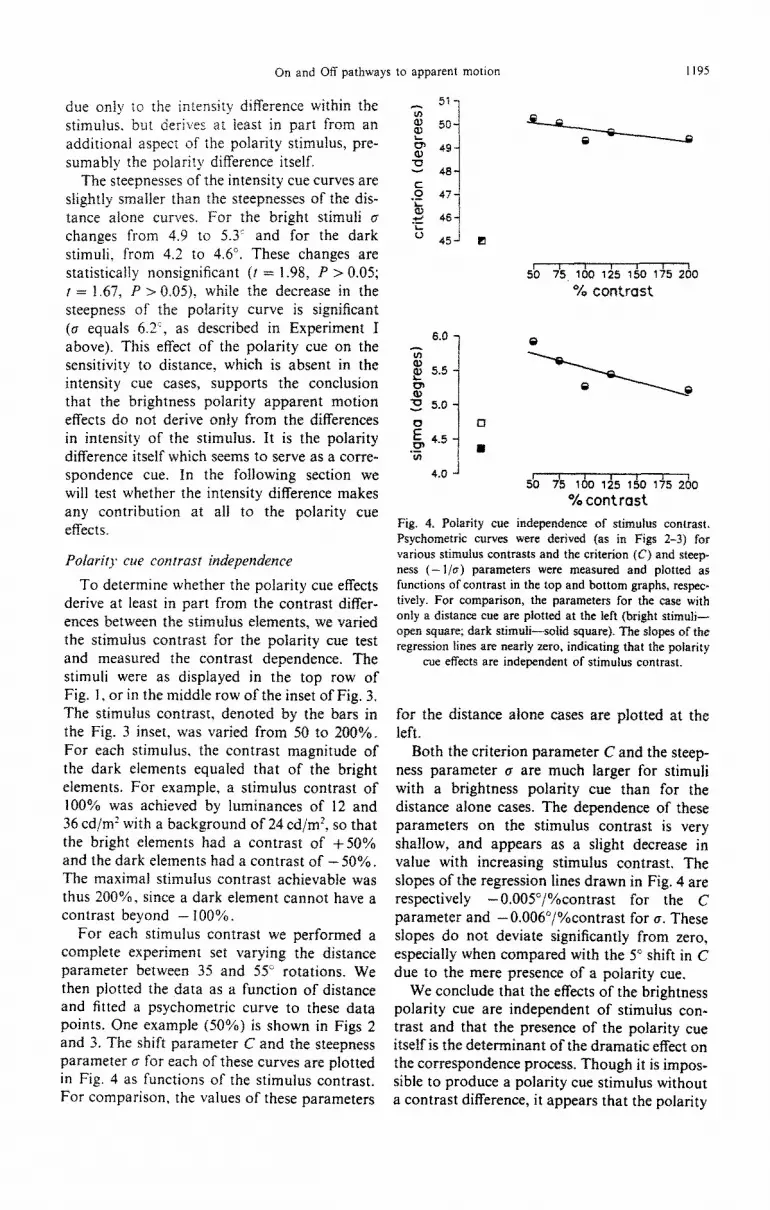
1, The VEP for decrements is greater than for increments, at all stimulus contrasts. This may be related to our finding that
when distance is the only correspon- dence cue, the dependence on distance is greater when using dark elements than when using bright elements (Fig. 2).
2. The difference between the increment and decrement VEP is nearly indepen- dent of contrast. This may be related to our finding that the polarity effect is nearly independent of the contrast of the two elements when their magnitudes are kept equal (Fig. 4).

On and Off pathways to apparent motion 1203
L a.0
5: 4.0 -
; 2.0 -
: l.O- 2
.Z z 0.5- E a
I I I I I I
4 a 16 32 64
Weber contrast (%)
Fig. 10. VEP contrast dependence. The amplitude of the
fundamental component of the visual evoked potentials is
plotted as a function of Weber contrast for one subject for
luminance decrements (solid symbols) and luminance incre-
ments (open symbols), reproduced from Zemon et al. (1988).
The patterned stimulus was a grid of 9’ checks whose
luminance was modulated sinusoidally at 6.3 Hz either
above the luminance of the static background (positive
contrast-luminance increments) or below it (negative con-
trast). Squares and circles represent data of different days.
Note that the response to decrements is greater than to
increments and that the increments contrast dependence is
somewhat steeper. See text for possible relationship of these
characteristics of the difference between the On and Of
pathway contributions to apparent motion.
3. The slope of the log VEP vs Contrast curve is greater for increments than for decrements, for most subjects. This may be related to our finding that when intensity is used as a correspondence cue in the absence of the polarity cue, the dependence of the criterion shift on contrast difference is somewhat greater for bright elements than for dark ele- ments (Fig. 5).
4. The difference between the increment and decrement VEP is enhanced by using a larger decrement contrast than increment contrast, and is diminished by using a larger increment contrast than decrement contrast. This may be related to our finding that when the magnitudes of the contrasts of the dark and bright elements in a polarity cue stimulus are unequal, there is an addi- tional effect due to this intensity differ- ence only when the contrast magnitude of the dark elements is greater than that of the bright elements (Fig. 6).
These correlations between psychophysics and VEP results suggest that the differences between the processing of bright and dark stim- uli may indeed derive from the differences be- tween the On and Off pathways. A more direct
comparison between physiology and psycho- physics calls for single neuron electrophysiolog- ical recording in the alert behaving monkey.
CONCLUSION
It has been suggested that the visual motion system is color blind. We have shown that the system does know the difference between black and white: though information is integrated from the On and Off pathways, the source of this information is not lost and a strong prefer- ence is shown for motion directions in which information is limited to a single pathway, and cross-pathway integration may be avoided. Finally, the On or Off pathway origin of the visual information is reflected also in its quanti- tative characteristics.
Acknowledgements-We thank Peter Hillman and Robert
M. Shapley for helpful discussions and comments through-
out the course of this study. We are grateful to V. Zemon,
J. Gordon and J. Welch for permission to reproduce their
VEP data figure here. This research was supported by grants
from the Israel Institute for Psychobiology-Charles E.
Smith Family Foundation and the U.S.-Israel Binational
Science Foundation (BSF).
REFERENCES
Anstis, S. M. (1970). Phi movement as a subtraction process.
Vision Research, IO, 141 I-1430. Anstis, S. M. (1980). The perception of apparent movement.
Philosophical Transactions of the Royal Society 08 London, B, 290, 153-168.
Anstis, S. M. (1986). Recovering motion information from
luminance. Vison Research, 26, 147-160. Anstis, S. M. & Mather, G. (1985). Effects of luminance and
contrast on direction of ambiguous apparent motion.
Perceprion, 14, 167-179.
Bergen, J. R. & Julesz, B. (1983). Parallel versus serial
processing in rapid pattern discrimination. Nature, Lon- don, 303, 696-698.
Braddick, 0. J. (1974). A short range process in apparent
motion. Vision Research, 14, 519-527. Braddick. 0. J. (1980). Low-level and high-level processes in
apparent motion. Philosophical Transactions of the Royal Society of London, B, 290, 137-I 51.
Burt, P. & Sperling, G. (1981). Time, distance and feature
trade-offs in visual apparent motion. Psychological Re- niew, 88, 171-195.
Chang, J. J. & Julesz, B. (1983). Displacement limits for
spatial frequency filtered random-dot cinematograms in
apparent motion. Vision Research, 23, 1379-l 385. De Valois, K. K. (1977). Independence of black and white:
Phase-specific adaptation. Vision Research. 17, 209-2 15. De Yoe, E. A. & Van Essen, D. C. (1988). Concurrent
processing streams in monkey visual cortex. Trends in Neuroscience. I I, 2 19-226.
Gelb, D. J. & Wilson, H. R. (1983). Shifts in perceived size
as a function of contrast and temporal modulation. Vision Research, 23, 7 I-82.
I204 S!MA SHECHTEK and SHALL HOCHSTW.
Georgeson. M. A. & Shackleton. T. M. (I%%;. Monocular
moimn sensinp. binocular motion perceptior:. ~e~wppiccw. Ii. Al!
Hammond. P. (1974). Cat retina! gancgilon ceils, Sue and
shape of receptwe field center:. ~o~tr-rw: o! pill .RO/O~~,V. 242% 99 ! 18.
l-lube]. D. H. 8: Wtesel. T. N. i 1961). lntegratlve actton in
the cat’s lateral genlculate bodl iowwr/ o/ P/~wo/og~. IS. 385-398.
Kuffler. S. W. (1953). Discharge patterns and functional
organization of mammahan retina. Jlournn/ of ,~europh~~.s-
iolog~,, 16. 37-68.
Kolers. P A. (1972). .4.specr.r o/ ~~~u//o~~ ,>c~re~,~~~~ Nea
York: Pergamon Press.
LIvingstone. M. S. & Hubel. D. H. (1987). Psychophysical
evidence for separate channels for the perception of form.
movement and depth. Jo~rn~~l of. .Neuroscience. 7.
34 16-3468.
Magnussen. S. & Glad, A. (1975). Brightness and darkness
enhancement during flicker: Perceptual correlates of
neuronal B- and D-systems in human vision. Esperimen- ial Brain Research. 22, 399413.
Marozas. D. S. & May. D. C. (1985). Effects of figure-
ground reversal on the visual-perceptual and visuo-motor
performances of cerebral palsied and normal children.
Percrprual and Motor Skills. 60. 591-598.
May, D. C. (1978). Effects of color reversal of figure and
ground drawing materials on drawing performance. E-Y- cepprronal Children, 44, 254-260.
Milkman. N.. Schick, G.. Rossetto M., Ratliff. F.. Shapley,
R. & Victor. J. (1980). A two dimensional computer-
controlled visual stimulator. Behavior Research Methods and Insrrumenration, 12. 283-292.
Mishkin, M.. Ungerleider. L. G. & Macko, K. A. (1983).
Object vision and spatial vision: Two cortical pathways.
Trends in Neuroscience. 6. 414-4 17.
Miiller. J. (I 833). Handboch de ph),siologie des menschenjur ~~orlesungen (Vol. 2). Coblenz: Holscher.
Nakayama. K. (I 985). Biological image motion processing:
A review. Vision Research, 25, 625-660. Nakayama. K. & Silverman. G. H. (1986). Serial and
parallel processing of visual feature conjunctions. Nature. London. 320, 264-265.
Navon. D. (I 976). Irrelevance of figural identity for resolv-
ing ambiguities in apparent motion. Journal of Esperi- mental Psj,chology, Human Perceplion and Performance, 2. 130-138.
Newsome W. T.. Mikami, A. & Wurtz, R. H. (1986).
Motion selectivity in Macaque visual cortex. III. Psycho-
physics and physiology of apparent motion. Journal Q” R’europh~~siolog~~, 55. I340- I35 1
ilamachandran. \- W. & Gregory. R. L. (1978). Does color
Shapley. R. & Rossetto, M. (1976). An electromc visual
provide an input to human motion perceptlon? t’cr/urtz. L/l,idO,7
stimulator. Behavior Research Methods and Instrumenra-
-775 55-56 . . Ramachandran. V. S.. Ginsburg. A. P. d Anstl,. S M
rion. 8. 15~.20.
I 19X3). Low spatial frequencies dominate apparent mo-
tlon Prrceprion. I? 457 -46 I Schlller. P. H. (1982). Central connections of the retmal On
and OK pathways. Sarure. London. -797. 580-583.
Shaple). R. (1986). The importance of contrast for the
activit) of single neurons. the VEP and perception I’r.cro,~
Re.wtrrA. 26. 45-6 I
Shechter. S. & Hochstein, S. (1989). Size, Flux and Lumi-
nance effects in the apparent motion correspondence
process. Vision Research, 29, 579-59 1. Shechter. S.. Hochstein. S. & Hillman, P. (1988).
Shape similarity and distance disparity as apparent
motion correspondence cues. Vision Research, 28. 1013-1021.
Treisman, A. & Gelade, G. (1980). A feature inte-
gration theory of attention. Cognitizre Psychology, 1.2, 97-136.
Uhlin, D. M. & Dickson, J. D. (1970). The effect of
figure-ground reversal in the H-T-P drawings of spastic
cerebral palsied children. Journal of Clinical Psychology, 26. 87-88.
Ullman, S. (1979). The inrerpretation of visual motion. Cambridge, Mass.: MIT Press.
Van Erning, L. J. Th. O., Gerrits, H. J. M. & Eijkman,
E. G. J. (1988). Apparent size and receptive field proper-
ties. Vision Research, 28. 407-418. Van Essen, D. & Maunsell, J. H. R. (1983). Hierarchical
organization and functional streams in the visual cortex.
Trends in Neuroscience, 6, 370-375. Weale, R. A. (1975). Apparent size and contrast. Vision
Research, 15, 949-955. Wertheimer. M. (1912). Experimentelle Studien uber das
Sehen von Bewegung. Zeirschrijr fur Psychologie. 61. 161-265.
Wiesel, T. N. (1960). Receptive fields of ganglion cells in the
cat’s retina. Journal of Physiology, 153? 583-594. Zeki. S. M. (1983). The distribution of wavelength and
orientation selective cells in different areas of monkey
visual cortex. Proceedings of the Royal Society of London, B. 217, 449470.
Zemon, V., Gordon, J. & Welch, J. (1988). Asymmetries in
On and OK visual pathways of human revealed using
contrast-evoked cortical potentials. Visual Neuroscience. 1. 145-150.