oil spill disasters detection and monitoring by rst analysis of optical satellite radiances: the...
TRANSCRIPT
A New RST-Based Approach for Continuous Oil Spill Detection in TIR Range:The Case of the Deepwater Horizon Platform in the Gulf of Mexico
C. S. L. Grimaldi ,1 I. Coviello,2 T. Lacava,1,2 N. Pergola,1,2 and V. Tramutoli1,2
1Department o(DIFA), Universit
2Institute of(IMAA), National
Monitoring and MA Record-BreakinGeophysical MonCopyright 2011 b10.1029/2011GM
Oil pollution is a threat that increasingly concerns marine/coastal ecosystem.Timely detection and continuous update of information are fundamental toreduce oil spill environmental impact. EOSs, especially meteorological satellites,can be profitably used for a near real time sea monitoring thanks to their hightemporal resolution and easy data delivery. In this paper, we present a newalgorithm, based on the general Robust Satellite Technique (RST) approach, forautomatic near-real-time oil spill detection and continuous monitoring (i.e., inboth daytime and nighttime) by using optical data. The new RST scheme hasbeen applied to the analysis of the recent oil spill disaster of the DeepwaterHorizon Platform in the Gulf of Mexico. In particular, a dense temporal series ofRST-based oil spill maps, obtained by using Moderate Resolution ImagingSpectroradiometer-thermal infrared records acquired in both daytime and night-time during the 25–29 April 2010 period, are shown and commented. The resultsseem to confirm the good performance of the proposed approach in automaticdetection of oil spill presence with a high level of reliability and sensitivity evenin nighttime acquisitions. These achievements confirm the potential of opticaldata for oil spill detection and monitoring, thus suggesting their use in combi-nation with radar acquisitions toward developing a multiplatform system that isable to furnish detailed and frequent information about oil spill presence anddynamics.
1. INTRODUCTION
Oil discharge is, nowadays, a serious threat to maritimeand coastal environments. In recent years, the exploitation ofmarine resources has strongly increased, and as a conse-quence, platform or tanker accidents have become more andmore frequent. The explosion of the Deepwater Horizon
f Engineering and Physics of the Environmenty of Basilicata, Potenza, Italy.Methodologies for Environmental AnalysisResearch Council, Tito Scalo, Italy.
odeling the Deepwater Horizon Oil Spill:g Enterpriseograph Series 195y the American Geophysical Union.001105
19
semisubmersible drilling platform in the Gulf of Mexico on20 April 2010 was a clear demonstration of the environmen-tal impact of such a technological hazard [Mitsch, 2010],which can also be directly caused by natural phenomena. Asan example, more than 17,000 barrels of crude oil werereleased into the Gulf of Mexico as a consequence of thepassage of the hurricanes Katrina and Rita over those areasduring 2005 [Hogarth, 2005; Pine, 2006; Cruz and Kraus-mann, 2008, 2009].Besides these huge events, the main causes of oil sea pol-
lution are operational discharges from tankers (i.e., oil dumpedduring cleaning operations; ITOPF, International Tanker Own-ers Pollution Federation Limited, 2010, Handbook 2010/2011,available from http://www.itopf.com/information-services/publications/documents/itopfhandbook2010.pdf). All thesephenomena can occur on a global scale with very differentdynamics: from few hours for small illicit discharges up to

20 NEW RST-BASED APPROACH FOR CONTINUOUS OIL SPILL DETECTION
few months for huge events. Such an extreme variabilityrequires efficient tools to monitor sea surface at an adequatespace-time scale.Thanks to global coverage and continuity of observations,
satellite remote sensing might contribute to the mitigation of oilspill environmental impact, provided that reliable and effectivedetection techniques are developed and that relevant informa-tion and products are timely delivered and made available.In this work, we focus more on data acquired by passive
optical sensors on board meteorological satellites. In fact,such systems may be used in combination with syntheticaperture radar (SAR) systems, which still represent the bestinstruments both for oil spill detection and monitoring [Liu etal., 2000; Brekke and Solberg, 2005; Kostianoy et al., 2006;Ferraro et al., 2007, 2010; Jha et al., 2008; Topouzelis,2008; Li and Li, 2010; Liu et al., 2010; Cheng et al., 2011;Zhang et al., 2011] mainly thanks to their all-weather and all-time capabilities [Fingas and Brown, 1997, 2000], togetherwith their high spatial resolution.Passive optical sensors on board meteorological satellites,
although potentially limited by cloud cover that prevents theEarth surface observation from space, are particularly usefulfor the study of such events. In fact, these systems are suitedfor offering timely detection and continuity of monitoring ofthe phenomena which require prompt reactions for a moreeffective damage mitigation. All this is possible thanks totheir global coverage, high temporal resolution (from severalhours to a few minutes, depending on the characteristics ofthe platform/sensor), together with a general quick and nocharge access to their data.Anyway oil spill detection by satellite optics requires suit-
able data analysis techniques. The few methods proposed upto now are only able to manually and interactively localize thepresence of an already known oil spill, often requiring theintervention of an expert operator. In particular, techniquesbased on thermal infrared (TIR) records [Cross, 1992; Tsengand Chiu, 1994; Borzelli et al., 1996] exploit oil and seawaterdifferent thermal inertia to map oil spill. Oil thermal inertia, infact, is lower than that of seawater. Thus, oil-polluted areaschange their temperature faster than seawater [Fingas andBrown, 1997, 2000]; they appear warmer than seawater indaytime images and colder in nighttime acquisitions. Otheroptical techniques exploit the different reflectance of the twoelements (e.g., oil and seawater) in the visible (VIS) andnear infrared (NIR) regions of the electromagnetic spectrumthat may occur in particular observing conditions. Theoil identification in this range is disadvantaged by the non-univocal spectral signature that may change depending onseveral factors as, for example, sun/satellite geometry, seasurface roughness and oil thickness. As a consequence, oilspill often shows an ambiguous behavior in VIS and NIR
bands, appearing less or more reflecting than the seawater[Otremba and Piskozub, 2001, 2003; Hu et al., 2003]. All ofthese techniques [Hu et al., 2003, 2009; Howari, 2004; Shi etal., 2007; Chust and Sagarminaga, 2007; Dessì et al., 2008;Adamo et al., 2009] are applied only off-line after an alert,when the event is already displayed, and the damages are notrecoverable. Moreover, they require the supervision and expe-rience of an operator.The integration of both methodologies (i.e., active and
passive) is what might guarantee the best results. A series ofattempts in this direction have been made over the last fewyears in the framework of different international projects(e.g., PRogetto pilota Inquinamento Marino da Idrocarburi(PRIMI), Chemical Effluent and Oil Pollution Alert (CLEO-PATRA), Cyprus Coastal Ocean Forecasting and ObservingSystem (CYCOFOS), etc). As an example, the PRIMI proj-ect, funded by the Italian Space Agency, is aimed to developa system for oil slick detection by utilizing concurrent multi-platform satellite measurements. The satellite sensor suiteused includes SAR and optical data, ensuring a frequentrevisit time of any Mediterranean Sea area. Regarding theoptical data, Moderate Resolution Imaging Spectroradi-ometer (MODIS) and Medium-Resolution Imaging Spec-trometer (MERIS) reflectance imagery are investigated inorder to intercept oil spill features by a two-step supervisedclassification, which take into account several parametersdevised and tested on a number of certified and known oilslicks (PRIMI oil spills database) [Nirchio et al., 2010].Unfortunately, the population of the PRIMI oil spill databaseis not complete and does not include all the possible oil spillfeatures. Moreover, such an approach requires an operator’ssupervision and cannot be fully implemented automatically.Most recently, an innovative technique for an automatic oil
spill detection and monitoring in near real time using diurnaldata, based on the general Robust Satellite Techniques (RST)approach [Tramutoli, 2005, 2007], originally applied to ad-vanced very high resolution radiometer (AVHRR) data andso named robust AVHRR technique (RAT) [Tramutoli,1998], has been proposed. Such technique allows us toautomatically detect the presence of oil spill over the seasurface, simultaneously minimizing the “false-positive” re-lated to presence over the sea surface of objects which havean oil spill similar spectral behavior. In its first configuration,TIR data acquired by NOAA-AVHRR both in channels 4 and5 (respectively, 10.3–11.3 and 11.5–12.5 μm) have been used[Casciello et al., 2007a, 2007b, 2011; Grimaldi et al., 2011]in order to detect oil spill presence. Despite its moderate/coarse spatial resolution (1 km at nadir) in this range,AVHRR has demonstrated good performances in the contextof a near real time oil spill disaster monitoring system.Thanks to its intrinsic exportability (it is based only on

GRIMALDI ET AL. 21
satellite data), RST approach has been applied also by usingMODIS data [Grimaldi et al., 2009a, 2009b] in channel 31and 32 (respectively, 10.78–11.28 and 11.77–12.27 μm)showing similar results. In this way, the short revisiting timeof the NOAA and EOS satellite constellations (less than 6 hfor AVHRR and 3–9 h for MODIS) has been further reducedby the combined use of AVHRR and MODIS sensors (up to1 h), incrementing sea surface sample rate.Up to now, the RST approach, as well as most of the
traditional TIR techniques, has been applied only in day-time acquisitions. Clouds do not produce perturbing effectsin these data, due to an inverse spectral response to the oilone (i.e., clouds are cold, oil is warm). In addition, thethermal contrast between oil and seawater is quite evident[Casciello et al., 2011]. During nighttime acquisitions, boththose statements are no longer confirmed. Oil and cloudsusually appear as cold objects on the sea surface, and thetemperature contrast between sea surface and oil (like theone between sea and land) is small, and it is more difficultto identify.In this paper, an advanced version of RST approach spe-
cifically devoted to obtain a reliable oil spill detection alsoduring nighttime acquisitions (e.g., when oil is colder thanwater) is proposed for the first time. In particular, resultsachieved by implementing such a new methodology basedon a “split-window” approach using MODIS data will bepresented. This approach has been applied for the first time to
Figure 1. (a) Deepwater platform location. (b) Cumulative maelaborated by NOAA Office of Response and Restoration, Nabook_shelf/1884_cumlative4_29_trajectories.pdf).
the recent oil spill event that occurred on 20 April 2010 in theGulf of Mexico. This event is particularly interesting becauseoil presents, in this case, a behavior in daytime acquisitionssimilar to nighttime acquisitions (i.e., oil temperature lowerthan the surrounding seawater). In this way, this new ap-proach was able to investigate oil spill presence also indaytime acquisitions for this particular case. Present advan-tages, limits, and possible further improvements of the pro-posed approach will also be proposed and discussed.
2. THE TEST CAST: DEEPWATER HORIZON OIL SPILL
The Deepwater Horizon oil spill (also known as the Gulfof Mexico Oil Spill) is one of the largest marine episodes inhistory. It was caused by an explosion on the DeepwaterHorizon offshore oil platform about 80 km southeast of theMississippi River delta on 20 April 2010 (28.74°N, 88.39°W,Figure 1a). The Deepwater Horizon sank on 22 April, and anestimated 780.000 m3 (206 million gallons or 4.9 millionbarrels) of crude oil, in a period of 86 days, gushed out fromthe 1500 m pipe that connects the well at the ocean floor tothe drilling platform on the surface [Kerr et al., 2010]. Thespill became an ever-changing footprint, expanding to anarea of over several hundred kilometers squared (Figure1b) and leading to the shutdown of fishing in May 2010 of118,000 km2 of the Gulf by the U.S. government. The wellwas finally capped on 15 July [Mitsch, 2010].
p of approximate oil spill location from 25 to 30 April 2010tional Ocean Service (http://response.restoration.noaa.gov/

22 NEW RST-BASED APPROACH FOR CONTINUOUS OIL SPILL DETECTION
3. OIL SPILL CHARACTERISTICS IN TIR RANGE
As mentioned above, the capability to discriminate thepresence of oil at sea in TIR channels is mainly related tocontrast effects in thermally emitted radiances (measured inbrightness temperatures (BTs)) due to the different thermalinertia of oil and seawater. Oil, in fact, has a lower thermalinertia compared to seawater and therefore assumes higherBT values in the daytime acquisitions than the surroundingsea, while the opposite occurs at night [Cross, 1992; Borzelliet al., 1996; Fingas and Brown, 1997, 2000].Nighttime detection of oil spills is more difficult not only
because oil-water temperature contrast (in absolute terms) islower than in daytime condition, but also because clouds, likeoil, exhibit lower BT values than sea. Moreover, cloud detec-tion algorithms may fail in effectively identifying cloud edges,which can be easily mistaken for polluted areas when using oilspill detection methods based on this thermal signature.In Figure 2, the MODIS channel 31 image of 27 April
2011 at 07:40 UT (01:40 LT) is plotted. In this image, theDeepwater Horizon oil spill is evident as well as the presenceof several clouds in the scene. A BT profile crossing oil spilland clouds is shown in Figure 2b: note as both oil and cloudsshow lower thermal values than sea surface. In order todiscriminate clouds from oil-polluted areas and clean seawa-ter, a different approach should be considered.According to Salisbury et al. [1993], it is possible to
recognize crude oil, as it exhibits a particular spectral behav-ior in the TIR region, which makes it possible to discriminateoil not only from clean water but also from meteorologicalclouds. In fact, from laboratory measurements [e.g., Salisburyet al., 1993], it is possible to see that the difference of spectral
Figure 2. (a) Gulf of Mexico MODIS image of 27 April 2010 aLand is masked in black. In the outlined box a magnified imagis traced in Figure 2a, and (b) the corresponding BT values ar
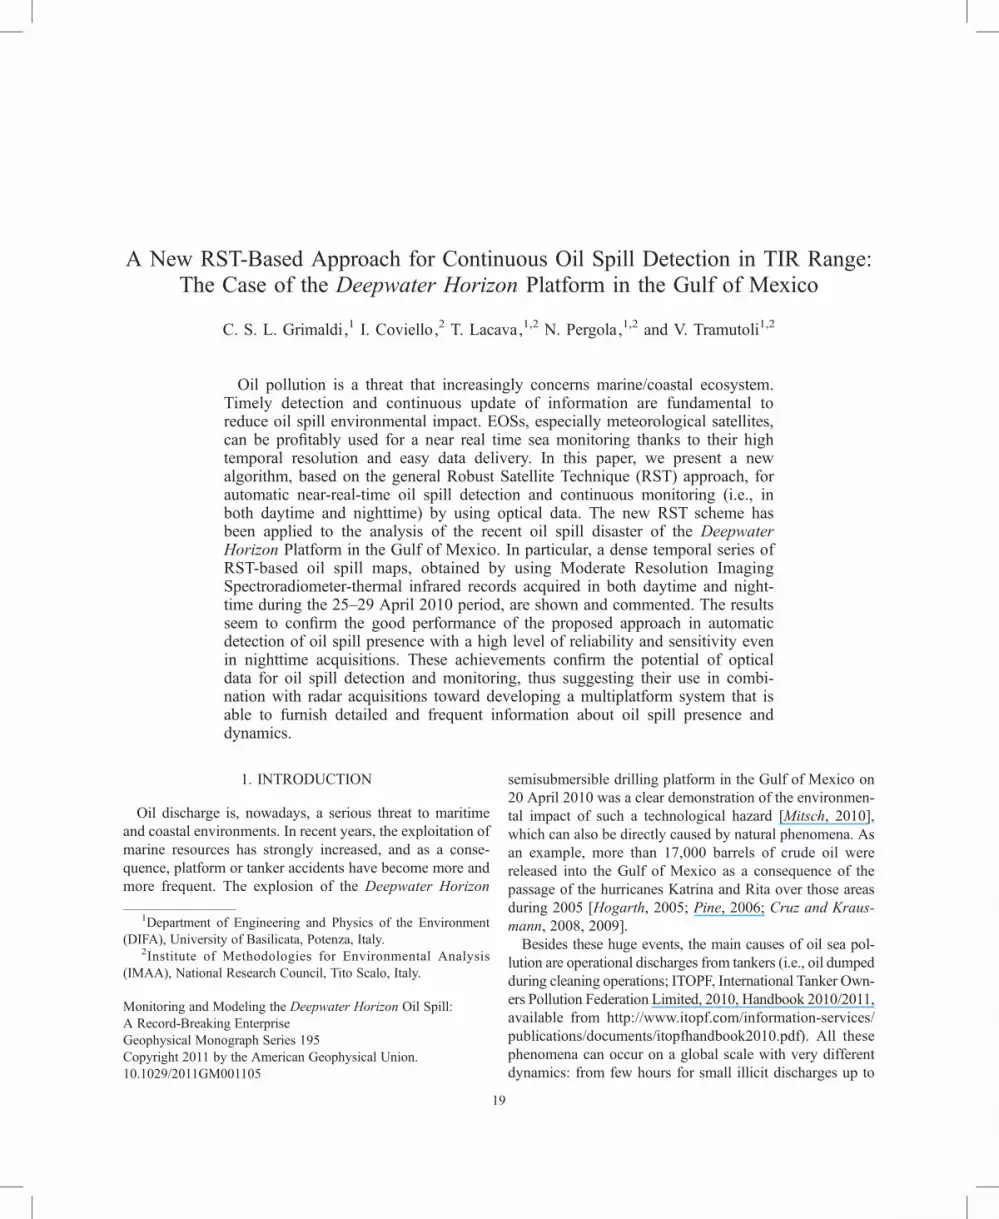
emissivity (around 11 and 12 μm) Δe = e11 � e12, assumessignificantly different values which increase quickly as mov-ing from oil-polluted water to clean seawater. As a conse-quence, higher differences ΔT = T11 � T12 are expected incorrespondence of BT measurements performed usingMODIS channel 31 (T11) and 32 (T12) over clean seawatercompared with those performed over an oil-polluted area. Inturn, such a difference results in lower measurements overclean water than the one observed in correspondence ofmeteorological clouds (as a consequence of the higher watervapor absorption at 12 μm than at 11 μm channels [Ackermanet al., 1998]). So ΔT oil < ΔTwater < ΔT clouds is quite evident inFigure 3, where the image difference of Ch31 and Ch32 of thesame MODIS acquisition, already shown in Figure 2, isplotted. It has to be stressed that such a peculiar behaviorprevents us from a possible false identification arising froman imperfect masking of clouds. These, in fact, show aninverse behavior to oil on nighttime imagery when the splitwindow signal (i.e., ΔT ) is considered. Hence, the impact ofproblems due to both the specific cloud detection schemeused and the residual cloud edges not well discriminated isintrinsically reduced when such a signal is taken into account.
4. METHODOLOGY
The proposed methodology for automatic and timely oil spilldetection and mapping is based on the general RST approach[Tramutoli, 2005, 2007]. Briefly, such a methodology identifiessignal anomalies as a deviation from unperturbed conditions,taking into account also its natural statistical fluctuations. Such“unperturbed” conditions are identified by analyzing a homo-geneous, multiyear, data set of colocated satellite images,
t 07:40 UT (01:40 LT), channel 31 (11 mm), satellite Aqua.e of the probable oil spill–affected area is shown. A transecte shown.
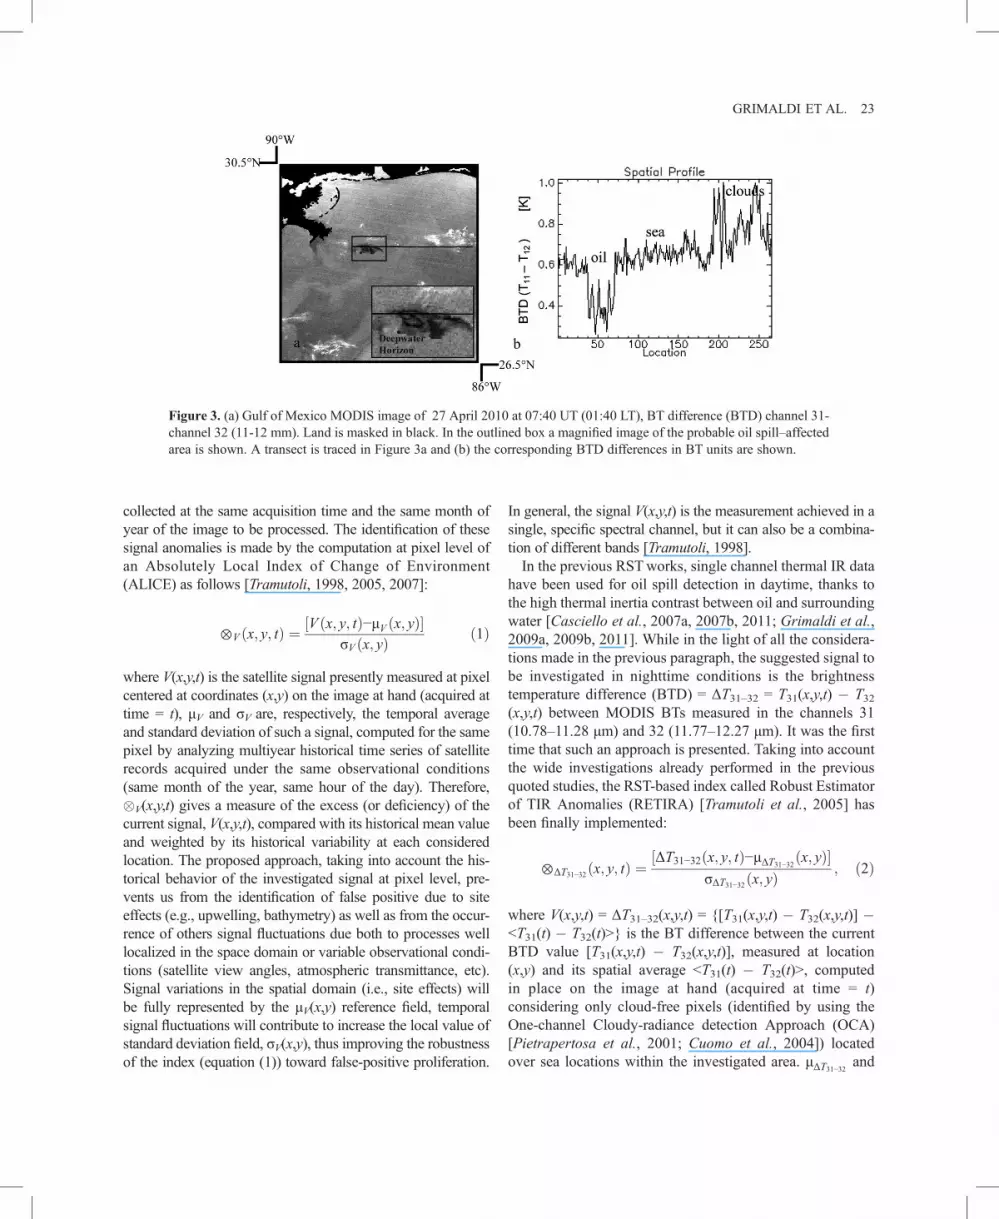
Figure 3. (a) Gulf of Mexico MODIS image of 27 April 2010 at 07:40 UT (01:40 LT), BT difference (BTD) channel 31-channel 32 (11-12 mm). Land is masked in black. In the outlined box a magnified image of the probable oil spill–affectedarea is shown. A transect is traced in Figure 3a and (b) the corresponding BTD differences in BT units are shown.
GRIMALDI ET AL. 23
collected at the same acquisition time and the same month ofyear of the image to be processed. The identification of thesesignal anomalies is made by the computation at pixel level ofan Absolutely Local Index of Change of Environment(ALICE) as follows [Tramutoli, 1998, 2005, 2007]:
⊗V ðx; y; tÞ ¼ ½V ðx; y; tÞ−μV ðx; yÞ�σV ðx; yÞ ð1Þ
where V(x,y,t) is the satellite signal presently measured at pixelcentered at coordinates (x,y) on the image at hand (acquired attime = t), μV and σV are, respectively, the temporal averageand standard deviation of such a signal, computed for the samepixel by analyzing multiyear historical time series of satelliterecords acquired under the same observational conditions(same month of the year, same hour of the day). Therefore,�V(x,y,t) gives a measure of the excess (or deficiency) of thecurrent signal, V(x,y,t), compared with its historical mean valueand weighted by its historical variability at each consideredlocation. The proposed approach, taking into account the his-torical behavior of the investigated signal at pixel level, pre-vents us from the identification of false positive due to siteeffects (e.g., upwelling, bathymetry) as well as from the occur-rence of others signal fluctuations due both to processes welllocalized in the space domain or variable observational condi-tions (satellite view angles, atmospheric transmittance, etc).Signal variations in the spatial domain (i.e., site effects) willbe fully represented by the μV(x,y) reference field, temporalsignal fluctuations will contribute to increase the local value ofstandard deviation field, σV(x,y), thus improving the robustnessof the index (equation (1)) toward false-positive proliferation.
In general, the signal V(x,y,t) is the measurement achieved in asingle, specific spectral channel, but it can also be a combina-tion of different bands [Tramutoli, 1998].In the previous RSTworks, single channel thermal IR data
have been used for oil spill detection in daytime, thanks tothe high thermal inertia contrast between oil and surroundingwater [Casciello et al., 2007a, 2007b, 2011; Grimaldi et al.,2009a, 2009b, 2011]. While in the light of all the considera-tions made in the previous paragraph, the suggested signal tobe investigated in nighttime conditions is the brightnesstemperature difference (BTD) = ΔT31–32 = T31(x,y,t) � T32(x,y,t) between MODIS BTs measured in the channels 31(10.78–11.28 μm) and 32 (11.77–12.27 μm). It was the firsttime that such an approach is presented. Taking into accountthe wide investigations already performed in the previousquoted studies, the RST-based index called Robust Estimatorof TIR Anomalies (RETIRA) [Tramutoli et al., 2005] hasbeen finally implemented:
⊗ΔT31−32ðx; y; tÞ ¼½ΔT31−32ðx; y; tÞ−μΔT31−32ðx; yÞ�
σΔT31−32ðx; yÞ; ð2Þ
where V(x,y,t) = ΔT31–32(x,y,t) = {[T31(x,y,t) � T32(x,y,t)] �<T31(t) � T32(t)>} is the BT difference between the currentBTD value [T31(x,y,t) � T32(x,y,t)], measured at location(x,y) and its spatial average <T31(t) � T32(t)>, computedin place on the image at hand (acquired at time = t)considering only cloud-free pixels (identified by using theOne-channel Cloudy-radiance detection Approach (OCA)[Pietrapertosa et al., 2001; Cuomo et al., 2004]) locatedover sea locations within the investigated area. μΔT31−32 and

Table 1. Analyzed MODIS Images
Day Time
25 Apr 2010 17:15 UT (11:15 LT)25 Apr 2010 18:55 UT (12:55 LT)26 Apr 2010 04:15 UT (22:15 LT)26 Apr 2010 19:35 UT (13:35 LT)27 Apr 2010 03:20 UT (21:20 LT)27 Apr 2010 07:40 UT (01:40 LT)29 Apr 2010 07:30 UT (01:30 LT)29 Apr 2010 16:55 UT (10:55 LT)
24 NEW RST-BASED APPROACH FOR CONTINUOUS OIL SPILL DETECTION
σΔT31−32 are, respectively, the temporal average and standarddeviation of such a signal, computed for the same pixel byanalyzing multiyear historical time series of satellite recordsacquired under the same observational conditions (samemonth of the year, same hour of the day). Besides the otherintrinsic advantages of RST methodology already reportedabove [Tramutoli, 2005, 2007], such a contextual approachprevents us from coming across potential problems relatedto year-to-year changes of the signal and/or seasonal timedrifts, which usually affect near surface temperatures on aregional scale. In this context, considering that ΔT31–32
oil
Figure 4. (top) MODIS channel 31 (11 mm) images (left) oneLT) and (right) one acquired in nighttime on 26 April 2010 at 0of oil spill–affected area is shown. Land is masked in black; cltransects depicted in the images on the top.
< ΔT31–32water < ΔT31–32
clouds, we expect: (1) the lowest andnegative values of ⊗ΔT31−32 (x,y,t) in correspondence of oilspill-affected areas; (2) no influence due to the presence ofclouds over the investigated area.
5. IMPLEMENTATION
Starting from 25 April (the first image where oil spillpresence was evident), 22 MODIS images covering the areamainly affected by the presence of the spill were available,among these, 8 were identified as cloud-free. Table 1 reportsthe list of these last images.A preliminary consideration arises from the analysis of this
list: eight clear MODIS acquisitions of the oil slick are avail-able over a period of 5 days. Only a sensor aboard meteoro-logical satellites, like MODIS, can guarantee at the moment(used alone) such a revisiting routine time. This is a firstrelevant outcome of the present work, which confirms thepotential of meteorological satellites in furnishing timely infor-mation about a phenomenon in progress on the Earth’s surface.Before fully implementing the proposed methodology to
analyze the Deepwater Horizon oil spill, a preliminary in-vestigation of the thermal oil behavior in the MODIS images
acquired in daytime on 25 April 2010 at 17:15 UT (11:154:15 UT (22:15 LT). In the outlined box a magnified imageouds are masked in light gray. (bottom) BT profile along the
able 2. Robust Satellite Technique Results in Numbers
ODIS ImageDetection for
Sure (S/N Level)Max S/NValue
Number of OilSpill Pixels
5 Apr 2010 17:15UT (11:15 LT)
�4 �7.8 312
5 Apr 2010 18:55UT (12:55 LT)
�3 �5.6 150
6 Apr 2010 04:15UT (22:15 LT)
�5 �6.2 59
6 Apr 2010 19:35UT (13:35 LT)
�3 �5.8 353
7 Apr 2010 03:20UT (21:20 LT)
�4 �6.2 172
7 Apr 2010 07:40UT (01:40 LT)
�3 �4.1 78
9 Apr 2010 07:30UT (01:30 LT)
�3 �5.9 835
9 Apr 2010 16:55UT (10:55 LT)
�3.5 �5.5 51
GRIMALDI ET AL. 25
acquired during April 2010 has been performed. As alreadydiscussed in section 3, we expect to measure higher BTvalues during daytime in correspondence of oil spill-affectedpixels with respect to those affected by clean seawater (theopposite at night). Looking at Figure 4 where, as an example,one daytime and nighttime MODIS acquisitions are plotted,respectively, we can observe that this behavior is no longerconfirmed. For this event, in fact, oil presents lower BTvalues than the surrounding seawater both in daytime andnighttime, as it can be seen to be better looking at the BTprofile reported in the same figure. This circumstance, whichis present in all the images of the events (not shown for sakeof brevity) is probably related to the great depth (1500 m)from which the oil comes. At that depth, temperatures aretypically around 4°C [Forrest et al., 2005], so during theconsidered days of the event, there was a continuous flow ofcold oil which reached sea surface producing such an effect.For this reason, we decided to implement the same scheme,based on the BTD signature, for both daytime and nighttimeacquisitions.For the computation of nighttime and daytime reference
fields, a historical data set of all MODIS images (collectedboth from Terra and Aqua) available in a temporal range of8 years, from 2003 to 2010, covering the studied region,during the month of April and in the same temporal range(03:30–07:30 UT for nighttime data set and 15:30–19:30 fordaytime data set; LT = GMT-6), was processed. An area ofinterest (AOI) of 400 � 400 pixels was extracted from eachsatellite scene and re-projected in the same geographic pro-jection (Lat-Lon-WGS84). The AOI is centered at 28.5°latitude N, 88° longitude W. Temporal average (μΔT31−32) andstandard deviation (σΔT31−32) of nighttime and daytime refer-ence fields were computed on this area using the above-constructed data sets for MODIS TIR difference channels31–32 considering only cloud-free records identified by usingthe OCA [Pietrapertosa et al., 2001; Cuomo et al., 2004]. Indetail, we used historical series of MODIS channel 32 imagescovering the AOI to preliminarily define normal thermalconditions to be compared to identify clouds. It has to bestressed that collecting within the same temporal slot dataacquired both from Aqua and Terra can generate an increasein the measured natural variability (i.e., standard deviationreference field). On the other hand, this makes the approachmore robust with respect to the detection of false positive,reducing the potential impact arising from calibration differ-ence between the sensors aboard the two satellites. Therefore,the above-defined index has been computed and applied, atpixel level, for all the cloud-free MODIS records acquiredsince the beginning of the event until the end of the month ofApril. As mentioned above, eight images in day and night-time have been investigated in this short temporal range.
6. RESULTS
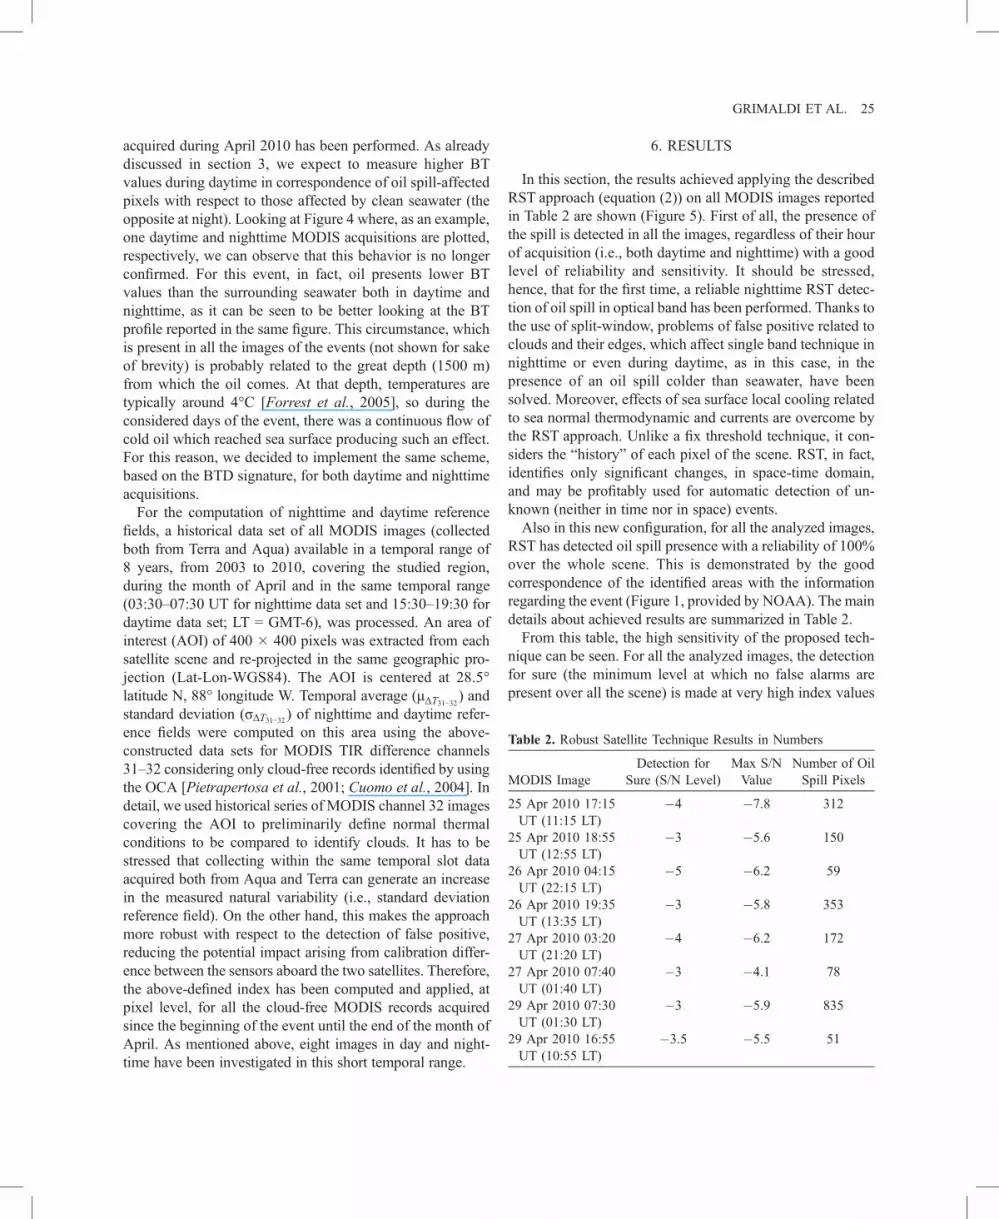
In this section, the results achieved applying the describedRST approach (equation (2)) on all MODIS images reportedin Table 2 are shown (Figure 5). First of all, the presence ofthe spill is detected in all the images, regardless of their hourof acquisition (i.e., both daytime and nighttime) with a goodlevel of reliability and sensitivity. It should be stressed,hence, that for the first time, a reliable nighttime RST detec-tion of oil spill in optical band has been performed. Thanks tothe use of split-window, problems of false positive related toclouds and their edges, which affect single band technique innighttime or even during daytime, as in this case, in thepresence of an oil spill colder than seawater, have beensolved. Moreover, effects of sea surface local cooling relatedto sea normal thermodynamic and currents are overcome bythe RST approach. Unlike a fix threshold technique, it con-siders the “history” of each pixel of the scene. RST, in fact,identifies only significant changes, in space-time domain,and may be profitably used for automatic detection of un-known (neither in time nor in space) events.Also in this new configuration, for all the analyzed images,
RST has detected oil spill presence with a reliability of 100%over the whole scene. This is demonstrated by the goodcorrespondence of the identified areas with the informationregarding the event (Figure 1, provided by NOAA). The maindetails about achieved results are summarized in Table 2.From this table, the high sensitivity of the proposed tech-
nique can be seen. For all the analyzed images, the detectionfor sure (the minimum level at which no false alarms arepresent over all the scene) is made at very high index values
T
M
2
2
2
2
2
2
2
2
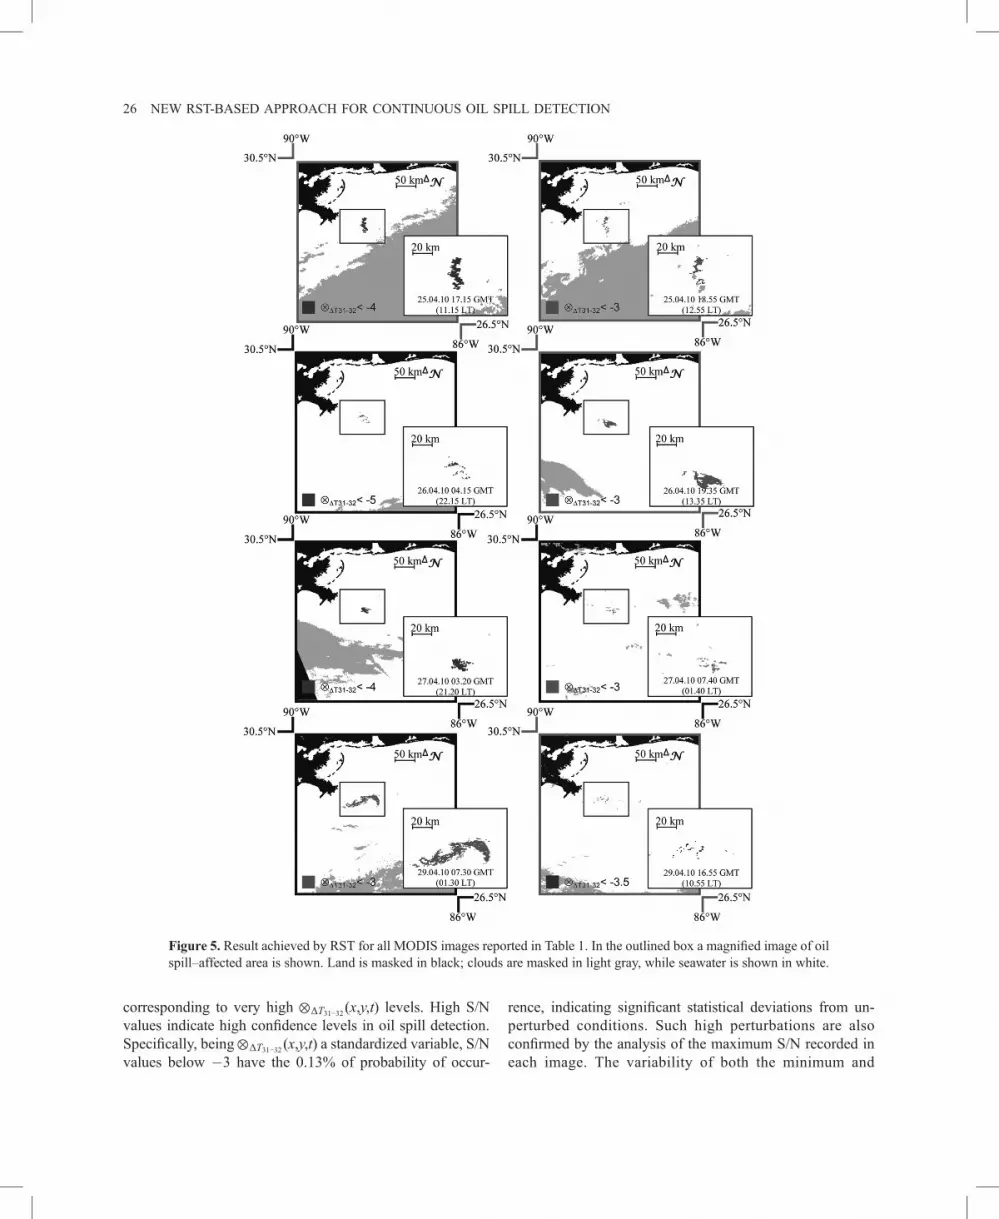
Figure 5. Result achieved by RST for all MODIS images reported in Table 1. In the outlined box a magnified image of oilspill–affected area is shown. Land is masked in black; clouds are masked in light gray, while seawater is shown in white.
26 NEW RST-BASED APPROACH FOR CONTINUOUS OIL SPILL DETECTION
corresponding to very high ⊗ΔT31−32 (x,y,t) levels. High S/Nvalues indicate high confidence levels in oil spill detection.Specifically, being⊗ΔT31−32 (x,y,t) a standardized variable, S/Nvalues below �3 have the 0.13% of probability of occur-
rence, indicating significant statistical deviations from un-perturbed conditions. Such high perturbations are alsoconfirmed by the analysis of the maximum S/N recorded ineach image. The variability of both the minimum and
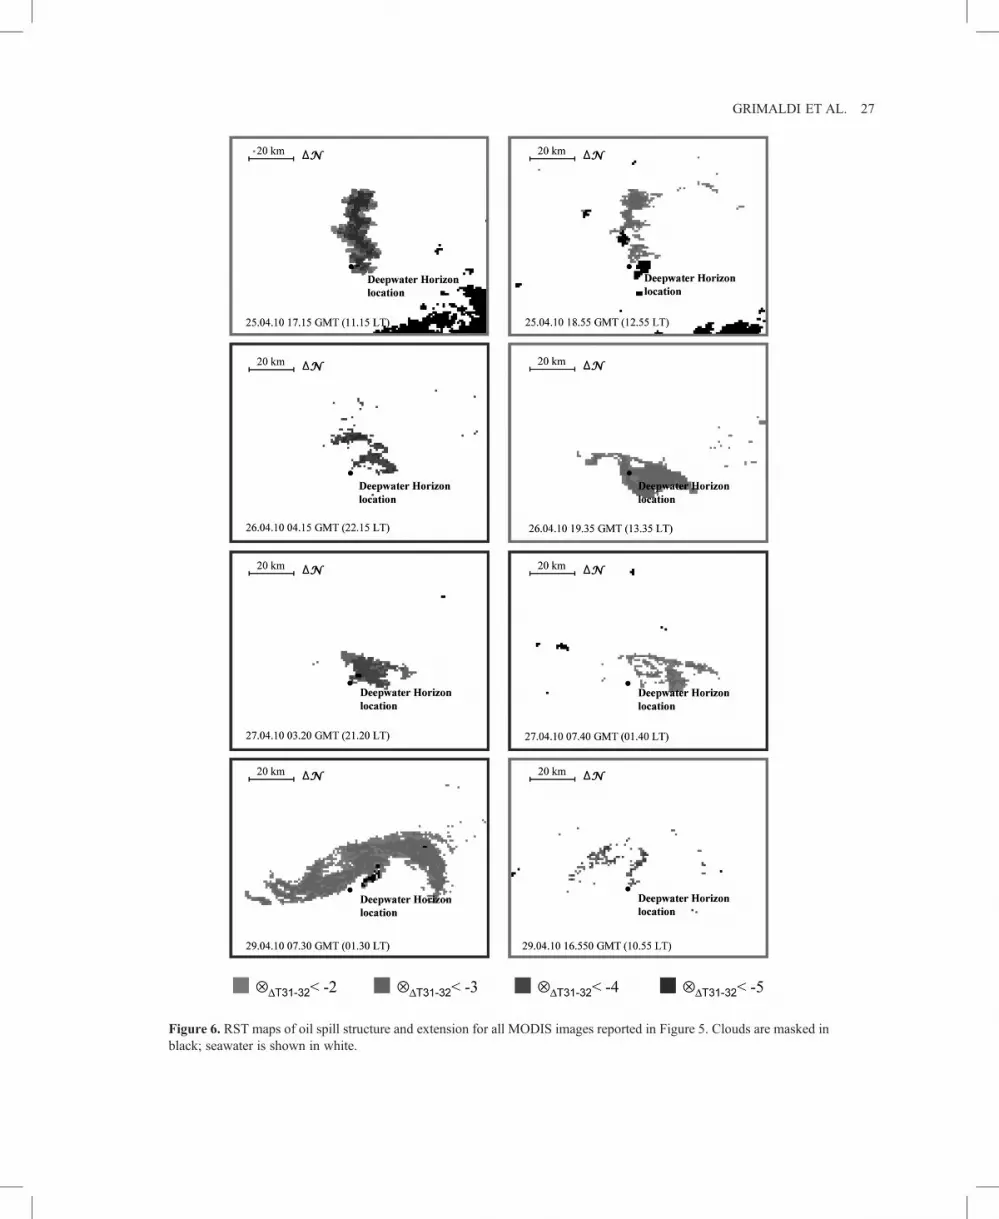
Figure 6. RST maps of oil spill structure and extension for all MODIS images reported in Figure 5. Clouds are masked inblack; seawater is shown in white.
GRIMALDI ET AL. 27

Figure 7. RST confutation maps. The technique has been applied on MODIS images a week before the event. No falsepositive identifications are present. Land is masked in black; cloudy pixels and no data are reported in light grey; seawateris shown in white.

GRIMALDI ET AL. 29
maximum S/N levels, as well as of the number of oil spill-detected pixels, is justifiable for several reasons. Mainly,the peculiar nature of the oil source, which did not assurea constant flux of oil, produced an extreme variability atthe sea surface. In addition, the effects of the efforts devotedto contain, dilute, and disperse the oil have to be takeninto account [Mitsch, 2010]. Finally, the observational con-ditions at which MODIS images were acquired have to beconsidered: cloud presence, wind speed, off-nadir acquisi-tion, etc.Another useful characteristic offered by RST is the possi-
bility to zoom on the areas detected “for sure” at higher indexvalues to perform subsequently a more detailed mapping ofthe slick, investigating spatial distribution of signal anoma-lies with lower intensities associated to oil of different thick-nesses/sizes and/or at different levels of emulsion in seawater[Casciello et al., 2011;Grimaldi et al., 2011]. Maps achievedby RST for the analyzed oil spill event are shown in Figure 6.These maps give a better slick description both in its shape/extent than in its structure. Besides evident correspondencewith NOAA reports (Figure 1), correspondences with inde-pendent observations and trajectories forecasts reported byLiu et al. [this volume] in another chapter of this book arealso quite evident. To demonstrate the robustness of theachieved results, a confutation analysis has been performedon the MODIS images acquired during the week before theDeepwater Horizon (DWH) accident, looking for signalanomalies around the platform (Figure 7). The absence ofsignificant anomalies (at least with S/N <�3) in an unper-turbed situation confirms the reliability of our methodology.Finally, these results highlight the reliability of the RST
approach and, overall, its capability to identify oil spillpresence with a high level of sensitivity. Moreover, it shouldbe noted that RST technique does not need an operator,automatically generating oil spill maps by means of a com-plete unsupervised processing scheme.
7. CONCLUSION
The explosion of the Deepwater Horizon Platform thatoccurred on April 2010 in the Gulf of Mexico has causedthe release of a huge quantity of oil for about 3 months,turning the affected areas into a big laboratory to test existingtechniques and to implement new ones. In this paper, animprovement of a RST-based technique for oil spill detectionand monitoring by means of TIR MODIS bands is presented.In particular, the new RST configuration here presented forthe first time, based on the use of the TIR split windowMODIS channels 31 and 32, has allowed us to perform areliable oil spill detection even during nighttime acquisition.In fact, the use of the BTD signature, within the RST scheme
enabled to overcome possible false-positive problems relatedto not well-recognized cloud edges and sea surface localcooling effects that often reduce the reliability of the retrieval.Moreover, as for this particular event, oil coming from adepth of 1500 m was colder than seawater both in daytimeand nighttime; it was possible to apply this new RST im-provement also for daytime acquisitions. Consequently,thanks to the high MODIS temporal resolution, a densetemporal series of RST-based oil spill maps obtained both indaytime and nighttime have been analyzed.Additionally, this study has demonstrated that the pro-
posed technique, also in this new configuration, is able todetect oil spill presence with a reliability of 100% (no falsealarms) and with high S/N levels (up to⊗ΔT31−32 <�5) for allthe analyzed images. The presence of high relative anomalyvalues also enabled us to investigate the spatial distributionof signal anomalies at lower intensities for a more detailedmapping of oil slick structure and extent. These maps giveimportant information on the time evolution of oil thicknessand position.The achieved results need to be confirmed by analyzing
further events characterized by different intensity and obser-vational conditions in order to confirm that the proposedstrategy could be generalized. However, such preliminaryachievements seem to indicate the good potential of thisapproach to detect and monitor in continuity (nighttime anddaytime) oil spill presence on the sea. The main limits of theproposed technique, like all those based on optical data, arerelated to clouds, which may mask the sea surface completely,hampering oil spill detection. In addition, a very low thermalcontrast between oil and sea surface might reduce the sensi-tivity of the proposed approach.Considering that such an approach, for its nature, is intrin-
sically exportable on every satellite sensor assuring the ther-mal split window channels (i.e., AVHRR), its potential for acontinuous monitoring might be further increased (up to 3 hof temporal resolution) by coupling different satellite sys-tems (e.g., AVHRR + MODIS). Such a dense flux of infor-mation, together with detailed spatial information providedby SAR systems, may be profitably integrated during theemergency phases to support monitoring and disaster miti-gation actions as well as to feed models predicting the oilslick evolution.
REFERENCES
Ackerman, S. A., K. I. Strabala, W. P. Menzel, R. A. Frey, C. C.Moeller, and L. E. Gumley (1998), Discriminating clear-sky fromclouds with MODIS, J. Geophys. Res., 103, 32,141–32,158.
Adamo, M., G. De Carolis, V. De Pasquale, and G. Pasquariello(2009), Detection and tracking of oil slicks on sun-glittered

Bo
Br
Ca
Ca
Ca
Ch
Ch
Cr
Cr
Cr
Cu
D
Fe
Fe
Fi
Fi
Fo
G
G
G
H
H
H
H
Jh
K
K
30 NEW RST-BASED APPROACH FOR CONTINUOUS OIL SPILL DETECTION
visible and near infrared satellite imagery, Int. J. Remote Sens., 30(24), 6403–6427, doi:10.1080/01431160902865772.rzelli, G., C. Ulivieri, A. Ciappa, G. Antonelli, and G. Laneve(1996), A new perspective on oil slick detection from space byNOAA satellites, Int. J. Remote Sens., 17(7), 1279–1292.ekke, C., and A. H. S. Solberg (2005), Review on oil spill detectionby satellite remote sensing, Remote Sens. Environ., 95, 1–13.sciello, D., T. Lacava, N. Pergola, and V. Tramutoli (2007a), RobustSatellite Techniques (RST) for oil spill detection and monitoring,paper presented at Fourth International Workshop on the Analysisof Multitemporal Remote Sensing Images, MultiTemp 2007, Leu-ven, Belgium, doi:10.1109/MULTITEMP.2007.4293040.sciello, D., C. S. L. Grimaldi, I. Coviello, T. Lacava, N. Pergola,and V. Tramutoli (2007b), A Robust Satellite Techniques for oilspill detection and monitoring in the optical range, in GlobalMonitoring for Security and Stability (GMOSS), edited by G.Zeug and M. Pesaresi, JRC Sci. Tech. Rep. EUR 23033 EN,pp. 294–305, Joint Res. Cent., Ispra, Italy.sciello, D., T. Lacava, N. Pergola, and V. Tramutoli (2011),Robust Satellite Techniques (RST) for oil spill detection andmonitoring using AVHRRThermal Infrared bands, Int. J. RemoteSens., 32(14), 4107–4129.eng, Y., X. Li, Q. Xu, O. Garcia-Pineda, O. Andersen, and W.Pichel (2011), SAR observation and model tracking of an oil spillevent in coastal waters,Mar. Pollut. Bull., 62, 350–363, doi:10.1016/j.marpolbul.2010.10.005.ust, G., and Y. Sagarminaga (2007), The multi-angle view ofMISR detects oil slicks under sun glitter conditions, RemoteSens. Environ., 107, 232–239.oss, A. M. (1992), Monitoring marine oil pollution usingAVHRR data: Observation off coast of Kuwait and Saudi Arabiaduring January 1991, Int. J. Remote Sens., 13, 781–788.uz, A. M., and E. Krausmann (2008), Damage to offshore oil andgas facilities following Hurricanes Katrina and Rita: An over-view, J. Loss Prev., 21, 620–626.uz, A. M., and E. Krausmann (2009), Hazardous-materials re-leases from offshore oil and gas facilities and emergency re-sponse following Hurricanes Katrina and Rita, J. Loss Prev.,22, 59–65.omo, V., C. Filizzola, N. Pergola, C. Pietrapertosa, and V. Tra-mutoli (2004), A self-sufficient approach for GERB cloudy radi-ance detection, Atmos. Res., 72, 39–56.essì, F., M. T. Melis, L. Naitza, and A. Marini (2008), MODISdata processing for coastal and marine environment monitoring:A study on anomaly detection and evolution in gulf of Cagliari(Sardinia-Italy), in The International Archives of the Photogram-metry, Remote Sensing and Spatial Information Sciences, ISPRSCongress Beijing 2008, Proceedings of Commission VIII, pp.695–698, ISPRS, Beijing, China.rraro, G., A. Bernardini, M. David, S. Meyer-Roux, O. Muellenh-off, M. Perkovic, D. Tarchi, and K. Topouzelis (2007), Towardsan operational use of space imagery for oil pollution monitoringin the Mediterranean basin: A demonstration in the Adriatic Sea,Mar. Pollut. Bull., 54, 403–422.
rraro, G., B. Baschek, G. deMontpellier, O. Njoten, M. Perkovic,and M. Vespe (2010), On the SAR derived alert in the detectionof oil spills according to the analysis of the EGEMP,Mar. Pollut.Bull., 60, 91–102.ngas, M. F., and C. E. Brown (1997), Remote sensing of oil spills,Sea Technol., 38, 37–46.ngas, M. F., and C. E. Brown (2000), A review of the status ofadvanced technologies for the detection of oil in and with ice,Spill Sci. Technol. Bull., 6(5), 295–302.rrest, J., E. Marcucci, and P. Scott (2005), Geothermal gradientsand subsurface temperatures in the Northern Gulf of Mexico,Trans. Gulf Coast Assoc. Geol. Soc., 55, 233–248.rimaldi, C. S. L., I. Coviello, T. Lacava, N. Pergola, and V.Tramutoli (2009a), Near real time oil spill detection and moni-toring using satellite optical data, in IEEE Geoscience andRemote Sensing Society IGARSS 2009, pp. 709–712, Inst. ofElectr. and Electron. Eng., Piscataway, N. J., doi:10.1109/IGARSS.2009.5417590.rimaldi, C. S. L., I. Coviello, T. Lacava, N. Pergola, and V.Tramutoli (2009b), RST-based oil spill detection and monitoringby using optical data, in Fifth International Workshop onthe Analysis of Multi-temporal Remote Sensing Images, Multi-Temp 2009, edited by D. L. Civico, pp. 323–330, Univ. of Conn.,Storrs.rimaldi, C. S. L., D. Casciello, I. Coviello, T. Lacava, N. Pergola,and V. Tramutoli (2011), An improved RST approach for timelyalert and Near Real Time monitoring of oil spill disasters by usingAVHRR data, Nat. Hazards Earth Syst. Sci., 11, 1281–1291,doi:10.5194/nhess-11-1281-2011.ogarth, W. (2005), Testimony on the effects of hurricanes Katrinaand Rita on the fishing industry and fishing communities in theGulf of Mexico before the House Committee on Resources,Subcommittee on Fisheries and Oceans, Washington, D. C.,15 Dec. [Available at http://www.ogc.doc.gov/ogc/legreg/testimon/109f/hogarth1215.htm, last accessed August 23, 2011.]owari, F. M. (2004), Investigation of hydrocarbon pollution inthe vicinity of United Arab Emirates coasts using visible andnear infrared remote sensing data, J. Coastal Res., 20(4),1089–1095.u, C., F. E. Müller-Krager, C. J. Taylor, D. Myhre, B. Murch, A. L.Odriozola, and G. Godoy (2003), MODIS detects oil spills inLake Maracaibo, Venezuela, Eos Trans. AGU, 84(33), 313–319.u, C., X. Li, W. G. Pichel, and F. E. Muller-Karger (2009),Detection of natural oil slicks in the NW Gulf of Mexico usingMODIS imagery, Geophys. Res. Lett., 36, L01604, doi:10.1029/2008GL036119.a, M. N., J. Levy, and Y. Gao (2008), Advances in remote sensingfor oil spill disaster management: State-of-the-art sensor technol-ogy for oil spill surveillance, Sensors, 8, 236–255.err, R. A., E. Kintisch, L. Schenkman, E. Stokstad (2010), Fivequestions on the spill, Science, 328, 962–963.ostianoy, A., K. Litovchenko, O. Lavrova, M. Mityagina, T.Bocharova, S. Lebedev, S. Stanichny, D. Soloviev, A. Sirota, andO. Pichuzhkina (2006), Operational satellite monitoring of oil

Li
Li
Li
Li
M
N
Ot
O
Pi
Pi
Sa
GRIMALDI ET AL. 31
spill pollution in the Southeastern Baltic Sea: 18 months experi-ence, Environ. Res. Eng. Manage., 4(38), 70–77., Y., and J. Li (2010), Oil spill detection from SAR intensityimagery using a marked point process, Remote Sens. Environ.,114, 1590–1601.u, A. K., Y. S. Wu, W. Y. Tseng, andW. G. Pichel (2000), Waveletanalysis of SAR images for coastal monitoring, Can. J. RemoteSens., 26, 494–500.u, P., C. Zhao, X. Li, M. He, and W. Pichel (2010), Identificationof ocean oil spills in SAR imagery based on fuzzy logic algo-rithm, Int. J. Remote Sens., 31, 4819–4833, doi:10.1080/01431161. 2010.485147.u, Y., R. H. Weisberg, C. Hu, and L. Zheng (2011), Trajectoryforecast as a rapid response to the Deepwater Horizon oil spill, inMonitoring and Modeling the Deepwater Horizon Oil Spill: ARecord-Breaking Enterprise , Geophys. Monogr. Ser. ,doi:10.1029/2011GM001121, this volume.itsch, W. J. (2010), The 2010 oil spill in the Gulf of Mexico: Whatwould Mother Nature do?, Ecol. Eng., 36, 1607–1610.irchio, F., and PRIMI Group (2010), The PRIMI Project: Aninterdisciplinary approach to oil spill monitoring, paper presentedat SeaSar 2010, Eur. Space Agency, Frascati, Italy. [Available athttp://spatial.telespazio.it/plone3.0/Primi/pubblicazioni/pubbli-cazioni/seasar-2010-primi/view2010.]remba, Z., and J. Piskozub (2001), Modelling of the optical contrastof an oil film on a sea surface, Optics Express, 9(8), 411–416.tremba, Z., and J. Piskozub (2003), Modelling the remotelysensed optical contrast caused by oil suspended in the sea watercolumn, Optics Express, 11(1), 2–6.etrapertosa, C., N. Pergola, V. Lanorte, and V. Tramutoli (2001),Self adaptive algorithms for change detection: OCA (the one-channel cloud-detection approach) an adjustable method forcloudy and clear radiances detection, in Eleventh International(A)TOVS Study Conference (ITSC-XI), Budapest, Hungary, edi-ted by J. F. Le Marshall and J. D. Jasper, pp. 281–291, Bur. ofMeteorol. Res. Cent., Melbourne, Australia.ne, J. (2006), Hurricane Katrina and oil spills: Impact on coastaland ocean environments, Oceanography, 19(2), 37–39.lisbury, J. W., D. M. D’Aria, and F. F. Sabins Jr. (1993), Thermalinfrared remote sensing of crude oil slick, Remote Sens. Environ.,45(2), 225–231.i, L., X. Zhang, G. Seielstand, C. Zhao, and M. He (2007), Oilspill detection by MODIS images using fuzzy cluster and texture
feature extraction, paper presented at IEEE Oceans 07, Aberdeen,U. K.
Topouzelis, K. (2008), Oil spill detection by SAR images: Darkformation detection, feature extraction and classification algo-rithms, Sensors, 8, 6624–6659.
Tramutoli, V. (1998), Robust AVHRR Techniques (RAT) for envi-ronmental monitoring: Theory and applications, in Earth SurfaceRemote Sensing II, edited by G. Cecchi, and E. Zilioli, Proc.SPIE, 3496, 101–113.
Tramutoli, V. (2005), Robust Satellites Techniques (RST) for nat-ural and environmental hazards monitoring and mitigation: Tenyears and applications, in 9th International Symposium on Phys-ical Measurements and Signatures in Remote Sensing, edited byL. Liang et al., pp. 792–795, ISPRS, Beijing China.
Tramutoli, V. (2007), Robust Satellite Techniques (RST) for naturaland environmental hazards monitoring and mitigation: Theoryand applications, paper presented at the Fourth InternationalWorkshop on the Analysis of Multitemporal Remote SensingImages, Louven, Belgium, doi:10.1109/MULTITEMP.2007.4293057.
Tramutoli, V., V. Cuomo, C. Filizzola, N. Pergola, and C. Pietra-pertosa (2005), Assessing the potential of thermal infrared satel-lite surveys for monitoring seismically active areas: The case ofKocaeli (İzmit) earthquake, August 17, 1999, Remote Sens.Environ., 96, 409–426.
Tseng, W. Y., and L. S. Chiu (1994), AVHRR observationsof Persian Gulf oil spills, in Geoscience and Remote SensingSymposium, IGARSS 1994, pp. 779–782, Inst. of Electr. andElectron. Eng., Piscataway, N. J., doi:10.1109/IGARSS.1994.399259.
Zhang, B., W. Perrie, X. Li, and W. G. Pichel (2011), Mapping seasurface oil slicks using RADARSAT-2 quad-polarization SARimage, Geophys. Res. Lett., 38, L10602, doi:10.1029/2011GL047013.
I. Coviello, Instit
ute of Methodologies for EnvironmentalAnalysis (IMAA), National Research Council, C.da S. Loja –85050 Tito Scalo, Italy.C. S. L. Grimaldi, T. Lacava, N. Pergola, and V. Tramutoli,
Department of Engineering and Physics of the Environment(DIFA), University of Basilicata, Via dell’Ateneo Lucano, 10 –
85100 Potenza, Italy. ([email protected])
Sh