oil prices and their effect on potential output
TRANSCRIPT
Electronic copy available at: http://ssrn.com/abstract=1359088
OIL PRICES AND THEIR EFFECT ON POTENTIAL OUTPUT
Documentos OcasionalesN.º 0902
Ángel Estrada and Pablo Hernández de Cos
2009

Electronic copy available at: http://ssrn.com/abstract=1359088
OIL PRICES AND THEIR EFFECT ON POTENTIAL OUTPUT
Electronic copy available at: http://ssrn.com/abstract=1359088
OIL PRICES AND THEIR EFFECT ON POTENTIAL OUTPUT
Ángel Estrada and Pablo Hernández de Cos
BANCO DE ESPAÑA
Documentos Ocasionales. N.º 0902 2009

The Occasional Paper Series seeks to disseminate work conducted at the Banco de España, in the performance of its functions, that may be of general interest. The opinions and analyses in the Occasional Paper Series are the responsibility of the authors and, therefore, do not necessarily coincide with those of the Banco de España or the Eurosystem. The Banco de España disseminates its main reports and most of its publications via the INTERNET at the following website: http://www.bde.es. Reproduction for educational and non-commercial purposes is permitted provided that the source is acknowledged. © BANCO DE ESPAÑA, Madrid, 2009 ISSN: 1696-2222 (print) ISSN: 1696-2230 (on line) Depósito legal: M. 43053-2009 Unidad de Publicaciones, Banco de España
Abstract
Oil prices have fluctuated considerably in the last few years, with major effects on the
economy. This paper describes some of the mechanisms by which these fluctuations
produce changes in the long-run growth of the economy. In particular, it analyses the effect
on productivity, capital stock and structural unemployment. The analysis suggests that a
(permanent) increase in oil prices can significantly reduce potential output. From an
economic policy point of view, this effect may be more marked when competition in the
product markets is low or when wage indexation is high; thus, reforms aiming to increase
competition and improve wage-setting mechanisms help to reduce the negative effects of
higher oil prices on long-run economic growth.
Keywords: oil price, potential output, production function.
JEL-Classification: O13, O47, J64.
CONTENTS
Abstract 7 CONTENTS 9 1 Introduction 11 2 The effect of oil prices on the determinants of potential output 12
2.1 Productivity 13 2.2 Capital stock 15 2.3 Employment 16
2.3.1 LABOUR DEMAND 17 2.3.2 LABOUR SUPPLY 18 2.3.3 LABOUR MARKET EQUILIBRIUM: THE NAIRU 18
3 Empirical evidence on the importance of these channels 20 4 Conclusions 25
REFERENCES 26
BANCO DE ESPAÑA 11 DOCUMENTO OCASIONAL N.º 0902
1 Introduction
Although oil prices in the international markets have diminished significantly in recent months
to $40 per barrel, since the beginning of the new millennium they have followed an upward
trend, amply exceeding the $100 per barrel barrier by mid-2008. Thus, the price of oil in real
terms (that is, calculated in the currency of the country in question and subtracting the price
level) surpassed the historical peaks reached in the first half of the 1980s in most importing
countries. This behaviour can be expected to have had a significant impact on both
aggregate demand and aggregate supply of the economy.
The channels that transform an increase in oil prices into a higher level of inflation
and a reduction in the real demand of agents are well understood. By contrast, less is known
of how this kind of shock impacts supply in the economy. This document seeks to describe
some of the mechanisms affecting the aggregate supply of an oil importing country after a
(permanent) change in the price of this raw material.
Before starting, it is important to clarify that the concept of aggregate supply we are
going to use is the traditional definition of potential output, that is, the level of activity
that can feasibly be reached without generating inflationary pressures. Furthermore, some
simplifying assumptions are made. First, we do not delve into the reasons behind changes
in oil prices. However, in the real world, the behaviour of the oil price, like that of any other
product, can be the result of shocks to supply or demand (or both), and the impact on the
economy can be very different depending on the initial cause of the price adjustment.1
Second, the definition of oil price that is relevant for economic agents has to take into account
the exchange rate2 and oil-related indirect taxes.3 This paper does not consider the impact of
taxes and, although our analysis considers exchange rate, it does not take into account
the effect of currency appreciation or depreciation on competitiveness, and, therefore, on
potential output.4
Against this background, the paper describes three possible channels by which
oil prices may influence the level of potential output (measured in terms of gross domestic
product �GDP�). Thus the next section analyses, firstly, the effect on (estimated)
productivity, secondly, the (optimal) capital stock, and, finally, the level of potential
employment. The third section provides some simple empirical evidence on the prevalence of
these channels in Europe and their quantitative impact. The last section sets out the main
conclusions.
1. For example, if the increase in oil prices is the result of strong oil demand by particular importing countries, these countries will demand not only oil but also other goods and services produced by other importing oil countries, which will also benefit from the increase in global demand. However, if the increase in oil prices is a result of lower oil supply (due, for example, to a strengthening of the OPEC’s oligopolistic power or to a reassessment of oil reserves), all the oil importing countries will reduce their aggregate demand for goods and services, including imports; thus world trade will diminish and therefore the exports of oil importing countries will fall. When the increase in oil prices is due to speculative financial factors, the implications are more complicated. 2. This means that the oil price has to be measured in the currency of the importing country. 3. It is necessary to consider indirect taxes because most of them are specific (as opposed to ad-valorem taxes, like VAT). Thus they do not change when oil prices change and they therefore soften the impact of the shock in terms of the price borne by the final consumer. 4. It is interesting to highlight this last relationship, since sometimes it is argued that an increase in the dollar price of oil is less harmful if it happens at the same time as an appreciation of the currency of the oil importing country with respect to the dollar. However, this analysis does not consider that the appreciation worsens competitiveness of the country and therefore, its domestic production is more expensive and the foreign production cheaper, thus reducing GDP.
BANCO DE ESPAÑA 12 DOCUMENTO OCASIONAL N.º 0902
2 The effect of oil prices on the determinants of potential output
As said in the introduction, in order to analyse the effect of oil prices on the aggregate supply
of the economy, this latter concept is taken as synonymous with potential output. Following
tradition, potential output is defined as the level of production that can be reached by the
economy using the available productive factors and existing technology without generating
inflationary pressures. Therefore, potential output can be considered a good description of
the supply side of the economy and thus a key variable for economic analysis and the design
of economic policy.
From a theoretical perspective, potential output can be modelled by means of a
production function relating the (real) GDP of the economy (Y) to the inputs used to
generate it. Usually, two primary inputs are considered (capital �K� and labour �L�) and a
third variable is included to capture the part of observed production that is not explained
by the recorded utilisation levels of the primary inputs. This last “factor” is known as total
factor productivity (TFP, denoted by the letter “A”). It proxies the technical efficiency with
which the productive factors are used and its behaviour is related to technological progress.
Mathematically, the productive process can be expressed as follows:
� �L,KFAY � [1]
where F is a (production) function which is twice differentiable and homogeneous of
degree 1. This last condition implies that the productive process exhibits constant returns
to scale; meaning that if the primary input endowments increase in the same proportion,
production also increases by that proportion. As a result, applying the Euler theorem to
this expression gives:
alYLFk
YKFy LK ���� ��� [2]
where the lower-case letters represent the natural log of the corresponding upper-case
variables, � is the difference operator and FI represents the partial derivative of the production
function with respect to each primary input (that is, its marginal productivity). Assuming the
existence of perfect competition in the input and product markets, profit optimisation
first-order conditions imply that the marginal productivity of labour and capital will be equal to
the real wage (W/P) and the real user cost of capital (CU/P), respectively. Therefore, [2] can
be written as follows:
� � alsksy LL ���� ���� 1 [3]
where sL is the share of labour income in nominal production.
In this last expression, all the variables are observable apart from the TFP growth
rate; therefore, it can be obtained as a residual. This means that, by construction, the
production function will be exactly fulfilled.
BANCO DE ESPAÑA 13 DOCUMENTO OCASIONAL N.º 0902
However, in order to estimate the potential output of the economy it will be
necessary to evaluate this equation at the potential level of each productive factor. Thus,
starting with TFP, its potential level is usually proxied by filtering this residual input with
a statistical procedure to eliminate its fluctuations at the business cycle frequency ( a� ).
In the case of the capital stock, its potential level is traditionally equated to its observed
value because, as it is the accumulation of an investment flow (with a depreciation rate which
is not very large), it does not exhibit fluctuations at the business cycle frequency. Finally,
the increase in potential employment ( l� ) is estimated by adding the growth rate of the
(working-age) population (which should be filtered since, although the natural growth of
population is not correlated with the cycle, migrant flows are), the potential participation
rate (that is, the proportion of the working age population that is working or actively seeking
a job � pop� �) and, with a negative sign, the changes in the potential unemployment rate
(proportion of participants in the labour market that do not find a job). This last variable is
called the NAIRU and is defined as the level of the unemployment rate that does not generate
inflationary pressures. Leaving aside socio-demographic elements, like the incorporation of
women in the labour market, the potential participation rate should have a close negative
relationship with the NAIRU, since individuals will be more reluctant to participate in that
market when conditions are less favourable, that is, when the unemployment rate is higher.
Thus, to estimate the potential growth of the economy ( y� ) it suffices to replace the
observed values in expression [3] by their potential counterparts:
� � � � aNAIRUpopsksy LL ������ ������ 11 [4]
At both theoretical and empirical level, at least three channels have been identified
through which oil prices influence potential growth: potential TFP, the capital stock and the
NAIRU. The next three sections describe them.
2.1 Productivity
The first channel is the possible impact of oil prices on (measured) productivity. The difference
between gross production and the value added of the economy serves to illustrate
this mechanism. GDP can be obtained as the sum of the value added by firms and,
in the National Accounts framework, it is estimated by subtracting intermediate consumption
from gross production. Intermediate consumption includes imported crude oil and derivatives.
Therefore, an increase in oil prices may mean that, even with the same capital and labour
endowment, the share of production that remains in the oil importing country is lower. Higher
oil prices are thus equivalent to a decrease in the productivity of the two primary inputs.
Therefore, a similarity exists between an oil price shock and a TFP shock.
Algebraically (and assuming for the sake of simplicity that the only intermediate
consumption is imported oil), the value added in nominal terms (PY) will be equal to nominal
gross production (PQQ) minus imports of oil, also in nominal terms (POO):
OPQPYP OQ �� [5]
In real terms (that is, taking on board price changes), the estimation of GDP is slightly
more complicated, as its deflator is not an observable variable. Thus, the National Accounts
use a technique known as “double deflation”. This methodology consists, firstly, of obtaining
BANCO DE ESPAÑA 14 DOCUMENTO OCASIONAL N.º 0902
the growth of gross production and oil imports in real terms; this is an easy task, since these
prices are observable. Secondly, the real growth of oil imports, weighted by the share of
this intermediate consumption in gross production (sQO), is subtracted from real gross
production growth:
QO
QO
sosq
y��
�1
��� [6]
Using this definition, it can be shown that the value added deflator can be calculated
as follows:
QO
OQO
Q
spsp
p��
�1
��� [7]
that is, it deducts oil prices from gross production prices.
From an economic perspective, modelling gross production is conceptually
equivalent to GDP, except for the appearance of a new productive factor, namely oil
(or intermediate consumption in more general frameworks). Therefore, using the same
symbols, we can write:
� �O,L,KFAQ QQ� [8]
Notice that neither gross production TFP nor the production function need be
the same as the value added (GDP) function. In any case, imposing the same conditions
as in the case of GDP (constant return to scale in the three inputs and perfect competition in
factor and product markets), a very similar expression is obtained. Thus, the gross production
growth rate is a weighted average of the productive factor growth rates (the weights being the
share of each factor’s cost in nominal gross production �sQI�) plus TFP growth rate:
� � QQO
QL
QO
QL aoslskssq ����� ������ 1 [9]
Thus, if expression [6] is substituted in [9], the following production function for GDP
growth is obtained:
� � QQO
LL
QQO
QO
QL
QO
QO
QL
as
lsks
as
lssk
sssy
���
����
����
��
��
����
�
111
11
111
[10]
If this last equation is compared with that obtained in [3], it may be concluded that oil
(and, therefore, its price) does not play any role in the determination of real GDP. However, it
should be taken into account that the TFP growth rate in terms of GDP is equal to the TFP
growth rate in terms of gross production divided by one minus the weight of oil costs in gross
production, and this weight can change when oil prices change.
BANCO DE ESPAÑA 15 DOCUMENTO OCASIONAL N.º 0902
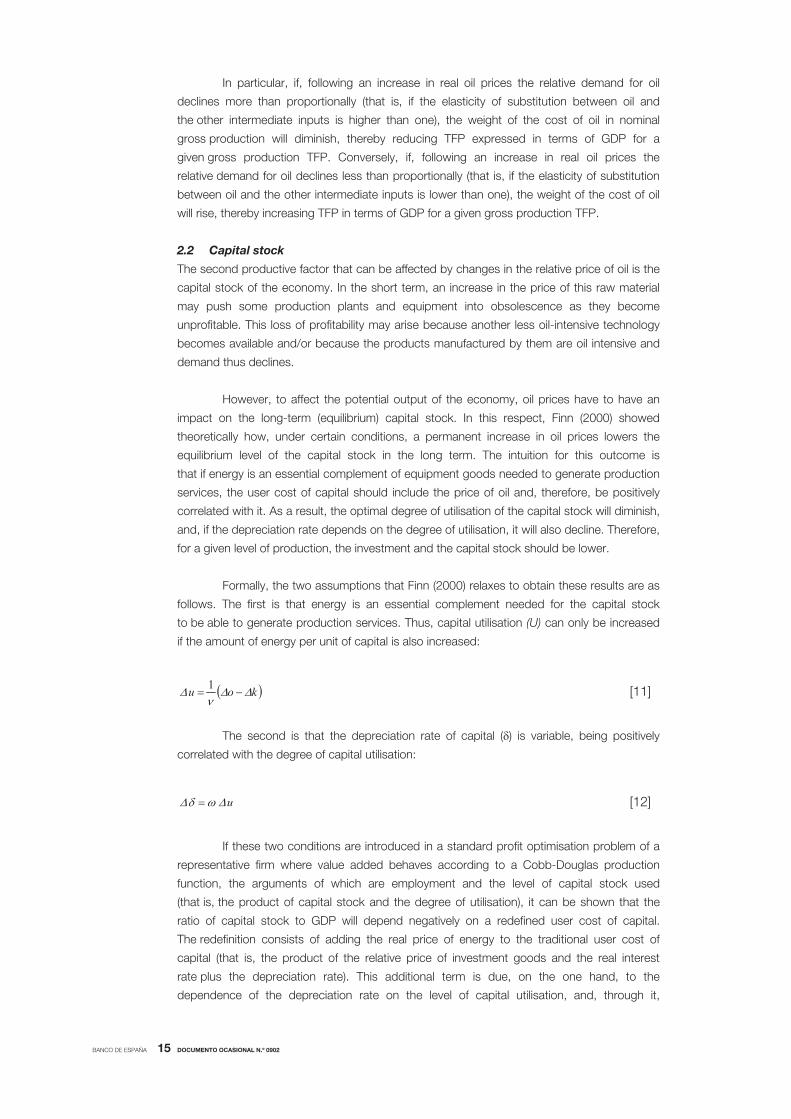
In particular, if, following an increase in real oil prices the relative demand for oil
declines more than proportionally (that is, if the elasticity of substitution between oil and
the other intermediate inputs is higher than one), the weight of the cost of oil in nominal
gross production will diminish, thereby reducing TFP expressed in terms of GDP for a
given gross production TFP. Conversely, if, following an increase in real oil prices the
relative demand for oil declines less than proportionally (that is, if the elasticity of substitution
between oil and the other intermediate inputs is lower than one), the weight of the cost of oil
will rise, thereby increasing TFP in terms of GDP for a given gross production TFP.
2.2 Capital stock
The second productive factor that can be affected by changes in the relative price of oil is the
capital stock of the economy. In the short term, an increase in the price of this raw material
may push some production plants and equipment into obsolescence as they become
unprofitable. This loss of profitability may arise because another less oil-intensive technology
becomes available and/or because the products manufactured by them are oil intensive and
demand thus declines.
However, to affect the potential output of the economy, oil prices have to have an
impact on the long-term (equilibrium) capital stock. In this respect, Finn (2000) showed
theoretically how, under certain conditions, a permanent increase in oil prices lowers the
equilibrium level of the capital stock in the long term. The intuition for this outcome is
that if energy is an essential complement of equipment goods needed to generate production
services, the user cost of capital should include the price of oil and, therefore, be positively
correlated with it. As a result, the optimal degree of utilisation of the capital stock will diminish,
and, if the depreciation rate depends on the degree of utilisation, it will also decline. Therefore,
for a given level of production, the investment and the capital stock should be lower.
Formally, the two assumptions that Finn (2000) relaxes to obtain these results are as
follows. The first is that energy is an essential complement needed for the capital stock
to be able to generate production services. Thus, capital utilisation (U) can only be increased
if the amount of energy per unit of capital is also increased:
� �kou ��
� ��1 [11]
The second is that the depreciation rate of capital (�) is variable, being positively
correlated with the degree of capital utilisation:
u���� � [12]
If these two conditions are introduced in a standard profit optimisation problem of a
representative firm where value added behaves according to a Cobb-Douglas production
function, the arguments of which are employment and the level of capital stock used
(that is, the product of capital stock and the degree of utilisation), it can be shown that the
ratio of capital stock to GDP will depend negatively on a redefined user cost of capital.
The redefinition consists of adding the real price of energy to the traditional user cost of
capital (that is, the product of the relative price of investment goods and the real interest
rate plus the depreciation rate). This additional term is due, on the one hand, to the
dependence of the depreciation rate on the level of capital utilisation, and, through it,
BANCO DE ESPAÑA 16 DOCUMENTO OCASIONAL N.º 0902
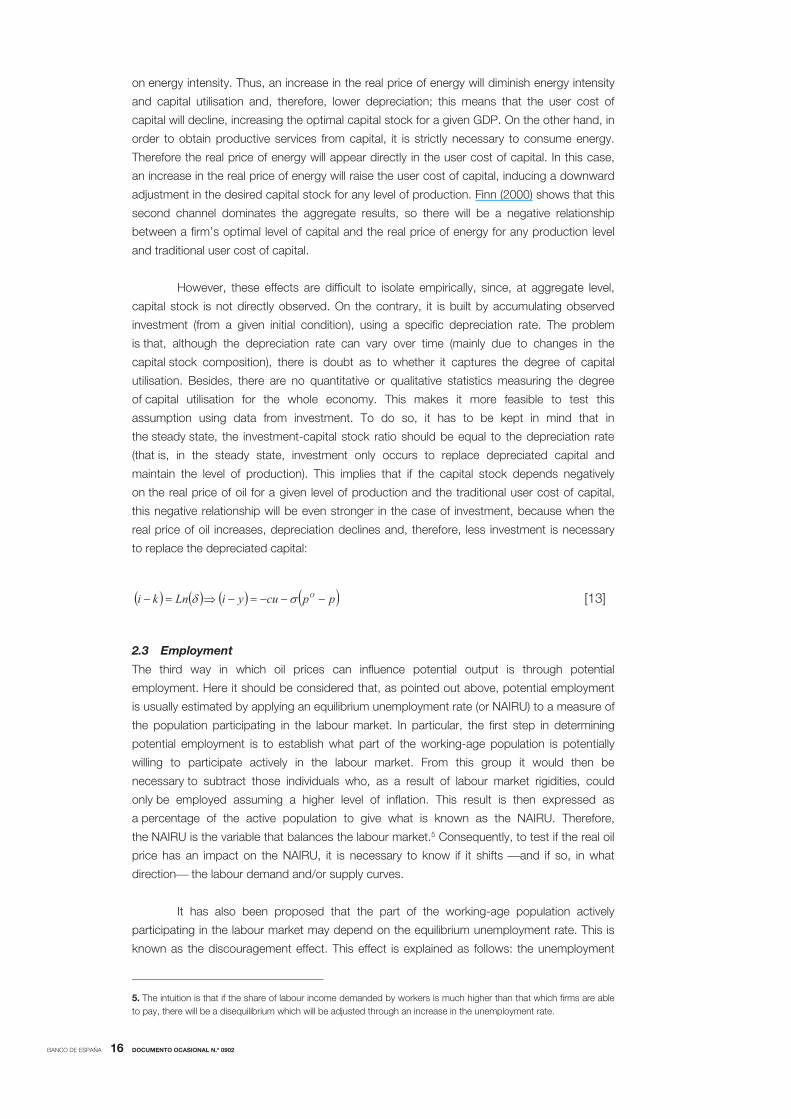
on energy intensity. Thus, an increase in the real price of energy will diminish energy intensity
and capital utilisation and, therefore, lower depreciation; this means that the user cost of
capital will decline, increasing the optimal capital stock for a given GDP. On the other hand, in
order to obtain productive services from capital, it is strictly necessary to consume energy.
Therefore the real price of energy will appear directly in the user cost of capital. In this case,
an increase in the real price of energy will raise the user cost of capital, inducing a downward
adjustment in the desired capital stock for any level of production. Finn (2000) shows that this
second channel dominates the aggregate results, so there will be a negative relationship
between a firm’s optimal level of capital and the real price of energy for any production level
and traditional user cost of capital.
However, these effects are difficult to isolate empirically, since, at aggregate level,
capital stock is not directly observed. On the contrary, it is built by accumulating observed
investment (from a given initial condition), using a specific depreciation rate. The problem
is that, although the depreciation rate can vary over time (mainly due to changes in the
capital stock composition), there is doubt as to whether it captures the degree of capital
utilisation. Besides, there are no quantitative or qualitative statistics measuring the degree
of capital utilisation for the whole economy. This makes it more feasible to test this
assumption using data from investment. To do so, it has to be kept in mind that in
the steady state, the investment-capital stock ratio should be equal to the depreciation rate
(that is, in the steady state, investment only occurs to replace depreciated capital and
maintain the level of production). This implies that if the capital stock depends negatively
on the real price of oil for a given level of production and the traditional user cost of capital,
this negative relationship will be even stronger in the case of investment, because when the
real price of oil increases, depreciation declines and, therefore, less investment is necessary
to replace the depreciated capital:
� � � � � � � �ppcuyiLnki O �������� �� [13]
2.3 Employment
The third way in which oil prices can influence potential output is through potential
employment. Here it should be considered that, as pointed out above, potential employment
is usually estimated by applying an equilibrium unemployment rate (or NAIRU) to a measure of
the population participating in the labour market. In particular, the first step in determining
potential employment is to establish what part of the working-age population is potentially
willing to participate actively in the labour market. From this group it would then be
necessary to subtract those individuals who, as a result of labour market rigidities, could
only be employed assuming a higher level of inflation. This result is then expressed as
a percentage of the active population to give what is known as the NAIRU. Therefore,
the NAIRU is the variable that balances the labour market.5 Consequently, to test if the real oil
price has an impact on the NAIRU, it is necessary to know if it shifts �and if so, in what
direction� the labour demand and/or supply curves.
It has also been proposed that the part of the working-age population actively
participating in the labour market may depend on the equilibrium unemployment rate. This is
known as the discouragement effect. This effect is explained as follows: the unemployment
5. The intuition is that if the share of labour income demanded by workers is much higher than that which firms are able to pay, there will be a disequilibrium which will be adjusted through an increase in the unemployment rate.
BANCO DE ESPAÑA 17 DOCUMENTO OCASIONAL N.º 0902
rate of an economy can be understood as a rough approximation to the inverse of the
probability of finding a job; thus, if it is permanently high there will be individuals who, although
of working age, do not search for a job because ex-ante the probability of finding it is
very low. In the same vein, when the unemployment rate is lower, hiring conditions for
workers improve, increasing the possible reward from participating in the market.
Therefore it can generally be assumed that real oil prices can shift labour demand
and supply, and this translates into changes in the equilibrium unemployment rate.
2.3.1 LABOUR DEMAND
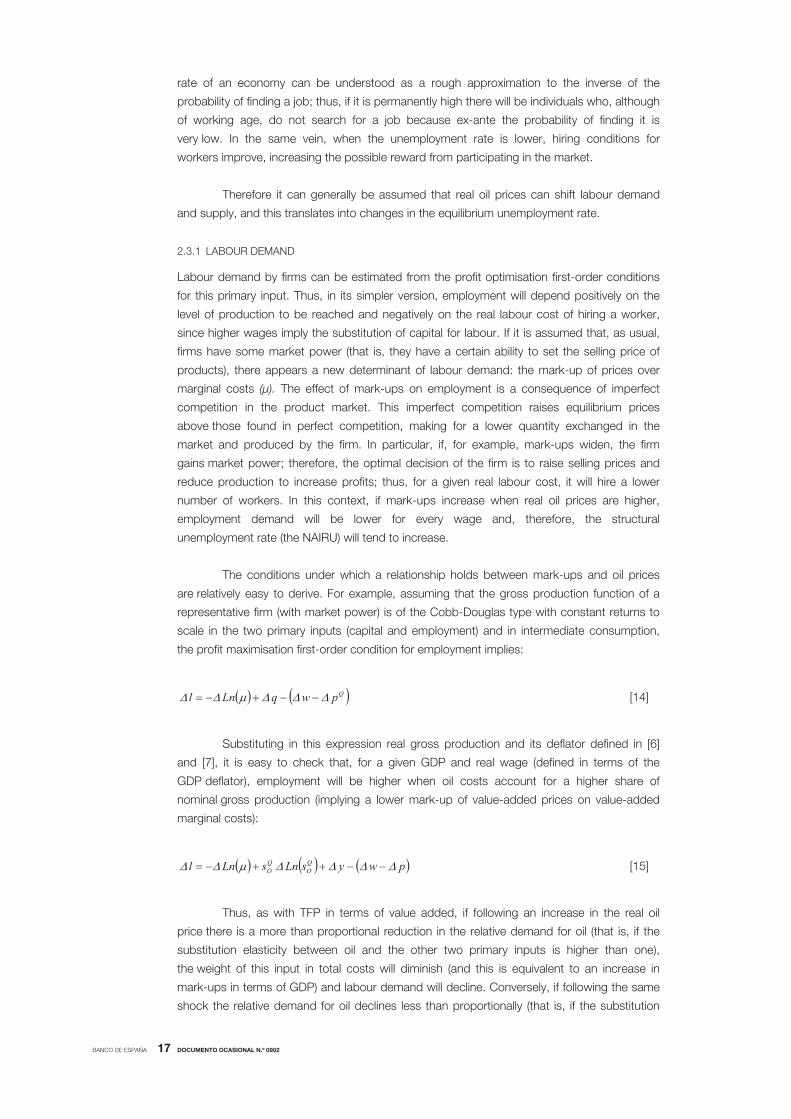
Labour demand by firms can be estimated from the profit optimisation first-order conditions
for this primary input. Thus, in its simpler version, employment will depend positively on the
level of production to be reached and negatively on the real labour cost of hiring a worker,
since higher wages imply the substitution of capital for labour. If it is assumed that, as usual,
firms have some market power (that is, they have a certain ability to set the selling price of
products), there appears a new determinant of labour demand: the mark-up of prices over
marginal costs (�). The effect of mark-ups on employment is a consequence of imperfect
competition in the product market. This imperfect competition raises equilibrium prices
above those found in perfect competition, making for a lower quantity exchanged in the
market and produced by the firm. In particular, if, for example, mark-ups widen, the firm
gains market power; therefore, the optimal decision of the firm is to raise selling prices and
reduce production to increase profits; thus, for a given real labour cost, it will hire a lower
number of workers. In this context, if mark-ups increase when real oil prices are higher,
employment demand will be lower for every wage and, therefore, the structural
unemployment rate (the NAIRU) will tend to increase.
The conditions under which a relationship holds between mark-ups and oil prices
are relatively easy to derive. For example, assuming that the gross production function of a
representative firm (with market power) is of the Cobb-Douglas type with constant returns to
scale in the two primary inputs (capital and employment) and in intermediate consumption,
the profit maximisation first-order condition for employment implies:
� � � �QpwqLnl ������ ����� [14]
Substituting in this expression real gross production and its deflator defined in [6]
and [7], it is easy to check that, for a given GDP and real wage (defined in terms of the
GDP deflator), employment will be higher when oil costs account for a higher share of
nominal gross production (implying a lower mark-up of value-added prices on value-added
marginal costs):
� � � � � �pwysLnsLnl QO
QO ������� ������ [15]
Thus, as with TFP in terms of value added, if following an increase in the real oil
price there is a more than proportional reduction in the relative demand for oil (that is, if the
substitution elasticity between oil and the other two primary inputs is higher than one),
the weight of this input in total costs will diminish (and this is equivalent to an increase in
mark-ups in terms of GDP) and labour demand will decline. Conversely, if following the same
shock the relative demand for oil declines less than proportionally (that is, if the substitution
BANCO DE ESPAÑA 18 DOCUMENTO OCASIONAL N.º 0902
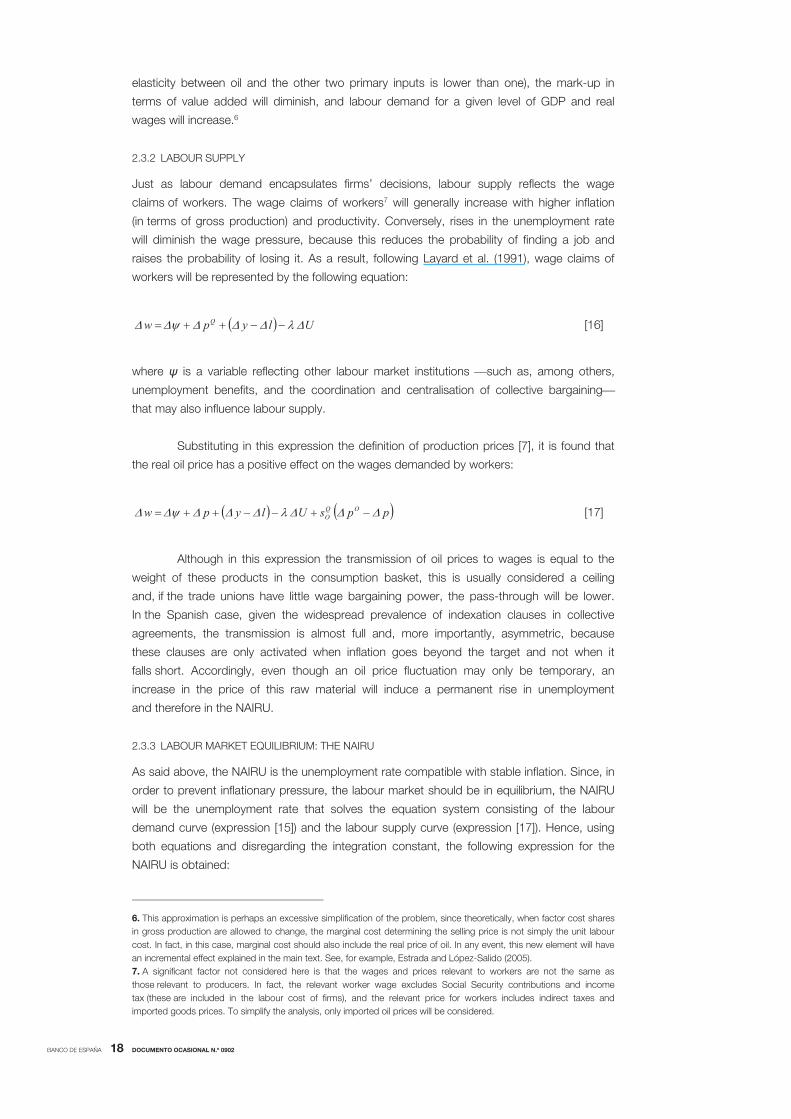
elasticity between oil and the other two primary inputs is lower than one), the mark-up in
terms of value added will diminish, and labour demand for a given level of GDP and real
wages will increase.6
2.3.2 LABOUR SUPPLY
Just as labour demand encapsulates firms’ decisions, labour supply reflects the wage
claims of workers. The wage claims of workers7 will generally increase with higher inflation
(in terms of gross production) and productivity. Conversely, rises in the unemployment rate
will diminish the wage pressure, because this reduces the probability of finding a job and
raises the probability of losing it. As a result, following Layard et al. (1991), wage claims of
workers will be represented by the following equation:
� � Ulypw Q �������� ����� [16]
where � is a variable reflecting other labour market institutions �such as, among others,
unemployment benefits, and the coordination and centralisation of collective bargaining�
that may also influence labour supply.
Substituting in this expression the definition of production prices [7], it is found that
the real oil price has a positive effect on the wages demanded by workers:
� � � �ppsUlypw OQO ���������� ������� [17]
Although in this expression the transmission of oil prices to wages is equal to the
weight of these products in the consumption basket, this is usually considered a ceiling
and, if the trade unions have little wage bargaining power, the pass-through will be lower.
In the Spanish case, given the widespread prevalence of indexation clauses in collective
agreements, the transmission is almost full and, more importantly, asymmetric, because
these clauses are only activated when inflation goes beyond the target and not when it
falls short. Accordingly, even though an oil price fluctuation may only be temporary, an
increase in the price of this raw material will induce a permanent rise in unemployment
and therefore in the NAIRU.
2.3.3 LABOUR MARKET EQUILIBRIUM: THE NAIRU
As said above, the NAIRU is the unemployment rate compatible with stable inflation. Since, in
order to prevent inflationary pressure, the labour market should be in equilibrium, the NAIRU
will be the unemployment rate that solves the equation system consisting of the labour
demand curve (expression [15]) and the labour supply curve (expression [17]). Hence, using
both equations and disregarding the integration constant, the following expression for the
NAIRU is obtained:
6. This approximation is perhaps an excessive simplification of the problem, since theoretically, when factor cost shares in gross production are allowed to change, the marginal cost determining the selling price is not simply the unit labour cost. In fact, in this case, marginal cost should also include the real price of oil. In any event, this new element will have an incremental effect explained in the main text. See, for example, Estrada and López-Salido (2005). 7. A significant factor not considered here is that the wages and prices relevant to workers are not the same as those relevant to producers. In fact, the relevant worker wage excludes Social Security contributions and income tax (these are included in the labour cost of firms), and the relevant price for workers includes indirect taxes and imported goods prices. To simplify the analysis, only imported oil prices will be considered.

BANCO DE ESPAÑA 19 DOCUMENTO OCASIONAL N.º 0902
� � � �� �qosLnNAIRU QO ���� ��
�1
[18]
This means that the level of the NAIRU will depend on labour market institutions and
will increase as the production mark-up increases, that is, as the market departs from perfect
competition. Also appearing in the expression is the weight of oil costs in gross production;
since this ratio will depend negatively on the real price of oil, increasing oil prices will drive the
NAIRU upwards, and even more so as the economy becomes more oil intensive.
Therefore, it can be said that the level of the NAIRU will increase with increasing real
oil price. On the other hand, a high NAIRU reduces the potential employment of the economy
and, thus, potential output, and, moreover, the labour market participation of the working-age
population is lower in countries with higher unemployment rates. As noted above, this is a
consequence of the unemployment rate being an (inverse) indicator of job finding probability.
Obviously, for a given working-age population, potential employment will be lower when there
is a lower long-term participation rate. Hence oil price shocks have an additional channel
through which to affect potential output.
BANCO DE ESPAÑA 20 DOCUMENTO OCASIONAL N.º 0902
3 Empirical evidence on the importance of these channels
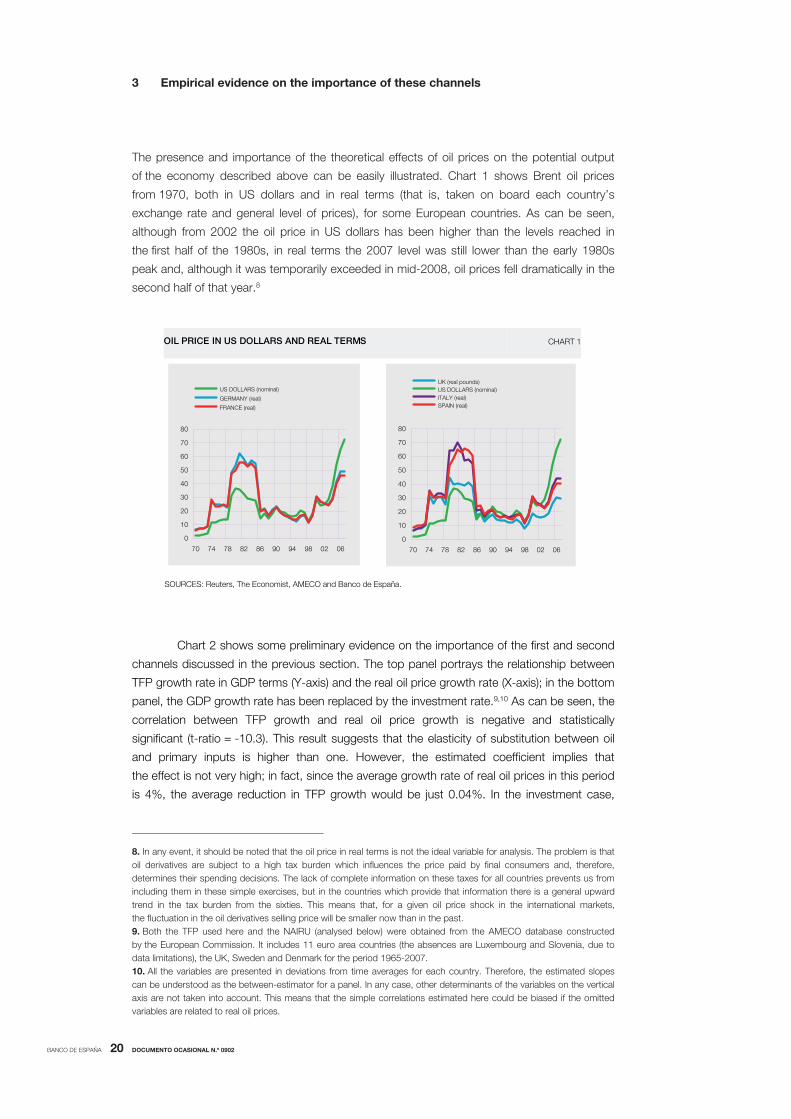
The presence and importance of the theoretical effects of oil prices on the potential output
of the economy described above can be easily illustrated. Chart 1 shows Brent oil prices
from 1970, both in US dollars and in real terms (that is, taken on board each country’s
exchange rate and general level of prices), for some European countries. As can be seen,
although from 2002 the oil price in US dollars has been higher than the levels reached in
the first half of the 1980s, in real terms the 2007 level was still lower than the early 1980s
peak and, although it was temporarily exceeded in mid-2008, oil prices fell dramatically in the
second half of that year.8
0
10
20
30
40
50
60
70
80
70 74 78 82 86 90 94 98 02 06
US DOLLARS (nominal)
GERMANY (real)
FRANCE (real)
OIL PRICE IN US DOLLARS AND REAL TERMS CHART 1
SOURCES: Reuters, The Economist, AMECO and Banco de España.
0
10
20
30
40
50
60
70
80
70 74 78 82 86 90 94 98 02 06
UK (real pounds) US DOLLARS (nominal) ITALY (real) SPAIN (real)
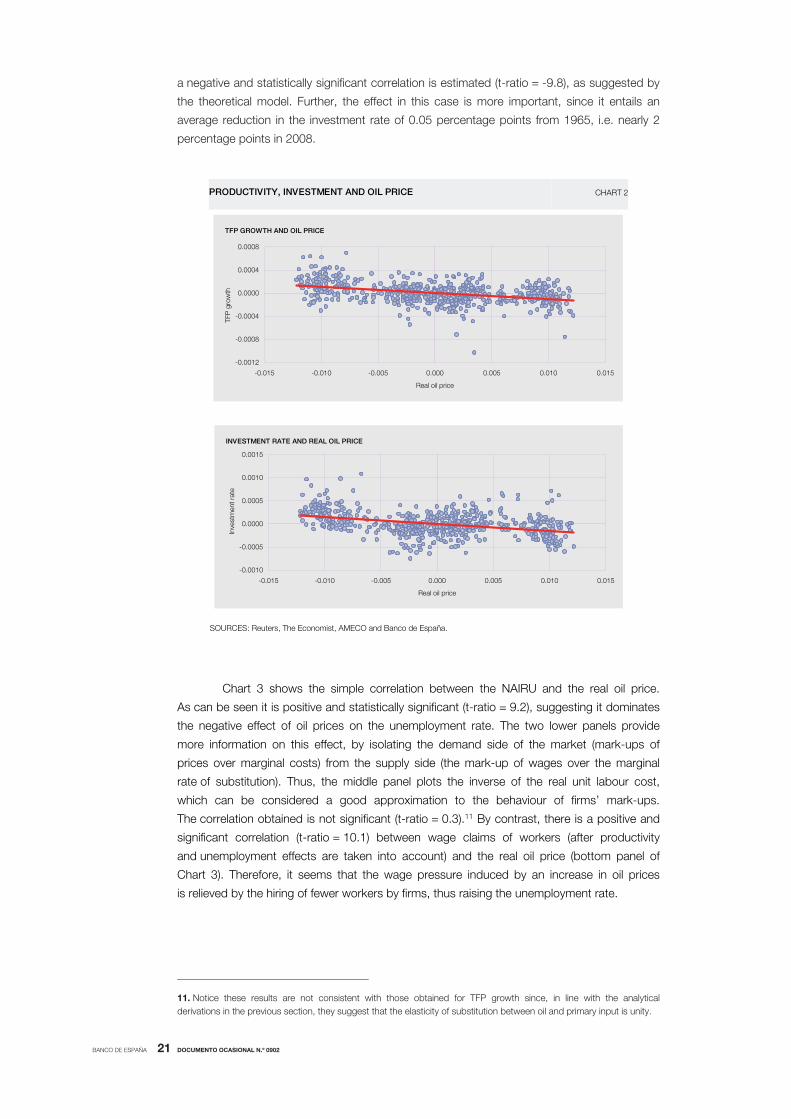
Chart 2 shows some preliminary evidence on the importance of the first and second
channels discussed in the previous section. The top panel portrays the relationship between
TFP growth rate in GDP terms (Y-axis) and the real oil price growth rate (X-axis); in the bottom
panel, the GDP growth rate has been replaced by the investment rate.9,10 As can be seen, the
correlation between TFP growth and real oil price growth is negative and statistically
significant (t-ratio = -10.3). This result suggests that the elasticity of substitution between oil
and primary inputs is higher than one. However, the estimated coefficient implies that
the effect is not very high; in fact, since the average growth rate of real oil prices in this period
is 4%, the average reduction in TFP growth would be just 0.04%. In the investment case,
8. In any event, it should be noted that the oil price in real terms is not the ideal variable for analysis. The problem is that oil derivatives are subject to a high tax burden which influences the price paid by final consumers and, therefore, determines their spending decisions. The lack of complete information on these taxes for all countries prevents us from including them in these simple exercises, but in the countries which provide that information there is a general upward trend in the tax burden from the sixties. This means that, for a given oil price shock in the international markets, the fluctuation in the oil derivatives selling price will be smaller now than in the past. 9. Both the TFP used here and the NAIRU (analysed below) were obtained from the AMECO database constructed by the European Commission. It includes 11 euro area countries (the absences are Luxembourg and Slovenia, due to data limitations), the UK, Sweden and Denmark for the period 1965-2007. 10. All the variables are presented in deviations from time averages for each country. Therefore, the estimated slopes can be understood as the between-estimator for a panel. In any case, other determinants of the variables on the vertical axis are not taken into account. This means that the simple correlations estimated here could be biased if the omitted variables are related to real oil prices.
BANCO DE ESPAÑA 21 DOCUMENTO OCASIONAL N.º 0902
a negative and statistically significant correlation is estimated (t-ratio = -9.8), as suggested by
the theoretical model. Further, the effect in this case is more important, since it entails an
average reduction in the investment rate of 0.05 percentage points from 1965, i.e. nearly 2
percentage points in 2008.
-0.0012
-0.0008
-0.0004
0.0000
0.0004
0.0008
-0.015 -0.010 -0.005 0.000 0.005 0.010 0.015
Real oil price
TFP
gro
wth
TFP GROWTH AND OIL PRICE
PRODUCTIVITY, INVESTMENT AND OIL PRICE CHART 2
SOURCES: Reuters, The Economist, AMECO and Banco de España.
-0.0010
-0.0005
0.0000
0.0005
0.0010
0.0015
-0.015 -0.010 -0.005 0.000 0.005 0.010 0.015
Real oil price
Inve
stm
ent r
ate
INVESTMENT RATE AND REAL OIL PRICE
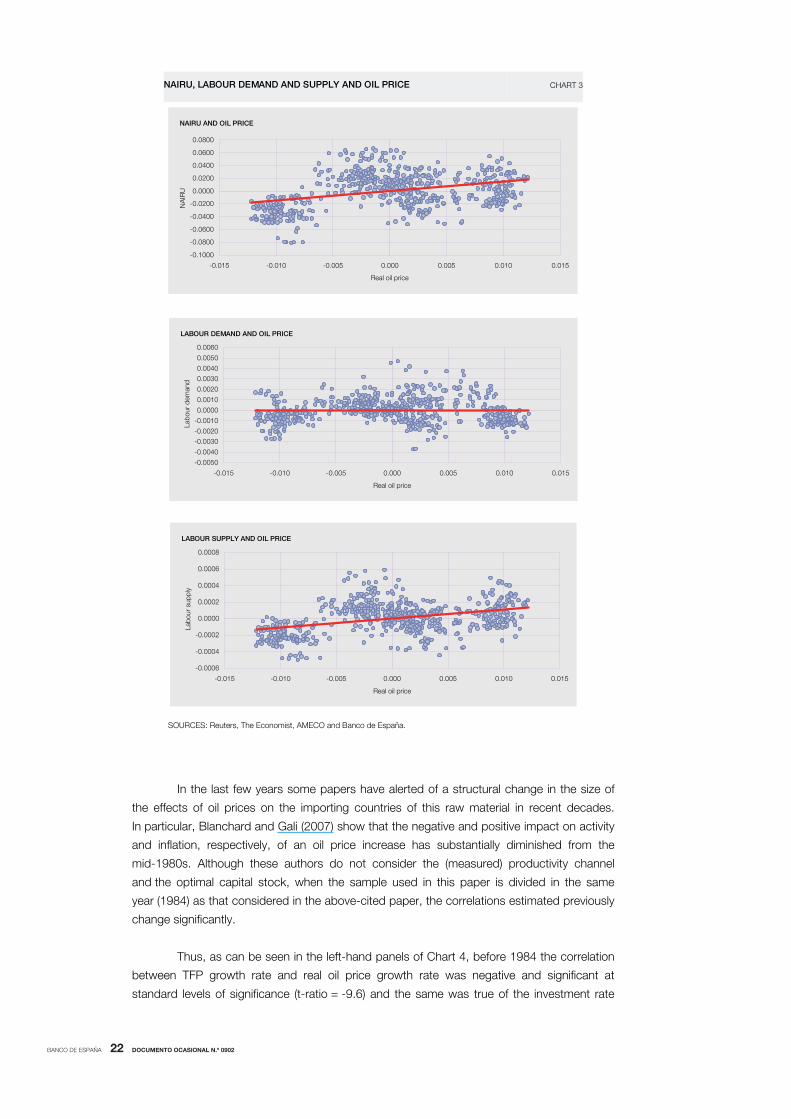
Chart 3 shows the simple correlation between the NAIRU and the real oil price.
As can be seen it is positive and statistically significant (t-ratio = 9.2), suggesting it dominates
the negative effect of oil prices on the unemployment rate. The two lower panels provide
more information on this effect, by isolating the demand side of the market (mark-ups of
prices over marginal costs) from the supply side (the mark-up of wages over the marginal
rate of substitution). Thus, the middle panel plots the inverse of the real unit labour cost,
which can be considered a good approximation to the behaviour of firms’ mark-ups.
The correlation obtained is not significant (t-ratio = 0.3).11 By contrast, there is a positive and
significant correlation (t-ratio = 10.1) between wage claims of workers (after productivity
and unemployment effects are taken into account) and the real oil price (bottom panel of
Chart 3). Therefore, it seems that the wage pressure induced by an increase in oil prices
is relieved by the hiring of fewer workers by firms, thus raising the unemployment rate.
11. Notice these results are not consistent with those obtained for TFP growth since, in line with the analytical derivations in the previous section, they suggest that the elasticity of substitution between oil and primary input is unity.
BANCO DE ESPAÑA 22 DOCUMENTO OCASIONAL N.º 0902
-0.1000
-0.0800
-0.0600
-0.0400
-0.0200
0.0000
0.0200
0.0400
0.0600
0.0800
-0.015 -0.010 -0.005 0.000 0.005 0.010 0.015
Real oil price
NA
IRU
NAIRU AND OIL PRICE
NAIRU, LABOUR DEMAND AND SUPPLY AND OIL PRICE CHART 3
SOURCES: Reuters, The Economist, AMECO and Banco de España.
-0.0050
-0.0040
-0.0030
-0.0020
-0.0010
0.0000
0.0010
0.0020
0.0030
0.0040
0.0050
0.0060
-0.015 -0.010 -0.005 0.000 0.005 0.010 0.015
Real oil price
Labo
ur d
eman
d
LABOUR DEMAND AND OIL PRICE
-0.0006
-0.0004
-0.0002
0.0000
0.0002
0.0004
0.0006
0.0008
-0.015 -0.010 -0.005 0.000 0.005 0.010 0.015
Real oil price
Labo
ur s
uppl
y
LABOUR SUPPLY AND OIL PRICE
In the last few years some papers have alerted of a structural change in the size of
the effects of oil prices on the importing countries of this raw material in recent decades.
In particular, Blanchard and Gali (2007) show that the negative and positive impact on activity
and inflation, respectively, of an oil price increase has substantially diminished from the
mid-1980s. Although these authors do not consider the (measured) productivity channel
and the optimal capital stock, when the sample used in this paper is divided in the same
year (1984) as that considered in the above-cited paper, the correlations estimated previously
change significantly.
Thus, as can be seen in the left-hand panels of Chart 4, before 1984 the correlation
between TFP growth rate and real oil price growth rate was negative and significant at
standard levels of significance (t-ratio = -9.6) and the same was true of the investment rate
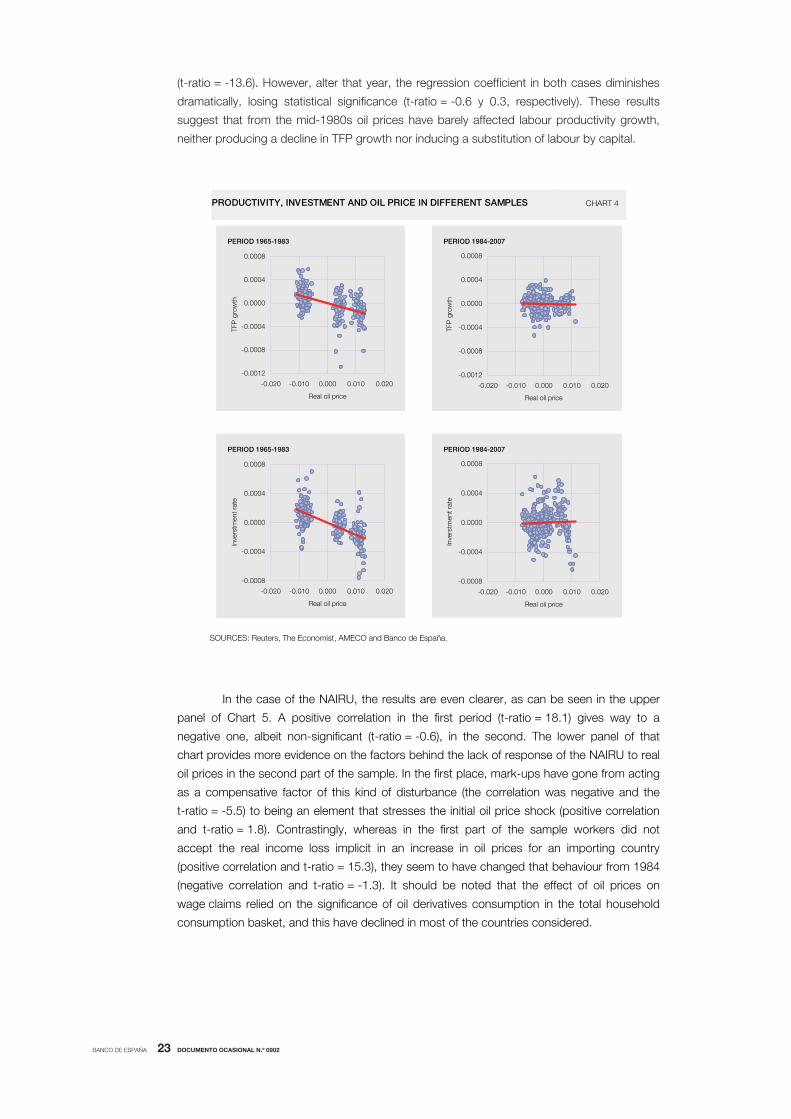
BANCO DE ESPAÑA 23 DOCUMENTO OCASIONAL N.º 0902
(t-ratio = -13.6). However, alter that year, the regression coefficient in both cases diminishes
dramatically, losing statistical significance (t-ratio = -0.6 y 0.3, respectively). These results
suggest that from the mid-1980s oil prices have barely affected labour productivity growth,
neither producing a decline in TFP growth nor inducing a substitution of labour by capital.
-0.0012
-0.0008
-0.0004
0.0000
0.0004
0.0008
-0.020 -0.010 0.000 0.010 0.020
Real oil price
TFP
gro
wth
PERIOD 1965-1983
PRODUCTIVITY, INVESTMENT AND OIL PRICE IN DIFFERENT SAMPLES CHART 4
SOURCES: Reuters, The Economist, AMECO and Banco de España.
-0.0012
-0.0008
-0.0004
0.0000
0.0004
0.0008
-0.020 -0.010 0.000 0.010 0.020
Real oil price
TFP
gro
wth
PERIOD 1984-2007
-0.0008
-0.0004
0.0000
0.0004
0.0008
-0.020 -0.010 0.000 0.010 0.020
Real oil price
Inve
rstm
ent r
ate
PERIOD 1965-1983
-0.0008
-0.0004
0.0000
0.0004
0.0008
-0.020 -0.010 0.000 0.010 0.020
Real oil price
Inve
rstm
ent r
ate
PERIOD 1984-2007
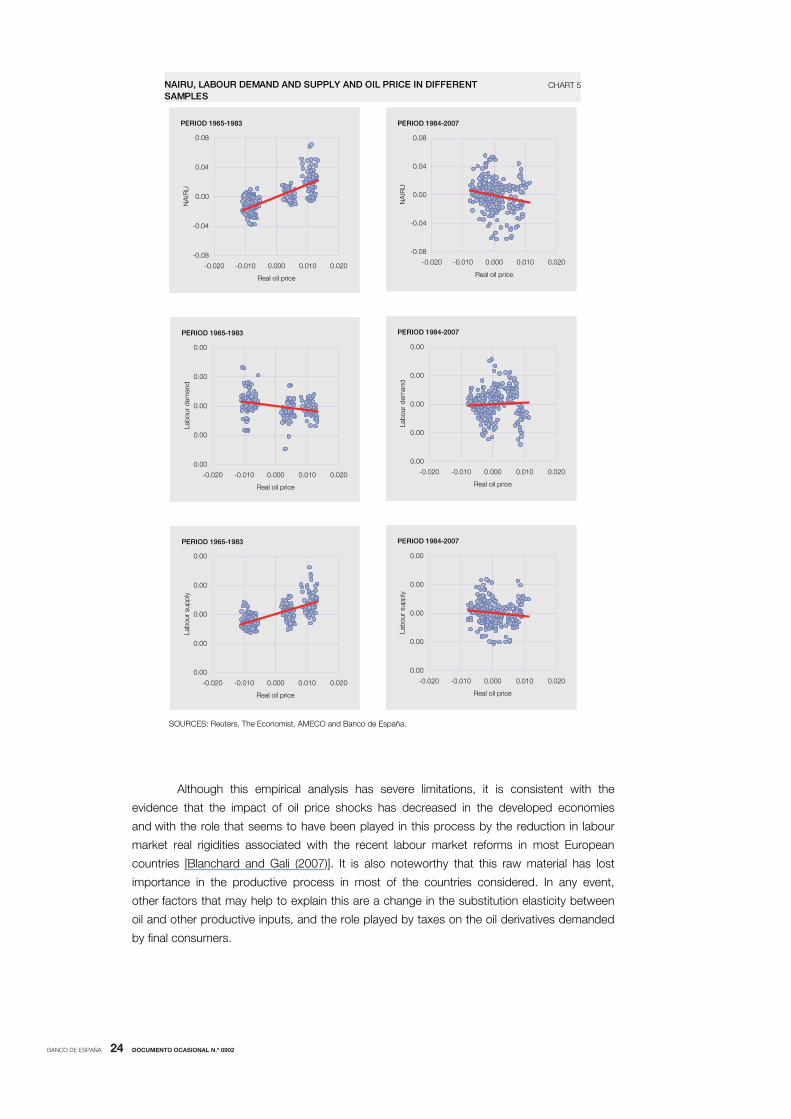
In the case of the NAIRU, the results are even clearer, as can be seen in the upper
panel of Chart 5. A positive correlation in the first period (t-ratio = 18.1) gives way to a
negative one, albeit non-significant (t-ratio = -0.6), in the second. The lower panel of that
chart provides more evidence on the factors behind the lack of response of the NAIRU to real
oil prices in the second part of the sample. In the first place, mark-ups have gone from acting
as a compensative factor of this kind of disturbance (the correlation was negative and the
t-ratio = -5.5) to being an element that stresses the initial oil price shock (positive correlation
and t-ratio = 1.8). Contrastingly, whereas in the first part of the sample workers did not
accept the real income loss implicit in an increase in oil prices for an importing country
(positive correlation and t-ratio = 15.3), they seem to have changed that behaviour from 1984
(negative correlation and t-ratio = -1.3). It should be noted that the effect of oil prices on
wage claims relied on the significance of oil derivatives consumption in the total household
consumption basket, and this have declined in most of the countries considered.
BANCO DE ESPAÑA 24 DOCUMENTO OCASIONAL N.º 0902
-0.08
-0.04
0.00
0.04
0.08
-0.020 -0.010 0.000 0.010 0.020
Real oil price
NA
IRU
PERIOD 1965-1983
NAIRU, LABOUR DEMAND AND SUPPLY AND OIL PRICE IN DIFFERENT SAMPLES
CHART 5
SOURCES: Reuters, The Economist, AMECO and Banco de España.
-0.08
-0.04
0.00
0.04
0.08
-0.020 -0.010 0.000 0.010 0.020
Real oil price
NA
IRU
PERIOD 1984-2007
0.00
0.00
0.00
0.00
0.00
-0.020 -0.010 0.000 0.010 0.020
Real oil price
Labo
ur d
eman
d
PERIOD 1965-1983
0.00
0.00
0.00
0.00
0.00
-0.020 -0.010 0.000 0.010 0.020
Real oil price
Labo
ur s
uppl
y
PERIOD 1965-1983
0.00
0.00
0.00
0.00
0.00
-0.020 -0.010 0.000 0.010 0.020
Real oil price
Labo
ur d
eman
d
PERIOD 1984-2007
0.00
0.00
0.00
0.00
0.00
-0.020 -0.010 0.000 0.010 0.020
Real oil price
Labo
ur s
uppl
y
PERIOD 1984-2007
Although this empirical analysis has severe limitations, it is consistent with the
evidence that the impact of oil price shocks has decreased in the developed economies
and with the role that seems to have been played in this process by the reduction in labour
market real rigidities associated with the recent labour market reforms in most European
countries [Blanchard and Gali (2007)]. It is also noteworthy that this raw material has lost
importance in the productive process in most of the countries considered. In any event,
other factors that may help to explain this are a change in the substitution elasticity between
oil and other productive inputs, and the role played by taxes on the oil derivatives demanded
by final consumers.
BANCO DE ESPAÑA 25 DOCUMENTO OCASIONAL N.º 0902
4 Conclusions
Oil prices reached very high levels in the first half of 2008, declining very significantly in the
second half of the year. The analysis of the effects of these fluctuations on the economy is
usually limited to emphasising its negative impact on demand and its positive bearing on
inflation. Not always taken into account, however, is the possible effect on the potential
output of the economy. This latter effect stems from the impact of oil prices on (measured)
productivity, capital stock and the structural unemployment rate (NAIRU) of the economy,
and, according to certain preliminary evidence, can be significant. In the case of the NAIRU,
this effect may be amplified when there is little competition in product markets and an
increase in oil prices is followed by increased mark-ups, or when high wage indexation
generates a pass-through of oil price shocks to wages. In this respect, reforms that increase
competition in product markets and improve wage-setting mechanisms help to reduce the
negative effects of oil price increases on the long-run growth of the economy. At least
the asymmetric working of these mechanisms should be avoided.
BANCO DE ESPAÑA 26 DOCUMENTO OCASIONAL N.º 0902
REFERENCES
BASU, S., and J. G. FERNALD (1997). Aggregate productivity and aggregate technology, International Finance Discussion Papers, No. 593, Board of Governors of the Federal Reserve System.
BLANCHARD, O., and J. GALI (2007). The Macroeconomic effects of oil price shocks: Why are the 2000s so different from the 1970s?, NBER Working Paper, No. 13368.
ESTRADA, Á., I. HERNANDO and J. D. LÓPEZ-SALIDO (2000). Measuring the NAIRU in the Spanish economy, Working Paper, No. 0009, Banco de España.
ESTRADA, Á., and J. D. LÓPEZ-SALIDO (2005). Sectoral mark-up dynamics in Spain, Working Paper, No. 0503, Banco de España.
FINN, M. (2000). “Perfect competition and the effects of energy price increases on economic activity”, Journal of Money, Credit and Banking, 52, pp. 400-416.
LAYARD, R., S. NICKELL and R. JACKMAN (1991). Unemployment, Macroeconomic Performance and the Labour Market, Oxford, Oxford University Press.
NAKOV, A., and A. PESCATORI (2008). Inflation-output trade-off with a dominant oil supplier, Working Paper, No. 0723, Banco de España.
ROTEMBERG, J. J., and M. WOODFORD (1996). “Imperfect competition and the effects of energy price increases”, Journal of Money, Credit and Banking, Vol. 28, No. 4, pp. 549-577.
BANCO DE ESPAÑA PUBLICATIONS
OCCASIONAL PAPERS
0501 JOSÉ RAMÓN MARTÍNEZ-RESANO: Size and heterogeneity matter. A microstructure-based analysis of
regulation of secondary markets for government bonds.
0502 ALICIA GARCÍA-HERRERO, SERGIO GAVILÁ AND DANIEL SANTABÁRBARA: China’s banking reform: an
assessment of its evolution and possible impact.
0503 ANA BUISÁN, DAVID LEARMONTH AND MARÍA SEBASTIÁ BARRIEL: An industry approach to understanding
export performance: stylised facts and empirical estimation.
0504 ANA BUISÁN AND FERNANDO RESTOY: Cross-country macroeconometric heterogeneity in EMU.
0505 JOSÉ LUIS MALO DE MOLINA: Una larga fase de expansión de la economía española.
0506 VÍCTOR GARCÍA-VAQUERO AND JORGE MARTÍNEZ: Fiscalidad de la vivienda en España.
0507 JAIME CARUANA: Monetary policy, financial stability and asset prices.
0601 JUAN F. JIMENO, JUAN A. ROJAS AND SERGIO PUENTE: Modelling the impact of aging on Social Security
expenditures.
0602 PABLO MARTÍN-ACEÑA: La Banque de France, la BRI et la création du Service des Études de la Banque
d’Espagne au début des années 1930. (There is a Spanish version of this edition with the same number.)
0603 CRISTINA BARCELÓ: Imputation of the 2002 wave of the Spanish Survey of Household Finances (EFF).
0604 RAFAEL GÓMEZ AND PABLO HERNÁNDEZ DE COS: The importance of being mature: The effect of
demographic maturation on global per-capita income.
0605 JUAN RUIZ AND JOSEP VILARRUBIA: International recycling of petrodollars. (The original Spanish version has
the same number.)
0606 ALICIA GARCÍA-HERRERO AND SERGIO GAVILÁ: Posible impacto de Basilea II en los países emergentes.
0607 ESTHER GORDO, JAVIER JAREÑO AND ALBERTO URTASUN: Radiografía del sector de servicios en España.
0608 JUAN AYUSO, ROBERTO BLANCO AND FERNANDO RESTOY: House prices and real interest rates in Spain.
0701 JOSÉ LUIS MALO DE MOLINA: Los principales rasgos y experiencias de la integración de la economía española
en la UEM.
0702 ISABEL ARGIMÓN, FRANCISCO DE CASTRO AND ÁNGEL LUIS GÓMEZ: Una simulación de los efectos de la
reforma del IRPF sobre la carga impositiva.
0703 YENER ALTUNBA�, ALPER KARA AND ADRIAN VAN RIXTEL: Corporate governance and corporate ownership:
The investment behaviour of Japanese institutional investors.
0704 ARTURO MACÍAS AND ÁLVARO NASH: Efectos de valoración en la posición de inversión internacional de
España.
0705 JUAN ÁNGEL GARCÍA AND ADRIAN VAN RIXTEL: Inflation-linked bonds from a central bank perspective.
0706 JAVIER JAREÑO: Las encuestas de opinión en el análisis coyuntural de la economía española.
0801 MARÍA J. NIETO AND GARRY J. SCHINASI: EU framework for safeguarding financial stability: Towards an
analytical benchmark for assessing its effectiveness.
0802 SILVIA IRANZO: Delving into country risk. (There is a Spanish version of this edition with the same number.)
0803 OLYMPIA BOVER: The Spanish survey of household finances (EFF): Description and methods of the 2005 wave.
0804 JAVIER DÍAZ-CASSOU, AITOR ERCE-DOMÍNGUEZ AND JUAN J. VÁZQUEZ-ZAMORA: Recent episodes of
sovereign debt restructurings. A case-study approach.
0805 JAVIER DÍAZ-CASSOU, AITOR ERCE-DOMÍNGUEZ AND JUAN J. VÁZQUEZ-ZAMORA: The role of the IMF in
recent sovereign debt restructurings: Implications for the policy of lending into arrears.
0806 MIGUEL DE LAS CASAS AND XAVIER SERRA: Simplification of IMF lending. Why not just one flexible credit
facility?
0807 MIGUEL GARCÍA-POSADA AND JOSEP M.ª VILARRUBIA: Mapa de exposición internacional de la economía
española.
0808 SARAI CRIADO AND ADRIAN VAN RIXTEL: Structured finance and the financial turmoil of 2007-2008: An
introductory overview. (There is a Spanish version of this edition with the same number.)

0809 FRANCISCO DE CASTRO Y JOSÉ M. GONZÁLEZ-MÍNGUEZ: La composición de las finanzas públicas y el
crecimiento a largo plazo: Un enfoque macroeconómico.
0810 OLYMPIA BOVER: The dynamics of household income and wealth: results from the panel of the Spanish survey
of household finances (EFF) 2002-2005. (The original Spanish version has the same number.)
0901 ÁNGEL ESTRADA, JUAN F. JIMENO AND JOSÉ LUIS MALO DE MOLINA: The Spanish economy in EMU:
The first ten years. (The original Spanish version has the same number.)
0902 ÁNGEL ESTRADA AND PABLO HERNÁNDEZ DE COS: Oil prices and their effect on potential output. (The
original Spanish version has the same number.)
0903 PALOMA LÓPEZ-GARCÍA, SERGIO PUENTE AND ÁNGEL LUIS GÓMEZ: Employment generation by small firms
in Spain.
Unidad de PublicacionesAlcalá, 522; 28027 Madrid
Telephone +34 91 338 6363. Fax +34 91 338 6488e-mail: [email protected]
www.bde.esE
Unidad de PublicacionesAlcalá, 522; 28027 Madrid
Telephone +34 91 338 6363. Fax +34 91 338 6488e-mail: [email protected]
www.bde.esE