oeconomia shifts in lithuania's agri-food industry export
TRANSCRIPT

Quarterly Journal
OeconomiA copernicana
2015 Volume 6 Issue 1, March
p-ISSN 2083-1277, e-ISSN 2353-1827 www.oeconomia.pl
Vitunskiene, V., & Serva, E. (2015). Shifts in Lithuania’s Agri-food Industry Export Com-petitiveness: a Comparative Analysis Versus High- and Medium-high Technology Manufac-turing Industries. Oeconomia Copernicana, 6(1), pp. 7-31, DOI: http://dx.doi.org/10. 12775/OeC.2015.001
Vlada Vitunskiene, Evaldas Serva∗
Aleksandras Stulginskis University, Lithuania
Shifts in Lithuania’s Agri-food Industry Export
Competitiveness: a Comparative Analysis Versus
High- and Medium-high Technology Manufacturing
Industries** JEL Classification: F14; Q17; F60; L660 Keywords: agri-food; manufacturing; end-use category; export Abstract: Given the rising importance of global value chain, this paper analyses long-run shifts in export competitiveness of Lithuania’s agri-food industry com-pared to high and medium-high-technology industries in the context of Lithuania’s export vertical specialization. The combination of two complementary parameters of competitiveness i.e. Balassa (1965) index of Revealed Comparative Advantage (RCA) and Total Effect (TE) index proposed by Nyssens and Poullet (cited in Ama-dor and Cabral, 2008, p. 202) were used. The matrix of both indexes builds on the scheme of analytical tool “products mapping” suggested by Widoto (2009). Our analytical tool is applied for the empirical analysis of export flows of goods by
© Copyright Institute of Economic Research & Polish Economic Society Branch in Toruń
Date of submission: June 13, 2014; date of acceptance: December 12, 2014 ∗ Contact: [email protected], [email protected], Aleksandras Stulginskis
University, Studentu St. 11, LT-53361 Akademija, Kauno r., Lithuania **
This research was funded by a grant (No IEP-01/2012) from the Research Council of Lithuania.

8 Vlada Vitunskiene, Evaldas Serva
three end-use categories within aggregate agri-food industry the same as four manufacturing industries classified by R&D intensities, i.e. high-, medium-high-, medium-low- and low-technology industries. The OECD’s STAN Bilateral Trade Database by Industry and End-use category at the same time was applied to empir-ical analysis. The findings based on detailed analysis indicated significant differ-ences in export competitiveness and its gains or losses in a long-term period among different reporting Lithuania’s industries and different goods by end-use category.
Introduction
The agri-food industry in Lithuania is export-oriented and plays an im-portant role in Lithuania’s economy. In recent years, 45% of processed food products in Lithuania have been exported, and the total export value of agri-food products accounted for approximately 19% of Lithuanian grand total exports of goods in value terms in 2013. Given the rising importance of global value chains (OECD, 2011) around which the world trade and production are increasingly structured (Backer & Miroudot, 2012), it should be observed that Lithuania’s export of agri-food goods was from consumption goods and intermediate inputs, which respectively accounted for 72% and for over 28% on average over the last five-year 2009–2013. During the two decades, the weight of consumption goods in total agri-food export has experienced an upward trend, whereas intermediate goods a downward trend, by +12.3% and −12.4% points in absolute change, respec-tively over the 1994–2013 period. In Lithuania’s whole export of goods, vice versa the weight of consumption goods was the least, whereas that of the intermediates was the greatest (respectively, with a share on average 25% and 60% of the total export of goods in 2009–2013). The remaining share of Lithuania’s export of goods was from capital goods, mixed end-use and miscellaneous goods, 9%, 5% and 1%, respectively, on average in 2008-2013.
The economic literature cites several definitions of Global Value Chains (GVCs). GVCs can be explained as follows. As stated by OECD (2011), according to Porter and Gereffi definition, “a value chain generally de-scribes the full range of firms’ activities from the conception of a product to its end use and beyond”. The value chain includes activities such as design, production, marketing, distribution and supply to the final consumer, which can be undertaken by a single firm or divided among different firms and can be concentrated within one location or spread out over different geo-graphical locations. It has been emphasized that the past decades have wit-nessed a strong trend towards the international dispersion of value chain

Shifts in Lithuania’s Agri-food Industry Export Competitiveness… 9
activities, hence the name GVCs. It has been argued that different stages in the production process are increasingly located across different countries and intermediate inputs are produced in one country and then exported to other countries for further production into the final consumption good (ibid). Consequently, international trade increasingly consists of the im-ports and exports of intermediates in addition to trade in final consumption goods.
In the economic literature, the term GVCs has been associated with dif-ferent concepts such as “global production sharing”, “international frag-mentation”, “vertical specialisation”, “multistage production”, “subcon-tracting”, “offshoring” and “outsourcing” (OECD, 2011), “global commod-ity chain”, “global production networks” (Henderson et al., 2002), etc. Neilson et al. (2014) hold the view that global value chains (GVCs) and global production networks (GPNs), as interrelated approaches, have been particularly useful as explanatory frameworks for understanding the global market engagement of firms, regions and nations. According to Backer and Miroudot (2012), the concept of GVCs was introduced in the early 2000s and has been successful in capturing several characteristics of the world economy: (i) the increasing fragmentation of production across countries; (ii) the specialisation of countries in tasks and business functions rather than specific products; and (iii) the role of networks, global buyers and global suppliers.
The international fragmentation forces countries to specialize in differ-ent activities in the production process (production of intermediate goods, final assembly, etc.) and countries just like firms increasingly become spe-cialised in specific functions within these GVCs (OECD, 2011). Zhu, Ya-mano and Camper (2011) note that the globalisation has been characterised by significant structural changes in trade patterns during recent decades, i.e. the rapid growth of trade in intermediate goods as a result of vertical spe-cialisation. Given this context, these authors draw attention to the issue that traditional trade statistics aggregated by product classifications may not fully reveal the country’s comparative advantages. They argued that rather than simply considering international trade as a set of bilateral flows from one country to another, it is more interesting to show the structure of GVCs. Therefore, in this article, the export competitiveness of Lithuania's agri-food and other reporting industries are investigated in the context of vertical specialization using flows of export goods by end-use categories, i.e. intermediate, household consumption and capital goods.
Most authors emphasize that the competitiveness indicators are not uni-versally endorsed. Drawing attention to this fact, O’Brien (2010) partly attributes this issue to a weak conceptual basis of competitiveness indica-tors. He suggests that the vast array of definitions of competitiveness can

10 Vlada Vitunskiene, Evaldas Serva
sometimes lead to confusion as to the purpose and relevance of competi-tiveness indicators. Sarker and Ratnesena (2014) note that, when the focus is on trade success, competitiveness can be measured with the real ex-change rate, comparative advantage indices and export or import indices; on the other hand, when competitiveness is viewed as a process or poten-tial, cost competitiveness can be measured based on various cost indicators as well as productivity and efficiency measures. The initial aim of this re-search is to examine how well Lithuania’s agri-food industry shifts in ex-port competitiveness position on international markets in comparison to its high- and medium-high technology industries over long time, specifically in recent years from the beginning of the economic crisis in 2009. It should be noted that focusing on trade success, previous competiveness studies on the agri-food sector in Lithuania include Jasinskaite and Masalskis (2001), Ferto and Hubbard (2003), Vitunskiene and Serva (2005, 2006), Jucevicius et al. (2010), Drozdz and Miskinis (2011), Saboniene et al. (2013), Starti-ene and Remeikiene (2014), Bojnec and Ferto, (2014). In all of these stud-ies excluding the last, the competitiveness was measured using Revealed Comparative Advantage (RCA) index and in Bojnec and Ferto’s study fo-cused on constant market share (CMS) model. The focus of this paper is on two approaches to competitive performance of the Lithuania’s agri-food industry and on two complementary parameters of competitiveness, i.e. Revealed Comparative Advantage (RCA) and Total Effect (TE) respective-ly.
The data on bilateral flows of export goods provided by the OECD’s STAN databases for bilateral trade in goods by industry and end-use (BTDIxE) ISIC Rev. 3 edition 2013 was applied to analyse quantitative measuring of the shifts in competitiveness in agri-food and reporting manu-facturing industries. The sample includes 86 nations. This dataset account-ed for more than 95% of the entire world’s export in value. The research included nearly past couple of decades from 1994 to 2012.
Methods and Empirical Background
Sarker and Ratnesena (2014) hold the view that the competition can be do-mestic, among farms or industries within the country, or international, in which case, comparisons are made between countries, therefore the com-petitiveness is a relative measure and beyond this general understanding. However, as it has already been emphasized, there is no agreement on how competitiveness should be measured. Durand and Giorno (1987) argued that the variety of competiveness definitions lead to its different indicators, each with its own particular application. In addition, several measures of

Shifts in Lithuania’s Agri-food Industry Export Competitiveness… 11
competitiveness may be adopted depending on the purpose to which the proposed indicator is to be put or on specific further assumptions. For ex-ample, to assess the export competitiveness in a particular industry or par-ticular goods and to compare the countries competitiveness on international markets indicators of comparative advantage and export market shares are often used (e.g. Banterle, 2005; OECD, 2011). In this article, the shifts in export competitiveness of reporting industries could be analysed from two points of view, i.e. Revealed Comparative Advantage (RCA) and Total Effect (TE). Respectively, both of these variables (i.e. RCA and TE index-es) should be adopted to build an analytical tool.
Nowadays, there are many empirical measures of competitiveness based on revealed comparative advantage. Its concept has been grounded on con-ventional international trade theory that is widely used in practice, as stated by Hinloopen and Van Marrewijk (2001). The principle of comparative advantage postulates that a country will export the goods in which it has its greatest comparative advantage and import those in which it has the least comparative advantage (Widodo, 2009). The RCA index has been applied in numerous reports and academic publications as a measure of internation-al competitiveness or export specialisation. According to the original for-mulation by Balassa (1965), the RCA formula can be expressed mathemati-cally as follows:
����� = �� ∑ ����∑ � � � ∑ ∑ � � �� ,
where: �����represents revealed comparative advantage of reporting coun-try c for industry i; and ��� denote the export of reporting country in indus-try i; ∑ ���� the grand total export of reporting country. The subscript ∑ ��� ��� refers to the export of the industry s and ∑ ∑ ������� refers to the grand total export for the rest of the counties rc, i.e. all countries without reporting country c. RCA index is the measure of export specialisation or revealed comparative advantage (disadvantage) in the reporting industry for reporting country. The RCA index takes values higher than zero. If the val-ue of the RCA exceeds unity, the country has a comparative advantage in the reporting industry, i.e. in which the country is relatively more special-ized in terms of exports. When the value of the RCA equals unity, the country has a neutral comparative advantage in international trade or its performance is the same as the average performance of the rest of the coun-ties. If the value of the RCA is less than unity, the country has a compara-tive disadvantage in the industry, in which the country is not specialized in terms of exports. According to the classification suggested by Hinloopen

12 Vlada Vitunskiene, Evaldas Serva
and Van Marrewijk (2001) the RCA index is divided into 4 classes that are interpreted as follows: − class a [>0; <1] covers all industries without a comparative advantage; − class b [>1; <2] relates to industries with weak comparative advantage; − class c [>2; <4] relates to industries with medium comparative ad-
vantage; and − class d [>4] covers industries with strong comparative advantage.
One more alternative view on measuring competitiveness suggested by Bowen and Perlman (1984 cited in Chen & Duan, 2001, p. 5) focusing on the shifts in an exporting country’s market shares as ex post reflections of changes in competitiveness can be analysed. Although shifts in export mar-ket shares are not entirely determined by changes in competitiveness, they nonetheless provide an accepted measure of changes in an exporting coun-try’s competitiveness vice versa the rest of exporting countries (Chen & Duan, 2001). According to the view expressed by Together (1990), “a competitive industry is one that possesses the sustained ability to profitably gain and maintain market share in domestic and foreign markets”.
To infer Lithuania’s agri-food and other reporting industries in com-petitiveness from shifts of their exports share in the world market the indi-cator of Total Effect (TE) from the Constant Market Share (CMS) model will be used. According to the definition suggested by Nyssens and Poullet (1990 cited in Amador & Cabral, 2008, p. 202), the TE (i.e. total change in the particular country’s share in the world market) is the difference between the growth of total exports of manufactured goods of this country and the growth of total exports of manufactured goods of the rest of the countries. The following mathematical expression gives this identity:
�� = ����,�� − �����,�� , where: ����,�� denotes the measures of weighted trend (compound growth rates) of exports X for the reporting country c and reporting industry i in value from time t0 to time t (over the particular period). The annual export growth rate between time t0 and time t (in this case five years) can be ex-pressed mathematically as follows:
����,�� = 100 × ����,���,��� /(�#��) − 1%,
�����,�� is the equivalent notion for the rest of the counties rc exports, i.e. all countries without reporting country c.

Shifts in Lithuania’s Agri-food Industry Export Competitiveness… 13
The TE index shows the annual change of reporting country’s exports share on the world market in relative term. This index includes values be-tween −∞ and ±∞ (in per cent), with positive values indicating increasing importance of the reporting country industry on the world market. If the annual growth rate of exports for reporting country is higher than that of rest of the counties, the TE will be positive and correspond to a market share gain in reporting country. This means that the country has increased its export market share and this may reflect increasing competitiveness of country’s industry. Vice versa, when the growth in exports of reporting country is lower than that of rest of the counties, the TE will be negative and correspond to a market share loss of the reporting country, that is to say, the country’s export market share has decreased and this may reflect decreasing competitiveness in country’s industry.
In order to reveal the shifts trajectory in export competitiveness of Lith-uania’s reporting industry, in a next step, the analytical technique con-structed by combining both previously described variables RCA and TE indexes and using the matrix of analytical tool termed “Product Mapping” proposed by Widodo (2009) was employed. An illustrative example of an application of “Product Mapping” can be found in Oelgemoller (2013) who analyses the competitiveness of Greece, Ireland, Portugal and Spain at the industry level; and Ishchukova and Smutka (2013), who studied the case of competitive performance in the Russian agricultural sector. Both indicators of Revealed Symmetric Comparative Advantage (RSCA) and Trade Bal-ance Index (TBI) were applied in both mentioned studies.
The dynamic comparative advantage paradigm termed “Flying Geese” (FG)1 was integrated in Widodo’s analytical tool “Product Mapping”. The FG paradigm of dynamic comparative advantage originated in the 1930s with what Kaname Akamatsu called the “ganko keitai” (a flock of flying geese) phenomenon of industrial development in catching-up economies (Kasahara, 2004). As Kanta Ray et al. (2004) note, the FG model motivates empirical research to progress beyond the narrow confines of static com-parative advantage to a systemic examination of dynamic comparative ad-vantage. Up to nowadays, the FG model has undergone various modifica-tions.
The illustration of the synthesis of both “Flying Geese” model and ana-lytical tool “Product Mapping” in Figure 1 can be explained as follows. As
1 The term “flying geese“ (FG) came from the graphic presentation of three time-series
curves for a particular product, with the time dimension on the horizontal axis. The first curve represents import; the second is for production in a national economy; and the third for export. The sequential appearance of these curves on a graph resemble geese flying in orderly ranks, each forming an inverse “V”, like geese flying in formation (Kasahara, 2004).

14 Vlada Vitunskiene, Evaldas Serva
described by Widodo (2009), imagine we are sitting in a room. Outside, there are flying geese (panel a in Figure), which corresponds with the ex-ports flow of goods for a reporting country in a reporting industry from time t0 to time t (over the reporting period). The room has a window (panel b) that corresponds with the analytical tool for industries mapping, i.e. two variables (RCA and TE) composition effect matrix. Through the window, we see flying geese (panel c) which, in our research, corresponds with the trajectory of shifts in the Lithuanian export competitiveness in reporting industry as a result affected by changes of both variables at the same time. In other words, the flying geese flock in terms of RCA change is paralleled with a similar flying geese formation in terms of TE change. In our re-search, the FG refers to a dynamic situation in RCA-TE composition matrix built on the Widodo’s analytical tool “Product Mapping”. Therefore, both variables have been introduced to develop the product/industry mapping as the RCA-THE composition effects matrix the interpretation of which is provided in figure 2 below. In this article, the terms “product mapping” and “industry mapping” and similarly the terms “product map” and “industry map” are used interchangeably.
Figure 1. The composition of “Product Mapping” and “Flying Geese”
Source: Authors’ own drawing following Widodo (2009), Photograph’ source: http://www.pbase.com/cogard/flying_ducks_geese__shorebirds%20for%20the%20geese%20flying.
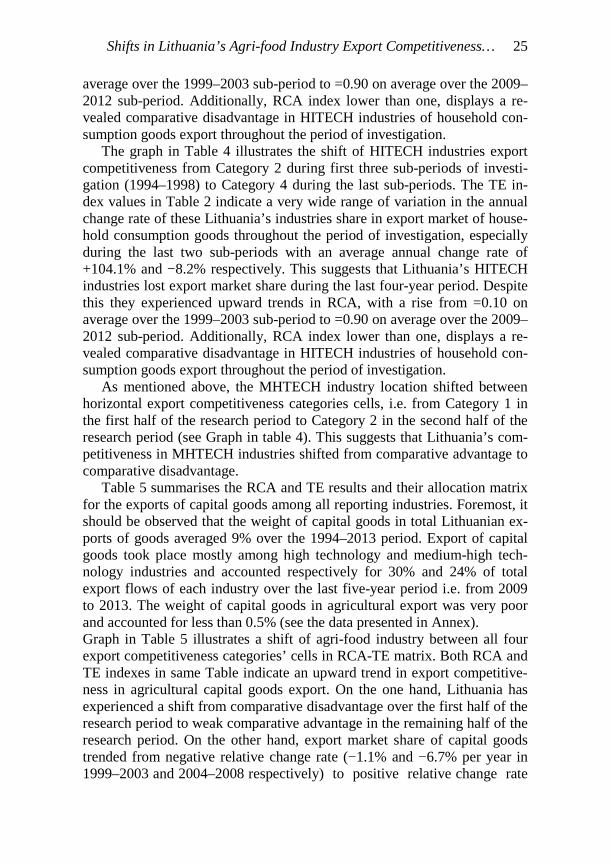
According to a possible composition of RCA-TE in product map, prod-ucts (or industries) could be classified into four categories of export com-petitiveness by advantage/disadvantage and by gain/loss in export market share as depicted in four RCA-TE composition matrix cells in Figure 2.
IV
Category 1
Category 2
Category 3
Category 4
a) Flying Geese b) Window: analytical
tool “Product Mapping” c) Flying Geese framed
in the analytical tool “Product Mapping”
Category 2
Category 4
Category 1
Category 3

Shifts in Lithuania’s Agri-food Industry Export Competitiveness… 15
Figure 2. Product mapping: the matrix illustrate of possible allocation effects of RCA-TE composition
To
tal e
ffec
t of c
han
ge
in a
n ex
po
rtin
g c
oun
try’
s m
arke
t sh
are
TE
>0
Competitiveness category 2: [RCA<1;TE>0] Comparative disadvantage; Market share gain
Competitiveness category 1: [RCA>1;TE>0] Comparative advantage; Market share gain
TE
<0
Competitiveness category 4: [RCA<1;TE<0] Comparative disadvantage; Market share loss
Competitiveness category 3: [RCA>1;TE<0] Comparative advantage; Market share loss
0>RCA>1 RCA>1
Exporting country’s revealed comparative advantage Source: own work.
Category 1 consists of products (or industries) with comparative ad-
vantage and gain in export market share. Products (or industries) in this category have export-specialization and growing share in the world market. Category 2 consists of products (or industries) with comparative disad-vantage and gain in export market share, i.e. although they have no export-specialization but their export market share is growing. Vice versa, Catego-ry 3 consists of products (or industries) with comparative advantage and loss of export market share, in other words, that were specialized in export-ing products (or industries), which are losing share in the world market. Category 4 consists of products (or industries) with comparative disad-vantage and loss of export market share, that is to say, these products (or industries) are not export-specialized and are losing share in the world mar-ket.
The OECD’s structural analysis (STAN) databases for bilateral trade in goods by industry and end-use (BTDIxE) at the same time applied to the empirical analysis. The analysis focused on the entire agri-food industry that aggregates primary economic activities of agriculture and hunting (hereinafter the agriculture) and manufacturing of food products, beverages and tobacco (hereinafter the food products manufacturing) based on the ISIC Revision 3 classification (OECD, 2014). For comparative evaluation, four manufacturing industries were classified according to direct R&D in-tensity, i.e. high technology, medium-high technology, medium-low tech-nology and low-technology industries based on the ISIC Revision 3 classi-

16 Vlada Vitunskiene, Evaldas Serva
fication were included as well. Naturally, agriculture like food products manufacturing is classified as the low-technology industry. The industries of primary and manufactured goods included in the analysis are profiled in Table 1.
Table 1. Primary and manufactured industries included in the analysis by BTDIxE classification
Industry (Symbol) ISIC Rev. 3 Primary
Agriculture, hunting (Agri) 01 Manufacturing
High-technology (HITECH) 2423, 30, 32, 33, 353 Medium-high technology (MHTECH) 24 excl. 2423, 29, 31, 34, 352,
359 Medium-low technology (MLTECH) 23, 25, 26, 27to28, 351 Low-technology (LOTECH) 15to16, 17to19, 20, 21to22,
36to37 Food, beverages and tobacco (Food) 15to16 Low-technology excluded Food, beverag-es and tobacco (LOTECH ex Food)
17to19, 20, 21to22, 36to37
Primary and Manufacturing aggregation Agriculture, hunting and Food, beverag-es and tobacco (Agri-Food)
01, 15to16
Source: authors’ preparation by the Bilateral Trade Database by Industry and End-use (BTDIxE), edition 2013, OECD (2014).
The data presented in Annex indicate that the weight of reporting agri-
food industry in total Lithuania’s export of goods in value has had an up-ward trend in the last decade and averaged 18% over the 2009–2013 sub-period compared to 12% over the 1999–2003 sub-period. The weight of medium-high and medium-low technology industries has had an upward trend as well. Their share in total export of goods increased on average from 19% to 24% and from 27% to 32% respectively if compared between the same times sub-periods. By contrast, the share of high technology in-dustries in Lithuania’s total export of goods in value decreased from 8% at an average over the 1994–1998 sub-period to 6% at an average over the 2009–2013 sub-period.
In the BTDIxE database, the trade flows are divided into nine categories of goods, including the three main end-uses categories (i.e. capital goods, intermediate inputs and consumption) and broken down by economic activ-ities based upon the ISIC Revision 3 (OECD, 2014). In this research, the

Shifts in Lithuania’s Agri-food Industry Export Competitiveness… 17
analysis is based on bilateral flows of all exported goods as well as three main end-use category goods identified in BTDIxE separately, i.e. interme-diate, household consumption and capital goods. As noted, the breakdown of trade in goods according to their end-use adds a new dimension to the traditional commodity-based trade statistics and provides a link to National Accounts Input-Output Tables, in which flows of goods and services are reported according to end-users (ibid). As Feenstra (1998) noted, rather than assigning goods by their production process, these categories assign them according to their use by purchasers.
In the System of National Accounts (SNA), there are generally three basic kinds of domestic end-use categories such as industrial intermediate inputs, consumption (by households and public sectors) and fixed capital formation. In BTDIxE, using the OECD developed the correspondence table to link Harmonised Systems (HS) classifications of trade in goods codes with Broad End-use Categories (BEC), bilateral flows of exports and imports are classified into intermediate goods, household consumption goods and capital goods (OECD, 2014). As Zhu, Yamano, and Cimper (2011) note, the BT DIxiE allows insights into the patterns of trade in in-termediate goods between countries to track global production networks and supply chains as well as helps to address other trade-related policy is-sues such as trade in value added and tasks.
The data on bilateral flows of exports goods extracted from the OECD STAN databases for Bilateral Trade in Goods by Industry and End-use (BTDIxE) ISIC Rev. 3 edition 2013 for the time-period 1994–2012. The sample includes 86 nations those together representing more than 95% of the entire world export in value. For calculation Lithuania’s RCA and TE indicators, the set of the “rest countries” covers the following 85 countries whereof: − all 27 EU countries excluding Lithuania (Austria, Belgium, Bulgaria,
Croatia, Cyprus, Czech Republic, Denmark, Estonia, Finland, France, Germany, Greece, Hungary, Ireland, Italy, Latvia, Luxembourg, Malta, Netherlands, Poland, Portugal, Romania, Slovak Republic, Slovenia, Spain, Sweden and United Kingdom);
− selected 13 OECD countries other than EU economies (Australia, Cana-da, Chile, Iceland, Israel, Japan, Korea, Mexico, New Zealand, Norway, Switzerland, Turkey and United States);
− selected 45 non-OECD economies (Algeria, Argentina, Bangladesh, Belarus, Bolivia, Bosnia and Herzegovina, Brazil, Cambodia, China, Chinese Taipei, Colombia, Costa Rica, Ecuador, Egypt, El Salvador, Guatemala, Honduras, Hong Kong, India, Indonesia, Iran, Kazakhstan, Kuwait, Malaysia, Moldova, Morocco, Nicaragua, Nigeria, Oman, Par-

18 Vlada Vitunskiene, Evaldas Serva
aguay, Peru, Philippines, Qatar, Russian Federation, Saudi Arabia, Ser-bia, Singapore, South Africa, Thailand, Tunisia, Ukraine, United Arab Emirates, Uruguay, Venezuela and Viet Nam). Note that together all “rest countries” accounted for more than 95% of the whole world export in value.
Results Calculated at the industry level by goods classified by end-use category, the RCA and TE indexes in value terms and industries mapping graphs pre-sented in Tables 2-5 provide rich information on shifts in export competi-tiveness in Lithuania’s agri-food industry and reporting manufacturing in-dustries over long research period from 1994 to 2012 subdivided into four sub-periods. In all tables, the annual rate of export growth is presented as well. These data enable to look at export growth trends at Lithuania’s and reporting set of the “rest countries” (RC) levels. Both indexes and annual export growth rate are calculated at an average term over each of the first three five-year sub-period and over last four-year sub-period as specified in all tables below. A graphical representation of both competitiveness indica-tors (RCA and TE) best depicts a shift trajectory in Lithuania’s reporting industries export competitiveness that has occurred over the past couple of decades. The graphs are constructed using data in average terms for each research sub-period that is mentioned above. The most interesting findings are summarized below by exports of total goods and by each of the main end-uses categories of intermediate inputs and final products, i.e. interme-diate goods, household consumption goods and capital goods.
Table 2 summarises the results on the exports of total goods among all reporting industries. As an indication of the long-term shift in export com-petitiveness throughout the period of investigation 1994–2012, graphic expression of “industries map” illustrates that shifts between competitive-ness categories’ cells in RCA-TE matrix did not take place to any signifi-cant extent for all reporting industries. As it can be seen, only the agri-food industry (Agri-Food) and high technology industries (HITECH) have expe-rienced a shift between vertical categories’ cells in the matrix. In both cas-es, these shifts were affected by gains in export market share. The agri-food industry as well the food sub-industry (Food) had a shift from competitive-ness Category 3 in the first research sub-period (1994–1998) to competi-tiveness Category 1 in the second and successive research sub-periods (i.e. in the years from 1999 to 2012). Simultaneously, the HITECH industries shifted from competitiveness Category 4 to Category 2 (see Agri-Food, Food and HITECH curves in Table 2). It suggests that both industries

Shifts in Lithuania’s Agri-food Industry Export Competitiveness… 19
showed an upward trend in annual relative change of export market share over the 1999–2012 while a downward trend over the 1994–1998 sub-period was established. However, this upward trend slowed considerably in HITECH industries in the years 2004–2012 and in agri-food in the years 2009–2012 (see values of the TE index given in Table 2). Over the end four-year period 2009–2012 the beginning of which coincides with the economic crisis, the export market share in Agri-Food industry increased at an average by 6.7% per year in terms of relative change, whereas HITECH and medium-high technology (MHTECH) industries shares rose at an aver-age by 10.3% and 10.7% per year, respectively.
Furthermore, RCA indices presented in Table 2 indicate a medium re-vealed comparative advantage in agri-food industry as well as Food sub-industry, except for a weak comparative advantage established for the 1999-2003 year sub-period. An important fact is that the trend seemed to be increasing, the RCA index average =1.65 over the 1999–2003 sub-period rose to =2.26 over the 2009-2012 sub-period what reflected its potential. By contrast, the HITECH and MHTECH industries displayed a revealed comparative disadvantage over the entire considered period (RCA index <1). Additionally, the RCA for MHTECH industry increased from an aver-age =0.60 in the sub-period 1999-2003 to an average =0.88 in the sub-period 2009–2012, whereas for HITECH industries, the RCA index fell from an average =0.38 in the sub-period 1994–1998 to an average =0.29 in the sub-period from1999 to 2012.
In addition, a location in the “industries map” of the other reporting manufacturing industries, like medium-high technology (MHTECH) and medium-low technology (MLTECH) industries and low-technology indus-tries excluding food products (LOTECH ex Food), did not shift between competitiveness categories’ cells in both vertical or horizontal terms (see Graph in Table 2). Despite a high variation of relative annual change rate of exports market share (like export annual growth rate) low variation was found in each of these industries.
The results of RCA and TE calculation by the exports of intermediate goods among all reporting industries are compiled in Table 3. In addition, it should be observed that nearly three-fifths of the overall Lithuanian export of goods in value was from intermediate goods (accounted for over 59% in the last decade from 2004 to 2013). Exports in intermediates took place mostly among medium-low technology and medium-high technology in-dustries and represented respectively 95% and 57% of the total export flows in each industry over the last five years from 2009 to 2013. The weight of the intermediates in total export value in agri-food industry showed downward trends throughout the period of investigation. Interme-diates share in the total export value of agriculture fell from 60% over the

Tab
le 2
. S
hifts
in
Lith
uani
a’s
exp
ort
co
mp
etiti
vene
ss i
n a
gri
-fo
od
and
ma
nufa
ctur
ing
ind
ustr
ies,
19
94
-20
12
: in
to
tal
exp
ort
s o
f go
od
s
Indu
stri
es M
ap
Indi
cato
rs
1994
-199
8 19
99-2
003
2004
-200
8 20
09-2
012
Agr
i-F
ood:
Agr
icul
ture
, Hun
ting
, Foo
d P
rodu
cts,
Bev
erag
es a
nd T
obac
co
An
nu
al e
xpor
t gr
owth
in v
alu
e in
LT
(%
) 0
.2
20.
6 3
6.8
19.
2 A
nn
ua
l exp
ort
grow
th in
va
lue
in th
e R
C (
%)
3
.9
6.3
1
5.4
12.
5 T
ota
l eff
ect
in e
xpor
t m
ark
et s
ha
re,
TE
(%
)
-3.6
1
4.3
21.
4 6
.7
RC
A in
dex
(a
n a
vera
ge)
2
.08
1.6
5 2
.05
2.2
6 F
ood:
Foo
d P
rodu
cts,
Bev
erag
es a
nd T
obac
co
An
nu
al e
xpor
t gr
owth
in v
alu
e in
LT
(%
) 0
.6
19.
6 2
9.1
15.
4 A
nn
ua
l exp
ort
grow
th in
va
lue
in th
e R
C (
%)
4
.3
6.2
1
4.9
11.
5 T
ota
l eff
ect
in e
xpor
t m
ark
et s
ha
re,
TE
(%
)
-3.7
1
3.4
14.
3 3
.9
RC
A in
dex
(a
n a
vera
ge)
2
.49
1.8
7 2
.04
2.0
7 L
OT
EC
H e
x F
ood:
Low
-Tec
hnol
ogy
Indu
stri
es e
xclu
ded
Foo
d P
rodu
cts,
Bev
erag
es a
nd T
obac
co
An
nu
al e
xpor
t gr
owth
in v
alu
e in
LT
(%
) 2
7.1
14.
6 1
2.2
15.
8 A
nn
ua
l exp
ort
grow
th in
va
lue
in th
e R
C (
%)
5
.8
5.4
9
.1
9.1
T
ota
l eff
ect
in e
xpor
t m
ark
et s
ha
re,
TE
(%
)
21.
4 9
.2
3.1
6
.7
RC
A in
dex
(a
n a
vera
ge)
1
.71
2.1
5 1
.73
1.5
3 M
LT
EC
H:
Med
ium
-Low
Tec
hnol
ogy
Indu
stri
es
An
nu
al e
xpor
t gr
owth
in v
alu
e in
LT
(%
) 1
6.1
40.
9 2
6.2
24.
9 A
nn
ua
l exp
ort
grow
th in
va
lue
in th
e R
C (
%)
7
.3
8.1
2
1.2
16.
4 T
ota
l eff
ect
in e
xpor
t m
ark
et s
ha
re,
TE
(%
)
8.8
3
2.9
5.0
8
.5
RC
A in
dex
(a
n a
vera
ge)
1
.35
1.9
7 1
.89
1.7
6 M
HT
EC
H:
Med
ium
-Hig
h Te
chno
logy
Ind
ustr
ies
An
nu
al e
xpor
t gr
owth
in v
alu
e in
LT
(%
) 2
2.0
24.
8 3
6.7
23.
3 A
nn
ua
l exp
ort
grow
th in
va
lue
in th
e R
C (
%)
7
.4
6.9
1
2.9
13.
0 T
ota
l eff
ect
in e
xpor
t m
ark
et s
ha
re,
TE
(%
)
14.
6 1
7.9
23.
9 1
0.3
RC
A in
dex
(a
n a
vera
ge)
0
.67
0.6
0 0
.78
0.8
8 N
ote:
the
larg
er th
e le
gend
mar
k is
the
late
r su
b-pe
riod
it
indi
cate
s (i
.e. t
he s
mal
lest
lege
nd m
ark
indi
cate
s th
e su
b-pe
riod
of 1
994-
1998
up
to th
e la
rges
t mar
k th
e in
dica
ting
sub
-pe
riod
of 2
009-
2012
).
HIT
EC
H:
Hig
h Te
chno
logy
Ind
ustr
ies
An
nu
al e
xpor
t gr
owth
in v
alu
e in
LT
(%
) 1
0.0
25.
6 2
1.2
19.
6 A
nn
ua
l exp
ort
grow
th in
va
lue
in th
e R
C (
%)
1
0.9
6.5
9
.7
8.9
T
ota
l eff
ect
in e
xpor
t m
ark
et s
ha
re,
TE
(%
)
-0.9
1
9.2
11.
4 1
0.7
RC
A in
dex
(a
n a
vera
ge)
0
.38
0.3
3 0
.34
0.2
9 S
ou
rce:
au
thor
s’ c
alcu
latio
n b
ased
on
the
dat
a fr
om
ST
AN
Bila
tera
l Tra
de
Dat
abas
e b
y In
du
stry
an
d E
nd
-u
se c
ateg
ory
, O
EC
D (
20
14).
-10-505101520253035
0,0
0,3
0,5
0,8
1,0
1,3
1,5
1,8
2,0
2,3
2,5
2,8
TE
RC
A
Tot
al g
ood
s
Agr
i-Foo
dF
ood
HIT
EC
HM
LTE
CH
MH
TE
CH
LOT
EC
H e
x F
ood

Shifts in Lithuania’s Agri-food Industry Export Competitiveness… 21
1994–1998 sub-period to 47% over the 2009–2013 sub-period, while in food products manufacture, intermediates share fell from 30% to 16% at the same time (see the data presented in Annex). This trend indicates that vertical specialization of Lithuania’s agri-food industry in the context of GVCs is falling constantly.
The “industries map” Graph in Table 3 indicates that the most signifi-cant shifts in export competitiveness of intermediate goods export took place in Agri-Food and HITECH industries. Both industries experienced a shift between vertical competitiveness categories cells in RCA-TE matrix. Like in the case of total goods export described above, the export competi-tiveness of intermediates in agri-food industry as well in food sub-industry shifted from Category 3 to Category 1, whereas in HITECH industries it shifted from Category 4 to Category 2 (see Agri-Food, Food and HITECH curve in Table 3). In both industries, these shifts were affected by gains of export market share. The agri-food industry showed a downward trend in intermediates’ export market share over first sub-period and an upward trend over the rest three sub-periods, with an average annual change rate of 8.9% (1994–1998) and +8.5% (1999–2003), +22.7% (2004–2008) and +3.6% (2009–2012), respectively. Meanwhile, HITECH industries showed a downward trend in market share of intermediates export in sub-period 2004–2008 (valued at −2% of average annual change rate) and an upward trend over the rest sub-periods under investigation (values of the TE index are given in Table 3).
In the last sub-period the beginning of which coincides with the eco-nomic crisis in 2009, export market share gains were twice higher in HITECH, MHTECH and MLTECH industries (average annual change rate +7.3%, +9.2% and +8.5%, respectively) than in agri-food industry (average annual change rate +3.6 %).
RCA indices presented in Table 3 indicate a weak revealed comparative advantage for intermediate goods of agri-food industry as well as food sub-industry, except for a medium revealed comparative advantage at the be-ginning of the research period. In agri-food industry, RCA index average =2.04 in sub-period 1994–1998 fell to =1.45 in sub-period 2004–2008, but rose to =1.62 in the last sub-period 2009–2012. By contrast, the HITECH and MHTECH industries displayed a revealed comparative disadvantage throughout the period of investigation (RCA index <1). In MHTECH in-dustry, the RCA rose from =0.70 on the average over the 1999–2003 sub-period to =0.91 on the average over the 2009–2012 sub-period, whereas for HITECH industries, the RCA index fell from =0.35 to =0.12 in average at the same time.

Tab
le 3
. Shi
fts in
Lith
uani
a’s
exp
ort
co
mp
etiti
vene
ss in
ag
ri-f
oo
d a
nd m
an
ufac
turi
ng in
du
stri
es,
19
94
-20
12
: in
inte
rmed
iate
go
od
s
Indu
stri
es M
ap
Indi
cato
rs
1994
-199
8 19
99-2
003
2004
-200
8 20
09-2
012
Agr
i-F
ood:
Agr
icul
ture
, Hun
ting
, Foo
d P
rodu
cts,
Bev
erag
es a
nd T
obac
co
An
nu
al e
xpor
t gr
owth
in v
alu
e in
LT
(%
) -6
.1
15.
3 4
1.8
20.
9 A
nn
ua
l exp
ort
grow
th in
va
lue
in th
e R
C (
%)
2
.8
6.8
1
9.1
17.
3 T
ota
l eff
ect
in e
xpor
t m
ark
et s
ha
re,
TE
(%
)
-8.9
8
.5
22.
7 3
.6
RC
A in
dex
(a
n a
vera
ge)
2
.04
1.5
7 1
.45
1.6
2 F
ood:
Foo
d P
rodu
cts,
Bev
erag
es a
nd T
obac
co
An
nu
al e
xpor
t gr
owth
in v
alu
e in
LT
(%
) -7
.7
8.7
3
1.8
20.
5 A
nn
ua
l exp
ort
grow
th in
va
lue
in th
e R
C (
%)
4
.0
7.1
1
9.0
16.
2 T
ota
l eff
ect
in e
xpor
t m
ark
et s
ha
re,
TE
(%
)
-11
.7
1.6
1
2.8
4.3
R
CA
ind
ex (a
n a
vera
ge)
3.1
5 1
.92
1.2
4 1
.23
LO
TE
CH
ex
Foo
d: L
ow-T
echn
olog
y In
dust
ries
exc
lude
d F
ood
Pro
duct
s, B
ever
ages
and
Tob
acco
A
nn
ua
l exp
ort
grow
th in
va
lue
in L
T (
%)
23.
7 1
1.4
13.
3 1
9.1
An
nu
al e
xpor
t gr
owth
in v
alu
e in
the
RC
(%
)
5.5
4
.1
6.7
7
.5
Tot
al e
ffec
t in
exp
ort
ma
rket
sh
are
, T
E (
%)
1
8.2
7.3
6
.5
11.
6 R
CA
ind
ex (
an
ave
rage
)
1.8
6 1
.96
1.7
1 1
.69
ML
TE
CH
: M
ediu
m-L
ow T
echn
olog
y In
dust
ries
A
nn
ua
l exp
ort
grow
th in
va
lue
in L
T (
%)
15.
5 3
4.0
27.
9 2
6.4
An
nu
al e
xpor
t gr
owth
in v
alu
e in
the
RC
(%
)
7.5
8
.4
22.
0 1
7.9
Tot
al e
ffec
t in
exp
ort
ma
rket
sh
are
, T
E (
%)
8
.0
25.
6 6
.0
8.5
R
CA
ind
ex (
an
ave
rage
)
1.5
1 1
.95
1.9
5 1
.90
MH
TE
CH
: M
ediu
m-H
igh
Tech
nolo
gy I
ndus
trie
s A
nn
ua
l exp
ort
grow
th in
va
lue
in L
T (
%)
20.
4 1
7.2
38.
3 2
2.4
An
nu
al e
xpor
t gr
owth
in v
alu
e in
the
RC
(%
)
7.8
7
.2
13.
6 1
3.2
Tot
al e
ffec
t in
exp
ort
ma
rket
sh
are
, T
E (
%)
1
2.5
10.
0 2
4.8
9.2
R
CA
ind
ex (
an
ave
rage
)
0.7
0 0
.61
0.8
2 0
.91
Not
e: th
e la
rger
the
lege
nd m
ark
is th
e la
ter
sub-
peri
od it
in
dica
tes
(i.e
. the
sm
alle
st le
gend
mar
k in
dica
tes
the
sub-
peri
od o
f 199
4-19
98 u
p to
the
larg
est m
ark
the
indi
cati
ng s
ub-
peri
od o
f 200
9-20
12).
HIT
EC
H:
Hig
h Te
chno
logy
Ind
ustr
ies
An
nu
al e
xpor
t gr
owth
in v
alu
e in
LT
(%
) 1
1.7
23.
8 4
.3
16.
9 A
nn
ua
l exp
ort
grow
th in
va
lue
in th
e R
C (
%)
1
0.9
5.4
7
.4
9.5
T
ota
l eff
ect
in e
xpor
t m
ark
et s
ha
re,
TE
(%
)
0.8
1
8.5
-3.1
7
.3
RC
A in
dex
(a
n a
vera
ge)
0
.35
0.3
7 0
.24
0.1
2 S
ou
rce:
au
thor
s’ c
alcu
latio
n b
ased
on
the
dat
a fr
om
ST
AN
Bila
tera
l Tra
de
Dat
abas
e b
y In
du
stry
an
d E
nd
-u
se c
ateg
ory
, O
EC
D (
20
14).
-15
-10-5051015202530
0,0
0,3
0,6
0,9
1,2
1,5
1,8
2,1
2,4
2,7
3,0
3,3
3,6
TE
RC
A
Inte
rmed
iate
goo
ds
Agr
i-Foo
dF
ood
HIT
EC
HM
LTE
CH
MH
TE
CH
LOT
EC
H e
x F
ood
Shifts in Lithuania’s Agri-food Industry Export Competitiveness… 23
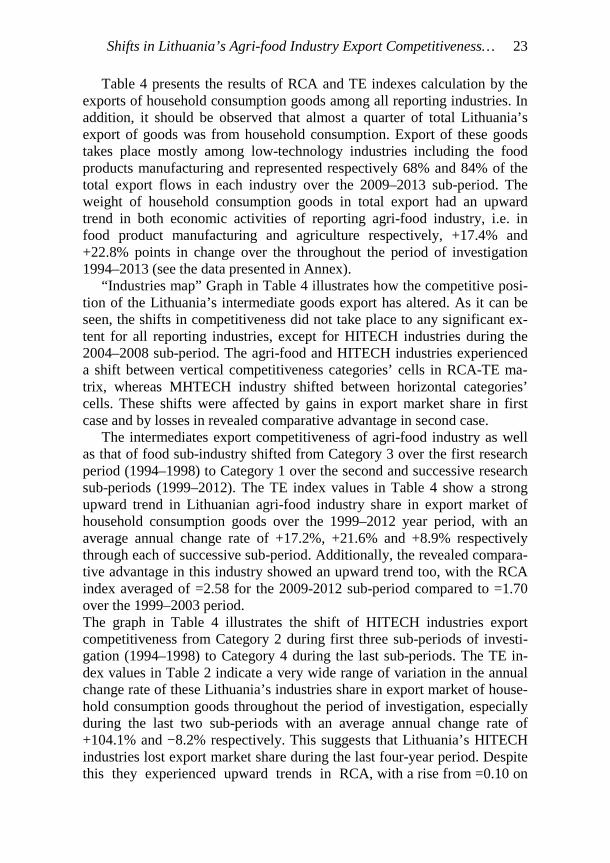
Table 4 presents the results of RCA and TE indexes calculation by the exports of household consumption goods among all reporting industries. In addition, it should be observed that almost a quarter of total Lithuania’s export of goods was from household consumption. Export of these goods takes place mostly among low-technology industries including the food products manufacturing and represented respectively 68% and 84% of the total export flows in each industry over the 2009–2013 sub-period. The weight of household consumption goods in total export had an upward trend in both economic activities of reporting agri-food industry, i.e. in food product manufacturing and agriculture respectively, +17.4% and +22.8% points in change over the throughout the period of investigation 1994–2013 (see the data presented in Annex).
“Industries map” Graph in Table 4 illustrates how the competitive posi-tion of the Lithuania’s intermediate goods export has altered. As it can be seen, the shifts in competitiveness did not take place to any significant ex-tent for all reporting industries, except for HITECH industries during the 2004–2008 sub-period. The agri-food and HITECH industries experienced a shift between vertical competitiveness categories’ cells in RCA-TE ma-trix, whereas MHTECH industry shifted between horizontal categories’ cells. These shifts were affected by gains in export market share in first case and by losses in revealed comparative advantage in second case.
The intermediates export competitiveness of agri-food industry as well as that of food sub-industry shifted from Category 3 over the first research period (1994–1998) to Category 1 over the second and successive research sub-periods (1999–2012). The TE index values in Table 4 show a strong upward trend in Lithuanian agri-food industry share in export market of household consumption goods over the 1999–2012 year period, with an average annual change rate of +17.2%, +21.6% and +8.9% respectively through each of successive sub-period. Additionally, the revealed compara-tive advantage in this industry showed an upward trend too, with the RCA index averaged of =2.58 for the 2009-2012 sub-period compared to =1.70 over the 1999–2003 period. The graph in Table 4 illustrates the shift of HITECH industries export competitiveness from Category 2 during first three sub-periods of investi-gation (1994–1998) to Category 4 during the last sub-periods. The TE in-dex values in Table 2 indicate a very wide range of variation in the annual change rate of these Lithuania’s industries share in export market of house-hold consumption goods throughout the period of investigation, especially during the last two sub-periods with an average annual change rate of +104.1% and −8.2% respectively. This suggests that Lithuania’s HITECH industries lost export market share during the last four-year period. Despite this they experienced upward trends in RCA, with a rise from =0.10 on
Tab
le
4.
Shi
fts
in
Lith
uani
a’s
exp
ort
co
mp
etiti
vene
ss
in
agri
-fo
od
an
d
ma
nuf
actu
ring
in
du
stri
es,
19
94
-20
12
: in
ho
use
hold
co
nsu
mp
tion
goo
ds
cate
gory
Ind
ustr
ies
Map
In
dica
tors
19
94-1
998
1999
-200
3 20
04-2
008
2009
-201
2
Agr
i-F
ood:
Agr
icul
ture
, Hun
ting
, Foo
d P
rodu
cts,
Bev
erag
es a
nd T
obac
co
An
nu
al e
xpor
t gr
owth
in v
alu
e in
LT
(%
) 4
.0
23.
2 3
5.0
18.
4 A
nn
ua
l exp
ort
grow
th in
va
lue
in th
e R
C (
%)
4
.4
6.0
1
3.4
9.6
T
ota
l eff
ect
in e
xpor
t m
ark
et s
ha
re,
TE
(%
)
-0.5
1
7.2
21.
6 8
.9
RC
A in
dex
(a
n a
vera
ge)
2
.12
1.7
0 2
.38
2.6
8 F
ood:
Foo
d P
rodu
cts,
Bev
erag
es a
nd T
obac
co
An
nu
al e
xpor
t gr
owth
in v
alu
e in
LT
(%
) 4
.2
22.
8 2
8.6
14.
4 A
nn
ua
l exp
ort
grow
th in
va
lue
in th
e R
C (
%)
4
.4
5.9
1
3.6
9.8
T
ota
l eff
ect
in e
xpor
t m
ark
et s
ha
re,
TE
(%
)
-0.2
1
6.8
15.
0 4
.6
RC
A in
dex
(a
n a
vera
ge)
2
.29
1.8
6 2
.29
2.3
7 L
OT
EC
H e
x F
ood:
Low
-Tec
hnol
ogy
Indu
stri
es e
xclu
ded
Foo
d P
rodu
cts,
Bev
erag
es a
nd T
obac
co
An
nu
al e
xpor
t gr
owth
in v
alu
e in
LT
(%
) 3
0.8
16.
1 1
0.5
13.
5 A
nn
ua
l exp
ort
grow
th in
va
lue
in th
e R
C (
%)
5
.6
6.2
1
0.1
9.9
T
ota
l eff
ect
in e
xpor
t m
ark
et s
ha
re,
TE
(%
)
25.
3 9
.9
0.3
3
.6
RC
A in
dex
(a
n a
vera
ge)
1
.73
2.5
4 1
.91
1.6
5 M
LT
EC
H:
Med
ium
-Low
Tec
hnol
ogy
Indu
stri
es
An
nu
al e
xpor
t gr
owth
in v
alu
e in
LT
(%
) 1
7.9
25.
7 2
9.0
20.
0 A
nn
ua
l exp
ort
grow
th in
va
lue
in th
e R
C (
%)
6
.1
6.2
9
.6
13.
6 T
ota
l eff
ect
in e
xpor
t m
ark
et s
ha
re,
TE
(%
)
11.
8 1
9.5
19.
4 6
.4
RC
A in
dex
(a
n a
vera
ge)
0
.28
0.3
8 0
.64
0.7
0 M
HT
EC
H:
Med
ium
-Hig
h Te
chno
logy
Ind
ustr
ies
An
nu
al e
xpor
t gr
owth
in v
alu
e in
LT
(%
) 1
7.9
21.
7 1
2.9
20.
8 A
nn
ua
l exp
ort
grow
th in
va
lue
in th
e R
C (
%)
5
.8
7.9
1
0.0
9.4
T
ota
l eff
ect
in e
xpor
t m
ark
et s
ha
re,
TE
(%
)
12.
1 1
3.9
3.0
1
1.4
RC
A in
dex
(a
n a
vera
ge)
1
.44
1.0
7 0
.97
0.9
0 N
ote:
the
larg
er th
e le
gend
mar
k is
the
late
r su
b-pe
riod
it
indi
cate
s (i
.e. t
he s
mal
lest
lege
nd m
ark
indi
cate
s th
e su
b-pe
riod
of 1
994-
1998
up
to th
e la
rges
t mar
k th
e in
dica
ting
sub
-pe
riod
of 2
009-
2012
).
HIT
EC
H:
Hig
h Te
chno
logy
Ind
ustr
ies
An
nu
al e
xpor
t gr
owth
in v
alu
e in
LT
(%
) 2
6.1
14.
3 1
29.3
-2
.6
An
nu
al e
xpor
t gr
owth
in v
alu
e in
the
RC
(%
)
3.3
6
.5
25.
1 5
.6
Tot
al e
ffec
t in
exp
ort
ma
rket
sh
are
, T
E (
%)
2
2.8
7.8
1
04.1
-8
.2
RC
A in
dex
(a
n a
vera
ge)
0
.15
0.1
0 0
.41
0.9
0 S
ou
rce:
au
thor
s’ c
alcu
latio
n b
ased
on
the
dat
a fr
om
ST
AN
Bila
tera
l Tra
de
Dat
abas
e b
y In
du
stry
an
d E
nd
-u
se c
ateg
ory
, O
EC
D (
20
14).
-20020406080100
120
0,0
0,3
0,6
0,9
1,2
1,5
1,8
2,1
2,4
2,7
3,0
TE
RC
A
Hou
seh
old
con
sum
ptio
n g
ood
s
Agr
i-Foo
dF
ood
HIT
EC
HM
LTE
CH
MH
TE
CH
LOT
EC
H e
x F
ood
Shifts in Lithuania’s Agri-food Industry Export Competitiveness… 25
average over the 1999–2003 sub-period to =0.90 on average over the 2009–2012 sub-period. Additionally, RCA index lower than one, displays a re-vealed comparative disadvantage in HITECH industries of household con-sumption goods export throughout the period of investigation.
The graph in Table 4 illustrates the shift of HITECH industries export competitiveness from Category 2 during first three sub-periods of investi-gation (1994–1998) to Category 4 during the last sub-periods. The TE in-dex values in Table 2 indicate a very wide range of variation in the annual change rate of these Lithuania’s industries share in export market of house-hold consumption goods throughout the period of investigation, especially during the last two sub-periods with an average annual change rate of +104.1% and −8.2% respectively. This suggests that Lithuania’s HITECH industries lost export market share during the last four-year period. Despite this they experienced upward trends in RCA, with a rise from =0.10 on average over the 1999–2003 sub-period to =0.90 on average over the 2009–2012 sub-period. Additionally, RCA index lower than one, displays a re-vealed comparative disadvantage in HITECH industries of household con-sumption goods export throughout the period of investigation.
As mentioned above, the MHTECH industry location shifted between horizontal export competitiveness categories cells, i.e. from Category 1 in the first half of the research period to Category 2 in the second half of the research period (see Graph in table 4). This suggests that Lithuania’s com-petitiveness in MHTECH industries shifted from comparative advantage to comparative disadvantage.
Table 5 summarises the RCA and TE results and their allocation matrix for the exports of capital goods among all reporting industries. Foremost, it should be observed that the weight of capital goods in total Lithuanian ex-ports of goods averaged 9% over the 1994–2013 period. Export of capital goods took place mostly among high technology and medium-high tech-nology industries and accounted respectively for 30% and 24% of total export flows of each industry over the last five-year period i.e. from 2009 to 2013. The weight of capital goods in agricultural export was very poor and accounted for less than 0.5% (see the data presented in Annex). Graph in Table 5 illustrates a shift of agri-food industry between all four export competitiveness categories’ cells in RCA-TE matrix. Both RCA and TE indexes in same Table indicate an upward trend in export competitive-ness in agricultural capital goods export. On the one hand, Lithuania has experienced a shift from comparative disadvantage over the first half of the research period to weak comparative advantage in the remaining half of the research period. On the other hand, export market share of capital goods trended from negative relative change rate (−1.1% and −6.7% per year in 1999–2003 and 2004–2008 respectively) to positive relative change rate

Tab
le 5
. Shi
fts in
Lith
uani
a’s
exp
ort
co
mp
etiti
vene
ss in
ag
ri-f
oo
d a
nd m
an
ufac
turi
ng in
du
stri
es,
19
94
-20
12
: in
cap
ital g
oo
ds
In
dust
ries
Map
In
dica
tors
19
94-1
998
1999
-200
3 20
04-2
008
2009
-201
2
Agr
i-F
ood:
Agr
icul
ture
, Hun
ting
, Foo
d P
rodu
cts,
Bev
erag
es a
nd T
obac
co
An
nu
al e
xpor
t gr
owth
in v
alu
e in
LT
(%
)
13.
9 9
.4
2.1
3
1.8
An
nu
al e
xpor
t gr
owth
in v
alu
e in
the
RC
(%
)
4.3
1
0.5
8
.8
12.
5 T
ota
l eff
ect
in e
xpor
t m
ark
et s
ha
re,
TE
(%
) 9
.6
-1.
1 -6
.7
19.
2 R
CA
ind
ex (
an
ave
rage
) 0
.62
0.3
4 2
.13
1.0
9 L
OT
EC
H e
x F
ood:
Low
-Tec
hnol
ogy
Indu
stri
es e
xclu
ded
Foo
d P
rodu
cts,
Bev
erag
es a
nd T
obac
co
An
nu
al e
xpor
t gr
owth
in v
alu
e in
LT
(%
)
16.
4 3
0.9
25.
3 1
7.6
An
nu
al e
xpor
t gr
owth
in v
alu
e in
the
RC
(%
)
8.5
3
.9
20.
3 1
5.6
Tot
al e
ffec
t in
exp
ort
ma
rket
sh
are
, T
E (
%)
7
.9
27
.0
5.0
2
.0
RC
A in
dex
(a
n a
vera
ge)
1.3
9 2
.11
2.3
8 1
.78
ML
TE
CH
: M
ediu
m-L
ow T
echn
olog
y In
dust
ries
A
nn
ua
l exp
ort
grow
th in
va
lue
in L
T (
%)
3
6.5
97.
7 0
.1
-11
.6
An
nu
al e
xpor
t gr
owth
in v
alu
e in
the
RC
(%
)
6.7
6
.2
20.
9 3
.3
Tot
al e
ffec
t in
exp
ort
ma
rket
sh
are
, T
E (
%)
2
9.8
91.
4 -2
0.8
-1
4.8
R
CA
ind
ex (
an
ave
rage
) 0
.67
3.9
5 2
.09
0.6
2 M
HT
EC
H:
Med
ium
-Hig
h Te
chno
logy
Ind
ustr
ies
An
nu
al e
xpor
t gr
owth
in v
alu
e in
LT
(%
)
5.8
2
7.4
48.
9 3
4.6
An
nu
al e
xpor
t gr
owth
in v
alu
e in
the
RC
(%
)
7.2
5
.5
15.
0 1
4.4
Tot
al e
ffec
t in
exp
ort
ma
rket
sh
are
, T
E (
%)
-1
.4
21.
8 3
3.9
20.
3 R
CA
ind
ex (
an
ave
rage
) 0
.38
0.3
3 0
.63
0.8
6 H
ITE
CH
: H
igh
Tech
nolo
gy I
ndus
trie
s N
ote:
the
larg
er th
e le
gend
mar
k is
the
late
r su
b-pe
riod
it
indi
cate
s (i
.e. t
he s
mal
lest
lege
nd m
ark
indi
cate
s th
e su
b-pe
riod
of 1
994-
1998
up
to th
e la
rges
t mar
k th
e in
dica
ting
sub
-pe
riod
of 2
009-
2012
).
An
nu
al e
xpor
t gr
owth
in v
alu
e in
LT
(%
)
2.8
3
4.6
25.
7 2
5.8
An
nu
al e
xpor
t gr
owth
in v
alu
e in
the
RC
(%
)
8.3
4
.6
14.
1 9
.8
Tot
al e
ffec
t in
exp
ort
ma
rket
sh
are
, T
E (
%)
-5
.5
30.
0 1
1.6
16.
0 R
CA
ind
ex (
an
ave
rage
) 0
.46
0.3
9 0
.57
0.3
5 S
ou
rce:
au
thor
s’ c
alcu
latio
n b
ased
on
the
dat
a fr
om
ST
AN
Bila
tera
l Tra
de
Dat
abas
e b
y In
du
stry
an
d E
nd
-u
se c
ateg
ory
, O
EC
D (
20
14).
-30
-20
-100102030405060708090100
0,0
0,4
0,8
1,2
1,6
2,0
2,4
2,8
3,2
3,6
4,0
TE
RC
A
Ca
pita
l goo
ds
Agr
i-Foo
dH
ITE
CH
MLT
EC
HM
HT
EC
HLO
TE
CH

Shifts in Lithuania’s Agri-food Industry Export Competitiveness… 27
(+19.2% per year in 2009–2012). Whereas, as it can be seen in the same Graph, both HITECH and MHTECH industries locations shifted vertically from Category 4 to Category 2. This suggests a comparative disadvantage (RCA index<1,) in these industries for capital goods export throughout the period of investigation, with strong upward trends in average annual change rate over the last three research sub-periods (TE index>1) as compared to negative change rate over the first research sub-periods (TE index>1), for details, see Table 5.
Conclusions
This article adopts an industrial approach to assessing export competitive-ness in Lithuania’s agri-food industry by comparing manufacturing indus-tries according to their technological intensity, more specifically, high and medium-high-technology industries. The agriculture like food products manufacturing was classified as the low-technology industry. Dual classifi-cation of export flows of goods by industry’s technological intensity and end-use category designed in BTDIxE was adapted. The classification of trade flows by end-use categories allowed analysing Lithuania’s export competitiveness in the context of vertical specialization that can involve either intermediate goods or final goods. The composition of two indexes, i.e. RCA and TE were used to assess the shifts in export competitiveness over a long almost twenty-year period. According to possible compositions of RCA-TE in “product mapping” analytical tool, industries were classified into four categories of export competitiveness by revealed comparative advantage/disadvantage and by export share gain/loss in the world market.
The agri-food industry in Lithuania is export-oriented, has a significant and an increasing weight in the Lithuania’s exports and accounted for near-ly one-fifth of Lithuania’s whole exports of goods in recent years. Detailed analysis results suggest that there has been a downward trend of export share of intermediate inputs in relative to upward trend of export share of consumption goods in total exports of this industry in last twenty-year peri-od. There is an opposite trend in relative to the whole rest courtiers. It indi-cates that the Lithuanian agri-food industry is less and less involved in the global food value chains whose importance is rising progressively.
A more detailed analysis indicated significant differences in export competitiveness and its gains or losses in a long-term period among differ-ent reporting Lithuania’s industries and different goods by end-use catego-ry.

28 Vlada Vitunskiene, Evaldas Serva
During the considered period, both agri-food industry and food sub-industry had a medium comparative advantage in export of consumption goods (except for a weak comparative advantage in the 1999–2003 sub-period) and weak comparative advantage in export of intermediate inputs. Although a loss of export market share of both end-use categories of agri-food goods was recorded during the first sub-period (1994–1998), the com-petitive position subsequently improved with an upward trend of annual change rate of market share over the rest sub-periods under investigation. These suggest a clear trend of improvement in export competitiveness of agri-food industry.
The findings on HITECH and MHTECH industries revealed different results. Both industries had a comparative disadvantage with an upward trend in consumption goods export of HITECH and intermediates export of MHTECH and downward trend in intermediates export of HITECH and consumption goods export of MHTECH. However, it is important to note that both industries were competitive in terms of the total market share ef-fect, i.e. they showed an upward trend in annual change of market share during the considered period, with the exception of two cases of downward trend in HITECH industry.
References
Amador, J., & Cabral, S. (2008). The Portuguese export performance in perspec-
tive: A constant market share analysis. Banco de Portugal Economic Bulletin. Backer, K., & Miroudot, S. (2012). Mapping global value chains. Paper prepared
for the Final WIOD Conference: Causes and Consequences of Globalization, Groningen, The Netherlands, April 24-26.
Balassa, B. (1965). Trade liberalization and revealed comparative advantage. The Manchester School of Economic and Social Studies, 33. New York: Cambridge University Press.
Banterle, A. (2005). Competitiveness and agri-food trade: an empirical analysis in the European Union. In 11th Congress of the EAAE ‘The Future of Rural Eu-rope in the Global Agri-Food System’. Copenhagen.
Bojnec, Š., & Fertő, I. (2014). Agri-food exports from European Union Member States using constant market share analysis. Studies in Agricultural Economics, 116. http://dx.doi.org/10.7896/j.1404.
Chen, K. Z., & Duan, Y. (2001). Competitiveness of Canadian agri-food exports against competitors in Asia: 1980-97. Journal of International Food and Agri-business Marketing, 11(4). http://dx.doi.org/10.1300/J047v11n04_01.
Cheptea, A., Fontagné, L, & Zignago, S. (2014). European export performance. Review of World Economics. 150(1). http://dx.doi.org/10.1007/s10290-013-0176-z.

Shifts in Lithuania’s Agri-food Industry Export Competitiveness… 29
Droždz, J., & Miškinis, A. (2011). Rusijos, Baltarusijos ir Kazachstano muitų sąjungos žemės ūkio ir maisto produktų santykinio pranašumo vertinimas. Pi-nigų studijos, 15(2).
Durand, M., & Giorno, C. (1987). Indicators of international competitiveness: con-ceptual aspects and evaluation. OECD economic studies, 9(2).
Feenstra, R. C. (1998). Integration of Trade and Disintegration of Production in the Global Economy. The Journal of Economic Perspectives, 12(4). http://dx.doi.org/10.1257/jep.12.4.31.
Ferto, I., & Hubbard, L.J. (2003). The Dynamics of Agri–Food Trade Patterns – The Accession Countries’ Case. In: Contributed Paper Presented at the Inter-national Conference Agricultural Policy Reform and the WTO: where are we heading? Capri. June 23–26.
Henderson, J., Dicken, P., Hess, M., Coe, N., &Yeung, H. W. C. (2002). Global production networks and the analysis of economic development. Review of in-ternational political economy, 9(3). http://dx.doi.org/10.1080/09692290210 150842.
Hinloopen, J., & Van Marrewijk, C. (2001). On the empirical distribution of the Balassa index. Weltwirtschaftliches Archiv, 137(1). http://dx.doi.org/10.1007 /BF02707598.
Ishchukova, N., & Smutka, L. (2013). Comparative Advantage: Products Mapping of the Russian Agricultural Exports. AGRIS on-line Papers in Economics and Informatics, 5(3).
Jasinskaitė, S., & Masalskis K. (2001). Pramonės konkurencingumas ES. Lietuvos ekonomikos apžvalga, Gegužė.
Jucevičius, R., Vitunskienė, V., & Šajeva, S. (2010). Lietuvos maisto produktų gamybos pramonės konkurencingumas: mokslo studija. Kauno technologijos universitetas. Kaunas.
Kanta Ray, P., Ida, M., Suh, C. S., & Rhaman, S. U. (2004). Dynamic Capabilities of Japanese and Kore-an Enterprises and the ‘Flying Geese’of International Competitiveness. Asia Pacific Business Review, 10(3-4).
Kasahara, S. (2004). The Flying Geese Paradigm: A critical study of its applica-tion to East Asian regional development. Discussion Paper No. 169, United Na-tions Conference on Trade and Development, April.
Neilson, J., Pritchard, B., & Yeung, H. W. C. (2014). Global value chains and global production networks in the changing international political economy: An introduction. Review of International Political Economy, 21(1).
O’Brien, D. (2010). Measuring Ireland’s Price and Labour Cost Competitiveness. Bulletin trimestriel.
OECD. (2011). Global Value Chains: Preliminary Evidence and Policy Issues, DSTI/IND3, Paris, OECD.
OECD. (2014). OECD Bilateral Trade Database by Industry and End-use (BTDIxE), edition 2013. Directorate for Science, Technology and Industry, Di-vision for Economic Analysis and Statistics.
Oelgemoller. J. (2013). Revealed comparative advantages in Greece, Ireland, Por-tugal and Spain. Intereconomics. 48(4). http://dx.doi.org/10.1007/s10272-013-0466-7.

30 Vlada Vitunskiene, Evaldas Serva
Rimkus, V., & Karlaitė, D. (2011). Tendencies of the Lithuanian dairy produce and export. Business Systems and Economics, 1(1).
Saboniene, A., Masteikiene, R., & Venckuviene, V. (2013). Lithuania’s Export Specialization According to Technological Classification. Mediterranean Jour-nal of Social Sciences, 4(11). http://dx.doi.org/10.5901/mjss.2013.v4n11p346.
Sarker, R., & Ratnesena, S. (2014). Revealed Comparative Advantage and Half-A-Century Competitiveness of Canadian Agriculture: A Case Study of Wheat, Beef and Pork Sectors (No. 165675). http://dx.doi.org/10.1111/cjag.12057.
Startienė, G., & Remeikienė, R. (2014). Evaluation of Revealed Comparative Ad-vantage of Lithuanian Industry in Global Markets. Procedia-Social and Behav-ioral Sciences, 110. 428-438. http://dx.doi.org/10.1016/j.sbspro.2013.12.887.
Together, G. (1990). A Report to Ministers of Agriculture Task Force on Competi-tiveness in the Agri-Food Industry, Larry J. Martin (Task Force Chairperson). Working Group Reports.
Vitunskienė, V., & Serva, E. (2006). Atskleistasis santykinis pranašumas: teorinis požiūris ir analizė Lietuvos pieno sektoriuje ES-15 atžvilgiu. Ekonomika, 73.
Vitunskienė, V., & Serva, E. 2005. Atskleistasis santykinis pranašumas Lietuvos pieno sektoriuje. Vagos, 68 (21).
Widodo, T. (2009). Comparative advantage: theory, empirical measures and case studies. Review of Economic and Business Studies, II( 2).
Zhu, S., Yamano, N., & Cimper, A. (2011). Compilation of bilateral trade data-base by industry and end-use category (No. 2011/6). OECD Publishing.
Appendix Annex 1. Share of industries and end-use categories in Lithuanian total export of goods
1994-1998
1999-2003
2004-2008
2009-2013 2013
by industry GRAND TOTAL 100% 100% 100% 100% 100% Agriculture, Hunting 3.5% 2.5% 4.3% 7.0% 7.8% Total Manufacturing 89.7% 91.9% 91.9% 89.4% 89.1%
High Technology Industries 7.8% 7.7% 7.3% 5.9% 6.1% Medium-High Technology Industries 21.8% 18.7% 23.8% 24.8% 24.4% Medium-Low Technology Industries 19.4% 27.1% 31.7% 31.6% 31.6% Low-Technology Industries 40.7% 38.3% 29.1% 27.1% 27.0%
Food products, Beverages and Tobacco 16.0% 9.8% 10.0% 11.4% 11.4% Agriculture, Hunting, Food products, Beverages and Tobacco
19.4% 12.3% 14.3% 18.3% 19.2%
by end-use category of goods in industry GRAND TOTAL
Intermediate goods 59.0% 57.3% 59.4% 59.3% 58.4% Household consumption goods 28.5% 28.2% 24.5% 25.4% 26.1% Capital goods 6.5% 8.8% 10.2% 9.0% 9.6% Other goods (mixed end-use and miscellaneous) 6.0% 5.8% 5.9% 6.3% 5.9%

Shifts in Lithuania’s Agri-food Industry Export Competitiveness… 31
Annex 1 continued
1994-1998
1999-2003
2004-2008
2009-2013 2013
Agriculture, Hunting Intermediate goods 60.1% 67.1% 51.2% 47.1% 45.2% Household consumption goods 39.5% 32.6% 47.8% 52.7% 54.7% Capital goods 0.4% 0.3% 1.0% 0.2% 0.1% Other goods (mixed end-use and miscellaneous) 0.0% 0.0% 0.0% 0.0% 0.0%
Total Manufacturing Intermediate goods 56.3% 54.7% 58.3% 59.3% 58.6% Household consumption goods 30.2% 29.7% 24.3% 24.3% 24.4% Capital goods 7.2% 9.5% 11.0% 10.0% 10.7% Other goods (mixed end-use and miscellaneous) 6.3% 6.0% 6.3% 6.5% 6.3%
High Technology Industries Intermediate goods 46.2% 55.0% 31.6% 17.5% 16.2% Household consumption goods 1.7% 1.1% 5.9% 16.0% 10.2% Capital goods 29.6% 27.1% 39.5% 29.9% 31.1% Other goods (mixed end-use and miscellaneous) 22.5% 16.8% 23.1% 36.6% 42.4%
Medium-High Technology Industries Intermediate goods 53.9% 53.3% 56.3% 57.0% 54.8% Household consumption goods 14.4% 11.8% 8.0% 6.6% 7.4% Capital goods 14.2% 12.8% 19.0% 23.7% 27.2% Other goods (mixed end-use and miscellaneous) 17.4% 22.0% 16.6% 12.7% 10.6%
Medium-Low Technology Industries Intermediate goods 94.7% 85.5% 91.6% 95.0% 95.6% Household consumption goods 1.5% 1.5% 1.8% 2.0% 2.5% Capital goods 3.7% 12.6% 6.2% 2.4% 1.4% Other goods (mixed end-use and miscellaneous) 0.2% 0.4% 0.5% 0.6% 0.5%
Low-Technology Industries Intermediate goods 41.2% 33.9% 30.1% 28.9% 28.4% Household consumption goods 57.8% 64.4% 67.2% 68.4% 68.7% Capital goods 1.0% 1.6% 2.5% 2.1% 2.1% Other goods (mixed end-use and miscellaneous) 0.0% 0.0% 0.3% 0.6% 0.7%
Food products, Beverages and Tobacco Intermediate goods 29.7% 22.1% 14.2% 16.0% 16.4% Household consumption goods 70.3% 77.9% 85.8% 83.9% 83.5% Other goods (mixed end-use and miscellaneous) 0.0% 0.0% 0.0% 0.1% 0.1% Source: authors’ calculation based on the data from STAN Bilateral Trade Database by Industry and End-use category, OECD (2014).