october 14, 2021 dear ibm stockholder
TRANSCRIPT

October 14, 2021
Dear IBM Stockholder:
In October 2020, IBM announced plans to separate into two market-leading companies, each withstrategic focus and flexibility to drive customer and stockholder value. Both will leverage their respectivestrategies and strengths to accelerate customers’ digital transformations.
The first, IBM, will focus on hybrid cloud and AI. IBM will leverage an open strategy, technology andplatform innovation, and expertise to address the $1 trillion hybrid cloud market opportunity. Post separation,IBM will move from a company with more than half of its revenues in services to one with a majority in high-value cloud software and solutions.
The second, Kyndryl, will provide innovative services to design, run and modernize customer technologyenvironments, participating in a $415 billion market. These services will enable enterprises to realize strong,secure, resilient, and adaptive technology environments. Kyndryl is uniquely positioned to address theseIT services needs, as a natural extension of the role it plays supporting the mission critical technologyinfrastructure of the world’s most important businesses and institutions.
As separate businesses, each can capitalize on their respective missions. Both will have more agility tofocus on their operating and financial models, both will have greater freedom to partner with others, andboth will align their investments and capital to their strategic focus areas. All of this will create value for clientsand for you, the investors, with an improved financial profile of both companies.
The separation will occur by means of a pro rata distribution to IBM stockholders of 80.1% of theoutstanding shares of Kyndryl. IBM will retain 19.9% of the shares of Kyndryl common stock with theintention of exchanging those shares for IBM debt during the 12-month period following the distribution,subject to market considerations.
Each holder of IBM common stock will receive one share of Kyndryl common stock for every fiveshares of IBM common stock held on October 25, 2021, the record date for the distribution. The distributionis expected to occur on November 3, 2021. It is intended that, for U.S federal income tax purposes, thedistribution generally will be tax-free to IBM stockholders.
You do not need to take any action to receive shares of Kyndryl common stock to which you areentitled as an IBM stockholder. You do not need to pay any consideration or surrender or exchange yourshares of IBM common stock to participate in the spin-off.
I encourage you to read the attached information statement, which is being provided to all IBMstockholders who hold shares on the record date for the distribution. The information statement describesthe separation in detail and contains important business and financial information about Kyndryl.
We remain committed to working on your behalf to continue to build long-term stockholder value.
Sincerely,
Arvind KrishnaChairman and Chief Executive OfficerInternational Business Machines Corporation

October 14, 2021
Dear Future Kyndryl Stockholder:
As we work toward our separation from IBM, I am delighted to welcome you as a future Kyndrylstockholder. This is an exciting time for our new company, which is already recognized as a global leader indesigning, building, managing and modernizing mission-critical information and technology systems at scale.More than 4,000 organizations around the world already depend on our nearly 90,000 world-classtechnologists, consultants and service professionals every day, all focused on growing our business, servingeven more customers and delivering value for you.
As an independent company, we will be flatter, faster, more focused and organized around high-priority customer needs and opportunities. We will also have more freedom to invest in and build on ourcapabilities to serve an addressable market that we expect to expand to over $500 billion by 2024, which isbeing driven by an explosion in data, migration to the cloud to manage all the data and analytics, and anurgent and obvious need to make information and technology systems more secure.
We are starting “life” as a clear leader in our business, with a world-class board of directors, anexperienced management team, an investment grade balance sheet, a revenue base of $19 billion and acommitment to achieving sustainable margins, consistent cash flows and meaningful returns for stockholders.Importantly, we are committed to deploying our capital in a disciplined way to create sustainable long-termvalue.
In line with our values, we will actively seek to better society by attracting and retaining diverse talent,embracing best-in-class ethical standards, and working to operate more sustainably — particularly aroundthe use of renewable energy to power our data centers.
Our growth plan is built around being the provider of choice for our customers — providing essentialservices, powering their IT environments and helping them succeed in their digital transformationjourneys — as well as the employer of choice in our industry. We bring and will build on an extraordinaryintellectual property portfolio, we have unique experience across the technology ecosystem, and we can workwith a broader set of technology partners to meet customers’ needs and preferences.
In short, we are embarking on an exciting new path, with a passion for advancing the vital systems thatpower human progress. We are committed to earning your trust and ongoing investment in the future. I lookforward to the opportunities ahead and encourage you to learn more about Kyndryl by reading theenclosed information statement.
Sincerely,
Martin SchroeterChief Executive OfficerKyndryl Holdings, Inc.
INFORMATION STATEMENT
Kyndryl Holdings, Inc.
Common Stock(par value $0.01 per share)
Kyndryl Holdings, Inc. (“Kyndryl” or “we”), a wholly-owned subsidiary of International BusinessMachines Corporation (“IBM”), is sending you this Information Statement in connection with the spin-offof Kyndryl by IBM. To effect the spin-off, IBM will distribute 80.1% of our common stock on a pro ratabasis to the holders of IBM common stock. We expect that the distribution of our common stock will betax-free to holders of IBM common stock for U.S. federal income tax purposes, except for cash thatstockholders may receive (if any) in lieu of fractional shares. Immediately after the distribution becomeseffective, IBM will own 19.9% of the outstanding shares of our common stock. Prior to completing thedistribution, IBM may adjust the percentage of our common stock to be distributed to IBM stockholders andretained by IBM in response to market and other factors, and we will amend this information statement toreflect any such adjustment.
If you are a record holder of IBM common stock as of the close of business on October 25, 2021,which is the record date for the distribution, you will be entitled to receive one share of our common stockfor every five shares of IBM common stock that you hold on that date. IBM will distribute its shares of ourcommon stock in book-entry form, which means that we will not issue physical stock certificates. Thedistribution agent will not distribute any fractional shares of our common stock.
The distribution will be effective as of 5:00 p.m., New York City time, on November 3, 2021. Immediatelyafter the distribution becomes effective, we will be an independent, publicly traded company.
IBM’s stockholders are not required to vote on or take any other action to approve the spin-off. We arenot asking you for a proxy, and request that you do not send us a proxy. IBM stockholders will not be requiredto pay any consideration for the shares of our common stock they receive in the spin-off, and they will notbe required to surrender or exchange their shares of IBM common stock or take any other action in connectionwith the spin-off.
No trading market for our common stock currently exists. We expect, however, that a limited tradingmarket for our common stock, commonly known as a “when-issued” trading market, will develop as earlyas one trading day prior to the record date for the distribution, and we expect “regular-way” trading of ourcommon stock will begin on the first trading day after the distribution date. We have been approved tolist our common stock on the New York Stock Exchange under the ticker symbol “KD.”
In reviewing this Information Statement, you should carefully consider the matters described in the sectionentitled “Risk Factors” beginning on page 13 of this Information Statement.
Neither the Securities and Exchange Commission nor any state securities commission has approved ordisapproved these securities or determined if this Information Statement is truthful or complete. Anyrepresentation to the contrary is a criminal offense.
This Information Statement is not an offer to sell, or a solicitation of an offer to buy, any securities.
The date of this Information Statement is October 14, 2021.

TABLE OF CONTENTS
Page
Trademarks and Copyrights . . . . . . . . . . . . . . . . . . . . . . . . . . . . . . . . . . . . . . . . . . . . . . . . . . . iiIndustry And Market Data . . . . . . . . . . . . . . . . . . . . . . . . . . . . . . . . . . . . . . . . . . . . . . . . . . . . iiInformation Statement Summary . . . . . . . . . . . . . . . . . . . . . . . . . . . . . . . . . . . . . . . . . . . . . . . 1Risk Factors . . . . . . . . . . . . . . . . . . . . . . . . . . . . . . . . . . . . . . . . . . . . . . . . . . . . . . . . . . . . . . 13Cautionary Statement Concerning Forward-Looking Statements . . . . . . . . . . . . . . . . . . . . . . . . . 29The Spin-Off . . . . . . . . . . . . . . . . . . . . . . . . . . . . . . . . . . . . . . . . . . . . . . . . . . . . . . . . . . . . . 30Dividend Policy . . . . . . . . . . . . . . . . . . . . . . . . . . . . . . . . . . . . . . . . . . . . . . . . . . . . . . . . . . . . 36Capitalization . . . . . . . . . . . . . . . . . . . . . . . . . . . . . . . . . . . . . . . . . . . . . . . . . . . . . . . . . . . . . 37Unaudited Pro Forma Condensed Combined Financial Statements . . . . . . . . . . . . . . . . . . . . . . . . 38Business . . . . . . . . . . . . . . . . . . . . . . . . . . . . . . . . . . . . . . . . . . . . . . . . . . . . . . . . . . . . . . . . . 50Management’s Discussion and Analysis of Financial Condition and Results of Operations . . . . . . . 61Management . . . . . . . . . . . . . . . . . . . . . . . . . . . . . . . . . . . . . . . . . . . . . . . . . . . . . . . . . . . . . . 96Director Compensation . . . . . . . . . . . . . . . . . . . . . . . . . . . . . . . . . . . . . . . . . . . . . . . . . . . . . . 103Compensation Discussion and Analysis . . . . . . . . . . . . . . . . . . . . . . . . . . . . . . . . . . . . . . . . . . . 104Security Ownership of Certain Beneficial Owners and Management . . . . . . . . . . . . . . . . . . . . . . . 115Certain Relationships and Related Party Transactions . . . . . . . . . . . . . . . . . . . . . . . . . . . . . . . . . 117Material U.S. Federal Income Tax Consequences . . . . . . . . . . . . . . . . . . . . . . . . . . . . . . . . . . . . . 123Description of Our Capital Stock . . . . . . . . . . . . . . . . . . . . . . . . . . . . . . . . . . . . . . . . . . . . . . . 127Where You Can Find More Information . . . . . . . . . . . . . . . . . . . . . . . . . . . . . . . . . . . . . . . . . . 132Index to Financial Statements . . . . . . . . . . . . . . . . . . . . . . . . . . . . . . . . . . . . . . . . . . . . . . . . . . F-1
i

TRADEMARKS AND COPYRIGHTS
We own or have rights to various trademarks, logos, service marks and trade names that we use inconnection with the operation of our business. We also own or have the rights to copyrights that protect thecontent of our products. Solely for convenience, the trademarks, service marks, trade names and copyrightsreferred to in this Information Statement are listed without the ™, ® or © symbols, but such references do notconstitute a waiver of any rights that might be associated with the respective trademarks, service marks,trade names and copyrights included or referred to in this Information Statement.
INDUSTRY AND MARKET DATA
This Information Statement includes data concerning our industry and the markets in which weoperate that is based on information from public filings, internal company sources, management estimatesand various third-party sources. All such industry data is available publicly or for purchase and was notcommissioned specifically for us. Forecasts based upon such data involve risks and uncertainties, andactual results regarding the subject matter of such forecasts are subject to change based upon various factorsbeyond our control.
The sources of certain statistical data, industry data, estimates and forecasts contained in thisInformation Statement are the following independent industry publications or reports:
• Gartner, Smarter With Gartner: Top Security and Risk Trends for 2021, dated April 5, 2021.
• Gartner, Forecast: IT Services, Worldwide, 2019-2025, 1Q21 Update, dated March 25, 2021 (the“Gartner IT Services Report”).
• Gartner, Forecast Analysis: Digital Business Consulting Services, Worldwide, dated December 7,2020 (the “Gartner Consulting Services Forecast Report”).
• Gartner Press Release, Gartner Forecasts Strong Revenue Growth for Global Container ManagementSoftware and Services Through 2024, dated June 25, 2020.
• Gartner, Forecast Analysis: Cloud Consulting and Implementation Services, Worldwide, datedMarch 5, 2020.
We performed calculations of market sizes and growth rates using Gartner research from the GartnerIT Services Report and the Gartner Consulting Services Forecast Report.
The Gartner reports described herein (the “Gartner Content”) represent research opinions or viewpointspublished, as part of a syndicated subscription service, by Gartner, Inc. (“Gartner”) and are notrepresentations of fact. Each Gartner Content speaks as of its original publication date (and not as of thedate of this Information Statement), and the opinions expressed in the Gartner Content are subject to changewithout notice.
ii

INFORMATION STATEMENT SUMMARY
In this Information Statement, unless the context otherwise requires:
• The “Company,” “Kyndryl,” “we,” “our” and “us” refer to Kyndryl Holdings, Inc. (a newly formedholding company) and, unless otherwise indicated or the context otherwise requires, its consolidatedsubsidiaries after giving effect to the Spin-Off; and
• “IBM” or “Parent” refers to International Business Machines Corporation and its consolidatedsubsidiaries.
The transaction in which IBM will distribute to its stockholders 80.1% of the shares of our commonstock is referred to in this Information Statement as the “Distribution” or the “Spin-Off.” Any references toIBM stockholders in this Information Statement refer to holders of IBM’s common stock. Prior to IBM’sDistribution of the shares of our common stock to its stockholders, IBM will undertake a series of internalreorganization transactions, pursuant to which, among other transactions, Kyndryl will hold, through itssubsidiaries, IBM’s managed infrastructure services business, which we refer to as the “Business.” We refer tothis series of internal reorganization transactions as the “Reorganization Transactions.”
Our Company
We are a leading technology services company and the largest infrastructure services provider in theworld, serving as a partner to more than 4,000 customers in over 100 countries. We have a long track recordof helping enterprises navigate major technological changes, particularly by enabling our customers tofocus on the core aspects of their businesses during these shifts while trusting us with their most criticalsystems. Today, enterprises are engaged in individual and unique digital transformations to differentiate theirbusinesses and derive value through better customer experiences. However, enterprises often face shortagesin critical technical expertise to successfully make this complex change. Our purpose is therefore to design,build, and manage secure and responsive private, public, and multicloud environments to accelerate ourcustomers’ digital transformations.
We put the customer at the center of everything we do, every day. We provide engineering talent,operating paradigms, and insights derived from our data around IT patterns. This enables us to deliveradvisory, implementation, and managed services at scale across technology infrastructures that allow ourcustomers to de-risk and realize the full value of their digital transformations. We do this while embracing newtechnologies and solutions, and continually expanding our skills and capabilities, as we help advance thevital systems that power progress for our customers. We are also organized to be fast and focused, in orderto respond more quickly to our customers’ needs, and our principles have led to a structure that drivesaccountability and responsibility to the teams that work closely with them and our partners. We delivertransformation and secure cloud services capabilities, insights, and depth of expertise to modernize andmanage IT environments based on our customers’ unique patterns of transformation at scale. We offerservices across domains such as cloud services, core enterprise and zCloud services, applications, data, andartificial intelligence services, digital workplace services, security and resiliency services, and network and edgeservices as we continue to support our customers through technological change. Our services enable us tomodernize and manage cloud and on-premise environments as “one” for our customers, enabling them toscale seamlessly.
To deliver these services, we rely on our team of skilled practitioners, consisting of approximately90,000 professionals. Given our large and diversified customer base operates in multiple industries andgeographies, we utilize a flexible labor and delivery model with a balanced mix of global and local talent asneeded to meet customer-specific needs, regulatory requirements, and data protection and labor laws. Ouremployees leverage their deep engineering expertise and extensive experience operating complex andheterogeneous technology environments to drive service quality, intellectual property development, and ourlong-term trusted customer relationships.
As described in “ — Our Customers,” we have many customer relationships that are decades long, aswe provide high-quality, mission-critical services that are core to operations with customers that representthe backbones of their respective industries. These customers entrust us to deliver the services they need, andmanage their complex environments so that they can achieve their business objectives.
1

As an independent company, we will be free to partner with a broader ecosystem, including a widerange of hyperscale cloud providers, system integrators, independent software vendors, and technologyvendors from startups to market leaders. This enables us to serve our customers with the contemporarytechnology capabilities that best fit their needs and open new avenues for growth. This is all underpinned byour ability to integrate and operate mission-critical technology at scale using deep engineering expertiseand intellectual property.
Our approach has enabled us to reach significant scale, with $19.4 billion in revenue for the fiscal yearended December 31, 2020. We are focused on driving revenue growth with sustainable margins by extendingour leadership in the markets in which we operate while investing in our capabilities, and expanding ourhigh value, next generation services consistent with customer needs.
Our Industry and Market Opportunity
We participate in an industry that provides services for customers’ technology environments that powertheir businesses. These services span areas such as management of mission-critical systems across dedicateddata centers and multiple clouds. As customers advance their digital transformations, they are looking forpartners that understand their business objectives and unique digital journeys, and have the skills to instrumentand engineer the IT environments to enable their transformations. Our long standing position as aninformed and trusted partner, with decades-long relationships and leading capabilities, provides us with theknowledge and expertise to best help existing and new customers realize their future.
The market for these services is large and dynamic. We project this market, which is a subset of thetotal IT services market, to represent a $415 billion opportunity in 2021, growing 7% annually to $510 billionin 2024. Growth in this market is driven by services that are aligned to customers’ transformations, andrepresent an incremental $75 billion. These transformation services include several high-growth portions ofthe market that each exceed approximately $10 billion in opportunity, including public cloud managed services(compounded annual growth of 11% from 2021 to 2024), data services (compounded annual growth of18% from 2021 to 2024), security services (compounded annual growth of 12% from 2021 to 2024), andintelligent automation services (compounded annual growth of 27% from 2021 to 2024). Managed servicesfor edge environments represents a smaller portion connected to many other opportunities, and itself isexpected to experience compounded annual growth above 100% from 2021 to 2024.
Several trends underpin the growth of our market, including:
• Greater demand for digital transformation services. Companies continue to digitally transform todeliver better customer experiences and compete more effectively, which drives the need for services tosupport modernization of IT within the enterprise. The COVID-19 global pandemic has acceleratedthis already pervasive trend, as organizations look to further their digital capabilities. InternationalData Corporation (“IDC”) estimates that approximately 65% of GDP will be digitized by 2022.Illustrating the growth in digitization, U.S. online retail sales surged by 32% year-over-year in 2020.While customers seek to transform, skills availability often represents a challenge, with lack of skillsranked as one of the top 3 impediments to transformation of the IT environment according toTechnology Business Research, Inc.
• Ongoing migration to the cloud. Companies continue to migrate workloads to the cloud, adoptingnew capabilities for flexibility, workload portability, and management. These transitions are oftencomplex, with companies seeking assistance from service providers. Gartner forecasts that by 2025,85% of large organizations will have engaged external service providers to migrate applications to thecloud, an increase from 43% in 2019. Furthermore, Gartner projects that by 2022, more than 75%of global organizations will be running containerized applications in production (an increase from lessthan 30% today) and worldwide revenue for container management will double by 2024. Theextension of public cloud services to multiple environments in different locations has given rise todistributed cloud and migration of workload to these infrastructures that have a greater fit for purpose.
• Rapid data growth. As economies have evolved digitally, significantly increasing data volume,management of this data has become much more complex. IDC estimates that in 2020, enterprisescreated and captured 64 zettabytes of data. The challenge for many organizations is how to collect,harness and govern this data for insights that yield business results and realize data as a differentiator.
2

In order to leverage advanced capabilities such as artificial intelligence and machine learning toenable their business use cases, enterprises need to address data privacy, compliance, security,multicloud data management and data governance across physical and virtual layers of the IT estate.
• Increasing need for secure systems. As technology environments become increasingly complex andonline, remote and distributed work environments persist, cybersecurity will remain of paramountimportance as threats proliferate. Breaches in security can have severe, lasting financial and reputationalconsequences on businesses. In response, businesses continue to build out their cybersecurityefforts, using service providers to augment their capabilities. According to PwC’s 2021 CEO Survey,one-third of U.S. CEOs plan to increase investments in cybersecurity by double digits, with 47% ofCEOs citing cyber threats as sources of extreme concern to growth prospects. Enterprises seekservice providers that can deploy the expertise and resources needed to manage their growingcybersecurity needs with an efficient and comprehensive approach. Gartner estimates approximately80% of organizations currently have 16 or more tools from different vendors in their cybersecurityportfolio, recognize vendor consolidation as an avenue for reduced costs and better security thataddresses the complexity in their IT environments, and are, therefore, interested in vendor consolidationstrategies.
• Accelerating pace of technological advancement. As companies adopt new technologies for improvedbusiness performance and innovation, they face a challenge in complexity to integrate these newtechnologies with their existing IT estates. As a result, the required skills, integration burden, and costin end-to-end operational management often increases. This drives adoption of new capabilities,such as automation, artificial intelligence, and machine learning to ensure that the IT environment iswell designed and orchestrated to effectively realize business objectives.
Our Services
We provide advisory, implementation, and managed services in and across a range of technologydomains to help our customers manage and modernize enterprise IT environments in support of theirbusiness and transformation objectives. Our services are differentiated based on our expertise and intellectualproperty, and data around IT patterns across customers in the following domains:
• Cloud Services: We design, build, and provide managed services for our customers’ multicloudenvironments. We apply a mix of skilled practitioners, intelligent automation and modern servicemanagement principles of Site Reliability Engineering, AIOps, Infrastructure as Code and DevOps.We help enterprises optimize their use of hyperscale cloud providers in a unified environment,seamlessly integrating services delivered by: ISVs, large public cloud providers, internal platforms,and other technologies (e.g., IoT).
• Core Enterprise & zCloud Services: We establish and operate modern, dedicated technologyinfrastructure on behalf of enterprise customers to enable their current and future growth andprofitability objectives. We support a range of enterprise infrastructure, including private clouds,mainframe environments, distributed computing, enterprise networks, and storage environments.
• Application, Data, and Artificial Intelligence Services: We provide end-to-end enterprise dataservices, including data transformation, data architecture and management, data governance andcompliance, and data migration. We support Chief Digital Officers and CIOs in governing the vastquantities of enterprise data across internal and external sources to drive their digital strategies,transactions, and business objectives, while maintaining security, ethical standards, and compliancewith country-specific data protection regulations (e.g., GDPR, HIPAA, and PCI). We provide servicesto design, build, manage, and automate the IT environments for enterprise applications as theymigrate to the cloud. Our services help CIOs and Chief Technology Officers (CTOs) unlock the fullvalue of leading third-party Enterprise Resource Planning systems (e.g., Oracle, SAP) and packagedapplications through the use of AI and software-defined technologies.
• Digital Workplace Services: Our digital workplace services provide the technology infrastructure,mobility, security, and access solutions to support a global workforce that is constantly evolving. Ourservices include enterprise mobility solutions that provide users with the ability to work seamlesslyacross environments and locations.
3

• Security & Resiliency Services: We provide comprehensive enterprise cyber-security services for ChiefInformation Security Officers and CRO, including: insights, protection, detection, response, andrecovery to support the security of our client's hybrid IT estate, data and operations. Concurrently,we provide resiliency services that include a mix of business continuity planning and cloud-baseddisaster recovery capabilities (composed of experts, digital tools and automation, and failoverenvironments). These services allow our customers to operate without issue or disruption in responseto attacks, outages, natural disasters, and geopolitical events.
• Network Services & Edge: We provide network and edge services to help customers meet theirtechnological and commercial requirements for connectivity and compute across their digitalenvironments. Our strategy and assessment services help evaluate customers’ network needs for theirmulticloud environments, while our network transformation and managed services allow customersto realize benefits of the latest software-defined network technologies. We deliver these services with aproprietary framework and architecture coupled with proof of concepts to then implement andmanage enterprise networks with the right economics.
Our Competitive Strengths
We are a recognized leader in many of the services we provide, as acknowledged by research analysts(e.g., Everest, Forrester, Gartner, and IDC). We are known for our technology integration and modernizationexpertise — designing, building, and managing complex technology environments. Our worldwide andhigh-quality service delivery is underpinned by experienced and highly-trained practitioners that bring thebest of our capabilities to our customers on a daily basis. Importantly, our culture of customer serviceexcellence — especially in times of crisis, from COVID-19 to tsunamis, floods, cyber-attacks, and poweroutages — carries on from our heritage through our people. Given our unique capabilities, scale, intellectualproperty, and engineering talent, we are positioned to partner with enterprises for their future across arange of technologies, use cases, and business strategies to help them maximize the return on their technologyinvestments and digital transformations.
Our competitive strengths stem from our intellectual property and data around IT patterns, our mission-critical expertise, and our broad ecosystem of partners:
• We are a leader in technology services. We are the largest provider of IT infrastructure services andare recognized by research analysts (e.g., Gartner, Forrester, IDC, Everest, NelsonHall, and HfSResearch) as a leader in key service areas. We possess significant experience in virtually all industries,gained through collaboration with customers across over 30 years designing, building, and managingoperating environments for their IT systems. Our highly skilled workforce provides the expertise(e.g., approximately 13,000 Red Hat accreditations) to securely and reliably handle many of the mostcomplex issues. In conjunction with our delivery capabilities (such as artificial intelligence thataugments our people) and scale, we provide mission-critical services to a diversified customer base.We also have unique intellectual property applicable to IT environments, as reflected by our portfolioof approximately 3,000 patents.
• We consistently deliver unsurpassed performance and reliability for complex environments. Our expertpractitioners and talented engineers provide services through modern ways of working, including agileand design thinking. Additionally, our unique intellectual property and industry-leading technologyplatforms utilize contemporary approaches to IT operations to provide reliable and efficient solutionsfor each customer’s operating model. These capabilities allow us to execute with secure and compliantoperating and delivery models at scale, driving high-quality performance and customer satisfaction.We realize high quality performance across thousands of service-level agreements and consistentlyachieve world-class customer satisfaction and advocacy.
• We deliver insights at scale, supported by unique automation capabilities and application of AI. Ourability to deliver superior outcomes for customers is driven by our capacity to leverage our data aroundIT patterns and insights, derived from multiple technology environments across customerengagements. We apply machine learning, combined with our practitioner expertise to derive uniqueinsights used to service customers, enhance our offerings and to produce our next-generationservices, investing to ensure continuous innovation for improved outcomes. For example, we are
4

recognized leaders in the use of automation and operational AI in the delivery of our services, withover 6,000,000 automated actions per month, enabling greater quality and efficiency for us and ourcustomers. Our operational AI approach and set of technologies, along with intellectual propertythat we apply and continually evolve, are leveraged to develop predictive actions to prevent issuesbefore they arise.
• We are a recognized leader in managed services for cloud and on-premise environments and servicessuch as security and resiliency. We offer a range of high-value capabilities including cloud services, andsecurity & resiliency services, providing us with a sustainable competitive advantage when helpingcustomers transform their technology environments. Our multicloud management capabilities aredifferentiated by our ability to deliver an integrated view of our customers’ diverse technologyenvironments and to provide our services and solutions digitally. We offer integrated services betweenthe cloud and on-premise environments.
• We offer an integrated ecosystem to help customers adopt and run an increasingly heterogeneous set oftechnologies. As customers pursue multiple cloud-based technology partners, applications, andcapabilities, integration is increasingly critical for customers to manage and orchestrate the technologyecosystem required to run their businesses and achieve their broader objectives. We provide holisticservices across thousands of diverse technologies, delivering end-to-end integration across public andprivate / on-premise cloud platforms and other full-stack technology solutions. Following the Spin-Off, we will enhance our ecosystem of partners, including large public cloud providers, application-oriented system integrators, independent software vendors, and other players in the technologystack to provide the best technology and capability for our customers. Our services and ecosystemsenable us to offer leading services for all levels of customer environment complexity and integration.
Our Strategies
We will pursue a strategy centered on our ability to build and enrich trusted relationships withcustomers and technology partners, differentiating through our proven ability to create and deploy scale-derived intellectual property, provide mission-critical expertise across industries, and partner with a broadecosystem for contemporary capabilities that best suit customers’ needs. We have a strong and long-standingfoundation developed by governing and managing complex technology environments, including IBM (e.g.,Red Hat and Cloud Paks) and third-party technologies (e.g., VMWare, ServiceNow, and Microsoft). Withincreased freedom of action, we will extend these capabilities to an even broader ecosystem of technologyproviders and develop more services that are digitally consumable to expand accessibility to new customersand markets.
We have a long track record of running customers’ technology environments, enabling them to focuson the core aspects of their businesses. Given the nature of the work we do, we have a unique perspective onthe operating paradigms that enable the high-quality technology environments which our customers havecome to rely on for their most critical systems. This position enables us to meet customers where they are intheir unique digital transformations, work alongside our customers to take them where they want to be,and in turn enable them to realize the full, at-scale value of that journey. Underpinning all of this are ourintellectual property, mission-critical expertise across industries, and a broad ecosystem.
We benefit from the long-standing and deep relationship with IBM. We manage the largest installedbase of IBM hardware and software products, including some of the most complex deployments. While wewill be an independent and distinct entity following the separation, we will continue to work with IBM on anarms-length basis. In addition to any transition services agreements for services that IBM will provide tous as part of the Spin-Off, they will be part of our partner ecosystem from the standpoint of a technologyprovider, cloud provider, and application services partner. See “Certain Relationships and Related PartyTransactions — Agreements with IBM — Other Arrangements.”
As we look to the future, our focus is centered on the following strategic tenets:
• Scale Insights and Intellectual Property. We will invest to position ourselves at the forefront ofdeveloping and innovating the services and operating paradigms for the evolution and integration ofmission critical technology, further expanding our existing intellectual property in differentiatedareas. Our depth of experience implementing and operating complex architectures across technology
5
sets has yielded valuable experience and intellectual property that has defined the operating paradigmfor much of the technology stack. We have approximately 3,000 patents that relate to various areasof running complex technology environments, including certain patents related to multi-cloudmanagement, orchestration, integrated monitoring, issue triage and resolution, and several otherareas that enable quality of service. Our mission-critical expertise across all industries, augmented byour automation platforms that draw on our IP and data, is a key differentiator in managing complextechnology environments.
• Diverse Ecosystem with Freedom of Action. As an independent entity, we will have the freedom ofaction to develop a broad ecosystem of strategic partnerships with a wider set of technology andservices companies to complement our relationship with IBM. We will invest in an ecosystem oftechnology providers and corresponding skill-sets that are increasingly relevant as enterprises digitizeand transform their business models, building on our existing base of certifications across manymarket-leading technologies. In parallel, we will extend our operating paradigms and governance andcompliance models to this broader set of technologies to integrate and provide end-to-endcapabilities for our customers as they digitize and evolve their environments.
• Digitally Consumable Services Models. Looking ahead, we see opportunity to further expand inareas where we can better serve customers through consumption models that allow them to experienceour services digitally. These models will combine our platforms, our technology governance, andour ecosystem with ease-of-use and scalability, tailored to the needs of specific customer segmentssuch as middle-market enterprises.
To execute these strategies, our operating model will reflect that of a services company, emphasizingcustomers and resulting in a flatter, faster, and more focused company. We will pursue an investment andco-investment strategy focused on building our team, developing aligned intellectual property and automation,and broadening our ecosystem of partnerships.
The Spin-Off
On October 8, 2020, IBM announced plans for the complete legal and structural separation of ourBusiness from IBM. In reaching the decision to pursue the Spin-Off, IBM considered a range of potentialstructural alternatives for the Business and concluded that the Spin-Off is the most attractive alternative forenhancing stockholder value. To effect the separation, first, IBM will undertake the series of ReorganizationTransactions described under “Certain Relationships and Related Party Transactions — Agreements withIBM — Separation and Distribution Agreement.” IBM will subsequently distribute 80.1% of our commonstock to IBM’s stockholders, and following the Distribution, Kyndryl, holding the Business, will become anindependent, publicly traded company. IBM will retain 19.9% of our outstanding shares following theDistribution. Prior to completion of the Spin-Off, we intend to enter into a separation and distributionagreement (the “Separation and Distribution Agreement”) and several other agreements with IBM related tothe Spin-Off. These agreements will govern our relationship with IBM up to and after completion of theSpin-Off and allocate between us and IBM and various assets, liabilities and obligations, including employeebenefits, intellectual property and tax-related assets and liabilities. See “Certain Relationships and RelatedParty Transactions” for more information.
IBM’s plan to transfer less than all of our common stock to its stockholders in the Distribution ismotivated by its desire to establish, in an efficient and non-taxable, cost-effective manner, an appropriatecapital structure for each of us and IBM, including by reducing, directly or indirectly, IBM’s indebtednessduring the 12-month period following the Distribution. We understand that IBM currently intends to disposeof all of our common stock that it retains after the Distribution through one or more subsequent exchangesof our common stock for IBM debt held by one or more investment banks or, if market and generaleconomic conditions and sound business judgment do not support such exchanges during the 12-monthperiod following the Distribution, IBM may dispose of such common stock (i) through distributions to IBMstockholders as dividends or in exchange for outstanding shares of IBM common stock, in each caseduring the 12-month period following the Distribution or (ii) in one or more public or private sale transactions(including potentially through secondary transactions) as soon as practicable, taking into account marketand general economic conditions and sound business judgment, but in no event later than five years after theDistribution.
6

Completion of the Spin-Off is subject to the satisfaction or waiver of a number of conditions. Inaddition, IBM has the right not to complete the Spin-Off if, at any time, IBM’s board of directors, or the“IBM Board,” determines, in its sole and absolute discretion, that the Spin-Off is not in the best interests ofIBM or its stockholders, or is otherwise not advisable. See “The Spin-Off — Conditions to the Spin-Off”for more information.
Following the Spin-Off, we and IBM will each have a more focused business that will be betterpositioned to invest more in growth opportunities and execute strategic plans best suited to address thedistinct market trends and opportunities for the respective businesses. Following the ReorganizationTransactions, we will hold IBM’s former managed infrastructure services business, and we will have greateragility to design, run and modernize the technology environments of some of the world’s most importantorganizations. We plan to focus on further developing our expertise in broad and complex mission-criticalIT environments and our separation from IBM will allow IBM to focus on its open hybrid cloud platform andartificial intelligence capabilities. Further, the Spin-Off will allow our management team to devote its timeand attention to the corporate strategies and policies that are based specifically on the needs of our Business.We plan to create incentives for our management and employees that align more closely with our businessperformance and the interests of our stockholders, which will help us attract, retain and motivate highlyqualified personnel. Moreover, the Spin-Off is expected to increase the aggregate trading price of each of ourand IBM’s common stock above what the trading price of IBM common stock would have had if it hadcontinued to represent an interest in both the businesses, allowing each company to use its stock to pursueand achieve strategic objectives including evaluating and effectuating acquisitions. Additionally, we believe theSpin-Off will help align our stockholder base with the characteristics and risk profile of the respectivebusinesses. See “The Spin-Off — Reasons for the Spin-Off” for more information.
Following the Spin-Off, we expect our common stock will trade on the New York Stock Exchangeunder the ticker symbol “KD.”
Our Corporate Information
We were incorporated in December 2020. Our corporate headquarters will be located at One VanderbiltAvenue, 15th Floor, New York, New York 10017, and our telephone number is (212) 896-2098. Our websiteaddress is www.kyndryl.com. Information contained on, or that can be accessed through, our website isnot part of, and is not incorporated into, this Information Statement.
Questions and Answers about IBM’s Reasons for the Spin-Off
The following provides only a summary of certain information regarding IBM’s reasons for the Spin-Off. You should read this Information Statement in its entirety for a more detailed description of the mattersdescribed below.
Q: What are the reasons for the Spin-Off?
A: The IBM Board believes that the separation of the managed infrastructure services businessfrom IBM is in the best interests of IBM stockholders and for the success of the managedinfrastructure services business for a number of reasons. See “The Spin-Off — Reasons forthe Spin-Off” for more information.
Q: Why is our separation structured as a spin-off?
A: IBM believes that a distribution of our shares that is tax-free to IBM and its stockholders forU.S. federal income tax purposes is the most efficient way to separate our business from IBM.
Questions and Answers about the Spin-Off
The following provides only a summary of certain information regarding the Spin-Off. You shouldread this Information Statement in its entirety for a more detailed description of the matters describedbelow.
Q: What is the Spin-Off?
7
A: The Spin-Off is the method by which we will separate from IBM. In the Spin-Off, IBM willdistribute to its stockholders 80.1% of the outstanding shares of our common stock. Followingthe Spin-Off, we will be an independent, publicly traded company, and IBM will continue toretain 19.9% of the outstanding shares of our common stock.
Q: Is the completion of the Spin-Off subject to the satisfaction or waiver of any conditions?
A: Yes, the completion of the Spin-Off is subject to the satisfaction, or the IBM Board’s waiver,of certain conditions. Any of these conditions may be waived by the IBM Board to the extentsuch waiver is permitted by law. In addition, IBM may at any time until the Distributiondecide to abandon the Distribution or modify or change the terms of the Distribution. See“The Spin-Off — Conditions to the Spin-Off” for more information.
Q: Will the number of IBM shares I own change as a result of the Spin-Off?
A: No, the number of shares of IBM common stock you own will not change as a result of theSpin-Off.
Q: Will the Spin-Off affect the trading price of my IBM common stock?
A: The trading price of shares of IBM common stock immediately following the Distribution isexpected to be lower than the trading price immediately prior to the Distribution because thetrading price will no longer reflect the value of the Business. IBM believes that our separationfrom IBM offers its stockholders the greatest long-term value. There can be no assurance that,following the Distribution, the combined trading prices of the IBM common stock and ourcommon stock will equal or exceed what the trading price of IBM common stock would havebeen in the absence of the Spin-Off.
It is possible that after the Spin-Off, our and IBM’s combined equity value will be less thanIBM’s equity value before the Spin-Off.
Q: What will I receive in the Spin-Off in respect of my IBM common stock?
A: As a holder of IBM common stock, you will receive a dividend of one share of our commonstock for every five shares of IBM common stock you hold on the Record Date (as definedbelow). The distribution agent will distribute only whole shares of our common stock in theSpin-Off. See “The Spin-Off — Treatment of Fractional Shares” for more information on thetreatment of the fractional share you may be entitled to receive in the Distribution. Yourproportionate interest in IBM will not change as a result of the Spin-Off. For a more detaileddescription, see “The Spin-Off.”
Q: What is being distributed in the Spin-Off?
A: IBM will distribute approximately 179,360,070 shares of our common stock in the Spin-Off,based on the approximately 896,800,350 shares of IBM common stock outstanding as ofSeptember 30, 2021. The actual number of shares of our common stock that IBM willdistribute will depend on the total number of shares of IBM common stock outstanding onthe Record Date. The shares of our common stock that IBM distributes will constitute 80.1%of the issued and outstanding shares of our common stock immediately prior to theDistribution. For more information on the shares being distributed in the Spin-Off, see“Description of Our Capital Stock — Common Stock.”
Q: What do I have to do to participate in the Distribution?
A: All holders of IBM’s common stock as of the Record Date will participate in the Distribution.You are not required to take any action in order to participate, but we urge you to read thisInformation Statement carefully. Holders of IBM common stock on the Record Date will notneed to pay any cash or deliver any other consideration, including any shares of IBMcommon stock, in order to receive shares of our common stock in the Distribution. In addition,no stockholder approval of the Distribution is required. We are not asking you for a voteand request that you do not send us a proxy card.
8

Q: What is the record date for the Distribution?
A: IBM will determine record ownership as of the close of business on October 25, 2021, whichwe refer to as the “Record Date.”
Q: When will the Distribution occur?
A: The Distribution will be effective as of 5:00 p.m., New York City time, on November 3, 2021,which we refer to as the “Distribution Date.”
Q: How will IBM distribute shares of our common stock?
A: On the Distribution Date, IBM will release the shares of our common stock to the distributionagent to distribute to IBM stockholders. The whole shares of our common stock will becredited in book-entry accounts for IBM stockholders entitled to receive the shares in theDistribution. If you own IBM common stock as of the close of business on October 25, 2021,the shares of our common stock that you are entitled to receive in the Distribution will beissued to your account as follows:
Registered stockholders: If you own your shares of IBM common stock directly throughIBM’s transfer agent (Computershare Trust Company, N.A.), you are a registered stockholder.In this case, the distribution agent will credit the whole shares of our common stock youreceive in the Distribution by way of direct registration in book-entry form to a new accountwith our transfer agent. Registration in book-entry form refers to a method of recording shareownership where no physical stock certificates are issued to stockholders, as is the case in theDistribution. You will be able to access information regarding your book-entry account forshares of our common stock at [email protected] or by calling (833) 981-5963or (781) 575-4557 (non-U.S.).
“Street name” or beneficial stockholders: If you own your shares of IBM common stockbeneficially through a bank, broker or other nominee, the bank, broker or other nominee holdsthe shares in “street name” and records your ownership on its books. In this case, your bank,broker or other nominee will credit your account with the whole shares of our common stockthat you receive in the Distribution on or shortly after the Distribution Date. We encourageyou to contact your bank, broker or other nominee if you have any questions concerning themechanics of having shares held in “street name.”
See “The Spin-Off — When and How You Will Receive Our Shares” for a more detailedexplanation.
Q: If I sell my shares of IBM common stock on or before the Distribution Date, will I still be entitled toreceive shares of our common stock in the Distribution?
A: If you sell your shares of IBM common stock before the Record Date, you will not beentitled to receive shares of our common stock in the Distribution. If you hold shares ofIBM common stock on the Record Date and decide to sell them on or before the DistributionDate, you may have the ability to choose to sell your IBM common stock with or withoutyour entitlement to receive our common stock in the Distribution. You should discuss theavailable options in this regard with your bank, broker or other nominee. See “The Spin-Off — Trading Prior to the Distribution Date” for more information.
Q: How will fractional shares be treated in the Distribution?
A: The distribution agent will not distribute any fractional shares of our common stock inconnection with the Spin-Off. Instead, the distribution agent will aggregate all fractional sharesinto whole shares and sell the whole shares in the open market at prevailing market prices onbehalf of IBM stockholders entitled to receive a fractional share. The distribution agent willthen distribute the aggregate cash proceeds of the sales, net of brokerage fees, transfer taxesand other costs, pro rata to these holders (net of any required withholding for taxes applicableto each holder). We anticipate that the distribution agent will make these sales in the “when-issued” market, and “when-issued” trades will generally settle within two trading days following
9

the Distribution Date. See “Q: How will our common stock trade?” for additional informationregarding “when-issued” trading and “The Spin-Off — Treatment of Fractional Shares” fora more detailed explanation of the treatment of fractional shares. The receipt of cash in lieu offractional shares generally will be taxable to the recipient IBM stockholders for U.S. federalincome tax purposes as described in the section entitled “Material U.S. Federal Income TaxConsequences of the Spin-Off.” The distribution agent will, in its sole discretion, without anyinfluence by IBM or us, determine when, how, through which broker-dealer and at whatprice to sell the whole shares of our common stock. The distribution agent is not, and anybroker-dealer used by the distribution agent will not be, an affiliate of either IBM or us.
Q: What are the U.S. federal income tax consequences to me of the Distribution?
A: IBM has received a private letter ruling from the Internal Revenue Service (“IRS”), to theeffect that, among other things, the Distribution, including the retention of 19.9% of the sharesof our common stock, will qualify as a transaction that is tax-free for U.S. federal incometax purposes under Sections 355 and 368(a)(1)(D) of the Internal Revenue Code of 1986 (the“Code”). Completion of the Spin-Off is conditioned on IBM’s receipt of a separate writtenopinion from Paul, Weiss, Rifkind and Wharton & Garrison LLP to the effect that theDistribution will qualify for non-recognition of gain and loss under Section 355 and relatedprovisions of the Code. Accordingly, it is expected that the Distribution, together with certainrelated transactions, qualifies as a transaction that is tax-free to IBM and IBM’s stockholders,for U.S. federal income tax purposes, under Sections 368(a)(1)(D) and 355 of the Code, andthus no gain or loss will be recognized by, or be includible in the income of, a U.S. Holder(as defined in “Material U.S. Federal Income Tax Consequences of the Spin-Off”) as a resultof the Distribution, except with respect to any cash (if any) received by IBM stockholdersin lieu of fractional shares. After the Distribution, IBM stockholders will allocate their basisin their IBM common stock held immediately before the Distribution between their IBMcommon stock and our common stock in proportion to their relative fair market values onthe date of Distribution. IBM may also waive the tax opinion as a condition to the completionof the Spin-Off. IBM does not currently intend to waive this condition to the obligation tocomplete the Spin-Off. If IBM were to waive this condition, it would communicate such waiverto IBM stockholders in a manner as described in “The Spin-Off — Conditions to the Spin-Off.” See “Material U.S. Federal Income Tax Consequences of the Spin-Off” for moreinformation regarding the potential tax consequences to you of the Spin-Off. You shouldconsult your tax advisor as to the particular tax consequences of the Spin-Off to you.
Q: How will IBM vote any shares of our common stock it retains?
A: IBM is expected to agree to vote any shares of our common stock that it retains in proportionto the votes cast by our other stockholders and is expected to grant us a proxy with respectto such retained shares. As a result, IBM will not be able to exert any control over us throughthe shares of our common stock it retains. For additional information on these votingarrangements, see “Certain Relationships and Related Person Transactions — Agreementswith IBM — Stockholder and Registration Rights Agreement.”
Q: What does IBM intend to do with any shares of our common stock it retains?
A: We understand that IBM currently intends to dispose of all of our common stock that itretains after the Distribution through one or more subsequent exchanges of our common stockfor IBM debt held by one or more investment banks or, if market and general economicconditions and sound business judgment do not support such exchanges during the 12-monthperiod following the Distribution, IBM may dispose of such common stock (i) throughdistributions to IBM stockholders as dividends or in exchange for outstanding shares of IBMcommon stock, in each case during the 12-month period following the Distribution or (ii) inone or more public or private sale transactions (including potentially through secondarytransactions) as soon as practicable, taking into account market and general economicconditions and sound business judgment, but in no event later than five years after theDistribution.
10

Q: Do I have appraisal rights in connection with the Spin-Off?
A: No. Holders of IBM common stock are not entitled to appraisal rights in connection with theSpin-Off.
Q: Where can I get more information?
A: If you have any questions relating to the mechanics of the Distribution, you should contactthe distribution agent at:
Computershare Trust Company, N.A.P.O. Box 505005
Louisville, KY 40233-5005(888) IBM-6700
Before the Spin-Off, if you have any questions relating to the Spin-Off, you should contactIBM at:
IBM Stockholder RelationsP.O. Box 505005
Louisville, KY 40233-5005
After the Spin-Off, if you have any questions relating to Kyndryl, you should contact usat:
Kyndryl Holdings, Inc.One Vanderbilt Avenue, 15th Floor
New York, NY 10017Attention: Investor Relations
Questions and Answers about Kyndryl
The following provides only a summary of certain information regarding Kyndryl. You should readthis Information Statement in its entirety for a more detailed description of the matters described below.
Q: Do we intend to pay cash dividends?
A: Following the separation, the initial combined dividend level of Kyndryl and IBM is expectedto be no less than IBM’s pre-spin dividend per share. The timing, declaration, amount andpayment of future dividends to stockholders will fall within the discretion of our board ofdirectors (our “Board”). Among the items we will consider when evaluating the payment ofdividends will be the capital needs of our business and opportunities to retain future earningsfor use in the operation of our business and to fund future growth. See “Dividend Policy”for more information.
Q: Will we incur any debt prior to or at the time of the Distribution?
A: In connection with the Spin-Off, we priced $2.4 billion in aggregate principal amount ofsenior unsecured notes with closing expected to occur on October 15, 2021, subject tocustomary closing conditions. In addition, we expect to incur additional indebtedness in anaggregate principal amount of approximately $0.5 billion of term loans. Approximately$0.9 billion of the net proceeds will be transferred to IBM substantially concurrently with theconsummation of the Spin-Off. We also intend to enter into a senior unsecured revolvingcredit facility in an aggregate committed amount of $3,150 million, none of which is expectedto be drawn at the closing of the Spin-Off. The terms of such indebtedness are subject tochange and will be finalized prior to the closing of the Spin-Off. See “Capitalization,”“Unaudited Pro Forma Condensed Combined Financial Statements,” and “Management’sDiscussion and Analysis of Financial Condition and Results of Operations — OtherInformation — Liquidity and Capital Resources” for more information. Our cash balance atthe time of the Spin-Off will be approximately $2.0 billion.
11

Q: How will our common stock trade?
A: We have been approved to list our common stock on the New York Stock Exchange underthe symbol “KD.” Currently, there is no public market for our common stock.
We anticipate that trading in our common stock will begin on a “when-issued” basis as earlyas one trading day prior to the Record Date for the Distribution and will continue up to andincluding the Distribution Date. “When-issued” trading in the context of a spin-off refers toa sale or purchase made conditionally on or before the Distribution Date because the securitiesof the spun-off entity have not yet been distributed. “When-issued” trades generally settlewithin two trading days after the Distribution Date. On the first trading day following theDistribution Date, any “when-issued” trading of our common stock will end and “regular-way” trading will begin. Regular-way trading refers to trading after the security has beendistributed and typically involves a trade that settles on the second full trading day followingthe date of the trade. See “The Spin-Off — Trading Prior to the Distribution Date” for moreinformation. We cannot predict the trading prices for our common stock before, on or afterthe Distribution Date.
Q: Who is the transfer agent and registrar for our common stock?
A: Computershare Trust Company, N.A. is the transfer agent and registrar for our commonstock.
Q: Are there risks associated with owning shares of our common stock?
A: Yes, there are substantial risks associated with owning shares of our common stock.Accordingly, you should read carefully the information set forth under “Risk Factors” in thisInformation Statement.
Summary of Risk Factors
An investment in our company is subject to a number of risks. These risks relate to our business,cybersecurity and data privacy, laws and regulations, financing and capital markets activities, the Spin-Offand our common stock and the securities market. Any of these risks and other risks could materially andadversely affect our business, financial condition and results of operations and the actual outcome ofmatters as to which forward-looking statements are made in this Information Statement. Please read theinformation in the section captioned “Risk Factors” of this Information Statement for a description of theprincipal risks that we face.
12

RISK FACTORS
Risks Relating to Our Business
A lack of new customers, retention of existing customers and sales of additional services to customers couldadversely impact our revenue and results of operations.
Our ability to maintain or increase our revenues and profit may be impacted by a number of factors,including our ability to attract new customers, retain existing customers and sell additional, comparablegross margin services to our customers. We may incur higher customer acquisition or retention costs as aresult of the Spin-Off and as we seek to grow our customer base and expand our markets. Moreover, to theextent we are unable to retain and sell additional services to existing customers, our revenue and results ofoperations may decrease. Our outsourcing customer contracts typically have an average duration of overfive years and, unless terminated, may be renewed or automatically extended on a month-to-month basis. Ourcustomers have no obligation to renew their services after their initial contract periods expire and anytermination fees associated with an early termination may not be sufficient to recover our costs associatedwith such contracts. The loss of business from any of our major customers, whether by the cancellation ofexisting contracts, the failure to obtain new business or lower overall demand for our services, couldadversely impact our revenue and results of operations.
Technological developments and the speed by which we respond to them could adversely impact our long-termsuccess.
Our business depends on generating and maintaining ongoing, profitable customer demand for ourservices and solutions, including through the creation, adaptation and expansion of our services and solutionsin response to ongoing changes in technology. A significant reduction in such demand or a failure to investin strategic growth areas could materially affect our results of operations. Technological developments maycause customers to delay spending under existing contracts and engagements, or to delay entering intonew contracts while they evaluate new technologies, which could negatively impact our results of operationsif we are unable to introduce new commercial models that reflect the value of these technologicaldevelopments or if customer spending on new technologies is not sufficient to make up any shortfall causedby such delays.
We may not meet our growth and productivity objectives.
Our goals for profitability and capital return following the Spin-Off rely upon a number of assumptions,including our ability to make successful investments to grow and further develop our business and simplifyour operations. The risks and challenges we face in connection with our strategies include expanding ourprofessional services capability, expanding in geographies where we currently have a small presence andensuring that our services remain competitive in a rapidly changing technological environment. We may investsignificantly in key strategic areas to drive long-term revenue growth and market share gains. Theseinvestments may adversely affect our near-term revenue growth and results of operations, and we cannotguarantee that they will ultimately be successful. Customer adoption rates and viable economic models areless certain in highly competitive segments. Additionally, emerging business and delivery models mayunfavorably impact demand and profitability for our solutions or services. If we are unable to find partnersto develop cutting-edge innovations in a highly competitive and rapidly evolving environment, or areunable to implement and integrate such innovations with sufficient speed and versatility, we could fail inour ongoing efforts to maintain and increase our market share and profit margins.
Competition in the markets in which we operate may adversely impact our results of operations.
Our competitors include incumbents that have expanded their offerings to migration and managementof cloud-based environments; companies that utilize labor-based models and leverage talent pools primarilyin lower-cost countries that have grown to offer a broad range of services with a worldwide presence; andadvisory-focused system integrators specializing in bringing together disparate technology environments sothat they function as one. Our competitiveness is based on factors including quality of services, technical skillsand capabilities, industry knowledge and experience, financial value, ability to innovate, intellectual
13

property and methods, contracting flexibility, and speed of execution. If we are unable to compete based onsuch factors, our results of operations and business prospects could be harmed.
This competition may decrease our revenue and place downward pressure on operating margins in ourindustry, particularly for contract extensions or renewals. As a result, we may not be able to maintain ourcurrent revenue and operating margins, or achieve favorable operating margins, for contracts extended orrenewed in the future. If we fail to create and sustain an efficient and effective cost structure that scales withrevenues during periods with declining revenues, our margins and results of operations may be adverselyaffected.
We have a large portfolio of services and we need to strategically allocate financial, personnel and otherresources across these services while competing with companies that have smaller portfolios or specialize inone or more of our service lines. Our competitors may have greater financial, technical and marketing resourcesavailable to them compared to the resources allocated to our services. In addition, competitors who have agreater presence and brand recognition in some of the markets in which we compete, or who can provide morefavorable contractual terms and conditions, may be more successful at winning new business. Industryconsolidation may also affect competition by creating larger and potentially stronger competitors in themarkets in which we operate, furthering pressuring margins. Additionally, competitors may affect ourbusiness by entering into exclusive arrangements with existing or potential customers or suppliers. Companieswith whom we have alliances in certain areas may be or become competitors in other areas. In addition,companies with whom we have alliances also may acquire or form alliances with competitors, which couldreduce their business with us. If we are unable to effectively manage these complicated relationships withalliance partners, our business and results of operations could be adversely affected.
Our business could be adversely impacted by our relationships with critical suppliers and partners.
Our business employs a wide variety of products and services from a number of suppliers and partnersaround the world. Our relationships with our partners, who supply us with necessary components to theservices and solutions we offer our customers, are also critical to our ability to provide many of our servicesand solutions that address customer demands. There can be no assurance that we will be able to maintainsuch relationships, including in light of our separation from IBM. Among other things, such partners may inthe future decide to compete with us, form exclusive or more favorable arrangements with our competitorsor otherwise reduce our access to their products impairing our ability to provide the services and solutionsdemanded by customers. Further, changes in the business condition (financial or otherwise) of thesesuppliers or partners could subject us to losses and affect our ability to bring our offerings to market.Additionally, the failure of our suppliers and partners to deliver products and services in sufficient quantities,in a timely manner, and in compliance with all applicable laws and regulations could adversely affect ourbusiness. Any defective products or inadequate services received from suppliers or partners could reduce thereliability of our services and harm our reputation.
If we are unable to attract and retain key personnel and other skilled employees, our business could be harmed.
If any of our key employees were to leave, we could face substantial difficulty in hiring qualifiedsuccessors and could experience a loss in productivity while any successor obtains the necessary trainingand experience. Although we have arrangements with some of our executive officers designed to promoteretention, our employment relationships are generally at-will and key employees may leave us. We cannotassure you that one or more key employees will not leave in the future. We intend to continue to hire additionalhighly qualified personnel but may not be able to attract, assimilate or retain similarly qualified personnelin the future.
In addition, much of our future success depends on the continued service, availability and integrity ofskilled employees, including technical, marketing and staff resources. Skilled and experienced personnel inthe areas where we compete are in high demand, and competition for their talents is intense. Our inability toretain skilled employees could intensify the adverse impact of a shortage of critical skills. Changingdemographics and labor workforce trends also may result in a shortage of or insufficient knowledge andskills. Further, as global opportunities and industry demand shifts, realignment, training and scaling of skilledresources may not be sufficiently rapid or successful. Any failure to attract, integrate, motivate and retainthese employees could harm our business.
14

Due to our global presence, our business and operations could be adversely impacted by local legal, economic,political, health and other conditions, including the COVID-19 pandemic.
We are a globally integrated company and have operations worldwide. Changes in the laws or policiesof the countries in which we operate, or inadequate development or enforcement of such laws or policies,could affect our business and our overall results of operations. Further, we may be impacted directly orindirectly by the development and enforcement of laws and regulations in the U.S. and globally that arespecifically targeted at the technology industry. Our results of operations also could be affected by economicand political changes in those countries and by macroeconomic changes, including recessions, inflation,currency fluctuations between the U.S. dollar and non-U.S. currencies and adverse changes in traderelationships amongst those countries. As we expand our customer base and the scope of our offerings,both within the United States and globally, we may be further impacted by additional regulatory or otherrisks, including compliance with U.S. and foreign data privacy requirements, data localization requirements,labor relations laws, enforcement of IP protection laws, laws relating to anti-corruption, anti-competitionregulations, and import, export and trade restrictions. Further, international trade disputes could createuncertainty. Tariffs and international trade sanctions resulting from these disputes could affect our ability tomove goods and services across borders, or could impose added costs to those activities. Measures taken todate by us to mitigate these impacts could be made less effective should trade sanctions or tariffs change. Inaddition, any widespread outbreak of an illness, pandemic or other local or global health issue, naturaldisasters including those that could be related to climate change impacts, or uncertain political climates,international hostilities, or any terrorist activities, could adversely affect customer demand, our operationsand supply chain, and our ability to source and deliver solutions to our customers. For example, the COVID-19pandemic has created significant volatility, uncertainty and economic disruption. In the currentmacroeconomic environment, customers continue to balance short-term challenges and opportunities fortransformation. While some customers have begun to accelerate their digital transformation and increasetheir expenditures, the short-term priorities of other customers continue to be focused on operational stability,flexibility and cash preservation, and as such, we may experience some disruptions in transactionalperformance. Additionally, customers’ short-term priorities, as well as quarantines, limitations on travel andother factors associated with the COVID-19 pandemic may result in delays in some services projects.Another example, the U.K.’s withdrawal from the E.U., commonly referred to as “Brexit,” has caused globaleconomic, trade and regulatory uncertainty. We are actively monitoring and planning for possible impactsfrom Brexit.
A downturn in the economic environment and customer spending budgets could adversely impact our business.
Our overall performance depends in part on global macroeconomic and geopolitical conditions, whichcan change suddenly and unpredictably. Because we operate globally and have significant businesses in manymarkets, an economic slowdown in any of those markets could adversely affect our results of operations. Ifoverall demand for our solutions decreases, or if customers decide to reduce their spending budgets as a resultof such conditions, including those associated with the COVID-19 pandemic, our revenue and profit couldbe materially and adversely impacted.
Damage to our reputation could adversely impact our business.
Our reputation may be susceptible to damage by events such as significant disputes with customers,internal control deficiencies, delivery failures, cybersecurity incidents, government investigations or legalproceedings or actions of current or former customers, directors, employees, competitors, vendors, alliancepartners or joint venture partners. If we fail to gain a positive reputation as leader in our field, or if our brandimage is tarnished by negative perceptions, our ability to attract and retain customers and talent could beimpacted.
If we are unable to accurately estimate the cost of services and the timeline for completion of contracts, theprofitability of our contracts may be materially and adversely affected.
Our commercial contracts are typically awarded on a competitive or “Sole source” basis. Our bids arebased upon, among other items, the expected price to provide the services. We are dependent on our internalforecasts and predictions about our projects and the marketplace and, to generate an acceptable return on
15

our investment in these contracts, we must be able to accurately estimate our costs to provide the servicesrequired by the contract and to complete the contracts in a timely manner. We face a number of risks whenpricing our contracts, as many of our projects entail the coordination of operations and workforces inmultiple locations and utilizing workforces with different skill sets and competencies across geographicallydiverse service locations. In addition, revenues from some of our contracts are recognized using the percentage-of-completion method, which requires estimates of total costs at completion, fees earned on the contract,or both. This estimation process, particularly due to the technical nature of the services being performed andthe long-term nature of certain contracts, is complex and involves significant judgment. Adjustments tooriginal estimates are often required as work progresses, experience is gained, and additional informationbecomes known, even though the scope of the work required under the contract may not change. If we failto accurately estimate our costs or the time required to complete a contract, the profitability of our contractsmay be materially and adversely affected.
Service delivery issues could adversely impact our business and operating results.
We have customer agreements in place that include certain service level commitments. If we are unableto meet such commitments, we may be contractually obligated to pay penalties or provide these customerswith service credits for a portion of the service fees paid by our customers. However, we cannot be assured thatour customers will accept these penalties or credits in lieu of other legal remedies that may be available tothem. Our failure to meet our commitments could also result in customer dissatisfaction or loss and have anadverse effect on our business, financial condition and results of operations.
Risks from acquisitions, alliances and dispositions include integration challenges, failure to achieve objectives,the assumption of liabilities and higher debt levels.
Subject in certain circumstances to the consent of IBM under the Tax Matters Agreement, as discussedin “— Risks Relating to the Spin-Off,” we may decide to make acquisitions, alliances and dispositions infurtherance of our strategy. Such transactions present significant challenges and risks and there can be noassurances that we will identify or manage such transactions successfully or that strategic opportunities willbe available to us on acceptable terms or at all. The related risks include us failing to achieve strategicobjectives, anticipated revenue improvements and cost savings, the failure to retain key strategic relationshipsof acquired companies, the failure to retain key personnel and the assumption of liabilities related tolitigation or other legal proceedings involving the businesses in such transactions, as well as the failure toclose planned transactions. Such transactions may require us to secure financing and the indebtedness weincur concurrently with or prior to the Distribution may limit the availability of financing to us or thefavorability of the terms of available financing. If we do acquire other companies, we may not realize all theeconomic benefit from those acquisitions, which could cause an impairment of goodwill or intangibleassets. If our goodwill or net intangible assets become impaired, we may be required to record a charge toour Combined Income Statement.
We could be adversely impacted by our business with government customers.
Our customers include numerous governmental entities within and outside the United States, includingforeign governments and U.S. state and local entities. Some of our agreements with these customers may besubject to periodic funding approval. Funding reductions or delays could adversely impact public sectordemand for our services. Also, government contracts tend to be have additional requirements beyondcommercial contracts and, for example, may contain provisions providing for higher liability limits for certainlosses. In addition, we could be suspended or debarred as a governmental contractor and could incur civiland criminal fines and penalties, which could negatively impact our results of operations, financial results andreputation.
Intellectual property matters could adversely impact our business.
Our intellectual property rights may not prevent competitors from independently developing servicessimilar to or duplicative to ours, nor can there be any assurance that the resources invested by us to protectour intellectual property will be sufficient or that our intellectual property portfolio will adequately determisappropriation or improper use of our technology. Our ability to protect our intellectual property could
16

also be impacted by changes to existing laws, legal principles and regulations governing intellectual property.Further, we rely on third party intellectual property rights, open source software, and other third-partysoftware in providing some of our services and solutions and there can be no assurances that we will be ableto obtain from third parties the licenses we need in the future. If we cannot obtain licenses to third partyintellectual property on commercially reasonable terms, or if we must obtain alternative or substitutetechnology or to redesign services, our business may be adversely affected. Additionally, we cannot be surethat our services and solutions, or the solutions of others that we offer to our customers, do not infringe on theintellectual property rights of third parties (including competitors as well as non-practicing holders ofintellectual property assets), and these third parties could claim that we, our customers or parties indemnifiedby us are infringing upon their intellectual property rights. In addition, we may be the target of aggressiveand opportunistic enforcement of patents by third parties, including patent assertion entities and non-practicing entities. These claims, even if we believe they have no merit, could subject us to a temporary orpermanent injunction or damages, harm our reputation, divert management attention and resources, andcause us to incur substantial costs or prevent us from offering some services or solutions in the future. Evenif we have an agreement providing for third parties to indemnify us for the foregoing claims, theindemnifying parties may be unwilling or unable to fulfill their contractual obligations.
Risks Relating to Cybersecurity and Data Privacy
Cybersecurity and privacy considerations could adversely impact our business.
There are numerous and evolving risks to cybersecurity and privacy, including risks originating fromintentional acts of criminal hackers, hacktivists and nation states; from intentional and unintentional acts ofcustomers, contractors, business partners, vendors, employees, competitors and other third parties; andfrom errors in processes or technologies, as well as the risks associated with an increase in the number ofcustomers, contractors, business partners, vendors, employees and other third parties working remotely as aresult of the COVID-19 pandemic. Computer hackers and others routinely attack the security of technologyproducts, services, systems and networks using a wide variety of methods, including ransomware or othermalicious software and attempts to exploit vulnerabilities in hardware, software, and infrastructure.Attacks also include social engineering to fraudulently induce customers, contractors, business partners,vendors, employees and other third parties to disclose information, transfer funds, or unwittingly provideaccess to systems or data. We are at risk of security breaches not only of our own services, systems andnetworks, but also those of customers, contractors, business partners, vendors, employees and other thirdparties. Cyber threats are continually evolving, making it difficult to defend against certain threats andvulnerabilities that can persist undetected over extended periods of time. Our services, systems and networks,including cloud-based systems and systems and technologies that we maintain on behalf of our customers,may be used in critical company, customer or third-party operations, and involve the storage, processing andtransmission of sensitive data, including valuable intellectual property, other proprietary or confidentialdata, regulated data, and personal information of employees, customers and others. These services, systemsand networks are also used by customers in heavily regulated industries, including those in the financialservices, healthcare, critical infrastructure and government sectors. Successful cybersecurity attacks or othersecurity incidents could result in, for example, one or more of the following: unauthorized access to,disclosure, modification, misuse, loss, or destruction of company, customer, or other third party data orsystems; theft or import or export of sensitive, regulated, or confidential data including personal informationand intellectual property; the loss of access to critical data or systems through ransomware, crypto mining,destructive attacks or other means; and business delays, service or system disruptions or denials of service. Inthe event of such actions, we, our customers and other third parties could be exposed to liability, litigation,and regulatory or other government action, as well as the loss of existing or potential customers, damage tobrand and reputation, damage to our competitive position, and other financial loss. In addition, the costand operational consequences of responding to cybersecurity incidents and implementing remediationmeasures could be significant. In our industry, security vulnerabilities are increasingly discovered, publicizedand exploited across a broad range of hardware, software or other infrastructure, elevating the risk ofattacks and the potential cost of response and remediation for us and our customers. In addition, the fast-paced, evolving, pervasive, and sophisticated nature of certain cyber threats and vulnerabilities, as well as thescale and complexity of the business and infrastructure, make it possible that certain threats or vulnerabilitieswill be undetected or unmitigated in time to prevent or minimize the impact of an attack on us or our
17

customers. Cybersecurity risk to us and our customers also depends on factors such as the actions, practicesand investments of customers, contractors, business partners, vendors and other third parties. Cybersecurityattacks or other catastrophic events resulting in disruptions to or failures in power, information technology,communication systems or other critical infrastructure could result in interruptions or delays to company,customer, or other third party operations or services, financial loss, injury or death to persons or property,potential liability, and damage to brand and reputation. Although we continuously take significant steps tomitigate cybersecurity risk across a range of functions, such measures can never eliminate the risk entirelyor provide absolute security. To date, while we continue to monitor for, identify, investigate, respond to,remediate and develop plans to quickly recover from cybersecurity incidents, there have not been cybersecurityincidents that have had a material adverse effect on us, though there is no assurance that there will not becybersecurity incidents that will have a material adverse effect in the future.
As a global enterprise, the regulatory environment with regard to cybersecurity, privacy and dataprotection issues is increasingly complex and will continue to impact our business, including throughincreased risk, increased costs, and expanded or otherwise altered compliance obligations. As our relianceon data grows, the potential impact of regulations on our business, risks, and reputation will grow accordingly.The enactment and expansion of data protection and privacy laws and regulations around the globe,including an increased focus on international data transfer mechanisms driven by the European Court ofJustice decision in the Schrems II matter; the lack of harmonization of such laws and regulations; the increasein associated litigation and enforcement activity; the potential for damages, fines and penalties; and thepotential regulation of new and emerging technologies, such as artificial intelligence, will continue to resultin increased compliance costs and risks. Any additional costs and penalties associated with increasedcompliance, enforcement and risk reduction could make certain offerings less profitable or increase thedifficulty of bringing certain offerings to market.
Risks Relating to Laws and Regulations
Tax matters could impact our results of operations and financial condition.
We are subject to income taxes in both the United States and numerous foreign jurisdictions. Wecalculate and provide for taxes in each tax jurisdiction in which we operate. Tax accounting often involvescomplex matters and requires our judgment to determine our worldwide provision for income taxes and othertax liabilities. Our provision for income taxes and cash tax liability in the future could be adversely affectedby numerous factors including, but not limited to, income before taxes being lower than anticipated incountries with lower statutory tax rates and higher than anticipated in countries with higher statutory taxrates, changes in the valuation of deferred tax assets and liabilities, and changes in tax laws, regulations,accounting principles or interpretations thereof, which could adversely impact our results of operations andfinancial condition in future periods. The Organization for Economic Cooperation and Development(OECD) continues to issue guidelines that are different, in some respects, than long-standing internationaltax principles. As countries unilaterally amend their tax laws to adopt certain parts of the OECD guidelines,this may increase tax uncertainty and may adversely impact our income taxes. Local country, state, provincialor municipal taxation may also be subject to review and potential override by regional, federal, nationalor similar forms of government, which may also adversely impact our income taxes. It is likely that our taxreturns could be examined by taxing authorities in the jurisdictions in which we do business which also couldadversely impact our income tax provision.
We are subject to legal proceedings and investigatory risks.
As a company with approximately 90,000 employees and with customers in over 100 countries, we areor may become involved as a party and/or may be subject to a variety of claims, demands, suits, investigations,tax matters and other proceedings that arise from time to time in the ordinary course of our business. Therisks associated with such legal proceedings are described in more detail in note K, “Commitments andContingencies” in the combined financial statements elsewhere in this Information Statement. We believethat we have adopted appropriate risk management and compliance programs. Legal and compliance risks,however, will continue to exist and additional legal proceedings and other contingencies, the outcome of whichcannot be predicted with certainty, may arise from time to time.
18

We could incur costs for environmental matters.
We are subject to various federal, state, local and foreign laws and regulations concerning the dischargeof materials into the environment or otherwise related to environmental protection. We could incur costs,including cleanup costs, fines and civil or criminal sanctions, as well as third-party claims for property damageor personal injury, if we were to violate or become liable under environmental laws and regulations.Compliance with environmental laws and regulations is not expected to have a material adverse effect onour financial position, results of operations and competitive position.
Risks Relating to Financing and Capital Markets Activities
The commercial and credit environment may adversely affect our access to capital.
Our ability to issue debt or enter into other financing arrangements on acceptable terms could beadversely affected if there is a material decline in the demand for our services or in the solvency of ourcustomers or suppliers or if there are other significantly unfavorable changes in economic conditions.Volatility in the world financial markets could increase borrowing costs or affect our ability to access thecapital markets. These conditions may adversely affect our ability to obtain targeted credit ratings prior toand following the Spin-Off.
Our financial performance could be adversely impacted by changes in market liquidity conditions and bycustomer credit risk on receivables.
Our financial performance is exposed to a wide variety of industry sector dynamics worldwide,including sudden shifts in regional or global economic activity such as those associated with the COVID-19pandemic. Our earnings and cash flows, as well as our access to funding, could be negatively impacted bychanges in market liquidity conditions. Our customer base includes many worldwide enterprises, from smalland medium businesses to the world’s largest organizations and governments, with a significant portion ofour revenue coming from global customers across many sectors. If we become aware of information related tothe creditworthiness of a major customer, or if future actual default rates on receivables in general differfrom those currently anticipated, we may have to adjust our allowance for credit losses, which could affectour net income in the period the adjustments are made.
Our results of operations and financial condition could be negatively impacted by our pension plans.
Adverse financial market conditions and volatility in the credit markets may have an unfavorable impacton the value of our pension trust assets and its future estimated pension liabilities. As a result, our financialresults in any period could be negatively impacted. In addition, in a period of an extended financialmarket downturn, we could be required to provide incremental pension plan funding with resulting liquidityrisk which could negatively impact our financial flexibility. Further, our results could be negatively impactedby premiums for mandatory pension insolvency insurance coverage outside the United States. Premiumincreases could be significant due to the level of insolvencies of unrelated companies in the country atissue.
We are exposed to currency risk that could adversely impact our revenue and business.
We derive a significant percentage of our revenues and costs from our affiliates operating in localcurrency environments, and those results are affected by changes in the relative values of non-U.S. currenciesand the U.S. dollar, as well as sudden shifts in regional or global economic activity such as those associatedwith the COVID-19 pandemic. In addition, large changes in foreign exchange rates relative to our functionalcurrencies could increase the costs of our services to customers relative to local competitors, therebycausing us to lose existing or potential customers to these local competitors. Further, as we grow ourinternational operations, our exposure to foreign currency risk could become more significant. We have notindependently executed derivative financial instruments to manage our foreign currency risk and insteadhave participated in a centralized foreign currency hedging program administered by IBM to reduce foreigncurrency volatility. Our current strategy does not include hedging all of our foreign currency exposuresand the hedges placed through the centralized program may not fully mitigate our foreign currency risk ormay prove disadvantageous. At the time of the Spin-Off, we intend to have our own risk management program,
19

hedging foreign currency exposure and interest rate risk. See “— Risks Relating to the Spin-Off — We maybe unable to make, on a timely or cost-effective basis, the changes necessary to operate as an independent,publicly traded company, and we may experience increased costs after the Spin-Off.”
Risks Relating to the Spin-Off
The Spin-Off could result in significant tax liability to IBM and its stockholders if it is determined to be ataxable transaction.
IBM has received a private letter ruling from the IRS to the effect that, among other things, theDistribution, including the retention of 19.9% of the shares of our common stock, will qualify as atransaction that is tax-free for U.S. federal income tax purposes under Sections 355 and 368(a)(1)(D) of theCode. Completion of the Spin-Off is conditioned on IBM’s receipt of a written opinion from Paul, Weiss,Rifkind and Wharton & Garrison LLP to the effect that the Distribution will qualify for non-recognition ofgain and loss under Section 355 and related provisions of the Code. IBM can waive receipt of the taxopinion as a condition to the completion of the Spin-Off.
The opinion of counsel does not address any U.S. state or local or foreign tax consequences of the Spin-Off. The opinion assumes that the Spin-Off will be completed according to the terms of the Separation andDistribution Agreement and relies on the facts as stated in the Separation and Distribution Agreement,the Tax Matters Agreement, the other ancillary agreements, this Information Statement and a number ofother documents.
The opinion of counsel and the private letter ruling rely on certain facts, assumptions, representationsand undertakings from IBM and us regarding the past and future conduct of the companies’ respectivebusinesses and other matters. If any of these facts, assumptions, representations or undertakings are incorrector not otherwise satisfied, IBM and its stockholders may not be able to rely on the private letter ruling orthe opinion of counsel and could be subject to significant tax liabilities.The opinion of counsel is not bindingon the IRS or the courts, and there can be no assurance that the IRS or a court will not take a contraryposition. Notwithstanding the private letter ruling or opinion of counsel, the IRS could determine on auditthat the Distribution or any of certain related transactions is taxable if it determines that any of thesefacts, assumptions, representations or undertakings are not correct or have been violated or if it disagreeswith the conclusions in the opinion that are not covered by the private letter ruling, or for other reasons,including as a result of certain significant changes in the stock ownership of IBM or us after the Distribution.
If the Spin-Off were determined not to qualify for non-recognition of gain or loss under Section 355and related provisions of the Code, each U.S. Holder who receives our common stock in the Distributionwould generally be treated as receiving a distribution in an amount equal to the fair market value of ourcommon stock received, which would generally result in: (1) a taxable dividend to the U.S. Holder to the extentof that U.S. Holder’s pro rata share of IBM’s current or accumulated earnings and profits; (2) a reductionin the U.S. Holder’s basis (but not below zero) in IBM common stock to the extent the amount receivedexceeds the stockholder’s share of IBM’s earnings and profits; and (3) taxable gain from the exchange of IBMcommon stock to the extent the amount received exceeds the sum of the U.S. Holder’s share of IBM’searnings and profits and the U.S. Holder’s basis in its IBM common stock. See below and “Material U.S.Federal Income Tax Consequences of the Spin-Off.”
If the Spin-Off were determined not to qualify as tax-free for U.S. federal income tax purposes, we could havean indemnification obligation to IBM, which could adversely affect our business, financial condition and resultsof operations.
If, as a result of any of our representations being untrue or our covenants being breached, the Spin-Offwere determined not to qualify for non-recognition of gain or loss under Section 355 and related provisionsof the Code, we could be required to indemnify IBM for the resulting taxes and related expenses. Thoseamounts could be material. Any such indemnification obligation could adversely affect our business, financialcondition and results of operations.
In addition, if we or our stockholders were to engage in transactions that resulted in a 50% or greaterchange by vote or value in the ownership of our stock during the four-year period beginning on the date
20

that begins two years before the date of the Distribution, the Spin-Off would generally be taxable to IBM,but not to stockholders, under Section 355(e), unless it were established that such transactions and the Spin-Off were not part of a plan or series of related transactions. If the Spin-Off were taxable to IBM due tosuch a 50% or greater change in ownership of our stock, IBM would recognize gain equal to the excess ofthe fair market value on the Distribution Date of our common stock distributed to IBM stockholders overIBM’s tax basis in our common stock, and we generally would be required to indemnify IBM for the tax onsuch gain and related expenses. Those amounts could be material. Any such indemnification obligationcould adversely affect our business, financial condition and results of operations. See “Certain Relationshipsand Related Party Transactions — Agreements with IBM — Tax Matters Agreement.”
We intend to agree to numerous restrictions to preserve the non-recognition treatment of the Spin-Off, whichmay reduce our strategic and operating flexibility.
To preserve the tax-free nature of the Spin-Off and related transactions, we intend to agree in the TaxMatters Agreement to covenants and indemnification obligations that address compliance with Section 355of the Code and related provisions of the Code, as well as state, local and foreign tax law. These covenantswill include certain restrictions on our activity for a period of two years following the Spin-Off. Specifically,we will be subject to certain restrictions on our ability to enter into acquisition, merger, liquidation, saleand stock redemption transactions with respect to our stock or assets. In addition, under the Tax MattersAgreement, we may be required to indemnify IBM against any such tax liabilities as a result of the acquisitionof our stock or assets, even if we do not participate in or otherwise facilitate the acquisition. Furthermore,we will be subject to specific restrictions on discontinuing the active conduct of our trade or business, theissuance or sale of stock or other securities (including securities convertible into our stock but excludingcertain compensatory arrangements), and sales of assets outside the ordinary course of business. Thesecovenants and indemnification obligations may limit our ability to pursue strategic transactions or engage innew businesses or other transactions that may maximize the value of our business, and might discourageor delay a strategic transaction that our stockholders may consider favorable. See “Certain Relationships andRelated Party Transactions — Agreements with IBM — Tax Matters Agreement.”
We may be unable to achieve some or all of the benefits that we expect to achieve from the Spin-Off.
We may be unable to achieve the full strategic and financial benefits expected to result from theseparation and distribution, or such benefits may be delayed or not occur at all. We believe that, as anindependent, publicly traded company, we will be able to, among other things, more effectively focus onpursue our own distinct operating priorities and strategies, position us as a global leader in our industry withthe ability to better address specific market dynamics and target innovation, increase the aggregate tradingprice of the stock of IBM and Kyndryl above the trading price that the stock of IBM would have had if it hadcontinued to represent an interest in both the businesses, create incentives for our management andemployees that align more closely with our business performance and the interests of our stockholders, andallow us to articulate a clear investment proposition and tailored capital allocation policy to attract along-term investor base best suited to our business needs. We may be unable to achieve some or all of thebenefits that we expect to achieve as an independent company in the time we expect, if at all, for a variety ofreasons, including: (i) the completion of the Spin-Off will require significant amounts of our management’stime and effort, which may divert management’s attention from operating and growing our business;(ii) following the Spin-Off, we may be more susceptible to market fluctuations and other adverse events thanif it were still a part of IBM; (iii) following the Spin-Off, our businesses will be less diversified than IBM’sbusinesses prior to the separation; (iv) the other actions required to separate IBM’s and our respectivebusinesses could disrupt our operations; and (v) under the terms of the Tax Matters Agreement, we will berestricted from taking certain actions that could cause the Distribution to fail to qualify as a tax-freetransaction and these restrictions may limit us for a period of time from pursuing strategic transactions andequity issuances or engaging in other transactions that may increase the value of our business. If we fail toachieve some or all of the benefits that we expect to achieve as an independent company, or do not achievethem in the time we expect, our business, financial condition and results of operations could be adverselyaffected.
21

The terms we will receive in our agreements with IBM could be less beneficial than the terms we may haveotherwise received from unaffiliated third parties.
The agreements we will enter into with IBM in connection with the separation, will be negotiated priorto the Spin-Off, at a time when our business will still be operated by IBM. The agreements generally will beentered into on arms-length terms similar to those that would be agreed with an unaffiliated third party suchas a buyer in sale transaction, but we will not have an independent board of directors or a managementteam independent of IBM representing its interests while the agreements are being negotiated. In addition,until the Distribution occurs, we will continue to be a wholly owned subsidiary of IBM and, accordingly, IBMwill still have the discretion to determine and change the terms of the separation until the DistributionDate. As a result of these factors, the terms of those agreements may not reflect terms that would have resultedfrom arm’s-length negotiations between unaffiliated third parties and it is possible that we might have beenable to achieve more favorable terms if the circumstances differed. See “Certain Relationships and RelatedParty Transactions.”
Our customers, prospective customers, suppliers or other companies with whom we conduct business may needassurances that our financial stability on a stand-alone basis is sufficient to satisfy their requirements for doingor continuing to do business with them.
Some of our customers, prospective customers, suppliers or other companies with whom we conductbusiness may need assurances that our financial stability on a stand-alone basis is sufficient to satisfy theirrequirements for doing or continuing to do business with them. Any failure of parties to be satisfied with ourfinancial stability could have an adverse effect on our business, financial condition, results of operationsand cash flows.
Following the Spin-Off, we could incur substantial additional costs and experience temporary businessinterruptions, and we may not be adequately prepared to meet the requirements of an independent, publiclytraded company.
In connection with the Spin-Off, we have been installing and implementing information technologyinfrastructure to support certain of our business functions, including accounting and reporting, humanresources, sales operations, customer service, and fulfillment. We may incur substantially higher costs thancurrently anticipated as we transition from the existing transactional and operational systems and data centerswe currently use as part of IBM. If we are unable to transition effectively, we may incur temporaryinterruptions in business operations. Any delay in implementing, or operational interruptions suffered whileimplementing, our new information technology infrastructure could disrupt our business and have amaterial adverse effect on our results of operations.
In addition, if we are unable to replicate or transition certain systems, our ability to comply withregulatory requirements could be impaired. As a result of the Spin-Off, we will be directly subject toreporting and other obligations under the U.S. Securities and Exchange Act of 1934, as amended (the“Exchange Act”). Beginning with our second required Annual Report on Form 10-K, we intend to complywith Section 404 of the Sarbanes Oxley Act of 2002, as amended (the “Sarbanes Oxley Act”), which willrequire annual management assessments of the effectiveness of our internal control over financial reportingand a report by our independent registered public accounting firm on the effectiveness of internal control overfinancial reporting. These reporting and other obligations may place significant demands on management,administrative and operational resources, including accounting systems and resources.
The Exchange Act requires that we file annual, quarterly and current reports with respect to ourbusiness and financial condition. Under the Sarbanes Oxley Act, we are required to maintain effectivedisclosure controls and procedures and internal controls over financial reporting. To comply with theserequirements, we may need to upgrade our systems, implement additional financial and management controls,reporting systems and procedures and hire additional accounting and finance staff. We expect to incuradditional annual expenses for the purpose of addressing these, and other public company reporting,requirements. If we are unable to upgrade our financial and management controls, reporting systems,information technology systems and procedures in a timely and effective fashion, our ability to comply withfinancial reporting requirements and other rules that apply to reporting companies under the ExchangeAct could be impaired, and we may be unable to conclude that our internal control over financial reporting
22

is effective and to obtain an unqualified report on internal controls from our auditors as required underSection 404 of the Sarbanes-Oxley Act. Any failure to achieve and maintain effective internal controls couldhave a material adverse effect on our business, financial condition, results of operations and cash flow.
We may be unable to make, on a timely or cost-effective basis, the changes necessary to operate as anindependent, publicly traded company, and we may experience increased costs after the Spin-Off.
We have historically operated as part of IBM’s corporate organization, and IBM has provided us withvarious corporate functions. Following the Spin-Off, IBM will have no obligation to provide us withassistance other than the transition and other services described under “Certain Relationships and RelatedParty Transactions.” These services do not include every service that we have received from IBM in the past,and IBM is only obligated to provide the transition services for limited periods following completion ofthe Spin-Off. Following the Spin-Off and the cessation of any transition services agreements, we will needto provide internally or obtain from unaffiliated third parties the services we will no longer receive from IBM.We may be unable to replace these services in a timely manner or on terms and conditions as favorable asthose we receive from IBM. Because our business has historically operated as part of the wider IBMorganization, we may be unable to successfully establish the infrastructure or implement the changesnecessary to operate independently, or may incur additional costs that could adversely affect our business.In particular, our ability to position and market ourselves as a provider of technology services could beadversely affected by our loss of access to IBM’s development platforms. If we fail to obtain the quality ofservices necessary to operate effectively or incur greater costs in obtaining these services, our business,financial condition and results of operations may be adversely affected.
As an independent, publicly traded company, we may not enjoy the same benefits that we did as a part of IBM.
There is a risk that, by separating from IBM, we may become more susceptible to market fluctuationsand other adverse events than we would have been if we were still a part of the current IBM organizationalstructure. As part of IBM, we have been able to enjoy certain benefits from IBM’s operating diversity, size,purchasing power, lower cost of capital and opportunities to pursue integrated strategies with IBM’s otherbusinesses. As an independent, publicly traded company, we will not have the same benefits. Additionally, aspart of IBM, we have been able to leverage the IBM historical market reputation and performance andbrand identity to recruit and retain key personnel to run and operate our business. As an independent,publicly traded company, we will not have the same historical market reputation and performance or brandidentity as IBM and it may be more difficult for us to recruit or retain such key personnel.
We have no operating history as an independent, publicly traded company, and our historical combinedfinancial information is not necessarily representative of the results we would have achieved as an independent,publicly traded company and may not be a reliable indicator of our future results.
We derived the historical combined financial information included in this Information Statement fromIBM’s consolidated financial statements, and this information does not necessarily reflect the results ofoperations and financial position we would have achieved as an independent, publicly traded company duringthe periods presented, or those that we will achieve in the future. This is primarily because of the followingfactors:
• Prior to the Spin-Off, we operated as part of IBM’s broader corporate organization, and IBMperformed various corporate functions for us. Our historical combined financial information reflectsallocations of corporate expenses from IBM for these and similar functions. These allocations maynot reflect the costs we will incur for similar services in the future as an independent publicly tradedcompany.
• We will enter into transactions with IBM that did not exist prior to the Spin-Off, such as IBM’sprovision of transition and other services, and undertake indemnification obligations, which will causeus to incur new costs. See “Certain Relationships and Related Party Transactions — Agreementswith IBM.”
• Our historical combined financial information does not reflect changes that we expect to experiencein the future as a result of our separation from IBM, including changes in the financing, cash
23
management, operations, cost structure and personnel needs of our business. As part of IBM, weenjoyed certain benefits from IBM’s operating diversity, reputation, size, purchasing power, borrowingleverage and available capital for investments, and we will lose these benefits after the Spin-Off. Asan independent entity, we may be unable to purchase goods, services and technologies, such asinsurance and health care benefits and computer software licenses, or access capital markets, onterms as favorable to us as those we obtained as part of IBM prior to the Spin-Off, and our resultsof operations may be adversely affected. In addition, our historical combined financial data do notinclude an allocation of interest expense comparable to the interest expense we will incur as a result ofthe Reorganization Transactions and the Spin-Off, including interest expense in connection withour incurrence of indebtedness.
Following the Spin-Off, we will also face additional costs and demands on management’s time associatedwith being an independent, publicly traded company, including costs and demands related to corporategovernance, investor and public relations and public reporting. For additional information about our pastfinancial performance and the basis of presentation of our Combined Financial Statements, see “UnauditedPro Forma Condensed Combined Financial Statements,” “Management’s Discussion and Analysis ofFinancial Condition and Results of Operations” and our historical Combined Financial Statements and theNotes thereto included elsewhere in this Information Statement.
We expect to incur new indebtedness concurrently with or prior to the Distribution, and the degree to which wewill be leveraged following completion of the Distribution could adversely affect our business, financial conditionand results of operations.
In connection with the Spin-Off, we intend to incur substantial indebtedness in an aggregate principalamount of approximately $2.9 billion, consisting of $2.4 billion of senior unsecured notes and $0.5 billionof term loans. Approximately $0.9 billion of the net proceeds will be transferred to IBM substantiallyconcurrently with the consummation of the Spin-Off. We also intend to enter into a senior unsecuredrevolving credit facility in an aggregate committed amount of $3,150 million, none of which is expected tobe drawn at the closing of the Spin-Off. Our cash balance at the time of the Spin-Off will be approximately$2.0 billion. We have historically relied upon IBM to fund our working capital requirements and othercash requirements. After the Distribution, we will not be able to rely on the earnings, assets or cash flow ofIBM, and IBM will not provide funds to finance our working capital or other cash requirements. As a result,after the Distribution, we will be responsible for servicing our own debt and obtaining and maintainingsufficient working capital and other funds to satisfy our cash requirements. After the Spin-Off, our access toand cost of debt financing will be different from the historical access to and cost of debt financing underIBM. Differences in access to and cost of debt financing may result in differences in the interest rate chargedto us on financings, as well as the amount of indebtedness, types of financing structures and debt marketsthat may be available to us. Our ability to make payments on and to refinance our indebtedness, including thedebt incurred in connection with the Spin-Off, as well as any future debt that we may incur, will depend onour ability to generate cash in the future from operations, financings or asset sales. Our ability to generate cashis subject to general economic, financial, competitive, legislative, regulatory and other factors that arebeyond our control.
A lowering or withdrawal of the ratings, outlook or watch assigned to our new debt securities by rating agenciesmay increase our future borrowing costs, reduce our access to capital and adversely impact our financialperformance.
Our indebtedness has an investment grade rating, and any rating, outlook or watch assigned could belowered or withdrawn entirely by a rating agency if, in that rating agency’s judgment, current or futurecircumstances relating to the basis of the rating, outlook or watch such as adverse changes to our business,so warrant. Any future lowering of our ratings, outlook or watch likely would make it more difficult or moreexpensive for us to obtain additional debt financing. Moreover, a reduction in our rating to below investmentgrade could cause certain customers to reduce or cease to do business with us, which would adverselyimpact our financial performance.
24

Following the Spin-Off, certain of our employees may have actual or potential conflicts of interest because oftheir financial interests in IBM.
Because of their current or former positions with IBM, certain of our expected executive officers ownequity interests in both us and IBM. Continuing ownership of IBM shares and equity awards could create,or appear to create, potential conflicts of interest if we and IBM face decisions that could have implicationsfor both us and IBM. For example, potential conflicts of interest could arise in connection with theresolution of any dispute between us and IBM regarding the terms of the agreements governing theseparation and distribution and our relationship with IBM following the separation and distribution.Potential conflicts of interest may also arise out of any commercial arrangements that we or IBM may enterinto in the future.
We or IBM may fail to perform under various transaction agreements that will be executed as part of theseparation.
In connection with the separation, and prior to the Distribution, we and IBM will enter into varioustransaction agreements related to the Spin-Off. All of these agreements will also govern our relationshipwith IBM following the Spin-Off. We will rely on IBM to satisfy its performance obligations under theseagreements. If we or IBM are unable to satisfy our or its respective obligations under these agreements,including indemnification obligations, our business, results of operations and financial condition could beadversely affected. See “Certain Relationships and Related Party Transactions.”
Certain non-U.S. entities or assets that are part of our separation from IBM may not be transferred to us priorto the Distribution or at all.
Certain non-U.S. entities and assets that are part of our separation from IBM may not be transferredprior to the Distribution because the entities or assets, as applicable, are subject to foreign government orthird party approvals that we may not receive prior to the Distribution. Such approvals may include, but arenot limited to, approvals to merge or demerge, to form new legal entities (including obtaining requiredregistrations and/or licenses or permits) and to transfer assets and/or liabilities. It is currently anticipatedthat most material transfers will occur without delays beyond the Distribution Date, but we cannot offer anyassurance that such transfers will ultimately occur or not be delayed for an extended period of time. To theextent such transfers do not occur prior to the Distribution, under the Separation and Distribution Agreement,the economic consequences of owning such assets and/or entities will, to the extent reasonably possibleand permitted by applicable law, be provided to us. In the event such transfers do not occur or are significantlydelayed because we do not receive the required approvals, we may not realize all of the anticipated benefitsof our separation from IBM and we may be dependent on IBM for transition services for a longer period oftime than would otherwise be the case.
Risks Relating to Our Common Stock and the Securities Market
No market for our common stock currently exists and an active trading market may not develop or be sustainedafter the Spin-Off. Following the Spin-Off, our stock price may fluctuate significantly, and there can be noassurance that the combined trading prices of our and IBM’s common stock would exceed the trading price ofIBM common stock absent the Spin-Off.
There is currently no public market for our common stock. In connection with the Spin-Off, we havebeen approved to list our common stock on the New York Stock Exchange . We anticipate that before theDistribution Date, trading of shares of our common stock will begin on a “when-issued” basis and thistrading will continue through the Distribution Date. However, an active trading market for our common stockmay not develop as a result of the Spin-Off or may not be sustained in the future. The lack of an activemarket may make it more difficult for stockholders to sell our shares and could lead to our share price beingdepressed or volatile.
Although the Spin-Off is expected to increase the aggregate trading price of the common stock ofIBM and Kyndryl above what the trading price of IBM common stock would have had if it had continuedto represent an interest in both the businesses, we cannot predict the prices at which our common stock maytrade after the Spin-Off or whether the combined trading prices of a share of our common stock and a
25

share of IBM’s common stock will be less than, equal to or greater than the trading price of a share of IBMcommon stock prior to the Spin-Off. The market price of our common stock may fluctuate widely,depending on many factors, some of which may be beyond our control.
Furthermore, our business profile and market capitalization may not fit the investment objectives ofsome IBM stockholders and, as a result, these IBM stockholders may sell their shares of our common stockafter the Distribution. See “— Substantial sales of our common stock may occur in connection with the Spin-Off, or in the future, including the disposition by IBM of our shares of common stock that it may retain afterthe Distribution either of which could cause our stock price to decline.” Low trading volume for our stock,which may occur if an active trading market does not develop, among other reasons, would amplify the effectof the above factors on our stock price volatility. Should the market price of our shares drop significantly,stockholders may institute securities class action lawsuits against us. A lawsuit against us could cause us toincur substantial costs and could divert the time and attention of our management and other resources.
Substantial sales of our common stock may occur in connection with the Spin-Off, or in the future, includingthe disposition by IBM of our shares of common stock that it may retain after the Distribution, either of whichcould cause our stock price to decline.
Immediately following the Distribution, IBM will own 19.9% of the economic interest and votingpower of our outstanding common stock. We understand that IBM currently intends to dispose of all ofour common stock that it retains after the Distribution through one or more subsequent exchanges of ourcommon stock for IBM debt held by one or more investment banks or, if market and general economicconditions and sound business judgment do not support such exchanges during the 12-month periodfollowing the Distribution, IBM may dispose of such common stock (i) through distributions to IBMstockholders as dividends or in exchange for outstanding shares of IBM common stock, in each case duringthe 12-month period following the Distribution or (ii) in one or more public or private sale transactions(including potentially through secondary transactions) as soon as practicable, taking into account marketand general economic conditions and sound business judgment, but in no event later than five years after theDistribution. Prior to the Distribution, we will enter into a stockholder and registration rights agreementunder which we will agree, upon the request of IBM, to use our reasonable best efforts to effect a registrationunder applicable federal and state securities laws of any shares of our common stock retained by IBM, tofacilitate IBM’s disposition of our common stock. See “Certain Relationships and Related PartyTransactions — Agreements with IBM — Stockholder and Registration Rights Agreement.”
Further, IBM stockholders receiving shares of our common stock in the Distribution generally maysell those shares immediately in the public market. It is likely that some IBM stockholders, including someof its larger stockholders, will sell their shares of our common stock received in the Distribution if, for reasonssuch as our business profile or market capitalization as an independent company, we do not fit theirinvestment objectives, or, in the case of index funds, we are not a participant in the index in which they areinvesting. The sales of significant amounts of our common stock or the perception in the market that suchsales might occur may decrease the market price of our common stock.
We cannot guarantee the timing, amount or payment of dividends on our common stock.
Following the Spin-Off, the initial combined dividend level of Kyndryl and IBM is expected to be noless than IBM’s pre-spin dividend per share. The timing, declaration, amount and payment of futuredividends to stockholders will fall within the discretion of our Board. The Board’s decisions regarding thepayment of dividends will depend on consideration of many factors, such as our financial condition, earnings,sufficiency of distributable reserves, opportunities to retain future earnings for use in the operation of ourbusiness and to fund future growth, capital requirements, covenants associated with certain debt serviceobligations, legal requirements, regulatory constraints and other factors that the Board deems relevant.For more information, see “Dividend Policy.” There can be no assurance that we will pay our anticipateddividend in the same amount, frequency or at all in the future.
Holders of our common stock may be diluted due to future equity issuances.
In the future, holders of our common stock may be diluted because of equity issuances for acquisitions,capital market transactions or otherwise, including any equity awards that we will grant to our directors,
26

officers and employees. Our employees will have stock-based awards that correspond to shares of ourcommon stock after the distribution as a result of the conversion of and/or adjustments to their IBM stock-based awards. Such awards will have a dilutive effect on our earnings per share, which could adverselyaffect the market price of our common stock. We also plan to issue additional stock-based awards, includingannual awards, new hire awards and periodic retention awards, as applicable, to our directors, officers andother employees under our employee benefits plans as part of our ongoing equity compensation program.
The rights associated with our common stock will differ from the rights associated with IBM common stock.
Upon completion of the Distribution, the rights of IBM stockholders who become our stockholderswill be governed by our Amended and Restated Certificate of Incorporation and by Delaware law. Therights associated with IBM shares are different from the rights associated with our shares. In addition, therights of IBM stockholders are governed by New York law, while the rights of our stockholders will begoverned by Delaware law. Material differences between the rights of stockholders of IBM and the rightsof our stockholders include differences with respect to, among other things, anti-takeover measures. See“Description of Our Capital Stock — Certain Provisions of Delaware Law, Our Amended and RestatedCertificate of Incorporation and Amended and Restated By-Laws” for more information.
Certain provisions in our Amended and Restated Certificate of Incorporation and Amended and Restated By-Laws and Delaware law may discourage takeovers and limit the power of our stockholders.
Several provisions of our Amended and Restated Certificate of Incorporation, Amended and RestatedBy-Laws and Delaware law may discourage, delay or prevent a merger or acquisition. These include, amongothers, provisions that (i) provide for staggered terms for directors on our Board for a period following theSpin-Off; (ii) establish advance notice requirements for stockholder nominations and proposals; (iii) providefor the removal of directors only for cause during the time the Board is classified; (iv) limit the ability ofstockholders to call special meetings or act by written consent; and (v) provide the Board the right to issueshares of preferred stock without stockholder approval. In addition, we are subject to Section 203 of theDelaware General Corporation Law (“DGCL”), which could have the effect of delaying or preventing achange of control that you may favor. See “Description of our Capital Stock” for more information.
These and other provisions of our Amended and Restated Certificate of Incorporation, Amended andRestated By-Laws and Delaware law may discourage, delay or prevent certain types of transactions involvingan actual or a threatened acquisition or change in control of Kyndryl, including unsolicited takeoverattempts, even though the transaction may offer our stockholders the opportunity to sell their shares of ourcommon stock at a price above the prevailing market price. Our Board believes these provisions willprotect our stockholders from coercive or otherwise unfair takeover tactics by requiring potential acquirersto negotiate with the Board and by providing the Board with more time to assess any acquisition proposal.These provisions will apply even if the offer may be considered beneficial by some stockholders and coulddelay or prevent an acquisition that the Board determines is not in our and our stockholders’ best interests.See “Description of Our Capital Stock” for more information.
Our Amended and Restated Certificate of Incorporation will provide that certain courts in the State ofDelaware or the federal district courts of the United States will be the sole and exclusive forum for substantiallyall disputes between us and our stockholders, which could limit our stockholders’ ability to obtain a favorablejudicial forum for disputes with us or our directors, officers or employees.
Our Amended and Restated Certificate of Incorporation will provide, in all cases to the fullest extentpermitted by law, unless we consent in writing to the selection of an alternative forum, the Court of Chancerylocated within the State of Delaware will be the sole and exclusive forum for any derivative action orproceeding brought on behalf of us, any action asserting a claim of breach of a fiduciary duty owed by anydirector, officer or other employee or stockholder of Kyndryl to us or our stockholders, any action assertinga claim arising pursuant to the DGCL or as to which the DGCL confers jurisdiction on the Court of Chancerylocated in the State of Delaware or any action asserting a claim governed by the internal affairs doctrine orany other action asserting an “internal corporate claim” as that term is defined in Section 115 of the DGCL,or any action asserting a claim arising under the DGCL, our Amended and Restated Certificate ofIncorporation or our Amended and Restated By-Laws. However, if the Court of Chancery within the State
27

of Delaware does not have jurisdiction, the action may be brought in the United States District Court forthe District of Delaware. The exclusive forum provision will provide that it will not apply to claims arisingunder the Securities Act, the Exchange Act or other federal securities laws for which there is exclusive federalor concurrent federal and state jurisdiction. Unless we consent in writing to the selection of an alternativeforum, the federal district courts of the United States of America shall be the exclusive forum for the resolutionof any complaint asserting a cause of action arising under the Securities Act.
Any person or entity purchasing or otherwise acquiring any interest in shares of our capital stock willbe deemed to have notice of and, to the fullest extent permitted by law, to have consented to the provisionsof our Amended and Restated Certificate of Incorporation described above. The choice of forum provisionmay limit a stockholder’s ability to bring a claim in a judicial forum that it finds favorable for disputeswith us or our directors, officers, other employees or stockholders, which may discourage such lawsuitsagainst us and our directors, officers, other employees or stockholders. However, the enforceability of similarforum provisions in other companies’ certificates of incorporation has been challenged in legal proceedings.If a court were to find the exclusive choice of forum provision contained in our Amended and RestatedCertificate of Incorporation to be inapplicable or unenforceable in an action, we may incur additional costsassociated with resolving such action in other jurisdictions.
28

CAUTIONARY STATEMENT CONCERNING FORWARD-LOOKING STATEMENTS
Certain statements contained in this Information Statement may constitute “forward-lookingstatements” that involve risks and uncertainties. Forward-looking statements are based on our currentassumptions regarding future business and financial performance. These statements by their nature addressmatters that are uncertain to different degrees. Forward-looking statements provide current expectationsof future events based on certain assumptions and include any statement that does not directly relate to anyhistorical or current fact. Words such as “anticipates,” “believes,” “expects,” “estimates,” “intends,” “plans,”“projects,” and similar expressions, may identify such forward-looking statements. Any forward-lookingstatement in this Information Statement speaks only as of the date on which it is made. Although webelieve that the forward-looking statements contained in this Information Statement are based on reasonableassumptions, you should be aware that many factors could affect our actual financial results or results ofoperations and could cause actual results to differ materially from those in such forward-looking statements,including but not limited to:
• the failure to attract new customers, retain existing customers or make sales of additional services tocustomers;
• technological developments and the speed by which we respond to them;
• the failure to meet growth and productivity objectives;
• competition in the markets in which we operate;
• our relationship with critical suppliers and partners;
• our ability to attract and retain qualified personnel and other skilled employees;
• local economic, political, health and other conditions due to our global presence;
• a downturn in the economic environment and customer spending budgets;
• damage to our reputation;
• the failure to accurately estimate the cost of services and timeline for completion of contracts;
• service delivery issues;
• the risks from acquisitions, alliances and dispositions;
• the additional requirements or approvals needed for business with government customers;
• the failure to protect our intellectual property or allegations that we have infringed the intellectualproperty of others;
• cybersecurity and privacy considerations;
• tax matters;
• legal proceedings and investigatory risks;
• environmental matters;
• the impact of the commercial and credit environment on our access capital;
• changes in market liquidity conditions and customer credit risk on receivables;
• a lowering or withdrawal of our credit ratings;
• the impact by our pension plans;
• exposure to currency risk; and
• certain factors discussed elsewhere in this Information Statement.
These and other factors are more fully discussed in the “Risk Factors” and “Management’s Discussionand Analysis of Financial Condition and Results of Operations” sections and elsewhere in this InformationStatement. Those cautionary statements are not exclusive and are in addition to other factors discussedelsewhere in this Information Statement. Except as required by law, we assume no obligation to update orrevise any forward-looking statements.
29

THE SPIN-OFF
Background
On October 8, 2020, IBM announced that it intended to separate its Managed Infrastructure Servicesunit from its Hybrid Cloud platform and AI capabilities. To effect the separation, IBM is undertaking theReorganization Transactions described under “Certain Relationships and Related Party Transactions —Agreements with IBM — Separation and Distribution Agreement” and, following the ReorganizationTransactions, will distribute 80.1% of the outstanding shares of our common stock to holders of IBM’scommon stock on a pro rata basis. IBM will retain 19.9% of our outstanding shares of common stockfollowing the Distribution. Prior to completing the Distribution, IBM may adjust the percentage of ourcommon stock to be distributed to IBM stockholders and retained by IBM in response to market and otherfactors, and we will amend this Information Statement to reflect any such adjustment.
On October 10, 2021, the IBM Board approved the distribution of 80.1% of the issued and outstandingshares of our common stock, on the basis of one share of our common stock for every five shares of IBMcommon stock held as of the close of business on the record date of October 25, 2021.
On November 3, 2021, the Distribution Date, each IBM stockholder will receive one share of ourcommon stock for every five shares of IBM common stock held at close of business on the record date.Following the Spin-Off, we will operate independently from IBM. No approval of IBM’s stockholders isrequired in connection with the Spin-Off, and IBM’s stockholders will not have any appraisal rights inconnection with the Spin-Off.
Completion of the Spin-Off is subject to the satisfaction, or the IBM Board’s waiver, to the extentpermitted by law, of a number of conditions. In addition, IBM may at any time until the Distributiondecide to abandon the Distribution or modify or change the terms of the Distribution. For a more detaileddiscussion, see “— Conditions to the Spin-Off.”
Reasons for the Spin-Off
The IBM Board has reviewed various factors, including the company’s portfolio and capital allocationoptions with the goal of enhancing long-term stockholder value and determined that the Spin-Off is in thebest interests of IBM and its stockholders. The potential benefits considered by the IBM Board in making thedetermination to consummate the Spin-Off include the following:
• Greater Focus and Enhanced Operational Agility: The Spin-Off will permit both us and IBM andtheir management teams to more effectively focus on pursuing their own distinct operating prioritiesand strategies. IBM will focus on its open hybrid cloud platform and AI capabilities, and we willhave greater agility to design, run and modernize the technology environments of some of the world’smost important organizations. This will enable each company to better serve and adapt faster toclients’ changing needs.
• Strong Financial Profile to Support Growth: The Spin-Off will enable each business to be positionedas a global leader in its industry with investment grade credit ratings and strong financial characteristicsto independently drive growth and investment to better address specific market dynamics andtarget innovation.
• Value Creation: The Spin-Off is expected to increase the aggregate trading price of the stock of IBMand Kyndryl above the trading price that the stock of IBM would have had if it had continued torepresent an interest in both the businesses, so as to: (i) allow each company to use its stock to pursueand achieve strategic objectives including evaluating and effectuating acquisitions, and (ii) increasethe long-term attractiveness of equity compensation programs in a significantly more efficient andeffective manner with significantly less dilution to existing stockholders.
• Alignment of Incentives with Performance: The Spin-Off will enable each company to create incentivesfor its management and employees that align more closely with business performance and theinterests of their respective stockholders, which is also expected to help each company attract, retainand motivate highly qualified personnel.
30

• Broadening of Investor Base: The Spin-Off allows each company to articulate a clear investmentproposition and tailored capital allocation policy to attract a long-term investor base best suited toits business needs.
The IBM Board of Directors also considered some factors that may be adverse to us, including any one-time costs and dissynergies associated with separation, and the possibility of disruptions to the business asa result of the Spin-Off. Notwithstanding these costs and risks, IBM determined that the Spin-Off providedthe best opportunity to achieve the above benefits and enhance long-term stockholder value. Please referto the “Risk Factors — Risks Relating to the Spin-Off” elsewhere in this Information Statement for additionalconsiderations.
IBM’s Retention of Shares of Our Common Stock
IBM’s plan to transfer less than all of our common stock to its stockholders in the Distribution ismotivated by its desire to establish, in an efficient and non-taxable, cost-effective manner, an appropriatecapital structure for each of us and IBM, including by reducing, directly or indirectly, IBM’s indebtednessduring the 12-month period following the Distribution. We understand that IBM currently intends to disposeof all of our common stock that it retains after the Distribution through one or more subsequent exchangesof our common stock for IBM debt held by one or more investment banks or, if market and generaleconomic conditions and sound business judgment do not support such exchanges during the 12-monthperiod following the Distribution, IBM may dispose of such common stock (i) through distributions to IBMstockholders as dividends or in exchange for outstanding shares of IBM common stock, in each caseduring the 12-month period following the Distribution or (ii) in one or more public or private sale transactions(including potentially through secondary transactions) as soon as practicable, taking into account marketand general economic conditions and sound business judgment, but in no event later than five years after theDistribution.
When and How You Will Receive Our Shares
IBM will distribute to its stockholders, as a pro rata dividend, one share of our common stock forevery five shares of IBM common stock outstanding as of October 25, 2021, the Record Date of theDistribution.
Prior to the Distribution, IBM will deliver 80.1% of the issued and outstanding shares of our commonstock to the distribution agent. Computershare Trust Company, N.A. will serve as distribution agent inconnection with the Distribution and as transfer agent and registrar for our common stock.
If you own IBM common stock as of the close of business on October 25, 2021, the shares of ourcommon stock that you are entitled to receive in the Distribution will be issued to your account as follows:
• Registered stockholders. If you own your shares of IBM common stock directly through IBM’stransfer agent, you are a registered stockholder. In this case, the distribution agent will credit thewhole shares of our common stock you receive in the Distribution by way of direct registration in book-entry form to a new account with our transfer agent. Registration in book-entry form refers to amethod of recording share ownership where no physical stock certificates are issued to stockholders,as is the case in the Distribution. You will be able to access information regarding your book-entryaccount for our shares at [email protected] or by calling (833) 981-5963 or (781) 575-4557(non-U.S.).
Commencing on or shortly after the Distribution Date, the distribution agent will mail to you anaccount statement that indicates the number of whole shares of our common stock that have beenregistered in book-entry form in your name. We expect it will take the distribution agent up to twoweeks after the Distribution Date to complete the distribution of the shares of our common stock andmail statements of holding to all registered stockholders.
• “Street name” or beneficial stockholders. If you own your shares of IBM common stock beneficiallythrough a bank, broker or other nominee, the bank, broker or other nominee holds the shares in“street name” and records your ownership on its books. In this case, your bank, broker or othernominee will credit your account with the whole shares of our common stock that you receive in the
31

Distribution on or shortly after the Distribution Date. We encourage you to contact your bank,broker or other nominee if you have any questions concerning the mechanics of having shares heldin “street name.”
If you sell any of your shares of IBM common stock on or before the Distribution Date, the buyer ofthose shares may in some circumstances be entitled to receive the shares of our common stock to bedistributed in respect of the IBM shares you sold. See “— Trading Prior to the Distribution Date” for moreinformation.
We are not asking IBM stockholders to take any action in connection with the Spin-Off. We are notasking you for a proxy and request that you not send us a proxy. We are also not asking you to make anypayment or surrender or exchange any of your shares of IBM common stock for shares of our common stock.The number of outstanding shares of IBM common stock will not change as a result of the Spin-Off.
Number of Shares You Will Receive
On the Distribution Date, you will be entitled to receive one share of our common stock for every fiveshares of IBM common stock that you hold on the record date.
Treatment of Fractional Shares
The distribution agent will not distribute any fractional shares of our common stock in connectionwith the Spin-Off. Instead, the distribution agent will aggregate all fractional shares into whole shares andsell the whole shares in the open market at prevailing market prices on behalf of IBM stockholders entitledto receive a fractional share. The distribution agent will then distribute the aggregate cash proceeds of thesales, net of brokerage fees, transfer taxes and other costs, pro rata to these holders (net of any requiredwithholding for taxes applicable to each holder). We anticipate that the distribution agent will make these salesin the “when-issued” market, and “when-issued” trades will generally settle within two trading daysfollowing the Distribution Date. See “— Trading Prior to the Distribution Date” for additional informationregarding “when-issued” trading. The distribution agent will, in its sole discretion, without any influenceby IBM or us, determine when, how, through which broker-dealer and at what price to sell the whole shares.The distribution agent is not, and any broker-dealer used by the distribution agent will not be, an affiliateof either IBM or us.
The distribution agent will send to each registered holder of IBM common stock entitled to a fractionalshare a check in the cash amount deliverable in lieu of that holder’s fractional share as soon as practicablefollowing the Distribution Date. We expect the distribution agent to take about two weeks after theDistribution Date to complete the distribution of cash in lieu of fractional shares to IBM stockholders. Ifyou hold your shares through a bank, broker or other nominee, your bank, broker or nominee will receive, onyour behalf, your pro rata share of the aggregate net cash proceeds of the sales. No interest will be paid onany cash you receive in lieu of a fractional share. The cash you receive in lieu of a fractional share will generallybe taxable to you for U.S. federal income tax purposes. See “Material U.S. Federal Income Tax Consequencesof the Spin-Off” for more information.
Incurrence of Debt
In connection with the Spin-Off, we priced $2.4 billion in aggregate principal amount of seniorunsecured notes with closing expected to occur on October 15, 2021, subject to customary closing conditions.In addition, we expect to incur additional indebtedness in an aggregate principal amount of approximately$0.5 billion of term loans. Approximately $0.9 billion of the net proceeds will be transferred to IBMsubstantially concurrently with the consummation of the Spin-Off. We also intend to enter into a seniorunsecured revolving credit facility in an aggregate committed amount of $3,150 million, none of which isexpected to be drawn at the closing of the Spin-Off. For more information, see “Management’s Discussionand Analysis of Financial Condition and Results of Operations — Other Information — Liquidity andCapital Resources.” Our cash balance at the time of the Spin-Off will be approximately $2.0 billion.
Results of the Spin-Off
After the Spin-Off, we will be an independent, publicly traded company. Immediately following the Spin-Off, we expect to have approximately 223,920,187 shares of our common stock outstanding, based on the
32

number of IBM shares of common stock outstanding on September 30, 2021 and the number of shares tobe retained by IBM as described above. The actual number of shares of our common stock IBM will distributein the Spin-Off will depend on the actual number of shares of IBM common stock outstanding on theRecord Date, which will reflect any issuance of new shares, vesting of equity awards or exercises of outstandingoptions pursuant to IBM’s equity plans, and any repurchase of IBM shares by IBM under its commonstock repurchase program, on or prior to the Record Date. Shares of IBM common stock held by IBM astreasury shares will not be considered outstanding for purposes of, and will not be entitled to participate in,the Distribution. The Spin-Off will not affect the number of outstanding shares of IBM common stock orany rights of IBM stockholders. However, following the Distribution, the equity value of IBM will no longerreflect the value of the Business (except to the extent of the shares of our common stock retained by IBMas described above). Although IBM believes that our separation from IBM offers its stockholders the greatestlong-term value, there can be no assurance that the combined trading prices of the IBM common stockand our common stock will equal or exceed what the trading price of IBM common stock would have beenin absence of the Spin-Off.
Before our separation from IBM, we intend to enter into the Separation and Distribution Agreementand several other agreements with IBM related to the Spin-Off. These agreements will govern the relationshipbetween us and IBM up to and after completion of the Spin-Off and allocate between us and IBM variousassets, liabilities, rights and obligations, including employee benefits, environmental, intellectual property andtax-related assets and liabilities. We describe these arrangements in greater detail under “CertainRelationships And Related Party Transactions — Agreements with IBM.”
Listing and Trading of Our Common Stock
As of the date of this Information Statement, we are a wholly owned subsidiary of IBM. Accordingly,no public market for our common stock currently exists, although a “when-issued” market in our commonstock may develop prior to the Distribution. See “— Trading Prior to the Distribution Date” below for anexplanation of a “when-issued” market. We have been approved to list our shares of common stock on theNew York Stock Exchange the symbol “KD.” Following the Spin-Off, IBM common stock will continue totrade on the New York Stock Exchange under the symbol “IBM.”
Although IBM believes that our separation from IBM offers its stockholders the greatest long-termvalue, neither we nor IBM can assure you as to the trading price of IBM common stock or our commonstock after the Spin-Off, or as to whether the combined trading prices of our common stock and the IBMcommon stock after the Spin-Off will equal or exceed the trading prices of IBM common stock prior to theSpin-Off. The trading price of our common stock may fluctuate significantly following the Spin-Off.
The shares of our common stock distributed to IBM stockholders will be freely transferable, except forshares received by individuals who are our affiliates. Individuals who may be considered our affiliates afterthe Spin-Off include individuals who control, are controlled by or are under common control with us, as thoseterms generally are interpreted for federal securities law purposes. These individuals may include some orall of our directors and executive officers. Individuals who are our affiliates will be permitted to sell theirshares of our common stock only pursuant to an effective registration statement under the Securities Act of1933, or the “Securities Act,” or an exemption from the registration requirements of the Securities Act,such as those afforded by Section 4(a)(1) of the Securities Act or Rule 144 thereunder.
Trading Prior to the Distribution Date
We expect a “when-issued” market in our common stock to develop as early as one trading day prior tothe Record Date for the Distribution and continue up to and including the Distribution Date. “When-issued” trading refers to a sale or purchase made conditionally on or before the Distribution Date becausethe securities of the spun-off entity have not yet been distributed. If you own shares of IBM common stockat the close of business on the Record Date, you will be entitled to receive shares of our common stock inthe Distribution. You may trade this entitlement to receive shares of our common stock, without the sharesof IBM common stock you own, on the “when-issued” market. We expect “when-issued” trades of ourcommon stock to settle within two trading days after the Distribution Date. On the first trading day followingthe Distribution Date, we expect that “when-issued” trading of our common stock will end and “regular-way” trading will begin.
33

We also anticipate that, as early as one trading day prior to the Record Date and continuing up to andincluding the Distribution Date, there will be two markets in IBM common stock: a “regular-way” marketand an “ex-distribution” market. Shares of IBM common stock that trade on the regular-way market willtrade with an entitlement to receive shares of our common stock in the Distribution. Shares that trade onthe ex-distribution market will trade without an entitlement to receive shares of our common stock in theDistribution. Therefore, if you sell shares of IBM common stock in the regular-way market up to and includingthe Distribution Date, you will be selling your right to receive shares of our common stock in theDistribution. However, if you own shares of IBM common stock at the close of business on the RecordDate and sell those shares on the ex-distribution market up to and including the Distribution Date, you willstill receive the shares of our common stock that you would otherwise be entitled to receive in theDistribution.
If “when-issued” trading occurs, the listing for our common stock is expected to be under a tradingsymbol different from our regular-way trading symbol. We will announce our “when-issued” trading symbolwhen and if it becomes available. If the Spin-Off does not occur, all “when-issued” trading will be null andvoid.
Conditions to the Spin-Off
We expect that the Spin-Off will be effective on the Distribution Date, provided that the followingconditions shall have been satisfied or waived by IBM:
• the IBM Board shall have approved the Distribution and not withdrawn such approval, and shallhave declared the dividend of our common stock to IBM stockholders;
• the Separation and Distribution Agreement, as well as the ancillary agreements contemplated by theSeparation and Distribution Agreement, shall have been executed by each party to those agreements;
• the Securities and Exchange Commission (the “SEC”) shall have declared effective our RegistrationStatement on Form 10, of which this Information Statement is a part, under the Exchange Act, and nostop order suspending the effectiveness of the Registration Statement shall be in effect and noproceedings for that purpose shall be pending before or threatened by the SEC;
• our common stock shall have been accepted for listing on a national securities exchange approved byIBM, subject to official notice of issuance;
• IBM shall have received the written opinion of Paul, Weiss, Rifkind, Wharton & Garrison LLP,which shall remain in full force and effect, regarding the intended treatment of the Distribution underthe Code;
• the Reorganization Transactions shall have been completed (other than those steps that are expresslycontemplated to occur at or after the Distribution);
• no order, injunction or decree issued by any governmental authority of competent jurisdiction orother legal restraint or prohibition preventing consummation of the Distribution shall be in effect,and no other event outside the control of IBM shall have occurred or failed to occur that prevents theconsummation of the Distribution;
• no other events or developments shall have occurred prior to the Distribution that, in the judgmentof the IBM Board, would result in the Distribution having a material adverse effect on IBM or itsstockholders;
• prior to the Distribution Date, the Notice of Internet Availability of this Information Statement orthis Information Statement shall have been mailed to the holders of IBM common stock as of theRecord Date; and
• certain other conditions set forth in the Separation and Distribution Agreement.
Any of the above conditions may be waived by the IBM Board to the extent such waiver is permittedby law. If the IBM Board waives any condition prior to the effectiveness of the Registration Statement onForm 10, of which this Information Statement forms a part, or change the terms of the Distribution, and theresult of such waiver or change is material to IBM stockholders, we will file an amendment to the
34

Registration Statement on Form 10, of which this Information Statement forms a part, to revise thedisclosure in the Information Statement accordingly. In the event that IBM waives a condition or changesthe terms of the Distribution after this Registration Statement on Form 10 becomes effective and such waiveror change is material to IBM stockholders, we would communicate such waiver or change to IBM’sstockholders by filing a Form 8-K describing the waiver or change.
The fulfillment of the above conditions will not create any obligation on IBM’s part to complete the Spin-Off. We are not aware of any material federal, foreign or state regulatory requirements with which we mustcomply, other than SEC rules and regulations, or any material approvals that we must obtain, other than theapproval for listing of our common stock and the SEC’s declaration of the effectiveness of the RegistrationStatement, in connection with the Distribution. IBM may at any time until the Distribution decide toabandon the Distribution or modify or change the terms of the Distribution.
Reasons for Furnishing this Information Statement
We are furnishing this Information Statement solely to provide information to IBM’s stockholders whowill receive shares of our common stock in the Distribution. You should not construe this InformationStatement as an inducement or encouragement to buy, hold or sell any of our securities or any securities ofIBM. We believe that the information contained in this Information Statement is accurate as of the date setforth on the cover. Changes to the information contained in this Information Statement may occur afterthat date, and neither we nor IBM undertakes any obligation to update the information except in the normalcourse of our and IBM’s public disclosure obligations and practices.
35

DIVIDEND POLICY
Following the separation, the initial combined dividend level of Kyndryl and IBM is expected to be noless than IBM’s pre-spin dividend per share. The payment of any dividends in the future, and the timing andamount thereof, is within the discretion of the Board. The Board’s decisions regarding the payment ofdividends will depend on many factors, such as our financial condition, earnings, capital requirements, debtservice obligations, restrictive covenants in our debt, industry practice, legal requirements, regulatoryconstraints and other factors that the Board deems relevant. Our ability to pay dividends will depend onour ongoing ability to generate cash from operations and on our access to the capital markets. We cannotguarantee that we will pay a dividend in the future or continue to pay any dividends if and when we commencepaying dividends.
36

CAPITALIZATION
The following table sets forth our cash and cash equivalents and capitalization as of June 30, 2021, ona historical basis and on an as adjusted basis to give effect to the Spin-Off and the transactions related tothe Spin-Off, as if they occurred on June 30, 2021. You should review the following table in conjunction with“Management’s Discussion and Analysis of Financial Condition and Results of Operations,” our historicalCombined Financial Statements and the accompanying notes thereto and our unaudited pro formacondensed combined financial statements and the accompanying notes thereto included elsewhere in thisInformation Statement. See “Unaudited Pro Forma Condensed Combined Financial Statements.”
As of June 30, 2021
($ in millions) Historical Pro Forma
Cash and cash equivalents . . . . . . . . . . . . . . . . . . . . . . . . . . . . . . . . . . . . . . . . . . $ 29 $ 2,013Capitalization:Indebtedness:
Revolving credit facility . . . . . . . . . . . . . . . . . . . . . . . . . . . . . . . . . . . . . . . . . . $ — $ —Short-term debt and current portion of long-term debt . . . . . . . . . . . . . . . . . . . . 109 94Long-term debt . . . . . . . . . . . . . . . . . . . . . . . . . . . . . . . . . . . . . . . . . . . . . . . 285 3,143
Total indebtedness . . . . . . . . . . . . . . . . . . . . . . . . . . . . . . . . . . . . . . . . . . . . $ 394 $ 3,237Equity:
Net Parent investment . . . . . . . . . . . . . . . . . . . . . . . . . . . . . . . . . . . . . . . . . . . $ 5,985 $ —Common Stock . . . . . . . . . . . . . . . . . . . . . . . . . . . . . . . . . . . . . . . . . . . . . . . — 2Additional paid-in-capital . . . . . . . . . . . . . . . . . . . . . . . . . . . . . . . . . . . . . . . . — 5,203Accumulated other comprehensive income/(loss) . . . . . . . . . . . . . . . . . . . . . . . . (1,163) (1,572)Noncontrolling interests . . . . . . . . . . . . . . . . . . . . . . . . . . . . . . . . . . . . . . . . . 53 33
Total Parent invested equity . . . . . . . . . . . . . . . . . . . . . . . . . . . . . . . . . . . . . $ 4,875 $ 3,666Total capitalization . . . . . . . . . . . . . . . . . . . . . . . . . . . . . . . . . . . . . . . . . . . . . . . $ 5,269 $ 6,903
37

UNAUDITED PRO FORMA CONDENSED COMBINED FINANCIAL STATEMENTS
Our unaudited pro forma condensed combined financial statements consist of an unaudited ProForma Condensed Combined Income Statement for the six months ended June 30, 2021 and the year endedDecember 31, 2020, and an unaudited Pro Forma Condensed Combined Balance Sheet as of June 30,2021.
The following unaudited pro forma condensed combined financial statements give effect to theseparation and related adjustments in accordance with Article 11 of the Securities and ExchangeCommission’s Regulation S-X. In May 2020, the SEC adopted Release No. 33-10786 “Amendments toFinancial Disclosures about Acquired and Disposed Businesses,” or the Final Rule. The Final Rule becameeffective on January 1, 2021 and the unaudited pro forma condensed combined financial information herein ispresented in accordance therewith.
The unaudited pro forma condensed combined financial statements presented below have been derivedfrom our historical unaudited Combined Income Statement for the six months ended June 30, 2021, ourhistorical audited Combined Income Statement for the year ended December 31, 2020 and the historicalunaudited Combined Balance Sheet at June 30, 2021. The unaudited Pro Forma Condensed CombinedBalance Sheet gives effect to the separation and related transactions described below as if they had occurredon June 30, 2021. The pro forma adjustments to the unaudited Pro Forma Condensed Combined IncomeStatement for the six months ended June 30, 2021 and the year ended December 31, 2020 assume that theseparation and related transactions occurred as of January 1, 2020.
The unaudited pro forma condensed combined financial statements have been prepared to includetransaction accounting, autonomous entity and other transaction adjustments to reflect the financialcondition and results of operations as if we were a separate stand-alone entity. In addition, we have provideda presentation of adjustments on page 48 that management believes are necessary to enhance anunderstanding of the pro forma effects of the transaction.
The Company has historically assigned receivables with extended payment terms to IBM’s GlobalFinancing business. The Company will not retain these receivables in the Spin-Off. In addition, followingthe Spin-Off, it intends to enter into an agreement with a third-party financial institution to sell thesereceivables. As a result, both the historical financial statements and pro forma adjustments exclude suchreceivables. The average annual amount of receivables assigned, and therefore not reflected in the balancesheet, was approximately $3.0 billion. Fees and the net gains and losses associated with the assignment ofreceivables were not material in any of the periods.
The net loss of ($531) million and ($2,091) million for the six months ended June 30, 2021 and the yearended December 31, 2020, respectively, in our unaudited Pro Forma Condensed Combined Income Statementsincludes $237 million and $836 million for the six months ended June 30, 2021 and the year endedDecember 31, 2020, respectively, of certain transaction costs resulting from the Spin-Off. These costsinclude actual expenses incurred through June 30, 2021 included in our historical financial results andestimates for additional costs we expect to incur between June 30, 2021 and eighteen months after the Spin-Off. These costs primarily relate to legal, audit and advisory fees, system implementation costs, businessseparation and applicable employee retention fees and direct taxes from internal restructuring transactions.Actual transaction costs incurred may differ from the estimates.
The unaudited pro forma condensed combined financial information is for informational purposesonly and does not purport to represent what our financial position and results of operations actually wouldhave been had the separation and distribution occurred on the dates indicated, or to project our financialperformance for any future period. Our historical combined financial statements have been derived fromIBM’s historical accounting records and reflect certain allocation of expenses. All of the allocations andestimates in such financial statements are based on assumptions that management believes are reasonable.Our historical combined financial statements do not necessarily represent our financial position or results ofoperations had we been operated as a standalone company during the periods or at the dates presented. Asa result, autonomous entity adjustments have been reflected in the unaudited pro forma condensed combinedfinancial information and management adjustments are presented for additional information.
38

The unaudited pro forma condensed combined financial information reported below should be read inconjunction with the “Management’s Discussion and Analysis of Financial Condition and Results ofOperations,” the historical combined financial statements and the corresponding notes included elsewherein this Information Statement.
Within the financial statements and tables presented, certain columns and rows may not add due to theuse of rounded numbers for disclosure purposes.
39

UNAUDITED PRO FORMA CONDENSED COMBINED INCOME STATEMENTFOR THE SIX MONTHS ENDED JUNE 30, 2021
($ in millions except per share amounts) Historical
TransactionAccountingAdjustments Notes
AutonomousEntity
Adjustments Notes
OtherTransactionAdjustments
(Note w)Pro
Forma
Revenues . . . . . . . . . . . . . . . . . $ 9,523 $166 (b,n) $ — $(274) $ 9,415
Cost of services . . . . . . . . . . . . $ 8,545 $ 2 (b,n,o) $(221) (s) $(250) $ 8,076Selling, general and
administrative . . . . . . . . . . . . 1,567 7 (b,n,o) 36 (t) (1) 1,609Workforce rebalancing charges . . 41 — — — 41Research, development and
engineering . . . . . . . . . . . . . . 29 — 5 (u) — 34Interest expense . . . . . . . . . . . . 29 39 (j) — — 68Other (income) and expense . . . . 34 13 (g) — — 47Total costs and expenses . . . . . . . $10,245 $ 60 $(180) $(250) $ 9,875Income/(loss) before income taxes $ (722) $106 $ 180 $ (24) $ (460)Provision for income taxes . . . . . $ 165 $ 47 (p) $(134) (v) $ (7) $ 71Net income/(loss) (Note x) . . . . . $ (887) $ 59 $ 314 $ (17) $ (531)
Earnings/(loss) per share ofcommon stock (Note y)Assuming dilution . . . . . . . . . $ (2.38)Basic . . . . . . . . . . . . . . . . . . $ (2.38)
Weighted-average number ofcommon shares outstanding(Note y)Assuming dilution . . . . . . . . . 223,305,111Basic . . . . . . . . . . . . . . . . . . 223,305,111
See accompanying notes to the unaudited pro forma condensed combined financial statements.
40

UNAUDITED PRO FORMA CONDENSED COMBINED INCOME STATEMENTFOR THE YEAR ENDED DECEMBER 31, 2020
($ in millions except per share amounts) Historical
TransactionAccountingAdjustments Notes
AutonomousEntity
Adjustments Notes
OtherTransactionAdjustments
(Note w)Pro
Forma
Revenues . . . . . . . . . . . . . . . . . $19,352 $ 288 (b,n) $ — $(544) $ 19,096
Cost of services . . . . . . . . . . . . $17,143 $ 229 (b,n,o) $(501) (s) $(490) $ 16,380Selling, general and
administrative . . . . . . . . . . . 2,893 357 (b,n,o) 73 (t) (2) 3,321Workforce rebalancing charges . 918 12 (b,o) — — 930Research, development and
engineering . . . . . . . . . . . . . 76 — 10 (u) — 86Interest expense . . . . . . . . . . . . 63 77 (j) — — 140Other (income) and expense . . . 25 34 (g) — — 59Total costs and expenses . . . . . . $21,118 $ 709 $(418) $(492) $ 20,916Income/(loss) before income taxes $ (1,766) $(421) $ 418 $ (51) $ (1,820)Provision for income taxes . . . . . $ 246 $ 255 (p) $(214) (v) $ (15) $ 271Net income/(loss) (Note x) . . . . . $ (2,011) $(676) $ 633 $ (36) $ (2,091)
Earnings/(loss) per share ofcommon stock (Note y)Assuming dilution . . . . . . . . $ (9.41)Basic . . . . . . . . . . . . . . . . . . $ (9.41)
Weighted-average number ofcommon shares outstanding(Note y)Assuming dilution . . . . . . . . 222,309,283Basic . . . . . . . . . . . . . . . . . . 222,309,283
See accompanying notes to the unaudited pro forma condensed combined financial statements.
41

UNAUDITED PRO FORMA CONDENSED COMBINED BALANCE SHEET AT JUNE 30, 2021
($ in millions) Historical
TransactionAccountingAdjustments Notes
AutonomousEntity
Adjustments Notes
OtherTransactionAdjustments
(Note w)Pro
FormaAssets:
Current assets:Cash and cash equivalents . . . . . . . . . . $ 29 $ 1,984 (a) $ — $ — $ 2,013Restricted cash . . . . . . . . . . . . . . . . . . 14 — — — 14Notes and accounts receivable – net . . . . 1,614 (14) (b) — (49) 1,551Deferred costs . . . . . . . . . . . . . . . . . . . 1,259 (55) (b) — (64) 1,140Prepaid expenses and other current
assets . . . . . . . . . . . . . . . . . . . . . . . 199 85 (c) — (2) 282Total current assets . . . . . . . . . . . . . . . . . $ 3,115 $ 2,000 $ — $(116) $ 4,999
Property and equipment – net . . . . . . . . . $ 3,632 $ (173) (b,d) $ — $(169) $ 3,290Operating right-of-use assets – net . . . . . . 1,125 (29) (b) 372 (q) — 1,469Deferred costs . . . . . . . . . . . . . . . . . . . . 1,420 (128) (b) — (53) 1,239Deferred taxes . . . . . . . . . . . . . . . . . . . . 434 725 (e) 6 (r) (8) 1,156Goodwill . . . . . . . . . . . . . . . . . . . . . . . . 1,206 — — — 1,206Intangible assets – net . . . . . . . . . . . . . . . 56 — — — 56Other assets . . . . . . . . . . . . . . . . . . . . . . 78 304 (f,g) — — 382
Total assets . . . . . . . . . . . . . . . . . . . . . . . . $11,066 $ 2,699 $379 $(346) $13,798
Liabilities and equity:Current liabilities:
Short-term debt . . . . . . . . . . . . . . . . . $ 109 $ — $ — $ (15) $ 94Accounts payable . . . . . . . . . . . . . . . . 803 (28) (b) — (18) 757Compensation and benefits . . . . . . . . . 393 136 (g,h) — (4) 525Deferred income . . . . . . . . . . . . . . . . . 939 — — (136) 802Operating lease liabilities . . . . . . . . . . . 333 (8) (b) 85 (q) — 411Accrued contract costs . . . . . . . . . . . . . 489 (12) (b) — (79) 397Other accrued expenses and liabilities . . 686 (143) (b,c,i) — — 543
Total current liabilities . . . . . . . . . . . . . . . $ 3,752 $ (56) $ 85 $(252) $ 3,529
Long-term debt . . . . . . . . . . . . . . . . . . . $ 285 $ 2,884 (j) $ — $ (26) $ 3,143Retirement and nonpension postretirement
benefitobligations . . . . . . . . . . . . . . . . . . . . . 516 581 (b,g) — — 1,098
Deferred income . . . . . . . . . . . . . . . . . . . 554 — — (4) 550Operating lease liabilities . . . . . . . . . . . . . 805 (20) (b) 303 (q) — 1,087Other liabilities . . . . . . . . . . . . . . . . . . . . 278 403 (c,e,h,i) 43 (r) — 724Total liabilities . . . . . . . . . . . . . . . . . . . . $ 6,190 $ 3,792 $431 $(282) $10,132
Commitments and contingencies . . . . . . . . .Equity:
Net Parent investment . . . . . . . . . . . . . $ 5,985 $(5,985) (k) $ — $ — $ —Common Stock, $0.01 par value . . . . . . — 2 (l) — — 2Additional paid-in capital . . . . . . . . . . . — 5,299 (m) (52) (q,r) (43) 5,203Accumulated other comprehensive
income/(loss) . . . . . . . . . . . . . . . . . . (1,163) (409) (g) — — (1,572)Noncontrolling interest . . . . . . . . . . . . . . 53 — — (21) 33Total equity . . . . . . . . . . . . . . . . . . . . . . $ 4,875 $(1,093) $ (52) $ (64) $ 3,666
Total liabilities and equity . . . . . . . . . . . . . . $11,066 $ 2,699 $379 $(346) $13,798
See accompanying notes to the unaudited pro forma condensed combined financial statements.
42

NOTES TO UNAUDITED PRO FORMA CONDENSED COMBINED FINANCIAL STATEMENTS
Transaction Accounting Adjustments:
(a) Reflects $2.9 billion of borrowings expected to be incurred in connection with the Spin-Off, net ofapproximately $0.9 billion expected to be distributed to IBM and an estimated $16 million of debtissuance costs. See note (j) below.
(b) Reflects the impact of removing from our combined historical results of operations and balance sheet ajoint venture relationship, that was historically managed by us and included in our combined historicalfinancial results that will not be transferred to us as part of the Spin-Off. The pro forma adjustments aresummarized below:
($ in millions)
Notes and accounts receivable . . . . . . . . . . . . . . . . . . . . . . . . . . . . . . . . . . . . . . $ (14)Deferred costs - current . . . . . . . . . . . . . . . . . . . . . . . . . . . . . . . . . . . . . . . . . . . (55)Property and equipment . . . . . . . . . . . . . . . . . . . . . . . . . . . . . . . . . . . . . . . . . . (81)Operating right-of-use assets . . . . . . . . . . . . . . . . . . . . . . . . . . . . . . . . . . . . . . . (29)Deferred costs - non current . . . . . . . . . . . . . . . . . . . . . . . . . . . . . . . . . . . . . . . . (128)Accounts payable . . . . . . . . . . . . . . . . . . . . . . . . . . . . . . . . . . . . . . . . . . . . . . . (28)Operating lease liabilities - current . . . . . . . . . . . . . . . . . . . . . . . . . . . . . . . . . . . (8)Accrued contract costs . . . . . . . . . . . . . . . . . . . . . . . . . . . . . . . . . . . . . . . . . . . (12)Other accrued expenses and liabilities . . . . . . . . . . . . . . . . . . . . . . . . . . . . . . . . . (15)Retirement and nonpension postretirement benefit obligations . . . . . . . . . . . . . . . (30)Operating lease liabilities - non current . . . . . . . . . . . . . . . . . . . . . . . . . . . . . . . . (20)
($ in millions)
Six MonthsEnded
June 30, 2021Year Ended
December 31, 2020
Revenue . . . . . . . . . . . . . . . . . . . . . . . . . . . . . . . . . . . . . . . . . $(189) $(373)Cost of services . . . . . . . . . . . . . . . . . . . . . . . . . . . . . . . . . . . . (215) (389)Selling, general and administrative . . . . . . . . . . . . . . . . . . . . . . (4) (11)Workforce rebalancing charges . . . . . . . . . . . . . . . . . . . . . . . . . — (34)Total pre-tax income . . . . . . . . . . . . . . . . . . . . . . . . . . . . . . . . $ 30 $ 61
(c) The majority of the prepaid taxes relate to Kyndryl’s share of prepaid taxes for entities transferring tothe Kyndryl group.
Kyndryl has estimated approximately $25 million due from IBM related to IBM’s share of incometaxes for the pre-spin period for which Kyndryl has an associated liability.
Kyndryl may realize tax benefits in the future from pre-spin taxes. These tax benefits are estimated at$450 million and have been primarily recognized as Deferred Tax Assets on the Balance Sheet. Under theterms of the Tax Matters Agreement, these tax benefits may need to be reimbursed to IBM. Kyndrylhas currently estimated this liability to be approximately $450 million and has recorded this amount inOther Liabilities. This amount is an estimate, and the final liability is likely to be different.
(d) Reflects the impact of property and equipment directly attributable to Kyndryl that will not betransferred from IBM to Kyndryl in connection with the Spin-Off. This $92 million adjustment isprimarily driven by owned buildings that will be retained by IBM. Going forward, we will enter intonew leasing agreements with IBM for these buildings prior to the Spin-Off. See note (q) below.
(e) The tax effects of the pro forma adjustments at the applicable statutory income tax rates include$725 million in deferred taxes and ($77) million in Other liabilities. The majority of the deferred taximpact reflected herein relates to tax basis in Kyndryl assets including the anticipated step ups in tax basis
43

Kyndryl expects to receive as a result of the separation transactions. For the most part, the tax basisstep ups are based on the valuation of related assets and liabilities, which have not yet been completed.We expect to finalize such valuations after completion of the transactions. In addition, this adjustmentincludes the deferred tax impact related to additional retirement and nonpension postretirement benefitplan assets and obligations that will be transferred to Kyndryl prior to completion of the Spin-Offdescribed in note (g) below.
(f) Reflects an agreement under which IBM will commit to provide Kyndryl with approximately$265 million of upgraded hardware at no cost over an expected two-year period following completionof the Spin-Off. The expected average useful life of the upgraded hardware is approximately 5 years andthe Company intends to recognize total depreciation approximating $265 million over the useful life,consistent with our depreciation policy. No associated income statement adjustment to reflect an increasein depreciation has been made as the timing of the receipt of the new hardware could not be reasonablyestimated and the expected impact in the periods presented was not deemed material.
(g) Reflects additional retirement and nonpension postretirement benefit plan assets and obligations thatwill be transferred to Kyndryl prior to completion of the Spin-Off including prepaid pension assets of$39 million, current liabilities — compensation and benefits of $38 million and noncurrentliabilities — compensation and benefits of $611 million. The assets and obligations associated withsuch plans resulted in recognizing accumulated other comprehensive loss of $409 million, net of tax atJune 30, 2021 and an adjustment to other (income) and expense associated with the plan of $13 millionand $34 million for the six months ended June 30, 2021 and the year ended December 31, 2020,respectively. These additional plans are excluded from our historical Combined Balance Sheets asKyndryl was not the plan sponsor for the related benefit plans. Certain benefit plan expenses associatedwith these additional plans are included in our historical Combined Income Statements.
(h) Reflects $98 million of current and $34 million of non-current accrued liabilities for retention bonusesrelated to the Spin-Off estimated to be accrued between June 30, 2021 and the Spin-Off. The incomestatement impact has been reflected in the unaudited Pro Forma Condensed Combined Income Statementfor the year ended December 31, 2020. See note (o) below.
(i) Reflects $153 million of current and $4 million of non-current accrued restructuring liabilities that willbe retained by IBM for former and current Kyndryl employees pursuant to the terms in our localtransfer agreements in certain countries.
(j) Reflects indebtedness of approximately $2.9 billion, consisting of expected term loans and senior noteswith maturities ranging from three years to twenty years and an average interest rate of approximately2.5%, which are expected to be issued in connection with the Spin-Off, and related debt issuance costs of$16 million. Taking into account the current strategic view of Kyndryl’s required capital structure andrelated working capital needs, it is estimated that we will distribute approximately $0.9 billion of theproceeds received from the issuance of debt to IBM in connection with the Spin-Off with the remainingproceeds to be held by the Company in cash equivalent investments. The value and terms of suchindebtedness and related capital structure requirements of Kyndryl remain under continuing strategicreview, which will be finalized prior to the Spin-Off.
We also expect to enter into a revolving credit facility, however, the facility is not expected to be utilizedat the closing of the Spin-Off.
The unaudited Pro Forma Condensed Combined Income Statement adjustments reflect estimatedinterest expense related to the debt issuances and amortization of deferred issuance costs. Interestexpense was calculated assuming constant debt levels throughout the periods. A 0.125 percent changeto the annual interest rate would change interest expense by approximately $2 million and $4 million forthe six months ended June 30, 2021 and the year ended December 31, 2020, respectively.
($ in millions)
Six MonthsEnded
June 30, 2021Year Ended
December 31, 2020
Interest expense on debt . . . . . . . . . . . . . . . . . . . . . . . . . . . . . . $38 $75Amortization of issuance costs . . . . . . . . . . . . . . . . . . . . . . . . . 1 2Total pro forma adjustment to interest expense . . . . . . . . . . . . . . $39 $77
44
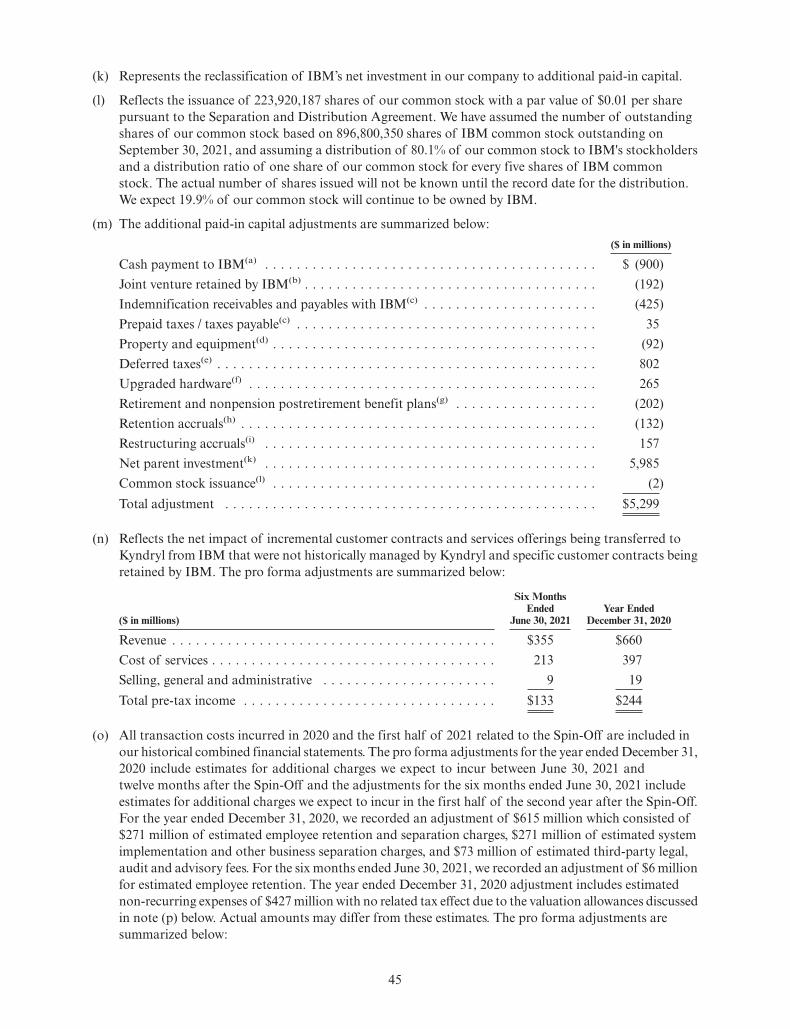
(k) Represents the reclassification of IBM’s net investment in our company to additional paid-in capital.
(l) Reflects the issuance of 223,920,187 shares of our common stock with a par value of $0.01 per sharepursuant to the Separation and Distribution Agreement. We have assumed the number of outstandingshares of our common stock based on 896,800,350 shares of IBM common stock outstanding onSeptember 30, 2021, and assuming a distribution of 80.1% of our common stock to IBM's stockholdersand a distribution ratio of one share of our common stock for every five shares of IBM commonstock. The actual number of shares issued will not be known until the record date for the distribution.We expect 19.9% of our common stock will continue to be owned by IBM.
(m) The additional paid-in capital adjustments are summarized below:($ in millions)
Cash payment to IBM(a) . . . . . . . . . . . . . . . . . . . . . . . . . . . . . . . . . . . . . . . . . . $ (900)Joint venture retained by IBM(b) . . . . . . . . . . . . . . . . . . . . . . . . . . . . . . . . . . . . . (192)Indemnification receivables and payables with IBM(c) . . . . . . . . . . . . . . . . . . . . . . (425)Prepaid taxes / taxes payable(c) . . . . . . . . . . . . . . . . . . . . . . . . . . . . . . . . . . . . . . 35Property and equipment(d) . . . . . . . . . . . . . . . . . . . . . . . . . . . . . . . . . . . . . . . . . (92)Deferred taxes(e) . . . . . . . . . . . . . . . . . . . . . . . . . . . . . . . . . . . . . . . . . . . . . . . . 802Upgraded hardware(f) . . . . . . . . . . . . . . . . . . . . . . . . . . . . . . . . . . . . . . . . . . . . 265Retirement and nonpension postretirement benefit plans(g) . . . . . . . . . . . . . . . . . . (202)Retention accruals(h) . . . . . . . . . . . . . . . . . . . . . . . . . . . . . . . . . . . . . . . . . . . . . (132)Restructuring accruals(i) . . . . . . . . . . . . . . . . . . . . . . . . . . . . . . . . . . . . . . . . . . 157Net parent investment(k) . . . . . . . . . . . . . . . . . . . . . . . . . . . . . . . . . . . . . . . . . . 5,985Common stock issuance(l) . . . . . . . . . . . . . . . . . . . . . . . . . . . . . . . . . . . . . . . . . (2)Total adjustment . . . . . . . . . . . . . . . . . . . . . . . . . . . . . . . . . . . . . . . . . . . . . . . $5,299
(n) Reflects the net impact of incremental customer contracts and services offerings being transferred toKyndryl from IBM that were not historically managed by Kyndryl and specific customer contracts beingretained by IBM. The pro forma adjustments are summarized below:
($ in millions)
Six MonthsEnded
June 30, 2021Year Ended
December 31, 2020
Revenue . . . . . . . . . . . . . . . . . . . . . . . . . . . . . . . . . . . . . . . . . $355 $660Cost of services . . . . . . . . . . . . . . . . . . . . . . . . . . . . . . . . . . . . 213 397Selling, general and administrative . . . . . . . . . . . . . . . . . . . . . . 9 19Total pre-tax income . . . . . . . . . . . . . . . . . . . . . . . . . . . . . . . . $133 $244
(o) All transaction costs incurred in 2020 and the first half of 2021 related to the Spin-Off are included inour historical combined financial statements. The pro forma adjustments for the year ended December 31,2020 include estimates for additional charges we expect to incur between June 30, 2021 andtwelve months after the Spin-Off and the adjustments for the six months ended June 30, 2021 includeestimates for additional charges we expect to incur in the first half of the second year after the Spin-Off.For the year ended December 31, 2020, we recorded an adjustment of $615 million which consisted of$271 million of estimated employee retention and separation charges, $271 million of estimated systemimplementation and other business separation charges, and $73 million of estimated third-party legal,audit and advisory fees. For the six months ended June 30, 2021, we recorded an adjustment of $6 millionfor estimated employee retention. The year ended December 31, 2020 adjustment includes estimatednon-recurring expenses of $427 million with no related tax effect due to the valuation allowances discussedin note (p) below. Actual amounts may differ from these estimates. The pro forma adjustments aresummarized below:
45

($ in millions)
Six MonthsEnded
June 30, 2021Year Ended
December 31, 2020
Cost of services . . . . . . . . . . . . . . . . . . . . . . . . . . . . . . . . . . . . $ 4 $221Selling, general and administrative . . . . . . . . . . . . . . . . . . . . . . 2 349Workforce rebalancing charges . . . . . . . . . . . . . . . . . . . . . . . . . — 46Total adjustment . . . . . . . . . . . . . . . . . . . . . . . . . . . . . . . . . . . $ 6 $615
(p) Reflects $47 million and $255 million for the six months ended June 30, 2021 and for the year endedDecember 31, 2020, respectively, of the income tax effects of pro forma adjustments, inclusive ofKyndryl’s anticipated transfer pricing policies. This adjustment was determined by applying therespective statutory tax rates to pre-tax pro forma adjustments in jurisdictions where valuation allowanceswere not required. The amount for the year ended December 31, 2020 also includes $200 million ofnon-recurring tax impacts of internal restructuring transactions which will be completed prior to theSpin-Off. These internal restructuring transactions will include taxable and non-taxable transfers toestablish the Kyndryl legal entity structure which will ultimately be separated from IBM. The tax impactof these transactions is based on estimated amounts since the valuation of assets and liabilities hasnot been completed and hence subject to change. Due to the complexities involved, the tax impact couldincrease or decrease materially. Kyndryl’s post-separation income taxes will be impacted by manyfactors, including the profitability in local jurisdictions and the legal entity structure implementedsubsequent to separation, and may be materially different from the pro forma results.
Autonomous Entity Adjustments:
(q) Reflects the net impact of lease arrangements with third parties and lease and sub-lease arrangementswith IBM for corporate offices and data centers that have been entered into or will be entered into priorto the Spin-Off. These adjustments record the operating right-of-use assets and related operating leaseliabilities based on the estimated present value of the lease payments over the lease term. There is noincome statement impact as lease expense is expected to be consistent with facilities charges includedin our historical Combined Income Statements. The pro forma adjustments are summarized below:
($ in millions)
OperatingRight-of-Use
Assets
CurrentOperating Lease
Liabilities
Non-CurrentOperating Lease
Liabilities
Operating leases with third parties . . . . . . . . . . . . . $121 $29 $101Operating leases and sub-leases with IBM . . . . . . . . 251 56 201Total adjustment . . . . . . . . . . . . . . . . . . . . . . . . . $372 $85 $303
(r) Reflects the tax effects of the pro forma adjustments at the applicable statutory income tax rates. Themajority of the deferred tax impact reflected herein relates to reversal of hypothetical tax balancescalculated on a separate return basis in the combined financial statements that will not be transferredto Kyndryl, including removal of hypothetical net operating losses, tax credits, and valuation allowances.In addition, this adjustment also includes the deferred tax impact of new lease arrangements discussedin note (q) above.
(s) Reflects the effect of agreements that Kyndryl and IBM have entered into or will enter into prior to theSpin-Off. The net reduction to cost of $221 million and $501 million for the six months ended June 30,2021 and for the year ended December 31, 2020, respectively, reflects the impacts of the new commercialpricing in these arrangements applied to historical purchases of goods and services from IBM.
(t) Reflects $36 million and $73 million for the six months ended June 30, 2021 and for the year endedDecember 31, 2020, respectively, of certain transition services costs associated with the TransitionServices Agreement (TSA) we intend to enter into with IBM. The costs are primarily associated withinformation technology services.
(u) Reflects $5 million and $10 million for the six months ended June 30, 2021 and for the year endedDecember 31, 2020, respectively, of estimated research, development and engineering expense associatedwith the research master collaboration agreement that Kyndryl and IBM intend to enter into forfuture joint research projects between Kyndryl and IBM’s Research Division.
46

(v) Reflects ($134) million and ($214) million for the six months ended June 30, 2021 and for the yearended December 31, 2020, respectively, of the income tax pro forma adjustments. This adjustment wasdetermined by applying the respective statutory tax rates to pre-tax pro forma adjustments injurisdictions where valuation allowances were not required. Additionally, the tax effects relate to theimpacts of Kyndryl’s anticipated transfer pricing policies. Kyndryl’s post-separation income taxes willbe impacted by many factors, including the profitability in local jurisdictions and the legal entity structureimplemented subsequent to separation, and may be materially different from the pro forma results.
Other Transaction Adjustments:
(w) Reflects the mutual agreement between IBM and a client of the infrastructure services business todissolve their joint venture relationship, that was historically managed by us, which will be acceleratedto become effective at the date of Spin-Off and does not take into account any anticipated post-spinclient contractual relationships with us. The adjustment reflects the removal of the assets and liabilitiesof this joint venture as of June 30, 2021 that will not be transferred to Kyndryl and the removal of therevenue, cost and expense, including the related income taxes, from this joint venture relationship forthe six months ended June 30, 2021 and for the year ended December 31, 2020. Going forward, we expectthe client will develop separate, unique contractual relationships with IBM and Kyndryl, directly.
Net Income/(Loss):
(x) Pro Forma Net Loss of ($531) million and ($2,091) million for the six months ended June 30, 2021 andthe year ended December 31, 2020, respectively, includes transaction costs resulting from the Spin-Offof ($237) million and ($836) million for the six months ended June 30, 2021 and the year endedDecember 31, 2020, respectively. These costs include actual expenses incurred through June 30, 2021included in our historical financial results and estimates for additional costs we expect to incur betweenJune 30, 2021 and eighteen months after the Spin-Off. These costs primarily relate to legal, audit andadvisory fees, system implementation costs, business separation and applicable employee retention feesand direct taxes from internal restructuring transactions. Actual transaction costs incurred may differfrom the estimates.
Earnings (Loss) Per Share:
(y) The weighted-average number of shares of our common stock used to compute basic earnings pershare for the six months ended June 30, 2021 and the year ended December 31, 2020 is based on thenumber of weighted average IBM common shares outstanding during the six months ended June 30,2021 and year ended December 31, 2020, respectively, assuming a distribution ratio of one share of ourcommon stock for every five shares of IBM common stock and the 19.9% interest of the outstandingshares of our common stock that will be retained by IBM.
The weighted average number of shares used to compute diluted earnings per share is based on theweighted average number of basic shares of our common stock since the company had a net loss forthe six months ended June 30, 2021 and the year ended December 31, 2020. The incremental sharesassociated with the stock-based awards granted to our employees under IBM's stock-based compensationplans were not included in the computation of earnings per share in either period since if includedthey would have been anti-dilutive. The actual future impact of potential dilution from stock-basedawards granted to our employees under IBM equity plans will depend on various factors, includingemployees who may change employment from one company to another.
Management Adjustments:
We have calculated net savings related to certain expenses previously allocated from IBM. Followingthe Spin-Off, we expect to incur incremental costs as a separate public company in certain of our corporatesupport functions (e.g., finance, accounting, tax, treasury, IT, HR, legal, among others). We received thebenefit of economies of scale as a business unit within IBM’s overall centralized model, however, in establishingthese support functions independently, the expenses will be higher than the prior shared allocation. In theadjustments shown below, these dis-synergies, or higher costs are $161 million for the year ended December 31,2020 and $81 million for the six months ended June 30, 2021. In addition, pursuant to the Transition
47

Services Agreement we intend to enter into with IBM, we will incur incremental expenses primarily relatedto internal information technology support of $73 million for the year ended December 31, 2020 and $36million for the six months ended June 30, 2021, respectively. The TSA is reflected in the autonomousentity adjustments and described in Note (t). In contrast, operating as a separate stand-alone company witha flatter cost structure, we anticipate synergies in the form of lower costs in other corporate supportfunctions, such as sales, marketing, and communications and other corporate overhead, reflected below forthe year ended December 31, 2020 in the amount of $752 million and $384 million for the six months endedJune 30, 2021.
Each function (e.g., finance, IT, HR, etc.) performed a zero-based budget assessment of the resourcesand associated cost required as a baseline to stand up Kyndryl as a stand-alone company. Internal resourceswere matched to job roles to meet the required baseline. Any shortfall to required resource needs werefilled through external hiring or will be supported by IBM through the TSAs. In addition to resources, vendorcosts and other third-party spending in each function were considered and resulted in either the inclusionof new spending requirements or the cessation of certain spending (referred to as non-labor-based in the tablebelow). These types of costs include, for example, audit fees, vendor software licensing fees, external legalfees, external advertising and marketing agency fees, etc. This process was used by all functions and certainfunctions had incremental costs and others had lower costs than the corporate allocations included in thehistorical financial statements, resulting in an overall net savings. In addition to the baseline assessment,certain other allocated charges result in synergy management adjustments, referred to below as other corporateoverhead. This includes for example, interest expense that was previously allocated and other acquiredintangible asset fees that will no longer be incurred. The Kyndryl legal entities were established as ofSeptember 1, 2021 and the resources were transferred to those legal entities. From a timeframe standpoint,these net cost reductions will begin to materialize at the effective date of separation. Management believes theresource transfers and costs which were used as the basis for the management adjustments below arereasonable and representative of the baseline to stand up Kyndryl as a stand-alone company. Both theresource and vendor cost baseline would be impacted by additional costs and investments that Kyndryl mayincur as it pursues its growth strategies. In addition, other adverse effects and limitations including thosediscussed in the section entitled “Risk Factors” to this document may impact actual costs incurred.
Primarily as a result of the above items, the management adjustments presented below show a netreduction of expenses compared to the allocated expenses from IBM included in our historical CombinedIncome Statements. The total adjustments for the six months ended June 30, 2021 and for the year endedDecember 31, 2020 are ($303) million and ($591) million, respectively. However, actual expenses that will beincurred could differ materially from these estimates.
Management believes the presentation of these adjustments are necessary to enhance an understandingof the pro forma effects of the transaction. The pro forma financial information below reflects all adjustmentsthat are, in the opinion of management necessary to provide a fair statement of the pro forma financialinformation, aligned with the assessment described above. If Kyndryl decides to increase or reduce resourceor invest more heavily in certain areas in the future, that will be part of its future decisions and have notbeen included in the management adjustments below.
These management adjustments include forward-looking information that is subject to the safe harborprotections of the Exchange Act. The tax effect has been determined by applying the respective statutorytax rates to the aforementioned adjustments in jurisdictions where valuation allowances were not required.
The below table includes each category of management adjustments split between synergies and dis-synergies.
48
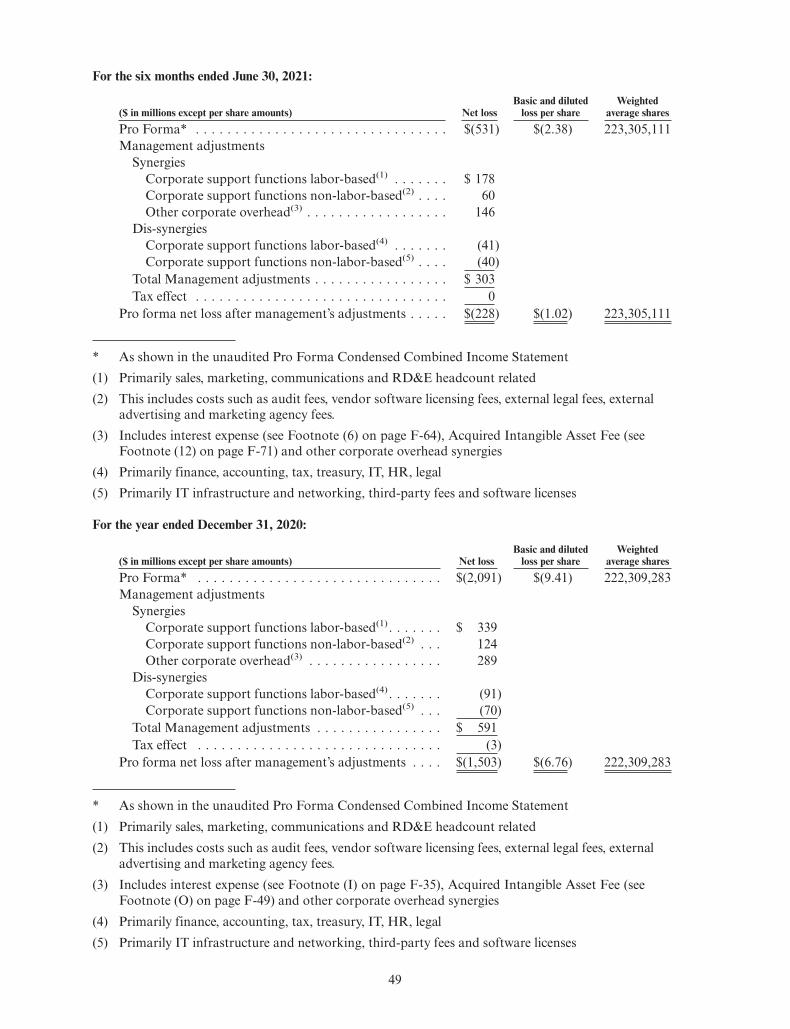
For the six months ended June 30, 2021:
($ in millions except per share amounts) Net lossBasic and diluted
loss per shareWeighted
average shares
Pro Forma* . . . . . . . . . . . . . . . . . . . . . . . . . . . . . . . . $(531) $(2.38) 223,305,111Management adjustments
SynergiesCorporate support functions labor-based(1) . . . . . . . $ 178Corporate support functions non-labor-based(2) . . . . 60Other corporate overhead(3) . . . . . . . . . . . . . . . . . . 146
Dis-synergiesCorporate support functions labor-based(4) . . . . . . . (41)Corporate support functions non-labor-based(5) . . . . (40)
Total Management adjustments . . . . . . . . . . . . . . . . . $ 303Tax effect . . . . . . . . . . . . . . . . . . . . . . . . . . . . . . . . 0
Pro forma net loss after management’s adjustments . . . . . $(228) $(1.02) 223,305,111
* As shown in the unaudited Pro Forma Condensed Combined Income Statement(1) Primarily sales, marketing, communications and RD&E headcount related(2) This includes costs such as audit fees, vendor software licensing fees, external legal fees, external
advertising and marketing agency fees.(3) Includes interest expense (see Footnote (6) on page F-64), Acquired Intangible Asset Fee (see
Footnote (12) on page F-71) and other corporate overhead synergies(4) Primarily finance, accounting, tax, treasury, IT, HR, legal(5) Primarily IT infrastructure and networking, third-party fees and software licenses
For the year ended December 31, 2020:
($ in millions except per share amounts) Net lossBasic and diluted
loss per shareWeighted
average shares
Pro Forma* . . . . . . . . . . . . . . . . . . . . . . . . . . . . . . . $(2,091) $(9.41) 222,309,283Management adjustments
SynergiesCorporate support functions labor-based(1). . . . . . . $ 339Corporate support functions non-labor-based(2) . . . 124Other corporate overhead(3) . . . . . . . . . . . . . . . . . 289
Dis-synergiesCorporate support functions labor-based(4). . . . . . . (91)Corporate support functions non-labor-based(5) . . . (70)
Total Management adjustments . . . . . . . . . . . . . . . . $ 591Tax effect . . . . . . . . . . . . . . . . . . . . . . . . . . . . . . . (3)
Pro forma net loss after management’s adjustments . . . . $(1,503) $(6.76) 222,309,283
* As shown in the unaudited Pro Forma Condensed Combined Income Statement(1) Primarily sales, marketing, communications and RD&E headcount related(2) This includes costs such as audit fees, vendor software licensing fees, external legal fees, external
advertising and marketing agency fees.(3) Includes interest expense (see Footnote (I) on page F-35), Acquired Intangible Asset Fee (see
Footnote (O) on page F-49) and other corporate overhead synergies(4) Primarily finance, accounting, tax, treasury, IT, HR, legal(5) Primarily IT infrastructure and networking, third-party fees and software licenses
49

BUSINESS
Our Company
We are a leading technology services company and the largest infrastructure services provider in theworld, serving as a partner to more than 4,000 customers in over 100 countries. We have a long track recordof helping enterprises navigate major technological changes, particularly by enabling our customers tofocus on the core aspects of their businesses during these shifts while trusting us with their most criticalsystems. Today, enterprises are engaged in individual and unique digital transformations to differentiate theirbusinesses and derive value through better customer experiences. However, enterprises often face shortagesin critical technical expertise to successfully make this complex change. Our purpose is therefore to design,build, and manage secure and responsive private, public, and multicloud environments to accelerate ourcustomers’ digital transformations.
We put the customer at the center of everything we do, every day. We provide engineering talent,operating paradigms, and insights derived from our data around IT patterns. This enables us to deliveradvisory, implementation, and managed services at scale across technology infrastructures that allow ourcustomers to de-risk and realize the full value of their digital transformations. We do this while embracing newtechnologies and solutions, and continually expanding our skills and capabilities, as we help advance thevital systems that power progress for our customers. We are also organized to be fast and focused, in orderto respond more quickly to our customers’ needs, and our principles have led to a structure that drivesaccountability and responsibility to the teams that work closely with them and our partners. We delivertransformation and secure cloud services capabilities, insights, and depth of expertise to modernize andmanage IT environments based on our customers’ unique patterns of transformation at scale. We offerservices across domains such as cloud services, core enterprise and zCloud services, applications, data, andartificial intelligence services, digital workplace services, security and resiliency services, and network and edgeservices as we continue to support our customers through technological change. Our services enable us tomodernize and manage cloud and on-premise environments as “one” for our customers, enabling them toscale seamlessly.
To deliver these services, we rely on our team of skilled practitioners, consisting of approximately 90,000professionals. Given our large and diversified customer base operates in multiple industries and geographies,we utilize a flexible labor and delivery model with a balanced mix of global and local talent as needed tomeet customer-specific needs, regulatory requirements, and data protection and labor laws. Our employeesleverage their deep engineering expertise and extensive experience operating complex and heterogeneoustechnology environments to drive service quality, intellectual property development, and our long-termtrusted customer relationships.
As described in “— Our Customers,” we have many customer relationships that are decades long, as weprovide high-quality, mission-critical services that are core to operations with customers that represent thebackbones of their respective industries. These customers entrust us to deliver the services they need, andmanage their complex environments so that they can achieve their business objectives.
As an independent company, we will be free to partner with a broader ecosystem, including a widerange of hyperscale cloud providers, system integrators, independent software vendors, and technologyvendors from startups to market leaders. This enables us to serve our customers with the contemporarytechnology capabilities that best fit their needs and open new avenues for growth. This is all underpinned byour ability to integrate and operate mission-critical technology at scale using deep engineering expertiseand intellectual property.
Our approach has enabled us to reach significant scale, with $19.4 billion in revenue for the fiscal yearended December 31, 2020. We are focused on driving revenue growth with sustainable margins by extendingour leadership in the markets in which we operate while investing in our capabilities, and expanding ourhigh value, next generation services consistent with customer needs.
50

Our Segments
Our reportable segments correspond to how we organize and manage the business and are aligned tokey geographic markets in which Kyndryl operates. Segment results do not include any impacts associatedwith inter-company transactions between the segments:
• Americas: This segment comprises Kyndryl’s operations in North and Latin America, and includescountries such as, but not limited to, the United States, Canada, Brazil, Mexico, Peru, Colombia,Argentina and Chile. For the year ended the December 31, 2020, Americas contributed 38 percentof our revenue and 55 percent of Kyndryl’s gross profit.
• Europe/Middle East/Africa (EMEA): This segment comprises Kyndryl’s operations in Europe, theMiddle East, and Africa and includes countries such as, but not limited to, Germany, France, theUnited Kingdom, Italy, Spain, Turkey, Israel, Saudi Arabia, South Africa, and Egypt. For the yearended December 31, 2020, EMEA contributed 38 percent of our revenue and 5 percent of thecompany’s gross profit.
• Japan: This segment comprises Kyndryl’s operations in Japan and does not include any othercountries. For the year ended December 31, 2020, Japan contributed 16 percent of our revenue and29 percent of Kyndryl’s gross profit.
• Asia Pacific: This segment comprises Kyndryl’s operations in Australia and Asia, excluding Japan,and includes countries such as, but not limited to India, China, Australia, Singapore, Korea,New Zealand and Thailand. For the year ended December 31, 2020, Asia Pacific contributed 8 percentof our revenue and 12 percent of the company’s gross profit.
From time to time, our geographic markets work together to sell and implement certain contracts. Theresulting revenues and costs from these contracts may be apportioned among the participating geographicmarkets. The economic environment and its effects on the industries served by our geographic markets affectrevenues and operating expenses within our geographic markets to differing degrees. Local currencyfluctuations also tend to affect our geographic markets differently, depending on the geographic concentrationsand locations of their businesses. We present additional segment financial information in note D,“Segments,” to our combined financial statements.
Our Industry and Market Opportunity
We participate in an industry that provides services for customers’ technology environments that powertheir businesses. These services span areas such as management of mission-critical systems across dedicateddata centers and multiple clouds. As customers advance their digital transformations, they are looking forpartners that understand their business objectives and unique digital journeys, and have the skills to instrumentand engineer the IT environments to enable their transformations. Our long standing position as aninformed and trusted partner, with decades-long relationships and leading capabilities, provides us with theknowledge and expertise to best help existing and new customers realize their future.
The market for these services is large and dynamic. We project this market, which is a subset of thetotal IT services market, to represent a $415 billion opportunity in 2021, growing 7% annually to $510 billionin 2024. Growth in this market is driven by services that are aligned to customers’ transformations, andrepresent an incremental $75 billion. These transformation services include several high-growth portions ofthe market that each exceed approximately $10 billion in opportunity, including public cloud managed services(compounded annual growth of 11% from 2021 to 2024), data services (compounded annual growth of18% from 2021 to 2024), security services (compounded annual growth of 12% from 2021 to 2024), andintelligent automation services (compounded annual growth of 27% from 2021 to 2024). Managed servicesfor edge environments represents a smaller portion connected to many other opportunities, and itself isexpected to experience compounded annual growth above 100% from 2021 to 2024.
Several trends underpin the growth of our market, including:
• Greater demand for digital transformation services. Companies continue to digitally transform todeliver better customer experiences and compete more effectively, which drives the need for servicesto support modernization of IT within the enterprise. The COVID-19 global pandemic has accelerated
51

this already pervasive trend, as organizations look to further their digital capabilities. IDC estimatesthat approximately 65% of GDP will be digitized by 2022. Illustrating the growth in digitization, U.S.online retail sales surged by 32% year-over-year in 2020. While customers seek to transform, skillsavailability often represents a challenge, with lack of skills ranked as one of the top 3 impediments totransformation of the IT environment according to Technology Business Research, Inc.
• Ongoing migration to the cloud. Companies continue to migrate workloads to the cloud, adoptingnew capabilities for flexibility, workload portability, and management. These transitions are oftencomplex, with companies seeking assistance from service providers. Gartner forecasts that by 2025,85% of large organizations will have engaged external service providers to migrate applications to thecloud, an increase from 43% in 2019. Furthermore, Gartner projects that by 2022, more than 75%of global organizations will be running containerized applications in production (an increase from lessthan 30% today) and worldwide revenue for container management will double by 2024. Theextension of public cloud services to multiple environments in different locations has given rise todistributed cloud and migration of workload to these infrastructures that have a greater fit for purpose.
• Rapid data growth. As economies have evolved digitally, significantly increasing data volume,management of this data has become much more complex. IDC estimates that in 2020, enterprisescreated and captured 64 zettabytes of data. The challenge for many organizations is how to collect,harness and govern this data for insights that yield business results and realize data as a differentiator.In order to leverage advanced capabilities such as artificial intelligence and machine learning toenable their business use cases, enterprises need to address data privacy, compliance, security,multicloud data management and data governance across physical and virtual layers of the IT estate.
• Increasing need for secure systems. As technology environments become increasingly complex andonline, remote and distributed work environments persist, cybersecurity will remain of paramountimportance as threats proliferate. Breaches in security can have severe, lasting financial and reputationalconsequences on businesses. In response, businesses continue to build out their cybersecurityefforts, using service providers to augment their capabilities. According to PwC’s 2021 CEO Survey,one-third of U.S. CEOs plan to increase investments in cybersecurity by double digits, with 47% ofCEOs citing cyber threats as sources of extreme concern to growth prospects. Enterprises seekservice providers that can deploy the expertise and resources needed to manage their growingcybersecurity needs with an efficient and comprehensive approach. Gartner estimates approximately80% of organizations currently have 16 or more tools from different vendors in their cybersecurityportfolio, recognize vendor consolidation as an avenue for reduced costs and better security thataddresses the complexity in their IT environments, and are, therefore, interested in vendor consolidationstrategies.
• Accelerating pace of technological advancement. As companies adopt new technologies for improvedbusiness performance and innovation, they face a challenge in complexity to integrate these newtechnologies with their existing IT estates. As a result, the required skills, integration burden, and costin end-to-end operational management often increases. This drives adoption of new capabilities,such as automation, artificial intelligence, and machine learning to ensure that the IT environment iswell designed and orchestrated to effectively realize business objectives.
Our Services
We provide advisory, implementation, and managed services in and across a range of technologydomains to help our customers manage and modernize enterprise IT environments in support of theirbusiness and transformation objectives. Our services are differentiated based on our expertise and intellectualproperty, and data around IT patterns across customers in the following domains:
• Cloud Services: We design, build, and provide managed services for our customers’ multicloudenvironments. We apply a mix of skilled practitioners, intelligent automation and modern servicemanagement principles of Site Reliability Engineering, AIOps, Infrastructure as Code and DevOps.We help enterprises optimize their use of hyperscale cloud providers in a unified environment,seamlessly integrating services delivered by: ISVs, large public cloud providers, internal platforms,and other technologies (e.g., IoT).
52

• Core Enterprise & zCloud Services: We establish and operate modern, dedicated technologyinfrastructure on behalf of enterprise customers to enable their current and future growth andprofitability objectives. We support a range of enterprise infrastructure, including private clouds,mainframe environments, distributed computing, enterprise networks, and storage environments.
• Application, Data, and Artificial Intelligence Services: We provide end-to-end enterprise dataservices, including data transformation, data architecture and management, data governance andcompliance, and data migration. We support Chief Digital Officers and CIOs in governing the vastquantities of enterprise data across internal and external sources to drive their digital strategies,transactions, and business objectives, while maintaining security, ethical standards, and compliancewith country-specific data protection regulations (e.g., GDPR, HIPAA, and PCI). We provide servicesto design, build, manage, and automate the IT environments for enterprise applications as theymigrate to the cloud. Our services help CIOs and Chief Technology Officers (CTOs) unlock the fullvalue of leading third-party Enterprise Resource Planning systems (e.g., Oracle, SAP) and packagedapplications through the use of AI and software-defined technologies.
• Digital Workplace Services: Our digital workplace services provide the technology infrastructure,mobility, security, and access solutions to support a global workforce that is constantly evolving. Ourservices include enterprise mobility solutions that provide users with the ability to work seamlesslyacross environments and locations.
• Security & Resiliency Services: We provide comprehensive enterprise cyber-security services for ChiefInformation Security Officers and CRO, including: insights, protection, detection, response, andrecovery to support the security of our client’s hybrid IT estate, data and operations. Concurrently,we provide resiliency services that include a mix of business continuity planning and cloud-baseddisaster recovery capabilities (composed of experts, digital tools and automation, and failoverenvironments). These services allow our customers to operate without issue or disruption in responseto attacks, outages, natural disasters, and geopolitical events.
• Network Services & Edge: We provide network and edge services to help customers meet theirtechnological and commercial requirements for connectivity and compute across their digitalenvironments. Our strategy and assessment services help evaluate customers’ network needs for theirmulticloud environments, while our network transformation and managed services allow customersto realize benefits of the latest software-defined network technologies. We deliver these services with aproprietary framework and architecture coupled with proof of concepts to then implement andmanage enterprise networks with the right economics.
Our Competitive Strengths
We are a recognized leader in many of the services we provide, as acknowledged by research analysts(e.g., Everest, Forrester, Gartner, and IDC). We are known for our technology integration and modernizationexpertise — designing, building, and managing complex technology environments. Our worldwide andhigh-quality service delivery is underpinned by experienced and highly-trained practitioners that bring thebest of our capabilities to our customers on a daily basis. Importantly, our culture of customer serviceexcellence — especially in times of crisis, from COVID-19 to tsunamis, floods, cyber-attacks, and poweroutages — carries on from our heritage through our people. Given our unique capabilities, scale, intellectualproperty, and engineering talent, we are positioned to partner with enterprises for their future across arange of technologies, use cases, and business strategies to help them maximize the return on their technologyinvestments and digital transformations.
Our competitive strengths stem from our intellectual property and data around IT patterns, our mission-critical expertise, and our broad ecosystem of partners:
• We are a leader in technology services. We are the largest provider of IT infrastructure services andare recognized by research analysts (e.g., Gartner, Forrester, IDC, Everest, NelsonHall, and HfSResearch) as a leader in key service areas. We possess significant experience in virtually all industries,gained through collaboration with customers across over 30 years designing, building, and managingoperating environments for their IT systems. Our highly skilled workforce provides the expertise(e.g., approximately 13,000 Red Hat accreditations) to securely and reliably handle many of the most
53

complex issues. In conjunction with our delivery capabilities (such as artificial intelligence thataugments our people) and scale, we provide mission-critical services to a diversified customer base.We also have unique intellectual property applicable to IT environments, as reflected by our portfolioof approximately 3,000 patents.
• We consistently deliver unsurpassed performance and reliability for complex environments. Our expertpractitioners and talented engineers provide services through modern ways of working, including agileand design thinking. Additionally, our unique intellectual property and industry-leading technologyplatforms utilize contemporary approaches to IT operations to provide reliable and efficient solutionsfor each customer’s operating model. These capabilities allow us to execute with secure and compliantoperating and delivery models at scale, driving high-quality performance and customer satisfaction.We realize high quality performance across thousands of service-level agreements and consistentlyachieve world-class customer satisfaction and advocacy.
• We deliver insights at scale, supported by unique automation capabilities and application of AI. Ourability to deliver superior outcomes for customers is driven by our capacity to leverage our data aroundIT patterns and insights, derived from multiple technology environments across customerengagements. We apply machine learning, combined with our practitioner expertise to derive uniqueinsights used to service customers, enhance our offerings and to produce our next-generationservices, investing to ensure continuous innovation for improved outcomes. For example, we arerecognized leaders in the use of automation and operational AI in the delivery of our services, withover 6,000,000 automated actions per month, enabling greater quality and efficiency for us and ourcustomers. Our operational AI approach and set of technologies, along with intellectual propertythat we apply and continually evolve, are leveraged to develop predictive actions to prevent issuesbefore they arise.
• We are a recognized leader in managed services for cloud and on-premise environments and servicessuch as security and resiliency. We offer a range of high-value capabilities including cloud services, andsecurity & resiliency services, providing us with a sustainable competitive advantage when helpingcustomers transform their technology environments. Our multicloud management capabilities aredifferentiated by our ability to deliver an integrated view of our customers’ diverse technologyenvironments and to provide our services and solutions digitally. We offer integrated services betweenthe cloud and on-premise environments.
• We offer an integrated ecosystem to help customers adopt and run an increasingly heterogeneous set oftechnologies. As customers pursue multiple cloud-based technology partners, applications, andcapabilities, integration is increasingly critical for customers to manage and orchestrate the technologyecosystem required to run their businesses and achieve their broader objectives. We provide holisticservices across thousands of diverse technologies, delivering end-to-end integration across public andprivate / on-premise cloud platforms and other full-stack technology solutions. Following the Spin-Off, we will enhance our ecosystem of partners, including large public cloud providers, application-oriented system integrators, independent software vendors, and other players in the technologystack to provide the best technology and capability for our customers. Our services and ecosystemsenable us to offer leading services for all levels of customer environment complexity and integration.
Our Strategies
We will pursue a strategy centered on our ability to build and enrich trusted relationships withcustomers and technology partners, differentiating through our proven ability to create and deploy scale-derived intellectual property, provide mission-critical expertise across industries, and partner with a broadecosystem for contemporary capabilities that best suit customers’ needs. We have a strong and long-standingfoundation developed by governing and managing complex technology environments, including IBM (e.g.,Red Hat and Cloud Paks) and third-party technologies (e.g., VMWare, ServiceNow, and Microsoft). Withincreased freedom of action, we will extend these capabilities to an even broader ecosystem of technologyproviders and develop more services that are digitally consumable to expand accessibility to new customersand markets.
We have a long track record of running customers’ technology environments, enabling them to focuson the core aspects of their businesses. Given the nature of the work we do, we have a unique perspective on
54
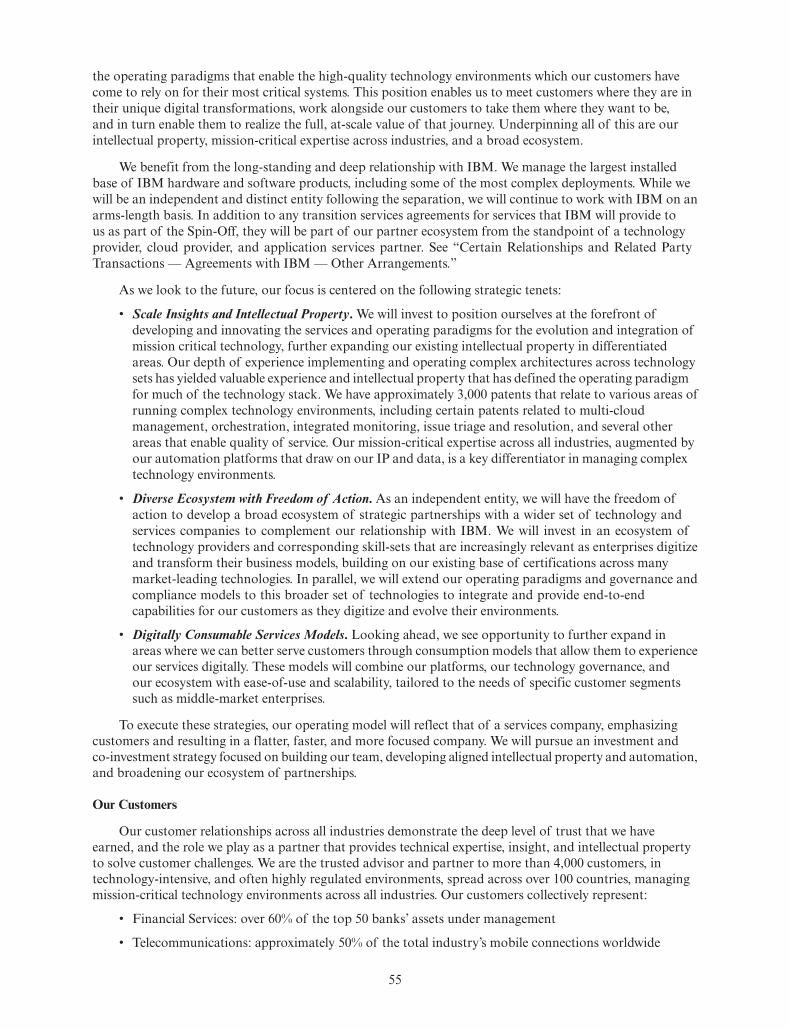
the operating paradigms that enable the high-quality technology environments which our customers havecome to rely on for their most critical systems. This position enables us to meet customers where they are intheir unique digital transformations, work alongside our customers to take them where they want to be,and in turn enable them to realize the full, at-scale value of that journey. Underpinning all of this are ourintellectual property, mission-critical expertise across industries, and a broad ecosystem.
We benefit from the long-standing and deep relationship with IBM. We manage the largest installedbase of IBM hardware and software products, including some of the most complex deployments. While wewill be an independent and distinct entity following the separation, we will continue to work with IBM on anarms-length basis. In addition to any transition services agreements for services that IBM will provide tous as part of the Spin-Off, they will be part of our partner ecosystem from the standpoint of a technologyprovider, cloud provider, and application services partner. See “Certain Relationships and Related PartyTransactions — Agreements with IBM — Other Arrangements.”
As we look to the future, our focus is centered on the following strategic tenets:
• Scale Insights and Intellectual Property. We will invest to position ourselves at the forefront ofdeveloping and innovating the services and operating paradigms for the evolution and integration ofmission critical technology, further expanding our existing intellectual property in differentiatedareas. Our depth of experience implementing and operating complex architectures across technologysets has yielded valuable experience and intellectual property that has defined the operating paradigmfor much of the technology stack. We have approximately 3,000 patents that relate to various areas ofrunning complex technology environments, including certain patents related to multi-cloudmanagement, orchestration, integrated monitoring, issue triage and resolution, and several otherareas that enable quality of service. Our mission-critical expertise across all industries, augmented byour automation platforms that draw on our IP and data, is a key differentiator in managing complextechnology environments.
• Diverse Ecosystem with Freedom of Action. As an independent entity, we will have the freedom ofaction to develop a broad ecosystem of strategic partnerships with a wider set of technology andservices companies to complement our relationship with IBM. We will invest in an ecosystem oftechnology providers and corresponding skill-sets that are increasingly relevant as enterprises digitizeand transform their business models, building on our existing base of certifications across manymarket-leading technologies. In parallel, we will extend our operating paradigms and governance andcompliance models to this broader set of technologies to integrate and provide end-to-endcapabilities for our customers as they digitize and evolve their environments.
• Digitally Consumable Services Models. Looking ahead, we see opportunity to further expand inareas where we can better serve customers through consumption models that allow them to experienceour services digitally. These models will combine our platforms, our technology governance, andour ecosystem with ease-of-use and scalability, tailored to the needs of specific customer segmentssuch as middle-market enterprises.
To execute these strategies, our operating model will reflect that of a services company, emphasizingcustomers and resulting in a flatter, faster, and more focused company. We will pursue an investment andco-investment strategy focused on building our team, developing aligned intellectual property and automation,and broadening our ecosystem of partnerships.
Our Customers
Our customer relationships across all industries demonstrate the deep level of trust that we haveearned, and the role we play as a partner that provides technical expertise, insight, and intellectual propertyto solve customer challenges. We are the trusted advisor and partner to more than 4,000 customers, intechnology-intensive, and often highly regulated environments, spread across over 100 countries, managingmission-critical technology environments across all industries. Our customers collectively represent:
• Financial Services: over 60% of the top 50 banks’ assets under management
• Telecommunications: approximately 50% of the total industry’s mobile connections worldwide
55

• Retail: over 50% of the total industry’s hypermarket sales
• Automotive: approximately 45% of the total industry’s production of passenger vehicles
• Airlines: over 35% of total revenue passenger miles flown
As companies engage in their digital journey, they face a key impediment related to the skills andexpertise needed to realize their transformations. This, in part, is brought on by the increasing complexity ofenterprise environments, the incorporation of new technologies, and the deployment of different operatingmodels. While many companies have strengthened their technology teams, they have also encountereddifficulties in sourcing the breadth of expertise needed for their environments and leveraged service providersto address their needs. Companies will benefit from selecting service providers that have greater insightinto their environments and needs, which advantages partners with long-lasting customer relationships.
Through decades of collaboration with customers, we have developed deep relationships as wesupported the technology environments that advanced their business agendas. Recent examples include:
Large-scale transformation to cloud: We partnered with a large, European financial institution to helpthem migrate from a predominantly on-premise, classic infrastructure environment to a cloud-basedinfrastructure, utilizing both private and public clouds. We provided the expertise and support to navigatethis digital transformation while maintaining and improving quality of service as we moved over one thousandapplications. We also deployed a new Kubernetes container-based environment and management capabilitiesto increase workload portability and flexibility. This work enabled the customer’s platform to run withincreased digital agility and efficiency, embedding strong data security within the new cloud-basedinfrastructure and providing alignment to the existing infrastructure environment. The customer’stransformation has brought business benefits, from new products and services that are brought to marketfaster, to an increase in sales through online channels.
Modernization of the technology environment: Based on a relationship spanning almost 2 decades, wepartnered with a large European bank to help launch a 10-year transformational program to increaseoperational agility and efficiency by optimizing the customer’s critical infrastructure, reducing complexity,migrating to hybrid cloud, and reducing operational costs. We reduced IT infrastructure complexity byredesigning critical infrastructure architecture, including networks, storage, virtualization, and data backupfor improved efficiency, enabled ‘scalable’ hybrid cloud by implementing and updating existing systems toa hybrid cloud solution supported by Red Hat, and transformed legacy IT services by modernizing tools andthe operating model for deployment of IT services. The customer will benefit from modern IT infrastructureincluding cloud and mainframes that supports their core banking services and treasury functions.
Digital transformation across the enterprise: We collaborated with a large material sciences company inNorth America to support their mission-critical IT infrastructure globally, providing integrated managementfor environments that include hybrid cloud infrastructure, network, security, and end-user services. As theCOVID-19 pandemic impacted the operations of many companies, we worked with our customer to helpmove more than 40,000 employees to a remote model while maintaining critical operations in productionfacilities without disruption. Building on our 16-year history of collaboration, we are working to acceleratetheir digital transformation. We are helping our customer build foundational capabilities for their digitaljourney, powered by data, analytics, and artificial intelligence and machine learning integrated into corebusiness processes and connected through a flexible and secure network. This will support our customer’sability to fully exploit digital technologies, and realize business benefit.
Digitization for flexibility: Our customer, a large Japanese transportation company, was engaged in atechnology-driven transformation to establish a flexible IT environment using hybrid cloud that evolveswith changing business needs. Our teams worked together to build an integrated private and public cloudwith the same virtualization architecture, and a management capability that unifies operations and evolveswith the business. Through our collaboration, we created an integrated infrastructure to meet our customer’scurrent and future needs by modernizing on premise, off premise, and network environment as well as itsmanagement platform. We deployed software-defined networks across the environment and automation torealize improved quality and business continuity. Our work helps support our customer’s efforts to becomeone of the most valued and preferred transportation companies in the world.
56

An important part of our services involve supporting our customers during times of crisis, includingglobal disruptions. For instance, during the COVID-19 pandemic, our business continuity plans mitigatedall COVID-driven outages in 2020, providing peace-of-mind to our customers and giving them the confidenceto focus on their core businesses. We ensured that our customers had the data and IT services needed tomigrate operations to a work-from-home environment. Our response also demonstrated the resilience of ourdelivery model, as most of our professionals moved to work-from-home without impact to customerservice.
Sales and Marketing
Our customer engagement and brand positioning will focus on deepening our existing customerrelationships, attracting and winning new customers, and creating an ecosystem built on go-to-marketrelationships with leading cloud and other technology providers, advisors, and integrators to offer best-in-class advisory, implementation, and managed services tailored to each existing and new customer’senvironment and requirements.
Customer-Centric Account Approach. Following the Spin-Off, we will deploy dedicated accountcoverage teams within our global operating structure. The teams will leverage our intellectual capital andtools underpinned by insights and proven practices derived from operating at scale. Senior account leaderswill lead the teams and have end-to-end accountability from sale to delivery for managed services customers.They will tailor the full suite of our services to the customers’ needs to deliver value and business outcomesacross a wide range of technology environments. Account leaders will be supported by dedicated, multi-disciplinary technical sales and delivery teams, as well as by shared services teams, to support an effectiveand efficient engagement. This new account coverage model will ensure consistent and reliable delivery ofservices for our existing relationships over the lifetime of current and renewal contracts. In addition, themodel will support the potential expansion of existing relationships based on our deep industry perspectiveand expertise and knowledge of customers’ unique needs. Finally, this account-based model will seek to buildand expand existing relationships with line of business buyers, as they have become critical decisionmakers working alongside our customers.
Customer Growth and New Customer Acquisition. In line with our customer-centric approach, we willfocus on co-creating and innovating with customers to advance and deepen our relationships. We will leverageour broad base of expertise, capabilities, and partners to prototype, test, and develop innovative solutionsacross various approaches and technologies. Additionally, we will offer bespoke project capabilities in advisory,implementation, and transformation services to help customers enhance and evolve their technologyenvironments. We will deploy our talent, thought leadership, proven practices, intellectual capital, andpartnership ecosystem as part of our project engagements to mature them into longer-tail managed servicesopportunities. In addition, we will attract and develop new customers across the globe via account-basedmarketing, insights derived from operating at scale, and direct sales teams with years of sector-specificexperience and proven practices to generate unique insights for customers. As we gain new customers, we willapply our account coverage model to expand our relationships and footprint over time.
Partnership and Alliance Ecosystem. While we will maintain a strategic partnership with IBM, we willalso benefit from greater flexibility to enhance and develop strategic relationships with other partners. Wewill build a set of new routes to market to serve as a multiplier that enables us to expand business with ourpartner ecosystem. The ecosystem will at least include: public cloud providers, ISVs, technology providers(ranging from established, scaled players to growth-stage start-ups), system integrators, business consultingfirms, and business services providers. These relationships will benefit our customers through broader accessto best-in-class solutions that are tailored for their unique technology situations and digital journeys. Wewill have dedicated teams supporting our key alliance partners and will co-create and co-market with themto deliver value to our mutual customers.
Our Competition
We compete in a market for technology services along with many other providers, ranging from small,highly specialized companies that serve a limited number of customers to large, multi-service enterpriseswith many clients. These service providers include: incumbents that have expanded their offerings to migrationand management of cloud-based environments; companies that utilize labor-based models and leverage
57

talent pools primarily in lower-cost countries that have grown to offer a broad range of services with aworldwide presence; and advisory-focused system integrators specializing in bringing together disparatetechnology environments so that they function as one. Many of these companies offer a mix of advisory,implementation, and managed services across infrastructure, application, and business processes. Examplesinclude: Atos, DXC, Fujitsu, Infosys, Rackspace, Tata Consultancy Services, and Wipro, among others.
The basis of competition involves multiple factors, with key elements including quality of service,technical skills and capabilities, industry knowledge and experience, financial value, ability to innovate,intellectual property and methods, contracting flexibility, and speed of execution. Long-standing partnershipsand knowledge of the customers’ technology environment often enable service providers to better addressrequirements and future needs. Our decades-long collaboration with customers provides us with the insightsto realize distinctive performance that supports their digital transformation. We deliver unique value byproviding intellectual property derived from insights at scale, deploying mission-critical expertise, andleveraging a broad ecosystem — while building and strengthening partnerships to enhance the customerexperience.
We will position ourselves uniquely, leveraging a core strength in governance and management ofcomplex IT infrastructure environments, delivered through a global footprint. Our services supportcustomers’ digital transformations, as we help accelerate their journeys by providing instrumented andengineered technology environments. We offer choice with consistency through an operating paradigm andmanagement model built from our experiences with complex technologies. These capabilities uniquely positionus as both a leading partner and competitor within the same market.
Intellectual Property
We are committed to developing leading-edge ideas and technologies and see innovation as a source ofcompetitive advantage. We will bring approximately 3,000 patents from IBM that are related to our businessmodel. A key pillar of our strategy is continuing to invest in knowledge and intellectual property tosupport extending our services to a broader ecosystem of technology providers and customer challengesand solutions. Our decades of experiences working with our customers has generated operational insights,creating intellectual property that we leverage for the benefit of our customers. We will leverage our multicloudmanagement platform and orchestration and intelligence layer intellectual property to provide insights toour customers at scale. We rely on intellectual property protections in the countries in which we operate, alongwith contractual restrictions, to establish and protect our offerings and services and other applicable rights.In addition, we license third-party software along with other technologies that are used in the provision of orincorporated into some elements of our services. We possess a significant intellectual property portfolio,which we believe is important to our success. However, we believe our business as a whole is not materiallydependent on any particular intellectual property right or any particular group of patents, trademarks,copyrights or licenses.
Additionally, we own or have rights to various trademarks, logos, service marks, and trade names thatare used in the operation of our business. We also own or have the rights to copyrights that protect the contentof our products and other proprietary materials.
Human Capital Resources
Employees
We had approximately 90,000 employees as of June 30, 2021 spanning 63 countries. Approximately 92%of our employees work outside the U.S., with workforce hubs in India, Poland, Brazil, Japan, Czech Republic,and Hungary.
We work alongside the best people advancing the vital systems that power human progress. Our globalworkforce is highly skilled, reflective of the work we do for our customers’ digital transformations and insupport of their mission-critical operations. Our industry experts are also always continuously learning. In2020 alone, we earned more than 140,000 badges through our learning platform in strategic skills, includingcloud, AI, analytics, design thinking, quantum and security. At Kyndryl, we are:
58

• A purpose-led culture, focused on inspiring our dedicated people to advance what’s possible for ourcustomers
• A business where our people are our business. We want empowered employees who keep learning,thriving, and creating
• Inclusive and open. This starts with a diverse and empathetic workforce that listens and learns atevery step
• Fostering an environment that supports new ways of working, accelerated career progression, andthe chance to work with the most interesting technology systems
• Promoting innovation at every turn — in our open and transparent leadership, in our purpose, andin our shared values built around a commitment to advancing what’s next for ourselves and ourcustomers
Our people are truly at the center of designing, building, and managing the technology environmentsthat the world depends on every day. We will continue to invest in our teams to be at the heart of technologicalchange for our customers.
Talent and Culture
Our business is our people; and our talent strategy revolves around our ability to best serve ourcustomers through ongoing investment in talent and skill development. We attract, develop, and retaintalent in a dynamic and competitive environment. We are singularly focused on optimizing the employeeexperience at Kyndryl through:
• Attracting: We create technical careers of the future through increased skill development to meet andexceed new market demands
• Developing: We align our people’s goals with our customers, promoting acquisition of critical skillson an individual level, and continuous learning
• Retaining: We retain the best talent through increased career mobility/ velocity through internalupskilling and reskilling opportunities and promotions
We are committed to building the technical careers of the future and have made investments in trainingand skills to ensure our people are relevant, experienced, and technically positioned to serve our customerson their most complex challenges. We continue to expand our certifications and accreditations each yearthrough consistent investment in skill development around emerging technologies and key areas forgrowth.
We offer market competitive, comprehensive rewards and benefits programs including health benefits,mental health support and Employee Assistance Plans, retirement savings benefits, paid time off, and salaryand recognition programs, among others. We will continue to build on strong employee engagementincluding conducting an annual engagement survey, measuring elements such as workplace experience,inclusion, and pride.
Diversity and Inclusion
Diversity and Inclusion is inherent in our DNA. We will uphold and build upon a strong history ofdiversity, inclusion and equity. Key diversity and inclusion objectives are:
• Continually drive to achieve a diverse and equitable representation in both leadership positions andthe broader workforce
• Aim to eliminate implicit bias and ensure equity in all our employment practices for underrepresentedgroups
• Drive engaging and inclusive employee experiences
• Exceed Equal Opportunity compliance goals in all countries where we operate, and
• Comply with Equal Opportunity audits
59

Health, Safety and Well-Being
We have a clear commitment to the health, safety and well-being of our employees. We have anexperienced Health and Safety team comprised of medical doctors, nurses, industrial hygiene, safety, andworkforce health experts. This team will implement a health and safety management system that ensurescompliance with all local health and safety regulations, minimizes workplace health and safety risks, andprovides for safe and healthy workplaces so our employees can do their best work.
During the COVID-19 pandemic, our priority continues to be the health and safety of employees,customers, and partners, while supporting our customers’ operations. We have a comprehensive, global,pandemic management plan. This includes a robust case management system to manage potential COVID-19exposures and a comprehensive playbook on workplace health and safety measures that allow our officesto reopen when conditions improve. Our employees are supported with access to our Health and Safety team,education, timely updates and forums to ask questions and raise concerns. Additionally, we will continueto focus on mental health and supporting our employees through different phases of the pandemic.
Properties
As of June 30, 2021 we owned or leased approximately 19 million square feet of space worldwide, asummary of which is provided below. We believe that our existing properties are in good condition and aresuitable for the conduct of our business.
Americas EMEA Japan Asia Pacific Total
Numberof
Locations
SquareFeet
(millions)
Numberof
Locations
SquareFeet
(millions)
Numberof
Locations
SquareFeet
(millions)
Numberof
Locations
SquareFeet
(millions)
Numberof
Locations
SquareFeet
(millions)
Total . . . . . 79 8.0 162 6.5 40 1.1 62 3.1 343 18.8Leased . . 68 4.5 156 5.8 40 1.1 62 3.1 326 14.5Owned . . 11 3.5 6 0.7 — — — — 17 4.2
Principal Executive Offices
Our principal executive offices, including our global headquarters, are located at New York, New York.
Legal Proceedings
Refer to note K, “Commitments and Contingencies,” to the combined financial statements includedelsewhere in this Information Statement.
60
MANAGEMENT’S DISCUSSION AND ANALYSIS OF FINANCIAL CONDITION ANDRESULTS OF OPERATIONS
The following discussion should be read together with the Combined Financial Statements and relatedNotes thereto and other financial information appearing elsewhere in this Information Statement. This discussioncontains forward-looking statements that involve risk, assumptions and uncertainties, such as statements ofour plans, objectives, expectations, intentions and forecasts. Our actual results and the timing of selected eventscould differ materially from those discussed in these forward-looking statements as a result of several factors,including those set forth under the section of this Information Statement titled “Risk Factors” and elsewhere inthis Information Statement. You should carefully read the “Risk Factors” to gain an understanding of theimportant factors that could cause actual results to differ materially from our forward-looking statements. Pleasealso see the section of this Information Statement titled “Cautionary Statement Concerning Forward-Looking Statements.”
The following Management’s Discussion and Analysis of Financial Condition and Results of Operationsis intended to help you understand the results of operations for the three and six months ended June 30, 2021and 2020, and for the years ended December 31, 2020, 2019 and 2018, as well as the financial condition ofthe Business at June 30, 2021 and the annual periods ended December 31, 2020, 2019 and 2018.
Business Overview
We are a leading technology services company and the largest infrastructure services provider in theworld, serving as a partner to more than 4,000 customers in over 100 countries. We have a long track recordof helping enterprises navigate major technological changes, particularly by enabling our customers tofocus on the core aspects of their businesses during these shifts while trusting us with their most criticalsystems. Today, enterprises are engaged in individual and unique digital transformations to differentiate theirbusinesses and derive value through better customer experiences. However, enterprises often face shortagesin critical technical expertise to successfully make this complex change. Our purpose is therefore uniquelypositioned to design, build, and manage secure and responsive private, public, and multicloud environmentsto accelerate our customers’ digital transformations.
We put the customer at the center of everything we do, every day. We provide engineering talent,operating paradigms, and insights derived from our data around IT patterns. This enables us to deliveradvisory, implementation, and managed services at scale across technology infrastructures that allow ourcustomers to de-risk and realize the full value of their digital transformations. We do this while embracing newtechnologies and solutions, and continually expanding our skills and capabilities, as we help advance thevital systems that power progress for our customers. We are also organized to be fast and focused, in orderto respond more quickly to our customers’ needs, and our principles have led to a structure that drivesaccountability and responsibility to the teams that work closely with them and our partners. We delivertransformation and secure cloud services capabilities, insights, and depth of expertise to modernize andmanage IT environments based on our customers’ unique patterns of transformation at scale. We offerservices across domains such as cloud services, core enterprise and zCloud services, applications, data, andartificial intelligence services, digital workplace services, security and resiliency services, and network and edgeservices as we continue to support our customers through technological change. Our services enable us tomodernize and manage cloud and on-premise environments as “one” for our customers, enabling them toscale seamlessly.
To deliver these services, we rely on our team of skilled practitioners, consisting of approximately90,000 professionals. Given our large and diversified customer base operates in multiple industries andgeographies, we utilize a flexible labor and delivery model with a balanced mix of global and local talent asneeded to meet customer-specific needs, regulatory requirements, and data protection and labor laws. Ouremployees leverage their deep engineering expertise and extensive experience operating complex andheterogeneous technology environments to drive service quality, intellectual property development, and ourlong-term trusted customer relationships.
As described in “Business — Our Customers,” we have many customer relationships that are decadeslong, as we provide high-quality, mission-critical services that are core to operations with customers that
61

represent the backbones of their respective industries. These customers entrust us to deliver the servicesthey need, and manage their complex environments so that they can achieve their business objectives.
As an independent company, we will be free to partner with a broader ecosystem, including a wide rangeof hyperscale cloud providers, system integrators, independent software vendors, and technology vendorsfrom startups to market leaders. This enables us to serve our customers with the contemporary technologycapabilities that best fit their needs and open new avenues for growth. This is all underpinned by our ability tointegrate and operate mission-critical technology at scale using deep engineering expertise and intellectualproperty.
Our approach has enabled us to reach significant scale, with $19.4 billion in revenue for the fiscal yearended December 31, 2020. We are focused on driving revenue growth with sustainable margins by extendingour leadership in the markets in which we operate while investing in our capabilities, and expanding ourhigh value, next generation services consistent with customer needs.
Management Discussion Snapshot
For the Three Months EndedJune 30, Percent/
MarginChange
For the Six Months EndedJune 30, Percent/
MarginChange($ in millions) 2021 2020 2021 2020
Revenue . . . . . . . . . . . . . . . . . . . . . . $4,751 $4,737 0.3% $9,523 $ 9,569 (0.5)%Gross profit margin . . . . . . . . . . . . . . 11.1%* 10.9% 0.1pts. 10.3%* 10.7% (0.4)pts.Total expense and other (income) . . . . . $ 845** $ 803 5.3% $1,700** $ 1,903 (10.7)%Loss before income taxes . . . . . . . . . . $ (319)*** $ (284) 12.2% $ (722)*** $ (879) (17.9)%Provision for income taxes . . . . . . . . . 74 89 (16.4)% 165 176 (5.9)%Net loss . . . . . . . . . . . . . . . . . . . . . . $ (393)*** $ (373) 5.4% $ (887)*** $(1,055) (15.9)%
Net loss margin . . . . . . . . . . . . . . . . . (8.3)% (7.9)% (0.4)pts. (9.3)% (11.0)% 1.7pts.
* Includes impact from $58 million and $61 million of pre-tax spin-off-related charges in the secondquarter and first half, respectively.
** Includes $119 million and $171 million of pre-tax spin-off-related charges in the second quarter andfirst half, respectively.
*** Includes $177 million and $232 million of pre-tax spin-off related charges in the second quarter andfirst half, respectively.
($ in millions)At June 30,
2021At December 31,
2020
Yr.-to-Yr.PercentChange
Assets . . . . . . . . . . . . . . . . . . . . . . . . . . . . . . . . . . . . . . . . . . . . $11,066 $11,205 (1.2)%Liabilities . . . . . . . . . . . . . . . . . . . . . . . . . . . . . . . . . . . . . . . . . $ 6,190 $ 6,274 (1.3)%Equity . . . . . . . . . . . . . . . . . . . . . . . . . . . . . . . . . . . . . . . . . . . . $ 4,875 $ 4,931 (1.1)%
($ in millions)For the year ended December 31:
Yr.-to-Yr.Percent/Margin
Change
2020 2019 2018 2020 – 2019 2019 – 2018
Revenue . . . . . . . . . . . . . . . . . . . . . . . . . . $19,352 $20,279 $21,796 (4.6)% (7.0)%Gross profit margin . . . . . . . . . . . . . . . . . . 11.4% 12.8% 11.7% (1.4)pts. 1.1pts.Total expense and other (income) . . . . . . . . . $ 3,975* $ 3,176 $ 3,187 25.1% (0.3)%Loss before income taxes . . . . . . . . . . . . . . . $ (1,766)* $ (579) $ (630) 205.0% (8.1)%Provision for income taxes . . . . . . . . . . . . . 246 364 350 (32.5)% 4.0%Net loss . . . . . . . . . . . . . . . . . . . . . . . . . . $ (2,011)* $ (943) $ (980) 113.3% (3.7)%
Net loss margin . . . . . . . . . . . . . . . . . . . . . (10.4)%* (4.7)% (4.5)% (5.7)pts. (0.2)pts.
62

* Includes $918 million of pre-tax charges for workforce rebalancing actions during the year.
($ in millions)At December 31: 2020 2019
Yr.-to-Yr.PercentChange
Assets . . . . . . . . . . . . . . . . . . . . . . . . . . . . . . . . . . . . . . . . . . . . . . . . . $11,205 $11,744 (4.6)%Liabilities . . . . . . . . . . . . . . . . . . . . . . . . . . . . . . . . . . . . . . . . . . . . . . $ 6,274 $ 5,796 8.3%Equity . . . . . . . . . . . . . . . . . . . . . . . . . . . . . . . . . . . . . . . . . . . . . . . . $ 4,931 $ 5,948 (17.1)%
Organization of Information
As a result of the allocations and carve out methodologies used to prepare these combined financialstatements, the accompanying combined financial statements included throughout this InformationStatement may not be indicative of our future performance, do not necessarily include the actual expensesthat would have been incurred by us and may not reflect our results of operations, financial position and cashflows had we been a separate, standalone company during the periods presented. For additional information,see “Basis of Presentation.”
Financial Performance Summary
Environmental Dynamics
With the unprecedented COVID-19 pandemic and macroeconomic uncertainty beginning inMarch 2020, many clients experienced declines in their business volumes, and client priorities shifted tomaintaining operational stability, flexibility and preservation of cash. While there was continued demandfor offerings that support their digital transformation, clients moved to shorter term duration engagementsand prioritized operational expenditures over capital expenditures. These dynamics impacted our performancein 2020.
We expect the rate and pace of recovery from the pandemic to differ by geography and industry. Theunderlying fundamentals of our business continue to remain sound as we continue to manage through thismacroeconomic uncertainty. As the world recovers from the effects of the pandemic, Kyndryl continues to bewell positioned to support our clients to emerge even stronger.
2021 Financial Performance
Three months ended June 30:
In the second quarter of 2021, we reported $4.8 billion in revenue, an increase of 0.3 percent year toyear driven by the EMEA segment. This revenue growth reflects a modest improvement in year-to-yearperformance, driven by improving trends in client-based business volumes and project activity. Overall, wesaw base portfolio improvement aligned to recovering trends of the macro-economic events. Gross profitmargin of 11.1 percent increased 0.1 points versus the prior-year period reflecting the benefits from theproductivity actions taken in 2020 to improve the profit and margin profile of the business in advance ofthe separation. The improving trends we saw in revenue are also reflected in our gross profit performance.Total expense and other income of $0.8 billion increased 5.3 percent year to year impacted by spin-off-related charges of $0.1 billion recorded in the second quarter of 2021 partially offset by lower workforcerebalancing charges of $0.1 billion. Net loss of $0.4 billion, increased 5.4 percent versus the prior-yearperiod primarily driven by the same factors described above.
Six months ended June 30:
In the first six months of 2021, we reported $9.5 billion in revenue, a decline of 0.5 percent whencompared to the prior-year period primarily driven by declines in the Americas segment. Although therewas an improved trajectory in project activity and client-based business volumes in the first half of 2021,signings were down year to year with strong signings in the first-quarter 2020 driven by large renewals. Gross
63

profit margin of 10.3 percent declined by 0.4 points versus the prior-year period. The benefits from thestructural actions did not start to realize until the end of the first half of 2021. Although first half saw year-to-year decline in revenue and gross profit, this is mainly driven by the first quarter results. We sawimproving trends in second quarter as we were less impacted by unique dynamics related to prior year macro-economic events. In second quarter, we also saw our base portfolio begin to stabilize as we balance theprofit impact of both existing and new clients. Total expense and other income of $1.7 billion decreased10.7 percent year to year primarily driven by lower workforce rebalancing charges of $0.3 billion and animprovement in expected credit loss expense of $0.1 billion, partially offset by spin-off-related charges of$0.2 billion recorded in the first half of 2021. Net loss of $0.9 billion, improved by 15.9 percent versus theprior-year period primarily driven by the same factors described above.
Net cash used in operating activities of ($0.5) billion includes approximately $0.5 billion of cashoutflows consisting of payments for our structural actions initiated in the fourth quarter of 2020 and spin-off-related charges. Total assets of $11.1 billion decreased by $0.1 billion from December 31, 2020predominantly driven by declines in property and equipment of $0.4 billion partially offset by an increase innotes and accounts receivable of $0.2 billion and deferred costs of $0.1 billion. Total liabilities of $6.2 billiondecreased by $0.1 billion from year-end 2020 primarily as a result of a decrease in workforce rebalancingliabilities of $0.2 billion partially offset by an increase in debt of $0.1 billion. Total equity of $4.9 billiondeclined $0.1 billion from year-end 2020, mainly driven by a net loss of $0.9 billion, an increase in foreigncurrency translation losses of $0.1 billion, partially offset by net transfers from IBM of $0.9 billion.
2020 Financial Performance
In 2020, we reported $19.4 billion in revenue, a decline of 4.6 percent when compared to the prior yearwhich was driven by declines in the Americas segment. Revenue declined primarily due to a reduction inclient volumes within industries heavily impacted by the global pandemic. We ended 2020 with approximately4,400 customers, as compared to approximately 4,600 customers in the prior year. Gross profit margin of11.4 percent declined by 1.4 points. Total expense and other income of $4.0 billion increased 25.1 percent andreflects the impacts of higher workforce rebalancing charges of $0.8 billion. We took these structuralactions to simplify and optimize our operating model. Losses from operations were $2.0 billion, an increaseof $1.1 billion when compared to the prior year, primarily due to the higher workforce rebalancing charges.
We generated $0.6 billion in cash from operations in 2020. Total assets of $11.2 billion decreased by$0.6 billion compared to the prior year, predominantly driven by declines in notes and accounts receivableof $0.4 billion. Total liabilities of $6.3 billion at December 31, 2020 increased by $0.5 billion from the prioryear, primarily as a result of an increase in workforce rebalancing liabilities of $0.6 billion. Total equity of$5.0 billion at December 31, 2020 declined by $1.0 billion from the prior year, primarily driven by losses fromoperations within the year.
2019 Financial Performance
In 2019, we reported $20.3 billion in revenue, a decline of 7.0 percent when compared to the prior year,which was driven by declines in the Americas and EMEA segments, and a currency headwind. Like ourclients, we prioritized higher value opportunities in 2019. Discrete account and portfolio actions were takento improve our profitability in the long term even though they had an impact on our 2019 results. Weended 2019 with approximately 4,600 customers, as compared to approximately 5,100 customers in the prioryear. The majority of the historical net customer count decline was driven by lower revenue transactionalbusiness. Gross profit margin of 12.8 percent improved by 1.1 points, reflecting the benefit from structuralactions taken to improve contract profitability. Total expense and other income of $3.2 billion was flat whencompared to the prior year. Losses from operations were $0.9 billion, consistent with the prior year.
We generated $1.0 billion in cash from operations in 2019. Total assets of $11.8 billion increased by$0.9 billion compared to the prior year, predominantly driven by right-of-use asset increases of $1.2 billiondue to the adoption of the new lease standard. Total liabilities of $5.8 billion at December 31, 2019 increasedby $1.2 billion from the prior year, primarily as a result of an increase in operating lease liabilities of$1.2 billion. Total equity of $6.0 billion at December 31, 2019 declined by $0.3 billion from the prior year,primarily driven by losses from operations within the year.
64
Basis of Presentation
Our combined financial statements included throughout this Information Statement have been derivedfrom the consolidated financial statements and accounting records of IBM, as if we had operated on astandalone basis during the periods presented, and were prepared in accordance with U.S. GAAP andpursuant to the rules and regulations of the SEC.
Historically, we were included in IBM’s Global Technology Services segment and did not operate as aseparate, standalone entity. Accordingly, IBM has reported our financial position and the related results ofoperations, cash flows and changes in equity in IBM’s consolidated financial statements. As the separate legalentities that comprise us were not historically held by a single legal entity, Total Net Parent investment isshown in lieu of shareholder’s equity in the combined financial statements included throughout thisInformation Statement. Intercompany transactions between Kyndryl and IBM are considered to beeffectively settled in the combined financial statements at the time the transaction is recorded. The total neteffect of the settlement of these intercompany transactions is reflected as Net transfers from Parent in thefinancing activities section in the Combined Statement of Cash Flows and in the Combined Balance Sheetwithin Net Parent investment. Net Parent investment represents IBM’s interest in the recorded assets of ourbusiness and represents the cumulative investment by IBM in us through the dates presented, inclusive ofoperating results.
The combined financial statements included elsewhere in this Information Statement include thehistorical basis of assets, liabilities, revenues and expenses of the individual businesses of IBM’s historicalmanaged infrastructure services business, including the joint ventures and partnerships over which we havea controlling financial interest. The combined financial statements included elsewhere in this InformationStatement include certain assets and liabilities that are held by IBM that are specifically identifiable orotherwise attributable to us. All of our intracompany transactions between our businesses have beeneliminated. All of our significant intercompany transactions between us and IBM have been included in thecombined financial statements.
Cash is managed centrally through bank accounts controlled and maintained by IBM. Accordingly,cash and cash equivalents held by IBM at the corporate level were not attributable to us for any of theperiods presented. Only cash amounts specifically attributable to us are reflected in the combined financialstatements included throughout this Information Statement. Transfers of cash, both to and from IBM’scentralized cash management system, are reflected as a component of Net Parent investment in theCombined Balance Sheet and as a financing activity on the Combined Statement of Cash Flows. Historically,we received or provided funding as part of IBM’s centralized treasury program. IBM’s debt was notattributed to us because IBM’s borrowings are not our legal obligation. Interest expense in the CombinedIncome Statement reflects the allocation of interest on borrowing and funding related activity associated withthe portion of IBM’s borrowings where the proceeds benefited us. Third-party debt obligations included inthe combined financial statements are those for which the legal obligor is a legal entity of Kyndryl or the debtis expected to transfer to Kyndryl no later than the effective date of the spin off.
During the periods presented, we functioned as part of an operating segment of IBM. Accordingly,IBM performed certain corporate overhead functions for us. Therefore, certain corporate costs, includingcompensation costs for corporate employees supporting us, have been allocated from IBM. These allocatedcosts are for corporate functions including, but not limited to, senior management, legal, human resources,finance and accounting, treasury, IT, marketing and communications, internal audit and other sharedservices, which are not provided at the business level. Where possible, these costs were allocated based ondirect usage, with the remainder allocated on a basis of cost, headcount or other measures we have determinedas reasonable. The combined financial statements included throughout this Information Statement do notnecessarily represent the expenses that would have been incurred or held by us had we been a separate,standalone company.
As a result of the allocations and carve out methodologies used to prepare these combined financialstatements, the combined financial statements included throughout this Information Statement may not beindicative of our future performance, do not necessarily include the actual expenses that would have beenincurred by us and may not reflect our results of operations, financial position and cash flows had we beena separate, standalone company during the periods presented. Our operations are included in the consolidated
65
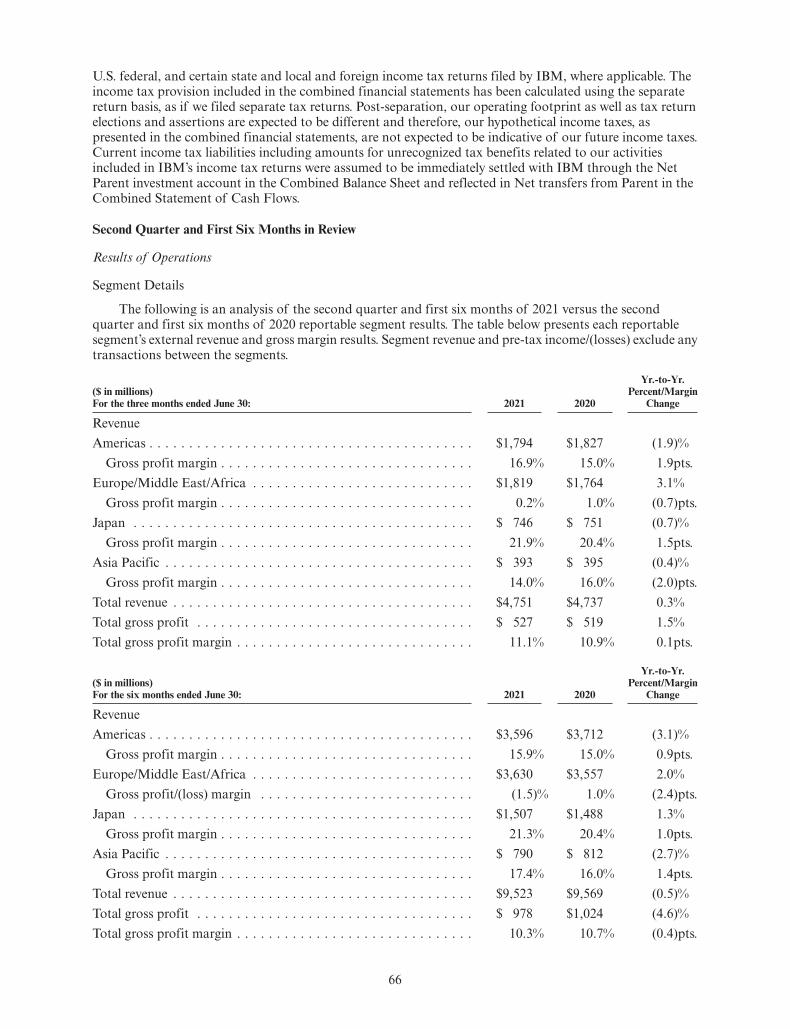
U.S. federal, and certain state and local and foreign income tax returns filed by IBM, where applicable. Theincome tax provision included in the combined financial statements has been calculated using the separatereturn basis, as if we filed separate tax returns. Post-separation, our operating footprint as well as tax returnelections and assertions are expected to be different and therefore, our hypothetical income taxes, aspresented in the combined financial statements, are not expected to be indicative of our future income taxes.Current income tax liabilities including amounts for unrecognized tax benefits related to our activitiesincluded in IBM’s income tax returns were assumed to be immediately settled with IBM through the NetParent investment account in the Combined Balance Sheet and reflected in Net transfers from Parent in theCombined Statement of Cash Flows.
Second Quarter and First Six Months in Review
Results of Operations
Segment Details
The following is an analysis of the second quarter and first six months of 2021 versus the secondquarter and first six months of 2020 reportable segment results. The table below presents each reportablesegment’s external revenue and gross margin results. Segment revenue and pre-tax income/(losses) exclude anytransactions between the segments.
($ in millions)For the three months ended June 30: 2021 2020
Yr.-to-Yr.Percent/Margin
Change
RevenueAmericas . . . . . . . . . . . . . . . . . . . . . . . . . . . . . . . . . . . . . . . . . $1,794 $1,827 (1.9)%
Gross profit margin . . . . . . . . . . . . . . . . . . . . . . . . . . . . . . . . 16.9% 15.0% 1.9pts.Europe/Middle East/Africa . . . . . . . . . . . . . . . . . . . . . . . . . . . . $1,819 $1,764 3.1%
Gross profit margin . . . . . . . . . . . . . . . . . . . . . . . . . . . . . . . . 0.2% 1.0% (0.7)pts.Japan . . . . . . . . . . . . . . . . . . . . . . . . . . . . . . . . . . . . . . . . . . . $ 746 $ 751 (0.7)%
Gross profit margin . . . . . . . . . . . . . . . . . . . . . . . . . . . . . . . . 21.9% 20.4% 1.5pts.Asia Pacific . . . . . . . . . . . . . . . . . . . . . . . . . . . . . . . . . . . . . . . $ 393 $ 395 (0.4)%
Gross profit margin . . . . . . . . . . . . . . . . . . . . . . . . . . . . . . . . 14.0% 16.0% (2.0)pts.Total revenue . . . . . . . . . . . . . . . . . . . . . . . . . . . . . . . . . . . . . . $4,751 $4,737 0.3%Total gross profit . . . . . . . . . . . . . . . . . . . . . . . . . . . . . . . . . . . $ 527 $ 519 1.5%Total gross profit margin . . . . . . . . . . . . . . . . . . . . . . . . . . . . . . 11.1% 10.9% 0.1pts.
($ in millions)For the six months ended June 30: 2021 2020
Yr.-to-Yr.Percent/Margin
Change
RevenueAmericas . . . . . . . . . . . . . . . . . . . . . . . . . . . . . . . . . . . . . . . . . $3,596 $3,712 (3.1)%
Gross profit margin . . . . . . . . . . . . . . . . . . . . . . . . . . . . . . . . 15.9% 15.0% 0.9pts.Europe/Middle East/Africa . . . . . . . . . . . . . . . . . . . . . . . . . . . . $3,630 $3,557 2.0%
Gross profit/(loss) margin . . . . . . . . . . . . . . . . . . . . . . . . . . . (1.5)% 1.0% (2.4)pts.Japan . . . . . . . . . . . . . . . . . . . . . . . . . . . . . . . . . . . . . . . . . . . $1,507 $1,488 1.3%
Gross profit margin . . . . . . . . . . . . . . . . . . . . . . . . . . . . . . . . 21.3% 20.4% 1.0pts.Asia Pacific . . . . . . . . . . . . . . . . . . . . . . . . . . . . . . . . . . . . . . . $ 790 $ 812 (2.7)%
Gross profit margin . . . . . . . . . . . . . . . . . . . . . . . . . . . . . . . . 17.4% 16.0% 1.4pts.Total revenue . . . . . . . . . . . . . . . . . . . . . . . . . . . . . . . . . . . . . . $9,523 $9,569 (0.5)%Total gross profit . . . . . . . . . . . . . . . . . . . . . . . . . . . . . . . . . . . $ 978 $1,024 (4.6)%Total gross profit margin . . . . . . . . . . . . . . . . . . . . . . . . . . . . . . 10.3% 10.7% (0.4)pts.
66

Americas
($ in millions)For the three months ended June 30: 2021 2020
Yr.-to-Yr.Percent/Margin
Change
AmericasRevenue . . . . . . . . . . . . . . . . . . . . . . . . . . . . . . . . . . . . . . . . . $1,794 $1,827 (1.9)%Gross profit . . . . . . . . . . . . . . . . . . . . . . . . . . . . . . . . . . . . . . . 304 273 11.2Gross profit margin . . . . . . . . . . . . . . . . . . . . . . . . . . . . . . . . . 16.9% 15.0% 1.9pts.Pre-tax income/(loss) . . . . . . . . . . . . . . . . . . . . . . . . . . . . . . . . $ (49) $ (78) (36.7)Pre-tax income/(loss) margin . . . . . . . . . . . . . . . . . . . . . . . . . . . (2.8)% (4.3)% 1.5pts.
($ in millions)For the six months ended June 30: 2021 2020
Yr.-to-Yr.Percent/Margin
Change
AmericasRevenue . . . . . . . . . . . . . . . . . . . . . . . . . . . . . . . . . . . . . . . . . $3,596 $3,712 (3.1)%Gross profit . . . . . . . . . . . . . . . . . . . . . . . . . . . . . . . . . . . . . . . 573 557 2.8Gross profit margin . . . . . . . . . . . . . . . . . . . . . . . . . . . . . . . . . 15.9% 15.0% 0.9pts.Pre-tax income/(loss) . . . . . . . . . . . . . . . . . . . . . . . . . . . . . . . . $ (122) $ (217) (43.9)Pre-tax income/(loss) margin . . . . . . . . . . . . . . . . . . . . . . . . . . . (3.4)% (5.9)% 2.5pts.
In the second quarter of 2021, Americas revenue of $1,794 million declined by 1.9 percent whencompared to the prior-year period driven by declines mainly in the United States due to a significanttransaction in the prior year period relating to services provided in response to the Covid 19 pandemic. Forthe first six months of 2021, Americas revenue of $3,596 million decreased 3.1 percent as compared tothe prior-year period driven by declines in the United States and Brazil. Even though first half saw an overalldecline in revenue, we saw sequential improvement in second quarter. We began to see recovering trends inour client-based volumes as well as in our base portfolio. Signings were down year to year with strong signingsin the first-quarter 2020 driven by large renewals in both countries mentioned above. Gross profitmargin percent improved 1.9 points and 0.9 points, in the second quarter and first half of 2021, respectively,as compared to the prior -year period, primarily due to lower costs in the current year as a result of 2020workforce rebalancing actions. We saw recovering trends in our base portfolio in the second quarter of 2021which contributed to the margin expansion in first half of the current year. We were also still experiencingnegative margin contribution in the first quarter of 2021 from lower client volumes which did improve in thesecond quarter but overall impacted first half performance. Pre-tax loss of $49 million in the secondquarter of 2021 and $122 million in the first six months of 2021 decreased $29 million and $95 million,respectively, when compared to the prior-year periods. Pre-tax margin of (2.8) percent and (3.4) percentimproved by 1.5 points and 2.5 points in the three and six months ended June 30, 2021, respectively, whencompared to the prior-year periods. Pre-tax loss and pre-tax margin reflect the benefits from the productivityactions taken in 2020 to improve the profit and margin profile of the business.
Europe/Middle East/Africa
($ in millions)For the three months ended June 30: 2021 2020
Yr.-to-Yr.Percent/Margin
Change
Europe/Middle East/AfricaRevenue . . . . . . . . . . . . . . . . . . . . . . . . . . . . . . . . . . . . . . . . . $1,819 $1,764 3.1%Gross profit . . . . . . . . . . . . . . . . . . . . . . . . . . . . . . . . . . . . . . . 4 25 (83.3)Gross profit margin . . . . . . . . . . . . . . . . . . . . . . . . . . . . . . . . . 0.2% 1.0% (0.7)pts.Pre-tax income/(loss) . . . . . . . . . . . . . . . . . . . . . . . . . . . . . . . . $ (321) $ (296) 8.8Pre-tax income/(loss) margin . . . . . . . . . . . . . . . . . . . . . . . . . . . (17.7)% (16.8)% (0.9)pts.
67

($ in millions)For the six months ended June 30: 2021 2020
Yr.-to-Yr.Percent/Margin
Change
Europe/Middle East/AfricaRevenue . . . . . . . . . . . . . . . . . . . . . . . . . . . . . . . . . . . . . . . . . $3,630 $3,557 2.0%Gross profit/(loss) . . . . . . . . . . . . . . . . . . . . . . . . . . . . . . . . . . (54) 34 nmGross profit/(loss) margin . . . . . . . . . . . . . . . . . . . . . . . . . . . . . (1.5)% 1.0% (2.4)pts.Pre-tax income/(loss) . . . . . . . . . . . . . . . . . . . . . . . . . . . . . . . . $ (745) $ (820) (9.1)Pre-tax income/(loss) margin . . . . . . . . . . . . . . . . . . . . . . . . . . . (20.5)% (23.0)% 2.5pts.
nm — not meaningful
In the second quarter of 2021, EMEA revenue of $1,819 million increased 3.1 percent when comparedto the prior-year period mainly due to improvements in Spain. For the first six months of 2021, EMEArevenue of $3,630 million increased 2.0 percent as compared to the prior-year period mainly due toimprovements in Spain. Revenue growth in the second quarter and the first half of 2021 was primarilydriven by improvements in the base portfolio due to increased client-based business volumes and projectactivity. For the first six months of 2021, gross profit margin percent declined by 0.7 points and 2.4 pointsto 0.2 percent and (1.5) percent, in the second quarter and first half of 2021, respectively, as compared to theprior-year periods, in part driven by contract terminations and scope reductions. Although we saw margindecline in second quarter and first half of 2021 on a year-to-year basis, when we look at our base portfolio, wesee modest improving trend compared to first quarter, including benefits from the productivity actionstaken in 2020 which started to be realized in late second quarter of 2021. Overall, gross profit margins withinthe EMEA segment are typically lower than those in other reportable segments due to a higher laborresource cost profile. Pre-tax loss of $321 million in the second quarter of 2021 and $745 million in the firstsix months of 2021 increased $26 million in the three months ended June 30, 2021 but improved $74 millionin the first half of 2021, when compared to the prior-year periods. Pre-tax margin of (17.7) percent and (20.5)percent declined by 0.9 points in the three months ended June 30, 2021 but improved by 2.5 points in thefirst half of 2021, when compared to the prior-year periods. The pre-tax loss and pre-tax margin improvementsin first half 2021 compared to the prior-year period are the result of higher workforce rebalancing chargesin first half 2020.
Japan
($ in millions)For the three months ended June 30: 2021 2020
Yr.-to-Yr.Percent/Margin
Change
JapanRevenue . . . . . . . . . . . . . . . . . . . . . . . . . . . . . . . . . . . . . . . . . $ 746 $ 751 (0.7)%Gross profit . . . . . . . . . . . . . . . . . . . . . . . . . . . . . . . . . . . . . . . 163 158 3.2Gross profit margin . . . . . . . . . . . . . . . . . . . . . . . . . . . . . . . . . 21.9% 20.4% 1.5pts.Pre-tax income/(loss) . . . . . . . . . . . . . . . . . . . . . . . . . . . . . . . . $ 27 $ 43 (36.4)Pre-tax income/(loss) margin . . . . . . . . . . . . . . . . . . . . . . . . . . . 3.6% 5.7% (2.0)pts.
($ in millions)For the six months ended June 30: 2021 2020
Yr.-to-Yr.Percent/Margin
Change
JapanRevenue . . . . . . . . . . . . . . . . . . . . . . . . . . . . . . . . . . . . . . . . . $1,507 $1,488 1.3%Gross profit . . . . . . . . . . . . . . . . . . . . . . . . . . . . . . . . . . . . . . . 322 303 6.0Gross profit margin . . . . . . . . . . . . . . . . . . . . . . . . . . . . . . . . . 21.3% 20.4% 1.0pts.Pre-tax income/(loss) . . . . . . . . . . . . . . . . . . . . . . . . . . . . . . . . $ 55 $ 75 (26.8)Pre-tax income/(loss) margin . . . . . . . . . . . . . . . . . . . . . . . . . . . 3.7% 5.1% (1.4)pts.
68

In the second quarter of 2021, Japan revenue of $746 million decreased 0.7 percent but increased1.3 percent to $1,507 million in the first six months of 2021, when compared to the prior-year periods dueto second quarter 2020 headwinds. Gross profit margin percent increased 1.5 points and 1.0 points to21.9 percent and 21.3 percent, in the second quarter and first half of 2021, respectively, as compared to theprior-year periods, primarily due to lower costs in the current year as a result of 2020 workforce rebalancingactions. We are also beginning to reap the benefit of new signings which are contributing to the profitimprovement. Pre-tax income of $27 million in the second quarter of 2021 and $55 million in the firstsix months of 2021 decreased $16 million and $20 million, respectively, when compared to the prior-yearperiods. Pre-tax margin of 3.6 percent and 3.7 percent declined by 2.0 points and 1.4 points in the three andsix months ended June 30, 2021, respectively, when compared to the prior-year periods.
Asia Pacific
($ in millions)For the three months ended June 30: 2021 2020
Yr.-to-Yr.Percent/Margin
Change
Asia PacificRevenue . . . . . . . . . . . . . . . . . . . . . . . . . . . . . . . . . . . . . . . . . $ 393 $ 395 (0.4)%Gross profit . . . . . . . . . . . . . . . . . . . . . . . . . . . . . . . . . . . . . . . 55 62 (11.4)Gross profit margin . . . . . . . . . . . . . . . . . . . . . . . . . . . . . . . . . 14.0% 16.0% (2.0)pts.Pre-tax income/(loss) . . . . . . . . . . . . . . . . . . . . . . . . . . . . . . . . $ 25 $ 47 (46.7)Pre-tax income/(loss) margin . . . . . . . . . . . . . . . . . . . . . . . . . . . 6.4% 11.9% (5.5)pts.
($ in millions)For the six months ended June 30: 2021 2020
Yr.-to-Yr.Percent/Margin
Change
Asia PacificRevenue . . . . . . . . . . . . . . . . . . . . . . . . . . . . . . . . . . . . . . . . . $ 790 $ 812 (2.7)%Gross profit . . . . . . . . . . . . . . . . . . . . . . . . . . . . . . . . . . . . . . . 137 130 5.7Gross profit margin . . . . . . . . . . . . . . . . . . . . . . . . . . . . . . . . . 17.4% 16.0% 1.4pts.Pre-tax income/(loss) . . . . . . . . . . . . . . . . . . . . . . . . . . . . . . . . $ 90 $ 83 9.0Pre-tax income/(loss) margin . . . . . . . . . . . . . . . . . . . . . . . . . . . 11.4% 10.2% 1.2pts.
In the second quarter and first half of 2021, Asia Pacific revenue of $393 million and $790 million,decreased 0.4 percent and 2.7 percent, respectively, when compared to the prior-year periods driven primarilyby declines in India and Korea partially offset by improvements in Australia. While we see improvingtrends in our base, we were up against headwinds from negotiations made with our clients. While we see theimpacts in our revenue decline from these negotiations, we aim to build a portfolio with strong clientrelationships. Gross profit margin percent declined by 2.0 points to 14.0 percent in the second quarter of2021 as compared to the prior-year period but increased by 1.4 points to 17.4 percent, in first six months of2021. Pre-tax income of $25 million in the second quarter of 2021 and $90 million in the first six monthsof 2021 decreased $22 million in the three months ended June 30, 2021 but increased $7 million in the firsthalf of 2021, when compared to the prior-year periods. Pre-tax margin of 6.4 percent and 11.4 percent declinedby 5.5 points in the three months ended June 30, 2021 but improved 1.2 points in the first half of 2021,when compared to the prior-year periods. The pre-tax loss and pre-tax margin improvements in the first halfof 2021 compared to the prior-year period are the result of higher workforce rebalancing charges in firsthalf 2020.
69

Spin-off-related Charges
($ in millions)For the Three Months Ended
June 30, 2021For the Six Months Ended
June 30, 2021
Cost of services . . . . . . . . . . . . . . . . . . . . . . . . . . . . . . $ 58 $ 61Selling, general and administrative . . . . . . . . . . . . . . . . . 115 167Workforce rebalancing charges . . . . . . . . . . . . . . . . . . . 3 3Research, development and engineering . . . . . . . . . . . . . 0 0Total costs and expenses . . . . . . . . . . . . . . . . . . . . . . . . $177 $232
The process of completing the business separation has been and is expected to continue to be time-consuming and involves significant costs and expenses. Spin-off-related charges are primarily related tocosts to establish certain stand-alone functions and information technology systems, professional servicesfees and other transaction-related costs during the Company’s transition to being a stand-alone publiccompany. These charges are primarily recorded within Selling, general and administrative and cost of servicesin the Combined Income Statement. These costs primarily include finance, IT, consulting and legal fees,real estate, and other items that are incremental and one-time in nature. During the three and six monthsended June 30, 2021, we recorded spin-off-related charges of $177 million and $232 million, respectively.There were no spin-off-related charges recorded in the second quarter and first half of 2020.
Total Expense and Other Income
($ in millions)For the three months ended June 30: 2021 2020
Yr.-to-Yr.PercentChange
Expense and other (income)Selling, general and administrative . . . . . . . . . . . . . . . . . . . . . . . . . . . . . . . $ 814* $707 15.1%Workforce rebalancing charges/(benefit) . . . . . . . . . . . . . . . . . . . . . . . . . . . (11)** 58 nmResearch, development and engineering . . . . . . . . . . . . . . . . . . . . . . . . . . . 15 19 (19.5)Interest expense . . . . . . . . . . . . . . . . . . . . . . . . . . . . . . . . . . . . . . . . . . . . 15 16 (0.5)Other (income) and expense . . . . . . . . . . . . . . . . . . . . . . . . . . . . . . . . . . . 11 3 291.2Total expense and other (income) . . . . . . . . . . . . . . . . . . . . . . . . . . . . . . . . $ 845*** $803 5.3%
* Includes $115 million of pre-tax spin-off-related charges.** Includes $3 million of pre-tax spin-off-related charges.*** Includes $119 million of pre-tax spin-off-related charges.nm — not meaningful
($ in millions)For the six months ended June 30: 2021 2020
Yr.-to-Yr.PercentChange
Expense and other (income)Selling, general and administrative . . . . . . . . . . . . . . . . . . . . . . . . . . . . . $1,567* $1,469 6.7%Workforce rebalancing charges . . . . . . . . . . . . . . . . . . . . . . . . . . . . . . . 41** 356 (88.5)Research, development and engineering . . . . . . . . . . . . . . . . . . . . . . . . . 29 39 (26.0)Interest expense . . . . . . . . . . . . . . . . . . . . . . . . . . . . . . . . . . . . . . . . . . 29 31 (4.6)Other (income) and expense . . . . . . . . . . . . . . . . . . . . . . . . . . . . . . . . . 34 9 265.3Total expense and other (income) . . . . . . . . . . . . . . . . . . . . . . . . . . . . . . $1,700*** $1,903 (10.7)%
* Includes $167 million of pre-tax spin-off-related charges.** Includes $3 million of pre-tax spin-off-related charges.
70

*** Includes $171 million of pre-tax spin-off-related charges.
Total expense and other (income) year-to-year results for the three and six months ended June 30, 2021were impacted by lower workforce rebalancing charges and a benefit from expected credit loss expense,partially offset by spin-off-related charges recorded in 2021.
Total expense and other (income) increased 5.3 percent in the second quarter of 2021 versus the prioryear primarily driven by spin-off-related charges recorded in the quarter, partially offset by lower workforcerebalancing charges.
Total expense and other (income) declined by 10.7 percent in the six months ended June 30, 2021versus the prior year primarily driven by lower workforce rebalancing charges and a benefit from expectedcredit loss expense, partially offset by spin-off-related charges recorded in 2021.
For additional information regarding total expense and other (income) for both periods, see thefollowing analyses by category.
Selling, General and Administrative Expense
($ in millions)For the three months ended June 30: 2021 2020
Yr.-to-Yr.PercentChange
Selling, general and administrative expenseSelling, general and administrative-other . . . . . . . . . . . . . . . . . . . . . . . . . . . . . $374 $395 (5.3)%Allocation of corporate expenses . . . . . . . . . . . . . . . . . . . . . . . . . . . . . . . . . . 313 271 15.4Related party intangible assets fee . . . . . . . . . . . . . . . . . . . . . . . . . . . . . . . . . . 12 12 2.7Stock-based compensation . . . . . . . . . . . . . . . . . . . . . . . . . . . . . . . . . . . . . . . 11 9 29.1Advertising and promotional expense . . . . . . . . . . . . . . . . . . . . . . . . . . . . . . . 6 6 (0.4)Provision for/(benefit from) expected credit loss expense . . . . . . . . . . . . . . . . . . (22) 10 nmSpin-off-related charges . . . . . . . . . . . . . . . . . . . . . . . . . . . . . . . . . . . . . . . . . 115 — nmAmortization of acquired intangible assets . . . . . . . . . . . . . . . . . . . . . . . . . . . 5 5 (3.8)Total selling, general and administrative expense . . . . . . . . . . . . . . . . . . . . . . . . $814 $707 15.1%
nm — not meaningful
($ in millions)For the six months ended June 30: 2021 2020
Yr.-to-Yr.PercentChange
Selling, general and administrative expenseSelling, general and administrative-other . . . . . . . . . . . . . . . . . . . . . . . . . . $ 726 $ 778 (6.6)%Allocation of corporate expenses . . . . . . . . . . . . . . . . . . . . . . . . . . . . . . . . 630 594 6.0Related party intangible assets fee . . . . . . . . . . . . . . . . . . . . . . . . . . . . . . . 25 24 2.1Stock-based compensation . . . . . . . . . . . . . . . . . . . . . . . . . . . . . . . . . . . . 19 17 14.9Advertising and promotional expense . . . . . . . . . . . . . . . . . . . . . . . . . . . . . 13 18 (26.9)Provision for/(benefit from) expected credit loss expense . . . . . . . . . . . . . . . . (24) 28 nmSpin-off-related charges . . . . . . . . . . . . . . . . . . . . . . . . . . . . . . . . . . . . . . 167 — nmAmortization of acquired intangible assets . . . . . . . . . . . . . . . . . . . . . . . . . 9 10 (4.3)Total selling, general and administrative expense . . . . . . . . . . . . . . . . . . . . . . $1,567 $1,469 6.7%
nm — not meaningful
Total SG&A expense increased 15.1 percent in the second quarter of 2021 versus the prior year,primarily driven by the following factors:
71

• Spin-off-related charges in the current-year period of $115 million, partially offset by
• A benefit from expected credit loss expense of $22 million compared to a provision of $10 million inthe prior-year period.
Total SG&A expense increased 6.7 percent in the first six months of 2021 versus the prior year drivenprimarily by the following factors:
• Spin-off related charges in the current-year period of $167 million, partially offset by
• A benefit from expected credit loss expense of $24 million compared to a provision of $28 million inthe prior-year period.
Provisions for expected credit loss expense decreased $51 million year to year in the first six months of2021, primarily driven by decreases in both specific and general reserves in the current year compared withincreases in the prior-year period. In the prior year, the global pandemic resulted in some deterioration incustomer credit quality and/or bankruptcies which had an impact to provisions in the first half of 2020.The receivables provision coverage was 3.8 percent at June 30, 2021, decreased from 5.9 percent atDecember 31, 2020 driven by both an increase in receivables year to year and lower customer specificprovisions.
Workforce Rebalancing
Our second quarter performance reflects a modest margin expansion resulting from the productivityactions taken in 2020 to improve the profit and margin profile of the business. We continue to expect themajority of the employee exits to be completed by the end of 2021.
The prior-year periods included workforce rebalancing charges of $58 million and $356 million for thethree and six months ended June 30, respectively. Workforce rebalancing charges are recorded in theCombined Income Statement for severance and employee related benefits in accordance with the accountingguidance for ongoing benefit arrangements. The impact to pre-tax income by segment for the six monthsended June 30, 2020 was as follows: EMEA $235 million, Americas $88 million, Asia Pacific $18 million, andJapan $15 million. The current year financial results include a year-to-year improvement in workforcerebalancing charges of $69 million and $315 million for the three and six months ended June 30, 2021respectively.
Research, Development and Engineering Expense
($ in millions)For the three months ended June 30: 2021 2020
Yr.-to-Yr.PercentChange
Research, development and engineering expense . . . . . . . . . . . . . . . . . . . . . . . . . . $15 $19 (19.5)%Allocation of corporate expenses . . . . . . . . . . . . . . . . . . . . . . . . . . . . . . . . . . . . 0 1 (129.6)
($ in millions)For the six months ended June 30: 2021 2020
Yr.-to-Yr.PercentChange
Research, development and engineering expense . . . . . . . . . . . . . . . . . . . . . . . . . . $29 $39 (26.0)%Allocation of corporate expenses . . . . . . . . . . . . . . . . . . . . . . . . . . . . . . . . . . . . 0 3 (119.2)
Research, development and engineering (RD&E) expense was $15 million and $29 million in the threeand six months ended June 30, 2021, a decrease of $4 million and $10 million compared to the prior-yearperiods. Within these amounts, software-related expense was $12 million and $23 million in the secondquarter and first half of 2021, respectively.
RD&E expense was less than 1 percent of total revenue in all periods presented.
72

Other (Income) and Expense
($ in millions)For the three months ended June 30: 2021 2020
Yr.-to-Yr.PercentChange
Other (income) and expenseRetirement-related costs/(income) . . . . . . . . . . . . . . . . . . . . . . . . . . . . . . . . . . . $ 7 $ 6 6.6%Allocation of corporate expenses/(income) . . . . . . . . . . . . . . . . . . . . . . . . . . . . . 2 (2) nmNet(gain)/loss from derivatives . . . . . . . . . . . . . . . . . . . . . . . . . . . . . . . . . . . . . 2 (3) nmOther (income) and expense . . . . . . . . . . . . . . . . . . . . . . . . . . . . . . . . . . . . . . . (1) 2 nmTotal other (income) and expense . . . . . . . . . . . . . . . . . . . . . . . . . . . . . . . . . . . . $11 $ 3 291.2%
nm — not meaningful
($ in millions)For the six months ended June 30: 2021 2020
Yr.-to-Yr.PercentChange
Other (income) and expenseRetirement-related costs/(income) . . . . . . . . . . . . . . . . . . . . . . . . . . . . . . . . . . . $14 $13 10.8%Allocation of corporate expenses/(income) . . . . . . . . . . . . . . . . . . . . . . . . . . . . . 9 3 173.0Net(gain)/loss from derivatives . . . . . . . . . . . . . . . . . . . . . . . . . . . . . . . . . . . . . 7 (9) nmOther (income) and expense . . . . . . . . . . . . . . . . . . . . . . . . . . . . . . . . . . . . . . . 3 2 68.4Total other (income) and expense . . . . . . . . . . . . . . . . . . . . . . . . . . . . . . . . . . . . $34 $ 9 265.3%
nm — not meaningful
Total other (income) and expense was $11 million and $34 million of expense in the second quarterand first half of 2021, increased by $8 million and $24 million, respectively, when compared to the prior-year periods. The year-to-year change was primarily driven by net exchange losses (including impacts fromIBM derivative instruments) in the current year-periods versus net exchange gains (including impacts fromIBM derivative instruments) in the prior-year periods as well as higher allocation of corporate expenses inthe current year.
Interest Expense
($ in millions)For the three months ended June 30: 2021 2020
Yr.-to-Yr.PercentChange
Total interest expense . . . . . . . . . . . . . . . . . . . . . . . . . . . . . . . . . . . . . . . . . . . . $15 $16 (0.5)%Allocation of corporate expenses . . . . . . . . . . . . . . . . . . . . . . . . . . . . . . . . . . . . 15 16 (1.3)
($ in millions)For the six months ended June 30: 2021 2020
Yr.-to-Yr.PercentChange
Total interest expense . . . . . . . . . . . . . . . . . . . . . . . . . . . . . . . . . . . . . . . . . . . . $29 $31 (4.6)%Allocation of corporate expenses . . . . . . . . . . . . . . . . . . . . . . . . . . . . . . . . . . . . 29 31 (5.1)
Interest expense was essentially flat in the second quarter of 2021 compared to the prior-year periodand decreased $1 million in the first six months of 2021 versus prior-year period. We share in a portion ofthe interest expense incurred by IBM as IBM’s debt balance supports the operations of our business. Interestexpense was allocated on a pro rata basis based on our portion of total assets compared to IBM.
Retirement-Related Plans
The following table provides the total pre-tax cost for retirement-related plans. Service cost, multi-employer plans and cost of defined contribution plans are included in the Combined Income Statement
73

within the caption (e.g., Cost, SG&A, RD&E) relating to the job function of the plan participants. Theother components of net periodic pension costs are included in other (income) and expense in the CombinedIncome Statement.
($ in millions)For the three months ended June 30: 2021 2020
Yr.-to-Yr.PercentChange
Retirement-related plans – costService cost . . . . . . . . . . . . . . . . . . . . . . . . . . . . . . . . . . . . . . . . . . . . . . . . . . . $23 $28 (15.2)%Multi-employer plans* . . . . . . . . . . . . . . . . . . . . . . . . . . . . . . . . . . . . . . . . . . . 2 2 5.1Cost of defined contribution plans . . . . . . . . . . . . . . . . . . . . . . . . . . . . . . . . . . 44 49 (11.4)Interest cost . . . . . . . . . . . . . . . . . . . . . . . . . . . . . . . . . . . . . . . . . . . . . . . . . . 2 3 (27.2)Expected return on plan assets . . . . . . . . . . . . . . . . . . . . . . . . . . . . . . . . . . . . . (6) (6) (1.1)Recognized actuarial losses . . . . . . . . . . . . . . . . . . . . . . . . . . . . . . . . . . . . . . . . 10 9 18.1Amortization of prior service costs/(credits) . . . . . . . . . . . . . . . . . . . . . . . . . . . . 0 0 3.0Other costs . . . . . . . . . . . . . . . . . . . . . . . . . . . . . . . . . . . . . . . . . . . . . . . . . . . 1 1 (41.0)Total retirement-related plans – cost . . . . . . . . . . . . . . . . . . . . . . . . . . . . . . . . . $76 $85 (11.0)%
* Represents third-party plans.
($ in millions)For the six months ended June 30: 2021 2020
Yr.-to-Yr.PercentChange
Retirement-related plans – costService cost . . . . . . . . . . . . . . . . . . . . . . . . . . . . . . . . . . . . . . . . . . . . . . . . . $ 47 $ 55 (14.2)%Multi-employer plans* . . . . . . . . . . . . . . . . . . . . . . . . . . . . . . . . . . . . . . . . . 3 3 3.9Cost of defined contribution plans . . . . . . . . . . . . . . . . . . . . . . . . . . . . . . . . . 90 95 (5.2)Interest cost . . . . . . . . . . . . . . . . . . . . . . . . . . . . . . . . . . . . . . . . . . . . . . . . . 4 5 (28.0)Expected return on plan assets . . . . . . . . . . . . . . . . . . . . . . . . . . . . . . . . . . . . (12) (12) (1.5)Recognized actuarial losses . . . . . . . . . . . . . . . . . . . . . . . . . . . . . . . . . . . . . . 21 17 18.0Amortization of prior service costs/(credits) . . . . . . . . . . . . . . . . . . . . . . . . . . . 0 0 3.3Curtailments/settlements . . . . . . . . . . . . . . . . . . . . . . . . . . . . . . . . . . . . . . . . 0 — nmOther costs . . . . . . . . . . . . . . . . . . . . . . . . . . . . . . . . . . . . . . . . . . . . . . . . . 2 3 (29.3)Total retirement-related plans – cost . . . . . . . . . . . . . . . . . . . . . . . . . . . . . . . . $155 $166 (6.8)%
* Represents third-party plans.
nm — not meaningful
Total pre-tax retirement-related plan cost decreased $9 million and $11 million in the second quarterand first half of 2021, respectively, when compared to the prior-year periods. The decline was primarilydriven by lower service costs and lower cost for defined contribution plans.
Income Taxes
The provision for income taxes for the second quarter of 2021 was $74 million, compared to $89 millionin the second quarter of 2020. The provision for income taxes for the first six months of 2021 was $165 million,compared to $176 million for the first six months of 2020. The provision for income taxes for the periodspresented was attributable to jurisdictions generating taxable income as well as jurisdictions in which lossesdo not generate a benefit for the Company. The decrease in provision for income taxes was primarily driven bya change in the geographic mix of income before taxes, net of change in valuation allowance.
74

Financial Position
Dynamics
Cash, restricted cash and marketable securities at June 30, 2021 were $43 million, essentially flat whencompared to prior year end. Total assets of $11.1 billion decreased by $0.1 billion from December 31, 2020predominantly driven by declines in property and equipment of $0.4 billion partially offset by an increase innotes and accounts receivable of $0.2 billion and deferred costs of $0.1 billion. Total liabilities of $6.2 billiondecreased by $0.1 billion from year-end 2020 primarily as a result of a decrease in workforce rebalancingliabilities of $0.2 billion partially offset by an increase in debt of $0.1 billion. Total equity of $4.9 billiondeclined $0.1 billion from year-end 2020, mainly driven by a net loss of $0.9 billion, an increase in foreigncurrency translation losses of $0.1 billion, partially offset by net transfers from IBM of $0.9 billion.
Net cash used in operating activities of ($0.5) billion and free cash flow deficit of ($0.8) billion includesapproximately $0.5 billion of cash outflows consisting of payments for our structural actions initiated in thefourth quarter of 2020 and spin-off-related charges.
Overall pension funded status as of the end of June was fairly consistent with year-end 2020.
Working Capital
($ in millions)At June 30,
2021At December 31,
2020
Current assets . . . . . . . . . . . . . . . . . . . . . . . . . . . . . . . . . . . . . . . . . . . . . . $ 3,115 $ 2,843Current liabilities . . . . . . . . . . . . . . . . . . . . . . . . . . . . . . . . . . . . . . . . . . . . 3,752 3,910Working capital . . . . . . . . . . . . . . . . . . . . . . . . . . . . . . . . . . . . . . . . . . . . . $ (637) $(1,067)Current ratio . . . . . . . . . . . . . . . . . . . . . . . . . . . . . . . . . . . . . . . . . . . . . . . 0.84:1 0.73:1
Working capital improved $430 million from the year-end 2020 position. The key changes are describedbelow:
Current assets increased $272 million ($328 million adjusted for currency) due to:
• An increase of $170 million in notes and accounts receivable, and
• An increase of $54 million in deferred costs.
Current liabilities decreased $158 million (decreased $62 million adjusted for currency) as a result of:
• A decrease in workforce rebalancing liabilities of $224 million primarily due to payments related tothe action taken in 2020, and
• A decrease in accounts payable of $116 million; partially offset by
• An increase in deferred income of $85 million.
Receivables and Allowances
Roll Forward of Receivables Allowance for Credit Losses
($ in millions)January 1, 2021 Additions / (Releases) Write-offs Other* June 30, 2021
$91 $(24) $(4) $1 $65
* Primarily represents translation adjustments and reclassifications.
The receivables provision coverage was 3.8 percent at June 30, 2021, decreased from 5.9 percent atDecember 31, 2020 driven by both an increase in receivables year to year and lower customer specificprovisions.
75

Non-Current Assets and Liabilities
Non-current assets of $7,951 million at June 30, 2021 declined by $412 million ($239 million adjustedfor currency) when compared to December 31, 2020, primarily driven by a decline in property and equipmentof $359 million which includes the impact from the sale of a datacenter in Japan of $101 million.
Non-current liabilities of $2,438 million at June 30, 2021 increased $74 million ($131 million adjustedfor currency) when compared to December 31, 2020, mainly driven by an increase in long-term debt of$145 million.
Equity
Total equity of $4,875 million at June 30, 2021 decreased by $56 million from December 31, 2020primarily due to net losses of $887 million and an increase in foreign currency translation losses of$63 million, partially offset by net transfers from IBM within Net Parent investment of $900 million.
Cash Flow
Our cash flows from operating, investing and financing activities, as reflected in the CombinedStatement of Cash Flows are summarized in the table below.
($ in millions)For the six months ended June 30: 2021 2020
Net cash provided by/(used in) continuing operationsOperating activities . . . . . . . . . . . . . . . . . . . . . . . . . . . . . . . . . . . . . . . . . . . . . . . . $(489) $ 90Investing activities . . . . . . . . . . . . . . . . . . . . . . . . . . . . . . . . . . . . . . . . . . . . . . . . . (311) (433)Financing activities . . . . . . . . . . . . . . . . . . . . . . . . . . . . . . . . . . . . . . . . . . . . . . . . 807 332
Effect of exchange rate changes on cash, cash equivalents and restricted cash . . . . . . . . . . (2) (2)Net change in cash, cash equivalents and restricted cash . . . . . . . . . . . . . . . . . . . . . . . . . $ 5 $ (13)
Net cash from operating activities declined $579 million in the first six months of 2021 when comparedto the prior-year period driven by the following key factors:
• A decrease in cash provided by receivables of $353 million driven by strong collections performancein the prior year period, and
• Payments associated to spin-off-related charges in the current-year period of $209 million, and
• A higher level of workforce rebalancing payments of $152 million; partially offset by.
• A decrease in litigation liabilities of approximately $100 million as result of the settlement with theState of Indiana in the prior year period.
Net cash used in investing activities decreased $121 million in the first six months of 2021 whencompared to the prior-year period driven by:
• Lower spending on property and equipment of $64 million, and
• Higher proceeds from the disposition of property and equipment of $70 million, driven by the saleof a datacenter in Japan.
Net cash provided by financing activities increased $475 million in the first six months of 2021 whencompared to the prior-year period driven by:
• An increase in net transfers from IBM of $343 million, and
• An increase in third-party debt of $140 million.
76

YEARS IN REVIEW
Results of Operations
Segment Details
The following is an analysis of the 2020, 2019 and 2018 reportable segment results. The table belowpresents each reportable segment’s external revenue and gross margin results. Segment revenue and pre-taxincome/(losses) exclude any transactions between the segments.
($ in millions)For the year ended December 31:
Yr.-to-Yr.Percent/Margin
Change
2020 2019 2018 2020 – 2019 2019 – 2018
RevenueAmericas . . . . . . . . . . . . . . . . . . . . . . . . . . . $ 7,401 $ 7,951 $ 8,581 (6.9)% (7.3)%
Gross profit margin . . . . . . . . . . . . . . . . . . 16.3% 17.4% 17.6% (1.1)pts. (0.2)pts.Europe/Middle East/Africa . . . . . . . . . . . . . . $ 7,289 $ 7,566 $ 8,162 (3.7)% (7.3)%
Gross profit margin . . . . . . . . . . . . . . . . . . 1.6% 4.5% 3.5% (2.9)pts. 1.0pts.Japan . . . . . . . . . . . . . . . . . . . . . . . . . . . . . $ 3,037 $ 2,925 $ 2,936 3.8% (0.4)%
Gross profit margin . . . . . . . . . . . . . . . . . . 20.8% 19.3% 15.7% 1.5pts. 3.6pts.Asia Pacific . . . . . . . . . . . . . . . . . . . . . . . . . $ 1,625 $ 1,838 $ 2,117 (11.6)% (13.2)%
Gross profit margin . . . . . . . . . . . . . . . . . . 15.8% 17.0% 14.0% (1.2)pts. 3.0pts.Total revenue . . . . . . . . . . . . . . . . . . . . . . . . $19,352 $20,279 $21,796 (4.6)% (7.0)%Total gross profit . . . . . . . . . . . . . . . . . . . . . $ 2,210 $ 2,596 $ 2,557 (14.9)% 1.5%Total gross profit margin . . . . . . . . . . . . . . . . 11.4% 12.8% 11.7% (1.4)pts. 1.1pts.
Americas
($ in millions)For the year ended December 31:
Yr.-to-Yr.Percent/Margin
Change
2020 2019 2018 2020 – 2019 2019 – 2018
AmericasRevenue . . . . . . . . . . . . . . . . . . . . . . . . . . . . . . . $7,401 $7,951 $8,581 (6.9)% (7.3)%Gross profit . . . . . . . . . . . . . . . . . . . . . . . . . . . . 1,205 1,381 1,514 (12.7) (8.7)Gross profit margin . . . . . . . . . . . . . . . . . . . . . . . 16.3% 17.4% 17.6% (1.1)pts. (0.3)pts.Pre-tax income/(loss) . . . . . . . . . . . . . . . . . . . . . . $ (313) $ (22) $ 130 nm nmPre-tax income/(loss) margin . . . . . . . . . . . . . . . . (4.2)% (0.3)% 1.5% (3.9)pts. (1.8)pts.
nm — not meaningful
2020 Performance
Americas revenue of $7,401 million in 2020 declined by 6.9 percent when compared to the prior-yearperiod driven by declines across the contract portfolio and impacts from the COVID-19 pandemic, mainlyin the United States, Canada and Brazil. Gross profit margin of 16.3 percent declined 1.1 points whencompared to 2019. Pre-tax loss of $313 million increased $290 million when compared to the prior-yearperiod. Pre-tax margin of (4.2) percent worsened by 3.9 points when compared to the prior-year period. Pre-tax loss and pre-tax margin reflect the impact of workforce rebalancing actions taken in 2020 to simplifyand optimize our operating model.
77

2019 Performance
Americas revenue of $7,951 million in 2019 declined by 7.3 percent when compared to 2018 mainlydriven by declines in the United States partially offset by increases in Canada and Mexico. Gross profitmargin of 17.4 percent declined 0.2 points when compared to 2018. In 2019, we took discrete contract andportfolio actions to exit lower value offerings which also had an impact on revenue. Pre-tax income declinedby $152 million to a loss of $22 million in 2019. Pre-tax margin of (0.3) percent worsened by 1.8 pointswhen compared to the prior-year period.
Europe/Middle East/Africa
($ in millions)For the year ended December 31:
Yr.-to-Yr.Percent/Margin
Change
2020 2019 2018 2020 – 2019 2019 – 2018
Europe/Middle East/AfricaRevenue . . . . . . . . . . . . . . . . . . . . . . . . . . . . . $ 7,289 $7,566 $ 8,162 (3.7)% (7.3)%Gross profit . . . . . . . . . . . . . . . . . . . . . . . . . . 116 339 286 (65.8) 18.5Gross profit margin . . . . . . . . . . . . . . . . . . . . . 1.6% 4.5% 3.5% (2.9)pts. 1.0pts.Pre-tax income/(loss) . . . . . . . . . . . . . . . . . . . . $(1,825) $ (926) $(1,006) 97.0% (7.9)Pre-tax income/(loss) margin . . . . . . . . . . . . . . (25.0)% (12.2)% (12.3)% (12.8)pts. 0.1pts.
2020 Performance
EMEA revenue of $7,289 million in 2020 declined by 3.7 percent when compared to the prior-yearperiod driven by declines across the contract portfolio and impacts from the COVID-19 pandemic, mainlyin the United Kingdom, the Netherlands and Germany. Gross profit margin of 1.6 percent declined 2.9 pointswhen compared to 2019, which can be attributed to declines in client business volumes impacted by themacroeconomic environment. Overall, gross profit margins within the EMEA segment are typically lowerthan those in our other reportable segments due to a higher labor resource cost profile. Pre-tax loss of$1,826 million increased by $899 million when compared to the prior-year period. Pre-tax margin of (25.0)percent worsened by 12.8 points when compared to the prior-year period. Pre-tax loss and pre-tax marginreflect the impact of workforce rebalancing actions taken in 2020 to simplify and optimize our operatingmodel.
2019 Performance
EMEA revenue of $7,566 million in 2019 declined by 7.3 percent when compared to 2018 driven bydeclines across the contract portfolio, mainly in Germany, France, Italy and Belgium. Gross profit marginof 4.5 percent improved 1.0 point when compared to 2018. 2019 performance was impacted by therestructuring of low margin contracts which was a headwind to revenue but a help to profit. Pre-tax lossesdeclined by $79 million to a loss of $926 million in 2019. Pre-tax margin of (12.2) percent improved by0.1 points when compared to the prior-year period.
Japan
($ in millions)For the year ended December 31:
Yr.-to-Yr.Percent/Margin
Change
2020 2019 2018 2020 – 2019 2019 – 2018
JapanRevenue . . . . . . . . . . . . . . . . . . . . . . . . . . . . . . $3,037 $2,925 $2,936 3.8% (0.4)%Gross profit . . . . . . . . . . . . . . . . . . . . . . . . . . . 632 564 462 12.1 21.9Gross profit margin . . . . . . . . . . . . . . . . . . . . . . 20.8% 19.3% 15.7% 1.5pts. 3.5pts.Pre-tax income/(loss) . . . . . . . . . . . . . . . . . . . . . $ 195 $ 179 $ 105 9.3% 70.8%Pre-tax income/(loss) margin . . . . . . . . . . . . . . . . 6.4% 6.1% 3.6% 0.3pts. 2.5pts.
78

2020 Performance
Japan revenue of $3,037 million in 2020 increased by 3.8 percent when compared to the prior-yearperiod driven by strong performance in new client contracts. Gross profit margin of 20.8 percent increased1.5 points when compared to 2019. Pre-tax income of $195 million increased by $16 million when comparedto the prior-year period. Pre-tax margin of 6.4 percent improved by 0.3 points when compared to the prior-year period.
2019 Performance
Japan revenue of $2,925 million in 2019 was flat when compared to the prior-year period. Gross profitmargin of 19.3 percent improved 3.5 points when compared to 2018. Pre-tax income of $179 million in 2019increased by 70.8 percent when compared to 2018. Pre-tax margin of 6.1 percent improved by 2.5 pointswhen compared to the prior-year period.
Asia Pacific
($ in millions)For the year ended December 31:
Yr.-to-Yr.Percent/Margin
Change
2020 2019 2018 2020 – 2019 2019 – 2018
Asia PacificRevenue . . . . . . . . . . . . . . . . . . . . . . . . . . . . . . $1,625 $1,838 $2,117 (11.6)% (13.2)%Gross profit . . . . . . . . . . . . . . . . . . . . . . . . . . . 257 313 296 (17.8) 5.8Gross profit margin . . . . . . . . . . . . . . . . . . . . . . 15.8% 17.0% 14.0% (1.2)pts. 3.1pts.Pre-tax income/(loss) . . . . . . . . . . . . . . . . . . . . . $ 176 $ 191 $ 141 (7.7) 35.4Pre-tax income/(loss) margin . . . . . . . . . . . . . . . . 10.8% 10.4% 6.6% 0.5pts. 3.7pts.
2020 Performance
Asia Pacific revenue of $1,625 million in 2020 decreased by 11.6 percent when compared to the prior-year period driven by declines across the contract portfolio, mainly in Australia and India. Gross profitmargin of 15.8 percent decreased 1.2 points when compared to 2019. Pre-tax income of $176 milliondecreased by 7.7 percent when compared to the prior-year period. Pre-tax margin of 10.8 percent improvedby 0.5 points when compared to the prior-year period.
2019 Performance
Asia Pacific revenue of $1,838 million in 2019 declined 13.2 percent compared to the prior-year period,primarily driven by Australia and India. Performance was impacted by the decision to move away from lowervalue workloads and shift into higher value offerings. Gross profit margin of 17.0 percent improved3.1 points when compared to 2018. Pre-tax income of $191 million in 2019 increased by 35.4 percent whencompared to 2018. Pre-tax margin of 10.4 percent improved by 3.7 points when compared to the prior-yearperiod.
79

Total Expense and Other Income
($ in millions)For the year ended December 31:
Yr.-to-Yr.PercentChange
2020 2019 2018 2020 – 2019 2019 – 2018
Expense and other (income)Selling, general and administrative . . . . . . . . . . . . . . $2,893 $2,887 $2,924 0.2% (1.3)%Workforce rebalancing charges . . . . . . . . . . . . . . . . . 918 159 116 476.1 37.1Research, development and engineering . . . . . . . . . . 76 83 69 (9.3) 20.9Interest expense . . . . . . . . . . . . . . . . . . . . . . . . . . . 63 76 85 (16.8) (10.7)Other (income) and expense . . . . . . . . . . . . . . . . . . . 25 (29) (7) nm 339.8Total expense and other (income) . . . . . . . . . . . . . . . . $3,975 $3,176 $3,187 25.1% (0.3)%
nm — not meaningful
Total expense and other (income) year-to-year results for the year ended December 31, 2020 wereimpacted by pre-tax workforce rebalancing charges of $0.9 billion to simplify and optimize our operatingmodel.
Total expense and other (income) increased 25.1 percent in 2020 versus the prior year primarily drivenby higher charges for workforce rebalancing and decreases in other income, partially offset by lower interestexpense, and reductions in travel and other expenses associated with COVID-19 restrictions.
Total expense and other (income) was essentially flat when comparing 2019 versus 2018, primarilydriven by higher charges for workforce rebalancing partially offset by declines in total selling, general andadministrative (SG&A) expense.
For additional information regarding total expense and other (income) for both expense presentations,see the following analyses by category.
Selling, General and Administrative Expense
($ in millions)For the year ended December 31:
Yr.-to-Yr.PercentChange
2020 2019 2018 2020 – 2019 2019 – 2018
Selling, general and administrative expenseSelling, general and administrative-other . . . . . . . . . . $1,493 $1,524 $1,602 (2.0)% (4.8)%Allocation of corporate expenses . . . . . . . . . . . . . . . 1,216 1,178 1,206 3.2 (2.3)Related party intangible assets fee . . . . . . . . . . . . . . 49 23 — 109.7 nmStock-based compensation . . . . . . . . . . . . . . . . . . . 36 34 40 4.5 (13.6)Advertising and promotional expense . . . . . . . . . . . . 34 55 40 (39.3) 37.5Provision for expected credit loss expense . . . . . . . . . 25 51 16 (50.6) 228.0Spin-off-related charges . . . . . . . . . . . . . . . . . . . . . . 20 — — nm nmAmortization of acquired intangible assets . . . . . . . . 20 20 20 (0.6) 0.2Total selling, general and administrative expense . . . . . $2,893 $2,887 $2,924 0.2% (1.3)%
nm — not meaningful
Total SG&A expense was flat when comparing 2020 versus 2019, driven primarily by the followingfactors:
80

• Spending reductions associated with COVID-19 restrictions as well as lower employee compensationexpense as a result of the workforce rebalancing actions taken in 2019, and
• Lower provisions for expected credit losses; partially offset by
• Higher fees for the use of IBM’s acquired intangible assets of $26 million, and
• Higher allocations of IBM corporate overhead of $38 million.
Provisions for expected credit loss expense decreased $26 million in 2020 compared to 2019 driven bylower contract-specific reserve requirements. The receivables provision coverage was 5.9 percent atDecember 31, 2020, an increase of 158 basis points from December 31, 2019. The higher coverage rate atDecember 31, 2020 reflects the overall decline in total receivables.
Total SG&A expense decreased 1.3 percent in 2019 as compared to 2018, driven primarily by thefollowing factors:
• Lower allocations of IBM corporate overhead of $28 million, partially offset by
• Higher provisions for expected credit losses.
Provisions for expected credit loss expense increased $36 million in 2019 compared to 2018 driven byhigher contract-specific reserve requirements. The receivables provision coverage was 4.4 percent atDecember 31, 2019, a decrease of 127 basis points from December 31, 2018. The lower coverage rate atDecember 31, 2019 reflects the write-off of previously reserved receivables.
Workforce Rebalancing
In 2020, we recorded $918 million in workforce rebalancing charges in the Combined Income Statementfor severance and employee related benefits in accordance with the accounting guidance for ongoing benefitarrangements, an increase of $759 million compared to 2019. The increase was primarily driven bystructural actions taken in the fourth quarter to simplify and optimize our operating model. The impact to pre-tax income by segment for the year ended December 31, 2020 was as follows: EMEA $722 million, Americas$117 million, Asia Pacific $51 million, and Japan $28 million. We expect the majority of the employeeexits to be completed by the end of 2021.
Workforce rebalancing charges of $159 million increased by $43 million in 2019 compared to 2018driven by structural actions taken in the year to improve our cost competitiveness.
Research, Development and Engineering Expense
($ in millions)For the year ended December 31:
Yr.-to-Yr.PercentChange
2020 2019 2018 2020 – 2019 2019 – 2018
Research, development and engineering expense . . . . . . . . . . . . $76 $83 $69 (9.3)% 20.9%Allocation of corporate expenses . . . . . . . . . . . . . . . . . . . . . 4 7 0 (44.1) nm
nm — not meaningful
Research, development and engineering (RD&E) expense was $76 million in 2020, $83 million in 2019and $69 million in 2018. Within these amounts, software-related expense was $50 million, $44 million and$30 million in 2020, 2019 and 2018, respectively.
RD&E expense was less than 1 percent of total revenue in all periods presented.
81

Other (Income) and Expense
($ in millions)For the year ended December 31:
Yr.-to-Yr.PercentChange
2020 2019 2018 2020 – 2019 2019 – 2018
Other (income) and expenseRetirement-related costs/(income) . . . . . . . . . . . . . . . . . . . . $27 $ 27 $ 46 (1.6)% (41.3)%Allocation of corporate expenses/(income) . . . . . . . . . . . . . 4 (31) (53) nm (41.8)Net(gain)/loss from derivatives . . . . . . . . . . . . . . . . . . . . . . (6) (20) 1 (70.6) nmOther (income) and expense . . . . . . . . . . . . . . . . . . . . . . . . 0 (6) (1) nm 405.4Total other (income) and expense . . . . . . . . . . . . . . . . . . . . . $25 $(29) $ (7) nm% 339.8%
nm — not meaningful
Total other (income) and expense was expense of $25 million in 2020 compared to income of $29 millionin 2019. The year-to-year change was primarily driven by net exchange losses (including impacts from IBMderivative instruments) in the current year versus net exchange gains (including impacts from IBMderivative instruments) in the prior-year period. Underlying foreign exchange gains/losses are includedwithin the allocation of corporate expenses line in the table above.
Total other income of $29 million in 2019 increased by $22 million when compared to 2018. The year-to-year change was primarily driven by lower retirement-related costs of $19 million.
Interest Expense
($ in millions)For the year ended December 31:
Yr.-to-Yr.PercentChange
2020 2019 2018 2020 – 2019 2019 – 2018
Total interest expense . . . . . . . . . . . . . . . . . . . . . . . . . . . . . $63 $76 $85 (16.8)% (10.7)%Allocation of corporate expenses . . . . . . . . . . . . . . . . . . . . . 63 76 85 (16.3) (10.6)
Interest expense decreased $13 million in 2020 and $9 million in 2019 when compared to the prior-yearperiods. We share in a portion of the interest expense incurred by IBM as IBM’s debt balance supports theoperations of our business. Interest expense was allocated on a pro rata asset balance between IBM and us.
Stock-Based Compensation
Pre-tax stock-based compensation cost of $64 million increased $10 million compared to 2019. Stock-based compensation cost, and the year-to-year change, was reflected in the following categories: Cost:$26 million, up $11 million; SG&A expense: $36 million, down $1 million; and RD&E expense: $1 million,down $1 million.
Retirement-Related Plans
The following table provides the total pre-tax cost for retirement-related plans. Service cost, multi-employer plans and cost of defined contribution plans are included in the Combined Income Statementwithin the caption (e.g., Cost, SG&A, RD&E) relating to the job function of the plan participants. The othercomponents of net periodic pension costs are included in other (income) and expense in the CombinedIncome Statement.
82

($ in millions)For the year ended December 31:
Yr.-to-Yr.PercentChange
2020 2019 2018 2020 – 2019 2019 – 2018
Retirement-related plans – costService cost . . . . . . . . . . . . . . . . . . . . . . . . . . . . . . . . . . $112 $105 $122 6% (13)%Multi-employer plans* . . . . . . . . . . . . . . . . . . . . . . . . . . 7 9 11 (16) (21)Cost of defined contribution plans . . . . . . . . . . . . . . . . . . 194 207 208 (6) (1)Interest cost . . . . . . . . . . . . . . . . . . . . . . . . . . . . . . . . . . 11 18 17 (37) 1Expected return on plan assets . . . . . . . . . . . . . . . . . . . . . (25) (28) (22) (12) 31Recognized actuarial losses . . . . . . . . . . . . . . . . . . . . . . . 36 27 28 35 (7)Amortization of prior service costs/(credits) . . . . . . . . . . . (1) (0) (1) nm (96)Curtailments/settlements . . . . . . . . . . . . . . . . . . . . . . . . . (0) 0 — nm nmOther costs . . . . . . . . . . . . . . . . . . . . . . . . . . . . . . . . . . 6 11 22 (45) (52)Total retirement-related plans – cost . . . . . . . . . . . . . . . . . $341 $348 $387 (2)% (10)%
* Represents third-party plans.nm — not meaningful
Total pre-tax retirement-related plan cost decreased by $7 million in 2020 and by $39 million in 2019when compared to the prior-year periods. The decline in 2020 was primarily driven by lower costs for definedcontribution plans and lower interest cost. The decline in 2019 was driven by lower service cost and otherretirement-related costs.
Income Taxes
The provision for income taxes for 2020 was $246 million compared to $364 million in 2019. Thedecrease in the provision was primarily driven by higher pre-tax losses in 2020 partially offset by an increasein valuation allowances in jurisdictions with losses. The provision for income taxes for 2019 was $364 millioncompared to $350 million in 2018. The increase in the provision was primarily driven by lower pre-tax lossesin 2019 and a change in valuation allowance associated with jurisdictions with losses. For more information,see note E, “Taxes,” in our combined financial statements.
Financial Position
Dynamics
Cash, restricted cash and marketable securities at December 31, 2020 were $38 million, a decrease of$12 million compared to prior year end. Notes and accounts receivables declined $345 million to $1,444 millionas of December 31, 2020 reflective of lower business volumes and strategic mitigation actions. In 2020, wetook actions to simplify and optimize our operating model which resulted in an increase in workforcerebalancing liabilities of $549 million when compared to December 31, 2019.
At December 31, 2019, cash, restricted cash and marketable securities were $50 million, an increase of$5 million from the prior-year period. Our balance sheet position at December 31, 2019 reflects an increasein right-of-use assets and operating lease liabilities as a result of the implementation of the new accountinglease standard.
During 2020, we generated $628 million in cash from operating activities, a decrease of $506 millioncompared to 2019. The year-to-year decrease was primarily driven by the workforce rebalancing actionstaken in 2020. During 2019, we generated $1,134 million in cash from operating activities, an increase of$460 million when compared to 2018. The increase was predominantly driven by a lower amount of spendingon contract setup costs when compared to 2018. Our free cash flow was negative for 2020 at ($324) millionand for 2018 at ($775) million while our free cash flow was positive for 2019 at $8 million.
Consistent with accounting standards, we remeasured the funded status of our retirement andpostretirement plans at December 31. At December 31, 2020, the overall net underfunded position was
83

$548 million, an increase of $60 million from December 31, 2019, driven by lower discount rates partiallyoffset by strong asset returns. At December 31, 2019, the overall net underfunded position was $488 million,an increase of $63 million from December 31, 2018, driven by lower discount rates partially offset bystrong asset returns.
Working Capital
($ in millions)At December 31: 2020 2019
Current assets . . . . . . . . . . . . . . . . . . . . . . . . . . . . . . . . . . . . . . . . . . . . . . . . . . . $ 2,843 $ 3,151Current liabilities . . . . . . . . . . . . . . . . . . . . . . . . . . . . . . . . . . . . . . . . . . . . . . . . . 3,910 3,408Working capital . . . . . . . . . . . . . . . . . . . . . . . . . . . . . . . . . . . . . . . . . . . . . . . . . . $(1,067) $ (256)Current ratio . . . . . . . . . . . . . . . . . . . . . . . . . . . . . . . . . . . . . . . . . . . . . . . . . . . . 0.73:1 0.93:1
At December 31, 2020, working capital decreased $811 million from the year-end 2019 position. Thekey changes are described below:
Current assets decreased $308 million ($379 million adjusted for currency) due to:
• A decrease of $345 million in notes and accounts receivable; partially offset by
• An increase of $71 million in deferred costs.
Current liabilities increased $503 million ($358 million adjusted for currency) as a result of:
• An increase in workforce rebalancing liabilities of $549 million, and
• An increase in accounts payable of $92 million; partially offset by
• A decrease in deferred income of $43 million, and
• A decrease in accrued contract costs of $38 million.
At December 31, 2019, working capital decreased $521 million from the year-end 2018 position. Thekey changes are described below:
Current assets decreased $149 million ($125 million adjusted for currency) due to:
• A decrease of $107 million in deferred costs, and
• A decrease of $71 million in notes and accounts receivable
Current liabilities increased $372 million ($390 million adjusted for currency) as a result of:
• An increase in operating lease liabilities of $328 million and an increase in short-term debt of$42 million due to the implementation of the new lease standard, and
• An increase in accounts payable of $32 million; partially offset by
• A decrease in employee compensation liabilities of $45 million.
Receivables and Allowances
Roll Forward of Receivables Allowance for Credit Losses
($ in millions)January 1, 2020 Additions / (Releases) Write-offs Other* December 31, 2020
$82 $25 $(7) $(9) $91
January 1, 2019 Additions / (Releases) Write-offs Other* December 31, 2019
$111 $51 $(78) $(3) $82
* Primarily represents translation adjustments and reclassifications.
84

The receivables provision coverage was 5.9 percent at December 31, 2020, an increase of 158 basispoints from December 31, 2019. The higher coverage rate at December 31, 2020 reflects the overall declinein total receivables. The receivables provision coverage was 4.4 percent at December 31, 2019, a decrease of127 basis points from December 31, 2018. The lower coverage rate at December 31, 2019 reflects thewrite-off of previously reserved receivables.
Non-Current Assets and Liabilities
Non-current assets of $8,362 million at December 31, 2020 declined by $230 million ($565 millionadjusted for currency) when compared to December 31, 2019. The decline was driven by the following:
• A decline in property and equipment of $134 million, and
• A decline in deferred costs of $120 million, and
• A decline in operating right-of-use assets of $87 million; partially offset by
• An increase in deferred taxes of $76 million, and
• An increase in goodwill of $67 million which was driven by currency.
Non-current assets of $8,592 million at December 31, 2019 increased by $1,008 million ($1,017 millionadjusted for currency) when compared to December 31, 2018. The increase was driven by the following:
• An increase in operating right-of-use assets of $1,218 million driven by the adoption of the newlease standard, and
• An increase in deferred taxes of $56 million; partially offset by
• A decline in deferred contract costs of $196 million, and
• A decline in property and equipment of $55 million.
Non-current liabilities of $2,364 million at December 31, 2020 declined by $24 million ($150 millionadjusted for currency) when compared to December 31, 2019. The decline was driven by the following:
• A decline in deferred income of $72 million, and
• A decline in operating lease liabilities of $40 million; partially offset by
• An increase in pension and post-retirement liabilities of $61 million, and
• An increase in workforce rebalancing liabilities of $52 million.
Non-current liabilities of $2,388 million at December 31, 2019 increased by $854 million ($872 millionadjusted for currency) when compared to December 31, 2018. The increase was driven by the following:
• An increase in operating lease liabilities of $890 million and debt of $100 million primarily due tothe adoption of the new lease standard, and
• An increase in pension and post-retirement liabilities of $63 million; partially offset by
• A decline in deferred income of $146 million.
Equity
Total equity of $4,931 million at December 31, 2020 decreased by $1,017 million from December 31,2019, primarily due to net losses of $2,011 million, partially offset by net transfers from IBM within NetParent investment of $872 million.
Total equity of $5,948 million at December 31, 2019 decreased by $367 million from December 31,2018, primarily due to net losses of $943 million, partially offset by net transfers from IBM within NetParent investment of $598 million.
85

Cash Flow
Our cash flows from operating, investing and financing activities, as reflected in the CombinedStatement of Cash Flows are summarized in the table below.
($ in millions)For the year ended December 31: 2020 2019 2018
Net cash provided by/(used in) continuing operationsOperating activities . . . . . . . . . . . . . . . . . . . . . . . . . . . . . . . . . . . . . . . . . $ 628 $ 1,134 $ 674Investing activities . . . . . . . . . . . . . . . . . . . . . . . . . . . . . . . . . . . . . . . . . . (953) (1,128) (1,451)Financing activities . . . . . . . . . . . . . . . . . . . . . . . . . . . . . . . . . . . . . . . . . 312 0 791
Effect of exchange rate changes on cash, cash equivalents and restricted cash . . . 1 (1) (5)Net change in cash, cash equivalents and restricted cash . . . . . . . . . . . . . . . . . . $ (13) $ 5 $ 10
2020 Cash Flow Performance
Net cash provided by operating activities decreased $506 million in 2020 when compared to the prior-year period driven by the following key factors:
• Performance-related declines within net income, and
• A higher level of workforce rebalancing payments of $226 million, and
• An increase in spending related to contract setup costs of $93 million; partially offset by
• An increase in cash provided by receivables of $364 million.
Net cash used in investing activities decreased $175 million in 2020 when compared to the prior-yearperiod driven by:
• Lower spending on property and equipment of $153 million, and
• Higher proceeds from the disposition of property and equipment of $21 million.
Net cash provided by financing activities increased $312 million in 2020 when compared to the prior-year period driven by:
• An increase in net transfers from IBM of $359 million, offset by
• An increase in capital lease payments of $48 million.
2019 Cash Flow Performance
Net cash provided by operating activities increased $460 million in 2019 when compared to 2018 drivenby the following key factors:
• Lower spending related to contract setup costs,
• Performance-related increases within net income, partially offset by
• A decrease in cash provided by receivables of $197 million.
Net cash used in investing activities decreased $323 million in 2019 when compared to the prior-yearperiod driven by:
• Lower spending on property and equipment of $373 million; partially offset by
• Lower proceeds from the disposition of property and equipment of $51 million.
Net cash provided by financing activities decreased $791 million in 2019 when compared to the prior-year period driven by:
• A decrease in net transfers from IBM of $773 million, and
• An increase in capital lease payments of $18 million.
86

Other Information
Signings
($ in billions)For the three months ended June 30: 2021 2020
Yr.-to-Yr.PercentChange
Total signings . . . . . . . . . . . . . . . . . . . . . . . . . . . . . . . . . . . . . . . . . . . . . . . . $3.8 $3.9 (3.0)%
($ in billions)For the six months ended June 30: 2021 2020
Yr.-to-Yr.PercentChange
Total signings . . . . . . . . . . . . . . . . . . . . . . . . . . . . . . . . . . . . . . . . . . . . . . . . $6.3 $8.1 (23.0)%
The estimated signings for the three and six months ended June 30, 2021 was $3.8 billion and $6.3 billion,a decrease of 3.0 percent and 23.0 percent on a year-to-year basis, impacted by the strong signings in the first-quarter 2020 driven by large renewals of existing client contracts. While the sales cycle for new logo clientsis elongating, our performance with existing clients remains strong.
($ in billions)For the year ended December 31: 2020 2019
Yr.-to-Yr.PercentChange 2018
Yr.-to-Yr.PercentChange
Total signings . . . . . . . . . . . . . . . . . . . . . . . . . . . . . . . . . . $17.8 $18.1 (1.8)% $22.4 (19.2)%
The estimated signings for the years ended December 31, 2020, 2019 and 2018 was $17.8 billion,$18.1 billion and $22.4 billion, respectively, a decrease of 1.8 percent and 19.2 percent on a year-to-yearbasis. The decline in 2019 compared to 2018 was mainly attributed to the strong signings in the fourth-quarter 2018 driven by transactions over $100 million within our existing client base.
Signings > $100 Million($ in millions)For the three months ended June 30: Total Contract Value
2021New . . . . . . . . . . . . . . . . . . . . . . . . . . . . . . . . . . . . . . . . . . . . . . . . . . . . . . . . . . . $ —Existing. . . . . . . . . . . . . . . . . . . . . . . . . . . . . . . . . . . . . . . . . . . . . . . . . . . . . . . . . $1,5682020New . . . . . . . . . . . . . . . . . . . . . . . . . . . . . . . . . . . . . . . . . . . . . . . . . . . . . . . . . . . $ 558Existing . . . . . . . . . . . . . . . . . . . . . . . . . . . . . . . . . . . . . . . . . . . . . . . . . . . . . . . . $ 853
Signings > $100 Million($ in millions)For the six months ended June 30: Total Contract Value
2021New . . . . . . . . . . . . . . . . . . . . . . . . . . . . . . . . . . . . . . . . . . . . . . . . . . . . . . . . . . . $ 218Existing. . . . . . . . . . . . . . . . . . . . . . . . . . . . . . . . . . . . . . . . . . . . . . . . . . . . . . . . . $1,7092020New . . . . . . . . . . . . . . . . . . . . . . . . . . . . . . . . . . . . . . . . . . . . . . . . . . . . . . . . . . . $ 558Existing . . . . . . . . . . . . . . . . . . . . . . . . . . . . . . . . . . . . . . . . . . . . . . . . . . . . . . . . $3,352
87

Signings > $100 Million($ in millions)For the years ended December 31: Total Contract Value
2020New . . . . . . . . . . . . . . . . . . . . . . . . . . . . . . . . . . . . . . . . . . . . . . . . . . . . . . . . . . . $1,484Existing. . . . . . . . . . . . . . . . . . . . . . . . . . . . . . . . . . . . . . . . . . . . . . . . . . . . . . . . . $6,7702019New . . . . . . . . . . . . . . . . . . . . . . . . . . . . . . . . . . . . . . . . . . . . . . . . . . . . . . . . . . . $1,294Existing . . . . . . . . . . . . . . . . . . . . . . . . . . . . . . . . . . . . . . . . . . . . . . . . . . . . . . . . $6,3852018New . . . . . . . . . . . . . . . . . . . . . . . . . . . . . . . . . . . . . . . . . . . . . . . . . . . . . . . . . . . $3,390Existing. . . . . . . . . . . . . . . . . . . . . . . . . . . . . . . . . . . . . . . . . . . . . . . . . . . . . . . . . $8,571
Signings have historically been used by IBM’s management as an initial estimate of the value of acustomer’s commitment under a contract. Our management continues to evaluate the metrics that we willutilize to assess business performance moving forward as an independent company.
IBM’s management believes that the estimated values of signings provide insight into the Company’spotential future revenue, which has been historically used by management as a tool to monitor theperformance of the business including the business’ ability to attract new customers and sell additional scopeinto our existing customer base, as well as viewed as useful decision-making information for investors.There are no third-party standards or requirements governing the calculation of signings. The calculationhistorically used by IBM’s management involves estimates and judgments to gauge the extent of a customer’scommitment, including the type and duration of the agreement, and the presence of termination chargesor wind-down costs. Contract extensions and increases in scope are treated as signings only to the extent ofthe incremental new value. Signings can vary over time due to a variety of factors including, but not limited to,the timing of signing a small number of larger outsourcing contracts. The conversion of signings intorevenue may vary based on the types of services and solutions, customer decisions, and other factors, whichmay include, but are not limited to, macroeconomic environment or external events.
Liquidity and Capital Resources
Over the past three years, cash flow from operations provided a source of funds ranging between$628 million and $1,134 million per year. We have generated positive net cash flow from operations in eachof the three years presented, despite incurring net losses in each of those years. For the year endedDecember 31, 2020, we incurred significant workforce rebalancing charges, and, more recently, haveundertaken other productivity actions in anticipation of becoming a separate stand-alone public company.For the first six months of 2021, net cash used in operating activities of ($0.5) billion includes approximately$0.5 billion of cash outflows consisting of payments for our structural actions initiated in the fourthquarter of 2020 and spin-off-related charges. After considering the effects of those charges and actions, andthe resulting ongoing operating cash flow savings, IBM believes Kyndryl’s cash flow from operations as anautonomous entity will be sufficient to fund ongoing operations and recurring capital expenditures throughat least the end of 2022. Looking forward, IBM expects that Kyndryl will have additional liquidity throughseveral sources: maintaining an adequate cash balance from operations, access to global funding sourcesincluding debt, leasing, and term loan markets, a committed global credit facility and other committedand uncommitted lines of credit worldwide. In addition to these resources, IBM expects that Kyndryl willhave improved cash flows resulting from stronger operating performance, savings from structural actions toreduce infrastructure and overhead costs, and optimized asset management post Spin-Off.
Senior Unsecured Notes
On October 7, 2021, we priced $2.4 billion in aggregate principal amount of senior unsecured notes infour series: $700 million of 2.050% Senior Notes due 2026, $500 million of 2.700% Senior Notes due 2028,$650 million of 3.150% Senior Notes due 2031 and $550 million of 4.100% Senior Notes due 2041. Theclosing of the offering of the notes is expected to occur on October 15, 2021, subject to customary closing
88

conditions. The notes are being offered and sold to qualified institutional buyers in reliance on Rule 144Aunder the Securities Act and to non-U.S. persons in reliance on Regulation S of the Securities Act. The notesare subject to customary affirmative covenants, negative covenants and events of default for financings ofthis type and are redeemable at our option in a customary manner. In connection with the issuance of thenotes, we expect to enter into a registration rights agreement with the initial purchasers of the notes, pursuantto which we will use commercially reasonable efforts to register the notes with the SEC.
Credit Facilities
In connection with the Spin-Off, we also anticipate entering into a revolving credit facility in theaggregate committed amount of $3,150 million and a term loan facility in the aggregate principal amountof $500 million. Up to $300 million of the revolving credit facility is expected to be available for purposes ofissuing letters of credit. The revolving credit facility is expected to mature five years after the effective dateof the credit facilities and the term loan facility is expected to mature three years after the effective date of thecredit facilities. Interest rates on borrowings under the credit facilities are expected to be based on prevailingmarket interest rates for borrowers of a similar size and credit as us.
We expect to be able to voluntarily prepay borrowings under the credit facilities without premium orpenalty, subject to customary “breakage” costs. The credit facilities are also expected to include certaincustomary mandatory prepayment provisions. In addition, the credit facilities are expected to includecustomary events of default and affirmative and negative covenants as well as a maintenance covenant thatwill require that the ratio of our indebtedness for borrowed money to consolidated EBITDA (as definedin the credit agreement governing the credit facilities) for any period of four consecutive fiscal quarters beno greater than 3.50 to 1.00.
The following table provides a summary of the major sources of liquidity for the years endedDecember 31, 2018 through 2020.
Cash Flow and Liquidity Trends
($ in millions) 2020 2019 2018
Net cash from operating activities . . . . . . . . . . . . . . . . . . . . . . . . . . . . . . . . . . . $628 $1,134 $674Cash and cash equivalents, restricted cash and short-term marketable securities . . . $ 38 $ 50 $ 46
The Combined Statement of Cash Flows is prepared in accordance with applicable accountingstandards for cash flow presentation and highlight causes and events underlying sources and uses of cash inthat format.
IBM management has used free cash flow as a measure to evaluate its operating results, to planstrategic investments and assess its ability and need to incur and service debt. The entire free cash flowamount is not necessarily available for discretionary expenditures. We define free cash flow as net cash fromoperating activities less the change in net capital expenditures. Free cash flow guidance will be derivedusing an estimate of profit, working capital and operational cash flows.
($ in millions)For the six months ended June 30: 2021 2020
Net cash from/(used in) operating activities per GAAP* . . . . . . . . . . . . . . . . . . . . . . . . . $(489) $ 90Capital expenditures, net . . . . . . . . . . . . . . . . . . . . . . . . . . . . . . . . . . . . . . . . . . . . . . (298) (432)Free cash flow (FCF)* . . . . . . . . . . . . . . . . . . . . . . . . . . . . . . . . . . . . . . . . . . . . . . . . (786) 342Change in cash, cash equivalents, restricted cash and short-term marketable securities . . . . $ 5 $ (13)
* Includes approximately $0.5 billion of cash outflows consisting of payments for structural actionsinitiated in the fourth quarter of 2020 and spin-off-related charges.
89

($ in millions)For the year ended December 31: 2020 2019 2018
Net cash from operating activities per GAAP . . . . . . . . . . . . . . . . . . . . . . . $ 628 $ 1,134 $ 674Capital expenditures, net . . . . . . . . . . . . . . . . . . . . . . . . . . . . . . . . . . . . . . (952) (1,126) (1,449)Free cash flow (FCF) . . . . . . . . . . . . . . . . . . . . . . . . . . . . . . . . . . . . . . . . (324) 8 (775)Change in cash, cash equivalents, restricted cash and short-term marketable
securities . . . . . . . . . . . . . . . . . . . . . . . . . . . . . . . . . . . . . . . . . . . . . . . $ (13) $ 5 $ 10
Contractual Obligations
TotalContractual
PaymentStream
Payments Due In
($ in millions) 2021 2022 – 23 2024 – 25 After 2025
Finance lease obligations(1) . . . . . . . . . . . . . . . . . . $ 209 $ 69 $ 109 $ 31 $ 0Operating lease obligations(1) . . . . . . . . . . . . . . . . . 1,246 353 458 219 215Purchase obligations(2) . . . . . . . . . . . . . . . . . . . . . . 3,062 825 1,452 785 —Other long-term liabilities:
Long-term termination benefits(3) . . . . . . . . . . . . 671 597 56 12 7Other . . . . . . . . . . . . . . . . . . . . . . . . . . . . . . . . 50 21 12 15 2
Total . . . . . . . . . . . . . . . . . . . . . . . . . . . . . . . . . . $5,238 $1,865 $2,087 $1,062 $225
(1) Finance lease obligations are presented on a discounted cash flow basis, whereas operating leaseobligations are presented on an undiscounted cash flow basis.
(2) Includes amounts committed for the purchase of goods and services under legally enforceable contracts.Where it is not practically feasible to determine the legally enforceable portion of our obligationunder certain long-term purchase agreements, we include additional expected purchase obligationsbeyond what may be legally enforceable.
(3) Related primarily to structural actions in the fourth quarter of 2020, most of which is expected to bepaid in 2021.
The previous table summarizes our contractual obligations requiring future cash payments as ofDecember 31, 2020 on a historical basis. Certain contractual obligations exclude the effects of time valueand therefore, may not equal the amounts reported in the Combined Balance Sheet. Certain noncurrentliabilities are excluded from the previous table as their future cash outflows are uncertain. This includesdeferred taxes, deferred income, disability benefits and other sundry items.
Purchase obligations include all commitments to purchase goods or services of either a fixed orminimum quantity that meet any of the following criteria: (1) they are noncancelable, (2) we would incur apenalty if the agreement was canceled, or (3) we must make specified minimum payments even if we do nottake delivery of the contracted products or services (take-or-pay). If the obligation to purchase goods orservices is noncancelable, the entire value of the contract is included in the previous table. If the obligationis cancelable, but we would incur a penalty if canceled, the dollar amount of the penalty is included as apurchase obligation. Contracted minimum amounts specified in take-or-pay contracts are also included inthe table as they represent the portion of each contract that is a firm commitment.
In the ordinary course of business, we enter into contracts that specify that we will purchase all or aportion of our requirements of a specific product, commodity or service from a supplier or vendor. Thesecontracts are generally entered into in order to secure pricing or other negotiated terms. They do not specifyfixed or minimum quantities to be purchased and, therefore, we do not consider them to be purchaseobligations.
Off-Balance Sheet Arrangements
From time to time, we may enter into off-balance sheet arrangements as defined by SEC FinancialReporting Release 67 (FRR-67), “Disclosure in Management’s Discussion and Analysis about Off-BalanceSheet Arrangements and Aggregate Contractual Obligations.”
90

At December 31, 2020, and December 31, 2019, we had no such off-balance sheet arrangements thathave, or are reasonably likely to have, a material current or future effect on our financial condition, changesin financial condition, revenues or expenses, results of operations, liquidity, capital expenditures or capitalresources. See the table above for our contractual obligations, and note K, “Commitments and Contingencies,”to our combined financial statements for detailed information about our guarantees, financial commitments,and indemnification arrangements. We do not have retained interests in assets transferred to unconsolidatedentities or other material off-balance sheet interests or instruments.
Critical Accounting Estimates
The application of GAAP requires us to make estimates and assumptions about certain items andfuture events that directly affect our reported financial condition. The accounting estimates and assumptionsdiscussed in this section are those that we consider to be the most critical to our financial statements. Anaccounting estimate is considered critical if both (a) the nature of the estimate or assumption is material dueto the levels of subjectivity and judgment involved, and (b) the impact within a reasonable range ofoutcomes of the estimate and assumption is material to our financial condition. Our significant accountingpolicies are described in note A, “Significant Accounting Policies,” to our combined financial statements.
In 2020, the inputs into certain of our critical accounting estimates considered the macroeconomicimpacts of the COVID-19 pandemic. These estimates included but were not limited to, the allowances forcredit losses, the carrying values of goodwill and intangible assets and other long-lived assets, valuationallowances for tax assets and revenue recognition. The macroeconomic impacts of the COVID-19 pandemicdid not have a material impact on our critical accounting estimates reflected in our 2020 results. Given theinherent uncertainty of the magnitude of future impacts from and/or the duration of the pandemic, ourestimates may change materially in future periods.
A quantitative sensitivity analysis is provided where that information is reasonably available, can bereliably estimated and provides material information to investors. The amounts used to assess sensitivity(e.g., 1 percent, 10 percent, etc.) are included to allow users of the Information Statement to understand ageneral direction cause and effect of changes in the estimates and do not represent management’s predictionsof variability. For all of these estimates, it should be noted that future events rarely develop exactly asforecasted, and estimates require regular review and adjustment.
Pension Assumptions
For self-sponsored defined benefit pension plans, the measurement of the benefit obligation to planparticipants and net periodic pension (income)/cost requires the use of certain assumptions, including,among others, estimates of discount rates and expected return on plan assets.
Changes in the discount rate assumptions would impact the (gain)/loss amortization and interest costcomponents of the net periodic pension (income)/cost calculation and the projected benefit obligation (PBO).If the average discount rate assumption for the non-U.S. defined benefit pension plans (Plans) had increasedor decreased by 25 basis points from 0.62 percent on December 31, 2020, this would not result in a materialchange to pre-tax income recognized in 2021. Further changes in the discount rate assumptions would impactthe PBO which, in turn, may impact our funding decisions if the PBO exceeds plan assets. A 25 basis pointincrease or decrease in the discount rate would cause a corresponding decrease or increase, respectively, in thePlans’ PBO of an estimated $40 million based upon December 31, 2020 data.
The expected long-term return on plan assets assumption is used in calculating the net periodic pension(income)/cost. Expected returns on plan assets are calculated based on the market-related value of plan assets,which recognizes changes in the fair value of plan assets systematically over a five-year period in theexpected return on plan assets line in net periodic pension (income)/cost. The differences between the actualreturn on plan assets and the expected long-term return on plan assets are recognized over five years inthe expected return on plan assets line in net periodic pension (income)/cost and also as a component ofactuarial (gains)/losses, which are recognized over the service lives or life expectancy of the participants,depending on the plan, provided such amounts exceed thresholds which are based upon the benefit obligationor the value of plan assets, as provided by accounting standards.
91

To the extent the outlook for long-term returns changes such that management changes its expectedlong-term return on plan assets assumption, a 50 basis point increase or decrease in the expected long-termreturn on plan assets assumption would not have a material estimated decrease or increase on the followingyear’s pre-tax net periodic pension (income)/cost (based upon plan assets at December 31, 2020 and assumingno contributions are made in 2021).
We may voluntarily make contributions or be required, by law, to make contributions to our pensionplans. Actual results that differ from the estimates may result in more or less future funding into the pensionplans than is planned by management. Impacts of these types of changes on our pension plans would varydepending upon the status of each respective plan.
In addition to the above, we evaluate other pension assumptions involving demographic factors, suchas retirement age and mortality, and update these assumptions to reflect experience and expectations for thefuture. Actual results in any given year can differ from actuarial assumptions because of economic andother factors.
For additional information on our pension plans and the development of these assumptions, seenote N, “Retirement-Related Benefits,” to our combined financial statements.
Revenue Recognition
Application of GAAP related to the measurement and recognition of revenue requires us to makejudgments and estimates. Specifically, complex arrangements with nonstandard terms and conditions mayrequire significant contract interpretation to determine the appropriate accounting, including whetherpromised goods and services specified in an arrangement are distinct performance obligations. In certainarrangements revenue is recognized based on progress toward completion of the performance obligationusing a cost-to-cost measure of progress. The estimation of cost at completion is complex and requires us tomake judgements and estimates. Other significant judgments include determining whether we are acting asthe principal in a transaction and whether separate contracts should be combined and considered part of onearrangement.
Revenue recognition is also impacted by our ability to determine when a contract is probable ofcollection and to estimate variable consideration, including, for example, rebates, service-level penalties, andperformance bonuses. We consider various factors when making these judgments, including a review ofspecific transactions, historical experience and market and economic conditions. Evaluations are conductedeach quarter to assess the adequacy of the estimates. If the estimates were changed by 10 percent in 2020,the impact on net income would have been immaterial.
Costs to Complete Service Contracts
During the contractual period, revenue, cost and profits may be impacted by estimates of the ultimateprofitability of each contract, especially contracts for which we use cost-to-cost measures of progress. If atany time these estimates indicate the contract will be unprofitable, the entire estimated loss for the remainderof the contract is recorded immediately in cost. We perform ongoing profitability analyses of these servicescontracts in order to determine whether the latest estimates require updating. Key factors reviewed to estimatethe future costs to complete each contract are future labor costs and product costs and expected productivityefficiencies. Contract loss provisions recorded as a component of other accrued expenses and liabilitieswere immaterial at December 31, 2020 and 2019.
Capitalization of Outsourcing Contract Costs
In connection with outsourcing services arrangements, we incur and capitalize direct costs for transitionand setup activities performed at the inception of these long-term contracts that are necessary to enable usto perform under the terms of the arrangement. These costs are capitalized and are amortized on a straight-line basis over the expected period of benefit. We perform periodic reviews to assess the recoverability ofdeferred contract transition and setup costs. To assess recoverability, undiscounted estimated cash flows ofthe contract are projected over its remaining life and compared to the carrying amount of contract relatedassets, including the unamortized deferred cost balance. Key factors reviewed to estimate the undiscounted
92

cash flows are future labor costs and product costs and expected productivity efficiencies. Such estimatesrequire judgment and assumptions, and actual future cash flows could differ from these estimates. A significantchange in an estimate or assumption on one or more contracts could have a material effect on our resultsof operations.
Income Taxes
Our operations have historically been included in certain tax returns filed by IBM. The income taxprovisions included in the combined financial statements have been calculated using the separate returnbasis, as if we filed separate tax returns. Post separation, our operating footprint as well as tax return electionsand assertions are expected to be different and therefore, our hypothetical income taxes, as presented in thecombined financial statements, are not expected to be indicative of our future income taxes. Current incometax liabilities including amounts for unrecognized tax benefits related to our activities included in theParent’s income tax returns were assumed to be immediately settled with Parent through the Net Parentinvestment account in the Combined Balance Sheet and reflected in Net transfers from Parent in the CombinedStatement of Cash Flows.
We are subject to income taxes in the U.S. and numerous foreign jurisdictions. Significant judgmentsare required in determining the combined provision for income taxes.
During the ordinary course of business, there are many transactions and calculations for which theultimate tax determination is uncertain. As a result, we recognize tax expense based on estimates of whetheradditional taxes will be due. The related tax liabilities are settled through the Net Parent investmentaccount and are not reflected in the Combined Balance Sheet. However, the income tax expense related tothese tax liabilities is reflected in provision for income taxes in the Combined Income Statement. Uponseparation, liabilities related to unrecognized tax benefits for which we are liable and that are not includedwithin our Combined Balance Sheet are expected to be reported within the post-spin balance sheet basedupon tax authorities’ ability to assert that we may be the primary obligor for historical taxes, among otherfactors.
Significant judgment is also required in determining any valuation allowance recorded against deferredtax assets on a hypothetical separate return basis. In assessing the need for a valuation allowance, managementconsiders all available evidence for each jurisdiction including past operating results, estimates of futuretaxable income and the feasibility of ongoing tax planning strategies/actions. However, amounts presentedon the hypothetical separate return basis, including valuation allowances, are expected to differ from thedeferred tax assets reported within our post-spin financial statements, based upon the impacts of theseparation and application of local law, among other factors.
Valuation of Assets
The application of impairment accounting requires the use of significant estimates and assumptions.Impairment testing for assets, other than goodwill, requires the allocation of cash flows to those assets orgroup of assets and if required, an estimate of fair value for the assets or group of assets. Our estimates arebased upon assumptions believed to be reasonable, but which are inherently uncertain and unpredictable.These valuations require the use of management’s assumptions, which would not reflect unanticipated eventsand circumstances that may occur.
Valuation of Goodwill
We review goodwill for impairment annually and whenever events or changes in circumstances indicatethe carrying value of goodwill may not be recoverable by first assessing qualitative factors to determine if itis more likely than not that fair value is less than carrying value.
We assess qualitative factors in each of our reporting units that carry goodwill including relevantevents and circumstances that affect the fair value of reporting units. Examples include, but are not limitedto, macroeconomic, industry and market conditions, as well as other individual factors such as:
• A loss of key personnel;
• A significant adverse shift in the operating environment of the reporting unit such as unanticipatedcompetition;
93

• A significant pending litigation;
• A more likely than not expectation that a reporting unit or a significant portion of a reporting unitwill be sold or otherwise disposed of; and
• An adverse action or assessment by a regulator.
We assess these qualitative factors to determine whether it is necessary to perform the quantitativegoodwill impairment test. This quantitative test is required only if we conclude that it is more likely thannot that a reporting unit’s fair value is less than its carrying amount. Fair value is estimated by using adiscounted cash flow model. We evaluated goodwill for impairment for all reporting units for all periodspresented which resulted in no impairment. As of December 31, 2020, the estimated fair value of the EMEAreporting unit, which had goodwill of $288 million, exceeded its carrying amount by 23 percent. Each ofthe other reporting units with goodwill had a fair value that was substantially in excess of its carrying value.Management’s cash flow projections for the reporting unit with less significant headroom (EMEA or the“Reporting Unit”), included significant judgments and assumptions relating to projected EBITDA marginsand the discount rate. We evaluated the sensitivity of the significant assumptions used in the discounted cashflow model to estimate fair value for the Reporting Unit. A decline in the projected EBITDA margins of100 basis points or an increase in the discount rate of 100 basis points would not have resulted in animpairment of the Reporting Unit.
Loss Contingencies
We are currently involved in various claims and legal proceedings. At least quarterly, we review thestatus of each significant matter and assess our potential financial exposure. If the potential loss from anyclaim or legal proceeding is considered probable and the amount can be reasonably estimated, we accrue aliability for the estimated loss. Significant judgment is required in both the determination of probabilityand the determination as to whether an exposure is reasonably estimable. Because of uncertainties relatedto these matters, accruals are based only on the best information available at the time. As additionalinformation becomes available, we reassess the potential liability related to our pending claims and litigation,and may revise our estimates. These revisions in the estimates of the potential liabilities could have amaterial impact on our results of operations and financial position.
Quantitative and Qualitative Disclosures About Market Risk
Currency Rate Fluctuations
Changes in the relative values of non-U.S. currencies to the U.S. dollar affect our financial results andfinancial position. At December 31, 2020, currency changes resulted in assets and liabilities denominated inlocal currencies being translated into more dollars than at year-end 2019. During periods of sustainedmovements in currency, the marketplace and competition adjust to the changing rates. Large changes inforeign exchange rates relative to our functional currencies could increase the costs of our services tocustomers relative to local competitors thereby causing us to lose existing or potential customers. Currencymovements impacted our year-to-year revenue growth. Based on the currency rate movements in 2020, totalrevenue decreased 5.0 percent as reported and 5.1 percent at constant currency versus 2019. For non-U.S.subsidiaries and branches that operate in U.S. dollars or whose economic environment is highly inflationary,translation adjustments are reflected in results of operations. Generally, we manage currency risk in theseentities by linking prices and contracts to U.S. dollars. During 2018, the three-year cumulative inflation ratesin Argentina, using a combination of monthly indices, exceeded the 100 percent threshold for hyperinflation.As a result, effective July 1, 2018, we changed the functional currency from local currency to U.S. dollarfunctional for Argentina with no material impact. In 2019 and 2020, the Argentinean economy continued toexperience high inflation. The ongoing impact is not material given the size of our operations in thecountry (less than 1 percent of total 2020 and 2019 revenue, respectively).
Market Risk
In the normal course of business, our financial position is routinely subject to a variety of risks. Inaddition to the market risk associated with non-U.S. dollar denominated assets and liabilities, otherexample of risk includes collectability of accounts receivable. We regularly assess these risks and have
94

established policies and business practices to protect against the adverse effects of these and other potentialexposures. As a result, we do not anticipate any material losses from these risks.
To meet disclosure requirements, we perform a sensitivity analysis to determine the effects that marketrisk exposures may have on the fair values of our financial assets. The financial instruments that are includedin the sensitivity analysis are comprised of our cash and cash equivalents and short-term and long-termdebt.
To perform the sensitivity analysis, we assess the risk of loss in fair values from the effect of hypotheticalchanges in interest rates and foreign currency exchange rates on market-sensitive instruments. The marketvalues for interest and foreign currency exchange risk are computed based on the present value of future cashflows as affected by the changes in rates that are attributable to the market risk being measured. Thediscount rates used for the present value computations were selected based on market interest and foreigncurrency exchange rates in effect at December 31, 2020, and 2019. The differences in this comparison are thehypothetical losses associated with each type of risk.
Information provided by the sensitivity analysis does not necessarily represent the actual changes infair value that we would incur under normal market conditions because, due to practical limitations, allvariables other than the specific market risk factor are held constant. In addition, the results of the modelare constrained by the fact that certain items are specifically excluded from the analysis, while the financialinstruments relating to the financing or hedging of those items are included by definition.
The results of the sensitivity analysis at December 31, 2020 and 2019 are as follows:Interest Rate Risk
A hypothetical 10 percent adverse change in the levels of interest rates, with all other variables heldconstant, would result in an immaterial decrease in the fair value of our financial instruments at December 31,2020 and 2019.
Foreign Currency Exchange Rate Risk
A hypothetical 10 percent adverse change in the levels of foreign currency exchange rates relative to theU.S. dollar, with all other variables held constant, would result in an immaterial decrease in the fair value ofour financial instruments at December 31, 2020 and 2019.
Cybersecurity
While cybersecurity risk can never be completely eliminated, our approach draws on the depth andbreadth of our global capabilities, both in terms of our offerings to clients and our internal approaches torisk management. We offer commercial security solutions that deliver capabilities in areas such as identity andaccess management, data security, application security, network security and endpoint security. Thesesolutions include pervasive encryption, threat intelligence, analytics, cognitive and artificial intelligence, andforensic capabilities that analyze client security events, yielding insights about attacks, threats, andvulnerabilities facing the client. We also offer professional consulting and technical services solutions forsecurity from assessment and incident response to deployment and resource augmentation. In addition, weoffer managed and outsourced security solutions from multiple security operations centers around the world.Finally, security is embedded in a multitude of our offerings through secure engineering and operations,and by critical functions (e.g., encryption, access control) in servers, storage, software, services, and othersolutions.
From an enterprise perspective, we implement a multi-faceted risk-management approach based on theNational Institute of Standards and Technology Cybersecurity Framework to identify and addresscybersecurity risks. In addition, we have established policies and procedures that provide the foundationupon which our infrastructure and data are managed. We regularly assess and adjust our technical controlsand methods to identify and mitigate emerging cybersecurity risks. We use a layered approach with overlappingcontrols to defend against cybersecurity attacks and threats on networks, end-user devices, servers,applications, data and cloud solutions. We draw heavily on our own commercial security solutions andservices to mitigate cybersecurity risks. We also have threat intelligence and security monitoring programs,as well as a global incident response process to respond to cybersecurity threats and attacks. In addition, weutilize a combination of online training, educational tools, videos and other awareness initiatives to fostera culture of security awareness and responsibility among our workforce.
95

MANAGEMENT
The following table presents information concerning our executive officers and directors following theSpin-Off, including a five-year employment history.
Name Age Position
Martin Schroeter 57 Chief Executive Officer and Chairman of the BoardDavid Wyshner 54 Chief Financial OfficerElly Keinan 57 Group PresidentMaryjo Charbonnier 51 Chief Human Resources OfficerEdward Sebold 56 General Counsel and SecretaryVineet Khurana 48 ControllerDominic J. Caruso 64 DirectorJohn D. Harris II 60 DirectorStephen A. M. Hester 60 DirectorShirley Ann Jackson 75 DirectorJanina Kugel 51 DirectorDenis Machuel 57 DirectorRahul N. Merchant 65 DirectorJana Schreuder 63 DirectorHoward I. Ungerleider 53 Director
The following are brief biographies describing the backgrounds of our executive officers and directors.
Martin Schroeter. Mr. Schroeter was appointed our inaugural Chief Executive Officer in January 2021and will be appointed as Chairman of the Board in connection with the Spin-Off. Previously, Mr. Schroeterserved in a variety of business line and finance executive positions at IBM including Senior Vice Presidentand Chief Financial Officer from 2014 until 2017, leading IBM’s shift in spending profile to align with IBMstrategic initiatives, and Senior Vice President of Global Markets from 2018 until 2020, responsible forIBM’s global sales, customer relationships and satisfaction and worldwide geographic operations andoverseeing IBM’s marketing and communication functions and building IBM’s brand and reputation globally.Earlier in his career, Mr. Schroeter served as General Manager of IBM global financing, managing a totalasset base in excess of $37 billion, and had served numerous roles in Japan, the United States and Australia.Previously, Mr. Schroeter served as a director of the American Australian Association. Mr. Schroeterreceived his MBA from Carnegie Mellon University and his undergraduate degree from Temple University.Mr. Schroeter’s global business and leadership experience and financial expertise make him a well-qualified addition to our Board.
David Wyshner. Mr. Wyshner was appointed our Chief Financial Officer in September 2021. FromMarch 2020 until his appointment, Mr. Wyshner served as the Chief Financial Officer at XPO Logistics,Inc., where he led all financial functions for the global transportation and contract logistics company thatmanages supply chains for customers worldwide. Prior to that, Mr. Wyshner served as the Chief FinancialOfficer at Wyndham Hotels & Resorts, Inc. from May 2018 to December 2019, and as its senior advisor fromDecember 2019 to March 2020. He served as Executive Vice President and Chief Financial Officer ofWyndham Worldwide Corporation, from which Wyndham Hotels was spun-off, from August 2017 toMay 2018. From August 2006 to June 2017, Mr. Wyshner served as the Chief Financial Officer of Avis BudgetGroup and also served as Avis Budget Group’s president from January 2016 to June 2017. Mr. Wyshnerreceived his MBA from the Wharton School of the University of Pennsylvania and his bachelor’s degree fromYale University.
Elly Keinan. Mr. Keinan was appointed our Group President in March 2021. From September 2020until his appointment as our Group President, Mr. Keinan serves as a venture partner at Pitango VentureCapital, Israel’s leading venture capital group, focused on scaling the success of growth stage technologycompanies. Prior to that, Mr. Keinan served a variety of executive roles at IBM from July 1987 to June 2020,
96

including General Manager of IBM North America and Chairman of IBM Japan, and held top leadershiproles in Latin America and Europe. Mr. Keinan currently serves on the boards of Cellebrite, Ottopia andUnited Way of New York City. Mr. Keinan received his MBA from University of Miami Herbert BusinessSchool and his Bachelor of Science in Computer Science and Electrical Engineering from RensselaerPolytechnic Institute.
Maryjo Charbonnier. Ms. Charbonnier was appointed our Chief Human Resources Officer in July2021. From January 2015 until her appointment, Ms. Charbonnier served as the Chief Human ResourcesOfficer at Wolters Kluwer, where she was responsible for the design and implementation of all human resourcesstrategies, policies and processes. Prior to that, Ms. Charbonnier served as the Chief Human ResourcesOfficer at Broadridge Financial Solutions from August 2008 to December 2014. From August 1995 to August2008, Ms. Charbonnier was an HR executive in a variety of leadership roles at PepsiCo, including VicePresident for Talent Sustainability for PepsiCo Foods Americas. Ms. Charbonnier received her MBA fromSouthern Methodist University and her undergraduate degree from Catholic University.
Edward Sebold. Mr. Sebold will be appointed our General Counsel and Secretary in connection withthe Spin-Off. From March 2012 until his appointment as our General Counsel, Mr. Sebold served as AssistantGeneral Counsel at IBM, leading several global legal functions at IBM, including teams that worked withservices, IBM's Watson Health, litigation and mergers and acquisitions. Prior to joining IBM in 2012, Mr.Sebold was a partner at Jones Day in the firm’s Cleveland and Houston offices. Mr. Sebold serves on theboard of the Pro Bono Partnership. Mr. Sebold received his JD from University of Michigan and hisundergraduate degree from John Carroll University.
Vineet Khurana. Mr. Khurana was appointed our Controller in May 2021. Since July 2020, Mr.Khurana had been serving as Chief Financial Officer of IBM’s Global Business Services. Prior to assumingthis role, Mr. Khurana was the Chief Financial Officer of IBM Europe from March 2018 through July2020 and the Vice President and Chief Financial Officer of IBM United Kingdom and Ireland from July2016 until March 2018. Earlier in his IBM tenure, Mr. Khurana has held roles of increasing responsibilityspanning financial strategy and IBM’s Global Financing division. Mr. Khurana also serves as an ExternalGovernor and a member of the Infrastructure and Finance committee of the University of Portsmouth,United Kingdom. Mr. Khurana received his MBA from University of Warwick and his undergraduate degreefrom Manipal Institute of Technology.
Dominic J. Caruso. Mr. Caruso will be appointed to our Board in connection with the Spin-Off.Mr. Caruso served as the Executive Vice President and Chief Financial Officer of Johnson & Johnson from2007 until his retirement in 2018. Earlier in his career, Mr. Caruso served Centocor, Inc. as Vice President,Finance and Chief Financial Officer from 1994 to 1998, and as Senior Vice President and Chief FinancialOfficer from 1998 until the acquisition of Centocor by Johnson & Johnson in 1999. Mr. Caruso thenjoined Johnson & Johnson and served in various executive positions until his appointment as the ExecutiveVice President and Chief Financial Officer in 2007. Mr. Caruso is a director of McKesson Corporation.Mr. Caruso previously served as the Co-Chair of the U.S. Chamber of Commerce Global Initiative onHealth and the Economy and currently serves on the Board of Trustees of The Children’s Hospital ofPhiladelphia and the Cystic Fibrosis Foundation. Mr. Caruso received his BS from Drexel University.Mr. Caruso’s global business experience and financial expertise will make him a well-qualified addition to ourBoard.
John D. Harris II. Mr Harris will be appointed to our Board in connection with the Spin-Off.Mr. Harris served as Chief Executive Officer of Raytheon International Inc. from 2013 until 2020.Mr. Harris also served as Vice President of Business Development for Raytheon Company during histenure. Mr. Harris joined Raytheon in 1983 and held positions of increasing responsibility, including VicePresident of Operations and Contracts for Raytheon’s former electronic systems business, Vice President ofContracts for the company’s government and defense businesses until 2003, and Vice President ofContracts and Supply Chain for Raytheon Company until 2010, when he was named president of theRaytheon Technical Services Company, a role he served until 2013. Mr. Harris served on the Radio TechnicalCommission for Aeronautics NextGen Advisory Committee, the National Advisory Council on MinorityBusiness Enterprise with the U.S. Department of Commerce and the Association of the United States Army’sCouncil of Trustees. Mr. Harris serves as a board member for Cisco Systems Inc. and Flex Ltd. He
97

received his undergraduate degree from Boston University. Mr. Harris’ global business experience andtechnology, digital and cybersecurity expertise will make him a well-qualified addition to our Board.
Stephen A. M. Hester. Mr. Hester will be appointed to our Board in connection with the Spin-Off.Mr. Hester joined RSA Insurance Group in 2014, and was the Chief Executive Officer until his retirementin June 2021. Prior to joining RSA, he was group Chief Executive of Royal Bank of Scotland from 2008 to2013, Chief Executive of British Land Plc from 2004 to 2008, and Chief Operating Officer and ChiefFinancial Officer of Abbey National plc from 2002 to 2004. Mr. Hester began his career at Credit SuisseFirst Boston in 1982 and held positions of increasing responsibility including Chief Financial Officer andHead of Support Division from 1996 until 2000, when he was appointed as Global Head of the Fixed IncomeDivision, a role he served until 2001. Mr. Hester currently serves as a non-executive director of easyJet plcand a director of Centrica plc. Additionally, during the past five years, he served as a director of RSAInsurance Group plc. Mr. Hester was formerly a director of the Royal Bank of Scotland, Northern Rockand Abbey National plc. Mr. Hester received his undergraduate degree from Oxford University. Mr. Hester’sglobal business experience and financial expertise will make him a well-qualified member of our Board.
Shirley Ann Jackson. Dr. Jackson will be appointed to our Board in connection with the Spin-Off.Since 1999, Dr. Jackson has served as the President of Rensselaer Polytechnic Institute. From 1995 until sheassumed her current position, Dr. Jackson was the Chairwoman of the U.S. Nuclear RegulatoryCommission. From 1991 to 1995 Dr. Jackson served as a consultant to the former AT&T Bell Laboratoriesand was also a professor of theoretical physics at Rutgers University. Prior to such roles, Dr. Jackson wasa theoretical physicist at the former AT&T Bell Laboratories from 1976 to 1991. She has been Co-Chair ofthe President’s Intelligence Advisory Board, a member of the International Security Advisory Board to theUnited States Secretary of State, and a member of the United States Secretary of Energy AdvisoryBoard. Dr. Jackson is a fellow of the Royal Academy of Engineering (U.K.), the American Academy ofArts and Sciences, and a member of the U.S. National Academy of Engineering and the AmericanPhilosophical Society. Dr. Jackson is a recipient of the National Medal of Science, the highest award inscience and engineering awarded by the U.S. Government. Dr. Jackson is a member of the Council on ForeignRelations. She is a Regent Emerita and former Vice-Chair of the Board of Regents of the SmithsonianInstitution, a past president of the American Association for the Advancement of Sciences, and an honorarytrustee of the Brookings Institution. Dr. Jackson is a director of FedEx Corporation and Public ServiceEnterprise Group Incorporated. Additionally, during the past five years, she served as a director of IBM.Dr. Jackson received her PhD and BS degrees from MIT. Dr. Jackson’s extensive leadership and technologyexperience will make her a well-qualified member of our Board.
Janina Kugel. Ms. Kugel will be appointed to our Board in connection with the Spin-Off. Ms. Kugelserved as the Chief Human Resources Officer and member of the Managing Board of Siemens AG from2015 until 2020. Ms. Kugel joined Siemens AG in 2001 as Vice President of Communications Group Strategyand in 2005, was appointed Director of Global Commercial Excellence before becoming Director ofHuman Resources in 2009. Ms. Kugel joined Osram in 2012, where she served as the Chief Human ResourcesOfficer until 2013, when she was appointed Corporate Vice President of Human Resources and ChiefDiversity Officer at Siemens AG. Ms. Kugel serves on the Board of Konecranes plc and TUI AG and is amember of the Advisory Council of the German Pension Benefit Guaranty Association (Pensions-Sicherungs-Verein) and the Executive Committee of the Supervisory Board of the Confederation of GermanEmployers’ Associations (Bundesvereinigung der Deutschen Arbeitgeberverbände). Ms. Kugel is alsotrustee of the Hertie School of Governance in Germany, a member of the International Advisory Board ofthe IESE Business School in Spain and, the University Council of the Technical University of Munich.Since 2020, Ms. Kugel has served as senior advisor to EQT, AB Group and Boston Consulting Group, Inc.She received her MS from the Johannes Gutenberg University Mainz. Ms. Kugel’s global business experienceand government service will make her a well-qualified addition to our Board.
Denis Machuel. Mr. Machuel will be appointed to our Board in connection with the Spin-Off. From2018 to September 2021, Mr. Machuel has served as Chief Executive Officer of Sodexo S.A. Mr. Machueljoined Sodexo in 2007 as the Managing Director of Benefits and Rewards Services for Central and EasternEurope. In 2012, he became Chief Executive Officer of Sodexo benefits and rewards worldwide.Mr. Machuel joined the Sodexo Group Executive Committee in 2014, and from 2015 until 2018, served asGroup Chief Digital Officer and since 2017, he has served as Deputy Chief Executive Officer of Sodexo.
98

Additionally, between 2016 and 2017, Mr. Machuel served as Chief Executive Officer of Personal andHome Services at Sodexo. Mr. Machuel is also a member of the G7 Business for Inclusive Growth Coalitionand the Consumer Goods Forum. Mr. Machuel received his MS from Texas A&M University and hisundergraduate degree from ENSIMAG College of Engineering. Mr. Machuel’s global business experienceand technology and digital expertise will make him a well-qualified addition to our Board.
Rahul N. Merchant. Mr. Merchant will be appointed to our Board in connection with the Spin-Off.Mr. Merchant has served as Senior Executive Vice President and Head of Client Services and Technologyat TIAA since 2015. Prior to serving this role, Mr. Merchant served as citywide Chief Information andInnovation Officer for the City of New York from 2012 until 2014. From 2006 until 2009, Mr. Merchantserved as Executive Vice President, Chief Information and Operations Officer and member of the ExecutiveCommittee at the Federal National Mortgage Association (Fannie Mae), and Senior Vice President, ChiefInformation Officer and Chief Technology Officer at Merrill Lynch, Pierce, Fenner & Smith Incorporatedfrom 2000 until 2006. Mr. Merchant also serves as a director for Juniper Networks, Inc. Mr. Merchant receivedhis MBA from Temple University, his MS from Memphis State University and his BS from BombayUniversity. Mr. Merchant’s global business and technology experience will make him a well-qualified additionto our Board.
Jana Schreuder. Ms. Schreuder will be appointed to our Board in connection with the Spin-Off.Ms. Schreuder served as Executive Vice President and Chief Operating Officer of Northern TrustCorporation from 2014 until she retired from that role in 2018. Ms. Schreuder joined Northern Trust in1980 and during her tenure held multiple roles as a member of the management team, including service asChief Risk Officer from 2005 to 2006, President of Operations and Technology from 2006 to 2011, andPresident of Wealth Management from 2011 to 2014. Ms. Schreuder is a member of the Global GovernanceCommittee of Women Corporate Directors. Ms. Schreuder currently sits on the board of Blucora, Inc. andThe Bank of N.T. Butterfield & Son Limited. Additionally, during the past five years, she served as adirector of LifePoint Health Inc. Ms. Schreuder received her MBA from Northwestern University and herBA from Southern Methodist University. Ms. Schreuder’s technology, digital and cybersecurity expertise willmake her a well-qualified addition to our Board.
Howard I. Ungerleider. Mr. Ungerleider will be appointed to our Board in connection with the Spin-Off. Mr. Ungerleider has served as President and Chief Financial Officer of Dow Inc. since April 2019. In1990, he joined The Dow Chemical Company and subsequently held various positions, including ChiefFinancial Officer from 2014 to 2015. In 2016, he was appointed Chief Financial Officer of DowDuPonteffective upon the merger of The Dow Chemical Company and E.I. du Pont de Nemours and Company.Mr. Ungerleider served in this role from 2017 until April of 2019, when Dow Inc. separated from DowDuPont.Mr. Ungerleider is Chairman of the Dow Company Foundation and serves on the board of directors ofFCLTGlobal, the Michigan Israel Business Bridge and Keep America Beautiful. Mr. Ungerleider is also amember of the Executive Committee of the Business Leaders for Michigan business roundtable and theMichigan Climate Executive Advisory Group. Additionally, during the past five years, he served as a directorof Wolverine Bancorp, Inc. Mr. Ungerleider received his MBA from UCLA and his BBA from TheUniversity of Texas at Austin. Mr. Ungerleider’s global business and leadership experience and financialexpertise will make him a well-qualified member of our Board.
Our Board Following the Spin-Off and Director Independence
Upon completion of the Distribution, our Board is expected to consist of 10 members.
Until the conclusion of the 2027 annual meeting, our Board will be divided into three classes, with eachclass consisting, as nearly as may be possible, of one-third of the total number of directors. The directorsdesignated as Class I directors will have terms expiring at the first annual meeting of stockholders followingthe Distribution, which we expect to hold in 2022. The directors designated as Class II directors will haveterms expiring at the following year’s annual meeting, which we expect to hold in 2023, and the directorsdesignated as Class III directors will have terms expiring at the following year’s annual meeting, which weexpect to hold in 2024. Any director elected at the 2022, 2023 or 2024 annual meeting will belong to theclass whose term expires at such annual meeting and will hold office for a three-year term until his or hersuccessor has been duly elected and qualified or until his or her earlier resignation or removal. We expect that
99

Ms. Kugel, Mr. Machuel and Mr. Merchant will serve as Class I directors, Mr. Harris, Ms. Schreuder andMr. Ungerleider will serve as Class II directors and Mr. Caruso, Mr. Hester, Dr. Jackson and Mr. Schroeterwill serve as Class III directors.
Beginning at the 2025 annual meeting and at each annual meeting thereafter, all of our directors up forelection at such meeting will be elected annually and will hold office until the next annual meeting and untilhis or her successor has been duly elected and qualified or until his or her earlier resignation or removal.Effective as of the conclusion of the 2027 annual meeting, our Board will therefore no longer be divided intothree classes. Before our Board is declassified, it would take at least two elections of directors for anyindividual or group to gain control of our Board. Accordingly, while the classified board is in effect, theseprovisions could discourage a third party from initiating a proxy contest, making a tender offer or otherwiseattempting to control us. This temporary classified Board structure is intended to provide better continuityof leadership during Kyndryl’s first years of operation as an independent, publicly held business, versusannually elected directors. We have not yet set the date of the first annual meeting to be held following theDistribution.
We expect that Mr. Caruso, Mr. Harris, Mr. Hester, Dr. Jackson, Ms. Kugel, Mr. Machuel, Mr.Merchant,Ms. Schreuder and Mr. Ungerleider will meet the independence requirements set forth in the listing standardsof the New York Stock Exchange at the time of the Spin-Off.
Committees of the Board
Effective upon the completion of the Spin-Off, our Board will have the following committees, each ofwhich will operate under a written charter that will be posted on our website prior to the Spin-Off.
Audit Committee
The Audit Committee will be responsible for overseeing reports of our financial results, audit reporting,internal controls, and adherence to our code of ethics in compliance with applicable laws and regulations.Concurrent with that responsibility, as set out more fully in the Audit Committee charter, the Audit Committeewill perform other functions, including:
• selecting the independent registered public accounting firm, approving all related fees andcompensation, overseeing the work of the independent accountant, and reviewing its selection withthe Board;
• annually preapproving the proposed services to be provided by the accounting firm during the year;
• reviewing the procedures of the independent registered public accounting firm for ensuring itsindependence and other qualifications with respect to the services performed for us;
• reviewing any significant changes in accounting principles or developments in accounting practicesand the effects of those changes upon our financial reporting;
• assessing the effectiveness of our internal audit function and overseeing the adequacy of internalcontrols and risk management processes; and
• meeting with management prior to each quarterly earnings release and periodically to discuss theappropriate approach to earnings press releases and the type of financial information and earningsguidance to be provided to analysts and rating agencies.
The Audit Committee will have at least three members and will consist entirely of independentdirectors, each of whom will meet the independence requirements set forth in the listing standards of theNew York Stock Exchange, Rule 10A-3 under the Exchange Act and our Audit Committee charter. Eachmember of the Audit Committee will be financially literate, and at least one member of the Audit Committeewill have accounting and related financial management expertise and satisfy the criteria to be an “auditcommittee financial expert” under the rules and regulations of the SEC, as those qualifications are interpretedby our Board in its business judgment. Upon completion of the Spin-Off, we expect our Audit Committeewill consist of Mr. Caruso, Mr. Machuel and Mr. Merchant, with Mr. Caruso serving as chair.
100

Compensation Committee
The Compensation Committee will have responsibility for defining and articulating our overallexecutive compensation philosophy and key compensation policies, and administering and approving allelements of compensation for corporate officers. Concurrent with that responsibility, as set out more fullyin the Compensation Committee charter, the Compensation Committee will perform other functions,including:
• reviewing and approving the corporate goals and objectives relevant to the Chief Executive Officer’scompensation, evaluating performance in light of those goals and objectives and, together with theother independent directors, determining and approving the Chief Executive Officer’s compensationbased on this evaluation;
• reviewing our management resources programs (including our human capital management anddiversity and inclusion practices) and recommending qualified candidates for election as officers;
• approving, by direct action or through delegation, participation in and all awards, grants, and relatedactions under our various equity plans;
• reviewing the compensation structure for our officers and providing oversight of management’sdecisions regarding performance and compensation of other employees; and
• monitoring compliance with stock ownership and clawback guidelines.
Upon completion of the Spin-Off, we expect our Compensation Committee will consist of Ms. Kugel,Ms. Schreuder, Mr. Ungerleider, with Ms. Schreuder serving as chair.
Nominating and Governance Committee
The Nominating and Governance Committee will be devoted primarily to the continuing review,definition and articulation of our governance structure and practices. Concurrent with that responsibility,as set out more fully in the Nominating and Governance Committee charter, the Nominating and GovernanceCommittee will perform other functions, including:
• leading the search for qualified individuals for election as our directors, including for inclusion in theslate of directors that the Board proposes for election by stockholders at the Annual Meeting,recommending qualified candidates to the Board for election as directors based on each suchcandidate’s business or professional experience, the diversity of their background (including genderand ethnic diversity), and their talents and perspectives, reviewing and assessing the independence ofeach director nominee, and planning for future Board and Committee refreshment actions;
• advising and making recommendations to the Board on all matters concerning directorship practices,and on the function, composition and duties of the committees of the Board;
• assessing transactions with related persons under our related person transactions policy andreviewing the policy at least annually;
• reviewing our non-management director compensation practices;
• developing and making recommendations to the Board regarding a set of corporate governanceguidelines;
• reviewing and considering our position and practices on significant issues of corporate socialresponsibility; and
• reviewing and considering stockholder proposals and director nominees.
Upon completion of the Spin-Off, we expect our Nominating and Governance Committee will consistof Mr. Harris, Mr. Hester and Dr. Jackson, with Mr. Hester serving as chair.
Code of Ethics
Prior to the completion of the Spin-Off, we will adopt a written code of ethics for directors, executiveofficers and employees. The code will be designed to deter wrongdoing and to promote, among other things:
101

• honest and ethical conduct, including the ethical handling of actual or apparent conflicts of interestbetween personal and professional relationships;
• protection of client and third party information in compliance with applicable privacy and datasecurity requirements;
• full, fair, accurate, timely and understandable disclosure in reports and documents that we file withthe SEC and other regulators and in our other public communications;
• compliance with applicable laws, rules and regulations; and
• accountability for adherence to the code and prompt internal reporting of any possible violation ofthe code.
Director Nomination Process
Our initial Board will be selected through a process involving both IBM and us. The initial directorswho will serve after the Spin-Off will begin their terms at the time of the Distribution, with the exception ofone independent director who will begin his or her term prior to the date on which “when-issued” tradingof our common stock commences and will serve on our Audit Committee, Compensation Committee andNominating and Governance Committee.
Corporate Governance Guidelines
The Board will adopt a set of Corporate Governance Guidelines in connection with the separation toassist it in guiding our governance practices, which will be regularly reviewed by the Nominating andGovernance Committee. These guidelines will cover a number of areas, including Board independence,leadership, composition (including director qualifications and diversity), responsibilities and operations;director compensation; Chief Executive Officer evaluation and succession planning; Board committees;director orientation and continuing education; director access to management and independent advisers;annual Board and committee evaluations; the Board’s communication policy and others. A copy of ourcorporate governance guidelines will be posted on our website.
Communications with Non-Management Members of the Board
After the Spin-Off, stockholders and other interested parties may communicate with the Board,individual directors, the non-management directors as a group, or with the Chair, by writing in care of ourSecretary or sending an email to [email protected].
102

DIRECTOR COMPENSATION
Compensation of Directors
We expect that our Board will approve an initial director compensation program, as described below,pursuant to which each of our non-employee directors will receive an annual director fee and an annualequity award in connection with their services. In addition, each director will be reimbursed for out-of-pocket expenses in connection with his or her services. The initial director compensation program set outbelow was approved by IBM’s Directors and Corporate Governance Committee and Board of Directors,based upon the recommendations by Semler Brossy, the third-party compensation consultant of IBM’sDirectors and Corporate Governance Committee. The program will be designed to enable continued attractionand retention of highly qualified directors and to address the time, effort, expertise and accountabilityrequired of active Board membership.
Following the Spin-Off, we expect that our Nominating and Governance Committee will periodicallyreview and make recommendations to our Board regarding the form and amount of compensation for non-employee directors. Directors who are also our employees are expected to receive no additional compensationfor service on our Board.
Annual Compensation
In general, we believe that annual compensation for non-employee directors should consist of both acash component, designed to compensate members for their service on the Board and its committees, andan equity component, designed to align the interests of directors and stockholders and, by vesting over time,to create an incentive for continued service on the Board.
Board of Directors’ Annual CompensationCash Retainer $100,000Lead Independent Director – Additional CashCompensation
$45,000
Board Committee Chairmanship – Additional CashRetainer
Audit Committee Chair: $30,000 CompensationCommittee Chair: $22,500 Nominating andGovernance Committee Chair: $22,500
Annual Equity GrantsRSUs vest on the first anniversary of the date ofgrant.
Each non-employee director receives an annualRSU grant with a target value of $200,000
Cash elements are expected to be paid in installments and prorated for partial years of service. Inaddition, if the Equity Plan is approved by IBM, as our sole stockholder, and our Board, it is expected thatthe maximum aggregate value of shares of our common stock that may be issued under all stock-basedawards granted under such plan to non-employee directors in any fiscal year (together with any cash fees)would be $750,000.
Stock Ownership Guidelines
We expect to adopt a stock ownership policy pursuant to which each non-employee director, whileserving as a director of the Company, must hold our common stock with a market value of at least fivetimes the annual cash retainer (or $500,000) before being permitted to sell any of our common stock holdings,including net shares from vesting of RSU grants (i.e., shares vested less shares required to pay applicabletaxes).
103
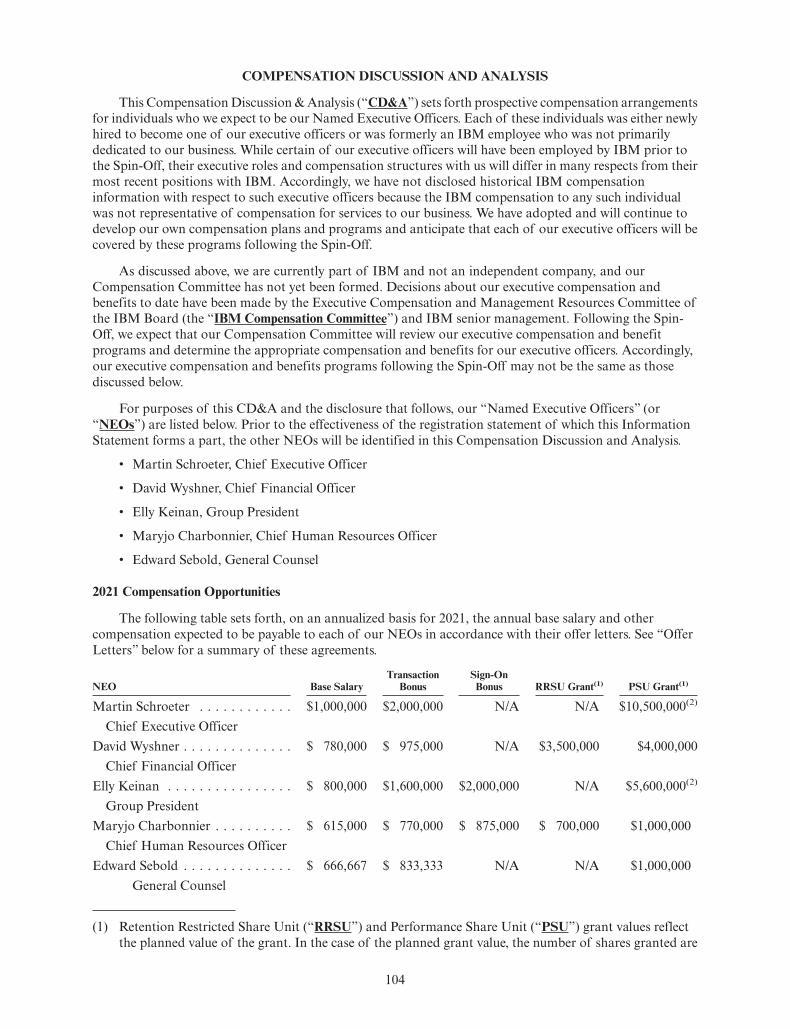
COMPENSATION DISCUSSION AND ANALYSIS
This Compensation Discussion & Analysis (“CD&A”) sets forth prospective compensation arrangementsfor individuals who we expect to be our Named Executive Officers. Each of these individuals was either newlyhired to become one of our executive officers or was formerly an IBM employee who was not primarilydedicated to our business. While certain of our executive officers will have been employed by IBM prior tothe Spin-Off, their executive roles and compensation structures with us will differ in many respects from theirmost recent positions with IBM. Accordingly, we have not disclosed historical IBM compensationinformation with respect to such executive officers because the IBM compensation to any such individualwas not representative of compensation for services to our business. We have adopted and will continue todevelop our own compensation plans and programs and anticipate that each of our executive officers will becovered by these programs following the Spin-Off.
As discussed above, we are currently part of IBM and not an independent company, and ourCompensation Committee has not yet been formed. Decisions about our executive compensation andbenefits to date have been made by the Executive Compensation and Management Resources Committee ofthe IBM Board (the “IBM Compensation Committee”) and IBM senior management. Following the Spin-Off, we expect that our Compensation Committee will review our executive compensation and benefitprograms and determine the appropriate compensation and benefits for our executive officers. Accordingly,our executive compensation and benefits programs following the Spin-Off may not be the same as thosediscussed below.
For purposes of this CD&A and the disclosure that follows, our “Named Executive Officers” (or“NEOs”) are listed below. Prior to the effectiveness of the registration statement of which this InformationStatement forms a part, the other NEOs will be identified in this Compensation Discussion and Analysis.
• Martin Schroeter, Chief Executive Officer
• David Wyshner, Chief Financial Officer
• Elly Keinan, Group President
• Maryjo Charbonnier, Chief Human Resources Officer
• Edward Sebold, General Counsel
2021 Compensation Opportunities
The following table sets forth, on an annualized basis for 2021, the annual base salary and othercompensation expected to be payable to each of our NEOs in accordance with their offer letters. See “OfferLetters” below for a summary of these agreements.
NEO Base SalaryTransaction
BonusSign-OnBonus RRSU Grant(1) PSU Grant(1)
Martin Schroeter . . . . . . . . . . . . $1,000,000 $2,000,000 N/A N/A $10,500,000(2)
Chief Executive OfficerDavid Wyshner . . . . . . . . . . . . . . $ 780,000 $ 975,000 N/A $3,500,000 $4,000,000
Chief Financial OfficerElly Keinan . . . . . . . . . . . . . . . . $ 800,000 $1,600,000 $2,000,000 N/A $5,600,000(2)
Group PresidentMaryjo Charbonnier . . . . . . . . . . $ 615,000 $ 770,000 $ 875,000 $ 700,000 $1,000,000
Chief Human Resources OfficerEdward Sebold . . . . . . . . . . . . . . $ 666,667 $ 833,333 N/A N/A $1,000,000
General Counsel
(1) Retention Restricted Share Unit (“RRSU”) and Performance Share Unit (“PSU”) grant values reflectthe planned value of the grant. In the case of the planned grant value, the number of shares granted are
104

determined by dividing the planned value by the average of IBM’s closing stock price for the 30 activetrading days prior to the date of grant.
(2) If, as of the closing of the Spin-Off, the fair market value of the IBM shares underlying Mr. Schroeter’sor Mr. Keinan’s target PSU award (“IBM PSU Share Value”) is less than the PSU planned grantvalue by $50,000 or more, then immediately after the closing of the Spin-Off, provided that the applicableperformance criteria have been met or excused, the executive officer will receive a Restricted ShareUnit (“RSU”) award with respect to the number of shares of our common stock with a value on thedate of grant equal to the difference between the target PSU grant value and the IBM PSU Share Value.
Our Compensation Programs Following the Spin-Off
Although executive compensation determinations following the Spin-Off will be made by theCompensation Committee, we expect that the primary objectives of our executive compensation will be tomeet five key objectives: (1) align the interests of our leaders with those of our investors by varyingcompensation based on both long-term and annual business results and delivering a large portion of thetotal pay opportunity in our stock; (2) balance rewards for both short-term results and the long-term strategicdecisions needed to ensure sustained business performance over time; (3) attract and retain the highlyqualified senior leaders needed to drive a global enterprise to succeed in today’s highly competitivemarketplace; (4) motivate our leaders to deliver a high degree of business performance without encouragingexcessive risk taking; and (5) differentiate rewards to reflect individual and team performance. To fulfillthese objectives, we also expect that we will have an executive compensation program that includes three majorelements—base salary, annual bonus incentives and long-term equity incentives, which may includerestricted stock and performance-based equity awards. Other than the offer letters and initial equity grants,which are described below, we have not adopted any compensation policies, procedures or plans withrespect to NEO compensation and any such determinations remain subject to the review and approval ofthe Compensation Committee.
Offer Letters with our Named Executive Officers
CEO Offer Letter. On January 2, 2021, IBM entered into an offer letter with Mr. Schroeter appointinghim as our Chief Executive Officer, which became effective when he was hired on January 15, 2021, andwhich will be assumed by us following the Spin-Off. The offer letter provides Mr. Schroeter with an annualbase salary of $1,000,000, prorated for 2021 based on Mr. Schroeter’s actual service for IBM during such year,a $2,000,000 transaction bonus and a new hire PSU award of $10,500,000 in planned value.
Mr. Schroeter’s transaction bonus will be paid no later than February 1, 2022, subject to the closing ofthe Spin-Off and Mr. Schroeter remaining actively employed through the closing of the Spin-Off. Althoughthe Spin-Off is expected to occur prior to December 31, 2021, Mr. Schroeter may still receive the transactionbonus if the Spin-Off is not complete by such date if (i) IBM’s Chief Executive Officer, in his sole discretion,decides to pay the bonus in full prior to February 1, 2022 (provided Mr. Schroeter is an active employee onthe payment date) or (ii) the Spin-Off was not completed for reasons beyond Mr. Schroeter’s reasonablecontrol and his employment is terminated without Cause (as defined below). In addition, if prior toDecember 31, 2021, for strategic business reasons, IBM formally announces it will not complete the Spin-Off or if we are sold to another buyer, and IBM’s Chief Executive Officer determines that such announcementor sale was not made as a result of Mr. Schroeter’s performance in moving the Spin-Off to closure, thenMr. Schroeter will still be eligible to receive the transaction bonus within one month after the later of (i) theannouncement not to complete the Spin-Off or (ii) the closing of the sale to another buyer, subject toMr. Schroeter’s continued employment through such announcement or closing, as applicable.
Mr. Schroeter’s new hire PSU award was granted on February 1, 2021 and will become eligible to vestif (i) the Spin-Off is completed as envisioned by January 1, 2023 (i.e., as described in this InformationStatement) and (ii) immediately following the closing of the Spin-Off, Mr. Schroeter accepts employment asour Chief Executive Officer. If the performance criteria are achieved, the PSU award vests 33% on thesix-month anniversary of the Spin-Off closing date, 33% on the first anniversary of the Spin-Off closingdate and 34% on the second anniversary of the Spin-Off closing date, subject to continued employment onsuch dates (except as provided below). In addition, if for strategic business reasons, IBM formally announcesit will not complete the Spin-Off or if we are sold to another buyer, and IBM’s Chief Executive Officer
105

determines that such announcement or sale was not made as a result of Mr. Schroeter’s performance inmoving the Spin-Off to closure, then Mr. Schroeter will still be eligible to receive the PSUs on the six-month,first and second anniversaries of (i) the announcement not to complete the Spin-Off or (ii) the closing ofthe sale to another buyer (in the case of a sale, also if Mr. Schroeter was not selected to become our ChiefExecutive Officer or was selected to become the Chief Executive Officer, but declines the offer), as applicable.Furthermore, if Mr. Schroeter’s employment is terminated without Cause prior to the Spin-Off or the saleto a third party, or if the Spin-Off is completed and Kyndryl’s offer of employment is not comparable in theaggregate to the terms of his offer letter (including with respect to annual salary, bonus and equity awards)or our Board does not appoint Mr. Schroeter as Chairman of our Board, then Mr. Schroeter will still beeligible to receive the PSUs on the six-month, first and second anniversaries of the termination date. If,other than by death or disability described below, the performance conditions are not met for any other reasonby January 1, 2023, the PSUs will be canceled. Upon Mr. Schroeter’s death or disability, the PSU awardwill remain eligible to vest in accordance with its terms and will vest if the Spin-Off does not occur asenvisaged by January 1, 2023.
If, as of the closing of the Spin-Off, the IBM PSU Share Value of Mr. Schroeter’s PSU award is lessthan $10,500,000 by $50,000 or more, then immediately after the closing of the Spin-Off, provided that theapplicable performance criteria have been met or excused, Mr. Schroeter will receive an RSU award withrespect to the number of shares of Kyndryl common stock with a value on the date of grant equal to thedifference between $10,500,000 and the IBM PSU Share Value, with such RSUs vesting on the same scheduleas the PSU award. If the Spin-Off does not occur and we are instead sold to another buyer and as of thesale date the IBM PSU Share Value of Mr. Schroeter’s PSU award is less than $10,500,000 by $50,000 or more,and Mr. Schroeter accepts employment with the buyer, then the buyer will grant an RSU award, orsubstantially equivalent cash or equity-based award in an affiliate of buyer, with a value equal to the differencebetween $10,500,000 and the IBM PSU Share Value, with the award vesting on the same schedule as thePSU award.
For purposes of Mr. Schroeter’s offer letter, Cause means, as reasonably determined by IBM, theoccurrence of any of the following: (i) embezzlement, misappropriation of corporate funds or othermaterial acts of dishonesty; (ii) commission or conviction of any felony or of any misdemeanor involvingmoral turpitude, or entry of a plea of guilty or nolo contendere to any felony or misdemeanor (other than aminor traffic violation or other minor infraction); (iii) engagement in any activity that Mr. Schroeterknows or should know could harm our business or reputation; (iv) failure to adhere to our corporate codes,policies or procedures; (v) a breach of any covenant in any employment agreement or any intellectualproperty agreement, or a breach of any other provision of Mr. Schroeter’s employment agreement, in eithercase if the breach is not cured to our satisfaction within a reasonable period after Mr. Schroeter is providedwith notice of the breach (no notice and cure period is required if the breach cannot be cured); (vi) failure byMr. Schroeter to perform his duties or follow management direction, which failure is not cured to oursatisfaction within a reasonable period of time after a written demand for substantial performance is deliveredto Mr. Schroeter (no notice or cure period is required if the failure to perform cannot be cured);(vii) violation of any statutory, contractual or common law duty or obligation to us, including, withoutlimitation, the duty of loyalty; or (viii) rendering of services for any organization or engaging directly orindirectly in any business which is or becomes competitive with us, or which organization or business, or therendering of services to such organization or business, is or becomes otherwise prejudicial to or in conflictwith our interests; or (ix) acceptance of an offer to engage in or associate with any business which is orbecomes competitive with us; provided, however, that the mere failure to achieve performance objectivesshall not constitute Cause.
CFO Offer Letter. On July 25, 2021, IBM entered into an offer letter with Mr. Wyshner appointing himas our Chief Financial Officer, which became effective on September 9, 2021, and which will be assumed byus following the Spin-Off. The offer letter provides Mr. Wyshner with an annual base salary of $780,000,prorated for 2021 based on Mr. Wyshner’s actual service for IBM during such year, a $975,000 transactionbonus, a new hire PSU award of $4,000,000 in planned value and a sign-on equity RRSU award of $3,500,000in planned value.
Mr. Wyshner’s transaction bonus will be paid no later than February 1, 2022, subject to the closing ofthe Spin-Off and Mr. Wyshner remaining actively employed through the closing of the Spin-Off. Although
106

the Spin-Off is expected to occur prior to December 31, 2021, Mr. Wyshner may still receive the transactionbonus if the Spin-Off is not complete by such date (i) no later than February 1, 2022, if IBM’s ChiefExecutive Officer, in his sole discretion, decides to pay the bonus in full or in part prior to February 1, 2022(provided Mr. Wyshner is an active employee on the payment date) or (ii) within one month following thedate of termination, if the Spin-Off was not completed for reasons beyond Mr. Wyshner’s reasonable controland his employment is terminated without Cause (as defined below). In addition, if prior to December 31,2021, for strategic business reasons, IBM formally announces it will not complete the Spin-Off or if we aresold to another buyer, and IBM’s Chief Executive Officer determines that (i) Mr. Wyshner’s performancein moving the Spin-Off to closure was not a contributing factor in the decision to make such announcementor sale and (ii) Mr. Wyshner’s performance is otherwise satisfactory, then Mr. Wyshner will still be eligibleto receive the transaction bonus within one month after the later of (i) the announcement not to complete theSpin-Off or (ii) the closing of the sale to another buyer, subject to Mr. Wyshner’s continued employmentthrough such announcement or closing, as applicable.
Mr. Wyshner’s new hire PSU award will be granted on October 1, 2021 and will become eligible to vestif (i) the Spin-Off is completed as envisioned by January 1, 2023 (i.e., as described in this InformationStatement) and (ii) if the Spin-Off is completed, immediately following the closing of the Spin-Off,Mr. Wyshner accepts employment as our Chief Financial Officer. If the performance criteria are achieved,the PSU award vests 33% on the six-month anniversary of the Spin-Off closing date, 33% on the firstanniversary of the Spin-Off closing date and 34% on the second anniversary of the Spin-Off closing date,subject to continued employment on such dates (except as provided below). In addition, if for strategicbusiness reasons, IBM formally announces it will not complete the Spin-Off or if we are sold to another buyer,and IBM’s Chief Executive Officer determines that such announcement or sale was not made as a result ofMr. Wyshner’s performance in moving the Spin-Off to such closure, then Mr. Wyshner will still be eligible toreceive the PSUs on the six-month, first and second anniversaries of (i) the announcement not to completethe Spin-Off or (ii) the closing of the sale to another buyer (in the case of a sale, also if Mr. Wyshner was notselected to become our Chief Financial Officer or a substantially comparable role), as applicable.Furthermore, if Mr. Wyshner’s employment is terminated without Cause prior to the Spin-Off or the sale toa third party, or if the Spin-Off is completed and our offer of employment is not comparable in theaggregate to the terms of his offer letter (including with respect to annual salary, bonus and equity awardsor Mr. Wyshner was not selected to become our Chief Financial Officer or a substantially comparable role),then Mr. Wyshner will still be eligible to receive the PSUs on the six-month, first and second anniversariesof the termination date. If, other than by death or disability described below, the performance conditions arenot met for any other reason by January 1, 2023, the PSUs will be canceled. Upon Mr. Wyshner’s death ordisability, the PSU award will remain eligible to vest in accordance with its terms and will vest if the Spin-Off does not occur as envisaged by January 1, 2023.
Mr. Wyshner’s sign-on RRSU award will be granted on October 1, 2021, will vest in an amount of$250,000 in planned value on the first anniversary of the grant date, $250,000 in planned value on thesecond anniversary of the grant date and $3,000,000 in planned value on the third anniversary of the grantdate and will be converted upon the Spin-Off in a manner consistent with similar IBM awards. IfMr. Wyshner’s employment is terminated without Cause prior to the third anniversary of the grant date,and his performance is otherwise satisfactory, Mr. Wyshner will still be eligible to receive the RRSU awardas scheduled. Upon Mr. Wyshner’s death, the RRSU award will vest immediately, and upon Mr. Wyshner’sdisability, the RRSU award will remain eligible to vest as scheduled.
For purposes of Mr. Wyshner’s offer letter, Cause has the same meaning as in Mr. Schroeter’s offerletter.
Group President Offer Letter. On March 1, 2021, IBM entered into an offer letter with Mr. Keinanappointing him as our Group President, which became effective on March 8, 2021, and which will beassumed by us following the Spin-Off. The offer letter provides Mr. Keinan with an annual base salary of$800,000, prorated for 2021 based on Mr. Keinan’s actual service for IBM during such year, a $1,600,000transaction bonus, a new hire equity PSU award of $5,600,000 in planned value and a $2,000,000 sign-onbonus.
Mr. Keinan’s transaction bonus will be paid no later than February 1, 2022, subject to the closing ofthe Spin-Off and Mr. Keinan remaining actively employed through the closing of the Spin-Off. Although
107

the Spin-Off is expected to occur prior to December 31, 2021, Mr. Keinan may still receive the transactionbonus if the Spin-Off is not complete by such date if (i) IBM’s Chief Executive Officer, in his sole discretion,decides to pay the bonus in full prior to February 1, 2022 (provided Mr. Keinan is an active employee onthe payment date) or (ii) the Spin-Off was not completed for reasons beyond Mr. Keinan’s reasonable controland his employment is terminated without Cause (as defined below). In addition, if prior to December 31,2021, for strategic business reasons, IBM formally announces it will not complete the Spin-Off or if we aresold to another buyer, and IBM’s Chief Executive Officer determines that such announcement or sale wasnot made as a result of Mr. Keinan’s performance in moving the Spin-Off to closure, then Mr. Keinan will stillbe eligible to receive the transaction bonus within one month after the later of (i) the announcement not tocomplete the Spin-Off or (ii) the closing of the sale to another buyer, subject to Mr. Keinan’s continuedemployment through such announcement or closing, as applicable.
Mr. Keinan’s new hire PSU award was granted on April 1, 2021 and will become eligible to vest if(i) the Spin-Off is completed as envisioned by January 1, 2023 (i.e., as described in this InformationStatement) and (ii) immediately following the closing of the Spin-Off, Mr. Keinan accepts employment asour Group President. If the performance criteria are achieved, the PSU award vests 33% on the six-monthanniversary of the Spin-Off closing date, 33% on the first anniversary of the Spin-Off closing date and 34%on the second anniversary of the Spin-Off closing date, subject to continued employment on such dates(except as provided below). In addition, if for strategic business reasons, IBM formally announces it will notcomplete the Spin-Off or if we are sold to another buyer, and IBM’s Chief Executive Officer determinesthat such announcement or sale was not made as a result of Mr. Keinan’s performance in moving the Spin-Off to such closure, then Mr. Keinan will still be eligible to receive the PSUs on the six-month, first and secondanniversaries of (i) the announcement not to complete the Spin-Off or (ii) the closing of the sale toanother buyer (in the case of a sale, also if Mr. Keinan was not selected to become our Group President ora substantially comparable role), as applicable. Furthermore, if Mr. Keinan’s employment is terminatedwithout Cause prior to the Spin-Off or the sale to a third party, or if the Spin-Off is completed and ouroffer of employment is not comparable in the aggregate to the terms of his offer letter (including with respectto annual salary, bonus and equity awards), then Mr. Keinan will still be eligible to receive the PSUs on thesix-month, first and second anniversaries of the termination date. If, other than by death or disability describedbelow, the performance conditions are not met for any other reason by January 1, 2023, the PSUs will becanceled. Upon Mr. Keinan’s death or disability, the PSU award will remain eligible to vest in accordance withits terms and will vest if the Spin-Off does not occur as envisaged by January 1, 2023.
If, as of the closing of the Spin-Off, the IBM PSU Share Value of Mr. Keinan’s PSU award is less than$5,600,000 by $50,000 or more, then immediately after the closing of the Spin-Off, provided that theapplicable performance criteria have been met or excused, Mr. Keinan will receive an RSU award with respectto the number of shares of Kyndryl common stock with a value on the date of grant equal to the differencebetween $5,600,000 and the IBM PSU Share Value, with such RSUs vesting on the same schedule as thePSU award. If the Spin-Off does not occur and we are instead sold to another buyer and as of the sale datethe IBM PSU Share Value of Mr. Keinan’s PSU award is less than $5,600,000 by $50,000 or more, andMr. Keinan accepts employment with the buyer, then the buyer will grant an RSU award or substantiallyequivalent cash or equity-based award in an affiliate of buyer, with a value equal to the difference between$5,600,000 and the IBM PSU Share Value, with the award vesting on the same schedule as the PSU award.
Mr. Keinan’s sign-on bonus was paid within two months of his hire date, and must be repaid ifMr. Keinan’s employment with IBM, or us after the closing of the Spin-Off, ends within two years after hishire date. Mr. Keinan will not be required to repay his sign on bonus upon his termination of employmentfrom IBM and us if: (i) IBM formally announces that it will not complete the Spin-Off, and IBM’s ChiefExecutive Officer determines that such decision was not made as a result of Mr. Keinan’s performance inmoving the Spin-Off to closure; (ii) we are purchased by another buyer, and (a) IBM’s Chief Executive Officerdetermines that such decision was not made as a result of Mr. Keinan’s performance and (b) Mr. Keinan isnot selected for a substantially comparable role at the new company; or (iii) such termination was withoutCause.
For purposes of Mr. Keinan’s offer letter, Cause has the same meaning as in Mr. Schroeter’s offerletter.
108

Chief Human Resources Officer Offer Letter. On May 28, 2021, IBM entered into an offer letter withMs. Charbonnier appointing her as our Chief Human Resources Officer, which became effective on July 6,2021, and which will be assumed by us following the Spin-Off. The offer letter provides Ms. Charbonnier withan annual base salary of $615,000, prorated for 2021 based on Ms. Charbonnier’s actual IBM start dateand termination date during such year, a $770,000 transaction bonus, a new hire equity PSU award of$1,000,000 in planned value, a sign-on equity RRSU award of $700,000 in planned value and a $875,000sign-on bonus.
Ms. Charbonnier’s transaction bonus will be paid no later than February 1, 2022, subject to the closingof the Spin-Off and Ms. Charbonnier remaining actively employed through the closing of the Spin-Off,although IBM, in its sole discretion, may decide to provide Ms. Charbonnier with a partial payment of$200,000 if she is terminated without Cause (as defined below) prior to the closing of the Spin-Off. Althoughthe Spin-Off is expected to occur prior to December 31, 2021, Ms. Charbonnier may still receive thetransaction bonus if the Spin-Off is not complete by such date if (i) IBM’s Chief Executive Officer, in hissole discretion, decides to pay the bonus in full or in part prior to February 1, 2022 (provided Ms. Charbonnieris an active employee on the payment date) or (ii) the Spin-Off was not completed for reasons beyondMs. Charbonnier’s reasonable control and her employment is terminated without Cause, payable byFebruary 1, 2022. In addition, if prior to December 31, 2021, for strategic business reasons, IBM formallyannounces it will not complete the Spin-Off or if we are sold to another buyer, and IBM’s Chief ExecutiveOfficer determines that (i) Ms. Charbonnier’s performance in moving the Spin-Off to closure was not acontributing factor in the decision to make such announcement or sale and (ii) Ms. Charbonnier’s performanceis otherwise satisfactory, then Ms. Charbonnier will still receive the transaction bonus within one monthafter the later of (i) the announcement not to complete the Spin-Off or (ii) the closing of the sale to anotherbuyer, subject to Ms. Charbonnier’s continued employment through such announcement or closing, asapplicable.
Ms. Charbonnier’s new hire PSU award was granted on August 1, 2021 and will become eligible to vestif (i) the Spin-Off is completed as envisioned by January 1, 2023 (i.e., as described in this InformationStatement) and (ii) if the Spin-Off is completed as envisaged, immediately following the closing of the Spin-Off, Ms. Charbonnier accepts employment as our Chief Human Resources Officer. If the performancecriteria are achieved, the PSU award vests 33% on the six-month anniversary of the Spin-Off closing date,33% on the first anniversary of the Spin-Off closing date and 34% on the second anniversary of the Spin-Off closing date, subject to continued employment on such dates (except as provided below). In addition,if for strategic business reasons, IBM formally announces it will not complete the Spin-Off or if we are soldto another buyer, and IBM’s Chief Executive Officer determines that such announcement or sale was notmade as a result of Ms. Charbonnier’s performance in moving the Spin-Off to such closure, thenMs. Charbonnier will still be eligible to receive the PSUs on the six-month, first and second anniversaries of(i) the announcement not to complete the Spin-Off or (ii) the closing of the sale to another buyer (in thecase of a sale, also if Ms. Charbonnier was not selected to become our Chief Human Resources Officer or asubstantially comparable role), as applicable. Furthermore, if Ms. Charbonnier’s employment is terminatedwithout Cause prior to the Spin-Off or the sale to a third party, if the Spin-Off is completed and our offer ofemployment is not comparable in the aggregate to the terms of her offer letter (including with respect toannual salary, bonus and equity awards) or the Spin-Off is completed and her geographic location is greaterthan 50 miles from her work location, then Ms. Charbonnier will still be eligible to receive the PSUs onthe six-month, first and second anniversaries of the termination date. If, other than by death or disabilitydescribed below, the performance conditions are not met for any other reason by January 1, 2023, the PSUswill be canceled. Upon Ms. Charbonnier’s death or disability, the PSU award will remain eligible to vest inaccordance with its terms and will vest if the Spin-Off does not occur as envisaged by January 1, 2023.
Ms. Charbonnier’s sign-on RRSU award was granted on August 1, 2021, will vest on the secondanniversary of the grant date and will be converted upon the Spin-Off in a manner consistent with similarIBM awards. If Ms. Charbonnier’s employment is terminated without Cause prior to the second anniversaryof the grant date, and her performance is otherwise satisfactory, Ms. Charbonnier will still be eligible toreceive the RRSU award as scheduled. Upon Ms. Charbonnier’s death, the RRSU award will vest immediately,and upon Ms. Chabonnier’s disability, the RRSU award will remain eligible to vest as scheduled.
Ms. Charbonnier’s sign-on bonus will be paid within 60 days of her hire date, and must be repaid ifMs. Charbonnier’s employment with IBM, or us after the closing of the Spin-Off, ends within one year
109

after her hire date. Ms. Charbonnier will not be required to repay her sign on bonus upon her terminationof employment from IBM and us if: (i) IBM formally announces that it will not complete the Spin-Off, andIBM’s Chief Executive Officer determines that Ms. Charbonnier’s performance in moving the Spin-Off toclosure was not a contributing factor in the decision not to complete the Spin-Off, and her performance wasotherwise satisfactory; (ii) we are purchased by another buyer, and (a) IBM’s Chief Executive Officerdetermines that Ms. Charbonnier’s performance was not a contributing factor in such decision and herperformance was otherwise satisfactory and (b) Ms. Charbonnier is not selected for a substantially comparablein the aggregate role at the new company (including annual salary, bonus, equity awards and geographiclocation, which cannot be greater than 50 miles from her work location); or (iii) such termination was withoutCause.
For purposes of Ms. Charbonnier’s offer letter, Cause has the same meaning as in Mr. Schroeter’s offerletter.
General Counsel. Mr. Sebold has not entered into an offer letter or employment agreement with us. Asdiscussed above, although Mr. Sebold had previously been employed by IBM, we have not disclosed hishistorical IBM compensation information since we do not believe such disclosure would accurately reflectthe compensation plans and philosophies that we intend to implement as a separate publicly traded company.While Mr. Sebold was employed by IBM prior to the Spin-Off, his executive role and compensationstructure with us will differ in many respects from his most recent positions with IBM. We have adoptedand will continue to develop our own compensation plan and program and anticipate that Mr. Sebold willbe covered by these programs following the Spin-Off.
Mr. Sebold’s annual base salary is $666,667, and Mr. Sebold is eligible to receive a transaction bonusequal to $833,333 no later than February 1, 2022, subject to the successful completion of the Spin-Off byDecember 31, 2021 and Mr. Sebold remaining an active employee through such date. If the Spin-Off is notcompleted by December 31, 2021, IBM’s Chief Executive Officer may, in his discretion, decide to pay thebonus in full or in part, and such payment will be made no later than February 1, 2022, so long as Mr. Seboldis an active employee of IBM or Kyndryl on such payment date.
Mr. Sebold also received a PSU award on May 3, 2021, with a planned value of $1,000,000. The PSUaward will become eligible to vest upon: (i) successful completion of the Spin-Off as envisaged by no laterthan January 1, 2023, and (ii) immediately following the closing of the Spin-Off, Mr. Sebold acceptsemployment with us as General Counsel. If the performance criteria are achieved, the PSU award vests 33%on the six-month anniversary of the Spin-Off closing date, 33% on the first anniversary of the Spin-Offclosing date and 34% on the second anniversary of the Spin-Off closing date. If, other than by death ordisability described below, the performance conditions are not met for any other reason by January 1, 2023,the PSUs will be canceled. Upon Mr. Sebold’s death or disability, the PSU award will remain eligible tovest in accordance with its terms and will vest if the Spin-Off does not occur as envisaged by January 1, 2023.
Treatment of IBM Equity Awards Held by Kyndryl Employees in the Spin-Off
Treatment of IBM RSUs in the Spin-Off. In connection with the Spin-Off, each outstanding IBM RSUheld by a Kyndryl employee will be converted into an RSU in respect of Kyndryl common stock and willotherwise be subject to the same terms and conditions (including the vesting schedule), except that the numberof shares of Kyndryl common stock to which such Kyndryl RSU relates will be equal to the product(rounded up to the nearest whole number of shares in most countries) of (i) the number of shares of IBMcommon stock to which such IBM RSU related prior to the Spin-Off by (ii) a quotient obtained by dividing(a) the closing price of IBM common stock on the last trading day prior to the Spin-Off by (b) the openingprice of Kyndryl common stock on the first trading day following the Spin-Off, carried out to six decimalplaces (such quotient, the “equity award exchange ratio”).
Treatment of IBM PSUs in the Spin-Off. In connection with the Spin-Off, each outstanding IBM PSUheld by a Kyndryl employee will be converted into an RSU in respect of Kyndryl common stock subjectsolely to time-based vesting conditions and will otherwise be subject to the same terms and conditions(including the vesting schedule, but not any performance conditions), except that the number of shares ofKyndryl common stock to which such Kyndryl RSU relates will be equal to the product (rounded up to thenearest whole number of shares in most countries) of (i) the number of shares of IBM common stock to
110

which such IBM PSU related prior to the Spin-Off assuming (a) for IBM PSUs related to performanceperiods that began prior to January 1, 2021, actual achievement of the relevant performance goals as of theSpin-Off as determined by IBM’s compensation committee, or (b) for IBM PSUs related to the 2021 to2023 performance period, target-level achievement of the relevant performance goals, by (ii) the equity awardexchange ratio.
Treatment of IBM Stock Options in the Spin-Off. In connection with the Spin-Off, each outstandingIBM stock option (whether vested or unvested) held by a Kyndryl employee will be converted into a Kyndrylstock option and will otherwise be subject to the same terms and conditions (including the vesting schedule),except that: (i) the number of shares of Kyndryl common stock subject to such Kyndryl stock option willbe equal to the product (rounded down to the nearest whole number of shares) of (A) the number of sharesof IBM common stock subject to such IBM stock option prior to the Spin-Off by (B) the equity awardexchange ratio; and (ii) the per share exercise price of such Kyndryl stock option will be equal to the quotient(rounded up to the nearest whole cent) obtained by dividing (A) the per share exercise price of such IBMstock option prior to the Spin-Off by (B) the equity award exchange ratio.
Treatment of IBM Restricted Stock Awards in the Spin-Off. In connection with the Spin-Off, eachoutstanding IBM restricted stock award held by a Kyndryl employee will be converted into a Kyndrylrestricted stock award and will otherwise be subject to the same terms and conditions (including theapplicable vesting schedule) after the Spin-Off, except that the number of shares of Kyndryl common stockto which such Kyndryl restricted stock award relates will be equal to the product (rounded up to thenearest whole number of shares in most countries) of (i) the number of shares of IBM common stock towhich such IBM restricted stock award related prior to the Spin-Off by (ii) the equity award exchange ratio.Following the Spin-Off, Kyndryl will be responsible for the payment or settlement of any accrued dividendswith respect to IBM restricted stock awards (or the Kyndryl restricted stock awards into which they wereconverted) held by Kyndryl employees, in accordance with the terms of the applicable IBM restrictedstock award.
Treatment of IBM Employees Stock Purchase Plan in the Spin-Off. In connection with the Spin-Off,Kyndryl employees who participate in the IBM’s employees stock purchase plan (“ESPP”) will not beeligible to participate in any future offering periods that begin following the employee’s transfer date andany cash remaining in IBM’s ESPP account for any Kyndryl employee after the employee’s transfer date willbe refunded to such employee without interest as soon as practicable.
Kyndryl Excess Plan
In connection with the Spin-Off, we will adopt the Kyndryl Excess Plan (the “Excess Plan”), anonqualified deferred compensation plan that, starting in 2022, offers eligible employees an opportunity todefer up to 80% of their eligible compensation (including base and performance pay, but not any non-recurringcompensation) in excess of the limits imposed by the Code under the Kyndryl 401(k) Plan. Employees areeligible to participate in the Excess Plan if they (i) are hired as an executive or promoted to an executiveposition by Kyndryl after September 1, 2021 or (ii) directly transferred from IBM to Kyndryl and either(a) made elective deferrals under IBM’s excess plan for the 2021 plan year or (b) were hired as an executiveby IBM between November 15, 2020 and September 1, 2021. For eligible employees that transferred fromIBM, we will make an annual contribution to the Excess Plan equal to 6% of the eligible pay in excess ofthe limits under the Code, but will not make any contributions to the Excess Plan for new hires. With respectto participants in IBM’s excess plan who become participants in the Excess Plan in 2021, the applicabledeferral elections and automatic and matching contributions that would have applied under IBM’s excessplan for the remainder of 2021 will instead apply to the Excess Plan. However, the Excess Plan will not providefor matching contributions commencing in 2022. Distributions are made based following death (in a lumpsum) or following a separation from service (in a lump sum or installments, based on the employee’sdistribution election), subject to certain exceptions for compliance with Section 409A of the Code.
2021 Long-Term Performance Plan
Prior to the Spin-Off, we expect our Board to adopt, and IBM, as our sole stockholder, to approve, the2021 Long-Term Performance Plan of Kyndryl and its Affiliates (the “Equity Plan”) for the benefit of certain
111

of our current and future employees. The following summary describes what we anticipate to be thematerial terms of the Equity Plan.
When approved by IBM, as our sole stockholder, and our Board, the full text of the Equity Plan willbe filed with the SEC, and the following discussion is qualified in its entirety by reference to such text.
Purpose of the Equity Plan. The Equity Plan will be designed to attract, motivate and retain certain ofour employees and other individuals providing services to us. These objectives will be accomplished by makinglong-term incentives and other awards under the Equity Plan, thereby providing participants with aproprietary interest in our growth and performance.
Shares Available for Awards. If the Equity Plan is approved by IBM, as our sole stockholder, and ourBoard, it is expected that the maximum aggregate number of shares of our common stock that may beissued under all stock-based awards granted under the Equity Plan would be 22,400,000 (which includes anyIBM awards that are assumed in connection with the Spin-Off ) plus any other awards or shares that areassumed by us in connection with an acquisition of a company. In addition, it is expected that the Equity Planwill contain a limit on the number of shares of our common stock available for grant in the form ofincentive stock options and a limit on the maximum aggregate value of shares of our common stock thatmay be issued under all stock-based awards to non-employee directors. Non-employee directors may notreceive awards in any fiscal year with a value (together with any cash fees) in excess of $750,000.
Under the Equity Plan, it is expected that we will have the flexibility to grant different types of equitycompensation awards, including stock options, stock appreciation rights, restricted stock, restrictedstock units, cash awards and other awards based, in whole or in part, on the value of our common stock.The grant, vesting, exercise and settlement of awards granted under the Equity Plan may be subject to thesatisfaction of time- or performance-based conditions, as determined at or after the date of grant of an awardunder the Equity Plan. However, awards may not vest prior to the first anniversary of the date of grant,other than awards (i) that are accelerated by our Compensation Committee in connection with a terminationof employment or due to a change in control, (ii) with respect to 5% or less of the total shares of commonstock available for awards under the Equity Plan, (iii) made to non-employee directors that occur in connectionwith our annual meeting of stockholders (which may vest on the earlier of the one-year anniversary of thedate of grant or the date of our next annual meeting of stockholders which is at least 50 weeks after theimmediately preceding year’s annual meeting) or (iv) granted in connection with the assumption of awardsof an acquired company that were scheduled to vest within the one-year minimum vesting period.
In the event of any corporate merger, consolidation, acquisition of property or stock, separation,reorganization or liquidation, the Compensation Committee will be authorized to issue or assume stockoptions, whether or not in a transaction to which Code section 424(a) applies, by means of substitution ofnew stock options for previously issued stock options or an assumption of previously issued stock options. Insuch event, the aggregate number of shares of common stock available for issuance under the Equity Planwill be increased to reflect such substitution or assumption.
In the event of any change in our outstanding capital stock by reason of a stock split, stock dividend,combination or reclassification of shares, recapitalization, merger, or similar event, it is expected that ourCompensation Committee may adjust proportionately: (a) the number of shares of our common stock(i) available for issuance under the Equity Plan, (ii) available for issuance under incentive stock options,(iii) for which awards may be granted to an individual participant and (iv) covered by outstanding awardsdenominated in stock or units of stock; (b) the exercise and grant prices related to outstanding awards; and(c) the appropriate fair market value and other price determinations for such awards. Notwithstandingthe foregoing, in the event of any change in our outstanding capital stock by reason of a stock split or areverse stock split, the above-referenced proportionate adjustments, if applicable, will be mandatory. In theevent of any other change affecting our capital stock or any distribution (other than normal cash dividends) toholders of our capital stock, such adjustments in the number and kind of shares and the exercise, grantand conversion prices of the affected awards as may be deemed equitable by our Compensation Committee,including adjustments to avoid fractional shares, will be made to give proper effect to such event.
It is expected that shares covered by awards that either wholly or in part are not earned, or that expireor are forfeited, terminated, canceled, settled in cash, payable solely in cash or exchanged for other awards,
112

will be available for future issuance under awards. However, shares tendered to or withheld by us inconnection with the exercise of stock options or stock appreciation rights, or the payment of tax withholdingon any award, will not be available for future issuance under awards.
Eligibility. It is expected that our non-employee directors, current and prospective employees or serviceproviders and current and prospective employees or service providers of our affiliates would be eligible toreceive awards under the Equity Plan.
Administration. It is expected that our Compensation Committee would have full power to selectparticipants, to interpret the Equity Plan, to grant waivers of award restrictions, to continue, accelerate orsuspend exercisability, vesting or payment of an award and to adopt such rules, regulations and guidelines forcarrying out the Equity Plan as it may deem necessary or proper. These powers are expected to include,but would not be limited to, the adoption of modifications, amendments, procedures, subplans and the likeas necessary to comply with provisions of the laws and regulations of the countries in which we operatein order to assure the viability of awards granted under the Equity Plan and to enable participants, regardlessof where employed, to receive advantages and benefits under the Equity Plan and such laws and regulations.Our Compensation Committee would be able to delegate to our officers, its duties, power and authorityunder the Equity Plan pursuant to such conditions or limitations as our Compensation Committee mayestablish, except that only our Compensation Committee or our Board would be able to select, and grantawards to, participants who are subject to Section 16 of the Exchange Act.
Effect of a Change in Control on Awards. Except as otherwise provided in an award agreement or anyother agreement between a participant and us or any of our affiliates, in the event of a change in control,notwithstanding any provision of the Equity Plan to the contrary: (i) if the acquirer or successor companyin such change in control has agreed to provide for the substitution, assumption, exchange or othercontinuation of awards granted pursuant to the Equity Plan, then, if the participant’s employment with orservice to the Company or an affiliate is terminated by the Company or affiliate without cause (and other thandue to death or disability) on or within 24 months following a change in control, then unless otherwiseprovided by the Compensation Committee, all options and stock appreciation rights held by such participantwill become immediately exercisable with respect to 100% of the shares subject to such options and stockappreciation rights, and that the restricted period (and any other conditions) will expire immediately withrespect to 100% of the shares of restricted stock and restricted stock units and any other awards (other thanother cash-based award) held by such participant (including a waiver of any applicable performanceconditions); provided that if the vesting or exercisability of any award would otherwise be subject to theachievement of performance conditions, the portion of such award that will become fully vested andimmediately exercisable will be based on the assumed achievement of actual or target performance asdetermined by the Compensation Committee; (ii) if the acquirer or successor company in such change incontrol has not agreed to provide for the substitution, assumption, exchange or other continuation of awardsgranted pursuant to the Equity Plan, then unless otherwise provided by the Compensation Committee, allstock options and stock appreciation rights held by such participant will become immediately exercisable withrespect to 100% of the shares subject to such stock options and stock appreciation rights, and the restrictedperiod (and any other conditions) will expire immediately with respect to 100% of the shares of restrictedstock and restricted stock units and any other awards (other than other cash-based award) held by suchparticipant (including a waiver of any applicable performance conditions); provided that if the vesting orexercisability of any award would otherwise be subject to the achievement of performance conditions, theportion of such award that will become fully vested and immediately exercisable will be based on the assumedachievement of actual or target performance as determined by the Compensation Committee; and (iii) theCompensation Committee may upon at least 10 days’ advance notice to the affected participants, cancel anyoutstanding award and pay to the holders thereof, in cash, securities or other property (including of theacquiring or successor company), or any combination thereof, the value of such awards based upon the priceper share received or to be received by other stockholders of the company in the event (it being understoodthat any stock option or stock appreciation right having a per-share exercise or hurdle price equal to, orin excess of, the fair market value (as of the date specified by the Compensation Committee) of a share subjectthereto may be canceled and terminated without any payment or consideration therefor). Notwithstandingthe above, the Compensation Committee will exercise such discretion over the timing of settlement of anyaward subject to Code Section 409A at the time such award is granted. To the extent practicable, these
113

provisions will occur in a manner and at a time that allows affected participants the ability to participate inthe change in control transaction with respect to the shares subject to their awards.
Additional Compensation-Related Policies
We expect to maintain share ownership requirements for our senior executives. These requirements areintended to reduce risk by aligning the economic interests of executives with those of our shareowners. Wealso expect to maintain a comprehensive policy on recoupment that applies to both annual and long-termincentive compensation. The policy will allow us to claw back compensation in certain circumstances.
114

SECURITY OWNERSHIP OF CERTAIN BENEFICIAL OWNERS AND MANAGEMENT
As of the date of this Information Statement, IBM beneficially owns all of the outstanding shares ofour common stock. After the Spin-Off, IBM will continue to own 19.9% of the shares of our commonstock. The following table provides information regarding the anticipated beneficial ownership of ourcommon stock at the time of the Distribution by:
• each of our directors;
• each of our named executive officers;
• all of our directors and executive officers as a group; and
• each of our stockholders whom we believe (based on the assumptions described below) willbeneficially own more than 5% of our outstanding common stock.
Except as otherwise noted below, we based the share amounts on each person’s beneficial ownership ofIBM common stock on September 30, 2021, giving effect to a Distribution ratio of one share of our commonstock for every five shares of IBM common stock. We also assume that IBM will retain 19.9% of ourcommon stock.
Except as otherwise noted in the footnotes below, each person or entity identified in the table has solevoting and investment power with respect to the securities beneficially owned.
Immediately following the Spin-Off, we estimate that 223,920,187 shares of our common stock will beissued and outstanding, based on the approximately 896,800,350 shares of IBM common stock outstandingon September 30, 2021 and the number of shares retained by IBM. The actual number of shares of ourcommon stock that will be outstanding following the completion of the Spin-Off will be determined onNovember 3, 2021.
115

Amount and Nature ofBeneficial Ownership Percentage of Class
Directors and Executive OfficersMartin Schroeter . . . . . . . . . . . . . . . . . . . . . . . . . . . . . . . . . . . . 8,960 *David Wyshner(1) . . . . . . . . . . . . . . . . . . . . . . . . . . . . . . . . . . . . 48 *Elly Keinan . . . . . . . . . . . . . . . . . . . . . . . . . . . . . . . . . . . . . . . . 889 *Maryjo Charbonnier . . . . . . . . . . . . . . . . . . . . . . . . . . . . . . . . . . — —Edward Sebold . . . . . . . . . . . . . . . . . . . . . . . . . . . . . . . . . . . . . . 237 *Dominic J. Caruso . . . . . . . . . . . . . . . . . . . . . . . . . . . . . . . . . . . — —John D. Harris II(2) . . . . . . . . . . . . . . . . . . . . . . . . . . . . . . . . . . . 56 *Stephen A. M. Hester . . . . . . . . . . . . . . . . . . . . . . . . . . . . . . . . . — —Shirley Ann Jackson . . . . . . . . . . . . . . . . . . . . . . . . . . . . . . . . . . 6,725 *Janina Kugel . . . . . . . . . . . . . . . . . . . . . . . . . . . . . . . . . . . . . . . — —Denis Machuel . . . . . . . . . . . . . . . . . . . . . . . . . . . . . . . . . . . . . . — —Rahul N. Merchant . . . . . . . . . . . . . . . . . . . . . . . . . . . . . . . . . . . — —Jana Schreuder . . . . . . . . . . . . . . . . . . . . . . . . . . . . . . . . . . . . . . — —Howard I. Ungerleider . . . . . . . . . . . . . . . . . . . . . . . . . . . . . . . . — —
Directors and Executive Officers as a group . . . . . . . . . . . . . . . . . . 16,915 *Principal Stockholders:International Business Machines Corporation . . . . . . . . . . . . . . . .
One New Orchard RoadArmonk, NY 10504
44,560,117 19.9%
The Vanguard Group(3) . . . . . . . . . . . . . . . . . . . . . . . . . . . . . . 14,761,278 6.6%100 Vanguard Blvd.Malvern, PA 19355
BlackRock, Inc.(4) . . . . . . . . . . . . . . . . . . . . . . . . . . . . . . . . . . 12,454,254 5.6%55 East 52nd StreetNew York, NY 10055
State Street Financial Corporation(5) . . . . . . . . . . . . . . . . . . . . . 10,388,371 4.6%State Street Financial CenterOne Lincoln StreetBoston, MA 02111
* Less than 1%.(1) Mr. Wyshner’s holdings include 48 shares of common stock in which voting and investment power are
shared.(2) Mr. Harris’ holdings include 56 shares in which voting and investment power are shared.(3) Based on the Schedule 13G/A filed with the SEC on February 10, 2021 by The Vanguard Group and
certain subsidiaries (“Vanguard”) with respect to IBM common stock. Vanguard reported that it had solevoting power over 1,453,904 shares of IBM common stock, shared voting power over 69,861,037shares of common stock, sole dispositive power over 3,945,354 shares of IBM common stock, andshared dispositive power over 73,806,391 shares of IBM common stock.
(4) Based on the Schedule 13G/A filed with the SEC on January 29, 2021 by BlackRock, Inc. and certainsubsidiaries (“BlackRock”) with respect to IBM common stock. BlackRock reported that it had solevoting power over 53,281,831 shares of IBM common stock and sole dispositive power over 62,271,273shares of IBM common stock.
(5) Based on the Schedule 13G/A filed with the SEC on February 12, 2021 by State Street Corporationand certain subsidiaries (“State Street”) with respect to IBM common stock. State Street reported thatit had shared voting power over 42,096,957 shares of common stock and shared dispositive powerover 51,941,856 shares of IBM common stock.
116

CERTAIN RELATIONSHIPS AND RELATED PARTY TRANSACTIONS
Agreements with IBM
In order to govern the ongoing relationships between us and IBM after the Spin-Off and to facilitatean orderly transition, we and IBM intend to enter into agreements providing for various services and rightsfollowing the Spin-Off, and under which we and IBM will agree to indemnify each other against certainliabilities arising from our respective businesses. The following summarizes the terms of the materialagreements we expect to enter into with IBM.
Separation and Distribution Agreement
We intend to enter into a Separation and Distribution Agreement with IBM before the Distribution.The Separation and Distribution Agreement will set forth our agreements with IBM regarding the principalactions to be taken in connection with the Spin-Off. It will also set forth other agreements that governaspects of our relationship with IBM following the Spin-Off.
Transfer of Assets and Assumption of Liabilities
The Separation and Distribution Agreement will identify certain transfers of assets and assumptions ofliabilities that are necessary in advance of our separation from IBM so that we and IBM retain the assets of,and the liabilities associated with, our respective businesses. The Separation and Distribution Agreementgenerally provides that the assets comprising our business will consist of those exclusively related to ourcurrent business and operations (except for intellectual property assets, which are allocated as further describedin “— Agreements Governing Intellectual Property”) or otherwise allocated to the business through aprocess of dividing shared assets. The liabilities we will assume in connection with the Spin-Off will generallyconsist of those related to the assets comprising our business or to the past and future operations of ourbusiness, including our locations used in our current operations. The Separation and Distribution Agreementwill also provide for the settlement or extinguishment of certain liabilities and other obligations between usand IBM.
Reorganization Transactions
The Separation and Distribution Agreement will describe certain actions related to our separationfrom IBM that will occur prior to the Distribution such as the formation of our subsidiaries and certainother internal restructuring actions to be taken by us and IBM, including the contribution by IBM to us ofthe assets and liabilities that comprise our business.
Intercompany Arrangements
All agreements, arrangements, commitments and understandings, including most intercompanyaccounts payable or accounts receivable, between us, on the one hand, and IBM, on the other hand, willterminate and/or be repaid effective as of the Distribution Date or shortly thereafter, except specifiedagreements and arrangements that are intended to survive the Distribution.
Credit Support
We will agree to use reasonable best efforts to arrange, on or prior to the Distribution, for thereplacement of all guarantees, covenants, indemnities, surety bonds, letters of credit or similar assurances ofcredit support, other than certain specified credit support instruments, currently provided by or throughIBM or any of its subsidiaries for the benefit of us or any of our subsidiaries.
Representations and Warranties
In general, neither we nor IBM will make any representations or warranties regarding any assets orliabilities transferred or assumed, any consents or approvals that may be required in connection with thesetransfers or assumptions, the value or freedom from any lien or other security interest of any assets transferred,the absence of any defenses relating to any claim of either party or the legal sufficiency of any conveyance
117

documents. Except as expressly set forth in the Separation and Distribution Agreement, all assets will betransferred on an “as-is,” “where-is” basis.
Further Assurances
The parties will use reasonable best efforts to effect any transfers contemplated by the Separation andDistribution Agreement that have not been consummated prior to the Distribution. In addition, the partieswill use reasonable best efforts to effect any transfer or re-transfer of any asset or liability that wasimproperly transferred or retained.
The Distribution
The Separation and Distribution Agreement will govern IBM’s and our respective rights and obligationsregarding the proposed Distribution. On or prior to the Distribution Date, IBM will deliver 80.1% of theissued and outstanding shares of our common stock to the distribution agent. On or as soon as practicablefollowing the Distribution Date, the distribution agent will electronically deliver the shares of our commonstock to IBM stockholders based on the distribution ratio. The IBM Board may, in its sole and absolutediscretion, determine the Record Date, the Distribution Date and the terms of the Spin-Off, including theamount of the shares of our common stock it may retain. In addition, IBM may, at any time until theDistribution, decide to abandon the Distribution or modify or change the terms of the Distribution.
Conditions
The Separation and Distribution Agreement will also provide that several conditions must be satisfiedor, to the extent permitted by law, waived by IBM, in its sole and absolute discretion, before the Distributioncan occur. For further information about these conditions, see “The Spin-Off — Conditions to the Spin-Off.”
Exchange of Information
We and IBM will agree to provide each other with information reasonably necessary to comply withreporting, disclosure, filing or other requirements of any national securities exchange or governmentalauthority, for use in judicial, regulatory, administrative and other proceedings and to satisfy audit, accounting,litigation and other similar requests. We and IBM will also agree to use reasonable best efforts to retainsuch information in accordance with our respective record retention policies applicable to our own informationor such longer period as required by law. Each party will also agree to use its reasonable best efforts toassist the other with its financial reporting and audit obligations.
Termination
The IBM Board, in its sole and absolute discretion, may terminate the Separation and DistributionAgreement at any time prior to the Distribution.
Release of Claims
We and IBM will each agree to release the other and its affiliates, successors and assigns, and allpersons that prior to the Distribution have been the other’s stockholders, directors, officers, members,agents and employees, and their respective heirs, executors, administrators, successors and assigns, from anyand all liabilities that such party is taking on in connection with the Spin-Off, whether at law or in equity(including any right of contribution), whether arising under any contract, by operation of law or otherwise,existing or arising from any acts or events occurring, or failing to occur, or alleged to have occurred, or tohave failed to occur, or any conditions existing or alleged to have existed on or before the Distribution,including in connection with the Spin-Off and all other activities to implement the Spin-Off. These releaseswill be subject to exceptions set forth in the Separation and Distribution Agreement.
Indemnification
We and IBM will each agree to indemnify the other and each of the other’s current and formerdirectors, officers and employees, and each of the heirs, executors, successors and assigns of any of them,
118

against certain liabilities incurred in connection with the Spin-Off and our and IBM’s respective businesses.The amount of either IBM’s or our indemnification obligations will be reduced by any net insuranceproceeds the party being indemnified receives. The Separation and Distribution Agreement will also specifyprocedures regarding claims subject to indemnification.
Transition Services Agreement
We intend to enter into a Transition Services Agreement pursuant to which IBM will provide us withcertain specified services for a limited time to ensure an orderly transition following the Distribution. Theservices IBM will provide predominately consist of information technology services, among others. Theservices are generally intended to be provided for a period no longer than two years following the Distribution.Each party may terminate the agreement in its entirety in the event of a material breach of the agreementby the other party that is not cured within a specified time period. We may also terminate the services on anindividual basis upon prior written notice to IBM, provided that a partial termination of a service willrequire mutual agreement between us and IBM.
The Transition Services Agreement will provide for customary indemnification and limits on liability.
Given the short-term nature of the Transition Services Agreement, we are in the process of increasing ourinternal capabilities to eliminate reliance on IBM for the transition services it will provide us as quickly aspossible following the Spin-Off.
Tax Matters Agreement
We intend to enter into a Tax Matters Agreement with IBM that will govern the respective rights,responsibilities and obligations of IBM and us after the Distribution with respect to all tax matters(including tax liabilities, tax attributes, tax returns and tax contests).
The Tax Matters Agreement will generally provide that we will be responsible and will indemnify IBMfor all taxes, including income taxes, sales taxes, VAT and payroll taxes, relating to the Business for all periodsfollowing the Distribution; IBM will be responsible and will indemnify us for all taxes relating to theBusiness for all periods preceding the Distribution, except as otherwise provided in the Tax MattersAgreement. In addition, the Tax Matters Agreement will address the allocation of liability for taxes that areincurred as a result of restructuring activities undertaken to effectuate the Spin-Off.
In addition, the Tax Matters Agreement will provide that we will be required to indemnify IBM for anytaxes (and reasonable expenses) resulting from the failure of the Spin-Off and related internal transactionsto qualify for their intended tax treatment under U.S. federal, state and local income tax law, as well as foreigntax law, where such taxes result from (a) breaches of covenants and representations we make and agree toin connection with the Spin-Off, (b) the application of certain provisions of U.S. federal income tax law to thethese transactions or (c) any other action or omission (other than actions expressly required or permittedby the Separation and Distribution Agreement, the Tax Matters Agreement or other ancillary agreements)we take after the Distribution that gives rise to these taxes. IBM will have the exclusive right to control theconduct of any audit or contest relating to these taxes, but we will have the right to review and commenton IBM’s conduct of any such audit or contest, to the extent that we could be liable for taxes under the TaxMatters Agreement as a result of such audit or contest.
The Tax Matters Agreement will impose certain restrictions on us and our subsidiaries (includingrestrictions on share issuances, redemptions or repurchases, mergers or other business combinations, salesof assets and similar transactions) that will be designed to address compliance with Section 355 and relatedprovisions of the Code, as well as state, local and foreign tax law, and are intended to preserve the tax-freenature of the Spin-Off and related transactions. Under the Tax Matters Agreement, these restrictions willapply for two years following the Distribution, unless IBM obtains a private letter ruling from the IRS or weobtain an opinion of counsel, in each case acceptable to IBM in its discretion, that the restricted actionwould not impact the non-recognition treatment of the Spin-Off or other transaction, or unless IBMotherwise gives its consent for us to take a restricted action in its discretion. Even if such a private letter rulingor opinion is obtained, or IBM does otherwise consent to our taking an otherwise restricted action, we willremain liable to indemnify IBM in the event such restricted action gives rise to an otherwise indemnifiable
119

liability. These restrictions may limit our ability to pursue strategic transactions or engage in new businessesor other transactions that may maximize the value of our business, and might discourage or delay astrategic transaction that our stockholders may consider favorable.
Employee Matters Agreement
We intend to enter into an Employee Matters Agreement with IBM that will address employment andemployee compensation and benefits matters. The Employee Matters Agreement will address the allocationand treatment of assets and liabilities relating to employees and compensation and benefit plans andprograms in which our employees participated prior to the Spin-Off. Except as specifically provided in theEmployee Matters Agreement, we will generally be responsible for all employment and employeecompensation and benefits-related liabilities relating to our employees, former employees and other serviceproviders. In particular, we will assume certain assets and liabilities with respect to our current employeesunder certain of IBM’s non-U.S. defined benefit pension plans (with assets and liabilities allocated basedon formulas specified in the Employee Matters Agreement for each pension plan). Generally, except as maybe provided in a transition services agreement, each of our employees will cease active participation inIBM compensation and benefit plans as of the Spin-Off. The Employee Matters Agreement also providesthat we will establish certain compensation and benefit plans for the benefit of our employees following theSpin-Off, including a 401(k) savings plan, which will accept direct rollovers of account balances from theIBM 401(k) savings plan for any of our employees who elects to do so. Generally, following the Spin-Off, wewill assume and be responsible for any annual bonus payments, including with respect to the year in whichthe Spin-Off occurs, and any other cash-based incentive or retention awards to our current and formeremployees. The Employee Matters Agreement incorporates the indemnification provisions contained inthe Separation and Distribution Agreement. In addition, the Employee Matters Agreement provides thatwe will indemnify IBM for certain employee-related liabilities associated with the failure to establish benefitplans or in connection with joint-employer liability claims by our employees.
Agreements Governing Intellectual Property
Allocation of Intellectual Property
The agreements we will enter into with IBM governing intellectual property will provide for (i) us toown certain specified patents and patent applications, trademarks, domain names, copyrights in proprietarysoftware and documentation, database rights and certain other intellectual property rights solely developedby or exclusively related to the Business and (ii) IBM to retain any of its other intellectual property rightsrelated to the Business. Intellectual property rights will generally be allocated to us if those rights weresolely developed by the Business (including with respect to software, database rights and certain othertechnologies) or are exclusively related to the Business. Any intellectual property and technologies that arenot allocated to us will be retained by IBM.
Intellectual Property Agreement
We intend to enter into an Intellectual Property Agreement with IBM, pursuant to which IBM willgrant to us perpetual and irrevocable, non-exclusive, royalty-free licenses to certain proprietary software anddocumentation, databases, trade secrets, and certain other intellectual property rights (excluding patentsand trademarks) that are used in the Business but are being retained by IBM. The foregoing license excludesIBM’s commercial software, which will be subject to IBM’s standard commercial terms if we choose to useit in the Business. Additionally, we will grant to IBM perpetual and irrevocable, non-exclusive, royalty-freelicenses to certain proprietary software and documentation, databases, trade secrets, and certain otherintellectual property rights (excluding patents and trademarks) that are allocated to us (other than certainrestricted software and research assets, to which IBM will be granted limited or no rights).
The field of use for the licenses granted to us will generally be the Business as conducted immediatelyprior to the Spin-Off, with natural extensions and evolutions. The field of use for the licenses granted toIBM will generally be all businesses, operations, products and services. The licenses will generally betransferable with any sale or transfer of an entity or line of business that utilizes the relevant intellectualproperty, and the transferred license will be limited to the business, products and services as conducted bythe transferred entity or line of business as of the date of the transfer, with natural extensions and evolutions.
120

In addition, pursuant to the Intellectual Property Agreement, we will be permitted to continue usingcertain of IBM’s trademarks, trade names and service marks with respect to the “IBM” brands in connectionwith certain limited transitional uses. The permitted transitional uses will generally not exceed one totwo years. The Intellectual Property Agreement will also provide that we will use commercially reasonableefforts to cease using such IBM trademarks as soon as reasonably practicable.
Other Intellectual Property Arrangements
We intend to enter into a patent cross license agreement with IBM, pursuant to which we will grant toIBM, and IBM will grant to us, a non-exclusive, worldwide, fully paid-up license to our respective patentportfolios as of the Spin-Off. The license will continue until the expiration of the last to expire of the licensedpatents, unless earlier terminated (as described below). IBM will also separately be licensed under anypatents issuing from applications we file based on invention disclosures assigned to us in the Spin-Off.
The field of our license to IBM’s patent portfolio will generally cover information handling systems(subject to certain exclusions related to quantum systems, IBM’s System z servers, integrated circuits andsemiconductor fabrication) and the performance of services, including services for information handlingsystems. The field of IBM’s license to our patent portfolio will generally cover information handling systemsand the performance of services, including services for information handling systems. Both licenses willinclude certain rights to extend new licenses to divested entities or in connection with divested product orservice lines, subject to certain limitations on the volume of licensed products and services under the newlicense and rights of the licensor party to terminate the new license if the counterparty asserts any patentinfringement claim against the licensor, its subsidiaries or any of their customers or distributors. Inaddition, such new license does not include the right to engage in further divestitures. The licenses under thepatent cross license agreement are also transferable if a party is acquired and becomes a subsidiary of athird party, but the transferred license is limited to only licensed products and services of the acquired partyimmediately prior to the acquisition and may also be terminated by the non-acquired party if the acquireror its affiliates asserts any claim of patent infringement against the non-acquired party, its subsidiaries or theirrespective customers or distributors. If either party to the patent cross license agreement is acquired by athird party such that it is no longer a separate legal entity, the license to that party will terminate as of thedate of such acquisition.
In addition, we will be granted licenses under certain of IBM’s patent cross-license agreements withthird parties that have been identified as being relevant to the Business, and IBM will work together with usto extend us rights under these agreements to the extent permitted thereunder.
We also intend to enter into a research master collaboration agreement with IBM, setting forth thegeneral terms and conditions applicable to certain, to be determined, joint research projects between us andIBM’s Research Division.
Real Estate Matters Agreement
We intend to enter into a Real Estate Matters Agreement with IBM that will govern the allocation andtransfer of real estate between IBM and Kyndryl and the colocation of IBM and Kyndryl following the Spin-Off. Real estate assets will be predominantly allocated such that properties with greater than 50% occupancyby one company will be allocated in full to such company and the non-majority company will move toanother location, except that the non-majority company will not be required to vacate earlier than theexpiration date of any applicable lease or sublease entered into pursuant to the Real Estate Matters Agreement(the “Allocation Principles”). Certain sites will need to be transferred from one company to the other toensure conformity with the Allocation Principles. Certain sites will be occupied by both IBM and Kyndrylemployees following the spin-off pursuant to a lease, occupancy agreement or sublease. IBM will bear all costsrelating to (i) the transfer of owned real property (e.g., transfer taxes and recording fees), (ii) the transferof leased real property (e.g., the costs of obtaining consents) and (ii) except as stated otherwise in theapplicable lease form, sublease form or split lease, any alterations or improvements reasonably required toseparate IBM from Kyndryl employees with respect to all properties.
121

Stockholder and Registration Rights Agreement
We intend to enter into a Stockholder and Registration Rights Agreement with IBM pursuant to whichwe will agree that, upon the request of IBM, subject to certain limitations, we will use our reasonable bestefforts to effect the registration under applicable federal or state securities laws of any shares of our commonstock retained by IBM. If we intend to file on our behalf or on behalf of any of our other security holdersa registration statement in connection with a public offering of any of our securities in a manner that wouldpermit the registration for offer and sale of our common stock held by IBM, IBM will have the right toinclude its shares of our common stock in that offering.
We will be generally responsible for all registration expenses in connection with the performance of ourobligations under the registration rights provisions in the agreement, and IBM will be responsible for its owninternal fees and expenses, any applicable underwriting discounts or commissions and any stock transfertaxes. The agreement will also contain customary indemnification and contribution provisions by us for thebenefit of IBM and, in limited situations, by IBM for the benefit of us with respect to the informationprovided by IBM included in any registration statement, prospectus or related document.
If IBM transfers shares covered by the agreement, it will be able to transfer the benefits of theStockholder’s and Registration Rights Agreement to transferees of 5% or more of the shares of ourcommon stock outstanding immediately following the Distribution, provided that each transferee agrees tobe bound by the terms of the Stockholder and Registration Rights Agreement.
In addition, IBM will agree to vote any shares of our common stock that it retains immediately afterthe Distribution in proportion to the votes cast by our other stockholders. In connection with such agreement,IBM will grant us a proxy to vote its shares of our retained common stock in such proportion. As a result,IBM will not be able to exert any control over us through the shares of our common stock it retains. Any suchproxy, however, will be automatically revoked as to a particular share upon any sale or transfer of suchshare from IBM to a person other than IBM, and neither the Stockholder and Registration Rights Agreementnor proxy will limit or prohibit any such sale or transfer.
Other Arrangements
We intend to enter into a number of commercial agreements with IBM on arm’s length terms, pursuantto which (i) we will purchase from IBM its branded and related hardware, software, and services for use inthe delivery of services arrangements with our customers and (ii) we will provide services to IBM, includingrelated to hosting data centers and servicing IBM’s information infrastructure. We have historicallyincurred costs (including their associated depreciation and amortization) for our purchases of IBM’sbranded and related hardware, software, and services of $3,227 million, $3,094 million, and $3,619 millionfor the years ended December 31, 2020, 2019 and 2018, respectively, and received revenue for the services weprovided to IBM of $645 million, $613 million and $623 million for the years ended December 31, 2020,2019 and 2018, respectively.
Policy and Procedures Governing Related Party Transactions
Prior to the completion of the Spin-Off, our Board will adopt a written policy regarding the reviewand approval of transactions with related persons. We anticipate that this policy will provide that ourindependent directors as a group or a committee comprised solely of independent directors review each ofour transactions involving an amount exceeding $120,000 and in which any “related person” had, has or willhave a direct or indirect material interest, subject to certain specified exceptions. In general, “relatedpersons” are our directors, director nominees, executive officers and stockholders beneficially owning morethan 5% of our outstanding common stock and immediate family members or certain other designatedpersons.
From time to time, Kyndryl may have employees who are related to our executive officers or directors.The daughter of Mr. Keinan (our Group President), who is currently an IBM employee, will transfer toKyndryl, to hold a non-executive position. She is expected to receive compensation between $120,000-150,000 in 2021 (annualized). Her compensation and other terms of employment are determined on a basisconsistent with Kyndryl’s human resources policies and industry practices.
122

MATERIAL U.S. FEDERAL INCOME TAX CONSEQUENCES OF THE SPIN-OFF
Consequences to U.S. Holders of IBM Common Stock
The following is a summary of the material U.S. federal income tax consequences to holders of IBMcommon stock in connection with the Distribution. This summary is based on the Code, the TreasuryRegulations promulgated under the Code and judicial and administrative interpretations of those laws, ineach case as in effect and available as of the date of this Information Statement and all of which are subjectto change at any time, possibly with retroactive effect. Any such change could affect the tax consequencesdescribed below.
This summary is limited to holders of IBM common stock that are U.S. Holders, as defined immediatelybelow, that hold their IBM common stock as a capital asset. A “U.S. Holder” is a beneficial owner of IBMcommon stock that is, for U.S. federal income tax purposes:
• an individual who is a citizen or a resident of the United States;
• a corporation, or other entity taxable as a corporation for U.S. federal income tax purposes, createdor organized under the laws of the United States or any state thereof or the District of Columbia;
• an estate the income of which is subject to U.S. federal income taxation regardless of its source; or
• a trust if (1) a court within the United States is able to exercise primary jurisdiction over itsadministration and one or more U.S. persons have the authority to control all of its substantialdecisions or (2) in the case of a trust that was treated as a domestic trust under law in effect before1997, a valid election is in place under applicable Treasury Regulations.
This summary is for general information only and is not tax advice. It does not discuss all taxconsiderations that may be relevant to stockholders in light of their particular circumstances, nor does itaddress the consequences to stockholders subject to special treatment under the U.S. federal income tax laws,such as:
• dealers or traders in securities or currencies;
• tax-exempt entities;
• banks, financial institutions or insurance companies;
• real estate investment trusts, regulated investment companies or grantor trusts;
• persons who acquired IBM common stock pursuant to the exercise of employee stock options orotherwise as compensation;
• stockholders who own, or are deemed to own, 10% or more, by voting power or value, of IBMequity;
• stockholders owning IBM common stock as part of a position in a straddle or as part of a hedging,conversion, synthetic security, integrated investment, constructive sale transaction or other riskreduction transaction for U.S. federal income tax purposes;
• persons who are subject to the alternative minimum tax;
• persons whose functional currency is not the U.S. Dollar;
• certain former citizens or long-term residents of the United States;
• persons who are subject to special accounting rules under Section 451(b) of the Code;
• persons who own IBM common stock through partnerships or other pass-through entities; or
• persons who hold IBM common stock through a tax-qualified retirement plan.
123

This summary is not a complete analysis or description of all potential U.S. federal income taxconsequences of the Distribution. It does not address any tax consequences arising under the Medicare taxon net investment income or the Foreign Account Tax Compliance Act (including the Treasury Regulationspromulgated thereunder and intergovernmental agreements entered into pursuant thereto or in connectiontherewith). In addition, it does not address any U.S. state or local or foreign tax consequences or anyestate, gift or other non-income tax consequences of the Distribution.
If a partnership, or any other entity treated as a partnership for U.S. federal income tax purposes,holds IBM common stock, the tax treatment of a partner in that partnership will generally depend on thestatus of the partner and the activities of the partnership. Such a partner or partnership is urged to consultits own tax advisor as to its tax consequences.
EACH HOLDER OF IBM COMMON STOCK IS URGED TO CONSULT ITS OWN TAXADVISOR WITH RESPECT TO THE U.S. FEDERAL, STATE AND LOCAL AND FOREIGN TAXCONSEQUENCES OF THE DISTRIBUTION.
General
IBM has received a private letter ruling from the IRS to the effect that, among other things, theDistribution, including the retention of 19.9% of the shares of our common stock, will qualify as atransaction that is tax-free for U.S. federal income tax purposes under Sections 355 and 368(a)(1)(D) of theCode. Completion of the Spin-Off is conditioned upon IBM’s receipt of a written opinion from Paul,Weiss, Rifkind, Wharton & Garrison LLP, counsel to IBM, to the effect that the Distribution will qualifyfor nonrecognition of gain or loss under Section 355 and related provisions of the Code. The opinion will bebased on the assumption that, among other things, the representations made, and information submitted,in connection with it are accurate. If the Distribution qualifies for this treatment and subject to thequalifications and limitations set forth herein (including the discussion below relating to the receipt of cashin lieu of fractional shares), for U.S. federal income tax purposes:
• no gain or loss will be recognized by, or be includible in the income of, a U.S. Holder as a result ofthe Distribution, except with respect to any cash received in lieu of fractional shares;
• the aggregate tax basis of the IBM common stock and our common stock held by each U.S. Holderimmediately after the Distribution will be the same as the aggregate tax basis of the IBM commonstock held by the U.S. Holder immediately before the Distribution, allocated between the IBMcommon stock and our common stock in proportion to their relative fair market values on the dateof the Distribution (subject to reduction upon the deemed sale of any fractional shares, as describedbelow); and
• the holding period of our common stock received by each U.S. Holder will include the holdingperiod of their IBM common stock, provided that such IBM common stock is held as a capital asseton the date of the Distribution.
U.S. Holders that have acquired different blocks of IBM common stock at different times or atdifferent prices are urged to consult their tax advisors regarding the allocation of their aggregate adjustedtax basis among, and the holding period of, shares of our common stock distributed with respect to suchblocks of IBM common stock.
The opinion of counsel will not address any U.S. state or local or foreign tax consequences of the Spin-Off. The opinion will assume that the Spin-Off will be completed according to the terms of the Separationand Distribution Agreement and will rely on the facts as stated in the Separation and Distribution Agreement,the Tax Matters Agreement, the other ancillary agreements, this Information Statement and a number ofother documents. In addition, the opinion will be based on certain representations as to factual matters from,and certain covenants by, IBM and us. The opinion cannot be relied on if any of the assumptions,representations or covenants is incorrect, incomplete or inaccurate or are violated in any material respect.
The opinion of counsel will not be binding on the IRS or the courts, and there can be no assurancethat the IRS or a court will not take a contrary position. If the conclusions expressed in the opinion arechallenged by the IRS, and if the IRS prevails in such challenge, the tax consequences of the Spin-Off couldbe materially less favorable.
124

If the Distribution were determined not to qualify for non-recognition of gain or loss, the aboveconsequences would not apply and each U.S. Holder who receives our common stock in the Distributionwould generally be treated as receiving a distribution in an amount equal to the fair market value of ourcommon stock received, which would generally result in:
• a taxable dividend to the U.S. Holder to the extent of that U.S. Holder’s pro rata share of IBM’scurrent or accumulated earnings and profits;
• a reduction in the U.S. Holder’s basis (but not below zero) in IBM common stock to the extent theamount received exceeds the stockholder’s share of IBM’s earnings and profits; and
• a taxable gain from the exchange of IBM common stock to the extent the amount received exceedsthe sum of the U.S. Holder’s share of IBM’s earnings and profits and the U.S. Holder’s basis in its IBMcommon stock.
Cash in Lieu of Fractional Shares
If a U.S. Holder receives cash in lieu of a fractional share of common stock as part of the Distribution,the U.S. Holder will be treated as though it first received a distribution of the fractional share in theDistribution and then sold it for the amount of cash actually received. Provided the fractional share isconsidered to be held as a capital asset on the date of the Distribution, the U.S. Holder will generally recognizecapital gain or loss measured by the difference between the cash received for such fractional share and theU.S. Holder’s tax basis in that fractional share, as determined above. Such capital gain or loss will be long-termcapital gain or loss if the U.S. Holder’s holding period for the IBM common stock is more than one yearon the date of the Distribution.
Payments of cash to U.S. Holders of IBM common stock in lieu of fractional shares of our commonstock may be subject to information reporting and backup withholding (currently, at a rate of 24 percent),unless such U.S. Holder delivers a properly completed IRS Form W-9 certifying such U.S. Holder’s correcttaxpayer identification number and certain other information, or otherwise establishes an exemption frombackup withholding. Corporations will generally be exempt from backup withholding, but may be required toprovide a certification to establish their entitlement to the exemption. Backup withholding is not anadditional tax. Amounts withheld under the backup withholding rules may be refunded or credited againsta U.S. Holder’s U.S. federal income tax liability, provided that the required information is timely furnished tothe IRS.
Information Reporting
Treasury Regulations require each IBM stockholder that, immediately before the Distribution, owned5% or more (by vote or value) of the total outstanding stock of IBM or stockholders whose basis in theirIBM common stock equals or exceeds $1,000,000 to attach to such stockholder’s U.S. federal income taxreturn for the year in which the Distribution occurs a statement setting forth certain information related to theDistribution.
Consequences to IBM
The following is a summary of the material U.S. federal income tax consequences to IBM in connectionwith the Spin-Off that may be relevant to holders of IBM common stock.
As discussed above, IBM has received a private letter ruling from the IRS to the effect that, amongother things, the Distribution, including the retention of 19.9% of the shares of our common stock, willqualify as a transaction that is tax-free for U.S. federal income tax purposes under Sections 355 and368(a)(1)(D) of the Code. Completion of the Spin-Off is conditioned upon IBM’s receipt of separate awritten opinion from Paul, Weiss, Rifkind, Wharton & Garrison LLP, counsel to IBM, to the effect that theDistribution will qualify for nonrecognition of gain or loss under Section 355 and related provisions ofthe Code. If the Distribution qualifies for nonrecognition of gain or loss under Section 355 and relatedprovisions of the Code, no gain or loss will be recognized by IBM as a result of the Distribution (other thanincome or gain arising from any imputed income or other adjustment to IBM, us or our respectivesubsidiaries if and to the extent that the Separation and Distribution Agreement or any ancillary agreement
125
is determined to have terms that are not at arm’s length). The opinion of counsel is subject to thequalifications and limitations as are set forth above under “— Consequences to U.S. Holders of IBMCommon Stock.”
If the Distribution were determined not to qualify for non-recognition of gain or loss under Section 355and related provisions of the Code, then IBM would recognize gain equal to the excess of the fair marketvalue of our common stock distributed to IBM stockholders over IBM’s tax basis in our common stock.
Indemnification Obligation
If, as a result of any of our representations being untrue or our covenants being breached, the Spin-Offwere determined not to qualify for non-recognition of gain or loss under Section 355 and related provisionsof the Code, we could be required to indemnify IBM for the resulting taxes and related expenses. Inaddition, if we or our stockholders were to engage in transactions that resulted in a 50% or greater changeby vote or value in the ownership of our stock during the four-year period beginning on the date that beginstwo years before the date of the Distribution, the Spin-Off would generally be taxable to IBM, but not tostockholders, under Section 355(e) of the Code, unless it were established that such transactions and the Spin-Off were not part of a plan or series of related transactions. If the Spin-Off were taxable to IBM due tosuch a 50% or greater change in ownership of our stock, IBM would recognize gain equal to the excess ofthe fair market value of our common stock distributed to IBM stockholders over IBM’s tax basis in ourcommon stock and we generally would be required to indemnify IBM for the tax on such gain and relatedexpenses. In addition, we will be liable to indemnify IBM if, as a result of any of representations beinguntrue or our covenants being breached, transactions related to the Spin-Off that were intended to be tax-freeunder U.S. or foreign law, are determined instead to be taxable to IBM.
126

DESCRIPTION OF OUR CAPITAL STOCK
General
Prior to the Distribution, IBM, as our sole stockholder, will approve and adopt our Amended andRestated Certificate of Incorporation, and our Board will approve and adopt our Amended and Restated By-Laws. The following summarizes information concerning our capital stock, including material provisionsof our Amended and Restated Certificate of Incorporation, our Amended and Restated By-Laws and certainprovisions of Delaware law. You are encouraged to read the forms of our Amended and Restated Certificateof Incorporation and our Amended and Restated By-Laws, which are filed as exhibits to our RegistrationStatement on Form 10, of which this Information Statement is a part, for greater detail with respect to theseprovisions.
Authorized Capital Stock
Immediately following the Spin-Off, our authorized capital stock will consist of 1,000,000,000 shares ofcommon stock, par value $0.01 per share, and 100,000,000 shares of preferred stock, par value $0.01 pershare.
Common Stock
Shares Outstanding
Immediately following the Spin-Off, we estimate that approximately 223,920,187 shares of ourcommon stock will be issued and outstanding, based on 896,800,350 shares of IBM common stockoutstanding as of September 30, 2021 and the number of shares to be retained by IBM. The actual numberof shares of our common stock outstanding immediately following the Spin-Off will depend on theactual number of shares of IBM common stock outstanding on the Record Date, and will reflect anyissuance of new shares or exercise of outstanding options pursuant to IBM’s equity plans and any repurchasesof IBM shares by IBM pursuant to its common stock repurchase program, in each case on or prior to theRecord Date.
Dividends
Holders of shares of our common stock will be entitled to receive dividends when, as and if declaredby our Board at its discretion out of funds legally available for that purpose, subject to the preferentialrights of any preferred stock that may be outstanding. The timing, declaration, amount and payment offuture dividends will depend on our financial condition, earnings, capital requirements and debt serviceobligations, as well as legal requirements, regulatory constraints, industry practice and other factors that ourBoard deems relevant. Additionally, the terms of the indebtedness we intend to incur in connection withthe Spin-Off and our obligations under the Indemnification and Reimbursement Agreement each will limitour ability to pay cash dividends. Our Board will make all decisions regarding our payment of dividendsfrom time to time in accordance with applicable law. See “Dividend Policy.”
Voting Rights
The holders of our common stock will be entitled to one vote for each share held of record on allmatters submitted to a vote of the stockholders.
Other Rights
Subject to the preferential liquidation rights of any preferred stock that may be outstanding, upon ourliquidation, dissolution or winding-up, the holders of our common stock will be entitled to share ratably inour assets legally available for distribution to our stockholders.
Fully Paid
The issued and outstanding shares of our common stock are fully paid and non-assessable. Anyadditional shares of common stock that we may issue in the future will also be fully paid and non-assessable. The holders of our common stock will not have preemptive rights or preferential rights tosubscribe for shares of our capital stock.
127

Preferred Stock
Our Amended and Restated Certificate of Incorporation will authorize our Board to designate andissue from time to time one or more series of preferred stock without stockholder approval. Our Board mayfix and determine the preferences, limitations and relative rights of each series of preferred stock. Thereare no present plans to issue any shares of preferred stock.
Certain Provisions of Delaware Law, Our Amended and Restated Certificate of Incorporation and Amendedand Restated By-Laws
Amended and Restated Certificate of Incorporation and Amended and Restated By-Laws
Certain provisions in our proposed Amended and Restated Certificate of Incorporation and ourproposed Amended and Restated By-Laws summarized below may be deemed to have an anti-takeovereffect and may delay, deter or prevent a tender offer or takeover attempt that a stockholder might considerto be in its best interests, including attempts that might result in a premium being paid over the market pricefor the shares held by stockholders. These provisions are intended to enhance the likelihood of continuityand stability in the composition of our Board and in the policies formulated by our Board and to discouragecertain types of transactions that may involve an actual or threatened change of control.
• Classified Board. Our Amended and Restated Certificate of Incorporation will provide that, until theconclusion of the 2027 annual meeting, our Board will be divided into three classes, with each classconsisting, as nearly as may be possible, of one-third of the total number of directors. The directorsdesignated as Class I directors will have terms expiring at the first annual meeting of stockholdersfollowing the Distribution, which we expect to hold in 2022. The directors designated as Class IIdirectors will have terms expiring at the following year’s annual meeting, which we expect to hold in2023, and the directors designated as Class III directors will have terms expiring at the followingyear’s annual meeting, which we expect to hold in 2024. Any director elected at the 2022, 2023 or 2024annual meeting will belong to the class whose term expires at such annual meeting and will holdoffice for a three-year term until his or her successor has been duly elected and qualified or until hisor her earlier resignation or removal. Beginning at the 2025 annual meeting and at each annual meetingthereafter, all of our directors up for election at such meeting will be elected annually and will holdoffice until the next annual meeting and until his or her successor has been duly elected and qualifiedor until his or her earlier resignation or removal. Effective as of the conclusion of the 2027 annualmeeting, our Board will therefore no longer be divided into three classes. Before our Board isdeclassified, it would take at least two elections of directors for any individual or group to gaincontrol of our Board. Accordingly, while the classified board is in effect, these provisions coulddiscourage a third party from initiating a proxy contest, making a tender offer or otherwise attemptingto control us.
• Removal. Our Amended and Restated Certificate of Incorporation will provide that (i) prior to ourBoard being declassified as discussed above, our stockholders may remove directors only for cause and(ii) after our Board has been fully declassified, our stockholders may remove directors with orwithout cause. Removal will require the affirmative vote of holders of at least a majority of ourvoting stock.
• Vacancies. Our Amended and Restated By-Laws will provide that any vacancies created on theBoard for any reason, including resulting from any increase in the authorized number of directors orthe death, resignation, disqualification or removal from office of any director, will be filled exclusivelyby a majority of the directors then in office, even if less than a quorum, or by the sole remainingdirector. Any director elected to fill a vacancy on our Board will hold office until the expiration ofthe term of office of the director he or she replaced or until his or her successor is duly elected andqualified.
• Blank Check Preferred Stock. Our Amended and Restated Certificate of Incorporation will authorizeour Board to designate and issue, without any further vote or action by the stockholders, up to100,000,000 shares of preferred stock from time to time in one or more series and, with respect toeach such series, to fix the number of shares constituting the series and the designation of the series,the voting powers (if any) of the shares of the series, and the preferences and relative, participating,
128

optional and other rights, if any, and any qualifications, limitations or restrictions, of the shares ofsuch series. The ability to issue such preferred stock could discourage potential acquisition proposalsand could delay or prevent a change in control.
• No Stockholder Action by Written Consent. Our Amended and Restated Certificate of Incorporationwill expressly exclude the right of our stockholders to act by written consent. Stockholder actionmust take place at an annual meeting or at a special meeting of our stockholders.
• Special Stockholder Meetings. Our Amended and Restated Certificate of Incorporation and ourAmended and Restated By-Laws will provide that holders of at least 25% of our outstanding sharesor our Board, will be able to call a special meeting of stockholders.
• Requirements for Advance Notification of Stockholder Nominations and Proposals. Under ourAmended and Restated By-Laws, stockholders of record will be able to nominate persons for electionto our Board or bring other business constituting a proper matter for stockholder action only byproviding proper notice to our Secretary. In the case of annual meetings, proper notice must be given,generally between 90 and 120 days prior to the first anniversary of the prior year’s annual meetingas first specified in the notice of meeting provided, however, that if (A) the annual meeting is advancedby more than 30 days, or delayed by more than 60 days, from the first anniversary of the prioryear’s annual meeting or (B) no annual meeting was held during the prior year, the notice by thestockholder to be timely must be received (1) no earlier than 120 days before such annual meetingand (2) no later than the later of 90 days before such annual meeting and the tenth day after the dayon which the notice of such annual meeting was first made by mail or public disclosure. In the case ofspecial meetings, proper notice must be given no earlier than the 120th day prior to the relevantmeeting and no later than the later of the 90th day prior to such meeting or the 10th day followingthe public announcement of the meeting. Such notice must include, among other information, certaininformation with respect to each stockholder nominating persons for election to the Board(including, the name and address, the number of shares directly or indirectly held by such stockholder,a description of any agreement with respect to the business to be brought before the annual meeting,a description of any derivative instruments based on or linked to the value of or return on oursecurities as of the date of the notice, a description of any proxy, contract or other relationshippursuant to which such stockholder has a right to vote any shares of our stock and any profit-sharing or performance-related fees that such stockholder is entitled to, based on any increase ordecrease in the value of our securities, as of the date of such notice), a representation that suchstockholder is a holder of record of our common stock as of the date of the notice, each stockholdernominee’s written consent to being named as a nominee and to serving as a director if elected,completed questionnaire and representation that such person has not and will not give any commitmentas to how such person will act or vote if elected as a director, become a party to any agreement withrespect to any compensation, reimbursement or indemnification in connection with service as adirector, and such person will comply with all policies applicable to directors, a description of allcompensation and other monetary agreements during the past three years and a representation as towhether such stockholder intends to solicit proxies.
• Proxy Access. Our Amended and Restated By-Laws will allow one or more stockholders (up to 20,collectively), owning at least 3% of our outstanding shares continuously for at least three years, tonominate for election to our Board and to be included in our proxy materials up to the greater of twoindividuals or 20% of our Board, only by sending proper notice to our Secretary.
• Cumulative Voting. The DGCL provides that stockholders are denied the right to cumulate votes inthe election of directors unless the Company’s certificate of incorporation provides otherwise. OurAmended and Restated Certificate of Incorporation will not provide for cumulative voting.
• Amendments to Certificate of Incorporation and By-Laws. The DGCL provides that the affirmativevote of holders of a majority of a company’s voting stock then outstanding is required to amend theCompany’s certificate of incorporation unless the Company’s certificate of incorporation providesa higher threshold, and our Amended and Restated Certificate of Incorporation will not provide fora higher threshold. Our Amended and Restated Certificate of Incorporation will provide that ourAmended and Restated By-Laws may be amended by our Board or by the affirmative vote of holdersof at least a majority of our voting stock.
129

Delaware Takeover Statute
We are subject to Section 203 of the DGCL, which, subject to certain exceptions, prohibits a Delawarecorporation from engaging in any business combination with any interested stockholder for a period ofthree years following the date that such stockholder became an interested stockholder.
Limitation on Liability of Directors and Indemnification of Directors and Officers
Delaware law authorizes corporations to limit or eliminate the personal liability of directors tocorporations and their stockholders for monetary damages for breaches of directors’ fiduciary duties asdirectors, and our Amended and Restated Certificate of Incorporation will include such an exculpationprovision. Our Amended and Restated By-Laws and Amended and Restated Certificate of Incorporation willinclude provisions that indemnify, to the fullest extent allowable under the DGCL, the personal liability ofdirectors or officers for monetary damages for actions taken as a director, officer or agent of Kyndryl, or forserving at our request as a director, officer, employee or agent at another corporation or enterprise, as thecase may be. Our Amended and Restated By-Laws and Amended and Restated Certificate of Incorporationwill also provide that we must indemnify and advance reasonable expenses to our directors, officers andemployees, subject to our receipt of an undertaking from the indemnified party as may be required underthe DGCL.
The limitation of liability and indemnification provisions that will be included in our Amended andRestated By-Laws and Amended and Restated Certificate of Incorporation may discourage stockholdersfrom bringing a lawsuit against directors for breach of their fiduciary duty. These provisions may also havethe effect of reducing the likelihood of derivative litigation against our directors and officers, even thoughsuch an action, if successful, might otherwise benefit us and our stockholders. However, these provisionswill not limit or eliminate our rights, or those of any stockholder, to seek non-monetary relief such asinjunction or rescission in the event of a breach of a director’s duty of care. The provisions will not alter theliability of directors under the federal securities laws. In addition, your investment may be adverselyaffected to the extent that, in a class action or direct suit, we pay the costs of settlement and damage awardsagainst directors and officers pursuant to these indemnification provisions. There is currently no pendingmaterial litigation or proceeding against any of our directors, officers or employees for which indemnificationis sought.
Exclusive Forum
Our Amended and Restated Certificate of Incorporation will provide, in all cases to the fullest extentpermitted by law, that unless we consent in writing to the selection of an alternative forum, the Court ofChancery located within the State of Delaware will be the sole and exclusive forum for any derivative actionor proceeding brought on behalf of us, any action asserting a claim of breach of a fiduciary duty owed byany director, officer, agent, employee or stockholder of Kyndryl to us or our stockholders, any action assertinga claim arising pursuant to the DGCL or as to which the DGCL confers jurisdiction on the Court ofChancery located in the State of Delaware, any action asserting a claim governed by the internal affairsdoctrine, or any action asserting a claim arising under the DGCL, our Amended and Restated Certificate ofIncorporation or our Amended and Restated By-Laws. However, if the Court of Chancery within theState of Delaware does not have jurisdiction, the action may be brought in the United States District Courtfor the District of Delaware. Additionally, our Amended and Restated Certificate of Incorporation willstate that the foregoing provision will not apply to claims arising under the Securities Act. Unless we consentin writing to the selection of an alternative forum, the federal district courts of the United States ofAmerica shall be the exclusive forum for the resolution of any complaint asserting a cause of action arisingunder the Securities Act. The exclusive forum provisions may limit a stockholder’s ability to bring a claimin a judicial forum that it finds favorable for disputes with us or any of our directors, officers or stockholders,which may discourage lawsuits with respect to such claims. Our stockholders will not be deemed to havewaived our compliance with the federal securities laws and the rules and regulations thereunder as a resultof our exclusive forum provisions.
Sale of Unregistered Securities
On December 4, 2020, we issued 1,000 shares of our common stock to IBM pursuant to Section 4(a)(2)of the Securities Act. We did not register the issuance of the issued shares under the Securities Act becausesuch issuance did not constitute a public offering.
130

Transfer Agent and Registrar
The transfer agent and registrar for our common stock will be Computershare Trust Company, N.A.
Listing
We have been approved to list our common stock on the New York Stock Exchange, under the tickersymbol “KD.”
131

WHERE YOU CAN FIND MORE INFORMATION
We have filed a Registration Statement on Form 10 with the SEC with respect to the shares of ourcommon stock that IBM’s stockholders will receive in the Distribution as contemplated by this InformationStatement. This Information Statement is a part of, and does not contain all the information set forth in,the Registration Statement and the other exhibits and schedules to the Registration Statement. For furtherinformation with respect to us and our common stock, please refer to the Registration Statement, including itsother exhibits and schedules. Statements we make in this Information Statement relating to any contract orother document are not necessarily complete, and you should refer to the exhibits attached to the RegistrationStatement for copies of the actual contract or document. You may review a copy of the RegistrationStatement, including its exhibits and schedules, on the Internet website maintained by the SEC at www.sec.gov.Information contained on any website we refer to in this Information Statement does not and will notconstitute a part of this Information Statement or the Registration Statement on Form 10 of which thisInformation Statement is a part.
As a result of the Spin-Off, we will become subject to the information and reporting requirements ofthe Exchange Act and, in accordance with the Exchange Act, we will file periodic reports, proxy statementsand other information with the SEC.
You may request a copy of any of our filings with the SEC at no cost by writing us at the followingaddress:
Kyndryl Holdings, Inc.One Vanderbilt Avenue, 15th Floor
New York, NY 10017Attention: Investor Relations
We intend to furnish holders of our common stock with annual reports containing financial statementsprepared in accordance with U.S. GAAP and audited and reported on by an independent registered publicaccounting firm.
132
INDEX TO COMBINED FINANCIAL STATEMENTS
Audited Combined Financial Statements
Report of Independent Registered Public Accounting Firm . . . . . . . . . . . . . . . . . . . . . . . . . . . . . F-2Combined Income Statement for the Years Ended December 31, 2020, 2019 and 2018 . . . . . . . . . . . F-4Combined Statement of Comprehensive Income for the Years Ended December 31, 2020, 2019 and
2018 . . . . . . . . . . . . . . . . . . . . . . . . . . . . . . . . . . . . . . . . . . . . . . . . . . . . . . . . . . . . . . . . . . F-5Combined Balance Sheet at December 31, 2020 and 2019 . . . . . . . . . . . . . . . . . . . . . . . . . . . . . . . F-6Combined Statement of Cash Flows for the Years Ended December 31, 2020, 2019 and 2018 . . . . . . F-7Combined Statement of Equity for the Years Ended December 31, 2020, 2019 and 2018 . . . . . . . . . . F-8Notes to Combined Financial Statements . . . . . . . . . . . . . . . . . . . . . . . . . . . . . . . . . . . . . . . . . . F-9
Unaudited Combined Financial Statements
Combined Income Statement for the Three and Six Months Ended June 30, 2021 and 2020 . . . . . . . F-50Combined Statement of Comprehensive Income for the Three and Six Months Ended June 30, 2021
and 2020 . . . . . . . . . . . . . . . . . . . . . . . . . . . . . . . . . . . . . . . . . . . . . . . . . . . . . . . . . . . . . . F-51Combined Balance Sheet at June 30, 2021 and December 31, 2020 . . . . . . . . . . . . . . . . . . . . . . . . F-52Combined Statement of Cash Flows for the Six Months Ended June 30, 2021 and 2020 . . . . . . . . . F-53Combined Statement of Equity for the Three and Six Months Ended June 30, 2021 and 2020 . . . . . F-54Notes to Combined Financial Statements . . . . . . . . . . . . . . . . . . . . . . . . . . . . . . . . . . . . . . . . . F-56Schedule II — Valuation and Qualifying Accounts for the Years Ended December 31, 2020, 2019
and 2018 . . . . . . . . . . . . . . . . . . . . . . . . . . . . . . . . . . . . . . . . . . . . . . . . . . . . . . . . . . . . . . S-1
F-1

Report of Independent Registered Public Accounting Firm
To the Board of Directors and Stockholders of International Business Machines Corporation:
Opinion on the Financial Statements
We have audited the accompanying combined balance sheet of Kyndryl (the managed infrastructureservices business of IBM) (the “Company”) as of December 31, 2020 and 2019, and the related combinedstatements of income, comprehensive income, equity and cash flows for each of the three years in the periodended December 31, 2020, including the related notes and financial statement schedule listed in theaccompanying index (collectively referred to as the “combined financial statements”). In our opinion, thecombined financial statements present fairly, in all material respects, the financial position of the Companyas of December 31, 2020 and 2019, and the results of its operations and its cash flows for each of thethree years in the period ended December 31, 2020 in conformity with accounting principles generallyaccepted in the United States of America.
Changes in Accounting Principles
As discussed in Note B to the combined financial statements, the Company changed the manner inwhich it accounts for leases in 2019 and the manner in which it accounts for revenue from contracts withcustomers in 2018.
Basis for Opinion
These combined financial statements are the responsibility of the Company’s management. Ourresponsibility is to express an opinion on the Company’s combined financial statements based on ouraudits. We are a public accounting firm registered with the Public Company Accounting Oversight Board(United States) (PCAOB) and are required to be independent with respect to the Company in accordance withthe U.S. federal securities laws and the applicable rules and regulations of the Securities and ExchangeCommission and the PCAOB.
We conducted our audits of these combined financial statements in accordance with the standards ofthe PCAOB and in accordance with auditing standards generally accepted in the United States of America.Those standards require that we plan and perform the audit to obtain reasonable assurance about whetherthe combined financial statements are free of material misstatement, whether due to error or fraud.
Our audits included performing procedures to assess the risks of material misstatement of the combinedfinancial statements, whether due to error or fraud, and performing procedures that respond to those risks.Such procedures included examining, on a test basis, evidence regarding the amounts and disclosures in thecombined financial statements. Our audits also included evaluating the accounting principles used andsignificant estimates made by management, as well as evaluating the overall presentation of the combinedfinancial statements. We believe that our audits provide a reasonable basis for our opinion.
Critical Audit Matters
The critical audit matter communicated below is a matter arising from the current period audit of thecombined financial statements that was communicated or required to be communicated to the auditcommittee and that (i) relates to accounts or disclosures that are material to the combined financial statementsand (ii) involved our especially challenging, subjective, or complex judgments. The communication ofcritical audit matters does not alter in any way our opinion on the combined financial statements, taken as awhole, and we are not, by communicating the critical audit matter below, providing a separate opinion onthe critical audit matter or on the accounts or disclosures to which it relates.
Goodwill Impairment Assessment
As described in Note H to the combined financial statements, the Company’s goodwill balance was$1,230 million as of December 31, 2020. As disclosed by management, goodwill is reviewed for impairmentannually, or whenever events or changes in circumstances indicate that the carrying value of goodwill maynot be recoverable by first assessing qualitative factors to determine if it is more likely than not that fair value
F-2

is less than carrying value. Management assesses qualitative factors to determine whether it is necessary toperform the quantitative goodwill impairment test. The quantitative test is required only if managementconcludes that it is more likely than not that a reporting unit’s fair value is less than its carrying amount.Fair value is estimated by management using a discounted cash flow model. Management’s cash flowprojections for the reporting unit with less significant headroom (the “Reporting Unit”), included significantjudgments and assumptions relating to projected EBITDA margins and the discount rate. Managementevaluated goodwill for impairment for all reporting units for all periods presented which resulted in noimpairment.
The principal considerations for our determination that performing procedures relating to the goodwillimpairment assessment for the Reporting Unit is a critical audit matter are (i) the significant judgment bymanagement when developing the fair value measurement of the Reporting Unit; (ii) a high degree of auditorjudgment, subjectivity, and effort in performing procedures and evaluating management’s significantassumptions related to the projected EBITDA margins and the discount rate; and (iii) the audit effort involvedthe use of professionals with specialized skill and knowledge.
Addressing the matter involved performing procedures and evaluating audit evidence in connectionwith forming our overall opinion on the combined financial statements. These procedures included, amongothers, (i) testing management’s process for developing the fair value estimate of the Reporting Unit,(ii) evaluating the appropriateness of the discounted cash flow model; (iii) testing the completeness andaccuracy of underlying data used in the model; and (iv) evaluating the reasonableness of the significantassumptions used by management related to the projected EBITDA margins and the discount rate. Evaluatingmanagement’s assumptions related to the projected EBITDA margins involved evaluating whether theassumptions used by management were reasonable considering (i) the current and past performance of theReporting Unit; (ii) the consistency with external market and industry data; and (iii) whether theseassumptions were consistent with evidence obtained in other areas of the audit. Professionals with specializedskill and knowledge were used to assist in the evaluation of the Company’s discounted cash flow modeland the discount rate assumption.
PricewaterhouseCoopers LLP (signed)
New York, New York
June 22, 2021
We have served as the Company’s auditor since 2020.
F-3

KYNDRYLCOMBINED INCOME STATEMENT
($ in millions)For the year ended December 31: Notes 2020 2019 2018
Revenues (related party revenue of $645 in 2020, $613 in 2019 and$623 in 2018) . . . . . . . . . . . . . . . . . . . . . . . . . . . . . . . . . . . . . C $19,352 $20,279 $21,796
Cost of services (related party cost of $3,767 in 2020, $3,592 in 2019and $4,112 in 2018) . . . . . . . . . . . . . . . . . . . . . . . . . . . . . . . . . C $17,143 $17,682 $19,238
Selling, general and administrative . . . . . . . . . . . . . . . . . . . . . . . . 2,893 2,887 2,924Workforce rebalancing charges . . . . . . . . . . . . . . . . . . . . . . . . . . 918 159 116Research, development and engineering . . . . . . . . . . . . . . . . . . . . 76 83 69Interest expense . . . . . . . . . . . . . . . . . . . . . . . . . . . . . . . . . . . . . I 63 76 85Other (income) and expense . . . . . . . . . . . . . . . . . . . . . . . . . . . . 25 (29) (7)Total costs and expenses . . . . . . . . . . . . . . . . . . . . . . . . . . . . . . . $21,118 $20,858 $22,425
Income/(loss) before income taxes . . . . . . . . . . . . . . . . . . . . . . . . . $ (1,766) $ (579) $ (630)Provision for income taxes . . . . . . . . . . . . . . . . . . . . . . . . . . . . . . E $ 246 $ 364 $ 350Net income/(loss) . . . . . . . . . . . . . . . . . . . . . . . . . . . . . . . . . . . . $ (2,011) $ (943) $ (980)
(Amounts may not add due to rounding.)(The accompanying notes are an integral part of the financial statements.)
F-4
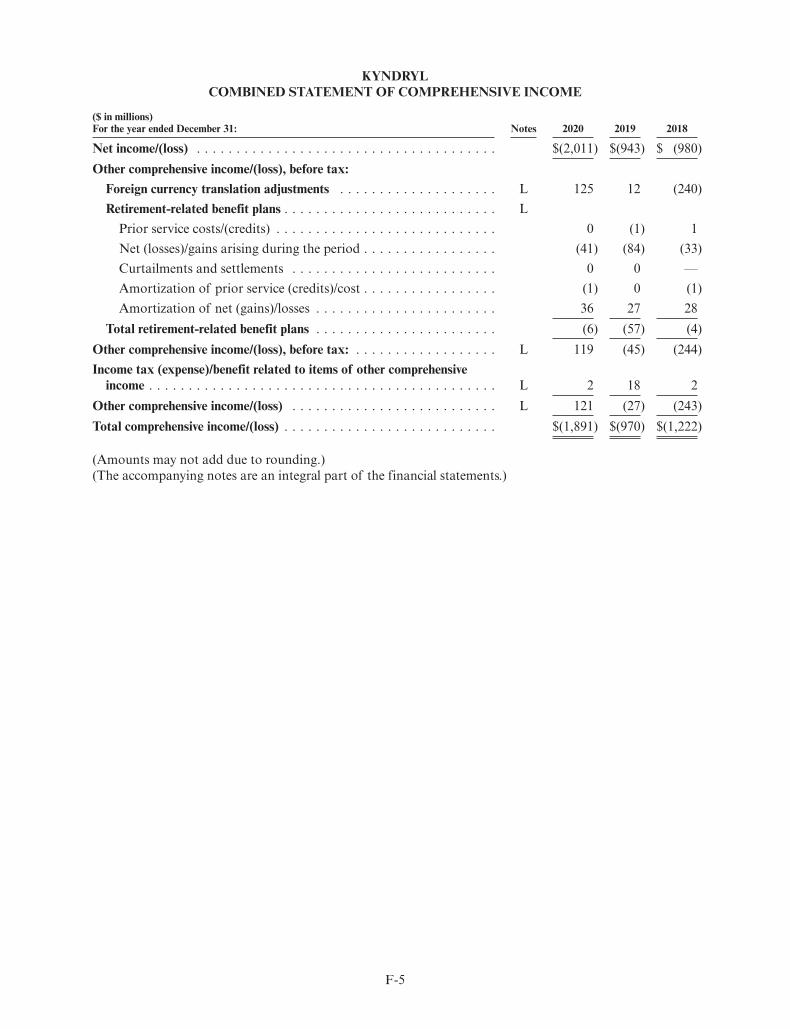
KYNDRYLCOMBINED STATEMENT OF COMPREHENSIVE INCOME
($ in millions)For the year ended December 31: Notes 2020 2019 2018
Net income/(loss) . . . . . . . . . . . . . . . . . . . . . . . . . . . . . . . . . . . . . . $(2,011) $(943) $ (980)Other comprehensive income/(loss), before tax:
Foreign currency translation adjustments . . . . . . . . . . . . . . . . . . . . L 125 12 (240)Retirement-related benefit plans . . . . . . . . . . . . . . . . . . . . . . . . . . . L
Prior service costs/(credits) . . . . . . . . . . . . . . . . . . . . . . . . . . . . 0 (1) 1Net (losses)/gains arising during the period . . . . . . . . . . . . . . . . . (41) (84) (33)Curtailments and settlements . . . . . . . . . . . . . . . . . . . . . . . . . . 0 0 —Amortization of prior service (credits)/cost . . . . . . . . . . . . . . . . . (1) 0 (1)Amortization of net (gains)/losses . . . . . . . . . . . . . . . . . . . . . . . 36 27 28
Total retirement-related benefit plans . . . . . . . . . . . . . . . . . . . . . . . (6) (57) (4)Other comprehensive income/(loss), before tax: . . . . . . . . . . . . . . . . . . L 119 (45) (244)Income tax (expense)/benefit related to items of other comprehensive
income . . . . . . . . . . . . . . . . . . . . . . . . . . . . . . . . . . . . . . . . . . . . L 2 18 2Other comprehensive income/(loss) . . . . . . . . . . . . . . . . . . . . . . . . . . L 121 (27) (243)Total comprehensive income/(loss) . . . . . . . . . . . . . . . . . . . . . . . . . . . $(1,891) $(970) $(1,222)
(Amounts may not add due to rounding.)(The accompanying notes are an integral part of the financial statements.)
F-5

KYNDRYLCOMBINED BALANCE SHEET
($ in millions)At December 31: Notes 2020 2019Assets:
Current assets:Cash and cash equivalents . . . . . . . . . . . . . . . . . . . . . . . . . . . . . . . . . . $ 24 $ 36Restricted cash . . . . . . . . . . . . . . . . . . . . . . . . . . . . . . . . . . . . . . . . . 14 14Notes and accounts receivable (net of allowances of $91 in 2020 and $82
in 2019) . . . . . . . . . . . . . . . . . . . . . . . . . . . . . . . . . . . . . . . . . . . . . 1,444 1,790Deferred costs . . . . . . . . . . . . . . . . . . . . . . . . . . . . . . . . . . . . . . . . . . C 1,205 1,133Prepaid expenses and other current assets . . . . . . . . . . . . . . . . . . . . . . . 157 178
Total current assets . . . . . . . . . . . . . . . . . . . . . . . . . . . . . . . . . . . . . . . . $ 2,843 $ 3,151
Property and equipment – net . . . . . . . . . . . . . . . . . . . . . . . . . . . . . . . . . F $ 3,991 $ 4,125Operating right-of-use assets – net . . . . . . . . . . . . . . . . . . . . . . . . . . . . . . G 1,131 1,218Deferred costs . . . . . . . . . . . . . . . . . . . . . . . . . . . . . . . . . . . . . . . . . . . . C 1,441 1,561Deferred taxes . . . . . . . . . . . . . . . . . . . . . . . . . . . . . . . . . . . . . . . . . . . . E 424 349Goodwill . . . . . . . . . . . . . . . . . . . . . . . . . . . . . . . . . . . . . . . . . . . . . . . H 1,230 1,162Intangible assets – net . . . . . . . . . . . . . . . . . . . . . . . . . . . . . . . . . . . . . . H 60 87Other assets . . . . . . . . . . . . . . . . . . . . . . . . . . . . . . . . . . . . . . . . . . . . . 86 90
Total assets . . . . . . . . . . . . . . . . . . . . . . . . . . . . . . . . . . . . . . . . . . . . . . . $11,205 $11,744
Liabilities and equity:Current liabilities:
Short-term debt . . . . . . . . . . . . . . . . . . . . . . . . . . . . . . . . . . . . . . . . . I $ 69 $ 42Accounts payable . . . . . . . . . . . . . . . . . . . . . . . . . . . . . . . . . . . . . . . . 919 826Compensation and benefits . . . . . . . . . . . . . . . . . . . . . . . . . . . . . . . . . 350 359Deferred income . . . . . . . . . . . . . . . . . . . . . . . . . . . . . . . . . . . . . . . . C 854 896Operating lease liabilities . . . . . . . . . . . . . . . . . . . . . . . . . . . . . . . . . . . G 333 328Accrued contract costs . . . . . . . . . . . . . . . . . . . . . . . . . . . . . . . . . . . . 512 550Other accrued expenses and liabilities . . . . . . . . . . . . . . . . . . . . . . . . . . J 874 406
Total current liabilities . . . . . . . . . . . . . . . . . . . . . . . . . . . . . . . . . . . . . . $ 3,910 $ 3,408
Long-term debt . . . . . . . . . . . . . . . . . . . . . . . . . . . . . . . . . . . . . . . . . . . I $ 140 $ 100Retirement and nonpension postretirement benefit obligations . . . . . . . . . . N 550 489Deferred income . . . . . . . . . . . . . . . . . . . . . . . . . . . . . . . . . . . . . . . . . . C 543 615Operating lease liabilities . . . . . . . . . . . . . . . . . . . . . . . . . . . . . . . . . . . . G 850 890Other liabilities . . . . . . . . . . . . . . . . . . . . . . . . . . . . . . . . . . . . . . . . . . . J 282 294Total liabilities . . . . . . . . . . . . . . . . . . . . . . . . . . . . . . . . . . . . . . . . . . . $ 6,274 $ 5,796
Commitments and contingencies . . . . . . . . . . . . . . . . . . . . . . . . . . . . . . . . K
Net Parent investment . . . . . . . . . . . . . . . . . . . . . . . . . . . . . . . . . . . . $ 5,972 $ 7,112Accumulated other comprehensive income/(loss) . . . . . . . . . . . . . . . . . . (1,100) (1,220)
Total Net Parent investment . . . . . . . . . . . . . . . . . . . . . . . . . . . . . . . . . . 4,873 5,892Noncontrolling interests . . . . . . . . . . . . . . . . . . . . . . . . . . . . . . . . . . . . . 58 56Total equity . . . . . . . . . . . . . . . . . . . . . . . . . . . . . . . . . . . . . . . . . . . . . . $ 4,931 $ 5,948
Total liabilities and equity . . . . . . . . . . . . . . . . . . . . . . . . . . . . . . . . . . . . . . $11,205 $11,744
(Amounts may not add due to rounding.)(The accompanying notes are an integral part of the financial statements.)
F-6

KYNDRYLCOMBINED STATEMENT OF CASH FLOWS
($ in millions)For the year ended December 31: 2020 2019 2018
Cash flows from operating activities:Net income/(loss) . . . . . . . . . . . . . . . . . . . . . . . . . . . . . . . . . . . . . . . . . . $(2,011) $ (943) $ (980)Adjustments to reconcile net income/(loss) to cash provided by operating
activities:Depreciation and amortization
Depreciation . . . . . . . . . . . . . . . . . . . . . . . . . . . . . . . . . . . . . . . . . . 1,869 1,898 1,496Amortization of deferred costs . . . . . . . . . . . . . . . . . . . . . . . . . . . . . 2,061 2,109 2,053Amortization of intangibles . . . . . . . . . . . . . . . . . . . . . . . . . . . . . . . 29 29 29
Stock-based compensation . . . . . . . . . . . . . . . . . . . . . . . . . . . . . . . . . . 64 51 57Deferred taxes . . . . . . . . . . . . . . . . . . . . . . . . . . . . . . . . . . . . . . . . . . (52) (33) 40Net (gain)/loss on asset sales and other . . . . . . . . . . . . . . . . . . . . . . . . . 4 1 (31)Change in operating assets and liabilities:
Deferred Costs . . . . . . . . . . . . . . . . . . . . . . . . . . . . . . . . . . . . . . . . (1,917) (1,802) (2,334)Right-of-use assets and liabilities . . . . . . . . . . . . . . . . . . . . . . . . . . . . (372) (418) —Workforce Rebalancing . . . . . . . . . . . . . . . . . . . . . . . . . . . . . . . . . . 560 27 0Receivables . . . . . . . . . . . . . . . . . . . . . . . . . . . . . . . . . . . . . . . . . . . 387 23 220Accounts payable . . . . . . . . . . . . . . . . . . . . . . . . . . . . . . . . . . . . . . 70 33 (29)Other assets/other liabilities . . . . . . . . . . . . . . . . . . . . . . . . . . . . . . . (62) 159 153
Net cash provided by operating activities . . . . . . . . . . . . . . . . . . . . . . . . . . $ 628 $ 1,134 $ 674
Cash flows from investing activities:Payments for property and equipment . . . . . . . . . . . . . . . . . . . . . . . . . . . $(1,036) $(1,190) $(1,563)Proceeds from disposition of property and equipment . . . . . . . . . . . . . . . . 84 63 114Other investing activities, net . . . . . . . . . . . . . . . . . . . . . . . . . . . . . . . . . . (1) (2) (2)Net cash used in investing activities . . . . . . . . . . . . . . . . . . . . . . . . . . . . . . $ (953) $(1,128) $(1,451)
Cash flows from financing activities:Payments to settle debt . . . . . . . . . . . . . . . . . . . . . . . . . . . . . . . . . . . . . . $ (66) $ (18) $ —Net transfers from Parent . . . . . . . . . . . . . . . . . . . . . . . . . . . . . . . . . . . . 377 18 791Net cash provided by financing activities . . . . . . . . . . . . . . . . . . . . . . . . . . . $ 312 $ 0 $ 791
Effect of exchange rate changes on cash, cash equivalents andrestricted cash . . . . . . . . . . . . . . . . . . . . . . . . . . . . . . . . . . . . . . . . . . $ 1 $ (1) $ (5)
Net change in cash, cash equivalents and restricted cash . . . . . . . . . . . . . . . $ (13) $ 5 $ 10
Cash, cash equivalents and restricted cash at January 1 . . . . . . . . . . . . . . . . 50 46 36Cash, cash equivalents and restricted cash at December 31 . . . . . . . . . . . . . . $ 38 $ 50 $ 46
Supplemental dataIncome taxes paid – net of refunds received . . . . . . . . . . . . . . . . . . . . . . . $ — $ — $ —Interest paid on debt . . . . . . . . . . . . . . . . . . . . . . . . . . . . . . . . . . . . . . . $ — $ — $ —
(Amounts may not add due to rounding.)(The accompanying notes are an integral part of the financial statements.)
F-7

KYNDRYLCOMBINED STATEMENT OF EQUITY
($ in millions)
NetParent
Investment
Accumulated OtherComprehensiveIncome/(Loss)
TotalNet ParentInvestment
Non-ControllingInterests
TotalEquity
Equity – January 1, 2018 . . . . . . . . . . . $6,978 $ (950) $ 6,027 $ 63 $ 6,090Cumulative effect of change in
accounting principle – Revenue* . . . . 154 154 154Net income/(loss) plus other
comprehensive income/(loss):Net income/(loss) . . . . . . . . . . . . . . (980) (980) (980)Other comprehensive income/(loss) . . (243) (243) (243)
Total comprehensive income/(loss) . . . . $(1,222) $(1,222)Net transfers from parent . . . . . . . . . . 1,304 1,304 1,304Changes in non-controlling interests . . . (11) (11)Equity – December 31, 2018 . . . . . . . . . $7,457 $(1,193) $ 6,264 $ 52 $ 6,315
* Reflects the adoption of FASB guidance. Refer to note B, “Accounting Pronouncements.”
($ in millions)
NetParent
Investment
Accumulated OtherComprehensiveIncome/(Loss)
TotalNet ParentInvestment
Non-ControllingInterests
TotalEquity
Equity – January 1, 2019 . . . . . . . . . . . . $7,457 $(1,193) $6,264 $52 $6,315Net income/(loss) plus other
comprehensive income/(loss):Net income/(loss) . . . . . . . . . . . . . . . (943) (943) (943)Other comprehensive income/(loss) . . . (27) (27) (27)
Total comprehensive income/(loss) . . . . . $ (970) $ (970)
Net transfers from parent . . . . . . . . . . . 598 598 598Changes in non-controlling interests . . . 4 4Equity – December 31, 2019 . . . . . . . . . $7,112 $(1,220) $5,892 $56 $5,948
($ in millions)
NetParent
Investment
Accumulated OtherComprehensiveIncome/(Loss)
TotalNet ParentInvestment
Non-ControllingInterests
TotalEquity
Equity – January 1, 2020 . . . . . . . . . . . $ 7,112 $(1,220) $ 5,892 $56 $ 5,948Net income/(loss) plus other
comprehensive income/(loss):Net income/(loss) . . . . . . . . . . . . . . (2,011) (2,011) (2,011)Other comprehensive income/(loss) . . 121 121 121
Total comprehensive income/(loss) . . . . $(1,891) $(1,891)
Net transfers from parent . . . . . . . . . . 872 872 872Changes in non-controlling interests . . . 2 2Equity – December 31, 2020 . . . . . . . . . $ 5,972 $(1,100) $ 4,873 $58 $ 4,931
(Amounts may not add due to rounding.)(The accompanying notes are an integral part of the financial statements.)
F-8

NOTES TO COMBINED FINANCIAL STATEMENTS
NOTE A. SIGNIFICANT ACCOUNTING POLICIES
Background
On October 8, 2020, International Business Machines Corporation (IBM or Parent) announced plansfor the complete legal and structural separation of the managed infrastructure services unit of its GlobalTechnology Services (GTS) segment into a new public company. The name of the new company is Kyndryl.The separation is expected to be achieved through a U.S. federal tax-free spin-off to IBM shareholders. Itwill be subject to customary market, regulatory and other closing conditions, including final IBM Board ofDirectors’ approval.
Prior to separation, IBM’s GTS segment includes Infrastructure & Cloud Services and TechnologySupport Services (TSS). The Infrastructure & Cloud services unit consists of IBM’s managed infrastructureservices capabilities and the IBM Public Cloud. The components of the GTS segment that will remainwith IBM will be the IBM Public Cloud and TSS. Kyndryl will also provide the security, regulatory and riskmanagement services and identity management services offerings which have historically been includedwithin the Security Services unit of IBM’s Cloud & Cognitive Software segment.
Basis of Presentation
The accompanying combined financial statements and footnotes of Kyndryl have been prepared inconnection with the expected separation and have been derived from the consolidated financial statementsand accounting records of IBM as if Kyndryl operated on a standalone basis during the periods presented,and were prepared in accordance with accounting principles generally accepted in the United States ofAmerica (GAAP). References in these combined financial statements to “the Company” or “Kyndryl” referto IBM’s managed infrastructure services business as it was historically managed.
The combined financial statements reflect allocations of certain IBM corporate, infrastructure andshared services expenses, including centralized research, legal, human resources, payroll, finance andaccounting, employee benefits, real estate, insurance, information technology, telecommunications, treasury,and other expenses. Where possible, these charges were allocated based on direct usage, with the remainderallocated on a pro rata basis of headcount, gross profit, asset, or other allocation methodologies that areconsidered to be a reasonable reflection of the utilization of services provided or the benefit received byKyndryl during the periods presented. The allocations may not, however, reflect the expense the Companywould have incurred as a standalone company for the periods presented. These costs also may not be indicativeof the expenses that the Company will incur in the future or would have incurred if the Company hadobtained these services from a third party.
The Combined Balance Sheet of the Company includes IBM’s assets and liabilities that are specificallyidentifiable or otherwise attributable to the Company, including subsidiaries and/or joint ventures conductingmanaged infrastructure services business in which IBM has a controlling financial interest or is the primarybeneficiary.
Cash and cash equivalents held by IBM at the corporate level were not attributable to the Company forany of the periods presented due to IBM’s centralized approach to cash management and the financing ofits operations. Only cash amounts specifically held by Kyndryl are reflected in the Combined Balance Sheet.IBM’s debt was not attributed to the Company for any of the periods presented because IBM’s borrowingsare not the legal obligation of Kyndryl. The only third-party debt obligations included in the combinedfinancial statements are those for which the legal obligor is a legal entity of Kyndryl. Interest expense inthe Combined Income Statement reflects the allocation of interest on borrowing and funding related activityassociated with the portion of IBM’s borrowings where the proceeds benefited us. Transfers of cash, bothto and from IBM’s centralized cash management system, are reflected as a component of Net Parentinvestment in the Combined Balance Sheet and as financing activities in the accompanying CombinedStatement of Cash Flows.
IBM maintains various benefit and stock-based compensation plans at a corporate level and otherpension and postretirement-related benefit plans at a subsidiary level. The Company’s employees participate
F-9

in those programs and a portion of the cost of those plans is included in the Company’s combined financialstatements. However, the Combined Balance Sheet does not include any net benefit plan assets orobligations unless legally sponsored by the Company. See note M, “Stock-Based Compensation” andnote N, “Retirement-Related Benefits,” for additional information.
Net Parent investment in the Combined Balance Sheet represents the accumulation of the Company’snet income/(loss) over time and net non-trade intercompany transactions between Kyndryl and IBM (forexample, investments from IBM or distributions to IBM). Changes in these non-trade intercompany balancesare reflected as Net transfers from Parent in the financing activities section of the Combined Statement ofCash Flows.
As a result of the allocations and carve out methodologies used to prepare these combined financialstatements, these results may not be indicative of the Company’s future performance, and may not reflectthe results of operations, financial position, and cash flows had Kyndryl been a separate, standalone companyduring the periods presented.
Kyndryl’s operations are included in the consolidated U.S. federal, certain state and local and foreignincome tax returns filed by IBM, where applicable. The income tax provision included in these combinedfinancial statements has been calculated using the separate return basis, as if Kyndryl filed separate taxreturns. Post separation, Kyndryl’s operating footprint as well as tax return elections and assertions areexpected to be different and therefore, Kyndryl’s hypothetical income taxes, as presented in the combinedfinancial statements, are not expected to be indicative of the Company’s future income taxes. Current incometax liabilities including amounts for unrecognized tax benefits related to Kyndryl’s activities included in theParent’s income tax returns were assumed to be immediately settled with Parent through the Net Parentinvestment account in the Combined Balance Sheet and reflected in Net transfers from Parent in theCombined Statement of Cash Flows.
Within the financial statements and tables presented, certain columns and rows may not add due to theuse of rounded numbers for disclosure purposes. Percentages presented are calculated from the underlyingwhole-dollar amounts.
Noncontrolling interest amounts of $9 million, $9 million and $6 million, net of tax, for the yearsended December 31, 2020, 2019 and 2018, respectively, are included as a reduction within other (income)and expense in the Combined Income Statement.
Principles of Combination
The combined financial statements include the Company’s net assets and results of operations asdescribed above. All significant intracompany transactions between Kyndryl’s businesses have beeneliminated. All significant intercompany transactions between Kyndryl and IBM have been included in thecombined financial statements. Intercompany transactions between Kyndryl and IBM are considered to beeffectively settled in the combined financial statements at the time the transaction is recorded. The totalnet effect of the settlement of these intercompany transactions is reflected as Net transfers from Parent inthe financing activities section in the Combined Statement of Cash Flows and in the Combined Balance Sheetwithin Net Parent investment.
Use of Estimates
The preparation of financial statements in conformity with GAAP requires management to makeestimates and assumptions that affect amounts that are reported in the combined financial statements andaccompanying disclosures. Estimates are used in determining the allocation of costs and expenses from IBM,and are used in determining the following, among others: revenue, costs to complete service contracts,income taxes, pension assumptions, valuation of assets including goodwill and intangible assets, thedepreciable and amortizable lives of other long-lived assets, loss contingencies, allowance for credit losses,deferred transition costs and other matters. These estimates are based on management’s best knowledge ofcurrent events, historical experience, actions that the Company may undertake in the future and on variousother assumptions that are believed to be reasonable under the circumstances, including the macroeconomicimpacts of the COVID-19 pandemic (beginning in 2020). Actual results may be different from these estimates.
F-10

Revenue
The Company accounts for a contract with a client when it has written approval, the contract iscommitted, the rights of the parties, including payment terms, are identified, the contract has commercialsubstance and consideration is probable of collection.
Revenue is recognized when, or as, control of a promised product or service transfers to a client, in anamount that reflects the consideration to which the Company expects to be entitled in exchange fortransferring those products or services. If the consideration promised in a contract includes a variableamount, the Company estimates the amount to which it expects to be entitled using either the expected valueor most likely amount method. The Company’s contracts may include terms that could cause variability inthe transaction price, including, for example, rebates, volume discounts, service-level penalties, andperformance bonuses or other forms of contingent revenue.
The Company only includes estimated amounts in the transaction price to the extent it is probable thata significant reversal of cumulative revenue recognized will not occur when the uncertainty associated withthe variable consideration is resolved. The Company may not be able to reliably estimate contingent revenuein certain long-term arrangements due to uncertainties that are not expected to be resolved for a longperiod of time or when the Company’s experience with similar types of contracts is limited. The Company’sarrangements infrequently include contingent revenue. Changes in estimates of variable consideration areincluded in note C, “Revenue Recognition.”
The Company’s standard billing terms are that payment is due upon receipt of invoice, payable within30 days. Invoices are generally issued as control transfers and/or as services are rendered, either at monthlyor quarterly intervals or upon achievement of contractual milestones. In some services contracts, the Companybills the client prior to recognizing revenue from performing the services. In these cases, deferred income ispresented in the Combined Balance Sheet. In other services contracts, the Company performs the servicesprior to billing the client. When the Company performs services prior to billing the client in design andbuild contracts, the right to consideration is typically subject to milestone completion or client acceptanceand the unbilled accounts receivable is classified as a contract asset. Refer to note C, “Revenue Recognition,”for contract assets for the periods presented. Contract assets are included in prepaid expenses and othercurrent assets in the Combined Balance Sheet. The remaining amount of unbilled accounts receivable of$358 million and $389 million at December 31, 2020 and 2019, respectively, is included in notes and accountsreceivable in the Combined Balance Sheet. Additionally, in determining the transaction price, the Companyadjusts the promised amount of consideration for the effects of the time value of money if the billingterms are not standard and the timing of payments agreed to by the parties to the contract provide theclient or the Company with a significant benefit of financing, in which case the contract contains a significantfinancing component. As a practical expedient, the Company does not account for significant financingcomponents if the period between when the Company transfers the promised product or service to the clientand when the client pays for that product or service will be one year or less.
The Company may include subcontractor services or third-party vendor equipment or software incertain integrated services arrangements. In these types of arrangements, revenue from sales of third-partyvendor products or services is recorded net of costs when the Company is acting as an agent between the clientand the vendor, and gross when the Company is the principal for the transaction. To determine whetherthe Company is an agent or principal, the Company considers whether it obtains control of the products orservices before they are transferred to the customer. In making this evaluation, several factors areconsidered, most notably whether the Company has primary responsibility for fulfillment to the client, aswell as inventory risk and pricing discretion.
The Company reports revenue net of any revenue-based taxes assessed by governmental authoritiesthat are imposed on and concurrent with specific revenue-producing transactions.
In addition to the aforementioned general policies, the following are the specific revenue recognitionpolicies for arrangements with multiple performance obligations and for the Company’s offerings.
Arrangements with Multiple Performance Obligations
The Company’s capabilities as an infrastructure services company include offerings that often encompassmultiple types of services and may integrate various IBM or other Original Equipment Manufacturer (OEM)
F-11

hardware and/or OEM software components. When an arrangement contains multiple distinct performanceobligations, revenue follows the specific revenue recognition policies for each deliverable, depending on thetype of offering. To the extent that a product or service in multiple performance obligation arrangements issubject to other specific accounting guidance, such as leasing guidance, that product or service is accountedfor in accordance with such specific guidance. For all other products or services in these arrangements, theCompany determines if the products or services are distinct and allocates the consideration to eachdistinct performance obligation on a relative standalone selling price basis.
When products and services are not distinct, the Company determines an appropriate measure ofprogress based on the nature of its overall promise for the single performance obligation.
The revenue policies below are applied to each performance obligation, as applicable.
Services
The Company delivers transformation and secure cloud services capabilities, insights, and depth ofexpertise to modernize and manage IT environments based on its customers’ unique patterns oftransformation at scale. The Company offers services such as cloud managed services, data services, securityand resiliency services, enterprise infrastructure services, digital workplace services, network services,managed Independent Software Vendor services, and distributed cloud services to support its customersthrough technological change. Many of these services can be delivered entirely or partially through cloud or as-a-Service delivery models. The Company’s services are provided on a time-and-material basis, as a fixed-price contract or as a fixed-price per measure of output contract and the contract terms range from less thanone year to over 10 years. The Company typically satisfies the performance obligation and recognizesrevenue over time in services arrangements because the client simultaneously receives and consumes thebenefits provided as the Company performs the services.
In outsourcing, other managed services, application management, and other cloud-based servicesarrangements, the Company determines whether the services performed during the initial phases of thearrangement, such as setup activities, are distinct. In most cases, the arrangement is a single performanceobligation comprised of a series of distinct services that are substantially the same and that have the samepattern of transfer (i.e., distinct days of service). The Company applies a measure of progress (typicallytime-based) to any fixed consideration and allocates variable consideration to the distinct periods ofservice based on usage. As a result, revenue is generally recognized over the period the services are providedon a usage basis. This results in revenue recognition that corresponds with the value to the client of theservices transferred to date relative to the remaining services promised.
Revenue from time-and-material contracts is recognized on an output basis as labor hours are deliveredand/or direct expenses are incurred. Revenue from as-a-Service type contracts is recognized either on astraight-line basis or on a usage basis, depending on the terms of the arrangement (such as whether theCompany is standing ready to perform or whether the contract has usage-based metrics). If an as-a-Servicecontract includes setup activities, those promises in the arrangement are evaluated to determine if theyare distinct.
In design and build arrangements, revenue is recognized based on progress toward completion of theperformance obligation using a cost-to-cost measure of progress (e.g., labor costs incurred to date asa percentage of the total estimated labor costs to fulfill the contract). The estimation of cost at completionis complex, subject to many variables and requires significant judgment. Changes in original estimates arereflected in revenue on a cumulative catch-up basis in the period in which the circumstances that gave riseto the revision become known by the Company. Refer to note C, “Revenue Recognition,” for the amount ofrevenue recognized in the reporting period on a cumulative catch-up basis (i.e., from performanceobligations satisfied, or partially satisfied, in previous periods).
The Company performs ongoing profitability analyses of its design and build services contractsaccounted for using a cost-to-cost measure of progress to determine whether the latest estimates ofrevenues, costs and profits require updating. If at any time these estimates indicate that the contract will beunprofitable, the entire estimated loss for the remainder of the contract is recorded immediately. For othertypes of services contracts, any losses are recorded as incurred.
F-12

The Company’s services offerings may include the integration and/or sale of IBM or OEM hardwareand/or software components. Contracts that include hardware and/or software components are evaluated todetermine if they are distinct performance obligations in accordance with the “Arrangements with MultiplePerformance Obligations” section above. Further, the Company assesses contracts with customers todetermine whether an embedded lease arrangement exists. A contract with a customer includes an embeddedlease when the Company grants the customer a right to control the use of an identified asset for a periodof time in exchange for consideration. Generally, the hardware or software utilized in outsourcing, managedservices, application management, and other cloud-based services arrangements are not distinct and donot meet the criteria to be considered an embedded lease. As a result, revenue is generally recognized overtime, consistent with the services provided to the customer.
For distinct hardware sales, revenue is recognized when control has transferred to the customer whichtypically occurs when the hardware has been shipped to the client, risk of loss has transferred to the clientand the Company has a present right to payment for the hardware.
Contracts are only determined to have distinct software components when the arrangement includes alicense to the software. To meet this criterion, the customer must have both the contractual right to takepossession of the software at any time, and the ability to feasibly run the software on its own hardware orhire another party to host the software without significant economic or functional penalty. Revenue fordistinct software is typically recognized at the beginning of the services arrangement as that is the point intime the customer can access and benefit from the software, and the point at which they have a legal rightto possession.
Standalone Selling Price
The Company allocates the transaction price to each performance obligation on a relative standaloneselling price basis. The standalone selling price (SSP) is the price at which the Company would sell a promisedproduct or service separately to a client. In most cases, the Company is able to establish SSP based on theobservable prices of products or services sold separately in comparable circumstances to similar clients. Forthird-party hardware or software components, the Company is able to establish SSP based on the costfrom the vendor. Historically, SSP for IBM hardware and software components offered in the Company’ssolutions were based on IBM’s SSP for these products and were approved and determined by IBM’smanagement. The Company reassesses SSP ranges on a periodic basis or when facts and circumstanceschange.
In certain instances, the Company may not be able to establish a SSP range based on observable pricesand the Company estimates SSP. The Company estimates SSP by considering multiple factors including,but not limited to, overall market conditions, including geographic or regional specific factors, competitivepositioning, competitor actions, internal costs, profit objectives and pricing practices. Estimating SSP is aformal process that includes review and approval by the Company’s management.
Cost of Services
Recurring operating costs for services contracts are recognized as incurred. Certain eligible, nonrecurringcosts (i.e., setup costs) incurred in the initial phases of outsourcing contracts and other cloud-based servicescontracts, are capitalized when the costs relate directly to the contract, the costs generate or enhanceresources of the Company that will be used in satisfying the performance obligation in the future, and thecosts are expected to be recovered. These costs consist of transition and setup costs related to the installationof systems and processes and other deferred fulfillment costs, including, for example, prepaid assets usedin services contracts (i.e., prepaid software or prepaid maintenance). Capitalized costs are amortized on astraight-line basis over the expected period of benefit, which approximates the pattern of transfer to the clientof the services to which the asset relates and includes anticipated contract renewals or extensions.Additionally, fixed assets associated with these contracts are capitalized and depreciated on a straight-linebasis over the expected useful life of the asset and recorded in cost of sales. If an asset is contract specific andcannot be repurposed, then the depreciation period is the shorter of the useful life of the asset or thecontract term. Amounts paid to clients in excess of the fair value of acquired assets used in outsourcingarrangements are deferred and amortized on a straight-line basis as a reduction of revenue over the expectedperiod of benefit. The Company performs periodic reviews to assess the recoverability of deferred contract
F-13

transition and setup costs. If the carrying amount is deemed not recoverable, an impairment loss isrecognized. Refer to note C, “Revenue Recognition,” for the amount of deferred costs to fulfill a contract atDecember 31, 2020 and 2019.
In situations in which an outsourcing contract is terminated, the terms of the contract may require theclient to reimburse the Company for the recovery of unbilled accounts receivable, unamortized deferredcontract costs and additional costs incurred by the Company to transition the services.
Incremental Costs of Obtaining a Contract
Incremental costs of obtaining a contract (e.g., sales commissions) are capitalized and amortized on astraight-line basis, which approximates the pattern that the assets’ economic benefits are expected to beconsumed, over the expected customer relationship period if the Company expects to recover those costs.The expected customer relationship period is determined based on the average customer relationship period,including expected renewals, for each offering type and ranges from three to six years. Expected renewalperiods are only included in the expected customer relationship period if commission amounts paid uponrenewal are not commensurate with amounts paid on the initial contract. Incremental costs of obtaining acontract include only those costs the Company incurs to obtain a contract that it would not have incurred ifthe contract had not been obtained. The Company has determined that certain commissions programsmeet the requirements to be capitalized. Some commission programs are not subject to capitalization as thecommission expense is paid and recognized as the related revenue is recognized. Additionally, as a practicalexpedient, the Company expenses costs to obtain a contract as incurred if the amortization period would havebeen a year or less. These costs are included in selling, general and administrative expenses.
Expense and Other Income
Selling, General and Administrative
Selling, general and administrative (SG&A) expense is charged to income as incurred, except forcertain sales commissions, which are capitalized and amortized. For further information regardingcapitalizing sales commissions, see “Incremental Costs of Obtaining a Contract” above. Expenses ofpromoting and selling services are classified as selling expense and, in addition to sales commissions, includesuch items as compensation, advertising and travel. General and administrative expense includes suchitems as compensation, legal costs, office supplies, non-income taxes, insurance and office rental. In addition,general and administrative expense includes other operating items such as allowance for credit losses,workforce rebalancing charges for contractually obligated payments to employees terminated in the ongoingcourse of business and amortization of certain intangible assets. A portion of SG&A is allocated to theCompany by IBM based on direct usage, with the remainder allocated on a pro-rata basis of gross profit,headcount, asset ownership or other measures the Company has determined as reasonable. For furtherinformation, see note O, “Related Party Transactions.”
Advertising and Promotional Expense
Advertising and promotional costs are expensed as incurred. Advertising and promotional expense,which includes media, agency, and promotional expense directly incurred by the Company was $34 million,$55 million and $40 million in 2020, 2019 and 2018, respectively, and is recorded in SG&A expense in theCombined Income Statement.
Research, Development and Engineering
Research, development and engineering (RD&E) costs are expensed as incurred and primarily consistof personnel costs as well as an allocation of facilities, depreciation, benefits and internal-use software costs.RD&E expense was $76 million in 2020, $83 million in 2019 and $69 million in 2018.
Other (Income) and Expense
Other (income) and expense primarily consists of expense related to certain components of retirement-related costs, including interest costs, expected return on plan assets, amortization of prior service costs
F-14

(credits), curtailments and settlements and other net periodic pension/post-retirement benefit costs. Alsoincluded are allocations of gains and losses from foreign currency transactions, certain real estate transactionsand corporate expenses. For more information, see note O, “Related Party Transactions”.
Intangible Assets Including Goodwill
Goodwill attributed to the Company represents the historical goodwill balances in the Parent’smanaged infrastructure services business arising from acquisitions specific to the Company. Goodwillrepresents the excess of the purchase price over the fair value of net assets, including the amount assignedto identifiable intangible assets. The primary drivers that generate goodwill are the value of synergies betweenthe acquired entities and the Company and the acquired assembled workforce, neither of which qualifiesas a separately identifiable intangible asset. Goodwill recorded in an acquisition is assigned to applicablereporting units based on expected revenues or expected cash flows. Identifiable intangible assets with finitelives are amortized on a straight-line basis over their useful lives, which approximates the pattern that theassets’ economic benefits are expected to be consumed over time. Amortization of completed technologyis recorded in cost of services, and amortization of all other intangible assets is recorded in SG&A expense.Acquisition-related costs, including advisory, legal, accounting, valuation, and pre-close and other costs,are typically expensed in the periods in which the costs are incurred and are recorded in SG&A expense. Theresults of operations of acquired businesses are included in the combined financial statements from theacquisition date.
Impairment
Long-lived assets, other than goodwill, are tested for impairment whenever events or changes incircumstances indicate that the carrying amount may not be recoverable. The impairment test is based onundiscounted cash flows and, if impaired, the asset is written down to fair value based on either discountedcash flows or appraised values. Goodwill is tested for impairment at least annually and whenever changesin circumstances indicate an impairment may exist. The goodwill impairment test is performed at the reportingunit level.
Depreciation and Amortization
Property and equipment are carried at cost and depreciated over their estimated useful lives using thestraight-line method. The estimated useful lives of certain depreciable assets are as follows: buildings, 30 to50 years; land improvements, 20 years; office and other equipment, 2 to 20 years; and information technologyequipment, 1.5 to 5 years. Leasehold improvements are amortized over the shorter of their estimateduseful lives or the related lease term, rarely exceeding 10 years.
Within the Combined Statement of Cash Flows and in note D, “Segments,” the Company also includesthe amortization of deferred costs, such as contract setup costs and deferred fulfillment costs, in itsdepreciation/amortization totals. Capitalized costs are amortized on a straight-line basis over the expectedperiod of benefit.
Environmental
The cost of internal environmental protection programs that are preventative in nature are expensed asincurred. When a cleanup program becomes likely, and it is probable that the Company will incur cleanupcosts and those costs can be reasonably estimated, the Company accrues remediation costs for knownenvironmental liabilities.
Asset Retirement Obligations
The Company records the fair value of Asset retirement obligations (ARO), which are legal obligationsassociated with the retirement of long-lived assets, based on an allocation from IBM using headcount andother reasonable allocation methodologies. The related asset retirement costs are capitalized by increasing thecarrying amount of the related assets by the same amount as the liability. Asset retirement costs aresubsequently depreciated over the useful lives of the related assets. Subsequent to initial recognition, the
F-15

Company records period-to-period changes in the ARO liability resulting from the passage of time ininterest expense and revisions to either the timing or the amount of the original expected cash flows to therelated assets.
Defined Benefit Pension and Nonpension Postretirement Benefit Plans
The defined benefit plans in which the Company participates relate primarily to plans sponsored by theParent. The Company accounts for these plans as multi-employer plans, and therefore the related assets andliabilities are not reflected in the Combined Balance Sheet. The Combined Income Statement reflects aproportional allocation of net periodic benefit cost for the multi-employer plans associated with the Company.
The Company also participates in self-sponsored plans (single employer plans). Single employer plansreflected in the combined financial statements represent the historical results of the legal entities that arebeing transferred to the Company. Refer to note N, “Retirement Related Benefits” for further details on theaccounting for multi-employer and single employer plans.
For single employer plans, the funded status is recognized in the Combined Balance Sheet. The fundedstatus is measured as the difference between the fair value of plan assets and the benefit obligation atDecember 31, the measurement date. For defined benefit pension plans, the benefit obligation is the projectedbenefit obligation (PBO), which represents the actuarial present value of benefits expected to be paid uponretirement based on employee services already rendered and estimated future compensation levels. For thenonpension postretirement benefit plans, the benefit obligation is the accumulated postretirement benefitobligation (APBO), which represents the actuarial present value of postretirement benefits attributed toemployee services already rendered. The fair value of plan assets represents the current market value of assetsheld in an irrevocable trust fund, held for the sole benefit of participants, which are invested by the trustfund. Overfunded plans, with the fair value of plan assets exceeding the benefit obligation, are aggregatedand recorded as a prepaid pension asset equal to this excess. Underfunded plans, with the benefit obligationexceeding the fair value of plan assets, are aggregated and recorded as a retirement and nonpensionpostretirement benefit obligation equal to this excess.
The current portion of the retirement and nonpension post-retirement benefit obligations representsthe actuarial present value of benefits payable in the next 12 months exceeding the fair value of plan assets,measured on a plan-by-plan basis. This obligation is recorded in compensation and benefits in the CombinedBalance Sheet.
Net periodic pension and nonpension postretirement benefit cost/(income) is recorded in the CombinedIncome Statement and includes service cost, interest cost, expected return on plan assets, amortization ofprior service costs/(credits) and (gains)/losses previously recognized as a component of other comprehensiveincome/(loss) (OCI). The service cost component of net benefit cost is recorded in Cost, SG&A andRD&E in the Combined Income Statement (unless eligible for capitalization) based on the employees’respective functions. The other components of net benefit cost are presented separately from service costwithin other (income) and expense in the Combined Income Statement.
(Gains)/losses and prior service costs/(credits) are recognized as a component of OCI in the CombinedStatement of Comprehensive Income as they arise. Those (gains)/losses and prior service costs/(credits) aresubsequently recognized as a component of net periodic pension and nonpension postretirement cost/(income)pursuant to the recognition and amortization provisions of applicable accounting guidance. (Gains)/lossesarise as a result of differences between actual experience and assumptions or as a result of changes in actuarialassumptions. Prior service costs/(credits) represent the cost of benefit changes attributable to prior servicegranted in plan amendments.
The measurement of benefit obligations and net periodic pension and nonpension postretirement cost/(income) is based on estimates and assumptions approved by the Company’s management. These valuationsreflect the terms of the plans and use participant-specific information such as compensation, age and yearsof service, as well as certain assumptions, including estimates of discount rates, expected return on plan assets,rate of compensation increases, interest crediting rates and mortality rates.
F-16

Defined Contribution Plans
The Parent offers various defined contribution plans for U.S. and non-U.S. employees. Contributionsare recorded when the employee renders service to the Company. The charge is recorded in Cost, SG&Aand RD&E in the Combined Income Statement based on the employees’ respective functions.
Stock-Based Compensation
Stock-based compensation represents the cost related to stock-based awards granted to employeesunder IBM’s stock-based compensation plans. The Company measures stock-based compensation cost atthe grant date, based on the estimated fair value of the award and recognizes the cost on a straight-line basis(net of estimated forfeitures) over the employee requisite service period. IBM grants the Company’semployees Restricted Stock Units (RSUs), including Retention Restricted Stock Units (RRSUs) andPerformance Share Units (PSUs); and periodically grants stock options. RSUs are stock awards granted toemployees that entitle the holder to shares of IBM common stock as the award vests, typically over a one- tofive-year period. PSUs are stock awards where the number of IBM shares ultimately received by theemployee depends on the Parent’s performance against specified targets and typically vest over a three-yearperiod. Over the performance period, the number of shares that will be issued is adjusted based upon theprobability of achievement of performance targets. The ultimate number of IBM shares issued and therelated compensation cost recognized as expense will be based on a comparison of the final performancemetrics to the specified targets. Dividend equivalents are not paid on the stock awards described above. Thefair value of the awards is determined and fixed on the grant date based on IBM’s stock price, adjustedfor the exclusion of dividend equivalents where applicable and for PSUs assumes that performance targetswill be achieved. The Company estimates the fair value of stock options using a Black-Scholes valuationmodel. Stock-based compensation cost is recorded in Cost, SG&A, and RD&E in the Combined IncomeStatement based on the employees’ respective functions.
The Company records deferred tax assets for awards that result in tax deductions in the combinedfinancial statements calculated using the separate return basis based on the amount of compensation costrecognized and the relevant statutory tax rates. The differences between the deferred tax assets recognized forfinancial reporting purposes and the actual tax deduction reported on the income tax return are recordedas a benefit or expense to the provision for income taxes in the Combined Income Statement.
Income Taxes
The Company’s operations have historically been included in certain tax returns filed by the Parent.Income tax expense and other income tax related information contained in the combined financial statementsare presented on a hypothetical separate return basis as if the Company filed separate tax returns. Theseparate return method applies the accounting guidance for income taxes to the standalone financialstatements as if the Company were a separate taxpayer and a standalone enterprise for the periods presented.Tax attributes have been reported based on the hypothetical separate return basis results for the periodspresented in the combined financial statements. The calculation of income taxes on a hypothetical separatereturn basis requires a considerable amount of judgment and use of both estimates and allocations, thereforeitems of current and deferred taxes may not be reflective of the actual tax balances subsequent to theperiods presented. Current income tax liabilities including amounts for unrecognized tax benefits related toKyndryl’s activities included in the Parent’s income tax returns are assumed to be immediately settled withParent and are relieved through the Net Parent investment account in the Combined Balance Sheet and Nettransfers from Parent in the Combined Statements of Cash Flows.
Income tax expense is based on reported income before income taxes. Deferred income taxes reflect thetax effect of temporary differences between asset and liability amounts that are recognized for financialreporting purposes and the amounts that are recognized for income tax purposes. These deferred taxes aremeasured by applying currently enacted tax laws. The U.S. Tax Cuts and Jobs Act (U.S. tax reform) introducedGlobal Intangible Low Taxed Income (GILTI), which subjects a U.S. shareholder to current tax on incomeearned by certain foreign subsidiaries. GAAP allows companies to either (1) recognize deferred taxes fortemporary differences that are expected to reverse as GILTI in future years or (2) account for taxes onGILTI as period costs in the year the tax is incurred. Beginning in 2018, IBM elected to include GILTI inmeasuring deferred taxes. The combined financial statements for Kyndryl have been prepared using the period
F-17

cost method since there is no GILTI inclusion in the periods presented and deferred GILTI does not, and isnot expected to have, a significant impact in the combined financial statements or when it is on a stand-alone basis, post separation. Valuation allowances are recognized to reduce deferred tax assets to the amountthat will more likely than not be realized on a hypothetical separate return basis. In assessing the need for avaluation allowance, management considers all available evidence for each jurisdiction including past operatingresults, estimates of future taxable income and the feasibility of ongoing tax planning strategies/actions.When there is a change in the determination as to the amount of deferred tax assets that can be realized, thevaluation allowance is adjusted with a corresponding impact to provision for income taxes in the period inwhich such determination is made.
The Company recognizes additional tax expense when it believes that certain positions may not be fullysustained upon review by tax authorities. Benefits from tax positions are measured at the largest amount ofbenefit that is greater than 50 percent likely of being realized upon settlement. Interest and penalties, ifany, related to accrued liabilities for potential tax assessments are included in provision for income taxes.
Translation of Non-U.S. Currency Amounts
Assets and liabilities of non-U.S. subsidiaries that have a local functional currency are translated toU.S. dollars at year-end exchange rates. Translation adjustments are recorded in OCI. Income and expenseitems are translated at weighted-average rates of exchange prevailing during the year.
Inventory, property and equipment — net and other non-monetary assets and liabilities of non-U.S.subsidiaries and branches that operate in U.S. dollars are translated at the approximate exchange ratesprevailing when the Company acquired the assets or liabilities. All other assets and liabilities denominatedin a currency other than U.S. dollars are translated at year-end exchange rates with the transaction gain or lossrecognized in other (income) and expense. Income and expense items are translated at the weighted-average rates of exchange prevailing during the year. These translation gains and losses are included in netincome for the period in which exchange rates change.
Derivative Financial Instruments
Kyndryl does not independently execute derivative financial instruments to manage its foreign currencyrisk and instead participates in a centralized foreign currency hedging program administered by IBM. Thehedging activity allocated to Kyndryl is for the management of the Company’s forecasted foreign currencyexpenses.
Accordingly, the Combined Income Statement includes the impact of IBM’s derivative financialinstruments designated as cash flow hedges to manage foreign currency risk that is deemed to be associatedwith the Company’s operations and has been allocated to the Company based on its pro rata share of theunderlying items hedged, where applicable, with the remainder allocated on a pro-rata basis of revenue. Noassets or liabilities are reflected in the Combined Balance Sheet from amounts related to derivatives andhedging activities. In 2020, 2019 and 2018 the Company recognized net gains from derivatives of $7 million,$19 million and $9 million, respectively, in Cost of services. The Company recognized a net loss fromderivatives of $1 million and net gains of $12 million and $1 million in 2020, 2019 and 2018 respectively, inSG&A expense. In 2020 and 2019 the Company recognized net gains from derivatives of $6 million and$20 million respectively, and recognized a net loss of $1 million in 2018 in Other (income) and expense.
Combined Statement of Cash Flows
IBM uses a centralized approach to cash management and the financing of its operations. Cash ismanaged centrally through bank accounts controlled and maintained by IBM. Accordingly, cash and cashequivalents held by IBM at the corporate level were not attributable to the Company for any of the periodspresented. Transfers of cash, both to and from IBM’s centralized cash management system are reflectedas financing activities in the Combined Statement of Cash Flows.
The Company has generated positive net cash flow from operations in each of the three years presented,despite incurring net losses in each of those years. For the year ended December 31, 2020, the Companyincurred significant workforce rebalancing charges, and, more recently, has undertaken other productivity
F-18
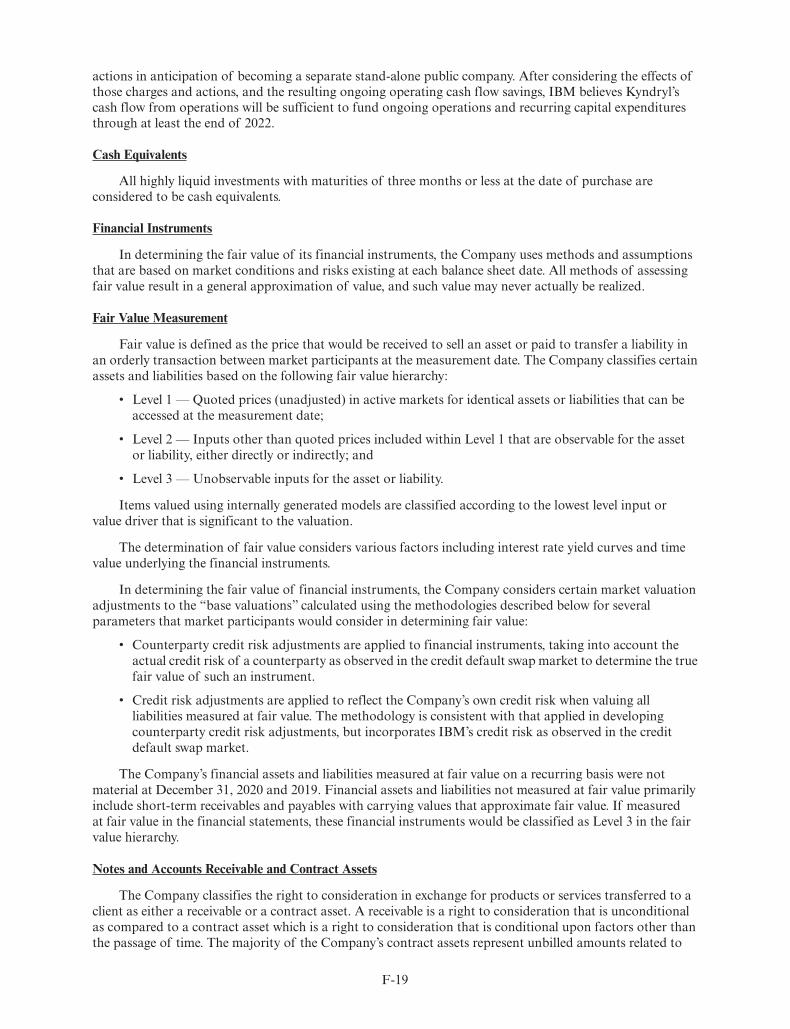
actions in anticipation of becoming a separate stand-alone public company. After considering the effects ofthose charges and actions, and the resulting ongoing operating cash flow savings, IBM believes Kyndryl’scash flow from operations will be sufficient to fund ongoing operations and recurring capital expendituresthrough at least the end of 2022.
Cash Equivalents
All highly liquid investments with maturities of three months or less at the date of purchase areconsidered to be cash equivalents.
Financial Instruments
In determining the fair value of its financial instruments, the Company uses methods and assumptionsthat are based on market conditions and risks existing at each balance sheet date. All methods of assessingfair value result in a general approximation of value, and such value may never actually be realized.
Fair Value Measurement
Fair value is defined as the price that would be received to sell an asset or paid to transfer a liability inan orderly transaction between market participants at the measurement date. The Company classifies certainassets and liabilities based on the following fair value hierarchy:
• Level 1 — Quoted prices (unadjusted) in active markets for identical assets or liabilities that can beaccessed at the measurement date;
• Level 2 — Inputs other than quoted prices included within Level 1 that are observable for the assetor liability, either directly or indirectly; and
• Level 3 — Unobservable inputs for the asset or liability.
Items valued using internally generated models are classified according to the lowest level input orvalue driver that is significant to the valuation.
The determination of fair value considers various factors including interest rate yield curves and timevalue underlying the financial instruments.
In determining the fair value of financial instruments, the Company considers certain market valuationadjustments to the “base valuations” calculated using the methodologies described below for severalparameters that market participants would consider in determining fair value:
• Counterparty credit risk adjustments are applied to financial instruments, taking into account theactual credit risk of a counterparty as observed in the credit default swap market to determine the truefair value of such an instrument.
• Credit risk adjustments are applied to reflect the Company’s own credit risk when valuing allliabilities measured at fair value. The methodology is consistent with that applied in developingcounterparty credit risk adjustments, but incorporates IBM’s credit risk as observed in the creditdefault swap market.
The Company’s financial assets and liabilities measured at fair value on a recurring basis were notmaterial at December 31, 2020 and 2019. Financial assets and liabilities not measured at fair value primarilyinclude short-term receivables and payables with carrying values that approximate fair value. If measuredat fair value in the financial statements, these financial instruments would be classified as Level 3 in the fairvalue hierarchy.
Notes and Accounts Receivable and Contract Assets
The Company classifies the right to consideration in exchange for products or services transferred to aclient as either a receivable or a contract asset. A receivable is a right to consideration that is unconditionalas compared to a contract asset which is a right to consideration that is conditional upon factors other thanthe passage of time. The majority of the Company’s contract assets represent unbilled amounts related to
F-19
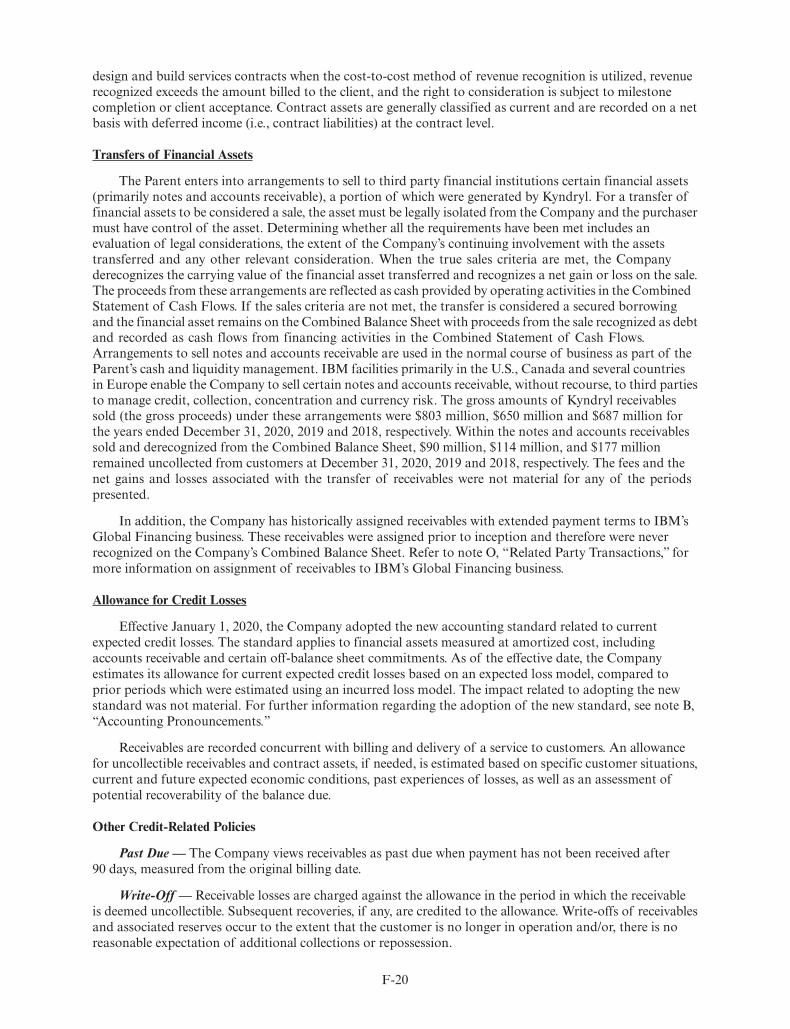
design and build services contracts when the cost-to-cost method of revenue recognition is utilized, revenuerecognized exceeds the amount billed to the client, and the right to consideration is subject to milestonecompletion or client acceptance. Contract assets are generally classified as current and are recorded on a netbasis with deferred income (i.e., contract liabilities) at the contract level.
Transfers of Financial Assets
The Parent enters into arrangements to sell to third party financial institutions certain financial assets(primarily notes and accounts receivable), a portion of which were generated by Kyndryl. For a transfer offinancial assets to be considered a sale, the asset must be legally isolated from the Company and the purchasermust have control of the asset. Determining whether all the requirements have been met includes anevaluation of legal considerations, the extent of the Company’s continuing involvement with the assetstransferred and any other relevant consideration. When the true sales criteria are met, the Companyderecognizes the carrying value of the financial asset transferred and recognizes a net gain or loss on the sale.The proceeds from these arrangements are reflected as cash provided by operating activities in the CombinedStatement of Cash Flows. If the sales criteria are not met, the transfer is considered a secured borrowingand the financial asset remains on the Combined Balance Sheet with proceeds from the sale recognized as debtand recorded as cash flows from financing activities in the Combined Statement of Cash Flows.Arrangements to sell notes and accounts receivable are used in the normal course of business as part of theParent’s cash and liquidity management. IBM facilities primarily in the U.S., Canada and several countriesin Europe enable the Company to sell certain notes and accounts receivable, without recourse, to third partiesto manage credit, collection, concentration and currency risk. The gross amounts of Kyndryl receivablessold (the gross proceeds) under these arrangements were $803 million, $650 million and $687 million forthe years ended December 31, 2020, 2019 and 2018, respectively. Within the notes and accounts receivablessold and derecognized from the Combined Balance Sheet, $90 million, $114 million, and $177 millionremained uncollected from customers at December 31, 2020, 2019 and 2018, respectively. The fees and thenet gains and losses associated with the transfer of receivables were not material for any of the periodspresented.
In addition, the Company has historically assigned receivables with extended payment terms to IBM’sGlobal Financing business. These receivables were assigned prior to inception and therefore were neverrecognized on the Company’s Combined Balance Sheet. Refer to note O, “Related Party Transactions,” formore information on assignment of receivables to IBM’s Global Financing business.
Allowance for Credit Losses
Effective January 1, 2020, the Company adopted the new accounting standard related to currentexpected credit losses. The standard applies to financial assets measured at amortized cost, includingaccounts receivable and certain off-balance sheet commitments. As of the effective date, the Companyestimates its allowance for current expected credit losses based on an expected loss model, compared toprior periods which were estimated using an incurred loss model. The impact related to adopting the newstandard was not material. For further information regarding the adoption of the new standard, see note B,“Accounting Pronouncements.”
Receivables are recorded concurrent with billing and delivery of a service to customers. An allowancefor uncollectible receivables and contract assets, if needed, is estimated based on specific customer situations,current and future expected economic conditions, past experiences of losses, as well as an assessment ofpotential recoverability of the balance due.
Other Credit-Related Policies
Past Due — The Company views receivables as past due when payment has not been received after90 days, measured from the original billing date.
Write-Off — Receivable losses are charged against the allowance in the period in which the receivableis deemed uncollectible. Subsequent recoveries, if any, are credited to the allowance. Write-offs of receivablesand associated reserves occur to the extent that the customer is no longer in operation and/or, there is noreasonable expectation of additional collections or repossession.
F-20

Leases
When procuring goods or services, the Company determines whether an arrangement contains a leaseat its inception. As part of that evaluation, the Company considers whether there is an implicitly or explicitlyidentified asset in the arrangement and whether the Company, as the lessee, has the right to control the useof that asset.
In its ordinary course of business, the Company enters into leases as a lessee for property and equipment.The Company recognized right-of-use (ROU) assets and associated lease liabilities in the Combined BalanceSheet for leases with a term of more than 12 months when a majority percentage of utilization wasattributed to the Company. Refer to note G, “Leases,” for more information on allocation methodologies.The lease liabilities are measured at the lease commencement date and determined using the present value ofthe lease payments not yet paid and the Company’s incremental borrowing rate, which approximates therate at which the Parent would borrow on a secured basis in the country where the lease was executed. Theinterest rate implicit in the lease is generally not determinable in transactions where the Parent is the lessee.The ROU asset equals the lease liability adjusted for any initial direct costs (IDCs), prepaid rent and leaseincentives. The Company’s variable lease payments generally relate to payments tied to various indexes, non-lease components and payments above a contractual minimum fixed amount.
Operating leases are included in operating right-of-use assets — net, current operating lease liabilitiesand operating lease liabilities in the Combined Balance Sheet. Finance leases are included in property andequipment, short-term debt and long-term debt in the Combined Balance Sheet. The lease term includesoptions to extend or terminate the lease when it is reasonably certain that the Company will exercise thatoption.
The Company made a policy election to not recognize leases with a lease term of 12 months or less inthe Combined Balance Sheet.
For all asset classes, the Company has elected the lessee practical expedient to combine lease and non-lease components (e.g., maintenance services) and account for the combined unit as a single lease component.A significant portion of the Company’s lease portfolio is real estate, which are mainly accounted for asoperating leases, and are primarily used for corporate offices and data centers. The average term of the realestate leases is approximately five years. The Company also has equipment leases, such as IT equipment andvehicles, which have lease terms that range from two to five years. For certain of these operating andfinance leases, the Company applies a portfolio approach to account for the lease assets and lease liabilities.
NOTE B. ACCOUNTING PRONOUNCEMENTS
New Standards to be Implemented
Simplifying the Accounting for Income Taxes
Standard/Description — Issuance date: December 2019. This guidance simplifies various aspects ofincome tax accounting by removing certain exceptions to the general principle of the guidance and clarifiesand amends existing guidance to improve consistency in application.
Effective Date and Adoption Considerations — The guidance was effective January 1, 2021 and earlyadoption was permitted. The Company adopted the guidance on a prospective basis as of the effective date.
Effect on Financial Statements or Other Significant Matters — The guidance is not expected to have amaterial impact in the combined financial results.
Standards Implemented
Simplifying the Test for Goodwill Impairment
Standard/Description — Issuance date: January 2017. This guidance simplifies the goodwill impairmenttest by removing Step 2. It also requires disclosure of any reporting units that have zero or negative carryingamounts if they have goodwill allocated to them.
F-21

Effective Date and Adoption Considerations — The guidance was effective January 1, 2020 and earlyadoption was permitted. The Company adopted the guidance on a prospective basis as of the effective date.
Effect on Financial Statements or Other Significant Matters — The guidance did not have a materialimpact in the Company’s combined financial statements upon adoption.
Leases
Standard/Description — Issuance date: February 2016, with amendments in 2018 and 2019. Thisguidance requires lessees to recognize right-of-use (ROU) assets and lease liabilities for most leases in theCombined Balance Sheet. The guidance also requires qualitative and quantitative disclosures to assess theamount, timing and uncertainty of cash flows arising from leases.
Effective Date and Adoption Considerations — The Company adopted the guidance on its effective dateof January 1, 2019, using the transition option whereby prior comparative periods were not retrospectivelypresented in the combined financial statements. The Company elected the package of practical expedients notto reassess prior conclusions related to contracts containing leases, lease classification and initial directcosts and the lessee practical expedient to combine lease and non-lease components for all asset classes. TheCompany made a policy election to not recognize ROU assets and lease liabilities for short-term leases forall asset classes.
Effect on Financial Statements or Other Significant Matters — The guidance had a material impact onthe Combined Balance Sheet as of the effective date. As a lessee, at adoption, the Company recognizedoperating ROU assets of $1,217 million and operating lease liabilities of $1,226 million. The adoption ofthe new guidance had an immaterial effect on finance leases. The transition adjustment recognized in NetParent Investment on January 1, 2019 was not material. None of the other changes to the guidance had amaterial impact in the Company’s combined financial results at the effective date.
Financial Instruments — Credit Losses
Standard/Description — Issuance date: June 2016, with amendments in 2018, 2019, and 2020. Thischanges the guidance for credit losses based on an expected loss model rather than an incurred loss model.It requires the consideration of all available relevant information when estimating expected credit losses,including past events, current conditions and forecasts and their implications for expected credit losses. Italso expands the scope of financial instruments subject to impairment, including off-balance sheetcommitments and residual value.
Effective Date and Adoption Considerations — The guidance was effective January 1, 2020 with one-year early adoption permitted. The Company adopted the guidance as of the effective date, using thetransition methodology whereby prior comparative periods were not retrospectively presented in thecombined financial statements.
Effect on Financial Statements or Other Significant Matters — At January 1, 2020, the guidance didnot have a material impact in the Company’s combined financial results.
Reclassification of Certain Tax Effects from AOCI
Standard/Description — Issuance date: February 2018. In accordance with its accounting policy, theCompany releases income tax effects from AOCI once the reason the tax effects were established cease toexist (e.g., when available-for-sale debt securities are sold or if a pension plan is liquidated). This guidanceallows for the reclassification of stranded tax effects as a result of the change in tax rates from the Tax Cutsand Jobs Act (U.S. tax reform) to be recorded upon adoption of the guidance rather than at the actualcessation date.
Effective Date and Adoption Considerations — The guidance was effective January 1, 2019 with earlyadoption permitted. The Company adopted the guidance effective January 1, 2018.
Effect on Financial Statements or Other Significant Matters — At adoption on January 1, 2018, theamount reclassified from AOCI to Net Parent Investment was not material.
F-22

Revenue Recognition — Contracts with Customers
Standard/Description — Issuance date: May 2014 with amendments in 2015 and 2016. Revenuerecognition depicts the transfer of promised goods or services to customers in an amount that reflects theconsideration to which the entity expects to be entitled in exchange for those goods or services. The guidancealso requires specific disclosures relating to revenue recognition.
Effective Date and Adoption Considerations — The Company adopted the guidance on its effective dateof January 1, 2018 using the modified retrospective transition method.
Effect on Financial Statements or Other Significant Matters — As a result of adoption, the Companyrecorded a cumulative effect net increase to Net Parent investment of $154 million, primarily due to in-scope sales commissions previously recorded in the Combined Income Statement that were capitalized todeferred costs. The revenue guidance did not have a material impact in the Company’s combined financialresults. Refer to note C, “Revenue Recognition,” for additional information.
For all other standards that the Company adopted in the periods presented, there was no materialimpact in the combined financial results.
NOTE C. REVENUE RECOGNITION
Disaggregation of Revenue
The following table provides details of revenue by geography.
Revenue by Geography
($ in millions)For the year ended December 31: 2020 2019 2018
Americas* . . . . . . . . . . . . . . . . . . . . . . . . . . . . . . . . . . . . . . . . . . . . . . $ 7,401 $ 7,951 $ 8,581Europe/Middle East/Africa** . . . . . . . . . . . . . . . . . . . . . . . . . . . . . . . . . 7,289 7,566 8,162Japan+ . . . . . . . . . . . . . . . . . . . . . . . . . . . . . . . . . . . . . . . . . . . . . . . . 3,037 2,925 2,936Asia Pacific++ . . . . . . . . . . . . . . . . . . . . . . . . . . . . . . . . . . . . . . . . . . . 1,625 1,838 2,117Total revenue . . . . . . . . . . . . . . . . . . . . . . . . . . . . . . . . . . . . . . . . . . . . $19,352 $20,279 $21,796
* Includes related party revenue of $382 million in 2020, $363 million in 2019 and $369 million in 2018** Includes related party revenue of $124 million in 2020, $118 million in 2019 and $120 million in 2018+ Includes related party revenue of $70 million in 2020, $67 million in 2019 and $68 million in 2018++ Includes related party revenue of $68 million in 2020, $65 million in 2019 and $66 million in 2018
Remaining Performance Obligations
The remaining performance obligation (RPO) disclosure provides the aggregate amount of thetransaction price yet to be recognized as of the end of the reporting period and an explanation as to whenthe Company expects to recognize these amounts in revenue. It is intended to be a statement of overall workunder contract that has not yet been performed and does not include contracts in which the customer isnot committed. The customer is not considered committed when they are able to terminate for conveniencewithout payment of a substantive penalty. The disclosure also includes estimates of variable consideration.Additionally, as a practical expedient, the Company does not include contracts that have an original durationof one year or less. RPO estimates are subject to change and are affected by several factors, includingterminations, changes in the scope of contracts, periodic revalidations, adjustment for revenue that has notmaterialized and adjustments for currency.
At December 31, 2020 the aggregate amount of the transaction price allocated to RPO related tocustomer contracts that are unsatisfied or partially unsatisfied was $62 billion. Approximately 50 percent of
F-23

the amount is expected to be recognized as revenue in the subsequent two years, approximately 40 percent inthe subsequent three to five years and the balance thereafter.
Revenue Recognized for Performance Obligations Satisfied (or Partially Satisfied) in Prior Periods
For the year ended December 31, 2020, revenue was reduced by $21 million for performance obligationssatisfied (or partially satisfied) in previous periods.
Reconciliation of Contract Balances
The following table provides information about notes and accounts receivable, contract assets anddeferred income balances.
($ in millions)At December 31: 2020 2019
Notes and accounts receivable (net of allowances of $91 in 2020 and $82 in 2019) . . . . . $1,444 $1,790Contract assets* . . . . . . . . . . . . . . . . . . . . . . . . . . . . . . . . . . . . . . . . . . . . . . . . . . . 72 72Deferred income (current) . . . . . . . . . . . . . . . . . . . . . . . . . . . . . . . . . . . . . . . . . . . . 854 896Deferred income (noncurrent) . . . . . . . . . . . . . . . . . . . . . . . . . . . . . . . . . . . . . . . . . 543 615
* Included within prepaid expenses and other current assets in the Combined Balance Sheet.
The amount of revenue recognized during the year ended December 31, 2020 that was included withinthe deferred income balance at December 31, 2019 was $873 million.
The following table provides roll forwards of the notes and accounts receivable allowance for expectedcredit losses for the years ended December 31, 2020 and 2019.
($ in millions)January 1, 2020 Additions / (Releases) Write-offs Other* December 31, 2020
$ 82 $25 $(7) $(9) $91
January 1, 2019 Additions / (Releases) Write-offs Other* December 31, 2019
$ 111 $51 $(78) $(3) $82
* Primarily represents translation adjustments and reclassifications.
The contract assets allowance for expected credit losses was not material in the years ended December 31,2020 and 2019.
Deferred Costs
($ in millions)At December 31: 2020 2019
Capitalized costs to obtain a contract . . . . . . . . . . . . . . . . . . . . . . . . . . . . . . . . . . . . $ 269 $ 204Deferred costs to fulfill a contract
Deferred setup costs . . . . . . . . . . . . . . . . . . . . . . . . . . . . . . . . . . . . . . . . . . . . . . 1,369 1,439Other deferred fulfillment costs* . . . . . . . . . . . . . . . . . . . . . . . . . . . . . . . . . . . . . . 1,006 1,051
Total deferred costs** . . . . . . . . . . . . . . . . . . . . . . . . . . . . . . . . . . . . . . . . . . . . . . . $2,646 $2,694
* Includes related party cost of $94 million at December 31, 2020 and $21 million at December 31, 2019.** Of the total deferred costs, $1,205 million was current (related party $76 million) and $1,441 million
was noncurrent (related party $18 million) at December 31, 2020 and $1,133 million was current (relatedparty $19 million) and $1,561 million was noncurrent (related party $2 million) at December 31, 2019.
F-24

The amount of total deferred costs amortized during the year ended December 31, 2020 was$2,061 million which includes amortization of deferred transition and set-up costs of $478 million,amortization of prepaid software of $901 million and amortization of prepaid maintenance and otherprepaid items of $683 million. There were no material impairment losses incurred during 2020. Refer tonote A, “Significant Accounting Policies,” for additional information on deferred costs to fulfill a contractand capitalized costs of obtaining a contract.
NOTE D. SEGMENTS
The segments represent components of the Company for which separate financial information isavailable that is utilized on a regular basis by the chief operating decision maker (Infrastructure Servicesunit leader on a historical basis) in determining how to allocate resources and evaluate performance. Thesegments are determined based on several factors including client base, homogeneity of services offerings,delivery channels and similar economic characteristics.
Segment revenue and pre-tax income exclude any transactions between the segments and insteadfocuses on the external client view which is regularly assessed and reviewed by the chief operating decisionmaker. Intersegment revenue and pre-tax income primarily consists of fees for the utilization of global servicedelivery centers, and would therefore not be a meaningful metric to the readers of Kyndryl’s financialstatements.
The Company utilizes globally integrated support organizations to realize economies of scale andefficient use of resources. As a result, a considerable amount of expense is shared by all of the segments.This shared expense includes sales coverage, certain marketing functions, and support functions such asAccounting, Procurement, Legal, Human Resources, and Billing and Collections. Where practical, sharedexpenses are allocated on measurable drivers of expense, e.g., headcount. When a clear and measurable drivercannot be identified, shared expenses are allocated based on a financial basis that is consistent with theCompany’s management system, e.g. advertising expense is allocated based on the gross profit of thesegments.
The following tables reflect the results of the Company’s segments consistent with the managementmeasurement system utilized within the Company. Performance measurement is based on pre-tax income.These results are used, in part, by the chief operating decision maker, both in evaluating the performance of,and in allocating resources to, each of the segments.
In 2020, the company recorded $918 million in workforce rebalancing charges in the Combined IncomeStatement for severance and employee related benefits in accordance with the accounting guidance forongoing benefit arrangements. The impact to pre-tax income by segment was as follows: EMEA $722 million,Americas $117 million, Asia Pacific $51 million and Japan $28 million. The company expects the majorityof the employee exits to be completed by the end of 2021.
F-25

Management System Segment View
($ in millions) Americas EMEA Japan Asia PacificTotal
Segments
For the year ended December 31, 2020External revenue . . . . . . . . . . . . . . . . . . . . . . . . . . . $7,018 $ 7,166 $2,966 $1,557 $18,707Related party revenue . . . . . . . . . . . . . . . . . . . . . . . 382 124 70 68 645Total revenue . . . . . . . . . . . . . . . . . . . . . . . . . . . . . $7,401 $ 7,289 $3,037 $1,625 $19,352
Pre-tax income/(loss) . . . . . . . . . . . . . . . . . . . . . . . . $ (313) $(1,825) $ 195 $ 176 $ (1,766)
Revenue year-to-year change . . . . . . . . . . . . . . . . . . (6.9)% (3.7)% 3.8% (11.6)% (4.6)%Pre-tax income/loss year-to-year change . . . . . . . . . . nm 97.0% 9.3% (7.6)% 205.3%Pre-tax income/(loss) margin . . . . . . . . . . . . . . . . . . (4.2)% (25.0)% 6.4% 10.8% (9.1)%
For the year ended December 31, 2019External revenue . . . . . . . . . . . . . . . . . . . . . . . . . . . $7,588 $ 7,448 $2,858 $1,773 $19,666Related party revenue . . . . . . . . . . . . . . . . . . . . . . . 363 118 67 65 613Total revenue . . . . . . . . . . . . . . . . . . . . . . . . . . . . . $7,951 $ 7,566 $2,925 $1,838 $20,279
Pre-tax income/(loss) . . . . . . . . . . . . . . . . . . . . . . . . $ (22) $ (926) $ 179 $ 191 $ (579)
Revenue year-to-year change . . . . . . . . . . . . . . . . . . (7.3)% (7.3)% (0.4)% (13.2)% (7.0)%Pre-tax income/loss year-to-year change . . . . . . . . . . nm (7.9)% 70.8% 35.4% (8.1)%Pre-tax income/(loss) margin . . . . . . . . . . . . . . . . . . (0.3)% (12.2)% 6.1% 10.4% (2.9)%
For the year ended December 31, 2018External revenue . . . . . . . . . . . . . . . . . . . . . . . . . . . $8,211 $ 8,042 $2,868 $2,051 $21,172Related party revenue . . . . . . . . . . . . . . . . . . . . . . . 369 120 68 66 623Total revenue . . . . . . . . . . . . . . . . . . . . . . . . . . . . . $8,581 $ 8,162 $2,936 $2,117 $21,796
Pre-tax income/(loss) . . . . . . . . . . . . . . . . . . . . . . . . $ 130 $(1,006) $ 105 $ 141 $ (630)
Revenue year-to-year change . . . . . . . . . . . . . . . . . . (2.1)% 3.1% 3.9% (8.9)% (0.2)%Pre-tax income/loss year-to-year change . . . . . . . . . . (26.5)% 12.3% (28.3)% (20.5)% 59.5%Pre-tax income/(loss) margin . . . . . . . . . . . . . . . . . . 1.5% (12.3)% 3.6% 6.6% (2.9)%
nm — not meaningful
Segment Assets and Other Items
Each of the Company’s segments contain similar asset categories such as accounts receivable, deferredcontract costs, property and equipment, operating leases, and goodwill. Depreciation expense and capitalexpenditures that are reported by each segment also are consistent with the landlord ownership basis of assetassignment.
F-26
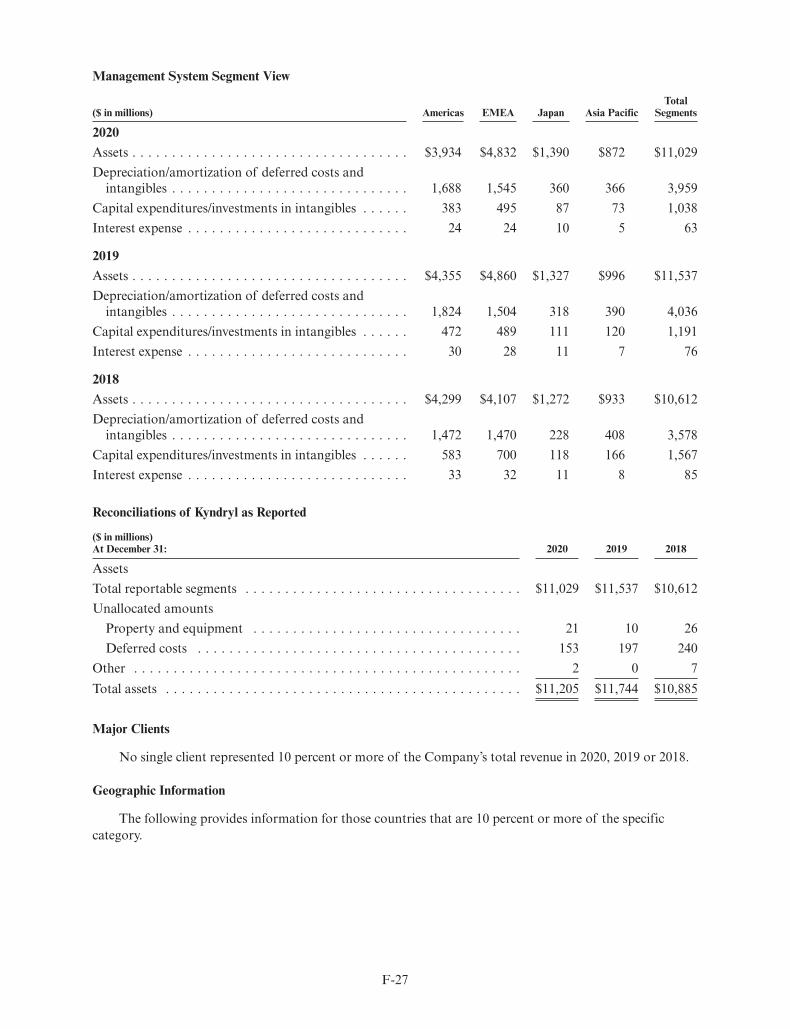
Management System Segment View
($ in millions) Americas EMEA Japan Asia PacificTotal
Segments
2020Assets . . . . . . . . . . . . . . . . . . . . . . . . . . . . . . . . . . . $3,934 $4,832 $1,390 $872 $11,029Depreciation/amortization of deferred costs and
intangibles . . . . . . . . . . . . . . . . . . . . . . . . . . . . . . 1,688 1,545 360 366 3,959Capital expenditures/investments in intangibles . . . . . . 383 495 87 73 1,038Interest expense . . . . . . . . . . . . . . . . . . . . . . . . . . . . 24 24 10 5 63
2019Assets . . . . . . . . . . . . . . . . . . . . . . . . . . . . . . . . . . . $4,355 $4,860 $1,327 $996 $11,537Depreciation/amortization of deferred costs and
intangibles . . . . . . . . . . . . . . . . . . . . . . . . . . . . . . 1,824 1,504 318 390 4,036Capital expenditures/investments in intangibles . . . . . . 472 489 111 120 1,191Interest expense . . . . . . . . . . . . . . . . . . . . . . . . . . . . 30 28 11 7 76
2018Assets . . . . . . . . . . . . . . . . . . . . . . . . . . . . . . . . . . . $4,299 $4,107 $1,272 $933 $10,612Depreciation/amortization of deferred costs and
intangibles . . . . . . . . . . . . . . . . . . . . . . . . . . . . . . 1,472 1,470 228 408 3,578Capital expenditures/investments in intangibles . . . . . . 583 700 118 166 1,567Interest expense . . . . . . . . . . . . . . . . . . . . . . . . . . . . 33 32 11 8 85
Reconciliations of Kyndryl as Reported
($ in millions)At December 31: 2020 2019 2018
AssetsTotal reportable segments . . . . . . . . . . . . . . . . . . . . . . . . . . . . . . . . . . . $11,029 $11,537 $10,612Unallocated amounts
Property and equipment . . . . . . . . . . . . . . . . . . . . . . . . . . . . . . . . . . 21 10 26Deferred costs . . . . . . . . . . . . . . . . . . . . . . . . . . . . . . . . . . . . . . . . . 153 197 240
Other . . . . . . . . . . . . . . . . . . . . . . . . . . . . . . . . . . . . . . . . . . . . . . . . . 2 0 7Total assets . . . . . . . . . . . . . . . . . . . . . . . . . . . . . . . . . . . . . . . . . . . . . $11,205 $11,744 $10,885
Major Clients
No single client represented 10 percent or more of the Company’s total revenue in 2020, 2019 or 2018.
Geographic Information
The following provides information for those countries that are 10 percent or more of the specificcategory.
F-27
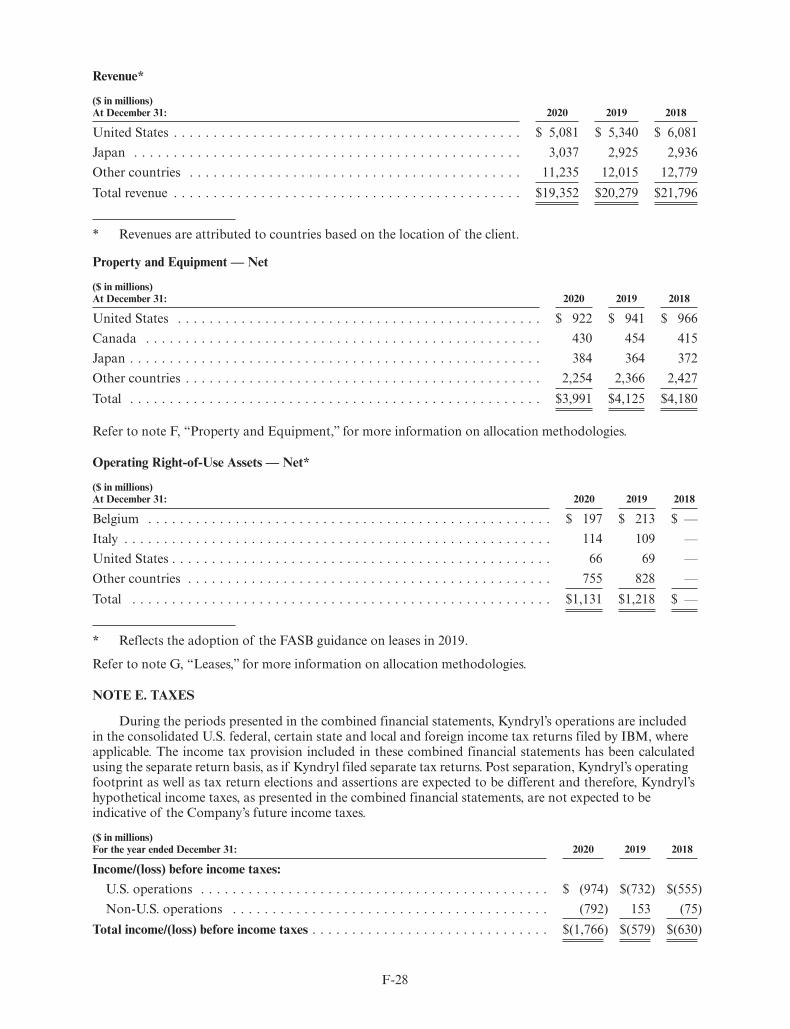
Revenue*
($ in millions)At December 31: 2020 2019 2018
United States . . . . . . . . . . . . . . . . . . . . . . . . . . . . . . . . . . . . . . . . . . . . $ 5,081 $ 5,340 $ 6,081Japan . . . . . . . . . . . . . . . . . . . . . . . . . . . . . . . . . . . . . . . . . . . . . . . . . 3,037 2,925 2,936Other countries . . . . . . . . . . . . . . . . . . . . . . . . . . . . . . . . . . . . . . . . . . 11,235 12,015 12,779Total revenue . . . . . . . . . . . . . . . . . . . . . . . . . . . . . . . . . . . . . . . . . . . . $19,352 $20,279 $21,796
* Revenues are attributed to countries based on the location of the client.
Property and Equipment — Net
($ in millions)At December 31: 2020 2019 2018
United States . . . . . . . . . . . . . . . . . . . . . . . . . . . . . . . . . . . . . . . . . . . . . . $ 922 $ 941 $ 966Canada . . . . . . . . . . . . . . . . . . . . . . . . . . . . . . . . . . . . . . . . . . . . . . . . . . 430 454 415Japan . . . . . . . . . . . . . . . . . . . . . . . . . . . . . . . . . . . . . . . . . . . . . . . . . . . . 384 364 372Other countries . . . . . . . . . . . . . . . . . . . . . . . . . . . . . . . . . . . . . . . . . . . . . 2,254 2,366 2,427Total . . . . . . . . . . . . . . . . . . . . . . . . . . . . . . . . . . . . . . . . . . . . . . . . . . . . $3,991 $4,125 $4,180
Refer to note F, “Property and Equipment,” for more information on allocation methodologies.
Operating Right-of-Use Assets — Net*
($ in millions)At December 31: 2020 2019 2018
Belgium . . . . . . . . . . . . . . . . . . . . . . . . . . . . . . . . . . . . . . . . . . . . . . . . . . . $ 197 $ 213 $ —Italy . . . . . . . . . . . . . . . . . . . . . . . . . . . . . . . . . . . . . . . . . . . . . . . . . . . . . . 114 109 —United States . . . . . . . . . . . . . . . . . . . . . . . . . . . . . . . . . . . . . . . . . . . . . . . . 66 69 —Other countries . . . . . . . . . . . . . . . . . . . . . . . . . . . . . . . . . . . . . . . . . . . . . . 755 828 —Total . . . . . . . . . . . . . . . . . . . . . . . . . . . . . . . . . . . . . . . . . . . . . . . . . . . . . $1,131 $1,218 $ —
* Reflects the adoption of the FASB guidance on leases in 2019.
Refer to note G, “Leases,” for more information on allocation methodologies.
NOTE E. TAXES
During the periods presented in the combined financial statements, Kyndryl’s operations are includedin the consolidated U.S. federal, certain state and local and foreign income tax returns filed by IBM, whereapplicable. The income tax provision included in these combined financial statements has been calculatedusing the separate return basis, as if Kyndryl filed separate tax returns. Post separation, Kyndryl’s operatingfootprint as well as tax return elections and assertions are expected to be different and therefore, Kyndryl’shypothetical income taxes, as presented in the combined financial statements, are not expected to beindicative of the Company’s future income taxes.
($ in millions)For the year ended December 31: 2020 2019 2018
Income/(loss) before income taxes:U.S. operations . . . . . . . . . . . . . . . . . . . . . . . . . . . . . . . . . . . . . . . . . . . . $ (974) $(732) $(555)Non-U.S. operations . . . . . . . . . . . . . . . . . . . . . . . . . . . . . . . . . . . . . . . . (792) 153 (75)
Total income/(loss) before income taxes . . . . . . . . . . . . . . . . . . . . . . . . . . . . . . $(1,766) $(579) $(630)
F-28

The provision for income taxes by geographic operations was as follows:
($ in millions)For the year ended December 31: 2020 2019 2018
U.S. operations . . . . . . . . . . . . . . . . . . . . . . . . . . . . . . . . . . . . . . . . . . . . . . . . . $ 27 $ 36 $ 18Non-U.S. operations . . . . . . . . . . . . . . . . . . . . . . . . . . . . . . . . . . . . . . . . . . . . . 219 328 332Total provision for income taxes . . . . . . . . . . . . . . . . . . . . . . . . . . . . . . . . . . . . . . $246 $364 $350
The components of the provision for income taxes by taxing jurisdiction were as follows:
($ in millions)For the year ended December 31: 2020 2019 2018
U.S. federal:Current . . . . . . . . . . . . . . . . . . . . . . . . . . . . . . . . . . . . . . . . . . . . . . . . . . . . $ — $ — $ —Deferred . . . . . . . . . . . . . . . . . . . . . . . . . . . . . . . . . . . . . . . . . . . . . . . . . . . . — — (13)
$ — $ — $ (13)U.S. state and local:
Current . . . . . . . . . . . . . . . . . . . . . . . . . . . . . . . . . . . . . . . . . . . . . . . . . . . . $ — $ — $ —Deferred . . . . . . . . . . . . . . . . . . . . . . . . . . . . . . . . . . . . . . . . . . . . . . . . . . . . — — (3)
$ — $ — $ (3)Non-U.S.
Current . . . . . . . . . . . . . . . . . . . . . . . . . . . . . . . . . . . . . . . . . . . . . . . . . . . . $304 $411 $312Deferred . . . . . . . . . . . . . . . . . . . . . . . . . . . . . . . . . . . . . . . . . . . . . . . . . . . . (58) (47) 54
$246 $364 $366Total provision for income taxes . . . . . . . . . . . . . . . . . . . . . . . . . . . . . . . . . . . . . . $246 $364 $350
A reconciliation of the provision for/(benefit from) income taxes at the statutory U.S. federal tax rateto the Company’s combined provision for income taxes was as follows:
($ in millions)For the year ended December 31: 2020 2019 2018
Statutory rate . . . . . . . . . . . . . . . . . . . . . . . . . . . . . . . . . . . . . . . . . . . . . . . . $(371) $(122) $(132)Tax differential on foreign income . . . . . . . . . . . . . . . . . . . . . . . . . . . . . . . . . . 104 109 136State and local . . . . . . . . . . . . . . . . . . . . . . . . . . . . . . . . . . . . . . . . . . . . . . . . (49) (37) (28)Valuation allowance . . . . . . . . . . . . . . . . . . . . . . . . . . . . . . . . . . . . . . . . . . . . 460 342 281Reserves for uncertain tax positions . . . . . . . . . . . . . . . . . . . . . . . . . . . . . . . . . 86 40 41Intercompany prepayment . . . . . . . . . . . . . . . . . . . . . . . . . . . . . . . . . . . . . . . (12) (3) 27Undistributed foreign earnings . . . . . . . . . . . . . . . . . . . . . . . . . . . . . . . . . . . . 18 20 19Other . . . . . . . . . . . . . . . . . . . . . . . . . . . . . . . . . . . . . . . . . . . . . . . . . . . . . . 10 15 6Total provision for income taxes . . . . . . . . . . . . . . . . . . . . . . . . . . . . . . . . . . . . $ 246 $ 364 $ 350
The provision for income taxes for the periods presented was attributable to losses in certain jurisdictionsthat cannot be benefited from and income tax expense in certain jurisdictions where taxable income isgenerated. The significant components of the provision include net change in valuation allowances recordedon benefits that cannot be recognized, tax differential on foreign income which includes the effects offoreign subsidiaries’ earnings taxed at rates other than the U.S statutory rate, as well as reserves for uncertaintax positions associated with current year activity.
The provision for income taxes for 2020 was $246 million compared to $364 million in 2019. Thedecrease in the provision was primarily driven by higher pre-tax losses in 2020 partially offset by an increasein valuation allowances in jurisdictions with losses. The provision for income taxes for 2019 was $364 million
F-29

compared to $350 million in 2018. The increase in the provision was primarily driven by lower pre-taxlosses in 2019 and a change in valuation allowance associated with jurisdictions with losses.
U.S. tax reform introduced GILTI, which subjects a U.S. shareholder to current tax on income earnedby certain foreign subsidiaries. GAAP allows companies to either (1) recognize deferred taxes for temporarydifferences that are expected to reverse as GILTI in future years or (2) account for taxes on GILTI asperiod costs in the year the tax is incurred. Beginning in 2018, IBM elected to include GILTI in measuringdeferred taxes. The combined financial statements for Kyndryl have been prepared using the period costmethod since there is no GILTI inclusion in the periods presented and deferred GILTI does not, and isnot expected to have, a significant impact on the combined financial statements or when it is on a stand-alone basis, post separation.
A reconciliation of the beginning and ending amount of unrecognized tax benefits was as follows:
($ in millions) 2020 2019 2018
Balance at January 1 . . . . . . . . . . . . . . . . . . . . . . . . . . . . . . . . . . . . . . . . . . . . . . $ — $ — $ —Additions based on tax positions related to the current year . . . . . . . . . . . . . . . . . . . 86 40 41Additions for tax positions of prior years . . . . . . . . . . . . . . . . . . . . . . . . . . . . . . . — — —Reductions for tax positions of prior years (including impacts due to a lapse of
statute) . . . . . . . . . . . . . . . . . . . . . . . . . . . . . . . . . . . . . . . . . . . . . . . . . . . . . . — — —Settlements (closed out to Net Parent investment) . . . . . . . . . . . . . . . . . . . . . . . . . . (86) (40) (41)Balance at December 31 . . . . . . . . . . . . . . . . . . . . . . . . . . . . . . . . . . . . . . . . . . . . $ — $ — $ —
The additions to unrecognized tax benefits related to each year presented were primarily attributable tonon-U.S. tax matters including transfer pricing, which are immediately settled with Parent and are relievedthrough the Net Parent investment account in the Combined Balance Sheet and Net transfers from Parent inthe Combined Statement of Cash Flows. The income tax provision has been prepared based on theassumption that any subsequent changes to the Company’s income tax liability as a result of tax examinationsare the responsibility of IBM. Therefore, the impact of any subsequent changes in assessment about thesustainability of related tax positions, including interest and penalties, are not presented in these combinedfinancial statements. In addition, due to this basis of presentation, Kyndryl is deemed to not be subject to taxexamination in any jurisdictions that could be reasonably expected to have a material impact on thecombined financial statements. Given there are no reserves for unrecognized tax benefits presented, there isno expectation of a significant increase or decrease in the unrecognized tax benefits within the next12 months. Upon separation, liabilities related to unrecognized tax benefits for which Kyndryl is liable andthat are not included within Kyndryl’s Combined Balance Sheet are expected to be reported within the post-separation Kyndryl balance sheet based upon tax authorities’ ability to assert Kyndryl may be the primaryobligor for historical taxes, among other factors.
The tax effects of temporary differences that give rise to significant portions of the deferred taxes wereas follows:
F-30

Deferred Tax Assets
($ in millions)At December 31: 2020 2019 2018
Retirement benefits . . . . . . . . . . . . . . . . . . . . . . . . . . . . . . . . . . . . . . . . . . $ 126 $ 107 $ 87Leases . . . . . . . . . . . . . . . . . . . . . . . . . . . . . . . . . . . . . . . . . . . . . . . . . . . 380 350 —Share-based and other compensation . . . . . . . . . . . . . . . . . . . . . . . . . . . . . . 37 40 46Domestic tax loss/credit carryforwards . . . . . . . . . . . . . . . . . . . . . . . . . . . . . 643 405 192Deferred income . . . . . . . . . . . . . . . . . . . . . . . . . . . . . . . . . . . . . . . . . . . . 50 52 85Foreign tax loss/credit carryforwards . . . . . . . . . . . . . . . . . . . . . . . . . . . . . . 509 307 207Bad debt, inventory and warranty reserves . . . . . . . . . . . . . . . . . . . . . . . . . . 37 51 39Depreciation . . . . . . . . . . . . . . . . . . . . . . . . . . . . . . . . . . . . . . . . . . . . . . . 123 128 72Restructuring charges . . . . . . . . . . . . . . . . . . . . . . . . . . . . . . . . . . . . . . . . . 59 11 5Section 163(j) interest limitation . . . . . . . . . . . . . . . . . . . . . . . . . . . . . . . . . 50 33 16Other . . . . . . . . . . . . . . . . . . . . . . . . . . . . . . . . . . . . . . . . . . . . . . . . . . . . 91 71 57Gross deferred tax assets . . . . . . . . . . . . . . . . . . . . . . . . . . . . . . . . . . . . . . $ 2,105 $1,555 $ 806Less: valuation allowance . . . . . . . . . . . . . . . . . . . . . . . . . . . . . . . . . . . . . . (1,110) (650) (308)Net deferred tax assets . . . . . . . . . . . . . . . . . . . . . . . . . . . . . . . . . . . . . . . . $ 995 $ 905 $ 498
Deferred Tax Liabilities
($ in millions)At December 31: 2020 2019 2018
Depreciation . . . . . . . . . . . . . . . . . . . . . . . . . . . . . . . . . . . . . . . . . . . . . . . . . . $203 $212 $206Goodwill and intangible assets . . . . . . . . . . . . . . . . . . . . . . . . . . . . . . . . . . . . . . 45 42 45Leases and right-of-use assets . . . . . . . . . . . . . . . . . . . . . . . . . . . . . . . . . . . . . . . 331 327 —Undistributed foreign earnings . . . . . . . . . . . . . . . . . . . . . . . . . . . . . . . . . . . . . . 57 39 19Other . . . . . . . . . . . . . . . . . . . . . . . . . . . . . . . . . . . . . . . . . . . . . . . . . . . . . . . . 12 17 11Gross deferred tax liabilities . . . . . . . . . . . . . . . . . . . . . . . . . . . . . . . . . . . . . . . . $648 $637 $281
Amounts presented in the deferred tax table above, calculated on a hypothetical separate return basis,are expected to be different from the amounts reflected in the opening post-separation balance sheet ofKyndryl, based upon the impacts of the separation and application of local law, among other factors.
The Company has operations in federal and certain state and local and foreign jurisdictions that on ahypothetical separate return basis would have tax credits and net operating loss carryforwards. Tax attributeshave been reported based on the hypothetical separate return basis results for the periods presented in thecombined financial statements. As of December 31, 2020, the Company had domestic and foreign netoperating loss carryforwards, the tax effect of which was $1,019 million, as well as $133 million of domesticand foreign credit carryforwards. Substantially all of the carryforwards are not available for use followingthe separation and therefore the carryforward periods are not relevant.
The valuation allowances as of December 31, 2020, 2019 and 2018 were $1,110 million, $650 millionand $308 million, respectively. The additions to valuation allowances for the years ended December 31,2020, 2019, and 2018 were $460 million, $342 million, and $281 million, respectively, and principally relateto foreign and domestic net operating loss and credit carryforwards determined on a hypothetical separatereturn basis, which in the opinion of management are not more likely than not to be realized when assessedon a hypothetical separate return basis.
At December 31, 2020 Kyndryl’s undistributed after-tax earnings from certain non-U.S. subsidiarieswere not indefinitely reinvested for which the Company has a deferred tax liability of $57 million for theestimated taxes associated with the repatriation of these earnings. Undistributed earnings of approximately
F-31

$221 million and other outside basis differences in foreign subsidiaries were indefinitely reinvested in foreignoperations. Quantification of the deferred tax liability, if any, associated with indefinitely reinvestedearnings and outside basis differences was not practicable.
NOTE F. PROPERTY AND EQUIPMENT
($ in millions)At December 31: 2020 2019
Information technology equipment . . . . . . . . . . . . . . . . . . . . . . . . . . . . . . . . . . . . $10,005 $ 9,621Buildings and building and leasehold improvements . . . . . . . . . . . . . . . . . . . . . . . . 2,968 2,858Office and other equipment . . . . . . . . . . . . . . . . . . . . . . . . . . . . . . . . . . . . . . . . . 346 369Land and land improvements . . . . . . . . . . . . . . . . . . . . . . . . . . . . . . . . . . . . . . . . 149 140Property and equipment – gross . . . . . . . . . . . . . . . . . . . . . . . . . . . . . . . . . . . . . . $13,468 $12,988Less: Accumulated depreciation . . . . . . . . . . . . . . . . . . . . . . . . . . . . . . . . . . . . . . 9,478 8,863Property and equipment – net . . . . . . . . . . . . . . . . . . . . . . . . . . . . . . . . . . . . . . . . $ 3,991 $ 4,125
The Company’s property and equipment reflected in the Combined Balance Sheet is based on anallocation of IBM’s balances depending on the type of asset. Information technology equipment balancesrelating to assets specifically utilized by the Company were fully allocated to the Company. Leaseholdimprovements associated with leases attributed to Kyndryl were fully allocated to the Company. Theremaining asset balances representing assets associated with space (land, buildings, and office and otherequipment in the space) were allocated based on the percentage of space utilized.
NOTE G. LEASES
The following tables presents the various components of lease costs:
($ in millions)For the year ended December 31: 2020 2019
Finance lease cost . . . . . . . . . . . . . . . . . . . . . . . . . . . . . . . . . . . . . . . . . . . . . . . . . . . . $ 61 $ 18Operating lease cost . . . . . . . . . . . . . . . . . . . . . . . . . . . . . . . . . . . . . . . . . . . . . . . . . . . 424 429Short-term lease cost . . . . . . . . . . . . . . . . . . . . . . . . . . . . . . . . . . . . . . . . . . . . . . . . . . 10 12Variable lease cost . . . . . . . . . . . . . . . . . . . . . . . . . . . . . . . . . . . . . . . . . . . . . . . . . . . . 114 124Sublease income . . . . . . . . . . . . . . . . . . . . . . . . . . . . . . . . . . . . . . . . . . . . . . . . . . . . . (4) (2)Total lease cost . . . . . . . . . . . . . . . . . . . . . . . . . . . . . . . . . . . . . . . . . . . . . . . . . . . . . . $605 $581
The Company’s ROU assets and lease liabilities reflected in the Combined Balance Sheet are based onan allocation of IBM’s balances depending on the type of lease. Finance lease balances relating to assetsspecifically utilized by the Company were fully allocated to the Company. The real estate lease balances wereallocated based on the percentage of space utilized. The remaining lease balances were allocated to theCompany based on headcount.
The Company had no sale and leaseback transactions for the years ended December 31, 2020 and2019.
Rental expense, including amounts charged to fixed assets and excluding amounts previously reserved,was $455 million for the year ended December 31, 2018.
The following table presents supplemental information relating to the cash flows arising from leasetransactions. Cash payments related to variable lease costs and short-term leases are not included in themeasurement of operating and finance lease liabilities, and, as such, are excluded from the amounts below.
F-32

($ in millions)For the year ended December 31: 2020 2019
Cash paid for amounts included in the measurement of lease liabilities:Operating cash outflows from finance leases . . . . . . . . . . . . . . . . . . . . . . . . . . . . . . $ 3 $ 1Financing cash outflows from finance leases . . . . . . . . . . . . . . . . . . . . . . . . . . . . . . 72 19Operating cash outflows from operating leases . . . . . . . . . . . . . . . . . . . . . . . . . . . . . 450 454
ROU assets obtained in exchange for new finance lease liabilities . . . . . . . . . . . . . . . . . . 129 147*
ROU assets obtained in exchange for new operating lease liabilities . . . . . . . . . . . . . . . . 336 1,647*
* Includes opening balance additions as a result of the adoption of the new lease guidance effectiveJanuary 1, 2019. The post adoption addition of leases for the year ended December 31, 2019 was$430 million for operating leases and $141 million for finance leases.
The following table presents the weighted-average lease term and discount rate for finance andoperating leases:
At December 31: 2020 2019
Finance leasesWeighted-average remaining lease term . . . . . . . . . . . . . . . . . . . . . . . . . . . . . . . . 3.5 yrs. 3.8 yrs.Weighted-average discount rate . . . . . . . . . . . . . . . . . . . . . . . . . . . . . . . . . . . . . 1.35% 1.55%
Operating leasesWeighted-average remaining lease term . . . . . . . . . . . . . . . . . . . . . . . . . . . . . . . . 5.7 yrs. 6.0 yrs.Weighted-average discount rate . . . . . . . . . . . . . . . . . . . . . . . . . . . . . . . . . . . . . 2.19% 2.59%
The following table presents a maturity analysis of expected undiscounted cash flows for operating andfinance leases on an annual basis for the next five years and thereafter.
($ in millions) 2021 2022 2023 2024 2025 ThereafterImputedInterest* Total**
Finance leases . . . . . . . . . . . . . . . . . . $ 73 $ 63 $ 47 $ 24 $ 8 $ 0 $ (7) $ 209Operating leases . . . . . . . . . . . . . . . . . $353 $274 $185 $123 $97 $215 $(64) $1,183
* Imputed interest represents the difference between undiscounted cash flows and discounted cash flows.
** The Company entered into lease agreements for certain facilities and equipment with paymentstotaling approximately $46 million that have not yet commenced as of December 31, 2020, and thereforeare not included in this table.
The following table presents the total amount of finance leases recognized in the Combined BalanceSheet:
At December 31: 2020 2019
ROU Assets- Property and equipment . . . . . . . . . . . . . . . . . . . . . . . . . . . . . . . . . . . . . . $201 $130Lease Liabilities:
Short-term debt . . . . . . . . . . . . . . . . . . . . . . . . . . . . . . . . . . . . . . . . . . . . . . . . . . . . $ 69 $ 42Long-term debt . . . . . . . . . . . . . . . . . . . . . . . . . . . . . . . . . . . . . . . . . . . . . . . . . . . . $140 $100
F-33

NOTE H. INTANGIBLE ASSETS INCLUDING GOODWILL
Intangible Assets
The following tables present the Company’s intangible asset balances by major asset class:
($ in millions)At December 31, 2020:
Gross CarryingAmount
AccumulatedAmortization
Net CarryingAmount
Intangible asset classCapitalized software . . . . . . . . . . . . . . . . . . . . . . . . . . . . . . $ 7 $ (4) $ 3Client relationships . . . . . . . . . . . . . . . . . . . . . . . . . . . . . . . 130 (77) 53Completed technology . . . . . . . . . . . . . . . . . . . . . . . . . . . . . 20 (17) 3Patents/trademarks . . . . . . . . . . . . . . . . . . . . . . . . . . . . . . . 2 (2) 0
Total . . . . . . . . . . . . . . . . . . . . . . . . . . . . . . . . . . . . . . . . . . . $159 $(99) $60
($ in millions)At December 31, 2019:
Gross CarryingAmount
AccumulatedAmortization
Net CarryingAmount
Intangible asset classCapitalized software . . . . . . . . . . . . . . . . . . . . . . . . . . . . . . $ 7 $ (3) $ 4Client relationships . . . . . . . . . . . . . . . . . . . . . . . . . . . . . . . 130 (58) 72Completed technology . . . . . . . . . . . . . . . . . . . . . . . . . . . . . 38 (27) 10Patents/trademarks . . . . . . . . . . . . . . . . . . . . . . . . . . . . . . . 6 (4) 1
Total . . . . . . . . . . . . . . . . . . . . . . . . . . . . . . . . . . . . . . . . . . . $181 $(93) $87
There was no impairment of intangible assets recorded in 2020, 2019 and 2018. The net carryingamount of intangible assets decreased $28 million during the year ended December 31, 2020, primarily dueto intangible asset amortization. The aggregate intangible amortization expense was $29 million forthe years ended December 31, 2020, 2019 and 2018. In addition, in the year ended December 31, 2020, theCompany retired $23 million of fully amortized intangible assets, impacting both the gross carrying amountand accumulated amortization by this amount. There was no retirement of intangible assets in the yearended December 31, 2019.
The future amortization expense relating to intangible assets currently recorded in the CombinedBalance Sheet is estimated to be the following at December 31, 2020:
($ in millions)Capitalized
SoftwareAcquired
Intangibles Total
2021 . . . . . . . . . . . . . . . . . . . . . . . . . . . . . . . . . . . . . . . . . . . . . . . . . . . $ 2 $22 $242022 . . . . . . . . . . . . . . . . . . . . . . . . . . . . . . . . . . . . . . . . . . . . . . . . . . . 1 18 192023 . . . . . . . . . . . . . . . . . . . . . . . . . . . . . . . . . . . . . . . . . . . . . . . . . . . 0 10 112024 . . . . . . . . . . . . . . . . . . . . . . . . . . . . . . . . . . . . . . . . . . . . . . . . . . . — 6 62025 . . . . . . . . . . . . . . . . . . . . . . . . . . . . . . . . . . . . . . . . . . . . . . . . . . . — — —Thereafter . . . . . . . . . . . . . . . . . . . . . . . . . . . . . . . . . . . . . . . . . . . . . . . — — —
Goodwill
Goodwill attributed to the Company represents the historical goodwill balances in the Parent’smanaged infrastructure services business arising from acquisitions specific to the Company. The changes inthe goodwill balances by reportable segment for the years ended December 31, 2020 and 2019 are asfollows:
F-34

($ in millions)Segment
Balance atJanuary 1, 2020
ForeignCurrency
Translationand Other
Adjustments*Balance at
December 31, 2020
Americas . . . . . . . . . . . . . . . . . . . . . . . . . . . . . . . . . . . . $ 416 $24 $ 440EMEA . . . . . . . . . . . . . . . . . . . . . . . . . . . . . . . . . . . . . 272 16 288Japan . . . . . . . . . . . . . . . . . . . . . . . . . . . . . . . . . . . . . . . 401 23 424Asia Pacific . . . . . . . . . . . . . . . . . . . . . . . . . . . . . . . . . . 74 4 78Total . . . . . . . . . . . . . . . . . . . . . . . . . . . . . . . . . . . . . . . $1,162 $67 $1,230
($ in millions)Segment
Balance atJanuary 1, 2019
ForeignCurrency
Translationand Other
Adjustments*Balance at
December 31, 2019
Americas . . . . . . . . . . . . . . . . . . . . . . . . . . . . . . . . . . . . $ 418 $(2) $ 416EMEA . . . . . . . . . . . . . . . . . . . . . . . . . . . . . . . . . . . . . . 274 (2) 272Japan . . . . . . . . . . . . . . . . . . . . . . . . . . . . . . . . . . . . . . . 403 (2) 401Asia Pacific . . . . . . . . . . . . . . . . . . . . . . . . . . . . . . . . . . 74 (0) 74Total . . . . . . . . . . . . . . . . . . . . . . . . . . . . . . . . . . . . . . . $1,169 $(6) $1,162
* Primarily driven by foreign currency translation.
There were no goodwill impairment losses recorded during 2020, 2019 or 2018 and the Company hasno accumulated impairment losses. As of December 31, 2020, the EMEA reporting unit had an estimatedfair value that exceeded its carrying amount by 23 percent. Each of the other reporting units with goodwillhad a fair value that was substantially in excess of its carrying value.
NOTE I. BORROWINGS
Short-Term Debt
($ in millions)At December 31: 2020 2019
Finance lease obligations . . . . . . . . . . . . . . . . . . . . . . . . . . . . . . . . . . . . . . . . . . . . . . . . . $69 $42
Long-Term Debt
($ in millions)At December 31: Maturities 2020 2019
Finance lease obligations (1.3%) . . . . . . . . . . . . . . . . . . . . . . . . . . . . . . . . 2021 – 2026 $209 $142Less: current maturities . . . . . . . . . . . . . . . . . . . . . . . . . . . . . . . . . . . . . . 69 42Total . . . . . . . . . . . . . . . . . . . . . . . . . . . . . . . . . . . . . . . . . . . . . . . . . . . $140 $100
Long-term debt is comprised of finance lease liabilities.
F-35

Contractual obligations of long-term debt outstanding at December 31, 2020, are as follows:
($ in millions) Total2021 . . . . . . . . . . . . . . . . . . . . . . . . . . . . . . . . . . . . . . . . . . . . . . . . . . . . . . . . . . . . . . . . . . . $ 692022 . . . . . . . . . . . . . . . . . . . . . . . . . . . . . . . . . . . . . . . . . . . . . . . . . . . . . . . . . . . . . . . . . . . 622023 . . . . . . . . . . . . . . . . . . . . . . . . . . . . . . . . . . . . . . . . . . . . . . . . . . . . . . . . . . . . . . . . . . . 472024 . . . . . . . . . . . . . . . . . . . . . . . . . . . . . . . . . . . . . . . . . . . . . . . . . . . . . . . . . . . . . . . . . . . 232025 . . . . . . . . . . . . . . . . . . . . . . . . . . . . . . . . . . . . . . . . . . . . . . . . . . . . . . . . . . . . . . . . . . . 8Thereafter . . . . . . . . . . . . . . . . . . . . . . . . . . . . . . . . . . . . . . . . . . . . . . . . . . . . . . . . . . . . . . . —Total . . . . . . . . . . . . . . . . . . . . . . . . . . . . . . . . . . . . . . . . . . . . . . . . . . . . . . . . . . . . . . . . . . . $209
Interest on Debt
Interest expense for the years ended December 31, 2020, 2019 and 2018 was $63 million, $76 millionand $85 million, respectively. Interest capitalized for the periods presented was immaterial. Interest in theCombined Income Statement reflects the allocation of interest expense on borrowing and funding relatedactivity associated with debt issued by IBM for which a portion of the proceeds benefited Kyndryl. SuchParent debt has not been attributed to the Company for any periods presented because Parent’s borrowingsare not the legal obligation of the Company. Refer to note O, “Related Party Transactions,” for moreinformation on the allocation of Parent’s corporate expenses.
NOTE J. OTHER LIABILITIES
($ in millions)At December 31: 2020 2019Workforce rebalancing . . . . . . . . . . . . . . . . . . . . . . . . . . . . . . . . . . . . . . . . . . . . . . . . . $595 $ 46Employee related taxes . . . . . . . . . . . . . . . . . . . . . . . . . . . . . . . . . . . . . . . . . . . . . . . . . 103 89Other . . . . . . . . . . . . . . . . . . . . . . . . . . . . . . . . . . . . . . . . . . . . . . . . . . . . . . . . . . . . . 176 270Other accrued expenses and liabilities . . . . . . . . . . . . . . . . . . . . . . . . . . . . . . . . . . . . . . . $874 $406Workforce rebalancing . . . . . . . . . . . . . . . . . . . . . . . . . . . . . . . . . . . . . . . . . . . . . . . . . $ 82 $ 31Disability benefits . . . . . . . . . . . . . . . . . . . . . . . . . . . . . . . . . . . . . . . . . . . . . . . . . . . . 76 87Asset retirement obligations . . . . . . . . . . . . . . . . . . . . . . . . . . . . . . . . . . . . . . . . . . . . . 21 18Deferred taxes . . . . . . . . . . . . . . . . . . . . . . . . . . . . . . . . . . . . . . . . . . . . . . . . . . . . . . . 78 80Other . . . . . . . . . . . . . . . . . . . . . . . . . . . . . . . . . . . . . . . . . . . . . . . . . . . . . . . . . . . . . 25 78Other non-current liabilities . . . . . . . . . . . . . . . . . . . . . . . . . . . . . . . . . . . . . . . . . . . . . . $282 $294
In response to changing business needs, the Company periodically takes workforce rebalancing actionsto improve productivity, cost competitiveness and to rebalance skills. The noncurrent liabilities are workforceaccruals primarily related to terminated employees who are no longer working for the Company who weregranted annual payments to supplement their incomes in certain countries. Depending on the individualcountry’s legal requirements, these required payments will continue until the former employee beginsreceiving pension benefits or passes away. The total amounts accrued for workforce rebalancing, includingamounts classified as other accrued expenses and liabilities in the Combined Balance Sheet were $677 millionand $77 million at December 31, 2020 and 2019, respectively. The increase in the total amount accrued asof December 31, 2020 relates to the workforce rebalancing actions in 2020, of which, $563 million wasrecorded in the fourth quarter in selling, general and administrative expense in the Combined IncomeStatement for severance and employee related benefits in accordance with the accounting guidance forongoing benefit arrangements.
As of December 31, 2020, the Company was unable to estimate the range of settlement dates and therelated probabilities for certain asbestos remediation AROs. These conditional AROs are primarily relatedto the encapsulated structural fireproofing that is not subject to abatement unless the buildings are demolishedand non-encapsulated asbestos that the Company would remediate only if it performed major renovationsof certain existing buildings. Because these conditional obligations have indeterminate settlement dates, theCompany could not develop a reasonable estimate of their fair values. The Company will continue toassess its ability to estimate fair values at each future reporting date. The related liability will be recognizedonce sufficient additional information becomes available. The total amounts accrued for ARO liabilities,
F-36

including amounts classified as current in the Combined Balance Sheet were $29 million at both December 31,2020 and 2019.
NOTE K. COMMITMENTS AND CONTINGENCIES
Commitments
The Company has applied the guidance requiring a guarantor to disclose certain types of guarantees,even if the likelihood of requiring the guarantor’s performance is remote. The Company guarantees certainloans and financial commitments. The maximum potential future payment under these financial guaranteesand the fair value of these guarantees recognized in the Combined Balance Sheet at December 31, 2020 andDecember 31, 2019 were not material.
Contingencies
As a company with approximately 90,000 employees and with clients around the world, Kyndryl issubject to, or could become subject to, either as plaintiff or defendant, a variety of contingencies, includingclaims, demands and suits, investigations, tax matters, and proceedings that arise from time to time in theordinary course of its business. Given the rapidly evolving external landscape of cybersecurity, privacy anddata protection laws, regulations and threat actors, the Company or its clients could become subject to actionsor proceedings in various jurisdictions. Also, as is typical for companies of Kyndryl’s scope and scale, theCompany is subject to, or could become subject to, actions and proceedings in various jurisdictions involvinga wide range of labor and employment issues (including matters related to contested employment decisions,country-specific labor and employment laws, and the Company’s benefit plans), as well as actions withrespect to contracts, securities, foreign operations, competition law and environmental matters. These actionsmay be commenced by a number of different parties, including competitors, clients, employees, governmentand regulatory agencies, stockholders and representatives of the locations in which the Company doesbusiness. Some of the actions to which the Company is, or may become, party may involve particularlycomplex technical issues, and some actions may raise novel questions under the laws of the various jurisdictionsin which these matters arise. Additionally, the Company is, or may be, a party to agreements pursuant towhich it may be obligated to indemnify the other party with respect to certain matters.
The Company records a provision with respect to a claim, suit, investigation or proceeding when it isprobable that a liability has been incurred and the amount of the loss can be reasonably estimated. Inaccordance with the relevant accounting guidance, the Company provides disclosures of matters for whichthe likelihood of material loss is at least reasonably possible. As of December 31, 2020, there were no suchmatters. In addition, the Company may also disclose matters based on its consideration of other mattersand qualitative factors, including the experience of other companies in the industry, and investor, customerand employee relations considerations.
The Company reviews claims, suits, investigations and proceedings at least quarterly, and decisions aremade with respect to recording or adjusting provisions and disclosing reasonably possible losses or range oflosses (individually or in the aggregate), to reflect the impact and status of settlement discussions, discovery,procedural and substantive rulings, reviews by counsel and other information pertinent to a particular matter.
Whether any losses, damages or remedies finally determined in any claim, suit, investigation orproceeding could reasonably have a material effect on the Company’s business, financial condition, resultsof operations or cash flows will depend on a number of variables, including: the timing and amount of suchlosses or damages; the structure and type of any such remedies; the significance of the impact any suchlosses, damages or remedies may have in the combined financial statements; and the unique facts andcircumstances of the particular matter that may give rise to additional factors. While the Company willcontinue to defend itself vigorously, it is possible that the Company’s business, financial condition, results ofoperations or cash flows could be affected in any particular period by the resolution of one or more ofthese matters.
The following is a summary of a significant legal matter relating to the Company.
On May 13, 2010, IBM and the State of Indiana (acting on behalf of the Indiana Family and SocialServices Administration) sued one another in a dispute over a 2006 contract regarding the modernization of
F-37

social service program processing in Indiana, with IBM service provided by the managed infrastructureservices business in its GTS segment. Multiple trials and appeals resulted in a net award of $78 million tothe State of Indiana, plus interest. IBM paid the judgment plus interest in full in January and April of 2020,after which the State of Indiana sought additional interest, which both the Indiana Superior Court andthe Indiana Court of Appeals denied. The Indiana Supreme Court declined further review.
NOTE L. EQUITY ACTIVITY
The Company had no available-for-sale securities or cash flow hedges during the periods presented inthe following tables:
Reclassifications and Taxes Related to Items of Other Comprehensive Income
($ in millions)For the year ended December 31, 2020:
Before TaxAmount
Tax (Expense)/Benefit
Net of TaxAmount
Other comprehensive income/(loss):Foreign currency translation adjustments . . . . . . . . . . . . . . . . . . . $125 $ — $125Retirement-related benefit plans(1):
Prior service costs/(credits) . . . . . . . . . . . . . . . . . . . . . . . . . . . $ 0 $ 0 $ 0Net (losses)/gains arising during the period . . . . . . . . . . . . . . . (41) 13 (28)Curtailments and settlements . . . . . . . . . . . . . . . . . . . . . . . . . 0 0 0Amortization of prior service (credits)/costs . . . . . . . . . . . . . . . (1) 0 0Amortization of net (gains)/losses . . . . . . . . . . . . . . . . . . . . . . 36 (12) 24
Total retirement-related benefit plans . . . . . . . . . . . . . . . . . . . . . . $ (6) $ 2 $ (4)Other comprehensive income/(loss) . . . . . . . . . . . . . . . . . . . . . . . . . $119 $ 2 $121
(1) These AOCI components are included in the computation of net periodic pension cost. Refer tonote N, “Retirement-Related Benefits,” for additional information.
($ in millions)For the year ended December 31, 2019:
Before TaxAmount
Tax (Expense)/Benefit
Net of TaxAmount
Other comprehensive income/(loss):Foreign currency translation adjustments . . . . . . . . . . . . . . . . . . . $ 12 $— $ 12Retirement-related benefit plans(1):
Prior service costs/(credits) . . . . . . . . . . . . . . . . . . . . . . . . . . . $ (1) $— $ (1)Net (losses)/gains arising during the period . . . . . . . . . . . . . . . (84) 27 (57)Curtailments and settlements . . . . . . . . . . . . . . . . . . . . . . . . . 0 0 0Amortization of prior service (credits)/costs . . . . . . . . . . . . . . . 0 0 0Amortization of net (gains)/losses . . . . . . . . . . . . . . . . . . . . . . 27 (9) 18
Total retirement-related benefit plans . . . . . . . . . . . . . . . . . . . . . . $(57) $18 $(39)Other comprehensive income/(loss) . . . . . . . . . . . . . . . . . . . . . . . . . $(45) $18 $(27)
(1) These AOCI components are included in the computation of net periodic pension cost. Refer tonote N, “Retirement-Related Benefits,” for additional information.
F-38

($ in millions)For the year ended December 31, 2018:
Before TaxAmount
Tax (Expense)/Benefit
Net of TaxAmount
Other comprehensive income/(loss):Foreign currency translation adjustments . . . . . . . . . . . . . . . . . . . $(240) $— $(240)Retirement-related benefit plans(1):
Prior service costs/(credits) . . . . . . . . . . . . . . . . . . . . . . . . . . . $ 1 $ 0 $ 1Net (losses)/gains arising during the period . . . . . . . . . . . . . . . (33) 10 (23)Amortization of prior service (credits)/costs . . . . . . . . . . . . . . . (1) 0 0Amortization of net (gains)/losses . . . . . . . . . . . . . . . . . . . . . . 28 (8) 20
Total retirement-related benefit plans . . . . . . . . . . . . . . . . . . . . . . $ (4) $ 2 $ (3)Other comprehensive income/(loss) . . . . . . . . . . . . . . . . . . . . . . . . . $(244) $ 2 $(243)
(1) These AOCI components are included in the computation of net periodic pension cost. Refer tonote N, “Retirement-Related Benefits,” for additional information.
Accumulated Other Comprehensive Income/(Loss) (net of tax)
($ in millions)
ForeignCurrency
TranslationAdjustments*
Net ChangeRetirement-
RelatedBenefitPlans
AccumulatedOther
ComprehensiveIncome/(Loss)
December 31, 2017 . . . . . . . . . . . . . . . . . . . . . . . . . . . . . . . . . . $ (779) $(172) $ (950)
Other comprehensive income/(loss)** . . . . . . . . . . . . . . . . . . . . . (240) (3) (243)December 31, 2018 . . . . . . . . . . . . . . . . . . . . . . . . . . . . . . . . . . $(1,019) $(175) $(1,193)
Other comprehensive income/(loss)** . . . . . . . . . . . . . . . . . . . . . 12 (39) (27)December 31, 2019 . . . . . . . . . . . . . . . . . . . . . . . . . . . . . . . . . . $(1,007) $(214) $(1,220)
Other comprehensive income/(loss)** . . . . . . . . . . . . . . . . . . . . . 125 (4) 121December 31, 2020 . . . . . . . . . . . . . . . . . . . . . . . . . . . . . . . . . . $ (882) $(218) $(1,100)
* Foreign currency translation adjustments are presented gross.
** No amounts were reclassified from accumulated other comprehensive income.
NOTE M. STOCK-BASED COMPENSATION
The Company participates in various IBM stock-based compensation plans, including incentivecompensation plans and employee stock purchase plan. All awards granted under the plans are based onIBM’s common shares and, as such, are reflected in the Parent’s Consolidated Statement of Stockholders’Equity and not in the Company’s Combined Statement of Equity. Stock-based compensation cost is based onthe awards and terms previously granted to employees by the Parent.
Compensation cost associated with Kyndryl employees’ participation in the Parent’s incentive planshave been identified for employees who exclusively support Kyndryl operations. Amounts allocated to theCompany from the Parent for shared services are reported within total allocated costs in note O, “RelatedParty Transactions.”
The following table presents stock-based compensation cost associated with employees who exclusivelysupport the Company and is included in net income/(loss).
F-39

($ in millions)For the year ended December 31: 2020 2019 2018
Cost . . . . . . . . . . . . . . . . . . . . . . . . . . . . . . . . . . . . . . . . . . . . . . . . . . . . . . . . . $ 26 $ 15 $ 16SG&A expense . . . . . . . . . . . . . . . . . . . . . . . . . . . . . . . . . . . . . . . . . . . . . . . . . . 36 34 40RD&E expense . . . . . . . . . . . . . . . . . . . . . . . . . . . . . . . . . . . . . . . . . . . . . . . . . . 1 1 1Pre-tax stock-based compensation cost . . . . . . . . . . . . . . . . . . . . . . . . . . . . . . . . . $ 64 $ 51 $ 57Income tax benefits . . . . . . . . . . . . . . . . . . . . . . . . . . . . . . . . . . . . . . . . . . . . . . . (14) (12) (13)Net stock-based compensation cost . . . . . . . . . . . . . . . . . . . . . . . . . . . . . . . . . . . $ 49 $ 40 $ 44
The Company’s total unrecognized compensation cost related to non-vested awards at December 31,2020 was $95 million and is expected to be recognized over a weighted-average period of approximately2.2 years. If there are any modifications or cancellations of the underlying unvested awards, the Companymay be required to accelerate, increase or cancel all or a portion of the remaining unearned stock-basedcompensation expense. Future unearned stock-based compensation will increase to the extent the Companygrants additional equity awards, changes incentive awards terms, or assumes unvested equity awards inconnection with acquisitions.
Capitalized stock-based compensation cost was not material at December 31, 2020, 2019 and 2018.
Incentive Awards
Stock-based incentive awards were provided to employees under the terms of IBM’s long-termperformance plans (the Plans). Awards under the Plans principally include Restricted Stock Units (RSUs)and Performance Share Units (PSUs).
The following table summarizes RSU and PSU activity under the Plans associated with employees whoexclusively support the Company during the years ended December 31, 2020, 2019 and 2018.
RSUs PSUs
Weighted-AverageGrant Price
Numberof Units
Weighted-AverageGrant Price
Numberof Units
Balance at January 1, 2018 . . . . . . . . . . . . . . . . . . . $141 688,048 $144 151,383Awards granted . . . . . . . . . . . . . . . . . . . . . . . . . . 121 386,581 130 51,949Awards released . . . . . . . . . . . . . . . . . . . . . . . . . . 148 (207,491) 152 (38,069)Awards canceled/forfeited/performance adjusted . . . . 139 (78,766) 147 (27,000)*
Balance at December 31, 2018 . . . . . . . . . . . . . . . . $130 788,372 $136 138,262**
Awards granted . . . . . . . . . . . . . . . . . . . . . . . . . . 119 454,465 117 79,741Awards released . . . . . . . . . . . . . . . . . . . . . . . . . . 136 (252,935) 140 (48,379)Awards canceled/forfeited/performance adjusted . . . 128 (78,970) 131 (6,406)*
Balance at December 31, 2019 . . . . . . . . . . . . . . . . $123 910,932 $126 163,219**
Awards granted . . . . . . . . . . . . . . . . . . . . . . . . . . 115 856,672 117 90,434Awards released . . . . . . . . . . . . . . . . . . . . . . . . . . 126 (304,102) 137 (36,054)Awards canceled/forfeited/performance adjusted . . . . 121 (104,603) 125 (14,665)*
Balance at December 31, 2020 . . . . . . . . . . . . . . . . $117 1,358,900 $120 202,934**
* Includes adjustments of (4,005), (488) and (18,749) PSUs for 2020, 2019 and 2018, respectively,because final performance metrics were above or below specified targets.
** Represents the number of shares expected to be issued based on achievement of grant date performancetargets. The actual number of shares issued will depend on final performance against specified targetsover the vesting period.
F-40

The total fair value of RSUs and PSUs granted and vested to employees wholly dedicated to theCompany during the years ended December 31, 2020, 2019 and 2018 were as follows:
($ in millions)For the year ended December 31: 2020 2019 2018
RSUs:Granted . . . . . . . . . . . . . . . . . . . . . . . . . . . . . . . . . . . . . . . . . . . . . . . . . . . . . . . . $96 $53 $46Vested . . . . . . . . . . . . . . . . . . . . . . . . . . . . . . . . . . . . . . . . . . . . . . . . . . . . . . . . . $32 $29 $26PSUs:Granted . . . . . . . . . . . . . . . . . . . . . . . . . . . . . . . . . . . . . . . . . . . . . . . . . . . . . . . . $11 $10 $ 7Vested . . . . . . . . . . . . . . . . . . . . . . . . . . . . . . . . . . . . . . . . . . . . . . . . . . . . . . . . . $ 4 $ 5 $ 4
Stock Options
In 2016, IBM made one grant of 1.5 million premium-priced stock options. As of December 31, 2020,these vested options had a remaining weighted-average contractual life of approximately 5.1 years and hadno intrinsic value.
Stock options outstanding as a result of the Parent’s conversion of stock-based awards previouslygranted by acquired entities was immaterial for all periods presented.
IBM Employees Stock Purchase Plan
Prior to the separation, eligible employees may participate in IBM’s non-compensatory EmployeesStock Purchase Plan (ESPP). The ESPP enables eligible participants to purchase shares of IBM commonstock at a discount through payroll deductions of up to 10 percent of eligible compensation during the offerperiod. The ESPP provides for semi-annual offering periods and continues as long as shares remainavailable under the ESPP. Individual ESPP participants are restricted from purchasing more than $25,000of common stock in one calendar year or 1,000 shares in an offering period.
No stock-based compensation expense was recorded in connection with employee purchases of ESPPbecause the criteria of a non-compensatory plan were met.
NOTE N. RETIREMENT-RELATED BENEFITS
Description of Plans
The Company sponsors defined benefit pension plans and other nonpension postretirement benefitplans. The defined benefit pension plans cover certain non-U.S. employees and retirees, and the pensionbenefits are based principally on employees years of service and/or compensation levels at or near retirement.These plans are accounted for as defined benefit pension plans for purposes of the combined financialstatements. Accordingly, the net benefit plan obligations and the related benefit plan expenses of those planshave been recorded in the Company’s combined financial statements. The nonpension postretirementbenefit plans cover certain non-U.S. employees and retirees and provides a fixed monthly dollar credit forretiree health care expense. The benefit obligation and related expenses for these plans are included in thecombined financial statements.
Additionally, certain Company employees participate in multi-employer defined benefit pension plansand post-retirement health plans as well as defined contribution plans that are sponsored by the Parent,which also includes other participants. Accordingly, the Company does not record an asset or liability torecognize the funded status. However, the Company records service cost and defined contribution costattributable to its employees who participate in the multi-employer and the defined contribution plans, as wellas expense allocated for certain corporate and shared functional employees. These amounts are included inthe Combined Income Statement.
Plan Financial Information
The Company’s defined contribution expense for the years ended December 31, 2020, 2019 and 2018was $194 million, $207 million, and $208 million, respectively.
F-41

The following table presents the components of net periodic (income)/cost of the retirement-relatedbenefit plans recognized in the Combined Income Statement, excluding defined contribution plans.
For the year ended December 31,
Defined BenefitPension Plans
NonpensionPostretirement Benefit Plans
($ in millions) 2020 2019 2018 2020 2019 2018
Service cost* . . . . . . . . . . . . . . . . . . . . . . . . . . . . . . . . . $109 $101 $118 $ 3 $ 3 $ 4Interest cost** . . . . . . . . . . . . . . . . . . . . . . . . . . . . . . . 10 17 17 1 1 1Expected return on plan assets** . . . . . . . . . . . . . . . . . . . (24) (27) (21) (1) (1) 0Amortization of prior service costs/(credits)** . . . . . . . . . (1) 0 (1) — — —Recognized actuarial losses** . . . . . . . . . . . . . . . . . . . . . 36 26 28 0 0 0Curtailments and settlements** . . . . . . . . . . . . . . . . . . . 0 0 — — — —Multi-employer plans/other costs+ . . . . . . . . . . . . . . . . . . 13 20 34 — — —Total net periodic (income)/cost . . . . . . . . . . . . . . . . . . . $143 $138 $175 $ 3 $ 4 $ 4
* Represents service costs of $16 million in both 2020 and 2019, and $18 million in 2018 attributable to self-sponsored plans as well as $96 million, $89 million, and $104 million in 2020, 2019 and 2018,respectively, attributable to allocations of costs for plans sponsored by the Parent.
** These components of net periodic pension costs are included in other (income) and expense in theCombined Income Statement.
+ Represents third-party plans.
The following table presents the changes in net benefit obligation and plan assets, excluding definedcontribution plans.
F-42

Defined BenefitPension Plans
NonpensionPostretirementBenefit Plans
($ in millions) 2020 2019 2020 2019
Change in benefit obligationBenefit obligation at January 1 . . . . . . . . . . . . . . . . . . . . . . . . . . . . . $1,099 $1,004 $ 13 $ 13Service cost* . . . . . . . . . . . . . . . . . . . . . . . . . . . . . . . . . . . . . . . . . . 15 15 1 1Interest cost . . . . . . . . . . . . . . . . . . . . . . . . . . . . . . . . . . . . . . . . . . 10 17 1 1Plan participants’ contributions . . . . . . . . . . . . . . . . . . . . . . . . . . . . — — — —Acquisitions/divestitures, net . . . . . . . . . . . . . . . . . . . . . . . . . . . . . . (12) (3) — —Actuarial losses/(gains) . . . . . . . . . . . . . . . . . . . . . . . . . . . . . . . . . . 33 117 (1) (1)Benefits paid from trust . . . . . . . . . . . . . . . . . . . . . . . . . . . . . . . . . . (21) (17) — —Direct benefit payments . . . . . . . . . . . . . . . . . . . . . . . . . . . . . . . . . . (19) (16) 0 0Foreign exchange impact . . . . . . . . . . . . . . . . . . . . . . . . . . . . . . . . . 97 (17) 0 0Amendments/curtailments/settlements/other . . . . . . . . . . . . . . . . . . . 0 (1) 0 0Benefit obligation at December 31 . . . . . . . . . . . . . . . . . . . . . . . . . . $1,202 $1,099 $ 13 $ 13
Change in plan assetsFair value of plan assets at January 1 . . . . . . . . . . . . . . . . . . . . . . . . $ 612 $ 574 $ 12 $ 11Actual return on plan assets . . . . . . . . . . . . . . . . . . . . . . . . . . . . . . . 13 61 2 1Employer contributions . . . . . . . . . . . . . . . . . . . . . . . . . . . . . . . . . . 4 4 — —Acquisitions/divestitures, net . . . . . . . . . . . . . . . . . . . . . . . . . . . . . . (10) — — —Plan participants’ contributions . . . . . . . . . . . . . . . . . . . . . . . . . . . . 0 0 — —Benefits paid from trust . . . . . . . . . . . . . . . . . . . . . . . . . . . . . . . . . . (21) (17) — —Foreign exchange impact . . . . . . . . . . . . . . . . . . . . . . . . . . . . . . . . . 56 (11) (1) 0Amendments/curtailments/settlements/other . . . . . . . . . . . . . . . . . . . 0 1 — 0Fair value of plan assets at December 31 . . . . . . . . . . . . . . . . . . . . . . $ 654 $ 612 $ 13 $ 12Funded status at December 31 . . . . . . . . . . . . . . . . . . . . . . . . . . . . . $ (548) $ (488) $ 0 $ (1)
Accumulated benefit obligation** . . . . . . . . . . . . . . . . . . . . . . . . . . . $1,171 $1,066 N/A N/A
* Represents service costs attributable to self-sponsored plans.
** Represents the benefit obligation assuming no future participant compensation increases.
N/A — Not applicable
The following table presents the amounts recorded in the Combined Balance Sheet.
Non U.S. Plans
($ in millions)At December 31:
Defined BenefitPension Plans
NonpensionPostretirement Benefit Plans
2020 2019 2020 2019
Prepaid pension assets . . . . . . . . . . . . . . . . . . . . . . . . . . . . . . $ 0 $ 0 $ 1 $ 0Current liabilities – compensation and benefits . . . . . . . . . . . . . 0 0 — —Noncurrent liabilities – retirement and nonpension
postretirement benefit obligations . . . . . . . . . . . . . . . . . . . . . (548) (487) (1) (1)Funded status – net . . . . . . . . . . . . . . . . . . . . . . . . . . . . . . . . $(548) $(488) $ 0 $ (1)
The following table presents information for defined benefit plans with accumulated benefit obligations(ABO) or projected benefit obligations (PBO) in excess of plan assets.
F-43

2020 2019
($ in millions)At December 31:
BenefitObligation
PlanAssets
BenefitObligation
PlanAssets
PBO in excess of plan assets . . . . . . . . . . . . . . . . . . . . . . . . . . . . . $1,202 $654 $1,099 $612ABO in excess of plan assets . . . . . . . . . . . . . . . . . . . . . . . . . . . . 1,079 561 971 514Plan assets in excess of PBO . . . . . . . . . . . . . . . . . . . . . . . . . . . . . 0 0 0 0
The following table presents information for the nonpension postretirement benefit plans withaccumulated postretirement benefit obligations (APBO) in excess of plan assets.
2020 2019
($ in millions)At December 31:
BenefitObligation
PlanAssets
BenefitObligation
PlanAssets
APBO in excess of plan assets . . . . . . . . . . . . . . . . . . . . . . . . . . . $ 1 $ 0 $ 1 $ 0Plan assets in excess of APBO . . . . . . . . . . . . . . . . . . . . . . . . . . . 12 13 12 12
The following table presents the pre-tax net loss and prior service costs/(credits) recognized in OCI andthe changes in pre-tax net loss and prior service costs/(credits) recognized in AOCI for the retirement-related benefits plans.
Defined BenefitPension Plans
NonpensionPostretirementBenefit Plans
($ in millions) 2020 2019 2020 2019
Net loss/(gain) at January 1 . . . . . . . . . . . . . . . . . . . . . . . . . . . . . . . . . . . . $307 $250 $ (1) $ 0Current period loss/(gain) . . . . . . . . . . . . . . . . . . . . . . . . . . . . . . . . . . . . . 43 84 (2) —Curtailments and settlements . . . . . . . . . . . . . . . . . . . . . . . . . . . . . . . . . . 0 0 — —Amortization of net loss included in net periodic (income)/cost . . . . . . . . . . . (36) (27) 0 0Net loss/(gain) at December 31 . . . . . . . . . . . . . . . . . . . . . . . . . . . . . . . . . $314 $307 $ (2) $ (1)Prior service costs/(credits) at January 1 . . . . . . . . . . . . . . . . . . . . . . . . . . . (3) (3) — —Current period prior service costs/(credits) . . . . . . . . . . . . . . . . . . . . . . . . . 0 1 — —Amortization for prior service (costs)/credits included in net periodic (income)/
cost . . . . . . . . . . . . . . . . . . . . . . . . . . . . . . . . . . . . . . . . . . . . . . . . . . 1 0 — —Prior service costs/(credits) at December 31 . . . . . . . . . . . . . . . . . . . . . . . . $ (2) $ (3) $— $—Total loss/(gain) recognized in accumulated other comprehensive income/
(loss)* . . . . . . . . . . . . . . . . . . . . . . . . . . . . . . . . . . . . . . . . . . . . . . . . . $312 $304 $ (2) $ (1)
* See note L, “Equity Activity,” for the total change in AOCI, and the Combined Statement ofComprehensive Income for the components of net periodic (income)/cost, including the related taxeffects, recognized in OCI for the retirement-related benefit plans.
Assumptions Used to Determine Plan Financial Information
The following table presents the assumptions used to measure the net periodic (income)/cost and theyear-end benefit obligations.
F-44

Defined BenefitPension Plans
NonpensionPostretirementBenefit Plans
2020 2019 2018 2020 2019 2018
Weighted-average assumptions used to measure net periodic(income)/cost
Discount rate . . . . . . . . . . . . . . . . . . . . . . . . . . . . . . . . . . . . 0.86% 1.65% 0.64% 8.31% 8.89% N/AExpected long-term returns on plan assets . . . . . . . . . . . . . . . . 4.03% 4.62% 4.01% 8.20% 9.00% N/ARate of compensation increase . . . . . . . . . . . . . . . . . . . . . . . . 2.25% 1.37% 2.66% N/A N/A N/AWeighted-average assumptions used to measure benefit
obligation . . . . . . . . . . . . . . . . . . . . . . . . . . . . . . . . . . . . .Discount rate . . . . . . . . . . . . . . . . . . . . . . . . . . . . . . . . . . . . 0.62% 0.86% 1.65% 8.31% 8.31% 8.89%Rate of compensation increase . . . . . . . . . . . . . . . . . . . . . . . . 2.22% 2.25% 1.37% N/A N/A N/A
N/A — Not applicable
In certain countries, a portfolio of high-quality corporate bonds is used to construct a yield-curve.Cash flows from the Company’s expected benefit obligation payments are matched to the yield curve toderive discounts. In other countries where the markets for high-quality long-term bonds are not as welldeveloped, a portfolio of long-term government bonds is used as a base, and a credit spread is added tosimulate corporate bond yields at these maturities in the jurisdiction of each plan. This is the benchmark fordeveloping the respective discount rates.
In developing the expected long-term rate of return on assets, the Company considers the long-termexpectations for future returns. The use of expected returns may result in pension income that is greater orless than the actual return of those plan assets in a given year. Over time, however, the expected rate of returnis expected to approximate the actual long-term results, leading to a pattern of income or loss recognitionthat more closely matches the pattern of services provided by the employees.
For the nonpension postretirement benefit plans, the Company reviews external data and its ownhistorical trends for healthcare costs to determine the healthcare costs trends. The healthcare cost trendrates have an insignificant effect on plan costs or other benefit obligations due to terms of the plan whichlimit the Company’s obligation to the participants.
Plan Assets
Retirement-related benefit plan assets are recognized and measured at fair value. Because of theinherent uncertainty of valuations, these fair value measurements may not necessarily reflect the amountsthe Company could realize in current market transactions.
Investment Policies and Strategies
The investment objectives of the plan assets is to generate returns that will enable the plan to meet itsfuture obligations. The weighted-average target allocation for the defined benefit plans is 33 percent equitysecurities, 57 percent fixed-income securities, 6 percent real estate and 4 percent other investments, which isconsistent with the allocation decisions made by the Company’s management. In some countries, ahigher percentage allocation to fixed income is required to manage solvency and funding risks. In others,the responsibility for managing the investments typically lies with a board that may include up to 50 percentof members elected by employees and retirees. This can result in slight differences compared with thestrategies previously described. Generally, these defined benefit plans do not invest in illiquid assets andtheir use of derivatives is mainly for currency hedging, interest rate risk management, credit exposure andalternative investment strategies.
The Company’s nonpension postretirement benefit plans are underfunded or unfunded. For someplans, the Company maintains a nominal, highly liquid trust fund balance to ensure timely benefit payments.
F-45

Defined Benefit Plan Assets
The following table presents the Company’s defined benefit pension plans’ asset classes and theirassociated fair value at December 31, 2020.
December 31, 2020 December 31, 2019
($ in millions) Level 1 Level 2 Level 3 Total Level 1 Level 2 Level 3 Total
Fixed incomeGovernment and related(1) . . . . . . . . . $— $ 18 $— $ 18 $— $ 18 $— $ 18Corporate bonds . . . . . . . . . . . . . . . . — 0 — 0 — 0 — 0Mortgage and asset-backed securities. . — — — — — 0 — 0Insurance contracts . . . . . . . . . . . . . . — 91 — 91 — 96 — 96
Cash and short-term investments(2) . . . . 1 — — 1 1 — — 1Other mutual funds . . . . . . . . . . . . . . . 7 — — 7 7 — — 7
Subtotal . . . . . . . . . . . . . . . . . . . . . . $ 8 $110 $— $118 $ 7 $114 $— $121Investments measured at net asset value
using the NAV practical expedient(3) . . — — — 537 — — — 490Other(4) . . . . . . . . . . . . . . . . . . . . . . . . — — — 0 — — — 0Fair value of plan assets . . . . . . . . . . . . $ 8 $110 $— $654 $ 7 $114 $— $612
(1) Includes debt issued by national, state and local governments and agencies.(2) Includes cash, cash equivalents and short-term marketable securities.(3) Investments measured at fair value using the net asset value (NAV) per share (or its equivalent) as a
practical expedient, including commingled funds, hedge funds, private equity and real estate partnerships.(4) Represents net unsettled transactions, relating primarily to purchases and sales of plan assets.
For the year ended December 31, 2020 and 2019, the nonpension postretirement benefit plan assets of$13 million and $12 million, respectively, in Mexico, were invested in government debt and corporate bonds,categorized as Level 2 in the fair value hierarchy.
Valuation Techniques
Fixed Income: The fair value of fixed-income securities is typically estimated using pricing models,quoted prices of securities with similar characteristics or discounted cash flows. If available, they are valuedusing the closing price reported on the major market on which the individual securities are traded.
Cash: Cash includes money market accounts that are valued at their cost-plus interest on a daily basis,which approximates fair value.
Short-term investments represent securities with original maturities of one year or less.
Certain investments are measured at fair value using the net asset value (NAV) per share (or itsequivalent) as a practical expedient. These investments, which include commingled funds, hedge funds,private equity and real estate partnerships, are typically valued using the NAV provided by the administratorof the fund and reviewed by the Company. The NAV is based on the value of the underlying assets ownedby the fund, minus liabilities and divided by the number of shares or units outstanding.
Contributions and Direct Benefit Payments
It is the Company’s general practice to fund amounts for pensions sufficient to meet the minimumrequirements set forth in applicable employee benefits laws and local tax laws. From time to time, theCompany contributes additional amounts as it deems appropriate.
The following table presents the contributions made to the defined benefit pension plan, nonpensionpostretirement benefit plans, multi-employer plans, defined contribution plans and direct payments made in
F-46

2020 and 2019. The cash contributions to the multi-employer plans represent the annual cost included in thenet periodic (income)/cost recognized in the Combined Income Statement.
($ in millions)At December 31, 2020 2019
Defined benefit plans . . . . . . . . . . . . . . . . . . . . . . . . . . . . . . . . . . . . . . . . . . . . . . . . . . $ 4 $ 4Multi-employer plans* . . . . . . . . . . . . . . . . . . . . . . . . . . . . . . . . . . . . . . . . . . . . . . . . . 7 9Defined contribution plans . . . . . . . . . . . . . . . . . . . . . . . . . . . . . . . . . . . . . . . . . . . . . . 194 207Direct payments . . . . . . . . . . . . . . . . . . . . . . . . . . . . . . . . . . . . . . . . . . . . . . . . . . . . . 19 16Total . . . . . . . . . . . . . . . . . . . . . . . . . . . . . . . . . . . . . . . . . . . . . . . . . . . . . . . . . . . . . $225 $236
* Represents third-party plans.
Defined Benefit Pension Plans
In 2021, the Company is not legally required to make any contributions to the multi-employer plans.However, depending on market conditions, or other factors, the Company may elect to make discretionarycontributions to the non-U.S. defined benefit plans during the year.
In 2021, the Company does not expect contributions to its non-U.S. defined benefit and multi-employer plans to be material.
Financial market performance in 2021 could increase the legally mandated minimum contribution incertain countries which require monthly or daily remeasurement of the funded status. The Company couldalso elect to contribute more than the legally mandated amount based on market conditions or other factors.
Expected Benefit Payments
Defined Benefit Pension Plan and Nonpension Postretirement Benefit Plan Expected Payments
The following table presents the total expected benefit payments to both the defined benefit pensionplans and nonpension postretirement benefit plan participants.
($ in millions)
DefinedBenefit
Pension Plans
NonPensionPostretirementBenefit Plans
2021 . . . . . . . . . . . . . . . . . . . . . . . . . . . . . . . . . . . . . . . . . . . . . . . . . . . . $ 42 $02022 . . . . . . . . . . . . . . . . . . . . . . . . . . . . . . . . . . . . . . . . . . . . . . . . . . . . 43 02023 . . . . . . . . . . . . . . . . . . . . . . . . . . . . . . . . . . . . . . . . . . . . . . . . . . . . 44 02024 . . . . . . . . . . . . . . . . . . . . . . . . . . . . . . . . . . . . . . . . . . . . . . . . . . . . 48 02025 . . . . . . . . . . . . . . . . . . . . . . . . . . . . . . . . . . . . . . . . . . . . . . . . . . . . 52 02026 – 2030 . . . . . . . . . . . . . . . . . . . . . . . . . . . . . . . . . . . . . . . . . . . . . . . 283 4
The 2021 expected benefit payments to nonpension postretirement benefit plan participants notcovered by the respective plan assets represent a component of compensation and benefits, within currentliabilities, in the Combined Balance Sheet.
NOTE O. RELATED PARTY TRANSACTIONS
Related Party Revenue and Purchases
Kyndryl provides various services to IBM including those related to hosting data centers and servicingIBM’s information technology infrastructure which are reported as revenue in the Combined IncomeStatement. Revenues for these services were $645 million, $613 million and $623 million for the years endedDecember 31, 2020, 2019 and 2018, respectively. The costs related to these services are reported in cost of
F-47

services in Kyndryl’s Combined Income Statement and were $509 million, $484 million and $492 million,for the years ended December 31, 2020, 2019 and 2018, respectively.
IBM historically provided its branded and related hardware, software and services to Kyndryl for use inthe delivery of services arrangements with Kyndryl customers. The cost of the hardware and software wasreflected at a price indicative of what the Company would have incurred had it operated on a stand-alonebasis. These costs and their associated depreciation and amortization were recorded as cost of services inthe Company’s Combined Income Statement in the amounts of $3,227 million, $3,094 million and$3,619 million, for the years ended December 31, 2020, 2019 and 2018, respectively. The capital expendituresfor purchases of IBM hardware were reflected as payments for property and equipment within the investingsection of the Combined Statement of Cash Flows in the amounts of $504 million, $526 million and$650 million, for the years ended December 31, 2020, 2019 and 2018, respectively.
Allocation of Corporate Expenses
The Combined Income Statement, Combined Statement of Comprehensive Income and CombinedStatement of Cash Flows include an allocation of general corporate expenses from IBM. The financialinformation in these combined financial statements does not necessarily include all of the expenses that wouldhave been incurred by Kyndryl had it been a separate, standalone company. It is not practicable to estimateactual costs that would have been incurred had Kyndryl been a standalone company during the periodspresented. The management of Kyndryl considers these allocations to be a reasonable reflection of theutilization of services by, or the benefits provided to the Company. Allocations for management costs andcorporate support services provided to Kyndryl for the years ended December 31, 2020, 2019, and 2018totaled $1,287 million, $1,230 million and $1,237 million, respectively. These amounts include costs forcorporate functions including, but not limited to, senior management, legal, human resources, finance andaccounting, treasury, IT and other shared services. All such amounts have been deemed to have been incurredand settled by Kyndryl in the period in which the costs were recorded and are included in the Net Parentinvestment. These costs were allocated based on direct usage as applicable, with the remainder allocated ona pro-rata basis of gross profit, headcount, asset ownership or other measures determined to be reasonable.
($ in millions)For the year ended December 31: 2020 2019 2018
Selling, general and administrative . . . . . . . . . . . . . . . . . . . . . . . . . . . . . . . . $1,216 $1,178 $1,206Research, development and engineering . . . . . . . . . . . . . . . . . . . . . . . . . . . . 4 7 0Other (income) and expense . . . . . . . . . . . . . . . . . . . . . . . . . . . . . . . . . . . . 4 (31) (53)Interest expense . . . . . . . . . . . . . . . . . . . . . . . . . . . . . . . . . . . . . . . . . . . . 63 76 85Total expense and other (income) . . . . . . . . . . . . . . . . . . . . . . . . . . . . . . . . $1,287 $1,230 $1,237
Cash Management and Financing
The Company participates in IBM’s centralized cash management and financing programs.Disbursements are made through centralized accounts payable systems, which are operated by IBM. Cashreceipts are transferred to centralized accounts, which are also maintained by IBM. As cash is received anddisbursed by IBM, it is accounted for by Kyndryl through Net Parent investment. Short and long-term debt isfinanced by IBM, and financing decisions for wholly and majority owned subsidiaries are determined byIBM. See note A, “Significant Accounting Policies,” for additional information. Kyndryl’s cash that was notincluded in the centralized cash management and financing programs is classified as Cash and cashequivalents on the Combined Balance Sheet.
Net Parent Investment
Related party transactions between Kyndryl and IBM have been included within Net Parent investmentin the Combined Balance Sheet in the historical periods presented as these related party transactions werenot settled in cash. Net Parent investment in the Combined Balance Sheet and Combined Statement ofChanges in Equity represents IBM’s historical investment in Kyndryl, the net effect of transactions with, andallocations from IBM, and Kyndryl’s accumulated earnings. Net transfers from IBM are included within
F-48

Net Parent investment. The components of Net transfers from IBM and the reconciliation to thecorresponding amount presented on the Combined Statement of Cash Flows were as follows:
($ in millions)For the year ended December 31: 2020 2019 2018
Cash pooling and general financing activities/other . . . . . . . . . . . . . . . . . . $(4,165) $(4,390) $(4,281)Allocation of IBM’s corporate expenses/other . . . . . . . . . . . . . . . . . . . . . . 1,668 1,610 1,713Related party sales and purchases . . . . . . . . . . . . . . . . . . . . . . . . . . . . . . 2,991 2,944 3,563Related party intangible assets fee . . . . . . . . . . . . . . . . . . . . . . . . . . . . . . 80 38 —Income taxes . . . . . . . . . . . . . . . . . . . . . . . . . . . . . . . . . . . . . . . . . . . . . 297 397 310Total Net transfers from Parent per Combined Statement of Equity . . . . . . . $ 872 $ 598 $ 1,304
Income taxes . . . . . . . . . . . . . . . . . . . . . . . . . . . . . . . . . . . . . . . . . . . . . (297) (397) (310)Allocation of IBM’s stock based compensation . . . . . . . . . . . . . . . . . . . . . (64) (51) (57)Other . . . . . . . . . . . . . . . . . . . . . . . . . . . . . . . . . . . . . . . . . . . . . . . . . . (133) (132) (146)Total Net transfers from Parent per Combined Statement of Cash Flows . . . $ 377 $ 18 $ 791
Assignment of Receivables
A portion of Kyndryl’s receivables with extended payment terms have historically been assigned toIBM’s Global Financing business. These receivables were not recognized on the Company’s CombinedBalance Sheet. The gross amounts of Kyndryl receivables assigned to IBM Global Financing were$3,077 million, $3,006 million and $2,819 million for the years ended December 31, 2020, 2019 and 2018,respectively. The fees and the net gains and losses associated with the assignment of receivables were notmaterial for any of the periods presented. Refer to note A, “Significant Accounting Policies,” for moreinformation on the transfer of financial assets.
Upon completion of the spin off, there is no guarantee that the Company will be able to enter into asimilar financing arrangement with a third-party, with similar volumes to the amounts historically financedby IBM. This may result in an increase in accounts receivable balances from those amounts historicallypresented within the Combined Balance Sheets.
Acquired Intangible Assets
Within the historical periods presented, the Company has been charged a fee for the use of certainacquired intangible assets by IBM for acquisitions which were not specific to Kyndryl. The amountsreflected within cost of services on the Combined Income Statement for these fees were $31 million and$15 million, for the years ended December 31, 2020 and 2019 respectively. The amounts for these fees reflectedwithin SG&A expense within the Combined Income Statement were $49 million and $23 million, forthe years ended December 31, 2020 and 2019 respectively. No fees were charged to Kyndryl for the yearended December 31, 2018.
NOTE P. SUBSEQUENT EVENTS
The combined financial statements of Kyndryl are derived from the Consolidated Financial Statementsof IBM, which issued its financial statements for the year ended December 31, 2020 on February 23, 2021.Accordingly, the Company has evaluated transactions or other events for consideration as recognizedsubsequent events in the annual financial statements through February 23, 2021. Additionally, Kyndryl hasevaluated transactions and other events that occurred through June 22, 2021, the date these combined financialstatements were issued, for purposes of disclosure of unrecognized subsequent events.
*****
F-49

KYNDRYLCOMBINED INCOME STATEMENT
(UNAUDITED)
Three Months EndedJune 30,
Six Months EndedJune 30,
($ in millions) 2021 2020 2021 2020
Revenues (related party revenue for the three and six months: $146and $300 in 2021, $162 and $323 in 2020) . . . . . . . . . . . . . . . . $4,751 $4,737 $ 9,523 $ 9,569
Cost of services (related party cost for the three and six months:$906 and $1,912 in 2021, $900 and $1,835 in 2020) . . . . . . . . . . $4,225 $4,218 $ 8,545 $ 8,545
Selling, general and administrative . . . . . . . . . . . . . . . . . . . . . . . 814 707 1,567 1,469Workforce rebalancing charges/(benefit) . . . . . . . . . . . . . . . . . . . (11) 58 41 356Research, development and engineering . . . . . . . . . . . . . . . . . . . 15 19 29 39Interest expense . . . . . . . . . . . . . . . . . . . . . . . . . . . . . . . . . . . . 15 16 29 31Other (income) and expense . . . . . . . . . . . . . . . . . . . . . . . . . . . 11 3 34 9Total costs and expenses . . . . . . . . . . . . . . . . . . . . . . . . . . . . . . $5,070 $5,021 $10,245 $10,448Income/(loss) before income taxes . . . . . . . . . . . . . . . . . . . . . . . . $ (319) $ (284) $ (722) $ (879)Provision for income taxes . . . . . . . . . . . . . . . . . . . . . . . . . . . . . $ 74 $ 89 $ 165 $ 176Net income/(loss) . . . . . . . . . . . . . . . . . . . . . . . . . . . . . . . . . . . $ (393) $ (373) $ (887) $ (1,055)
(Amounts may not add due to rounding.)(The accompanying notes are an integral part of the financial statements.)
F-50

KYNDRYLCOMBINED STATEMENT OF COMPREHENSIVE INCOME
(UNAUDITED)
Three Months EndedJune 30,
Six Months EndedJune 30,
($ in millions) 2021 2020 2021 2020
Net income/(loss) . . . . . . . . . . . . . . . . . . . . . . . . . . . . . . . . . . . . . $(393) $(373) $(887) $(1,055)Other comprehensive income/(loss), before tax:
Foreign currency translation adjustments . . . . . . . . . . . . . . . . . . . 19 131 (78) (122)Retirement-related benefit plans
Net (losses)/gains arising during the period . . . . . . . . . . . . . . . (5) — 0 0Curtailments and settlements . . . . . . . . . . . . . . . . . . . . . . . . . — — 0 —Amortization of prior service (credits)/cost . . . . . . . . . . . . . . . 0 0 0 0Amortization of net (gains)/losses . . . . . . . . . . . . . . . . . . . . . . 10 9 21 18
Total retirement-related benefit plans . . . . . . . . . . . . . . . . . . . . . . 5 9 21 18Other comprehensive income/(loss), before tax: . . . . . . . . . . . . . . . . . 24 140 (57) (104)Income tax (expense)/benefit related to items of other comprehensive
income . . . . . . . . . . . . . . . . . . . . . . . . . . . . . . . . . . . . . . . . . . (1) (3) (6) (6)Other comprehensive income/(loss) . . . . . . . . . . . . . . . . . . . . . . . . . 23 137 (63) (110)Total comprehensive income/(loss) . . . . . . . . . . . . . . . . . . . . . . . . . . $(370) $(235) $(951) $(1,164)
(Amounts may not add due to rounding.)(The accompanying notes are an integral part of the financial statements.)
F-51
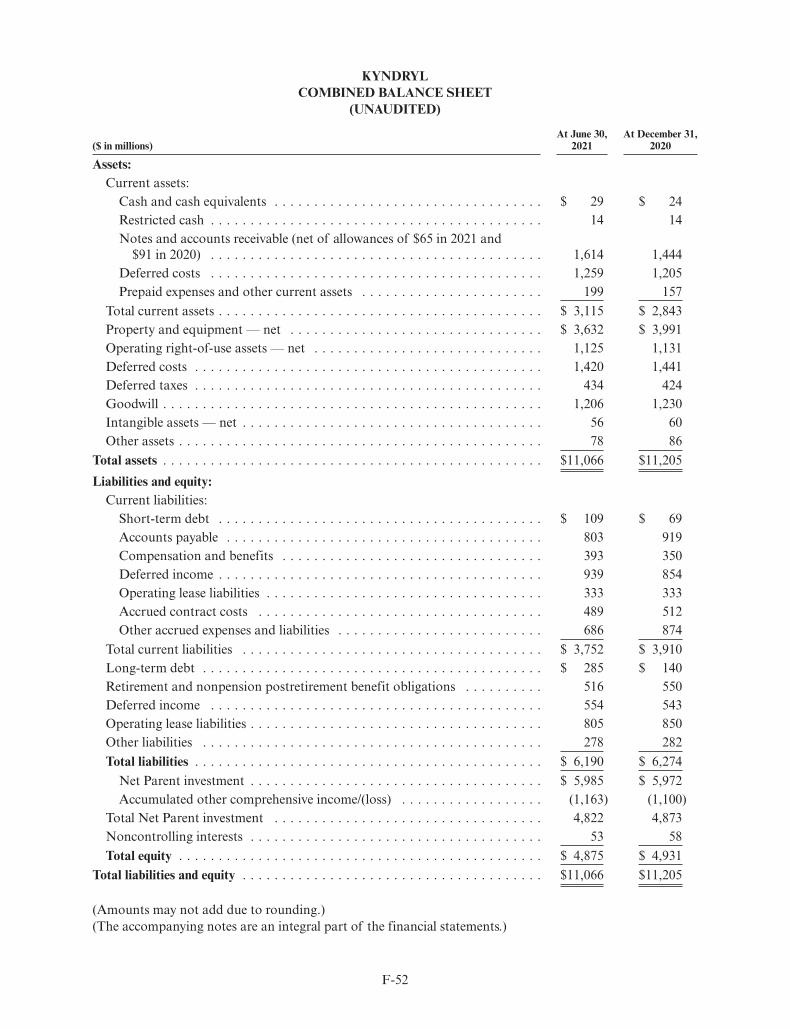
KYNDRYLCOMBINED BALANCE SHEET
(UNAUDITED)
($ in millions)At June 30,
2021At December 31,
2020
Assets:Current assets:
Cash and cash equivalents . . . . . . . . . . . . . . . . . . . . . . . . . . . . . . . . . . $ 29 $ 24Restricted cash . . . . . . . . . . . . . . . . . . . . . . . . . . . . . . . . . . . . . . . . . . 14 14Notes and accounts receivable (net of allowances of $65 in 2021 and
$91 in 2020) . . . . . . . . . . . . . . . . . . . . . . . . . . . . . . . . . . . . . . . . . . 1,614 1,444Deferred costs . . . . . . . . . . . . . . . . . . . . . . . . . . . . . . . . . . . . . . . . . . 1,259 1,205Prepaid expenses and other current assets . . . . . . . . . . . . . . . . . . . . . . . 199 157
Total current assets . . . . . . . . . . . . . . . . . . . . . . . . . . . . . . . . . . . . . . . . . $ 3,115 $ 2,843Property and equipment — net . . . . . . . . . . . . . . . . . . . . . . . . . . . . . . . . $ 3,632 $ 3,991Operating right-of-use assets — net . . . . . . . . . . . . . . . . . . . . . . . . . . . . . 1,125 1,131Deferred costs . . . . . . . . . . . . . . . . . . . . . . . . . . . . . . . . . . . . . . . . . . . . 1,420 1,441Deferred taxes . . . . . . . . . . . . . . . . . . . . . . . . . . . . . . . . . . . . . . . . . . . . 434 424Goodwill . . . . . . . . . . . . . . . . . . . . . . . . . . . . . . . . . . . . . . . . . . . . . . . . 1,206 1,230Intangible assets — net . . . . . . . . . . . . . . . . . . . . . . . . . . . . . . . . . . . . . . 56 60Other assets . . . . . . . . . . . . . . . . . . . . . . . . . . . . . . . . . . . . . . . . . . . . . . 78 86
Total assets . . . . . . . . . . . . . . . . . . . . . . . . . . . . . . . . . . . . . . . . . . . . . . . . $11,066 $11,205Liabilities and equity:
Current liabilities:Short-term debt . . . . . . . . . . . . . . . . . . . . . . . . . . . . . . . . . . . . . . . . . $ 109 $ 69Accounts payable . . . . . . . . . . . . . . . . . . . . . . . . . . . . . . . . . . . . . . . . 803 919Compensation and benefits . . . . . . . . . . . . . . . . . . . . . . . . . . . . . . . . . 393 350Deferred income . . . . . . . . . . . . . . . . . . . . . . . . . . . . . . . . . . . . . . . . . 939 854Operating lease liabilities . . . . . . . . . . . . . . . . . . . . . . . . . . . . . . . . . . . 333 333Accrued contract costs . . . . . . . . . . . . . . . . . . . . . . . . . . . . . . . . . . . . 489 512Other accrued expenses and liabilities . . . . . . . . . . . . . . . . . . . . . . . . . . 686 874
Total current liabilities . . . . . . . . . . . . . . . . . . . . . . . . . . . . . . . . . . . . . . $ 3,752 $ 3,910Long-term debt . . . . . . . . . . . . . . . . . . . . . . . . . . . . . . . . . . . . . . . . . . . $ 285 $ 140Retirement and nonpension postretirement benefit obligations . . . . . . . . . . 516 550Deferred income . . . . . . . . . . . . . . . . . . . . . . . . . . . . . . . . . . . . . . . . . . 554 543Operating lease liabilities . . . . . . . . . . . . . . . . . . . . . . . . . . . . . . . . . . . . . 805 850Other liabilities . . . . . . . . . . . . . . . . . . . . . . . . . . . . . . . . . . . . . . . . . . . 278 282Total liabilities . . . . . . . . . . . . . . . . . . . . . . . . . . . . . . . . . . . . . . . . . . . . $ 6,190 $ 6,274
Net Parent investment . . . . . . . . . . . . . . . . . . . . . . . . . . . . . . . . . . . . . $ 5,985 $ 5,972Accumulated other comprehensive income/(loss) . . . . . . . . . . . . . . . . . . (1,163) (1,100)
Total Net Parent investment . . . . . . . . . . . . . . . . . . . . . . . . . . . . . . . . . . 4,822 4,873Noncontrolling interests . . . . . . . . . . . . . . . . . . . . . . . . . . . . . . . . . . . . . 53 58Total equity . . . . . . . . . . . . . . . . . . . . . . . . . . . . . . . . . . . . . . . . . . . . . . $ 4,875 $ 4,931
Total liabilities and equity . . . . . . . . . . . . . . . . . . . . . . . . . . . . . . . . . . . . . . $11,066 $11,205
(Amounts may not add due to rounding.)(The accompanying notes are an integral part of the financial statements.)
F-52

KYNDRYLCOMBINED STATEMENT OF CASH FLOWS
(UNAUDITED)
For the Six Months Ended June 30,
($ in millions) 2021 2020
Cash flows from operating activities:Net income/(loss) . . . . . . . . . . . . . . . . . . . . . . . . . . . . . . . . . . . . . . . . . . $ (887) $(1,055)Adjustments to reconcile net income/(loss) to cash provided by operating
activities:Depreciation and amortization
Depreciation . . . . . . . . . . . . . . . . . . . . . . . . . . . . . . . . . . . . . . . . . . 853 946Amortization of deferred costs . . . . . . . . . . . . . . . . . . . . . . . . . . . . . 980 1,008Amortization of intangibles . . . . . . . . . . . . . . . . . . . . . . . . . . . . . . . 17 15
Stock-based compensation . . . . . . . . . . . . . . . . . . . . . . . . . . . . . . . . . 33 28Deferred taxes . . . . . . . . . . . . . . . . . . . . . . . . . . . . . . . . . . . . . . . . . . (14) (12)Net (gain)/loss on asset sales and other . . . . . . . . . . . . . . . . . . . . . . . . . (5) (3)Change in operating assets and liabilities:
Deferred costs . . . . . . . . . . . . . . . . . . . . . . . . . . . . . . . . . . . . . . . . . (1,057) (1,063)Right-of-use assets and liabilities . . . . . . . . . . . . . . . . . . . . . . . . . . . . (222) (238)Workforce rebalancing . . . . . . . . . . . . . . . . . . . . . . . . . . . . . . . . . . . (211) 164Receivables . . . . . . . . . . . . . . . . . . . . . . . . . . . . . . . . . . . . . . . . . . . (193) 160Accounts payable . . . . . . . . . . . . . . . . . . . . . . . . . . . . . . . . . . . . . . (95) 52Other assets/other liabilities . . . . . . . . . . . . . . . . . . . . . . . . . . . . . . . 313 86
Net cash provided by/(used in) operating activities . . . . . . . . . . . . . . . . . . . . $ (489) $ 90Cash flows from investing activities:Payments for property and equipment . . . . . . . . . . . . . . . . . . . . . . . . . . . $ (407) $ (472)Proceeds from disposition of property and equipment . . . . . . . . . . . . . . . . 109 40Other investing activities, net . . . . . . . . . . . . . . . . . . . . . . . . . . . . . . . . . . (13) (1)Net cash used in investing activities . . . . . . . . . . . . . . . . . . . . . . . . . . . . . . $ (311) $ (433)Cash flows from financing activities:Proceeds from new debt . . . . . . . . . . . . . . . . . . . . . . . . . . . . . . . . . . . . . $ 140 $ —Payments to settle debt . . . . . . . . . . . . . . . . . . . . . . . . . . . . . . . . . . . . . . (35) (28)Net transfers from Parent . . . . . . . . . . . . . . . . . . . . . . . . . . . . . . . . . . . . 702 360Net cash provided by financing activities . . . . . . . . . . . . . . . . . . . . . . . . . . $ 807 $ 332Effect of exchange rate changes on cash, cash equivalents and restricted cash $ (2) $ (2)Net change in cash, cash equivalents and restricted cash . . . . . . . . . . . . . . . $ 5 $ (13)Cash, cash equivalents and restricted cash at January 1 . . . . . . . . . . . . . . . . 38 50Cash, cash equivalents and restricted cash at June 30 . . . . . . . . . . . . . . . . . . $ 43 $ 38
(Amounts may not add due to rounding.)(The accompanying notes are an integral part of the financial statements.)
F-53

KYNDRYLCOMBINED STATEMENT OF EQUITY
(UNAUDITED)
($ in millions)
NetParent
Investment
AccumulatedOther
ComprehensiveIncome/(Loss)
TotalNet ParentInvestment
Non-ControllingInterests
TotalEquity
Equity — April 1, 2021 . . . . . . . . . . . . . . . $5,976 $(1,186) $4,791 $57 $4,848Net income/(loss) plus other comprehensive
income/(loss):Net income/(loss) . . . . . . . . . . . . . . . . . (393) (393) (393)Other comprehensive income/(loss) . . . . . 23 23 23
Total comprehensive income/(loss) . . . . . . . $ (370) $ (370)
Net transfers from parent . . . . . . . . . . . . . 402 402 402Changes in non-controlling interests . . . . . . (4) (4)Equity — June 30, 2021 . . . . . . . . . . . . . . . $5,985 $(1,163) $4,822 $53 $4,875
($ in millions)
NetParent
Investment
AccumulatedOther
ComprehensiveIncome/(Loss)
TotalNet ParentInvestment
Non-ControllingInterests
TotalEquity
Equity — April 1, 2020 . . . . . . . . . . . . . . . $7,043 $(1,468) $5,575 $51 $5,626Net income/(loss) plus other comprehensive
income/(loss):Net income/(loss) . . . . . . . . . . . . . . . . . (373) (373) (373)Other comprehensive income/(loss) . . . . . 137 137 137
Total comprehensive income/(loss) . . . . . . . $ (235) $ (235)
Net transfers from parent . . . . . . . . . . . . . 29 29 29Changes in non-controlling interests . . . . . . 3 3Equity — June 30, 2020 . . . . . . . . . . . . . . . $6,699 $(1,330) $5,369 $54 $5,423
($ in millions)
NetParent
Investment
AccumulatedOther
ComprehensiveIncome/(Loss)
TotalNet ParentInvestment
Non-ControllingInterests
TotalEquity
Equity — January 1, 2021 . . . . . . . . . . . . . $5,972 $(1,100) $4,873 $58 $4,931Net income/(loss) plus other comprehensive
income/(loss):Net income/(loss) . . . . . . . . . . . . . . . . . (887) (887) (887)Other comprehensive income/(loss) . . . . . (63) (63) (63)
Total comprehensive income/(loss) . . . . . . . $ (951) $ (951)
Net transfers from parent . . . . . . . . . . . . . 900 900 900Changes in non-controlling interests . . . . . . (5) (5)Equity — June 30, 2021 . . . . . . . . . . . . . . . $5,985 $(1,163) $4,822 $53 $4,875
F-54

($ in millions)
NetParent
Investment
AccumulatedOther
ComprehensiveIncome/(Loss)
TotalNet ParentInvestment
Non-ControllingInterests
TotalEquity
Equity — January 1, 2020 . . . . . . . . . . . . . $ 7,112 $(1,220) $ 5,892 $56 $ 5,948Net income/(loss) plus other comprehensive
income/(loss):Net income/(loss) . . . . . . . . . . . . . . . . . (1,055) (1,055) (1,055)Other comprehensive income/(loss) . . . . . (110) (110) (110)
Total comprehensive income/(loss) . . . . . . . $(1,164) $(1,164)
Net transfers from parent . . . . . . . . . . . . . 641 641 641Changes in non-controlling interests . . . . . (2) (2)Equity — June 30, 2020 . . . . . . . . . . . . . . $ 6,699 $(1,330) $ 5,369 $54 $ 5,423
(Amounts may not add due to rounding.)(The accompanying notes are an integral part of the financial statements.)
F-55

NOTES TO COMBINED FINANCIAL STATEMENTS (UNAUDITED)
1. Basis of Presentation:
Background
On October 8, 2020, International Business Machines Corporation (IBM or Parent) announced plansfor the complete legal and structural separation of the managed infrastructure services unit of its GlobalTechnology Services (GTS) segment into a new public company. The name of the new company is Kyndryl.The separation is expected to be achieved through a U.S. federal tax-free spin-off to IBM shareholders. Itwill be subject to customary market, regulatory and other closing conditions, including final IBM Board ofDirectors’ approval.
Prior to separation, IBM’s GTS segment includes Infrastructure & Cloud Services and TechnologySupport Services (TSS). The Infrastructure & Cloud services unit consists of IBM’s managed infrastructureservices capabilities and the IBM Public Cloud. The components of the GTS segment that will remainwith IBM will be the IBM Public Cloud and TSS. Kyndryl will also provide the security, regulatory and riskmanagement services and identity management services offerings which have historically been includedwithin the Security Services unit of IBM’s Cloud & Cognitive Software segment.
Basis of Presentation
The accompanying unaudited combined financial statements and footnotes of Kyndryl have beenprepared in connection with the expected separation and have been derived from the consolidated financialstatements and accounting records of IBM as if Kyndryl operated on a standalone basis during the periodspresented, and were prepared in accordance with accounting principles generally accepted in the UnitedStates of America (GAAP). In the opinion of management, these statements include all adjustments, includingnormal recurring adjustments, necessary to present a fair statement of the Company’s results of operations,financial position and cash flows. References in these statements to “the Company” or “Kyndryl” refer toIBM’s managed infrastructure services business as it was historically managed.
The combined financial statements reflect allocations of certain IBM corporate, infrastructure andshared services expenses, including centralized research, legal, human resources, payroll, finance andaccounting, employee benefits, real estate, insurance, information technology, telecommunications, treasury,and other expenses. Where possible, these charges were allocated based on direct usage, with the remainderallocated on a pro rata basis of headcount, gross profit, asset, or other allocation methodologies that areconsidered to be a reasonable reflection of the utilization of services provided or the benefit received byKyndryl during the periods presented. The allocations may not, however, reflect the expense the Companywould have incurred as a standalone company for the periods presented. These costs also may not be indicativeof the expenses that the Company will incur in the future or would have incurred if the Company hadobtained these services from a third party.
The Combined Balance Sheet of the Company includes IBM’s assets and liabilities that are specificallyidentifiable or otherwise attributable to the Company, including subsidiaries and/or joint ventures conductingmanaged infrastructure services business in which IBM has a controlling financial interest or is the primarybeneficiary.
Cash and cash equivalents held by IBM at the corporate level were not attributable to the Company forany of the periods presented due to IBM’s centralized approach to cash management and the financing ofits operations. Only cash amounts specifically held by Kyndryl are reflected in the Combined Balance Sheet.IBM’s debt was not attributed to the Company for any of the periods presented because IBM’s borrowingsare not the legal obligation of Kyndryl. Third-party debt obligations included in the combined financialstatements are those for which the legal obligor is a legal entity of Kyndryl or the debt is expected totransfer to Kyndryl no later than the effective date of the spin off. Interest expense in the Combined IncomeStatement reflects the allocation of interest on borrowing and funding related activity associated with theportion of IBM’s borrowings where the proceeds benefited the Company. Transfers of cash, both to and fromIBM’s centralized cash management system, are reflected as a component of Net Parent investment in theCombined Balance Sheet and as financing activities in the accompanying Combined Statement of CashFlows.
F-56

IBM maintains various benefit and stock-based compensation plans at a corporate level and otherpension and postretirement-related benefit plans at a subsidiary level. The Company’s employees participatein those programs and a portion of the cost of those plans is included in the Company’s combined financialstatements. However, the Combined Balance Sheet does not include any net benefit plan assets or obligationsunless legally sponsored by the Company. See note M, “Stock-Based Compensation” and note N,“Retirement-Related Benefits,” to the Company’s audited financial statements for additional information.
Net Parent investment in the Combined Balance Sheet represents the accumulation of the Company’snet income/(loss) over time and net non-trade intercompany transactions between Kyndryl and IBM (forexample, investments from IBM or distributions to IBM). Changes in these non-trade intercompany balancesare reflected as Net transfers from Parent in the financing activities section of the Combined Statement ofCash Flows.
As a result of the allocations and carve out methodologies used to prepare these combined financialstatements, these results may not be indicative of the Company’s future performance, and may not reflectthe results of operations, financial position, and cash flows had Kyndryl been a separate, standalone companyduring the periods presented. Further, interim results are not necessarily indicative of financial results fora full year. These unaudited combined financial statements should be read in conjunction with the auditedcombined financial statements and the corresponding notes thereto included elsewhere in this InformationStatement. See “Index to Combined Financial Statements.”
Kyndryl’s operations are included in the consolidated U.S. federal, certain state and local and foreignincome tax returns filed by IBM, where applicable. The income tax provision included in these combinedfinancial statements has been calculated using the separate return basis, as if Kyndryl filed separate taxreturns. Post separation, Kyndryl’s operating footprint as well as tax return elections and assertions areexpected to be different and therefore, Kyndryl’s hypothetical income taxes, as presented in the combinedfinancial statements, are not expected to be indicative of the Company’s future income taxes. Current incometax liabilities including amounts for unrecognized tax benefits related to Kyndryl’s activities included in theParent’s income tax returns were assumed to be immediately settled with Parent through the Net Parentinvestment account in the Combined Balance Sheet and reflected in Net transfers from Parent in theCombined Statement of Cash Flows.
The provision for income taxes for the second quarter of 2021 was $74 million, compared to $89 millionin the second quarter of 2020. The provision for income taxes for the first six months of 2021 was $165 million,compared to $176 million for the first six months of 2020. The provision for income taxes for the periodspresented was attributable to jurisdictions generating taxable income as well as jurisdictions in which lossesdo not generate a benefit for the Company. The decrease in provision for income taxes was primarily driven bya change in the geographic mix of income before taxes, net of change in valuation allowance.
The additions to unrecognized tax benefits for the periods presented were immaterial and are primarilyattributable to non-U.S. tax matters including transfer pricing, which are immediately settled with Parentand relieved through the Net Parent investment account in the Combined Balance Sheet and Net transfersfrom Parent in the Combined Statement of Cash Flows. The income tax provision has been prepared basedon the assumption that any subsequent changes to the Company’s income tax liability as a result of taxexaminations are the responsibility of IBM. Therefore, the impact of any subsequent changes in assessmentabout the sustainability of related tax positions, including interest and penalties, are not presented in thesecombined financial statements.
Noncontrolling interest amounts of $2 million, net of tax, for both the three months ended June 30,2021 and 2020, and $5 million, net of tax, for both the six months ended June 30, 2021 and 2020, are includedas a reduction within other (income) and expense in the Combined Income Statement.
Within the financial statements and tables presented, certain columns and rows may not add due to theuse of rounded numbers for disclosure purposes. Percentages presented are calculated from the underlyingwhole-dollar amounts.
Principles of Combination
The combined financial statements include the Company’s net assets and results of operations asdescribed above. All significant intracompany transactions between Kyndryl’s businesses have been
F-57

eliminated. All significant intercompany transactions between Kyndryl and IBM have been included in thecombined financial statements. Intercompany transactions between Kyndryl and IBM are considered to beeffectively settled in the combined financial statements at the time the transaction is recorded. The totalnet effect of the settlement of these intercompany transactions is reflected as Net transfers from Parent inthe financing activities section in the Combined Statement of Cash Flows and in the Combined Balance Sheetwithin Net Parent investment.
Use of Estimates
The preparation of financial statements in conformity with GAAP requires management to makeestimates and assumptions that affect amounts that are reported in the combined financial statements andaccompanying disclosures. Estimates are used in determining the allocation of costs and expenses from IBM,and are used in determining the following, among others: revenue, costs to complete service contracts,income taxes, pension assumptions, valuation of assets including goodwill and intangible assets, thedepreciable and amortizable lives of other long-lived assets, loss contingencies, allowance for credit losses,deferred transition costs and other matters. These estimates are based on management’s best knowledge ofcurrent events, historical experience, actions that the Company may undertake in the future and on variousother assumptions that are believed to be reasonable under the circumstances, including the macroeconomicimpacts of the COVID-19 pandemic (beginning in 2020). Actual results may be different from these estimates.
2. Accounting Pronouncements:
Standards Implemented
Simplifying the Accounting for Income Taxes
Standard/Description — Issuance date: December 2019. This guidance simplifies various aspects ofincome tax accounting by removing certain exceptions to the general principle of the guidance and alsoclarifies and amends existing guidance to improve consistency in application.
Effective Date and Adoption Considerations — The guidance was effective January 1, 2021 and earlyadoption was permitted. The company adopted the guidance on a prospective basis as of the effective date.
Effect on Financial Statements or Other Significant Matters — The guidance did not have a materialimpact in the combined financial results.
Simplifying the Test for Goodwill Impairment
Standard/Description — Issuance date: January 2017. This guidance simplifies the goodwill impairmenttest by removing Step 2. It also requires disclosure of any reporting units that have zero or negative carryingamounts if they have goodwill allocated to them.
Effective Date and Adoption Considerations — The guidance was effective January 1, 2020 and earlyadoption was permitted. The Company adopted the guidance on a prospective basis as of the effective date.
Effect on Financial Statements or Other Significant Matters — The guidance did not have a materialimpact in the Company’s combined financial statements upon adoption.
Financial Instruments — Credit Losses
Standard/Description — Issuance date: June 2016, with amendments in 2018, 2019, and 2020. Thischanges the guidance for credit losses based on an expected loss model rather than an incurred loss model.It requires the consideration of all available relevant information when estimating expected credit losses,including past events, current conditions and forecasts and their implications for expected credit losses. Italso expands the scope of financial instruments subject to impairment, including off-balance sheetcommitments and residual value.
Effective Date and Adoption Considerations — The guidance was effective January 1, 2020 with one-year early adoption permitted. The Company adopted the guidance as of the effective date, using the
F-58

transition methodology whereby prior comparative periods were not retrospectively presented in thecombined financial statements.
Effect on Financial Statements or Other Significant Matters — At January 1, 2020, the guidance didnot have a material impact in the Company’s combined financial results.
3. Revenue Recognition:
Disaggregation of Revenue
The following table provides details of revenue by geography.
Revenue by Geography
For the Three Months Ended June 30, For the Six Months Ended June 30,
($ in millions) 2021 2020 2021 2020
Americas* . . . . . . . . . . . . . . . . . . . . . . . . $1,794 $1,827 $3,596 $3,712Europe/Middle East/Africa** . . . . . . . . . . 1,819 1,764 3,630 3,557Japan+ . . . . . . . . . . . . . . . . . . . . . . . . . . 746 751 1,507 1,488Asia Pacific++ . . . . . . . . . . . . . . . . . . . . . 393 395 790 812Total revenue . . . . . . . . . . . . . . . . . . . . . . $4,751 $4,737 $9,523 $9,569
* Includes related party revenue of $87 million and $96 million for the three months ended June 2021and 2020, respectively; and $181 million and $188 million for the six months ended June 2021 and 2020respectively
** Includes related party revenue of $27 million and $31 million for the three months ended June 2021and 2020, respectively; and $54 million and $63 million for the six months ended June 2021 and 2020respectively
+ Includes related party revenue of $15 million and $19 million for the three months ended June 2021and 2020, respectively; and $32 million and $36 million for the six months ended June 2021 and 2020respectively
++ Includes related party revenue of $17 million and $17 million for the three months ended June 2021and 2020, respectively; and $33 million and $36 million for the six months ended June 2021 and 2020respectively
Remaining Performance Obligations
The remaining performance obligation (RPO) disclosure provides the aggregate amount of thetransaction price yet to be recognized as of the end of the reporting period and an explanation as to whenthe Company expects to recognize these amounts in revenue. It is intended to be a statement of overall workunder contract that has not yet been performed and does not include contracts in which the customer isnot committed. The customer is not considered committed when they are able to terminate for conveniencewithout payment of a substantive penalty. The disclosure also includes estimates of variable consideration.Additionally, as a practical expedient, the Company does not include contracts that have an original durationof one year or less. RPO estimates are subject to change and are affected by several factors, includingterminations, changes in the scope of contracts, periodic revalidations, adjustment for revenue that has notmaterialized and adjustments for currency.
At June 30, 2021, the aggregate amount of the transaction price allocated to RPO related to customercontracts that are unsatisfied or partially unsatisfied was $55 billion. Approximately 50 percent of the amountis expected to be recognized as revenue in the subsequent two years, approximately 35 percent in thesubsequent three to five years and the balance thereafter.
F-59

Revenue Recognized for Performance Obligations Satisfied (or Partially Satisfied) in Prior Periods
The revenue recognized for the three and six months ended June 30, 2021 for performance obligationssatisfied (or partially satisfied) in previous periods was immaterial.
Reconciliation of Contract Balances
The following table provides information about notes and accounts receivable, contract assets anddeferred income balances.
($ in millions)At June 30,
2021At December 31,
2020
Notes and accounts receivable (net of allowances of $65 in 2021 and $91 in2020) . . . . . . . . . . . . . . . . . . . . . . . . . . . . . . . . . . . . . . . . . . . . . . . . . . $1,614 $1,444
Contract assets* . . . . . . . . . . . . . . . . . . . . . . . . . . . . . . . . . . . . . . . . . . . . 75 72Deferred income (current) . . . . . . . . . . . . . . . . . . . . . . . . . . . . . . . . . . . . . 939 854Deferred income (noncurrent) . . . . . . . . . . . . . . . . . . . . . . . . . . . . . . . . . . . 554 543
* Included within prepaid expenses and other current assets in the Combined Balance Sheet.
The amount of revenue recognized during the three and six months ended June 30, 2021 that wasincluded within the deferred income balance at March 31, 2021 and December 31, 2020 was $456 millionand $525 million, respectively.
The following table provides roll forwards of the notes and accounts receivable allowance for thesix months ended June 30, 2021 and the year ended December 31, 2020.
($ in millions)January 1, 2021 Additions / (Releases) Write-offs Other* June 30, 2021
$ 91 $(24) $(4) $1 $65
January 1, 2020 Additions / (Releases) Write-offs Other* December 31, 2020
$ 82 $25 $(7) $(9) $91
* Primarily represents translation adjustments and reclassifications.
The contract assets allowance for expected credit losses was not material in any of the periods presented.
Deferred Costs
($ in millions)At June 30,
2021At December 31,
2020
Capitalized costs to obtain a contract . . . . . . . . . . . . . . . . . . . . . . . . . . . . . . $ 286 $ 269Deferred costs to fulfill a contract
Deferred setup costs . . . . . . . . . . . . . . . . . . . . . . . . . . . . . . . . . . . . . . . . 1,301 1,369Other deferred fulfillment costs* . . . . . . . . . . . . . . . . . . . . . . . . . . . . . . . 1,092 1,006
Total deferred costs** . . . . . . . . . . . . . . . . . . . . . . . . . . . . . . . . . . . . . . . . $2,679 $2,646
* Includes related party cost of $73 million at June 30, 2021 and $94 million at December 31, 2020.** Of the total deferred costs, $1,259 million was current (related party $60 million) and $1,420 million
was noncurrent (related party $14 million) at June 30, 2021 and $1,205 million was current (related party$76 million) and $1,441 million was noncurrent (related party $18 million) at December 31, 2020.
The amount of total deferred costs amortized during the second quarter of 2021 was $497 million,composed of $245 million amortization of prepaid software, $97 million amortization of transition andsetup costs, and $156 million of other deferred fulfilment costs. The amount of total deferred costs amortized
F-60

during the first six months of 2021 was $980 million, composed of $470 million amortization of prepaidsoftware, $194 million amortization of transition and setup costs, and $316 million of other deferred fulfilmentcosts.
4. Segments:
The following tables reflect the results of the Company’s segments consistent with the managementmeasurement system that has been utilized within the Company. Performance measurement is based on pre-tax income. These results are used, in part, by the chief operating decision maker, both in evaluating theperformance of, and in allocating resources to, each of the segments.
In the second quarter and first half of 2020, the company recorded $58 million and $356 million inworkforce rebalancing charges in the Combined Income Statement for severance and employee relatedbenefits in accordance with the accounting guidance for ongoing benefit arrangements. The impact to pre-tax income by segment for the six months ended June 30, 2020 was as follows: EMEA $235 million, Americas$88 million, Asia Pacific $18 million, and Japan $15 million. The current year financial results include a year-to-year improvement in workforce rebalancing charges of $69 million and $315 million for the three andsix months ended June 30, 2021 respectively.
TotalSegments($ in millions) Americas EMEA Japan Asia Pacific
For the three months ended June 30, 2021External revenue . . . . . . . . . . . . . . . . . . . . . . . . . . . . $1,706 $1,792 $ 731 $ 376 $4,605Related party revenue . . . . . . . . . . . . . . . . . . . . . . . . 87 27 15 17 146Total revenue . . . . . . . . . . . . . . . . . . . . . . . . . . . . . . $1,794 $1,819 $ 746 $ 393 $4,751
Pre-tax income/(loss) . . . . . . . . . . . . . . . . . . . . . . . . . $ (49) $ (321) $ 27 $ 25 $ (319)
Revenue year-to-year change . . . . . . . . . . . . . . . . . . . (1.9)% 3.1% (0.7)% (0.4)% 0.3%Pre-tax income/loss year-to-year change . . . . . . . . . . . (36.7)% 8.8% (36.4)% (46.7)% 12.2%Pre-tax income/(loss) margin . . . . . . . . . . . . . . . . . . . (2.8)% (17.7)% 3.6% 6.4% (6.7)%For the three months ended June 30, 2020External revenue . . . . . . . . . . . . . . . . . . . . . . . . . . . . $1,732 $1,733 $ 732 $ 378 $4,575Related party revenue . . . . . . . . . . . . . . . . . . . . . . . . 96 31 19 17 162Total revenue . . . . . . . . . . . . . . . . . . . . . . . . . . . . . . $1,827 $1,764 $ 751 $ 395 $4,737
Pre-tax income/(loss) . . . . . . . . . . . . . . . . . . . . . . . . . $ (78) $ (296) $ 43 $ 47 $ (284)
Revenue year-to-year change . . . . . . . . . . . . . . . . . . . (8.8)% (6.5)% 4.2% (15.6)% (6.7)%Pre-tax income/loss year-to-year change . . . . . . . . . . . nm (2.3)% 13.5% 66.7% 17.2%Pre-tax income/(loss) margin . . . . . . . . . . . . . . . . . . . (4.3)% (16.8)% 5.7% 11.9% (6.0)%
nm — not meaningful
F-61

TotalSegments($ in millions) Americas EMEA Japan Asia Pacific
For the six months ended June 30, 2021External revenue . . . . . . . . . . . . . . . . . . . . . . . . . . . $3,415 $3,575 $1,475 $ 757 $9,223Related party revenue . . . . . . . . . . . . . . . . . . . . . . . . 181 54 32 33 300Total revenue . . . . . . . . . . . . . . . . . . . . . . . . . . . . . . $3,596 $3,630 $1,507 $ 790 $9,523
Pre-tax income/(loss) . . . . . . . . . . . . . . . . . . . . . . . . $ (122) $ (745) $ 55 $ 90 $ (722)
Revenue year-to-year change . . . . . . . . . . . . . . . . . . . (3.1)% 2.0% 1.3% (2.7)% (0.5)%Pre-tax income/loss year-to-year change . . . . . . . . . . . (43.9)% (9.1)% (26.8)% 9.0% (17.9)%Pre-tax income/(loss) margin . . . . . . . . . . . . . . . . . . . (3.4)% (20.5)% 3.7% 11.4% (7.6)%For the six months ended June 30, 2020External revenue . . . . . . . . . . . . . . . . . . . . . . . . . . . $3,524 $3,494 $1,452 $ 776 $9,246Related party revenue . . . . . . . . . . . . . . . . . . . . . . . . 188 63 36 36 323Total revenue . . . . . . . . . . . . . . . . . . . . . . . . . . . . . . $3,712 $3,557 $1,488 $ 812 $9,569
Pre-tax income/(loss) . . . . . . . . . . . . . . . . . . . . . . . . $ (217) $ (820) $ 75 $ 83 $ (879)
Revenue year-to-year change . . . . . . . . . . . . . . . . . . . (7.7)% (6.1)% 4.2% (13.7)% (6.0)%Pre-tax income/loss year-to-year change . . . . . . . . . . . nm 35.6% 72.7% 32.1% 79.4%Pre-tax income/(loss) margin . . . . . . . . . . . . . . . . . . . (5.9)% (23.0)% 5.1% 10.2% (9.2)%
nm — not meaningful
5. Intangible Assets Including Goodwill:
Intangible Assets
The following tables present the Company’s intangible asset balances by major asset class:
($ in millions)
At June 30, 2021
Gross CarryingAmount
AccumulatedAmortization
Net CarryingAmount
Intangible asset classCapitalized software . . . . . . . . . . . . . . . . . . . . . . . . . . . . . . $ 18 $ (7) $11Client relationships . . . . . . . . . . . . . . . . . . . . . . . . . . . . . . . 130 (86) 44Completed technology . . . . . . . . . . . . . . . . . . . . . . . . . . . . . 20 (18) 1Patents/trademarks . . . . . . . . . . . . . . . . . . . . . . . . . . . . . . . 2 (2) 0
Total . . . . . . . . . . . . . . . . . . . . . . . . . . . . . . . . . . . . . . . . . . . $170 $(113) $56
At December 31, 2020
Gross CarryingAmount
AccumulatedAmortization
Net CarryingAmount($ in millions)
Intangible asset classCapitalized software . . . . . . . . . . . . . . . . . . . . . . . . . . . . . . $ 7 $ (4) $ 3Client relationships . . . . . . . . . . . . . . . . . . . . . . . . . . . . . . . 130 (77) 53Completed technology . . . . . . . . . . . . . . . . . . . . . . . . . . . . . 20 (17) 3Patents/trademarks . . . . . . . . . . . . . . . . . . . . . . . . . . . . . . . 2 (2) 0
Total . . . . . . . . . . . . . . . . . . . . . . . . . . . . . . . . . . . . . . . . . . . $159 $(99) $60
F-62
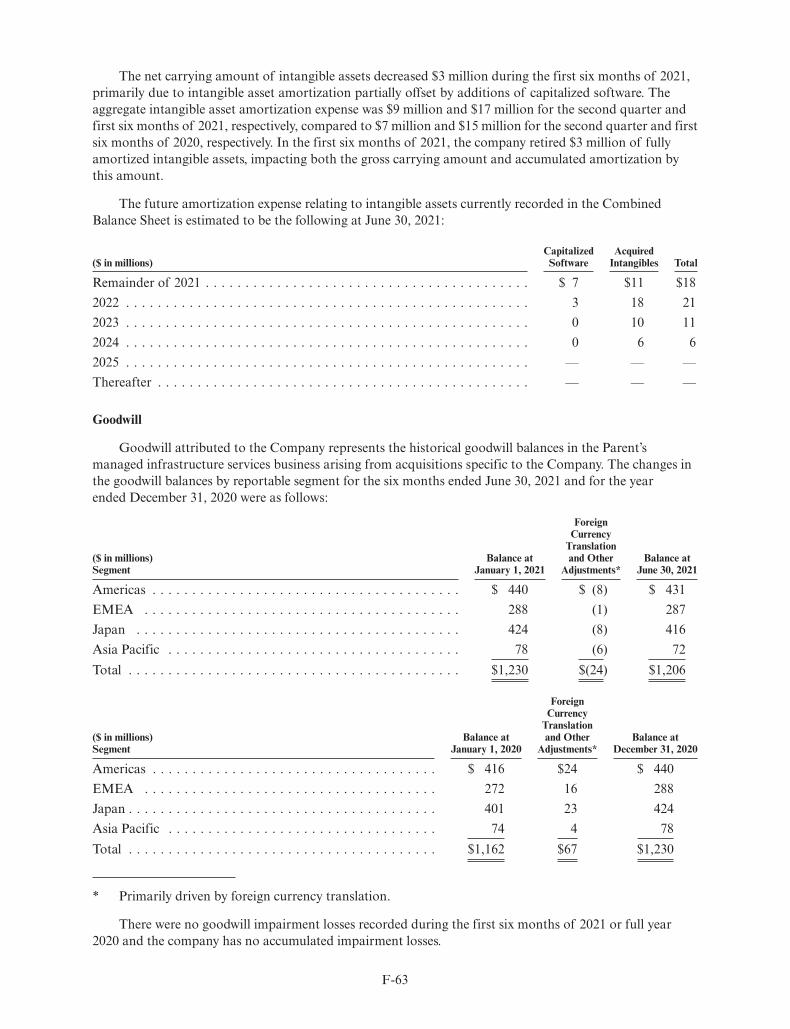
The net carrying amount of intangible assets decreased $3 million during the first six months of 2021,primarily due to intangible asset amortization partially offset by additions of capitalized software. Theaggregate intangible asset amortization expense was $9 million and $17 million for the second quarter andfirst six months of 2021, respectively, compared to $7 million and $15 million for the second quarter and firstsix months of 2020, respectively. In the first six months of 2021, the company retired $3 million of fullyamortized intangible assets, impacting both the gross carrying amount and accumulated amortization bythis amount.
The future amortization expense relating to intangible assets currently recorded in the CombinedBalance Sheet is estimated to be the following at June 30, 2021:
CapitalizedSoftware
AcquiredIntangibles($ in millions) Total
Remainder of 2021 . . . . . . . . . . . . . . . . . . . . . . . . . . . . . . . . . . . . . . . . . $ 7 $11 $182022 . . . . . . . . . . . . . . . . . . . . . . . . . . . . . . . . . . . . . . . . . . . . . . . . . . . 3 18 212023 . . . . . . . . . . . . . . . . . . . . . . . . . . . . . . . . . . . . . . . . . . . . . . . . . . . 0 10 112024 . . . . . . . . . . . . . . . . . . . . . . . . . . . . . . . . . . . . . . . . . . . . . . . . . . . 0 6 62025 . . . . . . . . . . . . . . . . . . . . . . . . . . . . . . . . . . . . . . . . . . . . . . . . . . . — — —Thereafter . . . . . . . . . . . . . . . . . . . . . . . . . . . . . . . . . . . . . . . . . . . . . . . — — —
Goodwill
Goodwill attributed to the Company represents the historical goodwill balances in the Parent’smanaged infrastructure services business arising from acquisitions specific to the Company. The changes inthe goodwill balances by reportable segment for the six months ended June 30, 2021 and for the yearended December 31, 2020 were as follows:
($ in millions)Segment
Balance atJanuary 1, 2021
ForeignCurrency
Translationand Other
Adjustments*Balance at
June 30, 2021
Americas . . . . . . . . . . . . . . . . . . . . . . . . . . . . . . . . . . . . . . . $ 440 $ (8) $ 431EMEA . . . . . . . . . . . . . . . . . . . . . . . . . . . . . . . . . . . . . . . . 288 (1) 287Japan . . . . . . . . . . . . . . . . . . . . . . . . . . . . . . . . . . . . . . . . . 424 (8) 416Asia Pacific . . . . . . . . . . . . . . . . . . . . . . . . . . . . . . . . . . . . . 78 (6) 72Total . . . . . . . . . . . . . . . . . . . . . . . . . . . . . . . . . . . . . . . . . . $1,230 $(24) $1,206
($ in millions)Segment
Balance atJanuary 1, 2020
ForeignCurrency
Translationand Other
Adjustments*Balance at
December 31, 2020
Americas . . . . . . . . . . . . . . . . . . . . . . . . . . . . . . . . . . . . $ 416 $24 $ 440EMEA . . . . . . . . . . . . . . . . . . . . . . . . . . . . . . . . . . . . . 272 16 288Japan . . . . . . . . . . . . . . . . . . . . . . . . . . . . . . . . . . . . . . . 401 23 424Asia Pacific . . . . . . . . . . . . . . . . . . . . . . . . . . . . . . . . . . 74 4 78Total . . . . . . . . . . . . . . . . . . . . . . . . . . . . . . . . . . . . . . . $1,162 $67 $1,230
* Primarily driven by foreign currency translation.
There were no goodwill impairment losses recorded during the first six months of 2021 or full year2020 and the company has no accumulated impairment losses.
F-63

6. Borrowings:
Short-Term Debt
($ in millions)At June 30,
2021At December 31,
2020
Long-term debt – current maturities . . . . . . . . . . . . . . . . . . . . . . . . . . . . . . $109 $69
Long-Term Debt
($ in millions) MaturitiesBalance
6/30/2021Balance
12/31/2020
U.S. dollar debt (weighted-average interest rate at June 30, 2021):Long-term debt (3.0%) . . . . . . . . . . . . . . . . . . . . . . . . . . . . . . . . . . . 2021-2026 $140 $ —Finance lease obligations (1.3%) . . . . . . . . . . . . . . . . . . . . . . . . . . . . 2021-2026 254 209
$394 $209Less: current maturities . . . . . . . . . . . . . . . . . . . . . . . . . . . . . . . . . . 109 69Total . . . . . . . . . . . . . . . . . . . . . . . . . . . . . . . . . . . . . . . . . . . . . . . $285 $140
In the second quarter of 2021, IBM entered into a $140 million loan agreement with a bank to financea purchase on behalf of Kyndryl. The amortizing loan is secured by collateral and contains covenants,primarily for compliance with the scheduled payments in the loan agreement. Failure to comply with the loancovenants could constitute an event of default and result in the immediate repayment of the principal andinterest on the loan. The Company is in compliance with all of the loan covenants and is expected to maintaina credit rating at or above the level outlined in the loan agreement. The loan is expected to transfer toKyndryl no later than the effective date of the spin-off and is included in the Company’s financial statements.The carrying amount of the loan approximates fair value. If measured at fair value in the financialstatements, the loan would be classified as Level 2 in the fair value hierarchy.
($ in millions)At June 30, 2021: Total
Remainder of 2021 . . . . . . . . . . . . . . . . . . . . . . . . . . . . . . . . . . . . . . . . . . . . . . . . . . . . . . . . . $ 542022 . . . . . . . . . . . . . . . . . . . . . . . . . . . . . . . . . . . . . . . . . . . . . . . . . . . . . . . . . . . . . . . . . . . 1062023 . . . . . . . . . . . . . . . . . . . . . . . . . . . . . . . . . . . . . . . . . . . . . . . . . . . . . . . . . . . . . . . . . . . 932024 . . . . . . . . . . . . . . . . . . . . . . . . . . . . . . . . . . . . . . . . . . . . . . . . . . . . . . . . . . . . . . . . . . . 672025 . . . . . . . . . . . . . . . . . . . . . . . . . . . . . . . . . . . . . . . . . . . . . . . . . . . . . . . . . . . . . . . . . . . 52Thereafter . . . . . . . . . . . . . . . . . . . . . . . . . . . . . . . . . . . . . . . . . . . . . . . . . . . . . . . . . . . . . . . 21Total . . . . . . . . . . . . . . . . . . . . . . . . . . . . . . . . . . . . . . . . . . . . . . . . . . . . . . . . . . . . . . . . . . . $394
Interest on Debt
Interest expense for the six months ended June 30, 2021 and 2020 was $29 million and $31 million,respectively. Interest capitalized for the periods presented was immaterial. Most of the interest in theCombined Income Statement reflects the allocation of interest expense on borrowing and funding relatedactivity associated with debt issued by IBM for which a portion of the proceeds benefited Kyndryl. SuchParent debt has not been attributed to the Company for any periods presented because Parent’s borrowingsare not the legal obligation of the Company. Refer to note 12, “Related Party Transactions,” for moreinformation on the allocation of Parent’s corporate expenses.
7. Commitments:
The Company has applied the guidance requiring a guarantor to disclose certain types of guarantees,even if the likelihood of requiring the guarantor’s performance is remote. The Company guarantees certainloans and financial commitments. The maximum potential future payment under these financial guarantees
F-64

and the fair value of these guarantees recognized in the Combined Balance Sheet at June 30, 2021 andDecember 31, 2020 were not material.
8. Contingencies:
As a company with approximately 90,000 employees and with clients around the world, Kyndryl issubject to, or could become subject to, either as plaintiff or defendant, a variety of contingencies, includingclaims, demands and suits, investigations, tax matters, and proceedings that arise from time to time in theordinary course of its business. Given the rapidly evolving external landscape of cybersecurity, privacy anddata protection laws, regulations and threat actors, the Company or its clients could become subject to actionsor proceedings in various jurisdictions. Also, as is typical for companies of Kyndryl’s scope and scale, theCompany is subject to, or could become subject to, actions and proceedings in various jurisdictions involvinga wide range of labor and employment issues (including matters related to contested employment decisions,country-specific labor and employment laws, and the Company’s benefit plans), as well as actions withrespect to contracts, securities, foreign operations, competition law and environmental matters. These actionsmay be commenced by a number of different parties, including competitors, clients, employees, governmentand regulatory agencies, stockholders and representatives of the locations in which the Company doesbusiness. Some of the actions to which the Company is, or may become, party may involve particularlycomplex technical issues, and some actions may raise novel questions under the laws of the various jurisdictionsin which these matters arise. Additionally, the Company is, or may be, a party to agreements pursuant towhich it may be obligated to indemnify the other party with respect to certain matters.
The Company records a provision with respect to a claim, suit, investigation or proceeding when it isprobable that a liability has been incurred and the amount of the loss can be reasonably estimated. Inaccordance with the relevant accounting guidance, the Company provides disclosures of matters for whichthe likelihood of material loss is at least reasonably possible. In addition, the Company may also disclosematters based on its consideration of other matters and qualitative factors, including the experience ofother companies in the industry, and investor, customer and employee relations considerations.
The Company reviews claims, suits, investigations and proceedings at least quarterly, and decisions aremade with respect to recording or adjusting provisions and disclosing reasonably possible losses or range oflosses (individually or in the aggregate), to reflect the impact and status of settlement discussions, discovery,procedural and substantive rulings, reviews by counsel and other information pertinent to a particular matter.
Whether any losses, damages or remedies finally determined in any claim, suit, investigation orproceeding could reasonably have a material effect on the Company’s business, financial condition, resultsof operations or cash flows will depend on a number of variables, including: the timing and amount of suchlosses or damages; the structure and type of any such remedies; the significance of the impact any suchlosses, damages or remedies may have in the combined financial statements; and the unique facts andcircumstances of the particular matter that may give rise to additional factors. While the Company willcontinue to defend itself vigorously, it is possible that the Company’s business, financial condition, results ofoperations or cash flows could be affected in any particular period by the resolution of one or more ofthese matters.
The following is a summary of a significant legal matter relating to the Company.
In July 2017, BMC Software, Inc. (BMC) sued IBM in the U.S. Court for the Southern District ofTexas in a dispute involving IBM's managed infrastructure services business. BMC alleges IBM’s removal ofBMC software from one of its client’s sites at the client’s request constituted breach of contract and tradesecret misappropriation. IBM defeated BMC’s motion for injunctive relief, completed the client’stransformation project and counterclaimed for breach of contract. In September 2021, the trial courtoverruled in part and granted in part the Magistrate Judge’s recommendations on summary judgment,dismissing IBM’s counterclaims and permitting some of BMC’s claims for damages to proceed. The caseremains pending.
F-65
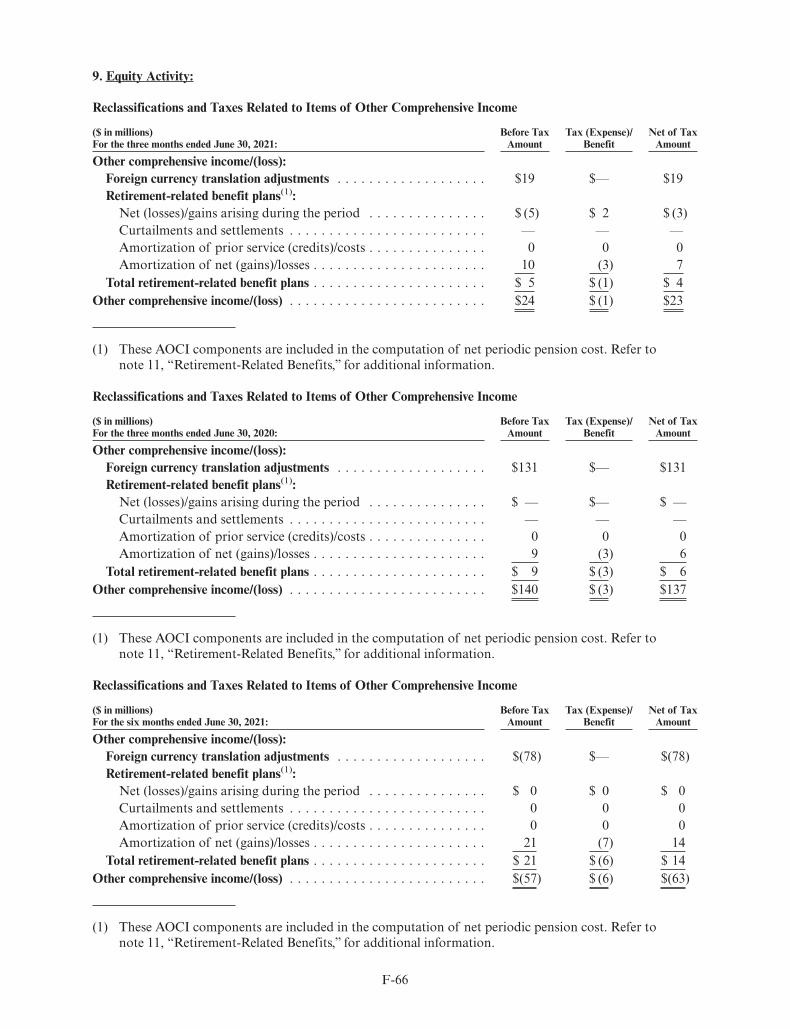
9. Equity Activity:
Reclassifications and Taxes Related to Items of Other Comprehensive Income
($ in millions)For the three months ended June 30, 2021:
Before TaxAmount
Tax (Expense)/Benefit
Net of TaxAmount
Other comprehensive income/(loss):Foreign currency translation adjustments . . . . . . . . . . . . . . . . . . . $19 $— $19Retirement-related benefit plans(1):
Net (losses)/gains arising during the period . . . . . . . . . . . . . . . $ (5) $ 2 $ (3)Curtailments and settlements . . . . . . . . . . . . . . . . . . . . . . . . . — — —Amortization of prior service (credits)/costs . . . . . . . . . . . . . . . 0 0 0Amortization of net (gains)/losses . . . . . . . . . . . . . . . . . . . . . . 10 (3) 7
Total retirement-related benefit plans . . . . . . . . . . . . . . . . . . . . . . $ 5 $ (1) $ 4Other comprehensive income/(loss) . . . . . . . . . . . . . . . . . . . . . . . . . $24 $ (1) $23
(1) These AOCI components are included in the computation of net periodic pension cost. Refer tonote 11, “Retirement-Related Benefits,” for additional information.
Reclassifications and Taxes Related to Items of Other Comprehensive Income
($ in millions)For the three months ended June 30, 2020:
Before TaxAmount
Tax (Expense)/Benefit
Net of TaxAmount
Other comprehensive income/(loss):Foreign currency translation adjustments . . . . . . . . . . . . . . . . . . . $131 $— $131Retirement-related benefit plans(1):
Net (losses)/gains arising during the period . . . . . . . . . . . . . . . $ — $— $ —Curtailments and settlements . . . . . . . . . . . . . . . . . . . . . . . . . — — —Amortization of prior service (credits)/costs . . . . . . . . . . . . . . . 0 0 0Amortization of net (gains)/losses . . . . . . . . . . . . . . . . . . . . . . 9 (3) 6
Total retirement-related benefit plans . . . . . . . . . . . . . . . . . . . . . . $ 9 $ (3) $ 6Other comprehensive income/(loss) . . . . . . . . . . . . . . . . . . . . . . . . . $140 $ (3) $137
(1) These AOCI components are included in the computation of net periodic pension cost. Refer tonote 11, “Retirement-Related Benefits,” for additional information.
Reclassifications and Taxes Related to Items of Other Comprehensive Income
($ in millions)For the six months ended June 30, 2021:
Before TaxAmount
Tax (Expense)/Benefit
Net of TaxAmount
Other comprehensive income/(loss):Foreign currency translation adjustments . . . . . . . . . . . . . . . . . . . $(78) $— $(78)Retirement-related benefit plans(1):
Net (losses)/gains arising during the period . . . . . . . . . . . . . . . $ 0 $ 0 $ 0Curtailments and settlements . . . . . . . . . . . . . . . . . . . . . . . . . 0 0 0Amortization of prior service (credits)/costs . . . . . . . . . . . . . . . 0 0 0Amortization of net (gains)/losses . . . . . . . . . . . . . . . . . . . . . . 21 (7) 14
Total retirement-related benefit plans . . . . . . . . . . . . . . . . . . . . . . $ 21 $ (6) $ 14Other comprehensive income/(loss) . . . . . . . . . . . . . . . . . . . . . . . . . $(57) $ (6) $(63)
(1) These AOCI components are included in the computation of net periodic pension cost. Refer tonote 11, “Retirement-Related Benefits,” for additional information.
F-66

Reclassifications and Taxes Related to Items of Other Comprehensive Income
($ in millions)For the six months ended June 30, 2020:
Before TaxAmount
Tax (Expense)/Benefit
Net of TaxAmount
Other comprehensive income/(loss):Foreign currency translation adjustments . . . . . . . . . . . . . . . . . . . $(122) $— $(122)Retirement-related benefit plans(1):
Net (losses)/gains arising during the period . . . . . . . . . . . . . . . $ 0 $ (0) $ 0Curtailments and settlements . . . . . . . . . . . . . . . . . . . . . . . . . — — —Amortization of prior service (credits)/costs . . . . . . . . . . . . . . . 0 0 0Amortization of net (gains)/losses . . . . . . . . . . . . . . . . . . . . . . 18 (5) 12
Total retirement-related benefit plans . . . . . . . . . . . . . . . . . . . . . . $ 18 $ (6) $ 12Other comprehensive income/(loss) . . . . . . . . . . . . . . . . . . . . . . . . . $(104) $ (6) $(110)
(1) These AOCI components are included in the computation of net periodic pension cost. Refer tonote 11, “Retirement-Related Benefits,” for additional information.
Accumulated Other Comprehensive Income/(Loss) (net of tax)
($ in millions)
ForeignCurrency
TranslationAdjustments*
Net ChangeRetirement-
RelatedBenefitPlans
AccumulatedOther
ComprehensiveIncome/(Loss)
January 1, 2021 . . . . . . . . . . . . . . . . . . . . . . . . . . . . . . . . . . . . $(882) $(218) $(1,100)
Other comprehensive income/(loss)** . . . . . . . . . . . . . . . . . . . . . (78) 14 (63)June 30, 2021 . . . . . . . . . . . . . . . . . . . . . . . . . . . . . . . . . . . . . . $(959) $(204) $(1,163)
* Foreign currency translation adjustments are presented gross.
** No amounts were reclassified from accumulated other comprehensive income.
($ in millions)
ForeignCurrency
TranslationAdjustments*
Net ChangeRetirement-
RelatedBenefitPlans
AccumulatedOther
ComprehensiveIncome/(Loss)
January 1, 2020 . . . . . . . . . . . . . . . . . . . . . . . . . . . . . . . . . . . . $(1,007) $(214) $(1,220)
Other comprehensive income/(loss)** . . . . . . . . . . . . . . . . . . . . . (122) 12 (110)June 30, 2020 . . . . . . . . . . . . . . . . . . . . . . . . . . . . . . . . . . . . . . $(1,129) $(201) $(1,330)
* Foreign currency translation adjustments are presented gross.
** No amounts were reclassified from accumulated other comprehensive income.
10. Stock-Based Compensation:
Compensation costs associated with Kyndryl employees’ participation in the Parent’s incentive planshave been identified for employees who exclusively support Kyndryl operations. Amounts allocated to theCompany from the Parent for shared services are reported within total allocated costs in note 12, “RelatedParty Transactions.”
F-67

The following table presents stock-based compensation cost associated with employees who exclusivelysupport the Company and is included in net income/(loss):
For the Three Months Ended June 30, For the Six Months Ended June 30,
($ in millions) 2021 2020 2021 2020
Cost . . . . . . . . . . . . . . . . . . . . . . . . . . . . $ 7 $ 7 $14 $11SG&A expense . . . . . . . . . . . . . . . . . . . . 11 9 19 17RD&E expense . . . . . . . . . . . . . . . . . . . . 0 0 0 1Pre-tax stock-based compensation cost . . . . $18 $16 $33 $28Income tax benefits . . . . . . . . . . . . . . . . . (5) (3) (9) (6)Net stock-based compensation cost . . . . . . $13 $13 $25 $22
Total unrecognized compensation cost related to non-vested awards at June 30, 2021 was $107 millionand is expected to be recognized over a weighted-average period of approximately 2.3 years. If there are anymodifications or cancellations of the underlying unvested awards, the Company may be required toaccelerate, increase or cancel all or a portion of the remaining unearned stock-based compensation expense.Future unearned stock-based compensation will increase to the extent the Company grants additionalequity awards, changes incentive awards terms, or assumes unvested equity awards in connection withacquisitions.
Capitalized stock-based compensation cost was not material at June 30, 2021 and 2020.
11. Retirement-Related Benefits:
The Company sponsors defined benefit pension plans and other nonpension postretirement benefitplans primarily consisting of retiree medical benefits. Additionally, certain Company employees participatein multi-employer defined benefit pension plans and post-retirement health plans as well as definedcontribution plans that are sponsored by the Parent, which also includes other participants.
The Company’s defined contribution expense for the three months ended June 30, 2021 and 2020 was$44 million and $49 million, respectively and for the six months ended June 30, 2021 and 2020 was $90 millionand $95 million, respectively.
The following tables provide the components of the cost/(income) of retirement-related benefit plansrecognized in the Combined Income Statement, excluding defined contribution plans.
($ in millions)For the three months ended June 30:
Defined BenefitPension Plans
Nonpension PostretirementBenefit Plans
2021 2020 2021 2020
Service cost* . . . . . . . . . . . . . . . . . . . . . . . . . . . . . . . . . . . . . . . $23 $27 $ 1 $ 1Interest cost** . . . . . . . . . . . . . . . . . . . . . . . . . . . . . . . . . . . . . . 2 2 0 0Expected return on plan assets** . . . . . . . . . . . . . . . . . . . . . . . . . (6) (6) 0 0Amortization of prior service costs/(credits)** . . . . . . . . . . . . . . . . 0 0 — —Recognized actuarial losses** . . . . . . . . . . . . . . . . . . . . . . . . . . . 10 9 0 0Curtailments and settlements** . . . . . . . . . . . . . . . . . . . . . . . . . . — — — —Multi-employer plans/other costs+ . . . . . . . . . . . . . . . . . . . . . . . . 2 3 — —Total net periodic (income)/cost . . . . . . . . . . . . . . . . . . . . . . . . . . $31 $35 $ 1 $ 1
F-68

($ in millions)For the six months ended June 30:
Defined BenefitPension Plans
Nonpension PostretirementBenefit Plans
2021 2020 2021 2020
Service cost* . . . . . . . . . . . . . . . . . . . . . . . . . . . . . . . . . . . . . . . $ 46 $ 53 $ 1 $ 1Interest cost** . . . . . . . . . . . . . . . . . . . . . . . . . . . . . . . . . . . . . . 3 5 1 1Expected return on plan assets** . . . . . . . . . . . . . . . . . . . . . . . . . (11) (12) 0 0Amortization of prior service costs/(credits)** . . . . . . . . . . . . . . . . 0 0 — —Recognized actuarial losses** . . . . . . . . . . . . . . . . . . . . . . . . . . . 21 17 0 0Curtailments and settlements** . . . . . . . . . . . . . . . . . . . . . . . . . . 0 — — —Multi-employer plans/other costs+ . . . . . . . . . . . . . . . . . . . . . . . . 5 6 0 —Total net periodic (income)/cost . . . . . . . . . . . . . . . . . . . . . . . . . . $ 63 $ 69 $ 1 $ 2
* Represents service costs of $3 million and $4 million for the three months ended June 30, 2021 and2020, respectively, attributed to self-sponsored plans as well as $20 million and $24 million, respectively,attributed to allocations of costs for plans sponsored by the Parent. Represents service costs of$6 million and $8 million for the six months ended June 30, 2021 and 2020, respectively, attributed to self-sponsored plans as well as $41 million and $47 million, respectively, attributable to allocations ofcosts for plans sponsored by the Parent.
** These components of net periodic pension cost are included in other (income) and expense in theCombined Income Statement.
+ Represents third party costs.
In 2021, the Company does not expect contributions to its non-U.S. defined benefit and multi-employer plans to be material.
12. Related Party Transactions:
Related Party Revenue and Purchases
Kyndryl provides various services to IBM including those related to hosting data centers and servicingIBM’s information technology infrastructure which are reported as revenue in the Combined IncomeStatement. Revenues for these services were $146 million and $162 million for the three months ended June 30,2021 and 2020, respectively, and $300 million and $323 million for the six months ended June 30, 2021 and2020, respectively. The costs related to these services are reported in cost of services in Kyndryl’s CombinedIncome Statement and were $116 million and $128 million for the three months ended June 30, 2021 and2020, respectively, and $237 million and $255 million for the six months ended June 30, 2021 and 2020,respectively.
IBM historically provided its branded and related hardware, software and services to Kyndryl for use inthe delivery of services arrangements with Kyndryl customers. The cost of the hardware and software wasreflected at a price indicative of what the Company would have incurred had it operated on a stand-alonebasis. These costs and their associated depreciation and amortization were recorded as cost of services inthe Company’s Combined Income Statement in the amounts of $782 million and $763 million, for thethree months ended June 30, 2021 and 2020, respectively, and $1,659 million and $1,564 million, for thesix months ended June 30, 2021 and 2020, respectively. The capital expenditures for purchases of IBMhardware were reflected as payments for property and equipment within the investing section of theCombined Statement of Cash Flows in the amounts of $211 million and $253 million, for the first half of2021 and 2020, respectively.
Allocation of Corporate Expenses
The Combined Income Statement, Combined Statement of Comprehensive Income and CombinedStatement of Cash Flows include an allocation of general corporate expenses from IBM. The financialinformation in these combined financial statements does not necessarily include all of the expenses that would
F-69

have been incurred by Kyndryl had it been a separate, standalone company. It is not practicable to estimateactual costs that would have been incurred had Kyndryl been a standalone company during the periodspresented. The management of Kyndryl considers these allocations to be a reasonable reflection of theutilization of services by, or the benefits provided to the Company. Allocations for management costs andcorporate support services provided to Kyndryl for the three months ended June 30, 2021 and 2020 totaled$331 million and $286 million, respectively, and $668 million and $631 million for the six months endedJune 30, 2021 and 2020, respectively. These amounts include costs for corporate functions including, butnot limited to, senior management, legal, human resources, finance and accounting, treasury, IT and othershared services. All such amounts have been deemed to have been incurred and settled by Kyndryl in theperiod in which the costs were recorded and are included in the Net Parent investment. These costs wereallocated based on direct usage as applicable, with the remainder allocated on a pro-rata basis of gross profit,headcount, asset ownership or other measures determined to be reasonable.
For the Three Months Ended June 30, For the Six Months Ended June 30,($ in millions) 2021 2020 2021 2020
Selling, general and administrative . . . . . . . $313 $271 $630 $594Research, development and engineering . . . 0 1 0 3Other (income) and expense . . . . . . . . . . . 2 (2) 9 3Interest expense . . . . . . . . . . . . . . . . . . . . 15 16 29 31Total expense and other (income) . . . . . . . . $331 $286 $668 $631
Cash Management and Financing
The Company participates in IBM’s centralized cash management and financing programs.Disbursements are made through centralized accounts payable systems, which are operated by IBM. Cashreceipts are transferred to centralized accounts, which are also maintained by IBM. As cash is received anddisbursed by IBM, it is accounted for by Kyndryl through Net Parent investment. Short and long-term debt isfinanced by IBM, and financing decisions for wholly and majority owned subsidiaries are determined byIBM. See note 1, “Basis of Presentation,” to the Company’s audited financial statements for additionalinformation. Kyndryl’s cash that was not included in the centralized cash management and financing programsis classified as Cash and cash equivalents on the Combined Balance Sheet.
Net Parent Investment
Related party transactions between Kyndryl and IBM have been included within Net Parent investmentin the Combined Balance Sheet in the historical periods presented as these related party transactions werenot settled in cash. Net Parent investment in the Combined Balance Sheet and Combined Statement ofChanges in Equity represents IBM’s historical investment in Kyndryl, the net effect of transactions with, andallocations from IBM, and Kyndryl’s accumulated earnings. Net transfers from IBM are included withinNet Parent investment. The components of Net transfers from IBM and the reconciliation to thecorresponding amount presented on the Combined Statement of Cash Flows were as follows:
For the Six Months Ended June 30,($ in millions) 2021 2020
Cash pooling and general financing activities/other . . . . . . . . . . . . . . . . . . $(1,695) $(1,863)Allocation of IBM’s corporate expenses/other . . . . . . . . . . . . . . . . . . . . . . 862 810Related party sales and purchases . . . . . . . . . . . . . . . . . . . . . . . . . . . . . . 1,514 1,467Related party intangible assets fee . . . . . . . . . . . . . . . . . . . . . . . . . . . . . . 40 39Income taxes . . . . . . . . . . . . . . . . . . . . . . . . . . . . . . . . . . . . . . . . . . . . . 179 188Total Net transfers from Parent per Combined Statement of Equity . . . . . . . $ 900 $ 641Income taxes . . . . . . . . . . . . . . . . . . . . . . . . . . . . . . . . . . . . . . . . . . . . . (179) (188)Allocation of IBM’s stock based compensation . . . . . . . . . . . . . . . . . . . . . (33) (28)Other . . . . . . . . . . . . . . . . . . . . . . . . . . . . . . . . . . . . . . . . . . . . . . . . . . 15 (65)Total Net transfers from Parent per Combined Statement of Cash Flows . . . $ 702 $ 360
F-70

Assignment of Receivables
A portion of Kyndryl’s receivables with extended payment terms have historically been assigned toIBM’s Global Financing business. These receivables were not recognized on the Company’s CombinedBalance Sheet. The gross amounts of Kyndryl receivables assigned to IBM Global Financing were $602 millionand $787 million for the second quarter of 2021 and 2020, respectively, and $1,300 million and $1,551 millionfor the first six months of 2021 and 2020, respectively. The fees and the net gains and losses associatedwith the assignment of receivables were not material for any of the periods presented.
Upon completion of the spin off, there is no guarantee that the Company will be able to enter into asimilar financing arrangement with a third-party, with similar volumes to the amounts historically financedby IBM. This may result in an increase in accounts receivable balances from those amounts historicallypresented within the Combined Balance Sheets.
Acquired Intangible Assets
Within the historical periods presented, the Company has been charged a fee for the use of certainacquired intangible assets by IBM for acquisitions which were not specific to Kyndryl. The amountsreflected within cost of services on the Combined Income Statement for these fees were $8 million for thesecond quarter of both 2021 and 2020, and $16 million and $15 million, for the first six months of 2021 and2020, respectively. The amounts for these fees reflected within SG&A expense within the CombinedIncome Statement were $12 million for the second quarter of both 2021 and 2020, and $25 million and$24 million, for the first half of 2021 and 2020, respectively.
13. Subsequent Events:
On October 7, 2021, the Company priced $2.4 billion in aggregate principal amount of senior unsecuredfixed-rate notes with maturities ranging from five to twenty years and coupons ranging from 2.1 to 4.1percent. The closing of the offering of notes is expected to occur on October 15, 2021, subject to customaryclosing conditions. The notes are subject to customary affirmative covenants, negative covenants andevents of default for financings of this type and are redeemable at our option in a customary manner.
The combined financial statements of Kyndryl are derived from the Consolidated Financial Statementsof IBM, which issued its financial statements for the second quarter 2021 on July 27, 2021. Accordingly, theCompany has evaluated transactions or other events for consideration as recognized subsequent events inthe interim financial statements through July 27, 2021. Additionally, Kyndryl has evaluated transactions andother events that occurred through August 31, 2021, the date these combined financial statements wereissued and further, through October 12, 2021, for purposes of disclosure of unrecognized subsequent events.
F-71

SCHEDULE II
KYNDRYLVALUATION AND QUALIFYING ACCOUNTS AND RESERVES
For the Years Ended December 31:(Dollars in Millions)
Description
Balance atBeginningof Period
Additions /(Releases) Write-offs Other*
Balance atEnd
of Period
Allowance For Credit Losses:2020 . . . . . . . . . . . . . . . . . . . . . . . . . . . . . . . . . $ 82 $ 25 $ (7) $(9) $ 91
2019 . . . . . . . . . . . . . . . . . . . . . . . . . . . . . . . . . $111 $ 51 $ (78) $(3) $ 82
2018 . . . . . . . . . . . . . . . . . . . . . . . . . . . . . . . . . $104 $ 16 $ (2) $(6) $111
Revenue Based Provisions:2020 . . . . . . . . . . . . . . . . . . . . . . . . . . . . . . . . . $110 $167 $(141) $ 3 $140
2019 . . . . . . . . . . . . . . . . . . . . . . . . . . . . . . . . . $113 $103 $(108) $ 2 $110
2018 . . . . . . . . . . . . . . . . . . . . . . . . . . . . . . . . . $ 93 $219 $(198) $(1) $113
* Primarily represents translation adjustments and reclassifications.
Additions/(Releases) to the Allowance For Credit Losses represent changes in estimates of unrecoverableamounts in receivables and are recorded to expense accounts. Amounts are written-off when they are deemedunrecoverable by the Company. Additions/(Releases) to Revenue Based Provisions represent changes inestimated reductions to revenue, primarily as a result of revenue-related programs, including customerrebates. Write-offs for Revenue Based Provisions represent reductions in the provision due to amountsremitted to customers. Other primarily comprises currency translation adjustments. See note E, “Taxes,” tothe combined financial statements for further details about the Company’s income tax valuation allowances.
S-1