numerical simulation of reactive processes in an experiment with partially saturated bentonite
TRANSCRIPT
Seediscussions,stats,andauthorprofilesforthispublicationat:https://www.researchgate.net/publication/7394317
Numericalsimulationofreactiveprocessesinanexperimentwithpartiallysaturatedbentonite.JContamHydrol83(1-2):122-147
ARTICLEinJOURNALOFCONTAMINANTHYDROLOGY·MARCH2006
ImpactFactor:2.2·DOI:10.1016/j.jconhyd.2005.11.003·Source:PubMed
CITATIONS
32
READS
67
5AUTHORS,INCLUDING:
MingliangXie
UniversityofBritishColumbia-…
22PUBLICATIONS208CITATIONS
SEEPROFILE
SebastianBauer
Christian-Albrechts-Universität…
78PUBLICATIONS941CITATIONS
SEEPROFILE
Availablefrom:MingliangXie
Retrievedon:04February2016
Journal of Contaminant Hydrology 83 (2006) 122–147
www.elsevier.com/locate/jconhyd
Numerical simulation of reactive processes in an
experiment with partially saturated bentonite
Mingliang Xie a,*, Sebastian Bauer a, Olaf Kolditz a,
Thomas Nowak b, Hua Shao b
a Center for Applied Geoscience, Chair of GeoSystemsResearch, University of Tubingen,
Sigwartstr. 10. D-72076 Tubingen, Germanyb Federal Institute for Geosciences and Natural Resources, Stilleweg 2, D-30655, Hannover, Germany
Received 30 August 2004; received in revised form 4 November 2005; accepted 7 November 2005
Abstract
Bentonites are preferred materials for use as engineered barriers for high-level nuclear waste
repositories. Simulation of geochemical processes in bentonite is therefore important for long-term safety
assessment of those repositories. In this work, the porewater chemistry of a bentonite sample subject to
simultaneous heating and hydration, as studied by Cuevas et al. [Cuevas, J., Villar, M., Fernandez, A.,
Gomez, P., Martın, P., 1997. Porewaters extracted from compacted bentonite subjected to simultaneous
heating and hydration. Applied Geochemistry 12, 473–481.], was assessed with a non-isothermal reactive
transport model by coupling the geochemical software PHREEQC2 with the object-oriented FEM
simulator GeoSys/RockFlow. Reactive transport modelling includes heat transport, two-phase flow,
multicomponent transport and geochemical reactions in the liquid phase, i.e. ion exchange, mineral
dissolution/precipitation and equilibrium reactions. Simulations show that the easily soluble minerals in
bentonite determine the porewater chemistry. Temperature affects both two-phase flow and geochemical
reactions. Porosity change due to dissolution/precipitation is low during the experiment. However,
changes of the effective porosity caused by bentonite swelling can be very large. The simulated results
agree well with the experimental data.
D 2005 Elsevier B.V. All rights reserved.
Keywords: Non-isothermal reactive transport; Two-phase flow; Numerical modelling; Geochemical reaction; Bentonite
0169-7722/$ -
doi:10.1016/j.
* Correspon
E-mail add
see front matter D 2005 Elsevier B.V. All rights reserved.
jconhyd.2005.11.003
ding author. Tel.: +49 7071 29 73173.
ress: [email protected] (M. Xie).
M. Xie et al. / Journal of Contaminant Hydrology 83 (2006) 122–147 123
1. Introduction
Compacted bentonite is selected as buffer material for high-level radioactive waste (HLW)
repositories in many disposal concepts. In this situation, the bentonite is subjected to
simultaneous heating by the nuclear waste canister and hydration from the rock. The processes
within bentonite will be very complex—highly coupled thermal (T), hydraulic (H), mechanical
(M) and chemical (C) processes. Numerical simulation is a powerful tool for understanding and
predicting such complex processes (Gens et al., 1998; Tsang et al., 2003; Xie et al., submitted for
publication).
Simulation of porewater chemistry that may come in contact with the canister and later the
waste matrix is of special importance for the long term safety assessment of a repository. The
chemical composition of porewater and its oxidation potential govern the solubility of
radionuclides and influence the corrosion rate of the canister and waste matrix (Curti, 1993;
Bath, 1993). Furthermore, the material properties of bentonite can be changed or influenced by
heat and porewater chemical composition. Therefore, it is important to specify the chemistry in
the near field (Couture, 1985; Studds et al., 1998; Tessier et al., 1998; Wiebe et al., 1998; Tuller
and Or, 2003; Xie et al., 2004).
Various experimental studies on the chemistry of bentonite porewater have shown that the
composition of these waters is largely controlled by the dissolution or precipitation of reactive trace
solids, which are normally found in minor amounts in bentonite (Grambow et al., 1985; Snellman
and Rantanen, 1985; Wieland et al., 1994; Cuevas et al., 1997). However, such experiments
encompass only bshortQ periods in comparison with the long-term safety requirements of
repositories (over 10 k years) (Chapman and McKinley, 1987). Therefore, numerical modelling
approaches for mass transport and chemical reactions in subsurface systems have been presented
by a number of investigators (Ortoleva et al., 1987; Lichtner, 1985, 1988; Liu and Narasimhan,
1989; Nienhuis et al., 1991; Yeh and Tripathi, 1991; Simunek and Suares, 1994; Steefel and
Lasaga, 1994; Steefel and MacQuarrie, 1996; Parkhurst and Appelo, 1999; Xu and Pruess, 2001).
Three major approaches have been used to couple multi-species transport and geochemical
reactions: 1) The one-step or global implicit approach, which solves the governing equations,
including both reaction and transport terms, simultaneously; 2) The sequential non-iterative
approach (SNIA), which consists of solving the governing equations within a single timestep in
sequence without iteration between them; 3) The sequential iterative approach (SIA), which solves
the transport and the reaction equations separately in a sequential manner with an iterative
procedure. Details of the numerical approaches for modelling reactive transport can be found in
Steefel and MacQuarrie (1996).
The most difficult aspects of non-isothermal reactive transport in highly compacted bentonite
include: 1) treatment of the multiphase multicomponent flow system with extremely high
capillary pressure; 2) involvement of gas as well as liquid phase in the fluid flow, chemical
species transport, and reactions; 3) taking into account the swelling effect of bentonite; 4) the
kinetics of fluid–solid interactions. The model presented by Lasaga (1984) couples water flow,
solute and heat transport, and chemical reactions, and includes also kinetic mineral dissolution
and precipitation processes. The code UNSATCHEM-2D has been developed by Simunek and
Suares (1994). It is a two-dimensional finite element model for simulating the ion equilibrium
and kinetic non-equilibrium geochemistry in unsaturated soils. A multiphase non-isothermal
reactive transport model developed by White (1995) employs a one-step approach that solves all
flow, transport and reaction equations simultaneously. Another multiphase non-isothermal
reactive transport computer code MULTIFLO is presented by Lichtner (1996), and has been
M. Xie et al. / Journal of Contaminant Hydrology 83 (2006) 122–147124
applied for various problems such as pyrite oxidation and hydrothermal systems. The numerical
simulator TOUGHREACT developed by Xu and Pruess (2001) is a multiphase non-isothermal
reactive transport model in unsaturated fractured rocks. Other models can be found in the review
paper by van der Lee and De Windt (2001).
Modelling studies on reactive transport processes in clay and especially in highly compacted
bentonite have been undertaken by many investigators (e.g. Wanner, 1986; Curti, 1993; Wieland
et al., 1994; Snellman, 1994; Ohe and Tsukomoto, 1997; Pusch et al., 1999; Pusch, 2000;
Savage et al., 2002; Bradbury and Baeyens, 2003; De Windt et al., 2004). Bradbury and Baeyens
(2003) calculated porewater compositions in compacted re-saturated bentonite, taking into
consideration factors such as montmorillonite swelling, semi-permeable membrane effects, very
low bfree waterQ volume, and highly effective buffering characteristics. The simulation of the
interaction of bentonite with cement water was presented by Savage et al. (2002), in which the
porosity changes by kinetically controlled dissolution and precipitation of minerals have been
taken into account. Wersin (2003) presented a thermodynamic simulation with two distinct
surface complexation models to identify the geochemical reactions in bentonite at highly varying
solid / liquid ratios. More recently, De Windt et al. (2004) presented a coupled model of cement/
claystone interactions. However, the simulations mentioned above describe the saturated state
without taking the effect of swelling on hydration processes into consideration.
This paper presents the application of the newly developed object-oriented and process-
oriented simulator GeoSys/RockFlow, which couples unsaturated two-phase flow, heat transport
and multi-species reactive transport. The model is thus suited to simulate chemical processes
occurring in compacted bentonite under unsaturated and non-isothermal conditions. The model
is applied to simulate an experiment performed by Cuevas et al. (1997), who studied the
geochemistry in a compacted bentonite sample subject to simultaneous heating and hydration. In
Section 2, specific processes occurring in bentonite are introduced, while Section 3 presents the
governing equations of the numerical simulator. Section 4 presents the experimental design and
the simulation results.
2. Theoretical background
2.1. Swelling
2.1.1. Porosity
With the increase of water content and/or decrease of porewater chemical concentrations,
bentonite swells because of the interlayer porosity change, which can be described by the
chemical swelling model presented by Xie et al. (2004) as summarized in Eqs. (1) and (2):
nIL ¼ Sl� �g
dbdnILmax ð1Þ
nILmax ¼ mS0qd
�ee0RT
2F2I � 103
�12
ð2Þ
in which nIL is the interlayer porosity that represents the space occupied by diffuse double layers
(DDLs), nIL max means the maximum interlayer porosity that represents the swelling potential of
bentonite, Sl is degree of liquid saturation, b represents volume fraction of the expansive
minerals, g is a dimensionless coefficient, R is the universal gas constant [=8.3145(J mol�1
K�1)], T is the absolute temperature [K], F is the Faraday constant [=96485.309(Cdmol�1)],
M. Xie et al. / Journal of Contaminant Hydrology 83 (2006) 122–147 125
e is dielectric constant and e0 the permittivity of free space [=8.854�10�12 (C V�1 m�1)].
The ionic strength I is defined (see e.g. References Stumm and Morgan (1996), Dzombak
and Morel (1990)):
I ¼ 1
2
Xi
ciz2i ð3Þ
where ci is the ith ion concentration of porewater [mol l�1], zi represents the ion valence of
the ith ion.
The number of effective layers m in one particle of an expansive mineral (i.g.
montmorillonite) is a mineral structural parameter, that is defined as the number of layers
contributing to the swelling effect. As the montmorillonite particles are very fine in size, the
average m value is used and calculated by the ratio of total specific surface area Stotal in m2 g� 1
(including the surface between layers, which can separate by swelling) to external specific
surface area S0 in m2 g� 1 (only the surface of particles).
m ¼ Stotal
S0: ð4Þ
The value Stotal is normally determined by the methylene blue and the Keeling hygroscopy
methods. The value S0 is normally measured by BET (Brunauer, Emmet and Teller N2
Adsorption) method (ASTM International, 2001a,b; FEBEX Working groups, 2000).
The nILmax represents the swelling potential of the montmorillonite minerals contained in a
compacted bentonite, it depends on the soil properties of the sample, the mineral properties of
the montmorillonite, and the chemical properties of the porewater. The amount of swelling
depends on the initial water saturation and its variation, the swelling conditions (confined or
unconfined), and the porewater chemistry variation.
According to this model, porosity in bentonite can be distinguished by inter-layer (nIL) and
interparticle porosity (nIP). The latter is of special importance for water flow, and is often called
the effective porosity. During the swelling process, the effective porosity and consequently the
effective permeability of bentonite increase in the case of free swelling and decrease in
confined conditions; this subsequently influences the chemical transport process.
2.1.2. Effective porosity
Effective porosity is the amount of interconnected pore space in a soil or rock through
which fluids can pass, expressed as a percent of bulk volume (US Bureau of Mines, 1997).
Owing to electrostatic attraction, interlayer-water in compacted bentonite is practically
immobile. Therefore, the effective porosity neff of compacted bentonite varies with the
saturation and swelling processes. In the case of confined swelling, the effective porosity
decreases with the saturation process. Theoretically, it can be reduced to zero, which means
the permeability reaches zero. However, this is not the case in practice. A fraction of the
porosity remains, which is defined here as the minimal porosity. It depends on the swelling
pressure and the compressibility of the sample. Therefore, the effective porosity of bentonite in
the case of confined swelling can be derived from the initial porosity n0, interlayer porosity
nIL and minimal porosity nmin:
neff ¼�n0 � nIL ; n0 � nILNnmin
nmin ; elseð5Þ
M. Xie et al. / Journal of Contaminant Hydrology 83 (2006) 122–147126
In the case of free swelling, the volume change should be taken into consideration by
measuring how the total porosity ntot changes with swelling/shrinking. The effective porosity
is:
neff ¼ ntot � nIL ð6Þ
However, if the water content is below the shrinkage limit, free swelling/shrinking is
limited. Macroscopically, volume change nearly vanishes. Microscopically, interlayer porosity
variation changes the interparticle porosity. In this case, Eq. (5) can be used for calculating neff.
2.2. Water in compacted bentonite
Bentonites contain a large quantity of montmorillonite (65–90 wt.%), which determines the
properties of bentonites (Bradbury and Baeyens, 2003). Owing to the special mineral structure,
the relatively high net negative charge on the mineral surface, and the extremely high value in
specific surface, water flows through large pores as well as enters into the interlayer spaces.
Diffuse double layers (DDLs) tend to build up. Bradbury and Baeyens (2003) divided the
water in bentonite into three types—interlayer water, double layer water and free water.
Interlayer water is only one to four monolayers of water molecules thick (b1 nm), and differs
apparently from bfree water Q with respect to the fluid properties (Newman, 1987; Schoen et
al., 1989). Free water exists only in large pores. The rest is the double layer water in the
electric diffuse double layers. DDLs in highly compacted bentonite can overlap. As diffusion
and chemical reactions can also occur in the DDLs, the term bentonite porewater is defined
herein as the double layer water plus free water.
2.3. Two-phase flow
2.3.1. Capillary pressure
The parameters pc(S) (capillary pressure) and krel(S) (relative permeability) are key factors
affecting multiphase flow. In a two phase system with a gas and a liquid phase, capillary
pressure is defined as difference in pressure between the gas and the liquid in capillary spaces.
It is thus a function of the degree of saturation (Helmig, 1997). The pc(S) value can be
measured for a given soil with respect to various fluids.
2.3.2. Relative permeability–saturation
For porous media containing more than one fluid, relative permeability is a key parameter.
It is used to calculate the effective permeability, which is equal to intrinsic permeability
multiplied by relative permeability. Different relationships between relative permeability and
saturation can be found in the literature. These relationships include constant value, linear
function and potential function. The van Genuchten model in conjunction with the approach
of Mualem is adopted in this study (van Genuchten, 1980; Helmig, 1997; Lenhard and
Parker, 1987):
klrel ¼ Sl12
eff 1� 1� Sl1=aeff
� �ah i2ð7Þ
Sleff ¼h � hrhs � hr
ð8Þ
M. Xie et al. / Journal of Contaminant Hydrology 83 (2006) 122–147 127
where a is the van Genuchten parameter, s and r indicate saturated and residual values of the
water content (h), respectively.
kgrel ¼ 1� Sleff
� �12 1� S
l1=aeff
� �h i2að9Þ
2.3.3. Intrinsic permeability for swelling porous media
Intrinsic permeability kintr [m2] is a property of porous material and describes the ease with
which gases or liquids can flow through the medium (Mitchell, 1993). It depends on the pore
structure of the porous media and remains constant if the soil skeleton remains unchanged. As
bentonite swells or shrinks, however, the pore structure varies and kintr varies accordingly.
A large number of studies were aimed at generating methods to independently predict
permeability in sedimentary rocks by bulk porosity (Carman, 1937; Berg, 1970; Bloch, 1991;
Neuzil, 1994). It was found that measured permeabilities of clays and shales vary over the range
of 10�22 to 10�14 m2. Oelkers (1996) suggested a correlation of intrinsic permeability with
effective porosity, which is adopted here for highly compacted bentonite. Based on this, the
intrinsic permeability kintr for highly compacted bentonite is defined as:
kintr ¼ 9:87� 10�12e�10þ8neff ð10Þ
in which neff is the effective porosity as in Eq. (5).
2.4. Geochemical reactions
2.4.1. Ion exchange
Owing to the high permanent negative charge on the surface of montmorillonite, which is
compensated by the preferential sorption of exchangeable cations on the surface layers, the
exchange capacity of montmorillonites are very high. Ion exchange is an important interaction
mechanism between ions in porewater and solid minerals, especially in highly compacted
bentonite where the volume of porewater is small and the fraction of montmorillonite is large
(Bradbury and Baeyens, 2003). Consequently, porewater chemistry can be strongly influenced
by ion exchange.
Ion exchange in soil is normally described using competitive exchange models (Stumm and
Morgan, 1996). Commonly used models are presented by Gaines and Thomas (1953), Gapon
(1933), Vanselow (1932), and Rothmund–Kornfeld (Bond and Phillips, 1990). The Gaines–
Thomas convention is the standard method of PHREEQC, which assumes that the thermody-
namic activity of an exchange species is equal to its equivalent fraction. Optionally, in PHREEQC
the equivalent fraction can be multiplied by a Debye–Huckel activity coefficient (ci) to define theactivity of an exchange species. Both Gaines–Thomas convention and the second option are
adopted for the simulations here. The coefficient (ci) is given by Appelo (1994) as:
logci ¼� Az2e
ffiffiffil
p
1þ Ba0ffiffiffil
p þ bl: ð11Þ
In this equation, ci is the activity coefficient, A and B are constants at a given temperature, lis the ionic strength, ze is the number of equivalents of exchanger in the exchange species, and a0
and b are the Debye–Huckel parameters (Parkhurst and Appelo, 1999). In the simulation, four
ions are taken into consideration for ion exchange, e.g. Na+, K+, Ca2+ and Mg2+. Na+ is taken as

M. Xie et al. / Journal of Contaminant Hydrology 83 (2006) 122–147128
the reference ion, the logK is thus set to 0. Their half reaction equations are listed in Table A.1 in
Appendix. All of the related parameters are given in the PHREEQC database and most of them
are listed in the Appendix in Table A.1.
2.4.2. Dissolution/precipitation
With dissolution and precipitation processes, the porosity n may change. This can be
expressed using:
n ¼ n0 �Xnmj¼1
VjdDMj ð12Þ
where n0 is the original porosity, DMj is change of mass concentration of mineral j, in moles per
unit volume of porous medium, Vj is the molar volume of mineral j, nm is the number of minerals.
2.4.3. Temperature dependence
Owing to nuclei decay in the canister, heat is generated and thus temperature in the buffer
material changes with the time. Therefore, it is important to investigate the temperature
influence on the geochemical reactions. Temperature dependence of reactions is taken into
account in PHREEQC2 in the following two ways, both of which modify the equilibrium
constant K as a function of temperature:
1. the van’t Hoff equation:
lnK2
K1
� �¼ DH0
R
1
T1� 1
T2
� �ð13Þ
in which, K1, K2 are reaction coefficients at temperature T1, T2 in Kelvin, respectively. In
the PHREEQC2 database, reference logK values are given at 25 8C. For example, the logK
values of the chemical reaction of Albite NaAlSi3O8+8H2O=Na++Al(OH)4�+3H4SiO4 at
different temperatures are calculated using Eq. (13) with logK at 25 8C equal to �18.002,
and DH0 equal to 25.896 kcal.
2. an analytical expression for the temperature dependence of logK:
log10K ¼ A1 þ A2T þ A3
Tþ A4log10T þ A5
T2ð14Þ
Up to five coefficients Ai (i =1,2, . . ., 5) for the equation may be specified to calculate the
logK value at a given temperature. In PHREEQC2, the second method is given priority if
parameters for both methods are provided. The logK values of the chemical reaction of
Gypsum CaSO4 :2H2O=Ca2++SO42�+2H2O at different temperatures are calculated using
Eq. (14). logK at 25 8C is �18.002, the coefficients A1, A2, A3, A4 and A5 are 68.2401,
0.0, �3221.51, �25.0627 and 0.0.
3. Governing equations
3.1. Two-phase flow
In the macroscopic model, non-isothermal two-phase flow is considered. In general, there are
two concepts to formulate the balance equations: phase-related and compositional. The
compositional approach is advantageous for multiphase-multicomponental processes with phase

M. Xie et al. / Journal of Contaminant Hydrology 83 (2006) 122–147 129
changes (Gawin et al., 1995; Gens et al., 1998), and is adopted for this study. The porous
medium is conceptualized as a three component system, with the components air, water, and soil.
Each of these components can be present in three phases (gas, liquid and solid phase). In this
study, air and solid are treated as single pseudo components with averaged properties, even if
they consist of several components. In the following equations, the subscript k denotes
component (a—air or w—water), the superscript c denotes the phase (l—liquid, g—gas,
s—solid).
Hydraulic processes resulting from pressure, friction, and gravitation are described by the
extension of Darcy’s law for multiphase flow. The mobility of the fluid phases is
characterized by their relative permeability and capillary pressure via saturation. The mass
balance equation is:
B
BtnSgqg
k þ nSlqlk
� �þjd J
gk þ Jlk
� �¼ Qk ð15Þ
where n is porosity, Sc is phase saturation, qkc is component mass per unit volume of the
fluid phase c. The total flux of component k in phase c consists of advective JAkc
and
diffusive part JDkc.
Jck ¼ J
cAk þ J
cDk ð16Þ
The heat balance equation for porous medium consisting of three phases (solid, gas, liquid) is
described by
B
Bt1� nð Þqsus þ nSgqgug þ nSlqlul
� þjd Jsh þ J
gh þ Jlh
� �¼ Qh ð17Þ
where uc is phase internal energy, qc is phase density, Jhc is the total heat flux in phase c, Qh is
the heat source term, i.e. heat generation rate per unit volume.
Details can be found in Gawin et al. (1995), Helmig (1997) and Kolditz (2002).
3.2. Multicomponent transport
The balance equation for multicomponent mass transport in porous media is given by e.g.
Kolditz (2002):
nSc BCci
Bt¼ � vcjC
ci þj nScD
cijC
cið Þ þ nScQ
ci þ nScCc
i Cc1 . . .C
cm
� �ð18Þ
where Cic is the concentration of the i-th species of an m multi-species system in phase c, vc is
the Darcy velocity of phase c, Dic is the diffusion–dispersion coefficient of component i in
phase c, Qic is the source/sink term and Ci
c(C1c. . .Cm
c) is the source/sink term of species i in
phase c due to temperature dependent equilibrium chemical reactions with all other species
in the same phase.
3.3. Coupling scheme and numerical implementation
The object-oriented program GeoSys/RockFlow was adopted to solve the system of
coupled processes. The coupling processes are schematically described in Fig. 1. Time is
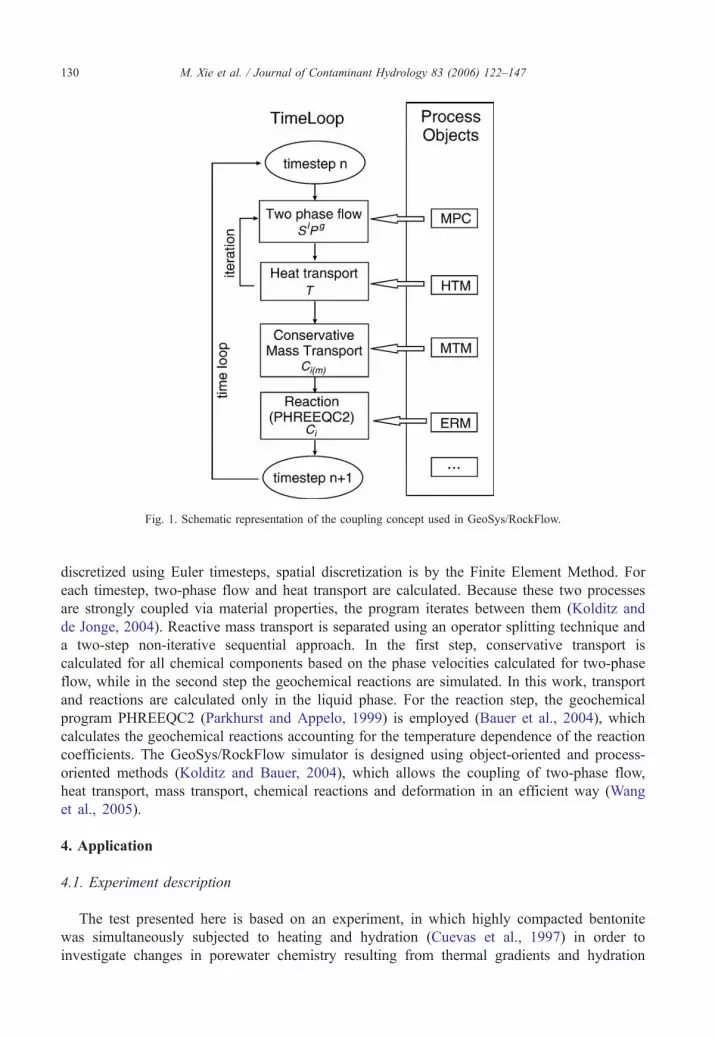
Fig. 1. Schematic representation of the coupling concept used in GeoSys/RockFlow.
M. Xie et al. / Journal of Contaminant Hydrology 83 (2006) 122–147130
discretized using Euler timesteps, spatial discretization is by the Finite Element Method. For
each timestep, two-phase flow and heat transport are calculated. Because these two processes
are strongly coupled via material properties, the program iterates between them (Kolditz and
de Jonge, 2004). Reactive mass transport is separated using an operator splitting technique and
a two-step non-iterative sequential approach. In the first step, conservative transport is
calculated for all chemical components based on the phase velocities calculated for two-phase
flow, while in the second step the geochemical reactions are simulated. In this work, transport
and reactions are calculated only in the liquid phase. For the reaction step, the geochemical
program PHREEQC2 (Parkhurst and Appelo, 1999) is employed (Bauer et al., 2004), which
calculates the geochemical reactions accounting for the temperature dependence of the reaction
coefficients. The GeoSys/RockFlow simulator is designed using object-oriented and process-
oriented methods (Kolditz and Bauer, 2004), which allows the coupling of two-phase flow,
heat transport, mass transport, chemical reactions and deformation in an efficient way (Wang
et al., 2005).
4. Application
4.1. Experiment description
The test presented here is based on an experiment, in which highly compacted bentonite
was simultaneously subjected to heating and hydration (Cuevas et al., 1997) in order to
investigate changes in porewater chemistry resulting from thermal gradients and hydration
M. Xie et al. / Journal of Contaminant Hydrology 83 (2006) 122–147 131
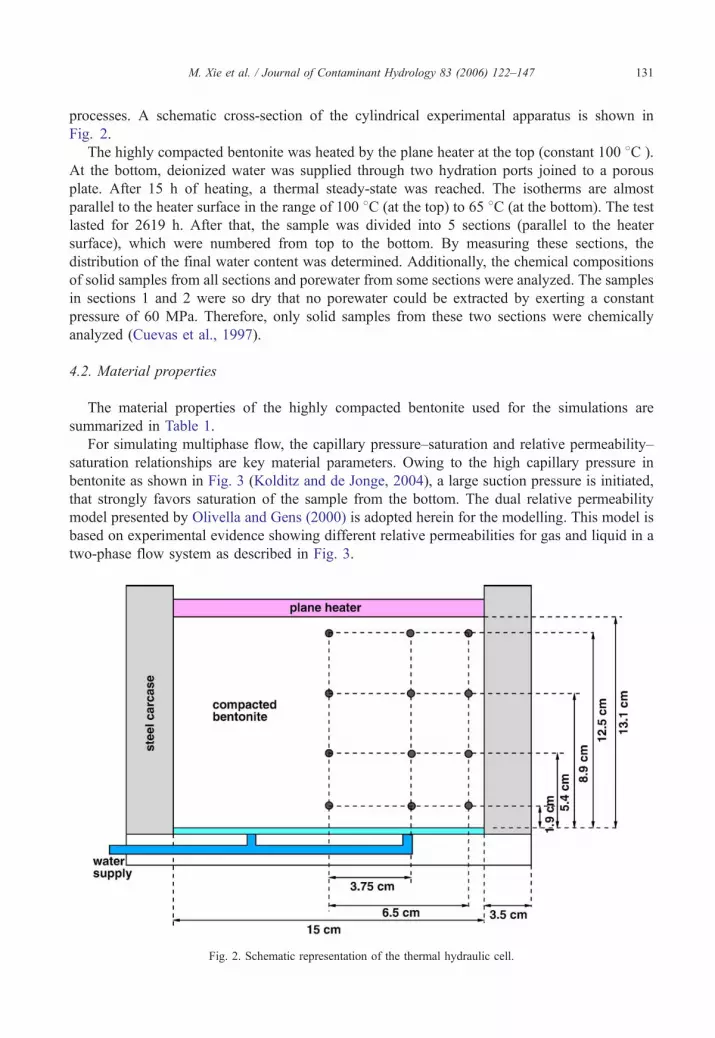
processes. A schematic cross-section of the cylindrical experimental apparatus is shown in
Fig. 2.
The highly compacted bentonite was heated by the plane heater at the top (constant 100 8C ).
At the bottom, deionized water was supplied through two hydration ports joined to a porous
plate. After 15 h of heating, a thermal steady-state was reached. The isotherms are almost
parallel to the heater surface in the range of 100 8C (at the top) to 65 8C (at the bottom). The test
lasted for 2619 h. After that, the sample was divided into 5 sections (parallel to the heater
surface), which were numbered from top to the bottom. By measuring these sections, the
distribution of the final water content was determined. Additionally, the chemical compositions
of solid samples from all sections and porewater from some sections were analyzed. The samples
in sections 1 and 2 were so dry that no porewater could be extracted by exerting a constant
pressure of 60 MPa. Therefore, only solid samples from these two sections were chemically
analyzed (Cuevas et al., 1997).
4.2. Material properties
The material properties of the highly compacted bentonite used for the simulations are
summarized in Table 1.
For simulating multiphase flow, the capillary pressure–saturation and relative permeability–
saturation relationships are key material parameters. Owing to the high capillary pressure in
bentonite as shown in Fig. 3 (Kolditz and de Jonge, 2004), a large suction pressure is initiated,
that strongly favors saturation of the sample from the bottom. The dual relative permeability
model presented by Olivella and Gens (2000) is adopted herein for the modelling. This model is
based on experimental evidence showing different relative permeabilities for gas and liquid in a
two-phase flow system as described in Fig. 3.
Fig. 2. Schematic representation of the thermal hydraulic cell.

Table 1
Material properties of bentonite
Symbol Value Unit
Initial dry density qd 1620* kg/m3
Initial porosity n0 39.6* %
Initial water content w 11.2* %
Intrinsic permeability k intr 5�10�19 m2
Total specific surface S0 37* m2/g
External specific surface S total 516F37z m2/g
Specific heat capacity c 1605.06 J/kg/K
Thermal conductivity k 0.78** W/m/K
*From Cuevas et al. (1997).
**From Olivella and Gens (2000).
zFrom FEBEX Working groups (2000).
M. Xie et al. / Journal of Contaminant Hydrology 83 (2006) 122–147132
4.3. Geochemical properties
The geochemical properties of the bentonite according to the experimental results by Cuevas
et al. (1997) and Villar et al. (1995) are summarized in Table 2. Plagioclase is the group name for
triclinic feldspars of the general formula:
Ca1�xNaxAl2þxO8 ð19Þ
in which x is between 0 and 1. When x =0, the mineral is pure anorthite. When x =1, the mineral
is pure albite. In the simulation, albite is used to represent plagioclase. Minerals comprising less
than 1% by weight are not listed. However, experimental (Muurinen and Lehikoinen, 1999) and
theoretical (Wersin, 2003) results showed that porewater chemistry can be significantly
influenced by the dissolution of gypsum, halite and calcite, which are normally of minor quantity
in bentonite. This is because of their relatively large dissolution rates compared to other minerals
like montmorillonite, quartz, etc. Therefore, a gypsum content of 0.14% is used for the
Fig. 3. Capillary pressure–saturation relationship (left), and dual relative permeability–saturation relationships (right) for
the compacted bentonite (Kolditz and de Jonge, 2004).
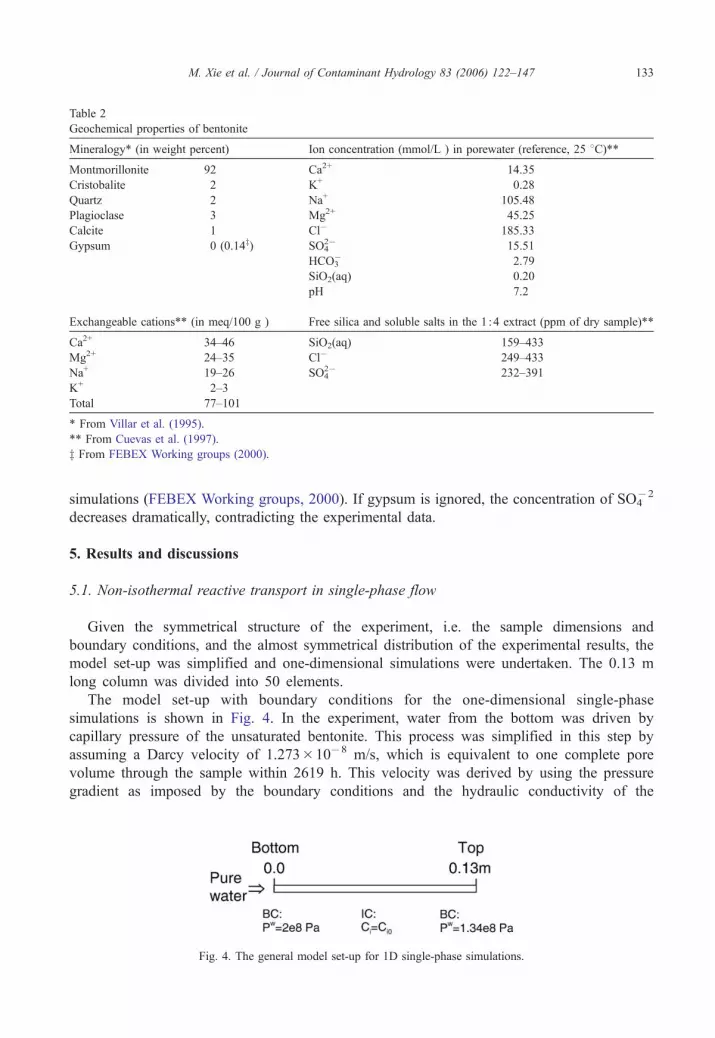
Fig. 4. The general model set-up for 1D single-phase simulations.
Table 2
Geochemical properties of bentonite
Mineralogy* (in weight percent) Ion concentration (mmol/L ) in porewater (reference, 25 8C)**
Montmorillonite 92 Ca2+ 14.35
Cristobalite 2 K+ 0.28
Quartz 2 Na+ 105.48
Plagioclase 3 Mg2+ 45.25
Calcite 1 Cl� 185.33
Gypsum 0 (0.14z) SO42� 15.51
HCO3� 2.79
SiO2(aq) 0.20
pH 7.2
Exchangeable cations** (in meq/100 g ) Free silica and soluble salts in the 1 :4 extract (ppm of dry sample)**
Ca2+ 34–46 SiO2(aq) 159–433
Mg2+ 24–35 Cl� 249–433
Na+ 19–26 SO42� 232–391
K+ 2–3
Total 77–101
* From Villar et al. (1995).
** From Cuevas et al. (1997).
z From FEBEX Working groups (2000).
M. Xie et al. / Journal of Contaminant Hydrology 83 (2006) 122–147 133
simulations (FEBEX Working groups, 2000). If gypsum is ignored, the concentration of SO4�2
decreases dramatically, contradicting the experimental data.
5. Results and discussions
5.1. Non-isothermal reactive transport in single-phase flow
Given the symmetrical structure of the experiment, i.e. the sample dimensions and
boundary conditions, and the almost symmetrical distribution of the experimental results, the
model set-up was simplified and one-dimensional simulations were undertaken. The 0.13 m
long column was divided into 50 elements.
The model set-up with boundary conditions for the one-dimensional single-phase
simulations is shown in Fig. 4. In the experiment, water from the bottom was driven by
capillary pressure of the unsaturated bentonite. This process was simplified in this step by
assuming a Darcy velocity of 1.273�10�8 m/s, which is equivalent to one complete pore
volume through the sample within 2619 h. This velocity was derived by using the pressure
gradient as imposed by the boundary conditions and the hydraulic conductivity of the

M. Xie et al. / Journal of Contaminant Hydrology 83 (2006) 122–147134
specimen. During the experiment the water saturation changed up to 0.12 m from the bottom.
Using a Darcy velocity equal to one pore volume over the entire routine ensured that the water
should travel at least to this point (x =0.12 m).
To simulate the reactive transport process observed in the experiment, reasonable
geochemical reactions were set up according to the changing chemical compositions of
porewater observed in the experiment. That is because simulating porewater chemistry by
using the mineral composition listed in Table 2 might give different results because some
minor components that strongly influence the short-term porewater chemistry are not included.
In this study, geochemical reactions were simulated using PHREEQC2. The reactions
accounted for in the simulation were aquatic reactions in porewater, ion exchange and
equilibrium dissolution/precipitation.
Model results are shown in Fig. 5. In the first case (Fig. 5, left side), the reaction system
does not include dolomite and therefore no dolomite appears during the simulation. If
dolomite is included in the reaction system (Fig. 5, right side), calcite dissolves completely
and dolomite precipitates, which disagrees with the experimental observations, where no
dolomite was found. Therefore dolomite was excluded from the reaction system. This result
demonstrates that great care has to be taken to define a consistent reaction system before
starting the reactive transport simulations.
The important reactions and aqueous species related to the minerals in Table 2 are selected
from the PHREEQC2 database (Parkhurst and Appelo, 1999). It is important to note that the
database for the simulation was extracted from the one provided by PHREEQC2; only those
reactions and data that were used in the simulation were selected. This improves the efficiency
of the calculations and avoids unreasonable reactions. This data is listed in Tables A.2 and A.3
in the Appendix.
After these preliminary studies, the simulation was undertaken by using a 1D non-
isothermal saturated model. The ionic concentrations in porewater, the quantity of minerals,
and the exchangeable ion concentration were used as initial conditions (Table 2). Distilled
water entered from one end (x =0.0 m) and flowed through the specimen. The simulation with
heat transport was performed to show the temperature effect on reactive transport. The model
set-up is as shown in Fig. 4, except that an initial temperature of 30 8C and boundary
Fig. 5. Distribution of ions in porewater at 122.7 days by 1D simulation with PHREEQC2-without dolomite (left), with
dolomite (right) in the reaction system.

Fig. 6. Comparison of isothermal with non-isothermal reactive transport (GeoSys/RockFlow)–distribution of ions in
porewater at 110 days.
M. Xie et al. / Journal of Contaminant Hydrology 83 (2006) 122–147 135
conditions of 100 8C at the top and 65 8C at the bottom are used, corresponding to the steady-
state conditions observed in the experiment after about 15 h. With heat transport, the
concentration of most ions in porewater were about 30% higher than without heat transport
(Fig. 6). Only HCO3� concentration decreases slightly because of the heat transport.
The simulation results obtained using the 1D non-isothermal reactive transport in single-
phase flow are compared with the experimental data in Fig. 7. Large differences exist between
them. Simulated ionic concentrations at 110 days are much lower than the measured values (at
110 days). Because water with lower ion concentrations is replacing water with higher ion
concentrations during the simulation, this shows that simulated mass transport is much faster
Fig. 7. Comparison to the experimental (Exp, Cuevas et al., 1997) and simulated (RF) distribution of ions in porewater a
110 days-non-isothermal reactive transport.
t

Fig. 8. Mineral dissolution/precipitation (left), and porosity change (right) for the compacted bentonite.
M. Xie et al. / Journal of Contaminant Hydrology 83 (2006) 122–147136
than in the experiment. This discrepancy is due to the hydraulic simplification of using single-
phase flow instead of two-phase flow.
Due to mineral dissolution and/or precipitation, the porosity of bentonite changes with time.
Especially for almost insoluble minerals like quartz or montmorillonite, this process is very slow.
Effects on such minerals are not observable within the short duration of the experiment. On the
other hand, dissolution/precipitation reactions of more soluble minerals are observable. The
calculated concentrations of two minerals – calcite and albite that are comparatively soluble–are
shown in Fig. 8. In the simulation, Calcite was dissolved at the injection end of the sample and
slight precipitation occurred in the middle of the sample. Dissolution of Albite occurred also at the
injection end of the sample, but no precipitation was observed. The calculated total porosity
change along the sample due to dissolution or precipitation of all minerals considered in the
model is an increase of 0.032. The initial total porosity was 0.396 (Fig. 8 (right)).
5.2. Isothermal and non-isothermal reactive transport with multiphase flow
The model set-up for the simulation of 1D non-isothermal reactive transport with multiphase
flow is shown in Fig. 9. As an intermediate step towards this model, a 1D submodel similar to
that in Fig. 9, but without heat transport, was also calculated. In this case, the temperature at
both ends of the specimen was set to 303 K, the same as the initial temperature.
Fig. 9. Model set-up for 1D non-isothermal reactive transport in multiphase flow.
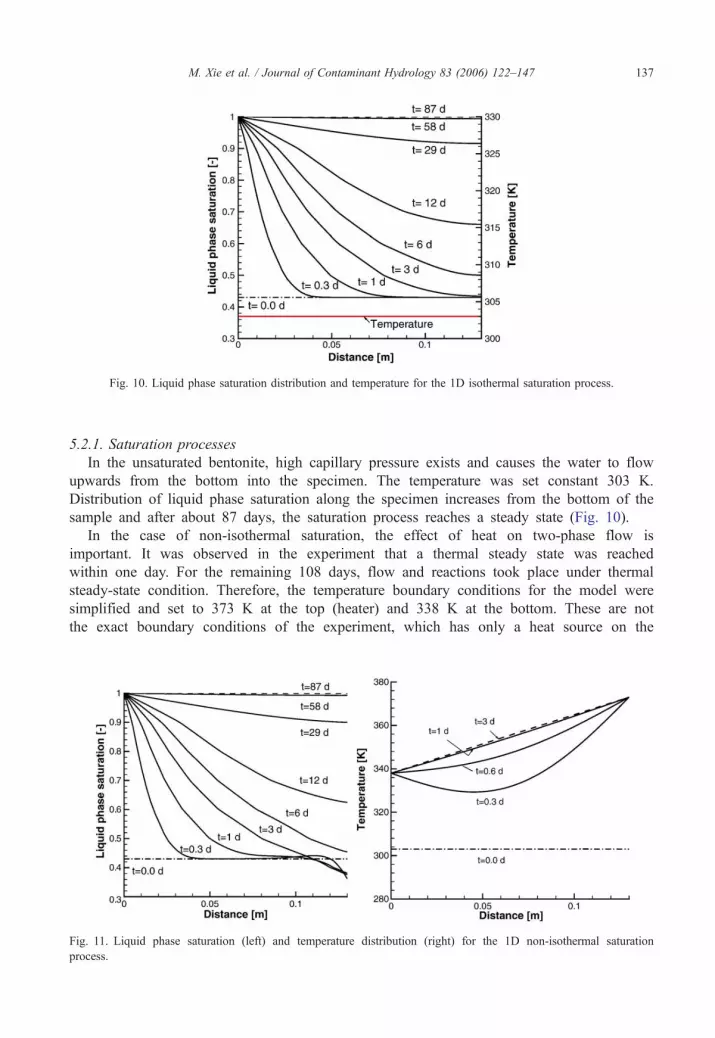
Fig. 10. Liquid phase saturation distribution and temperature for the 1D isothermal saturation process.
Fig. 11. Liquid phase saturation (left) and temperature distribution (right) for the 1D non-isothermal saturation
process.
M. Xie et al. / Journal of Contaminant Hydrology 83 (2006) 122–147 137
5.2.1. Saturation processes
In the unsaturated bentonite, high capillary pressure exists and causes the water to flow
upwards from the bottom into the specimen. The temperature was set constant 303 K.
Distribution of liquid phase saturation along the specimen increases from the bottom of the
sample and after about 87 days, the saturation process reaches a steady state (Fig. 10).
In the case of non-isothermal saturation, the effect of heat on two-phase flow is
important. It was observed in the experiment that a thermal steady state was reached
within one day. For the remaining 108 days, flow and reactions took place under thermal
steady-state condition. Therefore, the temperature boundary conditions for the model were
simplified and set to 373 K at the top (heater) and 338 K at the bottom. These are not
the exact boundary conditions of the experiment, which has only a heat source on the

M. Xie et al. / Journal of Contaminant Hydrology 83 (2006) 122–147138
top, but they are suitable boundary conditions to model the temperature distribution along
the specimen at steady state. After about 1.16 days, a steady-state temperature was almost
reached in the simulation (Fig. 11). Distribution of liquid phase saturation along the
specimen increased from the bottom to top in the calculation but initially decreased at the
top (near the heater) of the specimen (Fig. 11). After about 87 days, the whole model
was fully saturated. For times larger than 10 days, the modelled saturations obtained
under isothermal and under non-isothermal conditions differ only slightly.
5.2.2. Reactive transport
Concurrently with the saturation process, chemical components were transported along the
specimen in the liquid and gas phases. However, the dominating mode of reactive transport of
ions was in the liquid phase. It was therefore assumed that ion transport occurs only in the
liquid phase. As the liquid saturation was less than 1.0, the amount of mass transported is less
than in saturated specimens if flow velocities are the same.
In the case of reactive transport in isothermal multiphase flow, cations and anions move
along the specimen and can cause temporary local non-equilibrium. However, chemical
reactions between solid phases and solution restores equilibrium. The simulated evolutions of
ionic (Na+ and HCO3�) concentration distributions along the specimen during the transport
process are shown in Fig. 12. It is apparent that the concentration near the bottom decreased
owing to the injection of pure water. The Na+ concentration remained below the start value,
whereas the HCO3� concentration increased above the start value. Note, the start values differ
from the given initial concentrations because of the first chemical reaction calculation at the
start time, which equilibrates the geochemical system.
The simulation results for non-isothermal multiphase flow are different as shown in Fig. 13.
The effect of heat on reactive transport can be clearly seen by comparison of the HCO3�
concentration distributions in Fig. 12 (right) and Fig. 13 (right). The concentration of Na+
increased above the start value as shown in Fig. 13 (left), unlike the result of the isothermal
condition in which Na+ remained below the start value (Fig. 12 (left)). The concentrations of
HCO3� at all times (Fig. 13 (right)) were higher than those in the isothermal condition (Fig. 12
(right)). An overview of the effect of heat on the reactive transport is shown in Fig. 14 by
comparing the concentrations of all cations and anions along the specimen after about 110
Fig. 12. Na+ (left) and HCO3� (right) concentration assuming a constant temperature distribution in the case of isothermal
reactive transport.

Fig. 14. Ion distribution for isothermal and non-isothermal reactive transport after 110 days.
Fig. 13. Na+ (left) and HCO3� (right) concentration in the case of non-isothermal reactive transport in multiphase
flow.
M. Xie et al. / Journal of Contaminant Hydrology 83 (2006) 122–147 139
days in the case of isothermal and non-isothermal reactive transport. Additionally, a non-
reactive tracer was included in the simulation, in order to show the effect of heat on mass
transport alone. This effect observably is small. The ions Na+ and Ca2+, however, are more
strongly affected, making the effect of heat on the chemical reactions readily apparent.
5.2.3. Comparison of simulated with experimental results
The simulation results using the 1D non-isothermal reactive transport model with
multiphase flow are compared with the experimental data in Fig. 15. Some of the modelled
elemental concentrations agree well with the experimental data, especially Mg, Ca, Cl and K.
On the other hand, the modelled elemental concentration for C is too low in comparison to
the measured value. This may be because gases like CO2 in the enclosed system are not
included in the simulation. The concentration of element S was lower in the modelled results
although 0.14% gypsum was included in the simulation (Table 2). In general, the modelled

Fig. 15. Comparison of experimental (EXP—Cuevas et al., 1997) and simulated results at 110 days by non-isothermal
reactive transport in two-phase flow.
M. Xie et al. / Journal of Contaminant Hydrology 83 (2006) 122–147140
concentration values of all elements are lower than the measured data, that is because the
simulated moisture distribution is higher than that measured in the experiment.
5.3. Discussion
The experimental saturation distribution after 2619 h (about 109.1 days) is 100% at the
bottom and 43.1% on the top. However, the modelled result presented in Fig. 11 shows a
fully saturated state after 86.8 days. That shows that the simulated saturation process was
faster than that observed in the experiment. One reason for this difference might be the rapid
evaporation at the heated end (about 100 8C). Another possible cause of the discrepancy is
the swelling effect of bentonite during the moisture transport process (Agus and Schanz,
2004; Xie et al., 2004). A simulation taking swelling into account was executed using the
same model set-up as for the non-isothermal reactive transport with multiphase flow (Fig. 9).
The only difference was that the effective porosity and thus the effective permeability
changed with increasing water saturation. Most parameters used for the simulation are
Fig. 16. Swelling effect on saturation (left) and effective porosity (right).

Fig. 17. HCO3� concentration in the case of non-isothermal reactive transport in multiphase flow, including CO2.
Fig. 18. Na+ concentration in the case of non-isothermal reactive transport in multi-phase flow excluding ion
exchange.
M. Xie et al. / Journal of Contaminant Hydrology 83 (2006) 122–147 141
summarized in Tables 1 and 2. Two additional parameters were used: the effective layer
number m was set at 14, and the ionic strength I was set at 0.28—the value of the initial
porewater calculated by PHREEQC2. The changing water saturation and effective porosity
along the specimen are shown in Fig. 16. The saturation process is clearly slower than the
one shown in Fig. 11.
Once the bentonite is exposed to atmospheric conditions (rain, air), gaseous CO2 will be
present. This gas influences the equilibrium of carbonate and acts as a chemical buffer. In the
experiment the bentonite was installed in an enclosed system. Therefore, the initial amount of
CO2 can be changed by reactions. A simulation including CO2 (partial pressure PCO2assumed
to be 10�3.5 according to Bradbury and Baeyens (2003) in the reaction system is shown in
Fig. 17. In comparison to the simulated data in Fig. 13, this simulation predicts a higher
carbon concentration at the bottom of the sample, and lower concentration at the upper end of
the sample where the temperature is higher.

M. Xie et al. / Journal of Contaminant Hydrology 83 (2006) 122–147142
Owing to the extremely large specific surface area and net negative change on the surface
of montmorillonite, activities at the mineral–water interfaces like ion exchange are essential
for the reactive transport in bentonite materials (Herbert and Moog, 1999; Wersin, 2003). In
the simulation mentioned, only ion exchange between Na+, K+, Ca2+ and Mg2+, which
proved to be the most important forms (Wersin, 2003), were considered. Proton exchange is
not included in the reactions, because the simulated pH value is high (N8.0). A high pH, this
mechanism can be neglected (Appelo, 1994). If ion exchange is not considered, the chemical
reactions system is very different, which can be clearly seen by the comparison of the Na+
concentration distribution including ion exchange in Fig. 13 with that excluding ion exchange
in Fig. 18. In the later case, the initial concentrations and those at different times are much
lower than those with ion exchange.
6. Summary and conclusions
A two-phase and non-isothermal multi-species reactive transport model has been
developed and implemented in the object-oriented and process-oriented simulator GeoSys/
RockFlow. Geochemical reactions are incorporated by coupling of GeoSys/RockFlow to the
geochemistry code PHREEQC2. This allows the simulation of the complex behaviour of
bentonite, which is used as buffer material for underground storage of high level nuclear
waste. The code was applied to simulate an experiment by Cuevas et al. (1997), in which a
sample of highly compacted bentonite was simultaneously heated and hydrated and where
geochemical data at the end of the saturation process were measured.
During the simulations it was found that the definition of a consistent system of chemical
reactions is of major importance. It was observed that during the experiment the highly
soluble minerals like calcite, halite and gypsum strongly determined the porewater chemistry.
However, as these minerals formed only a very small fraction of the bentonite, their fractions
were not determined by Cuevas et al. (1997). As a result, it was necessary to deduce the
reactions from the chemical composition of the bentonite as well as from the experimentally
observed geochemical reactions. This limited the usefulness of this experiment for the
verification of our model.
By starting the numerical simulations with isothermal single-phase flow and increasing the
complexity stepwise to non-isothermal two-phase flow, the effects of the individual processes
on the observed ion distribution at the end of the experiment could be identified. It is found
that both two-phase flow and heat transport have to be included to obtain a good fit between
the simulated and measured values. Temperature affects two-phase flow via the material
parameters and by evaporation occurring at the heater, both enhancing the flow rate.
Geochemical reactions are affected via the reaction coefficients, which typically cause higher
ion concentrations in porewater compared to the case of a constant temperature. Due to the
relatively short duration of the experiment, the porosity change caused by mineral dissolution/
precipitation remained very small. By conducting model runs with and without allowing for
ion exchange it could be shown that ion exchange plays a major role in the studied
geochemical environment, causing significantly higher concentrations of ions in porewater.
Swelling is an important phenomenon in bentonite. With swelling under constrained
conditions, effective porosity and thus effective permeability of the bentonite change. The
swelling potential can also be influenced by variation of the chemical composition of the
bentonite. In the simulations, it was shown that swelling significantly slows down the
saturation process, because swelling reduces the porosity in the bentonite sample. However,

M. Xie et al. / Journal of Contaminant Hydrology 83 (2006) 122–147 143
detailed measurements of the required parameters for swelling would be required to draw
further conclusions. For a better verification of the conceptual and mathematical model, a
well designed experiment would be helpful, where all parameters needed for the simulation
are determined a priori and the measurements are performed in accordance with sensitivities
identified in preliminary modelling studies.
Acknowledgements
The work is supported by the German Federal Institute for Geosciences and Natural
Resources (BGR) and partly by the German Federal Ministry of Education and Research
(BMBF). We thank Dr. Wallner (BGR) for his support of this research work and Robert Walsh
(ZAG) for improving the manuscript.
Appendix A
The following data are extracted from the PHREEQC2 database (Parkhurst and Appelo,
1999). During the simulation, the database includes only the data used for the calculation.
This helps to improve the efficiency of the calculation and more importantly to avoid
unreasonable reactions.
Table A.1
Equations and parameters for ion exchange
Ion Equation LogK DH0 Debye–Huckel parameters
25 8C kcal a0 b
Na+ Na++X�=NaX 0.0 –
K+ K++X�=KX 0.7 �4.3 3.5 0.015
Ca2+ Ca2++2X�=CaX2 0.8 7.2 5.0 0.165
Mg2+ Mg2++2X�=MgX2 0.6 7.4 5.5 0.2
All data are from PHREEQC2 database Parkhurst and Appelo (1999).
Table A.2
Mineral hydrolysis reactions and equilibrium constants
Mineral Hydrolysis reaction LogK DH0
25 8C kcal
Albite NaAlSi3 O8+8H2O=
Na++Al(OH)4�+3H4SiO4
�18.002 25.896
Ca– Ca0.165 Al2.33Si3.67O10(OH)2+12H2O
Montmorillonite =0.165Ca2++2.33Al(OH)�4 �45.027 58.373
+3.67H4SiO4+2H+ �45.027 58.373
Cristobalite SiO2+2H2O=H4SiO4 �3.587 5.5
Calcite CaCO3=CO32� +Ca2+ �8.48 �2.297
Gypsum CaSO4:2 H2O=Ca2++SO42�+2H2O �4.58 �0.109
Quartz SiO2+2H2O=H4SiO4 �3.98 5.990
All data are from PHREEQC2 database Parkhurst and Appelo (1999).
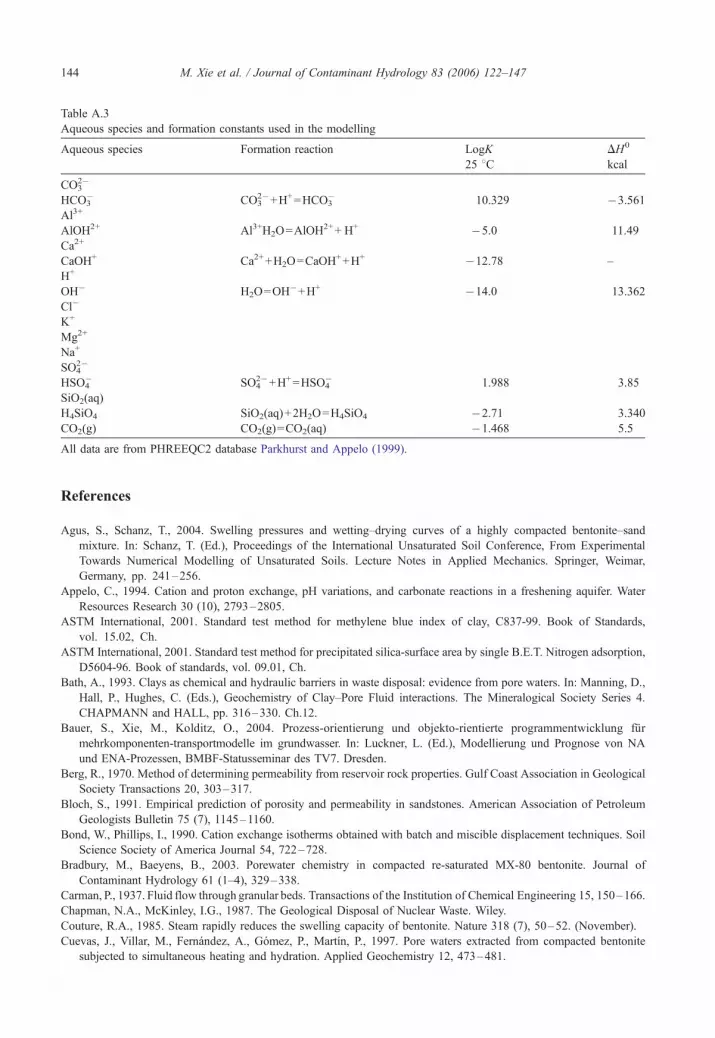
Table A.3
Aqueous species and formation constants used in the modelling
Aqueous species Formation reaction LogK DH0
25 8C kcal
CO32�
HCO3� CO3
2�+H+=HCO3� 10.329 �3.561
Al3+
AlOH2+ Al3+H2O=AlOH2++ H+ �5.0 11.49
Ca2+
CaOH+ Ca2++H2O=CaOH++H+ �12.78 –
H+
OH� H2O=OH�+H+ �14.0 13.362
Cl�
K+
Mg2+
Na+
SO42�
HSO4� SO4
2�+H+=HSO4� 1.988 3.85
SiO2(aq)
H4SiO4 SiO2(aq)+2H2O=H4SiO4 �2.71 3.340
CO2(g) CO2(g)=CO2(aq) �1.468 5.5
All data are from PHREEQC2 database Parkhurst and Appelo (1999).
M. Xie et al. / Journal of Contaminant Hydrology 83 (2006) 122–147144
References
Agus, S., Schanz, T., 2004. Swelling pressures and wetting–drying curves of a highly compacted bentonite–sand
mixture. In: Schanz, T. (Ed.), Proceedings of the International Unsaturated Soil Conference, From Experimental
Towards Numerical Modelling of Unsaturated Soils. Lecture Notes in Applied Mechanics. Springer, Weimar,
Germany, pp. 241–256.
Appelo, C., 1994. Cation and proton exchange, pH variations, and carbonate reactions in a freshening aquifer. Water
Resources Research 30 (10), 2793–2805.
ASTM International, 2001. Standard test method for methylene blue index of clay, C837-99. Book of Standards,
vol. 15.02, Ch.
ASTM International, 2001. Standard test method for precipitated silica-surface area by single B.E.T. Nitrogen adsorption,
D5604-96. Book of standards, vol. 09.01, Ch.
Bath, A., 1993. Clays as chemical and hydraulic barriers in waste disposal: evidence from pore waters. In: Manning, D.,
Hall, P., Hughes, C. (Eds.), Geochemistry of Clay–Pore Fluid interactions. The Mineralogical Society Series 4.
CHAPMANN and HALL, pp. 316–330. Ch.12.
Bauer, S., Xie, M., Kolditz, O., 2004. Prozess-orientierung und objekto-rientierte programmentwicklung fur
mehrkomponenten-transportmodelle im grundwasser. In: Luckner, L. (Ed.), Modellierung und Prognose von NA
und ENA-Prozessen, BMBF-Statusseminar des TV7. Dresden.
Berg, R., 1970. Method of determining permeability from reservoir rock properties. Gulf Coast Association in Geological
Society Transactions 20, 303–317.
Bloch, S., 1991. Empirical prediction of porosity and permeability in sandstones. American Association of Petroleum
Geologists Bulletin 75 (7), 1145–1160.
Bond, W., Phillips, I., 1990. Cation exchange isotherms obtained with batch and miscible displacement techniques. Soil
Science Society of America Journal 54, 722–728.
Bradbury, M., Baeyens, B., 2003. Porewater chemistry in compacted re-saturated MX-80 bentonite. Journal of
Contaminant Hydrology 61 (1–4), 329–338.
Carman, P., 1937. Fluid flow through granular beds. Transactions of the Institution of Chemical Engineering 15, 150–166.
Chapman, N.A., McKinley, I.G., 1987. The Geological Disposal of Nuclear Waste. Wiley.
Couture, R.A., 1985. Steam rapidly reduces the swelling capacity of bentonite. Nature 318 (7), 50–52. (November).
Cuevas, J., Villar, M., Fernandez, A., Gomez, P., Martın, P., 1997. Pore waters extracted from compacted bentonite
subjected to simultaneous heating and hydration. Applied Geochemistry 12, 473–481.

M. Xie et al. / Journal of Contaminant Hydrology 83 (2006) 122–147 145
Curti, E., 1993. Modelling bentonite pore waters for the Swiss high-level radioactive waste repository. Technical Report
93–45. Nagra.
De Windt, L., Pellegrini, D., van der Lee, J., 2004. Coupled modeling of cement/claystone interactions and radionuclide
migration. Journal of Contaminant Hydrology 68, 165–182.
Dzombak, D., Morel, F., 1990. Surface Complexation Modelling; Hydrous Ferric Oxide. Wiley-Interscience, New York.
FEBEX Working groups, 2000. Full-scale engineered barriers experiment for a deep geological repository for high level
radioactive waste in crystalline host rock. Final Report.
Gaines, G.L., Thomas, H.C., 1953. Adsorption studies on clay minerals: II. A formulation of the thermodynamics of
exchange adsorption. Journal of Chemical Physics 21, 714–718.
Gapon, Y.N., 1933. Theory of exchange adsorption in soils. Journal of General Chemistry, USSR, Engl. Transl. 3,
144–163.
Gawin, D., Baggio, P., Schrefler, B.A., 1995. Coupled heat, water and gas flow in deformable porous media. International
Journal for Numerical Methods in Fluids 20, 969–987.
Gens, A., Garcia-Molina, A.J., Olivella, S., Alonso, E.E., Huertas, F., 1998. Analysis of a full scale in situ test
simulating repository conditions. International Journal for Numerical and Analytical Methods in Geomechanics 22,
515–548.
Grambow, B., Hermansson, H., Bjorner, I., Wermer, L., 1985. Glass/water reaction with and without bentonite:
experiment and model. In: Bates, J., Seefeldt, W. (Eds.), Scientific Basis for Nuclear Waste Management IX, Material
Research Society Symposium Series, vol. 50, pp. 187–194.
Helmig, R., 1997. Multiphase Flow and Transport Processes in the Subsurface. Springer, Berlin.
Herbert, H.-J., Moog, H., 1999. Cation exchange, interlayer spacing, and water content of MX-80 bentonite in high molar
saline solutions. Engineering Geology 54 (1).
Kolditz, O., 2002. Computational Methods in Environmental Fluid Mechanics. Springer.
Kolditz, O., Bauer, S., 2004. A process-oriented approach to computing multi-field problems in porous media. Journal of
Hydroinformatics Online 6 (3), 225–244.
Kolditz, O., de Jonge, J., 2004. Non-isothermal two-phase flow in low-permeable porous media. Computational
Mechanics 33, 345–364.
Lasaga, A.C., 1984. Chemical kinetics of water–rock interactions. Journal of Geophysical Research 89, 4009–4025.
Lenhard, R.J., Parker, J.C., 1987. A model for hysteretic constitutive relations governing multiphase flow: 2.
Permeability–saturation relations. Water Resources Research 23, 2197–2206.
Lichtner, P., 1985. Continuum model for simultaneous chemical reactions and mass transport in hydrothermal systems.
Geochimica. et Cosmochimica. Acta 49, 779–800.
Lichner, P., 1988. The quasi-stationary state approximation to coupled mass transport and fluid–rock interaction in a
porous medium. Geochimica et Cosmochimica Acta 52, 143–165.
Lichner, P., 1996. Continuum formulation of multicomponent–multiphase re-active transport. In: Lichtner, P.C., Steefel,
C.I., Oelkers, E.H. (Eds.), Reactive Transport in Porous Media, Vol. 34 of Reviews in Mineralogy. Mineralogical
Society of America, pp. 1–79.
Liu, C., Narasimhan, T., 1989. Redox-controlled multiple species reactive chemical transport: 1. Model development.
Water Resources Research 25, 869–882.
Mitchell, J., 1993. Fundamentals of Soil Behaviour, 2nd edition. John Wiley and Sons.
Muurinen, A., Lehikoinen, 1999. Porewater Chemistry in Compacted Bentonite. Technical Report 99-20. Posiva,
Helsinki.
Neuzil, C., 1994. How permeable are clays and shales? Water Resources Research 30 (2), 145–150.
Newman, A., 1987. The interaction of water with clay mineral surfaces. Chemistry of Clays and Clay Minerals, vol. 6.
Longman Scientific and Technical, Harslow, Essex, pp. 237–274.
Nienhuis, P., Appelo, C.A.T., Willemsen, A., 1991. Program PHREEQM, Modified from PHREEQE for use in Mixing
Cell Flow Tube. The Netherlands, Amsterdam Free University.
Oelkers, E., 1996. Physical and chemical properties of rocks and fluids for chemical mass transport calculations. In:
Ribbe, P.H. (Ed.), Vol. 34. Ch.2 in Reactive Transport in Porous Media, Reviews in Mineralogy (Mineralogy Society
of America), pp. 130–191. Series Editor.
Ohe, T., Tsukomoto, M., 1997. Geochemical properties of bentonite porewater in high-level waste repository condition.
Nuclear Technology 118, 49–57.
Olivella, S., Gens, A., 2000. Vapour transport in low permeability unsaturated soils with capillary effects. Transport in
Porous Media 40, 219–241.
Ortoleva, P., Merino, E., Chadam, J., 1987. Geochemical self-organization: 2. Reaction-transport feedbacks and modeling
approach. American Journal of Science 287, 979–1007.
M. Xie et al. / Journal of Contaminant Hydrology 83 (2006) 122–147146
Parkhurst, D., Appelo, C., 1999. User’s guide to PHREEQC (Version 2) — A Computer Program for Speciation, Batch-
reaction, One-dimensional Transport, and Inverse Geochemical Calculations. Report 99-4259. U.S. Geological
Survey, Denver, Colorado.
Pusch, R., 2000. On the Effect of Hot Vapor on Mx80 Clay. Technical Report TR-00-16. SKB, Lund,
Sweden.
Pusch, R., Muurinen, A., Lehikoinen, J., Bors, J., Eriksen, T., 1999. Microstructural and chemical parameters of bentonite
as determinants of waste isolation efficiency. Project Report EUR 18950 EN, European Commission, Nuclear Science
and Technology.
Savage, D., Noy, D., Mihara, M., 2002. Modelling the interaction of bentonite with hyperalkaline fluids. Applied
Geochemistry 17, 207–233.
Schoen, M., Rhykerd, C.L., Diestler, D., Cushman, J., 1989. Shear forces in molecularly thin films. Science 245,
1223–1225. (September).
Simunek, J., Suares, D.L., 1994. Two-dimensional transport model for variably saturated porous media with major ion
chemistry. Water Resources Research 30, 1115–1133.
Snellman, M., 1994. Chemical buffering properties of bentonite — a general overview of some recent theoretical and
experimental studies. Imatran Voima Oy Work Report TEKA-94-12, TVO, Helsinki.
Snellman, M.H.U., Rantanen, J., 1985. Laboratory and modelling studies of sodium bentonite groundwater interactions.
In: Bates, J., Seefeldt, W. (Eds.), Scientific Basis for Nuclear Waste Management IX, Material Research Society
Symposium Series, vol. 50, pp. 718–790.
Steefel, C.I., Lasaga, A.C., 1994. A coupled model for transport of multiple chemical species and kinetic precipitation/
dissolution reactions with applications to reactive flow in single phase hydrothermal system. American Journal of
Science 294, 529–592.
Steefel, C., MacQuarrie, K.T.B., 1994. Approaches to modelling reactive transport in porous media. In: Lichtner, P.C.,
Steefel, C.I., Oelkers, E.H. (Eds.), Reactive transport in porous media., Reviews in Mineralogy, vol. 34.
Mineralogical Society of America, pp. 83–129.
Studds, P., Stewart, D., Cousens, T., 1998. The effects of salt solutions on the properties of bentonite–sand mixtures. Clay
Minerals 33, 651–660.
Stumm, W., Morgan, J.J., 1996. Aquatic Chemistry, third edition. John Wiley and Sons, New York.
Tessier, D.M.D., Beaumont, A., Jaunet, A., 1998. Swelling pressure and microstructure of an activated swelling clay with
temperature. Clay Minerals 33, 255–267.
Tsang, C.-F., Stephansson, O., Kautsky, F., Jing, L., 2003. An overview of the DECOVALEX project on coupled THM
processes in fractured rock-bentonite systems. GeoProc 2003: International conference on coupled T-H-M-C
processes in Geo-systems: Fundamentals, modeling, experiments and applications, vol. 1, pp. 3–11.
Tuller, M., Or, D., 2003. Hydraulic functions for swelling soils: pore scale considerations. Journal of Hydrology 272,
50–71.
US Bureau of Mines (Ed.), 1997. Dictionary of Mining, Mineral, and Related Terms, 2nd edition. American Geological
Institute.
van der Lee, J., De Windt, L., 2001. Present state and future directions of modeling of geochemistry in hydrogeological
systems. Journal of Contaminant Hydrology 47 (4), 265–282.
van Genuchten, M.T., 1980. A closed-form equation for predicting the hydraulic conductivity of saturated soils. Soil
Science Society of America Journal 44, 892–898.
Vanselow, A.P., 1932. Equilibria of the base-exchange reactions of bentonites permutites, soil colloids and zeolites. Soil
Science 33, 95–113.
Villar, M., Cuevas, J., Martın, P., Campos, R., Fernandez, A., 1995. Thermo-hydro-mechanical characterization of
Spanish reference clay material for engineering barrier for granite and clay HLW repository: laboratory and small
mock-up testing. Publicacin Tcnica 03/95. ENRESA.
Wang, W., Datcheva, M., Schanz, T., Koldtiz, O., 2005. A sub-stepping approach for elasto-plasticity with rotational
hardening. Computational Mechanics.
Wanner, H., 1986. Modelling interaction of deep groundwaters with bentonite and radionuclide speciation. Nuclear
Technology 79, 338–347.
Wersin, P., 2003. Geochemical modelling of bentonite porewater in high-level waste repositories. Journal of Contaminant
Hydrology 61, 405–422.
White, S.P., 1995. Multiphase non-isothermal transport of systems of reacting chemicals. Water Resources Research 31,
1761–1772.
Wiebe, B., Graham, J., Tang, G., Dixon, D., 1998. Influence of pressure, saturation and temperature on the behavior of
unsaturated sand–bentonite. Canadian Geotechnical Journal 35, 194–205.

M. Xie et al. / Journal of Contaminant Hydrology 83 (2006) 122–147 147
Wieland, E., Wanner, H., Albinsson, Y., Wersin, P., Karnland, O., 1994. A surface chemical model of the bentonite–water
interface and its implications for modelling the near field chemistry in a repository for spent fuel. Technical Report
TR 94-26. SKB, Stockholm, Sweden.
Xie, M., Agus, S., Schanz, T., Kolditz, O., 2004. An upscaling method and numerical modelling of swelling/shrinking
processes in compacted bentonite/sand mixtures. International Journal for Numerical and Analytical Methods in
Geomechanics 28, 1479–1502.
Xie, M., Wang, W., de Jonge, J., Kolditz, O., 2005. Numerical modelling of swelling pressure in unsaturated expansive
elasto-plasticporous media. Submitted to Transport in Porous Media.
Xu, T., Pruess, K., 2001. Modeling multiphase non-isothermal fluid flow and reactive geochemical transport in variably
saturated fractured rocks: 1. Methodology. American Journal of Science 301, 16–33. (January).
Yeh, G., Tripathi, V., 1991. A model for simulating transport of reactive multispecies components: model development
and demonstration. Water Resources Research 27 (12), 3075–3094.