noodles annual report 2020
TRANSCRIPT
Noodles Annual Report 2020Form 10-K (NASDAQ:NDLS)
Published: February 26th, 2020
PDF generated by stocklight.com
UNITED STATESSECURITIES AND EXCHANGE COMMISSION
WASHINGTON, D.C. 20549
FORM 10-K
☒ ANNUAL REPORT PURSUANT TO SECTION 13 OR 15(d) OF THE SECURITIES EXCHANGE ACT OF 1934
For the fiscal year ended December 31, 2019or
☐ TRANSITION REPORT PURSUANT TO SECTION 13 OR 15(d) OF THE SECURITIES EXCHANGE ACT OF 1934
For the transition period from to Commission File Number: 001-35987
NOODLES & COMPANY(Exact name of registrant as specified in its charter)
Delaware 84-1303469
(State or other jurisdiction of incorporation or organization) (IRS Employer Identification No.)
520 Zang Street, Suite D
Broomfield, CO 80021
(Address of principal executive offices) (Zip Code)
Registrant’s telephone number, including area code: (720) 214-1900
Securities registered pursuant to Section 12(b) of the Act:
Title of each class Trading Symbol Name of each exchange on which registered
Common stock, par value $0.01 per share NDLS Nasdaq Global Select Market
Securities registered pursuant to Section 12(g) of the Act: None
Indicate by check mark if the registrant is a well-known seasoned issuer, as defined in Rule 405 of the Securities Act. Yes ̈ No xIndicate by check mark if the registrant is not required to file reports pursuant to Section 13 or Section 15(d) of the Act. Yes ̈ No xIndicate by check mark whether the registrant: (1) has filed all reports required to be filed by Section 13 or 15(d) of the Securities Exchange Act of 1934 during the preceding
12 months (or for such shorter period that the registrant was required to file such reports), and (2) has been subject to such filing requirements for the past 90 days Yes x No ¨Indicate by check mark whether the registrant has submitted electronically every Interactive Data File required to be submitted pursuant to Rule 405 of Regulation S-T (§232.405
of this chapter) during the preceding 12 months (or for such shorter period that the registrant was required to submit such files). Yes x No ¨Indicate by check mark whether the registrant is a large accelerated filer, an accelerated filer, a non-accelerated filer, a smaller reporting company, or an emerging growth
company. See the definitions of “large accelerated filer,” “accelerated filer,” “smaller reporting company,” and “emerging growth company” in Rule 12b-2 of the Exchange Act.
Large accelerated filer ☐ Accelerated filer ☒ Non-accelerated filer ☐ Smaller reporting company ☒ Emerging growth company ☐
If an emerging growth company, indicate by check mark if the registrant has elected not to use the extended transition period for complying with any new or revised financialaccounting standards provided pursuant to Section 13(a) of the Exchange Act. ☐
Indicate by check mark whether the registrant is a shell company (as defined in Rule 12b-2 of the Act). Yes ☐ No ☒The aggregate market value of the voting and non-voting common stock held by non-affiliates as of July 2, 2019, the last business day of the registrant’s most recently completed
second fiscal quarter, was $234.1 million. This amount was calculated based on the closing price of the common stock on July 2, 2019 on the Nasdaq Global Select Market. Allexecutive officers and directors of the registrant have been deemed, solely for the purpose of the foregoing calculation, to be “affiliates” of the registrant.
As of February 24, 2020, there were 44,133,803 shares of the registrant’s Class A common stock, par value of $0.01 per share outstanding.

DOCUMENTS INCORPORATED BY REFERENCE
Portions of the registrant’s proxy statement relating to its 2020 Annual Meeting of Stockholders, to be held on or about April 30, 2020, are incorporated by reference into Part III ofthis Annual Report on Form 10-K, where so indicated. Such proxy statement will be filed with the U.S. Securities and Exchange Commission within 120 days after the end of the fiscalyear to which this report relates.
TABLE OF CONTENTS
Page
PART I ITEM 1. Business 1ITEM 1A. Risk Factors 8ITEM 1B. Unresolved Staff Comments 22ITEM 2. Properties 23ITEM 3. Legal Proceedings 24ITEM 4. Mine Safety Disclosures 24 PART II ITEM 5. Market for Registrant's Common Equity, Related Stockholder Matters and Issuer Purchases of Equity Securities 25ITEM 6. Selected Financial Data 26ITEM 7. Management's Discussion and Analysis of Financial Condition and Results of Operations 28ITEM 7A. Quantitative and Qualitative Disclosures About Market Risk 44ITEM 8. Financial Statements and Supplementary Data 45ITEM 9. Changes in and Disagreements with Accountants on Accounting and Financial Disclosure 72ITEM 9A. Controls and Procedures 72ITEM 9B. Other Information 74 PART III ITEM 10. Directors, Executive Officers and Corporate Governance 74ITEM 11. Executive Compensation 74ITEM 12. Security Ownership of Certain Beneficial Owners and Management and Related Stockholder Matters 74ITEM 13. Certain Relationships and Related Transactions, and Director Independence 74ITEM 14. Principal Accounting Fees and Services 74 PART IV ITEM 15. Exhibits, Financial Statement Schedules 75ITEM 16. Form 10-K Summary 79SIGNATURES EXHIBITS
PART I
ITEM 1. Business
General
Noodles & Company is a restaurant concept offering lunch and dinner within the fast-casual segment of the restaurant industry. We opened our firstlocation in Denver, Colorado in 1995, offering noodle and pasta dishes, staples of many different cuisines, with the goal of delivering fresh ingredients andflavors from around the world under one roof. Today, our globally-inspired menu includes a wide variety of high quality, cooked-to-order dishes, includingnoodles and pasta, soups, salads and appetizers. We believe that we offer our customers value, with per person spend of $9.53 for the fiscal year endedDecember 31, 2019.
We offer more than 20 globally-inspired dishes together on a single menu that can be enjoyed inside our restaurants, taken to-go, or, in most areas,delivered to our customers. We believe we will benefit from trends in consumer preferences such as the broader demand for international cuisines andthe increasing desire for convenience. At many restaurants, customers are limited to a particular ethnic cuisine or type of dish, such as a sandwich, burritoor burger. At Noodles & Company, we aim to eliminate the “veto vote” by satisfying the preferences of a wide range of customers, whether a family orparent with kids, a group of coworkers, an individual or a large party.
We believe that our globally-inspired menu, focused on noodle and pasta dishes, differentiates us from other restaurants. We believe our attributes—global flavors, variety, dishes prepared-to-order and fast service—allow us to compete against multiple segments throughout the restaurant industry andprovide us a larger addressable market for lunch and dinner than competitors who focus on a single cuisine. We strive to provide a pleasant diningexperience by quickly delivering fresh food with friendly service at a price point we believe is attractive to our customers. In addition, we believe that ourmenu is well suited for off-premise dining occasions in which customers order at our restaurant or online but then eat their meal at their home or office.
Noodles & Company is a Delaware corporation that was organized in 2002. Noodles & Company and its subsidiaries are sometimes referred to as “we,”“us,” “our,” and the “Company” in this report. We refer to our Class A Common Stock, par value $0.01 per share, as our “common stock.”
Our Concept and Business Strengths
Variety. We have purposefully chosen a range of healthy to indulgent dishes to satisfy multiple dietary preferences. Our menu encourages customers tocustomize their meals to meet their tastes and nutritional preferences with our selection of 20 fresh vegetables and nine proteins. Additionally, customersare able to customize the noodle that their dish is prepared with, including healthy options such as our zucchini noodle (“Zoodles”), cauliflower infusedrigatoni (“Caulifloodles”), and gluten free pipette noodle.
All of our dishes are cooked-to-order with fresh, high quality ingredients sourced from our carefully selected suppliers. Our commitment to the freshness ofour ingredients is further demonstrated by our use of seasonal ingredients and healthy add-in options such as seasoned tofu. Our culinary team strives todevelop new dishes and limited time offerings to further reinforce our brand positioning and regularly provide our customers additional options. Choice hasalways been a great strength of the brand, and we continue to innovate in ways that allow guests to enjoy the world flavors they know and love, as well asdiscover new ones with all of the benefits of healthier options. For example, the introduction of zucchini noodles in 2018 removed a major obstacle to thebrand by providing a low-carb, gluten free noodle alternative to our guests. Zoodles can be substituted into any of our dishes or enjoyed in a signaturedish. In 2019, we continued to innovate around plant-based menu options and launched cauliflower-infused rigatoni, which provides a full serving ofvegetables and has tremendous versatility as a substitute in all of our dishes. This focus on culinary innovation allows us to prepare and serve high qualityfood and meet changing consumer trends.
Value. The quality of our food and the welcoming ambiance of our restaurants creates an overall customer experience that we believe is unique anddifferentiated. Our per person spend is competitive not only within the fast-casual segment, but also within the quick-service segment. We deliver value bycombining a family-friendly dining environment with the opportunity to enjoy many dishes containing a variety of fresh ingredients. We also offer kidsmeals which, at a fixed low price, provide the opportunity for parents to feed their children a balanced meal with sides such as broccoli, carrots,applesauce and a smaller portion of our house made rice crispy treat.
Our Restaurant Experience. We design each location individually, which we believe creates an inviting restaurant environment. We believe the ambianceis warm and welcoming, with muted lighting and colors, comfortable seating and our own custom music mix, which is intended to make our customers feelrelaxed and at home.
We believe we deliver an exceptional overall dining experience. We believe that our customers should expect not only great food from our restaurants, butalso warm hospitality and attentive service. Whether you are a parent with kids or a businessperson with a laptop, you simply order your food, grab adrink and take a seat. We cook each dish to order in approximately five minutes and bring the food right to your table. Our customers may enjoy a relaxedmeal or just eat and run.
We also believe that our experience meets consumers’ increasing desire for speed and convenience. A substantial amount of our revenue is derived fromcustomers who consume their meal off-premise, either by ordering at the restaurant and taking the food to go or by ordering ahead of time through online,phone-in and delivery channels.
Consistent with our culture of enhanced customer service, we seek to hire individuals who will deliver prompt, attentive service by engaging customers themoment they enter our restaurants. Our training philosophy empowers both our restaurant managers and team members, also referred to as employees,to add a personal touch when serving our customers, such as coming out from behind the counter to explain our menu and guiding customers to the rightdish. Our restaurant managers are critical to our success, as we believe that their entrepreneurial spirit and outreach efforts build our brand in ourcommunities. We call our cashiers “Noodle Ambassadors” to highlight their role in helping our customers explore our global menu. After our customersorder at the counter, their food is delivered to their table by our friendly team members.
Our Operational Strategy
We believe our brand and globally-inspired menu resonates with consumers, and we believe our restaurants and team members provide customers aunique and high-quality experience. We are focused on offering customers flavorful, cooked-to-order dishes in a warm and welcoming environment at anattractive value.
Restaurant initiatives. Our plan to improve our performance includes the following four key strategies:
• Focusing on our global flavors and menu offerings. We believe that our globally-inspired menu, focused on noodle and pasta dishes, differentiatesus from other restaurants. We also believe this global variety, which includes a range of healthy to indulgent dishes that are cooked to order withfresh, high-quality ingredients, remains a competitive strength. We believe we have significant potential to broaden awareness for our zucchiniand cauliflower-infused noodles with additional dishes as we continue to test the next evolution of our better-for-you platform along with continuedinnovation around our core offerings.
• Improving efficiencies and unit-level margins. We believe that while we have made significant progress in recent quarters, there remainsmeaningful opportunity to improve our operational consistency as well as our overall unit level margins. We are actively enhancing our supplychain and food preparation procedures to reduce inbound ingredient costs and improve labor efficiency. During 2018, we completed the nationalroll out of self-busing stations, which reduced labor hours and improved cleanliness in our restaurants. In 2019, we began incorporating pick-upwindows into many of our new restaurants to reflect the evolution of overall guest preference towards the off-premise occasion. Additionally, wecontinue to optimize our equipment package and operating processes and expect to begin retrofitting our existing restaurants in 2020 with a newkitchen design engineered to increase efficiency while also improving throughput, food quality, off-premise ease of pick-up and flexibility for futureculinary innovation. In 2020, we will begin incorporating the new kitchen design and operating model into new restaurants.
• Enhancing convenience for our customers . We believe there is significant opportunity to increase convenience for our customers. In 2018, wecompleted a national roll out of dedicated pickup areas for customers who order and pay ahead so that they can have a faster and moreconvenient takeout experience. In 2019, we relaunched our digital platform making it easier for guests to navigate our menu and customize theirorders. Additionally, we introduced a new and improved Noodles Rewards program that incorporates points and tier-based rewards to furthercustomer engagement. Finally, we continue to offer an additional level of convenience for our customers through our third-party delivery program.
• Improving manager selection, training and development of our teams . We have increased our focus on the selection, training and development ofour restaurant teams. We have implemented certain changes to our restaurant compensation program
to encourage team member retention. We have rolled out training tools and learning management systems to improve execution and encouragecareer development within our teams. Finally, we utilize a thorough, disciplined process of sharing best practices throughout the organization.
Restaurant Portfolio and Franchising
Restaurant Portfolio. As of December 31, 2019, we had 389 company-owned restaurants and 68 franchise restaurants in 29 states and the District ofColumbia. Our restaurants are typically 2,600 to 2,700 square feet and are located in end-cap, in-line or free-standing locations across a variety ofsuburban and urban markets. During the near-term we will execute on a smaller square footage design as we embed the new operating model into newrestaurants. We anticipate that this design will better facilitate future expansion and better meet the needs of the changing consumer experience.
Restaurant Development. Given improvement in results, operating effectiveness and liquidity, we are currently pursuing a disciplined development pipelineto execute a modest new unit growth rate in the near term and expect an annual unit growth rate between 5% and 7% beginning in 2021. We anticipatethis unit growth to include a combination of both company and franchise development. In 2019, we opened four new company-owned restaurants,acquired one franchise restaurant, and sold five restaurants to a franchisee.
Certain Restaurant Closures. We closed five company-owned restaurants in 2019 and 19 company-owned restaurants in 2018, most of which were at orapproaching the expiration of their leases. We currently do not anticipate a significant number of restaurant closures for the foreseeable future; however,we may from time to time close or relocate certain restaurants, that are at, or near, the expiration of their leases.
Franchising. As of December 31, 2019, we had 68 franchise units in 15 states operated by 11 franchisees. In 2019, our franchisees opened onerestaurant, acquired five restaurants previously operated by the Company and closed two restaurants. We have a total of nine area developers who havesigned development agreements providing for the opening of 73 additional restaurants in their respective territories. We look for experienced, well-capitalized franchise partners who are able to leverage their existing infrastructure and local knowledge in a manner that benefits both our franchisees andus. We expect to continue to offer development rights in markets where we do not intend to build company-owned restaurants. We may offer such rights tolarger developers who commit to open 10 or more units, or to smaller developers who may commit to open fewer restaurants. We do not currently intend tooffer single-unit franchises. We believe the strength and attractiveness of our brand will attract experienced and well-capitalized area developers.
Site Development and Expansion
We consider our site selection and development process critical to our long-term success. We have used a combination of our own internal team andoutside real estate consultants to locate, evaluate and negotiate new sites using various criteria. In making site selection decisions, we use severalanalytical tools designed to uncover the key site, demographic, business, retail, competitive and traffic characteristics that drive successful locations.
Once a location has been approved by our executive-level selection committee, we begin a design process to match the characteristics and feel of thelocation to the trade area. For example, in a trade area with a high percentage of families we will utilize additional booth seating in the dining room, and inan urban location we will typically alter our kitchen design to enhance throughput for the busy lunch hours.
Restaurant Management and Operations
Friendly Team Members. We believe our genuine, friendly team members separate us from our competitors. We value the individuality of our teammembers, which we believe results in a management, operations and training philosophy distinct from that of our competitors. We strive to hire teammembers who share a passion for food, have a competitive spirit and will operate our restaurants in a way that is consistent with our high standards. Weseek to hire individuals who will deliver prompt, attentive service by engaging customers the moment they enter our restaurants. We empower our teammembers to enrich the experience of our customers and directly address any concerns that may arise in a manner that contributes to the success of ourbusiness.
Restaurant Management and Employees. Each restaurant typically has a restaurant manager, an assistant manager and 15 to 25 team members. Wecross-train our employees in an effort to create a depth of competency in our critical restaurant functions. Consistent with our emphasis on customerinteraction, we encourage our restaurant managers and team members to welcome and interact with
customers throughout their visit. To lead our restaurant management teams, we have area managers (each of whom is responsible for between five and10 restaurants), as well as regional directors (each of whom is responsible for between 45 and 57 restaurants).
Training and Career Development. We believe that our training efforts create a culture of continuous learning and professional growth that allows our teammembers to continue their career development with us. Within each restaurant, two to four team members are designated to lead the training efforts andensure a consistent approach to team member development. We produce training materials that encourage individual contributions and participation fromour team members while also requiring adherence to certain guidelines and procedures.
Food Preparation and Quality. Our teams use classic professional cooking methods, including par boiling and sautéing many of our vegetables, in fullkitchens resembling those of full-service restaurants. All team members, including our restaurant managers, spend their first several days working solelywith food and learning these techniques, and we spend a significant amount of time ensuring that each team member learns how to prepare and cook ourfood properly.
The majority of our restaurants have exhibition-style kitchens. This design demonstrates our commitment to cooking fresh food in an accessible manner.We provide each customer with individual attention and make every effort to respond to customer suggestions and concerns in a personal and hospitableway.
We require all of our dishes to be cooked to order at food safe temperatures or, in the case of salads, subject to our produce washing protocols, whichhelps to ensure that the food we serve to our customers is safe. We have designed our food safety and quality assurance programs to maintain highstandards for our food and food preparation procedures. Our director of quality assurance oversees comprehensive restaurant and supplier audits basedupon the potential food safety risk of each food. We also consider food safety and quality assurance when selecting our distributors and suppliers. Oursuppliers are inspected by federal, state and local regulators or other reputable, qualified inspection services, which helps ensure their compliance with allfederal food safety and quality guidelines. We regularly inspect our suppliers to ensure that the ingredients we buy conform to our quality standards andthat the prices we pay are competitive. We also rely on our own recipes, specifications and protocols to ensure that our food is consistently the best qualitythat is possible when it is served, including a physical examination of ingredients when they arrive at our restaurants. We train our employees to paydetailed attention to food quality at every stage of the food preparation cycle, and we have developed a daily checklist that our employees use to assessthe freshness and quality of food supplies. Finally, we encourage our customers to provide feedback regarding our food quality so that we can identify andresolve problems or concerns as quickly as possible.
Restaurant Marketing
Our marketing efforts seek to increase sales through a variety of channels and initiatives. Community-based restaurant marketing, as well as online,social and other media tools, highlight our competitive strengths, including our varied and healthy menu offerings and the value we offer our customers.
• Our Menu Offerings. We focus some of our marketing efforts on new menu offerings to broaden our appeal to our customers. We promote theseitems through a variety of formats including public relations events, social media marketing, television appearances, radio promotions, andmessaging to our Noodles Rewards members. In addition to increasing brand awareness, these promotions also encourage prompt consumeraction, resulting in more immediate increases in our customer traffic.
• Online, Social and Other Media Tools. We rely on our website, www.noodles.com, to promote our business and increase brand awareness. Theinformation on or available through our website is not, and should not be considered, a part of this report. Our customers are encouraged to signup to receive communications through our Noodles Rewards program, updating them on new menu offerings and promotional opportunities. As ofDecember 31, 2019, more than 4.1 million of our customers have signed up to receive communication through our rewards and e-club programs.We also communicate with our customers using social media, such as our Facebook and Instagram pages, and our Twitter feed. Our online andsocial media engagement provides exciting opportunities to engage with our customers.
• Digital and Search Advertising. We use targeted digital advertising in many of our markets. We believe this helps to increase top of mindawareness with potential customers and drives both frequency and trial. In addition, digital advertising provides us with the opportunity to promotespecific product platforms and offerings such as online ordering and catering.
• Creating New Meal Occasions. We also focus on ways Noodles & Company can serve customers at different times and in new places. Forexample, our Kids Meal menu was created for the future foodies of the world: children aged ten and under
are invited to design their own meal made fresh-to-order, with quality ingredients, by choosing their entrée, two sides and a drink for around $6.Customers who want to feed a large group can enjoy our catering options comprised of main entrées, sides and desserts. We market theseofferings in a variety of ways, including through in-restaurant posters, email, Noodles Rewards messages, Facebook posts and othercommunications outside of our restaurants.
• Making Noodles & Company Easier to Use. Some of our marketing efforts focus on making our restaurants easier to use. We seek to deliversuperior customer service at every opportunity, generating consumer awareness of menu offerings with in-restaurant communications such asdisplays of our menu offerings that are visible upon entry and tabletop cards that highlight healthy food offerings. We also continue to implementinitiatives to improve convenience for our customers, such as expanding the availability of third-party delivery and introducing dedicated pick-upshelving to increase the speed of the to-go transaction.
Suppliers
Maintaining a high degree of quality in our restaurants depends in part on our ability to acquire fresh ingredients and other necessary supplies that meetour specifications from reliable suppliers. We carefully select suppliers based on quality and their understanding of our brand, and we seek to developmutually beneficial long-term relationships with them. We work closely with our suppliers and use a mix of forward, fixed and formula pricing protocols. Insome cases, we have made efforts to increase the number of suppliers for our ingredients, which we believe can help mitigate pricing volatility. Wemonitor industry news, trade issues, weather, crises and other world events that may affect supply prices. In addition, a substantial volume of our produceitems is grown in Mexico and other countries and any new or increased import duties, tariffs or taxes, or other changes in U.S. trade or tax policy, couldresult in higher food and supply costs.
Seasonality
Seasonal factors and the timing of holidays cause our revenue to fluctuate from quarter to quarter. Our revenue per restaurant is typically lower in the firstand fourth quarters, due to reduced winter and holiday traffic, and higher in the second and third quarters.
Competition
We face competition from the casual dining, quick-service and fast-casual segments of the restaurant industry. These segments are highly competitivewith respect to taste, price, food quality and presentation, service, location and the ambiance and condition of each restaurant, among other things. Ourcompetition includes a variety of locally owned restaurants and national and regional chains who offer dine-in, carry-out and delivery services. Many of ourcompetitors have existed longer and have a more established market presence with substantially greater financial, marketing, personnel and otherresources than we have. Among our competitors are a number of multi-unit, multi-market fast-casual restaurant concepts, some of which are expandingnationally. As we expand, we will face competition from these concepts and new competitors that strive to compete with our market segments.
We also face competition from firms outside the restaurant industry, such as grocery stores and home meal replacement services, who sell preparedmeals for takeout and in some cases, offer delivery service.
Intellectual Property and Trademarks
We own a number of trademarks and service marks registered or pending with the U.S. Patent and Trademark Office (“PTO”). The marks we haveregistered with the PTO include the following: Noodles & Company, the Noodles & Company logo, Your World Kitchen, Noodles & Company WorldKitchen, Noodles World Kitchen, Noodles Rewards and Wisconsin Mac & Cheese. We also have certain trademarks registered or pending in certainforeign countries. In addition, we own the Internet domain name www.noodles.com. The information on, or that can be accessed through, our website isnot part of this report. We believe that our trademarks, service marks and other intellectual property rights have significant value and are important to themarketing of our brand, and it is our policy to protect and defend vigorously our rights to such intellectual property.
Governmental Regulation and Environmental Matters
We are subject to extensive and varied federal, state and local government regulation, including regulations relating to public and occupational health andsafety, sanitation and fire prevention. We operate each of our restaurants in accordance with standards and procedures designed to comply withapplicable codes and regulations. However, an inability to obtain or retain health department
or other licenses could adversely affect our operations. Although we have not experienced, and do not anticipate, any significant difficulties, delays orfailures in obtaining required licenses, permits or approvals, any such problem could delay or prevent the opening of, or adversely impact the viability of, aparticular restaurant or group of restaurants.
In addition, in order to develop and construct restaurants, we need to comply with applicable zoning, land use and environmental regulations. Federal andstate environmental regulations have not had a material effect on our operations to date, but more stringent and varied requirements of local governmentalbodies with respect to zoning, land use and environmental factors could delay or even prevent construction and increase development costs for newrestaurants. We are also required to comply with the accessibility standards mandated by the U.S. Americans with Disabilities Act (“ADA”), whichgenerally prohibits discrimination in accommodation or employment based on disability. We may in the future have to modify restaurants, for example byadding access ramps or redesigning certain architectural fixtures, to provide service to or make reasonable accommodations for disabled persons. Whilethese expenses could be material, our current expectation is that any such actions will not require us to expend substantial funds.
In addition, we are subject to the U.S. Fair Labor Standards Act, the U.S. Immigration Reform and Control Act of 1986, the Occupational Safety and HealthAct and various other federal and state laws governing similar matters including minimum wages, overtime, workplace safety and other workingconditions. Our failure to fully comply with these laws could subject us to potential litigation and liability. We are also subject to various laws andregulations relating to our current and any future franchise operations.
We are also subject to the Patient Protection and Affordable Care Act of 2010 (the “PPACA”), which requires health care coverage for many previouslyuninsured individuals and expands coverage for those already insured. We began offering such benefits in 2015. It is possible that legislation will bepassed by Congress and signed into law that repeals the PPACA, in whole or in part, and/or introduces a new form of health care reform. It is unclear atthis point what the scope of any such legislation will be and when it would become effective. Because of the uncertainty surrounding possible replacementhealth care reform legislation, we cannot predict with any certainty the likely impact of the PPACA’s repeal or the adoption of any other health care reformlegislation on our business, financial condition or results of operations. Whether or not there is alternative health care legislation enacted in the U.S., theremay be significant disruption to the health care market in the coming months and years and the costs of the Company’s health care expenditures mayincrease.
We are subject to federal, state and local environmental laws and regulations concerning waste disposal, pollution, protection of the environment and thepresence, discharge, storage, handling, release and disposal of, or exposure to, hazardous or toxic substances (“environmental laws”). Theseenvironmental laws can provide for significant fines and penalties for non-compliance and liabilities for remediation, sometimes without regard to whetherthe owner or operator of the property knew of, or was responsible for, the release or presence of the hazardous or toxic substances. Third parties mayalso make claims against owners or operators of properties for personal injuries and property damage associated with releases of, or actual or allegedexposure to, such substances. We are not aware of any environmental laws that will materially affect our earnings or competitive position, or result inmaterial capital expenditures relating to our restaurants. However, we cannot predict what environmental laws will be enacted in the future, how existing orfuture environmental laws will be administered, interpreted or enforced, or the amount of future expenditures that we may need to make to comply with, orto satisfy claims relating to, environmental laws. It is possible that we will become subject to environmental liabilities at our properties, and any suchliabilities could materially affect our business, financial condition or results of operations.
Management Information Systems
We use a variety of applications and systems to securely manage the flow of information within each restaurant, and within our central support officeinfrastructure. All of our restaurants use computerized management information systems, which we believe are scalable to support any future growthplans. We use point-of-sale (“POS”) computers designed specifically for the restaurant industry. Our POS system provides a touch screen interface, agraphical order confirmation display and integrated, high-speed credit card and gift card processing. Our online ordering system allows customers to placeorders online or through our mobile app. Orders taken remotely are routed to the point-of-sale system based on the time of customer order pickup. ThePOS system is used to collect daily transaction data, which generates information about daily sales, product mix and average check that we activelyanalyze. All products sold and prices at our company-owned restaurants are programmed into the system from our central support office. We alsocontinue to modernize and make investments in our information technology networks and infrastructure, specifically in our physical and technologicalsecurity measures, to anticipate cyber-attacks and defend against breaches and to provide improved control, security and scalability. Enhancing thesecurity of our financial data, customer information and other personal information is a high priority for us.
Our in-restaurant back office computer system is designed to assist in the management of our restaurants and provide labor and food cost managementtools. These tools provide restaurant operations management and our central support office quick access to detailed business data and reducesrestaurant managers’ administrative time. The system provides our restaurant managers the ability to submit orders electronically with our distributionnetwork. The system also supplies sales, bank deposit and variance data to our accounting department on a daily basis. We use this data to generatedaily sales information and weekly consolidated reports regarding sales and other key measures.
Franchisees use similar point of sale systems and are required to report sales on a daily basis through an online reporting network and submit theirrestaurant-level financial statements on a quarterly and annual basis. We also offer certain restaurant technology support services to our franchisees.
Financial Information About Segments
We operate as a single accounting segment. Financial information related to our business is included in Item 8 of this Annual Report on Form 10-K.
Employees
As of December 31, 2019, we had approximately 8,900 employees, including approximately 500 salaried employees and approximately 8,400 hourlyemployees. None of our employees are unionized or covered by a collective bargaining agreement, and we consider our current employee relations to begood.
Available Information
We maintain a website at www.noodles.com, including an investor relations section at investor.noodles.com, on which we routinely post importantinformation, such as webcasts of quarterly earnings calls, and any related materials. You may access our Annual Reports on Form 10-K, QuarterlyReports on Form 10-Q, Current Reports on Form 8-K, amendments to those reports and other reports relating to us that are filed with or furnished to theSEC, free of charge in the investor relations section of our website as soon as reasonably practicable after such material is electronically filed with orfurnished to the SEC.
The contents of the websites mentioned above are not incorporated into and should not be considered a part of this report. The references to the URLs forthese websites are intended to be inactive textual references only.
ITEM 1A. Risk Factors
Special Note Regarding Forward-Looking Statements
This report contains forward-looking statements within the meaning of the Private Securities Litigation Reform Act of 1995 that involve risks anduncertainties, including but not limited to the risks and uncertainties discussed under this Item 1A. “Risk Factors,” Item 7. “Management’s Discussion andAnalysis of Financial Condition and Results of Operations” and Item 1. “Business.” In some cases, you can identify forward-looking statements by termssuch as “may,” “might,” “will,” “objective,” “intend,” “should,” “could,” “can,” “would,” “expect,” “believe,” “design,” “estimate,” “predict,” “potential,” “plan” orthe negative of these terms and similar expressions intended to identify forward-looking statements. These statements involve known and unknown risks,uncertainties and other factors that may cause our actual results, performance or achievements to be materially different from any future results,performances or achievements expressed or implied by the forward-looking statements. We discuss these risks, uncertainties and other factors in greaterdetail below. These statements reflect our current views with respect to future events and are based on currently available operating, financial andcompetitive information. Unless required by United States federal securities laws, we do not intend to update any of these forward-looking statements toreflect circumstances or events that occur after the statement is made.
Risks Related to Our Business and Industry
We may not achieve our operational, strategic or financial goals.
We continue to pursue a number of financial, operational and strategic goals and we may be unsuccessful in achieving some or all of them. Our strategiesare designed to, among other objectives, improve restaurant operations and increase our restaurant revenue, comparable restaurant sales, net income,restaurant contribution and restaurant contribution margin and adjusted EBITDA. However, these strategies may not be successful in achieving our goalsin part or at all. Further, we may encounter difficulty in executing these strategies. Failing to execute our operational strategies could materially adverselyaffect our business, financial condition or results of operations.
Our strategies include improving our menu offerings, such as through the introduction of Zoodles and Caulifloodles; pursuing off-premise opportunities, forexample through our dedicated pick-up shelving and third-party delivery; improving efficiencies and unit level margins by simplifying operations; enhancingour menu structure and layout; and improving manager selection, training and development of our teams. However, customers may not favor new menuofferings or may not find initiatives aimed at off-premise dining appealing, and our efforts to increase our sales growth and improve our offerings may beunsuccessful. Additionally, our operational initiatives may be ineffective at reducing costs or may reduce the quality of the customer experience. Anyfailure of our new initiatives could materially adversely affect our business, financial condition or results of operations.
Further, we have had, and expect to continue to have, priorities and initiatives in various stages of testing, evaluation and implementation, upon which weexpect to rely to improve our results of operations and financial condition. Failure to achieve successful implementation of our initiatives could materiallyadversely affect our business, financial condition or results of operations.
We believe our culture, from the restaurant level up through management , is an important contributor to our success. As time passes, however, we mayhave difficulty maintaining our culture or adapting it sufficiently to meet the needs of our business. Among other important factors, our culture depends onour ability to attract, retain and motivate employees who share our enthusiasm and dedication to our concept. Our comparable restaurant sales, and morebroadly, our business, financial condition or results of operations, could be materially adversely affected if we do not maintain our infrastructure andculture.
Our strategic and operational goals are designed to improve our results of operations, including restaurant revenue and profitability. The level ofcomparable restaurant sales, which represent the change in year-over-year sales for restaurants open for at least 18 full periods, affects our restaurantrevenue growth and will continue to be a critical factor affecting profitability. Our ability to increase comparable restaurant sales depends in part on ourability to successfully implement our initiatives. It is possible that such initiatives will not be successful, that we will not achieve our target comparablerestaurant sales growth or that the change in comparable restaurant sales could be negative, which may cause a decrease in restaurant revenue andprofitability that could materially adversely affect our business, financial condition or results of operations.
Changes in economic conditions could materially affect our ability to maintain or increase sales at our restaurants.
The restaurant industry depends on consumer discretionary spending. The United States in general or the specific markets in which we operate havesuffered during certain historical periods and in the future may suffer from depressed economic activity, recessionary economic cycles, low consumerconfidence as a result of stock market volatility and other reasons, high levels of unemployment, reduced home values, increases in home foreclosures,investment losses, personal bankruptcies, reduced access to credit or other economic factors that may affect consumers’ discretionary spending. Traffic inour restaurants could decline if consumers choose to dine out less frequently or reduce the amount they spend on meals while dining out. Negativeeconomic conditions (including negative economic conditions resulting from war, terrorist activities, global economic occurrences or trends or other geo-political events might cause consumers to make long-term changes to their discretionary spending behavior, including dining out less frequently or diningat lower priced restaurants on an extended or permanent basis. If comparable restaurant sales decrease, our profitability would decline as we spreadfixed costs across a lower level of restaurant revenue. Reductions in staff levels, additional asset impairment charges and additional restaurant closurescould result from prolonged negative comparable restaurant sales, which could materially adversely affect our business, financial condition or results ofoperations.
An outbreak of disease, epidemic or pandemic, or similar public health threat, such as the coronavirus, could have a material adverse impacton the Company’s business, operating results and financial condition.
An outbreak of disease, epidemic or pandemic, or similar public threat, or fear of such an event, that negatively impacts consumer spending or ourcustomers’ willingness to dine out could have a material adverse impact on the Company’s business, financial condition and operating results. In addition,outbreaks of disease could result in disruptions to capital and financial markets and could have a material adverse impact on our business, financialcondition and operating results.
In December 2019, a novel strain of coronavirus (“COVID-19”) was reported in Wuhan, China. The World Health Organization has declared COVID-19 toconstitute a “Public Health Emergency of International Concern.” On January 30, 2020, the U.S. Department of State issued a Level 4 “do not travel”advisory for China. The U.S. government has also implemented enhanced screenings, quarantine requirements and travel restrictions in connection withthe COVID-19 outbreak. The extent and potential impact of the COVID-19 on the Company’s operational and financial performance will depend on futuredevelopments, including the duration and spread of the outbreak, our customers’ continued willingness to dine out and the impact on capital and financialmarkets, all of which are highly uncertain and cannot be predicted.
Competition from other restaurant companies could adversely affect us.
We face competition from the casual dining, fast-casual and quick-service segments of the restaurant industry. These segments are highly competitivewith respect to taste, price, food quality and presentation, service, location and the ambiance and condition of each restaurant, among other things. Ourcompetition includes a variety of locally owned restaurants and national and regional chains who offer dine-in, carry-out and delivery services. Many of ourcompetitors have existed longer and have a more established market presence with substantially greater financial, marketing, personnel and otherresources than we have. Among our competitors are a number of multi-unit, multi-market fast-casual restaurant concepts, some of which are expandingnationally. We continually face competition from these concepts and new competitors that strive to compete with our market segments. For example,additional competitive pressures come from the deli sections and in-store cafés of grocery store chains, as well as from convenience stores and onlinemeal preparation sites. These competitors may have, among other things, lower operating costs, food offerings more responsive to consumerpreferences, better locations and facilities, more experienced management, more effective marketing and more efficient operations.
Several of our competitors compete by offering menu items that are specifically identified as low in carbohydrates, gluten-free, or rich in protein. Inaddition, many of our competitors emphasize lower-cost value options or meal packages, or strategies we do not
currently pursue. Any of these competitive factors may materially adversely affect our business, financial condition or results of operations.
Our marketing programs may not be successful.
We incur costs and expend other resources in our marketing efforts to attract and retain customers. These initiatives may not be successful, resulting inexpenses incurred without the benefit of higher revenues. Additionally, many of our competitors have more marketing resources and we may not be ableto successfully compete. If our competitors increase spending on marketing, or if our marketing funds decrease for any reason, or if our advertising andpromotions are less effective than those of our competitors, our financial performance could be materially affected.
Many of our competitors are devoting increased resources to their social media marketing programs. Social media can be challenging because it reachesa broad audience with an ability to respond or react, in near real time. In addition, social media can facilitate the improper disclosure of proprietaryinformation, personally identifiable information, or inaccurate information. As a result, if we do not appropriately manage our social media strategies, ourmarketing efforts in this area may not be successful and could damage our reputation, negatively impacting our restaurant sales and financialperformance.
Our inability or failure to recognize, respond to and effectively manage the accelerated impact of social media could have an adverse effect onour business.
There has been a widespread and dramatic increase in the use of social media platforms that allow users to access a broad audience of consumers andother interested persons. The availability of information on social media can be virtually immediate, as can its impact, and users of many social mediaplatforms can post information without filters or checks on the accuracy of the content posted. Adverse information concerning our restaurants or brand,including user reviews, whether accurate or inaccurate, may be posted on such platforms at any time and can quickly reach a wide audience. Theresulting harm to our reputation may be immediate, without affording us an opportunity to correct or otherwise respond to the information, and it ischallenging to monitor and anticipate developments on social media in order to respond in an effective and timely manner.
In addition, although search engine marketing, social media and other new technological platforms offer great opportunities to increase awareness of andengagement with our restaurants and brand, our failure to use social media effectively in our marketing efforts may further expose us to the risksassociated with the accelerated impact of social media. Many of our competitors are expanding their use of social media and the social media landscapeis rapidly evolving, potentially making more traditional social media platforms obsolete. As a result, we need to continuously innovate and develop oursocial media strategies in order to maintain broad appeal with guests and brand relevance, and we may not do so effectively. A variety of additional risksassociated with our use of social media include the possibility of improper disclosure of proprietary information, exposure of personally identifiableinformation of our employees or guests, fraud, or the publication of out-of-date information, any of which may result in material liabilities or reputationaldamage. Furthermore, any inappropriate use of social media platforms by our employees could also result in negative publicity that could materiallydamage our reputation or lead to litigation that materially increases our costs.
New technologies or changes in consumer behavior facilitated by these technologies could negatively affect our business.
Advances in technologies or certain changes in consumer behavior driven by such technologies could impact the manner in which meals are marketed,prepared, ordered and delivered. We may pursue certain of those technologies, but consumers may not accept them, or we may fail to successfullyintegrate them into our operations, thereby harming our financial performance. In addition, our competitors, some of whom have more resources than us,may be more effective at responding to such advances in technologies and erode our competitive position.
Negative publicity relating to one or more of our restaurants, including our franchised restaurants, could reduce sales at some or all of ourother restaurants.
Our success is dependent in part upon our ability to maintain and enhance the value of our brand, consumers’ connection to our brand and positiverelationships with our franchisees. We may be faced with negative publicity relating to food quality, restaurant facilities, customer complaints or litigationalleging illness or injury, health inspection scores, integrity of our or our suppliers’ food processing, employee relationships or other matters, regardless ofwhether the allegations are valid or whether we are held to be responsible. The negative impact of adverse publicity relating to one restaurant may extendfar beyond the restaurant or franchise involved to affect some or all of our other restaurants. The risk of negative publicity is particularly great with respectto our franchised restaurants
because we are limited in the manner in which we can regulate them, especially on a real-time basis. Negative publicity generated by such incidents maybe amplified by the use of social media. A similar risk exists with respect to unrelated food service businesses, if consumers associate those businesseswith our own operations or are concerned with the food safety of the broader restaurant industry.
Additionally, employee claims against us based on, among other things, wage and hour violations, discrimination, harassment or wrongful termination mayalso create negative publicity that could materially adversely affect us and divert our financial and management resources that would otherwise be used tobenefit the future performance of our operations. A significant increase in the number of these claims or an increase in the number or scope of successfulclaims could materially adversely affect our business, financial condition or results of operations. Consumer demand for our products and our brand’svalue could diminish significantly if any such incidents or other matters create negative publicity or otherwise erode consumer confidence in us or ourproducts, or in the restaurant industry as a whole, which would likely result in lower sales and could materially adversely affect our business, financialcondition or results of operations.
Food safety and foodborne illness concerns could have an adverse effect on our business.
We cannot guarantee that our internal controls and training will be fully effective in preventing all food safety issues at our restaurants, including anyoccurrences of foodborne illnesses such as E. coli, Hepatitis A, listeria, norovirus and salmonella. The risk of illnesses associated with our food might alsoincrease in connection with the expansion of our catering and delivery businesses or other situations in which our food is served or delivered in conditionsthat we cannot control. Furthermore, we and our franchisees rely on third-party vendors throughout our supply chain, making it difficult to monitor foodsafety compliance and increasing the risk that foodborne illness would affect multiple locations rather than a single restaurant. Some foodborne illnessincidents could be caused by third-party vendors and transporters outside of our control. New illnesses resistant to our current precautions may develop inthe future, or diseases with long incubation periods could arise, that could give rise to claims or allegations on a retroactive basis. One or more instancesof foodborne illness in any of our restaurants or markets or related to food products we sell could negatively affect our restaurant sales nationwide if highlypublicized on national media outlets or through social media. This risk exists even if it were later determined that the illness was wrongly attributed to usor one of our restaurants.
A number of other restaurant chains have experienced incidents related to foodborne illnesses that have had a material adverse effect on their operations,including E. coli, listeria and norovirus outbreaks at other fast-casual concepts. These incidents at other restaurants could cause some customers to havea negative perception of fast-casual concepts generally, which can negatively affect our restaurants. The occurrence of a similar incident at one or more ofour restaurants, or negative publicity or public speculation about an incident, could materially adversely affect our business, financial condition or results ofoperations.
Adverse weather conditions could affect our sales.
Adverse weather conditions, such as regional winter storms, floods and hurricanes, could affect our sales at restaurants in locations that experience theseweather conditions, which could materially adversely affect our business, financial condition or results of operations. It is possible that weather conditionsmay impact our business more than other businesses in our industry because of the significant concentration of our restaurants in the Upper Midwest,Rocky Mountain and Mid-Atlantic states.
Our business could be adversely affected by difficulties in hiring and retaining top-performing employees.
Our success depends on the efforts of our employees and our ability to hire, motivate and retain qualified employees. There may be a small supply ofqualified individuals in some of the communities in which we operate, and competition in these communities for qualified individuals could require us topay higher wages and provide greater benefits. We devote significant resources to training our employees and strive to reduce turnover in order to keeptop performing employees and better realize our investment in training new employees. However, turnover among our restaurant employees may increase.Failure to hire and retain top-performing employees could impact our financial performance by increasing our training and labor costs and reducing thequality of our customers’ experiences.
We rely heavily on information technology, and any material failure, weakness, interruption or breach of security could prevent us fromeffectively operating our business.
We rely heavily on information systems, including point-of-sale processing in our restaurants, for management of our supply chain, payment of obligations,collection of cash, credit and debit card transactions and other processes and procedures. We also rely on third-party vendors to provide informationtechnology systems and to securely process and store related information, especially as it relates to credit and debit card transactions and online ordering.Our franchisees also rely on information systems and third-party vendors. Our ability to efficiently and effectively manage our business dependssignificantly on the reliability and capacity of these systems. Our operations depend upon our and our franchisees’, and our vendors’, ability to protectcomputer equipment and systems against damage from physical theft, fire, power loss, telecommunications failure or other catastrophic events, as well asfrom internal and external security breaches, viruses and other disruptive problems. Avoiding such incidents in the future will require us and ourfranchisees and vendors to continue to enhance information systems, procedures and controls and to hire, train and retain employees. The failure of thesesystems to operate effectively, maintenance problems, upgrading or transitioning to new platforms, or a breach in security of these systems could result indelays in customer service and reduce efficiency in our operations. Remediation of such problems could result in significant, unplanned capitalinvestments and harm our business, financial condition or results of operations.
We may be harmed by breaches of security of information technology systems or our confidential consumer, employee, financial, or otherproprietary data.
We use many information technology systems throughout our operations, including systems that record and process customer sales, manage humanresources and generate accounting and financial reports. For example, our restaurants use computerized management information systems, includingpoint-of-sale computers that process customer credit card, debit card and gift card payments, and in-restaurant back office computer systems designed toassist in the management of our restaurants and provide labor and food cost management tools. Our franchisees use similar point of sale systems and arerequired to report business and operational data through an online reporting network. Through these systems, we have access to and store a variety ofconsumer, employee, financial and other types of information related to our business. We also rely on third-party vendors to provide informationtechnology systems and to securely process and store related information. Our franchisees also use information technology systems and rely on third-party vendors. If our technology systems, or those of third-party vendors we or our franchisees rely upon, are compromised as a result of a cyber-attack(including from circumvention of security systems, denial-of-service attacks, hacking, “phishing” attacks, computer viruses, ransomware, malware, orsocial engineering) or other external or internal methods, it could materially adversely affect our reputation, business, financial condition or results ofoperations.
The cyber risks we face range from cyber-attacks common to most industries to attacks that target us due to the confidential consumer information weobtain through our electronic processing of credit and debit card transactions. Like others in our industry, we have experienced many attempts tocompromise our information technology and data, and we may experience more attempts in the future. For example, in 2016, we experienced a malwareattack that compromised the security of the payment information of some customers who used debit or credit cards at certain locations between January31, 2016 and June 2, 2016. We subsequently made payments of approximately $11 million to certain payment card companies for card issuer losses, cardreplacement costs and other charges issued by payment card companies, and incurred additional fees and costs associated with the malware attack,including legal fees, investigative fees, other professional fees, costs of communications with customers and capital investments for remediation activities.In addition to property and casualty insurance, which may cover restoration of data, certain physical damage or third-party injuries, we have cybersecurityinsurance related to a breach event. However, damage and claims arising from such incidents may not be covered or may exceed the amount of anyavailable insurance.
Because cyber-attacks take many forms, change frequently, are becoming increasingly sophisticated, and may be difficult to detect for significant periodsof time, we may not be able to respond adequately or timely to future cyber-attacks. If we or our franchisees, or third-party vendors, were to experience amaterial breach resulting in the unauthorized access, use, or destruction of our information technology systems or confidential consumer, employee,financial, or other proprietary data, it could negatively impact our reputation, reduce our ability to attract and retain customers and employees and disruptthe implementation and execution of our strategic goals. Moreover, such breaches could result in a violation of various privacy-related laws and subject usto investigations or private litigation, which, in turn, could expose us to civil or criminal liability, fines and penalties imposed by state and federal regulators,claims for purportedly fraudulent transactions arising out of the actual or alleged theft of credit or debit card information, compromised security andinformation systems, failure of our employees to comply with applicable laws, the unauthorized acquisition or use of such information by third parties, orother similar claims, and various costs associated with such matters.
We may be unable to negotiate favorable borrowing terms, and any additional capital we may require could be senior to existing equityholders, dilute existing equity holders or include unfavorable restrictions.As a general matter, operating and developing our business requires significant capital. Our credit agreement ends in 2024 and securing access to crediton reasonable terms thereafter will require us to extend or refinance such agreement. In addition, in order to pursue our business and operationalstrategies, we may need additional sources of liquidity in the future and it may be difficult or impossible at such time to increase our liquidity. Our lendersmay not agree to amend our credit agreement at such time to increase our borrowing capacity. Further, our requirements for additional liquidity maycoincide with periods during which we are not in compliance with covenants under our credit agreement and our lenders may not agree to further amendour credit agreement to accommodate such non-compliance. Even if we are able to access additional liquidity, agreements governing any borrowingarrangement could contain covenants restricting our operations. If we raise additional funds through future issuances of equity or convertible debtsecurities, our existing stockholders could suffer significant dilution, and any new equity securities we issue could have rights, preferences and privilegessuperior to those of holders of our common stock. Any debt financing we secure in the future could involve restrictive covenants relating to our capital-raising activities and other financial and operational matters, which might make it more difficult for us to obtain additional capital and to pursue businessopportunities. Moreover, if we issue new debt securities, the debt holders would have rights senior to common stockholders to make claims on our assets.In addition, variable-rate borrowings under our credit agreement typically use LIBOR as a benchmark for establishing the rate of interest. LIBOR is thesubject of recent national and international regulatory scrutiny which may result in changes that cause LIBOR to disappear entirely after 2021 or to cause itto perform differently than in the past. The consequences of these LIBOR developments on our variable-rate borrowings, including the possible transitionto other rates such as the Secured Overnight Financing Rate (SOFR), cannot be predicted at this time, but could include an increase in the cost of ourvariable-rate borrowings and volatility in our earnings.
Governmental regulation may adversely affect our ability to open new restaurants or otherwise adversely affect our business, financialcondition or results of operations.
We are subject to various federal, state and local regulations, including those relating to building and zoning requirements and those relating to thepreparation and sale of food. Our restaurants are also subject to state and local licensing and regulation by health, sanitation, food and occupational safetyand other agencies. We may experience material difficulties or failures in obtaining the necessary licenses, approvals or permits for our restaurants, whichcould delay planned restaurant openings or affect the operations at our existing restaurants. In addition, stringent and varied requirements of localregulators with respect to zoning, land use and environmental factors could delay or prevent development of new restaurants in particular locations.
We are subject to the ADA and similar state laws that give civil rights protections to individuals with disabilities in the context of employment, publicaccommodations and other areas, including our restaurants. We may in the future have to modify restaurants, for example, by adding access ramps orredesigning certain architectural fixtures, to provide service to or make reasonable accommodations for disabled persons. The expenses associated withthese modifications could be material.
Our operations are also subject to the U.S. Occupational Safety and Health Act, which governs worker health and safety, the U.S. Fair Labor StandardsAct, which governs such matters as minimum wages and overtime and a variety of similar federal, state and local laws that govern these and otheremployment law matters. In addition, federal, state and local proposals have been made related to paid sick leave and similar matters. Changes in theselaws or implementation of new proposals could materially adversely affect our business, financial condition or results of operations.
We rely heavily on certain vendors, suppliers and distributors, which could adversely affect our business.
Our ability to maintain consistent price, quality and safety throughout our restaurants depends in part upon our ability to acquire specified food productsand supplies in sufficient quantities from third-party vendors, suppliers and distributors at a reasonable cost. We do not control the businesses of ourvendors, suppliers and distributors and our efforts to specify and monitor the standards under which they perform may not be successful. Furthermore,certain food items are perishable, and we have limited control over whether these items will be delivered to us in appropriate condition for use in ourrestaurants. If any of our distributors or suppliers performs inadequately, or our distribution or supply relationships are disrupted for any reason, ourbusiness, financial condition, results of operations or cash flows could be materially adversely affected. If we cannot replace or engage distributors orsuppliers who meet our specifications in a short period of time, including any suppliers who are a sole source of supply of a particular ingredient, that couldincrease our expenses and cause shortages of food and other items at our restaurants, which could cause a restaurant to remove items from its menu. Ifthat were to happen, affected restaurants could experience significant reductions in sales during the shortage or thereafter, especially if customerschange their dining habits as a result. Our focus on a limited menu would make the consequences of a shortage of a key ingredient more severe. Inaddition, because we provide moderately priced food, we may choose not to, or
may be unable to, pass along commodity price increases to consumers. These potential changes in food and supply costs could materially adverselyaffect our business, financial condition or results of operations.
In addition, we use various third-party vendors to provide, support and maintain most of our management information systems. We also outsource certainaccounting, payroll and human resource functions to business process service providers. The failure of such vendors to fulfill their obligations coulddisrupt our operations. Additionally, any changes we may make to the services we obtain from our vendors, or new vendors we employ, may disrupt ouroperations. These disruptions could materially adversely affect our business, financial condition or results of operations.
We also partner with various third-party vendors to deliver our food. If any of our delivery vendors perform inadequately, or our delivery relationships aredisrupted for any reason, our business, financial condition or results of operations could be materially adversely affected.
Our ability to continue to expand our digital business, delivery orders and catering is uncertain, and these new business lines are subject torisks.
Our revenue from digital orders has increased significantly from prior years. This growth rate may not be sustainable, and if our digital business does notcontinue to expand it may be difficult for us to achieve our planned sales growth. We have also increased our efforts to promote delivery orders, whichhave also grown considerably. We rely on third-party providers to fulfill delivery orders, and the ordering and payment platforms used by these thirdparties, or our mobile app or online ordering system, could be damaged or interrupted by technological failures, user errors, cyber-attacks or other factors,which may materially adversely impact our sales through these channels and could negatively impact our brand. Additionally, our delivery partners areresponsible for order fulfillment and may make errors or fail to make timely deliveries, leading to customer disappointment that may negatively impact ourbrand. We also incur additional costs associated with using third-party service providers to fulfill these digital orders and the costs of delivering may havea material adverse impact on restaurant level margins. Moreover, the third-party restaurant delivery business is intensely competitive, with a number ofplayers competing for market share, online traffic, capital, and delivery drivers and other people resources. The third-party delivery services with which wework may struggle to compete effectively, and if they were to cease or curtail operations or fail to provide timely delivery services in a cost-effectivemanner, or if they give greater priority on their platforms to our competitors, our delivery business may be negatively impacted. We have also introducedcatering offerings on both a pick-up and delivery basis, and customers may choose our competitors’ catering offerings over ours, be disappointed withtheir experience with our catering, or experience food safety problems if they do not serve our food in a safe manner, which may negatively impact us.Such delivery and catering offerings also increase the risk of illnesses associated with our food because the food is transported and/or served by thirdparties in conditions we cannot control.
Because all of these offerings are relatively new, it is difficult for us to anticipate the level of sales they may generate. That may result in operationalchallenges, both in fulfilling orders made through these channels and in operating our restaurants as we balance fulfillment of these orders with service ofour traditional in-restaurant guests as well. Any such operational challenges may negatively impact the customer experience associated with our digital,delivery or catering orders, the guest experience for our traditional in-restaurant business, or both. These factors may materially adversely impact oursales and our brand reputation.
Changes in food and supply costs could adversely affect our results of operations.
Our profitability depends in part on our ability to anticipate and react to changes in food and supply costs. Shortages or interruptions in the availability ofcertain supplies caused by seasonal fluctuations, unanticipated demand, problems in production or distribution, food contamination, product recalls,government regulations, inclement weather or other conditions could materially adversely affect the availability, quality and cost of our ingredients, whichcould harm our operations. Weather related issues, such as freezes, heavy rains or drought, may also lead to temporary spikes in the prices of someingredients such as produce or meats. Increasing weather volatility or other long-term changes in global weather patterns, including any changesassociated with global climate change, could have a significant impact on the price, availability and timing of delivery of some of our ingredients. Inaddition, at certain times of the year a substantial volume of our produce items is imported from Mexico and other countries. Any new or increased importduties, tariffs or taxes, or other changes in U.S. trade or tax policy, could result in higher food and supply costs. Any increase in the prices of the foodproducts most critical to our menu, such as pasta, beef, chicken, wheat flour, cheese and other dairy products, tofu and vegetables, could materiallyadversely affect our operating results. Although we try to manage the impact that these fluctuations have on our operating results, we remain susceptibleto increases in food costs as a result of factors beyond our control, such as general economic conditions, seasonal fluctuations, weather conditions,demand, food safety concerns, generalized infectious diseases, product recalls and government regulations.
Changes in employment laws may adversely affect our business.
Various federal and state labor laws govern the relationship with our employees and affect operating costs. These laws include employee classification asexempt/non-exempt for overtime and other purposes, minimum wage requirements, unemployment tax rates, workers’ compensation rates, mandatoryhealth benefits, immigration status and other wage and benefit requirements. Some jurisdictions, including some of those in which we operate, haverecently increased their minimum wage by a significant amount, and other jurisdictions are considering similar actions, which may increase our labor costs.Significant additional government-imposed increases in the following areas could materially affect our business, financial condition, operating results orcash flow: overtime rules; mandatory health benefits; vacation accruals; paid leaves of absence, including paid sick leave; and tax reporting.
Immigration laws have recently been an area of considerable focus by the Department of Homeland Security, with enforcement operations taking placeacross the country, resulting in arrests, detentions and deportation of unauthorized workers. Some of these changes and enforcement programs mayincrease our obligations for compliance and oversight, which could subject us to additional costs and make our hiring process more cumbersome orreduce the availability of potential employees. Although we require all workers to provide us with government-specified documentation evidencing theiremployment eligibility, some of our employees may, without our knowledge, be unauthorized workers. Unauthorized workers are subject to deportationand may subject us to fines or penalties, and if any of our workers are found to be unauthorized we could experience adverse publicity that negativelyimpacts our brand and may make it more difficult to hire and keep qualified employees. Termination of a significant number of employees who wereunauthorized employees may disrupt our operations, cause temporary increases in our labor costs as we train new employees and result in additionaladverse publicity. We could also become subject to fines, penalties and other costs related to claims that we did not fully comply with all recordkeepingobligations of federal and state immigration compliance laws. These factors could materially adversely affect our business, financial condition or results ofoperations.
If we or our franchisees face labor shortages or increased labor costs, our operating results could be adversely affected.
Labor is a primary component in the cost of operating our restaurants. If we or our franchisees face labor shortages or increased labor costs because ofincreased competition for employees, higher employee turnover rates, increases in the federal, state or local minimum wage or other employee benefitscosts (including costs associated with health insurance coverage), our operating expenses could increase. In addition, our success depends in part uponour and our franchisees’ ability to attract, motivate and retain a sufficient number of well-qualified restaurant operators and management personnel, as wellas a sufficient number of other qualified employees, including customer service and kitchen staff. Qualified individuals needed to fill these positions are inshort supply in some geographic areas, and the national unemployment rate, as well as the unemployment rates in many of the areas in which weoperate, has continued to fall over the past few years. In addition, restaurants have traditionally experienced relatively high employee turnover rates. Ourand our franchisees’ ability to recruit and retain qualified individuals may delay the planned openings of new restaurants or result in higher employeeturnover in existing restaurants, which could have a material adverse effect on our business, financial condition or results of operations.
If we or our franchisees are unable to continue to recruit and retain sufficiently qualified individuals at wages comparable to those we currently pay, ourbusiness could be materially adversely affected. Competition for these employees could require us or our franchisees to pay higher wages, which couldresult in higher labor costs. In addition, increases in the minimum wage, which have become more common and more material in size in recent years,would increase our labor costs. Additionally, costs associated with workers’ compensation are rising, and these costs may continue to rise in the future.We may be unable to increase our menu prices in order to pass these increased labor costs on to consumers, in which case our margins would benegatively affected, which could materially adversely affect our business, financial condition or results of operations.
We depend on the services of key executives, the loss of which could materially harm our business.
We rely on executives and senior management to drive the financial and operational performance of our business. Turnover of executives and seniormanagement could materially adversely impact our business, our results of operations and may make recruiting for future management positions moredifficult or may require us to offer more generous executive compensation packages to attract top executives. In recent years, we have experienced bothexecutive and senior management turnover. Changes in other key management positions may temporarily affect our financial performance and results ofoperations as new management becomes familiar with our business. Our future success depends on our ability to identify, attract and retain qualifiedpersonnel on a timely basis. In addition, we must successfully integrate newly hired management personnel within our organization in order to achieve ouroperating objectives.
The effect of changes to healthcare laws in the United States may increase the number of employees who elect to participate in our healthcareplans, which may increase our healthcare costs and further changes, or the repeal of existing healthcare laws may further significantlyincrease our healthcare costs and negatively impact our financial results in future periods.
The Patient Protection and Affordable Care Act of 2010 (the “PPACA”) requires health care coverage for many previously uninsured individuals andexpands coverage for those already insured. We began offering such benefits in July 2015, and as a consequence we are incurring additional expensesfor employee healthcare. If we fail to continue to offer such benefits, or the benefits we elect to offer do not meet the applicable requirements, we mayincur penalties. It is also possible that by making changes or failing to make changes in the healthcare plans we offer, we will become less competitive inthe market for our labor. Finally, continuing to implement the requirements of the PPACA is likely to impose additional administrative costs. The futurecosts and other effects of these new healthcare requirements cannot be determined with certainty, but they may continue to significantly increase ourhealthcare coverage costs and could materially adversely affect our, business, financial condition or results of operations.
In addition to changes to the PPACA that have been implemented recently, it is possible that additional legislation will be passed by Congress and signedinto law that further repeals the PPACA, in whole or in part, and/or introduces a new form of health care reform. It is unclear at this point what the scope ofsuch legislation would be and when it would become effective. Because of the uncertainty surrounding possible replacement health care reformlegislation, we cannot predict with any certainty the likely impact of the PPACA’s repeal or the adoption of any other health care reform legislation on ourbusiness, financial condition or results of operations. Whether or not there is alternative health care legislation enacted in the U.S., there is likely to besignificant disruption to the health care market in the coming months and years and the costs of the Company’s health care expenditures may increase.
We may not be successful in executing our franchise strategy.
It is possible that we will seek to sell restaurants within certain markets to new or existing franchisees. In connection with a sale to new or existingfranchisees of restaurants in existing markets, we may enter into agreements that also provide for the development of new restaurants by suchfranchisees. We may be unable to identify franchisees willing to partner with us with respect to existing restaurants we elect to sell or new restaurants.Becoming a franchisee entails economic risks and uncertainties and the perceived risks and uncertainties may not, in the view of potential franchisees,outweigh the anticipated benefits. Our inability to identify franchisees, or to sell units to existing or new franchisees, could materially adversely affect ourfranchising strategy, which could materially adversely affect our business, financial condition or results of operations.
In addition, to the extent we are able to identify franchisees for the franchising of existing restaurants or the development of new restaurants, our successis dependent on the performance of our franchisees in successfully operating the restaurants. Our franchisees may not achieve financial and operationalobjectives, and they may close existing restaurants due to underperformance or they may ultimately be unsuccessful in developing new restaurants. Wemay also not be able to manage our franchise system effectively. Failure to provide our franchisees with adequate support and resources could materiallyadversely affect these franchisees, as well as cause disputes between us and them and potentially lead to material liabilities.
We rely in part on our franchisees, and if our franchisees cannot develop or finance new restaurants, build them on suitable sites or openthem on schedule, our success may be affected.
We rely in part on our franchisees and the manner in which they operate their locations to develop and promote our business. Although we havedeveloped criteria to evaluate and screen prospective franchisees, we cannot be certain that our franchisees will have the business acumen or financialresources necessary to operate successful franchises in their franchise areas and state franchise laws may limit our ability to terminate or modify thesefranchise arrangements. Moreover, despite our training, support and monitoring, franchisees may not successfully operate restaurants in a mannerconsistent with our standards and requirements or may not hire and train qualified managers and other restaurant personnel. The failure of our franchiseesto operate their franchises successfully could have a material adverse effect on us, our reputation, our brand and our ability to attract prospectivefranchisees and could materially adversely affect our business, financial condition or results of operations.
Franchisees may not have access to the financial or management resources that they need to open the restaurants contemplated by their agreementswith us or be able to find suitable sites on which to develop them, or they may elect to cease development for other reasons. Franchisees may not be ableto negotiate acceptable lease or purchase terms for the sites, obtain the necessary permits and government approvals or meet construction schedules.Any of these problems could reduce our franchise revenues. Additionally, our franchisees typically depend on financing from banks and other financialinstitutions, which may not always be available to them,
in order to construct and open new restaurants. The lack of adequate financing could materially adversely affect the number and rate of new restaurantopenings by our franchisees and could materially adversely affect our future franchise revenues.
Failure to support our franchise system could have a material adverse effect on our business, financial condition or results of operations.
Our strategy depends in part on our franchise network, which requires enhanced business support systems, management information systems, financialcontrols and other systems and procedures as well as additional management, franchise support and financial resources. We may not be able to manageour franchise system effectively. Failure to provide our franchisees with adequate support and resources could materially adversely affect both our newand existing franchisees as well as cause disputes between us and our franchisees and potentially lead to material liabilities. Any of the foregoing couldmaterially adversely affect our business, financial condition or results of operations.
The provision of information technology support services to our franchisees may expose us to certain risks.
In 2018 we began to offer certain information technology (“IT”) support services to our franchisees. We may incur costs or expenses in providing theseservices that exceed the fee income we receive for such services. In addition, the allocation of our IT resources to providing such services may materiallyadversely affect the provision of such services to our company-owned restaurants. The provision of such services may also expose us to claims fromfranchisees or third parties, or to litigation or regulatory matters, which may not be completely covered, or covered at all, by our insurance.
Unionization activities or labor disputes may disrupt our operations and affect our profitability.
Although none of our employees are currently covered under collective bargaining agreements, our employees may elect to be represented by laborunions in the future. If a significant number of our employees were to become unionized and collective bargaining agreement terms were significantlydifferent from our current compensation arrangements, it could materially adversely affect our business, financial condition or results of operations. Inaddition, a labor dispute involving some or all of our employees may harm our reputation, disrupt our operations and reduce our revenues and resolution ofdisputes may increase our costs. Potential changes in labor laws, including the possible passage of legislation designed to make it easier for employees tounionize, or increases in politically-inspired labor activism, could increase the likelihood of some or all of our employees being subjected to greaterorganized labor influence, and could have a material adverse effect on our business and financial results by imposing requirements that could potentiallyincrease our costs, reduce our flexibility and impact our employee culture.
As an employer, we may be subject to various employment-related claims, such as individual, class action or government enforcement actions relating toalleged employment discrimination, employee classification and related withholding, wage-hour, labor standards or healthcare and benefit issues. Suchactions, if brought against us and successful in whole or in part, may affect our ability to compete or could materially adversely affect our business,financial condition or results of operations.
Changes to estimates related to our property, fixtures and equipment or operating results that are lower than our current estimates at certainrestaurant locations may cause us to incur impairment charges on certain long-lived assets, which may materially adversely affect our resultsof operations.
In accordance with accounting guidance as it relates to the impairment of long-lived assets, we make certain estimates and projections with regard toindividual restaurant operations, as well as our overall performance, in connection with our impairment analyses for long-lived assets. When impairmenttriggers are deemed to exist for any location, the estimated undiscounted future cash flows are compared to its carrying value. If the carrying valueexceeds the undiscounted cash flows, an impairment charge equal to the difference between the carrying value and the fair value is recorded. Theprojections of future cash flows used in these analyses require the use of judgment and a number of estimates and projections of future operating results.If actual results differ from our estimates, additional charges for asset impairments may be required in the future. Over the past several years we haverecognized significant impairment charges and if future impairment charges continue to be significant, this could have a material adverse effect on ourbusiness, financial condition or results of operations.
We are subject to risks associated with long-term non-cancellable leases and the costs of exiting leases at restaurants we have closed or mayclose in the future may be greater than we estimate or could be greater than the funds we raise to address closure costs.
We do not own any real property. Payments under our operating leases account for a significant portion of our operating expenses and we expect the newrestaurants we open in the future will similarly be leased. Our leases generally have an initial term of ten years and generally can be extended only in five-year increments (at increased rates). All of our leases require a fixed annual rent, although some require the payment of additional rent if restaurant salesexceed a negotiated amount. Generally, our leases are “net” leases, which require us to pay all of the cost of insurance, taxes, maintenance and utilities.We generally cannot cancel these leases. Additional sites that we lease are likely to be subject to similar long-term non-cancelable leases. In connectionwith closing restaurants, we may nonetheless be committed to perform our obligations under the applicable lease including, among other things, payingthe base rent for the balance of the lease term. In addition, as each of our leases expires, we may fail to negotiate renewals, either on commerciallyacceptable terms or at all, which could cause us to pay increased occupancy costs or to close restaurants in desirable locations.
Opening and operating new restaurants entails numerous risks and uncertainties.
One element of our operational strategy is the opening of new restaurants and operating those restaurants on a profitable basis. In 2019, we opened fourcompany-owned restaurants, refranchised five restaurants and closed five company-owned restaurants. Our franchisees opened one restaurant, andclosed two restaurants. We expect to open between eight and eleven company-wide restaurants in 2020 with such openings primarily taking place in well-established existing markets.
Opening new restaurants presents numerous risks and uncertainties. We may not be able to open new restaurants as quickly as planned. In the past, wehave experienced delays in opening some restaurants and that could happen again. Delays or failures in opening new restaurants could materiallyadversely affect our business strategy and our expected results.
Our ability to open new restaurants also depends on other factors, including: site selection; negotiating leases with acceptable terms; identifying, hiring andtraining qualified employees; the state of the labor market in each local market; timely delivery of leased premises to use; managing construction anddevelopment costs; avoiding the impact of inclement weather, natural disasters and other calamities; obtaining construction materials and labor atacceptable costs; securing required governmental approvals, permits and licenses; and accessing sufficient capital.
Our new restaurants may be smaller in terms of square footage and seating than our current restaurants, in accordance with our increased focus on off-premise dining opportunities. Customers may react negatively to these re-designed, smaller stores, which could materially adversely affect our business,financial condition or results of operations.
Our long-term success is partially dependent on our ability to effectively identify appropriate target markets and secure appropriate sites fornew restaurants.
In order to build new restaurants, we must first identify target markets where we can expand our footprint, taking into account numerous factors, includingthe location of our current restaurants, local economic trends, population density, area demographics and geography. The selection of target markets forexpansion is challenging. We also must locate and secure appropriate sites for new restaurants, which is one of our biggest challenges. There arenumerous factors involved in identifying and securing an appropriate site, including, among others: identification and availability of locations; competition;financial conditions affecting developers and potential landlords; developers and potential landlords obtaining licenses or permits for development projectson a timely basis; proximity of potential development sites to an existing location; anticipated development near our new restaurants; and availability ofacceptable lease arrangements. If we are unable to fully implement our development plan, our business, financial condition or results of operations couldbe materially adversely affected.
New restaurants, once opened, may not be profitable.
New restaurants may not be profitable, and their sales performance may not follow historical patterns. In addition, our average restaurant sales andcomparable restaurant sales may underperform our expectations. Our ability to operate new restaurants profitably and increase average restaurant salesand comparable restaurant sales will depend on many factors, some of which are beyond our control, including: consumer awareness, understanding andsupport of our brand; general economic conditions, local labor costs and
prices we pay for the food products and other supplies we use; changes in consumer preferences; competition; temporary and permanent sitecharacteristics of new restaurants; and changes in government regulation.
If our new restaurants do not perform as planned, our business and future prospects could be harmed. In addition, if we are unable to achieve ourexpected average restaurant sales, our business, financial condition or results of operations could be materially adversely affected.
Opening new restaurants in existing markets may negatively affect sales at our existing restaurants.
The consumer target area of our restaurants varies by location, depending on a number of factors, including population density, other local retail andbusiness attractions, area demographics and geography. As a result, opening a new restaurant in or near markets in which we already have restaurantscould materially adversely affect the sales of these existing restaurants. Existing restaurants could also make it more difficult to build our consumer basefor a new restaurant in the same market. Our core business strategy does not entail opening new restaurants that we believe will materially affect sales atour existing restaurants, but we may selectively open new restaurants in and around areas of existing restaurants that are operating at or near capacity toeffectively serve our customers. Sales cannibalization between our restaurants may become significant in the future as we continue to expand ouroperations and could affect our sales growth, which could, in turn, materially adversely affect our business, financial condition or results of operations.
New information or attitudes regarding diet and health could result in changes in regulations and consumer consumption habits that couldadversely affect our results of operations.
Regulations and consumer eating habits may change as a result of new information or attitudes regarding diet, health and safety. Such changes mayinclude federal, state and local regulations and recommendations from medical and diet professionals pertaining to the ingredients and nutritional contentof the food and beverages we offer. The success of our restaurant operations is dependent, in part, upon our ability to effectively respond to changes inany consumer health regulations and our ability to adapt our menu offerings to trends in food consumption. If consumer health regulations or consumereating habits change significantly, we may choose or be required to modify or remove certain menu items, which may materially adversely affect theappeal of our menu to new or returning customers. To the extent we are unwilling or unable to respond with appropriate changes to our menu offerings, itcould materially affect consumer demand and could have a material adverse impact on our business, financial condition or results of operations.
Government regulation and consumer eating habits may impact our business as a result of changes in attitudes regarding diet and health or newinformation regarding the adverse health effects of consuming certain menu offerings. These changes have resulted in, and may continue to result in, lawsand regulations requiring us to disclose the nutritional content of our food offerings, and they have resulted, and may continue to result in, laws andregulations affecting permissible ingredients and menu offerings. For example, a number of states, counties and cities have enacted menu labeling lawsrequiring multi-unit restaurant operators to disclose to consumers certain nutritional information, or have enacted legislation restricting the use of certaintypes of ingredients in restaurants. These requirements may be different or inconsistent with requirements under the Patient Protection and AffordableCare Act of 2010 (the “PPACA”), which establishes a uniform, federal requirement for certain restaurants to post nutritional information on their menus.Specifically, the PPACA requires chain restaurants with 20 or more locations operating under the same name and offering substantially the same menu topublish the total number of calories of standard menu items on menus and menu boards, along with a statement that puts this calorie information in thecontext of a total daily calorie intake. Inconsistencies among state laws with respect to presentation of nutritional content could be challenging for us tocomply with in an efficient manner. The PPACA also requires covered restaurants to provide to consumers, upon request, a written summary of detailednutritional information for each standard menu item, and to provide a statement on menus and menu boards about the availability of this information uponrequest. An unfavorable report on, or reaction to, our menu ingredients, the size of our portions or the nutritional content of our menu items couldnegatively influence the demand for our offerings.
Compliance with current and future laws and regulations regarding the ingredients and nutritional content of our menu items may be costly and time-consuming. Additionally, if consumer health regulations or consumer eating habits change significantly, we may be required to modify or discontinuecertain menu items and we may experience higher costs associated with the implementation of those changes. The risks and costs associated withnutritional disclosures on our menus could also impact our operations, particularly given differences among applicable legal requirements and practiceswithin the restaurant industry with respect to testing and disclosure, ordinary variations in food preparation among our own restaurants and the need torely on the accuracy and completeness of nutritional information obtained from third-party suppliers.
We may not be able to effectively respond to changes in consumer health and safety perceptions or to successfully implement the nutrient contentdisclosure requirements and adapt our menu offerings to trends in eating habits. The imposition of additional menu labeling laws could materiallyadversely affect our business, financial condition or results of operations, as well as our position within the restaurant industry in general.
We may not be able to adequately protect our intellectual property, which could harm the value of our brand and could adversely affect ourbusiness.
Our intellectual property is material to the conduct of our business and our marketing efforts. Our ability to implement our business plan successfullydepends in part on our ability to further build brand recognition using our trademarks, service marks, trade dress and other proprietary intellectualproperty, including our name and logos and the unique ambiance of our restaurants. While it is our policy to protect and defend vigorously our rights to ourintellectual property, we cannot predict whether steps taken by us to protect our intellectual property rights will be adequate to prevent misappropriation ofthese rights or the use by others of restaurant features based upon, or otherwise similar to, our concept. It may be difficult for us to prevent others fromcopying elements of our concept and any litigation to enforce our rights will likely be costly and may not be successful. Although we believe that we havesufficient rights to all of our trademarks and service marks, we may face claims of infringement that could interfere with our ability to market our restaurantsand promote our brand. Any such litigation may be costly and divert resources from our business. Moreover, if we are unable to successfully defendagainst such claims, we may be prevented from using our trademarks or service marks in the future, may be liable for damages and may have to changeour marketing efforts, which in turn could materially adversely affect our business, financial condition or results of operations.
We could be party to litigation that could adversely affect us by distracting management, increasing our expenses or subjecting us to materialmoney damages and other remedies.
Our customers occasionally file complaints or lawsuits against us alleging we caused an illness or injury they suffered at or after a visit to our restaurants,or that we have problems with food quality or operations. These kinds of complaints or lawsuits may be more common in a period in which the public isfocused on health safety issues, or may attract more attention due to publication on various social media outlets. We are also subject to a variety of otherclaims arising in the ordinary course of our business, including personal injury claims, contract claims and claims alleging violations of federal and statelaw regarding workplace and employment matters, equal opportunity, discrimination and similar matters and we could become subject to class action orother lawsuits related to these or different matters in the future. Regardless of whether any claims against us are valid, or whether we are ultimately heldliable, claims may be expensive to defend and may divert time and money away from our operations and hurt our performance. A judgment in excess ofour insurance coverage for any claims could materially adversely affect our financial condition or results of operations. Any adverse publicity resultingfrom these allegations, even if proven to be false, may also materially adversely affect our reputation or prospects, which in turn could materially adverselyaffect our business, financial condition or results of operations.
In addition, the restaurant industry has from time to time been subject to claims based on the nutritional content of food products sold and disclosure andadvertising practices. We may in the future also be subject to this type of proceeding or to publicity about these matters (particularly those directed at thequick-service or fast-casual segments of the industry) may harm our reputation and could materially adversely affect our business, financial condition orresults of operations.
Our current insurance may not provide adequate levels of coverage against claims.
There are types of losses we may incur that cannot be insured against or that we believe are not economically reasonable to insure against. Such lossescould have a material adverse effect on our business and results of operations. In addition, we self-insure a portion of expected losses under ouremployee health, workers’ compensation, general liability, property and cyber insurance programs. Unanticipated changes in the actuarial assumptionsand management estimates underlying our reserves for these losses could result in materially different amounts of expense under these programs, whichcould have a material adverse effect on our financial condition, results of operations and liquidity. Failure to obtain and maintain adequate directors’ andofficers’ insurance could materially adversely affect our ability to attract and retain qualified officers and directors.
Changes to accounting rules or regulations may adversely affect our results of operations.
Changes to existing accounting rules or regulations may impact our future results of operations or cause the perception that we are more highly leveraged.Other new accounting rules or regulations and varying interpretations of existing accounting rules or regulations have occurred and may occur in thefuture. For instance, accounting regulatory authorities implemented a requirement
that lessees capitalize operating leases in their financial statements beginning in 2019. The adoption of this lease guidance had a material impact on ourConsolidated Balance Sheets by materially increasing non-current assets and current and non-current liabilities due to the recognition of the right-of-useassets and related lease liabilities primarily related to our restaurant operating leases and corporate office space. Future changes to accounting rules orregulations could materially adversely affect our business, financial condition or results of operations.
Failure of our internal control over financial reporting could adversely affect our business and financial results.
Our management is responsible for establishing and maintaining effective internal control over financial reporting under Section 404 of the Sarbanes-Oxley Act of 2002. Internal control over financial reporting is a process to provide reasonable assurance regarding the reliability of financial reporting forexternal purposes in accordance with accounting principles generally accepted in the United States of America (“GAAP”). Because of its inherentlimitations, internal control over financial reporting is not intended to provide absolute assurance that we would prevent or detect a misstatement of ourfinancial statements or fraud. Any failure to maintain an effective system of internal control over financial reporting could limit our ability to report ourfinancial results accurately and timely or to detect and prevent fraud. The identification of a material weakness could indicate a lack of controls adequateto generate accurate financial statements that, in turn, could cause a loss of investor confidence and decline in the market price of our common stock. Wemay not be able to timely remediate any material weaknesses that may be identified in future periods or maintain all of the controls necessary forcontinued compliance. Likewise, we cannot assure you that we will be able to retain sufficient skilled finance and accounting personnel, especially in lightof the increased demand for such personnel among publicly traded companies.
Our principal stockholders and their affiliates own a substantial portion of our outstanding equity, and their interests may not always coincidewith the interests of the other holders.
As of December 31, 2019, L Catterton and certain of its affiliates and Mill Road Capital II, L.P. and certain of its affiliates (“Mill Road”) beneficially ownedin the aggregate shares representing approximately 29.4% of our outstanding voting power. L Catterton and certain of its affiliates beneficially owned, inthe aggregate, shares representing approximately 18.5% of our outstanding equity interests and voting power as of December 31, 2019. Mill Road andcertain of its affiliates beneficially owned, in the aggregate, shares representing approximately 10.9% of our outstanding equity interests and voting poweras of December 31, 2019. As a result, L Catterton and Mill Road could continue to potentially have significant influence over all matters presented to ourstockholders for approval, including election and removal of our directors and change in control transactions. The interests of L Catterton and Mill Roadmay not always coincide with the interests of the other holders of our common stock.
Our quarterly operating results may fluctuate significantly and could fall below the expectations of securities analysts and investors due toseasonality and other factors, some of which are beyond our control, resulting in a decline in our stock price.
Our quarterly operating results may fluctuate significantly because of several factors, including but not limited to: increases and decreases in AUVs andcomparable restaurant sales; profitability of our restaurants; labor availability and costs for hourly and management personnel; changes in interest rates;macroeconomic conditions, both nationally and locally; negative publicity relating to the consumption of products we serve; changes in consumerpreferences and competitive conditions; impairment of long-lived assets and any loss on and exit costs associated with restaurant closures; expansion tonew markets; the timing of new restaurant openings and related expense; restaurant operating costs for our newly-opened restaurants; increases ininfrastructure costs; and fluctuations in commodity prices.
Seasonal factors, particularly weather disruptions, and the timing of holidays also cause our revenue to fluctuate from quarter to quarter. Our revenue perrestaurant is typically lower in the first and fourth quarters due to reduced winter and holiday traffic and higher in the second and third quarters. As a resultof these factors, our quarterly and annual operating results and comparable restaurant sales may fluctuate significantly. Accordingly, results for any onequarter are not necessarily indicative of results to be expected for any other quarter or for any year and comparable restaurant sales for any particularfuture period may decrease. In the future, operating results may fall below the expectations of securities analysts and investors. In that event, the price ofour common stock would likely decrease.
The price of our common stock may be volatile.
The market price of our common stock could fluctuate significantly. Those fluctuations could be based on various factors, including: our operatingperformance and the performance of our competitors or restaurant companies in general; the public’s reaction to our press releases, our other publicannouncements and our filings with the SEC; changes in earnings estimates or recommendations by
research analysts who follow us or other companies in our industry; global, national or local economic, legal and regulatory factors unrelated to ourperformance; changes in, or our ability to achieve, projections or estimates of our operating results made by analysts, investors or management; futuresales of our common stock by our officers, directors and significant stockholders; the exercise of warrants for shares of common stock; the arrival ordeparture of key personnel; and other developments affecting us, our industry or our competitors.
In addition, in recent years the stock market has experienced significant price and volume fluctuations. These fluctuations may be unrelated to theoperating performance of particular companies. These broad market fluctuations may cause declines in the market price of our common stock. The priceof our common stock could fluctuate based upon factors that have little or nothing to do with our business, financial condition or results of operations, andthose fluctuations could materially reduce the price of our common stock.
We do not intend to pay dividends for the foreseeable future.We have never declared nor paid any cash dividends on our common stock. For the foreseeable future, we intend to retain any earnings to finance theoperation of our business, and we do not anticipate paying any cash dividends on our common stock. See Item 5. “Market for the Registrant’s CommonEquity, Related Stockholder Matters and Issuer Purchases of Equity Securities-Dividends.”
Future sales of our common stock, or the perception that such sales may occur, could depress our common stock price.
Sales of a substantial number of shares of our common stock in the public market, or the perception that such sales may occur, could depress the marketprice of our common stock. Our amended and restated certificate of incorporation authorizes us to issue up to 180,000,000 shares of Class A commonstock and Class B common stock. As of December 31, 2019, we have 44,134,063 outstanding shares of Class A common stock and no outstandingshares of Class B common stock. In addition, as of such date, approximately 742,581 shares of Class A common stock are issuable upon the exercise ofoutstanding stock options and the vesting of restricted stock units, and 1,913,793 shares of Class A common stock and 28,850 shares of Class B commonstock are issuable upon the exercise of warrants. Moreover, as of that date, approximately 4.1 million shares of our common stock are available for futuregrants under our stock incentive plan and for future purchase under our employee stock purchase plan.
Provisions in our organizational documents and Delaware law may delay or prevent our acquisition by a third party.
Our amended and restated certificate of incorporation, our second amended and restated bylaws and Delaware law each contain several provisions thatmay make it more difficult for a third party to acquire control of us without the approval of our Board of Directors. For example, we have a classified Boardof Directors with three-year staggered terms, which could delay the ability of stockholders to change the membership of a majority of our Board ofDirectors. Additionally, the terms of outstanding warrants contain change of control provisions which, in the event of a potential change of controltransaction, may require the payment of a premium to holders of such warrants. These provisions may make it more difficult or expensive for a third partyto acquire a majority of our outstanding equity interests. These provisions also may delay, prevent or deter a merger, acquisition, tender offer, proxycontest or other transaction that might otherwise result in our stockholders receiving a premium over the market price for their common stock.
ITEM 1B. Unresolved Staff Comments
None.
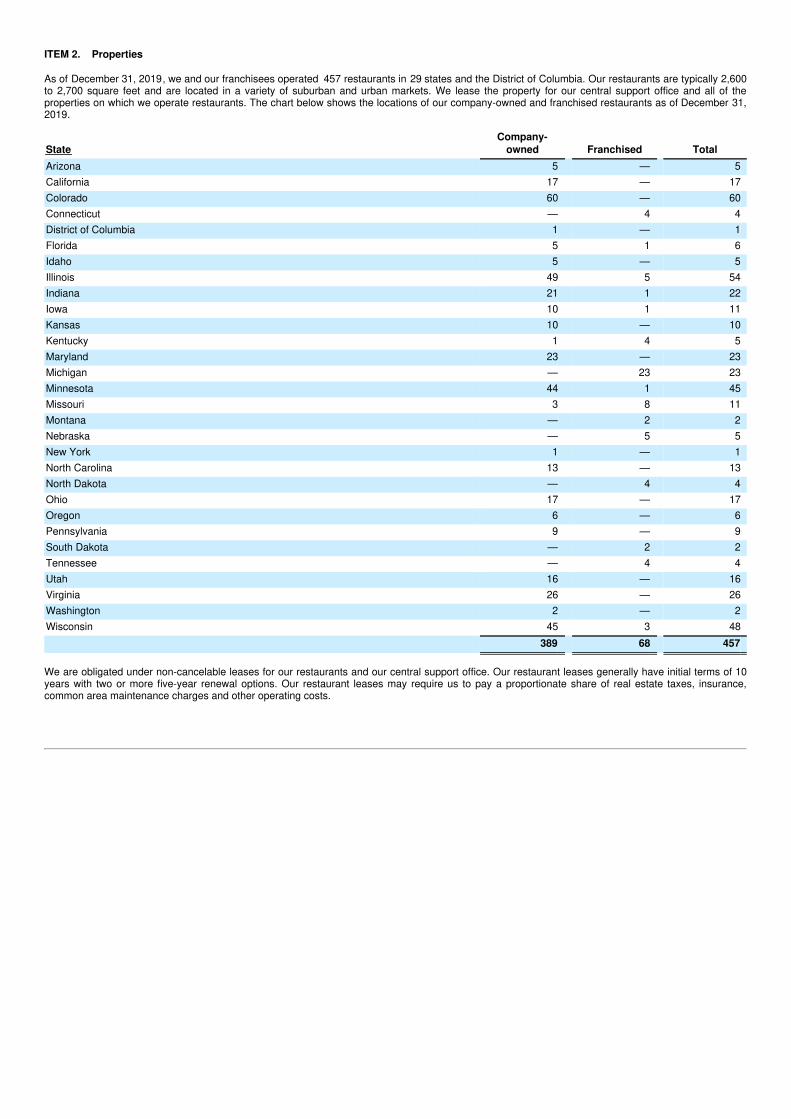
ITEM 2. Properties
As of December 31, 2019, we and our franchisees operated 457 restaurants in 29 states and the District of Columbia. Our restaurants are typically 2,600to 2,700 square feet and are located in a variety of suburban and urban markets. We lease the property for our central support office and all of theproperties on which we operate restaurants. The chart below shows the locations of our company-owned and franchised restaurants as of December 31,2019.
State Company-
owned Franchised TotalArizona 5 — 5California 17 — 17Colorado 60 — 60Connecticut — 4 4District of Columbia 1 — 1Florida 5 1 6Idaho 5 — 5Illinois 49 5 54Indiana 21 1 22Iowa 10 1 11Kansas 10 — 10Kentucky 1 4 5Maryland 23 — 23Michigan — 23 23Minnesota 44 1 45Missouri 3 8 11Montana — 2 2Nebraska — 5 5New York 1 — 1North Carolina 13 — 13North Dakota — 4 4Ohio 17 — 17Oregon 6 — 6Pennsylvania 9 — 9South Dakota — 2 2Tennessee — 4 4Utah 16 — 16Virginia 26 — 26Washington 2 — 2Wisconsin 45 3 48 389 68 457
We are obligated under non-cancelable leases for our restaurants and our central support office. Our restaurant leases generally have initial terms of 10years with two or more five-year renewal options. Our restaurant leases may require us to pay a proportionate share of real estate taxes, insurance,common area maintenance charges and other operating costs.

ITEM 3. Legal Proceedings
Other Matters
In the normal course of business, the Company is subject to other proceedings, lawsuits and claims. Such matters are subject to many uncertainties, andoutcomes are not predictable with assurance. Consequently, the Company is unable to ascertain the ultimate aggregate amount of monetary liability orfinancial impact with respect to these matters as of December 31, 2019. These matters could affect the operating results of any one financial reportingperiod when resolved in future periods. The Company believes that an unfavorable outcome with respect to these matters is remote or a potential range ofloss is not material to its consolidated financial statements. Significant increases in the number of these claims, or one or more successful claims thatresult in greater liabilities than the Company currently anticipates, could materially and adversely affect its business, financial condition, results ofoperations or cash flows.
ITEM 4. Mine Safety Disclosures
Not applicable.
PART II
ITEM 5. Market for the Registrant’s Common Equity, Related Stockholder Matters and Issuer Purchases of Equity Securities
Our Class A common stock has traded on the Nasdaq Global Select Market under the symbol NDLS since it began trading on June 28, 2013, the date ofour initial public offering (“IPO”). As of February 24, 2020, there were approximately 37 holders of record of our common stock. The number of holders ofrecord is based upon the actual numbers of holders registered at such date and does not include holders of shares in “street name” or persons,partnerships, associates, corporations or other entities in security position listings maintained by depositories.
Purchases of Equity Securities by the Issuer
We had no share repurchases during the fourth quarter of 2019.
Sales of Unregistered Securities by the Issuer
We sold no unregistered securities that have not been previously included in a Quarterly Report on Form 10-Q or in a Current Report on Form 8-K.
Dividends
No dividends have been declared or paid on our shares of common stock. We do not anticipate paying any cash dividends on any of our shares ofcommon stock in the foreseeable future. We currently intend to retain any earnings to finance the development and expansion of our business. Any futuredetermination to pay dividends will be at the discretion of our Board of Directors and will be dependent upon then-existing conditions, including ourearnings, capital requirements, results of operations, financial condition, business prospects and other factors that our Board of Directors considersrelevant. Further, the Company’s credit facility and warrants each contain provisions that limit its ability to pay dividends on its common stock. See“Management’s Discussion and Analysis of Financial Condition and Results of Operations” and “Certain Relationships and Related Transactions, andDirector Independence” for additional information regarding our financial condition.
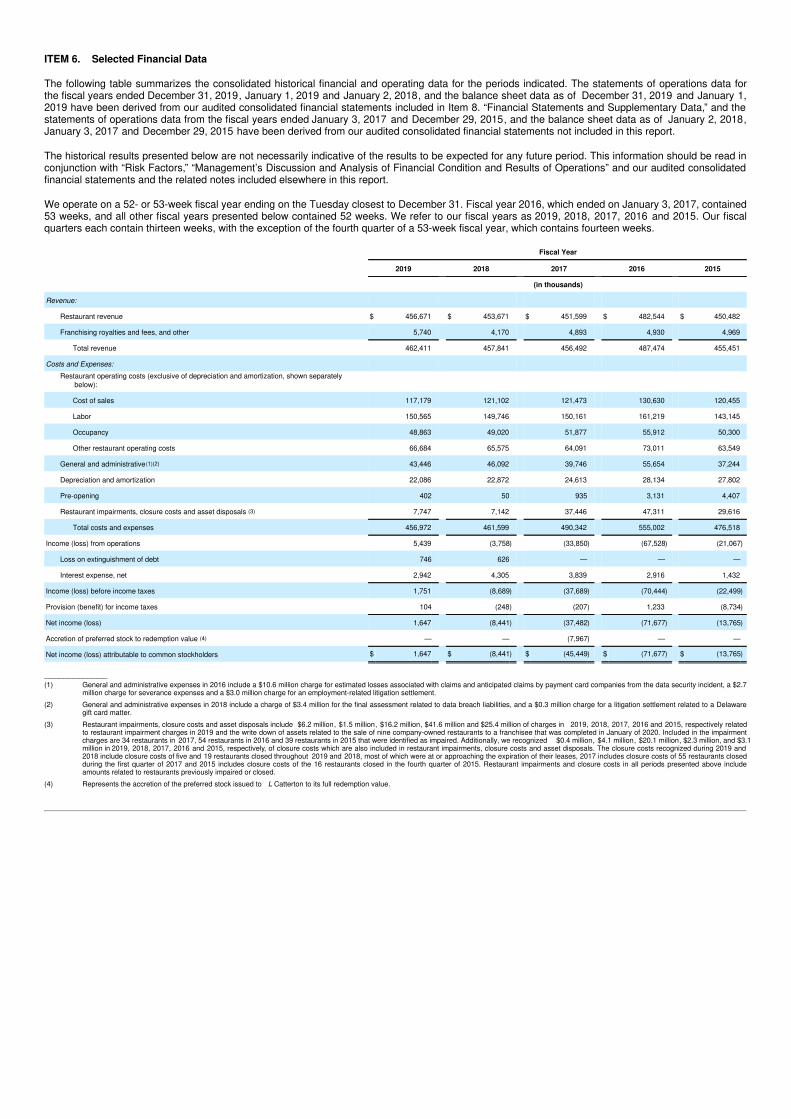
ITEM 6. Selected Financial Data
The following table summarizes the consolidated historical financial and operating data for the periods indicated. The statements of operations data forthe fiscal years ended December 31, 2019, January 1, 2019 and January 2, 2018, and the balance sheet data as of December 31, 2019 and January 1,2019 have been derived from our audited consolidated financial statements included in Item 8. “Financial Statements and Supplementary Data,” and thestatements of operations data from the fiscal years ended January 3, 2017 and December 29, 2015, and the balance sheet data as of January 2, 2018,January 3, 2017 and December 29, 2015 have been derived from our audited consolidated financial statements not included in this report.
The historical results presented below are not necessarily indicative of the results to be expected for any future period. This information should be read inconjunction with “Risk Factors,” “Management’s Discussion and Analysis of Financial Condition and Results of Operations” and our audited consolidatedfinancial statements and the related notes included elsewhere in this report.
We operate on a 52- or 53-week fiscal year ending on the Tuesday closest to December 31. Fiscal year 2016, which ended on January 3, 2017, contained53 weeks, and all other fiscal years presented below contained 52 weeks. We refer to our fiscal years as 2019, 2018, 2017, 2016 and 2015. Our fiscalquarters each contain thirteen weeks, with the exception of the fourth quarter of a 53-week fiscal year, which contains fourteen weeks.
Fiscal Year
2019 2018 2017 2016 2015
(in thousands)
Revenue:
Restaurant revenue $ 456,671 $ 453,671 $ 451,599 $ 482,544 $ 450,482
Franchising royalties and fees, and other 5,740 4,170 4,893 4,930 4,969
Total revenue 462,411 457,841 456,492 487,474 455,451
Costs and Expenses: Restaurant operating costs (exclusive of depreciation and amortization, shown separately
below):
Cost of sales 117,179 121,102 121,473 130,630 120,455
Labor 150,565 149,746 150,161 161,219 143,145
Occupancy 48,863 49,020 51,877 55,912 50,300
Other restaurant operating costs 66,684 65,575 64,091 73,011 63,549
General and administrative(1)(2) 43,446 46,092 39,746 55,654 37,244
Depreciation and amortization 22,086 22,872 24,613 28,134 27,802
Pre-opening 402 50 935 3,131 4,407
Restaurant impairments, closure costs and asset disposals (3) 7,747 7,142 37,446 47,311 29,616
Total costs and expenses 456,972 461,599 490,342 555,002 476,518
Income (loss) from operations 5,439 (3,758) (33,850) (67,528) (21,067)
Loss on extinguishment of debt 746 626 — — —
Interest expense, net 2,942 4,305 3,839 2,916 1,432
Income (loss) before income taxes 1,751 (8,689) (37,689) (70,444) (22,499)
Provision (benefit) for income taxes 104 (248) (207) 1,233 (8,734)
Net income (loss) 1,647 (8,441) (37,482) (71,677) (13,765)
Accretion of preferred stock to redemption value (4) — — (7,967) — —
Net income (loss) attributable to common stockholders $ 1,647 $ (8,441) $ (45,449) $ (71,677) $ (13,765)
_____________(1) General and administrative expenses in 2016 include a $10.6 million charge for estimated losses associated with claims and anticipated claims by payment card companies from the data security incident, a $2.7
million charge for severance expenses and a $3.0 million charge for an employment-related litigation settlement.(2) General and administrative expenses in 2018 include a charge of $3.4 million for the final assessment related to data breach liabilities, and a $0.3 million charge for a litigation settlement related to a Delaware
gift card matter.(3) Restaurant impairments, closure costs and asset disposals include $6.2 million, $1.5 million, $16.2 million, $41.6 million and $25.4 million of charges in 2019, 2018, 2017, 2016 and 2015, respectively related
to restaurant impairment charges in 2019 and the write down of assets related to the sale of nine company-owned restaurants to a franchisee that was completed in January of 2020. Included in the impairmentcharges are 34 restaurants in 2017, 54 restaurants in 2016 and 39 restaurants in 2015 that were identified as impaired. Additionally, we recognized $0.4 million, $4.1 million, $20.1 million, $2.3 million, and $3.1million in 2019, 2018, 2017, 2016 and 2015, respectively, of closure costs which are also included in restaurant impairments, closure costs and asset disposals. The closure costs recognized during 2019 and2018 include closure costs of five and 19 restaurants closed throughout 2019 and 2018, most of which were at or approaching the expiration of their leases, 2017 includes closure costs of 55 restaurants closedduring the first quarter of 2017 and 2015 includes closure costs of the 16 restaurants closed in the fourth quarter of 2015. Restaurant impairments and closure costs in all periods presented above includeamounts related to restaurants previously impaired or closed.
(4) Represents the accretion of the preferred stock issued to L Catterton to its full redemption value.
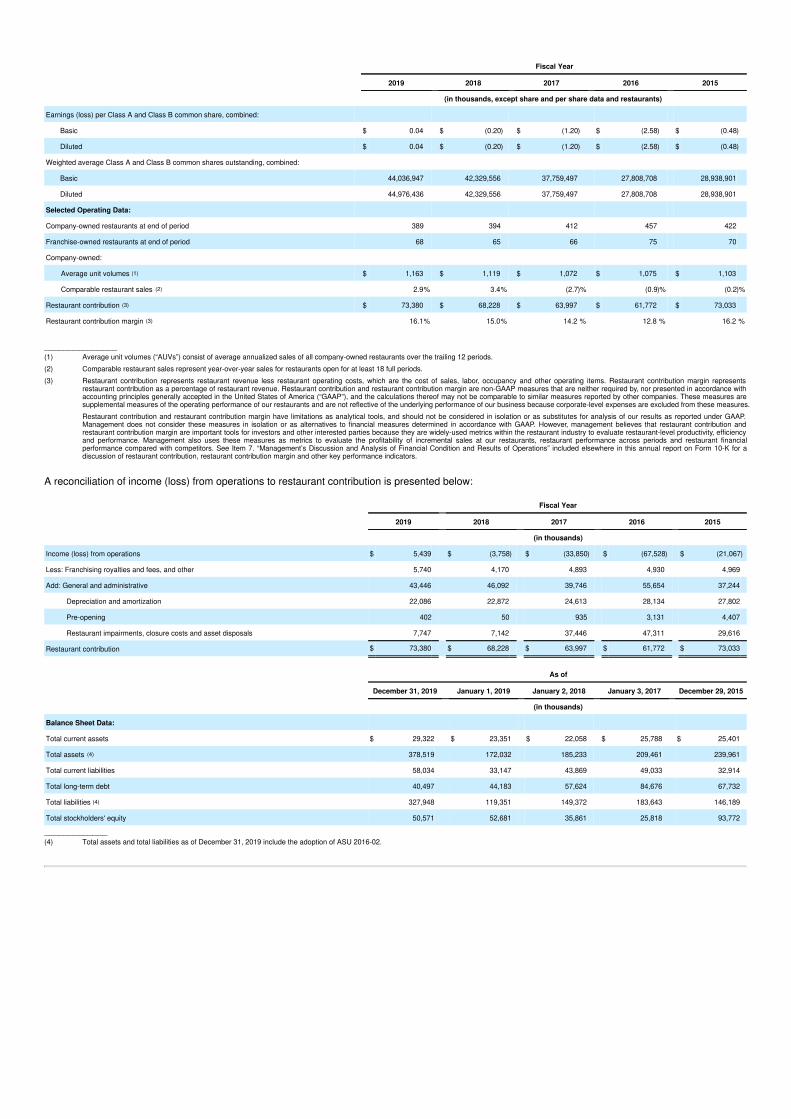
Fiscal Year
2019 2018 2017 2016 2015
(in thousands, except share and per share data and restaurants)
Earnings (loss) per Class A and Class B common share, combined:
Basic $ 0.04 $ (0.20) $ (1.20) $ (2.58) $ (0.48)
Diluted $ 0.04 $ (0.20) $ (1.20) $ (2.58) $ (0.48)
Weighted average Class A and Class B common shares outstanding, combined:
Basic 44,036,947 42,329,556 37,759,497 27,808,708 28,938,901
Diluted 44,976,436 42,329,556 37,759,497 27,808,708 28,938,901
Selected Operating Data:
Company-owned restaurants at end of period 389 394 412 457 422
Franchise-owned restaurants at end of period 68 65 66 75 70
Company-owned:
Average unit volumes (1) $ 1,163 $ 1,119 $ 1,072 $ 1,075 $ 1,103
Comparable restaurant sales (2) 2.9% 3.4% (2.7)% (0.9)% (0.2)%
Restaurant contribution (3) $ 73,380 $ 68,228 $ 63,997 $ 61,772 $ 73,033
Restaurant contribution margin (3) 16.1% 15.0% 14.2 % 12.8 % 16.2 %
_______________(1) Average unit volumes (“AUVs”) consist of average annualized sales of all company-owned restaurants over the trailing 12 periods.(2) Comparable restaurant sales represent year-over-year sales for restaurants open for at least 18 full periods.(3) Restaurant contribution represents restaurant revenue less restaurant operating costs, which are the cost of sales, labor, occupancy and other operating items. Restaurant contribution margin represents
restaurant contribution as a percentage of restaurant revenue. Restaurant contribution and restaurant contribution margin are non-GAAP measures that are neither required by, nor presented in accordance withaccounting principles generally accepted in the United States of America (“GAAP”), and the calculations thereof may not be comparable to similar measures reported by other companies. These measures aresupplemental measures of the operating performance of our restaurants and are not reflective of the underlying performance of our business because corporate-level expenses are excluded from these measures.Restaurant contribution and restaurant contribution margin have limitations as analytical tools, and should not be considered in isolation or as substitutes for analysis of our results as reported under GAAP.Management does not consider these measures in isolation or as alternatives to financial measures determined in accordance with GAAP. However, management believes that restaurant contribution andrestaurant contribution margin are important tools for investors and other interested parties because they are widely-used metrics within the restaurant industry to evaluate restaurant-level productivity, efficiencyand performance. Management also uses these measures as metrics to evaluate the profitability of incremental sales at our restaurants, restaurant performance across periods and restaurant financialperformance compared with competitors. See Item 7. “Management’s Discussion and Analysis of Financial Condition and Results of Operations” included elsewhere in this annual report on Form 10-K for adiscussion of restaurant contribution, restaurant contribution margin and other key performance indicators.
A reconciliation of income (loss) from operations to restaurant contribution is presented below:
Fiscal Year
2019 2018 2017 2016 2015
(in thousands)
Income (loss) from operations $ 5,439 $ (3,758) $ (33,850) $ (67,528) $ (21,067)
Less: Franchising royalties and fees, and other 5,740 4,170 4,893 4,930 4,969
Add: General and administrative 43,446 46,092 39,746 55,654 37,244
Depreciation and amortization 22,086 22,872 24,613 28,134 27,802
Pre-opening 402 50 935 3,131 4,407
Restaurant impairments, closure costs and asset disposals 7,747 7,142 37,446 47,311 29,616
Restaurant contribution $ 73,380 $ 68,228 $ 63,997 $ 61,772 $ 73,033
As of
December 31, 2019 January 1, 2019 January 2, 2018 January 3, 2017 December 29, 2015
(in thousands)
Balance Sheet Data:
Total current assets $ 29,322 $ 23,351 $ 22,058 $ 25,788 $ 25,401
Total assets (4) 378,519 172,032 185,233 209,461 239,961
Total current liabilities 58,034 33,147 43,869 49,033 32,914
Total long-term debt 40,497 44,183 57,624 84,676 67,732
Total liabilities (4) 327,948 119,351 149,372 183,643 146,189
Total stockholders' equity 50,571 52,681 35,861 25,818 93,772
_____________(4) Total assets and total liabilities as of December 31, 2019 include the adoption of ASU 2016-02.
ITEM 7. Management’s Discussion and Analysis of Financial Condition and Results of Operations
The following discussion and analysis of our financial condition and results of operations should be read in conjunction with Item 6. “Selected FinancialData” and our consolidated financial statements and related notes included in Item 8. “Financial Statements and Supplementary Data.” This section of theForm 10-K generally discusses 2019 and 2018 items and year-to-year comparisons of 2019 to 2018. Discussions of 2017 items and year-to-yearcomparisons of 2018 and 2017 that are not included in this Form 10-K can be found in “Management’s Discussion and Analysis of Financial Condition andResults of Operations” in Part II, Item 7 on our Annual Report on Form 10-K for the year ended January 1, 2019. In addition to historical information, thisdiscussion and analysis contains forward-looking statements that involve risks and uncertainties. Our actual results may differ materially from thoseanticipated in these forward-looking statements as a result of certain factors including, but not limited to, those discussed in Item 1A. “Risk Factors” andelsewhere in this report.
We operate on a 52- or 53-week fiscal year ending on the Tuesday closest to December 31. All fiscal years 2019, 2018 and 2017, which ended onDecember 31, 2019, January 1, 2019 and January 2, 2018, respectively, contained 52 weeks. We refer to our fiscal years as 2019, 2018 and 2017. Ourfiscal quarters each contained 13 operating weeks.
Overview
Noodles & Company is a restaurant concept offering lunch and dinner within the fast-casual segment of the restaurant industry. We opened our firstlocation in 1995, offering noodle and pasta dishes, staples of many different cuisines, with the goal of delivering fresh ingredients and flavors from aroundthe world under one roof. Today, our globally-inspired menu includes a wide variety of high quality, cooked-to-order dishes, including noodles and pasta,soups, salads and appetizers. We believe we offer our customers value with per person spend of approximately $9.53 in 2019.
Recent Trends, Risks and Uncertainties
Comparable Restaurant Sales. In fiscal 2019, system-wide comparable restaurant sales increased 2.8%, comprised of a 2.9% increase for company-owned restaurants and a 2.5% increase for franchise restaurants. Comparable restaurant sales represent year-over-year sales comparisons forrestaurants open for at least 18 full periods. Our ability to continue to increase comparable restaurant sales depends in part on our ability to successfullyimplement our operational strategies and initiatives.
Increased Labor Costs. Similar to much of the restaurant industry, our base labor costs have risen in recent periods. In 2019, we were able to mitigate theimpact of increased base labor costs through labor efficiencies; however, we expect that labor costs will continue to rise as wage rates and benefit costsincrease. Some jurisdictions in which we operate have recently increased their minimum wage by a significant amount and other jurisdictions areconsidering similar actions. Significant additional government-imposed increases could materially affect our labor costs.
Restaurant Development. Given improvement in results, operating effectiveness and liquidity, we are currently pursuing a disciplined development pipelineto execute an increased new unit growth rate in the near term. In 2020, we plan to open between ten and fifteen restaurants system-wide and develop apipeline to support a 5% - 7% unit growth rate beginning in 2021.
New restaurants have historically contributed substantially to our revenue growth. In 2019, we opened four company-owned restaurants, acquired onerestaurant from a franchisee, refranchised five restaurants, and closed five company-owned restaurants, while our franchisees opened one new restaurantand closed two restaurants. As of December 31, 2019, we had 389 company-owned restaurants and 68 franchise restaurants in 29 states and the Districtof Columbia.
Certain Restaurant Closures. We closed five and 19 company-owned restaurants in 2019 and 2018, respectively, most of which were at or approachingthe expiration of their leases. We currently do not anticipate significant restaurant closures for the foreseeable future; however, we may from time to timeclose certain restaurants, including closures at, or near, the expiration of their leases.
Impairment of Long-lived Assets. We impaired two restaurants in 2019 and one restaurant in 2018 and wrote down the assets related to the sale of ninecompany-owned restaurants to a franchisee that closed in January of 2020.
Impairment is based on our current assessment of the expected future cash flows of various restaurants based on recent results and other specific marketfactors. Many of these restaurants we had opened in the last three to four years in newer markets where brand awareness of our restaurants was not asstrong and where it had been more difficult to adequately staff our restaurants. Although impairment charges have meaningfully declined since 2017, wemay recognize impairment charges in the future.
Key Measures We Use to Evaluate Our Performance
To evaluate the performance of our business, we utilize a variety of financial and performance measures. These key measures include revenue, averageunit volumes (“AUVs”), comparable restaurant sales, restaurant contribution, restaurant contribution margin, EBITDA and adjusted EBITDA.
Revenue
Restaurant revenue represents sales of food and beverages in company-owned restaurants. Several factors affect our restaurant revenue in any period,including the number of restaurants in operation and per-restaurant sales.
Franchise royalties and fees represent royalty income and initial franchise fees. While we expect that the majority of our revenue and net income growthwill be driven by company-owned restaurants, our franchise restaurants remain an important factor impacting our revenue and financial performance.
Seasonal factors cause our revenue to fluctuate from quarter to quarter. Our revenue per restaurant is typically lower in the first and fourth quarters due toreduced winter and holiday traffic and higher in the second and third quarters. As a result of these factors, our quarterly and annual operating results andcomparable restaurant sales may fluctuate significantly.
Average Unit Volumes
AUVs consist of the average annualized sales of all company-owned restaurants for the trailing 12 periods. AUVs are calculated by dividing restaurantrevenue by the number of operating days within each time period and multiplying by the number of operating days we have in a typical year. Thismeasurement allows management to assess changes in consumer traffic and per person spending patterns at our restaurants.
Comparable Restaurant Sales
Comparable restaurant sales refer to year-over-year sales comparisons for the comparable restaurant base. We define the comparable restaurant base toinclude restaurants open for at least 18 full periods. As of the end of 2019, 2018 and 2017, there were 383, 392 and 385 restaurants, respectively, in ourcomparable restaurant base for company-owned locations. This measure highlights performance of existing restaurants, as the impact of new restaurantopenings is excluded. Changes in comparable restaurant sales are generated by changes in traffic, which we calculate as the number of entrées sold, orchanges in per-person spend, calculated as sales divided by traffic. Per-person spend can be influenced by changes in menu prices and the mix andnumber of items sold per person.
Measuring our comparable restaurant sales allows us to evaluate the performance of our existing restaurant base. Various factors impact comparablerestaurant sales, including, but not limited to:
• consumer recognition of our brand and our ability to respond to changing consumer preferences;
• overall economic trends, particularly those related to consumer spending;
• our ability to operate restaurants effectively and efficiently to meet consumer expectations;
• pricing;
• the number of restaurant transactions, per-person spend and average check amount;
• marketing and promotional efforts;
• abnormal weather patterns;
• food safety and foodborne illness concerns;
• local competition;
• trade area dynamics;
• introduction of new and seasonal menu items and limited time offerings; and
• opening new restaurants in the vicinity of existing locations.
Consistent with common industry practice, we present comparable restaurant sales on a calendar-adjusted basis that aligns current year sales weeks withcomparable periods in the prior year, regardless of whether they belong to the same fiscal period or not. Since opening new company-owned andfranchise restaurants is a part of our growth strategy and we anticipate new restaurants will be a component of our revenue growth, comparablerestaurant sales are only one measure of how we evaluate our performance.
Restaurant Contribution and Restaurant Contribution Margin
Restaurant contribution represents restaurant revenue less restaurant operating costs which are cost of sales, labor, occupancy and other restaurantoperating costs. Restaurant contribution margin represents restaurant contribution as a percentage of restaurant revenue. We expect restaurantcontribution to increase in proportion to the number of new restaurants we open and our comparable restaurant sales growth.
We believe that restaurant contribution and restaurant contribution margin are important tools for investors and other interested parties because they arewidely-used metrics within the restaurant industry to evaluate restaurant-level productivity, efficiency and performance. We also use restaurantcontribution and restaurant contribution margin as metrics to evaluate the profitability of incremental sales at our restaurants, restaurant performanceacross periods and restaurant financial performance compared with competitors. Restaurant contribution and restaurant contribution margin aresupplemental measures of the operating performance of our restaurants and are not reflective of the underlying performance of our business becausecorporate-level expenses are excluded from these measures.
EBITDA and Adjusted EBITDA
We define EBITDA as net income (loss) before interest expense, provision (benefit) for income taxes and depreciation and amortization. We defineadjusted EBITDA as net income (loss) before interest expense, provision (benefit) for income taxes, depreciation and amortization, restaurantimpairments, closure costs and asset disposals, certain litigation settlements, data breach assessments, non-recurring registration and related transactioncosts, loss on extinguishment of debt, severance costs and stock-based compensation.
We believe that EBITDA and adjusted EBITDA provide clear pictures of our operating results by eliminating certain non-recurring and non-cash expensesthat may vary widely from period to period and are not reflective of the underlying business performance.
The presentation of restaurant contribution, restaurant contribution margin, EBITDA and adjusted EBITDA is not intended to be considered in isolation oras a substitute for, or to be superior to, the financial information prepared and presented in accordance with accounting principles generally accepted inthe United States of America (“GAAP”). We use these non-GAAP financial measures for financial and operational decision making and as a means toevaluate period-to-period comparisons. We believe that they provide useful information to management and investors about operating results, enhancethe overall understanding of past financial performance and future prospects and allow for greater transparency with respect to key metrics used bymanagement in its financial and operational decision making.
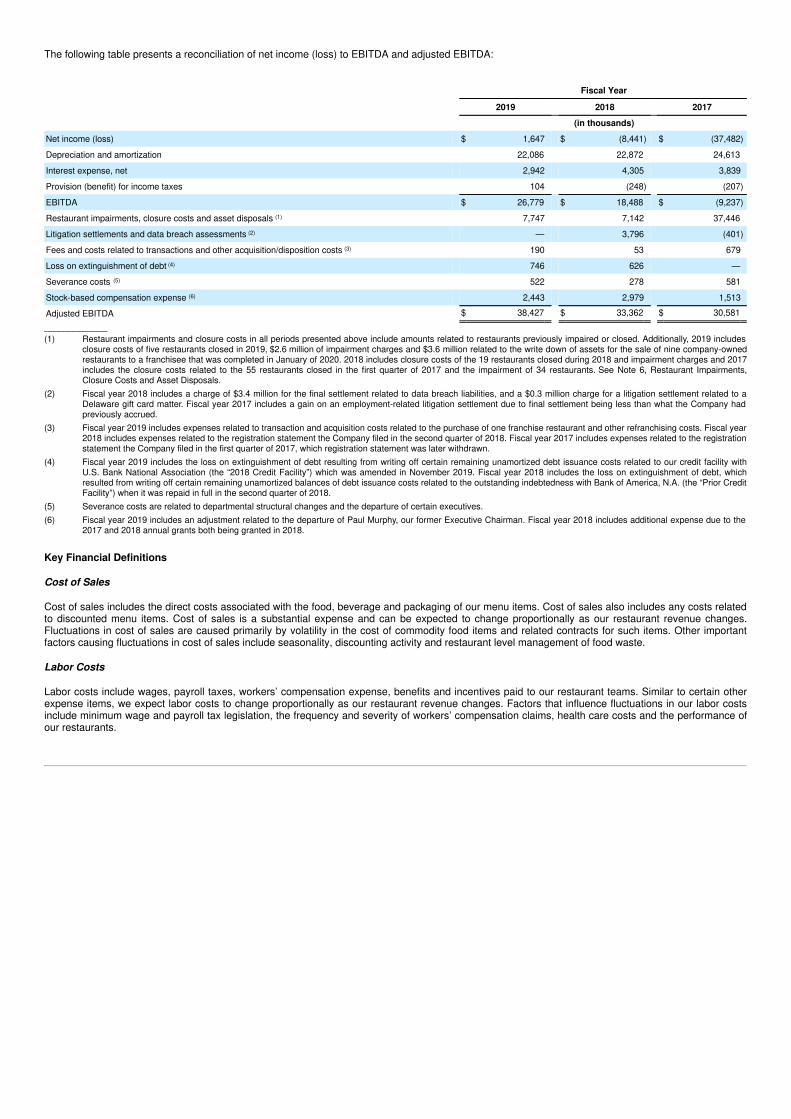
The following table presents a reconciliation of net income (loss) to EBITDA and adjusted EBITDA:
Fiscal Year
2019 2018 2017
(in thousands)
Net income (loss) $ 1,647 $ (8,441) $ (37,482)
Depreciation and amortization 22,086 22,872 24,613
Interest expense, net 2,942 4,305 3,839
Provision (benefit) for income taxes 104 (248) (207)
EBITDA $ 26,779 $ 18,488 $ (9,237)
Restaurant impairments, closure costs and asset disposals (1) 7,747 7,142 37,446
Litigation settlements and data breach assessments (2) — 3,796 (401)
Fees and costs related to transactions and other acquisition/disposition costs (3) 190 53 679
Loss on extinguishment of debt (4) 746 626 —
Severance costs (5) 522 278 581
Stock-based compensation expense (6) 2,443 2,979 1,513
Adjusted EBITDA $ 38,427 $ 33,362 $ 30,581_____________(1) Restaurant impairments and closure costs in all periods presented above include amounts related to restaurants previously impaired or closed. Additionally, 2019 includes
closure costs of five restaurants closed in 2019, $2.6 million of impairment charges and $3.6 million related to the write down of assets for the sale of nine company-ownedrestaurants to a franchisee that was completed in January of 2020. 2018 includes closure costs of the 19 restaurants closed during 2018 and impairment charges and 2017includes the closure costs related to the 55 restaurants closed in the first quarter of 2017 and the impairment of 34 restaurants. See Note 6, Restaurant Impairments,Closure Costs and Asset Disposals.
(2) Fiscal year 2018 includes a charge of $3.4 million for the final settlement related to data breach liabilities, and a $0.3 million charge for a litigation settlement related to aDelaware gift card matter. Fiscal year 2017 includes a gain on an employment-related litigation settlement due to final settlement being less than what the Company hadpreviously accrued.
(3) Fiscal year 2019 includes expenses related to transaction and acquisition costs related to the purchase of one franchise restaurant and other refranchising costs. Fiscal year2018 includes expenses related to the registration statement the Company filed in the second quarter of 2018. Fiscal year 2017 includes expenses related to the registrationstatement the Company filed in the first quarter of 2017, which registration statement was later withdrawn.
(4) Fiscal year 2019 includes the loss on extinguishment of debt resulting from writing off certain remaining unamortized debt issuance costs related to our credit facility withU.S. Bank National Association (the “2018 Credit Facility”) which was amended in November 2019. Fiscal year 2018 includes the loss on extinguishment of debt, whichresulted from writing off certain remaining unamortized balances of debt issuance costs related to the outstanding indebtedness with Bank of America, N.A. (the “Prior CreditFacility”) when it was repaid in full in the second quarter of 2018.
(5) Severance costs are related to departmental structural changes and the departure of certain executives.(6) Fiscal year 2019 includes an adjustment related to the departure of Paul Murphy, our former Executive Chairman. Fiscal year 2018 includes additional expense due to the
2017 and 2018 annual grants both being granted in 2018.
Key Financial Definitions
Cost of Sales
Cost of sales includes the direct costs associated with the food, beverage and packaging of our menu items. Cost of sales also includes any costs relatedto discounted menu items. Cost of sales is a substantial expense and can be expected to change proportionally as our restaurant revenue changes.Fluctuations in cost of sales are caused primarily by volatility in the cost of commodity food items and related contracts for such items. Other importantfactors causing fluctuations in cost of sales include seasonality, discounting activity and restaurant level management of food waste.
Labor Costs
Labor costs include wages, payroll taxes, workers’ compensation expense, benefits and incentives paid to our restaurant teams. Similar to certain otherexpense items, we expect labor costs to change proportionally as our restaurant revenue changes. Factors that influence fluctuations in our labor costsinclude minimum wage and payroll tax legislation, the frequency and severity of workers’ compensation claims, health care costs and the performance ofour restaurants.
Occupancy Costs
Occupancy costs include rent, common area maintenance charges and real estate tax expense related to our restaurants and are expected to growproportionally as we open new restaurants.
Other Restaurant Operating Costs
Other restaurant operating costs include the costs of repairs and maintenance, utilities, restaurant-level marketing, credit card processing fees, deliveryfees, restaurant supplies and other restaurant operating costs. Similar to certain other costs, they are expected to grow proportionally as restaurantrevenue grows.
General and Administrative Expense
General and administrative expense is composed of payroll, other compensation, travel, marketing, accounting and legal fees, insurance and otherexpenses related to the infrastructure required to support our restaurants. General and administrative expense also includes the non-cash stockcompensation expense related to our stock incentive plan.
Depreciation and Amortization
Our principal depreciation and amortization charges relate to depreciation of long-lived assets, such as property, equipment and leasehold improvements,from restaurant construction and ongoing maintenance.
Pre-Opening Costs
Pre-opening costs relate to the costs incurred prior to the opening of a restaurant. These include management labor costs, staff labor costs duringtraining, food and supplies utilized during training, marketing costs and other pre-opening related costs. Pre-opening costs also include rent recordedbetween the date of possession and the opening date for our restaurants.
Restaurant Impairments, Closure Costs and Asset Disposals
Restaurant impairments, closure costs and asset disposals include the net gain or loss on disposal of long-lived assets related to retirements andreplacement of equipment or leasehold improvements, restaurant closures and impairment charges.
Interest Expense
Interest expense consists primarily of interest on our outstanding indebtedness and amortization of debt issuance costs over the life of the related debtreduced by capitalized interest.
Provision (Benefit) for Income Taxes
Provision (benefit) for income taxes consists of federal, state and local taxes on our income.
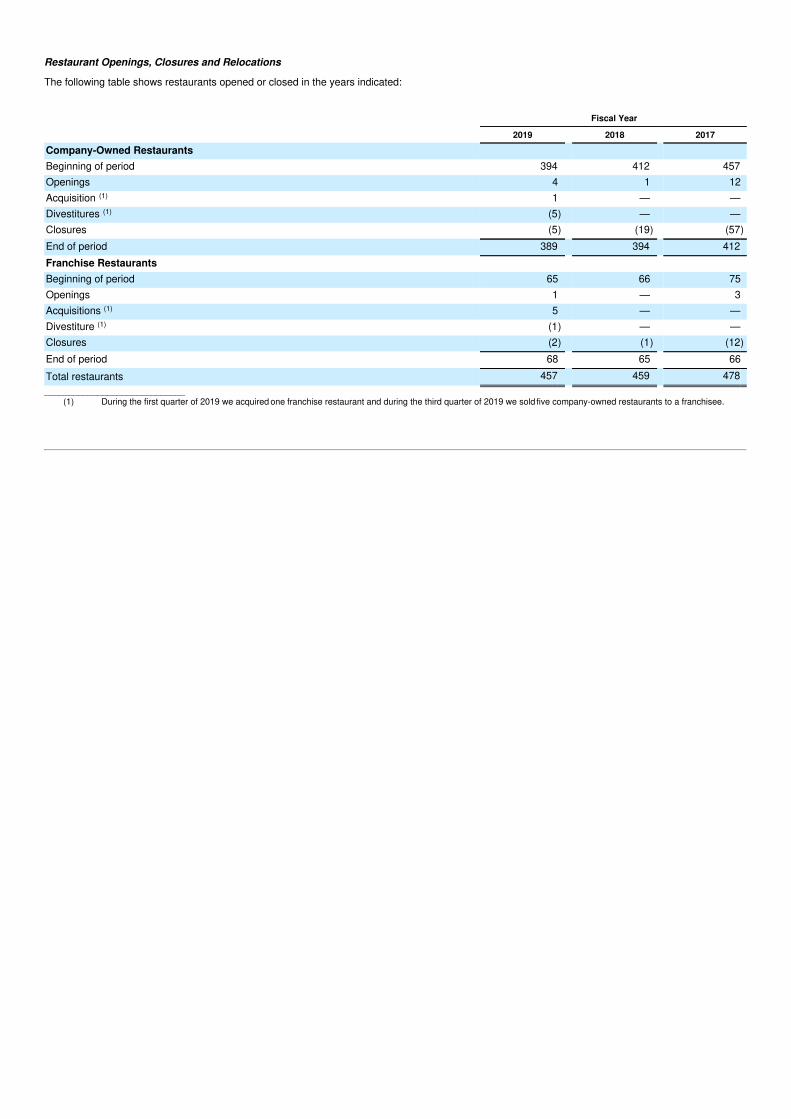
Restaurant Openings, Closures and Relocations
The following table shows restaurants opened or closed in the years indicated:
Fiscal Year
2019 2018 2017
Company-Owned Restaurants Beginning of period 394 412 457Openings 4 1 12Acquisition (1) 1 — —Divestitures (1) (5) — —Closures (5) (19) (57)End of period 389 394 412Franchise Restaurants Beginning of period 65 66 75Openings 1 — 3Acquisitions (1) 5 — —Divestiture (1) (1) — —Closures (2) (1) (12)End of period 68 65 66Total restaurants 457 459 478_____________________________
(1) During the first quarter of 2019 we acquired one franchise restaurant and during the third quarter of 2019 we sold five company-owned restaurants to a franchisee.
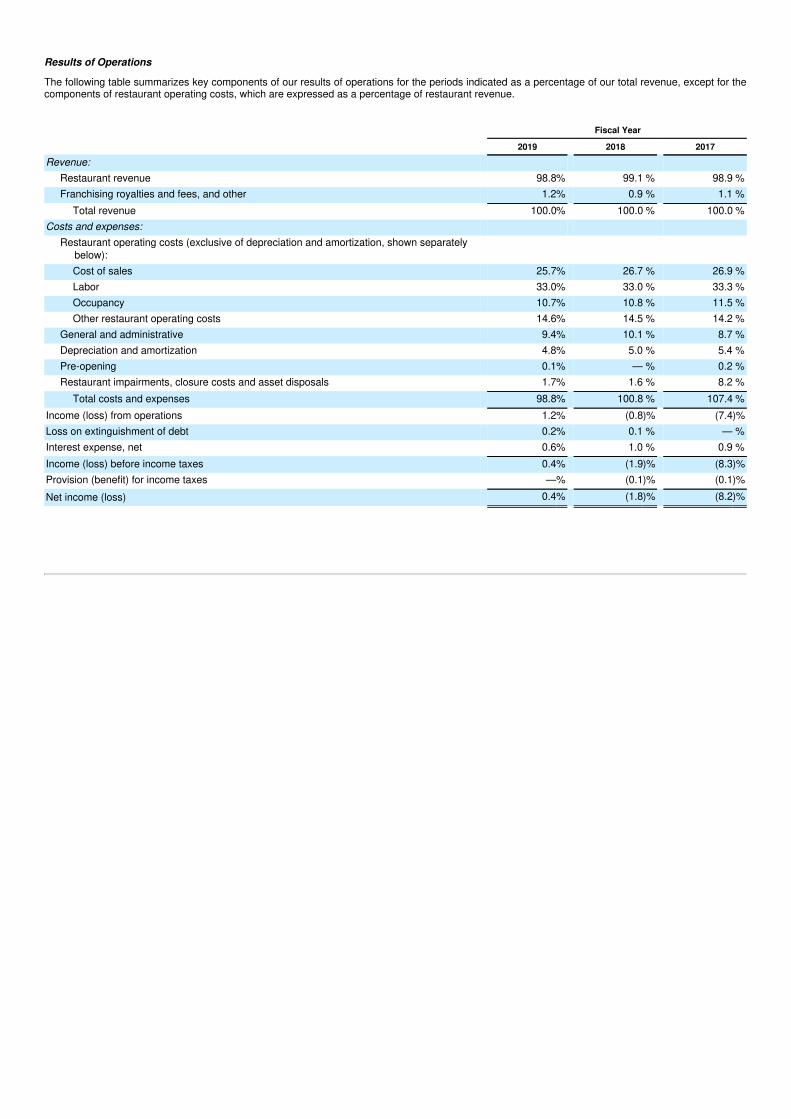
Results of Operations
The following table summarizes key components of our results of operations for the periods indicated as a percentage of our total revenue, except for thecomponents of restaurant operating costs, which are expressed as a percentage of restaurant revenue.
Fiscal Year
2019 2018 2017
Revenue: Restaurant revenue 98.8% 99.1 % 98.9 %Franchising royalties and fees, and other 1.2% 0.9 % 1.1 %
Total revenue 100.0% 100.0 % 100.0 %Costs and expenses:
Restaurant operating costs (exclusive of depreciation and amortization, shown separatelybelow): Cost of sales 25.7% 26.7 % 26.9 %Labor 33.0% 33.0 % 33.3 %Occupancy 10.7% 10.8 % 11.5 %Other restaurant operating costs 14.6% 14.5 % 14.2 %
General and administrative 9.4% 10.1 % 8.7 %Depreciation and amortization 4.8% 5.0 % 5.4 %Pre-opening 0.1% — % 0.2 %Restaurant impairments, closure costs and asset disposals 1.7% 1.6 % 8.2 %
Total costs and expenses 98.8% 100.8 % 107.4 %Income (loss) from operations 1.2% (0.8)% (7.4)%Loss on extinguishment of debt 0.2% 0.1 % — %Interest expense, net 0.6% 1.0 % 0.9 %Income (loss) before income taxes 0.4% (1.9)% (8.3)%Provision (benefit) for income taxes —% (0.1)% (0.1)%Net income (loss) 0.4% (1.8)% (8.2)%
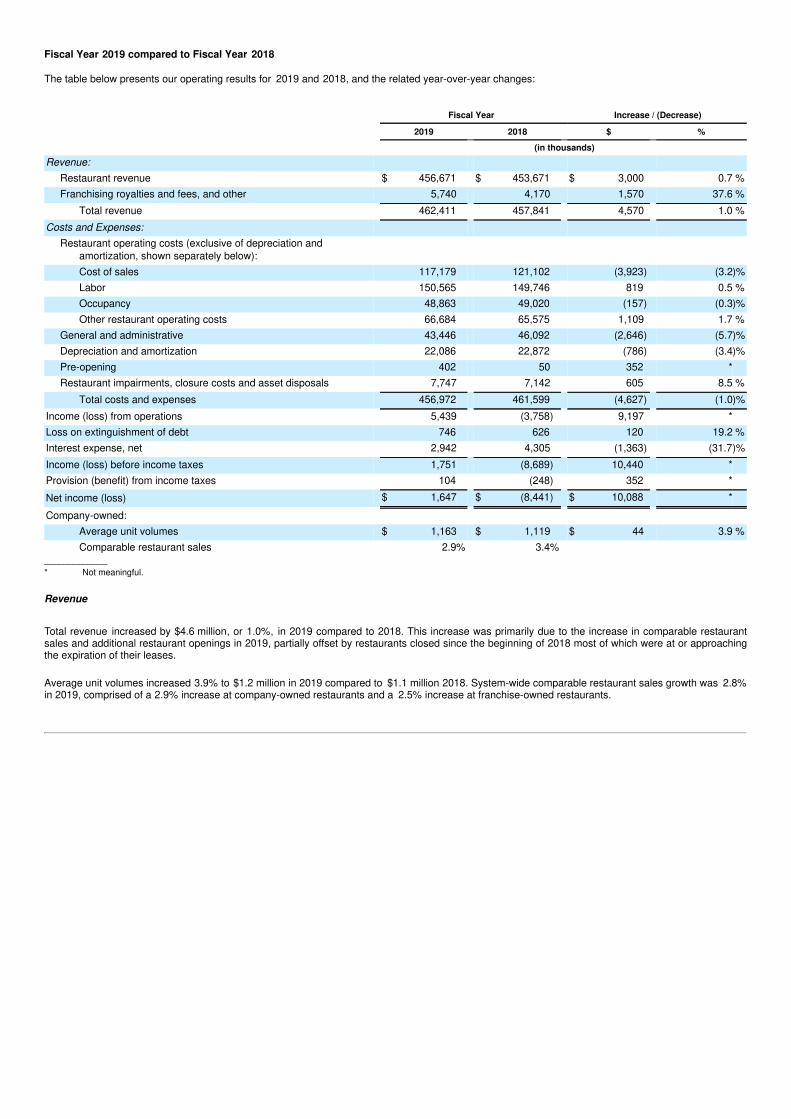
Fiscal Year 2019 compared to Fiscal Year 2018
The table below presents our operating results for 2019 and 2018, and the related year-over-year changes:
Fiscal Year Increase / (Decrease)
2019 2018 $ %
(in thousands)
Revenue: Restaurant revenue $ 456,671 $ 453,671 $ 3,000 0.7 %Franchising royalties and fees, and other 5,740 4,170 1,570 37.6 %
Total revenue 462,411 457,841 4,570 1.0 %Costs and Expenses:
Restaurant operating costs (exclusive of depreciation andamortization, shown separately below): Cost of sales 117,179 121,102 (3,923) (3.2)%Labor 150,565 149,746 819 0.5 %Occupancy 48,863 49,020 (157) (0.3)%Other restaurant operating costs 66,684 65,575 1,109 1.7 %
General and administrative 43,446 46,092 (2,646) (5.7)%Depreciation and amortization 22,086 22,872 (786) (3.4)%Pre-opening 402 50 352 *Restaurant impairments, closure costs and asset disposals 7,747 7,142 605 8.5 %
Total costs and expenses 456,972 461,599 (4,627) (1.0)%Income (loss) from operations 5,439 (3,758) 9,197 *Loss on extinguishment of debt 746 626 120 19.2 %Interest expense, net 2,942 4,305 (1,363) (31.7)%Income (loss) before income taxes 1,751 (8,689) 10,440 *Provision (benefit) from income taxes 104 (248) 352 *Net income (loss) $ 1,647 $ (8,441) $ 10,088 *
Company-owned: Average unit volumes $ 1,163 $ 1,119 $ 44 3.9 %Comparable restaurant sales 2.9% 3.4%
_____________* Not meaningful.
Revenue
Total revenue increased by $4.6 million, or 1.0%, in 2019 compared to 2018. This increase was primarily due to the increase in comparable restaurantsales and additional restaurant openings in 2019, partially offset by restaurants closed since the beginning of 2018 most of which were at or approachingthe expiration of their leases.
Average unit volumes increased 3.9% to $1.2 million in 2019 compared to $1.1 million 2018. System-wide comparable restaurant sales growth was 2.8%in 2019, comprised of a 2.9% increase at company-owned restaurants and a 2.5% increase at franchise-owned restaurants.
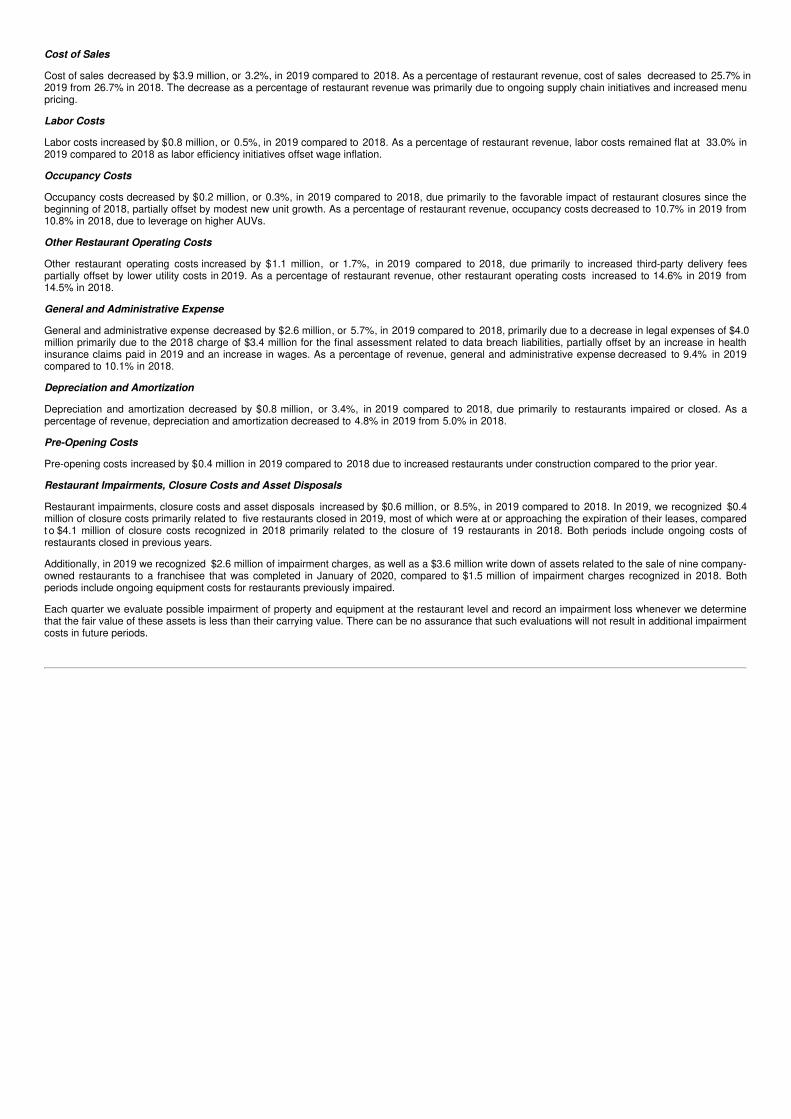
Cost of Sales
Cost of sales decreased by $3.9 million, or 3.2%, in 2019 compared to 2018. As a percentage of restaurant revenue, cost of sales decreased to 25.7% in2019 from 26.7% in 2018. The decrease as a percentage of restaurant revenue was primarily due to ongoing supply chain initiatives and increased menupricing.
Labor Costs
Labor costs increased by $0.8 million, or 0.5%, in 2019 compared to 2018. As a percentage of restaurant revenue, labor costs remained flat at 33.0% in2019 compared to 2018 as labor efficiency initiatives offset wage inflation.
Occupancy Costs
Occupancy costs decreased by $0.2 million, or 0.3%, in 2019 compared to 2018, due primarily to the favorable impact of restaurant closures since thebeginning of 2018, partially offset by modest new unit growth. As a percentage of restaurant revenue, occupancy costs decreased to 10.7% in 2019 from10.8% in 2018, due to leverage on higher AUVs.
Other Restaurant Operating Costs
Other restaurant operating costs increased by $1.1 million, or 1.7%, in 2019 compared to 2018, due primarily to increased third-party delivery feespartially offset by lower utility costs in 2019. As a percentage of restaurant revenue, other restaurant operating costs increased to 14.6% in 2019 from14.5% in 2018.
General and Administrative Expense
General and administrative expense decreased by $2.6 million, or 5.7%, in 2019 compared to 2018, primarily due to a decrease in legal expenses of $4.0million primarily due to the 2018 charge of $3.4 million for the final assessment related to data breach liabilities, partially offset by an increase in healthinsurance claims paid in 2019 and an increase in wages. As a percentage of revenue, general and administrative expense decreased to 9.4% in 2019compared to 10.1% in 2018.
Depreciation and Amortization
Depreciation and amortization decreased by $0.8 million, or 3.4%, in 2019 compared to 2018, due primarily to restaurants impaired or closed. As apercentage of revenue, depreciation and amortization decreased to 4.8% in 2019 from 5.0% in 2018.
Pre-Opening Costs
Pre-opening costs increased by $0.4 million in 2019 compared to 2018 due to increased restaurants under construction compared to the prior year.
Restaurant Impairments, Closure Costs and Asset Disposals
Restaurant impairments, closure costs and asset disposals increased by $0.6 million, or 8.5%, in 2019 compared to 2018. In 2019, we recognized $0.4million of closure costs primarily related to five restaurants closed in 2019, most of which were at or approaching the expiration of their leases, comparedt o $4.1 million of closure costs recognized in 2018 primarily related to the closure of 19 restaurants in 2018. Both periods include ongoing costs ofrestaurants closed in previous years.
Additionally, in 2019 we recognized $2.6 million of impairment charges, as well as a $3.6 million write down of assets related to the sale of nine company-owned restaurants to a franchisee that was completed in January of 2020, compared to $1.5 million of impairment charges recognized in 2018. Bothperiods include ongoing equipment costs for restaurants previously impaired.
Each quarter we evaluate possible impairment of property and equipment at the restaurant level and record an impairment loss whenever we determinethat the fair value of these assets is less than their carrying value. There can be no assurance that such evaluations will not result in additional impairmentcosts in future periods.

Loss on Extinguishment of Debt
In May 2018, we entered into a credit facility with U.S. Bank National Association (the “2018 Credit Facility”) and repaid in full our outstandingindebtedness under the prior credit facility with Bank of America, N.A. (the “Prior Credit Facility”) using funds drawn on the 2018 Credit Facility. Uponrepayment, the Prior Credit Facility and all related agreements were terminated. As a result, we wrote off the remaining unamortized balance of debtissuance costs related to the Prior Credit Facility and recognized a loss on extinguishment of debt in the amount of $0.6 million in 2018.
In November 2019, we entered into the first amendment to the 2018 Credit Facility, (the “Amendment” or “Amended Credit Facility”). As a result, we wroteoff unamortized debt issuance costs related to the 2018 Credit Facility and recognized a loss on extinguishment of debt in the amount of $0.7 million in2019.
Interest Expense
Interest expense decreased by $1.4 million, or 31.7% in 2019 compared to 2018. The decrease was the result of a decrease in the average interest rateon our credit facility and lower average debt balances during 2019 compared to 2018.
Provision (Benefit) from Income Taxes
The effective tax rate was 5.9% in 2019 compared to 2.9% in 2018. The effective tax rates in 2019 and 2018 are primarily related to changes in indefinite-lived intangibles. We will continue to maintain a valuation allowance against deferred tax assets until there is sufficient evidence to support a full or partialreversal. The reversal of a previously recorded valuation allowance will generally result in a benefit from income tax.
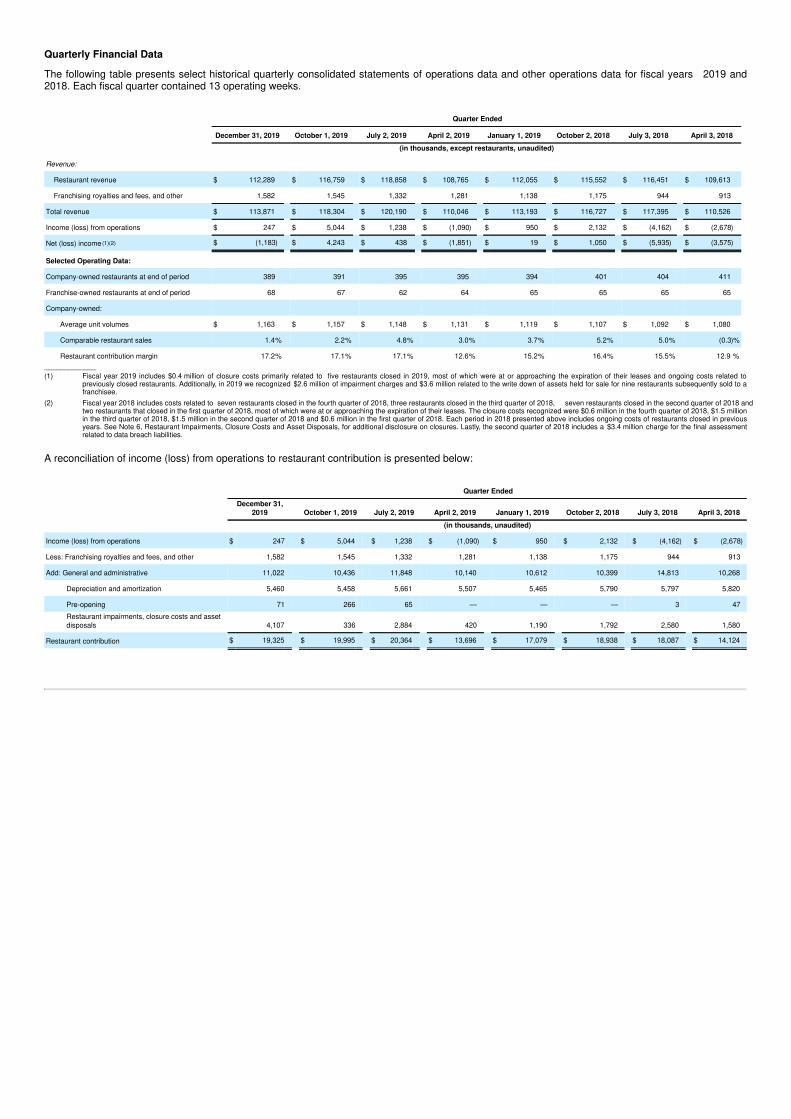
Quarterly Financial Data
The following table presents select historical quarterly consolidated statements of operations data and other operations data for fiscal years 2019 and2018. Each fiscal quarter contained 13 operating weeks.
Quarter Ended
December 31, 2019 October 1, 2019 July 2, 2019 April 2, 2019 January 1, 2019 October 2, 2018 July 3, 2018 April 3, 2018
(in thousands, except restaurants, unaudited)
Revenue: Restaurant revenue $ 112,289 $ 116,759 $ 118,858 $ 108,765 $ 112,055 $ 115,552 $ 116,451 $ 109,613
Franchising royalties and fees, and other 1,582 1,545 1,332 1,281 1,138 1,175 944 913
Total revenue $ 113,871 $ 118,304 $ 120,190 $ 110,046 $ 113,193 $ 116,727 $ 117,395 $ 110,526
Income (loss) from operations $ 247 $ 5,044 $ 1,238 $ (1,090) $ 950 $ 2,132 $ (4,162) $ (2,678)
Net (loss) income (1)(2) $ (1,183) $ 4,243 $ 438 $ (1,851) $ 19 $ 1,050 $ (5,935) $ (3,575)
Selected Operating Data: Company-owned restaurants at end of period 389 391 395 395 394 401 404 411
Franchise-owned restaurants at end of period 68 67 62 64 65 65 65 65
Company-owned: Average unit volumes $ 1,163 $ 1,157 $ 1,148 $ 1,131 $ 1,119 $ 1,107 $ 1,092 $ 1,080
Comparable restaurant sales 1.4% 2.2% 4.8% 3.0% 3.7% 5.2% 5.0% (0.3)%
Restaurant contribution margin 17.2% 17.1% 17.1% 12.6% 15.2% 16.4% 15.5% 12.9 %_____________(1) Fiscal year 2019 includes $0.4 million of closure costs primarily related to five restaurants closed in 2019, most of which were at or approaching the expiration of their leases and ongoing costs related to
previously closed restaurants. Additionally, in 2019 we recognized $2.6 million of impairment charges and $3.6 million related to the write down of assets held for sale for nine restaurants subsequently sold to afranchisee.
(2) Fiscal year 2018 includes costs related to seven restaurants closed in the fourth quarter of 2018, three restaurants closed in the third quarter of 2018, seven restaurants closed in the second quarter of 2018 andtwo restaurants that closed in the first quarter of 2018, most of which were at or approaching the expiration of their leases. The closure costs recognized were $0.6 million in the fourth quarter of 2018, $1.5 millionin the third quarter of 2018, $1.5 million in the second quarter of 2018 and $0.6 million in the first quarter of 2018. Each period in 2018 presented above includes ongoing costs of restaurants closed in previousyears. See Note 6, Restaurant Impairments, Closure Costs and Asset Disposals, for additional disclosure on closures. Lastly, the second quarter of 2018 includes a $3.4 million charge for the final assessmentrelated to data breach liabilities.
A reconciliation of income (loss) from operations to restaurant contribution is presented below:
Quarter Ended
December 31,
2019 October 1, 2019 July 2, 2019 April 2, 2019 January 1, 2019 October 2, 2018 July 3, 2018 April 3, 2018
(in thousands, unaudited)
Income (loss) from operations $ 247 $ 5,044 $ 1,238 $ (1,090) $ 950 $ 2,132 $ (4,162) $ (2,678)
Less: Franchising royalties and fees, and other 1,582 1,545 1,332 1,281 1,138 1,175 944 913
Add: General and administrative 11,022 10,436 11,848 10,140 10,612 10,399 14,813 10,268
Depreciation and amortization 5,460 5,458 5,661 5,507 5,465 5,790 5,797 5,820
Pre-opening 71 266 65 — — — 3 47Restaurant impairments, closure costs and assetdisposals 4,107 336 2,884 420 1,190 1,792 2,580 1,580
Restaurant contribution $ 19,325 $ 19,995 $ 20,364 $ 13,696 $ 17,079 $ 18,938 $ 18,087 $ 14,124
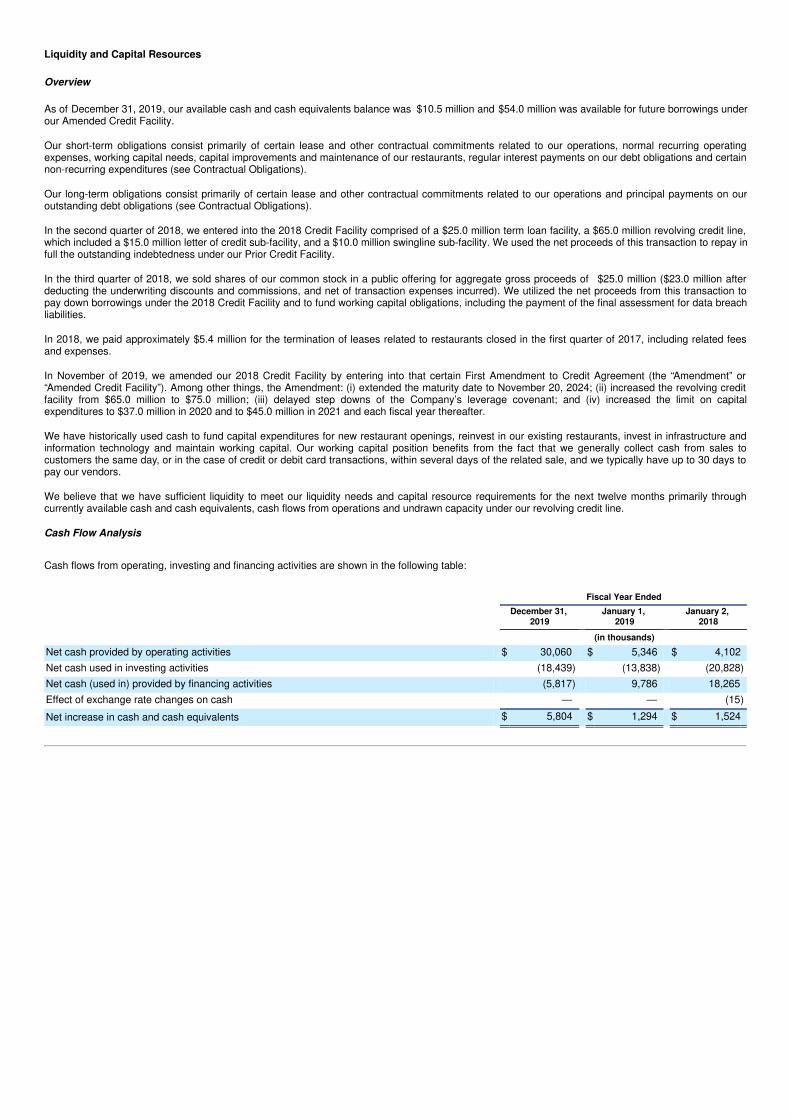
Liquidity and Capital Resources
Overview
As of December 31, 2019, our available cash and cash equivalents balance was $10.5 million and $54.0 million was available for future borrowings underour Amended Credit Facility.
Our short-term obligations consist primarily of certain lease and other contractual commitments related to our operations, normal recurring operatingexpenses, working capital needs, capital improvements and maintenance of our restaurants, regular interest payments on our debt obligations and certainnon-recurring expenditures (see Contractual Obligations).
Our long-term obligations consist primarily of certain lease and other contractual commitments related to our operations and principal payments on ouroutstanding debt obligations (see Contractual Obligations).
In the second quarter of 2018, we entered into the 2018 Credit Facility comprised of a $25.0 million term loan facility, a $65.0 million revolving credit line,which included a $15.0 million letter of credit sub-facility, and a $10.0 million swingline sub-facility. We used the net proceeds of this transaction to repay infull the outstanding indebtedness under our Prior Credit Facility.
In the third quarter of 2018, we sold shares of our common stock in a public offering for aggregate gross proceeds of $25.0 million ($23.0 million afterdeducting the underwriting discounts and commissions, and net of transaction expenses incurred). We utilized the net proceeds from this transaction topay down borrowings under the 2018 Credit Facility and to fund working capital obligations, including the payment of the final assessment for data breachliabilities.
In 2018, we paid approximately $5.4 million for the termination of leases related to restaurants closed in the first quarter of 2017, including related feesand expenses.
In November of 2019, we amended our 2018 Credit Facility by entering into that certain First Amendment to Credit Agreement (the “Amendment” or“Amended Credit Facility”). Among other things, the Amendment: (i) extended the maturity date to November 20, 2024; (ii) increased the revolving creditfacility from $65.0 million to $75.0 million; (iii) delayed step downs of the Company’s leverage covenant; and (iv) increased the limit on capitalexpenditures to $37.0 million in 2020 and to $45.0 million in 2021 and each fiscal year thereafter.
We have historically used cash to fund capital expenditures for new restaurant openings, reinvest in our existing restaurants, invest in infrastructure andinformation technology and maintain working capital. Our working capital position benefits from the fact that we generally collect cash from sales tocustomers the same day, or in the case of credit or debit card transactions, within several days of the related sale, and we typically have up to 30 days topay our vendors.
We believe that we have sufficient liquidity to meet our liquidity needs and capital resource requirements for the next twelve months primarily throughcurrently available cash and cash equivalents, cash flows from operations and undrawn capacity under our revolving credit line.
Cash Flow Analysis
Cash flows from operating, investing and financing activities are shown in the following table:
Fiscal Year Ended
December 31,
2019 January 1,
2019 January 2,
2018
(in thousands)
Net cash provided by operating activities $ 30,060 $ 5,346 $ 4,102Net cash used in investing activities (18,439) (13,838) (20,828)Net cash (used in) provided by financing activities (5,817) 9,786 18,265Effect of exchange rate changes on cash — — (15)Net increase in cash and cash equivalents $ 5,804 $ 1,294 $ 1,524
Operating Activities
Net cash provided by operating activities in 2019 increased $24.7 million compared to 2018. The improvement in operating cash flows resulted from betteroperating results during 2019 compared to 2018, adjusted for non-cash items such as depreciation and amortization, restaurant impairments, closurecosts and asset disposals and stock-based compensation as well as changes in working capital mainly due to changes in accrued expenses and otherliabilities from 2018. Fiscal 2018 included final payments for the data breach liabilities of $11.0 million.
Investing Activities
Net cash used in investing activities was primarily related to new restaurant capital expenditures for the opening of four, one and 12 company-ownedrestaurants in 2019, 2018 and 2017, respectively, as well as infrastructure improvements.
Financing Activities
Net cash used in financing activities was $5.8 million in 2019 largely related to repayments of long-term debt. During 2018, the primary sources and usesof cash from financing activities included net proceeds of $23.0 million from our public offering of our common stock, net of repayments of $12.1 million onlong-term debt.
Capital Resources
Future Capital Expenditure Requirements. Our capital expenditure requirements are primarily dependent upon the pace of our real estate developmentprogram and resulting new restaurant openings, costs for maintenance and remodeling of our existing restaurants, as well as information technologyexpenses and other general corporate capital expenditures.
Our total capital expenditures for 2019 were $17.4 million, and we expect to incur capital expenditures of approximately $20.0 million to $30.0 million in2020, related to our construction of new restaurants before any reductions for landlord reimbursements, reinvestment in existing restaurants andinvestments in technology. We expect such capital expenditures to be funded by a combination of cash from operations and borrowings under ourrevolving credit facility.
Current Resources. Our operations have not required significant working capital and, like many restaurant companies, we operate with negative workingcapital. Restaurant sales are primarily paid for in cash or by credit or debit card, and restaurant operations do not require significant inventories orreceivables. In addition, we receive trade credit for the purchase of food, beverages and supplies, therefore reducing the need for incremental workingcapital to support growth.
Credit Facility
On May 9, 2018, we entered into the 2018 Credit Facility which consists of a term loan facility in an aggregate principal amount of $25.0 million and arevolving line of credit of $65.0 million, which included a letter of credit subfacility in the amount of $15.0 million and a swingline subfacility in the amount of$10.0 million. The 2018 Credit Facility had a four-year term with a maturity date of May 9, 2022.
Upon execution of the 2018 Credit Facility, we repaid in full our outstanding indebtedness under our Prior Credit Facility using funds drawn on our 2018Credit Facility. Upon repayment, the Prior Credit Facility and all related agreements were terminated.
On November 20, 2019, we amended our 2018 Credit Facility by entering into the Amended Credit Facility. Among other things, the Amendment: (i)extended the maturity date to November 20, 2024; (ii) increased the revolving credit facility from $65.0 million to $75.0 million; (iii) delayed step downs ofthe Company’s leverage covenant; and (iv) increased the limit on capital expenditures to $37.0 million in 2020 and to $45.0 million in 2021 and each fiscalyear thereafter.
As of December 31, 2019, we had $42.6 million of indebtedness (excluding $1.4 million of unamortized debt issuance costs) and $3.2 million of letters ofcredit outstanding under the Amended Credit Facility. The term loan requires principal payments of $187,500 per quarter through the third quarter of2021, $375,000 through the third quarter of 2022, $531,250 through the third quarter of 2023 and $625,000 per quarter thereafter through maturity.
The material terms of the Amended Credit Facility also include, among other things, the following financial covenants: (i) a maximum consolidated lease-adjusted leverage ratio covenant; (ii) a minimum consolidated fixed charge coverage ratio covenant; and (iii) a covenant limiting the total capitalexpenditures by us in any fiscal year. Borrowings under the Amended Credit Facility bear interest annually, at our option, at either (i) LIBOR plus a marginof 2.00% to 2.75% per annum, based upon the consolidated total lease-adjusted leverage ratio or (ii) the highest of the following base rates plus a marginof 1.00% to 1.75% per annum: (a) the federal funds rate plus 0.50%; (b) the U.S. Bank prime rate or (c) the one-month LIBOR plus 1.00%. The 2018Credit Facility includes a commitment fee of 0.20% to 0.35% per annum, based upon the consolidated total lease-adjusted leverage ratio, on any unusedportion of the revolving credit facility.
Availability of borrowings under the Amended Credit Facility is conditioned upon our compliance with the terms of the Amendment, including the financialcovenants and other customary affirmative and negative covenants, such as limitations on additional borrowings, acquisitions, dividend payments andlease commitments, and customary representations and warranties. As of December 31, 2019, we were in compliance with all of our debt covenants.
We expect that we will meet all applicable financial covenants in our Amended Credit Facility, including the maximum consolidated total lease-adjustedleverage ratio, through at least the fiscal year ending December 31, 2020. However, there can be no assurance we will meet such financial covenants. Ifsuch covenants are not met, we would be required to seek a waiver or amendment from the banks participating in the credit facility. There can be noassurance that such waiver or amendment would be granted, which could have a material adverse impact on our liquidity.
Our Amended Credit Facility is secured by a pledge of stock of substantially all of our subsidiaries and a lien on substantially all of our and oursubsidiaries’ personal property assets.
Contractual Obligations
Our contractual obligations at December 31, 2019 were as follows:
Payments Due by Period
Total 1 Year 2 - 3
Years 4 - 5
Years After 5Years
(in thousands)
Lease obligations (1) $ 361,646 $ 43,782 $ 85,146 $ 79,996 $ 152,722Purchase obligations (2) 60,725 42,065 9,698 8,962 —Long-term debt (3) 42,618 750 2,594 39,274 —Other liabilities (4) 423 379 22 22 —
Total contractual obligations $ 465,412 $ 86,976 $ 97,460 $ 128,254 $ 152,722_____________(1) We are obligated under non-cancelable leases for our restaurants, administrative offices and equipment. Some restaurant leases provide for contingent rental payments
based on sales thresholds, which are excluded from this table. In addition to the lease obligations reflected in the table, we have legally binding minimum lease payments forleases signed but not yet commenced amounting to $11.0 million.
(2) We enter into various purchase obligations in the ordinary course of business. Our binding purchase obligations relate to volume commitments for beverage and foodproducts.
(3) Reflects the minimum required quarterly principal payments and full payment of our long-term debt at maturity of our credit facility in November 2024. Interest paymentsassociated with variable-rate long-term debt have not been included in the table. Assuming that the remaining unpaid balance on the term loan after minimum requiredquarterly payments and our $17.8 million outstanding revolving line of credit as of December 31, 2019 are repaid at maturity, and utilizing a weighted-average of interestrates in effect as of December 31, 2019, our annual interest payments (including commitment fees and letter of credit fees) on variable-rate long-term debt as ofDecember 31, 2019 is anticipated to be approximately $2.0 million over the next five years through maturity. The future annual interest obligations noted herein areestimated only in relation to debt outstanding as of December 31, 2019 and do not reflect interest obligations on potential future debt. See “Liquidity and Capital Resources”for a discussion of the terms of the revolving credit facility.
(4) Reflects the expected payments associated with our commitment under our non-qualified deferred compensationplan.
Off-Balance Sheet Arrangements
We did not have any off-balance sheet arrangements or obligations as of December 31, 2019.
Critical Accounting Policies and Estimates
Our consolidated financial statements and accompanying notes are prepared in accordance with GAAP. Preparing consolidated financial statementsrequires us to make estimates and assumptions that affect the reported amounts of assets, liabilities, revenue and expenses. These estimates andassumptions are affected by the application of our accounting policies. Our significant accounting policies are described in Note 1, Business and Summaryof Significant Accounting Policies, to our consolidated financial statements. Critical accounting estimates are those that require application ofmanagement’s most difficult, subjective or complex judgments, often as a result of matters that are inherently uncertain and may change in subsequentperiods. While we apply our judgment based on assumptions believed to be reasonable under the circumstances, actual results could vary from theseassumptions. It is possible that materially different amounts would be reported using different assumptions. We believe the critical accounting policiesdescribed below affect our more significant judgments and estimates used in the preparation of our consolidated financial statements.
Impairment of Long-Lived Assets
We review long-lived assets, such as property and equipment, right of use assets and intangibles, subject to amortization, for impairment when events orcircumstances indicate the carrying value of the assets may not be recoverable. In determining the recoverability of the asset value, an analysis isperformed at the individual restaurant level and primarily includes an assessment of historical cash flows and other relevant factors and circumstances.The other factors and circumstances include changes in the economic environment, changes in the manner in which assets are used, unfavorablechanges in legal factors or business climate, incurring excess costs in construction of the asset, overall restaurant operating performance and projectionsfor future performance. These estimates result in a wide range of variability on a year to year basis due to the nature of the criteria. Negative restaurant-level cash flow over the previous 12 periods is considered a potential impairment indicator. In such situations, we evaluate future undiscounted cash flowprojections in conjunction with qualitative factors and future operating plans. Our impairment assessment process requires the use of estimates andassumptions regarding the future undiscounted cash flows and operating outcomes, which are based upon a significant degree of management’sjudgment.
In performing our impairment testing, we forecast our future undiscounted cash flows by looking at recent restaurant level performance, restaurant leveloperating plans, sales trends and cost trends for cost of sales, labor and operating expenses. We believe that this combination of information gives us afair benchmark to estimate future undiscounted cash flows. We compare this cash flow forecast, excluding occupancy rent expense, to the asset’scarrying value, excluding lease liability, at the restaurant. Based on this analysis, if the carrying amount of the assets is greater than the estimated futureundiscounted cash flows, an impairment charge is recognized, measured as the amount by which the carrying amount exceeds the fair value of the asset.
Self-Insurance Programs
We are self-insured for health, workers’ compensation, general and liability and property damage. Predetermined loss limits have been arranged withinsurance companies to limit our per occurrence cash outlay. Estimated costs to settle reported claims and incurred but unreported claims for health andworkers’ compensation self-insured plans are recorded in accrued payroll and benefits and for general and liability and property damage in accruedexpenses and other current liabilities in the Consolidated Balance Sheets.
Leases
We lease all restaurant facilities, office space and certain equipment. Pursuant to FASB Accounting Standards Codification (“ASC”) Topic 842, beginningon January 2, 2019, we record a net operating lease right-of-use (“ROU”) asset and operating lease liability on our Consolidated Balance Sheets for alloperating leases with a contract term in excess of 12 months. Prior to the adoption of ASC Topic 842, these leases were treated as operating leasesunder ASC Topic 840 and therefore were not recorded on our Consolidated Balance Sheets.
ROU assets represent our right to use an underlying asset for the lease term and lease liabilities represent our obligation to make future lease paymentsarising from the lease. Operating lease ROU assets and liabilities are recorded at commencement date based on the present value of lease paymentsover the lease term. To determine the present value of lease payments not yet paid, we estimate incremental borrowing rates corresponding to thereasonably certain lease term. As most of our leases do not provide an implicit rate, we use the incremental borrowing rate based on information availableat commencement date in determining the present value of lease payments. Leases with an initial term of 12 months or less are not recorded on theConsolidated Balance Sheets. We recognize lease expense for these short-term leases on a straight-line basis over the lease term.
Our leases typically contain rent escalations over the lease term. We recognize expense for these leases on a straight-line basis over the lease term.Additionally, tenant incentives used to fund leasehold improvements are recognized when earned and reduce the right-of-use asset related to the lease.These are amortized through the right-of-use asset as reductions of expense over the lease term.

Rent expense for the period prior to the restaurant opening is reported as pre-opening expense in the Consolidated Statements of Operations.
Recently Issued Accounting Pronouncements
Refer to Note 1, Business and Summary of Significant Accounting Policies, of Notes to Consolidated Financial Statements of this report.
ITEM 7A. Quantitative and Qualitative Disclosure about Market Risk
Interest Rate Risk
We are exposed to market risk from changes in interest rates on debt. Our exposure to interest rate fluctuations is limited to our outstanding bank debt,which bears interest at variable rates. As of December 31, 2019, there was $42.6 million in outstanding borrowings under our Amended Credit Facility. Aplus or minus 1.0% in the effective interest rate applied on these loans would have resulted in a pre-tax interest expense fluctuation of approximately $0.4million on an annualized basis.
Commodity Price Risk
We purchase certain products that are affected by commodity prices and are, therefore, subject to price volatility caused by weather, market conditionsand other factors which are not considered predictable or within our control. Although these products are subject to changes in commodity prices, certainpurchasing contracts or pricing arrangements contain risk management techniques designed to minimize price volatility. Typically, we use these types ofpurchasing techniques to control costs as an alternative to directly managing financial instruments to hedge commodity prices. In many cases, we believewe will be able to address material commodity cost increases by adjusting our menu pricing or changing our product delivery strategy. However, increasesin commodity prices, without adjustments to our menu prices, could increase restaurant operating costs as a percentage of restaurant revenue.
Inflation
The primary inflationary factors affecting our operations are food, labor costs, energy costs and materials used in the construction of new restaurants.Increases in the minimum wage directly affect our labor costs. Many of our leases require us to pay taxes, maintenance, repairs, insurance and utilities, allof which are generally subject to inflationary increases. Finally, the cost of constructing our restaurants is subject to inflationary increases in the costs oflabor and material. Over the past five years, inflation has not significantly affected our operating results with the exception of increased wage inflation thataffected our results from 2015 through 2019. We expect wage inflation to continue to affect our results in the near future.
ITEM 8. Financial Statements and Supplementary Data
Noodles & Company
INDEX TO CONSOLIDATED FINANCIAL STATEMENTS
Consolidated Financial Statements Consolidated Balance Sheets as of December 31, 2019 and January 1, 2019 46Consolidated Statements of Operations for the years ended December 31, 2019, January 1, 2019 and January 2, 2018 47Consolidated Statements of Comprehensive Income (Loss) for the years ended December 31, 2019, January 1, 2019 and January 2, 2018 48Consolidated Statements of Stockholders’ Equity for the years ended December 31, 2019, January 1, 2019 and January 2, 2018 49Consolidated Statements of Cash Flows for the years ended December 31, 2019, January 1, 2019 and January 2, 2018 50Notes to Consolidated Financial Statements 51Report of Independent Registered Public Accounting Firm 71
See accompanying notes to consolidated financial statements.
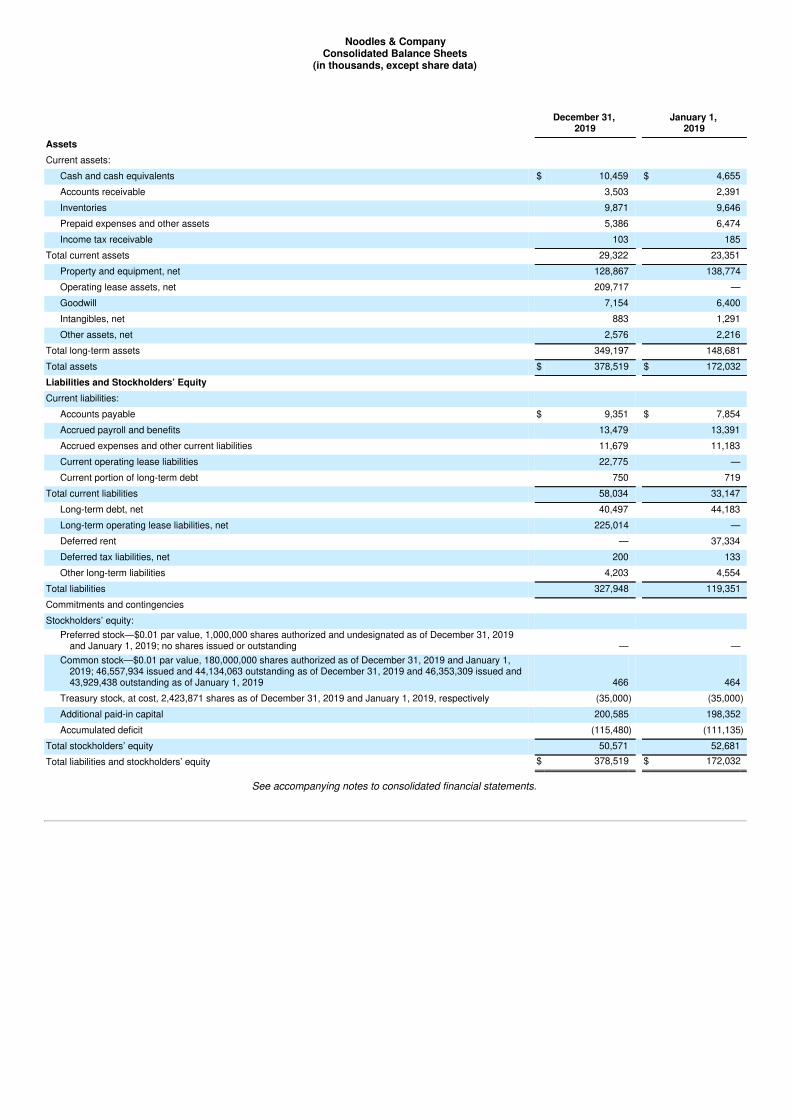
Noodles & CompanyConsolidated Balance Sheets
(in thousands, except share data)
December 31,
2019 January 1,
2019Assets Current assets:
Cash and cash equivalents $ 10,459 $ 4,655Accounts receivable 3,503 2,391Inventories 9,871 9,646Prepaid expenses and other assets 5,386 6,474Income tax receivable 103 185
Total current assets 29,322 23,351Property and equipment, net 128,867 138,774Operating lease assets, net 209,717 —Goodwill 7,154 6,400Intangibles, net 883 1,291Other assets, net 2,576 2,216
Total long-term assets 349,197 148,681Total assets $ 378,519 $ 172,032Liabilities and Stockholders’ Equity Current liabilities:
Accounts payable $ 9,351 $ 7,854Accrued payroll and benefits 13,479 13,391Accrued expenses and other current liabilities 11,679 11,183Current operating lease liabilities 22,775 —Current portion of long-term debt 750 719
Total current liabilities 58,034 33,147Long-term debt, net 40,497 44,183Long-term operating lease liabilities, net 225,014 —Deferred rent — 37,334Deferred tax liabilities, net 200 133Other long-term liabilities 4,203 4,554
Total liabilities 327,948 119,351Commitments and contingencies Stockholders’ equity:
Preferred stock—$0.01 par value, 1,000,000 shares authorized and undesignated as of December 31, 2019and January 1, 2019; no shares issued or outstanding — —
Common stock—$0.01 par value, 180,000,000 shares authorized as of December 31, 2019 and January 1,2019; 46,557,934 issued and 44,134,063 outstanding as of December 31, 2019 and 46,353,309 issued and43,929,438 outstanding as of January 1, 2019 466 464
Treasury stock, at cost, 2,423,871 shares as of December 31, 2019 and January 1, 2019, respectively (35,000) (35,000)Additional paid-in capital 200,585 198,352Accumulated deficit (115,480) (111,135)
Total stockholders’ equity 50,571 52,681Total liabilities and stockholders’ equity $ 378,519 $ 172,032
See accompanying notes to consolidated financial statements.
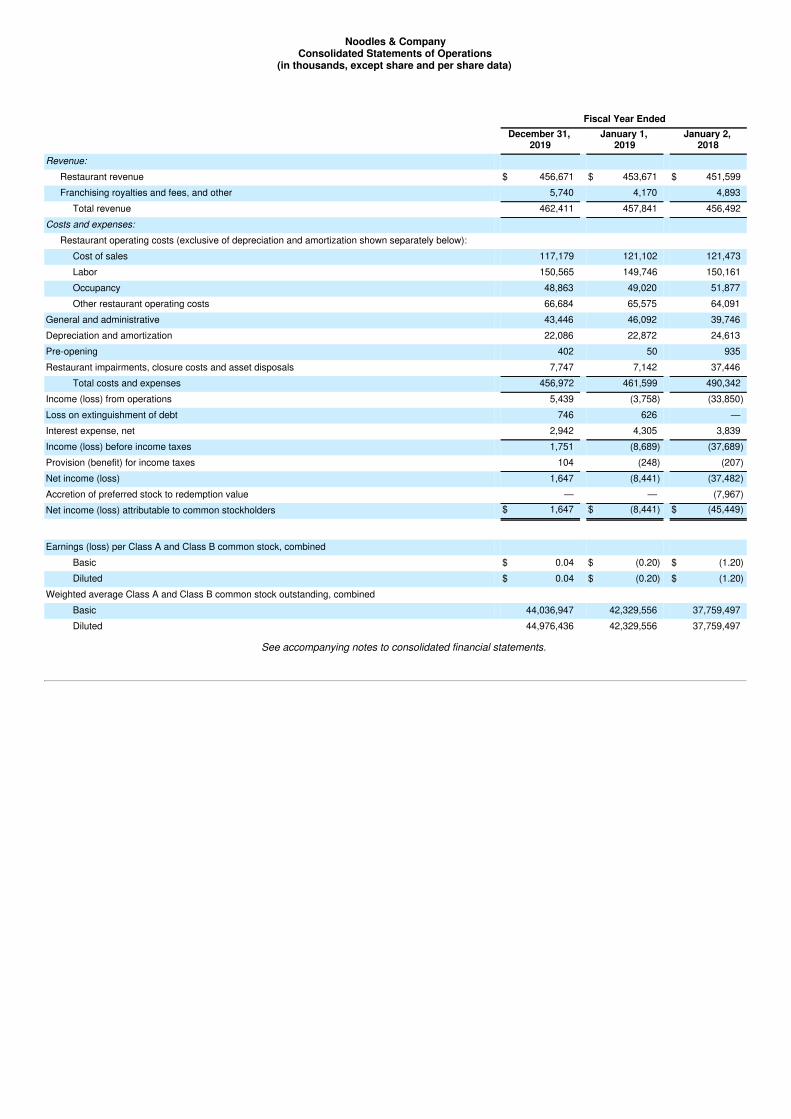
Noodles & CompanyConsolidated Statements of Operations
(in thousands, except share and per share data)
Fiscal Year Ended
December 31,
2019 January 1,
2019 January 2,
2018Revenue:
Restaurant revenue $ 456,671 $ 453,671 $ 451,599Franchising royalties and fees, and other 5,740 4,170 4,893
Total revenue 462,411 457,841 456,492Costs and expenses:
Restaurant operating costs (exclusive of depreciation and amortization shown separately below): Cost of sales 117,179 121,102 121,473Labor 150,565 149,746 150,161Occupancy 48,863 49,020 51,877Other restaurant operating costs 66,684 65,575 64,091
General and administrative 43,446 46,092 39,746Depreciation and amortization 22,086 22,872 24,613Pre-opening 402 50 935Restaurant impairments, closure costs and asset disposals 7,747 7,142 37,446
Total costs and expenses 456,972 461,599 490,342Income (loss) from operations 5,439 (3,758) (33,850)Loss on extinguishment of debt 746 626 —Interest expense, net 2,942 4,305 3,839Income (loss) before income taxes 1,751 (8,689) (37,689)Provision (benefit) for income taxes 104 (248) (207)Net income (loss) 1,647 (8,441) (37,482)Accretion of preferred stock to redemption value — — (7,967)Net income (loss) attributable to common stockholders $ 1,647 $ (8,441) $ (45,449)
Earnings (loss) per Class A and Class B common stock, combined Basic $ 0.04 $ (0.20) $ (1.20)Diluted $ 0.04 $ (0.20) $ (1.20)
Weighted average Class A and Class B common stock outstanding, combined Basic 44,036,947 42,329,556 37,759,497Diluted 44,976,436 42,329,556 37,759,497
See accompanying notes to consolidated financial statements.
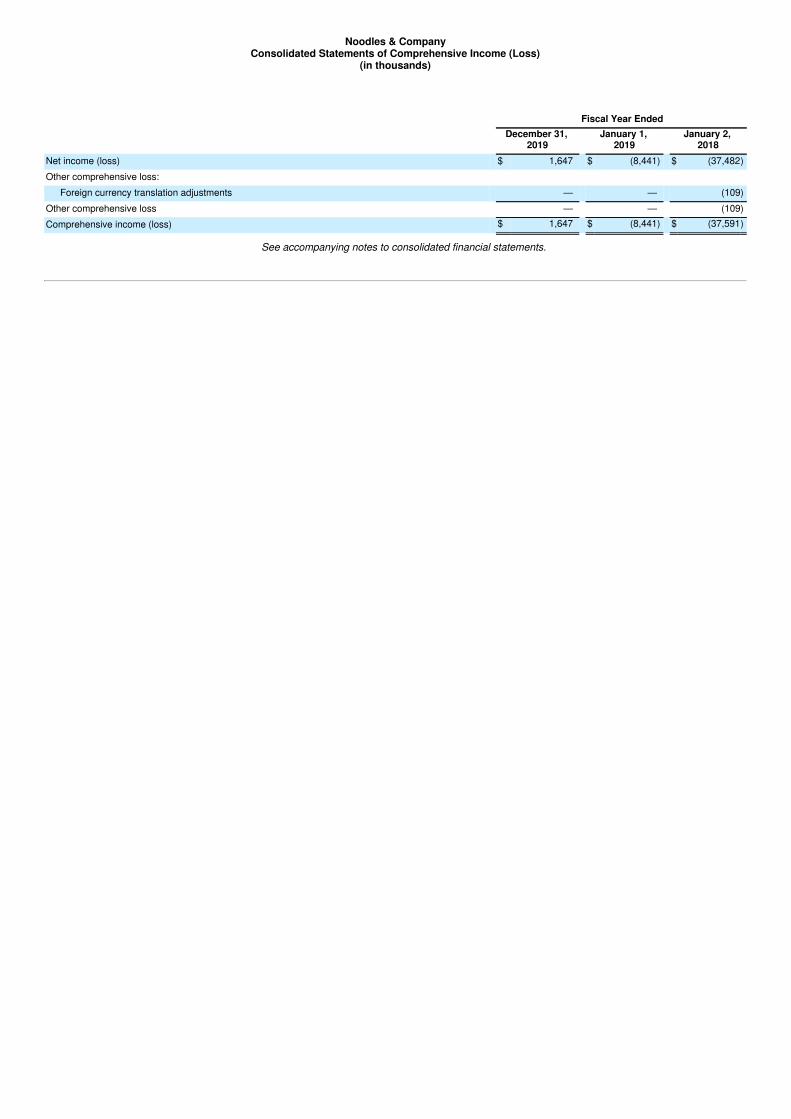
Noodles & CompanyConsolidated Statements of Comprehensive Income (Loss)
(in thousands)
Fiscal Year Ended
December 31,
2019 January 1,
2019 January 2,
2018Net income (loss) $ 1,647 $ (8,441) $ (37,482)Other comprehensive loss:
Foreign currency translation adjustments — — (109)Other comprehensive loss — — (109)Comprehensive income (loss) $ 1,647 $ (8,441) $ (37,591)
See accompanying notes to consolidated financial statements.
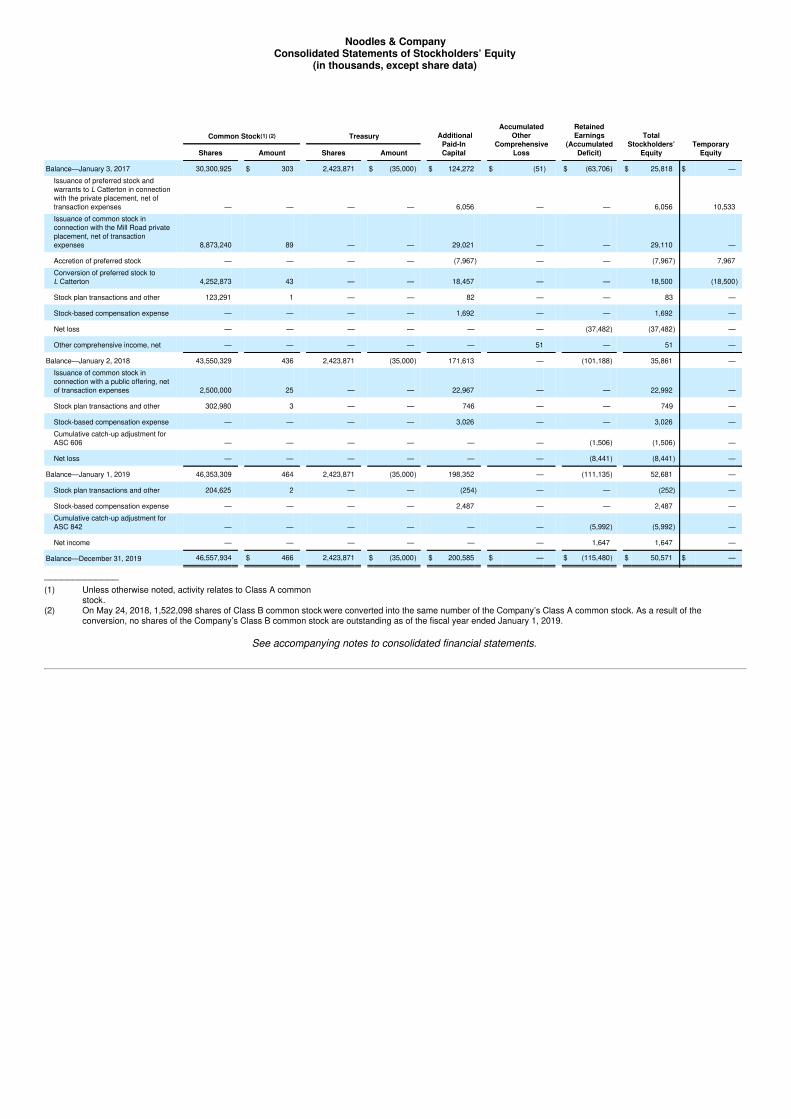
Noodles & CompanyConsolidated Statements of Stockholders’ Equity
(in thousands, except share data)
Common Stock(1) (2) Treasury Additional
Paid-InCapital
Accumulated
OtherComprehensive
Loss
RetainedEarnings
(AccumulatedDeficit)
TotalStockholders’
EquityTemporary
Equity
Shares Amount Shares Amount
Balance—January 3, 2017 30,300,925 $ 303 2,423,871 $ (35,000) $ 124,272 $ (51) $ (63,706) $ 25,818 $ —Issuance of preferred stock andwarrants to L Catterton in connectionwith the private placement, net oftransaction expenses — — — — 6,056 — — 6,056 10,533Issuance of common stock inconnection with the Mill Road privateplacement, net of transactionexpenses 8,873,240 89 — — 29,021 — — 29,110 —
Accretion of preferred stock — — — — (7,967) — — (7,967) 7,967Conversion of preferred stock toL Catterton 4,252,873 43 — — 18,457 — — 18,500 (18,500)
Stock plan transactions and other 123,291 1 — — 82 — — 83 —
Stock-based compensation expense — — — — 1,692 — — 1,692 —
Net loss — — — — — — (37,482) (37,482) —
Other comprehensive income, net — — — — — 51 — 51 —
Balance—January 2, 2018 43,550,329 436 2,423,871 (35,000) 171,613 — (101,188) 35,861 —Issuance of common stock inconnection with a public offering, netof transaction expenses 2,500,000 25 — — 22,967 — — 22,992 —
Stock plan transactions and other 302,980 3 — — 746 — — 749 —
Stock-based compensation expense — — — — 3,026 — — 3,026 —Cumulative catch-up adjustment forASC 606 — — — — — — (1,506) (1,506) —
Net loss — — — — — — (8,441) (8,441) —
Balance—January 1, 2019 46,353,309 464 2,423,871 (35,000) 198,352 — (111,135) 52,681 —
Stock plan transactions and other 204,625 2 — — (254) — — (252) —
Stock-based compensation expense — — — — 2,487 — — 2,487 —Cumulative catch-up adjustment forASC 842 — — — — — — (5,992) (5,992) —
Net income — — — — — — 1,647 1,647 —
Balance—December 31, 2019 46,557,934 $ 466 2,423,871 $ (35,000) $ 200,585 $ — $ (115,480) $ 50,571 $ —
_____________(1) Unless otherwise noted, activity relates to Class A common
stock.(2) On May 24, 2018, 1,522,098 shares of Class B common stock were converted into the same number of the Company’s Class A common stock. As a result of the
conversion, no shares of the Company’s Class B common stock are outstanding as of the fiscal year ended January 1, 2019.
See accompanying notes to consolidated financial statements.
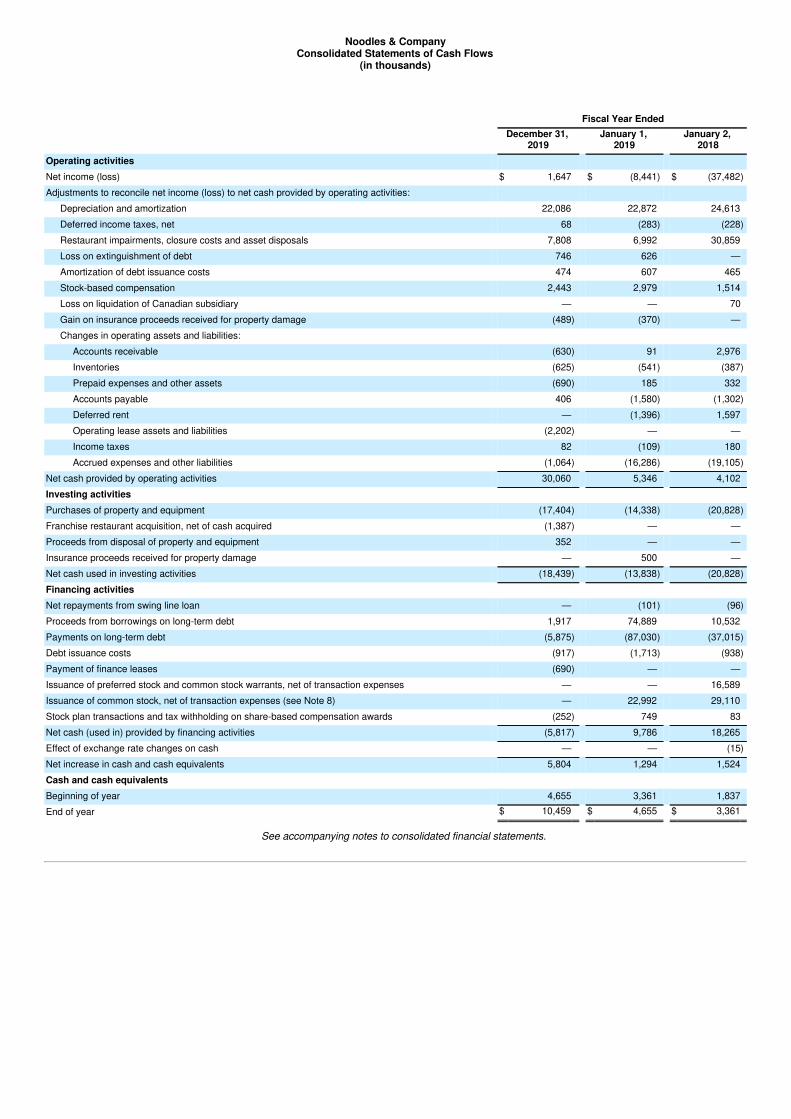
Noodles & CompanyConsolidated Statements of Cash Flows
(in thousands)
Fiscal Year Ended
December 31,
2019 January 1,
2019 January 2,
2018Operating activities Net income (loss) $ 1,647 $ (8,441) $ (37,482)Adjustments to reconcile net income (loss) to net cash provided by operating activities:
Depreciation and amortization 22,086 22,872 24,613Deferred income taxes, net 68 (283) (228)Restaurant impairments, closure costs and asset disposals 7,808 6,992 30,859Loss on extinguishment of debt 746 626 —Amortization of debt issuance costs 474 607 465Stock-based compensation 2,443 2,979 1,514Loss on liquidation of Canadian subsidiary — — 70Gain on insurance proceeds received for property damage (489) (370) —Changes in operating assets and liabilities:
Accounts receivable (630) 91 2,976Inventories (625) (541) (387)Prepaid expenses and other assets (690) 185 332Accounts payable 406 (1,580) (1,302)Deferred rent — (1,396) 1,597Operating lease assets and liabilities (2,202) — —Income taxes 82 (109) 180Accrued expenses and other liabilities (1,064) (16,286) (19,105)
Net cash provided by operating activities 30,060 5,346 4,102Investing activities Purchases of property and equipment (17,404) (14,338) (20,828)Franchise restaurant acquisition, net of cash acquired (1,387) — —Proceeds from disposal of property and equipment 352 — —Insurance proceeds received for property damage — 500 —Net cash used in investing activities (18,439) (13,838) (20,828)Financing activities Net repayments from swing line loan — (101) (96)Proceeds from borrowings on long-term debt 1,917 74,889 10,532Payments on long-term debt (5,875) (87,030) (37,015)Debt issuance costs (917) (1,713) (938)Payment of finance leases (690) — —Issuance of preferred stock and common stock warrants, net of transaction expenses — — 16,589Issuance of common stock, net of transaction expenses (see Note 8) — 22,992 29,110Stock plan transactions and tax withholding on share-based compensation awards (252) 749 83Net cash (used in) provided by financing activities (5,817) 9,786 18,265Effect of exchange rate changes on cash — — (15)Net increase in cash and cash equivalents 5,804 1,294 1,524Cash and cash equivalents Beginning of year 4,655 3,361 1,837End of year $ 10,459 $ 4,655 $ 3,361
See accompanying notes to consolidated financial statements.
NOODLES & COMPANY
NOTES TO CONSOLIDATED FINANCIAL STATEMENTS
1. Business and Summary of Significant Accounting Policies
Business
Noodles & Company (the “Company” or “Noodles & Company”), a Delaware corporation, develops and operates fast-casual restaurants that serveglobally-inspired noodle and pasta dishes, soups, salads and appetizers. As of December 31, 2019, the Company had 389 company-owned restaurantsand 68 franchise restaurants in 29 states and the District of Columbia. The Company operates its business as one operating and reportable segment.
Principles of Consolidation and Basis of Presentation
The accompanying consolidated financial statements include the accounts of Noodles & Company and its subsidiaries. All intercompany balances andtransactions are eliminated in consolidation.
Fiscal Year
The Company operates on a 52- or 53-week fiscal year ending on the Tuesday closest to December 31. Fiscal years 2019, 2018 and 2017, which endedon December 31, 2019, January 1, 2019, and January 2, 2018, respectively, each contained 52 weeks.
Estimates
The preparation of financial statements in conformity with accounting principles generally accepted in the United States of America (“GAAP”) requiresmanagement to make estimates and assumptions that affect the reported amounts of assets and liabilities and disclosure of contingent assets andliabilities as of the date of the financial statements and the reported amounts of revenue and expenses during the reporting period. Actual results coulddiffer from those estimates.
Cash and Cash Equivalents
The Company considers all highly liquid investment instruments with an initial maturity of three months or less when purchased to be cash equivalents.Amounts receivable from credit card processors are converted to cash shortly after the related sales transaction and are considered to be cashequivalents because they are both short-term and highly liquid in nature. Amounts receivable from credit card processors as of December 31, 2019 andJanuary 1, 2019, which are included in cash and cash equivalents, were $1.0 million and $1.6 million, respectively. Additionally, the Company records“book overdrafts” when outstanding checks at year end are in excess of cash and cash equivalents. Such book overdrafts are recorded within accountspayable in the accompanying Consolidated Balance Sheets and within operating activities in the accompanying Consolidated Statements of Cash Flows.
Accounts Receivable
Accounts receivable consists primarily of franchise receivables and vendor rebates, as well insurance receivables and other miscellaneous receivablesarising from the normal course of business. The Company believes all amounts to be collectible and does not have a history of losses. Accordingly, noallowance for doubtful accounts has been recorded as of December 31, 2019 or January 1, 2019.
Inventories
Inventories consist of food, beverages, supplies and smallwares, and are stated at the lower of cost (first-in, first-out method) or net realizable value.Smallwares inventory, which consist of the plates, silverware and cooking utensils used in the restaurants, are frequently replaced and are thereforeconsidered current assets. Replacement costs of smallwares inventory are recorded as other restaurant operating costs in the Consolidated Statements ofOperations and are expensed as incurred. As of December 31, 2019 and January 1, 2019, smallwares inventory of $6.6 million and $6.5 million,respectively, was included in the accompanying Consolidated Balance Sheets.
NOODLES & COMPANY
NOTES TO CONSOLIDATED FINANCIAL STATEMENTS (Continued)
Property and Equipment
Property and equipment are stated at cost, less accumulated depreciation. Expenditures for major renewals and improvements are capitalized, whileexpenditures for minor replacements and maintenance and repairs are expensed as incurred. Upon retirement or disposal of assets, the accounts arerelieved of cost and accumulated depreciation and the related gain or loss is reflected in earnings. Depreciation is calculated using the straight-line methodover the estimated useful lives of the assets. Leasehold improvements are amortized over the shorter of the estimated useful life or the lease term, whichgenerally includes option periods that are reasonably assured to be exercised. Depreciation and amortization expense on property and equipment,including assets recorded as finance leases, was $22.0 million, $22.7 million and $24.5 million in 2019, 2018 and 2017, respectively.
The estimated useful lives for property and equipment are:
Property and Equipment Estimated Useful LivesLeasehold improvements Shorter of lease term or estimated useful life, not to exceed 20 yearsFurniture and fixtures 3 to 15 yearsEquipment 3 to 7 years
The Company capitalizes internal payroll and payroll-related costs directly related to the successful acquisition, development, design and construction ofits new restaurants. Capitalized internal costs were $0.4 million, $0.2 million and $0.9 million in 2019, 2018 and 2017, respectively. Interest incurred onfunds used to construct company-owned restaurants is capitalized and amortized over the estimated useful life of the related assets. Capitalized interesttotaled $0.3 million, $0.1 million and $0.2 million in 2019, 2018 and 2017, respectively.
Goodwill
Goodwill represents the excess of purchase price over the fair value of identifiable net assets acquired. Goodwill is not subject to amortization, but insteadis tested for impairment at least annually (or more often, if necessary) as of the first day of the Company’s fourth fiscal quarter.
Goodwill is evaluated at the level of the Company’s single operating segment, which also represents the Company’s only reporting unit. In 2019 and 2018,the Company performed a qualitative impairment assessment. Under this approach, the Company first assesses qualitative factors to determine whetherit is more likely than not that the fair value of its reporting unit is less than its carrying amount as a basis for determining whether it is necessary to performthe two-step goodwill impairment test. The more-likely-than-not threshold is defined as having a likelihood of more than 50 percent. If after performing thequalitative assessment, the Company determines there is less than a 50 percent chance that the fair value of its reporting unit is less than its carryingamount, then performing the two-step test is unnecessary. Based on the qualitative assessment performed, management did not believe that it is morelikely than not that the Company’s goodwill has been impaired.
In 2017, the Company performed the two-step quantitative analysis. Under the two-step approach, step one of the impairment test is based upon acomparison of the carrying value of net assets, including goodwill balances, to the fair value of net assets. Fair value is measured using a combination ofthe income approach and the market approach. The income approach consists of utilizing the discounted cash flow method that incorporates theCompany’s estimates of future revenues and costs, discounted using a risk-adjusted discount rate.
Based on the Company’s analysis, no impairment charges were recognized on goodwill in 2019, 2018 or 2017.
Intangibles, net
Intangibles, net consists primarily of reacquired franchise rights, trademarks and transferable liquor licenses. The Company amortizes the fair value ofreacquired franchise rights over the remaining contractual terms of the reacquired franchise area development agreements at the time of acquisition,which ranged from approximately six years to 13 years as of December 31, 2019. Trademark rights are considered indefinite-lived intangible assets, thecarrying value of which are analyzed for impairment at least annually (or more often, if necessary). Transferable liquor licenses are carried at the lower ofcost or fair value and are evaluated annually for impairment or whenever events or changes in circumstances indicate that the carrying amount may notbe recoverable.
NOODLES & COMPANY
NOTES TO CONSOLIDATED FINANCIAL STATEMENTS (Continued)
Impairment of Long-Lived Assets
Long-lived assets are reviewed for impairment whenever events or changes in circumstances indicate that the carrying amount of an asset may not berecoverable. Recoverability of assets is measured by a comparison of the carrying amount of the assets to the future undiscounted net cash flowsexpected to be generated by the assets. Identifiable cash flows are measured at the lowest level for which they are largely independent of the cash flowsof other groups of assets and liabilities, generally at the restaurant level. If the assets are determined to be impaired, the amount of impairment recognizedis measured by the amount by which the carrying amount of the assets exceeds their fair value. Estimates of future cash flows are based on theCompany’s experience and knowledge of local operations. During 2019, 2018 and 2017, the Company recorded impairment charges of certain long-livedassets which are included in restaurant impairments, closure costs and asset disposals in the Consolidated Statements of Operations. See Note 6,Restaurant Impairments, Closure Costs and Asset Disposals . Fair value of the restaurant assets was determined using Level 3 inputs (as described inNote 5, Fair Value Measurements).
Debt Issuance Costs
Certain fees and costs incurred to obtain long-term financing are capitalized and included as a reduction in the net carrying value of long-term debt, net ofaccumulated amortization. These costs are amortized to interest expense over the term of the related debt. When debt is extinguished prior to its maturitydate, the amortization of the remaining unamortized debt issuance costs, or pro-rata portion thereof, is charged to loss on extinguishment of debt. Debtissuance costs of $1.4 million and $1.7 million, net of accumulated amortization, as of December 31, 2019 and January 1, 2019, respectively, are includedas a reduction of long-term debt in the Consolidated Balance Sheets.
Self-Insurance Programs
The Company self-insures for health, workers’ compensation, general liability and property damage. Predetermined loss limits have been arranged withinsurance companies to limit the Company’s per occurrence cash outlay. Estimated costs to settle reported claims and incurred but unreported claims forhealth and workers’ compensation self-insured plans are recorded in accrued payroll and benefits and for general liability and property damage in accruedexpenses and other liabilities in the Consolidated Balance Sheets.
Concentrations of Credit Risk
Financial instruments that potentially subject the Company to concentrations of credit risk consist primarily of cash and cash equivalents and accountsreceivable. The Company’s cash balances may exceed federally insured limits. Credit card transactions at the Company’s restaurants are processed byone service provider. Concentration of credit risk related to accounts receivable are limited, as the Company’s receivables are primarily amounts due fromfranchisees and the Company directly pulls the amounts owed from the franchisees bank accounts.
Revenue Recognition
Revenue consists of sales from restaurant operations and franchise royalties and fees. Revenue from the operation of company-owned restaurants arerecognized when sales occur. The Company reports revenue net of sales and use taxes collected from customers and remitted to governmental taxingauthorities.
Gift Cards
The Company sells gift cards which do not have an expiration date, and it does not deduct non-usage fees from outstanding gift card balances. TheCompany recognizes revenue from gift cards when the gift card is redeemed by the customer or the Company determines the likelihood of the gift cardbeing redeemed by the customer is remote (“gift card breakage”). The determination of the gift card breakage rate is based upon Company-specifichistorical redemption patterns. The Company has determined that approximately 9% of gift cards will not be redeemed, which is recognized ratably overthe estimated redemption period of the gift card, approximately 24 months.
Loyalty Program
Beginning in 2019, Customers who register on the Noodles App are automatically enrolled in the Noodles Rewards program, which is primarily a spend-based loyalty program. With each purchase, Noodles Rewards members earn loyalty points that can be redeemed for rewards, including free products.Using an estimate of the value of reward redemptions, we defer revenue associated with points earned, net of estimated points that will not be redeemed.Points generally expire after six months. Revenue is recognized in a future period when the reward points are redeemed.
NOODLES & COMPANY
NOTES TO CONSOLIDATED FINANCIAL STATEMENTS (Continued)
Franchise Royalties
Royalties from franchise restaurants are based on a percentage of restaurant revenues and are recognized in the period the related franchisedrestaurants’ sales occur. Development fees and franchise fees, portions of which are collected in advance, are nonrefundable. The Company hasdetermined that the initial franchise services are not distinct from the continuing rights or services offered during the term of the franchise agreement andshould be treated as a single performance obligation; therefore, such fees are recognized in income ratably over the term of the related franchiseagreement or recognized upon the termination of the agreement between the Company and the franchisee.
As of December 31, 2019, January 1, 2019 and January 2, 2018, there were 68, 65 and 66 franchise restaurants in operation, respectively. Franchiseesopened one restaurant and acquired five company-owned locations in 2019 and opened three restaurants in 2017. There were no franchise restaurantsopened in 2018.
Pre-Opening Costs
Pre-opening costs, including rent, wages, benefits and travel for the training and opening teams, food, beverage and other restaurant operating costs, areexpensed as incurred prior to a restaurant opening for business.
Advertising and Marketing Costs
Advertising and marketing costs are expensed as incurred and were $6.1 million, $6.0 million and $5.7 million in 2019, 2018 and 2017, respectively.These costs are included in restaurant operating costs, general and administrative expenses and pre-opening costs based on the nature of the advertisingand marketing costs incurred.
Rent
Rent expense for the Company’s leases, which generally have escalating rentals over the term of the lease, is recorded on a straight-line basis over thelease term. Additionally, tenant incentives used to fund leasehold improvements are recognized when earned and reduce the right-of-use asset related tothe lease. These are amortized through the right-of-use asset as reductions of expense over the lease term. Some of the Company’s leases include rentescalations based on inflation indexes and fair market value adjustments. Certain leases contain contingent rental provisions that include a fixed base rentplus an additional percentage of the restaurant’s sales in excess of stipulated amounts. Lease expense associated with rent escalation and contingentrental provisions is not material and is included within operating lease cost. Operating lease liabilities are calculated using the prevailing index or rate atlease commencement. Subsequent escalations in the index or rate and contingent rental payments are recognized as variable lease expenses. Our leaseagreements do not contain any material residual value guarantees or material restrictive covenants.
As most of the Company’s leases do not provide an implicit rate, the Company used its incremental borrowing rate based on the information available atcommencement date in determining the present value of lease payments.
Provision (Benefit) for Income Taxes
Provision (benefit) for income taxes is accounted for under the asset and liability method. Deferred tax assets and liabilities are recognized for the futuretax consequences attributable to differences between the financial statement carrying amounts of existing assets and liabilities and their respective taxbases and operating loss and tax credit carry forwards. Deferred tax assets and liabilities are measured using enacted tax rates expected to apply totaxable income in the years in which those deferred amounts are expected to be recovered or settled. Valuation allowances are recorded for deferred taxassets that more likely than not will not be realized. The effect on deferred tax assets and liabilities of a change in tax rates is recognized in income in theperiod that includes the enactment date. The Company’s policy is to recognize interest to be paid on an underpayment of income taxes in interest expenseand any related statutory penalties in provision (benefit) for income taxes in the Consolidated Statements of Operations.
Stock-Based Compensation Expense
Stock-based compensation expense is measured at the grant date based upon the estimated fair value of the portion of the award that is ultimatelyexpected to vest and is recognized as expense over the applicable vesting period of the award generally using the straight-line method (see Note 9,Stock-Based Compensation for more information).
Foreign Currency Translation
In 2017, the Company ceased its Canadian operations and liquidated the related assets. The Canadian dollar was the functional currency for theCompany’s Canadian restaurant operations. Assets and liabilities denominated in Canadian dollars were translated into U.S. dollars at exchange rates ineffect as of the balance sheet dates. Income and expense accounts were translated using the
NOODLES & COMPANY
NOTES TO CONSOLIDATED FINANCIAL STATEMENTS (Continued)
average exchange rates prevailing throughout the period. Translation adjustments from currency exchange were recorded in accumulated othercomprehensive income (loss) as a separate component of stockholders’ equity. Gains or losses from foreign currency transactions were recognized in theConsolidated Statements of Operations.
Recently Issued Accounting Pronouncements
In December 2019, the FASB issued ASU No. 2019-12, Income Taxes (Topic 740): Simplifying the Accounting for Income Taxes (“ASU 2019-12”). ASU2019-12 was issued as a means to reduce the complexity of accounting for income taxes for those entities that fall within the scope of the accountingstandard. The guidance is to be applied using a prospective method, excluding amendments related to franchise taxes, which should be applied on eithera retrospective basis for all periods presented or a modified retrospective basis through a cumulative-effect adjustment to retained earnings as of thebeginning of the fiscal year of adoption. We are currently evaluating the impacts of adoption of the new guidance to our consolidated financial statements.
In June 2016, the FASB issued ASU No. 2016-13, Financial Instruments-Credit Losses (Topic 326): Measurement of Credit Losses on FinancialInstruments, followed by other related ASUs that provided targeted improvements (collectively “ASU 2016-13”). ASU 2016-13 provides financial statementusers with more decision-useful information about the expected credit losses on financial instruments and other commitments to extend credit held by areporting entity at each reporting date. The guidance is to be applied using a modified retrospective method and is effective for fiscal years beginning afterDecember 15, 2022 for smaller reporting companies, with early adoption permitted. The Company adopted ASU 2016-13 on January 1, 2020. Theadoption of ASU 2016-13 is not expected to result in a material impact to the Company’s consolidated financial statements or disclosures.
Recently Adopted Accounting Pronouncements
In May 2014, the FASB issued ASU No. 2014-09, Revenue from Contracts with Customers (Topic 606) , which supersedes the revenue recognitionrequirements in Accounting Standards Codification 605, “Revenue Recognition.” This ASU is based on the principle that revenue is recognized to depictthe transfer of goods or services to customers in an amount that reflects the consideration to which the entity expects to be entitled in exchange for thosegoods or services. The ASU also requires additional disclosure about the nature, amount, timing and uncertainty of revenue and cash flows arising fromcustomer contracts, including significant judgments and changes in judgments and assets recognized from costs incurred to obtain or fulfill a contract.
The Company adopted Topic 606 at the beginning of the first quarter of 2018 using the modified retrospective method. The comparative information forfiscal 2017 has not been restated and continues to be reported under the accounting standards then in effect for those periods. The adoption of thesestandards did not have a material impact on the Company’s Consolidated Statements of Operations in 2018. The primary impact of adoption was theenhancement of the Company’s disclosures related to contracts with customers and revenue recognized from those performance obligations, whichincludes revenue related to initial fees charged to franchisees and revenue recognized related to gift cards. See Note 16, Revenue Recognition.
Further, the Company implemented internal controls related to the recognition and presentation of the Company’s revenues under this new standard.
On January 2, 2019, the Company adopted ASU 2016-02, “ Leases (Topic 842),” along with related clarifications and improvements. This pronouncementrequires a lessee to recognize a liability for lease obligations, which represents the discounted obligation to make future lease payments, and acorresponding right-of-use asset on the balance sheet. The guidance also requires certain qualitative and quantitative disclosures about the amount,timing and uncertainty of cash flows arising from leases. The Company elected the alternative transition method to apply the standard as of the beginningof the period of adoption; therefore, the Company has not applied the standard to the comparative periods presented on its condensed consolidatedfinancial statements.
The adoption of this lease guidance did have a material impact on the Company’s Consolidated Balance Sheets by materially increasing its non-currentassets and current and non-current liabilities due to the recognition of the right-of-use assets and related lease liabilities primarily related to theCompany’s restaurant operating leases and corporate office space. Upon adoption, the right-of-use assets were based upon the operating lease liabilitiesadjusted for prepaid and deferred rent, liabilities associated with lease termination costs and impairment of right-of-use assets. The impairment of right-of-use assets upon adoption was recognized in retained earnings as of January 2, 2019.
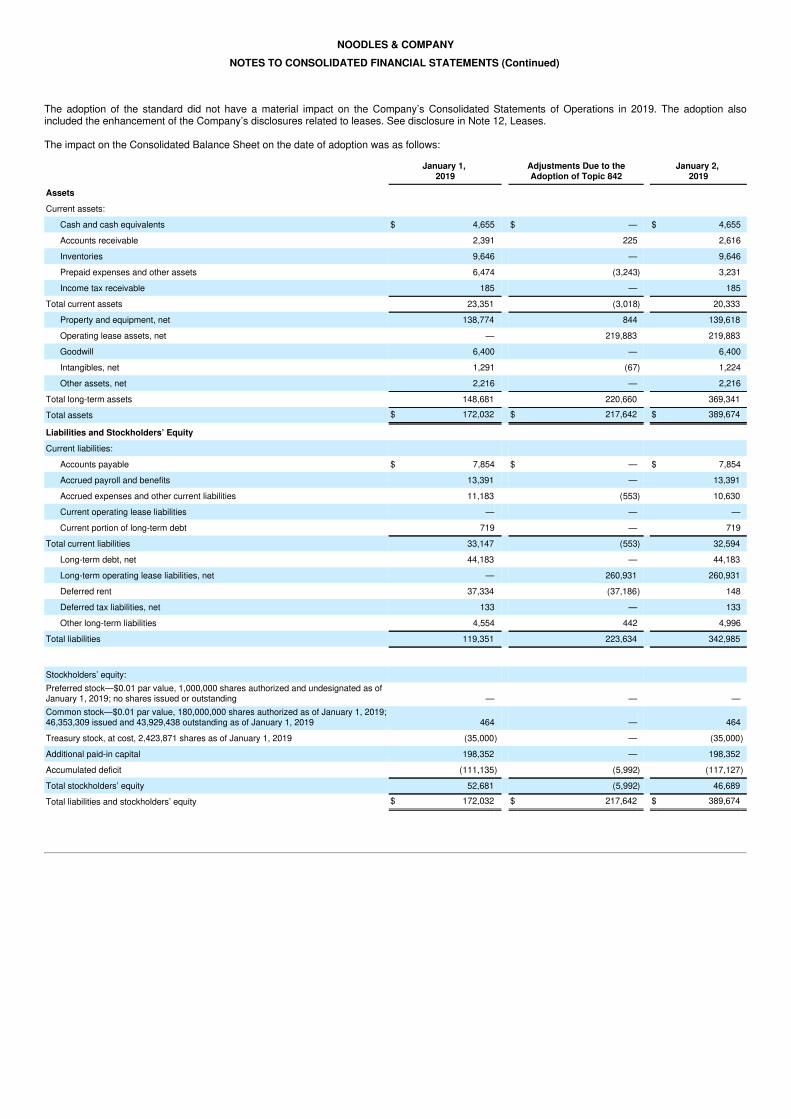
NOODLES & COMPANY
NOTES TO CONSOLIDATED FINANCIAL STATEMENTS (Continued)
The adoption of the standard did not have a material impact on the Company’s Consolidated Statements of Operations in 2019. The adoption alsoincluded the enhancement of the Company’s disclosures related to leases. See disclosure in Note 12, Leases.
The impact on the Consolidated Balance Sheet on the date of adoption was as follows:
January 1,
2019 Adjustments Due to theAdoption of Topic 842
January 2, 2019
Assets Current assets:
Cash and cash equivalents $ 4,655 $ — $ 4,655
Accounts receivable 2,391 225 2,616
Inventories 9,646 — 9,646
Prepaid expenses and other assets 6,474 (3,243) 3,231
Income tax receivable 185 — 185
Total current assets 23,351 (3,018) 20,333
Property and equipment, net 138,774 844 139,618
Operating lease assets, net — 219,883 219,883
Goodwill 6,400 — 6,400
Intangibles, net 1,291 (67) 1,224
Other assets, net 2,216 — 2,216
Total long-term assets 148,681 220,660 369,341
Total assets $ 172,032 $ 217,642 $ 389,674
Liabilities and Stockholders’ Equity Current liabilities:
Accounts payable $ 7,854 $ — $ 7,854
Accrued payroll and benefits 13,391 — 13,391
Accrued expenses and other current liabilities 11,183 (553) 10,630
Current operating lease liabilities — — —
Current portion of long-term debt 719 — 719
Total current liabilities 33,147 (553) 32,594
Long-term debt, net 44,183 — 44,183
Long-term operating lease liabilities, net — 260,931 260,931
Deferred rent 37,334 (37,186) 148
Deferred tax liabilities, net 133 — 133
Other long-term liabilities 4,554 442 4,996
Total liabilities 119,351 223,634 342,985
Stockholders’ equity: Preferred stock—$0.01 par value, 1,000,000 shares authorized and undesignated as ofJanuary 1, 2019; no shares issued or outstanding — — —Common stock—$0.01 par value, 180,000,000 shares authorized as of January 1, 2019;46,353,309 issued and 43,929,438 outstanding as of January 1, 2019 464 — 464
Treasury stock, at cost, 2,423,871 shares as of January 1, 2019 (35,000) — (35,000)
Additional paid-in capital 198,352 — 198,352
Accumulated deficit (111,135) (5,992) (117,127)
Total stockholders’ equity 52,681 (5,992) 46,689
Total liabilities and stockholders’ equity $ 172,032 $ 217,642 $ 389,674
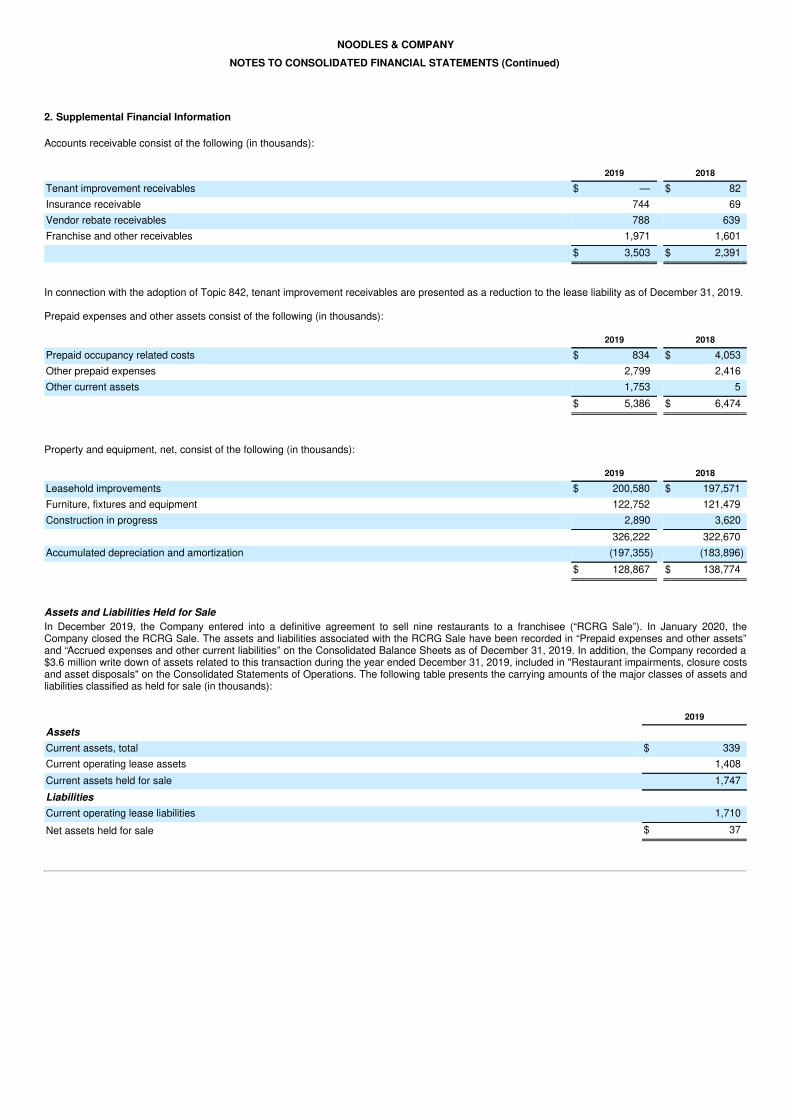
NOODLES & COMPANY
NOTES TO CONSOLIDATED FINANCIAL STATEMENTS (Continued)
2. Supplemental Financial Information
Accounts receivable consist of the following (in thousands):
2019 2018
Tenant improvement receivables $ — $ 82Insurance receivable 744 69Vendor rebate receivables 788 639Franchise and other receivables 1,971 1,601 $ 3,503 $ 2,391
In connection with the adoption of Topic 842, tenant improvement receivables are presented as a reduction to the lease liability as of December 31, 2019.
Prepaid expenses and other assets consist of the following (in thousands):
2019 2018
Prepaid occupancy related costs $ 834 $ 4,053Other prepaid expenses 2,799 2,416Other current assets 1,753 5 $ 5,386 $ 6,474
Property and equipment, net, consist of the following (in thousands):
2019 2018
Leasehold improvements $ 200,580 $ 197,571Furniture, fixtures and equipment 122,752 121,479Construction in progress 2,890 3,620 326,222 322,670Accumulated depreciation and amortization (197,355) (183,896) $ 128,867 $ 138,774
Assets and Liabilities Held for SaleIn December 2019, the Company entered into a definitive agreement to sell nine restaurants to a franchisee (“RCRG Sale”). In January 2020, theCompany closed the RCRG Sale. The assets and liabilities associated with the RCRG Sale have been recorded in “Prepaid expenses and other assets”and “Accrued expenses and other current liabilities” on the Consolidated Balance Sheets as of December 31, 2019. In addition, the Company recorded a$3.6 million write down of assets related to this transaction during the year ended December 31, 2019, included in "Restaurant impairments, closure costsand asset disposals" on the Consolidated Statements of Operations. The following table presents the carrying amounts of the major classes of assets andliabilities classified as held for sale (in thousands):
2019
Assets Current assets, total $ 339Current operating lease assets 1,408Current assets held for sale 1,747Liabilities Current operating lease liabilities 1,710Net assets held for sale $ 37
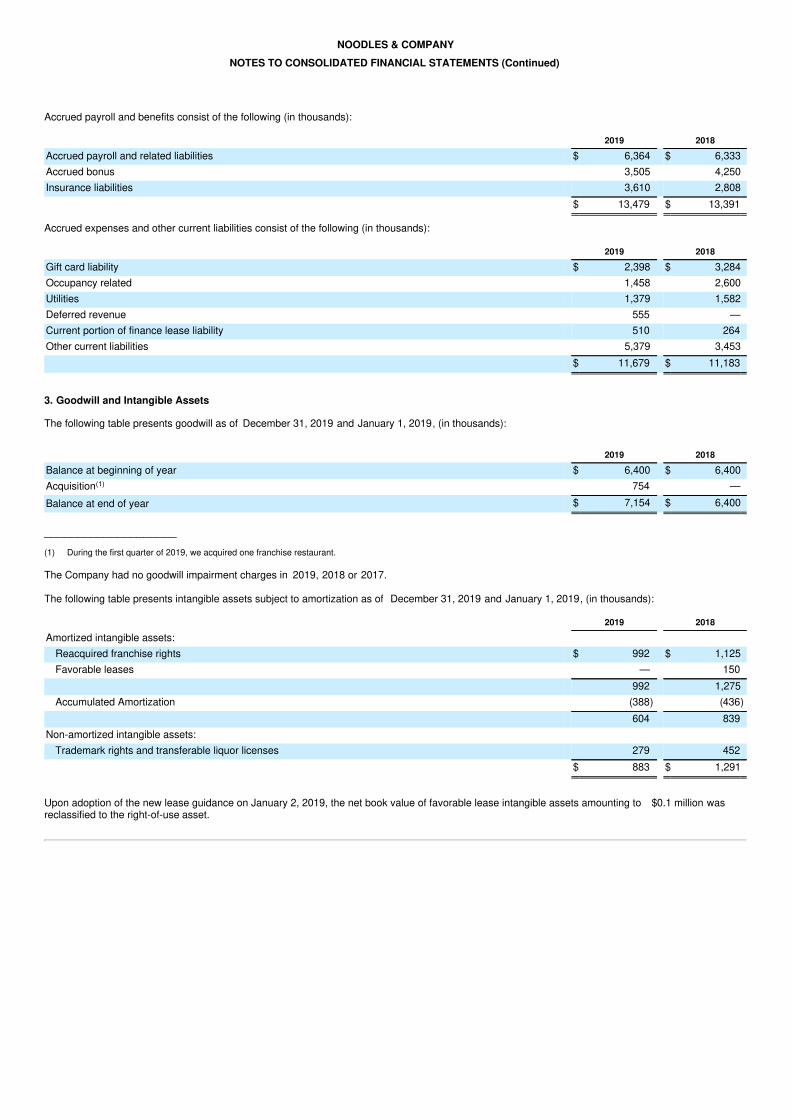
NOODLES & COMPANY
NOTES TO CONSOLIDATED FINANCIAL STATEMENTS (Continued)
Accrued payroll and benefits consist of the following (in thousands):
2019 2018
Accrued payroll and related liabilities $ 6,364 $ 6,333Accrued bonus 3,505 4,250Insurance liabilities 3,610 2,808 $ 13,479 $ 13,391
Accrued expenses and other current liabilities consist of the following (in thousands):
2019 2018
Gift card liability $ 2,398 $ 3,284Occupancy related 1,458 2,600Utilities 1,379 1,582Deferred revenue 555 —Current portion of finance lease liability 510 264Other current liabilities 5,379 3,453 $ 11,679 $ 11,183
3. Goodwill and Intangible Assets
The following table presents goodwill as of December 31, 2019 and January 1, 2019, (in thousands):
2019 2018
Balance at beginning of year $ 6,400 $ 6,400Acquisition(1) 754 —Balance at end of year $ 7,154 $ 6,400
____________________(1) During the first quarter of 2019, we acquired one franchise restaurant.
The Company had no goodwill impairment charges in 2019, 2018 or 2017.
The following table presents intangible assets subject to amortization as of December 31, 2019 and January 1, 2019, (in thousands):
2019 2018
Amortized intangible assets: Reacquired franchise rights $ 992 $ 1,125Favorable leases — 150
992 1,275Accumulated Amortization (388) (436)
604 839Non-amortized intangible assets:
Trademark rights and transferable liquor licenses 279 452 $ 883 $ 1,291
Upon adoption of the new lease guidance on January 2, 2019, the net book value of favorable lease intangible assets amounting to $0.1 million wasreclassified to the right-of-use asset.
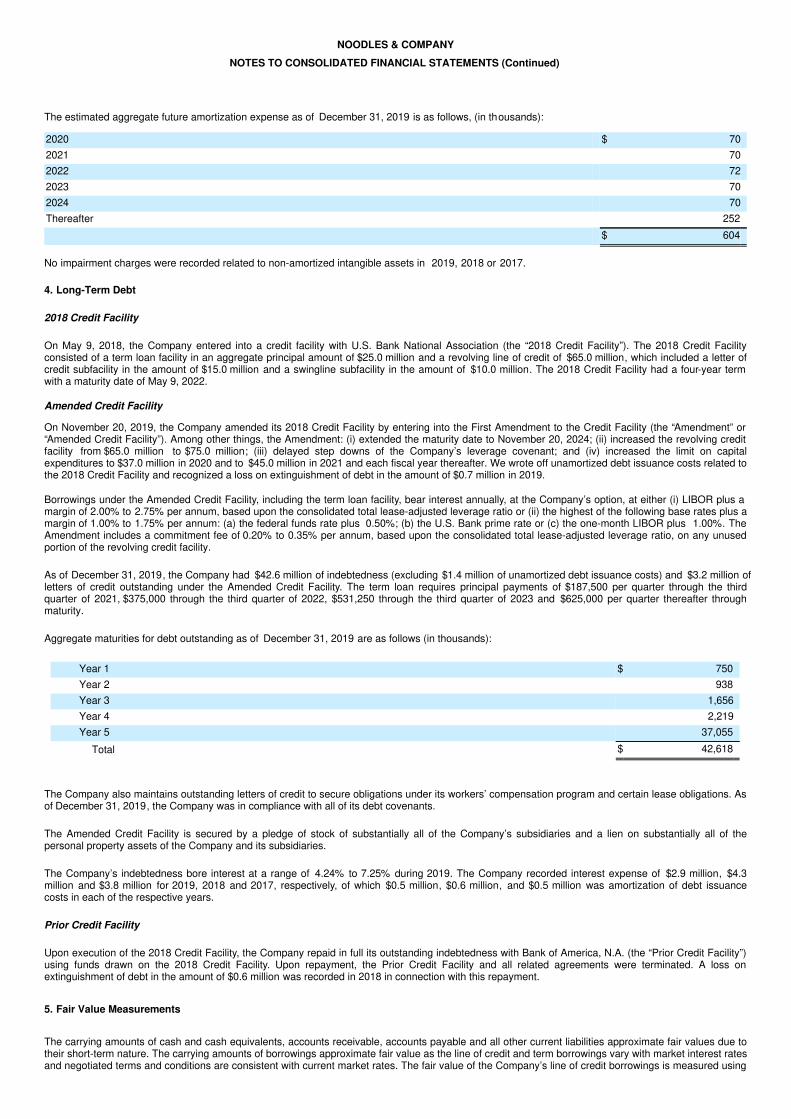
NOODLES & COMPANY
NOTES TO CONSOLIDATED FINANCIAL STATEMENTS (Continued)
The estimated aggregate future amortization expense as of December 31, 2019 is as follows, (in thousands):
2020 $ 702021 702022 722023 702024 70Thereafter 252 $ 604
No impairment charges were recorded related to non-amortized intangible assets in 2019, 2018 or 2017.
4. Long-Term Debt
2018 Credit Facility
On May 9, 2018, the Company entered into a credit facility with U.S. Bank National Association (the “2018 Credit Facility”). The 2018 Credit Facilityconsisted of a term loan facility in an aggregate principal amount of $25.0 million and a revolving line of credit of $65.0 million, which included a letter ofcredit subfacility in the amount of $15.0 million and a swingline subfacility in the amount of $10.0 million. The 2018 Credit Facility had a four-year termwith a maturity date of May 9, 2022.
Amended Credit Facility
On November 20, 2019, the Company amended its 2018 Credit Facility by entering into the First Amendment to the Credit Facility (the “Amendment” or“Amended Credit Facility”). Among other things, the Amendment: (i) extended the maturity date to November 20, 2024; (ii) increased the revolving creditfacility from $65.0 million to $75.0 million; (iii) delayed step downs of the Company’s leverage covenant; and (iv) increased the limit on capitalexpenditures to $37.0 million in 2020 and to $45.0 million in 2021 and each fiscal year thereafter. We wrote off unamortized debt issuance costs related tothe 2018 Credit Facility and recognized a loss on extinguishment of debt in the amount of $0.7 million in 2019.
Borrowings under the Amended Credit Facility, including the term loan facility, bear interest annually, at the Company’s option, at either (i) LIBOR plus amargin of 2.00% to 2.75% per annum, based upon the consolidated total lease-adjusted leverage ratio or (ii) the highest of the following base rates plus amargin of 1.00% to 1.75% per annum: (a) the federal funds rate plus 0.50%; (b) the U.S. Bank prime rate or (c) the one-month LIBOR plus 1.00%. TheAmendment includes a commitment fee of 0.20% to 0.35% per annum, based upon the consolidated total lease-adjusted leverage ratio, on any unusedportion of the revolving credit facility.
As of December 31, 2019, the Company had $42.6 million of indebtedness (excluding $1.4 million of unamortized debt issuance costs) and $3.2 million ofletters of credit outstanding under the Amended Credit Facility. The term loan requires principal payments of $187,500 per quarter through the thirdquarter of 2021, $375,000 through the third quarter of 2022, $531,250 through the third quarter of 2023 and $625,000 per quarter thereafter throughmaturity.
Aggregate maturities for debt outstanding as of December 31, 2019 are as follows (in thousands):
Year 1 $ 750Year 2 938Year 3 1,656Year 4 2,219Year 5 37,055
Total $ 42,618
The Company also maintains outstanding letters of credit to secure obligations under its workers’ compensation program and certain lease obligations. Asof December 31, 2019, the Company was in compliance with all of its debt covenants.
The Amended Credit Facility is secured by a pledge of stock of substantially all of the Company’s subsidiaries and a lien on substantially all of thepersonal property assets of the Company and its subsidiaries.
The Company’s indebtedness bore interest at a range of 4.24% to 7.25% during 2019. The Company recorded interest expense of $2.9 million, $4.3million and $3.8 million for 2019, 2018 and 2017, respectively, of which $0.5 million, $0.6 million, and $0.5 million was amortization of debt issuancecosts in each of the respective years.
Prior Credit Facility
Upon execution of the 2018 Credit Facility, the Company repaid in full its outstanding indebtedness with Bank of America, N.A. (the “Prior Credit Facility”)using funds drawn on the 2018 Credit Facility. Upon repayment, the Prior Credit Facility and all related agreements were terminated. A loss onextinguishment of debt in the amount of $0.6 million was recorded in 2018 in connection with this repayment.
5. Fair Value Measurements
The carrying amounts of cash and cash equivalents, accounts receivable, accounts payable and all other current liabilities approximate fair values due totheir short-term nature. The carrying amounts of borrowings approximate fair value as the line of credit and term borrowings vary with market interest ratesand negotiated terms and conditions are consistent with current market rates. The fair value of the Company’s line of credit borrowings is measured using
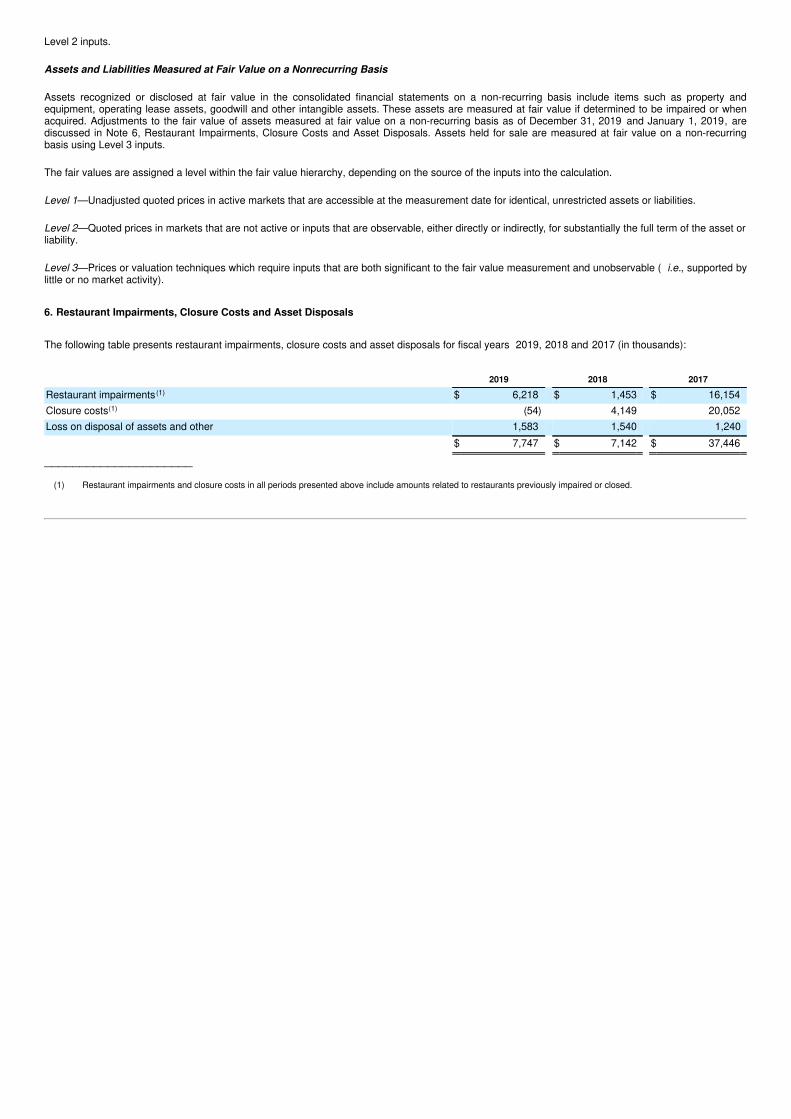
Level 2 inputs.
Assets and Liabilities Measured at Fair Value on a Nonrecurring Basis
Assets recognized or disclosed at fair value in the consolidated financial statements on a non-recurring basis include items such as property andequipment, operating lease assets, goodwill and other intangible assets. These assets are measured at fair value if determined to be impaired or whenacquired. Adjustments to the fair value of assets measured at fair value on a non-recurring basis as of December 31, 2019 and January 1, 2019, arediscussed in Note 6, Restaurant Impairments, Closure Costs and Asset Disposals. Assets held for sale are measured at fair value on a non-recurringbasis using Level 3 inputs.
The fair values are assigned a level within the fair value hierarchy, depending on the source of the inputs into the calculation.
Level 1—Unadjusted quoted prices in active markets that are accessible at the measurement date for identical, unrestricted assets or liabilities.
Level 2—Quoted prices in markets that are not active or inputs that are observable, either directly or indirectly, for substantially the full term of the asset orliability.
Level 3—Prices or valuation techniques which require inputs that are both significant to the fair value measurement and unobservable ( i.e., supported bylittle or no market activity).
6. Restaurant Impairments, Closure Costs and Asset Disposals
The following table presents restaurant impairments, closure costs and asset disposals for fiscal years 2019, 2018 and 2017 (in thousands):
2019 2018 2017
Restaurant impairments (1) $ 6,218 $ 1,453 $ 16,154Closure costs(1) (54) 4,149 20,052Loss on disposal of assets and other 1,583 1,540 1,240 $ 7,747 $ 7,142 $ 37,446
_____________________
(1) Restaurant impairments and closure costs in all periods presented above include amounts related to restaurants previously impaired or closed.
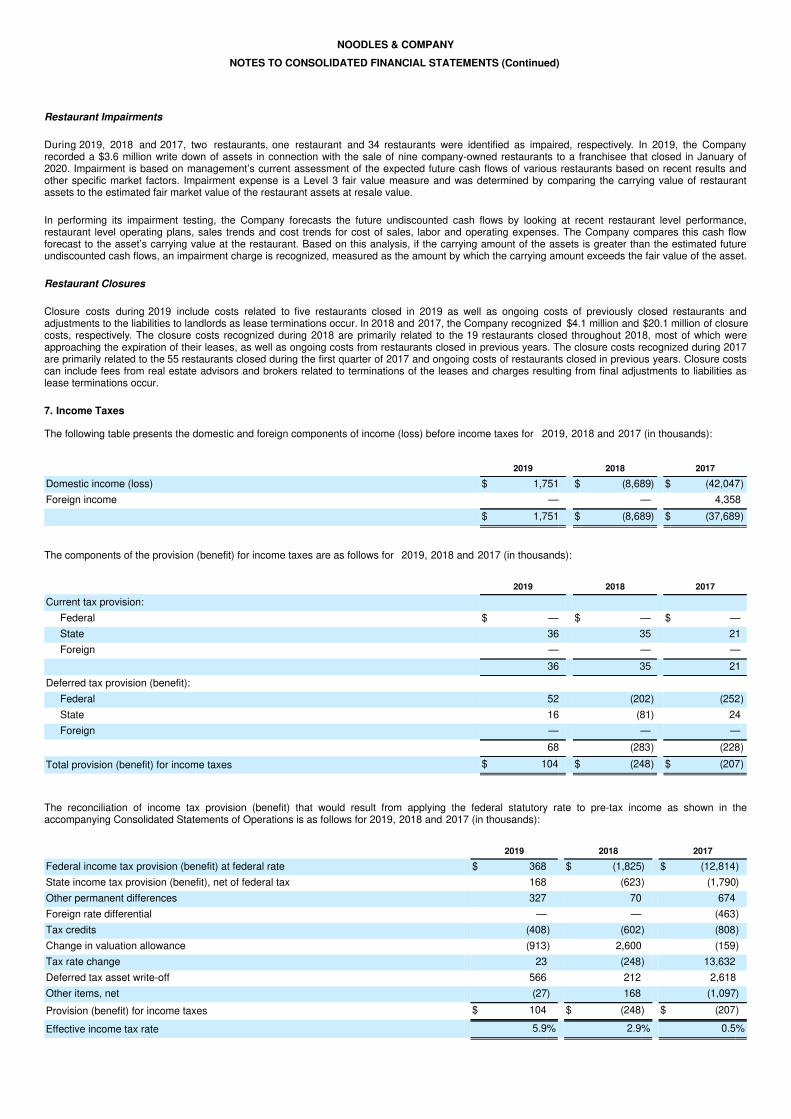
NOODLES & COMPANY
NOTES TO CONSOLIDATED FINANCIAL STATEMENTS (Continued)
Restaurant Impairments
During 2019, 2018 and 2017, two restaurants, one restaurant and 34 restaurants were identified as impaired, respectively. In 2019, the Companyrecorded a $3.6 million write down of assets in connection with the sale of nine company-owned restaurants to a franchisee that closed in January of2020. Impairment is based on management’s current assessment of the expected future cash flows of various restaurants based on recent results andother specific market factors. Impairment expense is a Level 3 fair value measure and was determined by comparing the carrying value of restaurantassets to the estimated fair market value of the restaurant assets at resale value.
In performing its impairment testing, the Company forecasts the future undiscounted cash flows by looking at recent restaurant level performance,restaurant level operating plans, sales trends and cost trends for cost of sales, labor and operating expenses. The Company compares this cash flowforecast to the asset’s carrying value at the restaurant. Based on this analysis, if the carrying amount of the assets is greater than the estimated futureundiscounted cash flows, an impairment charge is recognized, measured as the amount by which the carrying amount exceeds the fair value of the asset.
Restaurant Closures
Closure costs during 2019 include costs related to five restaurants closed in 2019 as well as ongoing costs of previously closed restaurants andadjustments to the liabilities to landlords as lease terminations occur. In 2018 and 2017, the Company recognized $4.1 million and $20.1 million of closurecosts, respectively. The closure costs recognized during 2018 are primarily related to the 19 restaurants closed throughout 2018, most of which wereapproaching the expiration of their leases, as well as ongoing costs from restaurants closed in previous years. The closure costs recognized during 2017are primarily related to the 55 restaurants closed during the first quarter of 2017 and ongoing costs of restaurants closed in previous years. Closure costscan include fees from real estate advisors and brokers related to terminations of the leases and charges resulting from final adjustments to liabilities aslease terminations occur.
7. Income Taxes
The following table presents the domestic and foreign components of income (loss) before income taxes for 2019, 2018 and 2017 (in thousands):
2019 2018 2017
Domestic income (loss) $ 1,751 $ (8,689) $ (42,047)Foreign income — — 4,358 $ 1,751 $ (8,689) $ (37,689)
The components of the provision (benefit) for income taxes are as follows for 2019, 2018 and 2017 (in thousands):
2019 2018 2017
Current tax provision: Federal $ — $ — $ —State 36 35 21Foreign — — —
36 35 21Deferred tax provision (benefit):
Federal 52 (202) (252)State 16 (81) 24Foreign — — —
68 (283) (228)Total provision (benefit) for income taxes $ 104 $ (248) $ (207)
The reconciliation of income tax provision (benefit) that would result from applying the federal statutory rate to pre-tax income as shown in theaccompanying Consolidated Statements of Operations is as follows for 2019, 2018 and 2017 (in thousands):
2019 2018 2017
Federal income tax provision (benefit) at federal rate $ 368 $ (1,825) $ (12,814)State income tax provision (benefit), net of federal tax 168 (623) (1,790)Other permanent differences 327 70 674Foreign rate differential — — (463)Tax credits (408) (602) (808)Change in valuation allowance (913) 2,600 (159)Tax rate change 23 (248) 13,632Deferred tax asset write-off 566 212 2,618Other items, net (27) 168 (1,097)Provision (benefit) for income taxes $ 104 $ (248) $ (207)
Effective income tax rate 5.9% 2.9% 0.5%
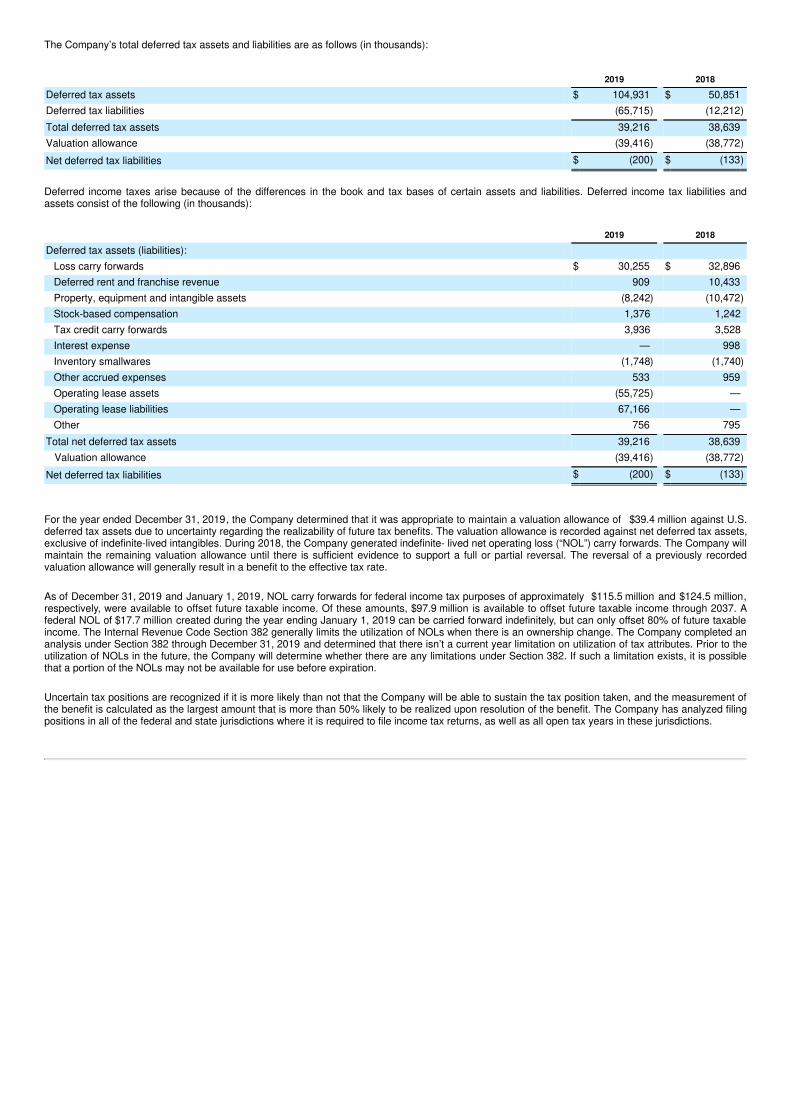
The Company’s total deferred tax assets and liabilities are as follows (in thousands):
2019 2018
Deferred tax assets $ 104,931 $ 50,851Deferred tax liabilities (65,715) (12,212)Total deferred tax assets 39,216 38,639Valuation allowance (39,416) (38,772)Net deferred tax liabilities $ (200) $ (133)
Deferred income taxes arise because of the differences in the book and tax bases of certain assets and liabilities. Deferred income tax liabilities andassets consist of the following (in thousands):
2019 2018
Deferred tax assets (liabilities): Loss carry forwards $ 30,255 $ 32,896Deferred rent and franchise revenue 909 10,433Property, equipment and intangible assets (8,242) (10,472)Stock-based compensation 1,376 1,242Tax credit carry forwards 3,936 3,528Interest expense — 998Inventory smallwares (1,748) (1,740)Other accrued expenses 533 959Operating lease assets (55,725) —Operating lease liabilities 67,166 —Other 756 795
Total net deferred tax assets 39,216 38,639 Valuation allowance (39,416) (38,772)Net deferred tax liabilities $ (200) $ (133)
For the year ended December 31, 2019, the Company determined that it was appropriate to maintain a valuation allowance of $39.4 million against U.S.deferred tax assets due to uncertainty regarding the realizability of future tax benefits. The valuation allowance is recorded against net deferred tax assets,exclusive of indefinite-lived intangibles. During 2018, the Company generated indefinite- lived net operating loss (“NOL”) carry forwards. The Company willmaintain the remaining valuation allowance until there is sufficient evidence to support a full or partial reversal. The reversal of a previously recordedvaluation allowance will generally result in a benefit to the effective tax rate.
As of December 31, 2019 and January 1, 2019, NOL carry forwards for federal income tax purposes of approximately $115.5 million and $124.5 million,respectively, were available to offset future taxable income. Of these amounts, $97.9 million is available to offset future taxable income through 2037. Afederal NOL of $17.7 million created during the year ending January 1, 2019 can be carried forward indefinitely, but can only offset 80% of future taxableincome. The Internal Revenue Code Section 382 generally limits the utilization of NOLs when there is an ownership change. The Company completed ananalysis under Section 382 through December 31, 2019 and determined that there isn’t a current year limitation on utilization of tax attributes. Prior to theutilization of NOLs in the future, the Company will determine whether there are any limitations under Section 382. If such a limitation exists, it is possiblethat a portion of the NOLs may not be available for use before expiration.
Uncertain tax positions are recognized if it is more likely than not that the Company will be able to sustain the tax position taken, and the measurement ofthe benefit is calculated as the largest amount that is more than 50% likely to be realized upon resolution of the benefit. The Company has analyzed filingpositions in all of the federal and state jurisdictions where it is required to file income tax returns, as well as all open tax years in these jurisdictions.
NOODLES & COMPANY
NOTES TO CONSOLIDATED FINANCIAL STATEMENTS (Continued)
There were no uncertain tax positions for the years ended December 31, 2019 or January 1, 2019. For federal and state income tax purposes, theCompany’s 2015 through 2018 tax years remain open for examination by the authorities under the normal three year statute of limitations. Should theCompany utilize any of its U.S. or state NOLs, the tax year to which the original loss relates will remain open to examination.
8. Stockholders’ Equity
Common Stock
The Company has 181,000,000 shares of stock authorized, consisting of 150,000,000 shares of Class A common stock, par value $0.01 per share;30,000,000 shares of Class B common stock, par value $0.01 and 1,000,000 shares of preferred stock, par value $0.01 per share. Preferred stock rightsare determined by the Company’s Board of Directors when preferred shares are issued. The following summarizes the rights of common stock:
Voting—Shares of Class A common stock and Class B common stock are entitled to one vote per share in all voting matters, with the exception thatClass B common stock does not vote on the election or removal of directors.
Conversion—Each share of Class A common stock held by either one of L Catterton Partners or Argentia Private Investments Inc. (“Argentia”) or theiraffiliates the (“Equity Sponsors”) is convertible, at the option of the holder, into one share of Class B common stock. Each share of Class B common stockis convertible, at the option of the holder, into one share of Class A common stock.
Dividends—Class A common stock and Class B common stock share equally if a dividend is declared or paid to either class, but they do not have rights toany special dividend.
Liquidation, Dissolution or Winding Up—Class A common stock and Class B common stock share equally in distributions in liquidation, dissolution orwinding up of the corporation.
Registration Rights—The Equity Sponsors have the right to demand registration of 10% or more of the shares of the Company’s common stock held bythem. A few shareholders who are also Executive Officers of the Company or members of the Company’s Board of Directors have piggyback registrationrights, but they are not required to exercise these rights.
Public Offering of Class A Common Stock
On July 31, 2018, the Company sold 2,500,000 shares of its common stock at a public offering price of $10.00 per share. The shares offered wereregistered pursuant to a registration statement that the Company filed with the Securities and Exchange Commission (the “SEC”). The Company receivednet proceeds of $23.0 million, after deducting the underwriting discounts and commissions, and net of transaction expenses incurred. The proceeds of theoffering were used by the Company to pay down borrowings under the 2018 Credit Facility and fund working capital obligations.
Conversion of Argentia Class B Common Stock
On May 24, 2018, Argentia Private Investments Inc. (“Argentia”) converted 1,522,098 shares of the Company’s Class B common stock, par value $0.01, itowned into the same number of shares of the Company’s Class A common stock. As a result of the conversion, no shares of the Company’s Class Bcommon stock are outstanding.
Reclassification of Cumulative Translation Adjustments
During the year ended January 2, 2018, the Company closed all Canadian restaurants and liquidated the Canadian foreign subsidiary. As a result, theCompany recognized a loss of approximately $0.2 million in operations for the translation adjustments from currency exchange that were previouslyrecorded in accumulated other comprehensive income (loss) as a separate component of stockholders’ equity. The Company recognized this chargewithin Restaurant impairments, closure costs and asset disposals in the Consolidated Statements of Operations.
9. Stock-Based Compensation
The Company’s Stock Incentive Plan (the “Plan”), as amended and restated in May of 2013, authorizes the grant of non-qualified stock options, incentivestock options, stock appreciation rights (“SARs”), restricted stock, restricted stock units (“RSUs”) and incentive bonuses to employees, officers, non-employee directors and other service providers. The Plan is administered by the Compensation Committee of the Company’s Board of Directors (the“Board”) or another committee designated by the Board, or in the absence of any such committee, the Board itself (the “administrator”). Stock options aregranted at a price determined by the administrator at an exercise price that is not less than the fair market value of the underlying stock on the date ofgrant. The administrator may also grant SARs and RSUs with terms determined by the administrator in accordance with the Plan. All share-based awards(except for RSUs) granted under the Plan have a life of ten years. Most awards vest ratably over four years; however, some have been granted withdifferent vesting schedules. Of the awards outstanding, none have been granted to non-employees (except those granted to non-employee members ofthe Board of Directors of the Company) under the Plan. At December 31, 2019, approximately 3.5 million share-based awards were available to begranted under the Plan.
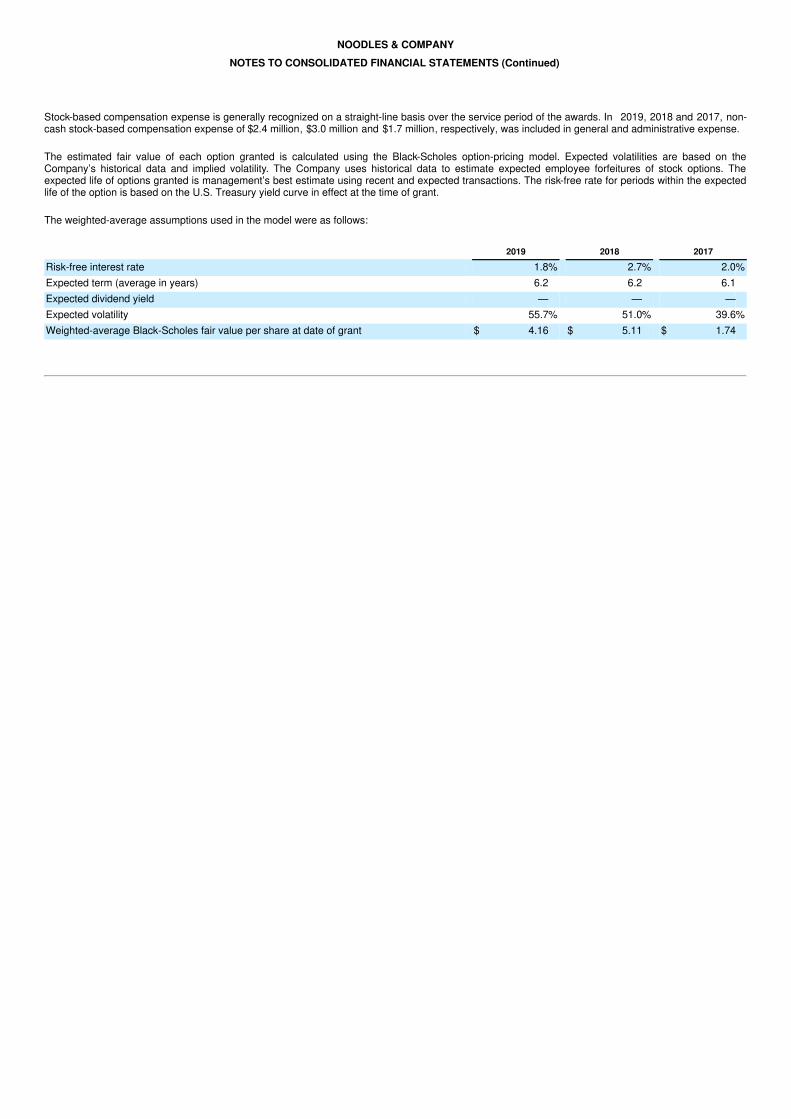
NOODLES & COMPANY
NOTES TO CONSOLIDATED FINANCIAL STATEMENTS (Continued)
Stock-based compensation expense is generally recognized on a straight-line basis over the service period of the awards. In 2019, 2018 and 2017, non-cash stock-based compensation expense of $2.4 million, $3.0 million and $1.7 million, respectively, was included in general and administrative expense.
The estimated fair value of each option granted is calculated using the Black-Scholes option-pricing model. Expected volatilities are based on theCompany’s historical data and implied volatility. The Company uses historical data to estimate expected employee forfeitures of stock options. Theexpected life of options granted is management’s best estimate using recent and expected transactions. The risk-free rate for periods within the expectedlife of the option is based on the U.S. Treasury yield curve in effect at the time of grant.
The weighted-average assumptions used in the model were as follows:
2019 2018 2017
Risk-free interest rate 1.8% 2.7% 2.0%Expected term (average in years) 6.2 6.2 6.1Expected dividend yield — — —Expected volatility 55.7% 51.0% 39.6%Weighted-average Black-Scholes fair value per share at date of grant $ 4.16 $ 5.11 $ 1.74
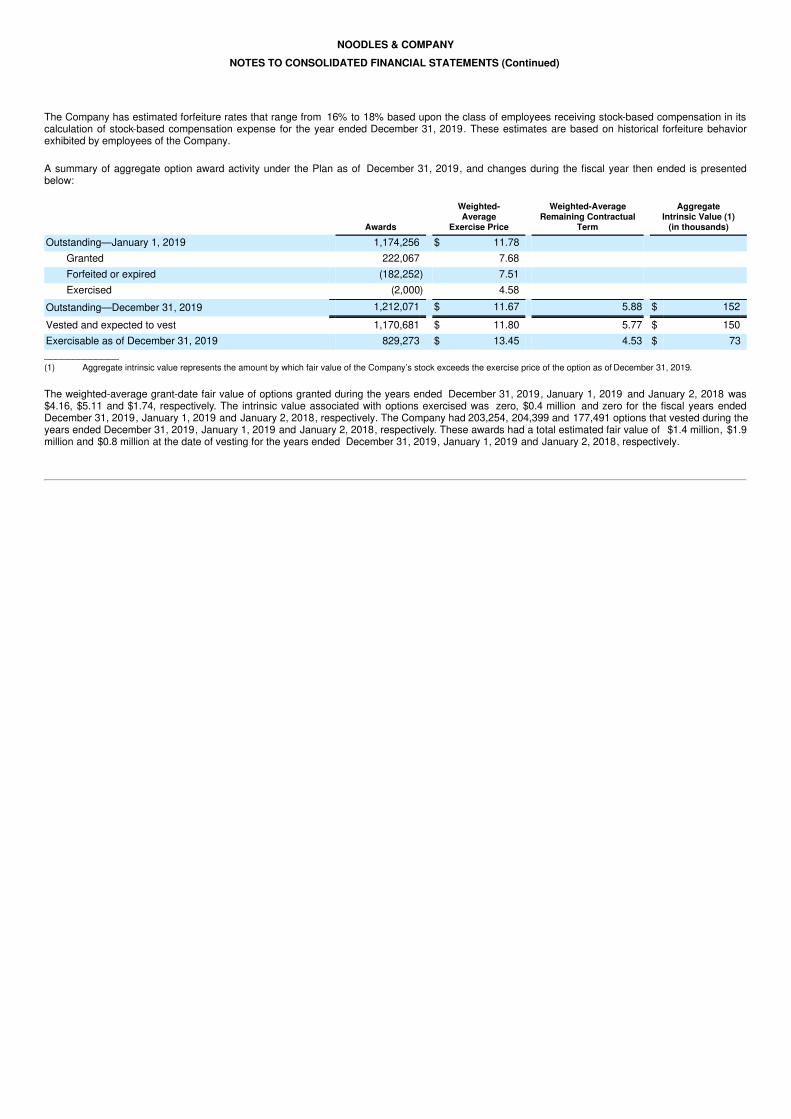
NOODLES & COMPANY
NOTES TO CONSOLIDATED FINANCIAL STATEMENTS (Continued)
The Company has estimated forfeiture rates that range from 16% to 18% based upon the class of employees receiving stock-based compensation in itscalculation of stock-based compensation expense for the year ended December 31, 2019. These estimates are based on historical forfeiture behaviorexhibited by employees of the Company.
A summary of aggregate option award activity under the Plan as of December 31, 2019, and changes during the fiscal year then ended is presentedbelow:
Awards
Weighted-Average
Exercise Price
Weighted-AverageRemaining Contractual
Term
AggregateIntrinsic Value (1)
(in thousands)
Outstanding—January 1, 2019 1,174,256 $ 11.78 Granted 222,067 7.68 Forfeited or expired (182,252) 7.51 Exercised (2,000) 4.58
Outstanding—December 31, 2019 1,212,071 $ 11.67 5.88 $ 152
Vested and expected to vest 1,170,681 $ 11.80 5.77 $ 150Exercisable as of December 31, 2019 829,273 $ 13.45 4.53 $ 73_____________(1) Aggregate intrinsic value represents the amount by which fair value of the Company’s stock exceeds the exercise price of the option as of December 31, 2019.
The weighted-average grant-date fair value of options granted during the years ended December 31, 2019, January 1, 2019 and January 2, 2018 was$4.16, $5.11 and $1.74, respectively. The intrinsic value associated with options exercised was zero, $0.4 million and zero for the fiscal years endedDecember 31, 2019, January 1, 2019 and January 2, 2018, respectively. The Company had 203,254, 204,399 and 177,491 options that vested during theyears ended December 31, 2019, January 1, 2019 and January 2, 2018, respectively. These awards had a total estimated fair value of $1.4 million, $1.9million and $0.8 million at the date of vesting for the years ended December 31, 2019, January 1, 2019 and January 2, 2018, respectively.

NOODLES & COMPANY
NOTES TO CONSOLIDATED FINANCIAL STATEMENTS (Continued)
A summary of the status of the Company’s non-vested restricted share units as of December 31, 2019 and changes during the year then ended ispresented below:
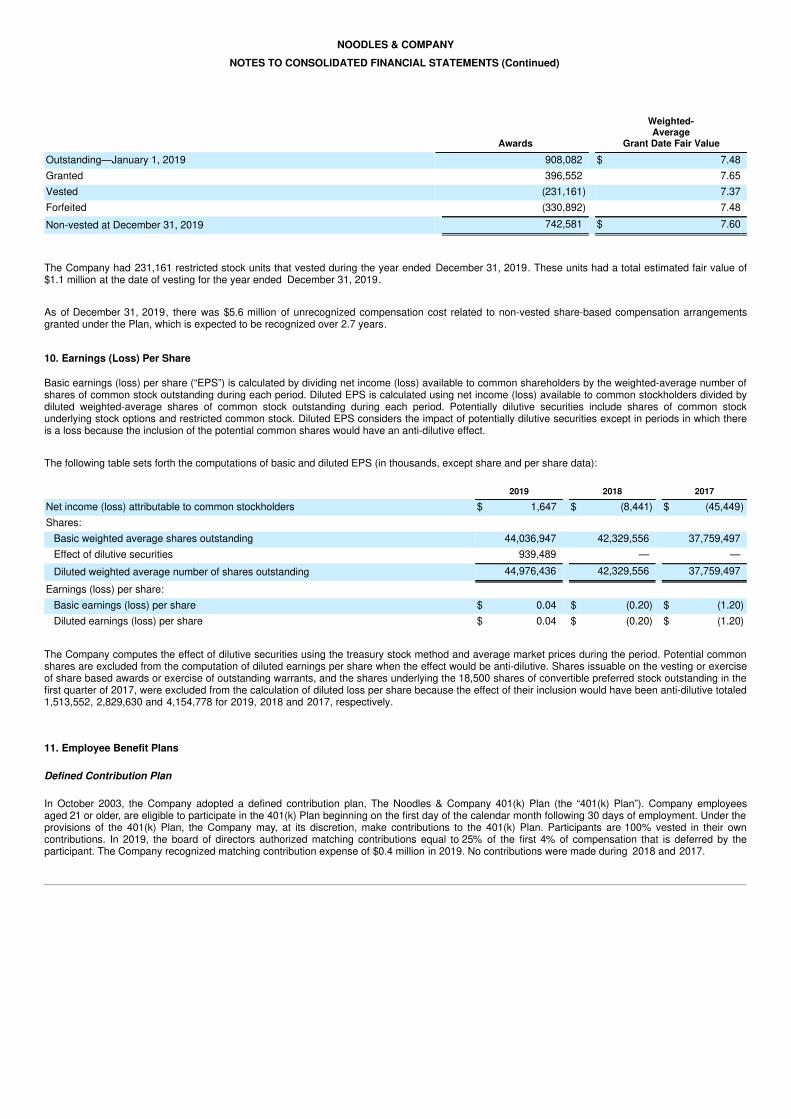
NOODLES & COMPANY
NOTES TO CONSOLIDATED FINANCIAL STATEMENTS (Continued)
Awards
Weighted-Average
Grant Date Fair Value
Outstanding—January 1, 2019 908,082 $ 7.48Granted 396,552 7.65Vested (231,161) 7.37Forfeited (330,892) 7.48Non-vested at December 31, 2019 742,581 $ 7.60
The Company had 231,161 restricted stock units that vested during the year ended December 31, 2019. These units had a total estimated fair value of$1.1 million at the date of vesting for the year ended December 31, 2019.
As of December 31, 2019, there was $5.6 million of unrecognized compensation cost related to non-vested share-based compensation arrangementsgranted under the Plan, which is expected to be recognized over 2.7 years.
10. Earnings (Loss) Per Share
Basic earnings (loss) per share (“EPS”) is calculated by dividing net income (loss) available to common shareholders by the weighted-average number ofshares of common stock outstanding during each period. Diluted EPS is calculated using net income (loss) available to common stockholders divided bydiluted weighted-average shares of common stock outstanding during each period. Potentially dilutive securities include shares of common stockunderlying stock options and restricted common stock. Diluted EPS considers the impact of potentially dilutive securities except in periods in which thereis a loss because the inclusion of the potential common shares would have an anti-dilutive effect.
The following table sets forth the computations of basic and diluted EPS (in thousands, except share and per share data):
2019 2018 2017
Net income (loss) attributable to common stockholders $ 1,647 $ (8,441) $ (45,449)Shares:
Basic weighted average shares outstanding 44,036,947 42,329,556 37,759,497Effect of dilutive securities 939,489 — —Diluted weighted average number of shares outstanding 44,976,436 42,329,556 37,759,497
Earnings (loss) per share: Basic earnings (loss) per share $ 0.04 $ (0.20) $ (1.20)Diluted earnings (loss) per share $ 0.04 $ (0.20) $ (1.20)
The Company computes the effect of dilutive securities using the treasury stock method and average market prices during the period. Potential commonshares are excluded from the computation of diluted earnings per share when the effect would be anti-dilutive. Shares issuable on the vesting or exerciseof share based awards or exercise of outstanding warrants, and the shares underlying the 18,500 shares of convertible preferred stock outstanding in thefirst quarter of 2017, were excluded from the calculation of diluted loss per share because the effect of their inclusion would have been anti-dilutive totaled1,513,552, 2,829,630 and 4,154,778 for 2019, 2018 and 2017, respectively.
11. Employee Benefit Plans
Defined Contribution Plan
In October 2003, the Company adopted a defined contribution plan, The Noodles & Company 401(k) Plan (the “401(k) Plan”). Company employeesaged 21 or older, are eligible to participate in the 401(k) Plan beginning on the first day of the calendar month following 30 days of employment. Under theprovisions of the 401(k) Plan, the Company may, at its discretion, make contributions to the 401(k) Plan. Participants are 100% vested in their owncontributions. In 2019, the board of directors authorized matching contributions equal to 25% of the first 4% of compensation that is deferred by theparticipant. The Company recognized matching contribution expense of $0.4 million in 2019. No contributions were made during 2018 and 2017.
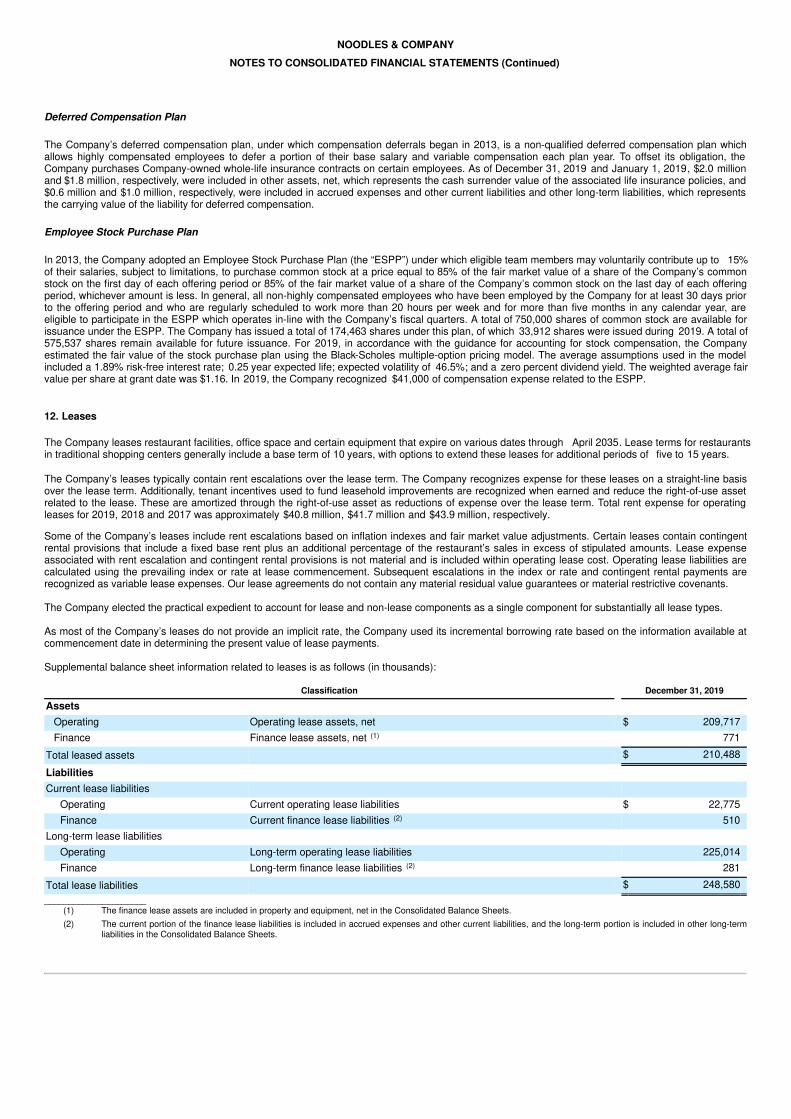
NOODLES & COMPANY
NOTES TO CONSOLIDATED FINANCIAL STATEMENTS (Continued)
Deferred Compensation Plan
The Company’s deferred compensation plan, under which compensation deferrals began in 2013, is a non-qualified deferred compensation plan whichallows highly compensated employees to defer a portion of their base salary and variable compensation each plan year. To offset its obligation, theCompany purchases Company-owned whole-life insurance contracts on certain employees. As of December 31, 2019 and January 1, 2019, $2.0 millionand $1.8 million, respectively, were included in other assets, net, which represents the cash surrender value of the associated life insurance policies, and$0.6 million and $1.0 million, respectively, were included in accrued expenses and other current liabilities and other long-term liabilities, which representsthe carrying value of the liability for deferred compensation.
Employee Stock Purchase Plan
In 2013, the Company adopted an Employee Stock Purchase Plan (the “ESPP”) under which eligible team members may voluntarily contribute up to 15%of their salaries, subject to limitations, to purchase common stock at a price equal to 85% of the fair market value of a share of the Company’s commonstock on the first day of each offering period or 85% of the fair market value of a share of the Company’s common stock on the last day of each offeringperiod, whichever amount is less. In general, all non-highly compensated employees who have been employed by the Company for at least 30 days priorto the offering period and who are regularly scheduled to work more than 20 hours per week and for more than five months in any calendar year, areeligible to participate in the ESPP which operates in-line with the Company’s fiscal quarters. A total of 750,000 shares of common stock are available forissuance under the ESPP. The Company has issued a total of 174,463 shares under this plan, of which 33,912 shares were issued during 2019. A total of575,537 shares remain available for future issuance. For 2019, in accordance with the guidance for accounting for stock compensation, the Companyestimated the fair value of the stock purchase plan using the Black-Scholes multiple-option pricing model. The average assumptions used in the modelincluded a 1.89% risk-free interest rate; 0.25 year expected life; expected volatility of 46.5%; and a zero percent dividend yield. The weighted average fairvalue per share at grant date was $1.16. In 2019, the Company recognized $41,000 of compensation expense related to the ESPP.
12. Leases
The Company leases restaurant facilities, office space and certain equipment that expire on various dates through April 2035. Lease terms for restaurantsin traditional shopping centers generally include a base term of 10 years, with options to extend these leases for additional periods of five to 15 years.
The Company’s leases typically contain rent escalations over the lease term. The Company recognizes expense for these leases on a straight-line basisover the lease term. Additionally, tenant incentives used to fund leasehold improvements are recognized when earned and reduce the right-of-use assetrelated to the lease. These are amortized through the right-of-use asset as reductions of expense over the lease term. Total rent expense for operatingleases for 2019, 2018 and 2017 was approximately $40.8 million, $41.7 million and $43.9 million, respectively.
Some of the Company’s leases include rent escalations based on inflation indexes and fair market value adjustments. Certain leases contain contingentrental provisions that include a fixed base rent plus an additional percentage of the restaurant’s sales in excess of stipulated amounts. Lease expenseassociated with rent escalation and contingent rental provisions is not material and is included within operating lease cost. Operating lease liabilities arecalculated using the prevailing index or rate at lease commencement. Subsequent escalations in the index or rate and contingent rental payments arerecognized as variable lease expenses. Our lease agreements do not contain any material residual value guarantees or material restrictive covenants.
The Company elected the practical expedient to account for lease and non-lease components as a single component for substantially all lease types.
As most of the Company’s leases do not provide an implicit rate, the Company used its incremental borrowing rate based on the information available atcommencement date in determining the present value of lease payments.
Supplemental balance sheet information related to leases is as follows (in thousands):
Classification December 31, 2019
Assets Operating Operating lease assets, net $ 209,717Finance Finance lease assets, net (1) 771
Total leased assets $ 210,488
Liabilities Current lease liabilities
Operating Current operating lease liabilities $ 22,775Finance Current finance lease liabilities (2) 510
Long-term lease liabilities Operating Long-term operating lease liabilities 225,014Finance Long-term finance lease liabilities (2) 281
Total lease liabilities $ 248,580_____________________
(1) The finance lease assets are included in property and equipment, net in the Consolidated Balance Sheets.(2) The current portion of the finance lease liabilities is included in accrued expenses and other current liabilities, and the long-term portion is included in other long-term
liabilities in the Consolidated Balance Sheets.
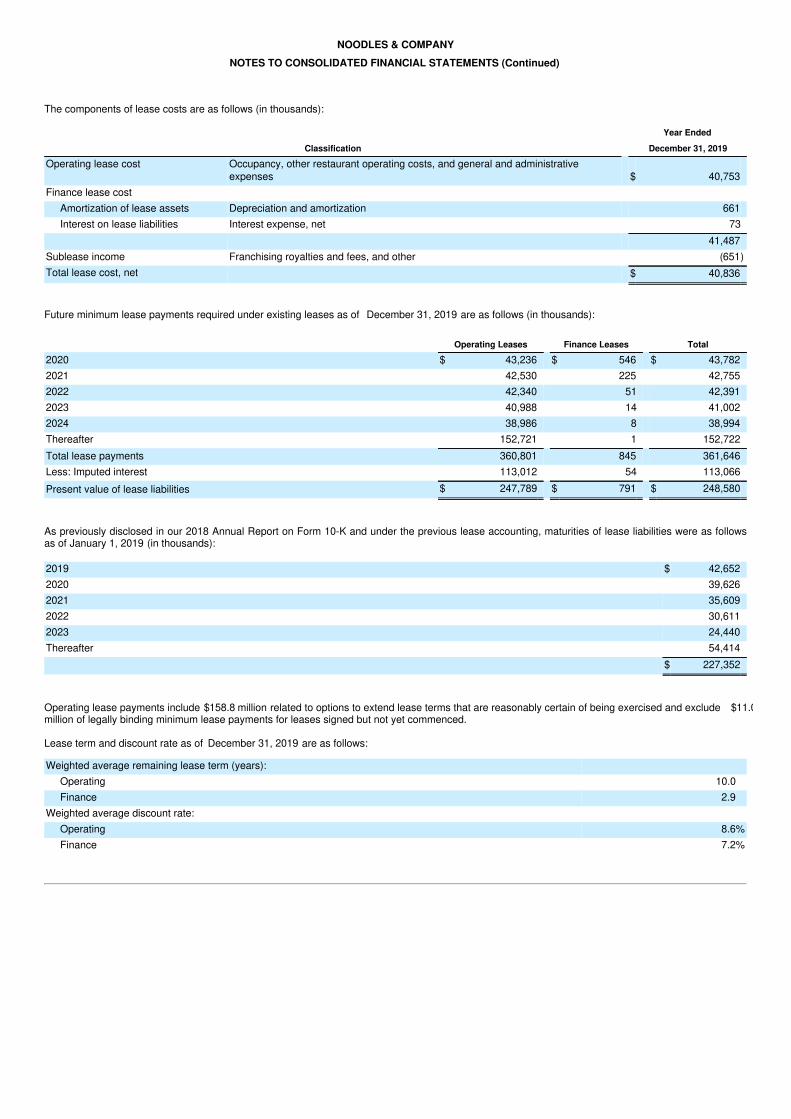
NOODLES & COMPANY
NOTES TO CONSOLIDATED FINANCIAL STATEMENTS (Continued)
The components of lease costs are as follows (in thousands):
Year Ended
Classification December 31, 2019
Operating lease cost Occupancy, other restaurant operating costs, and general and administrativeexpenses $ 40,753
Finance lease cost Amortization of lease assets Depreciation and amortization 661Interest on lease liabilities Interest expense, net 73
41,487Sublease income Franchising royalties and fees, and other (651)Total lease cost, net $ 40,836
Future minimum lease payments required under existing leases as of December 31, 2019 are as follows (in thousands):
Operating Leases Finance Leases Total
2020 $ 43,236 $ 546 $ 43,7822021 42,530 225 42,7552022 42,340 51 42,3912023 40,988 14 41,0022024 38,986 8 38,994Thereafter 152,721 1 152,722Total lease payments 360,801 845 361,646Less: Imputed interest 113,012 54 113,066Present value of lease liabilities $ 247,789 $ 791 $ 248,580
As previously disclosed in our 2018 Annual Report on Form 10-K and under the previous lease accounting, maturities of lease liabilities were as followsas of January 1, 2019 (in thousands):
2019 $ 42,6522020 39,6262021 35,6092022 30,6112023 24,440Thereafter 54,414 $ 227,352
Operating lease payments include $158.8 million related to options to extend lease terms that are reasonably certain of being exercised and exclude $11.0million of legally binding minimum lease payments for leases signed but not yet commenced.
Lease term and discount rate as of December 31, 2019 are as follows:
Weighted average remaining lease term (years): Operating 10.0Finance 2.9
Weighted average discount rate: Operating 8.6%Finance 7.2%
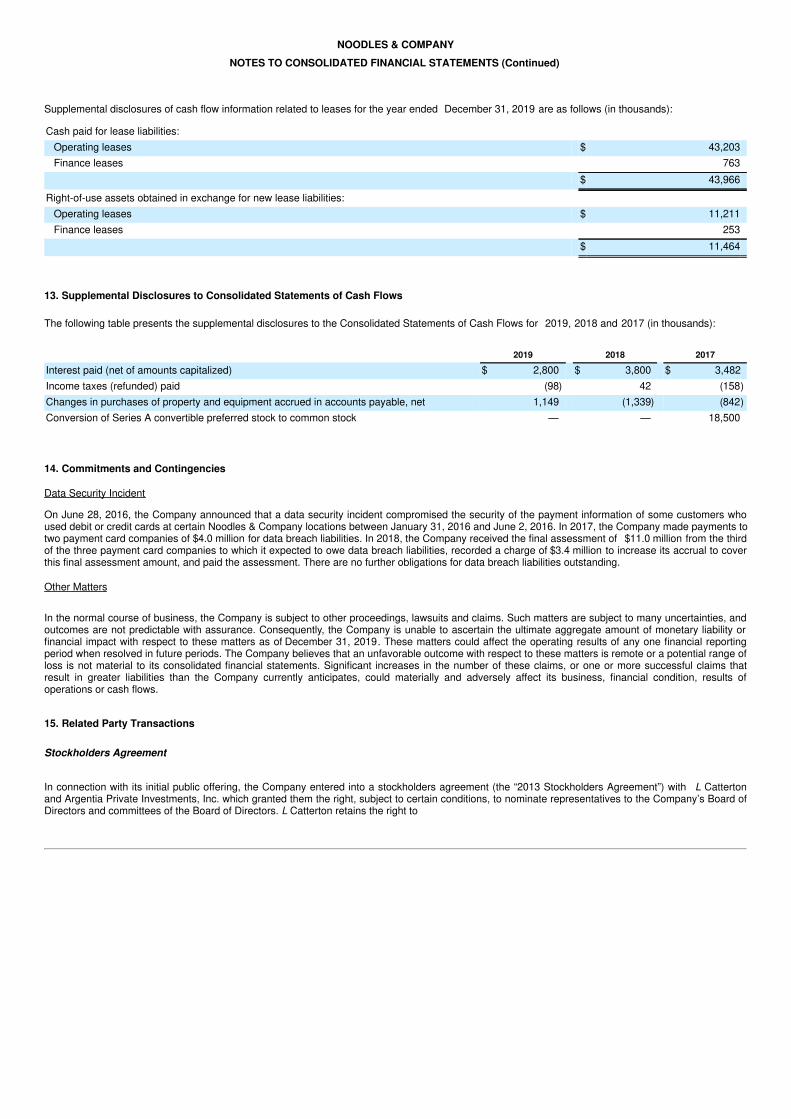
NOODLES & COMPANY
NOTES TO CONSOLIDATED FINANCIAL STATEMENTS (Continued)
Supplemental disclosures of cash flow information related to leases for the year ended December 31, 2019 are as follows (in thousands):
Cash paid for lease liabilities: Operating leases $ 43,203Finance leases 763
$ 43,966
Right-of-use assets obtained in exchange for new lease liabilities: Operating leases $ 11,211Finance leases 253
$ 11,464
13. Supplemental Disclosures to Consolidated Statements of Cash Flows
The following table presents the supplemental disclosures to the Consolidated Statements of Cash Flows for 2019, 2018 and 2017 (in thousands):
2019 2018 2017
Interest paid (net of amounts capitalized) $ 2,800 $ 3,800 $ 3,482Income taxes (refunded) paid (98) 42 (158)Changes in purchases of property and equipment accrued in accounts payable, net 1,149 (1,339) (842)Conversion of Series A convertible preferred stock to common stock — — 18,500
14. Commitments and Contingencies
Data Security Incident
On June 28, 2016, the Company announced that a data security incident compromised the security of the payment information of some customers whoused debit or credit cards at certain Noodles & Company locations between January 31, 2016 and June 2, 2016. In 2017, the Company made payments totwo payment card companies of $4.0 million for data breach liabilities. In 2018, the Company received the final assessment of $11.0 million from the thirdof the three payment card companies to which it expected to owe data breach liabilities, recorded a charge of $3.4 million to increase its accrual to coverthis final assessment amount, and paid the assessment. There are no further obligations for data breach liabilities outstanding.
Other Matters
In the normal course of business, the Company is subject to other proceedings, lawsuits and claims. Such matters are subject to many uncertainties, andoutcomes are not predictable with assurance. Consequently, the Company is unable to ascertain the ultimate aggregate amount of monetary liability orfinancial impact with respect to these matters as of December 31, 2019. These matters could affect the operating results of any one financial reportingperiod when resolved in future periods. The Company believes that an unfavorable outcome with respect to these matters is remote or a potential range ofloss is not material to its consolidated financial statements. Significant increases in the number of these claims, or one or more successful claims thatresult in greater liabilities than the Company currently anticipates, could materially and adversely affect its business, financial condition, results ofoperations or cash flows.
15. Related Party Transactions
Stockholders Agreement
In connection with its initial public offering, the Company entered into a stockholders agreement (the “2013 Stockholders Agreement”) with L Cattertonand Argentia Private Investments, Inc. which granted them the right, subject to certain conditions, to nominate representatives to the Company’s Board ofDirectors and committees of the Board of Directors. L Catterton retains the right to
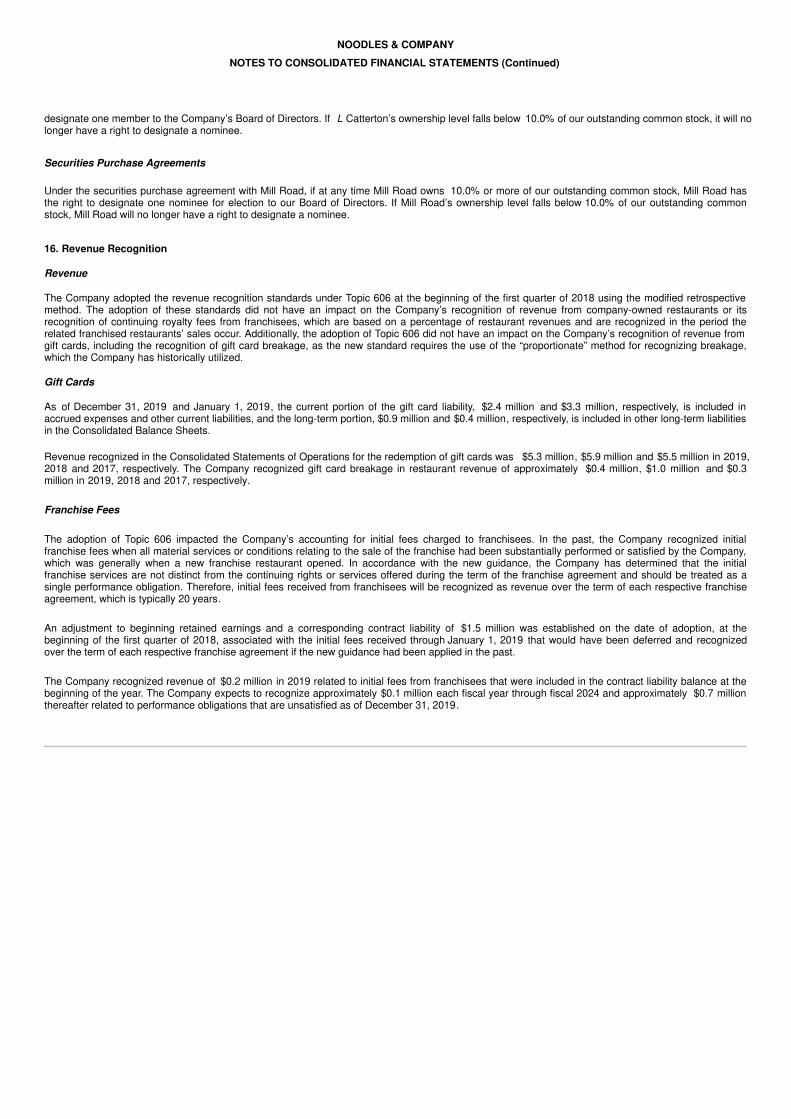
NOODLES & COMPANY
NOTES TO CONSOLIDATED FINANCIAL STATEMENTS (Continued)
designate one member to the Company’s Board of Directors. If L Catterton’s ownership level falls below 10.0% of our outstanding common stock, it will nolonger have a right to designate a nominee.
Securities Purchase Agreements
Under the securities purchase agreement with Mill Road, if at any time Mill Road owns 10.0% or more of our outstanding common stock, Mill Road hasthe right to designate one nominee for election to our Board of Directors. If Mill Road’s ownership level falls below 10.0% of our outstanding commonstock, Mill Road will no longer have a right to designate a nominee.
16. Revenue Recognition
Revenue
The Company adopted the revenue recognition standards under Topic 606 at the beginning of the first quarter of 2018 using the modified retrospectivemethod. The adoption of these standards did not have an impact on the Company’s recognition of revenue from company-owned restaurants or itsrecognition of continuing royalty fees from franchisees, which are based on a percentage of restaurant revenues and are recognized in the period therelated franchised restaurants’ sales occur. Additionally, the adoption of Topic 606 did not have an impact on the Company’s recognition of revenue fromgift cards, including the recognition of gift card breakage, as the new standard requires the use of the “proportionate” method for recognizing breakage,which the Company has historically utilized.
Gift Cards
As of December 31, 2019 and January 1, 2019, the current portion of the gift card liability, $2.4 million and $3.3 million, respectively, is included inaccrued expenses and other current liabilities, and the long-term portion, $0.9 million and $0.4 million, respectively, is included in other long-term liabilitiesin the Consolidated Balance Sheets.
Revenue recognized in the Consolidated Statements of Operations for the redemption of gift cards was $5.3 million, $5.9 million and $5.5 million in 2019,2018 and 2017, respectively. The Company recognized gift card breakage in restaurant revenue of approximately $0.4 million, $1.0 million and $0.3million in 2019, 2018 and 2017, respectively.
Franchise Fees
The adoption of Topic 606 impacted the Company’s accounting for initial fees charged to franchisees. In the past, the Company recognized initialfranchise fees when all material services or conditions relating to the sale of the franchise had been substantially performed or satisfied by the Company,which was generally when a new franchise restaurant opened. In accordance with the new guidance, the Company has determined that the initialfranchise services are not distinct from the continuing rights or services offered during the term of the franchise agreement and should be treated as asingle performance obligation. Therefore, initial fees received from franchisees will be recognized as revenue over the term of each respective franchiseagreement, which is typically 20 years.
An adjustment to beginning retained earnings and a corresponding contract liability of $1.5 million was established on the date of adoption, at thebeginning of the first quarter of 2018, associated with the initial fees received through January 1, 2019 that would have been deferred and recognizedover the term of each respective franchise agreement if the new guidance had been applied in the past.
The Company recognized revenue of $0.2 million in 2019 related to initial fees from franchisees that were included in the contract liability balance at thebeginning of the year. The Company expects to recognize approximately $0.1 million each fiscal year through fiscal 2024 and approximately $0.7 millionthereafter related to performance obligations that are unsatisfied as of December 31, 2019.
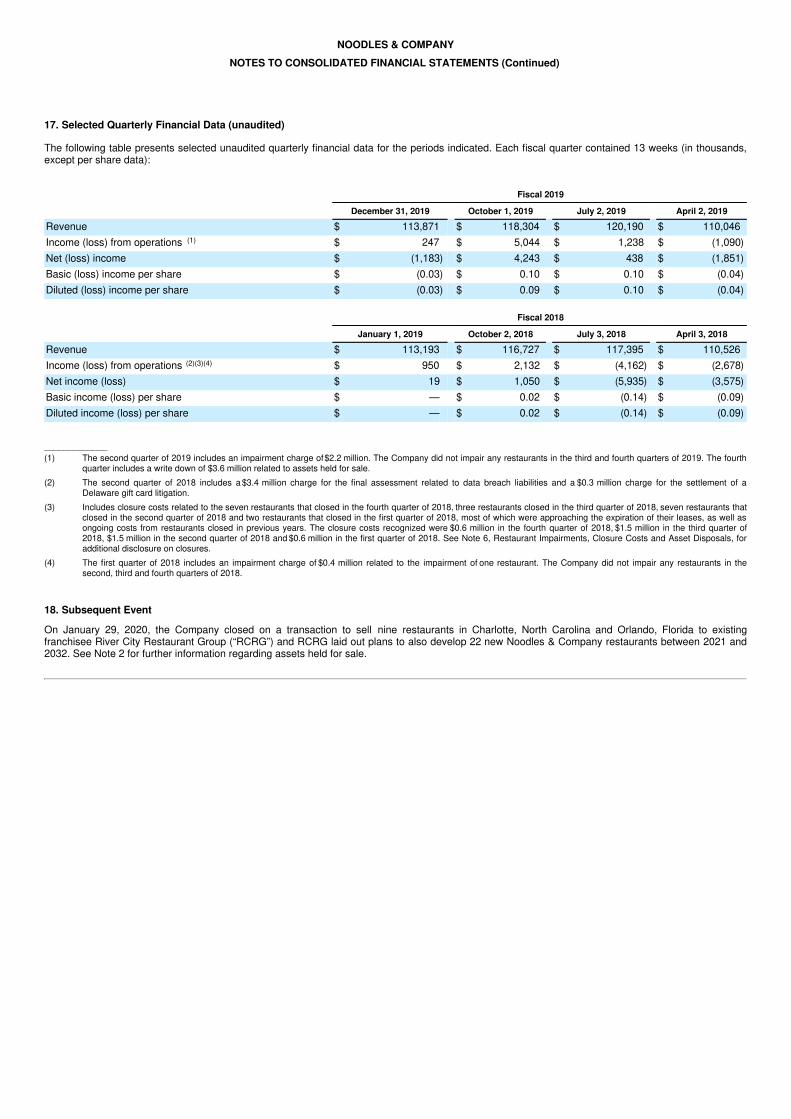
NOODLES & COMPANY
NOTES TO CONSOLIDATED FINANCIAL STATEMENTS (Continued)
17. Selected Quarterly Financial Data (unaudited)
The following table presents selected unaudited quarterly financial data for the periods indicated. Each fiscal quarter contained 13 weeks (in thousands,except per share data):
Fiscal 2019
December 31, 2019 October 1, 2019 July 2, 2019 April 2, 2019
Revenue $ 113,871 $ 118,304 $ 120,190 $ 110,046Income (loss) from operations (1) $ 247 $ 5,044 $ 1,238 $ (1,090)Net (loss) income $ (1,183) $ 4,243 $ 438 $ (1,851)Basic (loss) income per share $ (0.03) $ 0.10 $ 0.10 $ (0.04)Diluted (loss) income per share $ (0.03) $ 0.09 $ 0.10 $ (0.04) Fiscal 2018
January 1, 2019 October 2, 2018 July 3, 2018 April 3, 2018
Revenue $ 113,193 $ 116,727 $ 117,395 $ 110,526Income (loss) from operations (2)(3)(4) $ 950 $ 2,132 $ (4,162) $ (2,678)Net income (loss) $ 19 $ 1,050 $ (5,935) $ (3,575)Basic income (loss) per share $ — $ 0.02 $ (0.14) $ (0.09)Diluted income (loss) per share $ — $ 0.02 $ (0.14) $ (0.09)
_____________(1) The second quarter of 2019 includes an impairment charge of $2.2 million. The Company did not impair any restaurants in the third and fourth quarters of 2019. The fourth
quarter includes a write down of $3.6 million related to assets held for sale.(2) The second quarter of 2018 includes a $3.4 million charge for the final assessment related to data breach liabilities and a $0.3 million charge for the settlement of a
Delaware gift card litigation.(3) Includes closure costs related to the seven restaurants that closed in the fourth quarter of 2018, three restaurants closed in the third quarter of 2018, seven restaurants that
closed in the second quarter of 2018 and two restaurants that closed in the first quarter of 2018, most of which were approaching the expiration of their leases, as well asongoing costs from restaurants closed in previous years. The closure costs recognized were $0.6 million in the fourth quarter of 2018, $1.5 million in the third quarter of2018, $1.5 million in the second quarter of 2018 and $0.6 million in the first quarter of 2018. See Note 6, Restaurant Impairments, Closure Costs and Asset Disposals, foradditional disclosure on closures.
(4) The first quarter of 2018 includes an impairment charge of $0.4 million related to the impairment of one restaurant. The Company did not impair any restaurants in thesecond, third and fourth quarters of 2018.
18. Subsequent Event
On January 29, 2020, the Company closed on a transaction to sell nine restaurants in Charlotte, North Carolina and Orlando, Florida to existingfranchisee River City Restaurant Group (“RCRG”) and RCRG laid out plans to also develop 22 new Noodles & Company restaurants between 2021 and2032. See Note 2 for further information regarding assets held for sale.
Report of Independent Registered Public Accounting Firm
To the Shareholders and the Board of Directors of Noodles & Company
Opinion on the Financial Statements
We have audited the accompanying consolidated balance sheets of Noodles & Company (the Company) as of December 31, 2019 and January 1, 2019,the related consolidated statements of operations, comprehensive income (loss), stockholders’ equity, and cash flows for each of the three years in theperiod ended December 31, 2019, and the related notes (collectively referred to as the “consolidated financial statements”). In our opinion, theconsolidated financial statements present fairly, in all material respects, the financial position of the Company at December 31, 2019 and January 1, 2019,and the results of its operations and its cash flows for each of the three years in the period ended December 31, 2019, in conformity with U.S. generallyaccepted accounting principles.
We also have audited, in accordance with the standards of the Public Company Accounting Oversight Board (United States) (PCAOB), the Company'sinternal control over financial reporting as of December 31, 2019, based on criteria established in Internal Control-Integrated Framework issued by theCommittee of Sponsoring Organizations of the Treadway Commission (2013 framework) and our report dated February 26, 2020 expressed anunqualified opinion thereon.
Adoption of ASU No. 2016-02As discussed in Note 1 to the consolidated financial statements, the Company changed its method of accounting for leases in the consolidated financialstatements for the year ended December 31, 2019 due to the adoption of ASU No. 2016-02, Leases (Topic 842).
Basis for Opinion
These financial statements are the responsibility of the Company’s management. Our responsibility is to express an opinion on the Company’s financialstatements based on our audits. We are a public accounting firm registered with the PCAOB and are required to be independent with respect to theCompany in accordance with the U.S. federal securities laws and the applicable rules and regulations of the Securities and Exchange Commission andthe PCAOB.
We conducted our audits in accordance with the standards of the PCAOB. Those standards require that we plan and perform the audit to obtainreasonable assurance about whether the financial statements are free of material misstatement, whether due to error or fraud. Our audits includedperforming procedures to assess the risks of material misstatement of the financial statements, whether due to error or fraud, and performing proceduresthat respond to those risks. Such procedures included examining, on a test basis, evidence regarding the amounts and disclosures in the financialstatements. Our audits also included evaluating the accounting principles used and significant estimates made by management, as well as evaluating theoverall presentation of the financial statements. We believe that our audits provide a reasonable basis for our opinion.
/s/ Ernst & Young LLP
We have served as the Company’s auditor since 2009.Denver, ColoradoFebruary 26, 2020
ITEM 9. Changes in and Disagreements with Accountants on Accounting and Financial Disclosure
None.
ITEM 9A. Controls and Procedures
Evaluation of Disclosure Controls and Procedures
Our management carried out an evaluation, under the supervision and with the participation of our Chief Executive Officer and Chief Financial Officer, ofthe effectiveness of the design and operation of our disclosure controls and procedures (as defined in Rule 13a-15(e) of the Exchange Act) as of the endof the period covered by this report. Based on this evaluation, our Chief Executive Officer and Chief Financial Officer concluded that our disclosurecontrols and procedures were effective as of the end of the period covered by this annual report.
Changes in Internal Control over Financial Reporting
There have been no changes in our internal control over financial reporting that occurred during our most recent fiscal quarter that have materiallyaffected, or are reasonably likely to materially affect, our internal control over financial reporting.
Management’s Annual Report on Internal Control Over Financial Reporting
The management of Noodles & Company is responsible for establishing and maintaining adequate internal control over financial reporting. Our internalcontrol over financial reporting is a process designed to provide reasonable assurance regarding the reliability of financial reporting and the preparation offinancial statements for external purposes in accordance with accounting principles generally accepted in the United States of America. Our internalcontrol over financial reporting includes those policies and procedures that (i) pertain to the maintenance of records that, in reasonable detail, accuratelyand fairly reflect the transactions and dispositions of our assets; (ii) provide reasonable assurance that transactions are recorded as necessary to permitpreparation of financial statements in accordance with accounting principles generally accepted in the United State of America, and that our receipts andexpenditures are being made only in accordance with authorizations of our management and directors; and (iii) provide reasonable assurance regardingprevention or timely detection of unauthorized acquisition, use, or disposition of assets that could have a material effect on our financial statements.
Under the supervision and with the participation of our management, including our Chief Executive Officer and Chief Financial Officer, we carried out anevaluation of the effectiveness of our internal control over financial reporting as of December 31, 2019 based on the criteria in “Internal Control - IntegratedFramework (the 2013 framework)” issued by the Committee of Sponsoring Organizations of the Treadway Commission (“COSO”). Based on thisevaluation, our management concluded that our internal control over financial reporting was effective as of December 31, 2019.
Attestation Report of the Independent Registered Public Accounting FirmOur independent registered public accounting firm, Ernst & Young LLP, has issued an attestation report on the effectiveness of our internal control overfinancial reporting as of December 31, 2019. This report follows.
Report of Independent Registered Public Accounting Firm
To the Shareholders and the Board of Directors of Noodles & Company
Opinion on Internal Control over Financial Reporting
We have audited Noodles & Company’s internal control over financial reporting as of December 31, 2019, based on criteria established in InternalControl- Integrated Framework issued by the Committee of Sponsoring Organizations of the Treadway Commission (2013 framework) (the COSOcriteria). In our opinion, Noodles & Company (the Company) maintained, in all material respects, effective internal control over financial reporting as ofDecember 31, 2019, based on the COSO criteria.
We also have audited, in accordance with the standards of the Public Company Accounting Oversight Board (United States) (PCAOB), the consolidatedbalance sheets of the Company as of December 31, 2019 and January 1, 2019, the related consolidated statements of operations, comprehensiveincome (loss), stockholders’ equity and cash flows for each of the three years in the period ended December 31, 2019, and the related notes and ourreport dated February 26, 2020 expressed an unqualified opinion thereon.
Basis for Opinion
The Company’s management is responsible for maintaining effective internal control over financial reporting and for its assessment of the effectiveness ofinternal control over financial reporting included in the accompanying Management’s Annual Report on Internal Control over Financial Reporting. Ourresponsibility is to express an opinion on the Company’s internal control over financial reporting based on our audit. We are a public accounting firmregistered with the PCAOB and are required to be independent with respect to the Company in accordance with the U.S. federal securities laws and theapplicable rules and regulations of the Securities and Exchange Commission and the PCAOB.
We conducted our audit in accordance with the standards of the PCAOB. Those standards require that we plan and perform the audit to obtainreasonable assurance about whether effective internal control over financial reporting was maintained in all material respects.
Our audit included obtaining an understanding of internal control over financial reporting, assessing the risk that a material weakness exists, testing andevaluating the design and operating effectiveness of internal control based on the assessed risk, and performing such other procedures as we considerednecessary in the circumstances. We believe that our audit provides a reasonable basis for our opinion.
Definition and Limitations of Internal Control Over Financial Reporting
A company’s internal control over financial reporting is a process designed to provide reasonable assurance regarding the reliability of financial reportingand the preparation of financial statements for external purposes in accordance with generally accepted accounting principles. A company’s internalcontrol over financial reporting includes those policies and procedures that (1) pertain to the maintenance of records that, in reasonable detail, accuratelyand fairly reflect the transactions and dispositions of the assets of the company; (2) provide reasonable assurance that transactions are recorded asnecessary to permit preparation of financial statements in accordance with generally accepted accounting principles, and that receipts and expenditures ofthe company are being made only in accordance with authorizations of management and directors of the company; and (3) provide reasonable assuranceregarding prevention or timely detection of unauthorized acquisition, use, or disposition of the company’s assets that could have a material effect on thefinancial statements.
Because of its inherent limitations, internal control over financial reporting may not prevent or detect misstatements. Also, projections of any evaluation ofeffectiveness to future periods are subject to the risk that controls may become inadequate because of changes in conditions, or that the degree ofcompliance with the policies or procedures may deteriorate.
/s/ Ernst & Young LLP
Denver, ColoradoFebruary 26, 2020
ITEM 9B. Other Information
None.PART III
ITEM 10. Directors, Executive Officers and Corporate Governance
We have adopted a Code of Business Conduct and Ethics that applies to our directors and a Code of Business Conduct and Ethics that applies to ourofficers and employees (collectively, the “Codes”), including our principal executive, financial and accounting officers, and persons performing similarfunctions. These Codes are published on our corporate governance website located at investor.noodles.com/corporate-governance.cfm. We intend todisclose future amendments to provisions of our Codes, or waivers of provisions of the Codes granted to executive officers and directors, on the websitewithin four business days following the date of such amendment or waiver.
The remaining information required by this item is incorporated herein by reference to the sections entitled “Proposal No. 1 - Election of Directors,”“Section 16(a) Beneficial Ownership Reporting Compliance,” “Executive Officers,” “Board Committees—Policy Regarding Stockholder Recommendations”and “Board Committees—Audit Committee” in our definitive Proxy Statement for the Annual Meeting of Shareholders to be held on April 30, 2020 (the“Proxy Statement”).
ITEM 11. Executive Compensation
The information required by this item is incorporated by reference to the sections entitled “Executive Compensation,” “Director Compensation” and “BoardCommittees—Compensation Committee Interlocks and Insider Participation” in the Proxy Statement.ITEM 12. Security Ownership of Certain Beneficial Owners and Management and Related Stockholder Matters
The information required by this item is incorporated by reference to the sections entitled “Equity Compensation Plan Information” and “SecurityOwnership of Certain Beneficial Owners and Management” in the Proxy Statement.
ITEM 13. Certain Relationships and Related Transactions, and Director Independence
The information required by this item is incorporated by reference to the sections entitled “Transactions with Related Persons” and “Directors andCorporate Governance—Board Independence” in the Proxy Statement.ITEM 14. Principal Accounting Fees and Services
The information required by this item is incorporated by reference to the section entitled “Proposal No. 3 - Ratification of Appointment of IndependentRegistered Public Accounting Firm for 2020” in the Proxy Statement.
PART IV
ITEM 15. Exhibits, Financial Statement Schedules
1. Our Consolidated Financial Statements and Notes thereto are included in Item 8, “Financial Statements and Supplementary Data,” of this AnnualReport on Form 10-K.
2. All financial schedules have been omitted either because they are not applicable or because the required information is provided in ourConsolidated Financial Statements and Notes thereto, included in Item 8 of this Annual Report on Form 10-K.
3. The Index to Exhibits is incorporated herein by reference and is filed as part of this 10-K.
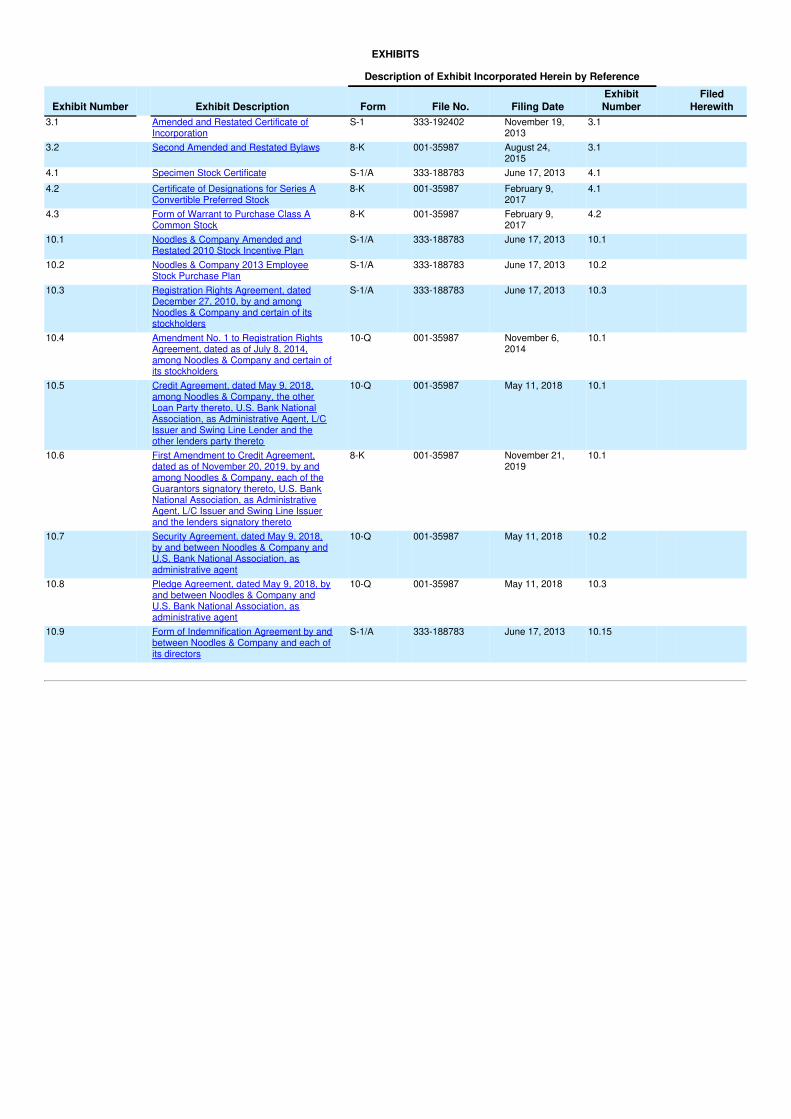
EXHIBITS
Description of Exhibit Incorporated Herein by Reference
Exhibit Number Exhibit Description Form File No. Filing Date ExhibitNumber
FiledHerewith
3.1
Amended and Restated Certificate ofIncorporation
S-1
333-192402
November 19,2013
3.1
3.2
Second Amended and Restated Bylaws
8-K
001-35987
August 24,2015
3.1
4.1 Specimen Stock Certificate S-1/A 333-188783 June 17, 2013 4.1 4.2
Certificate of Designations for Series AConvertible Preferred Stock
8-K
001-35987
February 9,2017
4.1
4.3
Form of Warrant to Purchase Class ACommon Stock
8-K
001-35987
February 9,2017
4.2
10.1
Noodles & Company Amended andRestated 2010 Stock Incentive Plan
S-1/A
333-188783
June 17, 2013
10.1
10.2
Noodles & Company 2013 EmployeeStock Purchase Plan
S-1/A
333-188783
June 17, 2013
10.2
10.3
Registration Rights Agreement, datedDecember 27, 2010, by and amongNoodles & Company and certain of itsstockholders
S-1/A
333-188783
June 17, 2013
10.3
10.4
Amendment No. 1 to Registration RightsAgreement, dated as of July 8, 2014,among Noodles & Company and certain ofits stockholders
10-Q
001-35987
November 6,2014
10.1
10.5
Credit Agreement, dated May 9, 2018,among Noodles & Company, the otherLoan Party thereto, U.S. Bank NationalAssociation, as Administrative Agent, L/CIssuer and Swing Line Lender and theother lenders party thereto
10-Q
001-35987
May 11, 2018
10.1
10.6
First Amendment to Credit Agreement,dated as of November 20, 2019, by andamong Noodles & Company, each of theGuarantors signatory thereto, U.S. BankNational Association, as AdministrativeAgent, L/C Issuer and Swing Line Issuerand the lenders signatory thereto
8-K
001-35987
November 21,2019
10.1
10.7
Security Agreement, dated May 9, 2018,by and between Noodles & Company andU.S. Bank National Association, asadministrative agent
10-Q
001-35987
May 11, 2018
10.2
10.8
Pledge Agreement, dated May 9, 2018, byand between Noodles & Company andU.S. Bank National Association, asadministrative agent
10-Q
001-35987
May 11, 2018
10.3
10.9
Form of Indemnification Agreement by andbetween Noodles & Company and each ofits directors
S-1/A
333-188783
June 17, 2013
10.15
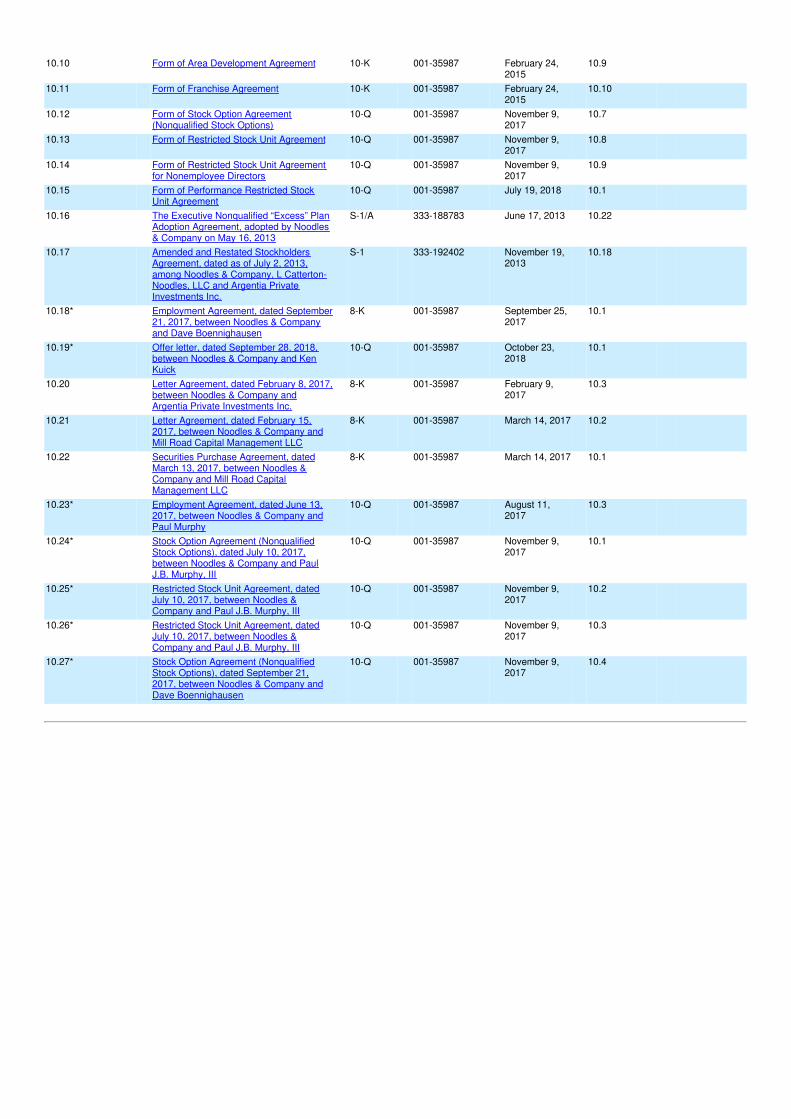
10.10
Form of Area Development Agreement
10-K
001-35987
February 24,2015
10.9
10.11
Form of Franchise Agreement
10-K
001-35987
February 24,2015
10.10
10.12
Form of Stock Option Agreement(Nonqualified Stock Options)
10-Q
001-35987
November 9,2017
10.7
10.13
Form of Restricted Stock Unit Agreement
10-Q
001-35987
November 9,2017
10.8
10.14
Form of Restricted Stock Unit Agreementfor Nonemployee Directors
10-Q
001-35987
November 9,2017
10.9
10.15
Form of Performance Restricted StockUnit Agreement
10-Q
001-35987
July 19, 2018
10.1
10.16
The Executive Nonqualified “Excess” PlanAdoption Agreement, adopted by Noodles& Company on May 16, 2013
S-1/A
333-188783
June 17, 2013
10.22
10.17
Amended and Restated StockholdersAgreement, dated as of July 2, 2013,among Noodles & Company, L Catterton-Noodles, LLC and Argentia PrivateInvestments Inc.
S-1
333-192402
November 19,2013
10.18
10.18*
Employment Agreement, dated September21, 2017, between Noodles & Companyand Dave Boennighausen
8-K 001-35987 September 25,2017
10.1
10.19*
Offer letter, dated September 28, 2018,between Noodles & Company and KenKuick
10-Q
001-35987
October 23,2018
10.1
10.20
Letter Agreement, dated February 8, 2017,between Noodles & Company andArgentia Private Investments Inc.
8-K 001-35987 February 9,2017
10.3
10.21
Letter Agreement, dated February 15,2017, between Noodles & Company andMill Road Capital Management LLC
8-K
001-35987
March 14, 2017
10.2
10.22
Securities Purchase Agreement, datedMarch 13, 2017, between Noodles &Company and Mill Road CapitalManagement LLC
8-K
001-35987
March 14, 2017
10.1
10.23*
Employment Agreement, dated June 13,2017, between Noodles & Company andPaul Murphy
10-Q
001-35987
August 11,2017
10.3
10.24*
Stock Option Agreement (NonqualifiedStock Options), dated July 10, 2017,between Noodles & Company and PaulJ.B. Murphy, III
10-Q
001-35987
November 9,2017
10.1
10.25*
Restricted Stock Unit Agreement, datedJuly 10, 2017, between Noodles &Company and Paul J.B. Murphy, III
10-Q
001-35987
November 9,2017
10.2
10.26*
Restricted Stock Unit Agreement, datedJuly 10, 2017, between Noodles &Company and Paul J.B. Murphy, III
10-Q
001-35987
November 9,2017
10.3
10.27*
Stock Option Agreement (NonqualifiedStock Options), dated September 21,2017, between Noodles & Company andDave Boennighausen
10-Q
001-35987
November 9,2017
10.4
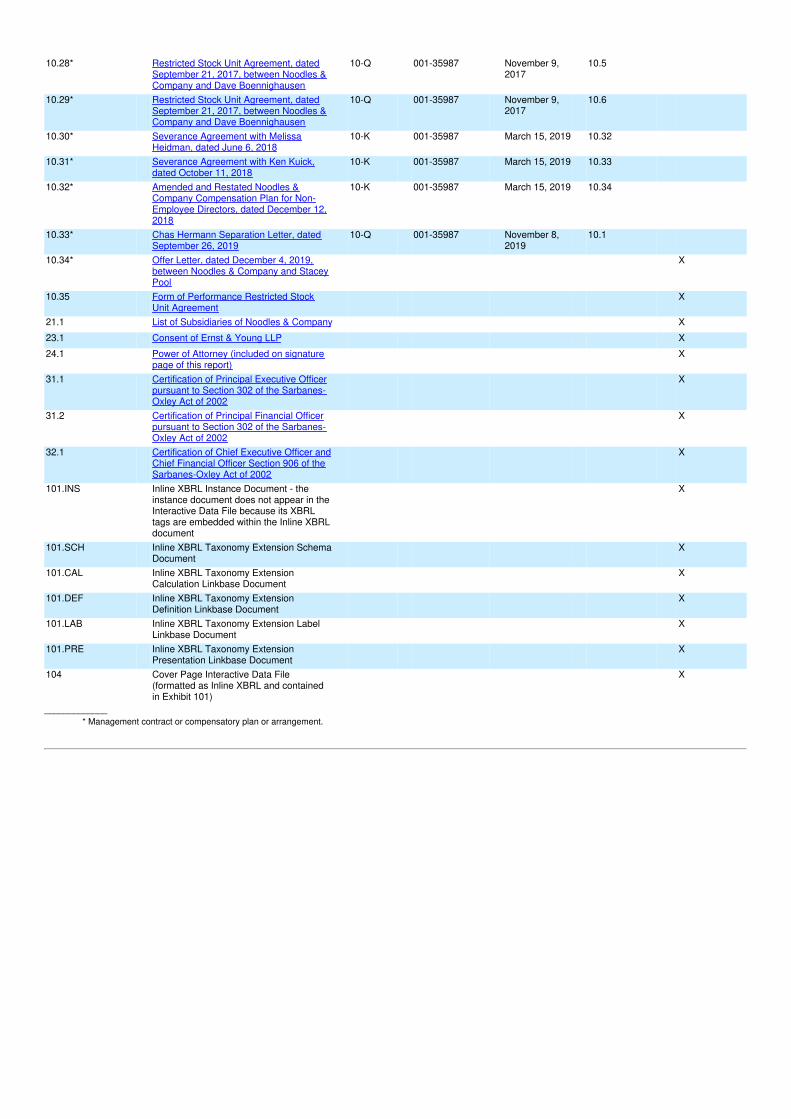
10.28*
Restricted Stock Unit Agreement, datedSeptember 21, 2017, between Noodles &Company and Dave Boennighausen
10-Q
001-35987
November 9,2017
10.5
10.29*
Restricted Stock Unit Agreement, datedSeptember 21, 2017, between Noodles &Company and Dave Boennighausen
10-Q
001-35987
November 9,2017
10.6
10.30*
Severance Agreement with MelissaHeidman, dated June 6, 2018
10-K
001-35987
March 15, 2019
10.32
10.31*
Severance Agreement with Ken Kuick,dated October 11, 2018
10-K
001-35987
March 15, 2019
10.33
10.32*
Amended and Restated Noodles &Company Compensation Plan for Non-Employee Directors, dated December 12,2018
10-K
001-35987
March 15, 2019
10.34
10.33*
Chas Hermann Separation Letter, datedSeptember 26, 2019
10-Q
001-35987
November 8,2019
10.1
10.34*
Offer Letter, dated December 4, 2019,between Noodles & Company and StaceyPool
X
10.35
Form of Performance Restricted StockUnit Agreement
X
21.1 List of Subsidiaries of Noodles & Company X23.1 Consent of Ernst & Young LLP X24.1
Power of Attorney (included on signaturepage of this report)
X
31.1
Certification of Principal Executive Officerpursuant to Section 302 of the Sarbanes-Oxley Act of 2002
X
31.2
Certification of Principal Financial Officerpursuant to Section 302 of the Sarbanes-Oxley Act of 2002
X
32.1
Certification of Chief Executive Officer andChief Financial Officer Section 906 of theSarbanes-Oxley Act of 2002
X
101.INS
Inline XBRL Instance Document - theinstance document does not appear in theInteractive Data File because its XBRLtags are embedded within the Inline XBRLdocument
X
101.SCH
Inline XBRL Taxonomy Extension SchemaDocument
X
101.CAL
Inline XBRL Taxonomy ExtensionCalculation Linkbase Document
X
101.DEF
Inline XBRL Taxonomy ExtensionDefinition Linkbase Document
X
101.LAB
Inline XBRL Taxonomy Extension LabelLinkbase Document
X
101.PRE
Inline XBRL Taxonomy ExtensionPresentation Linkbase Document
X
104
Cover Page Interactive Data File(formatted as Inline XBRL and containedin Exhibit 101)
X
_____________* Management contract or compensatory plan or arrangement.

ITEM 16. Form 10-K Summary.
None.
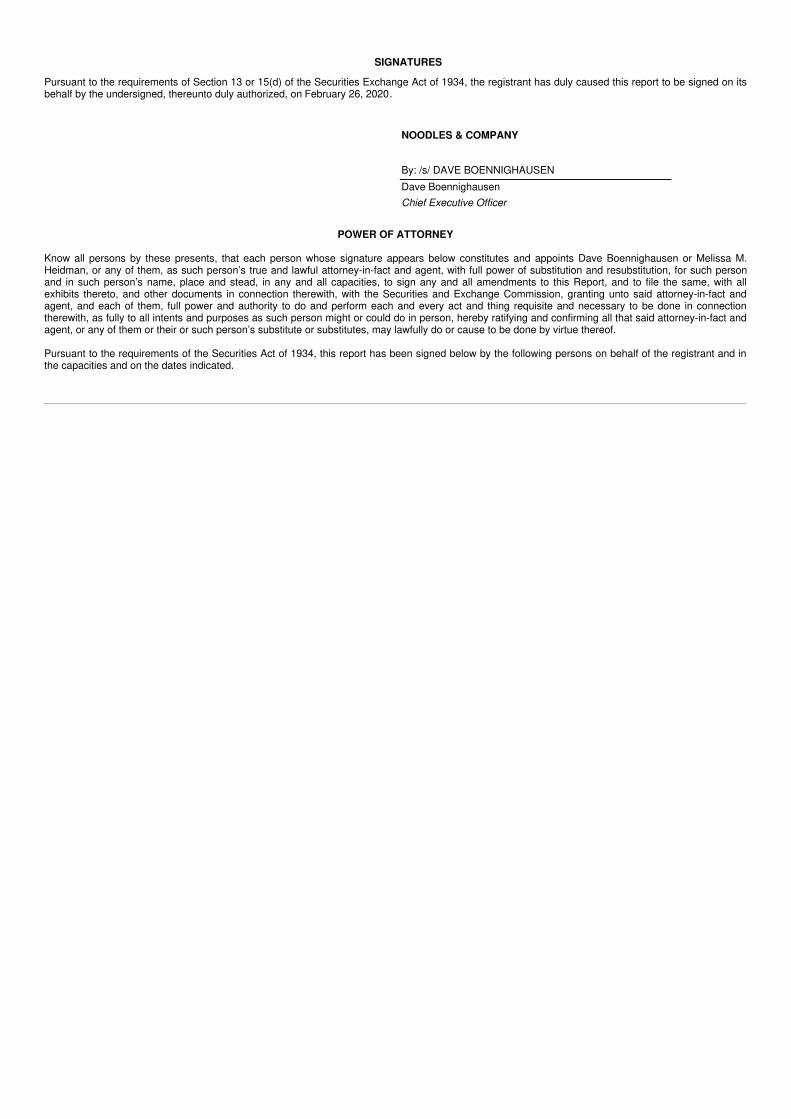
SIGNATURES
Pursuant to the requirements of Section 13 or 15(d) of the Securities Exchange Act of 1934, the registrant has duly caused this report to be signed on itsbehalf by the undersigned, thereunto duly authorized, on February 26, 2020.
NOODLES & COMPANY
By: /s/ DAVE BOENNIGHAUSEN Dave Boennighausen Chief Executive Officer
POWER OF ATTORNEY
Know all persons by these presents, that each person whose signature appears below constitutes and appoints Dave Boennighausen or Melissa M.Heidman, or any of them, as such person’s true and lawful attorney-in-fact and agent, with full power of substitution and resubstitution, for such personand in such person’s name, place and stead, in any and all capacities, to sign any and all amendments to this Report, and to file the same, with allexhibits thereto, and other documents in connection therewith, with the Securities and Exchange Commission, granting unto said attorney-in-fact andagent, and each of them, full power and authority to do and perform each and every act and thing requisite and necessary to be done in connectiontherewith, as fully to all intents and purposes as such person might or could do in person, hereby ratifying and confirming all that said attorney-in-fact andagent, or any of them or their or such person’s substitute or substitutes, may lawfully do or cause to be done by virtue thereof.
Pursuant to the requirements of the Securities Act of 1934, this report has been signed below by the following persons on behalf of the registrant and inthe capacities and on the dates indicated.
Signature Title Date/s/ DAVE BOENNIGHAUSEN
Dave Boennighausen Director, Chief Executive Officer(principal executive officer)
February 26, 2020
/s/ KEN KUICK Ken Kuick Chief Financial Officer
(principal financial officer)February 26, 2020
/s/ KATHY LOCKHART Kathy Lockhart Vice President and Controller
(principal accounting officer)February 26, 2020
/s/ JEFFREY JONES Jeffrey Jones Chairman February 26, 2020
/s/ ROBERT HARTNETT Robert Hartnett Director February 26, 2020
/s/ MARY EGAN Mary Egan Director February 26, 2020
/s/ DREW MADSEN Drew Madsen Director February 26, 2020
/s/ ELISA SCHREIBER Elisa Schreiber Director February 26, 2020
/s/ ANDREW TAUB Andrew Taub Director February 26, 2020
81