non-isothermal degradation of a thermoset powder coating in inert and oxidant atmospheres
TRANSCRIPT

Journal of Thermal Analysis and Calorimetry, Vol. 72 (2003) 719–728
NON-ISOTHERMAL DEGRADATION OF ATHERMOSET POWDER COATING IN INERT ANDOXIDANT ATMOSPHERES
J. M. Salla*, J. M. Morancho, A. Cadenato and X. Ramis
Laboratori de Termodin´mica i Físico-química, ETSEIB, UPC, Diagonal 647, 08028 Barcelona,Spain
Abstract
This paper studies the thermal stability of an epoxy powder coating. The study was carried out in a
thermobalance at various heating rates and in different atmospheres: nitrogen, air and oxygen. Deg-
radation in air and oxygen leads to a kinetic process which is clearly different from degradation in an
inert atmosphere. To characterise each process, the DTG signal peaks were separated and kinetic pa-
rameters were associated to each by means of the isoconversional method and other standard meth-
ods. The results obtained were compared with the experimental results.
Keywords: isoconversional kinetics, powder coating, thermosets
Introduction
Interest in thermoset powder coatings is rising continuously due their environmental ad-
vantages, such as low emission of volatile products. The final product is obtained by
means of polymerisation and cross-linking of their components [1, 2]. Thermal stability
studies by TG permit analysis of the quality of the material formed (the degree of cure or
the degree of cross-linking) [3] and enables quantification of the proportion of additives.
Differences in thermal stability, due either to differences in chemical structure or to dif-
ferences in degree of cure, using an inert, oxygen or air atmosphere, have also been used
to predict physical and chemical ageing and lifetime [4]. Obtaining the kinetic parameters
of these degradation processes enables us to analyse them on a scale of times and temper-
atures not necessarily limited to those employed to obtain the experimental results.
The literature includes many studies of the thermal degradation of thermoset and
thermoplastic materials which show the difficulty of kinetic studies, due to the heter-
ogeneity of the substances and the fact that the degradation process consists of vari-
ous stages. The latter problem implies superposition of different reactive processes
which are difficult to characterise with a single activation energy [5–8].The aim of this paper is to show the results of kinetic study of non-isothermal
thermal degradation of an epoxy powder coating, in an inert atmosphere and in
1388–6150/2003/ $ 20.00
© 2003 Akadémiai Kiadó, Budapest
Akadémiai Kiadó, Budapest
Kluwer Academic Publishers, Dordrecht
* Author for correspondence: E-mail: [email protected]

oxygen and air atmospheres. To obtain a kinetic triplet, (f(α), A and E, where f(α) is afunction of the degree of conversion, A, the preexponential factor and E, the activationenergy) which is representative of each degradation process, the processes manifestedas peaks in the DTG signal were separated and treated as independent reactions, and ki-netic parameters were associated to them by the standard methods. Specifically, in thiswork the differential and integral isoconversional methods [6, 9] are compared with theresults obtained with Coats–Redfern [10] and Ozawa [11] equations. With the first twomethods an activation energy (E) and a second kinetic parameter is obtained for eachdegree of conversion (Aint for the integral and Adif for the differential) which includesthe preexponential factor, without the need for presupposition of a kinetic model. In or-der to apply the Coats–Redfern and Ozawa equations to the entire reactive process, it isnecessary to presuppose a kinetic model, and a single activation energy (E) and a singlepreexponential factor (A) are obtained. A variation on the so-called Kissinger method[12] was also employed which only uses the temperature shift of the peaks at differentrates, to obtain the kinetic parameters. The results obtained through all these methodswere compared with the experimental results.
Theoretical considerations
In the non-isothermal experiments carried out with a thermobalance, the mass of a
substance is measured as a function of temperature. The degree of conversion [13] is
defined as:
α =∞
m m
m m
0
0
–
–(1)
where m is the mass corresponding to a temperature T, mo is the initial mass and m¥ is
the mass at the end of the experiment.
Variation of the degree of conversion with time (da/dt) is proportional to a func-
tion of the degree of conversion: f(α) [14]. The proportionality constant (k) is known
as rate constant and depends on the temperature, according to the Arrhenius equation,
where A is the preexponential factor and E is the activation energy.
d
d
α α αt
= =
kf A
E
RTf( ) exp – ( ) (2)
The integral of the inverse of f(α) between the start of the reaction (α=0) and a given
degree of conversion α, is represented by g(α):
g ( )α αα
α
=∫0
d
( )f(3)
f(α) can take different forms [13, 15]. Table 1 indicates those used here.
The variation of the degree of conversion with temperature (da/dT) is obtained
in dynamic experiments. Replacing the heating rate (β=dT/dt) in Eq. (2):
J. Therm. Anal. Cal., 72, 2003
720 SALLA et al.: THERMOSET POWDER COATING
β α αd
dT=
A
E
RTfexp – ( ) (4)
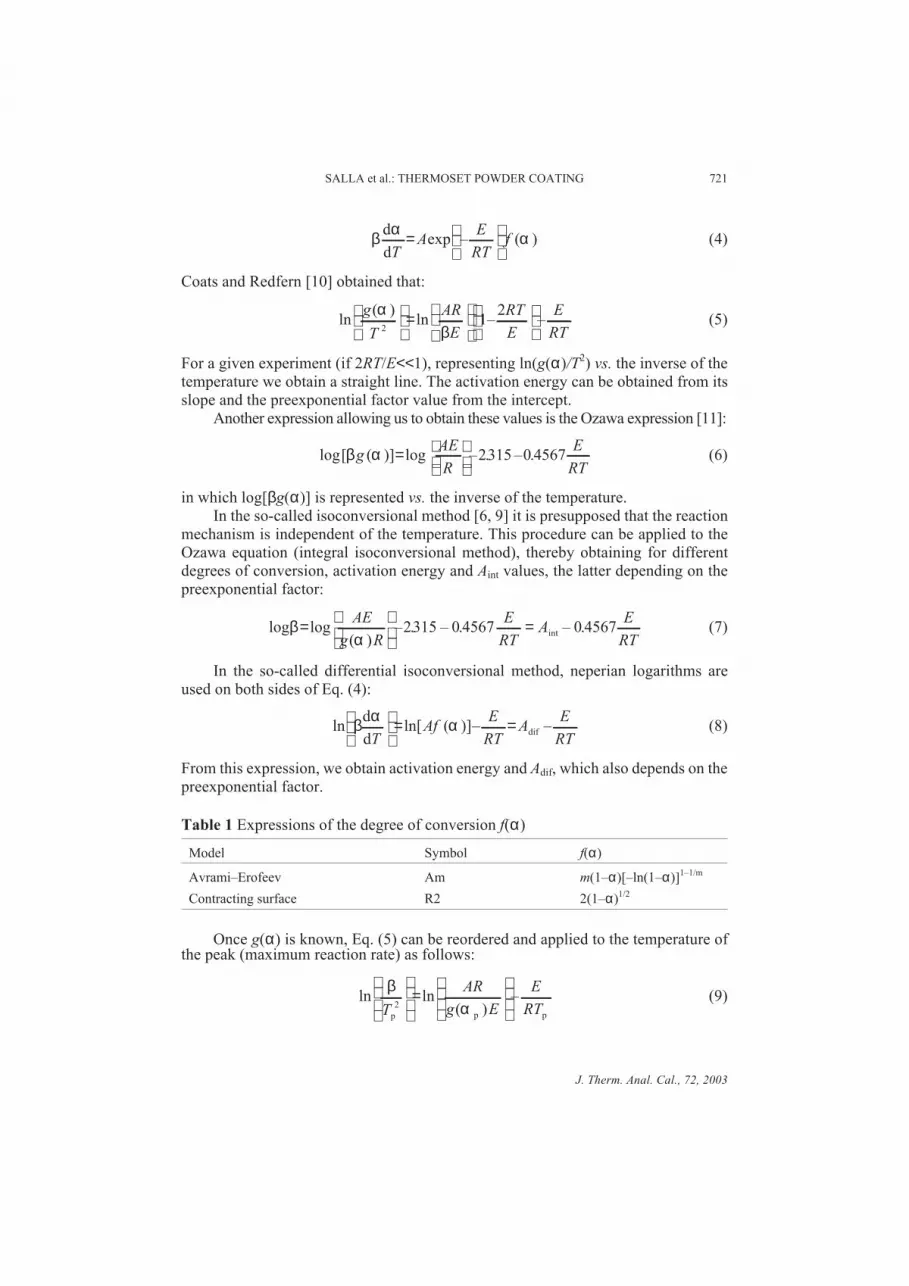
Coats and Redfern [10] obtained that:
ln( )
ln – –g
T
AR
E
RT
E
E
RT
αβ2
12
=
(5)
For a given experiment (if 2RT/E<<1), representing ln(g(α)/T2) vs. the inverse of the
temperature we obtain a straight line. The activation energy can be obtained from its
slope and the preexponential factor value from the intercept.
Another expression allowing us to obtain these values is the Ozawa expression [11]:
log[ ( )] log – . – .β αgAE
R
E
RT=
2315 0 4567 (6)
in which log[βg(α)] is represented vs. the inverse of the temperature.
In the so-called isoconversional method [6, 9] it is presupposed that the reaction
mechanism is independent of the temperature. This procedure can be applied to the
Ozawa equation (integral isoconversional method), thereby obtaining for different
degrees of conversion, activation energy and Aint values, the latter depending on the
preexponential factor:
log log( )
– . – . – .intβα
=
=AE
g
E
RTA
E
R2315 0 4567 0 4567
RT(7)
In the so-called differential isoconversional method, neperian logarithms are
used on both sides of Eq. (4):
ln ln[ ( )]– –β α αd
dT
= =Af
E
RTA
E
RTdif (8)
From this expression, we obtain activation energy and Adif, which also depends on the
preexponential factor.
Table 1 Expressions of the degree of conversion f(α)
Model Symbol f(α)
Avrami–Erofeev Am m(1–α)[–ln(1–α)]1–1/m
Contracting surface R2 2(1–α)1/2
Once g(α) is known, Eq. (5) can be reordered and applied to the temperature ofthe peak (maximum reaction rate) as follows:
ln ln( )
–β
αT
AR
g E
E
RTp
2
=
p p
(9)
J. Therm. Anal. Cal., 72, 2003
SALLA et al.: THERMOSET POWDER COATING 721

If the degree of conversion in the peak, αp does not vary with heating rate, representation
of ln( / )β Tp2 vs. 1/Tp for different rates permits us to obtain activation energy and pre-
exponential factor. If in Eq. (9) a model of order n is assumed and that n(1–αp)n–1≈1, we
obtain the well-known Kissinger’s equation [12].
ln ln –β
T
AR
E
E
RTp
2
=
p
(10)
A similar procedure could be followed for Eqs (6) and (8), using (da/dt)p instead
of Tp.
Experimental
Materials
E3-0007/V powder coating manufactured by Ferro Enamel EspaÔola, S.A. was used.
The reactive components of this product are epoxy bisphenol A (with a molecular
mass between 14000 and 15000 g mol–1) and dicyandiamide, which are found in a
proportion of 95/5. This coating also contains 30% of colouring additives: TiO2,
BaSO4, SiO2 and MgO (the latter two in a proportion of less than 1%).
Methods
Experimental determination was carried out with a Mettler TG50 thermobalance,
linked to a Mettler TA4000 thermal analysis system. Degradation of coating samples
with an approximate mass of 10 mg was studied. Dynamic tests were carried out at
different rates (1 to 20oC min) between 25 and 900oC (in the experiments carried out
at lower rates maximum temperature reached was 700oC) in nitrogen, air and oxygen
atmospheres (gases entered at 200 cm3 min–1, measured in normal conditions).
Results and discussion
Figure 1 represents the degree of conversion calculated by means of Eq. (1), where m¥ is
the sample mass at the end of the experiment, vs. the temperature for different heating
rates, in a nitrogen atmosphere. Two different stages can be observed in the process, and
the lower the heating rate, the lower the temperature at which they occur. The first stage
(at lower temperature) is associated with thermal degradation of the polymeric matrix,
the second with pyrolysis of the carbon formed in the first stage [16, 17].
Figure 2 shows the derivative of the curve in Fig. 1. A peak appears for each
stage of the process. Height and temperature of the peaks increase with heating rate.
The kinetics of the first stage of degradation were studied, considering m¥
(Eq. (1)) as the mass of the substance at the end of this stage. The results obtained by
means of isoconversional analysis, through both the integral (Eq. (7)) and differential
(Eq. (8)) methods are shown in Table 2, which sets out activation energy and Aint and
J. Therm. Anal. Cal., 72, 2003
722 SALLA et al.: THERMOSET POWDER COATING

Adif values. It can be seen that activation energy varies with degree of conversion.
Both methods lead to similar values in the intermediate area of the degradation stage
(between α=0.2 and α=0.9), where activation energy varies slightly, indicating that
this part of the degradation process must be quite similar. The differences observed at
the beginning and end of degradation must be interpreted with caution since they
could be the result of manipulation of the experimental results.
On the basis of the derivatives of the experimental curves (DTG curves), the
peaks were separated, for each heating rate. For separation, the mathematical proce-
dure provided by Jandel Scientific Software program ‘Peak.Fit’ was used. Among the
different functions included in the program, we used the so-called ‘log normal
4-parameter (area)’. The corresponding kinetic parameters were obtained by apply-
J. Therm. Anal. Cal., 72, 2003
SALLA et al.: THERMOSET POWDER COATING 723
Fig. 1 Degree of conversion (α) vs. temperature in a nitrogen atmosphere, for differentheating rates
Fig. 2 Rate of degree of conversion (dα/dt, DTG curves) vs. temperature in a nitrogenatmosphere for different heating rates

ing the various methods described to the peaks corresponding to the first stage of deg-
radation. For example, application of Eq. (5) to the curve corresponding to a rate of
10°C min–1, with Am model with m=1.5 (Table 1), gave an activation energy of
128 kJ mol–1 and a preexponential factor of 4.92⋅105 s–1. Employing Eq. (9), the tem-
peratures of the peaks of rates 1, 3, 5, 10 and 20°C min–1 and an Am model with
m=1.5, gave an activation energy of 188 kJ mol–1, very similar to that found with
isoconversional methods, and a preexponential factor of 2.48⋅1010 s-1.
Table 2 Activation energy and Aint, Adif values obtained by integral and differentialisoconversional methods in nitrogen atmosphere
Isoconversional integral (Eq. (7))
α 0.1 0.2 0.3 0.4 0.5 0.6 0.7 0.8 0.9
R2 0.964 0.987 0.988 0.99 0.99 0.989 0.989 0.9888 0.989
Aint/K s–1 7.437 13.61 14.68 15.15 15.14 15.29 15.56 16.539 7.3
Eint/kJ mol–1 113.3 166.2 180.1 185 183.8 185.6 187.2 190.26 198.4
Isoconversional differential (Eq. (8))
α 0.1 0.2 0.3 0.4 0.5 0.6 0.7 0.8 0.9
R2 0.993 0.993 0.991 0.987 0.979 0.986 0.988 0.9884 0.996
Adif/s–1 34.59 30.88 31.18 28.42 28.49 28.47 28.36 29.155 30.26
Edif/kJ mol–1 233.4 208.2 208.1 192.6 193.2 193.3 193.7 200.36 212.2
The models set out in Table 1 were chosen because they are the ones which best
reproduce the reduced master curve Z(α)/ Z(0.5), where Z(α)= f(α)⋅g(α). The way in
which the reduced function Z(α)/Z(0.5) is used to decide which model best fits the ex-
perimental results is described in [18].
Figure 3 shows the experimental degree of conversion vs. temperature (discon-
tinuous lines) for two heating rates (5 and 10oC min–1) along with the results obtained
from the various procedures applied. Although the best simulation is obtained with
the integral isoconversional method, the results given by the other methods also fit
reasonably well with the experimental data. This would seem to indicate that using
the same procedures for kinetic study of the oxidation process with air and oxygen
would produce similarly correct results.
Figure 4 compares the experimental curves obtained at 10oC min–1 in different at-
mospheres: nitrogen, air and oxygen. The degree of conversion is represented vs. the
temperature (m¥ is the mass at the end of the experiment). In the oxygen and air atmo-
spheres, the degradation process has an additional stage. Up to a temperature slightly
above 400°C, the degradation process is very similar in all three. Therefore, the decom-
position process should also be very similar. After this point, mass loss slows down in the
presence of oxygen or air. An intermediate oxidation compound may be formed. Then a
sharp change occurs in each of these atmospheres, especially oxygen. This stage is
clearly one of oxidation (the higher the proportion of oxygen, the more accelerated the
J. Therm. Anal. Cal., 72, 2003
724 SALLA et al.: THERMOSET POWDER COATING

process). At the same time, the curve corresponding to the nitrogen atmosphere slows
down and the coating continues to degrade (carbon pyrolysis). In air and oxygen atmo-
spheres, this last stage of degradation has practically disappeared.
Figure 5 shows the derivative of the curves in Fig. 4, in which the processes de-
scribed above can be observed. The oxidation taking place in pure oxygen and air is
clearly reflected and separated from the degradation processes. The appearance of
shoulders in the degradation peaks in the presence of air and oxygen (but not in the
J. Therm. Anal. Cal., 72, 2003
SALLA et al.: THERMOSET POWDER COATING 725
Fig. 3 Comparison of experimental data (discontinuous lines) and the data obtainedfrom different methods (symbols) of the degree of conversion (α) vs. tempera-ture of the first decomposition stage in a nitrogen atmosphere. In the legend, thenumber on the left is the heating rate in K min–1; isocon int are the dates ob-tained from Eq. (7); isocon dif, from Eq. (8); cr a15, from Eq. (5) withAm model and m=1.5; oza a15, from Eq. (6) with Am model and m=1.5;a15 pic, from Eq. (9) with Am model and m=1.5
Fig. 4 Comparison of degradation processes in nitrogen, oxygen and air. Degree ofconversion (α) vs. temperature at heating rate of 10 K min–1

nitrogen atmosphere), indicates that the oxydant atmospheres have a catalytic effect
on the degradation process.
Figure 6 shows the results of the mathematical procedure described for separa-
tion of the peaks of the degradation curve in an air atmosphere at 10°C min–1. The dis-
continuous curve corresponds to the real curve and the continuous curves to the peaks
obtained. The sum of all the separated curves provides a highly accurate reproduction
of the experimental signal. Similarly good results are obtained for other rates, both in
air and oxygen. From the temperature of the peak corresponding to oxidation in air
and oxygen associated to each experimental rate (1, 3, 5, 10 and 20°C min–1), the cor-
responding kinetic parameters were obtained by using Eq. (9). The models used were
the Am model and the R2. With the former and m=2, when the atmosphere was air,
J. Therm. Anal. Cal., 72, 2003
726 SALLA et al.: THERMOSET POWDER COATING
Fig. 5 Comparison of degradation processes in nitrogen, oxygen and air. Rate of thedegree of conversion (dα/dt) vs. temperature at heating rate of 10 K min–1
Fig. 6 Decomposition of overall kinetic process in different peaks. Degradation in air at 10 K min–1

the activation energy and preexponential factor obtained were 129 kJ mol–1 and
2.35⋅104 s–1, respectively. When the atmosphere is oxygen, the activation energy and
the preexponential factor are 217 kJ mol–1 and 3.14⋅1011 s–1, respectively. The discon-
tinuous line in Fig. 7 represents the degree of conversion vs. temperature, correspond-
ing to the oxidation stage at 10°C min–1 in air and oxygen (the degree of conversion of
this stage was normalized between 0 and 1) along with the values obtained from the
different models. As occurred with the nitrogen atmosphere, the results of the simula-
tion fit reasonably well.
As can be observed in Fig. 6, the catalytic effect produced by the presence of air
and oxygen leads to two peaks in the degradation process. One of these is identical to
that found for degradation in nitrogen and the other corresponds to lower tempera-
ture. Analysis of these peaks in both air and oxygen atmospheres gives an activation
energy which is practically identical to the activation energy associated with the first
degradation process in nitrogen.
Conclusions
The process of non-isothermal degradation of the thermoset epoxy coating in an inert
atmosphere basically occurs in two stages, a decomposition stage which occurs at
temperatures of around 400°C and another stage which takes place at a higher tem-
perature and consists of pyrolysis of the carbon residue formed in the first stage.
When degradation takes place in an oxygen or air atmosphere, after the first
stage, which again takes place at around 400°C, another process occurs which con-
sists of oxidation of the degraded matter, which takes place at some 50 or 100°C
higher, depending on whether the atmosphere is oxygen or air.
J. Therm. Anal. Cal., 72, 2003
SALLA et al.: THERMOSET POWDER COATING 727
Fig. 7 Comparison of experimental data (discontinuous lines) and data obtained fromdifferent models (symbols) of the degree of conversion (α) vs. temperature ofthe oxidation process in air (air in the legend) and oxygen (oxy in the legend) atheating rate of 10 K min–1 pic a2 are the date from Eq. (9) with Am model andm=2; pic a3 from Eq. (9) with Am model and m=3; isocon int from Eq. (7);isocon dif, from Eq. (8)

In order to characterise the degradation and oxidation processes by means of the
corresponding kinetic parameters, it was found that mathematical separation of the
DTG signal peaks and then the application of the usual procedures to each peak to de-
termine the kinetic triplet, produced reasonably correct results in comparison with ex-
perimental values.
The best results were obtained through the isoconversional method. However,
the use of temperature shift of the DTG curve maximums with heating rate, once a
model had been established, to determine the activation energy and the preexponen-
tial factor of each process is of great interest by virtue of its simplicity and the good
results obtained.
* * *
This work was supported by CICYT project no. MAT2000-1002-C02-02 and by CICYT and
FEDER under Grant No. PPQ2001-2764-C03-02. The material used for this work was provided by
Ferro Enamel EspaÔola S.A.
References
1 R. A. Dickie, D. R. Bauer, S. M. Ward and D. A. Wagner, Prog. Org. Coat., 31 (1997) 209.2 T. A. Misev and R. Vanderlinde, Prog. Org. Coat., 34 (1998) 160.3 R. B. Prime, J. M. Burns, M. L. Karmin, C. H. Moy and H. T. Tu, J. Coat. Technol., 60 (1988) 55.4 C. M. Neag, L. Floyd and S. Manzuk, Polym. Mater. Sci. Eng., 68 (1993) 331.5 S. Vyazovkin, Intern. J. Chem. Kinetics, 28 (1996) 95.6 S. Vyazovkin and W. Linert, J. Sol. State Chem., 114 (1995) 392.7 P. Budrugeac, D. Homenkovschi and E. Segal, J. Therm. Anal. Cal., 63 (2001) 457.8 P. Budrugeac, D. Homenkovschi and E. Segal, J. Therm. Anal. Cal., 63 (2001) 465.9 J. Šesták, J. Thermal Anal., 16 (1979) 503.
10 A. W. Coats and J. P. Redfern, Nature, 201 (1964) 68.11 T. Ozawa, Bull. Chem. Soc. Jpn., 38 (1965) 1881.12 H. E. Kissinger, Anal. Chem., 29 (1957) 1702.13 S. Montserrat, J. Málek and P. Colomer, Thermochim. Acta, 313 (1998) 83.14 J. Šesták, Thermophysical Properties of Solids, Their Measurements and Theoretical Analysis,
Elsevier, Amsterdam 1984.15 S. Vyazovkin and D. Dollimore, J. Chem. Inform. Comput. Sci., 36 (1996) 42.16 R. S. Parikh and R. Mahalingam, Ind. Eng. Chem. Res., 26 (1987) 2378.17 T. X. Phuoc and P. Durbetaki, Lett. Heat Mass Transfer, 30 (1987) 2231.18 J. M. Criado, Thermochim. Acta, 24 (1978) 186.
J. Therm. Anal. Cal., 72, 2003
728 SALLA et al.: THERMOSET POWDER COATING