noja power intelligent switchgear
TRANSCRIPT

i
NOJA Power
Intelligent Switchgear
Knowledge Sharing Report
Author: Jalil Yaghoobi
Sep 2021

i
PURPOSE
This document is the knowledge sharing report for NOJA Power Intelligent Switchgear project. This report describes the project, the activities undertaken, outcomes achieved, and potential future direction of the work.
DISCLAIMER
This Project received funding from the Australian Renewable Energy Agency (ARENA) as part of ARENA’s Advancing Renewables Program. The views expressed herein are not necessarily the views of the Australian Government, and the Australian Government does not accept responsibility for any information or advice contained herein.

ii
EXECUTIVE SUMMARY
There is a global momentum to diversify electricity generation sources for economic, environmental, and security reasons. “Distributed Generation” (DG) enables more companies to enter the electricity market stimulating competition, encouraging development of Renewable Energy (RE). However, conventional electricity distribution networks are poorly matched to the needs of DG because they were designed to meet the demands of a large generating capacity sited close to the centres of population. This project addresses the issues introduced by smart grids to enable electricity utilities to move away from centralised generation to an expanding DG model. On the other hand, high integration of renewable energy into the distribution system has caused challenges such as over-voltage, reverse power flow, protection coordination, short-circuit level, power quality, and risk of islanding. This project aims to utilize synchrophasor data to assist with these challenges and to ensure stability and reliability of the electricity grid.
The technical objective of this project is to design, develop, and test a range of economical intelligent switchgear products combined with unique electronic controllers specifically targeting the requirements of Distribution Network Service Providers (DNSP) to facilitate the connection of renewable energy resources to the electricity grid. The key objectives are to reduce barriers and cost of connecting renewables to the grid and increase the hosting capacity and long-term uptake of renewable energy sources by distribution networks. The developed products can address the protection challenges associated with renewable resources integration, thus increasing the hosting capacity of the electricity network by using dynamic protection configuration, precise wide-area measurements, and real-time monitoring capabilities.
The project has developed a breakthrough technology to implement the first large-scale synchrophasor measurement in distribution MV grid in the world. The main driver of the project is NOJA Power, an Australian company specialized in manufacturing intelligent Medium Voltage switchgear. The project received grant support from Australian Renewable Energy Agency (ARENA) and had Australian Energy Market Operator (AEMO), utility companies AusNet Services and Energy Queensland, and research institutions Deakin University, and the University of Queensland (UQ) as partners.
In this project, time-synchronized measurement of voltage and current phasors, and frequency across the power system by high-speed monitors called Phasor Measurement Units (PMUs) is performed. The time-synchronisation between measurements from all the units is enabled using GPS units integrated with the recloser control units. In the next stage, a secure transmission of the PMU data with 4G connection is performed to store the data on a cloud storage. The state-of-the-art recloser controller, RC20, were designed, industrialized, and manufactured by NOJA Power during this project. This product has the capability of measuring and transmitting PMU data with a high-resolution of every 20 msec to a cloud storage with the integrated 4G modem and Sim card. The large-scale installation of RC20 units includes 50 units installed in Energy Queensland network and another 50 units installed in AusNet Services network.
The PMU data provides high-resolution data that tools such as SCADA are unable to provide. This data, when visualized on Grafana platform, provides an overview of the trend of phasor measurements over extended periods of time. It can also capture the slightest of fluctuations over short periods of just few milli-seconds at the same time. Moreover, in-house integrated analytics solutions were developed at NOJA Power to further increase the efficiency. Overall, PMU data has the following advantages over traditional SCADA network data:

iii
• Higher sampling rate (25~50 per seconds): better understanding, modelling, visibility • GPS Time-stamped measurements: network-wide view, event monitoring, prediction • Phasor Angle: advanced protection & control
A comprehensive Data Analytics software and dashboard have been developed in this project to access, present, and analyse the generated PMU data from all the installed devices. The PMU data has been implemented for post event analysis, real-time power quality, data monitoring, and alert system, stability analysis, load and network characterization, and impact of renewables on system stability and voltage profile. With a daily data analysis, reverse current flow associated with each PMU device across the network identifies the devices with the highest reverse current ratio. In this way, their active power distributions are studied, which could help with evaluating the impact of renewable sources across the network. A real-time data alert system for frequency, voltage, GPS, and sequence components performs live data monitoring and triggers an email alert if the defined thresholds are exceeded.
Having high-resolution PMU data makes it possible to investigate and analyse different aspects of instability or power quality events in detail. For any network event, sequence components, Voltage Stability Index (VSI), active, reactive, and apparent powers are analysed to have a deeper understanding of the event dynamics. The impact of the event on devices linked with and without renewable generation is also evaluated. Further development is under way to implement PMU data in islanding detection and control of DER, accurate state estimation, protection coordination, and fault identification and location detection.

iv
Table of Contents
Executive Summary…………………………………………………………………………………… ii
1. Project overview……………………………………………………………………………............ 1
1.1 Project outcomes………………………………………………………………………………….. 1
1.2 Project outputs…………………………………………………………………………………….. 3
2. Synchrophasors in power system………………………………………………………............... 5
2.1 Situational awareness……………………………………………………………………... 5
2.2 Asset condition monitoring………………………………………………………………... 7
2.3 Voltage stability analysis………………………………………………………………….. 8
2.4 System voltage profile……………………………………………………………………... 9
3. Development of the Intelligent Switchgear……………………………………………………….. 11
3.1 Development of RC20…………………………………………………………………… 11
3.2 Deployment of RC20 in Energy Queensland and AusNet networks…………………. 13
4. NOJA analytics ……………………………………………………………………………………... 16
4.1 Configuring RC20 and data transfer to NOJA Analytics………………………………. 16
4.2 Data analysis with the developed software……………………………………………… 17
5. Informed system planning and real-time operation for distribution networks…………………. 23
5.1 Improving situational awareness in distribution networks with PMU data…………….. 23
5.2 Condition monitoring for power system assets………………………………………….. 29
6. Increase in the grid hosting capacity of renewable energy generation………………………… 41
6.1 Application of PMU data in voltage stability analysis…………………………………… 41
6.2 Evaluate the Impact of DER on Distribution System Voltage.…………………………. 47
7. Event analysis with PMU data……………………………………………………………………. 56
7.1 Frequency response analysis for a major network event……………………………... 56
7.2 Sequence component analysis.………………………………………………………….. 62
7.3 Impact of a network event on a device linked with invertors………………………….. 67
7.4 Identifying feeders capable of incorporating more renewables………………………. 68
8. Future work………………………………………………………………………………………….. 70
References……………………………………………………………………………………………… 73

1
1. Project Overview
The aim of this project was to develop and deploy next generation switchgear technology, which integrates a newly developed Phasor Measurement Unit (PMU) (Intelligent Switchgear) into its existing OSM Automatic Circuit Recloser (ACR) by NOJA Power. The Intelligent Switchgear was deployed on the Energy Queensland and AusNet networks as the utility partners at the Medium Voltage (MV) side of the distribution network in locations with high penetration of renewable resources.
The Intelligent Switchgear generates significantly more granular power system data than is currently available, which can help improve the visibility and modelling of the power system. Data collection, analysis, and interpretation of synchrophasor data generated in the deployments can facilitate better-informed system planning and real-time operations for both the Australian Energy Market Operator (AEMO) and distribution network service providers, which can assist with increasing the grid’s hosting capacity of renewable energy generation. The Intelligent Switchgear developed in this project also consolidates various hardware and software components into a lower-cost integrated solution that can be used for network connection requests and reduce cost of connecting medium-scale generators (30 kW - 5 MW) to the distribution network. Furthermore, in collaboration with several utilities and renewable energy developers, an Australian Standard for connection of mid-scale generation to the network has been proposed with the aim of streamlining the connection process and reducing the associated transaction costs for future renewable energy generators connecting to the MV network. 1.1 Project Outcomes
The expected outcomes of this project are as follows:
Lower Connection Costs for Distributed Energy Resource Connections into the Medium Voltage Distribution Network
The achieved components of the developed Intelligent Switchgear allow reduction in renewable energy connection costs for utilities and provide protection for both the utility and DGs integrated in a single device. The OSM recloser and its integrated controller, RC20, can replace discrete protection devices, which reduces the time to install and coordinate those devices. Additionally, the built-in automatic synchronizer function eliminates the need for expensive external synchronizing equipment. The integrated protection functionalities to RC20 for utilities allow renewables to operate autonomously during transient conditions. The synchrophasor capability of RC20 provides real-time monitoring and control, adaptive protection, smart islanding, and anti-islanding functionalities, which allow the utilities to captivate more electricity from renewables.
Better-informed System Planning and Real-time Operations for both AEMO and Distribution Network Service Providers

2
As a part of this project, situational awareness and asset condition monitoring using PMU data have been investigated. Activities performed to detect anomalies in voltage, current, frequency, and real- and reactive-power using synchrophasor data. At the first step, the distribution system model was learnt using deep-learning and model-based technologies and available synchrophasor data. Next, the learnt representation of the system was used to analyse new data. The final objective is to analyse large amounts of synchrophasor data in real-time from live stream. In the other part of the project related to better-informed system planning, the feasibility of the synchrophasor data application for quick arcing event detection and insulator aging condition assessment was studied. The preliminary results indicate that PMU data can be used to detect the arcing fault of insulator. The observed phenomenon during an arcing event is increased current and dropped voltage. After performing statistical analysis of arcing spikes based on PMU data, feature extraction of arcing spikes based on duration, magnitude, slope, changing trend with aging of the insulator is implemented. That will eventually lead to the development of a PMU-based arcing spikes detection approach.
Increase in the Grid’s Hosting Capacity of Renewable Energy Generation
Applications of PMU data to increase grid hosting capacity for renewable energy integration were evaluated in this project. For that purpose, PMU data was used to evaluate the impacts of renewable energy integration on voltage stability and voltage profile, as these parameters are directly related to the renewable energy hosting capacity of a network. As with the voltage stability analysis, a simulation study was first performed to determine different voltage stability indices on an hourly basis. These indices included critical eigenvalue, transmission loss, reactive power, and maximum loading margins. As the system load demand can vary with respect to customer behaviour, and solar PV generation is weather dependent, these uncertainties needed to be considered when analysing voltage stability of a power grid. At the work to evaluate the impact of renewable energy integration on the system voltage profile, a real-life case study considering 18 Medium Voltage distribution feeders including residential, industrial, hospital, and laboratory feeders with three-phase voltage data from field PMUs and postcode level solar generation data were analysed. The work intends to identify how much renewable penetration can be allowed in a certain feeder without violation of the voltage standards limits. A correlation model is being developed between the real-time solar generation data at the postcode levels and the voltage indices to help utilities to predict the maximum solar generation in a certain feeder. The model can help more accurate prediction of the network performance when fed with the renewable generation. Thus, the costs associated with the DER integration can be reduced through more realistic estimation of the components to maintain voltage regulations.
Standardised Connection Process for New Renewable Energy Generation on the Medium Voltage Network
NOJA Power has collaborated with utilities and key stakeholders to produce an Australian Standard for mid-scale DG connection to the distribution grid. It will be based on international standard adoption and experiences learned and feedback received from local installations. As part of the collaboration by NOJA Power, a report was prepared, which presented findings from reviewing Australian connection guidelines and main international standards namely: IEEE 1547, IEC 62786, EREC G59/3-2 and TS 50549-2. The document discussed the existing connection rules in Australia, Australian Guidelines, and Standards. The report also discussed the issues with current DNSP guidelines and reviewed International Standards and Guidelines. It covers most of the requirements of DNSPs like voltage, frequency, power quality, protection techniques, synchronization, reclosing co-ordination, communication, and maintenance. Further discussions were provided about common

3
areas and differences between the standards and connection guidelines. The document concludes by explaining the significance of using a unified standard and provides some recommendations that can be considered when modifying the existing IEC standard or developing a new standard that satisfies DNSP connection requirements. This unified standard reduces the proponents’ costs to familiarize with the requirements and ameliorates the connection timeframes. One recommendation is to add anti-islanding (ROCOF, voltage vector shift), negative sequence voltage and current backup protections. Another recommendation is to include a project plan and wiring diagram of generating units. In addition, directional earth fault, definite time sensitive earth fault, and Inverse-time Phase overcurrent protection should be incorporated in the standard. Furthermore, Live Line blocking along with stability and protection analysis report are recommended to be included in the standard.
At the time or preparing this report, the standard Committee EL-064 was progressing the development of a standard for “Decentralised electrical energy and grid integration of renewable energy systems” as planned. These outcomes will be elaborated in detail in chapters 4-7.
1.2 Project Outputs
1. Design and development of the Intelligent Switchgear to enable more economic integration of renewable energy into the electric distribution grid. The controller component of the Intelligent Switchgear is referred to as the RC20-S. This controller will comply with the Australian Standard and provide renewable energy grid interface capacity across 15kV, 27kV, and 38kV rated products. The controller incorporates a PMU to log data and new protection capabilities.
2. A demonstration trial with Energy Queensland and AusNet whereby a total of 50 Intelligent Switchgear units were provided to each utility and were installed to capture synchrophasor measurements across their distribution grids. Sites chosen were determined by the networks in consultation with AEMO across the following: a. 20 at the point of connection of a renewable energy generator with the distribution network.
Results and data gathered from these demonstrations were analysed to evaluate and quantify the effectiveness of the product in reducing renewable integration complexity and reducing network connection costs.
b. 80 at the MV side of distribution networks primarily on feeders with existing high penetration of variable renewable resources. The aim of this was to study the impact of the technology on the grid hosting capacity of renewable energy. The Synchrophasor data can identify vulnerable areas in AusNet and Energy Queensland networks, improve visibility and transparency of their distribution network, and provide better knowledge of their system state in real-time.
3. The installed Intelligent Switchgear captures significantly more granular medium voltage power system data than is currently available.
4. Synchrophasor data, as well as data and knowledge related to network events, generated during the trial deployment were provided to AEMO, AusNet Services, Energy Queensland, and Knowledge Sharing Partners to be used to develop advanced power system algorithms and methods to monitor, plan, and operate the power system. Performed activities by NOJA Power and Knowledge Sharing partners for this stage include: • Data collection: Utilities and NOJA Power worked with Telstra as a 4G network supplier to
collect the data from each Intelligent Switchgear unit. A private 4G Network was used by Energy Queensland and AusNet to communicate with the Intelligent Switchgear for data collection.

4
• Database creation: A database was created by NOJA Power to store the Synchrophasor data, as well as data and knowledge related to network events provided by AusNet and Energy Queensland. Utilities were required to provide their collected data to NOJA Power. NOJA Power stored this data and made it available to the Knowledge Sharing partners.
• Analysis: The contents of the Synchrophasor data, as well as data and knowledge related to network events lead the analysis process. As part of the process, NOJA Power investigated new challenges imposed by renewables to the distribution grid and modified the algorithms in relation to the identified shortcomings and update the demonstration software.
• Development of distributed renewable energy generators and power system models: Universities studied the impact of renewables on the distribution grid, investigated the benefits of PMU data for renewable integration, and developed load and Distributed Energy Resource (DER) models.
• Implementation of data: By using autoreclosers equipped with PMU, utilities can reduce the number of outages and disconnections of DER due to transient faults. The Synchrophasor data can help the autorecloser to detect and clear faults more effectively, which can also improve network’s reliability. Moreover, the Intelligent Switchgear provides alternative paths to loads and DERs during distribution line outages using data collected from other units. More accurate determination of MV Feeder limits can help utilities to reduce some of their limits on absorbing renewable energy. Also, by monitoring the power production of several DERs on a feeder at the same time, utilities can have a better understanding of the total power generation on the feeder and can relax their limits on the installation capacity.
5. Establishment of an Experiment Reference Group (ERG), which guided the data collection, analysis, and implementation activities.
6. Collaboration with distribution networks renewable energy developers, and industry associations to develop a new Australian Standard for mid-scale renewable generation (30kW-5MW) interconnection.
As with the contributions from Knowledge sharing partners, a research fellow, and a PhD
candidate from UQ, and two PhD candidates from Deakin university worked on the research part of this project. The research fellow from UQ focused on insulator aging experiment and arcing detection with synchrophasor data. The PhD candidate at UQ worked on improving situational awareness in large PMU power distribution networks. The primary objective of the first PhD candidate from Deakin university was voltage stability analysis of power grid with renewable integration. The other PhD candidate from Deakin studied the impact of solar generation on the distribution network voltage and characterised the impact using several voltage indices. These voltage indices considered any deviation or rise from the nominal voltage, voltage ramps, and voltage variances as well as the impact of active and reactive power changes on voltage fluctuations.

5
2. Synchrophasors in Power System
In this chapter, current applications of synchrophasors in situational awareness, asset condition monitoring, and voltage stability and profile of the distribution system with renewable energy integration are reviewed.
2.1 Situational Awareness
PMU data can offer a range of applications to improve operation, security, and reliability of distribution networks. Based on the type of analytics, these applications are primarily grouped into two categories: diagnostics/monitoring and control-based applications. These applications can help operators understand past or present conditions of the grid, thereby aiding in making optimised decisions in future [1].
Event Detection
Detecting events using PMU data can provide an opportunity to gain insights to improve power system operation, planning, and protection to ensure large-scale integration of intermittent renewable energy sources such as solar and wind at distribution level [2-4]. However, transforming huge datasets generated by PMUs and analysing them in real-time to extract events or patterns could be challenging. Thus, there has been increasing interest in developing models capable of performing diagnostic applications that could help operators understand the past or present conditions of the distribution grid. Use cases for event detection include:
• Detection of voltage dips and swells, sudden changes in current and frequency, which may be caused by low- and high-impedance faults, load switching such as motor and HVAC loads, and intermittency of renewable energy sources. This can be further extended to determine locally caused disturbances on the distribution network from those originating from the transmission grid by comparing the voltage and current measurements at locations with PMUs [5,6].
• Early indication of frequency or voltage instability, that may indicate islanding of a micro-grid for reliability reasons.
• Monitoring distribution grid assets such as tap changing transformers and capacitor banks. Intermittency of renewable energy sources such as PVs affect voltage profile of the grid leading to more operations of assets such as tap changers and capacitor banks to regulate the voltage profile. PMUs can detect capacitor bank switching and tap changer events, thus eliminating the need to install additional sensors for such assets. Detection of these switching events can also offer insights into the state and health of this equipment by detailed analysis those switching events on the dynamic response of the voltage and current data recorded by the PMU [7].
Event detection techniques can be supervised or unsupervised.
Supervised Event Detection

6
Supervised event detection algorithms have prior knowledge about the type of event to be detected and thus make use of examples of such events. They are usually framed as classification problems, thus, machine learning have proven useful in such situations using popular algorithms such as support vector machines and neural networks [8-10]. In [11], deep learning methods of convolutional neural networks and recurrent neural networks are used to classify different types of power system disturbances. The disturbances include generation trip, load shedding, system oscillation, line trip, and islanding using PMU data. A PMU-based event classifier can aid in accurate preventive maintenance scheduling of grid equipment, which may help extend the lifespan of assets. In [12], event classifiers to distinguish two disruptive events of malfunctioned capacitor bank switching and malfunctioned regulator on-load tap changer from normal abrupt load change are proposed. Although these events may not cause immediate failure, they can cause permanent equipment failure over time.
There are some limitations related to supervised event detection algorithms. When applied to real-world data, they may suffer from class imbalance, as it may not be possible to have equal number of examples for all events that needed to be detected. Also, these methods are specifically designed to recognise certain types of anomalies and events such as faults, tap changes, or sudden load changes. However, in an active distribution grid, one cannot realistically pre-determine the number of events that may occur, making these methods and frameworks deterministic. Event detection frameworks should therefore be able to identify new classes of events that may not exist in the training data.
Unsupervised Event Detection In contrast to supervised schemes, unsupervised event detectors have no prior information about
events. They are based on a common theory or premise: an event detector is fed with some samples of PMU data. Based on the samples presented, it uses a statistical technique to identify points that are significantly different from others and labels them as outliers [13-19]. One such framework is the integrated data storage and processing infrastructure proposed in [20], which is capable of detecting and analysing event patterns in voltage magnitude of a one-week time series data from two micro-PMUs joined by the same sub-transmission network. To discover patterns hidden in massive PMU data, the proposed data abstraction framework relies on a tree-like series data store, which offers statistical summaries of data, such as the mean, maximum, and minimum values across a wide range of temporal resolutions. Using this search algorithm, critical distribution events such as spike and step changes in voltage measurements are detected by comparing the statistical summaries of a particular segment of time series data at a desired temporal resolution with a predefined threshold. A rule-based data driven, which does not require knowledge of system topology technique, is also proposed in [21]. The proposed method relies on rules created by using PMU data to identify several types of faults in the network. The authors validate their method by comparing with recorded field data for fault events. In [22], an event detection scheme, which utilises spectral kurtosis to flag anomalies in data segments, is presented. The proposed algorithm can detect events by comparing the energy content of the current PMU window segment to the previous segment. The importance of detecting events and classifying them in real-time was highlighted in [23], where the authors proposed a method for detection, location, and accurate classification of PMU events in an IEEE 118 bus system using signal energy transformations.
Although these methods are effective at detecting some events to some extent, there are ongoing challenges that need to be addressed. First, they are heavily dependent on the length of the window and the sample size. Choosing a window size, however, is a daunting task as it may not be possible to detect all the event points using one window size. One solution is to use different threshold values coupled with moving and dynamic window sizes to detect overshoot and undershoot in the data sequence [24, 25]. This technique, however, increases the computation time, which makes it unsuitable

7
for real-time applications. Also, these methods do not consider the effect of data quality issues such as data loss or corrupt/bad data, which may occur due to problems in communication within the PMU, on the performance of their frameworks. Such data quality issues may be recognised as events; hence, a data pre-processing step needs to be included in the event detection schemes. To address these issues in the application of PMU data for event detection and classification, this part of project intended to perform the following tasks:
1. Develop a framework, which is independent of window size or the number of samples contained in a window and can detect events such voltage dips, voltage swells, sudden changes in current and frequency which may be caused by low and high impedance faults, load switching such as motor and HVAC loads and intermittency of renewable energy sources, in massive amounts of historical data or in online streams of PMU data.
2. Implement this framework using PMU data for utilities’ networks and extend the functionality of this framework to automatically classify events.
3. Use data analytics to provide summary statistics about the most occurring events in a locality.
4. Investigate other possible synchrophasor event specific applications such as topology detection and propose novel algorithms and schemes for such applications.
2.2 Asset Condition Monitoring
The rapid deployment of solar photovoltaic (PV) in Queensland distribution networks has created new challenges to power networks due to bi-directional power flow and PV power fluctuations. These new issues could accelerate the aging and deterioration of electrical assets, which were originally designed to be operated under a uni-directional and slow-changing power flow [26]. The accelerated deterioration will put stress on the aged distribution networks of Queensland. A large amount of equipment in Queensland distribution systems has been aged more than their designed lifetime, which poses a substantial risk to a reliable supply of electricity.
Traditionally, one way of monitoring assets such as transformers that use insulation paper and oil samples is to test dissolved gases in the oil, which are indicative of the level of degradation of the insulation materials and the integrity of the transformer. This method is known as dissolved gas analysis (DGA) [27], where the rate of change in gas concentrations between measurements can be an early indicator of developing faults and the absolute gas concentrations can be correlated to the overall aging of the transformer insulation paper. The Duval triangle analysis approach is usually used to process the dissolved gases and identify different fault types (e.g., thermal faults and discharge faults) from DGA [28]. However, the DGA-based approach has disadvantages such as the requirement of specialised skills to collect oil samples and the impracticality of taking oil samples frequently from the tank, which makes monitoring the development of dissolved gas concentrations less time-effective. An alternative approach is to install online DGA monitoring instrumentation into the transformer tank; however, it is comparatively expensive. It should be mentioned that there are a vast number of assets in distribution networks, and it is not practical and economical to continuously monitor these assets. Therefore, current asset management for distribution networks has adopted a passive strategy - either run-to-failure or performing field inspection of limited assets with a fixed period [29]. As a result of such a passive strategy, totally unprepared outages or unexpected failures between inspections could occur.
Considering the above issues, Phasor Measurement Units (PMUs) with synchronized measurements using Global Positioning System (GPS) could provide an opportunity to monitor the

8
equipment conditions in a proactive way. This could be achieved by investigating the characteristics of the PMU data over a period and determining possible relationships between asset conditions and PMU data variation features. Therefore, the development of the PMU-based condition monitoring approach is important to provide an economical and reliable alternative to traditional techniques.
An attempt has been made in [30] to identify the incipient failure of a past catastrophic transformer explosion with the variation band of the signal to noise ratio (SNR) of voltage and current signals. There are two observations for the SNR band study in [31]: (1) a steady growth in the width of the SNR variation bands is identified over a period until the failure of the transformer; (2) the width of the SNR variation band for a specific PMU increases with the time approaching the transformer failure. These preliminary results confirm a promising potential usage of PMU data for transformer incipient failure prediction. However, there is no solid demonstration and theoretical explanation on why the faulty transformer can cause the SNR variation band increasing. Therefore, this research will investigate the possibility of using SNRs of PMU data for transformer health condition evaluation through experimental demonstration.
Insulators are one of the essential assets and play a vital role in ensuring the reliable and secure operation of power networks. The arcing faults are prone to occur on the insulator due to the deterioration of their surface condition. The surface deterioration is usually caused by the combined effect of the atmospheric moisture and accumulated environmental contaminants. The arcing fault can lead to a severe damage of the insulator and it also can lead to the unplanned power outage.
In this part of project, the insulator aging experiment were developed by spraying the salt on its surface in the salt fog chamber at NOJA Power testing laboratory. The traditional arcing evaluation approach is mainly based on high-resolution waveform data [32,33]. The work investigated the feasibility of insulator arcing fault detection through PMU data.
2.3 Voltage Stability Analysis
Many national power system outages have been attributed to a range of different stability issues, where voltage instability is one of the major contributing factors to these failures [34]. With growing complexities of the power systems and increasing grid integration of Renewable Energy (RE) resources, voltage stability assessment has become more important in planning and safe operation of power systems. The intermittency of power generation by these RE sources due to weather conditions can negatively impact the voltage stability limits of the system. Several methods have been proposed to assess voltage stability such as minimum eigenvalue analysis, QV curve method, and continuation power flow [35-38]. These methods rely on the state estimation that uses network model to compute steady-state operating points of the grid. These operating points are generally updated every several minutes. The infrequent update rate and dependence on the accurate knowledge of the system parameters and topology are the main shortcomings of these traditional methods. For example, continuation power flow (CPF) involves large computations to iteratively solve nonlinear equations. Since conventional methods are highly time consuming, they are not feasible for online applications [39]. With improved communication infrastructure and GPS, PMU deployment can provide opportunities to supplement existing stability monitoring tools based on state estimation (SE) as discussed in [40]. It emphasizes the significance of PMU data-based methods to identify grid vulnerability to voltage collapse in real time.
Calculation of Voltage Stability Load Index (VLSI) in real-time using recurrent neural network Echo State Network (ESN) has been proposed in [41]. IEEE 14 bus has been split into small islands to prevent widespread system failure following any load shedding. PMU has been optimally placed so that even during disturbances or islanding, the system remains fully observable. The performance

9
of the ESN to estimate VLSI proves its high accuracy level under both normal and disturbance conditions. The study in [39] implements Genetic Algorithm (GA) based Support Vector Machine (SVM) for online voltage stability monitoring. Voltage magnitude and phase-angle from PMU are used as inputs to GA-based SVM model. Although this method reduces computational complexity, issues such as premature convergence and poor aptitude of local search have been reported in [42]. Moreover, it is difficult to choose population size, selection method, crossover rate, and mutation rate. In [42], a hybrid approach combining Dragonfly Optimization (DFO) algorithm with Support Vector Regression (SVR) is proposed to determine Voltage Stability Index (VSI) in real-time. DFO is used to obtain optimal parameters of SVR and enhance the accuracy level of SVM prediction. Voltage magnitudes for different operating points are obtained from PMU buses and used to train the model as input vectors and it provides VSI as output vectors. IEEE 30 bus system and Algerian 59 bus system were used to investigate the predictive ability of the hybrid model and its efficacy has been proven through the simulation results.
To determine weak lines of a transmission system, VSI and voltage collapse proximity indicator (VCPI) have been determined in [43] using streamed PMU data through Real-Time Digital Simulator (RTDS). VCPI was formulated based on the concept of maximum transferrable power through a line. The outputs of both VSI and VCPI are consistent for the top two vulnerable lines before voltage collapse occurs, however, they reflect differently on the levels of strength for other lines. Another method called Thevenin impedance matching has been proposed in [44-47]. The basic concept of this method is that the whole or part of the system seen from one bus can be replaced by a Thevenin equivalent. A PMU is placed on the same bus so that the load impedance can be calculated with voltage and current phasors from PMU data. Based on the impedance matching theory, the system is unstable when the Thevenin impedance equals to load impedance. Recursive Least Squares (RLS) are used in [44] to estimate the Thevenin voltage and Thevenin impedance of the equivalent circuit. The results in [44] verified that a voltage stability index using the relation of apparent Thevenin impedance and the load impedance at a load bus can be used to identify local voltage instability. The challenges of this method are to keep track of fast changes in Thevenin parameters and the sensitivity of Classical Least Square (CLS) to the measurement errors in PMU data. For an integrated power system, a transmission distribution index is proposed in [47] using phasor measurements at two time instants to determine whether transmission system or distribution system is contributing to the overall system voltage instability. One of the major setbacks of Thevenin impedance matching method is that it requires prior knowledge of system topology. For a system embedded with intermittent renewable sources, the systems operating condition become highly variable. Under such fast changing conditions, real-time calculation of power flow Jacobian calculation needs huge computational efforts.
To rectify the abovementioned problems, a novel methodology based on least square method, which rules out the need for knowledge on system parameters to build a system model is proposed in this project. The method relies on direct measurements from PMU data to estimate the system behaviour. The proposed framework mainly uses voltage and current magnitudes and phase-angles from PMU data installed at the node of a distribution network that is being monitored.
2.4 System Voltage Profile
Despite the several benefits of PV power, integration of PV into the grid is associated with some power quality problems due to the unpredictable nature of its power generation [48]. The most common issues of distributed PV are voltage fluctuation, voltage flicker, oscillatory instability, and overvoltage, which could disturb the safe and steady operation of the power grid [49-51]. Therefore, the distribution network equipment such as voltage regulator, capacitors, and load tap changers are required to operate frequently to control the feeder voltage, which shortens their life span and

10
increases the overall maintenance cost of the distribution system [52]. The negative impacts of PV integration on electricity distribution networks can be summarised as follows.
Voltage Rise
Voltage rise in the distribution network is one of the major concerns, which arises due to the high PV penetration. During the time of injecting active power into the grid, power flow of reactive power needs to adapt accordingly, which could disrupt the distribution network standards. Therefore, due to the variation in reactive power supply, the voltages of nearby buses increase [53]. To avoid this problematic situation, PV systems are designed to operate close to unity power factor.
Reverse Power Flow
The reverse power flow occurs in distribution networks during the times of low load demand by the utilities compared to the PV power generation. During the high PV penetration, the reverse power flow causes the voltage rise in the distribution line, which is associated with the frequent shutdown of PV generator and limits the PV power generation [54]. Reverse flow can cause several problems for the network protection and operation components such as transformers, particularly when the network protection systems and the voltage regulators operate in unidirectional mode and not designed to adapt with the reverse flow. However, in the case of bidirectional voltage regulators, a significant adjustment is still required in the regulator control to adjust with the reverse flow [55].
Feeder Power Loss
The feeder power losses decrease when the power generated from the PV system is consumed locally. On the contrary, the feeder power losses increase at the time when the active power from the PV system exceeds the local load demand by the consumers. In this situation, not all the energy produced from the RES is consumed locally and the excess energy is fed to the grid [56].
Voltage Fluctuation
Voltage fluctuation refers to the changes in the magnitude of the feeder voltage due to the short-term variations in the solar irradiance and PV power generation. Voltage fluctuations usually occur in scenarios with high PV output with low load demand and low PV output with high load demand. Voltage fluctuation increases the annual maintenance costs of power distribution systems because of the activation of additional automated tap changing in distribution transformers. Therefore, it is considered an issue for distribution system, when PV power generation systems are integrated with the grid [57,58]. During the cloud cover, the power output from the PV systems could significantly drop, which causes an under-voltage situation in the distribution network for an extended period. On the contrary, the over-voltages in the network could decrease the life span of network components. The over- and under-voltage situations can also cause PV inverter trip off, which makes the situation even worse [59]. In Australia, voltage fluctuation has also been identified as one of the major issues in the remote power networks [57,60].
Voltage Unbalance
Voltage unbalance refers to the difference in the voltage magnitudes of the three phases, where the sources of that are typically structural and operational [59,61]. The voltage unbalance could create some problems such as adverse effects on the active rectifier performance, thermal aging, and overheating of transformer and other devices, and disturbance in the operation of induction motors [62,63]. The severe voltage unbalance situation even forces the line-commutated rectifiers to move from three-phase mode to single-phase operation mode [64].

11
3. Development of the Intelligent Switchgear The achieved components of the developed Intelligent Switchgear allow reduction in renewable energy connection costs for utilities and provide protection for both the utility and DGs in a single device. The OSM recloser and its integrated controller, RC20 shown in Fig 3.1, can replace discrete protection devices, which reduces the time to install and coordinate those devices. Additionally, the built-in automatic synchronizer function eliminates the need for expensive external synchronizing equipment. The integrated protection functionalities to RC20 for utilities allow renewables to operate autonomously during transient conditions. The synchrophasor capability of RC20 provides real-time monitoring and control, adaptive protection, smart islanding, and anti-islanding functionalities, which allow the utilities to captivate more electricity from renewables.
(a) (b)
Figure 3.1. (a) NOJA Power OSM recloser, (b) developed intelligent OSM recloser controller RC20 In this chapter, a summary of development and features of the innovative RC20 and the
installation process of the units at utility networks are presented. 3.1 Development of RC20
This part of project undertook the development of the following products by NOJA Power:
• RC20 - an integrated controller to support renewables integration • Suite of distributed generation protection firmware • PMU data visualization and analysis software, NOJA Analytics • Interface software for computers and mobile applications

12
Prior to undertaking this project, NOJA Power compared competing technologies around the world. All major switchgear manufacturers are international companies including ABB (Switzerland), Alstom (France), Siemens (Germany), Schneider Electric (France), SEL (USA), and GE (USA). Although some of these devices can be used for distributed generation protection, no manufacturer offers an integrated solution. These products need to be installed separately and coordinated with other devices such as reclosers, circuit breakers, and communication devices, which may or may not be available from the same supplier. Therefore, the complexity of the protection scheme and, consequently, the installation time and cost of distributed renewable generators connection can significantly increase. In other words, the alternative to NOJA Power’s solution is to use a range of discrete protection and control devices as the secondary protection scheme. Equipment / Personnel Protection, Passive Anti-Islanding, Loss of Mains, Reverse Power, and Neutral Voltage Displacement (NVD) are some of the typical secondary protection systems required for DG connection. However, these protection systems could significantly increase the integration complexity and cost of the distributed renewable generators. Since no product or solution was identified in their search worldwide, NOJA Power commenced a project of design, development, and experimentation.
The Intelligent Switchgear developed in this project consolidates various hardware and software components into a lower-cost integrated solution that can be used for network connection requests and reduce cost of connecting medium-scale generators (30 kW - 5 MW) to the distribution network. The following features of the developed RC20 are improvements or unique features that cannot be found in the competitors:
• Processor: (12x Faster), Hardware Cryptographic Accelerators (Encryption/Authentication Security), and MMU
• DSP System: 24-bit, Simultaneous Sampling, 256 samples per cycle • Wi-Fi: 802.11n, Single Spatial Stream, Wi-Fi Access Point, (Future upgrade to 802.11ac) • Ethernet: 1000BASE-T Gigabit Ethernet over copper wiring (Cat 6, Cat 5e) • microSD: SD, SDHC and SDXC up to UHS-I Speeds (104MB/s) • RAM: SDRAM 1GB, 800MHz Bus Clock • Storage Flash: 1GB, 8-bit SLC NAND Flash • USB Host Ports: USB 3.0 – 400x faster data transfer
Additional communications options:
• GPS: RS232 + 1PPS + DC PWR Interface to GPS Receiver • 4G Modem: LTE Card Module, fall-back to HSPA+ or GSM/GPRS/EDGE • Ethernet: 2nd 1000BASE-T Gigabit Ethernet over copper wiring (Cat 6, Cat 5e) HMI • Intruder Detection: Temperature + RH Sensor, Accelerometer • Enhanced operator control and monitor: Increase number of User-configurable buttons and
LEDS
Capabilities and features:
• High speed encrypted communications and protection • Synchrophasors • Measurement up to 128th Harmonic • 256 sample per cycle oscillography • Sampled analogues according to IEC 61850-5

13
• GPS synchronised data and logs • Network capable secure high speed Smart Grid Automation • Integrated 4G and WiFi
3.2 Deployment of RC20 in Energy Queensland and AusNet networks
In this project, synchrophasor data was collected from RC20 units installed at distribution networks located at Queensland and Victoria managed by Energy Queensland (EQ) and AusNet Services. To collect the data from these utilities’ networks, two different methods were developed. A private 4G network was established at EQ for data collection. The Real-time synchrophasor data was collected form installed RC20s via a private 4G network into their operational technology network. Then, the data is passed through firewalls into a Virtual Machine (VM) in their demilitarized zone (DMZ). From their DMZ, the data goes to NOJA Power’s data concentrator on a VM in Azure cloud via internet and through a Virtual Private Network (VPN) between these two VMs. For AusNet, the data collection architecture is different. The synchrophasor data went directly from their installed units into the VM on the Azure cloud through a VPN tunnel.
Installation locations in EQL Network
NOJA Power delivered 50 RC20 units to Energy Queensland in December 2019. As Queensland was faced with extreme bushfire conditions in December 2019 and January 2020, and Coronavirus since February 2020, Energy Queensland had to reprioritise field resources available during this period. As the utility’s decision was made to only carry out essential operational work, there was some impact on RC20 installation schedules.
The identification of sites for trailing of the NOJA Power RC20 Synchrophasor recloser targeted
a split of 10 units to be installed near large-scale renewables, and 40 units to be installed on general network. Given the importance of identifying sites that were located at the point of connection (PoC) with large-scale renewables, both new and existing customer connections were reviewed. In the case of new connections, the sensitivity and tight delivery timeframes of those projects meant that they were generally not been well suited to RC20 installation. Thus, most large-scale renewable installations were targeted at existing customer connections. Of the 10 renewable sites, two synchronous generation sites were identified as potential candidates. Although these sites did not fall in the inverter-connected-PV format of renewable generation, they provided an opportunity to observe differing technical topologies of generation and their impact on the broader distribution network. The remaining 40 units were installed on the general network, where the locations were selected from recloser installations or replacements that were already part of Energy Queensland’s planned program of works. As a result, most of these installations related to ‘worst performing feeders’ and Energy Queensland’s replacement program. Fig. 3.2 illustrates some RC20 installations performed in Energy Queensland network.

14
Figure 3.2. Installation of RC20 and OSM recloser in Energy Queensland network The initial testing of the RC20’s by EQL exposed some communication limitations in the RC20,
which limited SCADA and Engineering access. This limitation forced EQL to reschedule installations as the RC20 was not fit-for-purpose to be deployed onto the network in that time. EQL and NOJA Power worked alongside each other to find a solution to the problem. The testing and approval of this solution set the project back by several months. Energy Queensland eventually completed the installation of the 50 RC20 units by November 2020.
Installation locations in AusNet Network
The installation of NOJA Power RC20 and OSM reclosers in AusNet Services network targeted a split of 10 units to be installed on large-scale renewables, and 40 units in general network. Most of the large-scale renewable installation were targeted at existing customer connections due to the timing of the new connection project, and they were mainly biogas and hydro generation. The remaining 40 units, which were installed on the general network, were selected from recloser replacements as part of REFCL (Rapid Earth Fault Current Limiters) project. As a result, these installations were within codified area of AusNet Services network. Some installations are presented in Fig. 3.3.
Due to natural disasters such as bush fire and flooding, and Coronavirus pandemic, there were some delays in installation of RC20 units and data streaming with 4G network. The data streaming from all the units were completed in Aug 2021.

15
Figure 3.3. Installation of RC20 and OSM recloser in AusNet Services network

16
4. NOJA Analytics
Synchrophasor data is collected from RC20 units installed at utilities’ distribution networks. To
collect the data from these utilities’ networks, two different methods were developed. A private 4G network was established at EQ for data collection. The Real-time synchrophasor data is collected from installed RC20’s via a private 4G network. A cloud-based data management system was developed by NOJA Power to collect the data from utilities and share it with knowledge sharing partners. Secured subscriptions were set up between NOJA Power’s platform and universities data servers. This secure subscription protocol shared real-time data with universities through Azure. Developed NOJA Analytics software provides a visualization platform capable of streaming real-time PMU data and providing cutting-edge analytics with the following features:
• Application of cloud-based solutions to host large volumes of real-time data through Analytics tool
• Archiving high-resolution real-time data of interval of 20 msec • Analysing critical events across the network and providing actionable insights • Monitoring critical parameters in real-time and developing highly responsive alert systems with
instant emails to the defined recipients • Formulating models using Machine Learning to be used as frameworks for future event
prediction • Creating dashboards with appropriate visualization widgets • Evaluation of sequence components and Voltage Stability Index • Studying Power flows across renewables • Interpreting events using state of the art analytics
The current power system industry is leveraging state of the art data visualization tools for real-time monitoring. Real-time data monitoring is integral to device health maintenance and assists in quick response in case of any critical events. The developed Data Analytics software is a necessary tool to enable capturing, transferring, storing, visualising, and analysing the PMU data. NOJA Power worked on extracting the value of PMU data and facilitating its access, visualisation, and analysis, and tried to improve the visualisation interface with feedbacks from utilities. The aim was to develop algorithms to create additional information based on the raw PMU data such as power measurements, voltage stability index, and symmetrical components. At the same time, effort was made to assure a smooth integration with utilities existing data acquisition tools.
4.1 Configuring RC20 and Data Transfer to Data Analytics
The PMU measures magnitudes and phase-angles of three-phase voltages and currents, frequency, and Rate of Change of Frequency (ROCOF) with a 20 msec time-resolution. These samples are synchronized to the high accuracy GPS time source at a frequency of either 50 Hz or 60 Hz. In this section, it is explained how PMU parameters are configured via the Control and

17
Management Software (CMS). The PMU data sets are configured in the IED Capability Description (ICD) file. Configuration of the PMU function of the RC20 is done using the RC20 IEC 61850 ICD file, which needs to be modified to match with the user’s system configuration. Once the PMU data for each device is configured, the next objective is to stream the data to the Data Analytics software. The Data Analytics are hosted on a virtual machine. The software consists of a client with a Graphical User Interface (GUI), a windows service, web services, a web front end, and a visualization application. Several PMUs will be connected to Data Analytics to provide data. This in-house Data Analytics software archives all data enabling data visualization in both real-time and historically stored data using different methods. The overall architecture of the data transfer is illustrated in the flow diagram shown in Fig. 4.1.
Figure 4.1. The architecture of the data transfer between installed RC20s in utilities’ networks, NOJA Power cloud, and users.
4.2 Data Analysis with the Developed Software
With the archived data in Data Analytics and coupled with other software tools such as Python, an Analytics Toolkit comprising of the following three components was developed:
Dashboards
The Data Analytics software has an in-built visualization application which has the capacity of visualizing both real-time and historical data. In this regard, individual dashboards for each connected PMU have been set-up for real-time monitoring of PMU data at a high resolution. Along with individual dashboards, dashboards containing an overview of all PMUs of a specific region were also developed to illustrate the range of voltage and current magnitudes in that region. The visualization tool also has a portal to download device specific data across any time range at varying resolutions.
Algorithms
To monitor the network more efficiently, state of the art algorithms were developed by integrating the data from Data Analytics software with other software tools such as Python. For that aim, three algorithms were developed:

18
Real-time E-mail Alert System
With this feature, in case of any deviation from the permissible ranges, an email is triggered to NOJA server mail account highlighting timestamp and value of the recorded deviation. If the parameters are within the desired ranges, the check keeps on iterating for every 20ms in real time. The alert system has been set up for frequency, voltage, GPS status, and sequence components so far. It is planned to extend that to other derived variables such as Voltage Stability Index (VSI) and Inertia. The flow diagram for the implemented email alert system is shown in Fig. 4.2.
Figure 4.2. Flow diagram for the implemented email alert system in NOJA Analytics.
Daily Power Flow Analysis
To track the daily performance of the devices near PV sources, the ratio of reverse power flow instances throughout the day for all devices are calculated and compared using histograms. This analysis is achieved by integrating parameters such as voltage and current magnitudes and phase-angles into an algorithm that computes the ratio and the corresponding active power for all the devices. In Fig. 4.3, the ratio of reverse current flow for all devices for a 24-hour period is shown along with the histograms for the two devices with the highest ratio in Fig. 4.4. The histograms also reflect the corresponding ratio of reverse current flow in terms of the power flow directions across the day.

19
Figure 4.3. Ratio of reverse current/power flow instances throughout the day for all the network devices.
Figure 4.4. Histograms for the two devices with the highest reverse-current ratio.

20
Daily GPS/COMMS Analysis
It is required that all the PMU devices installed in the network to be synchronized and have no COMMS issues. However, it has been noticed that some of the devices have erroneous GPS values and even data losses. Thus, an algorithm was developed to monitor the GPS and COMMS of every device over a 24-hour period and highlight the devices with issues. This algorithm can help with monitoring data quality and provide utilities with updates on the status of their devices on a weekly basis. As an example of a conducted analysis for a utility partner, the GPS/Comms analysis is split into 3 categories – Missing Comms, Invalid GPS, and Comms OK/GPS Valid and Locked. The pie-charts shown in Fig. 4.5 illustrates the percentage of each of these categories for a single device (Device X) and the overall ratio of impacted and non-impacted devices before and after the GPS synchronization of all the 50 devices in the utility network.
Figure 4.5. The percentage of missing Comms and invalid GPS before and after GPS synchronisation for all the installed units in the utility partner.
Frequency/Voltage Analysis
To track any anomalies in the network, besides power-quality analysis and data quality monitoring, any frequency and voltage fluctuations resulting from faults, network events, or device specific configurational changes are investigated. To illustrate the impact of such an analysis, the effect of Ref-Coils in the utility network and how high-resolution data coupled with instantaneous alert systems can help in detecting the phase voltage fluctuations for very short durations are considered. It can be seen from the event highlighted in Fig. 4.6 that the phase fluctuations occurred for 12 seconds before settling down with invalid frequencies being reported during the event.

21
Figure 4.6. A recorded event showing phase voltage fluctuations for 12 seconds before settling down with invalid frequencies being reported during the event.
For the power flow analysis, data quality monitoring, and frequency/voltage analysis, the analytical flow diagram is illustrated as given in Fig. 4.7.
Figure 4.7. Analytical flow diagram for the power flow analysis, data quality monitoring, and frequency/voltage analysis.

22
Network Event Analysis
To comprehend network events more holistically, an in-depth analysis of the events has been performed and various variables through the developed algorithms were examined. Some of the most widely used indicators used in event analysis are listed below:
• Sequence components: These help to characterize faults using sequence impedances. • Voltage Stability Index (VSI): This parameter highlights the overall stability of the network
during the event and the impact of renewables pre- and post-event. • Phase-angle fluctuations: Often the phase mapping of synchrophasors in a region are
inaccurate and thus detecting the fault becomes difficult. Thus, an algorithm was developed to map the phase-angles of the synchrophasors and detect the instance when the phase-angle fluctuations were the highest.
• Active/Reactive power trends: Using the voltage and current phasor data, the active/reactive powers of affected synchrophasors during an event are analysed. This helps to compare the power characteristics before and after the event and detect any power loss in the network.

23
5. Informed System Planning and Real-time Operation
for Distribution Networks
As a part of this project, researchers from UQ worked on situational awareness and asset condition monitoring using PMU data. A PhD candidate worked on detecting anomalies in voltage, current, frequency, and real and reactive power using synchrophasor data. At the first step, the distribution system model is learnt using deep-learning and model-based technologies and available synchrophasor data. Next, the learnt representation of the system is used to analyse new data. The final objective is to analyse large amounts of synchrophasor data in real-time from live stream. In the other part of project, a research fellow evaluated the feasibility of the synchrophasor data application for quick arcing event detection and insulator aging condition assessment. The preliminary results indicate that PMU data can be used to detect the arcing fault of insulator. The phenomenon observed during an arcing event is increased current and dropped voltage. Next, the researcher will work on statistical analysis of arcing spikes based on PMU data, feature extraction of arcing spikes: duration, magnitude, slope of the spikes, changing trend of the spikes with aging of the insulator, and PMU-based arcing spikes detection approach development. The performed activities of the UQ research team are presented in this chapter.
5.1 Improving Situational Awareness in Distribution Networks with PMU Data
This part of project focused on diagnostic applications mainly related to network event detection and classification. Considering the high-reporting rates of PMUs, it is imperative to develop schemes capable of analysing PMU data in near real-time, which will enable the system operators take timely actions. However, current methods used for situational awareness in active distribution grids are heavily dependent on data sample size or on detectors that require great effort in tuning. Developing better models will lead to better informed system planning and real-time operations for distribution network operators.
Three frameworks were used for event detection using PMU data. The first framework was developed to analyse events on five PMU network located on the EPFL campus in Switzerland. The second framework extends the functionality of the first framework to detect and classify events using data from the EQL network. The third application is more specific and is geared towards verifying the connectivity of switches in a distribution network using PMU data.
Event Detection - EPFL Network
The framework shown in Fig. 5.1 is a simple two-stage algorithmic framework capable of detecting anomalies in massive amounts of historical data or in online streams of PMU. The framework consists of two stages. The first stage of the proposed model acts as a data outlier filter and uses a robust function to decrease the influence of outliers, which are assumed to be event data points in the data as presented in Fig. 5.1(a). The second stage shown in Fig. 5.1(b) uses these filtered data points to train and optimise the weights of an ensemble of stacked autoencoders to learn a representation of the normal operating state of the distribution network. Using a static window size, the weights of trained autoencoder network are used to reconstruct individual points in each stream or window to detect

24
undershoot and overshoot in the data sequence. With this technique, the framework can detect events in a fraction of a second and as such could be suitable for online analysis of PMU data from multiple streams.
(a)
(b)
Figure 5.1. a) Data outlier filter, b) proposed framework for event detection.
Event Detection and Classification Framework - EQL Network
The functionality of the first framework was extended to analyse and classify events in the EQL PMU data as presented in Fig. 5.2. The new framework consists of two parts. The first part is an event detector based on recurrent autoencoders. The second part is an event classification framework based on the characteristics of the events and the learned weights of a 2D kohonen map.
Figure 5.2. Event detection and classification framework for EQL network
Topology Detection Framework
This framework analyses data from PMUs and relies on the fact that changes in network topology result in changes in the structure and admittance of the network. Using voltage and current

25
phasors recorded by PMUs, the proposed method then approximates network parameters using an ensemble-based deep-learning model. Thus, it does not require any knowledge of network parameters and load models. At the next stage, using the prediction error of the proposed model, a connectivity matrix, which shows the status of switches, is constructed. The model yields a low-error detection rate when its performance was validated using a modified version of the IEEE 33-bus network.
Outcomes In this section, results of the developed models using PMU data from EQL’s network are
presented. The main focus is on the event detection and classification framework introduced in the previous section. Using the framework, four weeks of data with over a billion data points from 24 PMUs located in the network were analysed. The development of this framework could assist with the better-informed system planning and real-time operations for distribution network operators. By clustering these events using the proposed model, the characteristics of these events and their possible causes can be summarised as follows, with examples shown on Fig. 5.3.
Class 1: these events are easily recognisable, and they appear as momentary fluctuations and large temporary dips and swells in frequency, and all three phases of voltage magnitude, current magnitude, active and reactive power. Of all event classes, class 1 events have the shortest span and only last for a few cycles. This class of events could be due to transient three-phase faults or line trips in the distribution feeder, from a nearby distribution feeder or from the transmission network. This type of event has a major impact on the network due to their magnitude and can be observed in the response of several PMUs. Due to their severity, class 1 events may cause significant damage to power system assets without proper protection schemes.
Class 2: these are local or feeder level events. This class of events represents the operation of the recloser during a close-open duty cycle during the interruption of a momentary fault. Class 2 events are therefore due to the operation of power system protection devices.
Class 3 and 4 events: these events have similar characteristics and appear as temporary dips in voltage and momentary spikes and fluctuations in frequency, current, active, and reactive powers. Due to their similarity, the events are quite close topographically on the Kohonen map. Except for high spike levels, class 3 events have a minor impact on current, active, and reactive powers than class 4 events. These events may be due to a load or distributed energy resource switching. PMUs may also register class 3 or 4 events if faults happen on other feeders, which are not located too close to these PMUs. The PMU timestamps can be used to verify if class 1 events are happening on other feeders or if other PMUs are also experiencing class 3/4 events.

26
Figure 5.3. Classes of events detected using the event detection and classification framework

27
Class 5 events: this class of events are characterised by a sudden drop of all PMU signals to zero. These events are quite rare and by the disconnection of the PMU from the circuit. These are not necessarily power system events and may be due to a malfunctioning of PMU. Further investigations can be conducted to determine the cause of this response.
Class 6 and 7 events: these events appear as a temporary dip in voltage and momentary fluctuations in current, active, and reactive powers. Due to high increase in current, these events may be due to the operation of loads such as heating, ventilation, air-condition systems, and motor loads as these types of loads normally yield a high inrush current. These events are normally seen in PMUs located in residential and industrial areas.
Class 8 and 9 events: these events manifest as sustained increased or decreased step in voltage, current, active, and reactive powers. The cause of these events may be due to the operation of on-load tap changing transformers or the switching of loads.
Class 10 events: these events manifest as oscillations in PMU measurements and may be due to the operation of certain loads or the malfunctioning of assets such as transformers.
Due to the timestamp information recorded by PMUs, events can be correlated across multiple devices, which helps to determine the extent or the localisation of an event. To illustrate that, Figs. 5.4 - 5.6 show the comparison of events for two PMUs across the same time instant. Fig. 5.4 shows the detection of a line trip event at the transmission level. This event appeared as a temporary fluctuation with a large dip in all variables were monitored by both PMUs. Due to the GPS synchronized timestamps recorded by the PMUs, it is easy to correlate events detected by PMU 1 with events detected by PMU 2. Although this event causes fluctuations in all the monitored variables, the voltage fluctuations seem to be more severe than fluctuations in current and frequency. Though this event was due to the tripping of a transmission line, faults on a nearby distribution feeder may also have these characteristics. On the other hand, Fig. 5.5 shows an event that appears as a temporary fluctuation in the voltage, current, active, and reactive power of PMU 1. When the timestamp of this event was correlated with PMU 2, it can be observed from the figure that this event was not visible in the measurements of PMU 2. These types of events are usually distribution level events, which are initiated downstream of a PMU. They may be due to the switching of local loads or distributed energy resources.

28
Figure 5.4. Event 1 - Detection of a line trip (Transmission level) event. Event was initiated upstream of PMUs. First row corresponds to measurements from PMU 1. Second row corresponds to measurements from PMU 2.
Figure 5.5. Event 2 - Detection of load switching events. Event was initiated downstream of PMU 1. Event not visible by PMU 2.
Similarly, Fig. 5.6 shows a distribution level event, which appears as damping oscillations in all variables and phases of the PMU data. As seen from the figure, the level of oscillations in the current magnitude, frequency, and active power appears to be higher than the oscillations in voltage. Although both PMUs capture the event, the magnitude of oscillations for this event is greater in PMU 1 than in PMU 2. Fig. 5.7 shows the overall number of events detected each day for two months.

29
Figure 5.6. Event 3 - An event involving oscillations. Magnitude of oscillations is greater in PMU 1. The source of event is closer to PMU 1.
Figure 5.7. Number of daily events for two months
5.2 Condition Monitoring for Power System Assets
The aim of this aspect of the project was to investigate new condition monitoring approaches for power system assets by leveraging high-precision PMU data. This will be achieved by dedicated experiment design, analysing the characteristics of the PMU data in an extended period, and linking the extracted features from the PMU data to asset health conditions or power system asset failure incidents. The assets of the transformer and insulator have been studied in this work. The tasks were performed in the following three stages: 1) Newly developed PMU performance testing through the lab experiment by collaborating with
NOJA Power team

30
2) Transformer aging experiment and aging evaluation approach development 3) Insulator aging experiment establishment and arcing detection approach development
Methodology
This work has been conducted through extensive experimental testing, data conditioning, and asset health condition evaluation approach development. The detailed roadmap is shown in Fig. 5.8. Two experimental setups (Exp-1 and Exp-3) were established at NOJA Power test laboratory and one experimental setup (Exp-2) was prepared at UQ long pocket campus. Exp-1 was developed for the PMU performance testing before it was integrated into the NOJA Power RC20 product. Exp-2 was built to investigate the transformer aging condition monitoring approach by using Signal to Noise Ratio (SNR) method. Exp-3 was established for insulator health condition monitoring. All the experiment PMU data was collected by real-time data streaming through a Phasor Data Concentrator (PDC) with a developed historian software tool. The collected data was processed by data conditioning for the PMU-based asset health condition evaluation approach development. The details about the research methodology are elaborated in the following three stages.
Figure 5.8. Roadmap of the proposed project

31
Stage 1: Developed PMU Performance Testing through Lab Experiment
To test the performance of the developed PMU, a testing plan was developed based on the PMU testing standards. IEEE Standards Association has published several standards and guidelines on how to test the PMU [12-15]. A standard-compliant PMU should meet all the steady-state and dynamic performance requirements in IEEE standard C37.118.1a-2014 [13]. IEEE/IEC 60255-118-1-2018 [15] specifies methods for evaluating PMU measurements and requirements for compliance with the standard under both static and dynamic states. Therefore, both standards are employed for the PMU testing. The procedure to conduct the proposed testing work is shown in Fig. 5.9. Both secondary and primary signal injection experiment platforms have been developed by NOJA Power team. For the secondary signal injection experiment, Doble was used to generate the reference testing signals (frequency, voltage, phase-angle changes) required by the standard. For the primary signal injection experiment, a real network was constructed with a generator, transformer, load band, switchgear, and the control box with PMU. To evaluate the accuracy of the developed PMU, another commercial PMU was installed and used to benchmark the NOJA Power PMU. Extensive operating scenarios were created to investigate the measurement accuracy of the PMU. After processing the captured data, the outcomes demonstrated that the NOJA Power PMU can meet the accuracy requirement of the PMU Standard IEEE C37.118.1a-2014. Therefore, the PMU can be implemented in the real system.
Stage 2: Transformer Aging Experiment and Aging Evaluation Approach Development
To investigate whether the SNR can be a good indicator for the transformer health condition assessment, an accelerated aging experiment platform was established at UQ transformer laboratory as shown in Fig. 5.10. The system consists of a load bank, prototype transformers, a recloser, a PMU and associated data acquisition/storage systems. The transformer was heated to 85°C to accelerate the aging of transformer insulation for two months. During the experiment, the PMU data were streamed to the data server through openHistorian in real-time. At the same time, oil and paper samples were also collected weekly to investigate whether any internal faults occurred during the aging experiment. Then, the oil and paper analysis results are the benchmark for the PMU results investigation.
To analyse the SNR of PMU measurements, noise must be distinguished from the raw data. For that purpose, a median filter is used to segregate the noise. Then, normalized auto-correlation coefficients (NACC) and noise distribution are used to evaluate the filter performance. The normalized auto-correlation calculation 𝑟𝑥𝑥 is shown in (5.1) to determine whether the filtered noise samples are independent or uncorrelated.
𝑟𝑥𝑥(𝑙) =∑ 𝜂(𝑛) ⋅ 𝜂(𝑛 − 𝑙)𝑁
𝑛=1
∑ 𝜂(𝑛)2𝑁𝑛=1
(5.1)
Where N is the total number of samples and 𝑙 is the delay [(−𝑁 + 1), (−𝑁 + 2), … , −1,0,1,2, … , (𝑁 −
2), (𝑁 − 1)].

32
Figure 5.9. Flowchart for PMU performance validation testing

33
Figure 5.10. Transformer aging experiment platform
Once noise is subtracted from the raw data, the SNR can be calculated by (5.2).
𝑆𝑁𝑅𝑑𝐵 = 20 log (𝜇
𝜎) (5.2)
Where 𝜇 is the mean value of the true signal and the 𝜎 is the standard deviation of the noise. The SNR calculation approach is shown in Fig. 5.11. An example of noise segregation is shown in Fig. 5.12, which contains the measured voltage, filtered voltage, and the extracted noise. It is observed that the NACC of the extracted noise (shown in Fig. 5.12 (b)) are all less than 0.01 and the extracted noise follows Gaussian distribution. Hence, the extract noise signal is considered as the true noise signal.
Figure 5.11. Flowchart of the proposed SNR calculation

34
(a)
(b)
(c)
Figure 5.12. (a) noise extraction, (b) normalized auto-correlation coefficient of noise, and (c) noise distribution
Stage 3: Insulator Aging Experiment Establishment and Arcing Detection Approach Development
Currently, the arcing faults are usually detected based on the high-resolution waveform data. The aim of this work is to investigate the feasibility of using low-resolution PMU measurements for insulator aging condition assessment and quick arcing event detection. Firstly, the experiment system

35
was established as shown in Fig. 5.13. The insulator was accelerated to failure by spraying the salt solution on its surface in the salt fog chamber at NOJA Power testing laboratory. This aims to imitate the pollution environment of the insulator installed at the feeder near the coastal area. The artificial pollution experiment is conducted based on IEEE standard 4-2013 (standard for high-voltage testing techniques) [65]. Two types of devices, including a power quality meter (PQM) and a PMU, are used to record the voltage/current at high-voltage (HV) and low-voltage (LV) windings, respectively. As shown in Fig. 5.13 (b), the HV side of the transformer is open-circuit, where there is no arcing fault. Thus, the current of HV winding is zero and the measured signal by PMU only contains voltage (9.9kV). At the same time, the LV current measured by PQM is zero as well. As the aging experiment continues, arcing faults occurred on the insulator of the switchgear. Then, voltage drop was recorded by PMU while current surge was measured by PQM. Therefore, the current waveform recorded by PQM with 1024 samples per cycle and the voltage data recorded by PMU with one sample per cycle are used for the arcing fault assessment.
(a)
(b)
Figure 5.13. Insulator aging experiment system: (a) lab set up, (b) electrical connection schematics.
The arcing fault detection approach is developed based on Isolation Forest (IForest) [66]. IForest is an unsupervised machine learning approach, which does not require any prior knowledge of the arcing incidents. One of the advantages of the IForest is that it requires less computational resources compared with other anomaly detection approaches. The fundamental of the IForest is the

36
decision tree. As shown in Fig. 5.14, the red dots represent the outliers and the light blue dots represent the normal common data. The normal uncommon data are represented by the dark blue dots. The IForest recursively generates the trees by randomly selecting features and selecting values for features. The abnormal data need fewer random portions to be isolated compared with the normal data. Therefore, the abnormal data will be the one that has a shorter path in a tree.
(a) (b)
Figure 5.14. IForest-based abnormally detection: (a) theoretical schematics, (b) proposed arcing detection approach.
The flowchart of the developed approach is shown in Fig. 5.14(b). The major steps are summarised as below:
Process the raw PMU data including noise extraction, missing data compensation, GPS unlocking detection.
Employ the IForest approach to detect the arcing fault. If the data point is abnormal compared to other data points, it should take fewer steps to separate it. Then form an isolation tree to indicate the path to find each point. The abnormal point should take less distance to reach the abnormal node. The selection of an anomaly score is important to separate the abnormal points. A trial-and-error method is used to determine the anomaly score.
After the isolation forest, the location of large arcing can be determined. However, the starting and ending point of the arcing cannot be identified correctly. This requires slope detection to further analyse the actual starting and ending points. The maximum voltage variation under normal operating conditions can be used as the threshold for the slope selection. Any voltage anomaly value greater than the threshold is considered as an abnormal value. The abnormal slope of 50V/20ms is used for the experiment data to determine the starting point and ending point.
Set up the feature matrix [T, ∆𝑉, N]. Validate the arcing detection results with the PQM data. Implement the PMU-based arcing detection approach.

37
Outcomes Stage 1: the PMU integrated into the control box of NOJA Power RC20 can meet all the requirements by the IEEE standard 37.118.1a-2014. The PMUs have been installed into Queensland and Victoria distribution networks. The PMU measurements have been used for actual incidents analysis and event detection. Stage 2: the transformer insulation paper and oil analysis results are the benchmark of the SNR analysis results. The insulation paper of the transformer is a key indicator to evaluate the operational year of the transformer. Thus, the Degree of Polymerization (DP) and moisture are measured based on the collected paper samples. The DP results are shown in Fig. 5.15. The operating years of the transformer are calculated based on the obtained DP. It shows the equivalent age of the transformer is 7.5-year before the aging experiment while it reaches 12.9 years after the two-month aging, which means the transformer is still in very good condition.
Figure 5.15. DP of the transformer in the experiment
The DGA measurements were conducted in Powerlink. Duval triangle approach [28] is employed to identify the incipient faults based on the DGA results after one-month and two-month aging, which are shown in Fig. 5.16. The red dots indicate the transformer has thermal faults with a temperature lower than 300°C. This fault is caused by the thermal accelerated aging experiment. Therefore, there is no other fault occurred in the transformer during the experiment.
An example of voltage, current and frequency measured by the PMU during the above two aging stages are shown in Fig. 5.17 and Fig. 5.18. During the first month of aging experiment, some PMU data are missing due to the loss of communication between the PMU and the data server. Therefore, an equivalent 20-days of SNR is calculated for the first month of aging experiment as shown in Fig. 5.17. Except for occasional spikes in the SNR caused by the GPS unlocking, most SNR variations of different measurements (voltage, current, and frequency) are quite consistent. There is no significant change in the SNR, which is consistent with the results from the DP measurements and the Duval tringle analysis. Therefore, minimal change is observed in the width of the SNR variation bands when the transformer is in a good condition without internal faults.

38
Figure 5.16. Incipient fault identified by Duval triangle after one-month (left subplot) and two-month (right-subplot) aging experiment (D1 Discharge fault with low energy, D2 Discharge fault with high energy, DT Fault caused by electrical and thermal stress, PD Partial discharge faults, T1 Thermal Fault at Temperatures < 300°C, T2 Thermal Fault at Temperatures > 300 °C and < 700 °C, T3 Thermal Fault at Temperatures > 700 °C)
Figure 5.17. SNR of voltage, current and frequency during the first month of aging

39
Figure 5.18. SNR of voltage, current, and frequency during the second month of aging
To validate the developed PMU-based arcing detection approach, high-resolution PQM waveform data are used as the benchmark. The comparison results are shown in Fig. 5.19. As it can be seen from this figure, the arcing ignition time detected by the PMU is the same as the one recorded by the PQM. The arcing duration is 76ms recorded by the PQM. The arcing duration identified by the proposed approach is 80ms. The difference in the duration length is caused by the reporting rate of the PMU data. The resolution of the PMU is 20ms. Thus, 80ms is reasonable for this arcing fault detected by PMU. It demonstrates that the developed PMU-based arcing detection approach can be used for insulator arcing fault detection. The other two arcing fault detection examples are shown in Fig. 5.20. The starting points and the ending points of the arcing faults are highlighted with coloured dots.
Figure 5.19. PMU-based arcing detection results validation with the recorded arcing fault by PQM.

40
Figure 5.20. Arcing faults detected by the developed approach.
In summary, the proposed IForest-based arcing fault detection approach can accurately identify the insulator arcing faults. When fully developed and integrated to the utility data system, the proposed method can indicate the rise in arcing levels of the system assets such as relays, cables, and transformers in near real-time. This would provide an opportunity for the utility to maintain the misbehaving asset to avoid failure and further damage to other assets.

41
6. Increase in the Grid Hosting Capacity of Renewable
Energy Generation
As a part of activities performed by the knowledge sharing partners, two PhD candidates from Deakin University worked on applications of PMU data to increase grid hosting capacity for renewable energy integration. The first PhD candidate performed simulations to determine different voltage stability indices on an hourly basis. These indices included critical eigenvalue, transmission loss, reactive power margin, and maximum loading margin. Since system load demand can vary with respect to customer behaviour, and solar PV generation is weather dependent, these uncertainties needed to be considered while analysing voltage stability of a power grid. At the work of the other PhD candidate, a real-life case study considering 18 medium voltage distribution feeders including residential, industrial, hospital, and laboratory feeders with three-phase voltage data from field PMUs and postcode level solar generation data were analysed. The performed activities and outcomes are presented in this chapter.
6.1 Application of PMU Data in Voltage Stability Analysis
The computational results of this work show that Thevenin parameters can be obtained from the weak node of a distribution network using least square method and PMU data. Using the Thevenin parameters, maximum loading point of the monitored node can be accurately computed. In the following, a brief overview of the implemented Ordinary Least Square (OLS) method to obtain Thevenin parameters based on PMU data is provided. The proposed method to derive the maximum critical point of the monitored node from the Thevenin parameters is then presented.
A Thevenin equivalent consists of a voltage source and a series-connected impedance. If any network from a monitored bus is converted into Thevenin equivalent, the Thevenin parameters represent the rest of the network seen from that bus. However, if the dynamics of the system change over time, the Thevenin parameters require to be re-calculated to correctly represent the terminal voltage and current for that specific time and operating point. The framework proposed in this part of the project does not require any topological information of the system or admittance matrix. Only PMU measurements from a single bus are utilized to determine Thevenin parameters. Fig. 6.1 represents a Thevenin equivalent circuit connected to a load bus. Here, the load impedance Zload at bus 2 consumes the complex power P+jQ. An ideal voltage source Eth supplies this power to the load through the impedance Zth. Eth can be calculated from the voltage phasor V2 and current phasor I2 from 6.1.
Eth − ZthI2 = V2 (6.1)

42
Figure 6.1. Thevenin equivalent network connected to a load
The voltage and current phasors including their magnitude and phase-angles over a selected time window are obtained from PMU installed at the monitored load bus. This data is conditioned to reduce the noise. Then, the Thevenin parameters are calculated for each time instance using the conditioned PMU data. Thereafter, maximum loading point of the load bus can be determined using these parameters for each instance over the window in real-time, which indicates the distance of the system from the collapse point.
Ordinary Least Square (OLS) Method
If the terms of 6.1 are separated into real and imaginary parts such that I2 = Ir + jIi, V2 = Vr + jVi, Zth = Rth + jXth and Eth = Er + jEi, a linear system of equations can be obtained as given in 6.2 [67].
(6.2)
This equation contains four unknown variables of Er, Ei, Rth, Xth, but the right-hand side bk has only two known variables (Vr, Vi). Thus, the equation is underdetermined. To address this, if the measurements of V2 and I2 are taken multiple time instances (k = 1, ......, M), equation 6.3 can be obtained.
Ax = b (6.3)
Where A= [ A1T A2
T A3T………. AM
T] and b= [ b1T b2
T b3T………. bM
T]. For M=2, 6.2 will have a solution but ideally the window length M should be much larger than 2 to remove the impact of transients and noise. Then the system of equations in 6.2 becomes overdetermined. Using OLS method, a solution of Thevenin matrix, x can be determined from 6.3.
Calculation of Maximum Loading Point
Critical voltage is a condition where the bus voltage is nearing the unstable region from stable region. Once this point is reached, no amount of load shedding can bring it back to stability. At this operating voltage, the amount of power drawn by the load is maximum, after which, the system becomes voltage unstable [68]. P-V curve for a load bus in Fig. 6.2 demonstrates its maximum loading
E th
V 1 V 2 Z th
Z load I 2

43
point (critical point), and stable and unstable regions. In that figure, P0 is the current operating point and Pm is the maximum active power that can be supplied to the load.
Figure 6.2. PV curve of a load bus in the power system.
Although maximum loading point can be calculated in P-V curve method, it can be computationally time-consuming for large power networks. In this method, active power consumed by a load bus is gradually increased in steps from a base case and for every increment step, it is required to recalculate power flows to determine the load bus voltage. This is continued until the curve reaches the critical point. The proposed framework in this project, however, reduces the computational time as it does not require repeated calculation of Jacobian matrix for powerflow. Moreover, it does not require any information of the system topology. To implement this method, the quadratic equation for critical voltage mentioned in [69] has been manipulated to obtain the following equation to determine the maximum loading point.
P2Dcr [4(Gth − βBth)2 − 4|Yth|2(1 + β2)] − PDcr [4(Gth − βBth) |Yth|2|Eth|2] + |Yth|4|Eth|4 = 0 (6.4)
Where, PDcr: maximum loading point, Gth: conductance, Bth: susceptance, Yth: admittance, and β = Q/P=tan (θV − θI). In (6.4), θV and θI are the phase-angles of voltage and current obtained from PMU data. Once Thevenin parameters (Rth, Xth and Zth) are determined from PMU measurements over a selected time-window using OLS method, Gth, Bth and Yth can be calculated from these parameters. β is calculated from voltage and current phase-angles of PMU data over that time window. Finally, the maximum loading point for the selected time-period is determined by solving (6.4).
Outcomes
To calculate real-time Thevenin parameters and, subsequently, real-time maximum loading point as voltage stability index for utilities, a framework was proposed. The findings from the framework are presented here.
Verification of the Proposed Framework
To validate the accuracy of the algorithm, a typical two-bus distribution network with a varying load is modelled in Simulink as presented in Fig. 6.3. The values of Rth, Xth, Eth obtained from the
P
Maximum loading point
Collapse margin
Critical voltage Stable region
Unstable region
P 0 P m
Loading margin

44
proposed method matches with the R = 0.019 Ω, X = 0.95 Ω, E = 13.8 KV of the network. With these parameters, the maximum loading point was obtained 51 MW, which was close to the expected value. Thus, the method is working for a simple system, so it can be tested on larger practical systems. Therefore, the application was extended to IEEE 33-bus distribution network and the results are presented as follows.
Figure 6.3. A typical two bus distribution network
Modelling of the Test System and Simulation Results
IEEE 33-bus radial distribution system is considered as a test system in this section. It consists of 33 buses and 32 lines with a nominal line-line voltage of 12.66 kV, load size of 3.7 MW and 2.3 MVAr. The network was modelled in Simulink to implement the developed algorithm. Since the load bus 33 is a weak node of this distribution network, it was monitored by transferring the rest of the network to a Thevenin equivalent circuit using PMU data with the proposed algorithm. For this purpose, a PMU unit is installed at this node with reporting rate of 64 samples per cycle. Using the framework, Thevenin parameters from bus 33 are found to be Rth = 5.7 Ω, Xth = 4.6 Ω, and Eth = 7.3 kV. Using these parameters, the maximum critical point of load bus 33 is calculated 19 MW. To check the accuracy of this index, MATPOWER tool was used to find the stability margin of the same bus, which was around 18 MW. Thus, the obtained result is quite close to the exact loading margin (around %5 error). Thus, the simulation results confirm that the application is suitable for implementation on distribution networks without requiring detailed topological information. In the next step, this application is implemented on real synchrophasor data obtained from Energy Queensland networks to showcase the practical implementation of the application. Validation of the Proposed Framework with PMU Data
To validate the proposed framework, PMU data including voltage and current measurements from a field location were collected. The data has been conditioned to remove noise and fed into the application for one hour time span. The results of Thevenin resistance (Rth), reactance (Xth), and voltage (Eth) are demonstrated in Figs. 6.4 - 6.6 respectively. From Fig. 6.4, it is observed that the Rth
for each phase is consistent with a range of 11-15.5 Ω. Fig. 6.5 indicates that Xth is also consistent for
G
00 0.019+j0.95
V 1 V
2
E= 13.8 K V

45
all three phases, ranging 3.4-4.8 Ω. Eth reflected from Fig. 6.6 ranges 5520-5820 V. From these three parameters, maximum loading point is calculated using 6.4 as presented in Fig. 6.7.
Figure 6.4. Calculated Thevenin resistance (Rth)
Figure 6.5. Calculated Thevenin reactance (Xth)
Figure 6.6. Calculated Thevenin voltage (Eth)
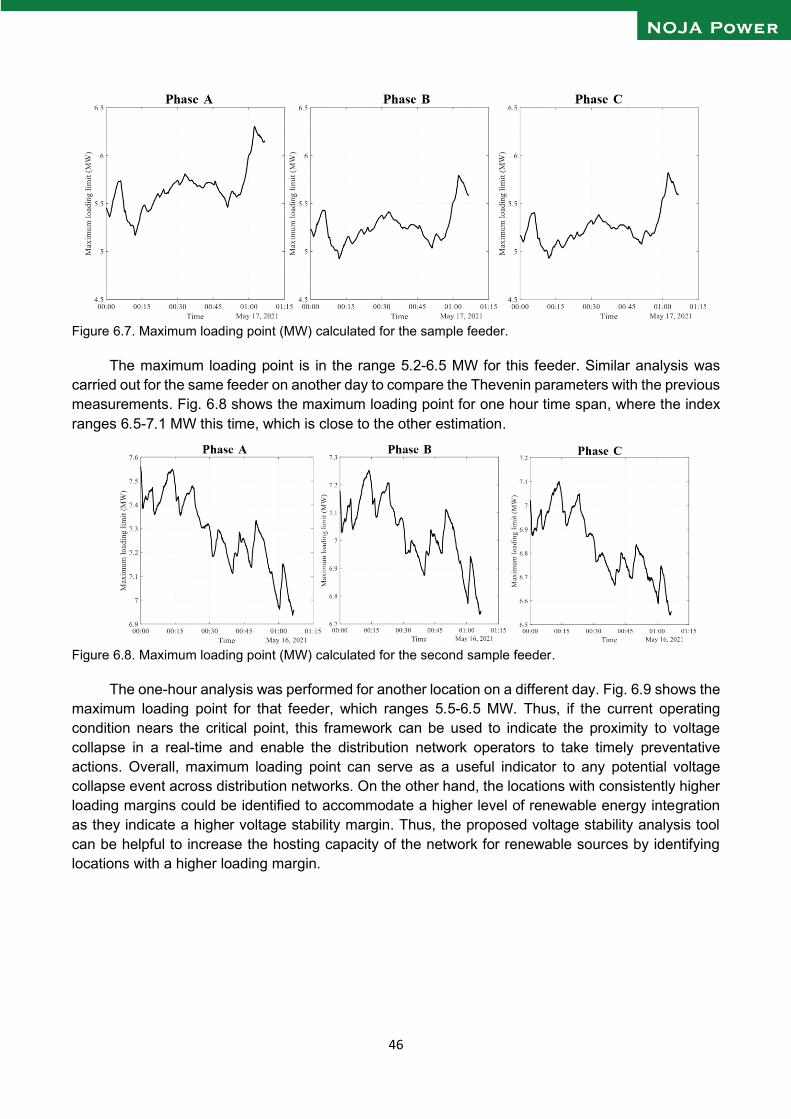
46
Figure 6.7. Maximum loading point (MW) calculated for the sample feeder.
The maximum loading point is in the range 5.2-6.5 MW for this feeder. Similar analysis was carried out for the same feeder on another day to compare the Thevenin parameters with the previous measurements. Fig. 6.8 shows the maximum loading point for one hour time span, where the index ranges 6.5-7.1 MW this time, which is close to the other estimation.
Figure 6.8. Maximum loading point (MW) calculated for the second sample feeder.
The one-hour analysis was performed for another location on a different day. Fig. 6.9 shows the maximum loading point for that feeder, which ranges 5.5-6.5 MW. Thus, if the current operating condition nears the critical point, this framework can be used to indicate the proximity to voltage collapse in a real-time and enable the distribution network operators to take timely preventative actions. Overall, maximum loading point can serve as a useful indicator to any potential voltage collapse event across distribution networks. On the other hand, the locations with consistently higher loading margins could be identified to accommodate a higher level of renewable energy integration as they indicate a higher voltage stability margin. Thus, the proposed voltage stability analysis tool can be helpful to increase the hosting capacity of the network for renewable sources by identifying locations with a higher loading margin.
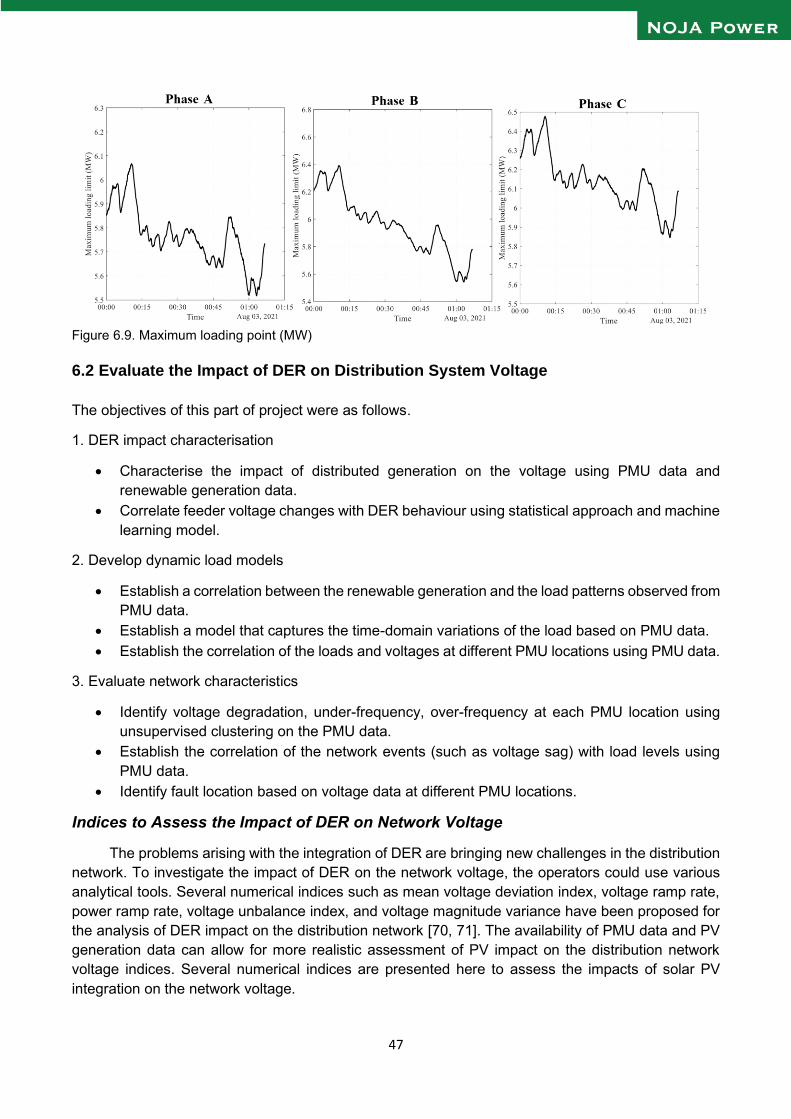
47
Figure 6.9. Maximum loading point (MW)
6.2 Evaluate the Impact of DER on Distribution System Voltage
The objectives of this part of project were as follows.
1. DER impact characterisation
• Characterise the impact of distributed generation on the voltage using PMU data and renewable generation data.
• Correlate feeder voltage changes with DER behaviour using statistical approach and machine learning model.
2. Develop dynamic load models
• Establish a correlation between the renewable generation and the load patterns observed from PMU data.
• Establish a model that captures the time-domain variations of the load based on PMU data. • Establish the correlation of the loads and voltages at different PMU locations using PMU data.
3. Evaluate network characteristics
• Identify voltage degradation, under-frequency, over-frequency at each PMU location using unsupervised clustering on the PMU data.
• Establish the correlation of the network events (such as voltage sag) with load levels using PMU data.
• Identify fault location based on voltage data at different PMU locations.
Indices to Assess the Impact of DER on Network Voltage
The problems arising with the integration of DER are bringing new challenges in the distribution network. To investigate the impact of DER on the network voltage, the operators could use various analytical tools. Several numerical indices such as mean voltage deviation index, voltage ramp rate, power ramp rate, voltage unbalance index, and voltage magnitude variance have been proposed for the analysis of DER impact on the distribution network [70, 71]. The availability of PMU data and PV generation data can allow for more realistic assessment of PV impact on the distribution network voltage indices. Several numerical indices are presented here to assess the impacts of solar PV integration on the network voltage.

48
Voltage Deviation Index (VDI): voltage rise is an identified impact of solar PV integration in the network [72]. Voltage rise is used to calculate the voltage deviation index, where VDI is defined by the amount of voltage rise noticed at any given time between the nominal voltage and a node in the feeder and can be obtained from 6.5 [70].
𝑉𝐷𝐼 =𝑉nom − 𝑉𝑖𝑛𝑠𝑡
𝑉nom (6.5)
Where, 𝑉nom is the nominal voltage and 𝑉𝑖𝑛𝑠𝑡 is the instantaneous voltage. This index can be used to understand the deviation/rise of feeder voltage affected by PV penetration. A value of 5% beyond the nominal voltage is considered as the upper limit based on Australian standard [71]. In the case of no PV power generation, the feeder voltages are usually lower than the nominal voltage, leading to the positive value of VDI. On the contrary, PV integration with network causes voltage rise and hence the VDI could be negative.
Voltage Ramp Rate (VRR): VRR in a distribution feeder is evaluated by the maximum amount of voltage variation in the feeder. The voltage ramp rate index is estimated based on the variation in voltage between the present and immediate previous measurement as given in 6.6 [70].
𝑉𝑅𝑅(𝑡) =
𝑉(𝑡) − 𝑉(𝑡 − 1)∆𝑡
𝑉nom (6.6)
Where, Δt is the time difference between consecutive samples. VRR can be either positive or negative, which specifies the direction of voltage ramp.
Power Ramp Rate (PRR): the PV power variation is usually caused due to the moving clouds and irradiance variation. PRR index of a distribution feeder is estimated based on the variation in PV power output between the present and immediate previous measurement as given in 6.7.
𝑃𝑅𝑅(𝑡) =
𝑃𝑉(𝑡) − 𝑃𝑉(𝑡 − 1)∆𝑡
𝐺𝑒𝑛𝑒𝑟𝑎𝑡𝑖𝑜𝑛 𝑐𝑎𝑝𝑎𝑐𝑖𝑡𝑦 (6.7)
Where, Δt is the time difference between consecutive samples. PRR can be either positive or negative, which specifies the direction of power ramp. The positive value of PRR indicates the increase in present PV generation in the distribution feeder compared the previous measurement and vice versa.
Voltage Unbalance (VU) Index: the power distribution network usually experiences an imbalance in the three-phase voltages due to the diversity of loads as well as increase of PV power generation in the distribution feeder and the uncertainty of renewable energy sources [73, 74]. VU index is expressed as the ratio of negative sequence to the positive sequence voltage and estimated by 6.8-6.9 [71].
𝑉𝑈 = √1 − √3 − 6𝛽
1 + √3 − 6𝛽 (6.8)
𝛽 =([𝑉𝑝𝑝(𝑎𝑏)]
4+ [𝑉𝑝𝑝(𝑏𝑐)]
4+ [𝑉𝑝𝑝(𝑐𝑎)]
4)
([𝑉𝑝𝑝(𝑎𝑏)]2
+ [𝑉𝑝𝑝(𝑏𝑐)]2
+ [𝑉𝑝𝑝(𝑐𝑎)]2
)2
(6.9)

49
Where, Vpp(ab), Vpp(bc) and Vpp(ca) are the line-to-line voltages between indicated phases.
Voltage Variation (VV): VV index is the absolute difference between instantaneous voltage (Vt) and mean voltage as the percentage of nominal voltage, which can be estimated by 6.10.
𝑉𝑉 =|𝑉t − 𝑉mean|
𝑉nom× 100 % (6.10)
Active Power Impact on Voltage Index (APIVI) and Reactive Power Impact on Voltage Index (RPIVI): the voltage variation occurs due to the load variation or contingencies. Contingencies are characterised by high reactive power demand and high reactive power loss in transmission network [75]. High PV power penetration can cause reverse power flow, affecting both active and reactive power demands. The impact of reactive power on the voltage indices such as VV, VRR, and VU needs to be studied to assess the performance of the distribution network. The high penetration of solar and wind power can cause instability in the power systems as it has increased the demand for reactive power [76][77]. APIVI and RPIVI can be obtained from 6.11 and 6.12.
𝐴𝑃𝐼𝑉𝐼 = (𝑉(𝑡 + 1) − 𝑉(𝑡)
𝑉nom) (
𝑃(𝑡 + 1) − 𝑃(𝑡)
𝑃max)⁄ (6.11)
𝑅𝑃𝐼𝑉𝐼 = (𝑉(𝑡 + 1) − 𝑉(𝑡)
𝑉nom) (
𝑄(𝑡 + 1) − 𝑄(𝑡)
𝑄max)⁄ (6.12)
Where 𝑃max and 𝑄max are the maximum real- and reactive-power consumptions over the period.
Data Analysis and Estimation of Indices
To evaluate the impact of DER on the system, voltage, current, phase-angle, active and reactive powers with PV generation were investigated for different PMU locations was investigated. Different feeders (residential, industrial) were identified from the weekly and weekend current profiles. Table 6.1 shows the residential and industrial feeders and their corresponding PV generation capacities.
Table 6.1. PV generation capacities of the feeders
Feeder Type Generation Capacity (MW) R1
Residential
30.6 R2 12.3 R3 26.5 R4 32.4 R5 22.9 R6 22.9 R7 22.9 R8 39.8 I1
Industrial
21.4 I2 22.9 I3 47.0 I4 27.6 I5 14.4 I6 32.4 I7 23.4 I8 33.0 H1 Hospital 7.3 L1 Laboratory 52.8

50
Initially, one weekday and weekend data were analysed and then the analyses were carried out for 7 days. For this analysis, R4, R5, I6, H1 feeder are considered. Then, the statistical analysis of the voltage indices based on 13 days data were carried out to investigate the DER impact. For the statistical analysis,11 kV distribution feeders in Australia are considered. Among them, 8 feeders are industrial, 8 residential, and one is a hospital load, and 1 is a laboratory load. This case study has been carried out using PMU data comprised over 13 days. Data has been collected for every 5-minute interval from February 23rd to March 8th, 2021. Solar generation data has been collected from [58] at postcode levels for every 5-minute intervals over the same period. The results, obtained from the 13 days analyses, are discussed in the following.
Impacts of Solar Generation on Voltage Indices
Figure 6.10 shows the effects of solar generation on voltage indices VDI, VRR, and VVAR for feeder R1 as an example. During the maximum solar generation, lower VDI value is observed for all the phases as depicted in Fig. 6.10 (a). That is, R1 is not experiencing any voltage rise for solar generation levels up to 25 MW. The maximum VDI of 8% is found on February 25th for phase B, which indicates the violation of VDI limit of ±5%. Compared to phases A and C, phase B shows a higher value of VDI for all days, which means that adding more solar generation in phase B can improve the voltage levels during daytime. The VRR values fluctuate between -0.61% and 0.53% as shown in Fig. 6.10 (b), which indicates they are within the limits of ±10%. On the other hand, the value of VVAR increases during the maximum solar generation as depicted in Fig. 6.10 (c). The maximum VVAR of 3.86% is observed for phase B on February 25th, when the solar generation fluctuated rapidly.
(a)

51
(b)
(c)
Figure 6.10. Effects of solar generation on voltage indices at R1: (a) VDI, (b) VRR, (c) VV.
Statistical Analysis of Voltage Indices for Different Feeders
Figure 6.11 illustrates statistical results for the indices for different feeders against solar generation. It can be seen from Fig. 6.11(a) that R5 has the highest VDI of around 7.9%, which exceeds the maximum VDI limit, followed by R4 and I7. On the other hand, I2 has the highest VRR value on average and the highest interquartile range, as shown in Fig. 6.11(b); however, the average VRR for all the feeders are within the acceptable range. The maximum VVAR value of 6.6% is found for I1 with the highest interquartile range as presented in Fig. 6.11(c). Moreover, H1 displays the lowest interquartile range of VVAR. As can be seen from Fig. 6.11(d), the maximum APIVI of 3.16 appears at I6, which also has the highest interquartile range. R2 and R6 show the maximum median value of APIVI of 0.38. In the case of RPIVI from Fig. 6.11(e), I6 shows the highest RPIVI value with the maximum median and the highest interquartile range. Maximum VDI at most of the feeders occurs
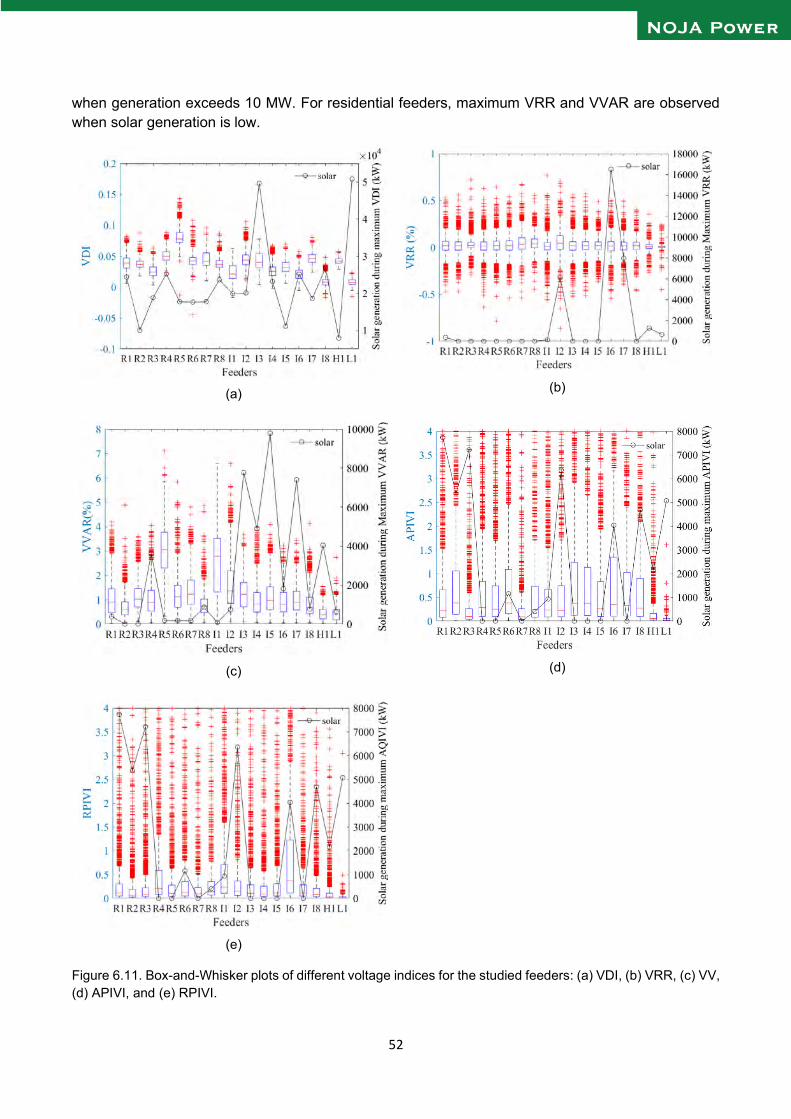
52
when generation exceeds 10 MW. For residential feeders, maximum VRR and VVAR are observed when solar generation is low.
(a)
(b)
(c)
(d)
(e)
Figure 6.11. Box-and-Whisker plots of different voltage indices for the studied feeders: (a) VDI, (b) VRR, (c) VV, (d) APIVI, and (e) RPIVI.

53
Figure 6.12 shows the 95th percentile values for all the voltage indices along with the maximum solar generation at different feeders in the given period. It can be seen from this figure that the highest 95th percentile VDI value of 10.6% is observed at R5. This is higher than the accepted limit and occurs when solar generation at R5 reaches 20 MW. R5 also shows the highest 95th percentile VVAR of 4.95%, while H1 exhibits the lowest 95th percentile VVAR of 0.96%. As with VRR, all the feeders demonstrate a low 95th percentile value within the acceptable limits. Moreover, I6 depicts the highest 95th percentile APIVI of 3.96 and RPIVI of 3.26, whereas L1 shows the lowest 95th percentile APIVI of 0.11 and RPIVI of 0.075 values.
Figure 6.12. 95th percentile values of voltage indices for different feeders.
Impact of Generation Tripping Event
Figure 6.13 presents the various voltage indices at four different feeders located across regional Queensland in response to a generation trip event. The PMU data for L1, I2, R5, and H1 with the resolution of 30 frames per second has been analysed from 2:04 pm to 2:08 pm for evaluating the indices before and after the event. All feeders except L1 experienced increased fluctuations from 2:06 pm, with the most significant changes seen around 2:06:42 pm (42 seconds after the generation tripping) for all the feeders. The VDI for L1 swings between -3.4% and 4.2% in that time. VDI then reaches -0.5% around 58 seconds after the generation tripping and remains steady. Prior to the power loss at H1, VDI exceeds 14%. Thus, the maximum values of VDI for H1, I2, and R5 exceeded the acceptable VDI limit of ±5%. VRR is zero most of the time except at the event time, when it increased to 0.8%, 0.58%, and 0.58% for L1, I2, and R5, respectively. As with H1, VRR dropped to -8.5% at 2:06:44 pm before the outage, as shown in Fig. 6.13 (d). However, the VRR for all feeders are within the allowable limit. The VVAR of L1 increases to 5.5% at 2:06:42 pm; however, it stays constant at around 0.36% after 2:06:59 pm. On the other hand, the maximum VVAR for I2 and R5 are 5.1% (Fig. 6.13(b)) and 5% (Fig. 6.13(c)) at 2:06:42 pm and 2:06:43 pm, respectively. H1 experiences 10% VVAR just before the power outage. The significant changes in VDI, VRR, and VVAR can potentially indicate power outages ahead of time. Moreover, it is observed that the feeders closer to the tripped generation source experienced a much higher VDI and VVAR compared to the tolerable ranges.

54
(a)
(b)
(c)
(d) Figure 6.13. Effect of generation tripping on different voltage indices during the event for feeders: (a) L1, (b) I2, (c) R5, (d) H1.
Based on the outcomes, it can be seen that none of the feeders experiences voltage rise during the studied period for the maximum solar generation levels between 10 and 50 MW. Thus, it can be predicted that the corresponding feeders will be able to maintain the network voltage standards with the estimated levels of PV generation. This allows the network operators and utilities to plan for load growth in the corresponding feeders to maintain VDI within the ±5% limits. The performed work can enable real-time insights on voltage fluctuations for feeders where PMUs are connected and raise flags when these fluctuations are outside standard limits. For example, as can be seen in Fig. 6.11 (a), VDI for phase B exceeds the 5% limits during early morning/late night periods over the measurement interval. Such insights can be useful for network operators to implement voltage regulators or tap changing transformers more effectively.
The estimation of the voltage indices considered in this project can be integrated with the PMU data monitoring platform and allow real-time operation of the distribution network. The outcomes of this project can also assist the distribution network operators to determine the hosting capacity of the feeders. For this, a correlation analysis will be performed based on the dataset of the voltage indices. The analysis will utilise machine learning based regression models to fit the available data on the

55
voltage indices and renewable generation. Then, based on the new data on renewable generation, the developed model will predict the voltage indices for different levels of renewable generation. The model can estimate the maximum level of renewable generation integration to maintain voltage indices withing their limits. Moreover, the proposed method can identify whether a certain feeder has lower voltage deviation during maximum solar generation (for example, R1 as shown in Fig. 6.11(a)). This leads to an insight that the integration of renewables can improve the voltage profile during peak generation and promote further uptake of renewable generation.

56
7. Event Analysis with PMU Data
The developed NOJA Analytics software is a powerful tool to analyse network instability and power quality events using captured high-resolution synchronised PMU data. In this chapter, some of the key insights and findings that have obtained based on investigations across a captured critical event using PMU data are presented.
7.1 Frequency Response Analysis for a Major Network Event
The frequency response of certain RC20 devices across the network were captured during a major event, which started from 14:06:00 with the main event occurring at 14:06:31. The studied devices experienced under-frequency during the event. The analysis includes the period from when the devices started reporting under-frequency, reached a local-minima, and then stabilized. Five aspects are considered in this detailed analysis:
• Lowest under-frequency reported during the period • Deviation from the permissible lower frequency threshold • Time to reach lowest minimum under-frequency from onset • ROCOF during the lowest under-frequency • Standard deviation of ROCOF throughout the period
Generator loss event before the main event
Before the major event at 14:06:00, there were two significant events related to major generator losses, where their impact was seen throughout the network. The frequency response of one device (device X), which experienced these pre-events, is shown in Fig. 7.1.
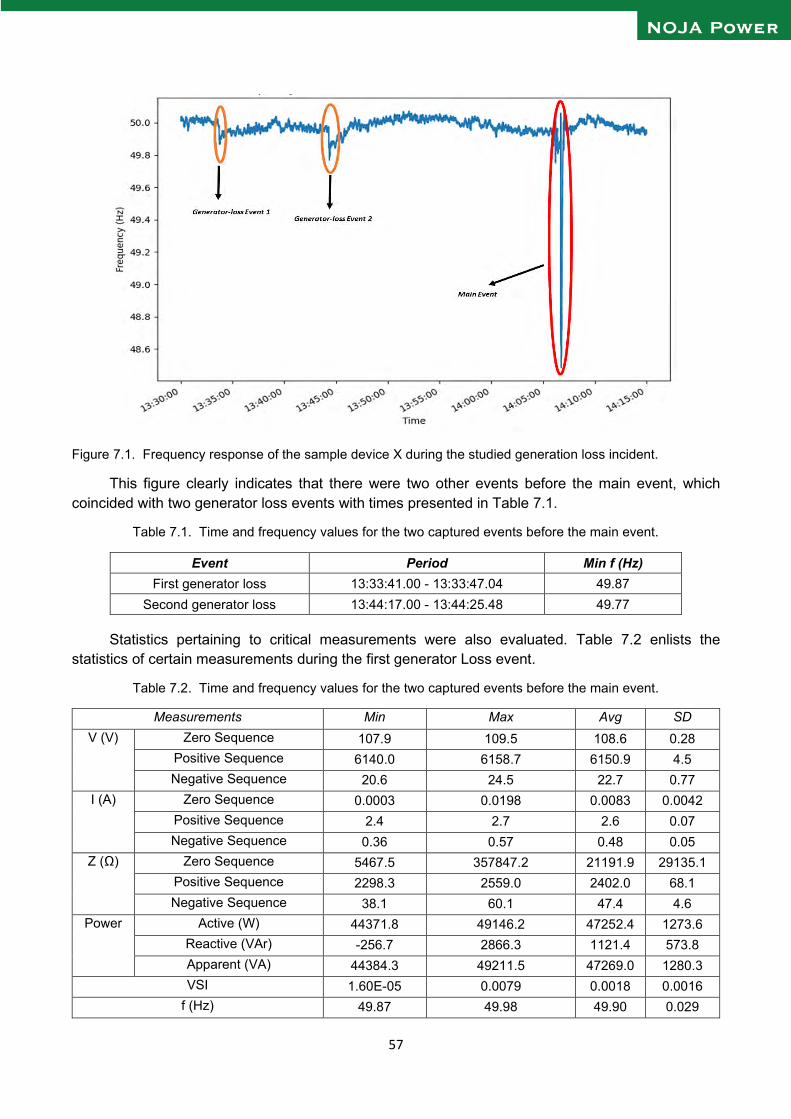
57
Figure 7.1. Frequency response of the sample device X during the studied generation loss incident.
This figure clearly indicates that there were two other events before the main event, which coincided with two generator loss events with times presented in Table 7.1.
Table 7.1. Time and frequency values for the two captured events before the main event.
Event Period Min f (Hz) First generator loss 13:33:41.00 - 13:33:47.04 49.87
Second generator loss 13:44:17.00 - 13:44:25.48 49.77
Statistics pertaining to critical measurements were also evaluated. Table 7.2 enlists the statistics of certain measurements during the first generator Loss event.
Table 7.2. Time and frequency values for the two captured events before the main event.
Measurements Min Max Avg SD V (V) Zero Sequence 107.9 109.5 108.6 0.28
Positive Sequence 6140.0 6158.7 6150.9 4.5 Negative Sequence 20.6 24.5 22.7 0.77
I (A) Zero Sequence 0.0003 0.0198 0.0083 0.0042 Positive Sequence 2.4 2.7 2.6 0.07 Negative Sequence 0.36 0.57 0.48 0.05
Z (Ω) Zero Sequence 5467.5 357847.2 21191.9 29135.1 Positive Sequence 2298.3 2559.0 2402.0 68.1 Negative Sequence 38.1 60.1 47.4 4.6
Power Active (W) 44371.8 49146.2 47252.4 1273.6 Reactive (VAr) -256.7 2866.3 1121.4 573.8 Apparent (VA) 44384.3 49211.5 47269.0 1280.3 VSI 1.60E-05 0.0079 0.0018 0.0016
f (Hz) 49.87 49.98 49.90 0.029

58
Although further analysis can be carried out on these two pre-events using high-resolution PMU data, it is outside the scope of this report. The analysis of the main event is presented as follows.
Main Event
The main event occurred during the period 14:06:31-14:06:57, with the time of under-frequency onset at 14:06:42:220. A zone-wise aggregation of frequency and ROCOF is given in Table 7.3.
Table 7.3. Zone-wise aggregation of frequency and ROCOF during the main event.
Zone Avg of the lowest f (Hz)
Avg zone-wise deviation from
49.85 Hz
Mean time to reach the lowest min
under-frequency (ms)
Avg of ROCOF at
the lowest f
Avg of ROCOF
SD
Brisbane North/Central 48.535 1.315 3073 22.13 0.978
Brisbane South 48.523 1.327 2220 24.35 1.033 Gold Coast 48.527 1.323 2220 32.75 1.189
Regional QLD 48.510 1.340 2870 34.50 1.526 Sunshine Coast 48.557 1.293 2220 28.30 1.266
On a zone-wise level, Sunshine Coast had the lowest mean deviation from 49.85Hz and North/South QLD had the highest. Moreover, the average ROCOF was the lowest at Brisbane North/Central and highest at regional QLD, which suggests that the further the distance from Brisbane central, the higher the SD of ROCOF. Finally, devices in Brisbane North/Central had the highest mean time to reach lowest minimum under-frequency from onset.
Comparison of Frequency, Current, and Voltage Responses of the Impacted Devices
In this section, the performance of three devices located near different sources of power generation including a conventional source (L), solar (S), and hydropower (H) is investigated. The goal is to study and compare the variation of frequency, current, and voltage for these three sources. The analysis includes two sections: variations during the event, and variation before the frequency dropped to its lowest under-frequency value. The frequency response for all the devices during the event is shown in Figure 7.2, where the vertical lines in all the plots indicate the time when the device reached minimum under-frequency.

59
Figure 7.2. The frequency response of the devices during the event.
It can be seen from this figure that, for each device, there are certain instances of load shedding and frequency recovery in the linear decay region before they reach the minimum under-frequency. Zooming into those regions will obtain the plots shown in Fig 7.3. The variation of phase A current during the same interval for the three devices is shown in Fig. 7.4.
Figure 7.3. The zoomed frequency response of the devices during the event.
Figure 7.4. Variation of phase A current during the event time for the three devices.

60
To better understand the variation in current across the devices, the values were normalized with respect to the mean value as presented in Fig 7.5. Moreover, variation of phase A voltages during the event time is presented in Fig. 7.6.
Figure 7.5. Variation of normalised phase A current during the event time for the three devices.
Figure 7.6. Variation of phase A voltage (L-N) during the event time for the three devices.
It can be observed that for both currents and voltages that all the devices had sudden peaks before reaching the minimum under-frequency value. Fig. 7.7 indicates the zoomed timeframe for both currents and voltages.

61
(a)
(b)
Figure 7.7. Zoomed timeframes for measured (a) currents, and (b) voltages during the captured event.
It can be inferred from these plots that, although the frequency variations are almost identical for all the devices, the solar and hydropower sites had in-rush currents during the event with two consecutive peaks in a span of almost 1.2 seconds. In the case of voltage, the overall mean for the solar device went up to 6.8 kV after the event. At the beginning of the under-frequency event, the peak was the highest for the conventional device (L) around 800 V. As can be seen from Table 7.4,

62
the Standard Deviations (SDs) for currents and voltages are higher for the solar site, indicating higher fluctuations and instability there during the event.
Table 7.4. Mean and SD values for currents and voltages during the event
Device Type Current Voltage
Mean (A) SD (A) Mean (V) SD (V)
L Conventional 20.36 0.51 6250 53.51
S Solar 46.93 1.85 6780 113.45
H Hydropower 42.58 1.04 6180 70.96
7.2 Sequence Components Analysis
To develop a more in-depth understanding of the currents and voltages during the event, the sequence components for the same timeframe are analysed in this section.
Sequence Voltages
The zero sequence voltage variations in all the three devices around the minimum under-frequency time is shown in Fig. 7.8. The zero-sequence voltage mean for the solar device is around 60 V more than the conventional and hydropower sites. There is also a significant peak in the zero-sequence voltage for the solar device just before the minimum under-frequency, which can be associated with some discharge.
Figure 7.8. Zero sequence voltage variations across three devices around the minimum under-frequency time.
The positive sequence voltage variations in all the three devices around the minimum under-frequency time is shown in Fig. 7.9. The positive sequence voltage for the conventional device stabilizes after around 5 seconds of reaching the peak. On the other hand, the solar sight device stabilizes after reaching the minimum under-frequency of almost after 15 seconds.

63
Figure 7.9. Positive sequence voltage variations across devices around minimum under-frequency time
The negative sequence voltage variations in all the three devices around the minimum under-frequency time is shown in Fig. 7.10. The negative sequence voltages for each of the devices have an initial peak for around one second. Interestingly, the peak at the solar site is around three times larger than the values for other devices.
Figure 7.10. Negative sequence voltage variations across three devices around the minimum under-frequency time.
Sequence Currents
The zero-sequence current trends for the three devices shown in Fig. 7.11 are similar to the zero-sequence voltages.

64
Figure 7.11. Zero-sequence current trends for the three devices.
The positive-sequence current trends for the devices shown in Fig. 7.12 are quite similar to the positive-sequence voltages.
Figure 7.12. Positive sequence current variation across three devices around the minimum under-frequency time.
The square pulse observed in the negative sequence currents shown in Fig. 7.13 is due to the impact of the rate of change of frequency during the initial transition period. This could reflect the difference in impedance. For the non-solar device H, we observe an inverted pulse, indicating increase in negative sequence impedance.

65
Figure 7.13. Negative sequence current variation across three devices around the minimum under-frequency time.
Sequence Impedances
No specific trend can be seen in any of the zero sequence impedance plots shown in Fig. 7.14, except the solar site impedance shows a sudden spike 1.5 seconds after reaching the minimum under-frequency.
Figure 7.14. Zero sequence impedance variation across three devices around the minimum under-frequency time.
The positive sequence impedance for all three devices exhibits dips in relation with the frequency impulses as shown in Fig. 7.15.

66
Figure 7.15. Positive sequence impedance variation across three devices around the minimum under-frequency time.
As with the negative sequence impedance components shown in Fig. 7.16, the solar device shows a higher level of average impedance compared to conventional and non-solar renewable devices. Also, the negative sequence impedance for the non-solar renewable shows a spike during the transition period.
Figure 7.16. Negative sequence impedance variation across three devices around the minimum under-frequency time.

67
7.3 Impact of a Network Event on a Device Linked with Invertors
In this section, the impact of another network event on a device X installed near invertors is analysed. Frequency, ROCOF, current, and voltage responses of the device during this event is shown in Fig. 7.17.
(a)
(b)
(c)

68
(d)
Figure 7.17. (a) frequency, (b) ROCOF, (c) current, and (d) voltage responses of device X during a voltage sag event.
From this figure, the event took place for only 150 msec, which would not have been possible to capture in lower-resolution measurement systems such as SCADA. There was a significant sharp dip in frequency at 21:20:47.40 to 49.01 Hz, which is below the threshold of 49.85 Hz. The voltage also dropped significantly below the rated value with a deviation of almost 3 kV. For other devices in the network during the event, the current also dipped along with the voltage. But in this case, a current surge can be observed, which indicates the presence of an inverter. The current peaked to almost 150 A and then dropped to zero. As can be seen from Figure 7.18, the current sharply dropped at 21:20:47 and gradually came back up at 21:55:55.
Figure 7.18. Fluctuations of the current during captured voltage sag event in device X.
7.4 Identifying Feeders Capable of Incorporating More Renewables
One of the expected outcomes of this project was to facilitate higher integration of renewable energy to the network. For that aim, feeders and locations across Energy Queensland network that have the capacity of incorporating more renewables without compromising the network stability have been identified and analysed in this project. For this analysis, the Voltage Stability Index (VSI) linked with all devices in the EQ network were evaluated. Theoretically, the devices with lower VSI are

69
considered more stable, thus, more suitable to have higher integration of renewable energy. The VSI was evaluated across a 24-hour period, when there were no events/perturbations. The calculated average VSI values for different devices based their regions are presented in Fig. 7.19.
Figure 7.19. Average VSI values for different devices based on their regions.
Figure 7.19 highlights the feeders/devices across specific regions of Energy Queensland grid which are stable in terms of VSI and have the resilience of incorporating more renewables. The analysis of overall VSI for different regions indicates that the network is more stable in areas with lower demand/population density as can be seen from Fig. 7.20.
Figure 7.20. Overall VSI values for different regions, indicating lower values (higher stability) for lower load/population density regions.
0 0.0001 0.0002 0.0003 0.0004 0.0005 0.0006
Brisbane North/Central
Brisbane South
Gold Coast
North/South QLD
Overall VSI

70
8. Future Work
The outcomes of this project show that synchrophasor technology could highly benefit the network operation related to the integration of more renewables and providing more visibility of the system operation for higher stability and controllability. This chapter summarises the further work that NOJA Power and knowledge sharing partners believe could be the future direction of PMU data applications.
Event Classification and Identification
The future work includes determining the frequency of event types for each PMU. This can help inform the operators of the types of events that occur in a locality. Future PMUs can be used in the pipeline to have more accurate identification. In the next stage, the developed frameworks can be integrated into utilities’ network monitoring system.
Asset Condition Monitoring
With more and more PMUs deployed in the power network, they can provide a new direction for asset health condition monitoring. This part of project demonstrated that the width of the SNR variation band is consistent when the transformer is in a good condition. As it takes time to make the transformer run to failure, the experiment can be continued to further study the feasibility of using the PMU data to estimate the impending failure of the transformer and reveal the relationship between the transformer impending failure and the SNR deviations. In a practical distribution network, the measured voltage and current signals could be the combination of different variations (e.g., different network faults and load variations), which will make the short-term arcing fault detection more challenging. Therefore, a more dedicated fault detection and classification approach may be needed to accurately distinguish the arcing fault. Voltage Stability and Profile
The proposed framework for obtaining real-time voltage stability index can be further modified to make it more robust and less sensitive to noises. Using this application, the Thevenin parameters and maximum loading point for different distribution buses can be calculated in real-time. Thus, it can be a useful voltage stability indicator to indicate any potential voltage collapse event in distribution networks.
To utilise the PMU data to make the grid more robust and stable with higher level of DERs, the current work can be further developed to incorporate Machine Learning models to achieve following goals.
At the future stage of this part of project, a correlation model between solar generation levels and the voltage indices will be developed. Then, the required load growth can be computed at the corresponding feeders to maintain the net active power observed by the network at a level without violating limits of the voltage indices.
Islanding Detection and Control of DER

71
Islanding is a phenomenon in which a portion of the system is islanded due to expansion of the generation into distribution network. For this detection, the rate of change of phase-angle can be monitored. The diagram shown in Fig. 8.1 indicates that the phase-angle data of RC20s associated with DERs would be extracted in real-time to identify the rate of change of phase (slip) and rate of change of slip (acceleration). Detecting the RC20s that have an increasing trend in slip and acceleration can assist with detecting the islanded part of the distribution system.
Figure 8.1. Proposed future work for islanding detection of DERs using PMU data
High resolution PMU measurements can be used to provide accurate rotor-angle estimates of synchronous generators, which are used as centralized generation units. Using the data analytics solutions, the slip and acceleration in real-time can then be monitors and triggers can be set-up when they exceed a certain threshold.
PMU-Driven measurement and Machine Learning Forecasting of Inertia
The reduction in the power system inertia due to higher DERs could leads to steep system-wide frequency fluctuations and shorter response time to contain the frequency change before it has a large-scale impact on the network. In this regard, regional distribution of inertia is important as the frequency and ROCOF could vary across the network. Thus, using synchrophasor measurements, effective inertia of areas across the power system can be extracted for real-time visualization, post analysis of events, and provide faster response to control any perturbations in the network. On top of that, machine learning driven algorithms have the potential to derive and establish relationship of influences of other state parameters and factors on the effective inertia and facilitate forecasting and sensitivity analysis.
State Estimation
As PMUs perform a direct measurement of the state vectors comprising of voltages’ magnitudes and phase angles, they can also provide significant benefits when estimating dynamic grid behaviour. The current state-of-art of NOJA Analytics enables data extraction and monitoring of state parameters such as currents and voltages. Future scope involves funnelling derived parameters such as VSI back along with other state parameters to achieve a holistic state estimation. This approach could enable an effective estimation of stability of any distributed management system.

72
Fault Location Detection and Characterization
With the added benefit of phase-angle data reported in PMUs, detecting faults has become more feasible. The phase-angle deviations across any fault duration could provide an idea about the nature of the fault and help to identify the location where the fault was triggered. This coupled with NOJA Analytics solutions, which have the capacity of evaluating sequence impedances, makes fault location detection even more accurate. Comparing the transient impedances pre- and post-faults could help with detecting the high impedance deviations and correspondingly locate the fault based on the line resistivity. Apart from detecting fault locations, the data analytics dashboards could have the ability to detect any kind of fault irrespective of its longevity.

73
References
[1] A. von Meier, E. Stewart, A. McEachern, M. Andersen, and L. Mehrmanesh, “Precision micro-synchrophasors for distribution systems: A summary of applications,” IEEE Trans. Smart Grid, vol. 8, no. 6, pp. 2926– 2936, 2017.
[2] Y. Zhou, R. Arghandeh, H. Zou, and C. J. Spanos, “Nonparametric event detection in multiple time series for power distribution networks,” IEEE Transactions on Industrial Electronics, vol. 66, pp. 1619–1628, Feb 2019.
[3] F. Yang, N. Xia, and Q. Han, “Event-based networked islanding detection for distributed solar pv generation systems,” IEEE Transactions on Industrial Informatics, vol. 13, pp. 322–329, Feb 2017.
[4] J. Barros and E. Perez, “Automatic detection and analysis of voltage events in power systems,” IEEE Transac- tions on Instrumentation and Measurement, vol. 55, pp. 1487–1493, Oct 2006.
[5] N. Save, M. Popov, A. Jongepier, and G. Rietveld, “Pmu-based power system analysis of a medium-voltage distribution grid,” CIRED - Open Access Proceedings Journal, vol. 2017, no. 1, pp. 1927–1930, 2017.
[6] Y. Seyedi, H. Karimi, and S. Grijalva, “Irregularity detection in output power of distributed energy resources using pmu data analytics in smart grids,” IEEE Trans. Industrial Informatics, vol. 15, pp. 2222–2232, April 2019.
[7] M. Farajollahi, A. Shahsavari, E. M. Stewart, and H. Mohsenian-Rad, “Locating the source of events in power distribution systems using micro-pmu data,” IEEE Trans. Power Systems, vol. 33, pp. 6343–6354, Nov 2018.
[8] D. Nguyen, R. Barella, S. A. Wallace, X. Zhao, and X. Liang, “Smart grid line event classification using super- vised learning over PMU data streams,” International Green and Sustainable Computing Conference (IGSC), Dec 2015.
[9] M. Jamil, S. K. Sharma, and R. Singh, “Fault detection and classification in electrical power transmission system using artificial neural network,” SpringerPlus, vol. 4, no. 1, p. 334, 2015.
[10] P. Gopakumar, B. Mallikajuna, M. J. B. Reddy, and D. K. Mohanta, “Remote monitoring system for real time detection and classification of transmission line faults in a power grid using PMU measurements,” Protection and Control of Modern Power Systems, vol. 3, no. 1, p. 16, 2018.
[11] Y. Zhu, C. Liu, and K. Sun, “Image embedding of PMU data for deep learning towards transient disturbance classification,” in 2018 IEEE International Conference on Energy Internet (ICEI), pp. 169–174, May 2018.
[12] I. Niazazari and H. Livani, “Disruptive event classification using PMU data in distribution networks,” in 2017 IEEE Power & Energy Society General Meeting, pp. 1–5, IEEE, 2017.
[13] D. Kim, T. Y. Chun, S. Yoon, G. Lee, and Y. Shin, “Wavelet-based event detection method using pmu data,” IEEE Transactions on Smart Grid, vol. 8, pp. 1154–1162, May 2017.
[14] M. Biswal, S. M. Brahma, and H. Cao, “Supervisory protection and automated event diagnosis using pmu data,” IEEE Transactions on Power Delivery, vol. 31, pp. 1855–1863, Aug 2016.
[15] S. Brahma, R. Kavasseri, H. Cao, N. R. Chaudhuri, T. Alexopoulos, and Y. Cui, “Real-time identification of dynamic events in power systems using PMU data, and potential applications—models, promises, and challenges,” IEEE Transactions on Power Delivery, vol. 32, pp. 294–301, Feb 2017.
[16] M. Rafferty, X. Liu, D. M. Laverty, and S. McLoone, “Real-time multiple event detection and classification using moving window pca,” IEEE Transactions on Smart Grid, vol. 7, pp. 2537–2548, Sep. 2016.
[17] M. Jamei, A. Scaglione, C. Roberts, E. Stewart, S. Peisert, C. McParland, and A. McEachern, “Anomaly detection using optimally placed µPMU sensors in distribution grids,” IEEE Transactions on Power Systems, vol. 33, pp. 3611–3623, July 2018.
[18] A. D. Allen, M. Singh, E. Muljadi, and S. Santoso, “Pmu data event detection: A user guide for power engineers,” 2014.
[19] S. J. Matthews and A. S. Leger, “Leveraging mapreduce and synchrophasors for real-time anomaly detection in the smart grid,” IEEE Transactions on Emerging Topics in Computing, vol. 7, pp. 392–403, 2017.

74
[20] D. B. Arnold, C. Roberts, O. Ardakanian, and E. M. Stewart, “Synchrophasor data analytics in distribution grids,” in 2017 IEEE Power & Energy Society Innovative Smart Grid Technologies Conference (ISGT), pp. 1– 5, IEEE, 2017.
[21] Xiaodong Liang, S. A. Wallace, and Duc Nguyen, “Rule-based data-driven analytics for wide-area fault detection using synchrophasor data,” in 2016 IEEE Industry Applications Society Annual Meeting, pp. 1–9, Oct 2016.
[22] S. S. Negi, N. Kishor, K. Uhlen, and R. Negi, “Event detection and its signal characterization in PMU data stream,” IEEE Transactions on Industrial Informatics, vol. 13, pp. 3108–3118, Dec 2017.
[23] R. Yadav, A. K. Pradhan, and I. Kamwa, “Real-time multiple event detection and classification in power system using signal energy transformations,” IEEE Transactions on Industrial Informatics, vol. 15, pp. 1521–1531, March 2019.
[24] A. Shahsavari, M. Farajollahi, E. Stewart, E. Cortez, and H. Mohsenian-Rad, “A machine learning approach to event analysis in distribution feeders using distribution synchrophasors,” in 2019 International Conference on Smart Grid Synchronized Measurements and Analytics (SGSMA), pp. 1–7, May 2019.
[25] A. Shahsavari, M. Farajollahi, E. Stewart, E. Cortez, and H. Mohsenian-Rad, “Situational awareness in distribution grid using micro-PMU data: A machine learning approach,” IEEE Transactions on Smart Grid, 2019.
[26] F. Bai, R. Yan, T. K. Saha, D. Eghbal, A new remote tap position estimation approach for open-delta step-voltage regulator in a photovoltaic integrated distribution network, IEEE Trans. on Power systems, 2018, Vol.33, Issue 4, pp.4433-4443.
[27] IEEE Guide for the Interpretation of Gases Generated in Oil-Immersed Transformers (IEEE Std C57.104-2008), New York: IEEE, 2009.
[28] M. Duval, "The Duval triangle for load tap changers, non-mineral oils and low temperature faults in transformers," IEEE Electr. Insul. Mag., vol.24, Issue 6, pp. 22-29, 2008.
[29] S. Li, Y. Nie, J. Li, Condition monitoring and diagnosis of power equipment: Review and Prospective, High Voltage, 2017, Vol.2, Issue 2, pp.82-91.
[30] M. Padhee and A. Pal, M. Rhodes, PMU-based online monitoring of critical power system assets, Presentation, May, 2018.
[31] K. Basu, M. Padhee, S. Roy, A. Pal, A. Sen, M. Rhodes, and B. Keel, Health monitoring of critical power system equipment using identifying codes, 13th International Conference on Critical Information Infrastructures Security, CRITIS 2018 - Kaunas, Lithuania, Oct. 2018
[32] Working group on power quality data analysis, Electric signatures of power equipment failures, IEEE PES Society, December 2019.
[33] M. Wei, F. Shi, H. Zhang, Z. Jin, V. Terzija, J. Zhou, H. Bao, High IMPEDANCE Arc Fault Detection based on the Harmonic Randomness and Waveform Distortion in the Distribution System, IEEE Transactions on Power Delivery, vol 35, no.2, pp: 837-850, 2020.
[34] J. De La Ree, V. Centeno, J. S. Thorp, and A. G. Phadke, “Synchronized phasor measurement applications in power systems,” IEEE Transactions on smart grid, vol. 1, no. 1, pp. 20–27, 2010.
[35] N. Ismail, A. Zin, A. Khairuddin, and S. Khokhar, “A comparison of voltage stability indices,” in 2014 IEEE 8th International Power Engineering and Optimization Conference (PEOCO2014). IEEE, 2014, pp. 30–34.
[36] S. B. Bhaladhare, A. Telang, and P. P. Bedekar, “PV QV curve: a novel approach for voltage stability analysis,” International Journal of Computer Applications R (IJCA), 2013, pp. 31–35.
[37] N. P. A. THAKUR and P. ALKA, “PV curve–approach for voltage stability analysis,” Information Technology, vol. 2012, p. 15, 2015.

75
[38] M. Furukakoi, T. Senjyu, and T. Funabashi, “Multi-objective optimal operation considering voltage stability for unit commitment,” in International Conference on Renewable Energies and Power Quality (ICREPQ’16), 2016.
[39] K. Sajan, V. Kumar, and B. Tyagi, “Genetic algorithm based support vector machine for on-line voltage stability monitoring,” International Journal of Electrical Power & Energy Systems, vol. 73, pp. 200– 208, 2015.
[40] J. M. Lim and C. L. DeMarco, “Model-free voltage stability assessments via singular value analysis of pmu data,” in IREP Symposium Bulk Power System Dynamics and Control-IX Optimization, IEEE Security and Control of the Emerging Power Grid, 2013, pp. 1–10.
[41] K. J. Makasa and G. K. Venayagamoorthy, “On-line voltage stability load index estimation based on pmu measurements,” IEEE Power and Energy Society General Meeting. IEEE, 2011, pp. 1–6.
[42] M. K. H. Pulok and M. O. Faruque, “Utilization of PMU data to evaluate the effectiveness of voltage stability boundary and indices,” in 2015 North American Power Symposium (NAPS). IEEE, 2015, pp. 1–6.
[43] P. G. Estevez, M. Elizondo, and C. Galarza, “Voltage stability assessment using synchronized phasor measurements applied to the argentine power system,” in 2018 IEEE Biennial Congress of Argentina (ARGENCON). IEEE, 2018, pp. 1–7.
[44] J. Zhao, Z. Wang, C. Chen, and G. Zhang, “Robust voltage instability predictor,” IEEE Transactions on Power Systems, vol. 32, no. 2, pp. 1578–1579, 2016.
[45] H. Yuan and F. Li, “A comparative study of measurement-based Thevenin equivalents identification methods,” in 2014 North American Power Symposium (NAPS). IEEE, 2014, pp. 1–6.
[46] H.-Y. Su and T.-Y. Liu, “Robust Thevenin equivalent parameter estimation for voltage stability assessment,” IEEE Transactions on Power Systems, vol. 33, no. 4, pp. 4637–4639, 2018.
[47] R. Amarsagar, M. Ramapuram, A. Singhal, and V. Ajjarapu, “Identifying long term voltage stability caused by distribution systems vs transmission systems,” in 2018 IEEE Power & Energy Society General Meeting (PESGM). IEEE, 2018, pp. 1–5.
[48] Q. Wang, B. Lu, X. Dou, Y. Sun, and J. Liu, “Distribution network voltage control based on coordinated optimization of PV and air-conditioning,” Int. J. Photoenergy, vol. 2018, 2018, doi: 10.1155/2018/2415289.
[49] L. Wang and Y. H. Lin, “Random fluctuations on dynamic stability of a grid-connected photovoltaic array,” in EEE Power Engineering Society Transmission and Distribution Conference, 2001, vol. 3, pp. 985–989.
[50] D. J. Lee and L. Wang, “Small-signal stability analysis of an autonomous hybrid renewable energy power generation/energy storage system part I: Time-domain simulations,” IEEE Trans. Energy Convers., vol. 23, no. 1, pp. 311–320, 2008, doi: 10.1109/TEC.2007.914309.
[51] R. Shah, N. Mithulananthan, A. Sode-Yome, and K. Y. Lee, “Impact of large-scale PV penetration on power system oscillatory stability,” IEEE PES Gen. Meet. PES 2010, pp. 1–7, 2010, doi: 10.1109/PES.2010.5589660.
[52] M. E. Baran, H. Hooshyar, Z. Shen, and A. Huang, “Accommodating high PV penetration on distribution feeders,” IEEE Trans. Smart Grid, vol. 3, no. 2, pp. 1039–1046, 2012, doi: 10.1109/TSG.2012.2190759.
[53] M. Farhoodnea, A. Mohamed, H. Shareef, and H. Zayandehroodi, “Power quality impact of grid-connected photovoltaic generation system in distribution networks,” SCOReD 2012 IEEE Student Conf. Res. Dev., 2012.
[54] Y. Wang, P. Zhang, W. Li, W. Xiao, and A. Abdollahi, “Online overvoltage prevention control of photovoltaic generators in microgrids,” IEEE Trans. Smart Grid, vol. 3, no. 4, pp. 2071–2078, 2012.
[55] R. Seguin, J. Woyak, D. Costyk, J. Hambrick, and B. Mather, “High-Penetration PV Integration Handbook for Distribution Engineers,” NREL - Natl. Renew. Energy Lab., pp. 1–109, 2016, [Online]. Available: www.nrel.gov/publications.
[56] G. Fernández et al., “Photovoltaic generation impact analysis in low voltage distribution grids,” Energies, vol. 13, no. 17, 2020, doi: 10.3390/en13174347.

76
[57] R. Passey, T. Spooner, I. MacGill, M. Watt, and K. Syngellakis, “The potential impacts of grid-connected distributed generation and how to address them: A review of technical and non-technical factors,” Energy Policy, vol. 39, no. 10, pp. 6280–6290, 2011.
[58] A. Mills et al., “Dark shadows: Understanding variability and uncertainty of photovoltaics for integration with the electric power system,” IEEE Power Energy Mag., vol. 9, no. 3, pp. 33–41, 2011.
[59] S. Chattopadhyay, M. Mitra, and S. Sengupta, Electric Power Quality. 2015.
[60] G. Simpson, “Network operators and the transition to decentralised electricity: An Australian socio-technical case study,” Energy Policy, vol. 110, no. October 2016, pp. 422–433, 2017, doi: 10.1016/j.enpol.2017.08.042.
[61] A. Von Jouanne and B. Banerjee, “Assessment of voltage unbalance,” IEEE Trans. Power Deliv., vol. 16, no. 4, pp. 782–790, 2001, doi: 10.1109/61.956770.
[62] Z. Liu and J. V. Milanović, “Probabilistic Estimation of Voltage Unbalance in MV Distribution Networks With Unbalanced Load,” IEEE Trans. Power Deliv., vol. 30, no. 2, pp. 693–703, 2015.
[63] A. Kharrazi, V. Sreeram, and Y. Mishra, “Assessment techniques of the impact of grid-tied rooftop photovoltaic generation on the power quality of low voltage distribution network - A review,” Renew. Sustain. Energy Rev., vol. 120, no. November 2019, p. 109643, 2020, doi: 10.1016/j.rser.2019.109643.
[64] D. Kumar, P. Davari, F. Zare, and F. Blaabjerg, “Analysis of three-phase rectifier systems with controlled DC-link current under unbalanced grids,” in Conference Proceedings - IEEE Applied Power Electronics Conference and Exposition - APEC, 2017, pp. 2179–2186.
[65] IEEE Standard for High-Voltage Testing Techniques, IEEE 4-2013, IEEE Power and Energy Society, Sponsored by the Power System Instrumentation and Measurements Committee.
[66] W. Chen, Y. Yun, M. Wen, H. Lu, Z. Zhang, Y. Liang, Representative subset selection and outlier detection via isolation forest, Analytical Method, 2016, 8, 7225.
[67] J. Lavenius, L. Vanfretti, and G. N. Taranto, “Performance assessment of pmu-based estimation methods of Thevenin equivalents for real-time voltage stability monitoring,” in 2015 IEEE 15th International Conference on Environment and Electrical Engineering (EEEIC). IEEE, 2015, pp. 1977–1982.
[68] Z. A. Kamaruzzaman and A. Mohamed, “Impact of grid-connected photovoltaic generator using pv curve and improved voltage stability index,” in IEEE International Conference on Power and Energy (PECon) 2014.
[69] M. Aldeen, S. Saha, and T. Alpcan, “Voltage stability margins and risk assessment in smart power grids,” IFAC Proceedings Volumes, vol. 47, no. 3, pp. 8188–8195, 2014.
[70] M. J. E. Alam, K. M. Muttaqi, and D. Sutanto, “An approach for online assessment of rooftop solar PV impacts on low-voltage distribution networks,” IEEE Trans. Sustain. Energy, vol. 5, no. 2, pp. 663–672, 2014.
[71] E. and E. Energy, “Standard for Network Performance.”
[72] IEEE Std 1159, IEEE Recommended Practice for Monitoring Electric Power Quality, vol. 2019. 2019.
[73] L. Fan, Z. Miao, and A. Domijan, “Impact of unbalanced grid conditions on PV systems,” IEEE PES Gen. Meet. PES 2010, pp. 7–12, 2010, doi: 10.1109/PES.2010.5589695.
[74] R. Shigenobu, A. Nakadomari, Y. Y. Hong, P. Mandal, H. Takahashi, and T. Senjyu, “Optimization of voltage unbalance compensation by smart inverter,” Energies, vol. 13, no. 18, pp. 1–22, 2020.
[75] W. Qin, P. Wang, X. Han, and F. Meng, “Risk analysis of power systems for both real and reactive power,” J. Mod. Power Syst. Clean Energy, vol. 1, no. 2, pp. 150–158, 2013, doi: 10.1007/s40565-013-0016-0.
[76] A. A. Tamimi, A. Pahwa, and S. Starrett, “Effective wind farm sizing method for weak power systems using critical modes of voltage instability,” IEEE Trans. Power Syst., vol. 27, no. 3, pp. 1610–1617, 2012.
[77] R. Yan and T. K. Saha, “Investigation of voltage stability for residential customers due to high photovoltaic penetrations,” IEEE Trans. Power Syst., vol. 27, no. 2, pp. 651–662, 2012, doi: 10.1109/TPWRS.2011.2180741.