nnr in rapidly rotated metals by
TRANSCRIPT
NNR IN RAPIDLY ROTATED METALS
By
R. S. TIFFEN, B. Sc.
Thesis Submitted to the University of Nottingham for the Degree of Doctor of Philosophy
MAY 1975
'Let them loiter in pleasure or toiZfuZZy spin'
from 'The Old Sexton'
by Park Benjamin (1809-1864)
ACKNOWLEDGEMENTS
I wish to express my thanks to:
Professor E. R. Andrew for providing me with both the
opportunity and the facilities to undertake this work:
also his guidance throughout.
Dr. Waldo S. Hinshaw and Dr. James L. Carolan for much
practical help and many useful discussions.
Mr. Tony Tatlow for'manufacturing the rotors, and for
his assistance in trying out the many variations of
design.
The Government of the United States of America who
through one of their divisions provided me with a
grant.
t****
ABSTRACT
Although this thesis is concerned solely with nuclear magnetic
resonance, it may be divided into two parts. One part deals with
a series of measurements on the NMR parameters of several pure metal
powders, namely aluminium, cadmium, niobium and vanadium, and in
particular the effect on their resonance spectra of rapid macro-
scopic sample rotation at the 'magic angle'. The other part
relates measurements of spin-lattice relaxation time as a function
of temperature for the three solid cuprous halides.
By spinning at high speeds a significant narrowing of the
resonance lineshape has been achieved in the case of cadium and
aluminium. This has enabled precise determinations of their iso-
tropic Knight shifts to be made. For cadmium the width of the
residual symmetric central spectrum has been used to obtain an
estimate of the magnitude of the indirect electron coupled exchange
interaction. Complete narrowing of the aluminium resonance line
requires rotation rates in excess of 8 kHz. To this end it has
been necessary to develop a new rotor system capable of carrying
small metal samples at extremely high spinning rates. In connect-
ion with the work on aluminium, pure powder specimens have been
prepared which exhibit values of second moment and dipolar relax-
ation time that agree well with theory. This is in contradiction
to the results obtained from filed powders and those recorded by
all other workers.
Below room temperature the form of the T1 results obtained from the cuprous halides is in accord with the theory of Raman
quadrupole relaxation. However theoretical T1 values, as derived
from the simple Raman two-phonon mechanism in an ionic crystal
lattice, fail to give quantitative agreement with experiment.
CONTENTS
Page
CHAPTER 1. INTRODUCTION TO THE NMR TECHNIQUE
1.1 Basic Theory 1
1.2 Spin-Spin and Spin-Lattice Relaxation Times 4
1.3 Comparison between PNMR and CWNMR Methods 6
CHAPTER 2. SPIN-SPIN AND SPIN-LATTICE INTERACTIONS
2.1 Introduction 8
2.2 Secular Interactions 9
2.2.1 Dipolar Interaction 9
2.2.2 The Quadrupole Interaction 11
2.2.3 Frequency Shift Mechanisms 13
(a) - Chemical Shifts 13
(b) Knight Shifts 14
2.2.4 Indirect Spin-Spin Coupling 17
(a) Non-Metals 17
(b) Metals 18
2.2.5 Method of Moments 20
2.3 Non-Secular Interactions 22
2.3.1 Introduction 22
2.3.2 Dipole-Dipole Relaxation 22
2.3.3 Impurity Relaxation 22
2.3.4 Interaction with Conduction Electrons 23
2.3.5 Quadrupole Relaxation 26
(i) Single Phonon 27
(ii) Four Phonon 27
(iii) Two Phonon (Raman) 27
CHAPTER 3. NARROWING THE NUCLEAR RESONANCE SPECTRUM BY MACROSCOPIC ROTATION
3.1 Introduction 31
3.2 Isotropic Motion 32
3.3 The Dipolar Interaction 34
3.4 The Quadrupole Interaction 36
3.5 Frequency-Shift Mechanisms 37
3.6 Indirect Spin-Spin Interaction 38
3.7 The Effect of Rotation on the Nuclear Lineshape 40
CHAPTER 4. EXPERIMENTAL ROTATION SYSTEMS
4.1 Introduction 43
4.2 Aspects of Rotor Design 44
4.2.1 Materials 44
4.2.2 Size 44
4.2.3 Stresses 45
4.2.4 The Problem of Whirl and Rotor Balance 45
4.2.5 The Driving Jets 46
4.3 The Conical Rotor System 47
4.3.1 Description 47
4.3.2 Experimental Details 48 4.3.3 Rotor Materials 49
4.4 The Foil Bearing Rotor System 50
4.4.1 Introduction 50
4.4.2 The Rotor 51
4.4.3 The Supporting Rig 53
4.4.4 Comments 55
4.5 Other Turbine Systems 56
4.5.1 The Axle Supported Rotor 56
4.5.2 The Prague Rotor System 56
CHAPTER 5. EXPERIMENTAL PROCEDURE
5.1 Equipment 58
5.2 Modification of the Spectrometer Pulse Programmer 59
5.3 Variable Temperature Measurements 60
5.4 The Probe Heads 61
5.4.1 The Design of the Tuned Circuits 61
5.4.2 The Mechanical Construction 62
5.5 Knight Shift Measurements 63
5.6 Fourier Transform Procedures 65
5.7 Fitting the Dead-Time Points 67
5.7.1 The Solid-Echo Pulse Sequence 68
5.7.2 The Jeener and Brockaert 'Zero Time' Sequence 68
5.8 Measurements of Relaxation Times 69
5.8.1 Spin-Lattice Relaxation Time (Tl) 69 5.8.2 Dipolar Relaxation Time (T10) 70
5.9 Sample Preparation 71
5.9.1 Cuprous Halides 71
5.9.2 Metals 71
CHAPTER 6. MEASUREMENTS OF THE SPIN-LATTICE RELAXATION TIMES IN THE CUPROUS HALIDES
6.1 Introduction 75
6.2 Results and Discussion 76
CHAPTER 7. EXPERIMENTAL RESULTS ON ALUMINIUM METAL
7.1 Introduction to the Measurements Undertaken 86
7.2 The Accurate Determination of the Aluminium Knight Shift 87
7.2.1 Introduction 87
7.2.2 Measurements 88
7.2.3 Possible Factors Influencing the Experimental Knight Shift Value 90
(a) Temperature 90
(b) Pressure 91
(c) Bulk Susceptibility Effects 92
(d) Other Effects 93
7.3 Record ed Lineshapes and Second Moment Values 94
7.3.1 Introduction 94
7.3.2 Measurements 94 7.3.3 Discussion 98
7.4 Variation of Lineshape with Rotation Speed 100
7.4.1 Introduction 100
7.4.2 Measurements 101
7.5 Determination of Relaxation Times 102
7.5.1 Spin-Lattice Relaxation Time (Tiz) 102
-7.5.2 Dipolar Relaxation Time (T1D) 103
7.5.3 Variation in 'TID' with Rotation Speed 105
CHAPTER 8. MEASUREMENTS ON VANADIUM, NIOBIUM AND CADMIUM METALS
8.1 Introduction 106
8.2 Vanadium 107
8.3 Niobium 110
8.4 Cadmium 112
8.4.1 Introduction to the Measurements 112
8.4.2 Knight Shift Determinations 113
8.4.3 Spin-Lattice Relaxation Times 115
8.4.4 Variation of Lineshape with Rotation Speed 116
REFERENCES 121
*****
-i-
CHAPTER 1
INTRODUCTION TO THE NMR TECHNIQUE
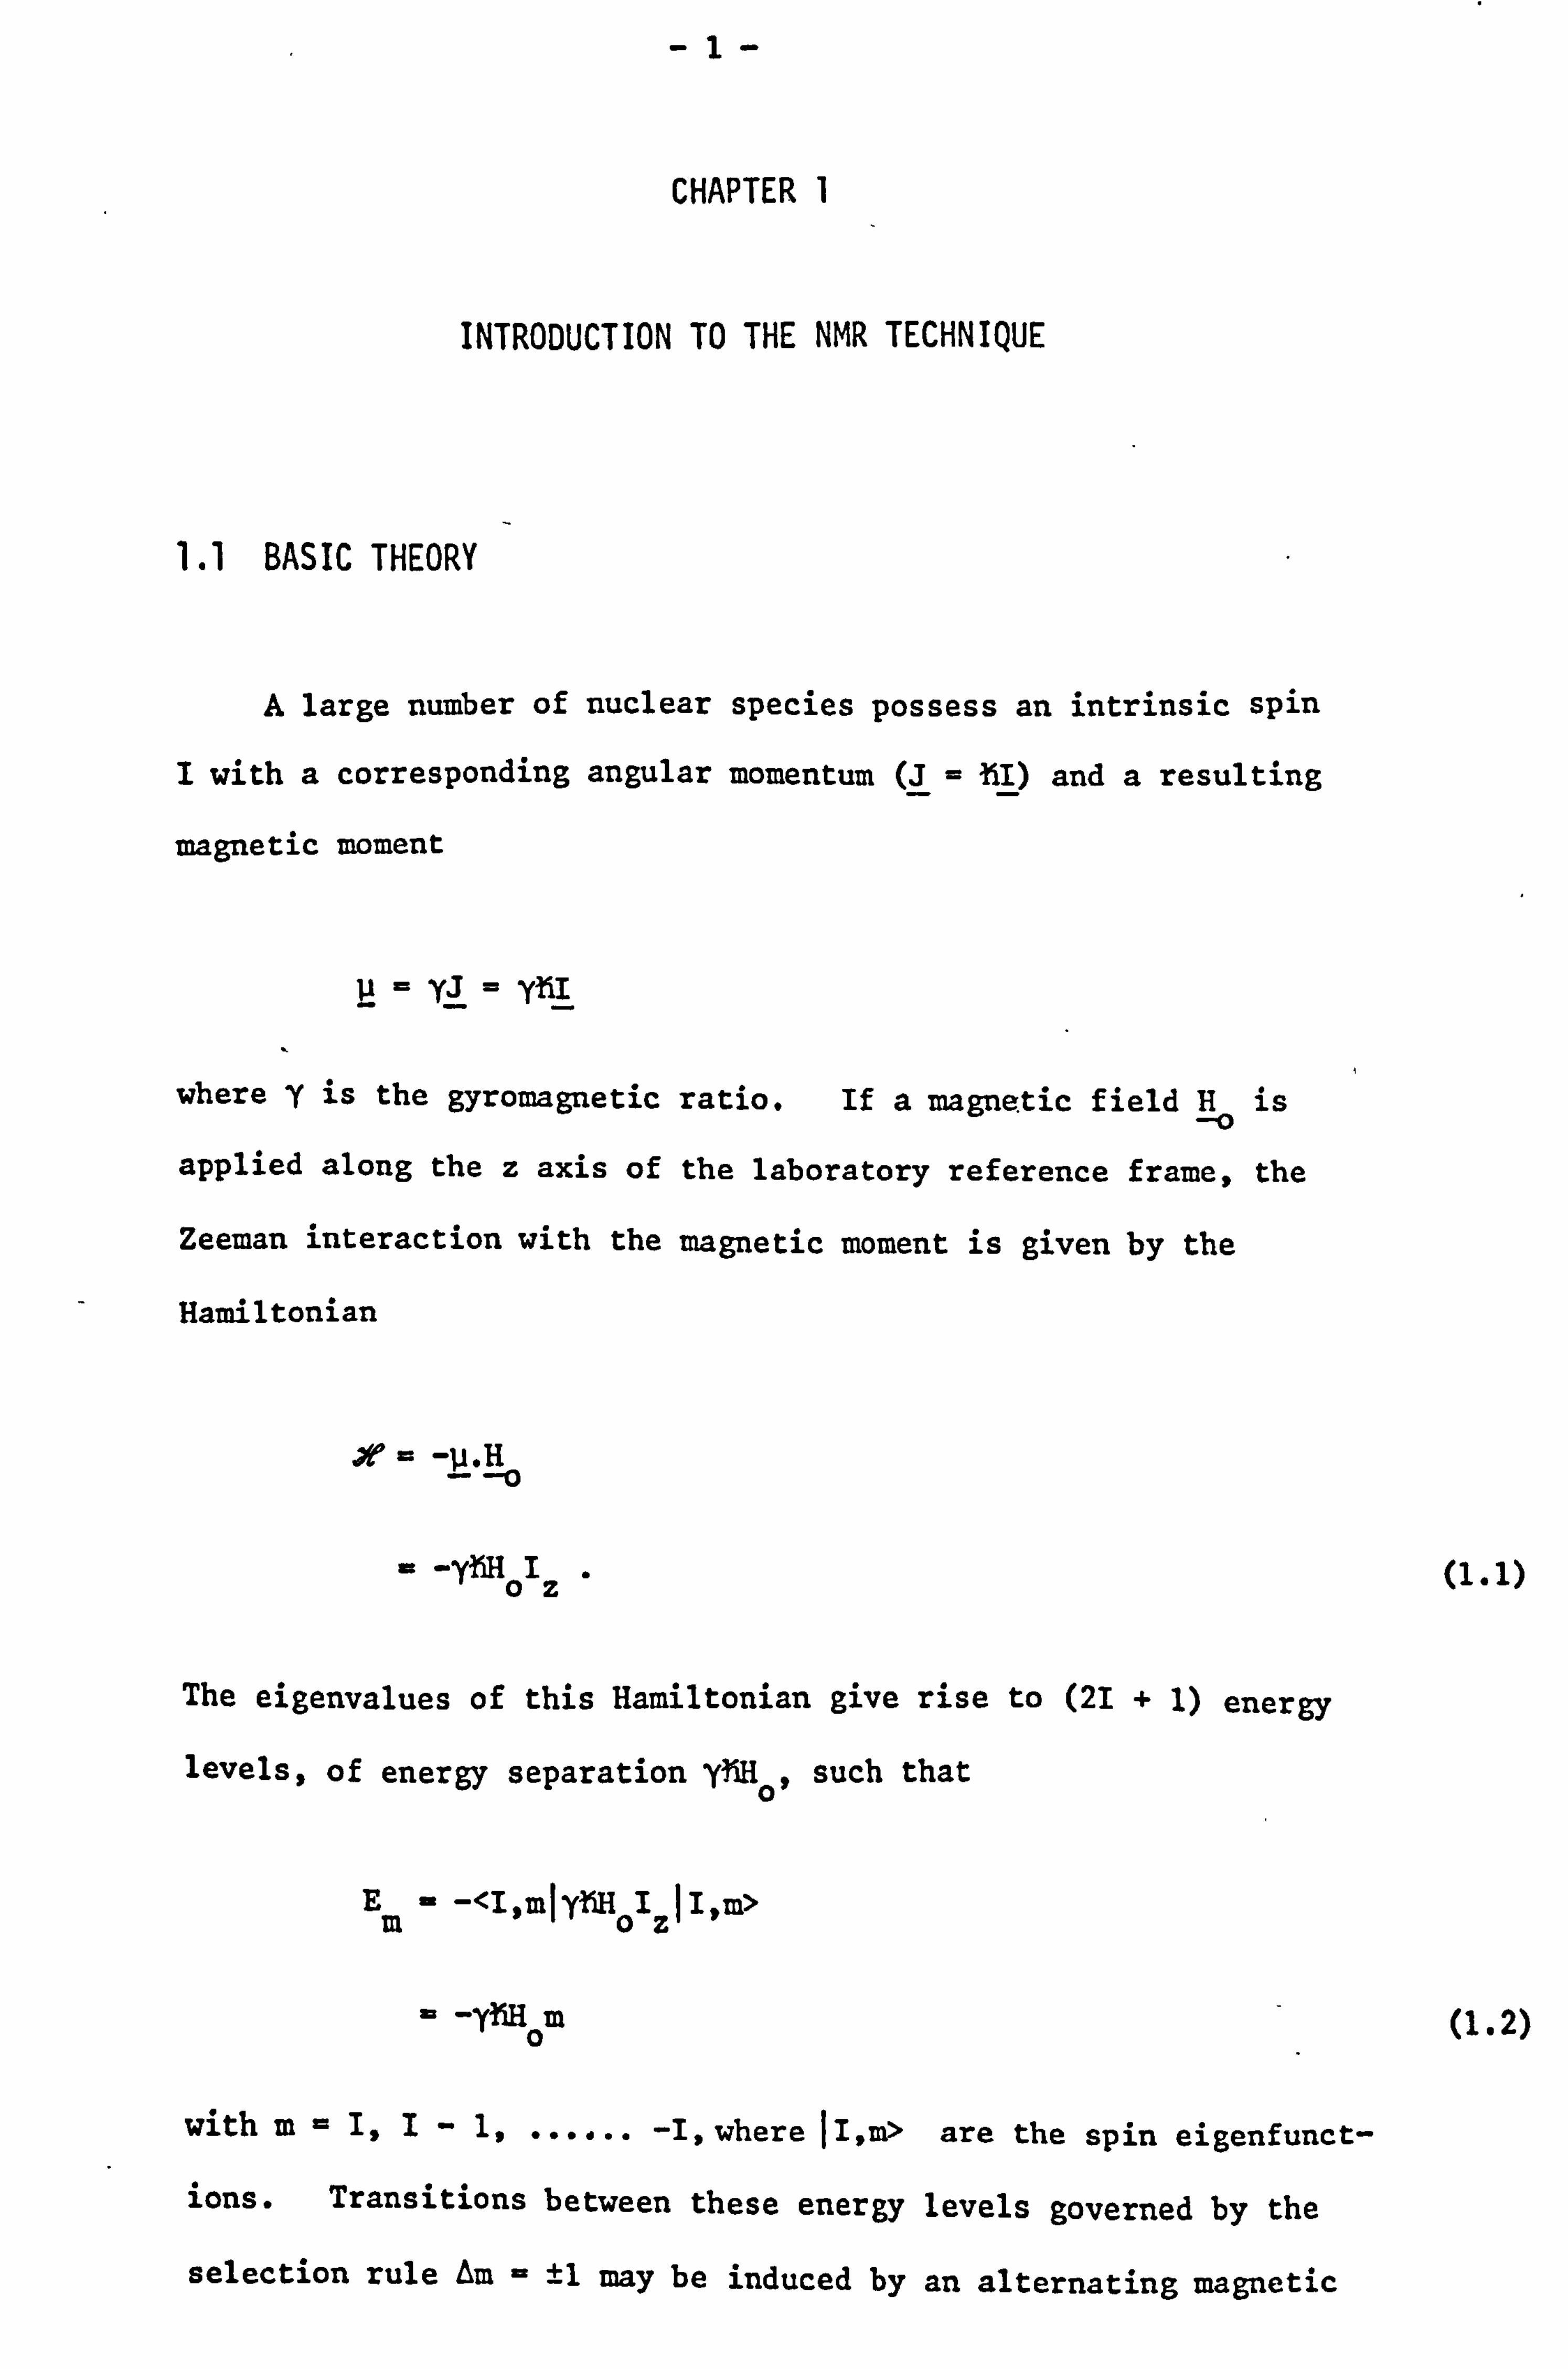
1.1 BASIC THEORY
A large number of nuclear species possess an intrinsic spin
I with a corresponding angular momentum (J = YI) and a resulting
magnetic moment
u=yJ=y1I
where y is the gyromagnetic ratio. If a magnetic field H0 is
applied along the z axis of the laboratory reference frame, the
Zeeman interaction with the magnetic moment is given by the
Hamiltonian
,W_ 'u " Ao
a -YbjH 01 z
The eigenvalues of this Hamiltonian give rise to (21 + 1) energy
levels, of energy separation Yiüio, such that
Em _ -<I, mly1'H 1li, m> z
° _Y11HOm
with m = I, I-1, ...... -I, where I I, m> are the spin eigenfunct-
ions. Transitions between these energy levels governed by the
(1.1)
(1.2)
selection rule Am a ±1 may be induced by an alternating magnetic
-2-
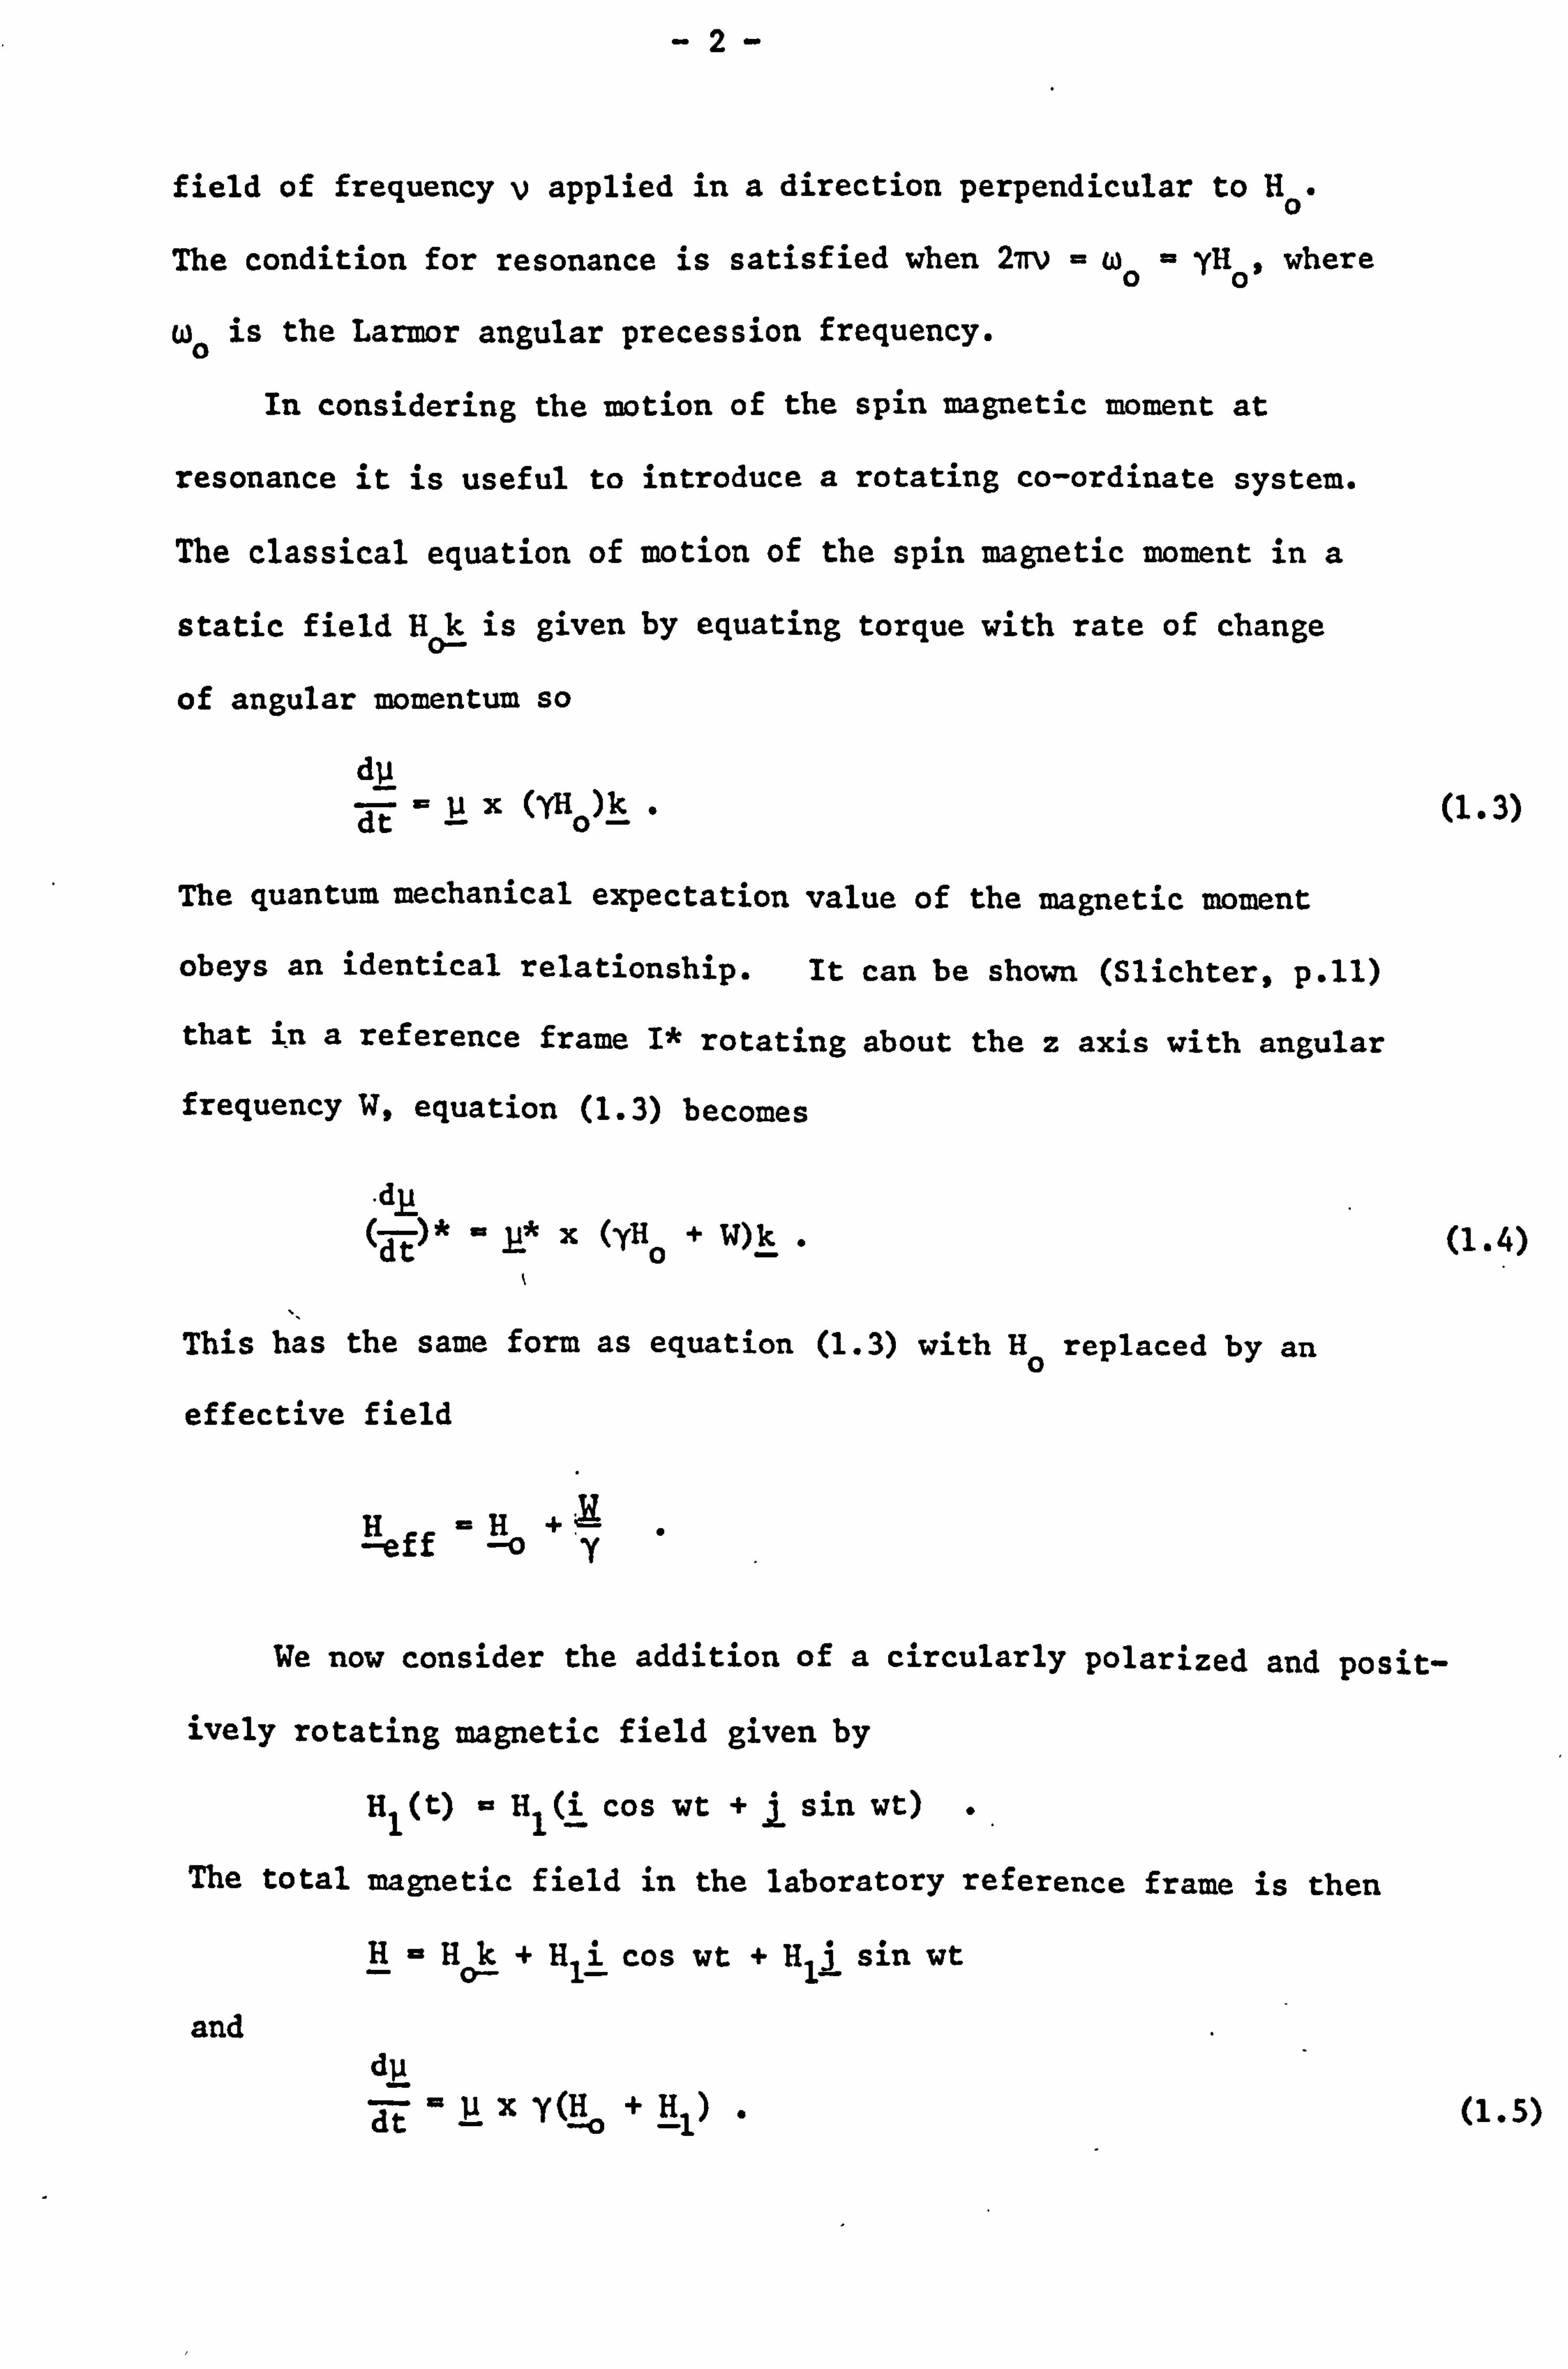
field of frequency v applied in a direction perpendicular to Ho.
The condition for resonance is satisfied when 2'rtv = wo - yHo, where
wo is the Larmor angular precession frequency.
In considering the motion of the spin magnetic moment at
resonance it is useful to introduce a rotating co-ordinate system.
The classical equation of motion of the spin magnetic moment in a
static field Ho- is given by equating torque with rate of change
of angular momentum so
di dt= ix(YH))k.
The quantum mechanical expectation value of the magnetic moment
obeys an identical relationship. It can be shown (Slichter, p. 11)
that in a reference frame I* rotating about the z axis with angular
frequency W, equation (1.3) becomes
. dot (Tt)*ýýýtx(yll +W)k
This has the same form as equation (1.3) with Ho replaced by an
effective field
eff 0 HH +'
(1.3)
(1.4)
We now consider the addition of a circularly polarized and posit-
ively rotating magnetic field given by
H1(t) - Hl(i cos wt +j sin wt) .
The total magnetic field in the laboratory reference frame is then
H= Hak + Hli cos wt + H1j sin wt
and di ät uxY(H+Hl) (1.5)
-3-
Transforming to the rotating frame such that W= +w both H0 and
H1 will be static. With the choice of the i* axis of the rotating
frame to lie along H1 equation (1.3) becomes
au (ýt)* = u* X y[(Ho + Y)k
+ Hli*]
and
Heff (H0 + Yak + Hli*
Thus, in the rotating frame, p precesses in a cone about Heff with
angular frequency YHeff' and at a fixed angle 0 to the z axis where
o tan l H1
H0 1
At resonance w= -yH0 so Heff =H1 and p* will precess about H1
with 6= ¶/2. Assuming that at t=0p lies along the k axis,
then if H1 is applied as a pulse at the resonance frequency for a
time duration dT the angle through which the magnetic moment nutates
is given by
ý- YH1S&r .
The rf pulse may then be defined by this angle.
Providing. the system of spins is non-interacting the above
equations are equally applicable to the expectation value of the
macroscopic total magnetic moment M.
In the experimental situation an alternating rf voltage
V cos Wt is applied to a coil wound around the sample with its axis
perpendicular to Ho. A linearly polarized magnetic field is prod-
(1.6)
(1.7)
(1.8)
(1.9)
uced which is equivalent to two counter rotating components of
-4-
equal amplitude H1. While the component rotating in the opposite
direction to the Larmor precession may be ignored (Abragam p. 21)
the other component fulfils the role of the perturbing H1 field
described above. In continuous wave NMR (CWNMR) the perturbat-
ion is applied continuously and at resonance will upset the
Boltzmann energy distribution of the nuclear spins by transfer-
ring energy to the spin system. By keeping the magnitude of Hl
low, the system remains close to thermal equilibrium. The absorpt-
ion of energy by the spin system can then be measured as either
Ho or the driving frequency V is swept slowly through the resonance
condition. In pulsed NMR (PNMR) a short, intense pulse of reson-
ant rf voltage is applied to the coil causing the magnetic moment
to precess about Hl in the rotating frame. After the pulse is
switched off the spin system returns to equilibrium at a rate
determined by the interaction of the spins with the lattice and
each other. It is with the PNMR method that we are primarily
concerned here.
1.2 SPIN-SPIN AND SPIN-LATTICE RELAXATION TIMES
We now introduce the phenomenological equation of motion for
the macroscopic magnetic moment first proposed by Bloch(l). In
this equation the return to equilibrium is defined by two separate
relaxation times so
dM Mx + Myj (Mý - 11)
dt ýYMxH -T-T° 21
Tl is the spin-lattice relaxation time describing the rate at which
(1.10)
the nuclear spin system approaches thermal equilibrium with the
-5-
lattice and T2 is the spin-spin relaxation time describing the
decay of any transverse magnetization. Bloch's equation predicts
a Lorentzian lineshape function
f (c)) aT21 1+ w2 T2
which usually provides a good approximation of the experimental
lineshape obtained from liquid samples. Implicit in equation (1.10)
is the assumption that both the transverse and longitudinal magnet-
izations decay exponentially. Although the decay of transverse
magnetization in solids does not usually obey such a relationship,
the two relaxation processes introduced in equation (1.10) are
generally valid. The absorption lineshapes obtained from solids
can often be represented satisfactorily by a Gaussian-shape funct-
ion
fýý) 1e W2/2A2 . 2. i
where A is the half-width between points of maximum slope of f(W)
and 1/0�2ir is a normalizing factor.
At this point we consider the development of the nuclear
magnetization in the rotating frame following a 900 rf pulse
applied along the x* axis. Immediately after the pulse the
nuclear magnetization will lie along the y* axis. In solids the
spins experience finite local internal magnetic fields (described
in detail in the next chapter) which give rise to a spread of - precession frequencies about wo As a result the spins begin
to fan out about y* in thex-y plane, and the transverse magnet- ization decays with a characteristic time T2. Any mechanism
-6-
leading to a loss of transverse magnetization will contribute to
T2. This includes the effect of a non-uniform external magnetic
field across the sample as well as processes governing the return
of the nuclear magnetization to thermal equilibrium - along the
z axis - with time constant T1.
1.3 COMPARISON BETWEEN PNMR AND CWNMR METHODS
In PNMR, following the rf pulse the voltage induced in the
receiver coil by the rotating magnetic moment may be observed
using phase coherent detection.
the free induction decay (FID).
The resulting signal is termed
When the rf reference applied
to the detector is equivalent to wo, the detected signal Vd(t)
can be set to trace out the decay of M* directly. Hence, at y
any point in time T
Vd(T) a M* (T) = cos W'TS NA(T)
W'
where W=w- wo andS ., is the number of spins per unit volume
with frequency between ü' and &' + dw.
With perfect instrumentation and negligible saturation the
absorption spectrum obtained from the CWN'I`R method is a direct
measure of the distribution of precession frequencies present in
the sample. Writing the normalized lineshape function as f(w')
it follows that in the rotating frame the fraction of spins with
angular precession frequency between W' and w' + SW is given by
f(w')dw. Therefore
(1.11)
5Nw, f (wl )acs
-7-
and
Vd(t) f(w1)cos w't dw Sao
- G(t) .
If the nuclear lineshape is symmetric about w' -0, G(t) may be
rewritten in the form
(1.12)
G (t) 27r 1f (v')exp(-27riv'#)dv (1.13)
where v' a W'/21T. Hence, we have shown that the observed FID is
equivalent to the Fourier transform of the absorption lineshape.
It follows that the lineshape may be defined by the inverse Fourier
transform of the FID.
In the case where f(w') is asymmetric the lineshape is obtained
by including the two components of the transverse decay, along the
x* and y* axes, in the complex Fourier transform (2)
f(w') 1 M* cos w't + M* sin w't dt .. co
A similar result is achieved by shifting the detection frequency
by a value a (greater than the linewidth) away from wo, and record-
ing the decay component MM(t). It is then only necessary to
define the phase of My(t) in order to obtain the asymmetric spectrum
from a symmetric transform about a.
-8-
CHAPTER 2
SPIN-SPIN AND SPIN-LATTICE INTERACTIONS
2.1 INTRODUCTION
For an assembly of nuclear spins the (21 + 1) discrete energy
levels described by the eigenvalues of the Zeeman Hamiltonian are
broadened by internal interactions. The complete Hamiltonian can
be written as
nt
''int may consist of several different terms but, providing quadrupole
effects are not large, it-is generally considered as a perturbation
of the Zeeman Hamiltonian. If nt contains diagonal matrix
elements between the Zeeman eigenstates it results in shifts and/
or broadening of the nuclear levels with a corresponding structure
and broadening of the resonance spectrum. These secular terms
commute with 0. Z. The off-diagonal matrix elements of Y nt connect
states of different eigenvalue m and hence give rise to transit-
ions between energy levels. In this way the non-secular terms
are responsible for the relaxation of the spin system to the temp-
erature of the lattice.
There are four main secular components of meint' Hence the
spin Hamiltonian may be written as
Z+ ýL°D -+ Q+, S+ rJ
-9-
where the terms represent the Zeeman, dipolar, quadrupole frequency
(chemical and Knight) shift and the indirect exchange interactions
respectively. We now describe the spin-spin interactions briefly
in turn.
2.2 SECULAR INTERACTIONS
2.2.1 DIPOLAR INTERACTION
From the classical energy of interaction between dipole moments
the dipolar Hamiltonian over N spins can be written as .
I.. r. aNi
iii -
3(Ii. rij_j _lj YD
3i Ij 21
(2.1)
i<j r1. rij
where the summation is performed once over each pair of spins and
rid is the position vector between spins I. and I3. Rewriting
this expression in terms of spherical co-ordinates we get
N 3 [A+B +C +C +D +D] r.. i<j iý.
where
A ffi I. ZIjZ(1 -3 cos2O)
Ba -}ýIiIj + IiIý](1 -3 cos20)
ý+ 2tlii. + 1. IýJsin 6 cos 0 e+iý jz 2. Z
D -li Ij singe e+2iß and
I+ W IX ±LIy
- 10 -
Term A represents the effect of the static local field prod-
uced at spin Ii by I3 . From a classical viewpoint, term B can
be considered as arising from the rotating component of the local
field. For identical nuclei it connects states of zero total
spin, i. e. t(mi + m3 )=0, causing mutual spin flips between energy
levels. In this way the lifetime of a spin state is limited and
both terms will contribute to the width of the resonance line.
Whereas term A is always secular, term B is only secular between
like nuclei.
Terms C and D are non-secular. C gives rise to single spin
flips A(mi + mi )= ±1 and D flips pairs of spins simultaneously
A(mi + mi )= ±2.
To first order the non-secular terms of XD will only contrib-
ute indirectly to the resonance linewidth by limiting the life-
time of the energy states. The second order effect is an admix-
ing of spin states resulting in second order energy shifts and
permitting otherwise forbidden transitions between states. Weak
satellite lines are produced in this manner at multiples of the
resonance frequency, but these are normally disregarded. The
truncated Hamiltonian which neglects the non-secular interactions
is given by
N YiY- 22 j3 ti I . Ij - 31.1. ] (3 cos 6- 1) .
i<j r13
The dipolar Hamiltonian may be represented as the tensor inter-
action
N Y. - iyjt2
3 1iiJJ .<r j ij
(2.2)
(2.3)
- 11 -
If rii = nrij = (Xli + X2j + X3k) where X1X2X3 are direction
cosines, then
1-3X
Dia = -3X1X2
-3X 1a3
-3X1a2 -3X1X3
1-3X2 -3X2X3
-3X2X3 1-3X3
Since Xi + X2 + X3 = land D2, m = DMZ the tensor is traceless and
symmetric.
Similarly the truncated dipolar interaction may be represented
by the traceless symmetric tensor
100 J
Di O10 (3 cos20 - 1) d
00 -2
2.2.2 THE QUADRUPOLE INTERACTION
Nuclei with spin greater than I possess an electric quadrupole
moment and therefore interact with electric field gradients produced
by the surrounding charge distribution. Following the approach
of Cohen and Reif (3)
this interaction may be written in the form
of a product of two second rank symmetric tensors so
12v q=I
(8a&ß)r=O Qaß
a, ß
eQ 2
6I(2I- 1) ýa
ß)r=0l2(IaIß + Ißla) - 6aß1(1 + 1)]
a, ß
where V(r)r_O is the crystalline electrostatic potential at the
nucleus, aß refers to any pair of cartesian axes and Q is the
(2.4)
quadrupole moment.
- 12 -
The tensor ä2V/8a2ß (now written as Vaß) representing the
electric field gradient is diagonalized in its principal reference
frame (i, j, k). From Laplace's equation I Vii = 0, so the tensor
is also traceless. In a position of cubic symmetry Vii = Vjj = Vkk
and the quadrupole interaction therefore vanishes. Generally the
principal axes are chosen so that, IVkkI > IVjj 1.1 IViij, and an
asymmetry parameter n and field gradient q are defined so
V.. - V. ii ýj eq - Vkk nc Vkk
The quadrupole Hamiltonian then becomes
e2gQ 2 1(1 + 1) + n(I? Q 4I(2I- 1)
13I zi3
If the electric field gradients arise from defects in an other-
wise cubic lattice structure the quadrupole interaction can be
treated as a perturbation of the Zeeman Hamiltonian. Assuming
axial symmetry (Vii Vand that the angle between the external
field H0 and the k axis is 0, the eigenvalues of the Hamiltonian
. X° = at°Z + . al°Q are given by
_ I(I + 1)ý . -.! 1 2 00 Em a Y5olz + 41(21 - 1)(3
cos28 - 1)13M2
As the energy levels m=t are shifted equally the centre of gravity
of the resonance line is unaffected. The 21 satellite lines occur
at frequencies
(2.5)
(2.6)
V }vgl uo + 3e2
(8(12- i) (3 cos26 - 1) ..
- 13 -
In powdered samples a weak interaction of this form usually
results in an increase in the linewidth and an enhancement of the
wings of the absorption lineshape(4). In cases where the quad-
rupole interaction is large it can no longer be considered as a
perturbation of.; r , and the central ;- transition is also z
shifted.
2.2.3 FREQUENCY SHIFT MECHANISMS
(a) Chemical Shifts
The chemical shift interaction arises via the magnetic coupling
between the external magnetic field H0 and the motion of electronic
charges. For a fixed value of Ho the nuclear resonance frequency
of any nuclear species depends in principle upon the particular
chemical sample observed. The precession of electrons about H0
produces a diamagnetic contribution to the magnetic field at the
nucleus. Polarization of the electronic orbitals gives rise to
a second order paramagnetic contribution to this field. Although
in most samples the orbital angular momentum is quenched, the
applied field produces an admixing of electronic states which results
in states having non-zero expectation values of angular momentum.
The total additional magnetic field at the nucleus is proportional
to Ho, so the effective field is given by
-eff ' H0(I - Q)
where I is the unit tensor and a is the chemical shift tensor. The
chemical shift interaction may be written
- 14 -
jyý .1 Ho
so if Ho is applied along the z axis we have
3iH II. Q. +I. Q" + I. Q. I. o ýx ýxz ýy ýyz ýz ýzz
J
In practice the magnitude of the chemical shift is small so only
the Q ZZ component need be considered.
(b) Knight Shifts
The nuclear resonance properties of metals are dominated by the
(2.7)
(2.8)
conduction electrons. Although these electrons are non-localized
they have predominantly s-type wave functions which have large prob-
ability densities at any nucleus. This results in a magnetic
hyperfine interaction, the magnitude of which depends upon the
average orientation of all the conduction electrons. In the pres-
ence of an applied magnetic field any unpaired electron spins are
polarized so there is a net spin density of s spins parallel to
the applied field. Because the spin susceptibility of the conduct-
ion electron gas is small the resulting positive shift in the magnetic
field experienced at any nucleus is also small. The Hamiltonian
describing this contact term may therefore be treated as a perturb-
ation of the Zeeman Hamiltonian. It is given by
, °K =y iI. H0 3 Xsc2<li(0) ý2>F (2.9)
where X. is the electron spin susceptibility per unit volume, 2
<I*k(0)j >F is the average probability density at the nucleus of the
conduction electron states at the Fermi surface, and c is the atomic
vnl lima
- 15 -
This contact term manifests itself as a small difference in
the resonance frequencies of a particular nucleus in the metal and
in a diamagnetic compound. This frequency shift, called the Knight
shift, is defined as
v-v mr
v r
where m and yr are the resonance frequencies of the metal and refer-
ence compound respectively in the same external field.
Because of the existence of chemical shifts any Knight shift
value will depend upon the particular reference compound used.
Similar chemical shifts are also present in metals usually arising
from the shielding of nuclei by the inner shell electrons. Although
this effect may not be negligible, it is usually approximately
equal for the metal and reference compound so it can be ignored.
Reference compounds are normally chosen which have no large para-
magnetic contribution to the chemical shift. Measured Knight
shifts are then usually much greater than the chemical shifts bet-
ween different possible reference samples.
From equation (2.9) the Knight shift can be written
K= Vm
v
yr tv _
$3 XSý<Iýk(0)ý2>F (2.10)
ro
This predicts that the Knight shift is
(i) Positive and independent of the applied field.
(ii) Insensitive to temperature.
(iii) Dependent upon atomic number.
These predictions are generally confirmed but other interactions
also contribute to the experimental value(5).
- 16 -
From a classical point of view the paired s electrons in the
filled shells cannot contribute to the contact term. However they
become exchange polarized by the polarized conduction electrons.
The magnitude and sign of the resulting hyperfine field depends
upon the relative s, p, d, etc. character of the conduction electron
wave functions. Generally this term appears to enhance the Knight
(6) shift; in some cases by as much as 30%. Similarly, for metals
and alloys with unfilled electron shells the applied field produces
a net polarization. The unfilled shells exchange polarize the
core s electrons resulting in a negative effective field at the
nucleus(l). The negative Knight shifts recorded for platinum(8) and
palladium(9) have been accounted for in this way.
Most transition metals have large Knight shifts. This is
due in part to the large density of states at the Fermi surface of
the narrow conduction bands, but there is also a large second order
paramagnetic orbital contribution arising from the small energy (10,
separation between the occupied and unoccupied levelsl1)
The p and d character of the conduction electron wave function
couples with the nucleus through a classical dipolar interaction
between spins. In metals with cubic symmetry such an interaction
is zero, but for non-cubic metals it gives rise to anisotropic
Knight shifts. Polycrystalline metal samples are normally used
in NMR measurements. This anisotropy then becomes apparent as a
field-dependent broadening of the resonance spectrum. Following
Winter (p. 53), assuming axial symmetry the resonance frequency
at a nuclear site is given by
va vs + la(3 cos20 - 1)
- 17 -
where 0 is the angle between the quadratic axis and the magnetic
field, vs = vo(1 + Kiso)and a is proportional to the value of the
anisotropic shift. In powdered samples all possible values of 0
are equally probably and the lineshape is given by
g(v) 12(v - vS) + aý-
for a' (v - vs) > -Ia. In practice the singularity predicted
when V= Vs - Ia (i. e. g(V) is suppressed by other sources
of broadening.
The Knight shift interaction may of course be represented in
tensorial form in the same manner as the chemical shift so
ar -E 'ý(. NI. Koff KJJ3 -0 J
11 where K3 is a second rank tensor. Assuming that the Knight shift
tensor components are small this can be again rewritten in the
form
X°K-I-Y. EH. K. Zý ZZ
J
2.2.4 INDIRECT SPIN-SPIN COUPLING
(a) Non-Metals
To first order there is no coupling between electrons and
nuclei in diamagnetic compounds because there is zero total electron
spin. There is however a second order effect. Classically a
nucleus slightly perturbs its electronic states and through exchange
coupling between electrons this results in an indirect spin-spin
(2.11)
(2.12)
- 18 -
coupling between nuclei. The interaction is proportional to the
magnetic moment of the nuclei and can be written in the form
Aiýuiu3
Such an interaction was first postulated to explain line splittings
observed in liquids(12). Similar effects occur in solids but with
the exception of metals are usually obscured by dipolar broaden-
ing of the resonance line.
We mention at this point the circumstances which may tend to
average the indirect exchange interaction to zero. If the life-
time of the Zeeman energy state of either spin is much shorter than
h/A, then the second spin experiences a time averaged hyperfine
field which averages to zero over the period h/A. Rapid chemical
exchange will result in a similar averaging effect.
(b) Metals
The indirect exchange interaction can be written in the form
hi. -J. A
i<j
where J is a second rank tensor.
For metals this tensor is symmetric and can be divided into
(2.13)
two parts, a scalar and a symmetric traceless tensor. The symmetric
traceless tensor arises from an indirect interaction between nuclei
via a classical dipolar coupling between the nuclei and the non-s-
character conduction electrons. Because it has the same form as
the normal dipolar coupling between nuclei this interaction is often
- 19 -
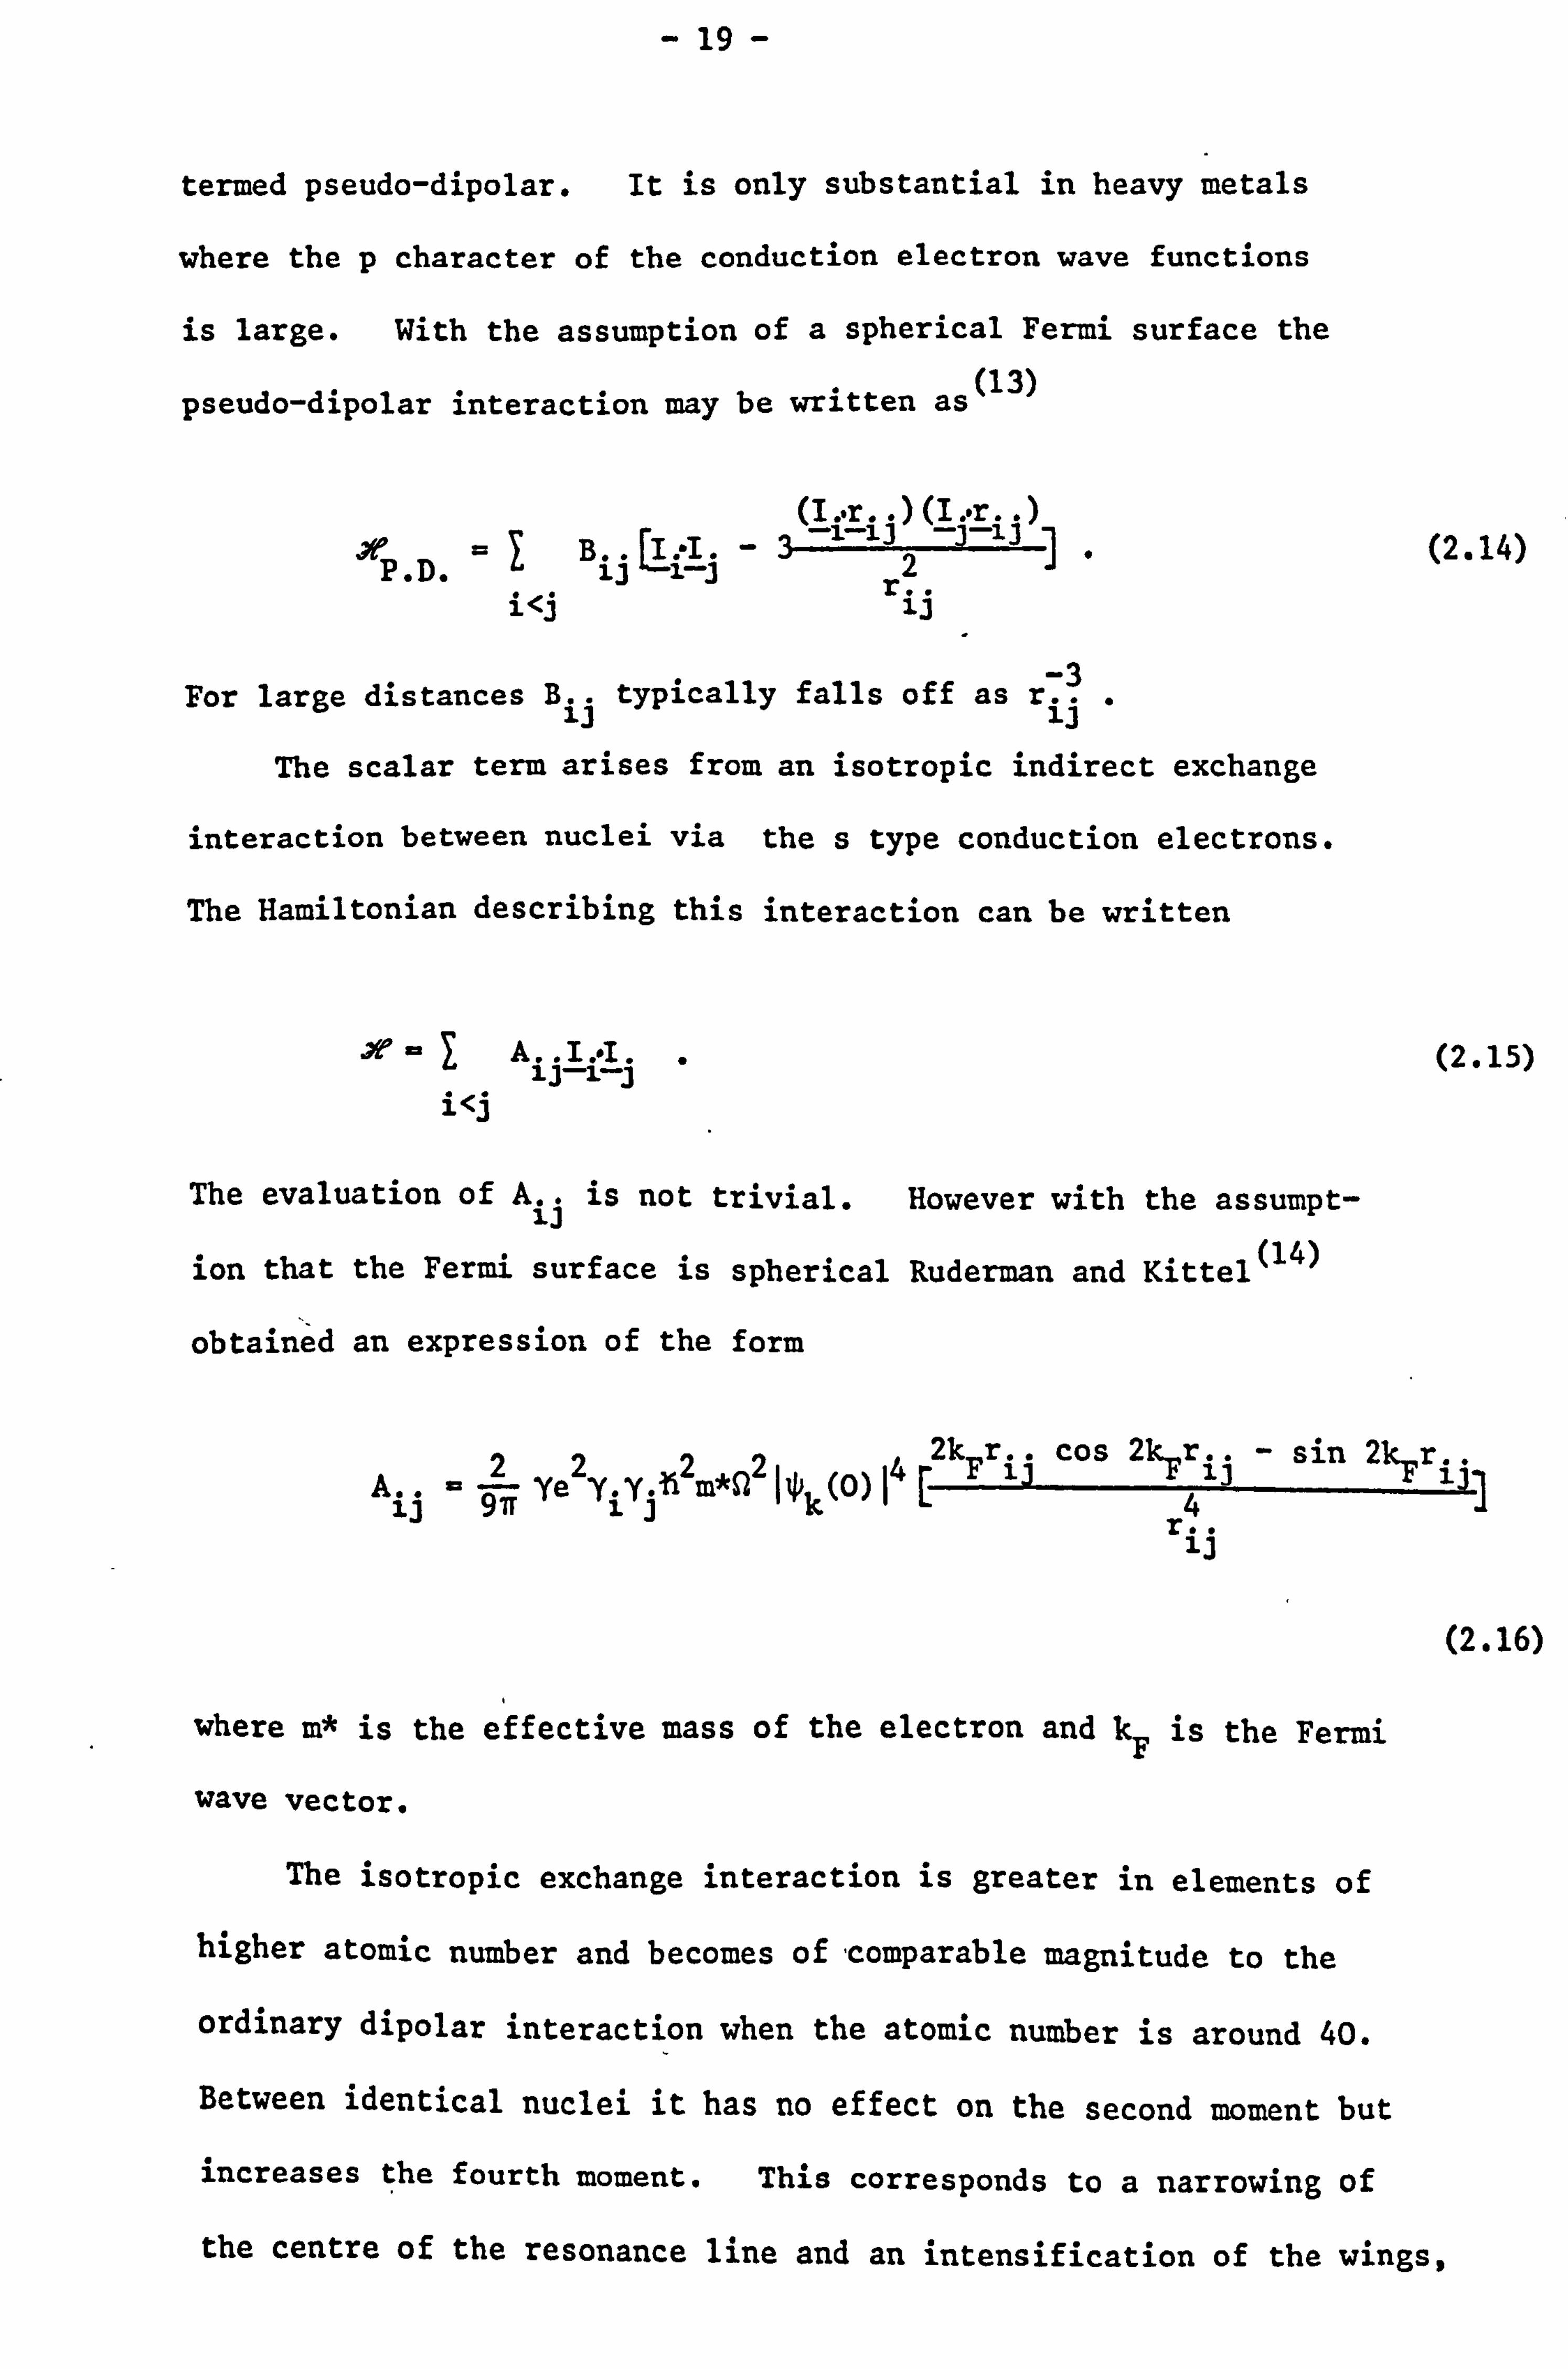
termed pseudo-dipolar. It is only substantial in heavy metals
where the p character of the conduction electron wave functions
is large. With the assumption of a spherical Fermi surface the
ýl3) pseudo-dipolar interaction may be written as
(I "r ) (I "r )
. oy =I B1 [I .. 1 ,-3
i-13 2j
i3 ]. (2.14) P. D. jJ
i<j r. .
For large distances Bid typically falls off as rid .
The scalar term arises from an isotropic indirect exchange
interaction between nuclei via the s type conduction electrons.
The Hamiltonian describing this interaction can be written
.°_IA.. I: I. . (2.15)
i <j
The evaluation of Aid is not trivial. However with the assumpt-
ion that the Fermi surface is spherical Ruderman and Kittel (14)
obtained an expression of the form
2k Fr iJ . cos 2kFri. 7 - sin 2kF
_ý r ij. Aij 97r Ye2Y. Yji12m*1 2Iýk(0)i4 [r4..
13
(2.16)
where m* is the effective mass of the electron and kF is the Fermi
wave vector.
The isotropic exchange interaction is greater in elements of
higher atomic number and becomes of, comparable magnitude to the
ordinary dipolar interaction when the atomic number is around 40.
Between identical nuclei it has no effect on the second moment but
increases the fourth moment. This corresponds to a narrowing of
the centre of the resonance line and an intensification of the wings,
- 20 -
known as exchange narrowing. Between unlike nuclei the exchange
interaction increases the second moment; termed exchange broaden-
ing.
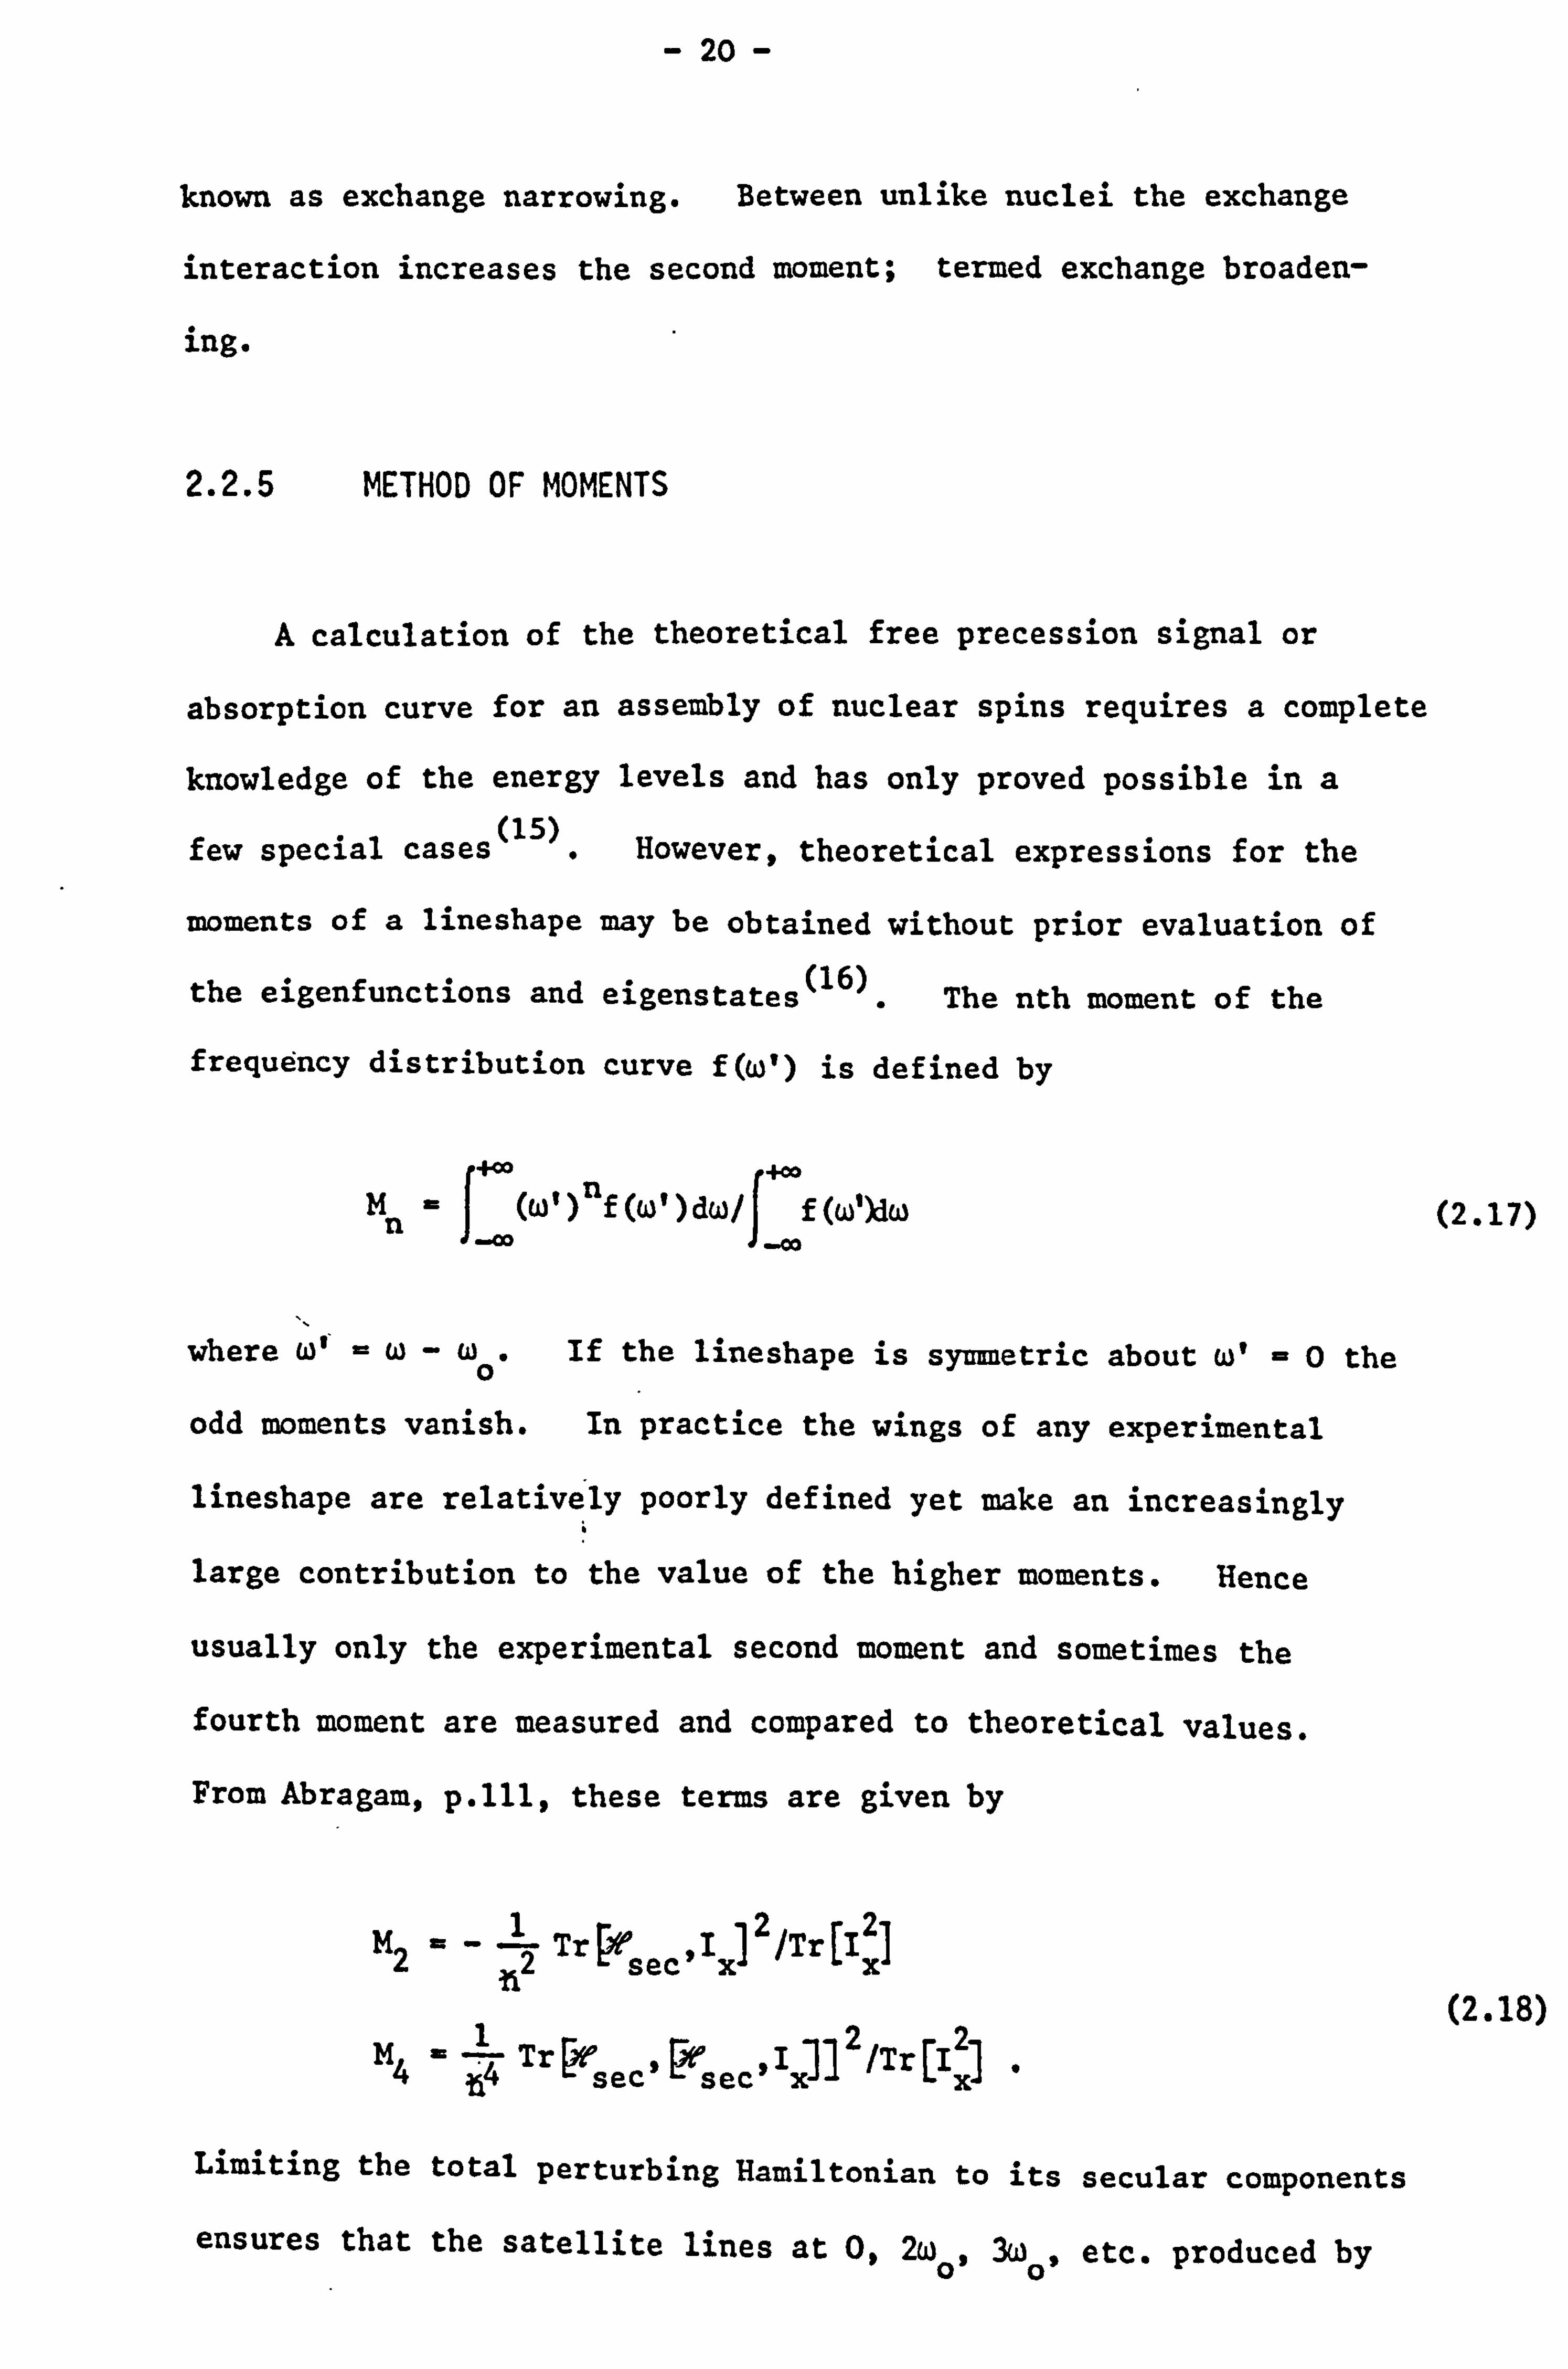
2.2.5 METHOD OF MOMENTS
A calculation of the theoretical free precession signal or
absorption curve for an assembly of nuclear spins requires a complete
knowledge of the energy levels and has only proved possible in a
few special cases(15). However, theoretical expressions for the
moments of a lineshape may be obtained without prior evaluation of
the eigenfunctions and eigenstates(16). The nth moment of the
frequency distribution curve f(c') is defined by
M (w' )nf (W') di/1 f (w')dw
where w' =w- wo If the lineshape is symmetric about w' =0 the
odd moments vanish. In practice the wings of any experimental
lineshape are relatively poorly defined yet make an increasingly
large contribution to the value of the higher moments. Hence
usually only the experimental second moment and sometimes the
fourth moment are measured and compared to theoretical values.
From Abragam, p. 111, these terms are given by
M2 2 Tr sec'Ixý2/TrLIX11
M4 ý j4 Tr [`sec' ý`sec'Ixý12/TrýIXI
Limiting the total perturbing Hamiltonian to its secular components
(2.17)
(2.18)
ensures that the satellite lines at 0,2w0,3w0, etc. produced by
- 21 -
the non-secular terms of the dipolar Hamiltonian (for example)
are ignored.
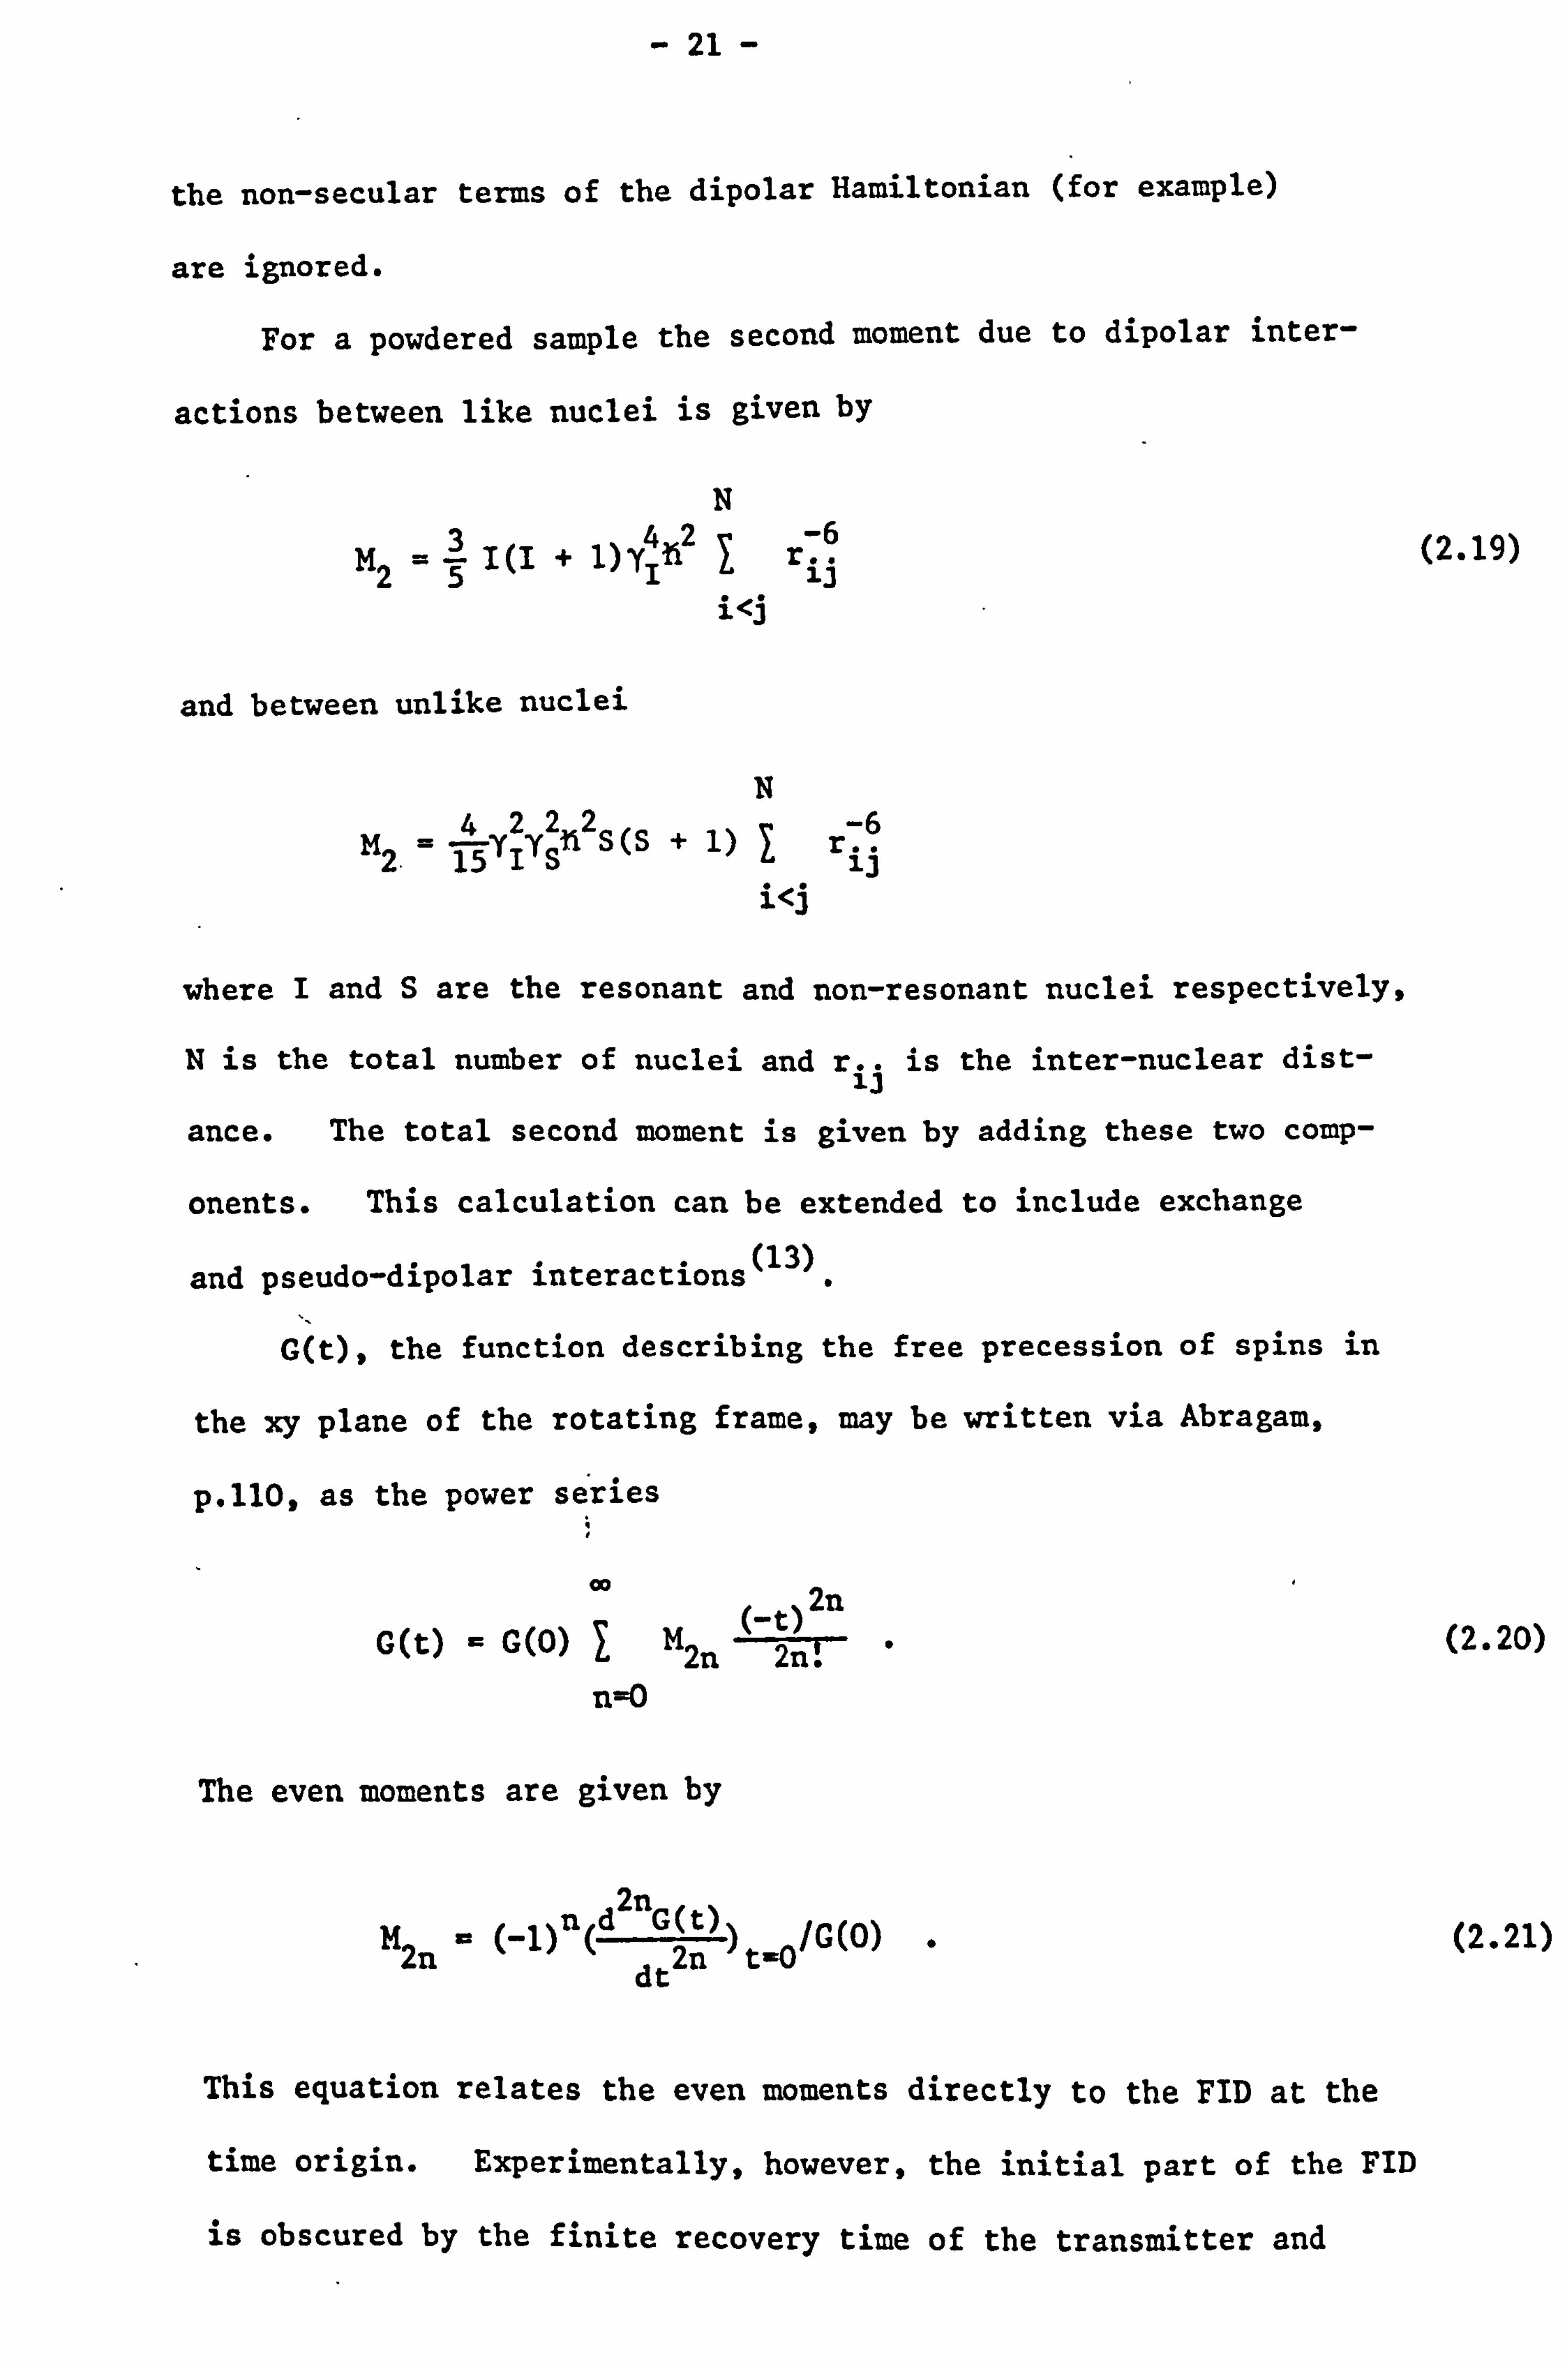
For a powdered sample the second moment due to dipolar inter-
actions between like nuclei is given by
N
M2 =5I (I + 1) 4112 1 rib (2.19)
i<j
and between unlike nuclei
N
M2 1SYIYS 2S O+ 1) r..
i<j
where I and S are the resonant and non-resonant nuclei respectively,
N is the total number of nuclei and r.. is the inter-nuclear dist- 1)
ance. The total second moment is given by adding these two comp-
onents. This calculation can be extended to include exchange
and pseudo-dipolar interactions(13).
G(t), the function describing the free precession of spins in
the xy plane of the rotating frame, may be written via Abragam,
p. 110, as the power series
GO ( 2n. (2.20) G(t) = G(O) I M2n 2n.
n0
The even moments are given by
M_ (_1)n(d2nG(t))/G(0) . (2.21) t=O 2n dt
This equation relates the even moments directly to the FID at the
time origin. Experimentally, however, the initial part of the FID
is obscured by the finite recovery time of the transmitter and
- 22 -
receiver so the moments cannot normally be measured in this
way.
2.3 NON-SECULAR INTERACTIONS
2.3.1 INTRODUCTION
There are a number of different processes by which a spin
system can exchange energy with the lattice. Any mechanism which
gives rise to fluctuating magnetic fields at a nucleus is a poss-
ible relaxation process, although often one particular mechanism
is dominant and the return to equilibrium may be described by a
single spin relaxation time. In liquids the relaxation processes
are usually different from those in solids. Here we are primarily
concerned with solid samples so of these processes we list only
the dipole-dipole interaction which usually predominates.
2.3.2 DIPOLE-DIPOLE RELAXATION
Motion of nuclei through Brownian motion and diffusion changes
the internal local fields. The component of the Fourier transform
of the fluctuating fields at the Larmor frequency induces transit-
ions between the Zeeman energy levels. Such a relaxation process
is most efficient when the correlation time TC equals 1/vo. T1
then exhibits a minimum when plotted against temperature.
2.3.3 IMPURITY RELAXATION
Any paramagnetic ions present in the sample are strongly coupled
to the lattice via spin-orbit coupling. Nearby nuclei are coupled
- 23 -
to the lattice directly via the time-dependent magnetic field of
the unpaired electron of the impurity ion. However most of the
nuclei are coupled only indirectly by spin diffusion through
dipole-dipole interactions. The spin-lattice relaxation time
resulting from such a process depends upon the nature of the impur-
ities and the impurity concentration. Where the concentration
of impurities is low, T1 depends upon the rate of spin diffusion.
2.3.4 INTERACTION WITH CONDUCTION ELECTRONS
This mechanism is the dominant relaxation process in metals.
The non-localized conduction electrons create relatively large
time varying local magnetic fields at a nucleus, which can induce
simultaneous but opposite flips of the electron and nuclear spins.
The resulting energy difference is made up by an increase in the
kinetic energy of the electrons. To a first approximation only
those s character electrons near the top of the Fermi distribut-
ion are able to take part in this process. From Slichter, p. 126,
the relaxation rate induced by this mechanism is given by
1 64 33222 222 T19 YeYnSt <Iýk(0)ý >Fp (EF)kBT
where p(EF) is the density of states at the Fermi surface and kB
is Boltzmann's constant.
Y2 t1z e Xs 2 P(EF)
For a non-interacting electron gas
(2.22)
Hence equations (2.10) and (2.22) lead to the simple Korringa relat-
ionship(l7) between the Knight shift and spin-lattice relaxation
- 24 -
time thus
Y T1K2T = 4, Y
)2 . (2.23) Bn
This expression is only approximate because it is based on the
free electron model and ignores the effect of exchange interactions
between electrons on Xs and p(EF). Contributions to T1 and K other
than from the direct contact term via the s character conduction
electrons are also ignored. In transition metals in particular,
core polarization and orbital hyperfine interactions arising from
the d band electrons can be significant in determining the magnitude
of both the relaxation time and the Knight shift.
The above discussion is concerned with the spin-lattice relax-
ation of the Zeeman Hamiltonian. The secular interactions (WS)
of ý nt
also return to thermal equilibrium, although at a different
rate. However, as the energy associated with spin-spin interact-
ions is small there is usually no observable effect on Tl. Follow-
ing Anderson and Redfield (18)
we may define the two relaxation
rates Tiz and Tis by
dZ>Z> Z>o dt -( T 1Z
) (2.24)
d-OrS> <; °s> -or S>o dt a -( T) 1S
(2.25)
Strictly these two processes are not independent because equations
(2.24) and (2.25) neglect the effect of spin flips induced by non-
secular spin-spin interactions, which act so as to conserve the
total energy -VZ + ýWs , Although the spin system is brought to a
common spin temperature in this way, in large fields this process is extremely slow (i. e. longer than Tiz). Equations (2.24) and
- 25 -
(2.25), can then be assumed to apply directly.
If. S is regarded as the sum of the local dipolar interact-
ion energies between all combinations of pairs of nuclei, this
energy will change if either of the spins in a single pair is
relaxed. By definition the relaxation of single spins proceeds
at a rate 1/Tlz, so from this simple model it follows that
Tis = Tlz/2. The ratio of the spin-lattice relaxation times
S Tlz/Tis is therefore equal to 2.
In practice the situation is more complicated because Tls
depends both upon the terms making up. °S and the degree of correlat-
ion between the fluctuating fields at the nuclear spin sites.. If
we consider. aP°S as the sum of a dipolar interaction and a scalar
exchange interaction thus
ALS - X- + A.. I . I1
then if the second term dominates and the conduction electrons have
long wavelengths, the local fields experienced by near-neighbours
are identical. Consequently the product 11.13 remains constant
and the relaxation time Tis will be very long. Generally, however,
(and particularly in light metals) the first term of equation (2.26)
dominates. 6 is then a measure of the correlation in the conduct-
ion electron spin system. It is given by
8e2+E
where
(2.26)
E Klj(6)/1 (6) ij rij ij rij
- 26 -
and Kid is a measure of the degree of electron correlation between
sites ri and r3 as calculated by Wolf P9).
It includes considerat-
ion of the electron wavelength as well as the amplitude of electron
exchange effects. For an ideal non-interacting gas
Kid = sin 2 (1tFri3 )/ (k., ri3)
2
where kF is the radius of the Fermi surface. Assuming one electron
per atom this yields a value for c of approximately 0.05(18) where-
as for complete spatial correlation c is unity.
(2.27)
In addition we note that there may also be a quadrupole contrib-
ution to 0S- If the quadrupole interactions are small (e. g. aris-
ing from imperfections in a cubic lattice structure) and axially
symmetric, the quadrupole reservoir has a relaxation time given by
T1Z/3(18). Hence any experimental estimate of 6 is sensitive to
quadrupole effects as well as spin correlation in the electronic
system.
2.3.5 QUADRUPOLE RELAXATION
For nuclei with spin greater than I the nuclear quadrupole
moment can couple to local field gradients due to molecular motion,
lattice vibrations or (in the case of metals) the non-localized
conduction electrons. In metals the quadrupole relaxation rate
is usually negligible but in ionic crystals quadrupole coupling
with the lattice phonons proves to be the dominant relaxation
mechanism. The transient departures from cubic symmetry caused
by the vibrations of the lattice result in fluctuating electric field gradients at the nuclei which interact with the nuclear
- 27 -
quadrupole moments to produce transitions within the spin levels
of the nuclei. The vibrational modes in a solid may be assumed
to occupy a Debye spectrum, the Debye frequency being defined by
hvD - keD. There are three suggested phonon relaxation processes,
(i) Single Phonon. Transitions induced between the nuclear
spin states correspond to the creation or destruction of a single
phonon. Only these phonons with energy hvp = hV0 can participate.
However V0 « VD, so there are very few phonons which fulfil this
condition and such a process is not an efficient relaxation
mechanism. As phonons obey Bose-Einstein statistics and hv0 « kT
the number of phonons with energy hV0 is proportional to the absolute
temperature. The relaxation probability depends upon the number 2
of vibrational modes with frequency V0. Hence l/T1 a v0T.
(ii) Four Phonon. A second order process has been suggested (20)
by which two phonons are created and two destroyed, the energy
difference being made up by the lattice transition. This mechanism
predicts aT4 dependence of T1 but although it was expected to
dominate at high temperatures it has never been observed experi-
mentally. Indeed, a more recent calculation (21)
has shown that
such a process does not in fact give rise to any net transition
between nuclear spin levels, and consequently does not contribute
to the overall Tl.
(iii) Two Phonon (Raman). This process is far more efficient
than the single phonon because any phonon in the Debye spectrum
can participate. A phonon is scattered inelastically at a nucleus
so an induced transition between spin states is accompanied by a
corresponding change in the phonon energy. Although the relaxation
- 28 -
rate is independent of the resonance frequency it has the follow-
ing temperature dependence
Tl aT2 for T >0D
T1 aT7 for T <0.026D.
Such a relaxation process was first examined in ionic crystals
of the NaCl type by Van Kranendonk(22), who assumed that the lattice
could be described by an array of point charges located at the
lattice sites. The theory was extended to lattices of the zinc
blende type by Mieher(23) with the result that the quadrupolar
transition probabilities between Zeeman levels n and m are given
by
nm s cIQnm12T*2E(T*)En-m(-)
where
c �3/(87Td2v a3) .
d is the density, v is the velocity of sound in the crystal, and
a is the lattice constant; Qnm is the matrix element of the quad-
rupolar operator; En_m&) is a function describing the angular
dependence of the transition probabilities and includes details
of the lattice; T* is the reduced temperature T/AD; E(T*) is a
function computed by Van Kranendonk which increases from zero for
T* =0 to unity when T> 6D.
With the assumption that at any time the spin system can be
(2.28)
described by a spin temperature, T1 is given by the general relation-
ship
T°g [I (En - Em) 2WW
En 1
n, m n
- 29 -
where En are the Zeeman energy levels (-yM n). This leads to
the expression
11a 40 f (I) (eQ)2cT*2E(T*) JE1(co) + 4E2(o) I
1
with
f (I) 21 +3
I2(2I - 1)
Such an equation is not specific to zinc blende crystal lattices
because all the structure parameters are included in the terms
cEn_m(()0). From Mieher's calculated values of E+1(co) and E+2(oo)
an isotropic relaxation time is predicted, which is given by
T= Af (I) e2 YQ ZT*2E (T*)
1r where
A 3305c 1983 40
71d2v 3
a2
The term (e2yQ/r5) is a measure of the strength of the electric
quadrupole interaction between nuclei, r being the nearest-neighbour
separation and ya scalar.
The weakness of the above expression is that any indirect
contributions to the nulcear quadrupole coupling are included only
through the multiplying factor y. In ionic crystals the electron
charge cloud surrounding each nucleus is distorted from spherical
symmetry by the electric field gradient arising from the other ions.
This leads to an additional contribution to the nuclear quadrupole
coupling, the magnitude of which can be estimated from the value
of the Sternheimer anti-shielding factor (3,24) for the particular
ion. However, compounds with a zinc blende type lattice structure
(2.29)
- 30 -
are strongly covalent. Consequently, any numerical estimate of
y also has to include an empirical factor relating the covalent
lattice to the point charge model.
In the alkali halides detailed consideration of the effects
of anti-shielding(25) and covalent bonding (26)
has improved the
quantitative agreement with experiment, as have calculations on the
effect of overlap distortion of the ionic electron distribution(27).
These extensions of the relaxation theory differ only in the mechan-
isms, which produce the field gradient at the nucleus: although
the magnitude of the relaxation time is altered, Van Kranendonk's
predicted temperature dependence is unaffected.
The ionic model has been further extended to include the inter-
action'between the nuclear quadrupole moment and the electric field
gradients due to the oscillating electric dipoles associated with
optical modes of vibration(28). Modification of the Debye approxi-
mation to include this effect alters. the absolute magnitude of the (29
spin-lattice coupling for any ion. 30) . However significant
departures from the form of Van Kranendonk's function T*2E(T*) have
only been found at low temperatures(30,31). Cenerally, experiments
on the alkali halides (29-32)
and several III-V compounds (23)
have
demonstrated that Van Kranendonk's model still provides a good
account of the temperature dependence of the relaxation time. This
behaviour reflects the fact that the Raman relaxation processes
involve an integrated effect of the lattice vibrational spectrum.
As a result the temperature dependence of the relaxation rate is
relatively insensitive to the precise form of the phonon distribut-
ion function.
- 31 -
CHAPTER 3
NARROWING THE NUCLEAR RESONANCE SPECTRUM BY
MACROSCOPIC SAMPLE ROTATION
3.1 INTRODUCTION
In Chapter 2 the various line-broadening interactions which
exist in solids, and metals in particular, have been considered.
In many liquids and solids the situation is different: motion of
the nuclear spins averages out the secular line broadening mechan-
ism. ' The internal motion may be described by a correlation funct-
ion f(v) with a mean correlation time Tc. If Tc is short and less
than T2 (the characteristic time describing the dephasing of spins
in the rotating frame) the spin vectors will execute a random walk
in the rotating frame and only slowly accumulate a phase difference
relative to the mean resonance frequency vo. In the extreme case
the secular interactions become so inefficient that the width of
the resonance spectrum is determined by the homogeneity of the
magnetic field across the sample and lifetime broadening.
The above discussion is concerned with microscopic motion with-
in a particular sample. Similar arguments apply when studying
the effect of a macroscopic rotation of the sample about a unique
axis, but there are a few important differences. Unlike random
internal motion, macroscopic rotation only causes averaging over
the plane of rotation and not over inter-nuclear distances. Macro-
scopic motion is a very slow process by molecular standards and
involves a single frequency of motion. Although Fourier analysis
-- 32 -
gives rise to a series of spinning sidebands, no modulation
component is present at the Larmor frequency and no spin-lattice
relaxation processes are introduced directly. Nevertheless spin (33,34) is rendered more inefficient, 34)
and hence also T1
relaxation via paramagnetic impurities. Rotation at a frequency
corresponding to the chemical shift between two resonance lines
has been shown (35)
to introduce a cross-relaxation mechanism bet-
ween nuclear spins which alters the spin-lattice relaxation time.
In studying the effect of motion on the nuclear spin system
it is convenient to divide the secular Hamiltonian into two parts,
a time-average component Re and a time-dependent component with
zero mean. (t). Although the Zeeman interaction is unaffected
by motion the various line-broadening interactions can be similarly
treated. Hence
X° _ ; £°Z +, + ýtoQ + Z- + ie- J
and
' (t) ° D(t) +, Q(t) + S(t) +, xJ(t)
This division is only properly applicable to those cases where
the motion is rapid, i. e. Tc < T2. Therefore the motional averag-
ing processes considered below are subject to this criterion.
3.2 ISOTROPIC MOTION
We first consider the effect of rapid isotropic reorientation
on the general tensor interaction A. T. B where A and B are motionally
invariant spin operators and T is a second rank coupling tensor.
The time average of this interaction is given by
- 33 -
Aý T. B a A"T"B "
It is a general property that T can be divided into a symmetric
tensor T* and an antisymmetric tensor T. If Tpp are the principal
values of the tensor T* and apt are the direction cosines of the
principal axes (p = 1,2,3) with respect to the laboratory reference
frame (2., m, n) then
TRm Lx PýX PM PP p=1,2,3
where subscript Em is used to imply summation over all axes, 9, m
and n. Under the condition of rapid isotropic reorientation the
time dependence of 1 only arises out of the motion of the principal
axes, the principal values remaining constant. The isotropic
average of Tjm is given by
Tim cLPP TPP
P
3a km TPP
P
Hence
T*a3TrT* .
The antisymmetric component Tt is given by
tach 7ý
fi TIm (, at bm
Tab
a, b
(3.1)
(3.2)
(3.3)
where a, b refers to any pair of axes of a convenient co-ordinate
system in the molecule. This expression can be rewritten as
- 34 -
TmtaL (X2. ýam xamXbl, )Tab
a>b
Isotropic averaging results in there being no preferred direction
so that T=0 and as a result
A. T. B =3 Tr T A. B
Because intermolecular interactions are subject to diffusional
motion as well as rotation in practice the inter-nuclear distances
change, causing the principal values of I to vary with time. This
results in an even more complete averaging process.
It has been shown that rapid isotropic reorientation of the
nuclear spins averages out tensor interactions between spins to
scalar values. Because the quantities Qaß of equation (2.4) are
only functions of spin operators and not of any angular factors,
secular quadrupole interactions are similarly averaged. Thus all
(3.4)
secular line-broadening interactions represented by traceless tensors
are reduced to zero.
We now consider the effect of macroscopic sample rotation (36,
following the approach of previous examinations37)
3.3 THE DIPOLAR INTERACTION
The truncated form of the dipolar interaction is given by
N2
JJ- -1j yiYj r3 "
1. - M. 1. Z1
(3 cos20.. - 1) . 1<J 13
(3.5)
Ho
(-Ur
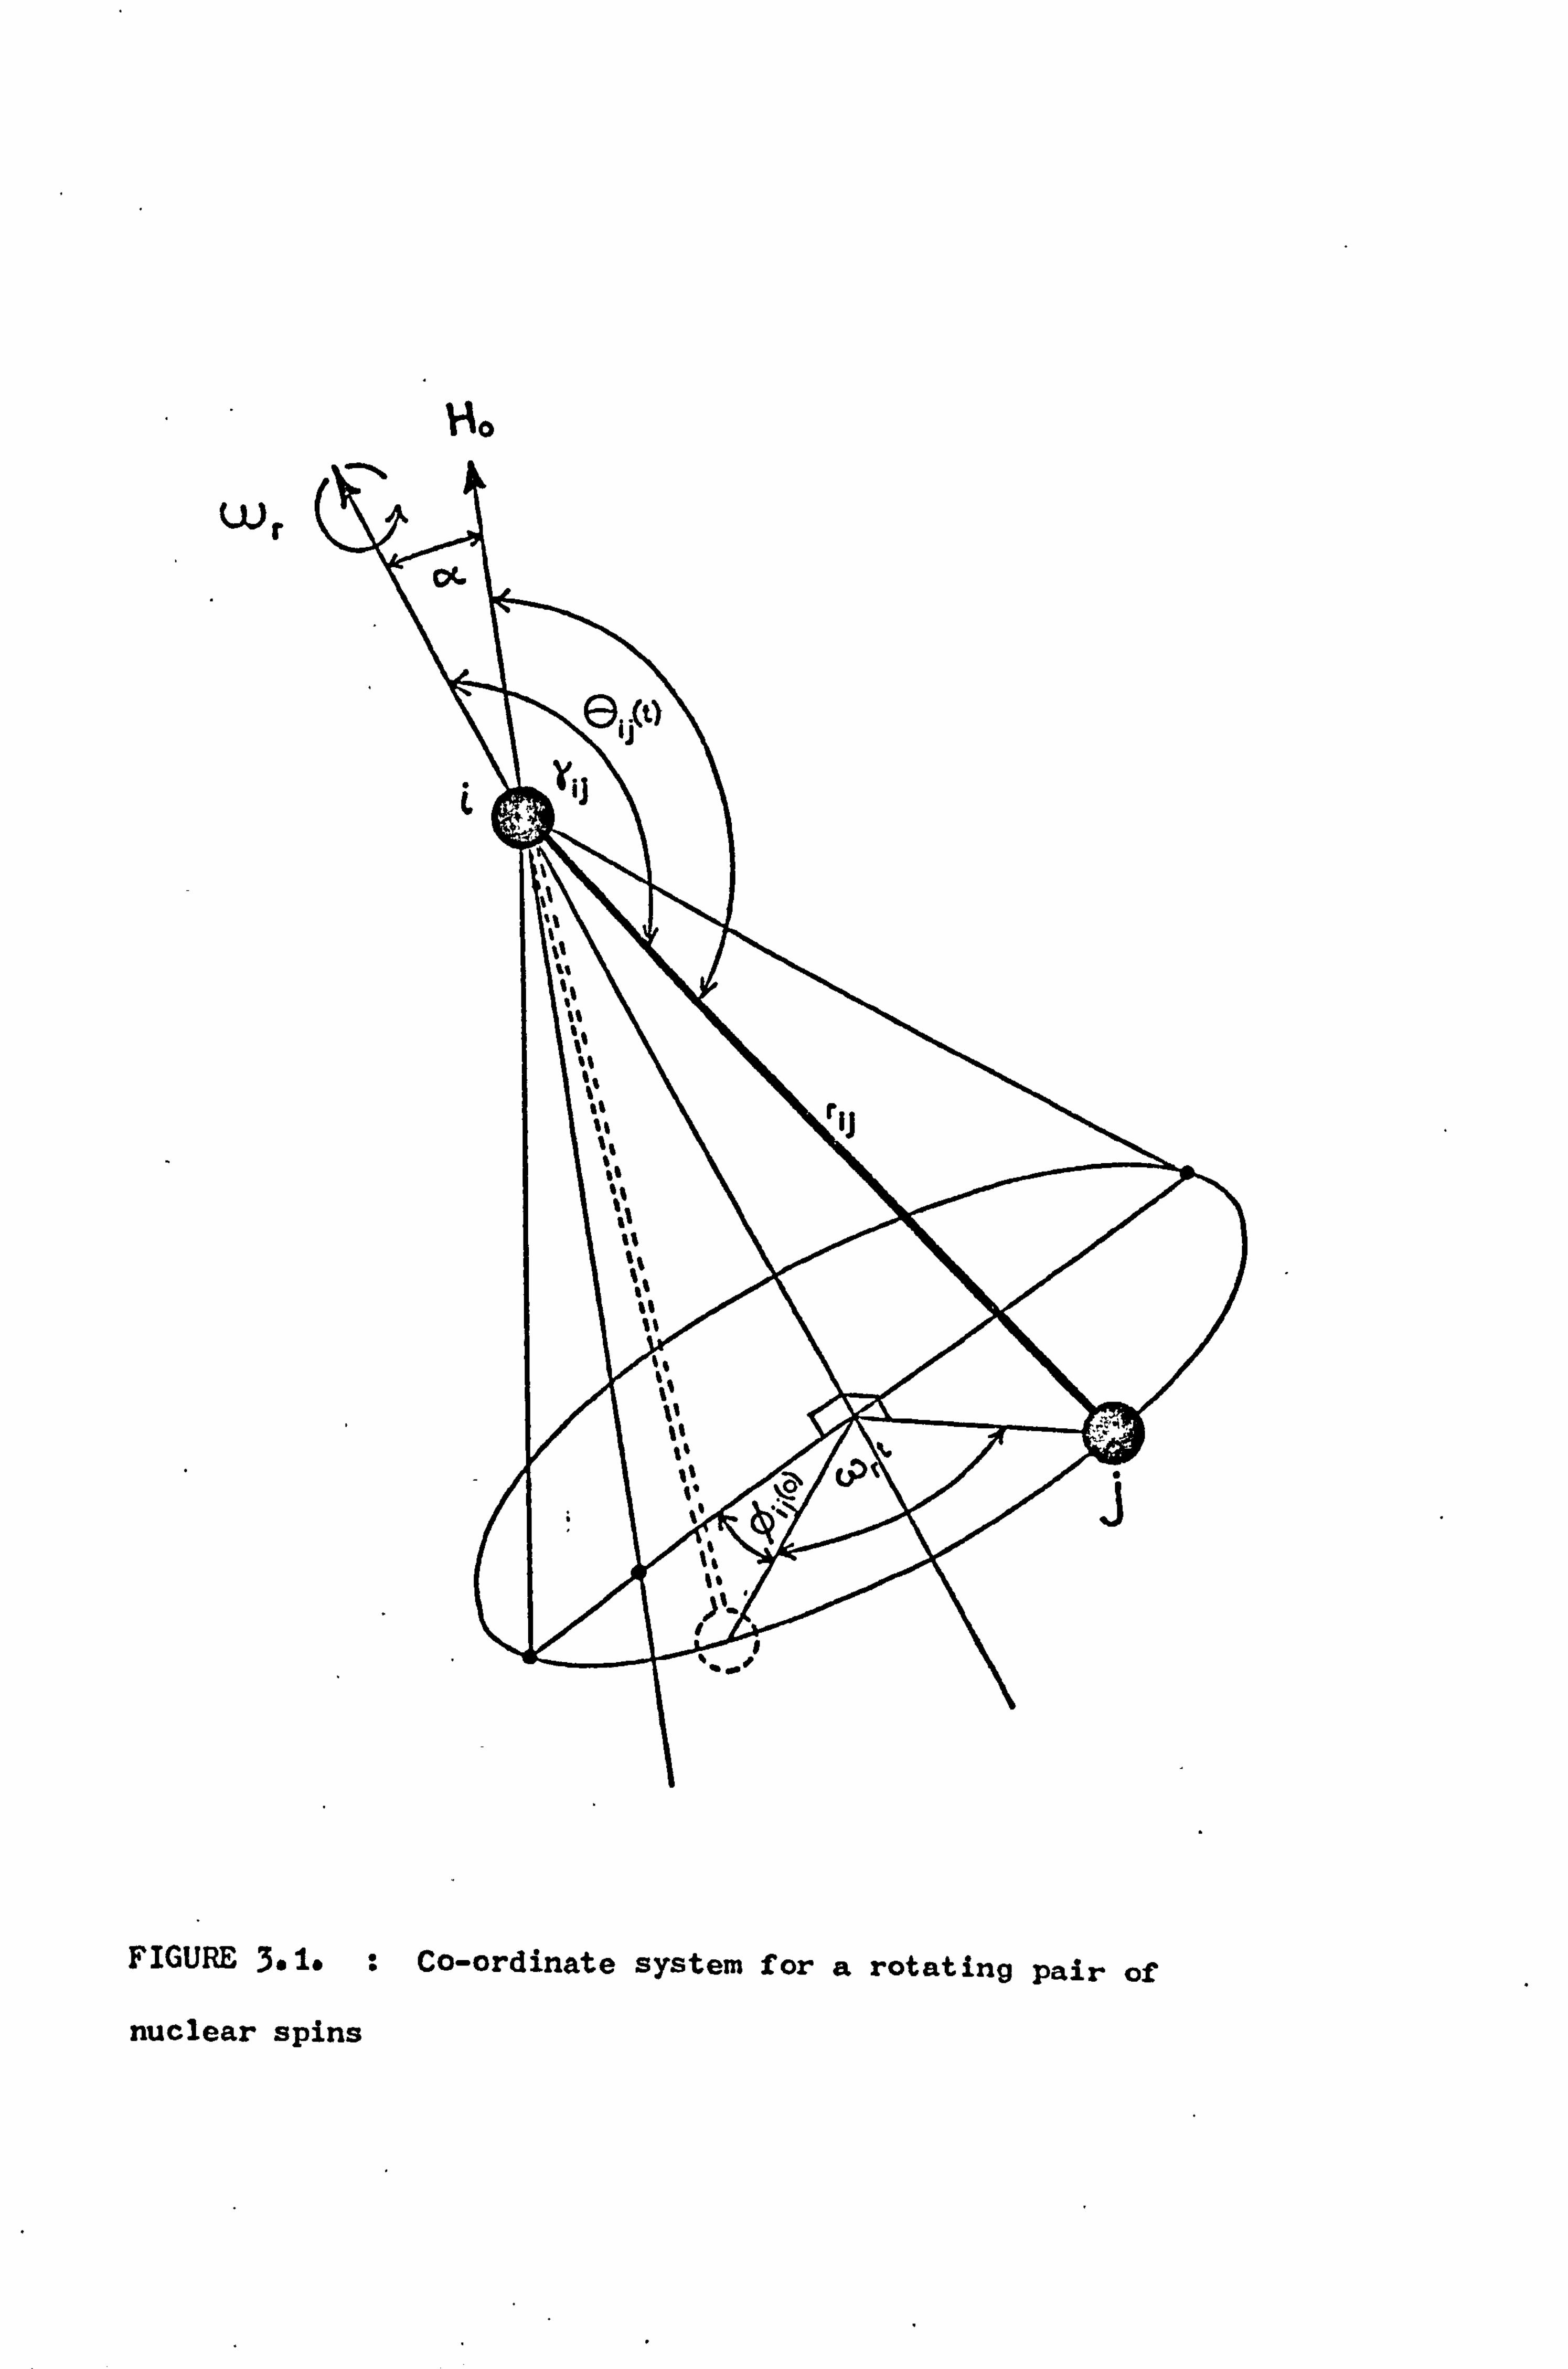
FIGURE 3.1. : Co-ordinate system for a rotating pair of
nuclear spins
-35-
Motion of each nuclear pair imparts a time dependence to 6iß leav-
ing the other terms of this expression unaffected. For a macro-
scopic rotation at angular velocity wr about an axis inclined at
an angle a to the applied magnetic field (Figure 3.1) it can be
shown that
cos 6 ij (t) = cos a cos yid + sin a sin yid cos(wrt + ýij )
(3.6)
where Yid is the angle between
cos2Aij (t) is expressed as the
and a time-dependent part cost'
the rotation axis and r... If 13
sum of a time-averaged part cos26iý(t)
'0. j (t) then
Cos20ii (t) = costa cos2Y + Isin2a sin2y
a 1(3
costa - 1)(3 cos2y - 1) +3 (3.7)
and
cos2'6ij(t) =i sin2yij sin2a cos 2(wrt + ýij)
+ sin2a sin 2y.. cos(wrt + ýii) . (3.8)
Upon substitution into' equation (3.5) the time-averaged Hamiltonian
is given by
Y, 22
D=4 (3 cos a- 1) 3 31 Ijz] (3 cos21. j i<j rij
(3.9)
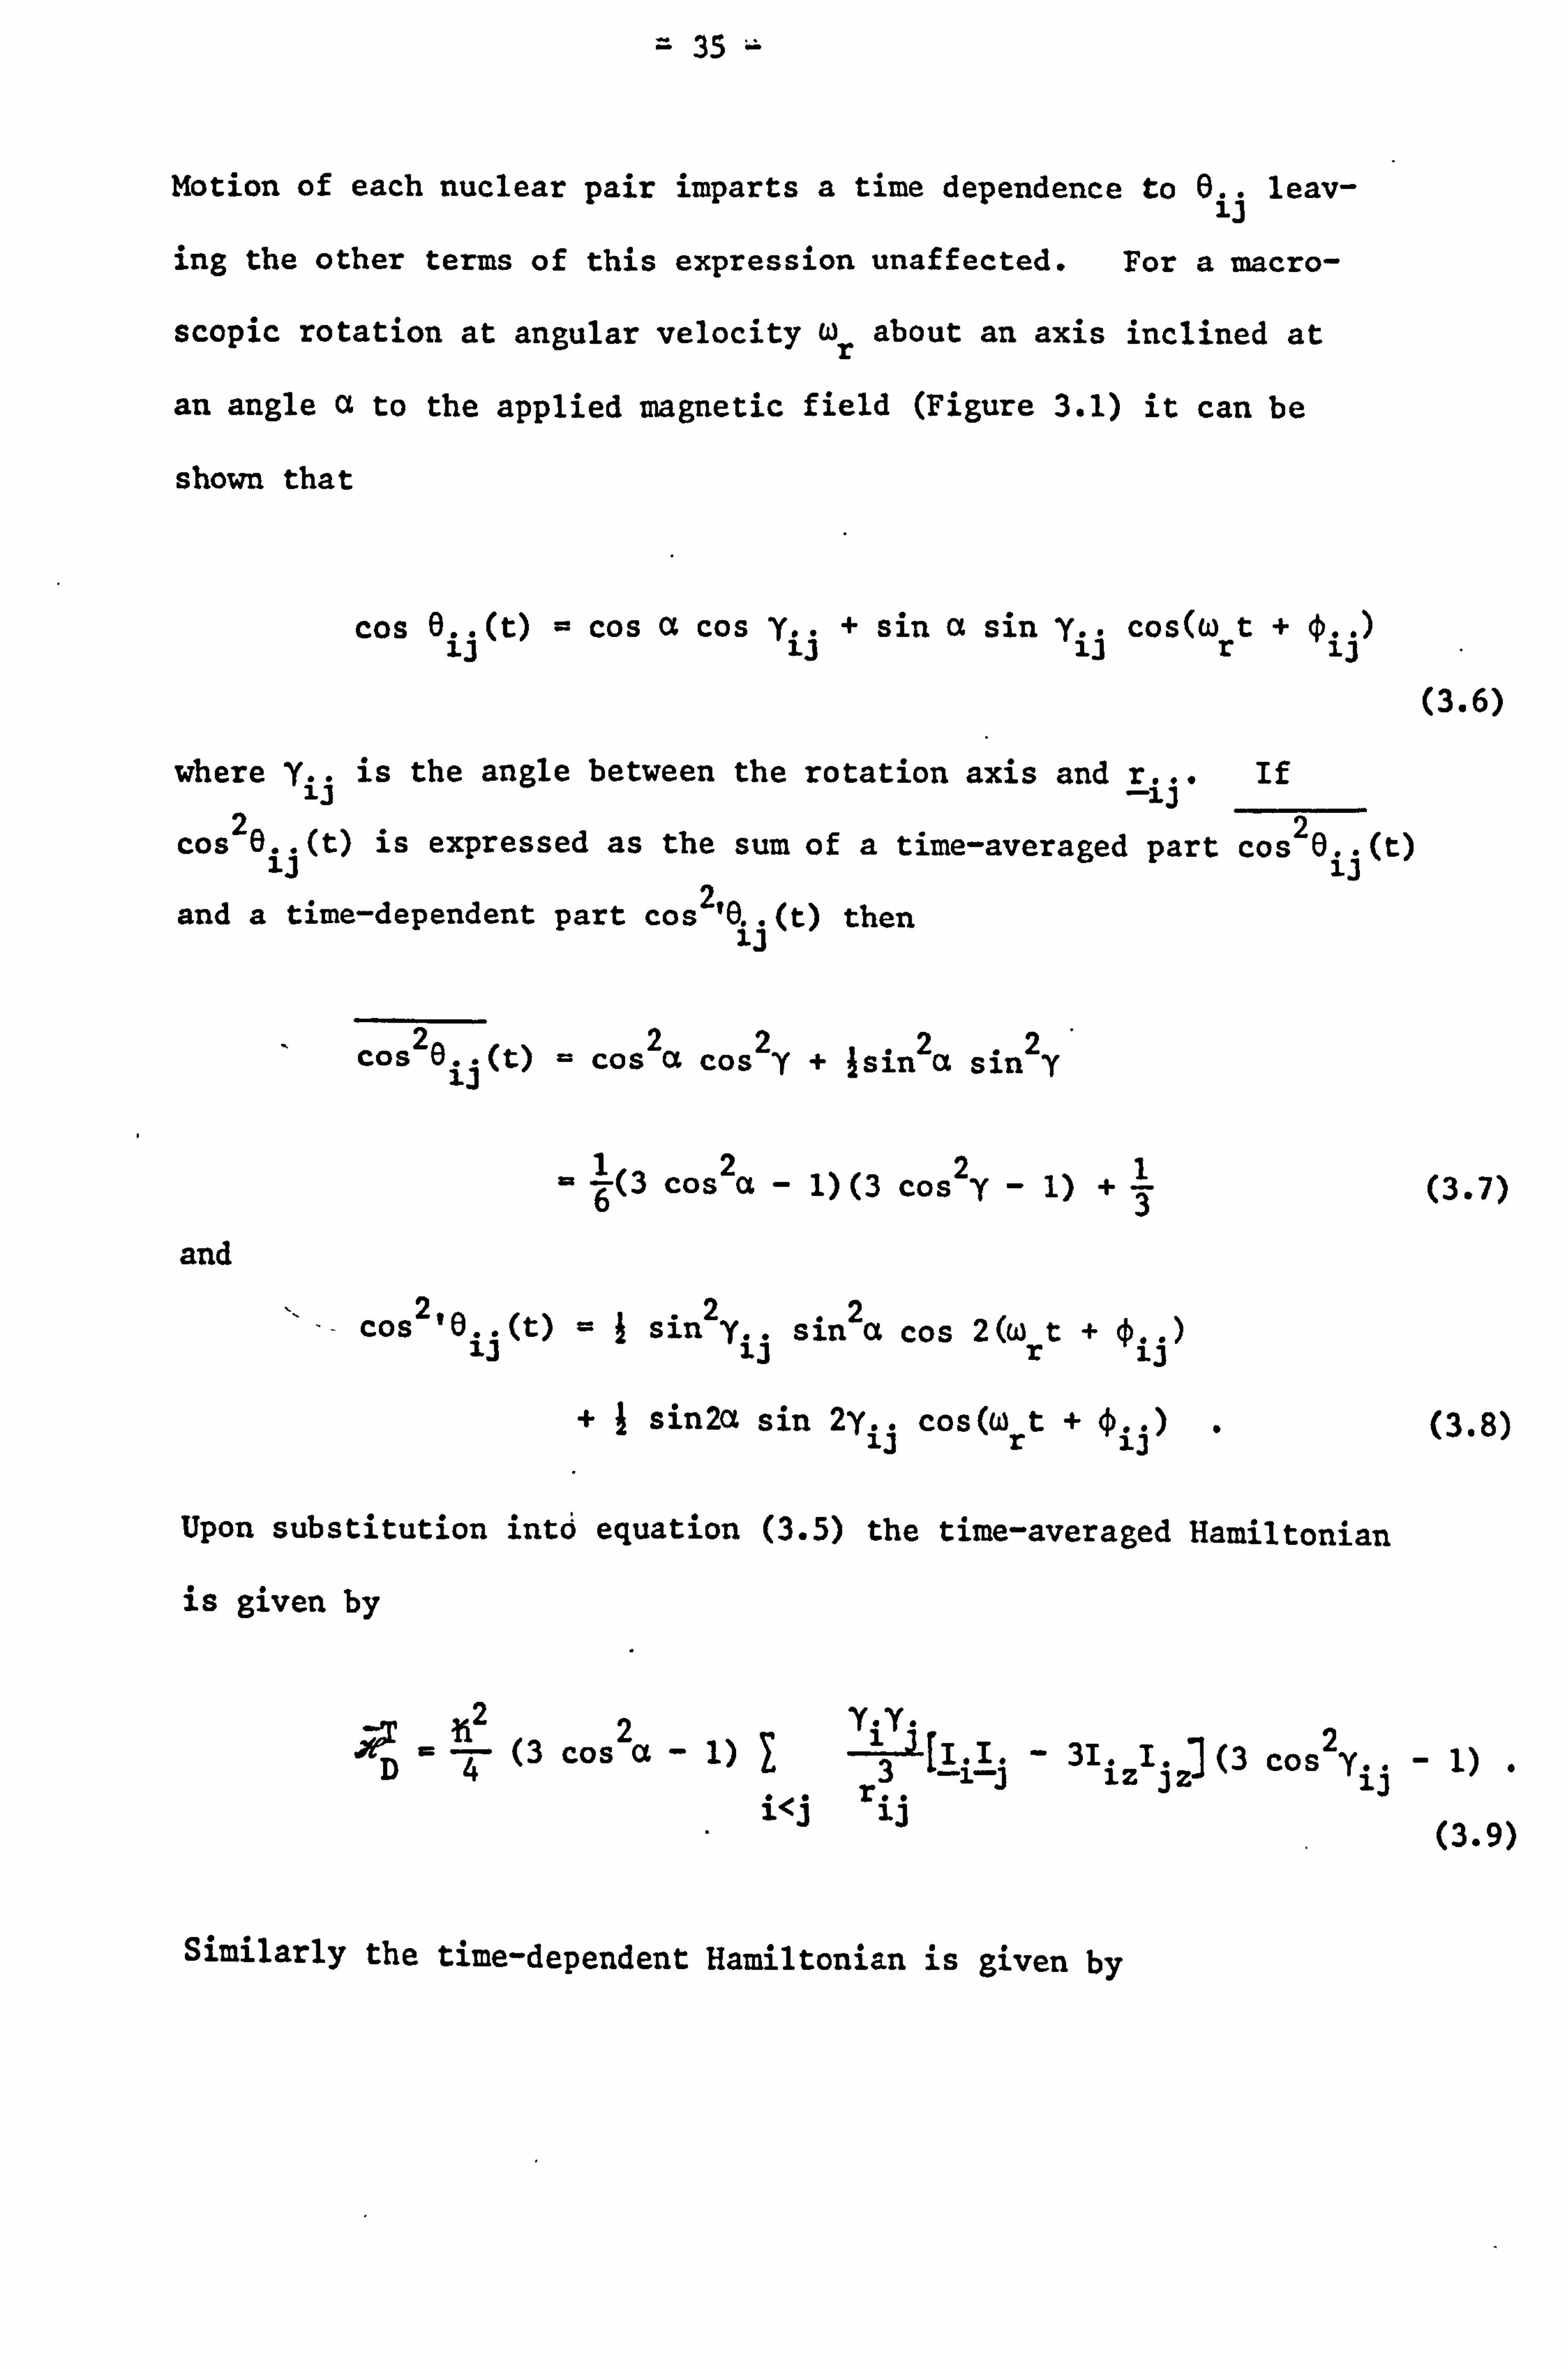
Similarly the time-dependent Hamiltonian is given by
- 36 -
D, (t) =
331 2 in 2aC1 Y"Y"
3f IfL - 31 izIjzl sin2yijcos 2 (wrt + ßi3 ) Gi<J
13
+ 3YI2 sin 2a
4
Y"Y"r
3 i<j r
ij
- 3I. ZIjZ]sin
2y.. cos(wrt + ýij),
(3.10)
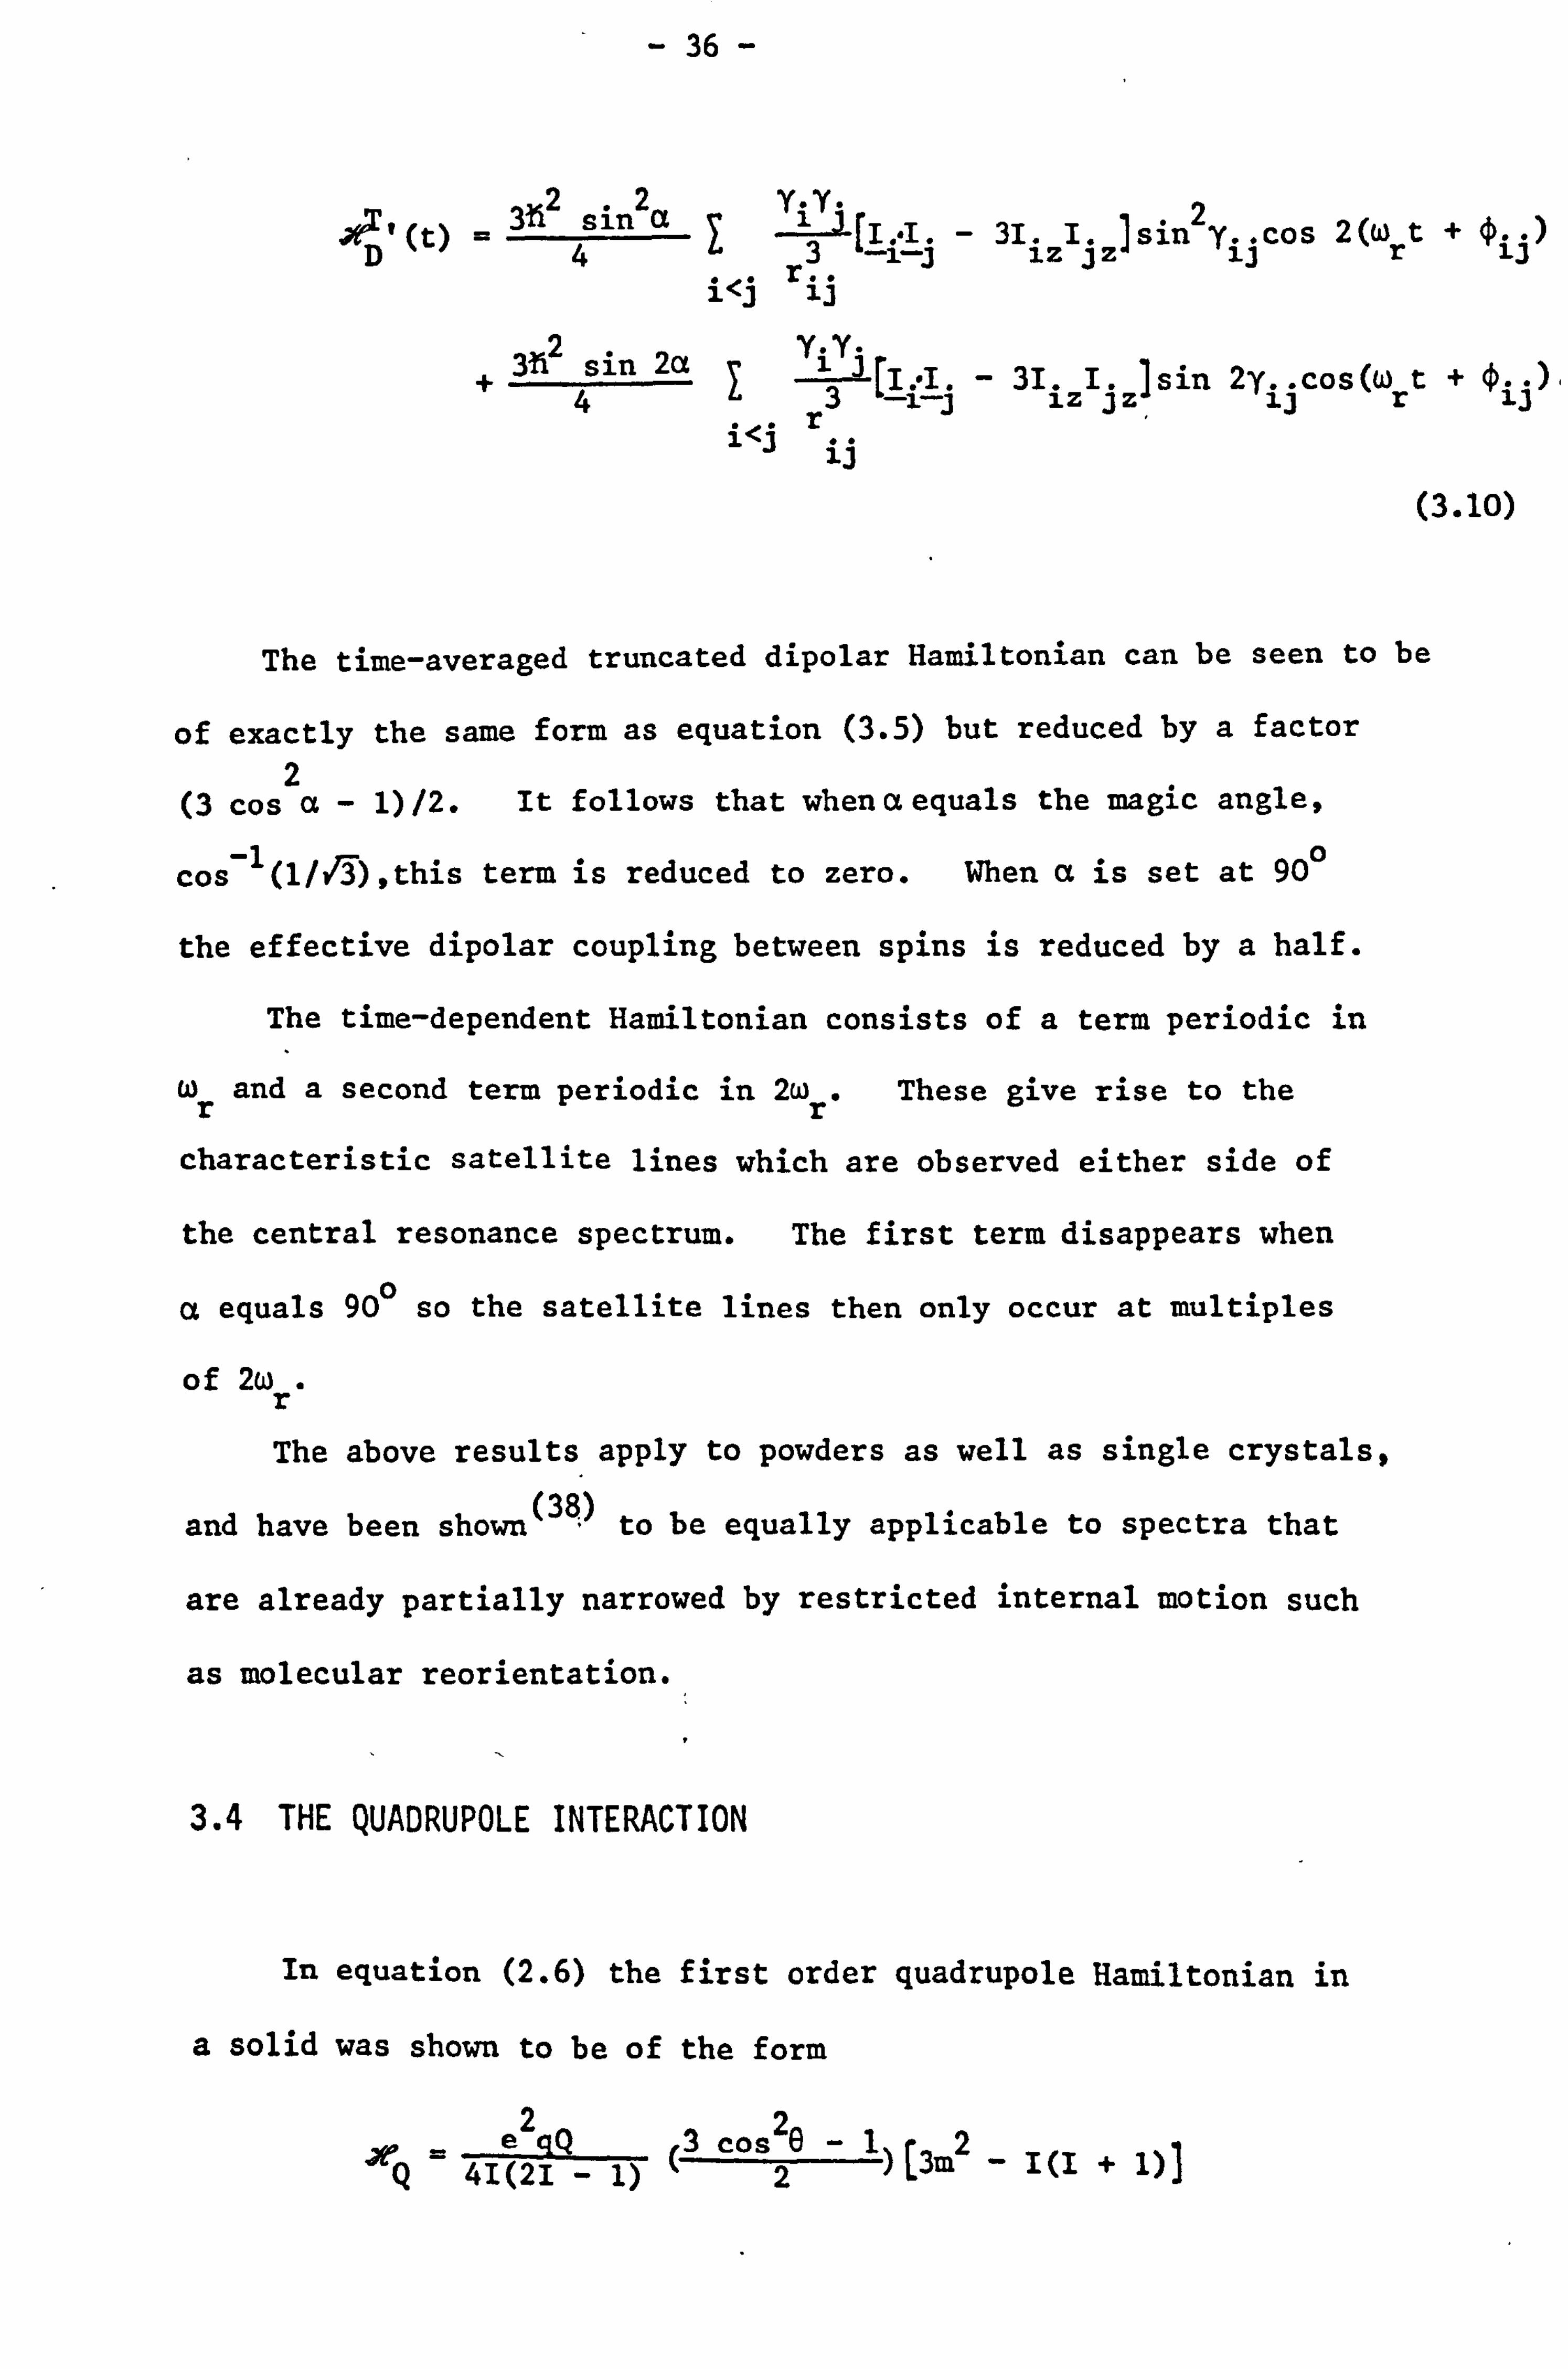
The time-averaged truncated dipolar Hamiltonian can be seen to be
of exactly the same form as equation (3.5) but reduced by a factor 2
(3 cos a- 1)/2. It follows that when a equals the magic angle,
cos-1(1/n), this term is reduced to zero. When a is set at 900
the effective dipolar coupling between spins is reduced by a half.
The time-dependent Hamiltonian consists of a term periodic in
wr and a second term periodic in 2wr. These give rise to the
characteristic satellite lines which are observed either side of
the central resonance spectrum. The first term disappears when
a equals 900 so the satellite lines then only occur at multiples
of 2wr.
The above results apply to powders as well as single crystals,
and have been shown(38) to be equally applicable to spectra that
are already partially narrowed by restricted internal motion such
as molecular reorientation.
3.4 THE QUADRUPOLE INTERACTION
In equation (2.6) the first order quadrupole Hamiltonian in
a solid was shown to be of the form
JrQ 41(21 - 1) (3 cos 220
- 1)[3m2 _ I(I + 1)1
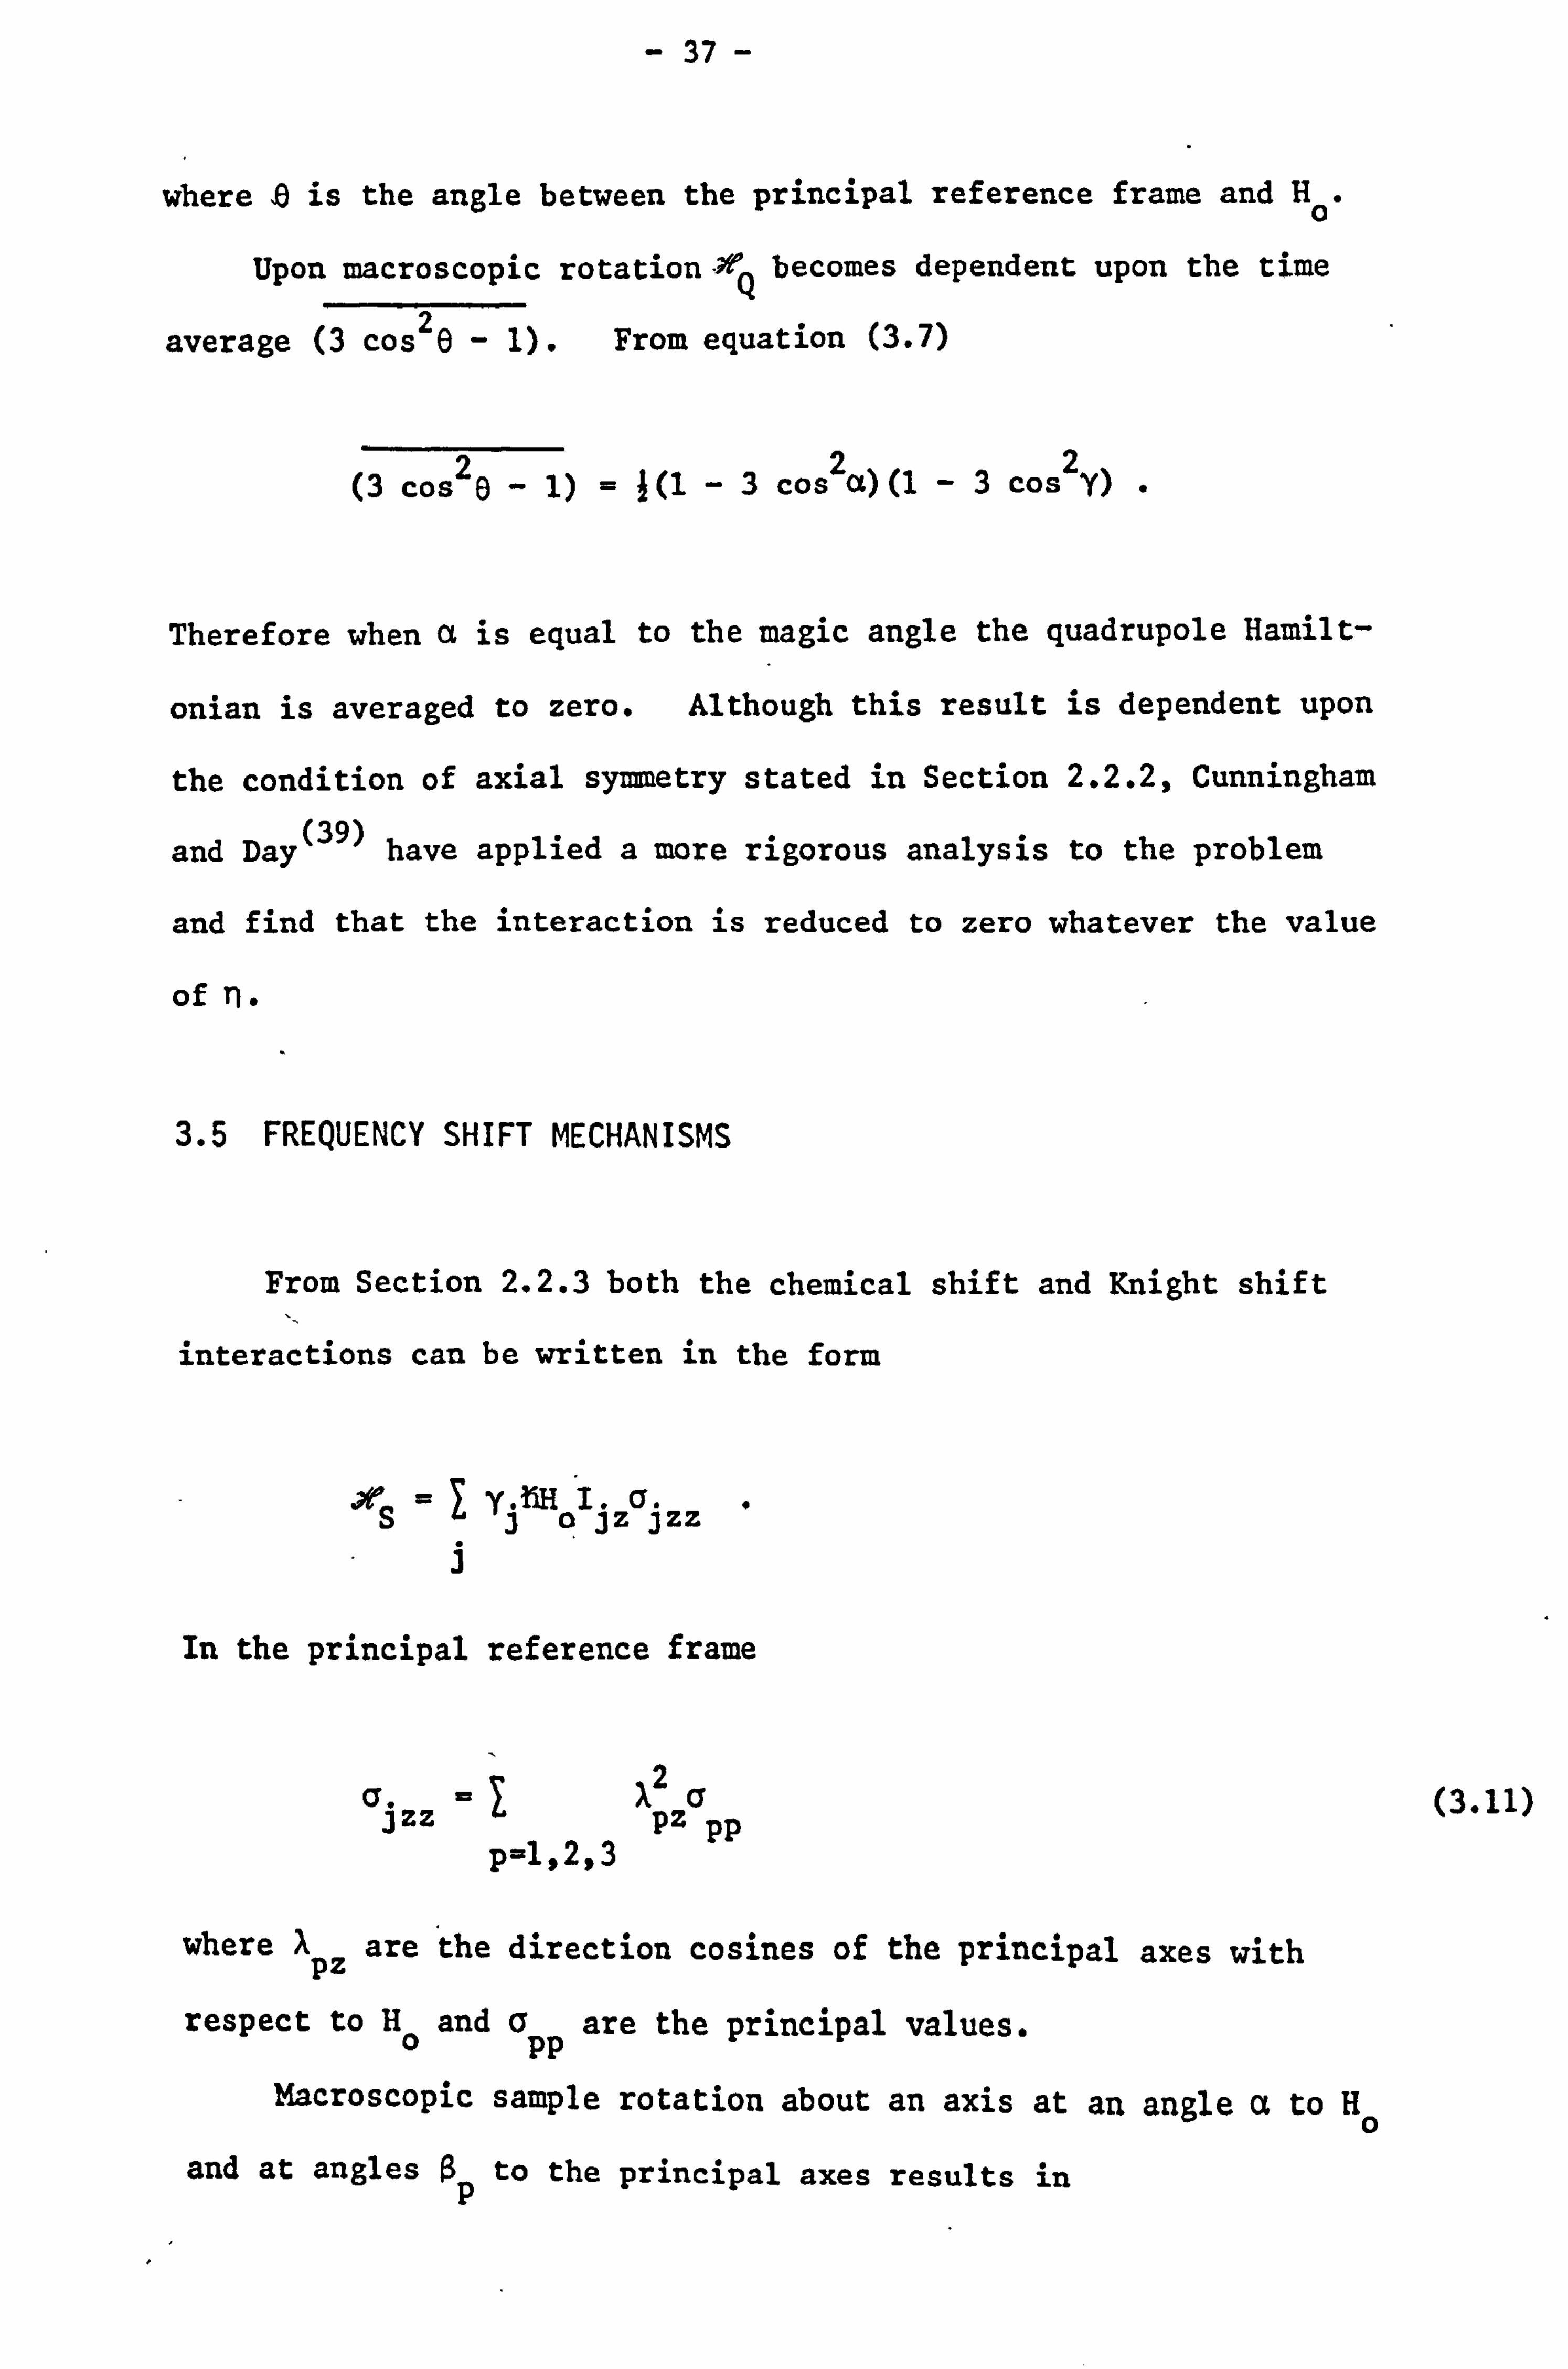
- 37 -
where is the angle between the principal reference frame and Ha.
Upon macroscopic rotation °Q becomes dependent upon the time
average (3 cos26 - 1). From equation (3.7)
(3 cos20 - 1) = J(1 -3 cos2a)(1 -3 cos2Y) "
Therefore when a is equal to the magic angle the quadrupole Hamilt-
onian is averaged to zero. Although this result is dependent upon
the condition of axial symmetry stated in Section 2.2.2, Cunningham
and Day (39) have applied a more rigorous analysis to the problem
and find that the interaction is reduced to zero whatever the value
ofrl.
3.5 FREQUENCY SHIFT MECHANISMS
From Section 2.2.3 both the chemical shift and Knight shift
interactions can be written in the form
JrS = Y31M01 j ZQ3 ZZ
J
In the principal reference frame
zcr ýjzz aL ýp2
p-1,2,3 PP
where apz are the direction cosines of the principal axes with
respect to Ho and app are the principal values.
Macroscopic sample rotation about an axis at an angle a to Ho
(3.11)
and at angles ßp to the principal axes results in
- 38 -
X (t) = cos a cos ßp + sin a sin 0p cos(wrt + ßp(0)) (3.12)
where ßp(0) is the azimuthal angle of the principal axis p at t=0.
The resulting time-averaged Hamiltonian is given by
S= YlHo y. IjZ[ sin2a Tr a+ 1(3 costa - 1)GOjpcos2ßip].
P
(3.13)
The time-dependent term. -'f'(t) consists of two terms periodic in wr
and 2wr which again give rise to rotational sidebands either side
of wo. When a= cos-'(l/F3) the time-averaged Hamiltonian reduces
to
A'S - iHo [Yi Ij z
Tr cri /3] (3.14) 3
as is the case for liquids. In this way anisotropic Knight shift
and chemical shift interactions may be averaged out. The correspond-
ing line-broadening effect present in polycrystalline samples is
therefore reduced to zero.
3.6 INDIRECT SPIN-SPIN INTERACTION k
The indirect spin-spin interaction Hamiltonian is given by
N
i<j
In metals the second rank tensor J may be separated into a scalar J
and a symmetric traceless tensor J* (see Section 2.2.4). Following
- 39 -
equation (3.1) the symmetric tensor interaction is given by
it ijPmliYijm =L xijpP ijpm Tijppl jm
p=1,2,3
Summation over repeated suffixes 2, m and n is again implied. The
expression may be truncated in a similar way to the normal dipolar
interaction by omitting non-secular spin terms which do not contrib-
ute directly to the observed spectrum. Then
-iýRm = -} Jij3t(3ýij3n 1ý + nij(ýij2n xijln)l
x (1.1. - 31. Iý Z)
where the asymmetry parameter TL i
is defined as
Ti.. = (Jij2 - J. jl)/Ji13 with J3 > J2 > J1 0
The direction cosines Xpn become time-dependent when the sample is
rotated such that as equation (3.7)
ýijpn 6(3 costa - 1)(3 cos.. 1) +3
where ßij p are the angles between the principal axes of J* and the
axis of rotation. When a is set to the magic angle, A2 2jpn is 1/3
for all three values of p and the time-averaged tensor J* is reduced
to zero. Hence rapid rotation about the magic angle effectively
transfers the anisotropic part of the indirect coupling interaction
to the spinning sidebands in exactly the same manner as the normal
dipolar interaction. The isotropic scalar term J is of course
unaffected by rotation.
(3.15)
(3.16)
- 40 -
3.7 THE EFFECT OF ROTATION ON THE NUCLEAR LINESHAPE
We have shown that sample rotation at the magic angle averages
out internal line-broadening interactions, although this result does
presuppose a sufficiently rapid rotation rate. We now consider
the form of the resulting spectrum.
The Hamiltonian describing the nuclear spin system may be
written as
jr _+ae +jP Zpm
where p is the sum of the secular perturbations and. *' is the mot-
Tonal Hamiltonian representing the kinetic energy. From equation
(2.18) the second moment of the nuclear lineshape about the centre
frequency is given by
Tr kp + ý, i 12 M2
3i2 Tr [Ixi 2
In the absence of p, the orientation of the nuclear spins in the
external magnetic field is independent of position or any relative
motion between spins. Consequently m commutes with IX. The
second moment of any resonance spectrum is therefore unaffected by
any sort of motion. However, as does not commute with p, it
can be shown(40) that the fourth moment is increased and the line-
shape altered in such a way as to narrow the central component and
enhance the wings.
Detailed calculations for the cases of both uniformly rotating
and randomly reorientating nuclear pairs confirm the above argu-
ments(41,42), In liquids rapid random reorientation can be thought
- 41 -
of as forming a continuum of sidebands which become unobservably
weak; hence resulting in the characteristic Lorentzian line-
shape. For macroscopic sample rotation at the magic angle the
central component of the absorption spectrum is flanked by a series
of sidebands at integer multiples of vr. As the rotation rate is
increased these sidebands move further out and become less intense.
When yr is greater than the linewidth the intensity of the satellites
falls as Vr for the nth satellite, thus preserving the total -2n
second moment. Both the central component and the satellites have
a finite width which decreases with increasing spinning frequency(43,44)
Accurate adjustment of the magic angle is an important criter-
ion in achieving a minimum linewidth. A reduction of the dipolar
linewidth to 1% of its original value requires that the magic angle
is set to an accuracy of better than half a degree. Such an
adjustment can best be performed empirically by direct observat-
ion of the FID from the rotated sample. With the assumption that
there is no antisymmetric component of the spin-spin interaction
the fully resolved central spectrum for any solid rotated about
the magic axis is determined by the Hamiltonian
, ýl° a -3i yß(1 -a)I. HO +I 3.. I.. Iý , J 1J
the same as that relating to fluids in high resolution NMR.
In practice complete resolution of the central line from the
first spinning sidebands flanking it either side is dependent upon
the frequency of rotation. The faster the sample is spun the
greater likelihood there is of attaining some rotationally invar-
iant limit. There have been several suggestions as to the manner
in which the residual dipolar broadening of the central spectrum
varies with rotation (33
rate, 34,38,45,46)
However experimental
(3.17)
- 42 -
observations are inconsistent with all of the simple relationships
predicted. Undoubtedly the precise form of the dependence is
determined by the line-broadening interactions present in the
. sample and hence the shape of the static absorption spectrum.
Generally the experimental lineshape narrows slowly until the rot-
ation frequency is about equal to the static half-width of the
absorption curve. It then narrows rapidly and later more slowly
until a rotationally invariant limit is reached.
We remark at this point that it was shown in Section 3.4 that
first order quadrupole broadening can be removed by rotation about
the magic angle. However, the rotation rates required for this
effect are normally considerably in excess of those which can be
achieved experimentally. If the quadrupole interaction is due
to imperfections in otherwise cubic solids it results in long tails
on the frequency spectrum which do not appreciably affect the line-
width. Dipolar broadening may then still be narrowed by magic
angle rotation, even though the quadrupolar broadening remains
unaffected.
In the limit any residual linewidth besides depending upon . ýt°
is subject to the normal field inhomogeneity and T1 broadening
mechanisms. Rapid rotation serves to average out part of the
contribution from field inhomogeneities but only in a plane perp-
endicular to the axis of rotation. The rotor systems employed
here could only be accommodated in a large magnet pole gap so the
field gradients along the axis of rotation could be significant in
determining the width of the narrowed central lineshape.
- 43 -
CHAPTER 4
EXPERIMENTAL ROTATION SYSTEMS
4.1 INTRODUCTION
The technique of magic angle sample rotation has been used to
observe fine structure in the NMR spectra of materials, which is
otherwise obscured by dipolar broadening(47). The rotation rates
employed have to be approximately the same as the static line-
width, and complete removal of the tensor broadening interactions
requires rates considerably in excess of this value. To this
end it has been necessary to use systems of rotation which are
capable of extremely high spinning frequencies. The highest rotat-
ion rate ever recorded is 1.5 MHz, using a fine metallic wire
supported magnetically(48). Obviously similar forms of suspen-
sion are excluded by the limitations imposed by NMR, so small
gas turbine systems are normally employed.
In the course of the work reported here three different such
turbine systems were constructed and used, which we shall call the
conical, foil bearing and Prague systems. Although the conical
rotors (19)
have been developed in the laboratory over a period of
some years, the foil bearing rotors represented a new approach to
the high speed rotation technique. Some time was spent on the
development and successful adaptation of these rotors for use in
conjunction with NMR measurements. The third type of gas turbine
was constructed following the design used by a group of experi-
mentalists in Prague(50). A study of this type of turbine showed
- 44 -
that it apparently offered no advantages over the other rotor
systems. Because of the non-trivial nature of the problem we
include below a short discussion of some of the criteria relevant
to the design of gas turbine systems for use in conjunction with
NMR.
4.2 ASPECTS OF ROTOR DESIGN
4.2.1 MATERIALS
The materials from which the rotors and the surrounding rig
are constructed must not upset the NMR measurements either by
affecting the homogeneity of the magnetic field or by causing
stray pick-up in the detection coil. The rotor itself cannot be
made from any metal because the speed of rotation in the external
field is then severely restricted by induced eddy currents.
4.2.2 SIZE
The size of the complete rotor system is. limited by the magnet
gap. However the sample volume must be such that a reasonable
signal-to-noise figure can be attained with the NMR equipment avail-
able. Although this condition varies greatly depending upon the
NMR sensitivity of the particular nuclei under investigation most
turbine systems used are capable of carrying a sample of volume
between 0.1 and 1.0 cc.
The sensitivity of the system is considerably-enhanced by
winding the detection coil co-axially about the rotor. The fill-
ing factor is maximized in this way but it should be remembered
that, if the same coil is used in the transmitter circuit, the Hl
field produced is not perpendicular to Ho.
- 45 -
4.2.3 STRESSES
The rotor has to withstand the large internal stresses gener-
ated by rapid rotation. Considering the simplified case of an
infinitely long hollow tube (and hence ignoring axial stresses)
the radial and tangential stresses are given by(5l)
a 23+u [a2+b2-r2-a2b2-
r=r8l r2
Q= pw2 3+u ra2 + b2 -1-
3u r2 + a2b2
tr8L 3+ 11 r2
where Wr is the angular velocity, p is the Poisson ratio and p is
the density of the rotor material; a and b are the internal and
external radii respectively. Therefore the maximum tangential
stress acts at the inner edge of the tube. The radial stress is
zero at the surfaces and has a maximum value at a radius given
by ab.
For the case of a solid rod a is zero and the maximum stresses
act at the centre where
at =a =pb2w2 3 8u
These stresses are proportional to the squares of both the external
radius and the spinning frequency.
4.2.4 THE PROBLEM OF WHIRL AND ROTOR BALANCE(52)
Probably the simplest rotor system would take the form of a
cylinder supported by one or more journal bearings, but most journal
(4.1)
(4.2)
- 46 -
bearings suffer from instabilities. There is usually some sort
of resonant response when the spinning frequency corresponds to
the natural frequency of the rotor in its bearing constraints.
However, very often the critical factor is a vibration called 'half-
speed whirl'. Whirling arises because when a rotating cylinder
is displaced from its equilibrium position the restoring force
from the bearing does not act straight back towards the centre but
at an angle towards the direction of rotation. Half-speed whirl
occurs at a frequency exactly half the rotor running speed. Although
the amplitude of the whirling motion may be small, this vibration
is sharply resonant where the natural frequency of the rotor is
close to this value. Then it invariably leads to rapid failure of
the bearing supports.
Any imbalance of the rotor gives rise to an out-of-balance
disturbance at the rotation frequency. Although machining toler-
ances are important, the inclusion of a sample can often cause a
drastic rotor imbalance. The most reliable systems are those in
which these factors are not critical.
4.2.5 THE DRIVING JETS
Assuming that a rotor is efficiently supported, its rotation
speed is determined by the velocity of the gas passing through the
driving jets. Using simple convergent nozzles the maximum exit
velocity is limited to the sonic velocity of the gas in the region
of the nozzle exit(53). Higher rotation speeds may in principle
be achieved by using supersonic gas nozzles, but the design and
manufacture of these involves advanced engineering concepts.
- 47 -
The problem may also be overcome by using a propelling gas in
which the velocity of sound is much higher. The maximum velocity
of the rotor is then determined by other factors - usually
mechanical - before the sonic limit is reached.
4.3 THE CONICAL ROTOR SYSTEM
4.3.1 DESCRIPTION
This rotor system is based on the type originally described
(54) by Henriot and Huguenard and by Beams ý55,56),
The conical-
shaped rotor base sits in a stator in which there are a series of
jets. The gas passing through these jets serves both to lift
the rotor off the base stator and to drive it round. Because of
the Bernoulli forces the rotor does not fly out of the stator,
but is supported by a cushion of air.
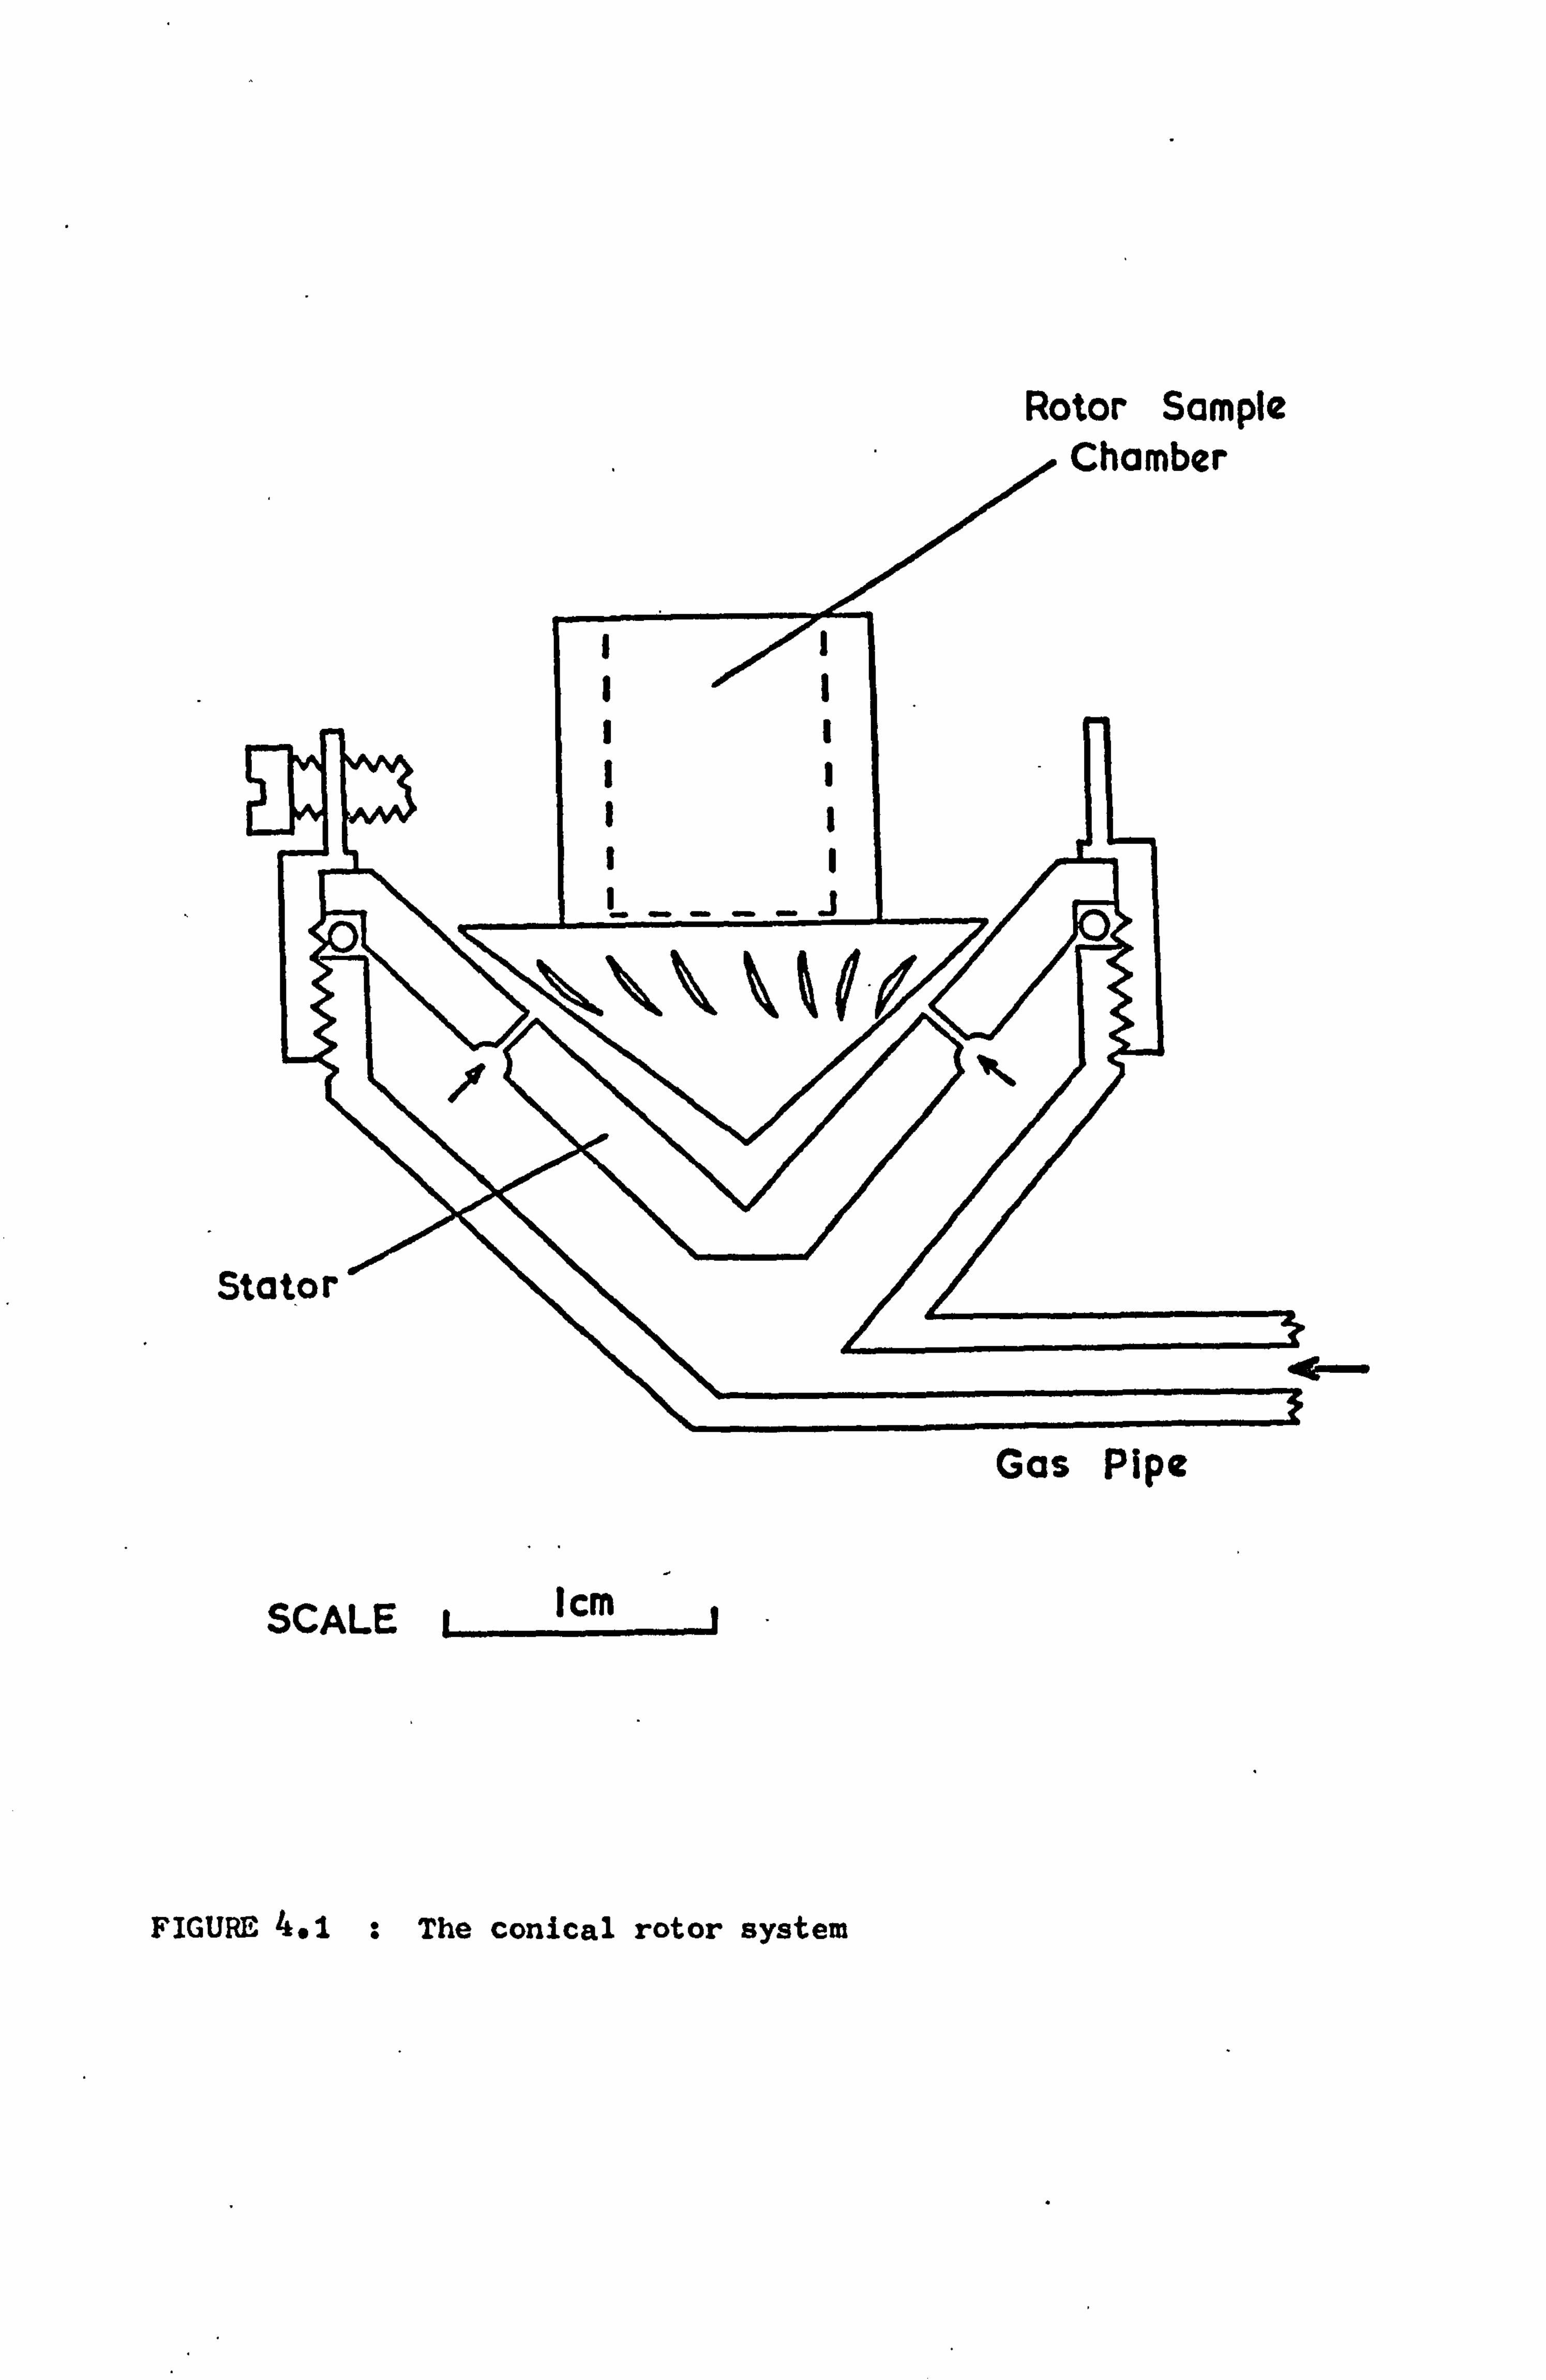
The present system, shown in Figure 4.1, is a compromise bet-
ween sample size and the higher rotation speeds possible with
smaller diameter rotors. The rotors have a series of 20 flutes
cut to a depth of 0.030" at an angle of approximately 300 to
the vertical axis. In the past much effort has gone into optimiz-
ing the number, position and size of the jets in the stator(57,58).
The most efficient combination of rotor and stator has been found
to vary with each individual rotor. Generally the best results
were achieved here using stators with 23 0.015" diameter jets set
in a single ring. Each jet was drilled at an angle of 600 to a
vertical line through the-apex of the stator and in a plane tangent-
ial to the rotor flutes at each point.
I
SI
Rotor Sample Chamber
Eý
SCALE il cm
Gas Pipe
FIGURE 4.1 : The conical rotor system
- 48 -
4.3.2 EXPERIMENTAL DETAILS
At a spinning frequency of 5 kHz the velocity of the rotor
flutes is close to the velocity of sound in air. Both hydrogen
and helium are capable of propelling rotors to considerably greater
speeds, but because sparks are often produced when a spinning rotor
touches the metal stator, helium is the gas used on the grounds
of safety. By using a compressor it would have been possible to
(59) collect and recycle helium after use. However, in practice
such an arrangement was not found to be very satisfactory because
the gas soon became 'dirty'. With the pulse spectrometer used
in this work it was only necessary to maintain rotation frequencies
for relatively short periods - particularly for metals with their
short spin-lattice relaxation times. Helium could then reason-
ably be taken directly from a cylinder and vented to the atmos-
phere. Unfortunately it proved extremely difficult to start the
rotors spinning with helium as the driving gas. The reason for
this was unclear, but attributed to the low gas density, the large
masses of the metallic, specimens and the lack of dynamic balancing.
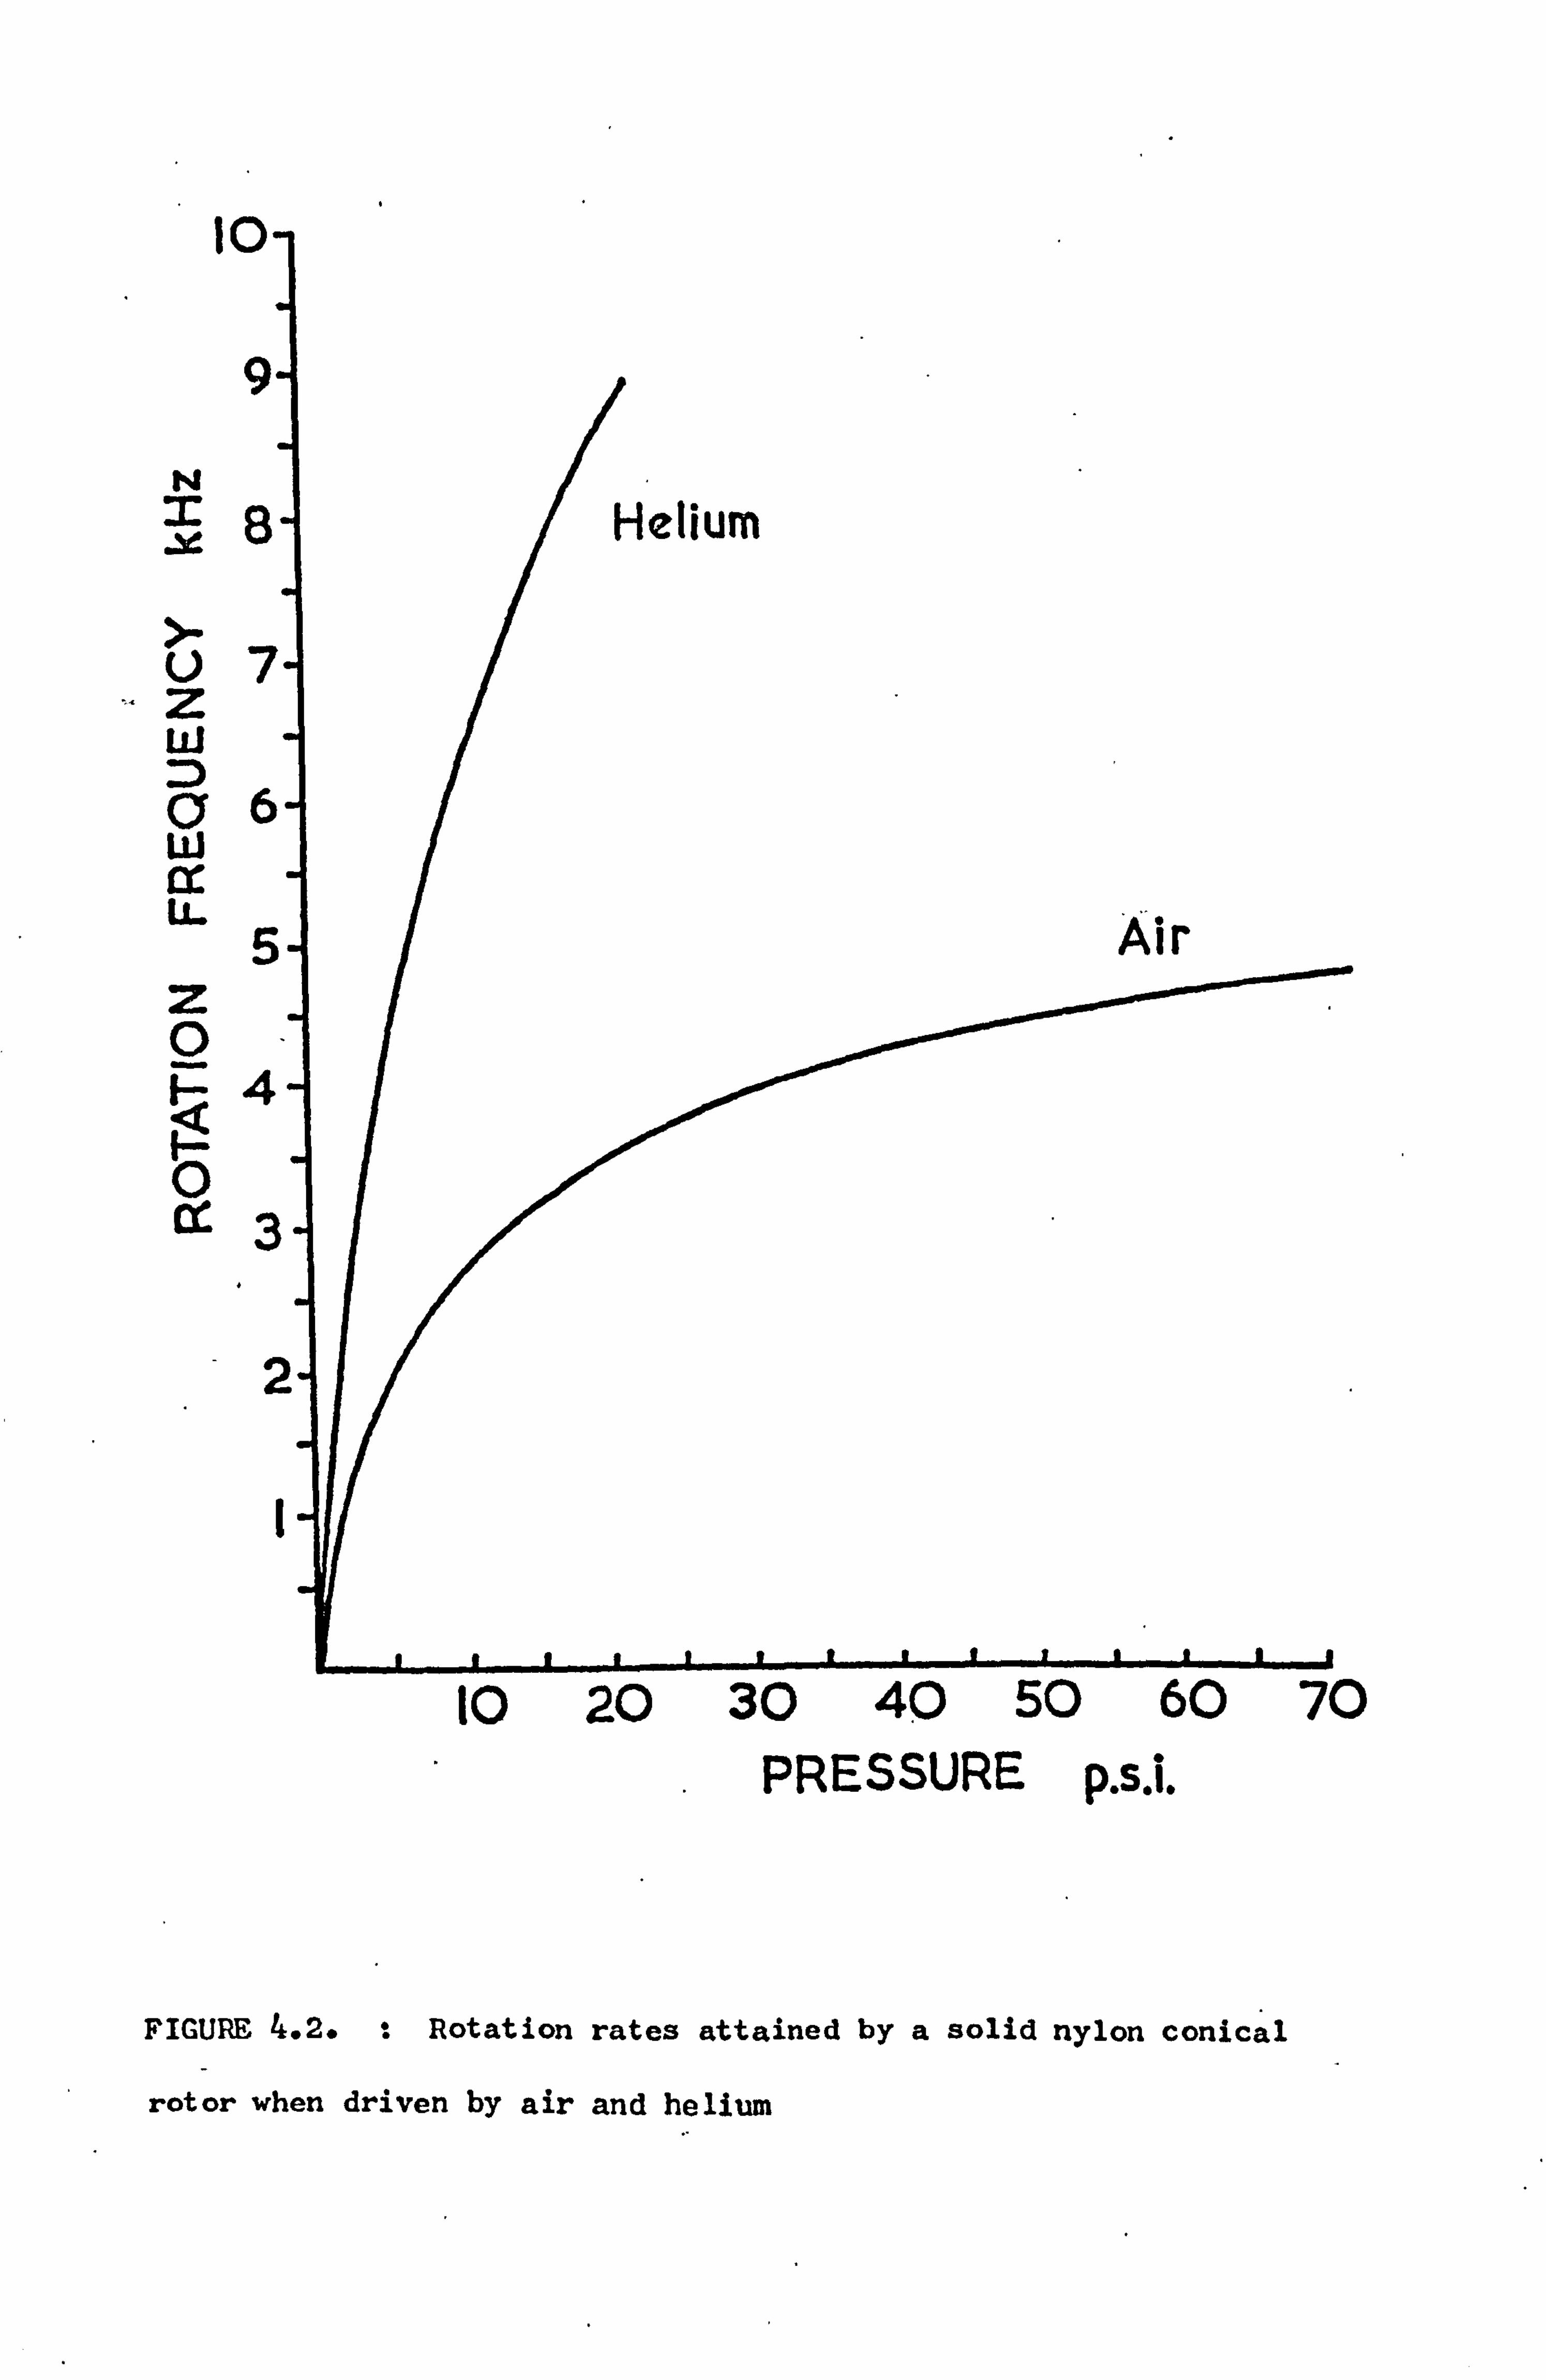
Figure 4.2 shows the rotation rates that have been achieved by a
solid nylon rotor when propelled by compressed air and helium.
The conical rotors start more easily with their axes of rotat-
ion vertical, but will rotate about any direction - even upside
down. Consequently a normal electromagnet was employed in this
work and the rotors spun about an axis inclined at 540 44' to the
horizontal magnetic field.
The single radiofrequency coils were wound on nylon formers
and held in position about the rotor superstructure by screws
1
to
9
N
. ýC 8
Ü7 Z w D 06 w ax U. 5 z 0 Q4
oC
d
FIGURE 4.2. t Rotation rates attained by a solid nylon conical
rotor when driven by air and helium
10 20 30 40 50 60 70 PRESSURE p. s. i.
- 49 -
through the stator clamping ring. The presence of the coils
affected the running characteristics of a particular rotor. Using
coils such that the mean clearance between the rotor and former
was approximately 1 mm, the rotors were most stable when running
very close to the coil at one point.
For test purposes the spinning rate was determined by using
a Dawes 1205A high frequency stroboscope, but this was not possible
when the rotor was enclosed in the spectrometer probe assembly.
The rotors emit a characteristic note at the frequency of rotation.
Therefore in the audio range the rotation frequency could be measured
by listening for beats against the note emitted by a loudspeaker
coupled to an audio oscillator. Beyond the frequency range 2-6 kHz
this technique became inconvenient because of the difficulty of
detecting beats by ear. At higher speeds the rotation rate could
be determined either by direct observation of the FID or by a
corresponding measurement of the separation between spinning side-
bands of the transformed lineshape.
4.3.3 ROTOR MATERIALS
Solid nylon rotors have been run up to speeds of 10 kHz, but
the strength of the rotors is substantially reduced by the machining
of the sample chamber. At speeds above 4 kHz there is consider-
able radial growth of the walls of the sample chamber and at higher
speeds they soon burst. To-date the use of other commercially
available materials (e. g. brands of tufnol, reinforced nylon, etc. )
has failed to result in any significant improvement, although some
success has been achieved in the past by using a glass cloth (59)
wrap
- 50 -
The rotors used in this work were manufactured from glass
fibre rods produced in the laboratory. Continuous 20 end roving
pre-impregnated s glass E747, made by U. S. Polymeric Inc. and
generously supplied by British Aerojet Ltd. was wound under a
resin mix: Epikote 828/Epikote JPA/BDMA accelerator using a
coil winder especially adapted for the purpose(59). The result-
ing rods were cured in a temperature-controlled oven. Rotors
manufactured from the material produced from a simple hoop wind-
ing pattern of the glass fibres were unsatisfactory because the
axial strength provided by the resin mix was insufficient to with-
stand speeds in excess of 5 kHz. To overcome this problem the
coil winder was further modified to produce 300 helical windings.
Although the material so produced had the required axial strength
the pointed outer edges of the rotors tended to delaminate upon
impact with the stator. Generally, the most reliable rotor mater-
ials were those produced by combining an initial helical winding
pattern with a hoop wound outer ring. Rotors manufactured from
a composite material made by hoop winding the glass fibre rovings
on to a thin tube of glass cloth wrap proved equally robust.
4.4 THE FOIL BEARING ROTOR SYSTEM
4.4.1 INTRODUCTION
A foil bearing is formed between a flexible member and a rigid
surface. Considering Figure 4.3 the foil is wrapped around the
circular shaft and held under tension. As the shaft is rotated
gas is drawn between the shaft and the foil by viscous drag. In
a central region both the gap and the pressure are uniform: the
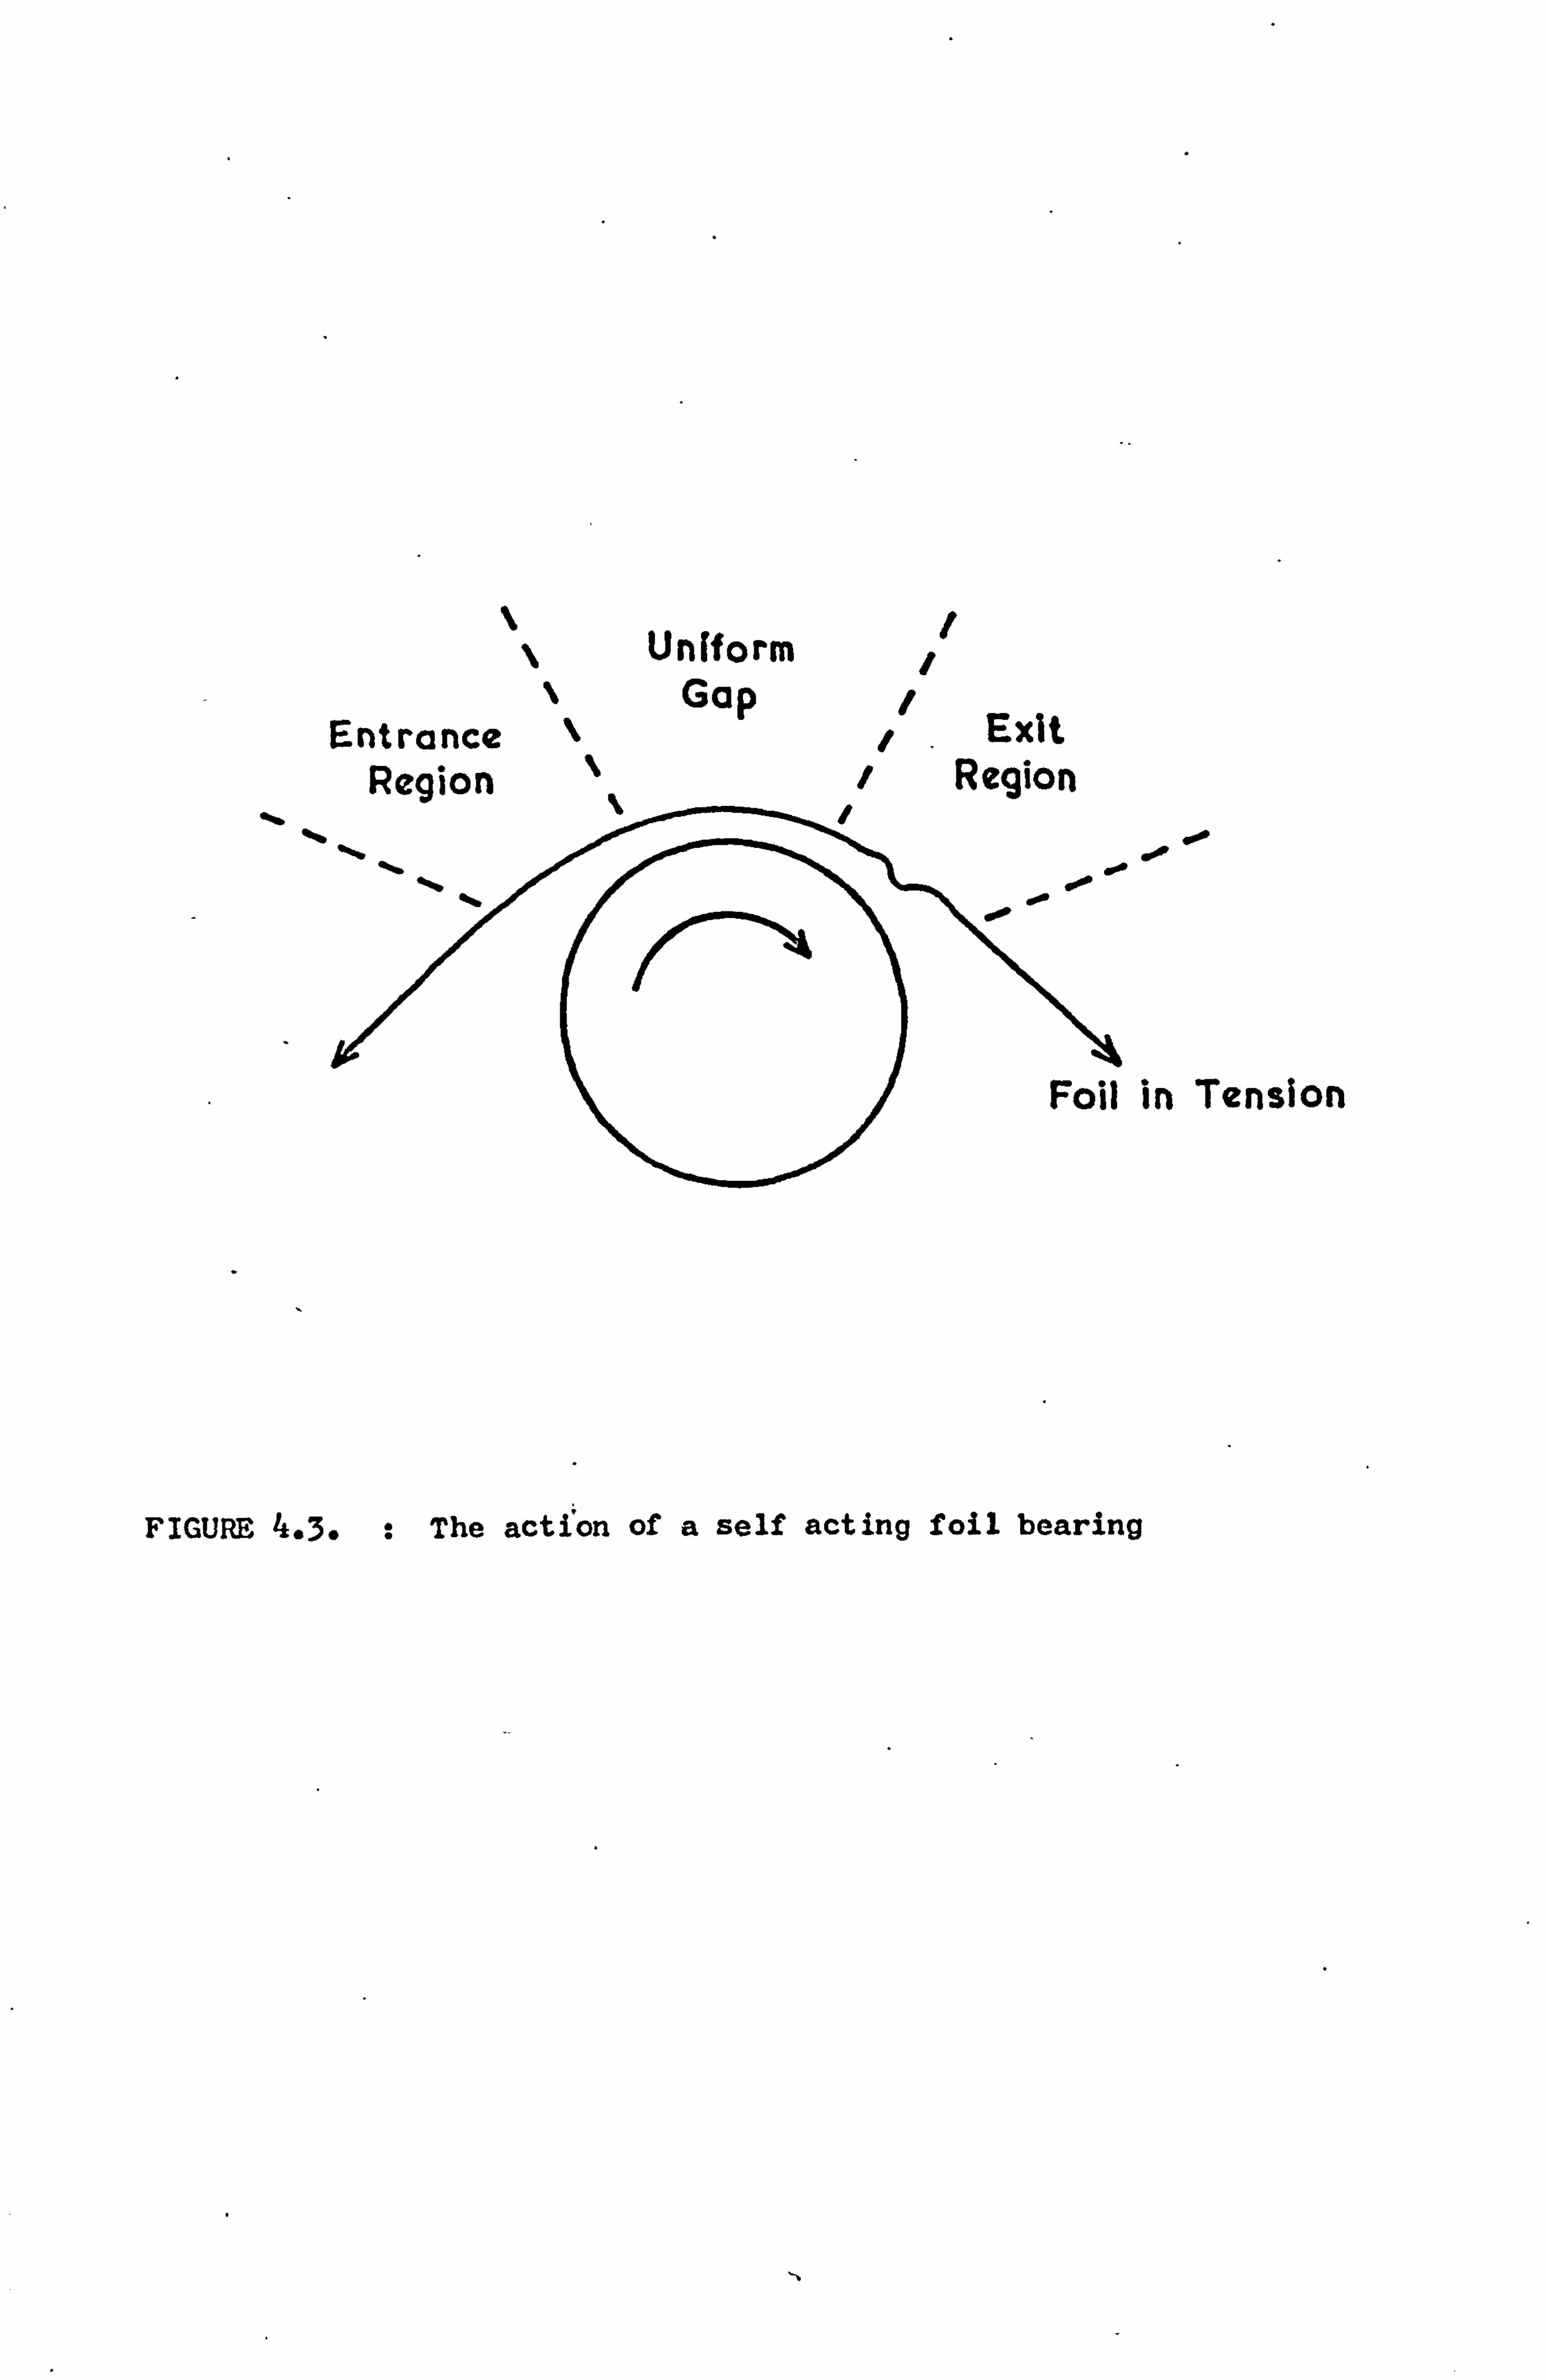
Entrance Region
i r 00 i
010 i
Foil in Tension
FIGURE 4.3. : The action of a self acting foil bearing
f Uniform Gap
fý Exit f Region
%
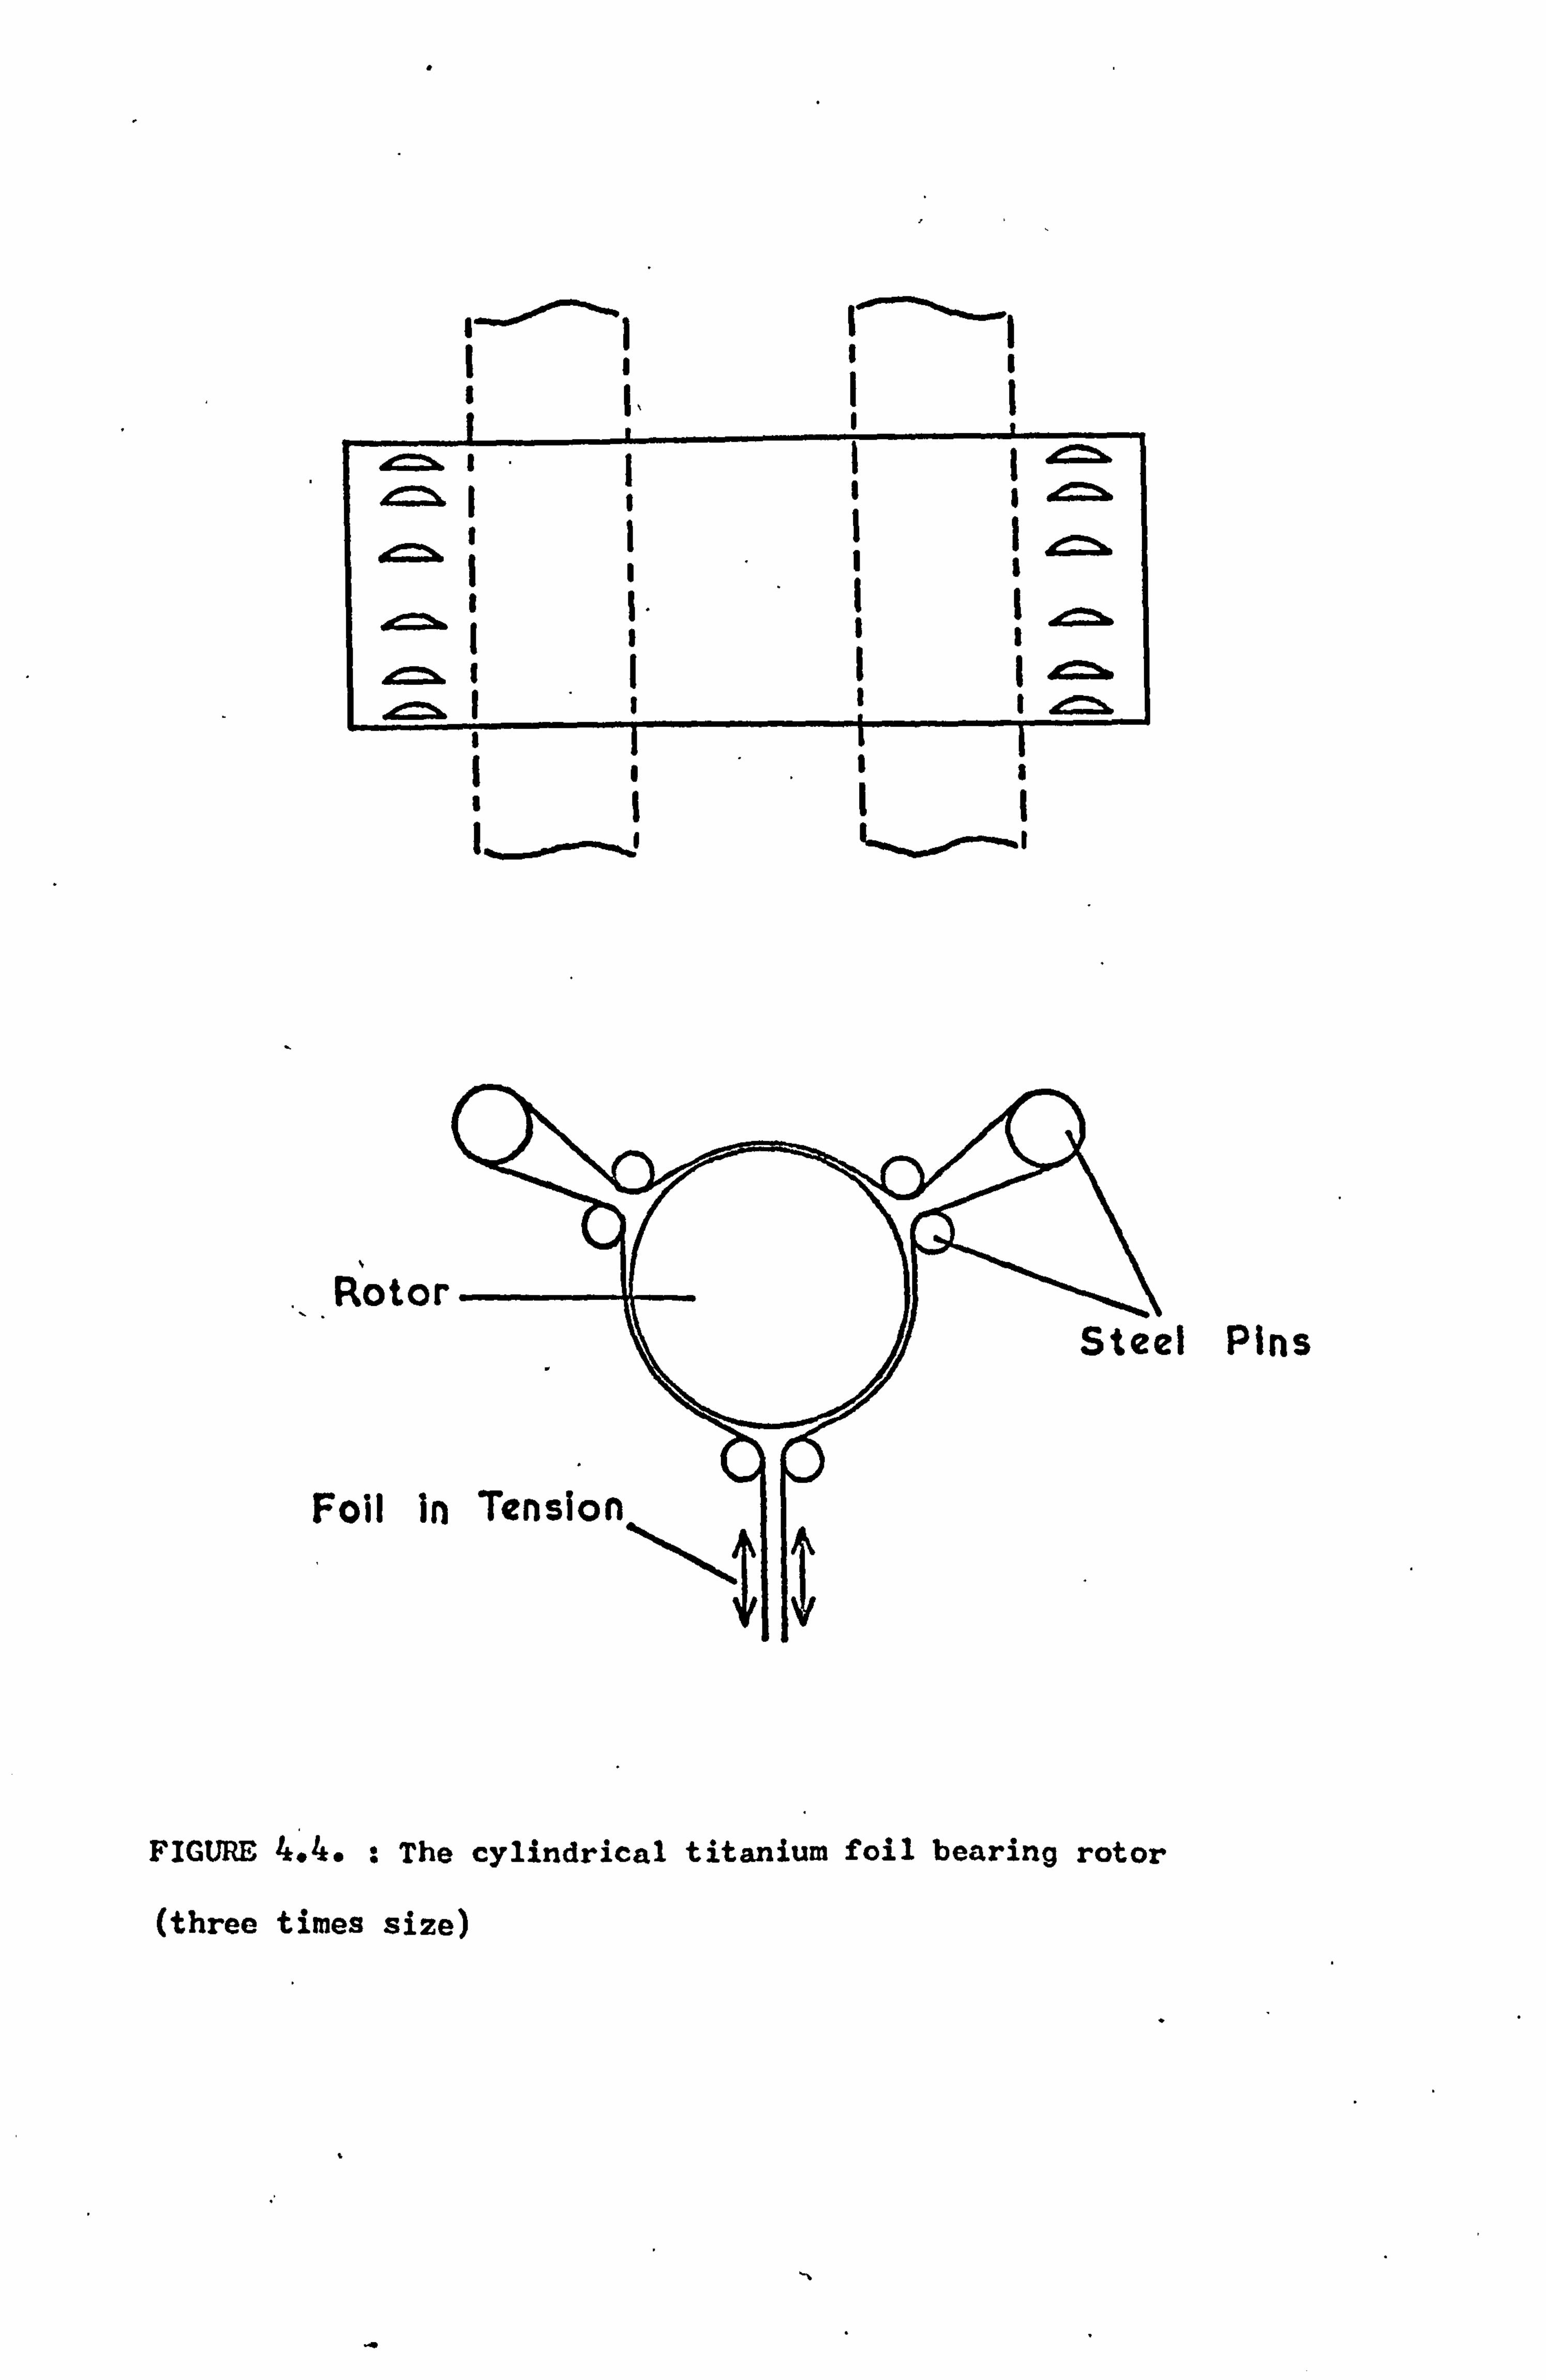
IJýi t - 1 -
O 1 1 p
1
OI ý I ýd Ip I 1 D
I'i 1'`
Rotor :i Pins
Foil in
FIGURE 4.4. : The cylindrical titanium foil bearing rotor
(three times size)
1
- 51 -
gap then diverges and the pressure is reduced. The bearing
formed in this way always acts perpendicularly to the surface of
the rotor so the system is free from the problems of fractional
speed whirl. Because the foil is flexible the bearing is un-
affected by a certain degree of misalignment or imbalance in the
rotor (60).
A preliminary investigation into the feasibility of attain-
ing high rotation frequencies by using a three pad foil bearing
rotor system was undertaken by the Gas Bearing Advisory Service
(61) at Southampton University. Considerable success was achieved
with metallic rotors and a cylindrical titanium rotor (shown in
Figure 4.4) reached a rotation speed of 15 kHz when propelled by
helium. A second type of rotor with smaller diameter bearing
axles, placed at the extremities attained a speed of 11 kHz.
However with non-metallic bearing surfaces the rotors failed to
run reliably if at all.
4.4.2 THE ROTOR
Experience with foil bearings has shown that the use of a
polished bearing surface is a most important criterion for their
reliable operation. Larger diameter bearings tend to be slightly
less susceptible to small surface irregularities - the mean bear-
ing pressure is lower so there is greater clearance between the
foil and the rotor. Against this the rotationally induced stresses
are also greater so the rotor arbors have to be stronger mechanically.
Various non-metallic materials have been used for the rotor
axles including several types of tufnol, nylon, glass, glass fibre
and ceramic. Those rotors which-did run either became unstable
)
- 52 -
at rotation speeds around 4 kHz or suffered mechanical failure.
Attempts were made to improve the efficiency of the smaller diameter
bearings by both sheathing and coating the surfaces with metal.
Under test such rotors ran reliably at speeds up to 10 kHz with-
out failure. However when placed in the electromagnet, it was
found that the quantity of metal needed to secure a good mechanical
bond to the non-metallic arbor was sufficient to result in consider-
able eddy current damping. Therefore the problem has been to
find a suitably strong, polished, non-metallic material from which
to make the bearing axles.
The only such materials with which there has been any degree
of success to-date are glass and alumina ceramic. Using two short
axles glued into a glass fibre body glass disintegrated at rotation
frequencies around 6 kHz. Slightly higher speeds were possible
with alumina axles, but the rotors then became extremely unstable.
From the successful running of rotors with solid metal and glass
arbors it was obvious that the circularity of the bearing axles
was not too important. However, the accurate alignment of the
two axles in the rotor body was found to be critical to the attain-
went of higher rotation rates.
Various simple positioning jigs were tried out but the necessary
degree of alignment was only realized by using a cylindrical assembly
made from hardened steel as shown in Figure 4.5. Alumina rods
obtained from Degussit were cut square to length and diamond ground
to a tolerance of 0.0005" on the diameter, so as to be a close fit
in the jig. They were glued into the rotor body with araldite
epoxy and polished afterwards with Hyprex 6-w-45 diamond compound.
The rotor bodies were machined from helically wound glass fibre,
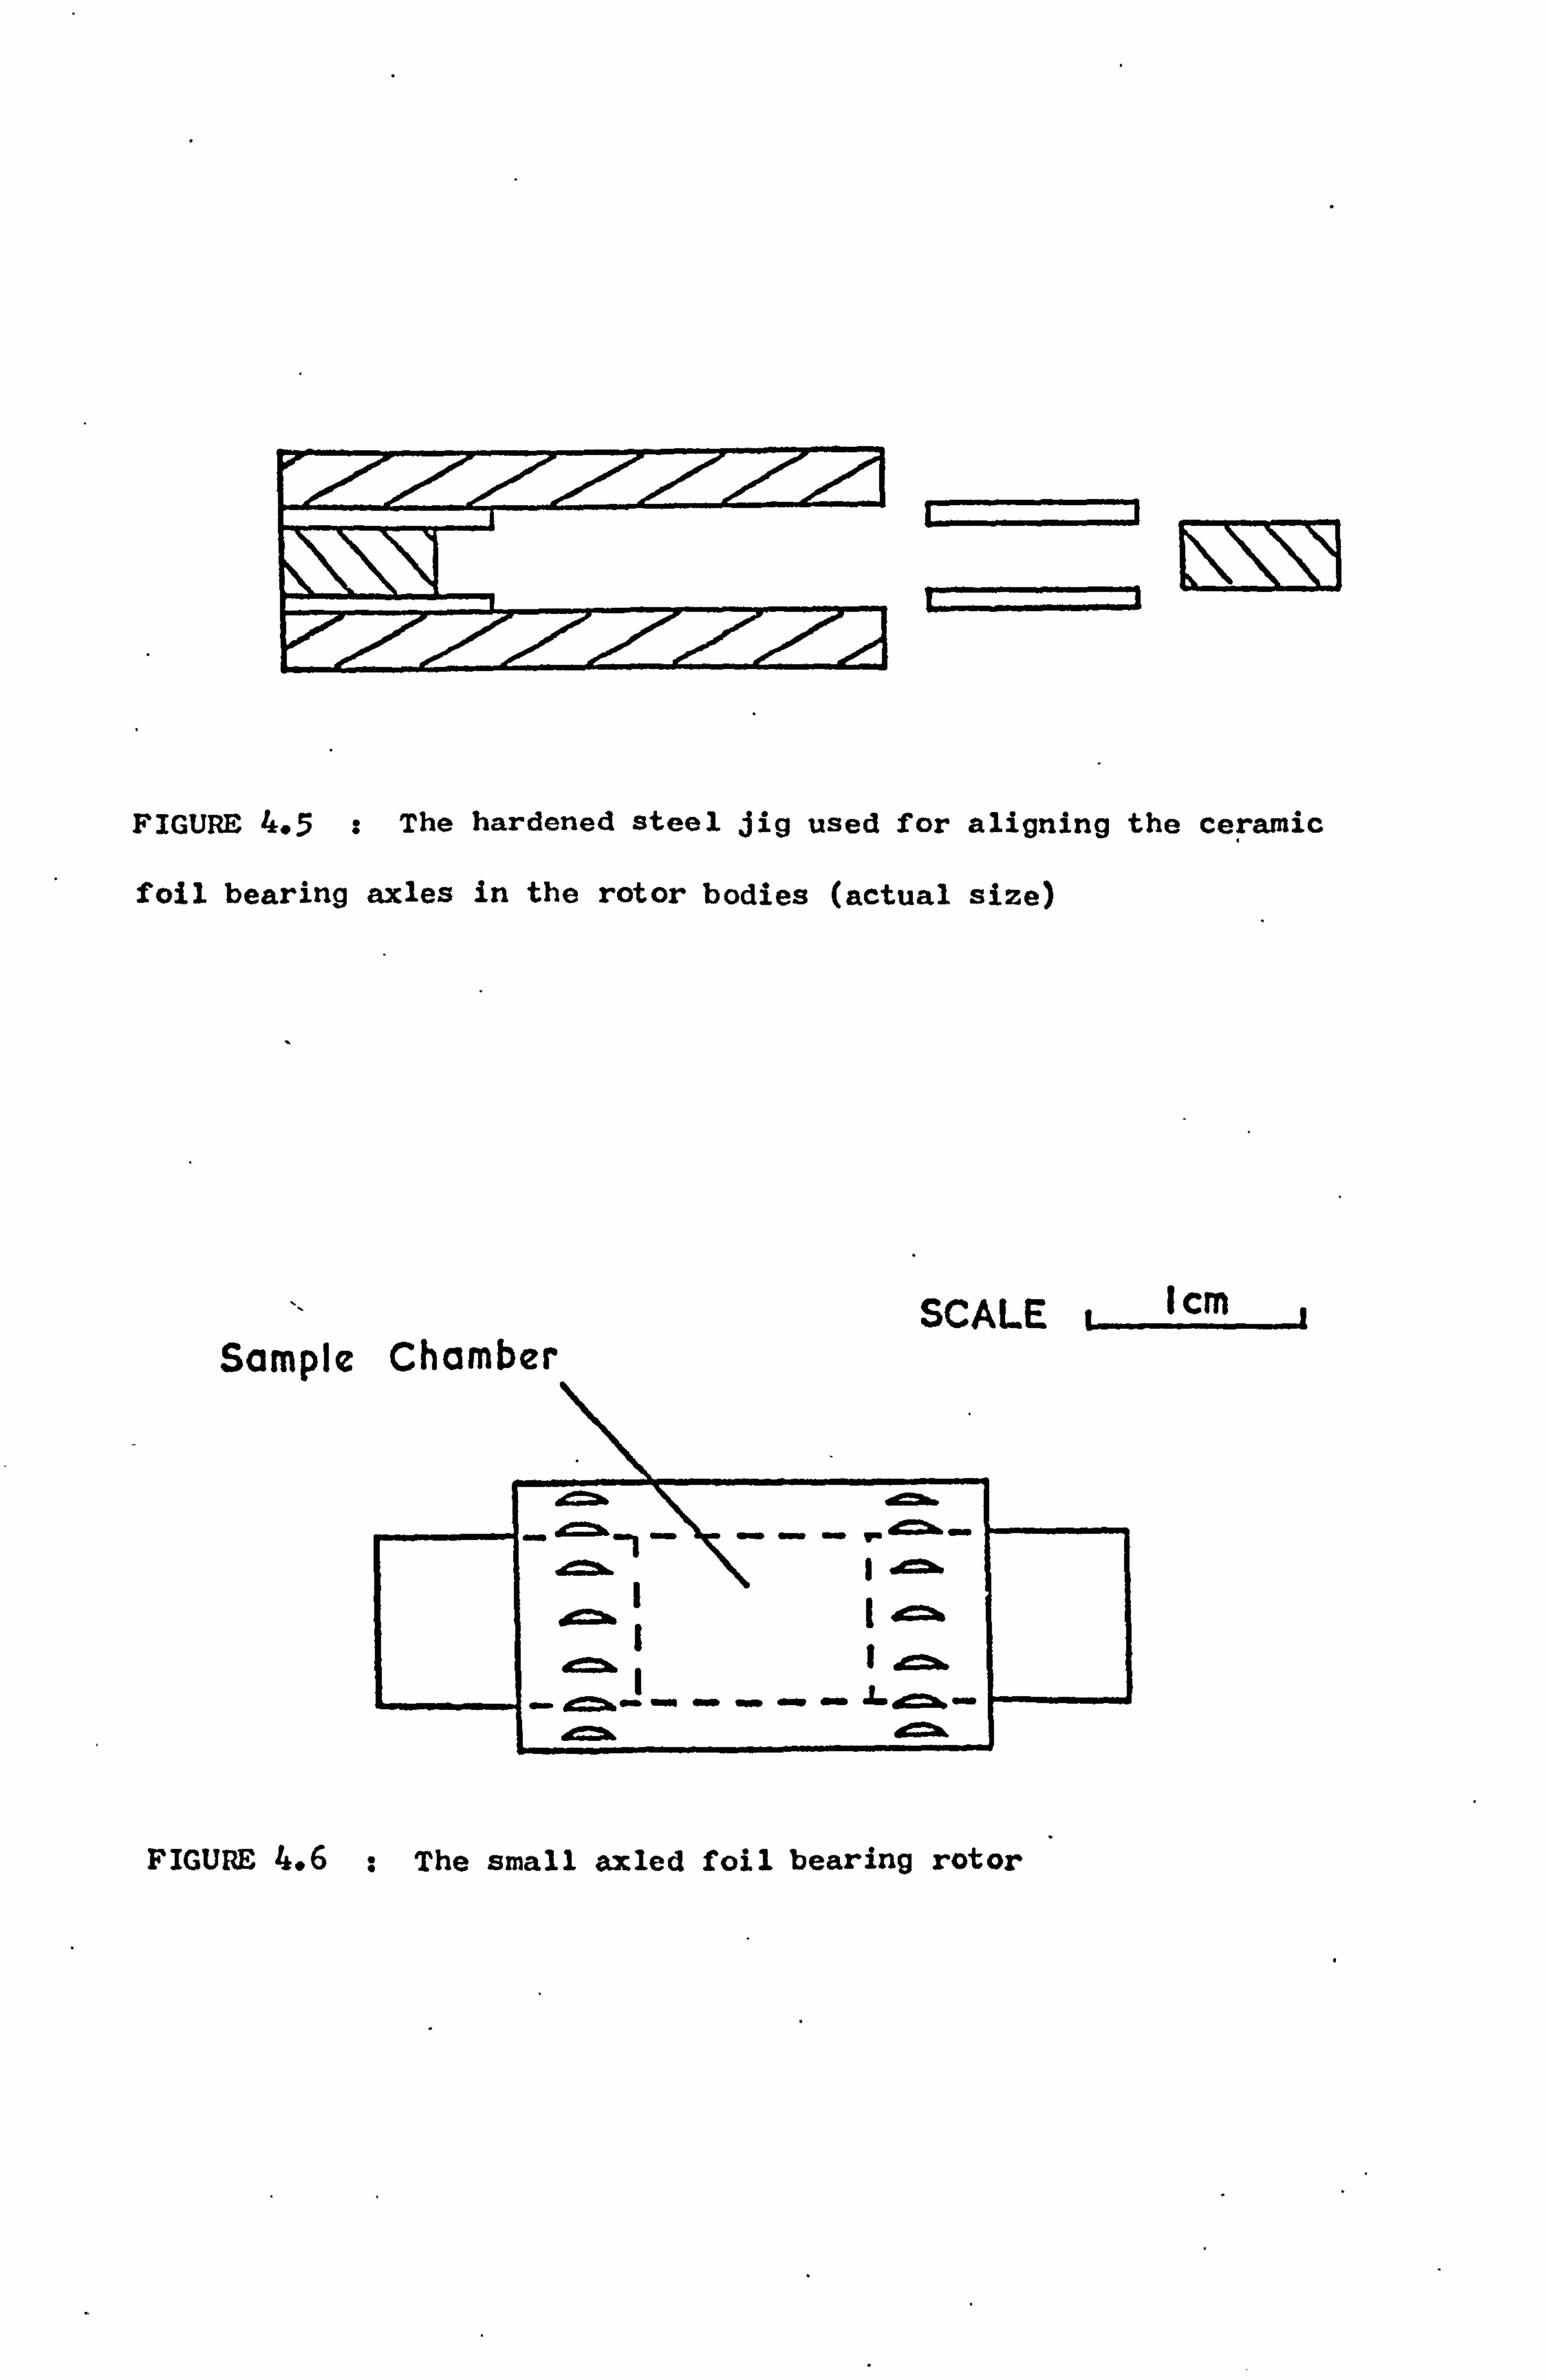
O
Lý 1N\N1
FIGURE 4.5 : The hardened steel jig used for aligning the ceramic
foil bearing axles in the rotor bodies (actual size)
SCALE 1 cm Sample Chamber
c.,. 1D
ý,, I 1ra
FIGURE 4.6 : The small axled foil bearing rotor
- 53 -
the manufacture of which was described in Section 4.3.3. Rotors
constructed in this way (shown in Figure 4.6) have been run at
speeds up to 9 kHz without instability. However at speeds above
7 kHz the axles are subject to mechanical failure.
The cause of these failures is not fully understood. The
tensile strength of this material is approximately 2650 kg/cm2 (62)
while the radial stress predicted by equation (4.2) is 500 kg/cm2
at 7.5 kHz. Attempts to reduce the stress concentration by rounding
off the outside edges of the axles and the internal edges between
the axles and body failed to improve the situation. The rotors
became warm after they had been running for some time. Thermal
stresses produced in the axles, as determined by simple theory (63)
would appear to be an order of magnitude too small to explain fail-
ure, but experimental evidence lends weight to such an explanation.
The rotors became hotter at higher rotation speeds and failure
occasionally occurred even after the rotors had been spinning at
a stable speed for several minutes.
4.4.3 THE SUPPORTING RIG
In the original design the bearing tapes were positioned about
the rotor axle by three pairs of aluminium pins and tensioned by
weights. Other methods of tensioning such as clamping the tapes
around rubber bushes and the use of simple springs generally
proved inferior especially at higher rotation speeds. Once the
bearing tapes had 'bedded in' the degree of tensioning failed
to affect the performance of the rotors to any great extent.
Normally the rotors started more easily and ran slightly faster
x - 54 -
with a minimum of tension but at higher rotation rates they were
most stable when the tension was increased to about 40 gm. The
tape used was 0.005" thick glass reinforced PTFE obtained from
Tygadure Ltd. Thinner tape was less able to withstand the rigors
of the rotors starting and stopping and thicker tape tended to
be too stiff. Metal tapes have proved more successful for rotors
with larger diameter axles.
The driving jets were constructed from brass or aluminium
with two or three equally spaced about each set of rotor flutes.
For starting a simple on/off switch was used with an air pressure
of around 100 psi. The rotors then quickly accelerated to a
stable spinning speed. The most efficient drive was achieved
using ä nozzle diameter of 0.025". The rotor flutes were cut to
a depth of 0.025" with 24 in each set. By placing the rotor so
that the propelling gas impinged against the curved face of the
flutes it was found that the rotors were sufficiently constrained
axially to make superfluous the use of any separate positioning
jets.
In theory the three-pad foil bearing is ideal for its purpose
because it supports the rotor equally in all directions about the
axis of rotation. However a two-pad system was found to be
equally efficient. This considerably facilitated the construct-
ion of a rig capable of supporting the rotors within the magnet
gap. Because the tapes had to be free to move, the foil guides
were rounded with a polished surface. They were glued separately
on to the two halves of the rig after machining. The full experi-
mental rig is shown in Figure 4.7, and Figure 4.8 shows the rotat-
ion rates achieved in it by a solid aluminium rotor.
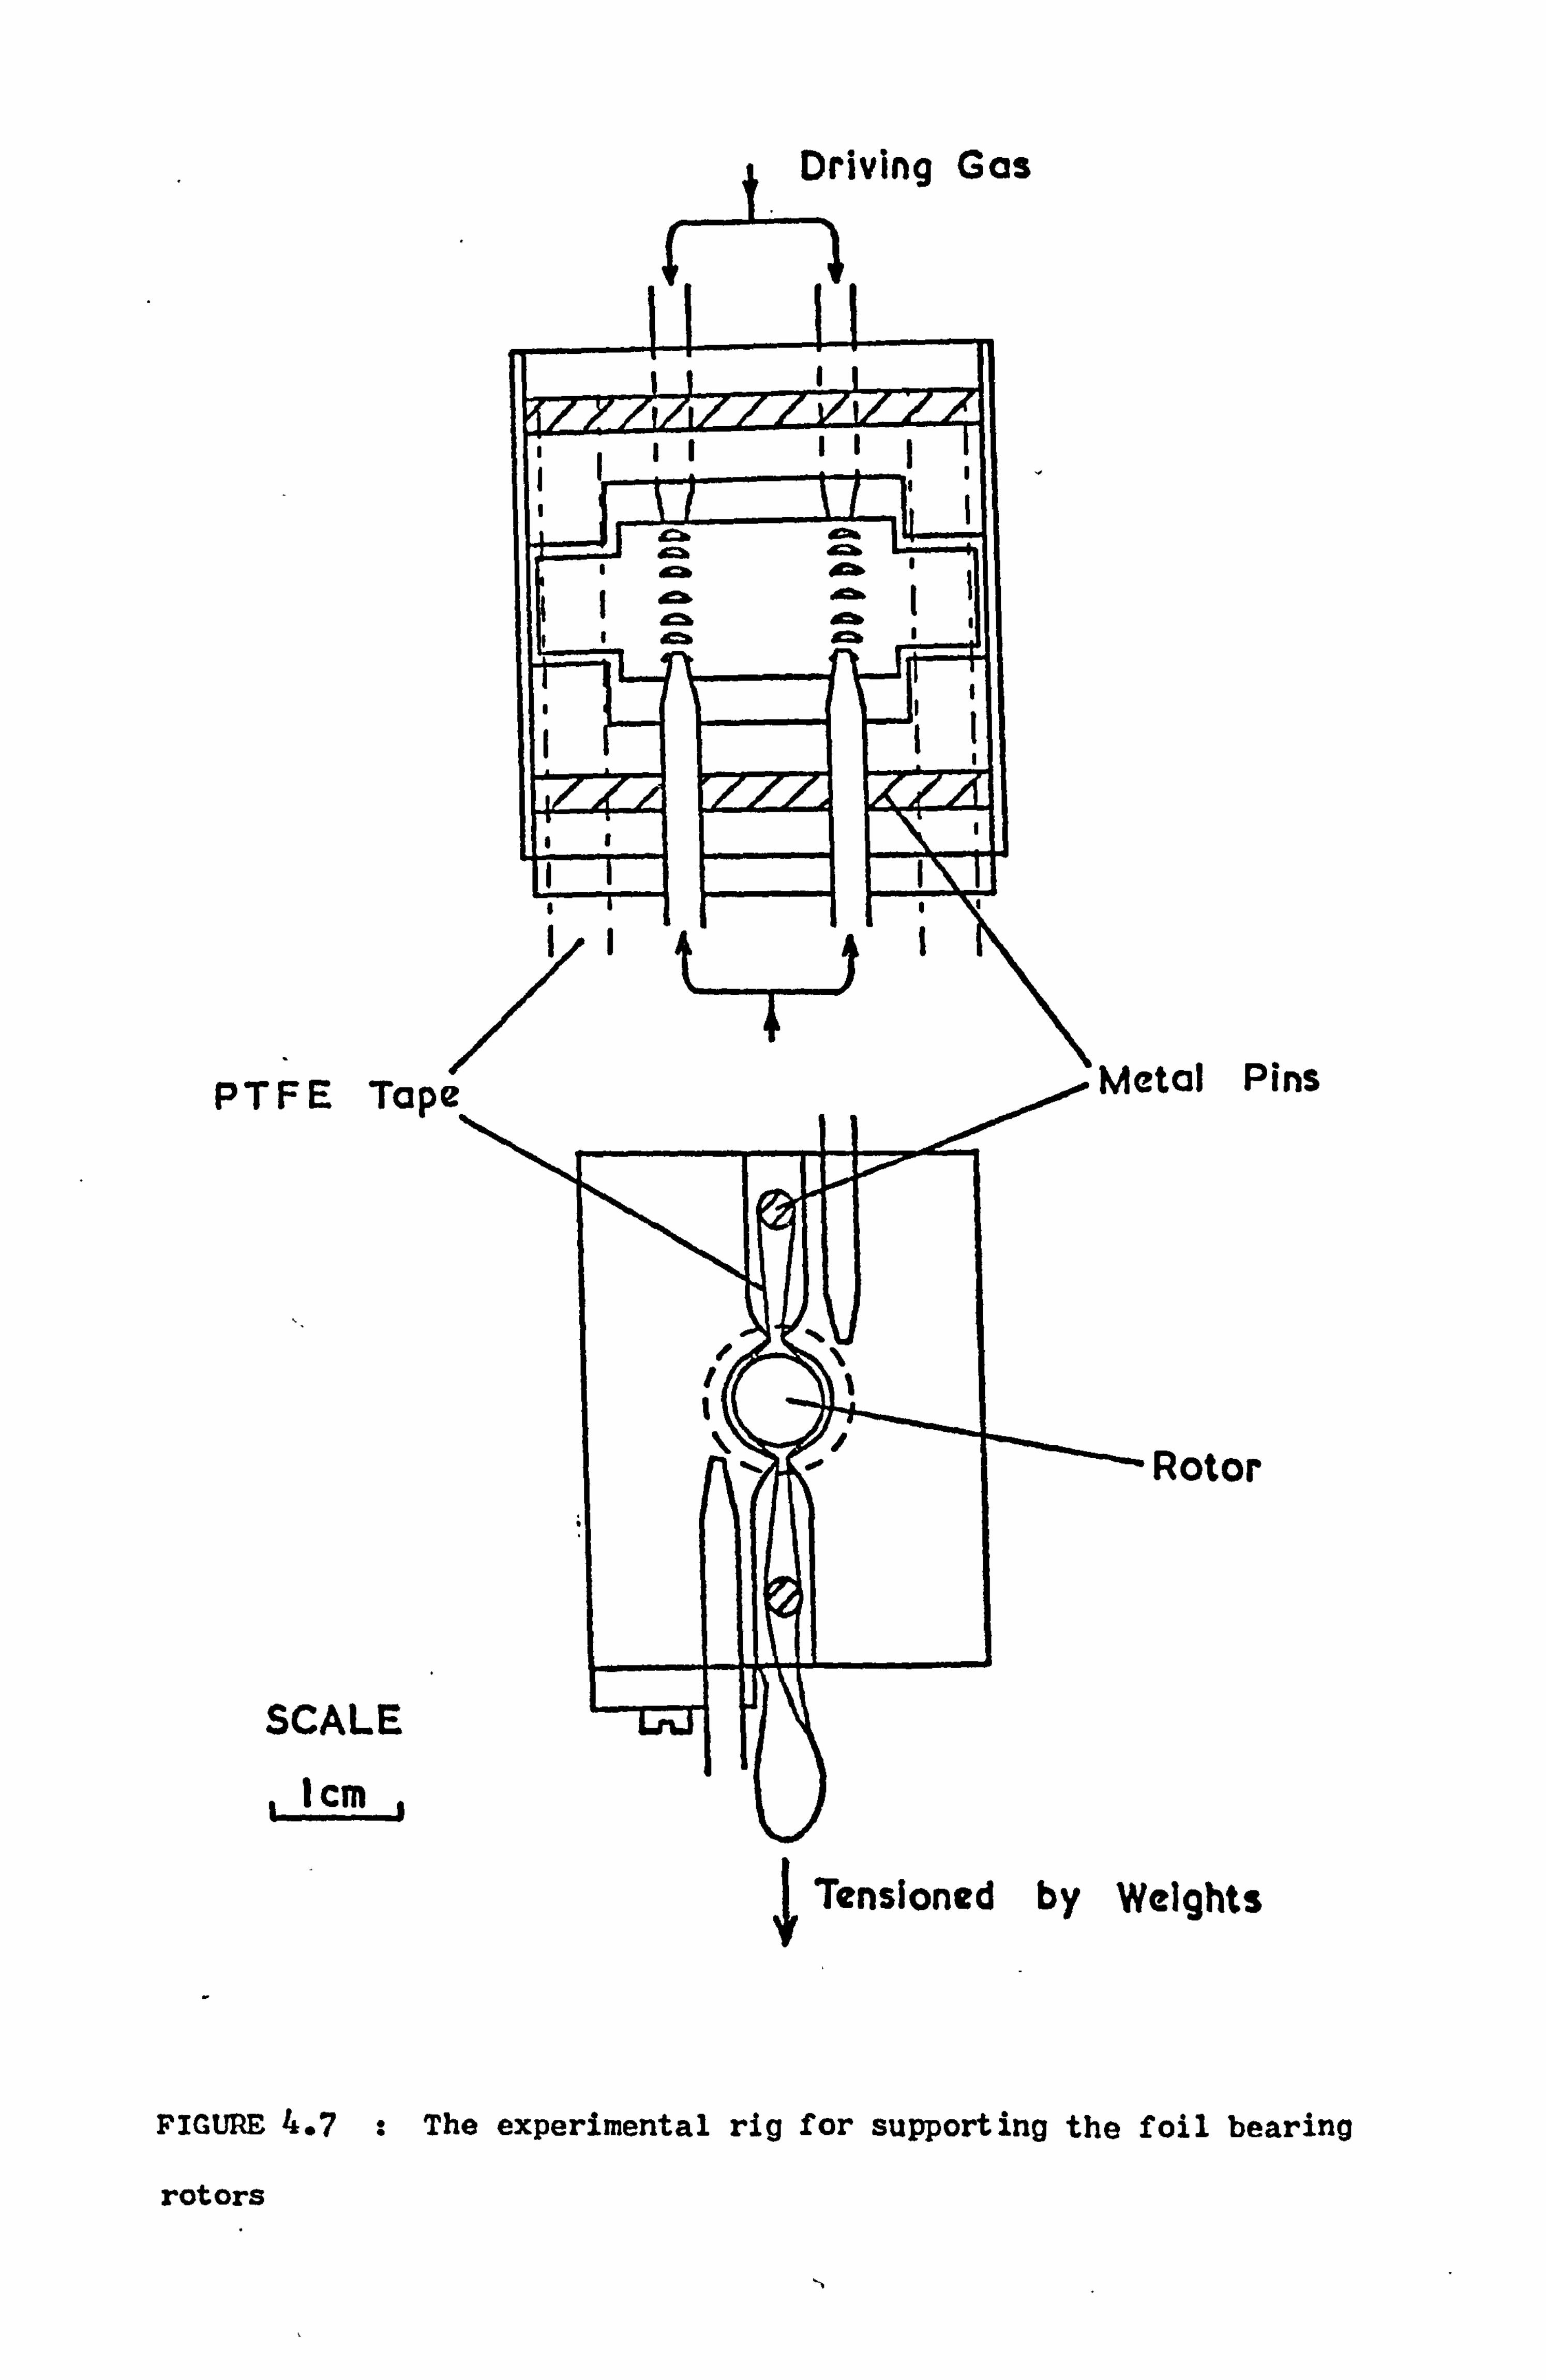
Driving Gas
a o" dcb
a I o oý
i ý1 ý ýi i
ii Ii
PTFE Tape_
SCALE
icm'
Metal Pins
Rotor
Tensioned by Weights
FIGURE 4.7 : The experimental rig for supporting the foil bearing
rotors
J 1
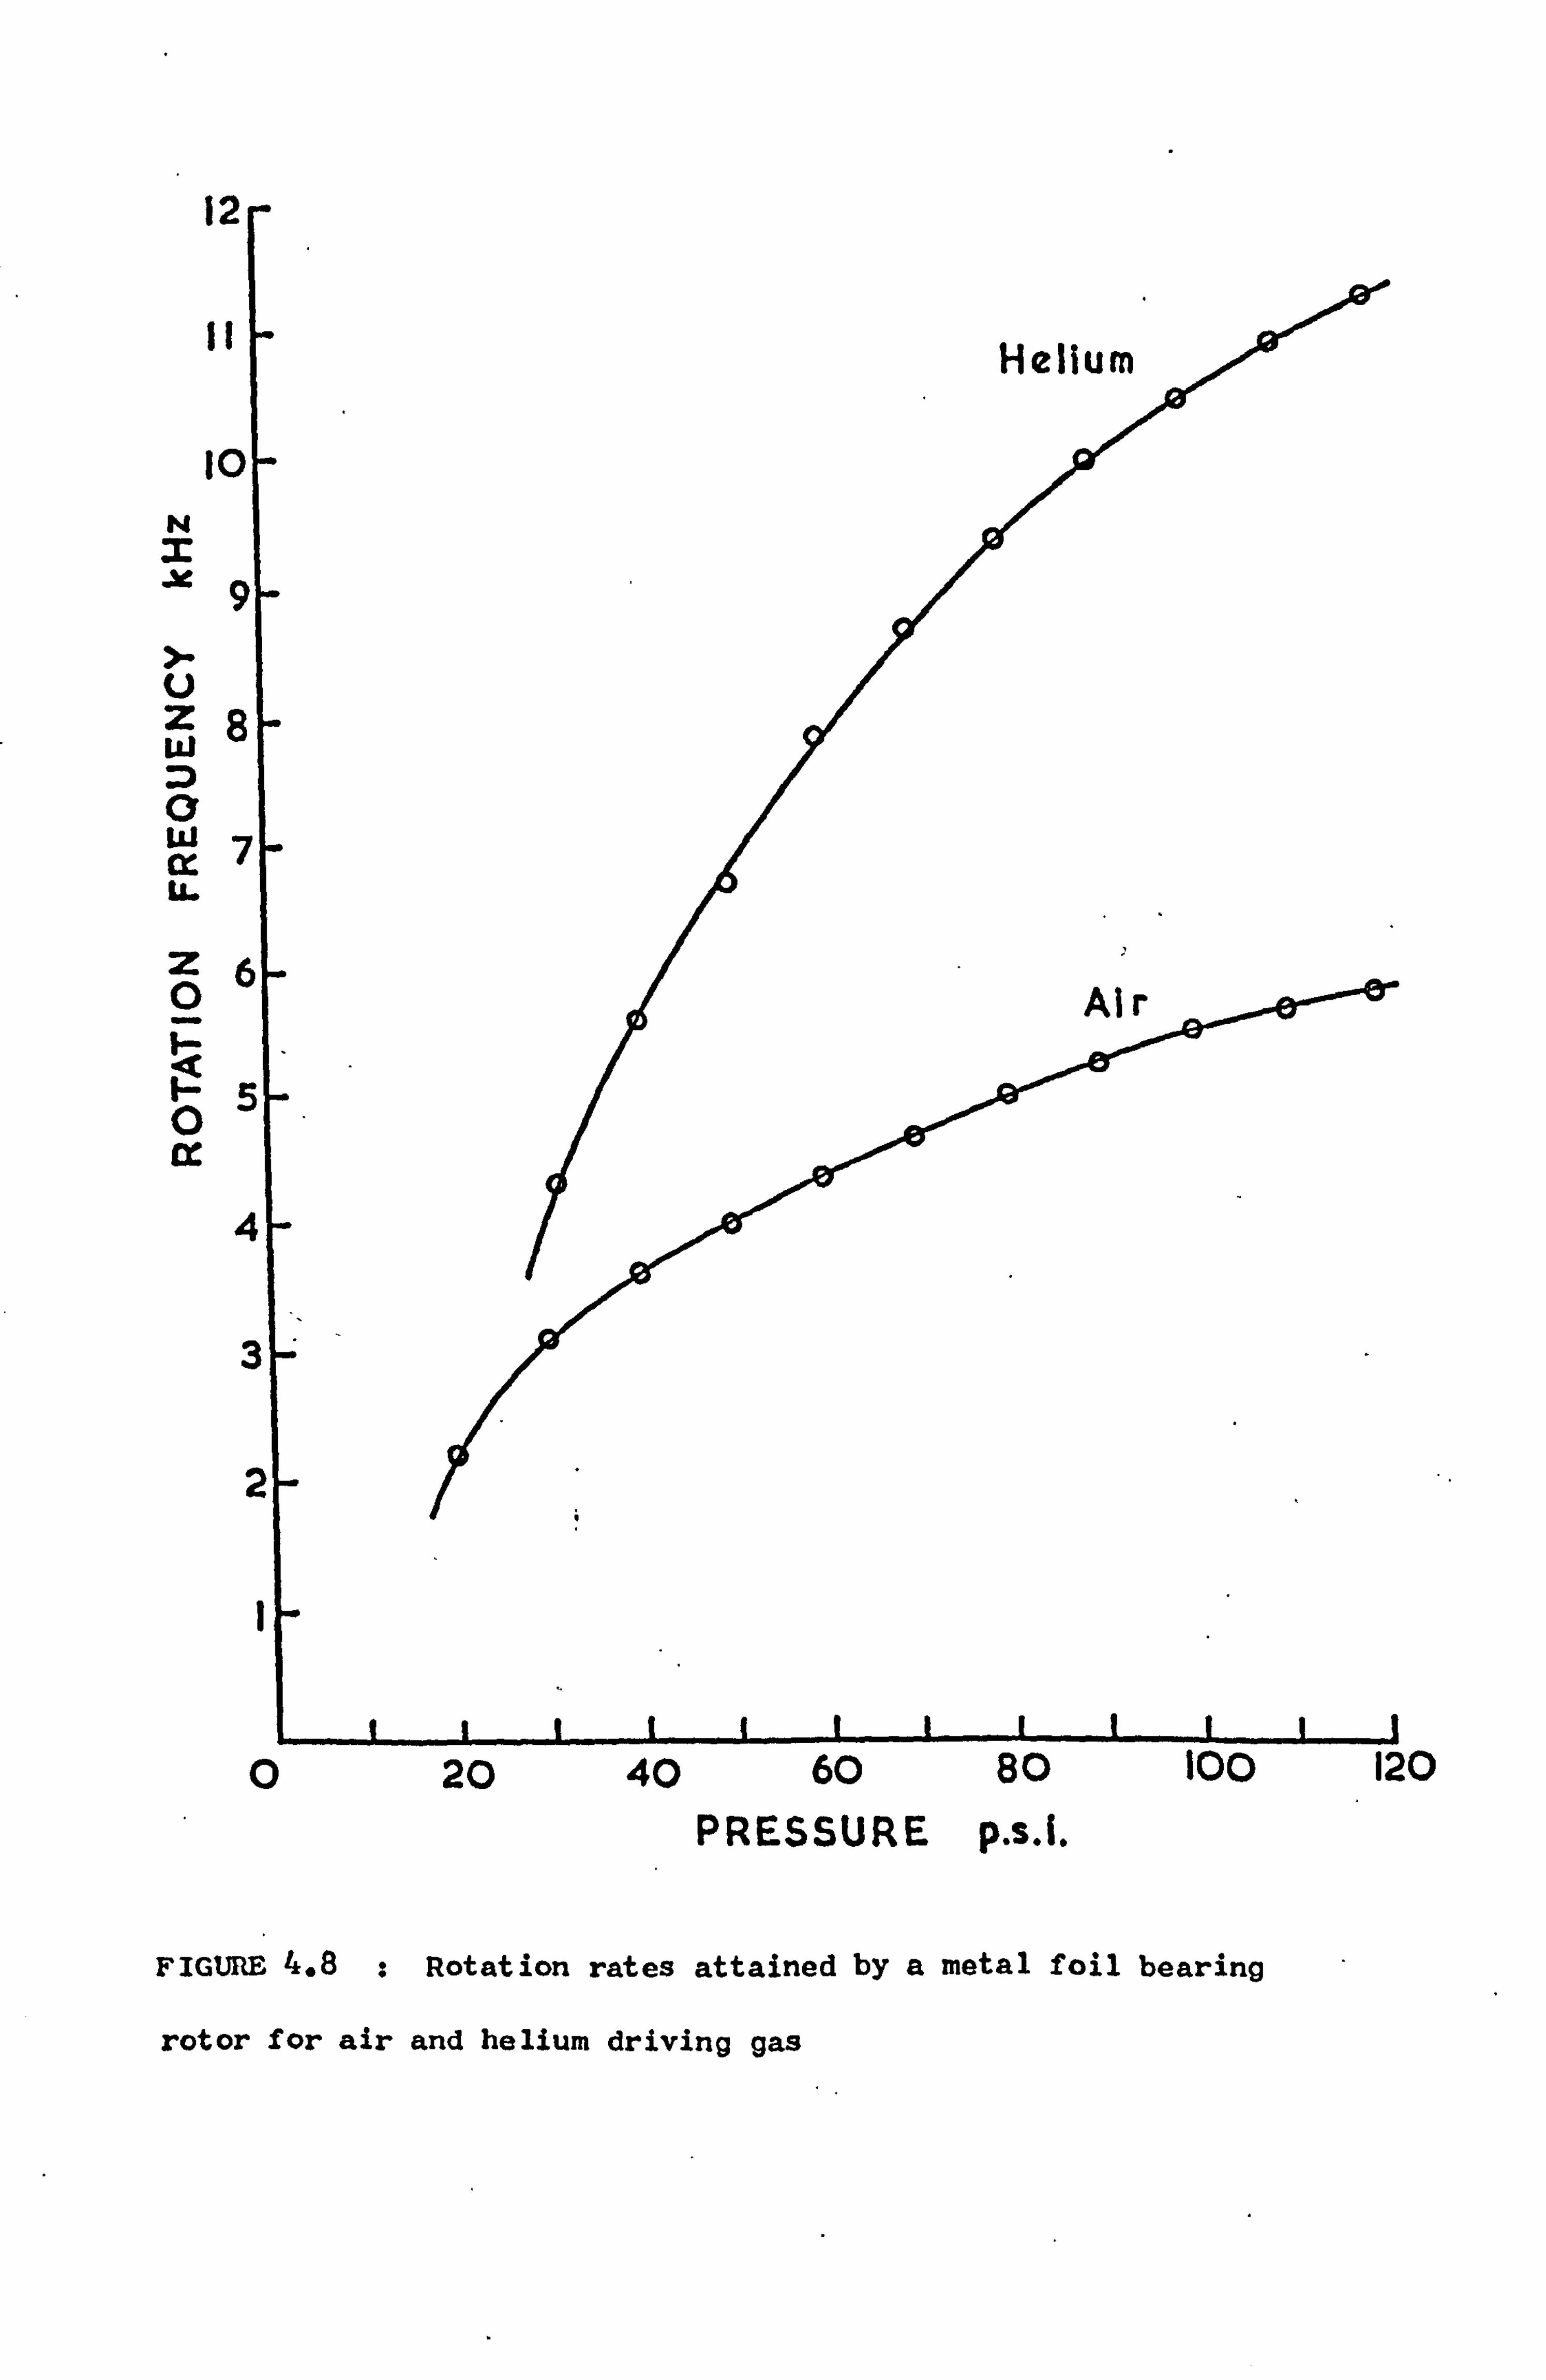
12
10 N
x9
} U w8
W cx V.
öý ä H ' 0
A
0 20 40 60 80 100 PRESSURE p. s. i.
FIGURE 4.8 : Rotation rates attained by a metal foil bearing
120
rotor for air and helium driving gas
- 55 -
4.4.4 COMMENTS
For completeness we include at this point a few general
comments about the foil bearing rotor system.
It was found that at speeds up to 7 kHz the foil bearing
rotors were extremely reliable. Every rotor constructed as
described in Section 4.4.2 rotated stably even with full-sized
liquid samples. Not all the conical rotors would rotates even
on air. Although it is not a normal requirement of any NMR
rotation system, it is worth noting that the Bernoulli rotors
would not spin with liquid samples of any reasonable volume.
Because of the heating effect upon rotation, use of the foil
bearing system appears to be limited to those cases where the
temperature of the sample is relatively unimportant. As the
attainment of rotation rates above 7 kHz was limited only by the
failure of the alumina axles, silicon nitride might well prove
a more suitable axle material. Its tensile strength is typically
the same as alumina, but its density is only about 2.6 gm/cm3
compared to 3.8 gm/cm 3.
The coefficient of thermal expansion in
silicon nitride is half that of alumina(64) so upon rotation both
the induced thermal and mechanical stresses should be less. If
the use of this or any other material does result in a consider-
able improvement in performance it might prove possible to use a
much simpler rotor design in a foil bearing, such as a single
hollow tube.
- 56 -
4.5 OTHER TURBINE SYSTEMS
4.5.1 THE AXLE SUPPORTED ROTOR
This rotor system has been used by a number of workers (34,39,44)
.
The hollow cylindrical rotor with a snap-on lid is supported about
its axis by a fine phosphor-bronze wire and propelled by a single
gas jet impinging against a ring of flutes about the rotor circum-
ference. Using compressed helium rotation rates of 8 kHz have
been reached. However these rotors are apparently only capable
of stable operation when the diameter/length ratio is greater than
one, which limits the volume of the sample chamber. Unfortunately
the filling factor of the rf coil is relatively poor in this system.
4.5.2 THE PRAGUE ROTOR SYSTEM
A rotor of a more conventional design has been used for the
measurement of proton magnetic resonance (50,65)
. The rotor is
suspended in two externally pressurized conical gas bearings and
driven by two pairs of jets placed against flutes on the main
body, as shown in Figure 4.9. Using rotors machined from poly-
mers rotation speeds of 10 kHz have been achieved but, for samples
placed in hollow glass or sapphire rotors of internal diameter
3.5 mm the speeds were limited to 5 kHz. These spinning frequencies
were reportedly dependent on machining tolerances of less than
0.003 mm.
An investigation has been carried out on a similar system
directly copied from this design. When propelled by compressed
air at a pressure of 100 psi a solid nylon rotor reached a spinning
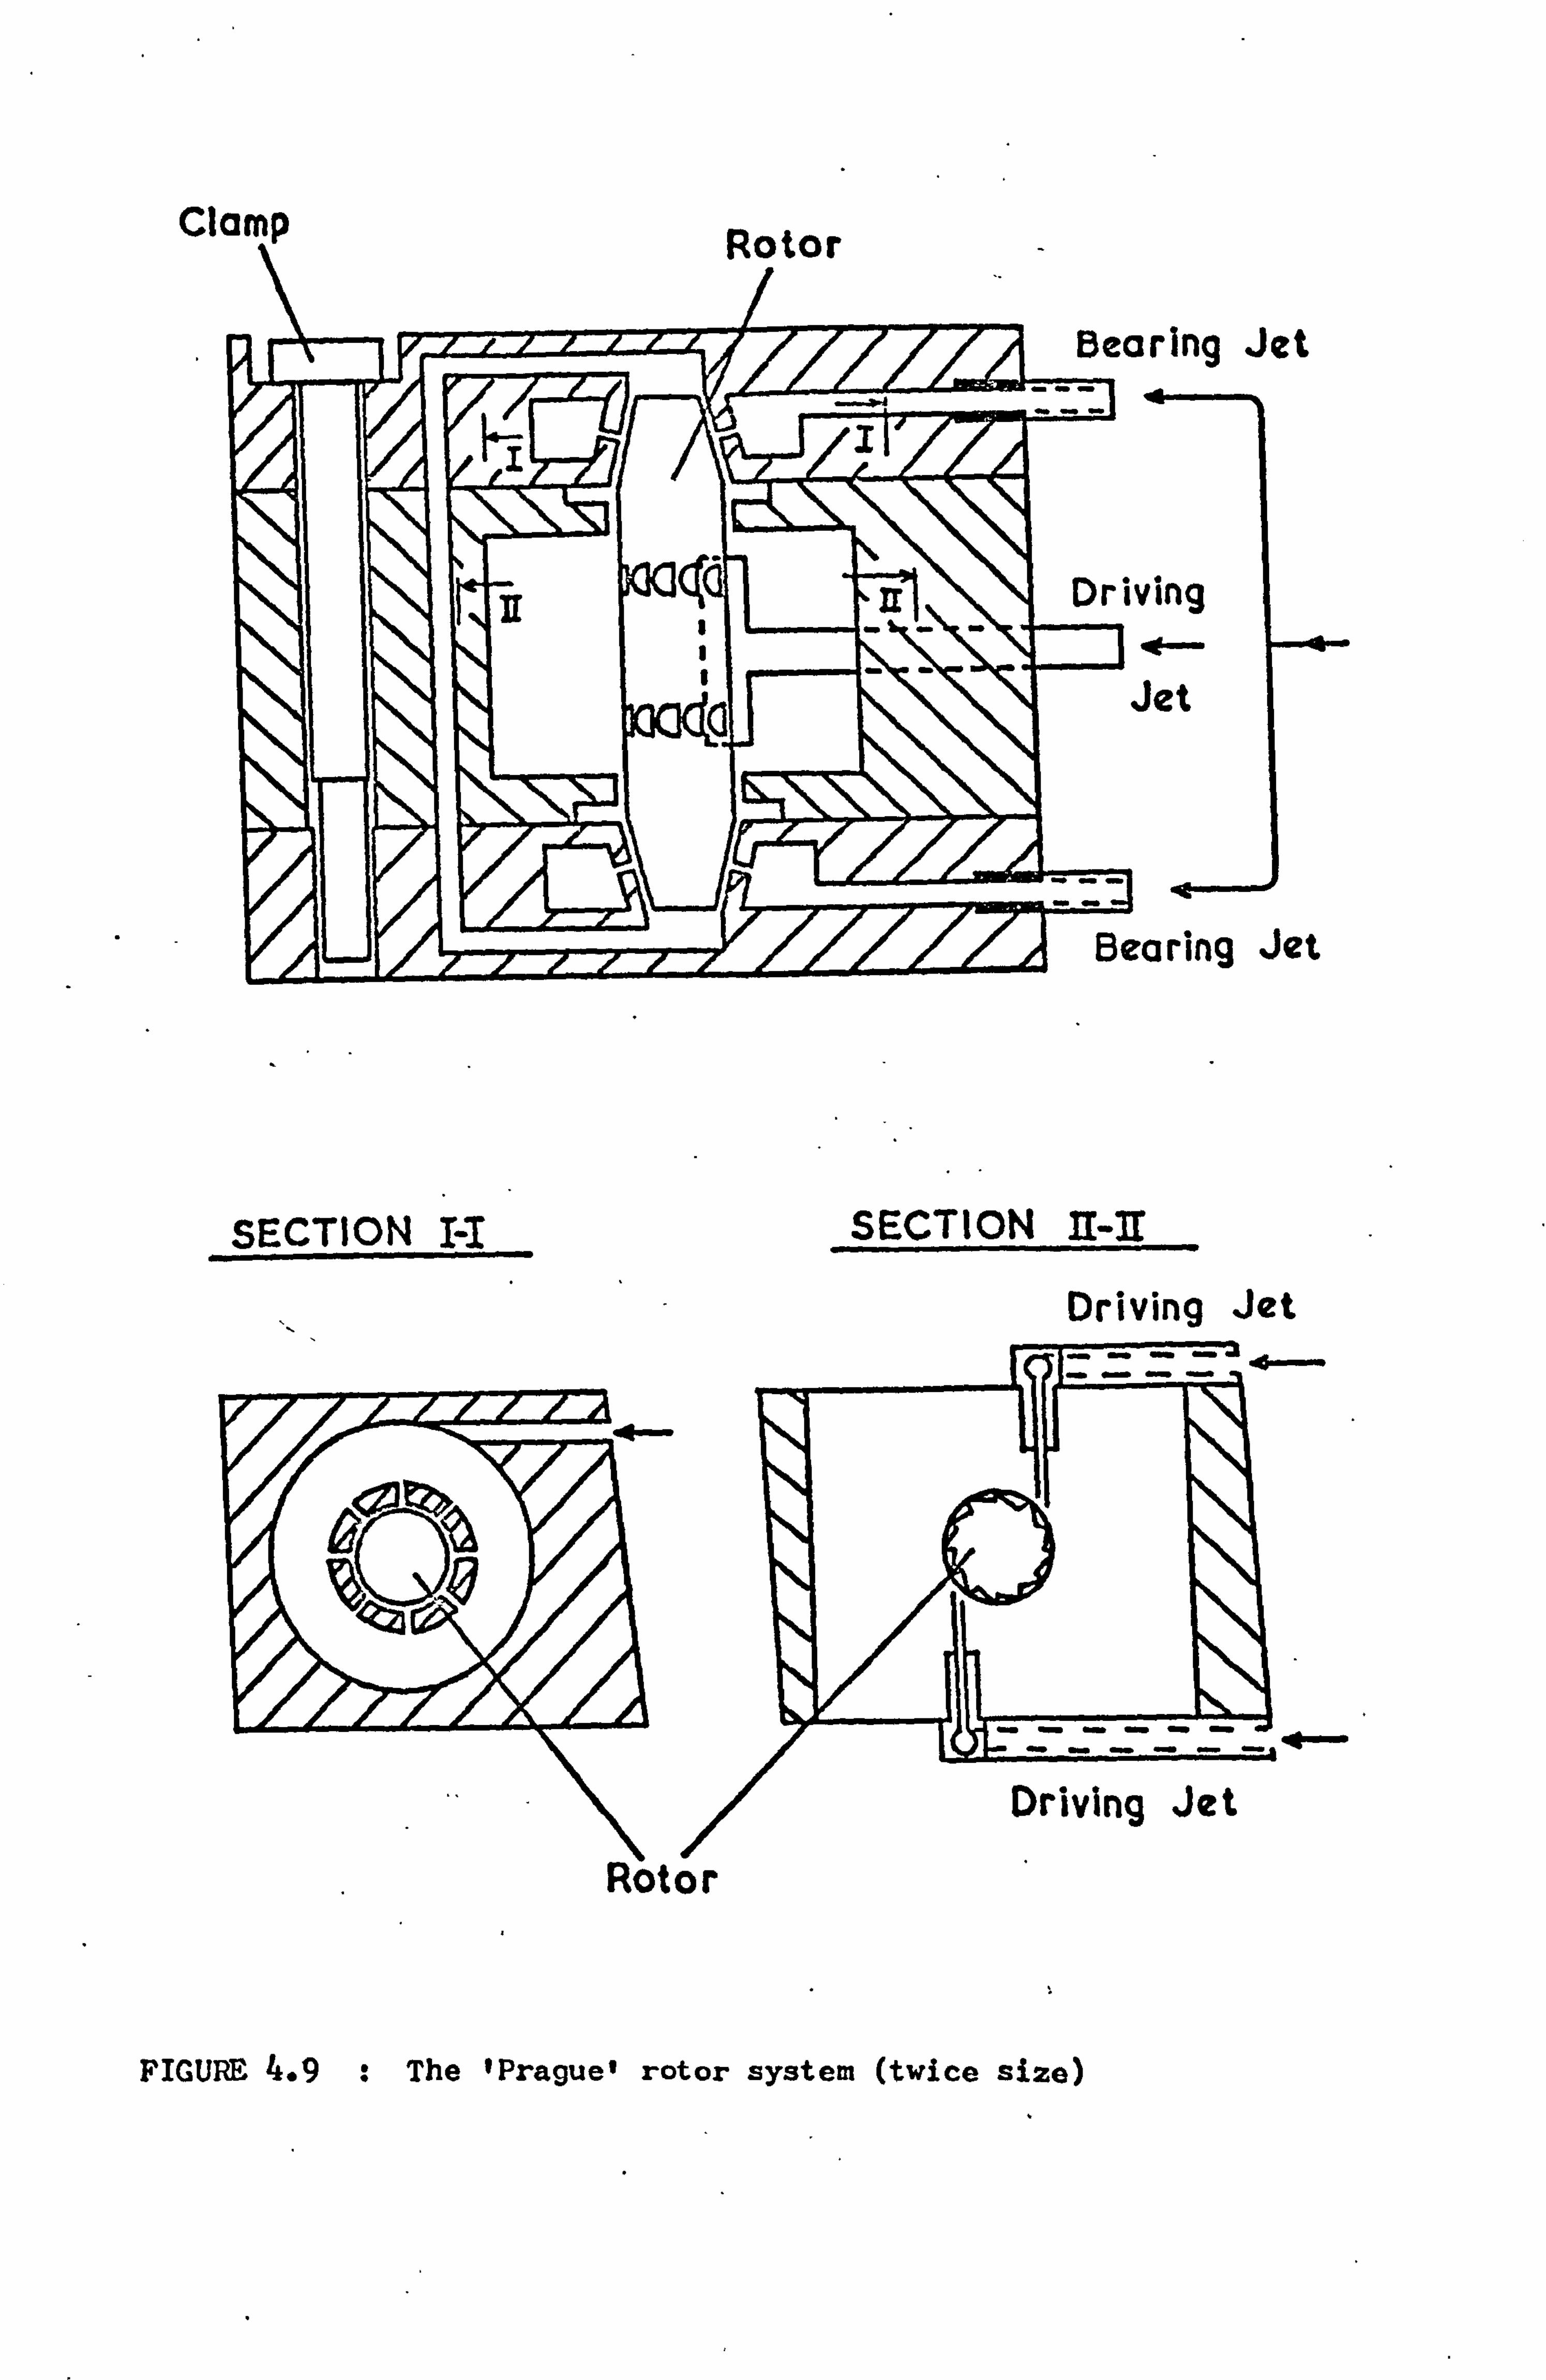
Clamp Pf-£--
3ring Jet
ving t Jet
raring Jet
SECTION II SECTION 11-]I
Rotor
FIGURE 4.9 : The 'Prague' rotor system (twice size)
Driving Jet
- 57 -
rate of 6 kHz. Higher speeds were achieved by using helium.
The rotors would spin at all frequencies down to 20 Hz and were
largely unaffected by altering the clearance between the rotor
and the bearing: characteristics which were remarkably different
from the original system.
The sample-carrying capacity of the Prague rotor system is
inferior to the conical and foil bearing rotors. The only
obvious advantage of the rotors produced in the laboratory was
their stable operation at very low frequencies. As this is not
a normal requirement of an NMR system, work was discontinued on
this type of rotor in favour of the foil-bearing design.
- 58 -
5.1 EQUIPMENT
CHAPTER 5
EXPERIMENTAL PROCEDURE
The variable frequency pulse spectrometer used in this work
was a Bruker B-KR 322s, a schematic diagram of which is shown in
Figure 5.1. The rf is generated to an accuracy of 1 part in 108
by the Schmondal frequency synthesiser and split into two main
channels. DC gating pulses are supplied by four separate pulse
units feeding in pairs to each channel. The resulting rf pulses
are amplified to a peak power of 500 W and output to the transmit-
ter coil is the probe head. Induced transients in the receiver
coil are passed via a tuned preamplifier and a variable attenuator
to a wide band main amplifier before diode or phase sensitive
detection. The resulting signal is amplified in a final stage
postamplifier.
The spectrometer was augmented by a Bruker B-KR 300z 15 pulse
gated integrator (PGI).
tudes at fixed points on
sampling times between 0
grator time constant was
output voltage level was
voltmeter (DVM).
This was used to measure signal ampli-
the detected transient decay curves. Gate
.5 us and 10 ms could be used and the inte-
adjustable between 10 us and 100 s. The
displayed on a Solatron LM 1420.2 digital
Signal averaging was undertaken by a Data Laboratories DL 102
200 point signal averager. In this instrument input voltages within
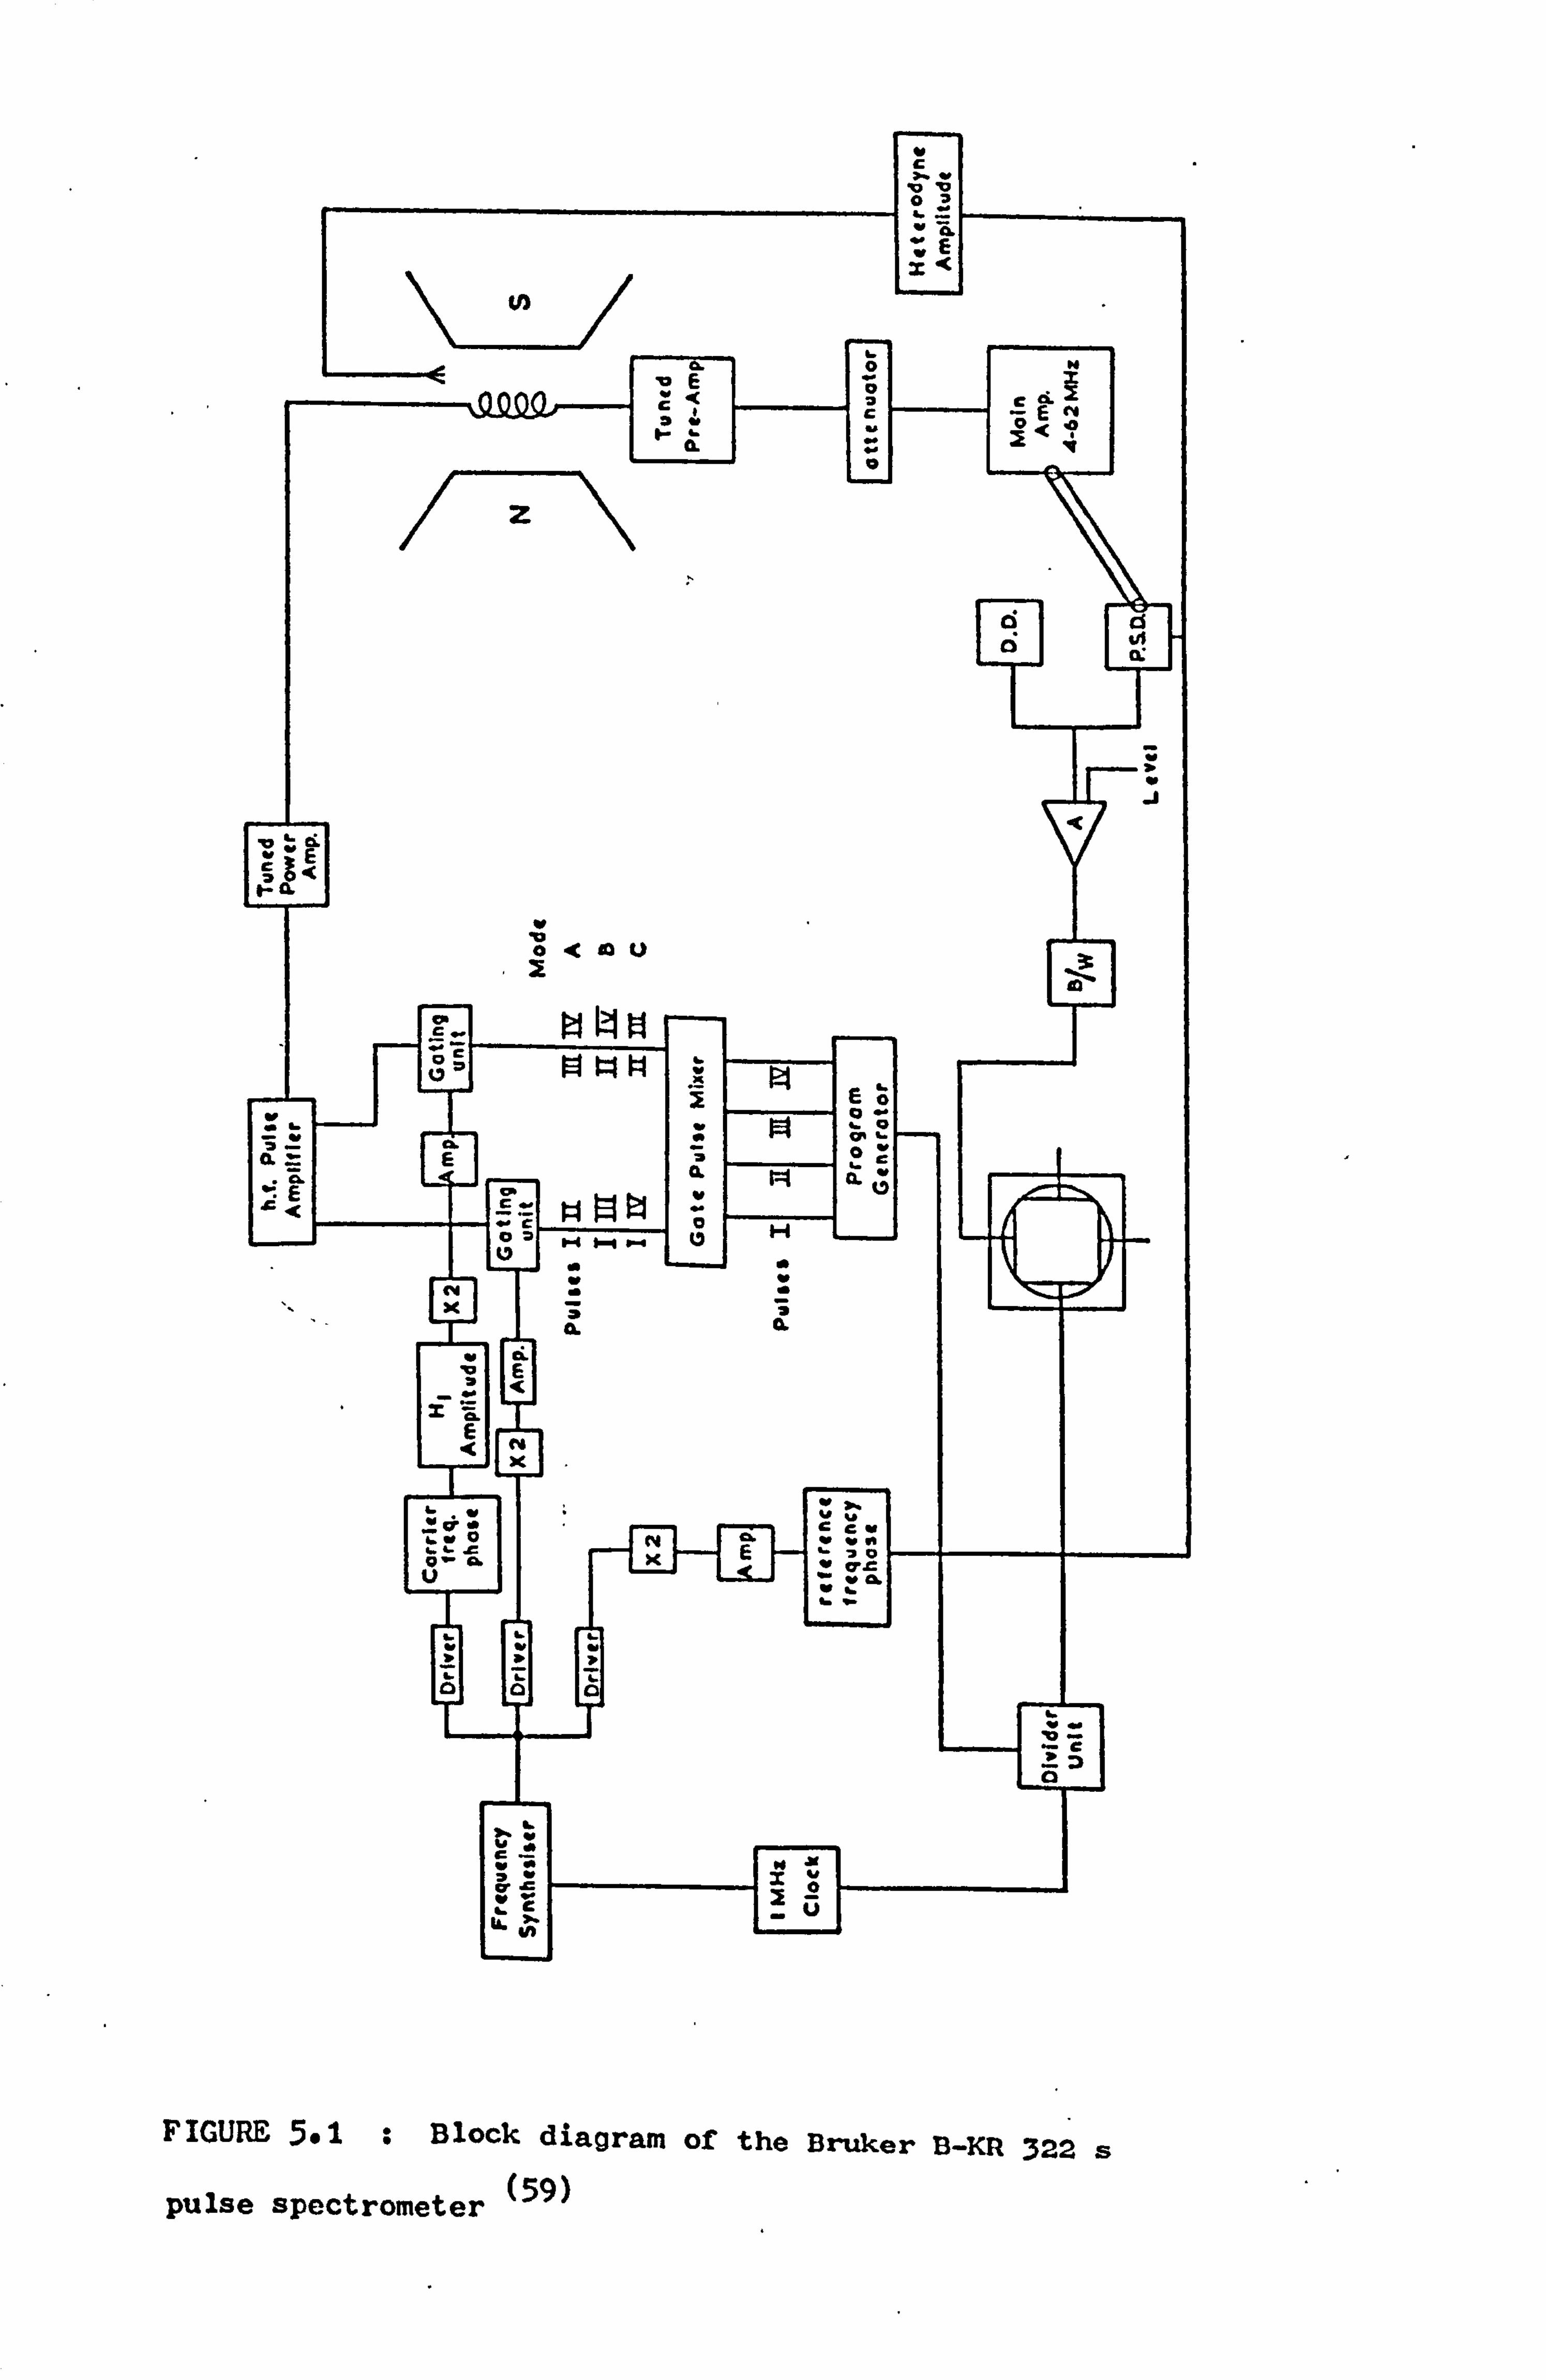
Y C a. v
ov O3 "4
a oE
o w
Y C E ý
Z
ö
Ö
v "E
v
;
ý= gk1b x P-J Eö
7.2 a. E
" II I9 - r 4 Icy .. (, 1"ý
v Nr
x3
r "
ä
Y 4 v E
E N x .
V y 3.
Y YV" CCY
ý t N`Yw . . o' o xE ör
u F 936 Y`
C
'. 16 VY M
Y E!
u--
Y
J
FIGURE 5.1 : Block diagram of the Bruker B-KR 322 s
pulse spectrometer (59)
- 59 -
the range ±1 V are digitised to a7 bit resolution and summed in
a 16 bit register. The time interval per point is variable bet-
ween 2 Ps and 50 ms and the averaged signal may be displayed on
an oscilloscope to 7 bit accuracy. In the particular experimental
set-up used the full 16 bit output of each register was read out
through a Data Laboratories 1002/100c interface coupled to a Data
Dynamics teletype.
The M12 electromagnet used in this work had originally been
part of an RS 2 high resolution CWNMR spectrometer manufactured by
AEI. The maximum period of time over which the signal could be
accumulated in the signal averager was in some cases limited by
the slight drift in the magnetic field.
5.2 MODIFICATION OF THE SPECTROMETER PULSE PROGRAMMER
The four pulse units of the spectrometer are located in inter-
changeable plug-in units. Each unit consists of two monostable
flip-flops; one for determining the pulse length and one for deter-
mining the delay time with respect to the previous pulse. However,
because the delay times are set via decade counters, they are
correct only when the pulse delay time is less or equal to that
of the preceeding pulse. Such a condition means that some simple
pulse sequences cannot be performed using the standard spectrometer.
To overcome this problem a Mullard FJK 101 integrated mono-
stable circuit was set-up to provide a positive DC pulse of contin-
uously variable duration between 0.5 us and 120 ms compatible with
the internal logic of the spectrometer. The complete circuit was
mounted in an aluminium box with a plug connector so as to be inter-
changeable with any of the plug-in pulse units. The monostable
-60-
circuit was triggered by the leading edge of the preceding pulse.
The trailing edge of the resulting pulse then triggered the delay
on the next pulse unit, so the total delay time was the sum of
the two settings. In this way pulse sequences requiring three
pulses could be performed even when the delay time between the
first and second pulses was shorter than that between the second
and third. Such is the case for the Jeener and Brockaert pulse
sequences as described in Sections 5.7 and 5.8.
5.3 VARIABLE TEMPERATURE MEASUREMENTS
For measurements other than at room temperature the temper-
ature*of the sample could be controlled using a Bruker B-ST 100/
700 temperature control system. In this system nitrogen gas is
passed through a heat exchanger immersed in liquid nitrogen and
then to a glass dewar probe insert via a heater. The temperature
of the gas immediately underneath the sample tube in the insert
is monitored by a copper-constantan junction connected to the
control unit. This automatically adjusts the current td the heat-
ing coil so that the temperature of the junction corresponds with
that selected.
The low temperature measurements on the cuprous halides were
performed using a small gas flow cryostat. The assembly shown in
Figure 5.2 was supported in a glass dewar in the magnet gap.
Although the Bruker control unit was used to adjust the flow of
cooling gas the temperature immediately above and below the sample
was measured independently via two calibrated copper-constantan
thermocouples and a DVM. The lowest temperature was attained by
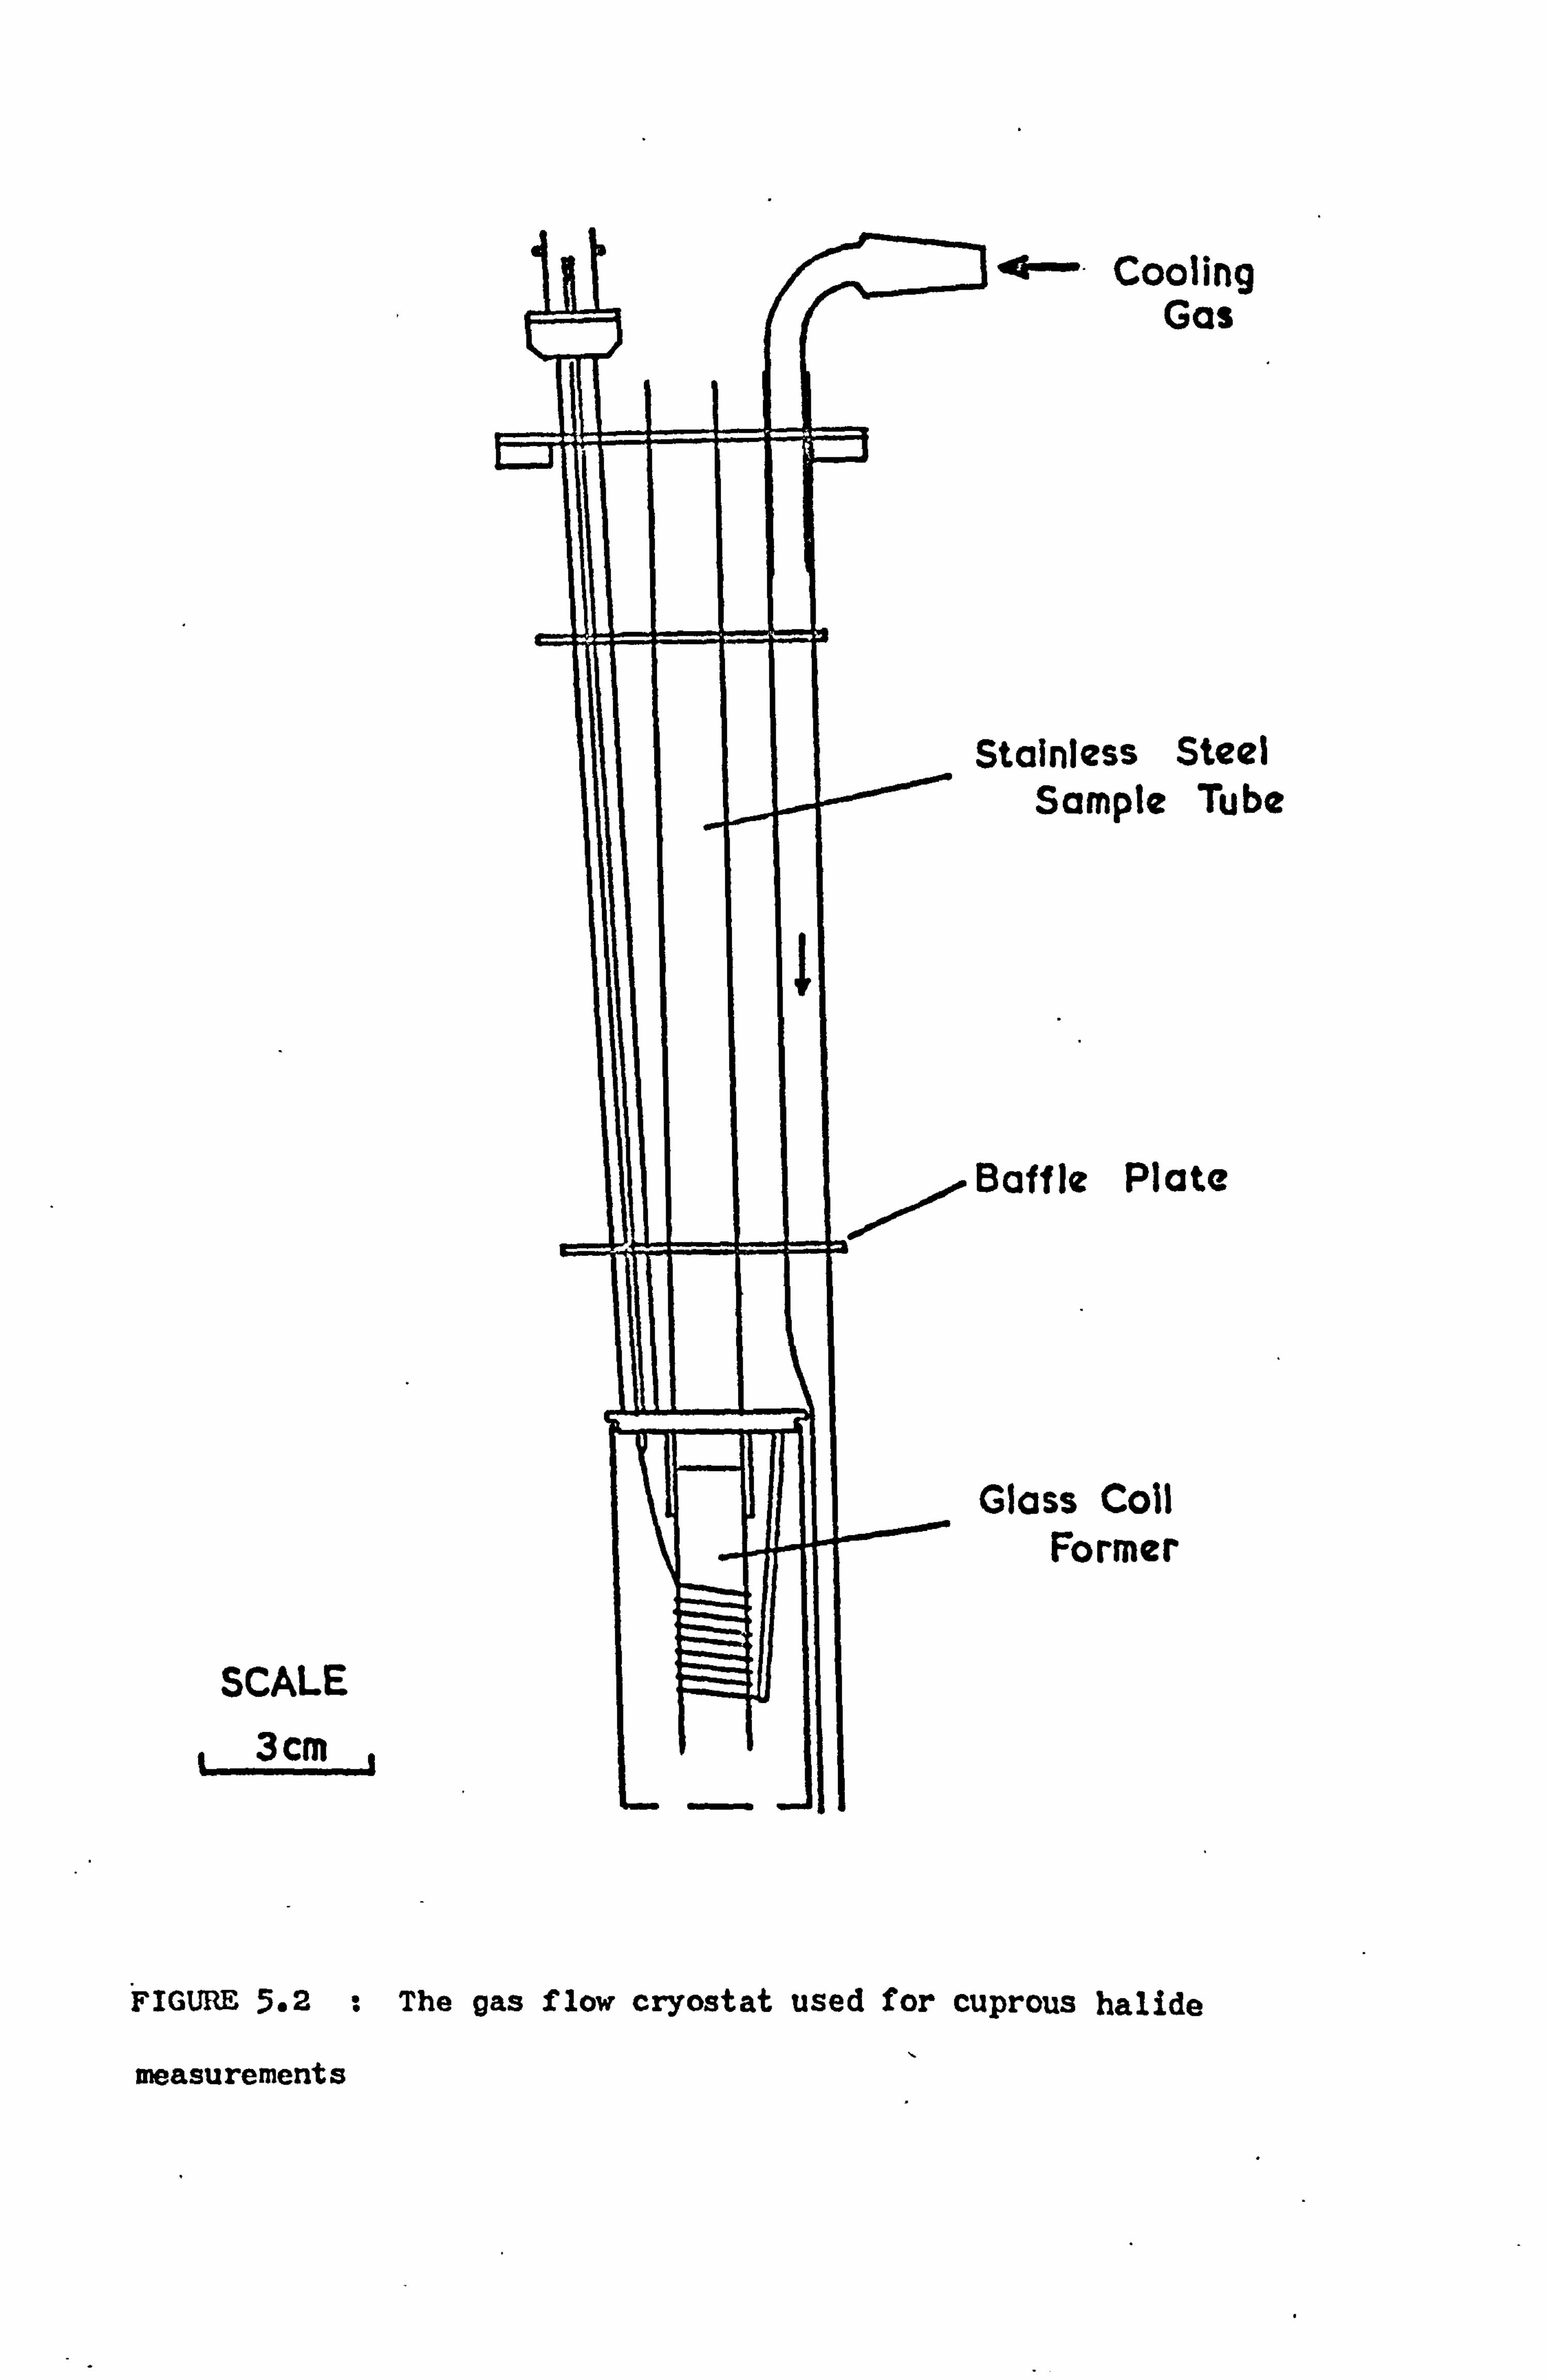
Cooling Gas
; tainiess Steel Sample Tube
3affle Plate
"'lass Coil Former
SCALE 3 cm j
FIGURE 5.2 : The gas flow cryostat used for cuprous halide
measurements
- 61 -
sealing the aluminium can surrounding the coil and submerging
it directly into liquid nitrogen.
5.4 THE PROBE HEADS
5.4.1 THE DESIGN OF THE TUNED CIRCUITS
A tuned PNMR transmitter circuit is required to produce
a high power H1 field in the sample from an rf pulse. The
Fourier transform of a rectangular rf pulse forms a distribution
of frequencies about the driving frequency the width of which
is of the order of the inverse of the pulse width. By making H1
large it follows from equation (1.9) that the pulse length is
short. - All nuclei will then be excited equally, even in solids
having broad spectral distribution functions.
After the exciting rf pulse the tuned receiver tank circuit
has to recover quickly to enable the small nuclear transient signal
to be amplified and detected. The importance of having only a
short 'dead time' during which the receiver is blocked arises
because that part of the signal near zero time makes a large contrib-
ution to the wings of the transformed lineshapes. If the signal
induced in the receiver coil of a series resonant circuit is
V sin wt, then the voltage appearing at the receiver input is
QV sin wot where Q, the quality factor, is given by wö /R. The
ringing in this circuit decays exponentially with a time constant (66)
2Q/wo. It follows that the two conditions of maximum signal
and minimum dead time are incompatible and a compromise has to be
adopted.
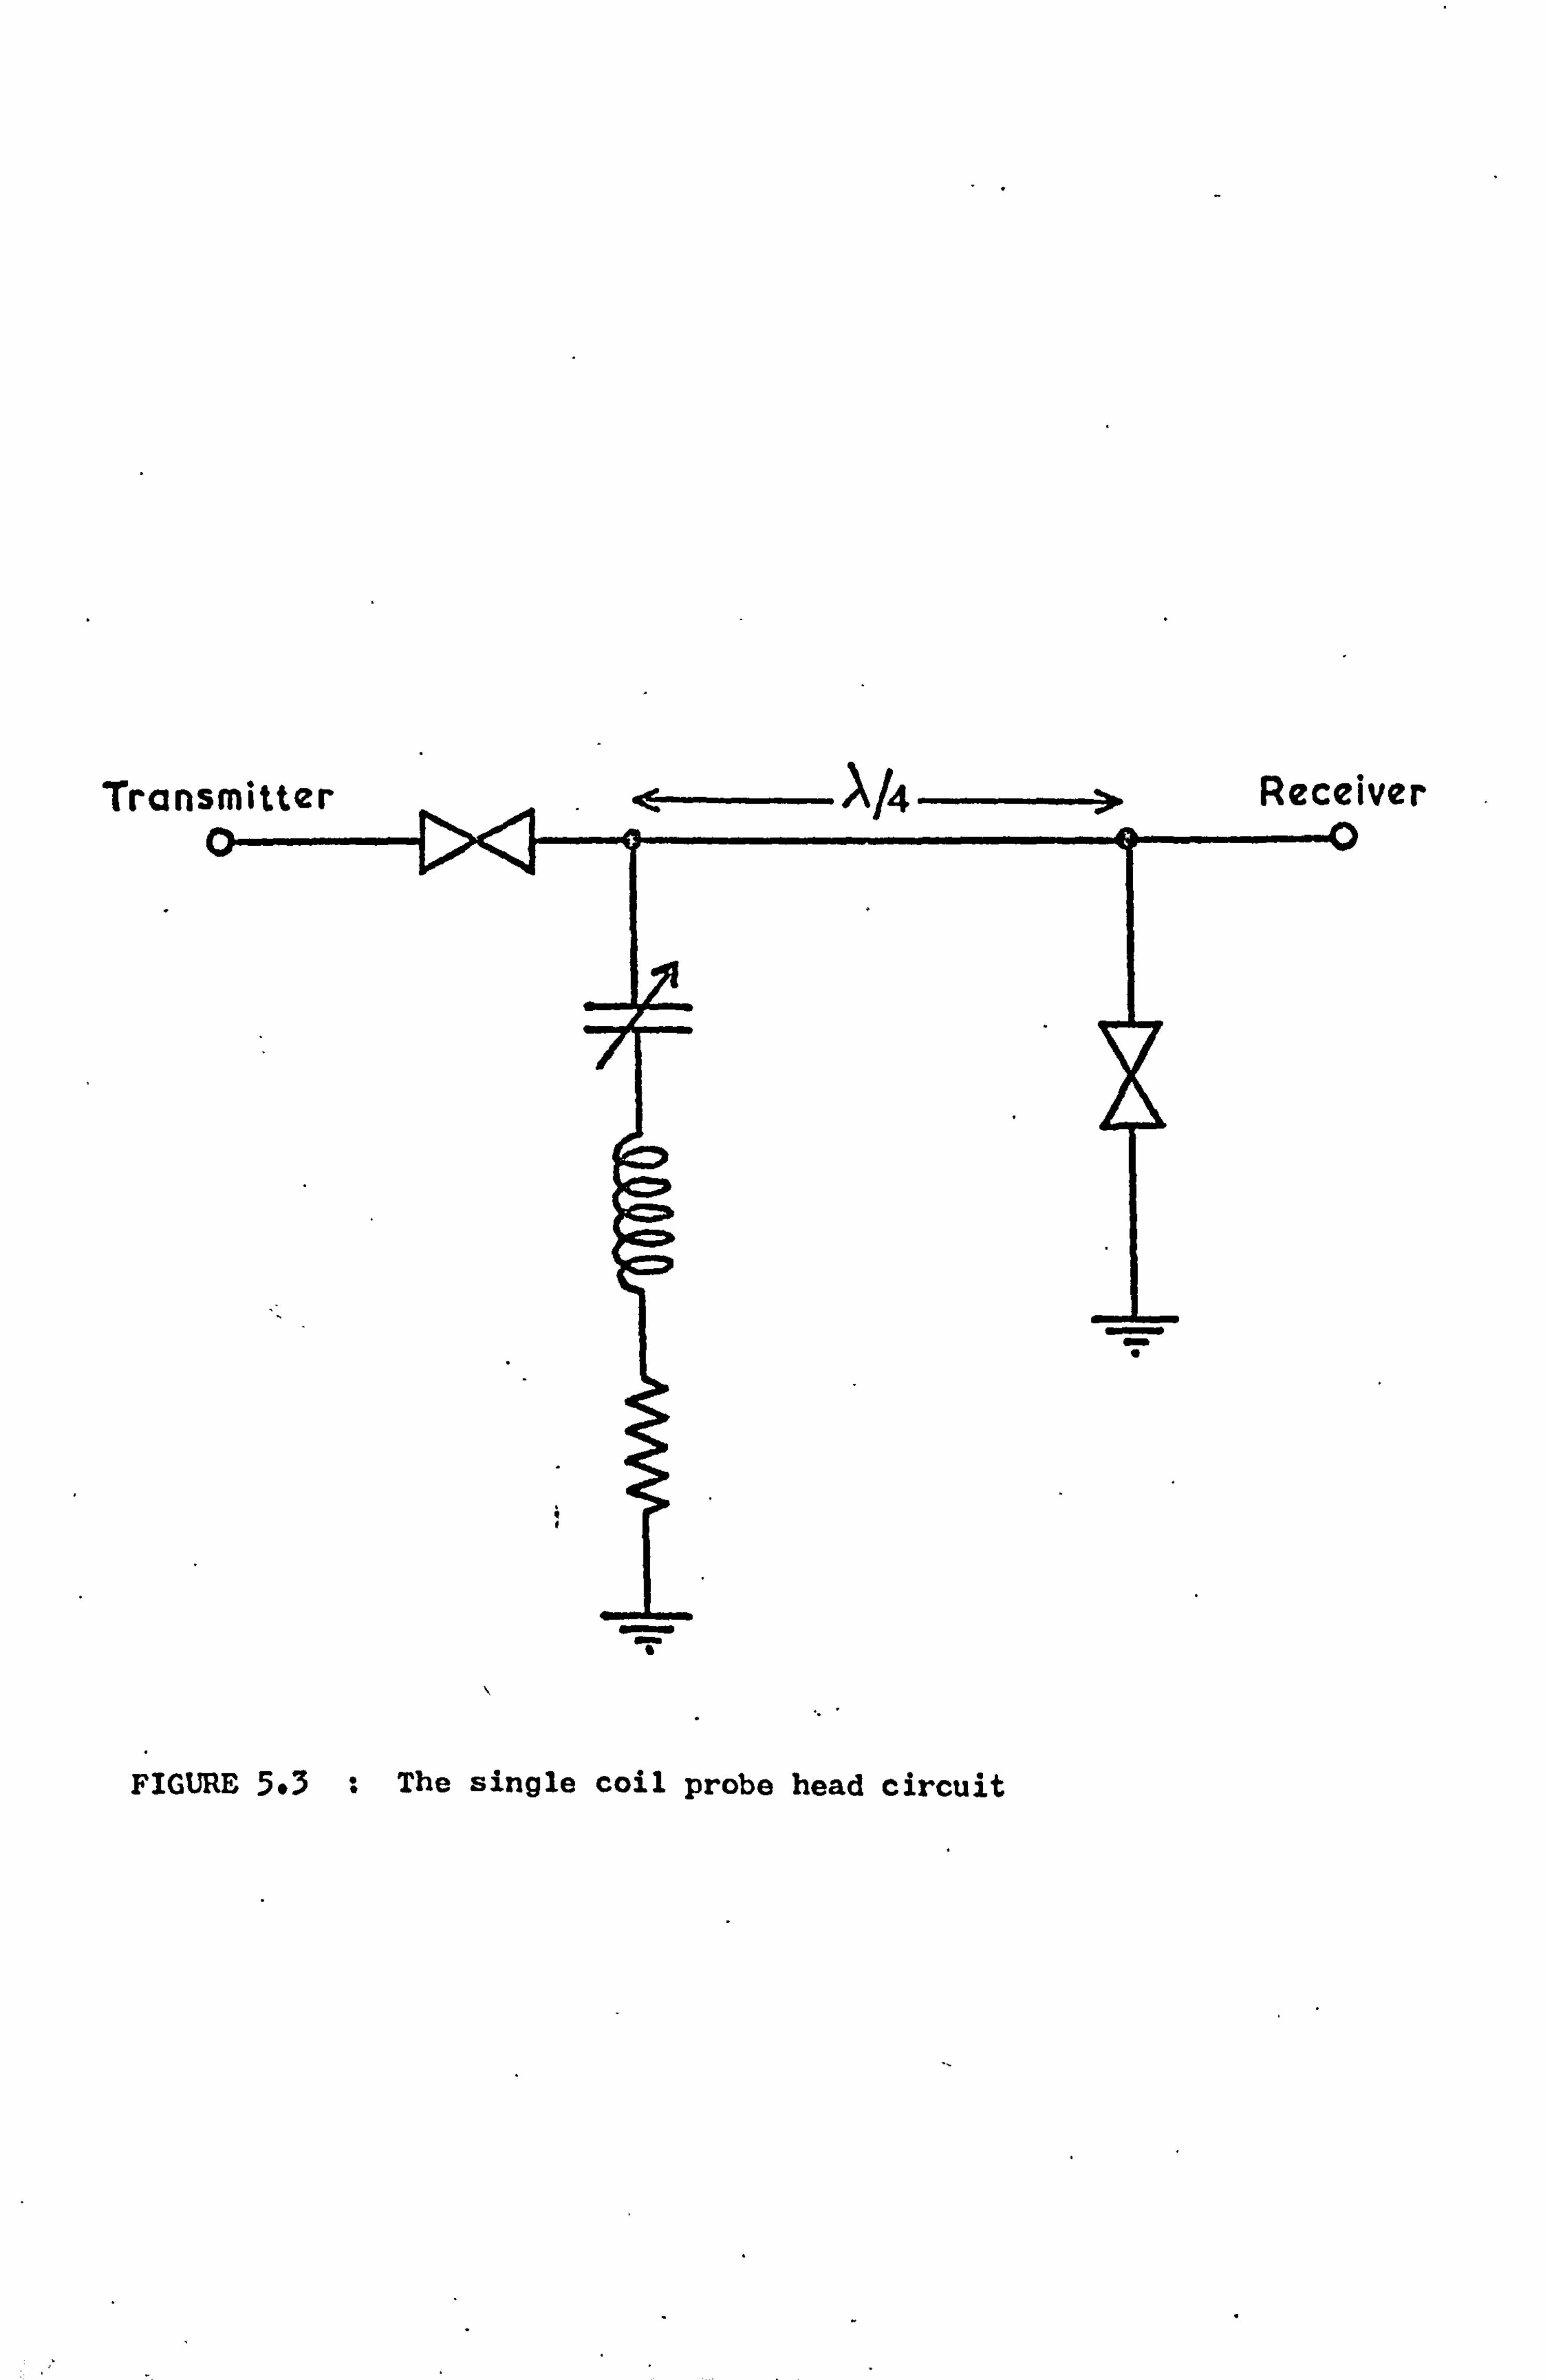
Trensmitter EXL, Receiver
FIGURE 5.3 : The single coil probe head circuit
- 62 -
The Bruker probe system employs separate transmitter and
receiver coils wound orthogonally. However for the rotor probe
heads and the gas flow cryostat it was found more convenient to
use a single coil system as shown in Figure 5.3. In the arrange-
ment used the sample coil was part of a series tuned resonant
circuit. When the pulse is applied both pairs of crossed diodes
conduct but, because the short circuited quarter wavelength cable
acts as an infinite impedance, the receiver is isolated from the
tuned circuit. When the pulse is switched off the crossed diodes
become non-conducting. The quarter wavelength cable then effect-
ively short circuits the receiver across the tuned circuit.
In each case the number of turns in the coil was set so that
at the-frequency required the tuned circuit had an impedance of
approximately 60 ohm, the output impedance of the power amplifier.
This operation was facilitated by the use of a Hewlett Packard
4815 A rf vector impedance meter. Although the coils possessed
an intrinsic resistance a small value resistor was sometimes added
to the series circuit. This had the effect of shortening the
receiver dead time by reducing the Q factor. The amplitude of
the nuclear transient signal at the receiver input was also reduced,
but this was not usually too important because of the use of signal
averaging techniques.
5.4.2 MECHANICAL CONSTRUCTION
For the gas flow cryostat the electromagnet was opened
out to its full 3" pole gap. Copper wire was found to interfere
with the copper resonances so the coil was wound from 36 SWG silver
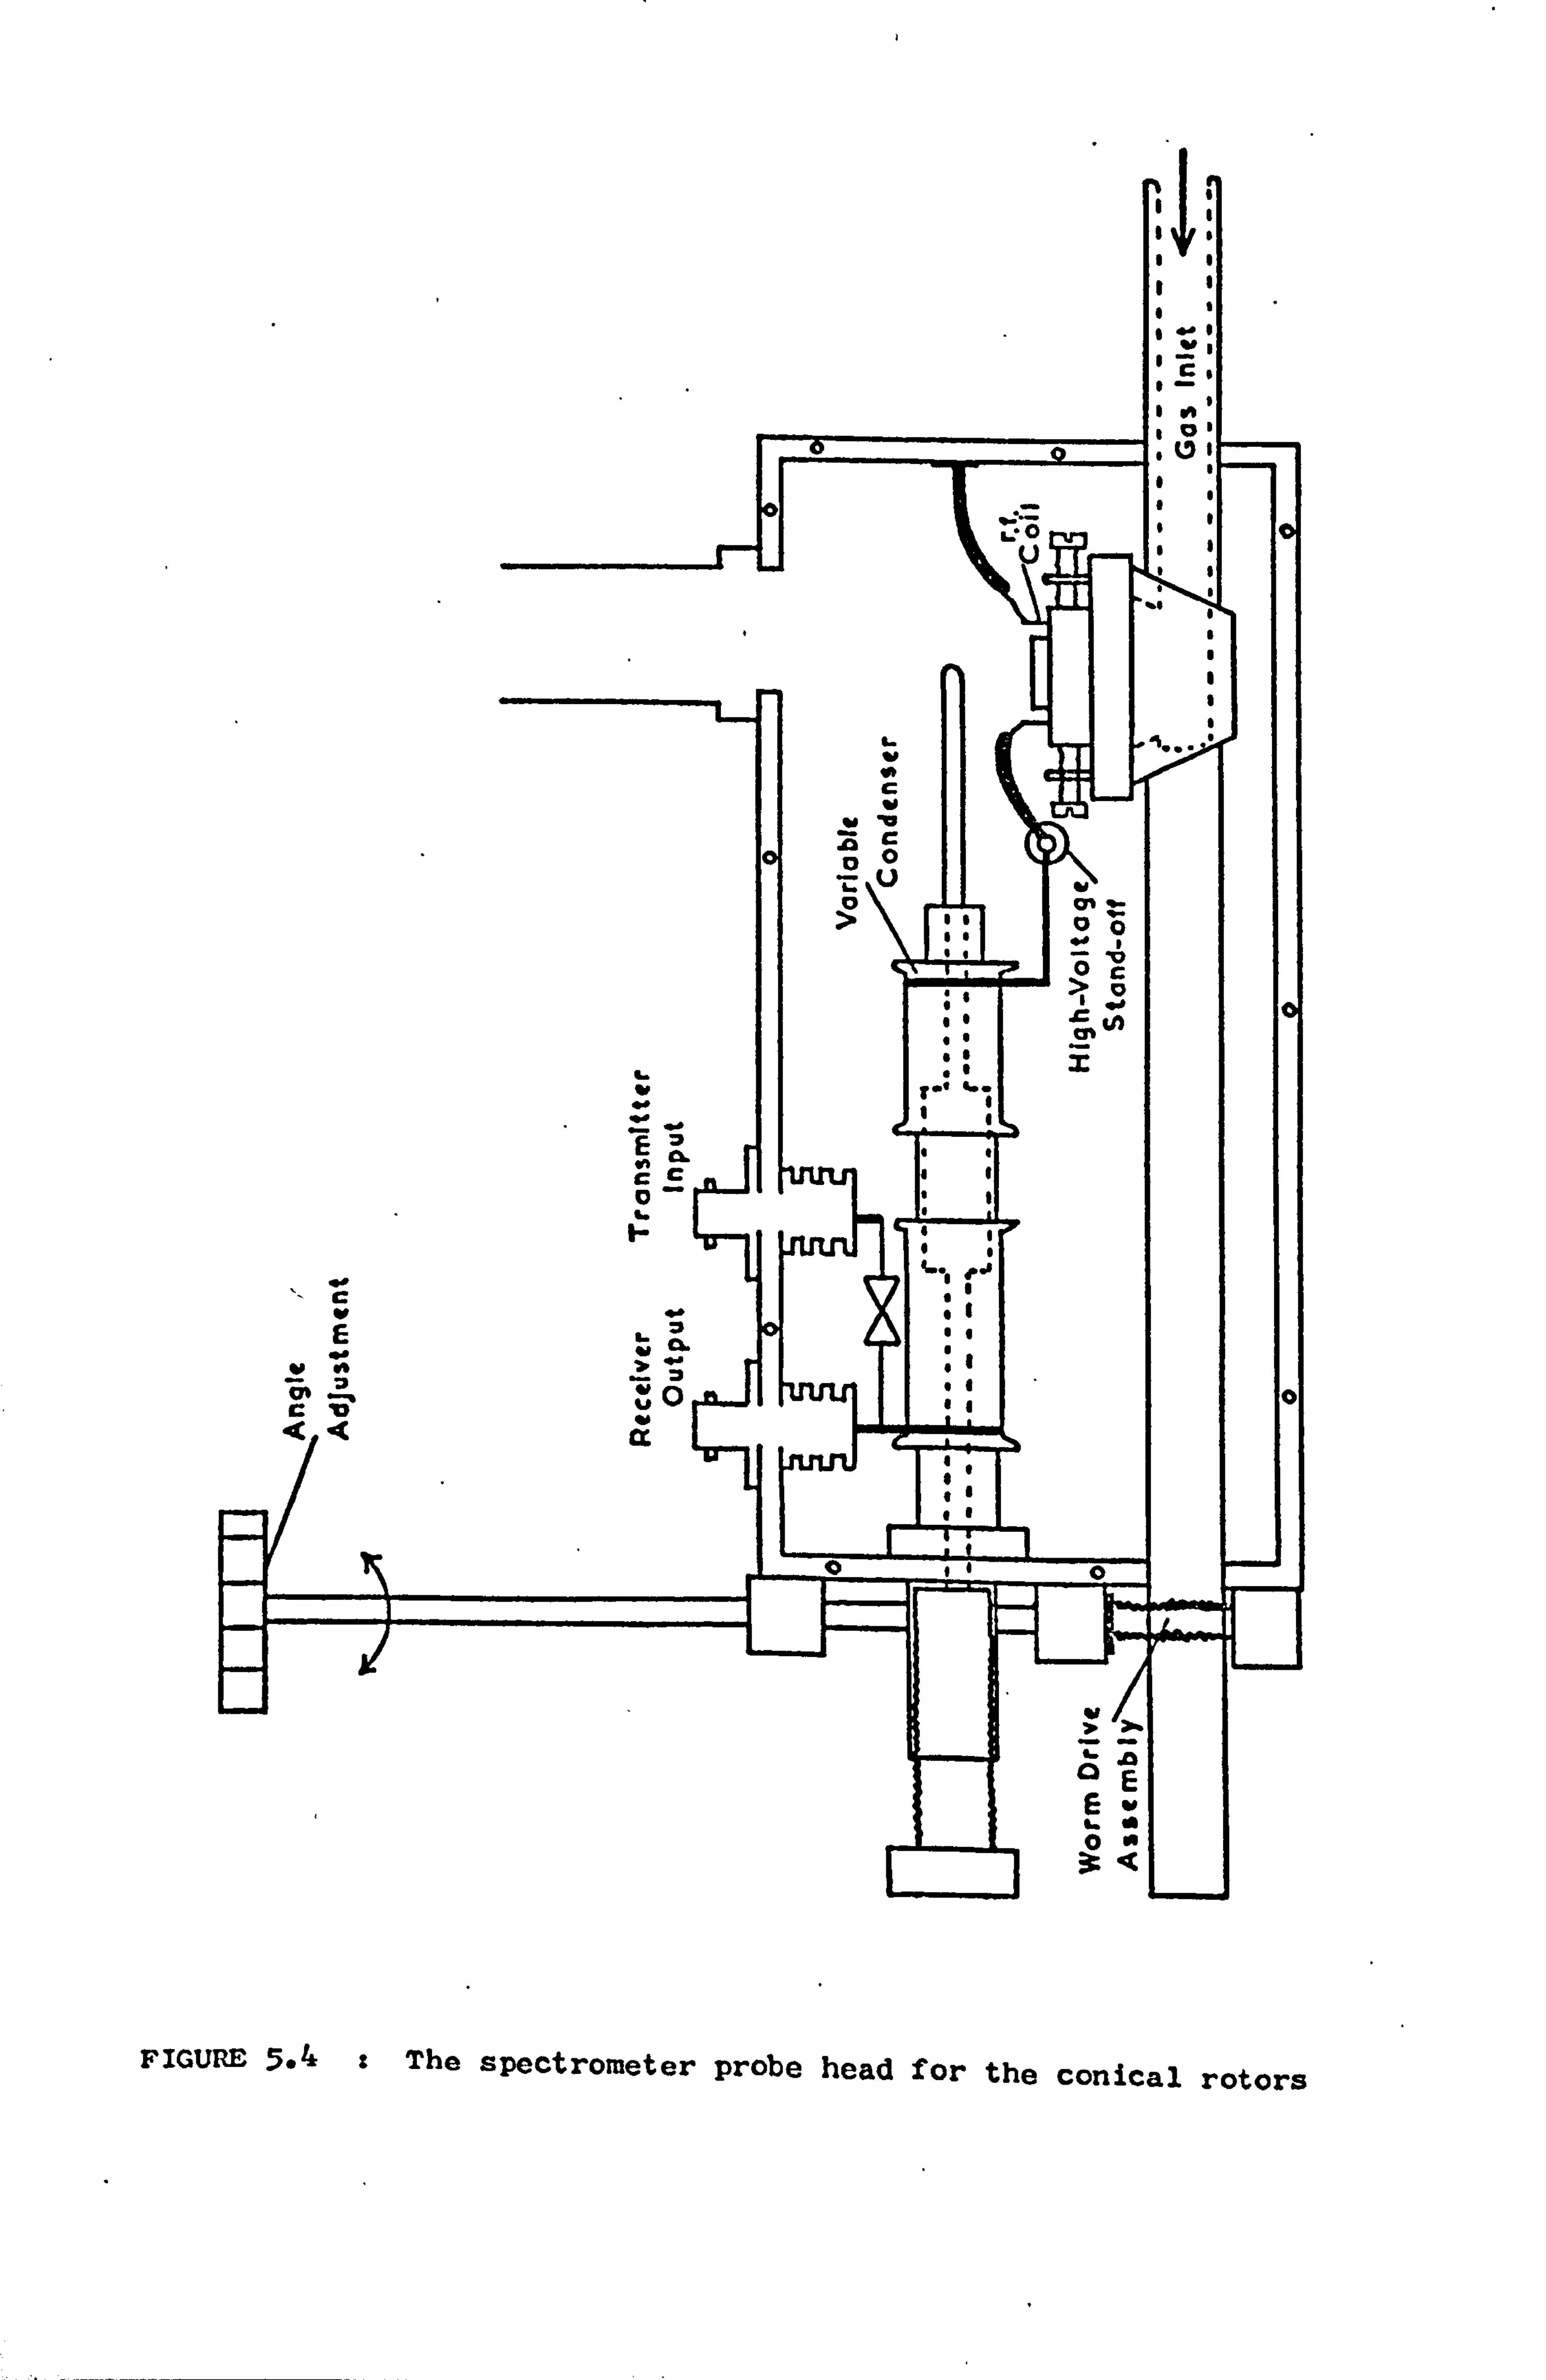
FIGURE $. 4 s The spectrometer probe head for the conical rotors
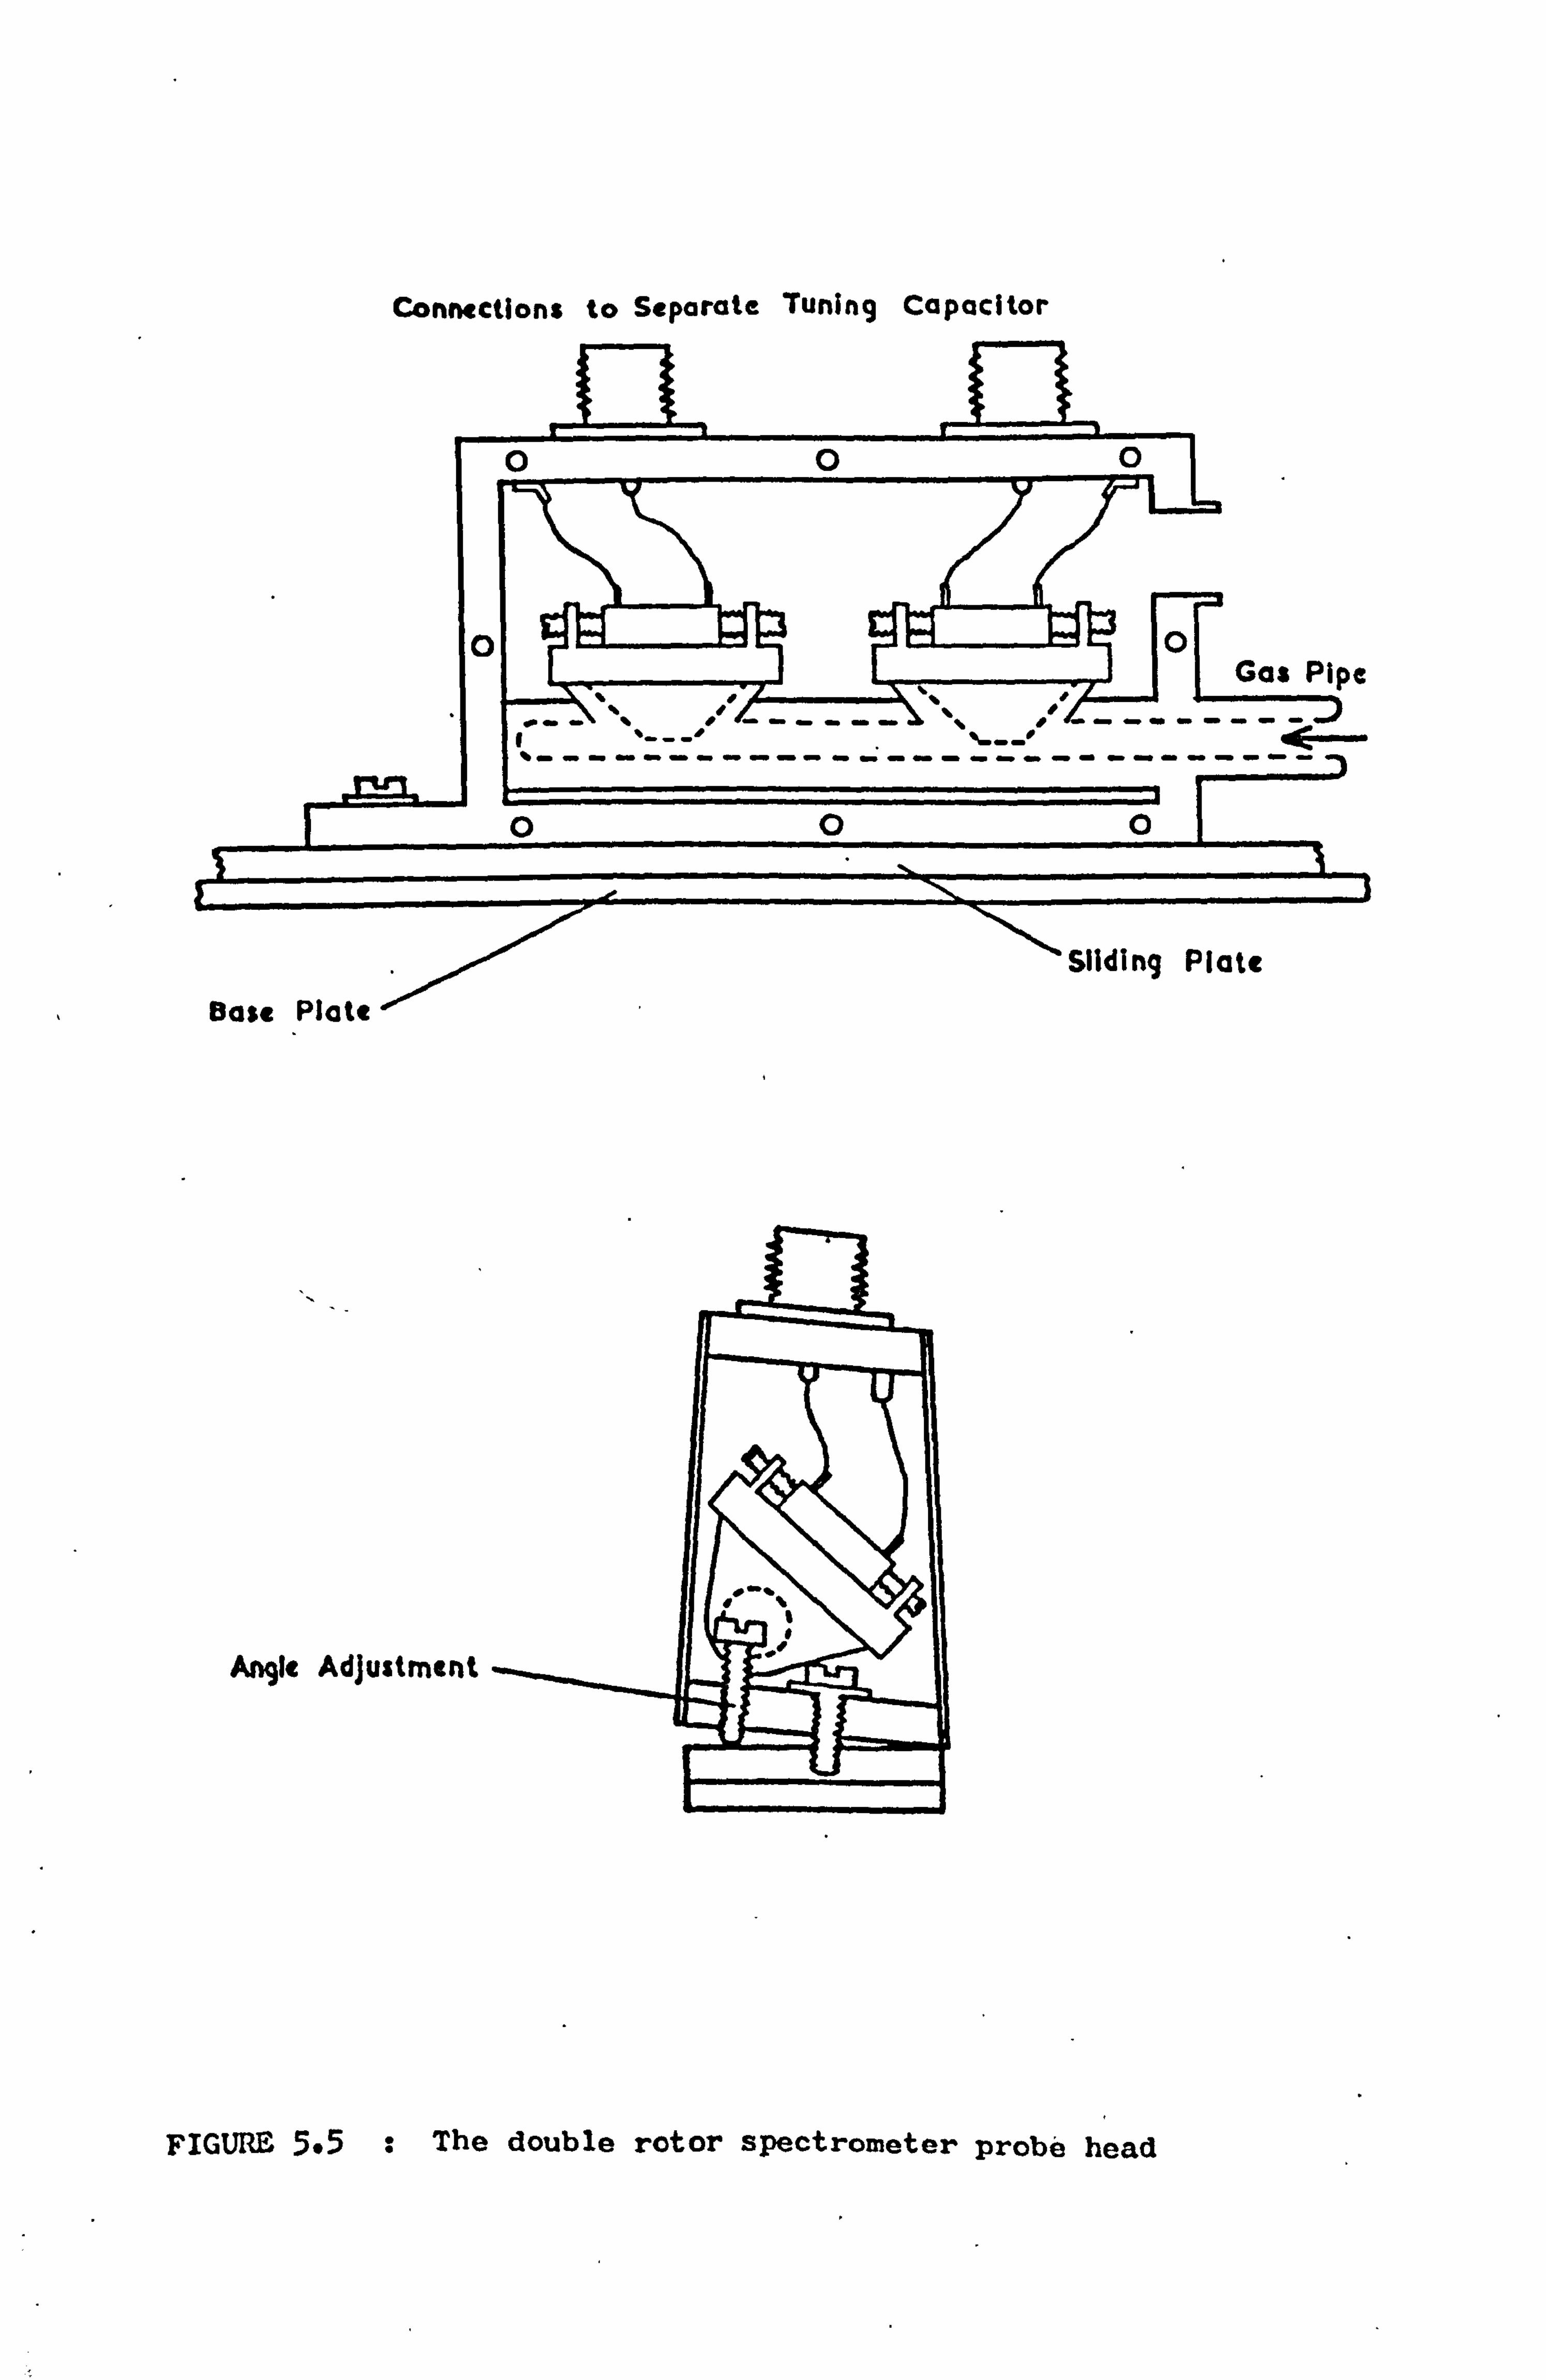
Connections to Separate Tuning Capacitor
WUPS Ua%j%%
Angle Adjustment
FIGURE 5.5 : The double rotor spectrometer probe head
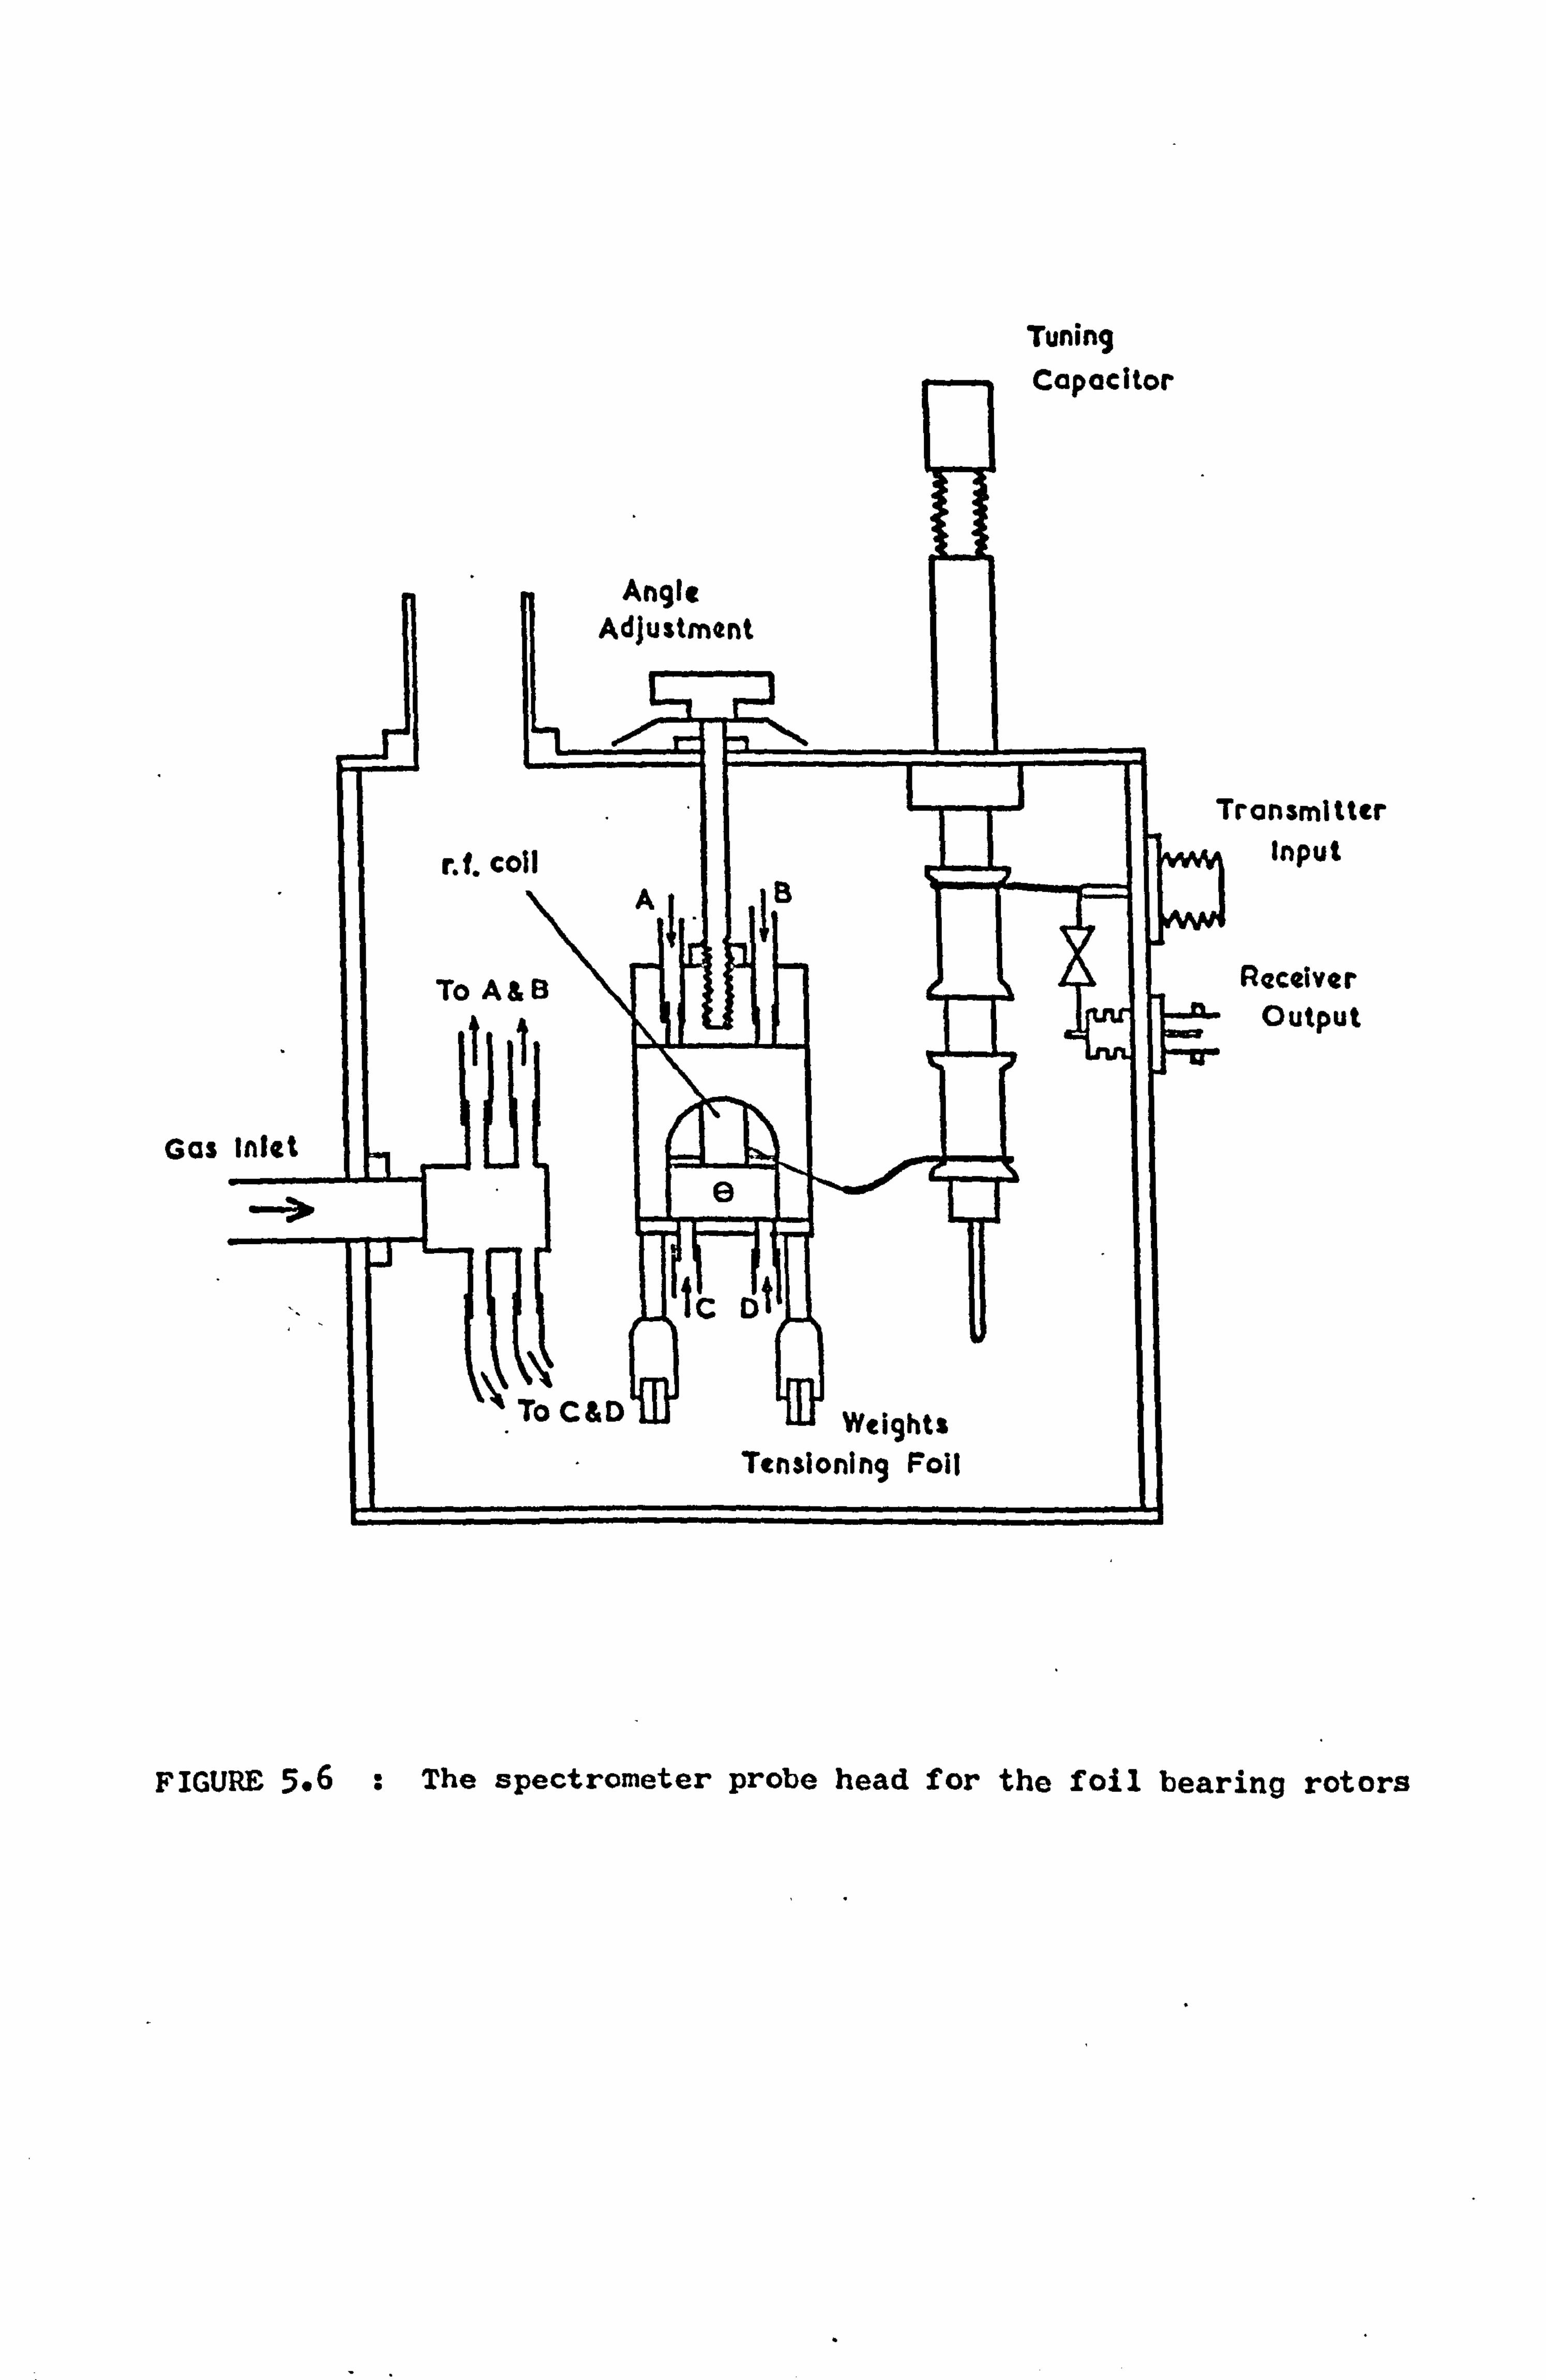
Tuning
ransmi tter Input
Receiver Output
Gas
FIGURE 5.6 : The spectrometer probe head for the foil bearing rotors
- 63 -
wire. The tuning capacitor, identical to those used in the rotor
bosses had a tuning range of 6-30 pp. It was placed in an alumin-
ium box and connected to the coil by a short co-axial cable and a
shielded small diameter stainless steel tube. Because of the stray
capacitance introduced into the tuned circuit the inductance of
the coil was fairly critical. For the measurements of the spin-
lattice relaxation times in the cuprous halides which were performed
at 12.5 Ma z it was optimized to a value of 3.25 IH.
The rotor probe heads were designed for a 2" magnet gap. They
were constructed mainly from dural and those parts of the body near
the rf coil were coated with varnish to eliminate mechanical vibrat-
ions set up by the rf pulse. The three types of probe head used
are shown in Figures 5.4,5.5 and 5.6. Adjustment of the magic
angle was achieved in a different manner in each case. For the
conical rotor system the rotors were canted at an angle in the
box. Fine adjustment was performed by a worm drive onto the
stator mounting in the single box and a simple screw system in the
double box. In the foil bearing system the rig was adjusted in
the horizontal plane by rotation of the supporting rod.
5.5 KNIGHT SHIFT MEASUREMENTS
Accurate determinations of resonance frequencies were made by
employing the Bruker phase sensitive detector. Assuming that the
nuclear lineshape is symmetric about the Larmor frequency vo, then
from consideration of the rotating frame it can be seen that the
frequency of the reference signal may be adjusted so that the
temporal behaviour of the magnetization is observed directly. The
- 64 -
phase can then be set so that the transverse magnetization is
completely nulled out. If, however, the reference frequency is
different from Vo the FID is modulated by beats at the frequency
difference and the null condition cannot be achieved. For asym-
metric spectra the spins fan out unevenly about any axis in the
rotating frame. As a result it is impossible to measure the
centre frequency by direct observation of the transient signals.
Experimentally the most homogeneous position in the magnet
gap was first found by using a suitable liquid specimen. A direct
comparison between the resonance frequencies of liquid samples
could be made by fine adjustment of the frequency synthesiser.
For weaker signals this operation was facilitated by a reduction
of the-receiver bandwidth and the use of the DL 102 signal averager.
The precise Knight shift measurements undertaken depended
upon the narrowing of the resonance spectrum by rapid sample rotat-
ion at the magic angle. Experimental Knight shifts are often
determined against liquid reference samples, but the conical rotors
used for this particular work would not rotate with liquid samples
of any reasonable volume. Therefore it was not possible to place
the metal and the reference specimen together in the same rotor
as has been done previously ý67ý
. Instead a different procedure
was adopted using the double rotor box shown in Figure 5.5. The
accuracy achieved was a significant improvement over previous
Knight shift estimates on the same metals. A short account of the
procedure adopted is included below.
A rotor was placed in one stator and the liquid reference
sample was put in an equivalent position in the second 'dummy'
stator. The assembly could be slid through the magnet pole gap
- 65 -
on top of a rigidly mounted base plate and locked into position.
Hence, without moving the main support or stopping the rotors
spinning, the two samples could be placed in exactly the same posit-
ion in the external field and their resonant frequencies determined.
Two identical sample coils were used which were connected alternat-
ely to the external tuning capacitor. Any difference in the mag-
netic field at the two stator positions was measured by replacing
the rotor with a second identical reference sample. Normally
the stator and clamping ring were made from dural, but for the
Knight shift measurements on aluminium the stators were made from
copper and the clamping rings from nylon.
5.6 FOURIER TRANSFORM PROCEDURES
As stated in Section 1.3 the absorption spectrum may be obtained
by Fourier transformation of the measured FID. This requires that
the detected signal is directly proportional to the transverse magnet-
ization in the rotating frame, i. e. that the receiver system is
linear. A simple check of the gain linearity was carried out using
different sample volumes and keeping the receiver attenuation const-
ant. There was no measurable variation in the shape of the recorded
FID, or the transformed lineshapes. The gain constancy with freq-
uency was checked by keeping the spectrometer controls unchanged and
comparing the resonance spectra obtained at different values of the
applied magnetic field. Over quite a wide range of resonant freq-
uencies (» linewidth) there was again no change in the recorded
line shapes.
-66-
The transient nuclear signals were recorded by using the
DL 102 signal averager. In the experimental arrangement used
each scan through the 200 memory channels was triggered off the
leading edge of the gating pulse to the transmitter and the det-
ected FID following the rf pulse was DC coupled into the averager.
No on-line Fourier transform capability was available, so the cont-
ents of the averager's memory were output to the teletype and
recorded onto paper tape. Fourier transformation of the recorded
data was undertaken with the University's ICL 1906A computer. The
program used for this purpose basically operated from the numeri-
cal summation
(w) _1 I G(t) cos wt St
Second moment values were determined from the transformed spectra
by a simple summation procedure written into the computer program.
Asymmetric nuclear lineshapes such as those arising from aniso-
tropic Knight shift interactions were obtained by setting the ref-
erence frequency to the phase sensitive detector well outside the
resonance spectrum. The transient response to the if pulse was
then recorded along a single detection axis in the rotating refer-
ence frame. After a correction for the reference phase the decay
signals were transformed using the same summation procedure as
above. This results in a symmetric frequency distribution with
the asymmetric absorption lineshape mirrored about vref'
The time origin of the recorded decay shapes was taken as the
centre of the -rf pulse for all measurements. This position has
been determined theoretically(68) and was confirmed for the rotating
- 67 -
samples by direct observation of the spinning beats on the FID.
5.7 FITTING THE DEAD-TIME POINTS
Before computation it was necessary to define that portion
of the transient nuclear signal that was lost during the intrumental
dead time. The dead time after the . rf pulse was typically 10 ps
for the Bruker probe system, but slightly longer for the single
coil circuits. The characteristic FIDs from the spinning samples
were long, so of the full decay shapes recorded in the store of
the signal averager only the first one or two data points were lost.
These could be estimated fairly accurately from the subsequent
behaviour of the FID. The dead time points of the signals recorded
off resonance were estimated by extrapolating the beats of the
detected decay shapes back to the centre of the rf pulse. The
phase of the first data point of the correct full decay signal was
then set empirically so as to give a flat baseline on the trans-
formed lineshape.
The attainment of reliable second moment values for the alumin-
ium samples depended upon the accurate prediction of the form of
the FID near the time origin. To assist in this task the behav-
iour of the transverse magnetization near zero time was investigated
using the solid echo pulse sequence and a three pulse sequence
b Jeener and Brockaert(69). proposed Y The procedure adopted consist-
ed of plotting out the first few detected points of the FIDs: those
points lost were then computed so that the initial part of the
decay curve mirrored the decay envelopes obtained from the two pulse
sequences as described below.
- 68 -
5.7.1 THE SOLID ECHO PULSE SEQUENCE
For a dipolar coupled spin system it may be shown (70,71)
that at resonance the transient response following a 90-T-9090
pulse sequence is given by the power series
M*(t' - T) =1-M (t' - T)
2+M (t' - T) 4+M 6t' 2T2
+ ... - y22.4 4.4E 4!
t' is the time measured from the second pulse, T is the time between
the two pulses and M4E is an error term defined by Mansfield (71)
0
It follows from equation (2.20) that when the product t'T is small
the response following the second pulse closely resembles the FID.
In practice the pulse lengths and the detection axis of the
PSD were adjusted for maximum signal. The phase of the second
pulse was set so that the response from a single such pulse was
zero, and T was fixed so that the echo maximum occurred immediately
after the dead time of the second pulse. The echo shape was then
recorded with the signal averager.
5.7.2 JEENER AND BROCKAERT 'ZERO TIP-1E' SEQUENCE
The results obtained from the aluminium samples with the
solid echo sequence were confirmed in part by using a
90 90 t-90_90-T-90 90 pulse sequence. In this sequence the magnet-
ization in the rotating frame My(t) is transferred back to the z
direction by the application of the second pulse 1800 out of phase
with the first. After a time T> T2 the transverse magnetization
has disappeared so that, providing T« T1, the amplitude of any
- 69 -
point on the FID following a third 'read' pulse is then directly
proportional to MM(t).
The delay T was set using the delay unit described previously
and the signal intensity after the third pulse was monitored with
the PGI. The form of the FID was found by stepping out the time
t between the first and second pulses. However, the effectiveness
of this pulse sequence was limited to times (t) greater than the
width of the 90 ° pulses.
5.8 MEASUREMENT OF RELAXATION TIMES
5.8.1 SPIN-LATTICE RELAXATION TIME (T1)
Both 180-T-90 and 90-T-90 pulse sequences were used to
measure spin-lattice relaxation times. In these sequences the
first pulse removes the magnetization from the z direction and the
amplitude of the FID following the second pulse determines that
fraction that has returned after a time T. Assuming a single
relaxation time the exponential recovery envelope plotted out in
this way is of the form
vio -VT= exp(-T/T1)
I
where V[0] is the signal magnitude following a single 900 pulse;
K takes the values V[0] and 2V [0] for the 90-T-90 sequence and
180-T-90 sequence respectively. T1 may then be found from the
linear graphical plot: ln[V[01 - V[T]] versus -T/T1.
" From equation (5.1) it follows that after a time = 5T1, the
magnetization has returned to equilibrium along the z axis and the
(5.1)
- 70 -
sequence may be repeated. In practice the PGI was used to measure
the signal amplitude at a fixed time after the second pulse. Once
a constant value was recorded the pulse separation T was changed
and the procedure repeated.
5.8.2 DIPOLAR RELAXATION TIME (TID)
Measurements of T1D (or more accurately Tis) were under-
taken using the 90-T-4590-t'-4590 pulse sequence of Jeener and (69)
Brockaert. In this sequence two rf pulses 900 out of phase
are used to transfer Zeeman order into observable amounts of dipolar
order. We include below a simple explanation as to the effect
of this pulse sequence on the nuclear spin system.
The first 900 pulse aligns the spins along the y* axis in the
rotating frame. After a time t ti T2 the spins have dephased so
that the fast spins point along the +x* axis direction and the
slow spins along the -x* direction. The second pulse along y*
turns the fast spins along the -z direction and the slow spins
along the +z direction. Once the remaining transverse magnet-
ization has decayed to zero this corresponds to a state of dipolar
order, i. e. an absorption spectrum which is absorptive above vo
and emissive below. Although this explanation is based on two
90° pulses the transfer of order is most efficient when the second
pulse length is reduced to 450. A third pulse, again 45 0, is
used to detect the amount of dipolar order after a time t'.
Experimentally the sequence was set up in the same manner as
described by Tunstall and Brown (72)
and will not be reiterated
here. The delay unit described in Section 5.2 was used to step
- 71 -
out the time t' between the second. and third pulses and the ampli-
tude of the resulting echo was monitored with the PGI. The value
of T1D was obtained by plotting In V(t') versus -t'/TID.
5.9 SAMPLE PREPARATION
5.9.1 CUPROUS HALIDES
Three cuprous halides exist in the solid state, CuCl,
CuBr and CuI (CuF is unstable at ordinary temperatures (73)).
Reagent grade specimens of each of these compounds were used together
with pure specimens of CuBr and Cul obtained from Alfa Inorganic.
In each case about 1 cm3 of polycrystalline material was sealed
into glass phials under vacuum. At low temperatures induced piezo-
electric vibrations in the crystallites caused severe distortion
of the detected decay curves and hampered the determinations of T1.
In order to overcome this problem thin aluminium foil was wound
around the samples to act as a Faraday shield. Mechanical vibrat-
ion in the foil was suppressed by coating the surface with low
temperature varnish.
5.9.2 METALS
The penetration of an rf field into a plane conducting
surface is governed by the equation
H(d) - H(O) exp(-d/U)
where Q, the skin depth, is given by
- 72 -
a° P/'rvu
p is the resistivity, V is the frequency of radiation and p the
permeability of the sample.
Because of the small skin depths at rf frequencies, NMR measure-
ments are usually performed on samples of fine powder or thin foil.
In the CW method the resonance lineshapes from bulk metallic samples
are distorted by a linear mixing of the absorption and dispersion (74)
modes and similar phase errors become apparent with the pulse tech-
nique(75). Measurements have been reported on single crystal
specimens including aluminium (76)
, but the interpretation of the
results involves some empirical assumptions being made about the
degree of lineshape distortion. In this work good rf penetration
was ensured by using fine powder specimens with dimensions approxi-
mately equal to the skin depth.
Most of the metal powders- were obtained commercially, but the
pure aluminium powders were prepared in the laboratory. In one
process 2 mm diameter aluminium wire was fed through a Metallisation
Mark 16 metal spraying pistol at a rate of 4 ft s-1 and the result-
ing powder collected in a large container of water. The pressures
of the gas supplies to the pistol were found to be critical to the
attainment of the fine powder required and were optimized to the
following values:
Propane 40 psi Oxygen 38 psi Air 70 psi.
After repeated washes with analar grade methanol the collected powder
was rinsed with acetone and dried. It was then passed through a
series of filters. Typical yields were as shown below:
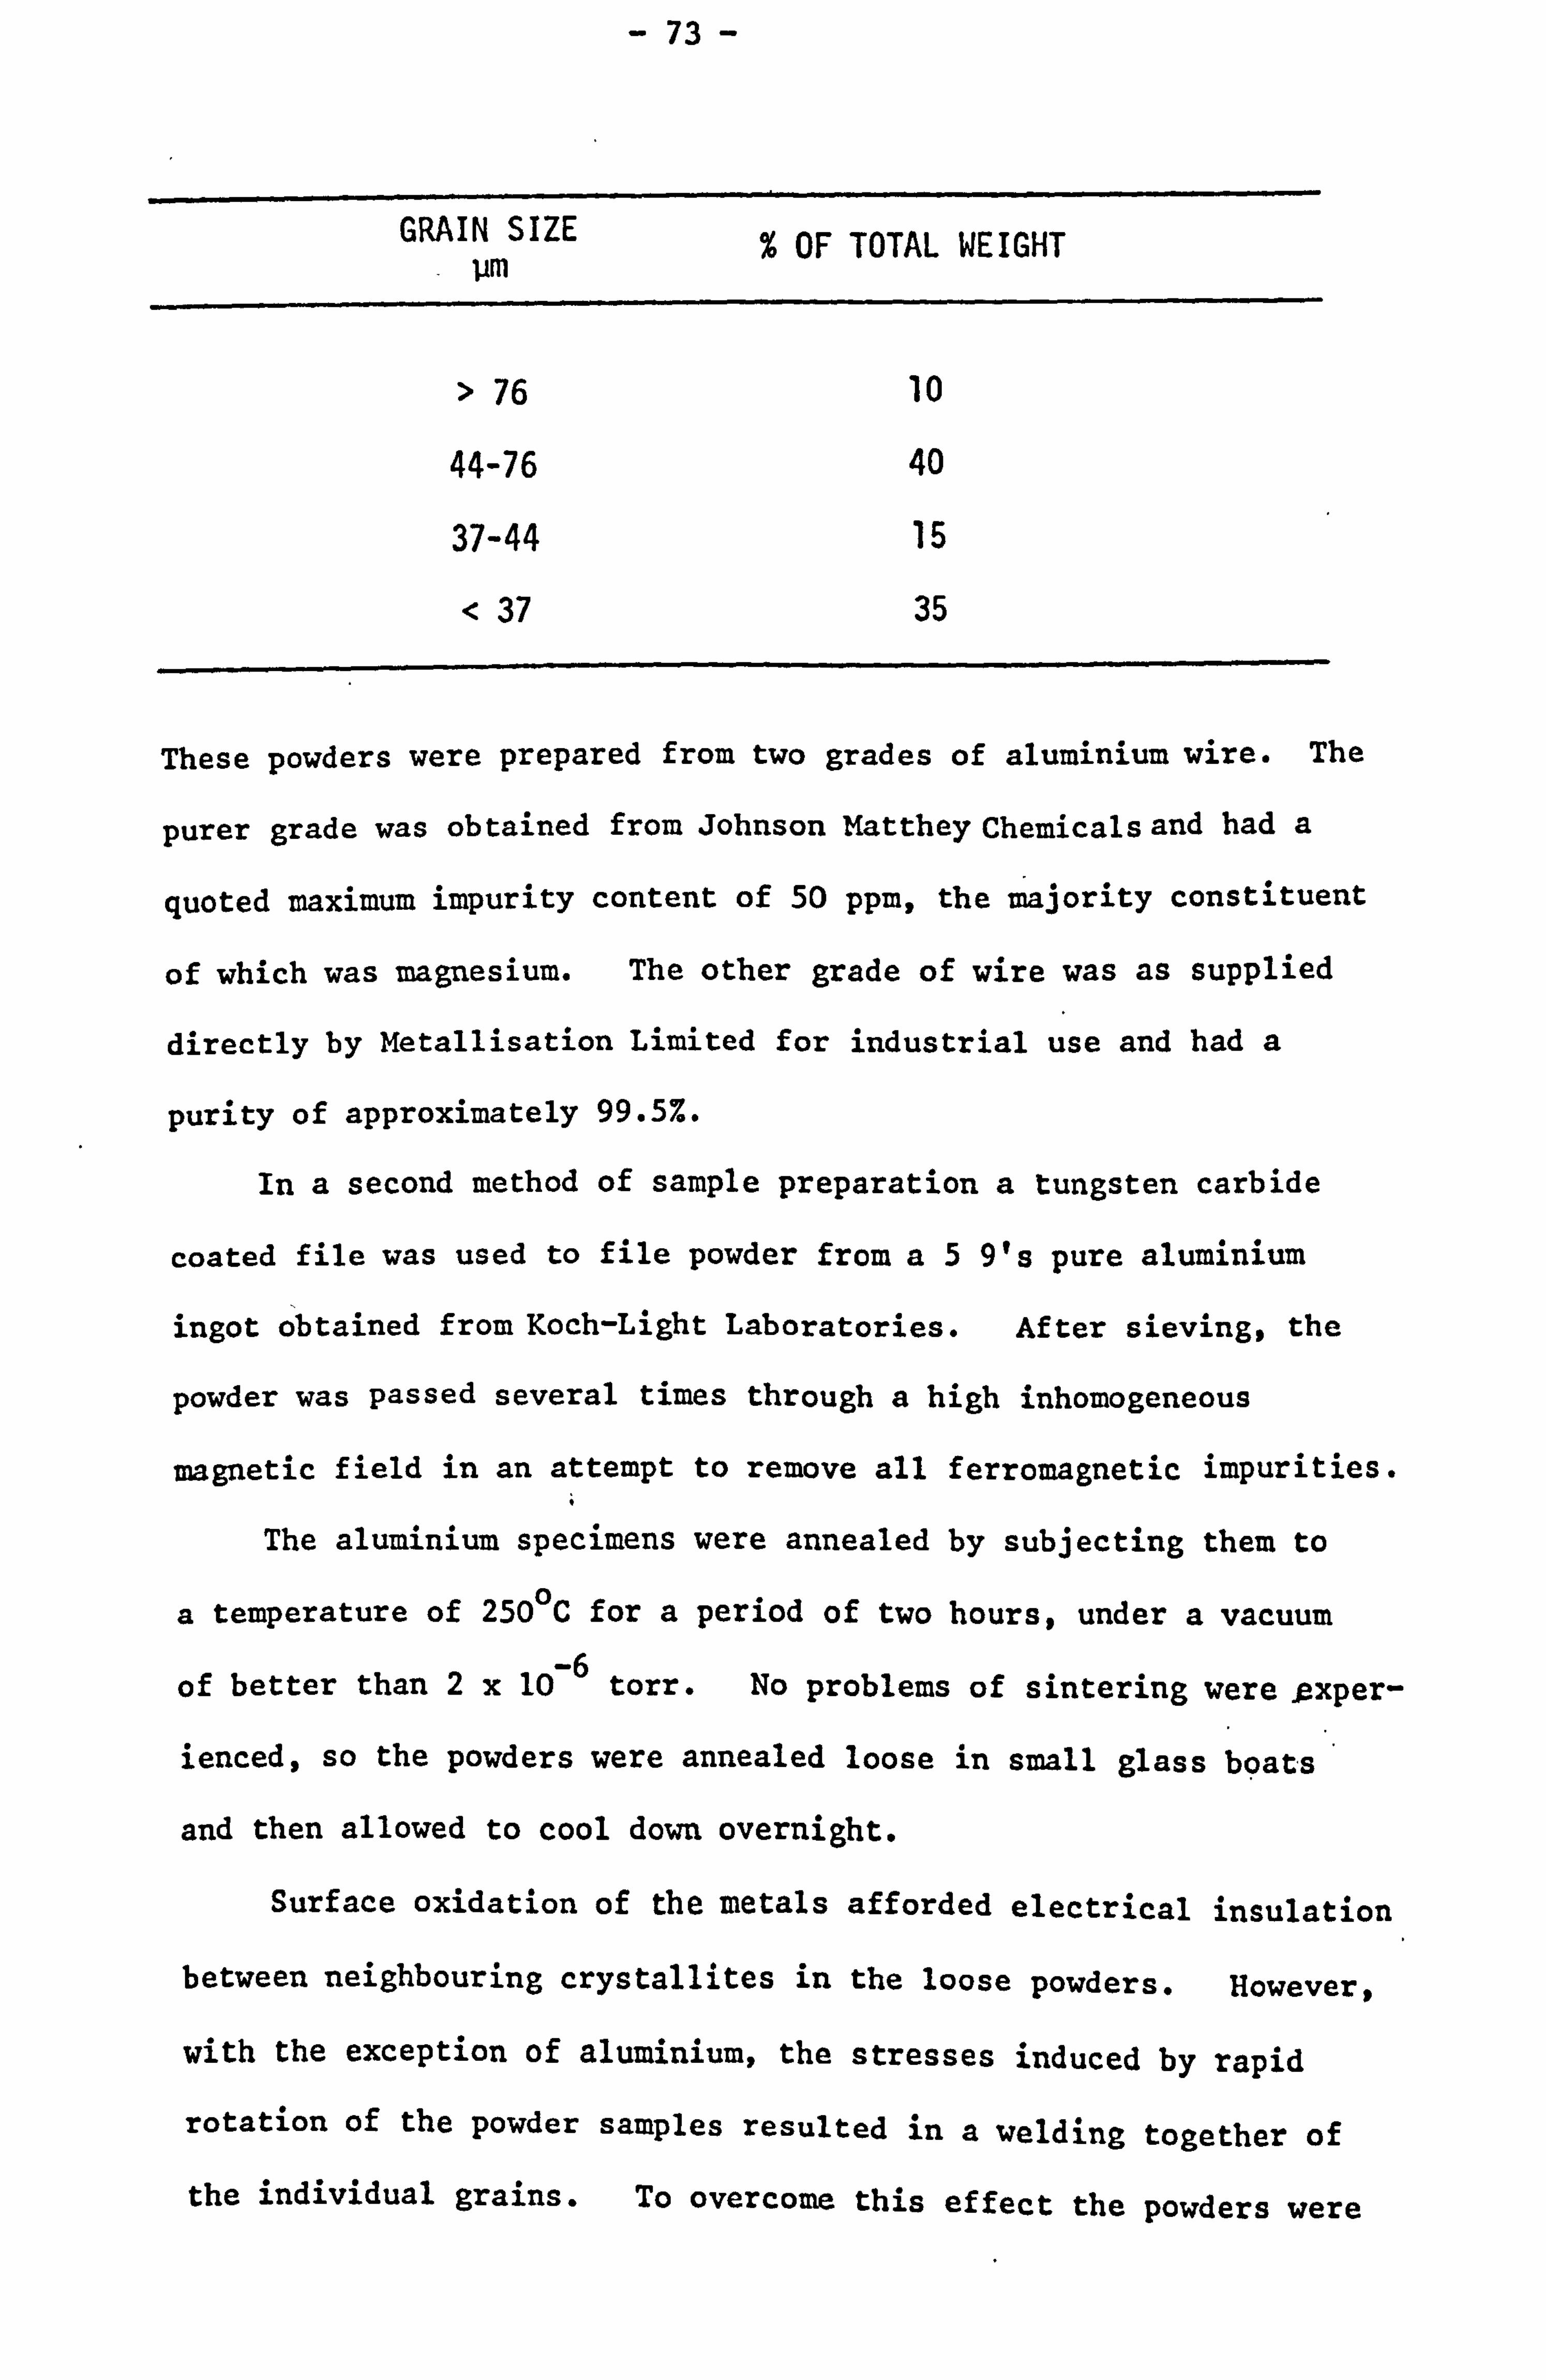
- 73 -
GRAIN SIZE % OF TOTAL WEIGHT - um
> 76 10
44-76 40
37-44 15
< 37 35
These powders were prepared from two grades of aluminium wire. The
purer grade was obtained from Johnson Matthey Chemicals and had a
quoted maximum impurity content of 50 ppm, the majority constituent
of which was magnesium. The other grade of wire was as supplied
directly by Metallisation Limited for industrial use and had a
purity of approximately 99.5%.
In a second method of sample preparation a tungsten carbide
coated file was used to file powder from a5 9's pure aluminium
ingot obtained from Koch-Light Laboratories. After sieving, the
powder was passed several times through a high inhomogeneous
magnetic field in an attempt to remove all ferromagnetic impurities.
The aluminium specimens were annealed by subjecting them to
a temperature of 250°C for a period of two hours, under a vacuum
of better than 2x 10⁻⁶ torr. No problems of sintering were ßxper-
ienced, so the powders were annealed loose in small glass boats
and then allowed to cool down overnight.
Surface oxidation of the metals afforded electrical insulation
between neighbouring crystallites in the loose powders. However,
with the exception of aluminium, the stresses induced by rapid
rotation of the powder samples resulted in a welding together of
the individual grains. To overcome this effect the powders were
- 74 -
combined with a low viscosity resin mix - araldite 753/HY 951
hardener. In order to maximize the specimen density the uncured mixt-
ure of resin and powder was centrifuged in cylindrical teflon moulds.
After curing under an infra-red lamp, the solid slugs of powder
and resin formed at the bottom of the moulds were machined to
size, etched with acid and then pressed into the rotor sample
chambers.
- 75 -
CHAPTER 6
" MEASUREMENTS ON THE SPIN-LATTICE RELAXATION TIMES
IN THE CUPROUS HALIDES
6.1 INTRODUCTION
The work described in this chapter deals with T1 measurements
on samples of the three solid cuprous halides. Interest in these
compounds first arose from their use as reference samples in the
accurate measurement of the Knight shift of 63Cu
and 65Cu in metal-
lic copper by the macroscopic rotation technique(67). Accurate
values of their chemical shifts were obtained at the same time (77)
It was decided to extend the investigation of these compounds to
the measurement of their spin-lattice relaxation times.
The cuprous halides have a zinc blende structure, the copper
and halogen atoms lying on separate FCC sites displaced from each
other by one-quarter of the distance along the body diagonal. Hence
each atom is surrounded tetrahedrally by four atoms of the opposite
kind. Despite the lack of any secular quadrupole interaction in
crystals having cubic symmetry, time dependent quadrupole interact-
ions arise from the distortion of the nuclear symmetry by lattice
phonons. The nuclear spin relaxation mechanism generated by the
lattice vibrational modes proves to be dominant over a large temper-
ature range in these compounds.
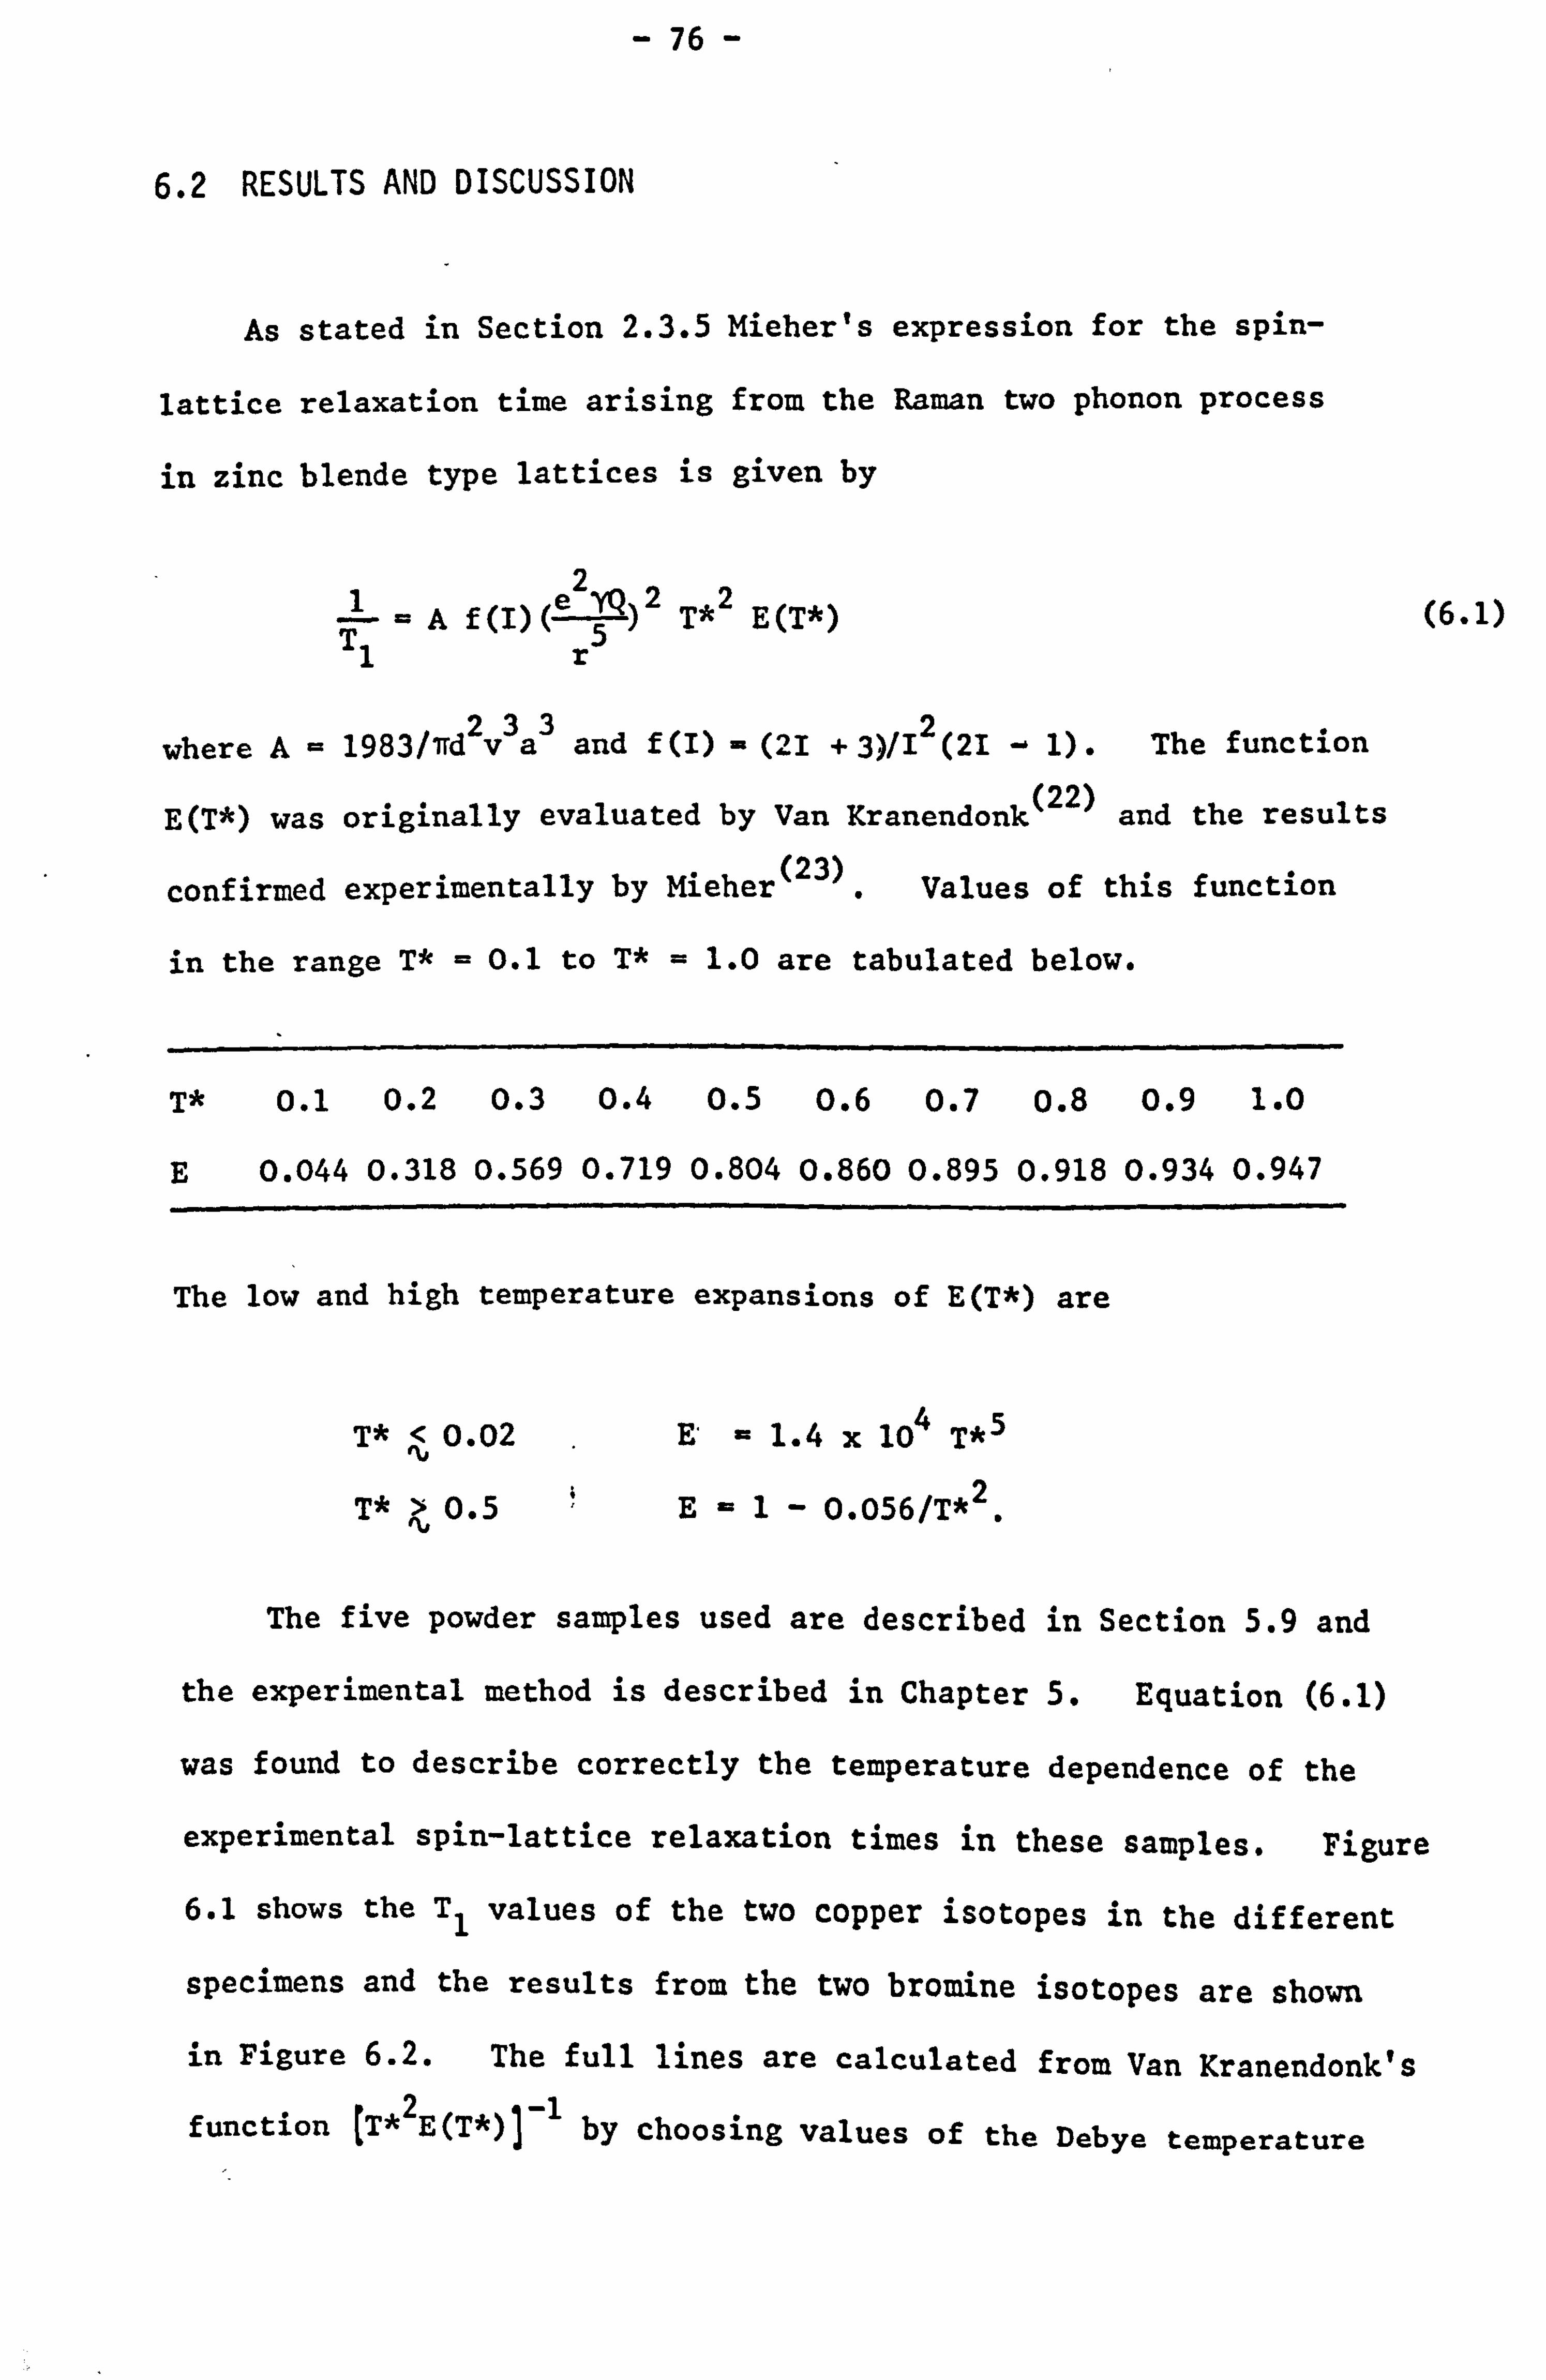
- 76 -
6.2 RESULTS AND DISCUSSION
As stated in Section 2.3.5 Mieher's expression for the spin-
lattice relaxation time arising from the Raman two phonon process
in zinc blende type lattices is given by
1=A f(I)(e z
)2 T*2 E(T*) T1 r
where A= 1983/Trd2v a3 and f(I) . (2I + 3)/I2(2I - 1). The function
E(T*) was originally evaluated by Van Kranendonk(22) and the results
(23) confirmed experimentally by Mieher. Values of this function
in the range T* = 0.1 to T* = 1.0 are tabulated below.
T* 0.1 0.2 0.3 0.4 0.5 0.6 0.7 0.8 0.9 1.0
E 0.044 0.318 0.569 0.719 0.804 0.860 0.895 0.918 0.934 0.947
The low and high temperature expansions of E(T*) are
T* ti 0.02 E' - 1.4 x 104 T*5
T* ti 0.5 E-1-0.056/T*. 2
The five powder samples used are described in Section 5.9 and
the experimental method is described in Chapter 5. Equation (6.1)
was found to describe correctly the temperature dependence of the
(6.1)
experimental spin-lattice relaxation times in these samples. Figure
6.1 shows the T1 values of the two copper isotopes in the different
specimens and the results from the two bromine isotopes are shown
in Figure 6.2. The full lines are calculated from Van Kranendonk's
function CT*2E(T*))-l by choosing values of the Debye temperature
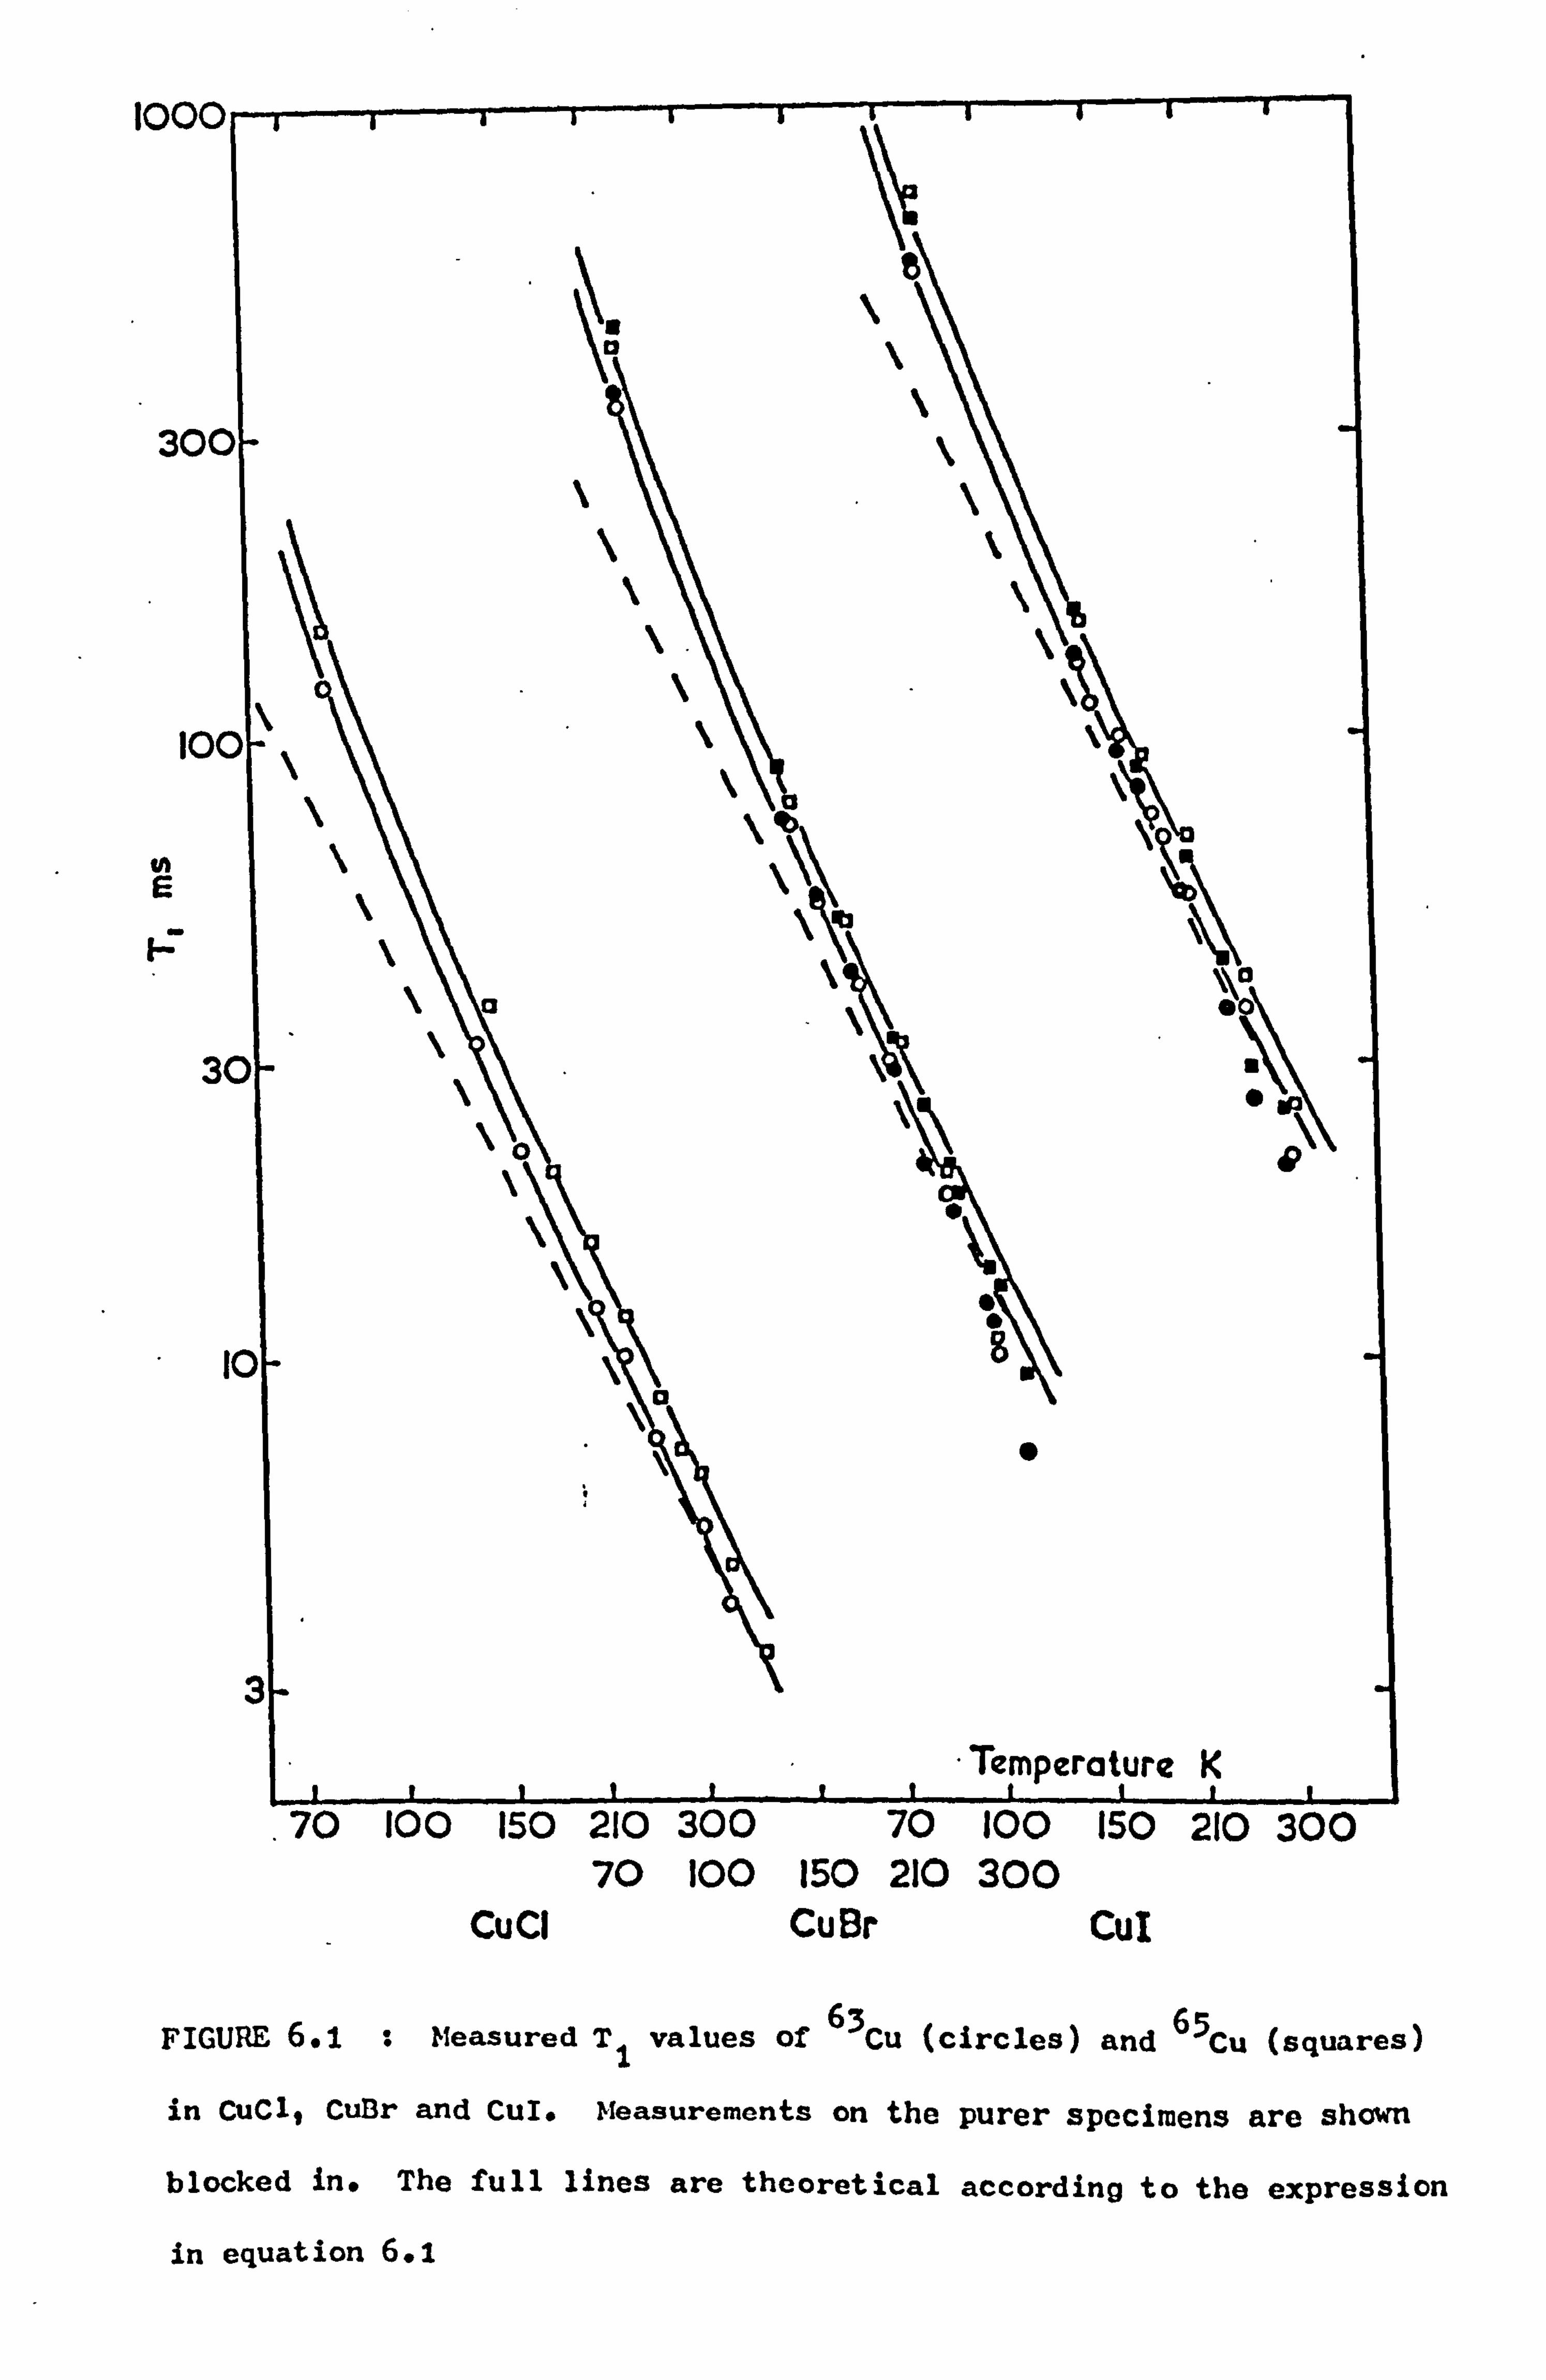
1000
N E
E
FIGURE 6.1 : Measured T1 values of 63Cu
(circles) and 65Cu
(squares)
in CuCl, CuBr and Cui. Measurements on the purer specimens are shown
blocked in. The full lines are theoretical according to the expression
in equation 6.1
. 70 100 150 210 300 70 100 150 210 300
70 100 150 210 300 Cu CI CuBr Cut
IC
1
I.
FIGURE 6.2 : Measured T1 values of 79
Br (squares) and 81
Br (circles)
in CuBr. The blocked in points again refer to the purer specimen.
The full line is theoretical according to the function given in
equation 6.1. The broken line shows the T-2 dependence at higher
temperatures
TEMPERATURE K
- 77 -
in each case so as to give the best fit to the experimental data.
The same values of 6D were used for both 63
Cu and 65
Cu in each
halide and also for 81
Br in the samples of cuprous bromide.
From Figures 6.1 and 6.2 it can be seen that although at lower
temperatures Van Kranendonk's function fits the data well, at
higher temperatures the T1 values from all three halides fall progres-
sively below the theoretical curves. This probably arises from
a contribution to the overall spin-lattice relaxation time from
(78'79) increasingly rapid ionic diffusion, as has been noted elsewhere.
Nevertheless the general tendency for Tl to decrease asymptotically
to a T-2 behaviour at higher temperatures, but deviate from such
a temperature dependence at lower temperatures is still apparent.
The values of T1 from the two specimens of cuprous bromide are
in very close agreement for 63Cu, 65Cu
and 81Br
over the entire
temperature range. The same is also true of the copper isotopes
in the two cuprous iodide specimens of differing purity, showing
that over the range of measurements the recorded T1 values were
largely insensitive to sample purity or origin.
The Debye temperatures found for each of the three cuprous
halides are shown in Table 6.1. The choice of value of 8D needed
to secure agreement between theory and experiment is not critical
so there is an uncertainty of approximately ±25 K in the values
quoted. Previous estimates of 8D as found from T1 measurements on
pure single crystals of CuCl and CuBr(80) and a powdered sample of
CuI(81) are included in the same table. The Debye temperatures
given by Domngang and Wucher for CuCl and CuBr are in reasonable
agreement with those quoted here, but there is some discrepancy in
the two values for CuI. This may simply reflect the insensitivity
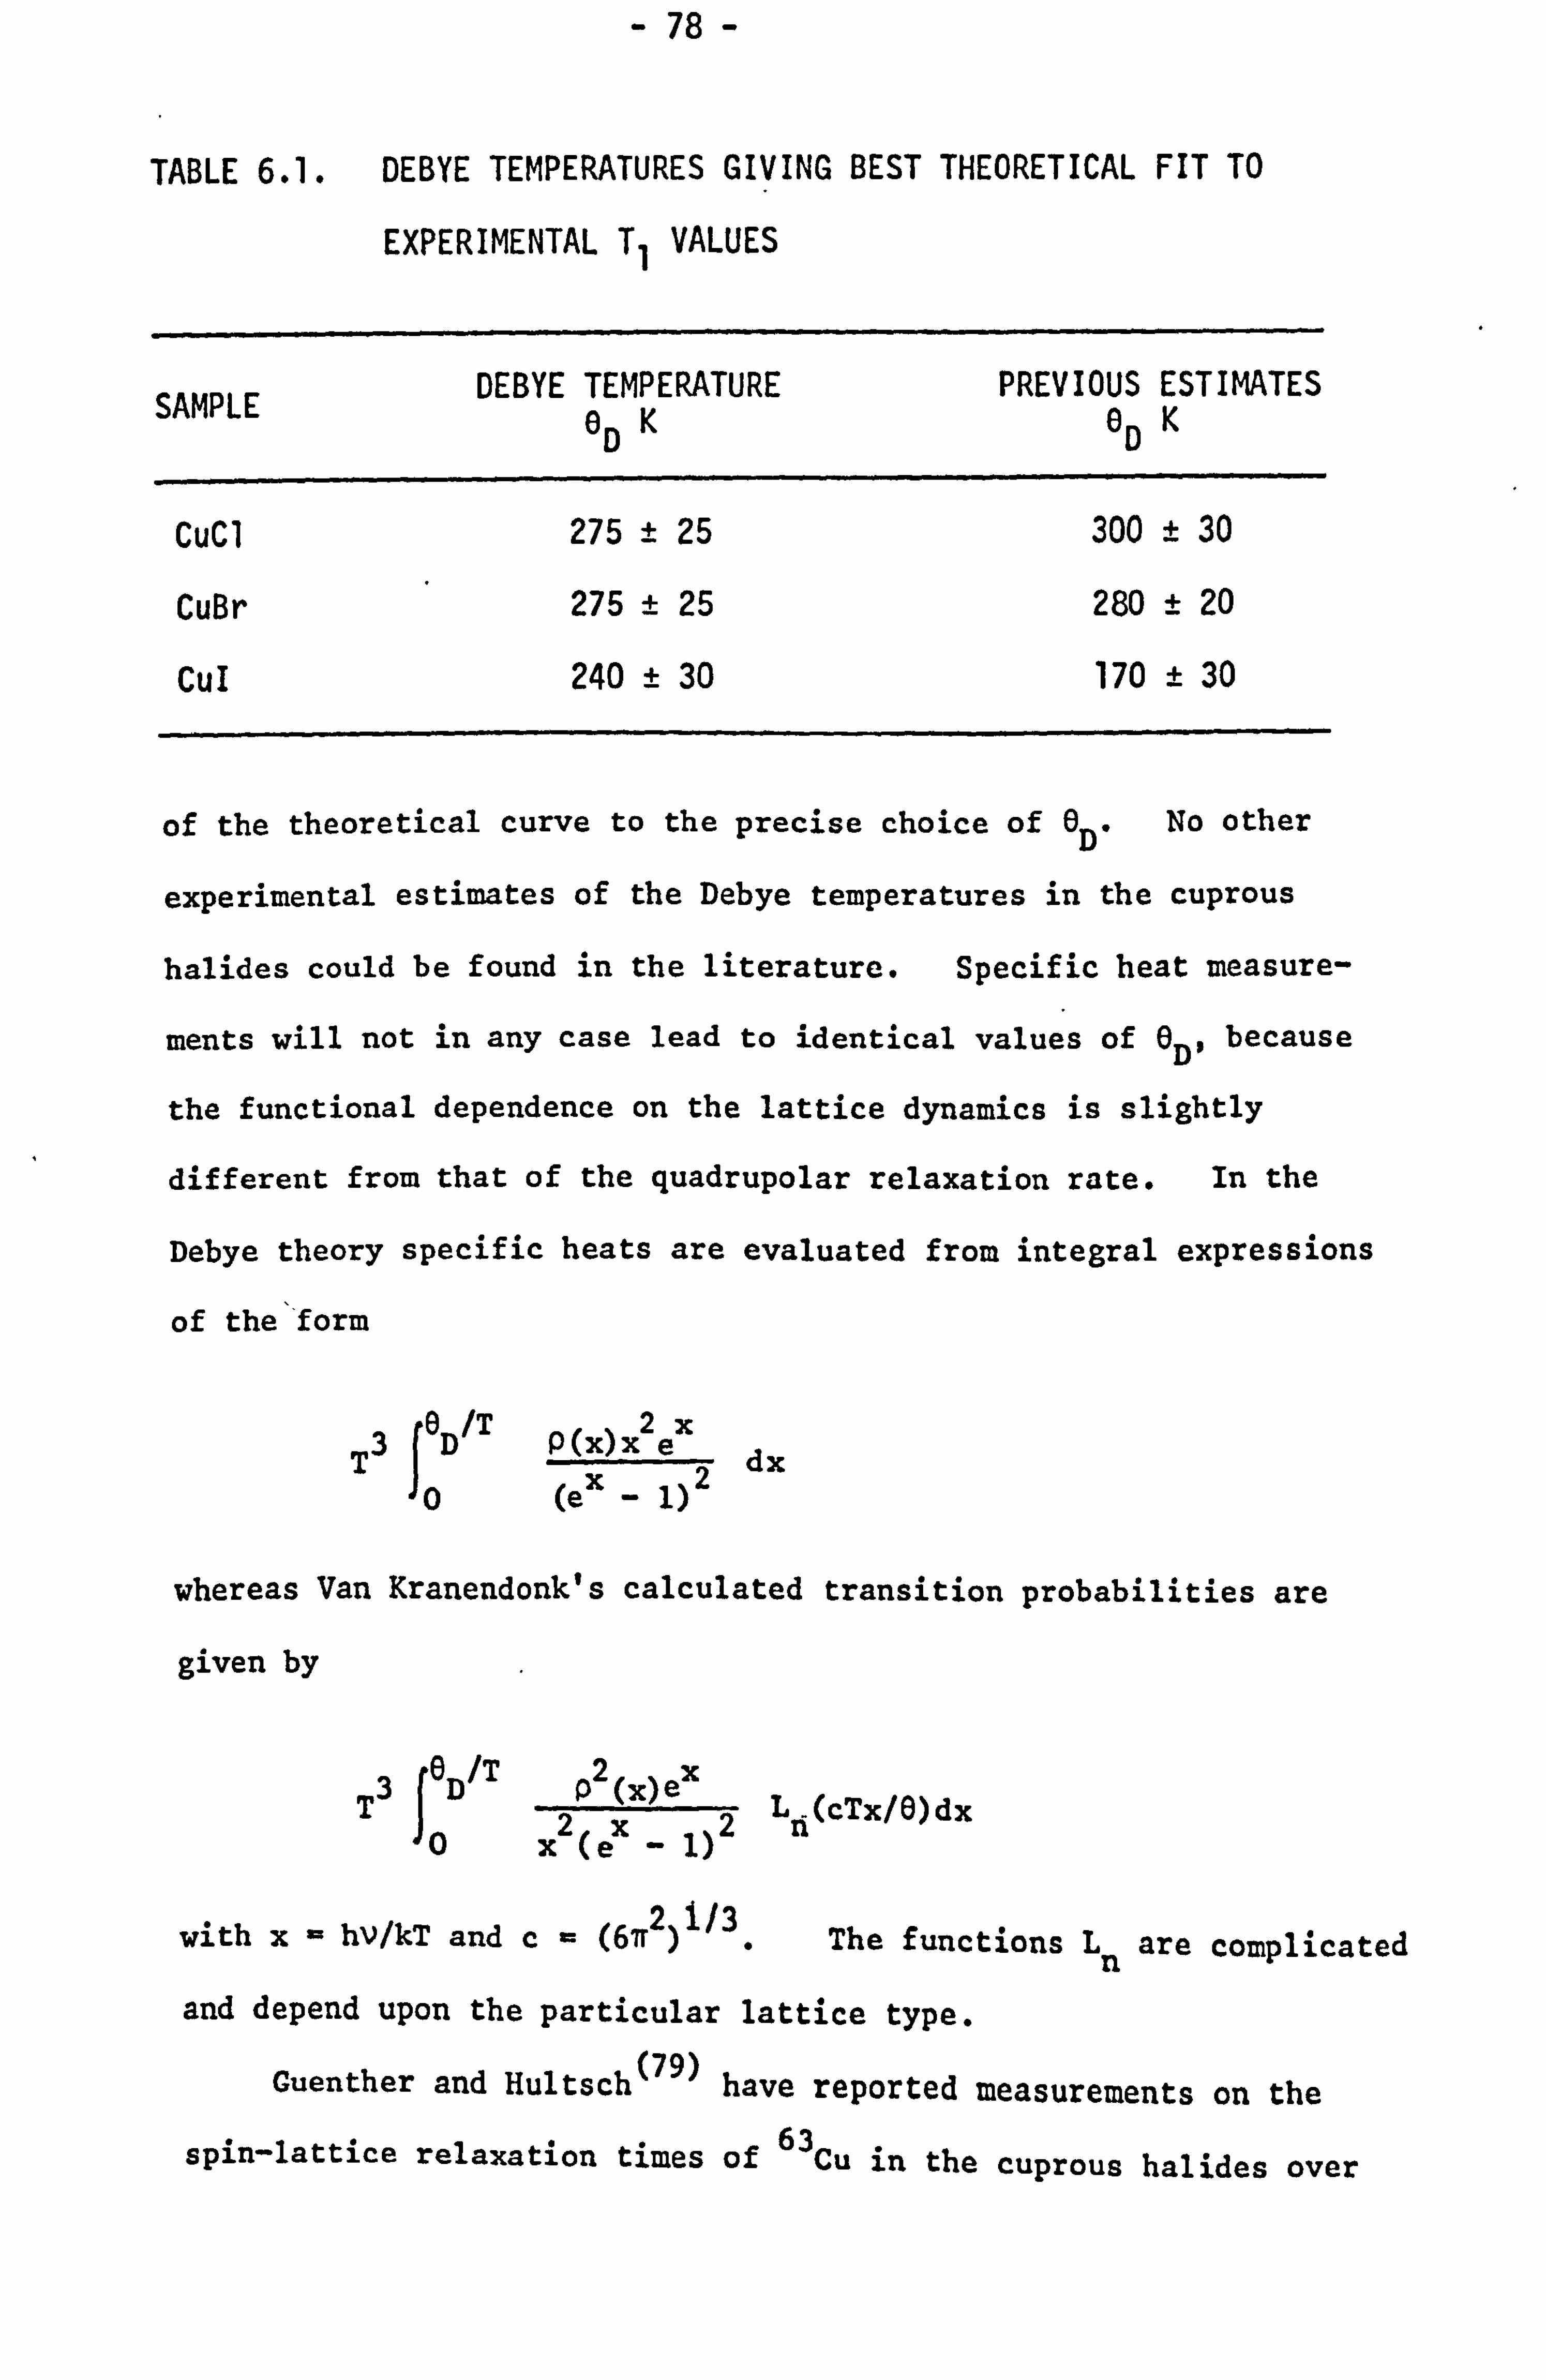
- 78 -
TABLE 6.1. DEBYE TEMPERATURES GIVING BEST THEORETICAL FIT TO
EXPERIMENTAL T, VALUES
SAMPLE DEBYE TEMPERATURE PREVIOUS ESTIMATES 0D K 0D K
CuC1 275 ± 25 300 ± 30
CuBr 275 ± 25 280 ± 20
CuI 240 ± 30 170 ± 30
of the theoretical curve to the precise choice of 8D. No other
experimental estimates of the Debye temperatures in the cuprous
halides could be found in the literature. Specific heat measure-
ments will not in any case lead to identical values of 8D, because
the functional dependence on the lattice dynamics is slightly
different from that of the quadrupolar relaxation rate. In the
Debye theory specific heats are evaluated from integral expressions
of the'form
T3 J6D/T p(x)x2ex dx
x2 0 (e - 1)
whereas Van Kranendonk's calculated transition probabilities are
given by
T3 JOD'T p2(x)ex
2x-2 0x (e 1) Ln(cTx/6)dx
with x- by/kT and c- (6712)1/3. The functions Ln are complicated
and depend upon the particular lattice type.
Guenther and Hultsch(79) have reported measurements on the
spin-lattice relaxation times of 63Cu in the cuprous halides over
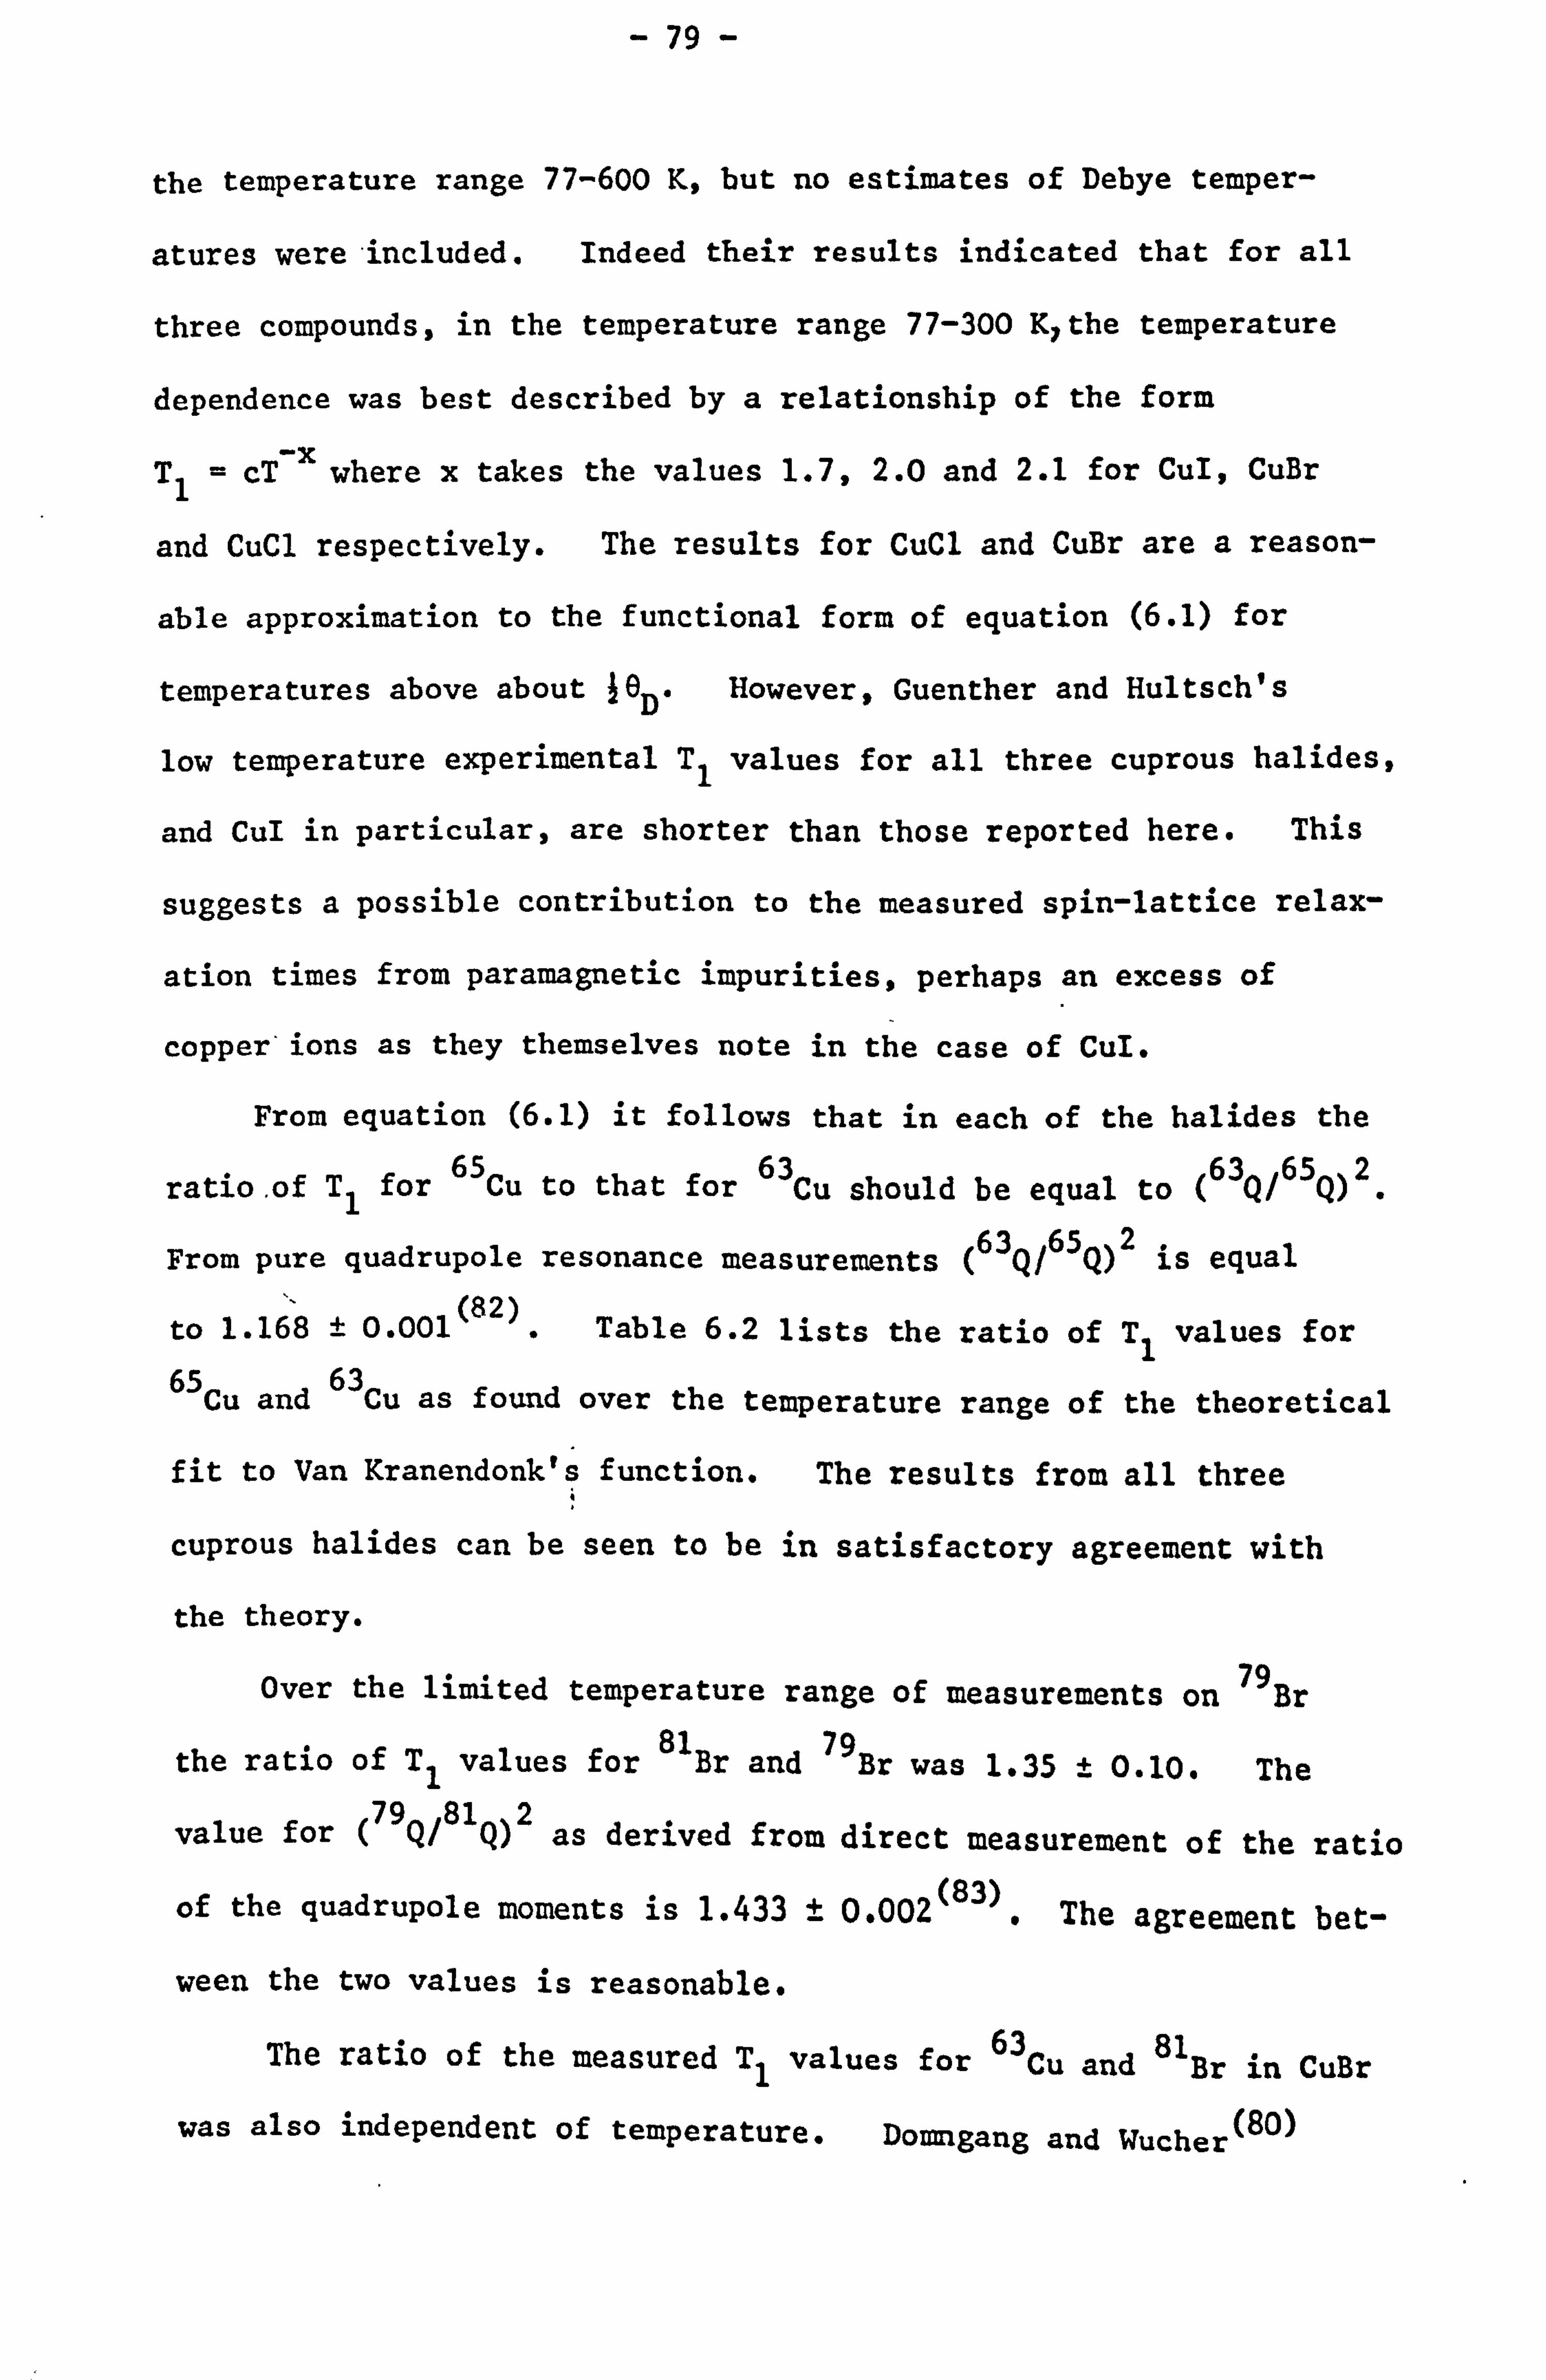
- 79 -
the temperature range 77-600 K, but no estimates of Debye temper-
atures were included. Indeed their results indicated that for all
three compounds, in the temperature range 77-300 K, the temperature
dependence was best described by a relationship of the form
T1 = cT x where x takes the values 1.7,2.0 and 2.1 for CuI, CuBr
and CuCl respectively. The results for CuCl and CuBr are a reason-
able approximation to the functional form of equation (6.1) for
temperatures above about 10D" However, Guenther and Hultsch's
low temperature experimental Tl values for all three cuprous halides,
and CuI in particular, are shorter than those reported here. This
suggests a possible contribution to the measured spin-lattice relax-
ation times from paramagnetic impurities, perhaps an excess of
copper ions as they themselves note in the case of CuI.
From equation (6.1) it follows that in each of the halides the
ratio. of T1 for 65Cu to that for 63Cu
should be equal to (63Q/65Q)2.
From pure quadrupole resonance measurements (63Q/65Q)2 is equal
to 1.168 ± 0.001(82). Table 6.2 lists the ratio of T1 values for 65Cu
and 63Cu
as found over the temperature range of the theoretical
fit to Van Kranendonk's function. The results from all three
cuprous halides can be seen to be in satisfactory agreement with
the theory.
Over the limited temperature range of measurements on 79Br
the ratio of T1 values for 81Br and
79Br was 1.35 t 0.10. The
value for (79Q/81Q)2 as derived from direct measurement of th rntin
of the quadrupole moments is 1.433 ± 0.002(83). The agreement bet-
ween the two values is reasonable.
The ratio of the measured T1 values for 63Cu and
81Br in CuBr
was also independent of temperature. Domngang and Wucher (80)
- 80 -
TABLE 6.2. RATIO OF TI VALUES FOR 65Cu AND 63Cu OVER TEMPERATURE
RANGE OF THEORETICAL FIT TO VAN KRANENDONK'S FUNCTION
RATIO SAMPLE
T1Cu65/T1Cu63
CuC1 1.18 ± 0.10
CuBr 1.19 ± 0.05
CuI 1.18 ± 0.05
reported that in their pure single crystal sample the ratio of T1
values'for the copper and bromine isotopes varied. However, this
variation only really became apparent at liquid nitrogen temper-
atures and below. The form of this behaviour was attributed to
the different relative contributions to the overall spin-lattice
relaxation times of optical phonons, which are not taken specific
account of in the Debye model of the lattice phonon spectrum. The
quadrupole moment ratios of the copper and bromine isotopes have
been determined separately to a considerable degree of accuracy but
there is some uncertainty in the absolute values of Q. Using the
quoted values for 63Cu and
81Br respectively of -0.16 ± 0.03(84)
and 0.28 ± 0.02(83) in units of 10 -28 m2 the ratio (Q/81Q2 is
equal to 3.1 ± 1.6. The experimental value found over the measured
temperature range was 4.0 ± 0.3, in reasonable agreement with the
figure of 4.3 determined by Domngang and Wucher at the higher temper-
atures of their range of measurements. The theoretical and experi-
mental ratios agree to within the large error limits imposed by the
- 81 -
uncertainty in the values of Q. However, unlike the comparison
of relaxation times for the two copper or two bromine isotopes it
cannot be assumed that anti-shielding, covalency and other effects
are identical at the different ionic sites. Thus the factors y
will in principle differ for the two nuclei. The theory is satis-
fied if the ratio 81y/63y has the value 1.14 ± 0.30.
In the simple ionic model of the crystal lattice the magnitude
of the effective quadrupolar coupling for any nucleus is determined
by the Sternheimer anti-shielding factor y. (3). Theoretical values
of y, depend to some extent upon the calculation procedure adopted
but for the copper and bromine ions may be taken as -15 and -123
(85 respectively . It follows that the ratio of the corresponding
y values - given by (1 - y. ) - is in disagreement with the prev-
iously determined figure of 1.14. Experimental estimates of the
anti-shielding factors for the halide ions differ quite consider-
ably from the theoretical values. However, even when an average
experimental value of -35 is taken for Br-(86) there is still a
considerable discrepancy in the ratio $1Y/63Y
predicted by anti-
shielding effects alone and that found from measurements of Tl.
In view of the fact that the cuprous halides are covalent the dis-
agreement is perhaps hardly surprising.
A detailed comparison of Tl values between the different
cuprous halides is precluded by the absence of any reliable
values for y as well as by the lack of any reported data on the
velocity of sound in these compounds. Nevertheless by making some
simplifying assumptions an approximate calculation can be made.
The values of T1 for 63Cu in the three halides at a temperature of
200 K are listed in Table 6.3. This temperature is chosen because,
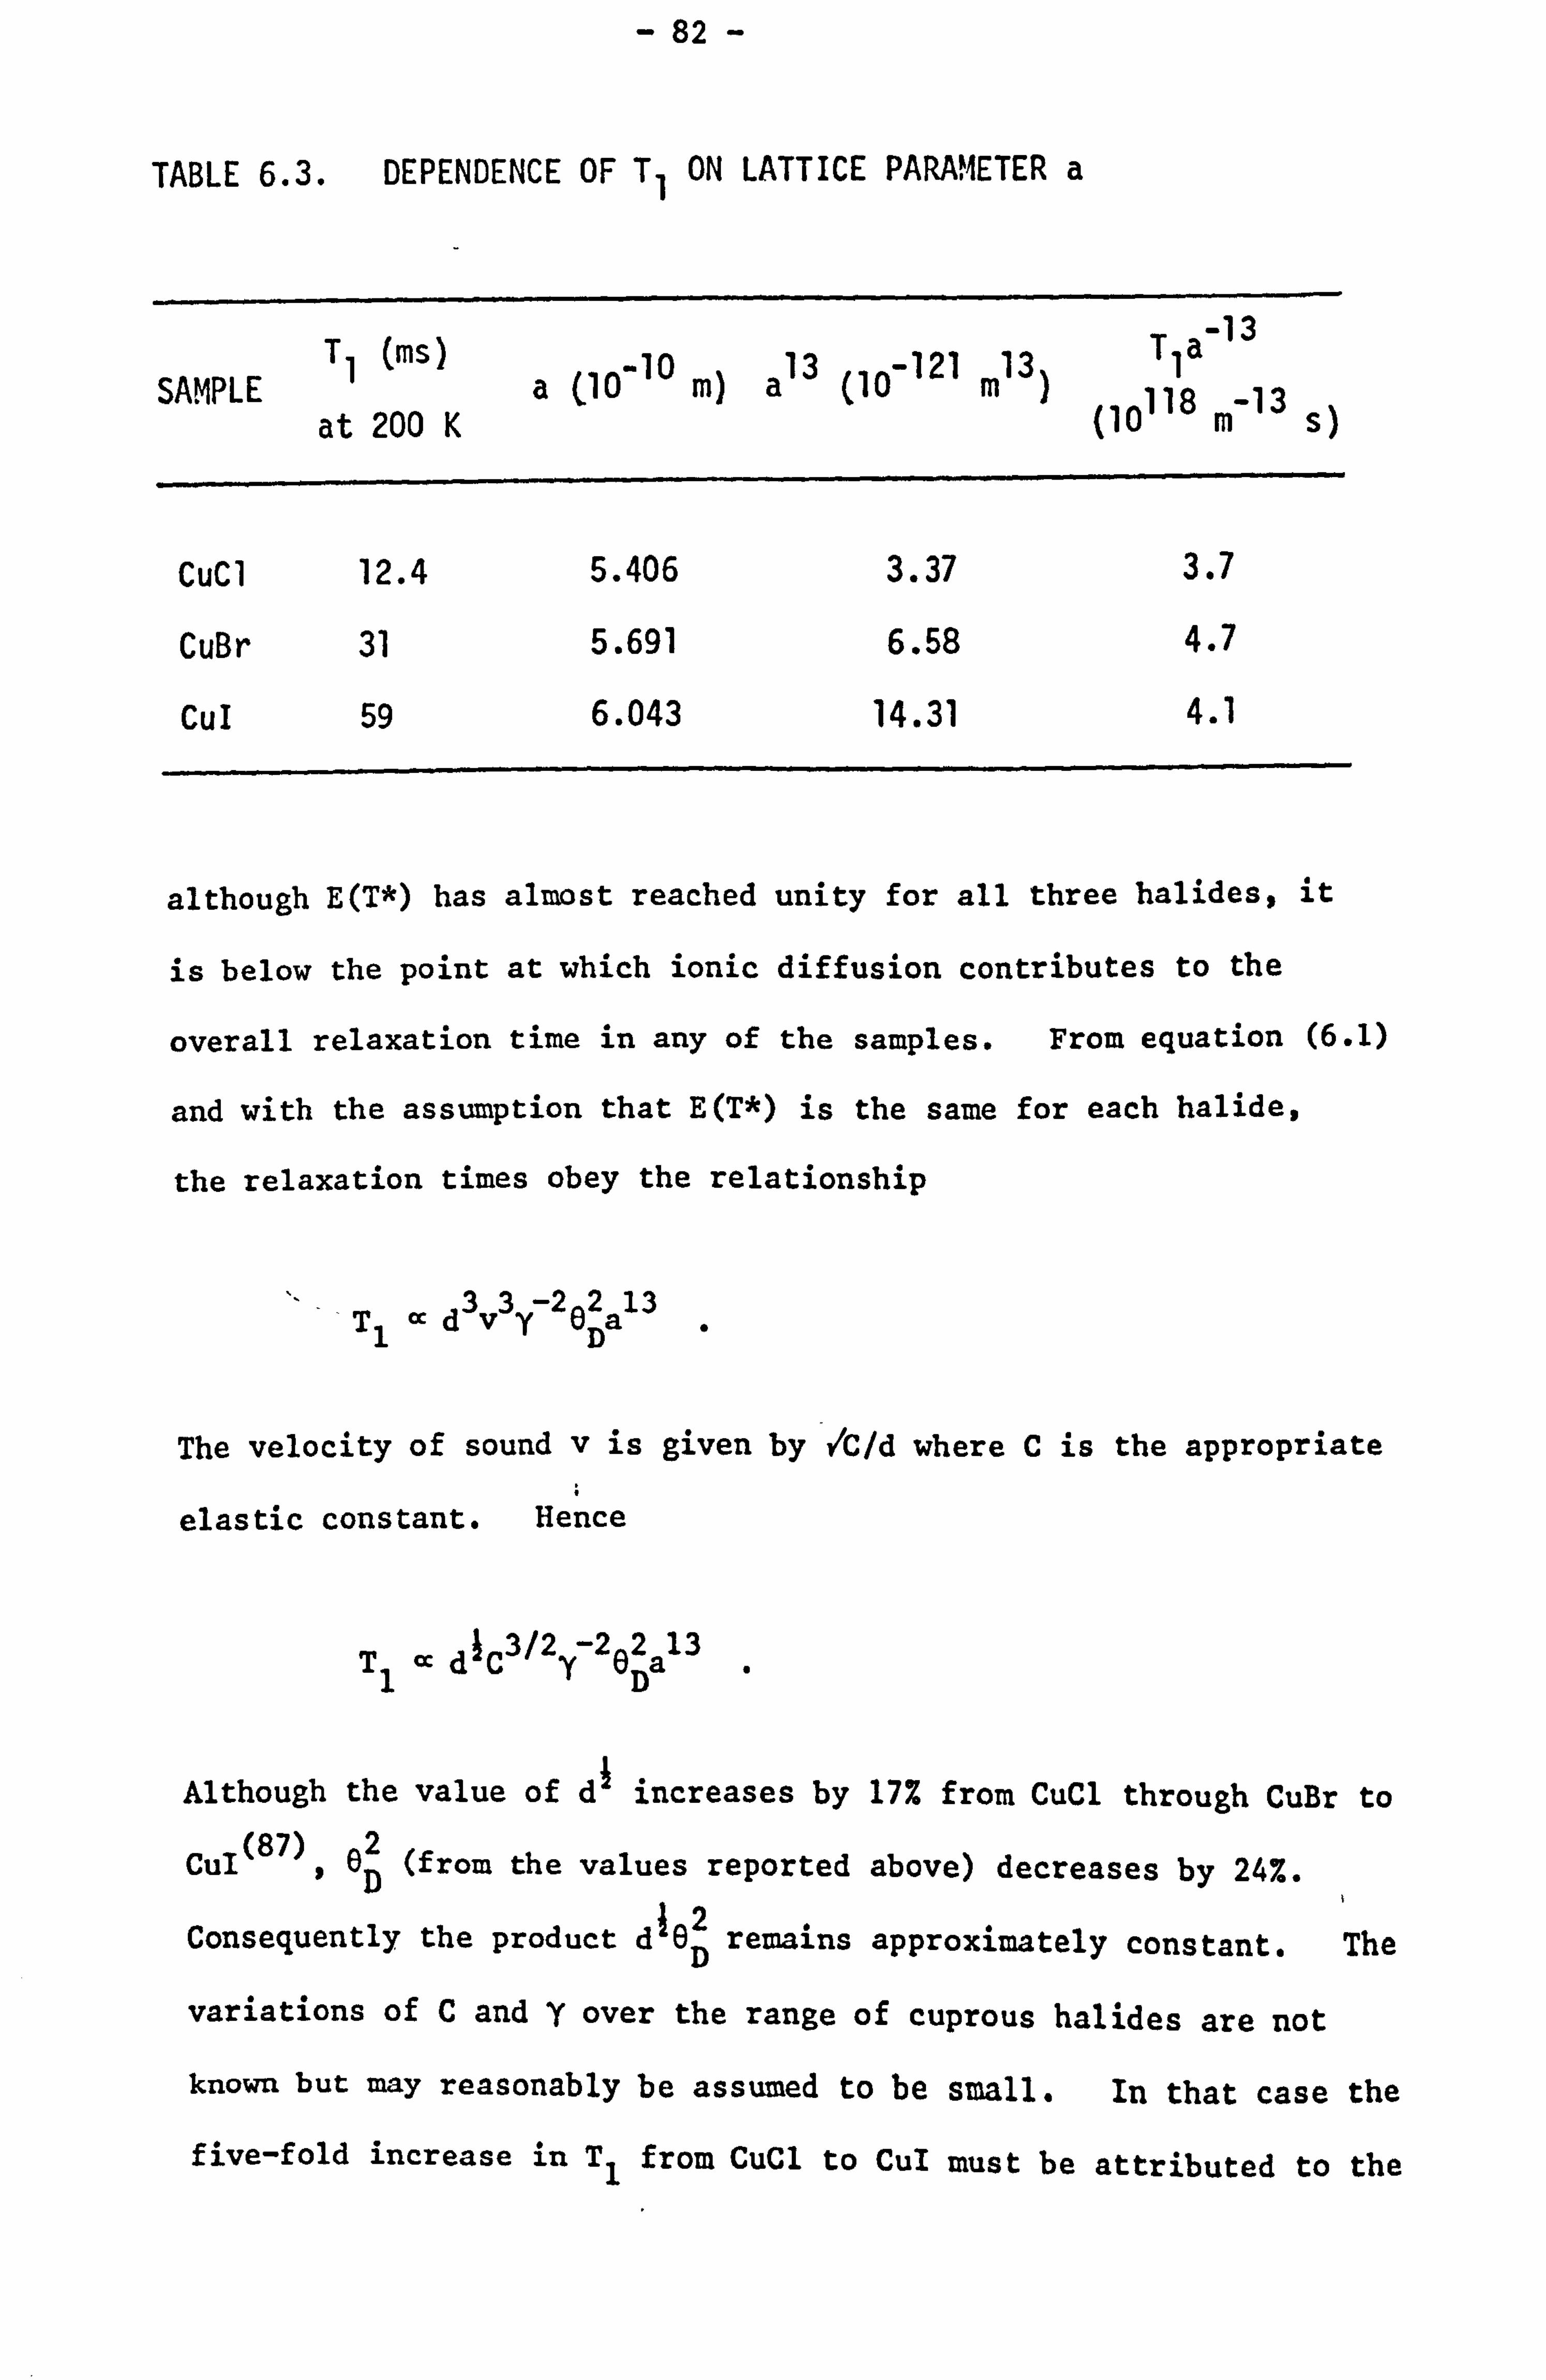
- 82 -
TABLE 6.3. DEPENDENCE OF T1 ON LATTICE PARAMETER a
-13 SAMPLE
T1 (ms) a (10-10 m) a13 (10-121 m13)
T1a
at 200 K (10118 m-13 s)
CuC1 12.4 5.406 3.37 3.7
CuBr 31 5.691 6.58 4.7
CuI 59 6.043 14.31 4.1
although E(T*) has almost reached unity for all three halides, it
is below the point at which ionic diffusion contributes to the
overall relaxation time in any of the samples. From equation (6.1)
and with the assumption that E(T*) is the same for each halide,
the relaxation times obey the relationship
a d3v3y 202a13
1D
The velocity of sound v is given by �C/d where C is the appropriate
elastic constant. Hence
Ta dlC3/2 -2e 2a 13 1yD
Although the value of d' increases by 17% from CuCl through CuBr to
CuI(87), 6p (from the values reported above) decreases by 24%.
Consequently the product d1AD remains approximately constant. The
variations of C and y over the range of cuprous halides are not
known but may reasonably be assumed to be small. In that case the
five-fold increase in T1 from CuCl to Cul must be attributed to the
- 83 -
change in the factor a13. Using the values of lattice parameter
a quoted by Wyckoff (88)
(but ignoring effects due to the thermal
expansion of the lattice) the product T1a^13 as listed in Table
6.3 can be seen to be constant to within ±12%. Therefore the
range of T1 values between the cuprous halides appears simply to
reflect the strong dependence of the quadrupole interactions on
the interatomic distance.
The above finding is somewhat in contradiction to that recorded
by Guenther and Hultsch(78). They interpreted a decrease in the
ratio of their calculated to measured T1 values over the cuprous
halides as being consistent with the reported variation in the
degree of covalent bonding in these compounds: CuC1 being the most
covalent and CuI the least. An increased amount of covalency
in the lattice bond is usually associated with a paramagnetic shift (26)
in the resonance frequency. However chemical shift measure-
ments(»'78) do not show such a correlation in the cuprous halides.
Evaluation of the absolute agreement between theory and experi-
ment depends upon the accuracy to which the individual components
of equation (6.1) are known. In calculating the spin-lattice relax-
ation time of 63Cu in CuCl at 200 K the following values were used:
3 -3 (87) (88) Ia 3/2, d=4.14 x 10 kg ma5.406 x 10-10 m
Q- -0.16 x 10⁻²⁸ m2 (84),
E(T*) - 1. In the absence of any better
estimate the velocity of sound v was taken as 3.5 x 10³ m s-1 as
reported for AgCl(89). .
The resulting value for T1 is then
9.46 x 10³ Y2s. compared to the measured value of 12.4 m s. It
follows that a value of Y ti 103 is required to secure agreement
between experiment and theory. Similar values for y have been deter-
mined from T1 measurements on some alkali halides(22'90). This
- 84 -
provides further evidence that refinements to Van Kranendonk's
and Mieher's theories, other than those arising from simple anti-
shielding considerations alone, are needed to achieve quantitative
agreement with experiment.
One line of approach to the solution of this discrepancy is
(21' the more recent development by Van Kranendonk and Walker.
Their detailed consideration of a second order anharmonic Raman
relaxation process has thrown doubt onto the absolute importance
of the direct Raman relaxation mechanism. The second order process
takes place via a combination of the direct single phonon spin-
lattice coupling and the cubic anharmonic lattice forces: in
effect the Raman change in phonon energy corresponding to a transit-
ion between nuclear spin states is preceeded by an intermediate
single phonon state. ' The theory as developed for the point charge
model of NaC1 type crystal lattices leads to the expression
2 ci + 4c2 WaR 27YG
d2 + 4d2 W1R
where WaR_and W1R are the anharmonic and first order Raman relax-
ation rates respectively; c1, c2, dl and d2 are spin-lattice coupl-
ing constants and YG is the Grüneisen constant. For the alkali
halides, the anharmonic relaxation mechanism given by equation (6.2)
predicts relaxation times a factor of 100 shorter than the first
order Raman process, which brings theory and experiment into much
closer accord. Although the appropriate values of c12 and d12 for
the more covalent zinc blende lattice are unknown, a relaxation
mechanism of similar magnitude would obviously secure a similar
(6.2)
agreement in the cuprous halides. The temperature dependence of
- 85 -
the anharmonic Raman process is identical to the first order proc-
ess. Consequently the lack of knowledge of the overall values of
y prevents any definite conclusion as to the validity of the
indirect second order process in the cuprous halides.
- 86 -
CHAPTER 7
EXPERIMENTAL RESULTS ON ALUMINIUM METAL
7.1 INTRODUCTION TO THE MEASUREMENTS UNDERTAKEN
The results reported in this chapter deal with a series of
measurements on aluminium of various NMR parameters. Although
many of the parameters are well documented in the literature
there has been some discrepancy in the past between experiment and
theory, particularly over the values of second moment and T1D.
The macroscopic rotation technique has proved useful previously in
the determination of accurate values of chemical shifts (47,77)
and
Knight shifts (67)
and has been applied here with similar success.
Because of the limitations imposed by the small skin depths,
powdered samples are normally used for NMR observations. An import-
ant aspect of the work reported below was the preparation of the
specimens of aluminium. powder, as described in detail in Section 5.9.
In this chapter the three different annealed powder samples prep-
ared in the laboratory will be referred to as follows:
(a) -powder prepared from the 99.995% pure wire by the metal
spraying technique;
(b)- powder prepared-from the nominally 99.5% pure wire by
metal spraying;
(c) -powder filed from a 99.999% pure ingot.
- 87 -
A fourth type of aluminium powder (d) was used unannealed in the
Knight shift measurements. This was obtained commercially from
Koch-Light Laboratories and had a quoted purity of 99% with a
particle size of 8-15 um.
7.2 THE ACCURATE DETERMINATION OF THE ALUMINIUM KNIGHT SHIFT
7.2.1 INTRODUCTION
a
Knight shift values provide a direct comparison of the
magnitudes of the internal magnetic fields present at the sites of
a particular nuclear species in the metallic state and in a chosen
reference material. Most information about the metallic state
would be obtained by using an isolated atom as the reference, but
this is obviously not practical. Consequently measured Knight
shifts depend to some extent on the chemical shift interaction
present in the reference sample. For many metals the experimental
isotropic Knight shift is largely attributable to the direct
contact term given by equation (2.10). However, very often further
terms - as discussed briefly in Section 2.2.3(b) - also have to
be considered in order to obtain absolute agreement between theory
and experiment.
Previous experimental estimates of the Knight shift of alumin-
ium at room temperature (76,91-95)
have all been in the range 1.50
to 1.68 x 10⁻³ , the generally accepted value being 1.61 x 10⁻³.
In most cases the reference sample was an aqueous solution of Aid 3. Ultimately any Knight shift determination is dependent upon the
accuracy of the measurements of frequency or magnetic field and
the precision with which the centre of the nuclear resonance spectra
of the metal and reference can be defined. The width of the
- 88 -
Lorentzian NMR lineshape of Aid 3 solution depends in the first
instance upon the homogeneity of the external magnetic field.
On the other hand the 27A1
resonance line is approximately Gauss-
ian with a width of about 9 kHz. Even if the line centre is
located to an accuracy of 2% of the width the greatest accuracy
to which the Knight shift can be determined in a magnetic field
of around 1 tesla is ±0.02 x 10 3.
Aluminium has a cubic structure at room temperature with only
one naturally occurring isotope. The broadening of the resonance
line from a pure annealed powdered specimen of this metal arises
from the magnetic dipolar interaction between nuclei. The rapid
rotation technique can be used therefore to narrow the resonance
lineshäpe. This enables the line centre and hence the Knight
shift to be determined to a correspondingly greater accuracy.
7.2.2 MEASUREMENTS
Experimental measurements were undertaken following the
procedure described in Section 5.5. Using compressed air, rotors
containing the aluminium powder samples were spun about the magic
angle at spinning frequencies of about'4 kHz. At these speeds the
width of the resonance lineshape is reduced by a factor of approxi-
mately 15. (Typical FIDs and Fourier transformed lineshapes
obtained from static and rotating pure powder specimens are included
in Figures 7.1 and 7.2 respectively. ) The reference material
used was a saturated aqueous solution of 99.999% pure A1C13 as
supplied by Johnson Matthey Chemicals. The solution was enclosed
inside a nylon container, the internal dimensions of which were
- 89 -
identical to those of the rotor sample chamber. All measurements
were recorded at room temperature (295 K) in a magnetic field of
1.35 T. With the PSD in quadrature phase at high gain, resonance
frequencies could be determined precisely from the detected signal
by fine adjustment of the dial settings on the frequency synthesiser.
In obtaining each Knight shift value a series of comparisons
of the resonance frequencies of the metal and reference material
were made. After a small correction of up to 10 Hz to account
for a very slight difference in the magnetic fields at the rotor
and the reference sample (see Section 5.5) the Knight shifts were
calculated from the equation (m - vr)/vr' Several separate deter-
minations were made, changing the samples used and also varying
slightly the rotation rate and the magnetic field. From eight
different series of measurements the mean value of the aluminium
Knight shift was 1640.0 ppm and the extreme values were 1638.9 and
1640.7 ppm. The estimated possible error in the measured resonance
frequency of each sample was ±5 Hz. Similar errors in determin-
ing the magnitude of the applied correction lead to an overall esti-
mate of the total possible error in each determination of (v - Vr)
of ±20 Hz. Hence with yr equal to 15 MHz the maximum possible
error in any single Knight shift estimate was approximately ±1.3 ppm.
Three specimens of aluminium powder were used in the measure-
ments: (a), (b) and (d). Powders prepared from the two grades of
aluminium wire ((a) and (b)) were sieved so that the maximum part-
icle size was limited to 44 pm. Originally the powder specimens
were encapsulated in epoxy resin in the manner described in Section
5.9. This was later found to be unnecessary so the powders were
packed directly into the rotor sample chambers which were then sealed
- 90 -
at the top with epoxy glue. There was no measurable difference
in the Knight shift values obtained from any of the three powder
samples whether they were encapsulated in the resin or not.
Various aqueous solutions of A1C13 were also compared, but
the value of the reference frequency v) was found to be unaffected
by concentration or by use of 99% reagent grade A1C13 instead of
the pure salt. In fact no change in resonant frequency was observed
even when aqueous solutions of reagent grade AlBr3 were substituted.
The value of the aluminium Knight shift quoted above is therefore
largely insensitive to the concentration of impurities in the metal
sample or the choice of reference solution.
We now consider other factors which might affect the Knight
shift value obtained.
7.2.3 POSSIBLE FACTORS INFLUENCING THE EXPERIMENTAL KNIGHT
SHIFT VALUE
(a) Temperature. Although at first sight all measurements were
undertaken at laboratory temperature, the temperature of the rotors
could not be monitored precisely. Due to cooling upon expansion
the temperature of the driving gas immediately after passing through
the jets in the stator was several degrees below room temperature.
However, as would be expected, any variation from room temperature
of the temperature of the samples was found to be small - less than
3 K. The temperature dependence of the aluminium Knight shift is
relatively small. The most recent reported measurements by Kushida
and Murphy (96)
and El-Hanany and Zamir(95) indicate that an error
of about 15 K would be required to produce an uncertainty of 1 ppm.
- 91 -
Consequently any resulting inaccuracy in the Knight shift value
quoted here is much smaller than the experimental error.
(b) Pressure. For those specimens of aluminium powder encapsul-
ated in resin the magnitude of the rotationally induced stresses
can be estimated using the expressions given in Section 4.2.3.
The maximum stresses in a rotating solid cylinder occur at the rot-
ation axis where at =r= 1/8(3 + u)pb2w2. The density'of the
aluminium powder slugs was found to be 1.6 g cm 3.
The precise
value of u is unknown but can be assumed to be less than but approx-
imately equal to 1. Consequently at a rotation speed of 4 kHz
the maximum pressures generated within the specimen are approxi-
mately 0.8 x 10⁷ N m; -2 . The same stress equations cannot automat-
ically be applied to those powder samples packed directly into the
rotors. However with the assumption that the metal powder can be
considered as an isotropic viscous fluid, it can be shown by element-
ary calculation that the radial stress generated in the specimen is
a roximatel 22 (59)
pp y Apr w The maximum stress acts therefore at
the periphery of the sample. At the rotation speed employed of 4 kHz
(and substituting the density of aluminium metal for p) this press-
ure is given by 1.4 x 10⁷ Nm2
Kushida and Murphy (96)
found that for a hydrostatic pressure
of 109 Nm2 the fractional increase in the aluminium Knight shift
was 1.31%. Hence, with the assumption that rotation and hydrostat-
ic pressures are comparable in their effects, the expected variat-
ion in the Knight shift at the highest rotationally generated stress
is 0.3 ppm. The mean pressure shift will lie within this value.
It follows that such effects have a negligible influence on the
experimental Knight shift value obtained.
- 92 -
(c) Bulk Susceptibility Effects. .
The magnetic field experienced
at any nuclear site is modified slightly from the applied external
field by the bulk susceptibility of the sample material. The
effective magnetic field H0 is given by (97)
Ho [l + (g - a) Xv1
where XV is the magnetic susceptibility per unit volume and a is
a numerical factor depending upon the shape of the sample. For
a spherical sample a= 41T/3 so Hä = Ho whereas for an infinitely
long rod a= 211. In the case considered here the sample is a
cylinder inclined at an angle of 540 44' to the applied magnetic
field and with a length slightly greater than the diameter. An
exact calculation of the effect of bulk susceptibility for the
aluminium powder samples is precluded by ignorance of the approp-
(7.1)
riate value of a for this configuration. However, an estimate
of the induced magnetic field can be made by approximating the
sample to a prolate ellipsoid aligned perpendicularly to the magnetic
field. If the ratio of the polar to equatorial axes is set as 3: 2,
(98) a is then equal to Or x 0.38 .
The quantity of metal in the centrifuged resin slugs was found
to be equivalent to that of the closely packed powders in the rotor
sample chambers. The amount of metal by volume was about 30% in
both cases. Taking the susceptibility per unit mass for aluminium
as 0.65 x 10⁻⁶ cgs units (but ignoring a small diamagnetic contrib-
ution of the resin matrix) the volume susceptibility of the metal
samples is given by 0.6 x lÖ-6 cgs units. When the above values
for a and Xv are substituted in equation (7.1) the resulting contrib-
ution to the magnetic field, and hence the resonance frequency, is
- 93 -
approximately 0.4 ppm. We remark in passing that a separate calc-
ulation(99) has predicted that the bulk susceptibility effect will
in fact be averaged out in a sample undergoing sufficiently rapid
macroscopic rotation at the magic angle. The bulk susceptibility
of the saturated Aid 3 reference solutions is unknown but can prob-
ably be safely neglected in comparison to-the metal. It follows
that the possible contribution of the sample bulk susceptibilities
to the experimental Knight shift is less than the experimental error.
(d) Other Effects. For small grain aluminium powders the Knight
shift has been reported to be dependent upon particle size(100)9
but this effect has only been detected at temperatures below 4K
and for particle sizes under 100 Field dependent oscillations
in the Knight shift due to the de Haas Van Alphen effect have been
measured at very low temperatures(101). The magnitude of these
oscillations is small and the average Knight shift value was found
to be unaffected. Both of these effects should be negligible at
room temperatures.
In conclusion it can be stated that neglecting the possibility
of unsuspected systematic errors, the experimental value of the
isotropic Knight shift was 1640 ppm with a maximum possible error
in measurement of ±1 ppm. If a possible contribution due to the
bulk susceptibility of the aluminium samples is included the error
limits should probably be extended to +1 and -2 ppm. From a detailed
theoretical calculation . Shyu, Das and Gaspari(102) obtained 'a value
for the aluminium Knight shift of 1624 ppm. Although their analysis
included a core polarization correction it did not take into account
any possible differences in the chemical shift interaction of the
- 94 -
aluminium nuclei in the metal and reference compound. A consider-
able improvement in the accuracy of Knight shift calculations will
be necessary to enable a precise comparison between theory and
experiment to be made. However the value reported here of
1.640 x 10 3 does show a small but significant departure from the
previously accepted estimate of 1.61 x 10 3.
7.3 RECORDED LINESHAPES AND SECOND MOMENT VALUES
7.3.1 INTRODUCTION
Although theory is unable to predict the exact form of
the absorption spectrum, a comparison between the theoretical and
experimental second moments can be made. 27A1 is the only natur-
ally occurring aluminium isotope. It occupies a FCC lattice, the
lattice constant being 4.0496 X. From this the dipolar second
moment predicted by Van Vleck's calculation (16) is 9.18 kU1z2
(7.44 G2). (It has also been quoted as 9.42 kHz2 (7.63 G2). )
Previous experimental determinations on pure annealed specimens
have consistently yielded values above this in the range 11.8 to
15.4 kHz2 (9.5-12.5 G2)(72,103-110). The discrepancy between theory
and experiment is well known. In the main it has been attribut-
ed to a nuclear quadrupole interaction, but the mechanism for such
an interaction has never been demonstrated conclusively.
7.3.2 MEASUREMENTS
The resonance spectra of the static aluminium powders
were obtained by Fourier transformation of the detected FIDs as
detailed in Section 5.6. In each case about 1 cm3 of the loose
- 95 -
annealed aluminium powder was placed in the standard Bruker probe
system. The measurements were recorded at temperatures in the
range 290-300 K using resonant frequencies of 15 and 16 MHz, but
the results obtained were insensitive to these variations.
Powders (a) and (b) were sieved so as to separate the specimen
particle sizes so: 37 um, 37-44 um, and 44-76 pin. A few drops of
pure acetone were added to the largest grain specimens in order to
reduce distortion of the detected signals by mechanical vibrations
set up in individual crystallites. The problem could not be cured
by the powders being encapsulated in resin because the widths of
the resonance spectra of the cured slugs were found to be increased
by this treatment. (That this broadening was due to a quadrupole
interaction rather than any stress induced distribution of Knight
shifts was made evident by its partial removal upon rapid rotation
of the specimens about the magic angle. ) Owing to the small skin
depth (ti 20 um) the signal intensities obtained from the coarsest
powders were less than those from the finer powders. However, with-
in the limits of experimental error, the transformed lineshapes
were found to be unaffected by particle size.
The observed characteristic decay shapes from powder samples,
(a) and (c), were quite distinguishable from each other. (Powder
(c) was filtered to a particle size of less than 44 pm. ) Typical
FIDs obtained from these two samples are shown in Figure 7.1 together
with the corresponding lineshapes in the frequency domain. The
FID and absorption spectrum of powder (b) were very similar in appear-
ance to those obtained for (c), and are therefore not illustrated
separately.
The tails of nuclear spectra in the frequency domain are deter-
mined largely by the supposition made about the behaviour of the FID
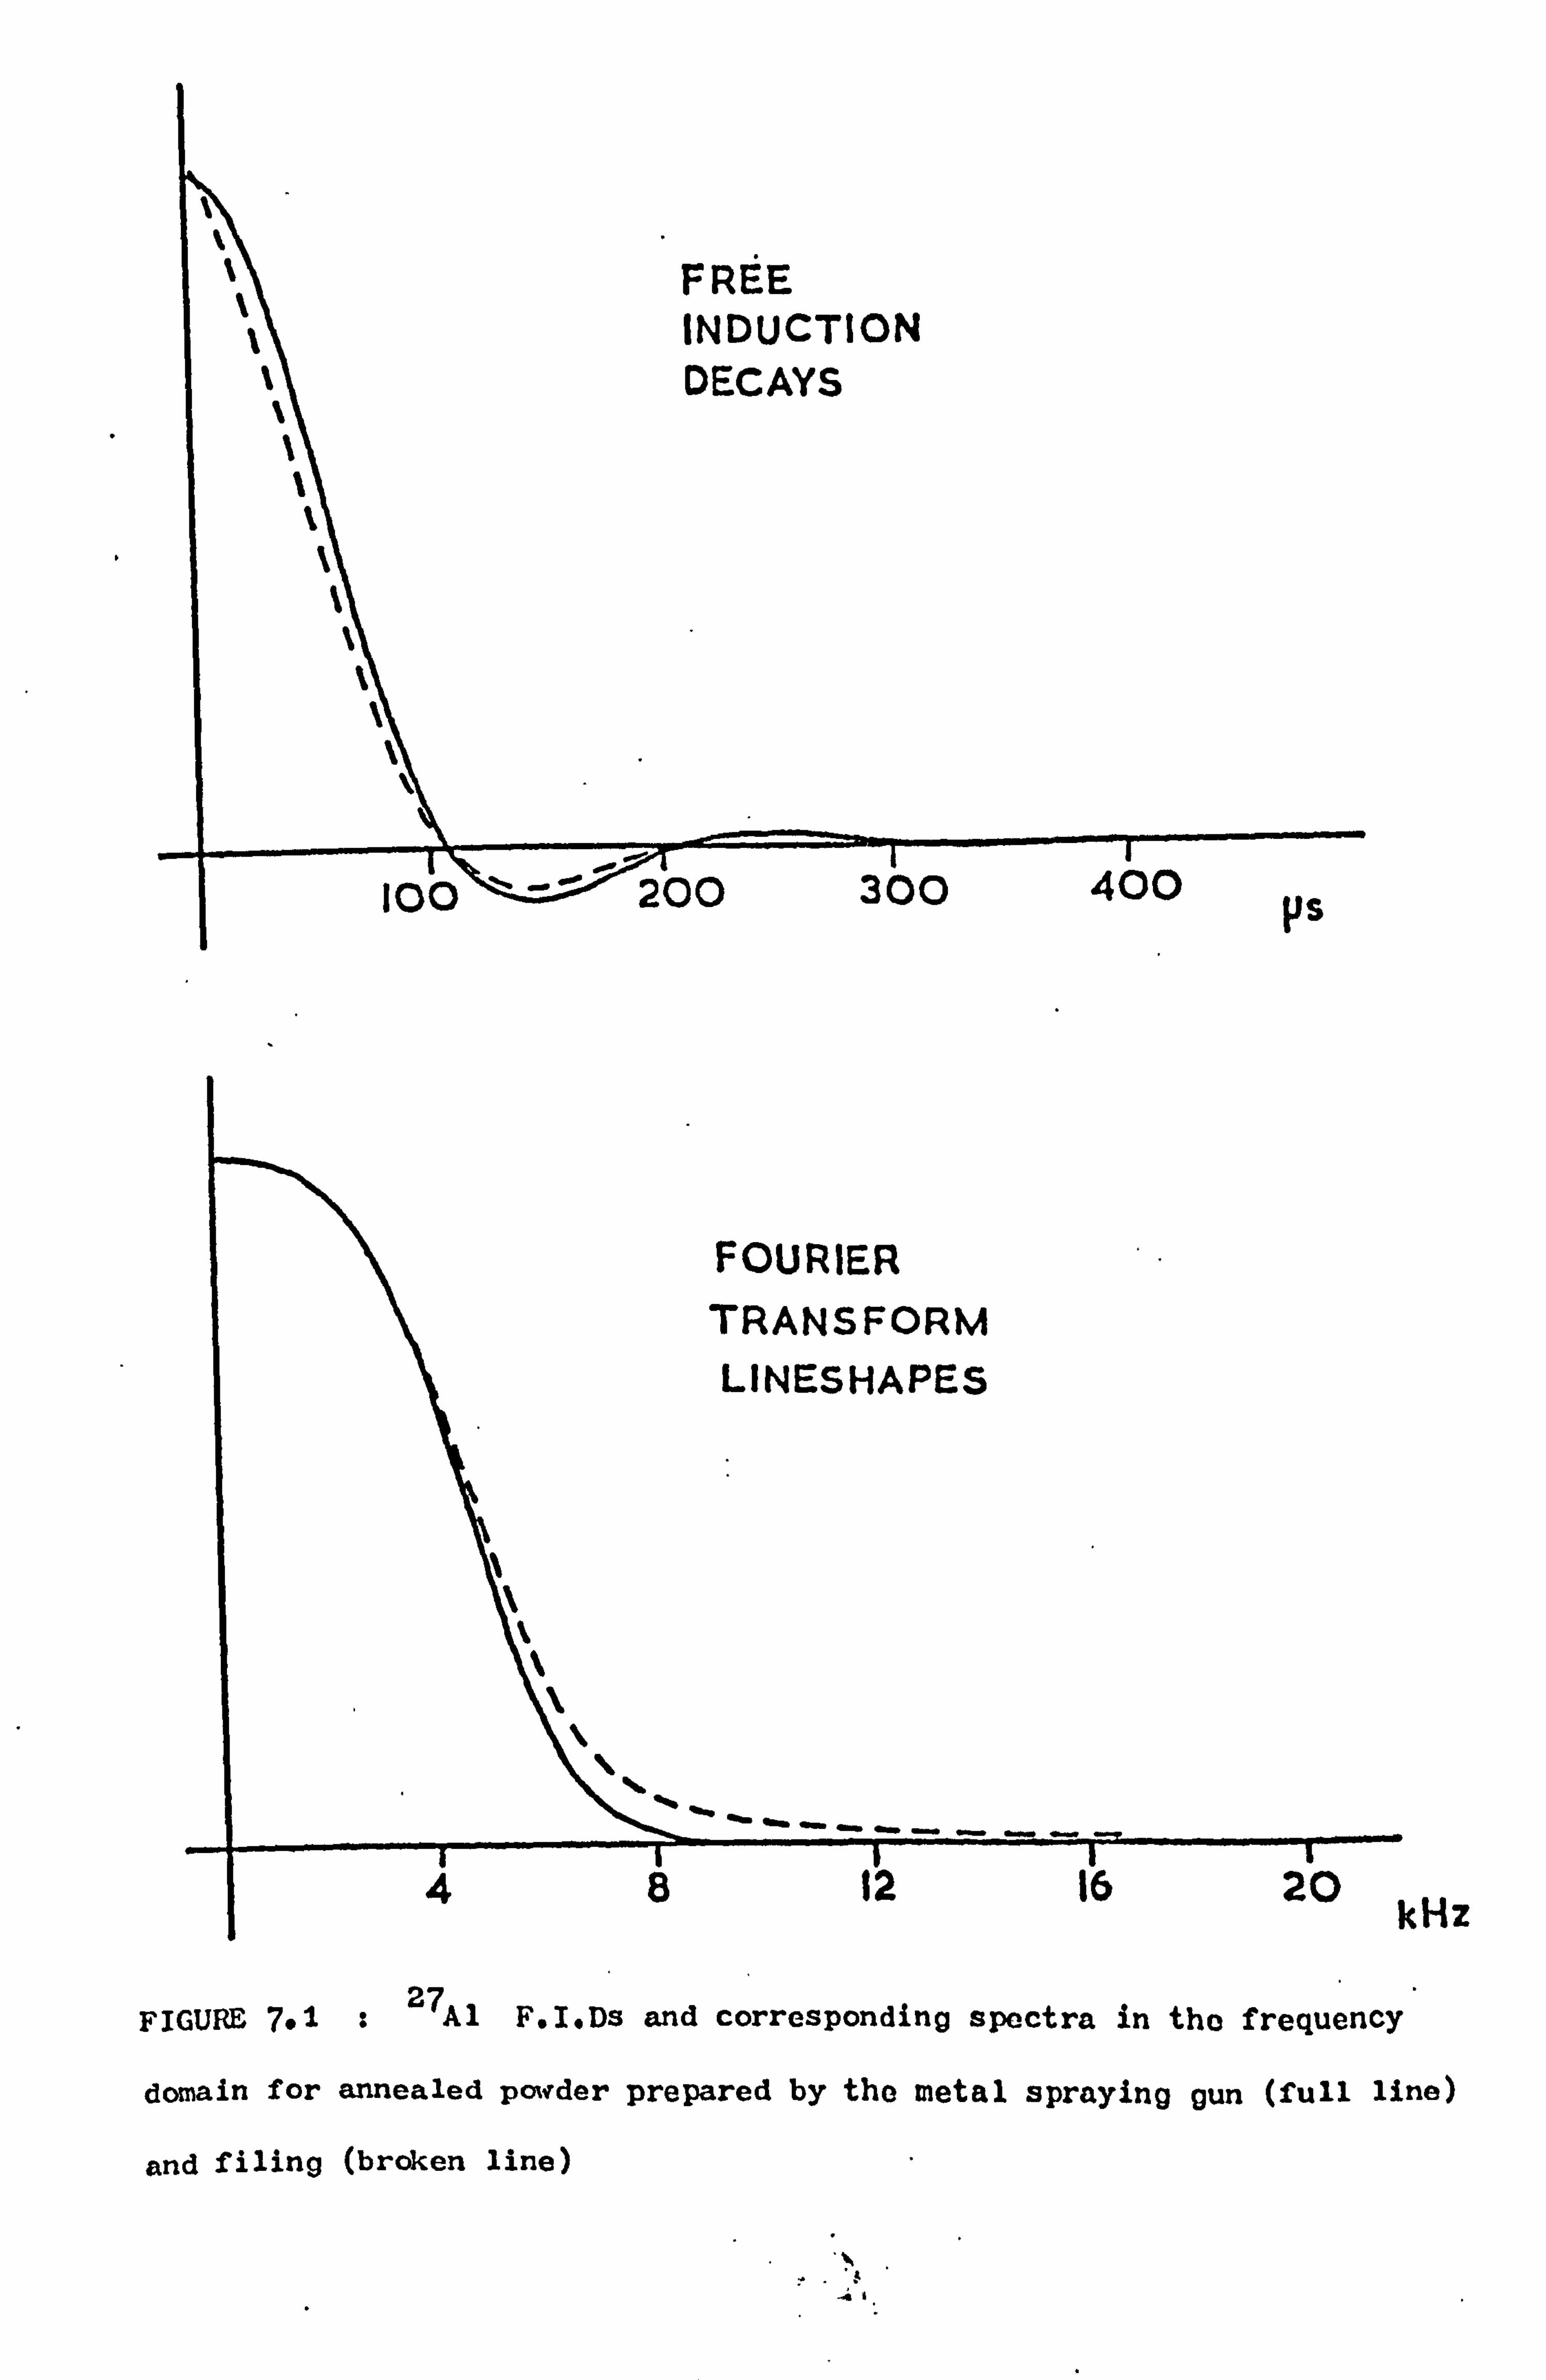
kHz
FIGURE 7.1 : 27A1
F. I. Ds and corresponding spectra in tho frequency
domain for annealed powder prepared by the metal spraying gun (full line)
and filing (broken line)
41
- 96 -
near the time origin. By using the solid echo (and Jeener and
Brockaert) pulse sequence it was shown that the decay curves for
sample (a) were Gaussian right back to the time origin. However
this was not found to be the case for the other samples. Both
the FIDs and the solid echo responses became more exponential
than Gaussian close to zero time. The anomalously high values of
second moment measured by other workers in samples similar to (c)
are regarded generally as indicating the presence of a nuclear
quadrupole interaction. If this is so, the validity of the data
points predicted by the solid echo sequence is brought into quest-
ion. The response following the 90-T-9090 sequence has been calc-
ulated for those cases where the internal spin interactions arise
either-from the dipolar coupling between spins (71)
or from the
first order quadrupole broadening in an imperfect cubic crystal
but not a combination of the two. Nevertheless for times less
than T2 the observed solid echoes were found to follow the shape
of the FIDs. ' Consequently the FID dead time points were estimated
so that the preliminary part of the decay envelope resembled the
outline of the solid echo maximum.
Experimental values of the second and fourth moments are recorded
in Table 7.1. The large variation in the second moment values of
the different specimens is indicative of the relative Lorentzian
character of the experimental lineshapes. The errors quoted refer
to the spread of measured values about the mean. The large error
values given for samples (b) and (c) arise out of the variation in
the tails of the transformed lineshapes caused by the uncertainty
in fitting the dead time points. These estimates do not however
include any consideration of the contribution to the second moment
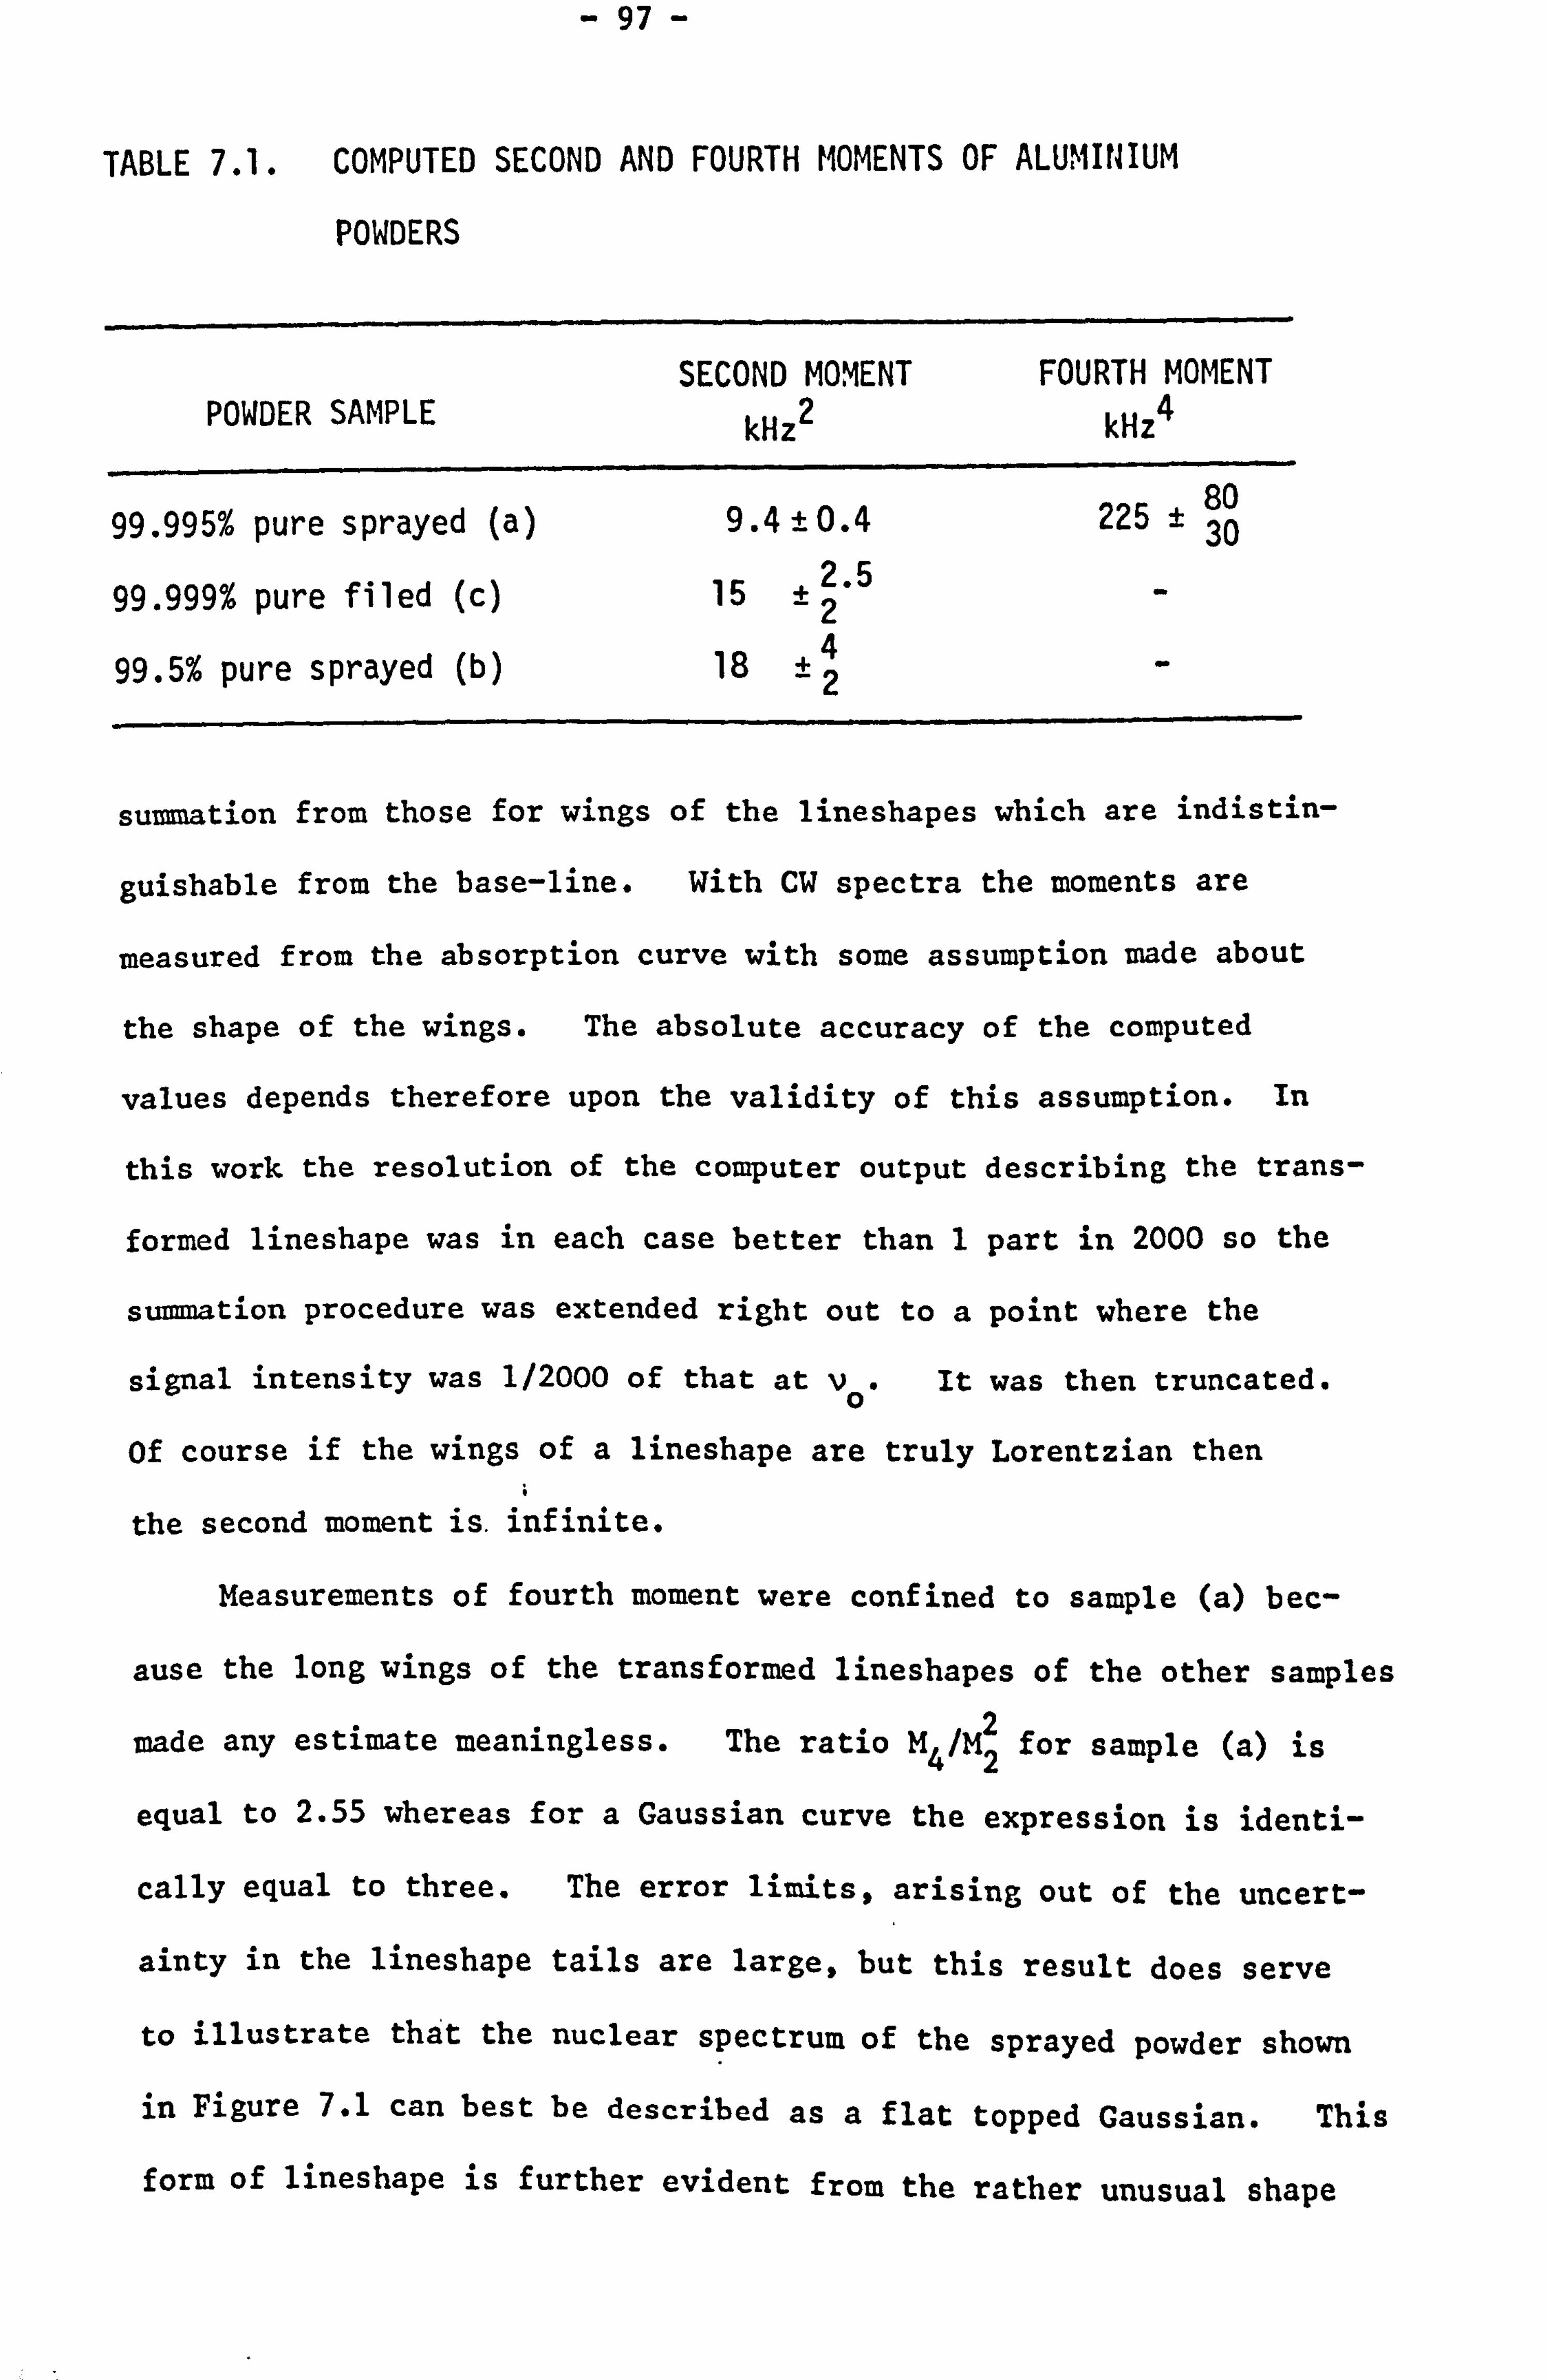
- 97 -
TABLE 7.1. COMPUTED SECOND AND FOURTH MOMENTS OF ALUMINIUM
POWDERS
SECOND MOMENT FOURTH MOMENT POWDER SAMPLE kHz2 kHz4
99.995% pure sprayed (a) 9.4 ± 0.4 225 t 80
99.999% pure filed (c) 15 ± 2.5
-
- 99.5% pure sprayed (b) 18 ±4
summation from those for wings of the lineshapes which are indistin-
guishable from the base-line. With CW spectra the moments are
measured from the absorption curve with some assumption made about
the shape of the wings. The absolute accuracy of the computed
values depends therefore upon the validity of this assumption. In
this work the resolution of the computer output describing the trans-
formed lineshape was in each case better than 1 part in 2000 so the
summation procedure was extended right out to a point where the
signal intensity was 1/2000 of that at vo. It was then truncated.
Of course if the wings of a lineshape are truly Lorentzian then
the second moment is. infinite.
Measurements of fourth moment were confined to sample (a) bec-
ause the long wings of the transformed lineshapes of the other samples
made any estimate meaningless. The ratio M4/M2 for sample (a) is
equal to 2.55 whereas for a Gaussian curve the expression is identi-
cally equal to three. The error limits, arising out of the uncert-
ainty in the lineshape tails are large, but this result does serve
to illustrate that the nuclear spectrum of the sprayed powder shown
in Figure 7.1 can best be described as a flat topped Gaussian. This
form of lineshape is further evident from the rather unusual shape
- 98 -
of the corresponding FID, with an apparent beat structure imposed
on top of a simple transient decay to the baseline.
As a check on the reliability of the measured second moments,
CW measurements were carried out on two purer samples (a) and (c).
The second moment values obtained in this way agreed with the
values shown in Table 7.1.
7.3.3 DISCUSSION
High values of second moment have been recorded by other
workers for specimens of thin foil and both commercial and filed
powders. The experimental second moment obtained here for the
powder filed from a pure ingot (c) is slightly higher than most of
these values, but in view of the large possible error the agree-
ment is reasonable. (One recent determination in particular put
the second moment of a6 9s pure filed sample as 12.5 G2 (15.4 kHz 2). )(110)
2 The second moment of 9.4 kHz measured from the 99.995% pure sprayed
powder (a) is markedly lower than the above values and in close
agreement with the theoretical value of 9.2 kHz2. Taken together
the tabulated results from all three samples show that the measured
second moment of annealed aluminium powder is sensitive to both purity
and the manner of specimen preparation; the implication being that
the lineshapes obtained from those specimens prepared by filing were
distorted by some form of nuclear quadrupole interaction.
Besides the anomalously high experimental second moment values,
other reported measurements have lent further support to the possi-
bility of some sort of resonant quadrupole interaction being present in filed powder and thin foil specimens of aluminium metal. Spokas
- 99 -
and Slichter(104) reported that at higher temperatures their measure-
ments of the Hahn echo T2 were consistent with a nuclear quadrupole
coupling to long-range, slowly varying lattice strains of some sort.
Similar results obtained by Fradin and Rowland (112)
have supported
this contention. Anderson and Redfield (18)
considered that their
anomalously high measured value for the ratio of the spin-lattice
relaxation time in high and low external magnetic fields (S) arose
from a quadrupolar coupling, possibly even due to the presence of
impurities. More recently Tunstall and Brown (72)
interpreted a
measured variation of S against temperature in terms of a quadrupolar
contribution to the local internal magnetic fields and showed how
agreement between theory and experiment could then be improved.
However in each of these cases the precise nature of the lattice
defects producing the quadrupole coupling has still to be isolated
satisfactorily.
The results reported here imply that lattice strains are intro-
duced by the cold working of the metal to produce foil or fine part-
icles. There are two ways in which such strains might arise:
either through the introduction of impurities or by a distortion
of the crystal lattice. Before annealing the second moments of
the sprayed and filed powders were about 50% higher than the values
stated in Table 7.1. (The same reduction caused by the annealing
process has been reported by other workers in filed powders (110)
and cold rolled foils(105). ) Therefore it would appear that anneal-
ing successfully removes'some strain mechanisms but leaves others.
The presence of impurities introduced by the cold working process
cannot be ruled out. Such impurities might exist separately as
macroscopic particles or diffuse into the grains of aluminium them-
selves. Certainly our use of a tungsten carbide coated file did
- 100 -
not prevent magnetic splinters from entering the filed powder
initially. A detailed chemical analysis of filed powders and
cold rolled foils would help in this respect.
In conclusion we note that there was a marked difference in
appearance between the individual grains of the filed powder speci-
mens and those prepared by the metal spraying technique. Under
a microscope the filed particles were very irregular in shape where-
as the sprayed particles tended to be elongated spheroids. How-
ever any surface effect would presumably have to be exceptionally
long-ranged in order to account for the observed amount of broaden-
ing in the nuclear resonance spectra.
7.4 VARIATION OF LINESHAPE WITH ROTATION SPEED
7.4.1 INTRODUCTION
The aluminium resonance line may be narrowed by rapid
rotation at the magic angle. No scalar broadening interaction of
the type discussed in Section 2.1.4 is present in aluminium. There-
fore it is predicted that the theoretical limit to the reduced
central spectrum will be determined only by the homogeneity of the
external magnetic field and the relaxation time of the aluminium
nuclei. Kessemeier and Norberg(34) have spun aluminium at speeds
up to 7.5 kHz and reported that the resonance signal was narrowed
by a factor of 10. Above 4 kHz they found that the FID was made
up of a Gaussian initial part and an exponential tail, the time
constant of which exhibited a roughly linear dependence on the rotat-
ion rate. The linewidth of static altnºinium powder is approximately
8 kHz, so it is expected that rotation rates considerably in excess
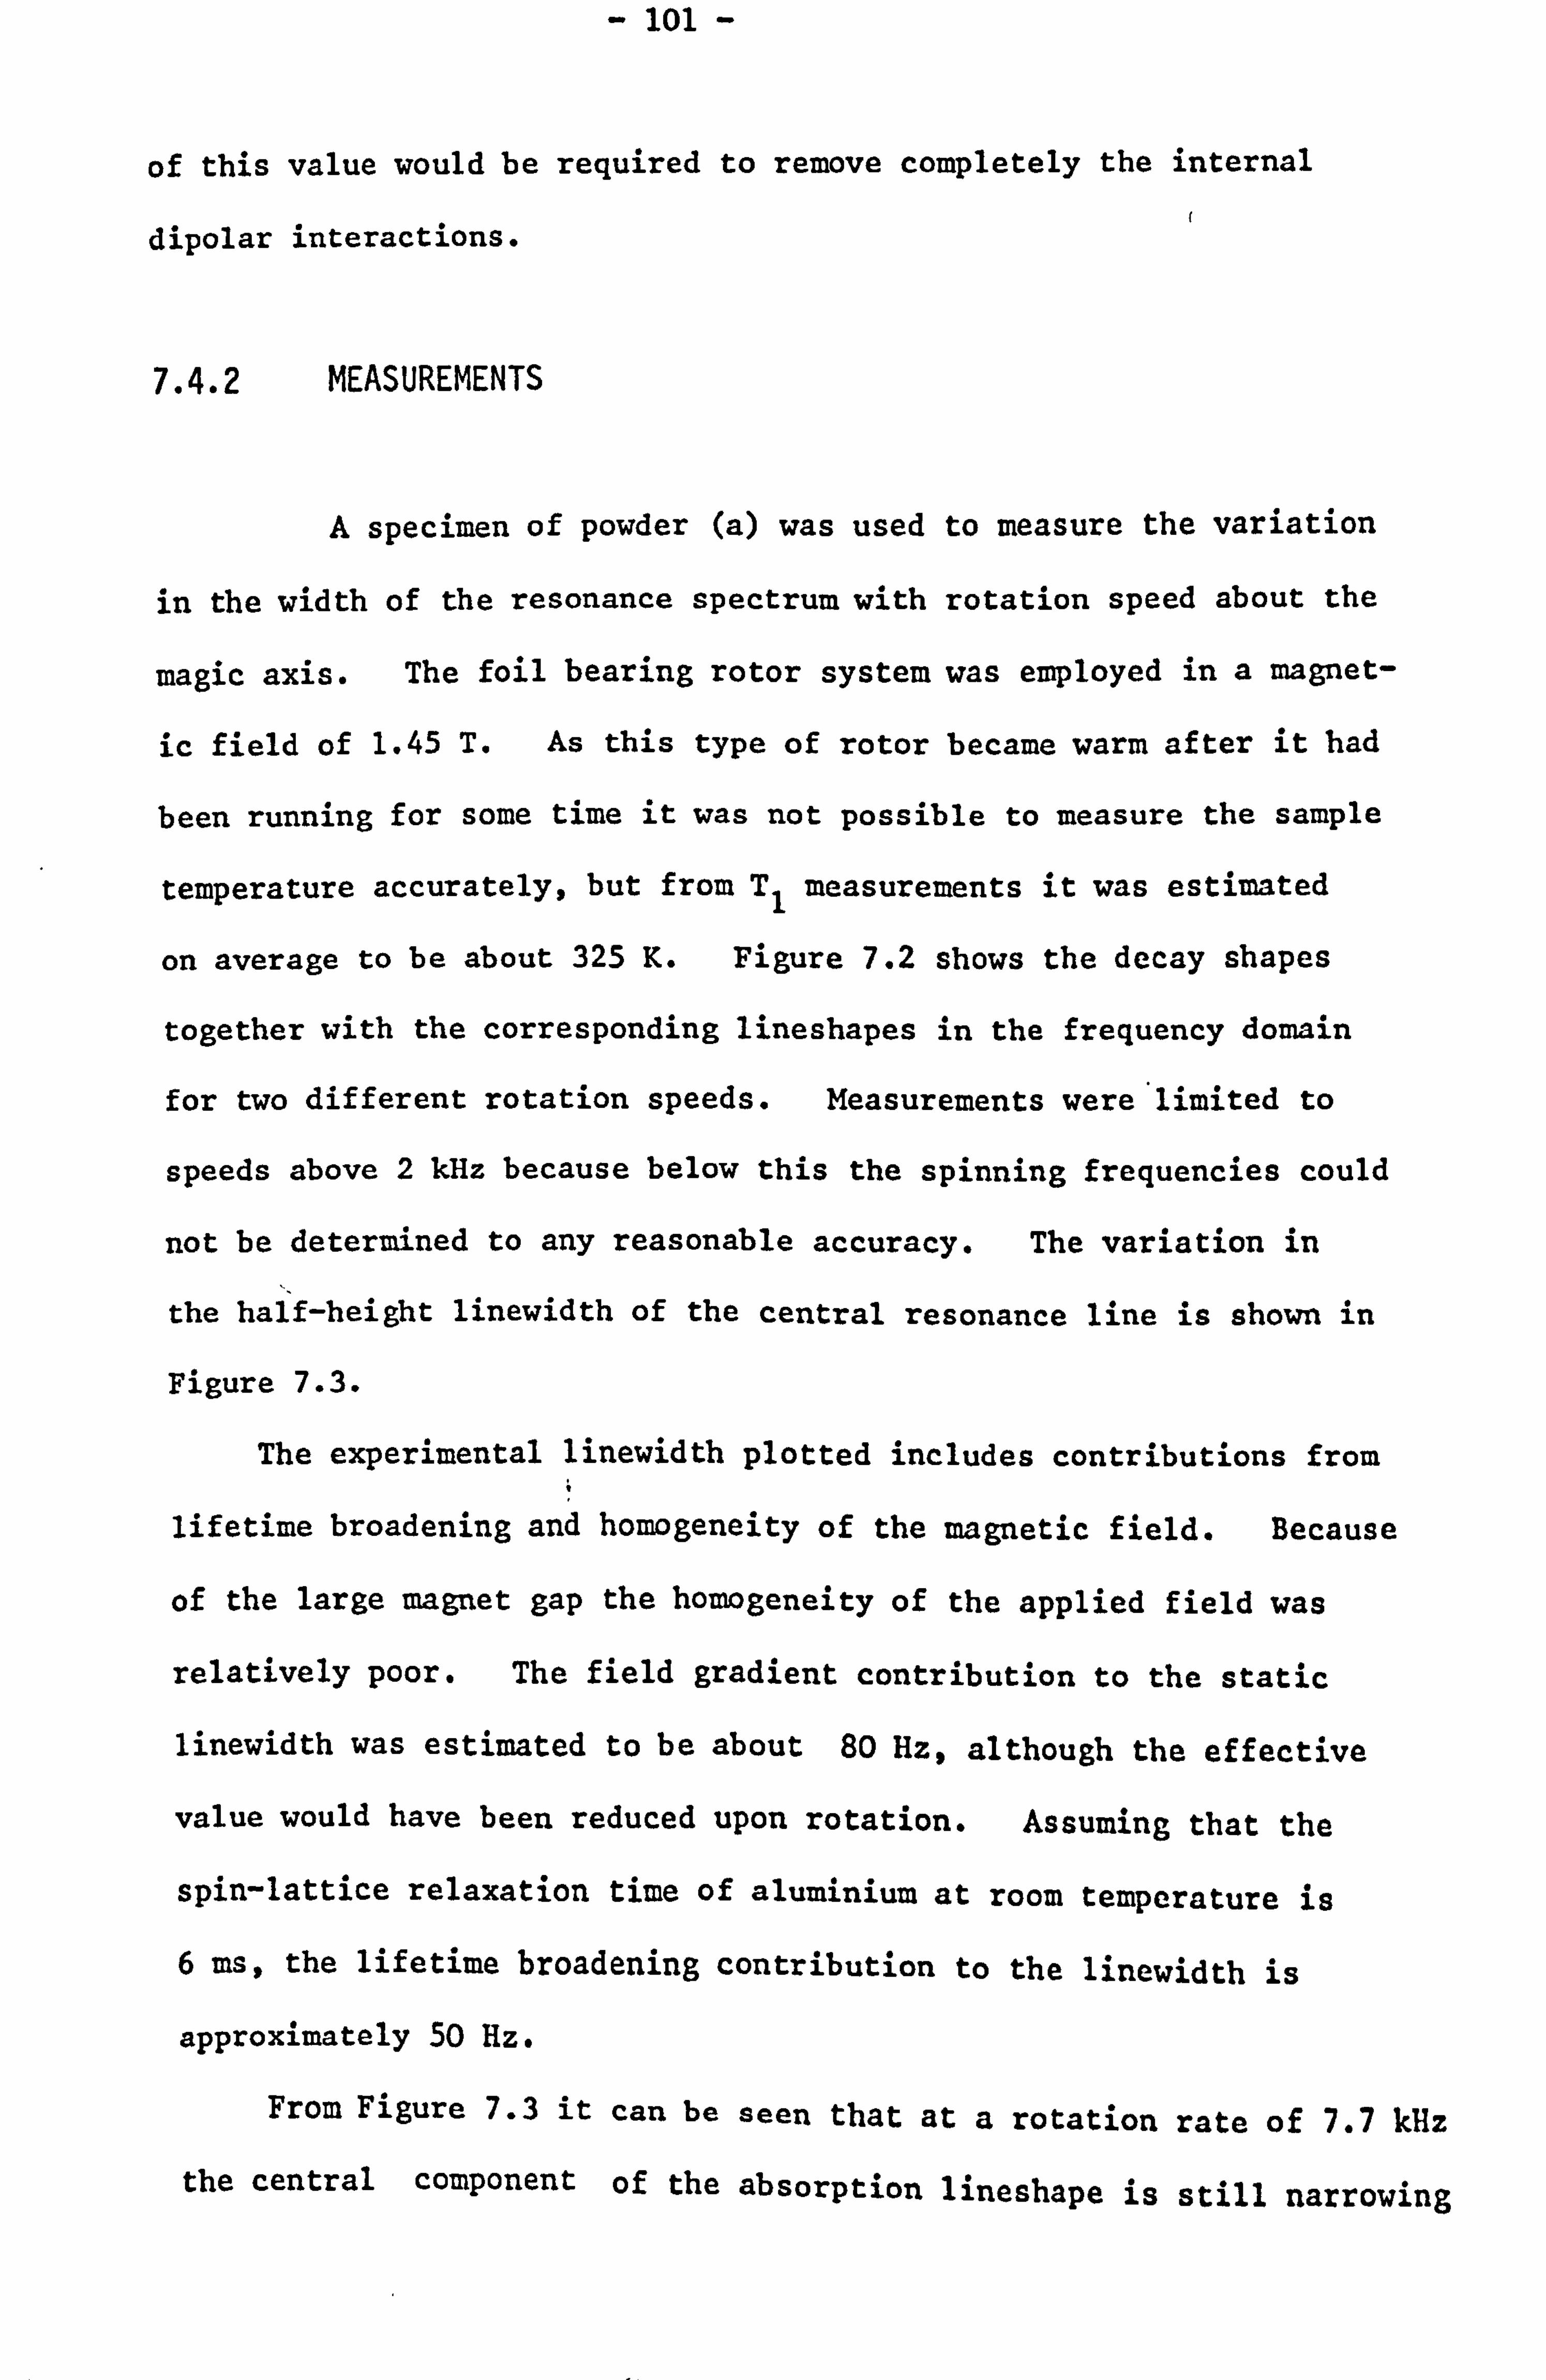
- 101 -
of this value would be required to remove completely the internal
dipolar interactions.
7.4.2 MEASUREMENTS
A specimen of powder (a) was used to measure the variation
in the width of the resonance spectrum with rotation speed about the
magic axis. The foil bearing rotor system was employed in a magnet-
ic field of 1.45 T. As this type of rotor became warm after it had
been running for some time it was not possible to measure the sample
temperature accurately, but from T1 measurements it was estimated
on average to be about 325 K. Figure 7.2 shows the decay shapes
together with the corresponding lineshapes in the frequency domain
for two different rotation speeds. Measurements were limited to
speeds above 2 kHz because below this the spinning frequencies could
not be determined to any reasonable accuracy. The variation in
the half-height linewidth of the central resonance line is shown in
Figure 7.3.
The experimental linewidth plotted includes contributions from
lifetime broadening and homogeneity of the magnetic field. Because
of the large magnet gap the homogeneity of the applied field was
relatively poor. The field gradient contribution to the static
linewidth was estimated to be about 80 Hz, although the effective
value would have been reduced upon rotation. Assuming that the
spin-lattice relaxation time of aluminium at room temperature is
6 ms, the lifetime broadening contribution to the linewidth is
approximately 50 Hz.
From Figure 7.3 it can be seen that at a rotation rate of 7.7 kHz
the central component of the absorption lineshape is still narrowing
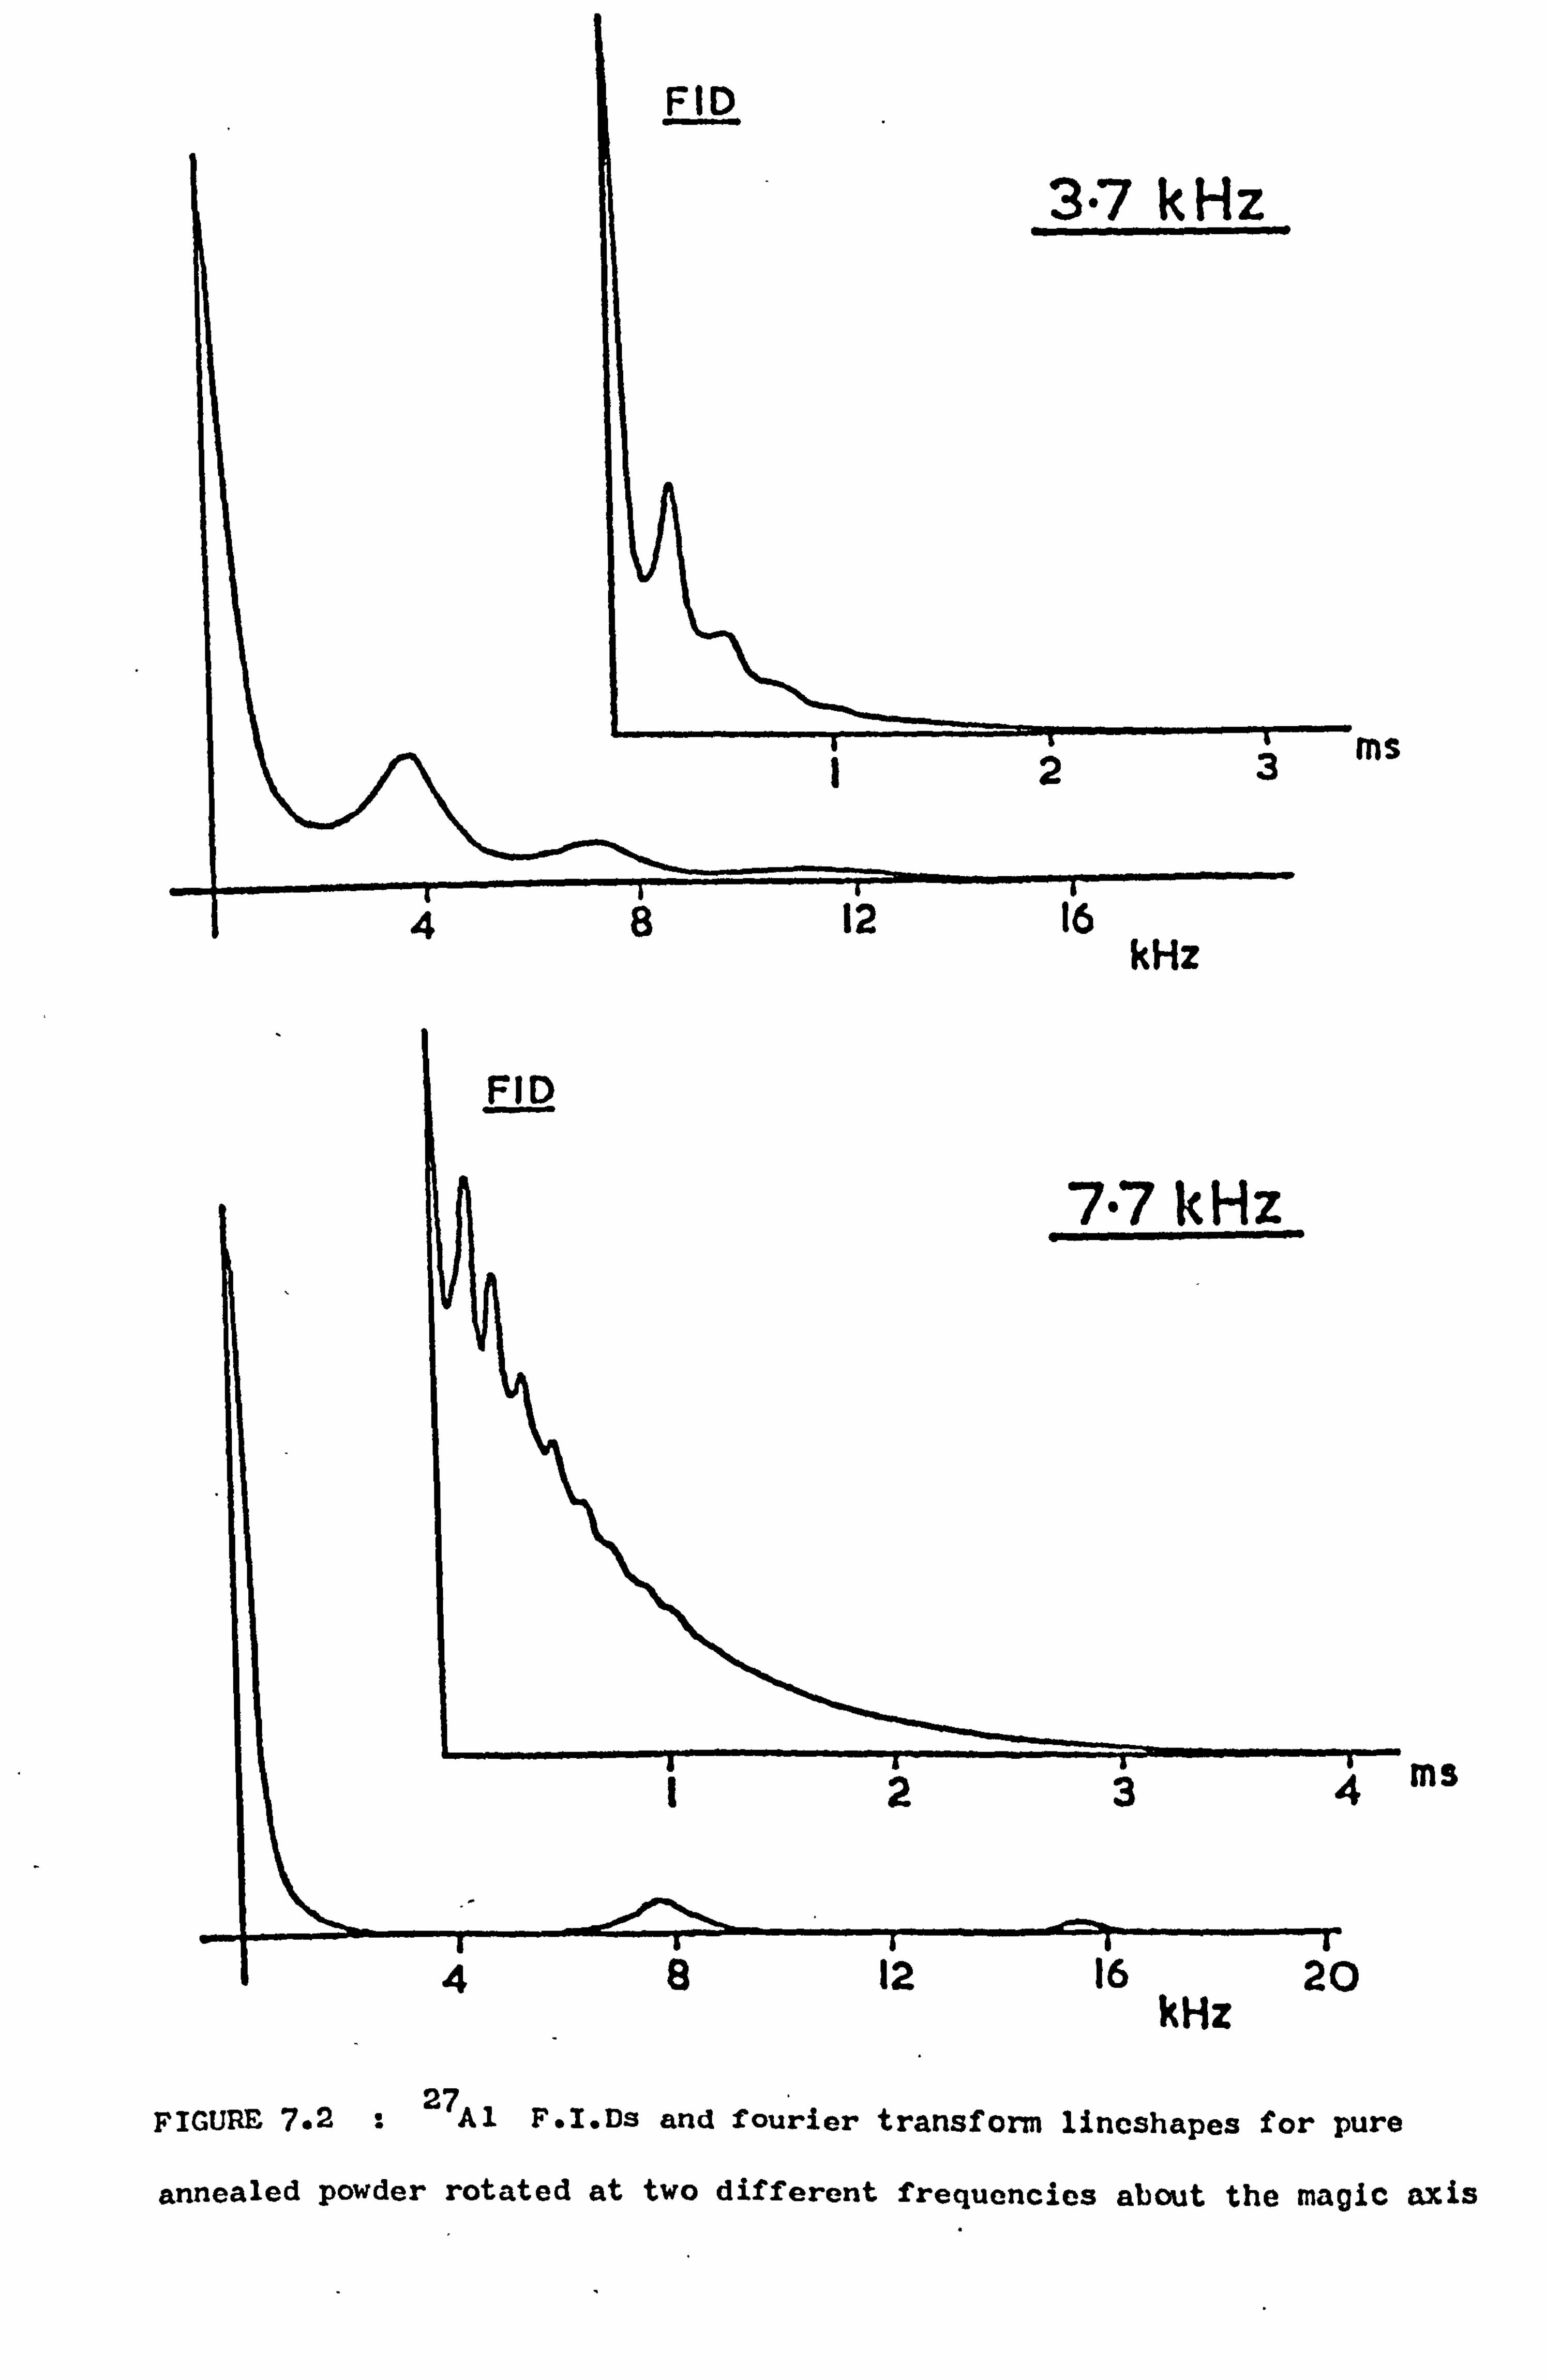
ms
kHz
ms
kHz
FIGURE 7.2 : 27A 1 F. I. Ds and fourier transform lineshapes for pure
annealed powder rotated at two different frequencies about the magic axis
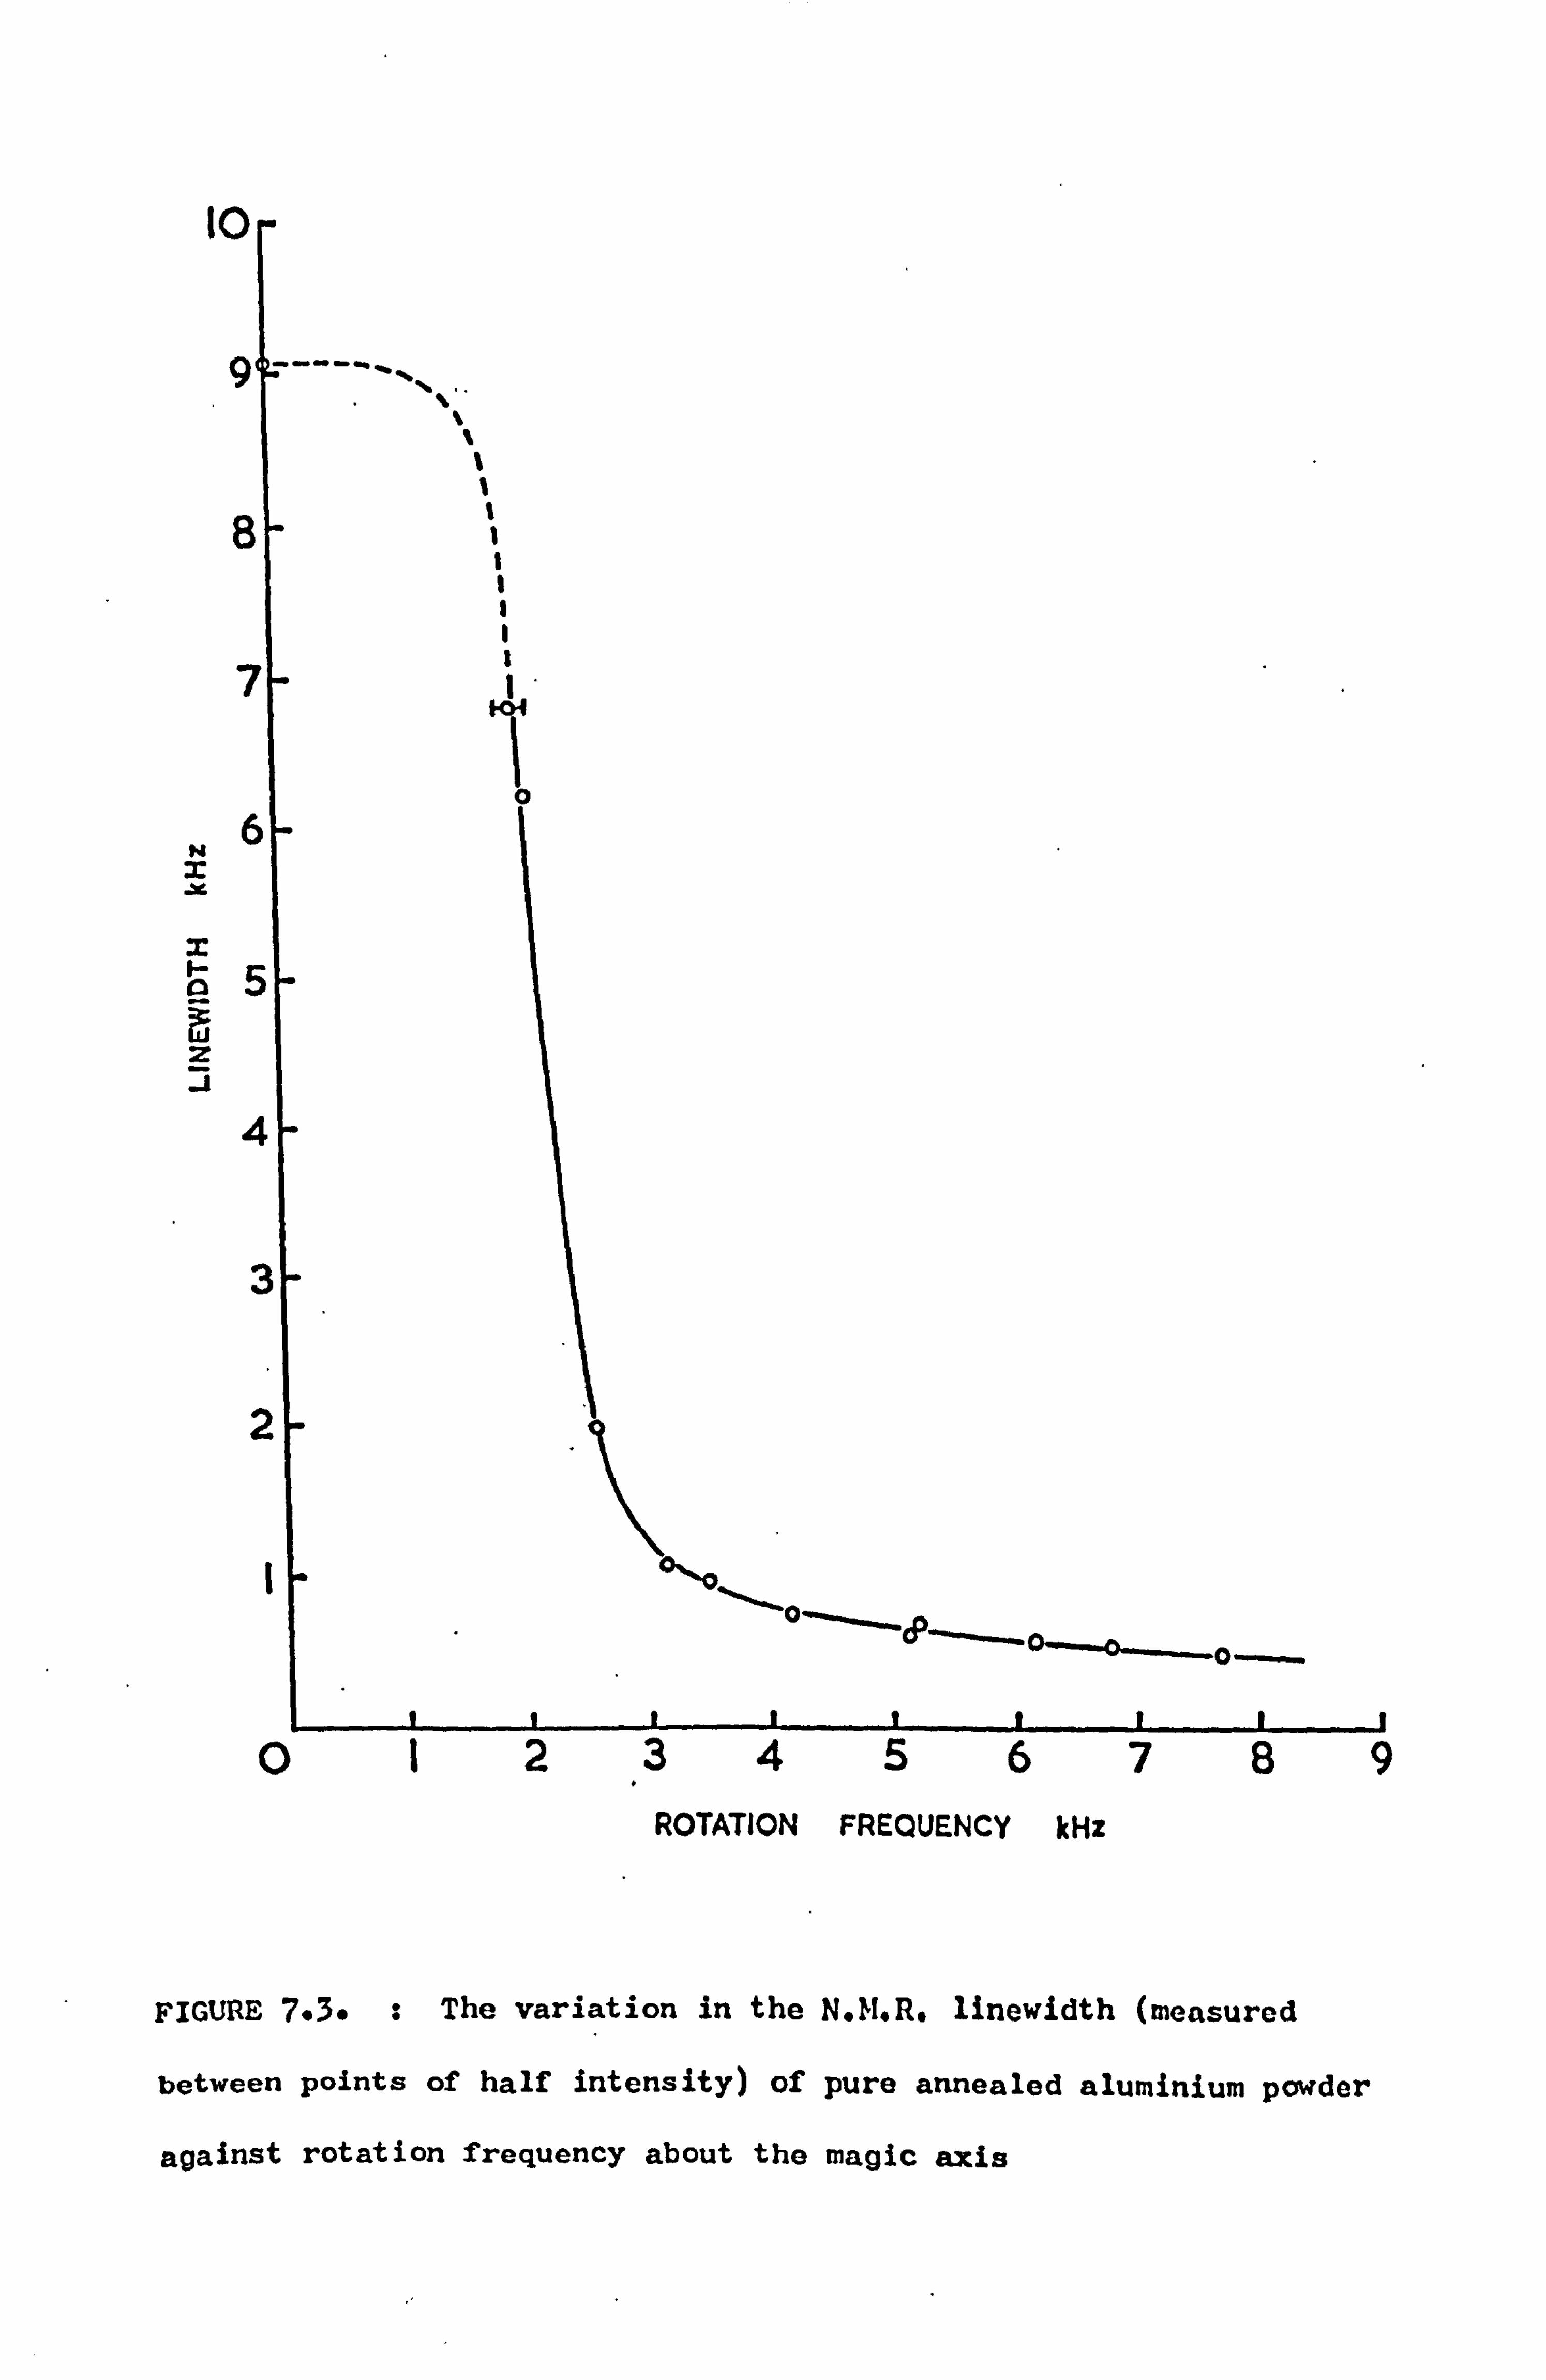
I0
N
JL
I F- 0
z J
ROTATION FREQUENCY kHz
FIGURE 7.3. : The variation in the N. M. R. linewidth (measured
between points of half intensity) of pure annealed aluminium powder
against rotation frequency about the magic axis
0123456789
- 102 -
even though it appears to be completely resolved from the first
rotation beat. At this speed the linewidth is decreased by a
factor of 20 over the static value. This is to be compared with
the simple order of magnitude decrease recorded by Kessemeier and
Norberg for a much smaller sample over the same range of spinning
frequencies. The discrepancy probably largely reflects the differ-
ent specifications of the samples used. The specimens employed
in the measurements reported here were of annealed pure powder prep-
ared by the metal spraying technique. Kessemeier and Norberg's
samples were of unspecified purity and were subject to first order
quadrupole interactions.
7.5 DETERMINATION OF RELAXATION TIMES
7.5.1 SPIN-LATTICE RELAXATION TIME (TIZ)
The powder samples used in these measurements were each
sieved so that the grain size was less than 44 µm.
The spin-lattice relaxation time of powder (a) was measured as
a function of rotation speed for speeds up to 4.5 kHz. For an
applied magnetic field of 1.35 T and a room temperature of 295 K
the measured Tlz of the aluminium sample in a conical rotor spinning
at the magic angle was 6.1 ± 0.2 ms, independent of rotation rate.
This value is in agreement with the expression T1T s 1.85 ± 0.05 ms K
as determined by Spokas and Slichter(104). Since the relaxation
mechanism is via the electron-nucleus scalar contact interaction,
the invariance of the relaxation time with rotation speed is to be
expected.
The static spin-lattice relaxation times of samples (a), (b)
and (c) were all determined using the 180-T-90 pulse sequence. The
1ý
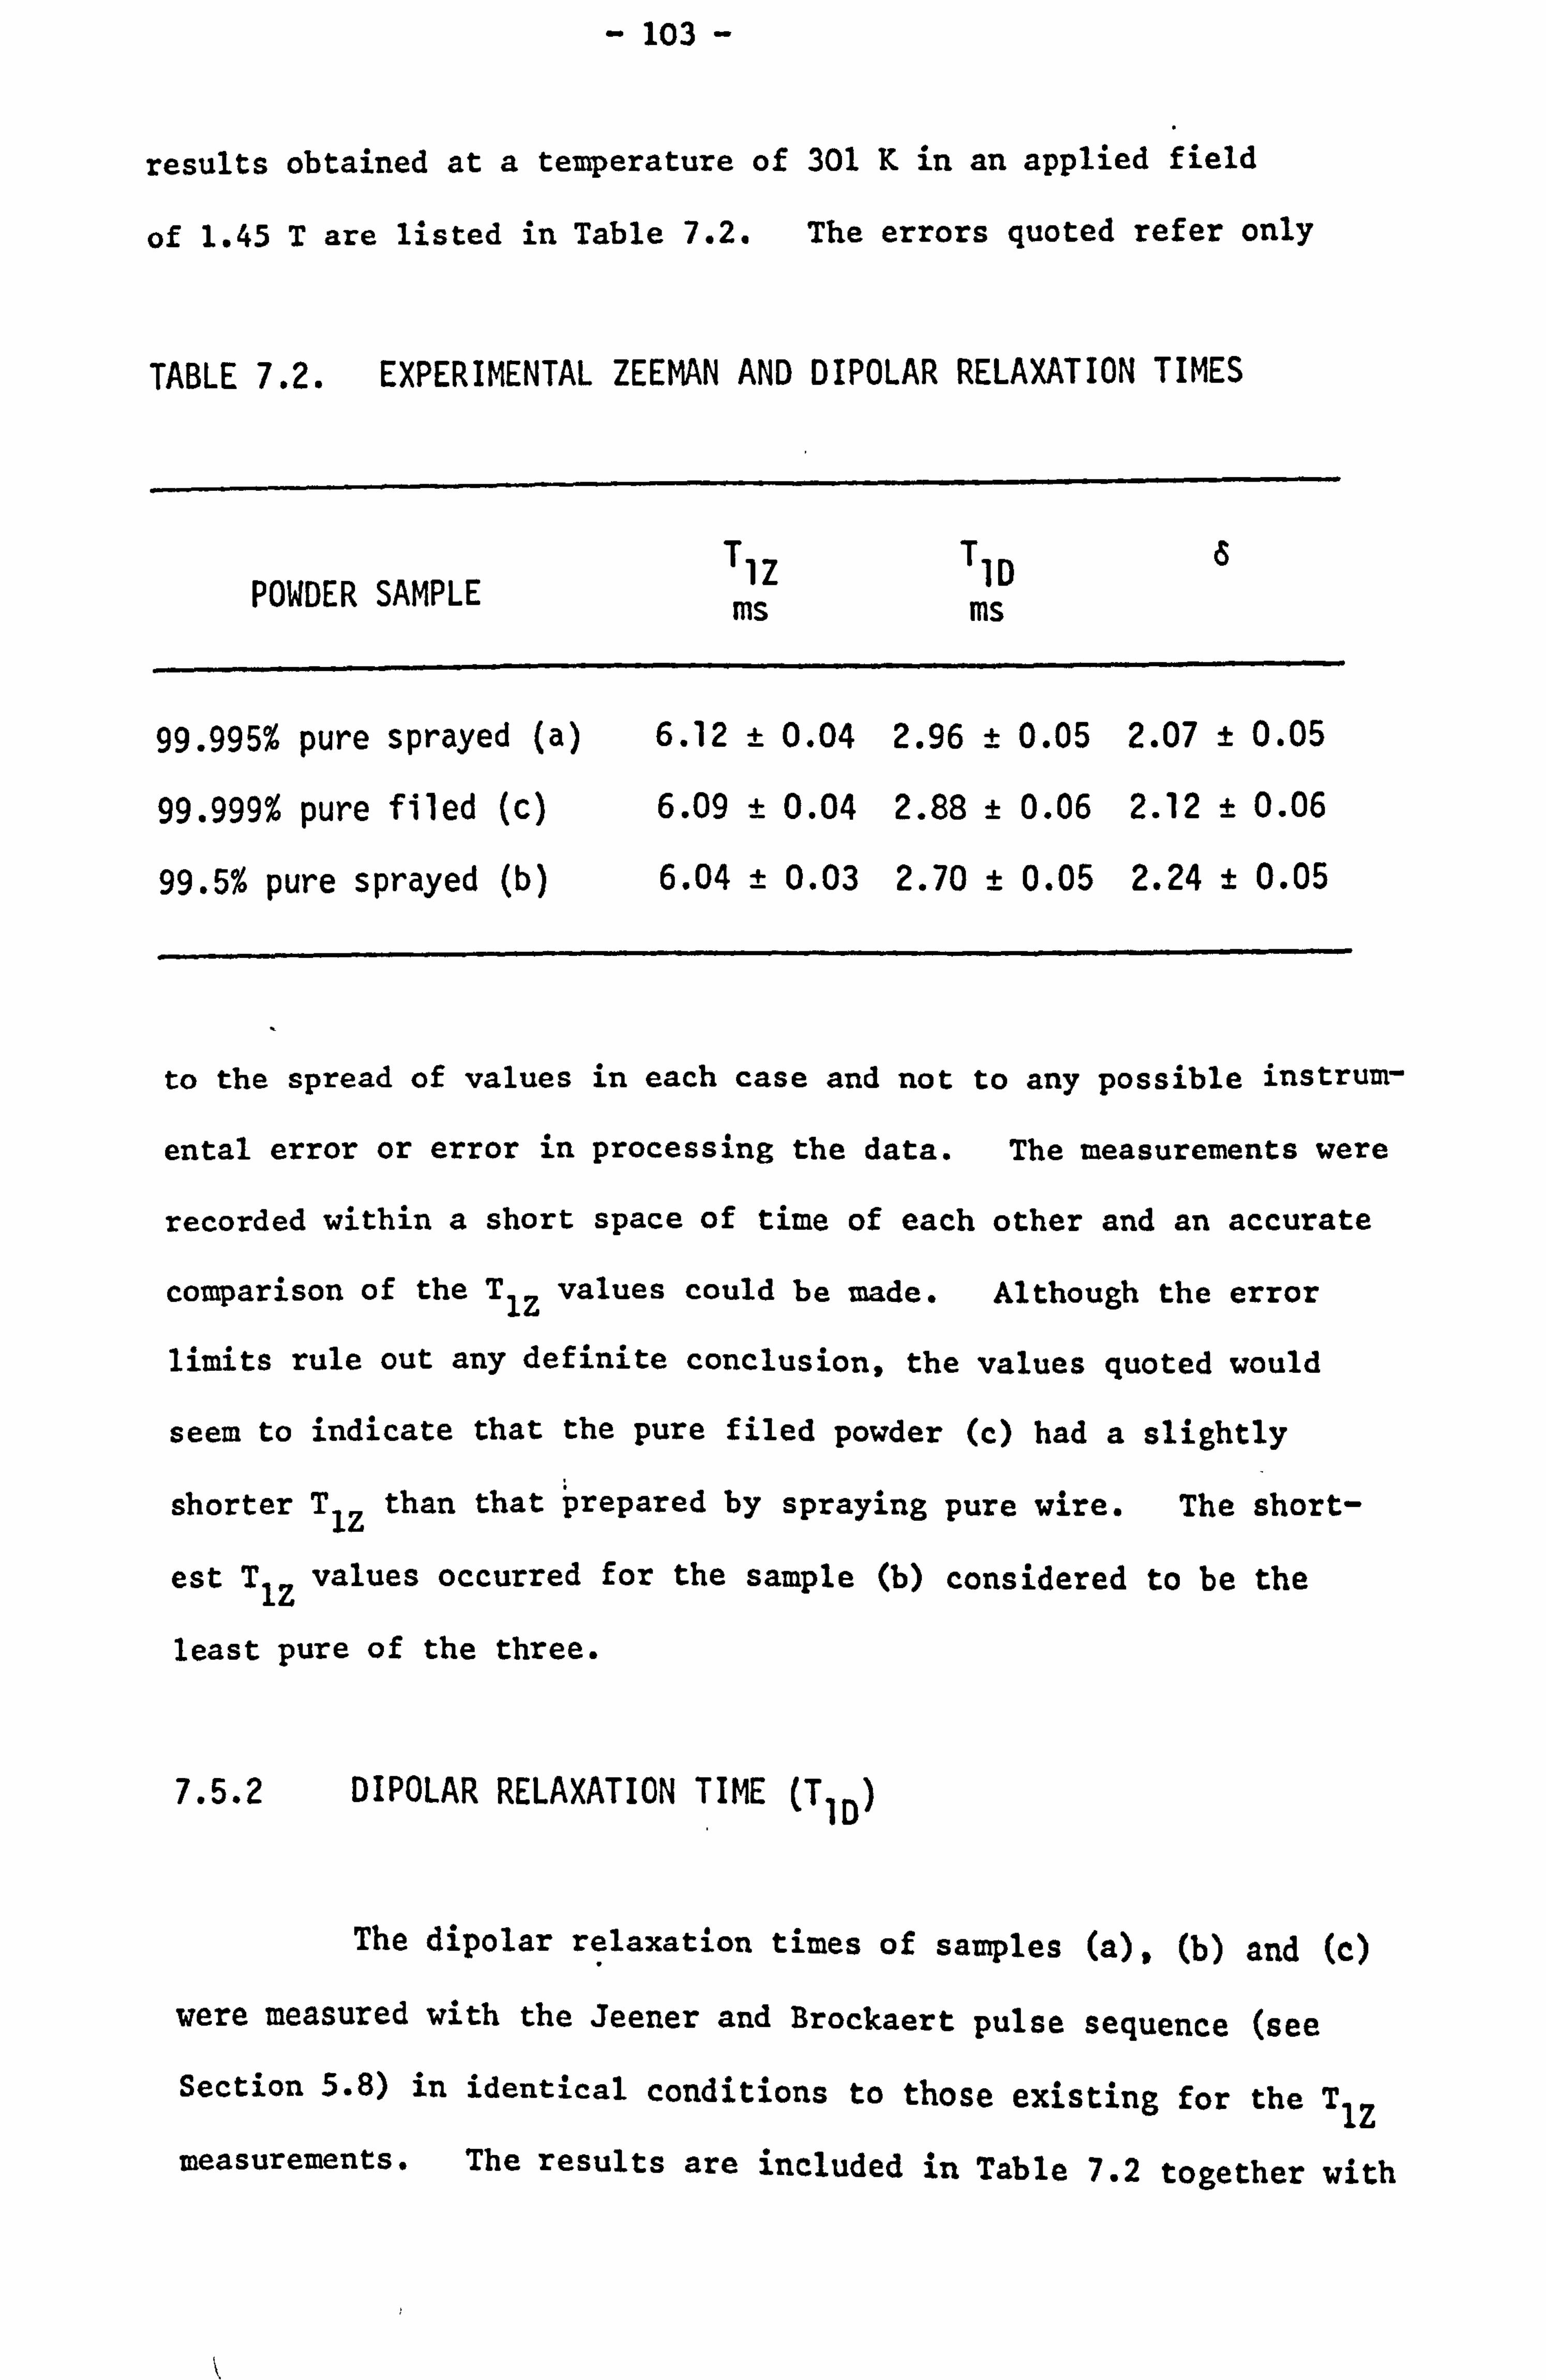
-103-
results obtained at a temperature of 301 K in an applied field
of 1.45 T are listed in Table 7.2. The errors quoted refer only
TABLE 7.2. EXPERIMENTAL ZEEMAN AND DIPOLAR RELAXATION TIMES
POWDER SAMPLE TjZ TID a
ms ms
99.995% pure sprayed (a) 6.12 ± 0.04 2.96 ± 0.05 2.07 ± 0.05
99.999% pure filed (c) 6.09 ± 0.04 2.88 ± 0.06 2.12 ± 0.06
99.5% pure sprayed (b) 6.04 ± 0.03 2.70 ± 0.05 2.24 ± 0.05
to the spread of values in each case and not to any possible instrun-
ental error or error in processing the data. The measurements were
recorded within a short space of time of each other and an accurate
comparison of the Tlz values could be made. Although the error
limits rule out any definite conclusion, the values quoted would
seem to indicate that the pure filed powder (c) had a slightly
shorter Tlz than that prepared by spraying pure wire. The short-
est Tlz values occurred for the sample (b) considered to be the
least pure of the three.
7.5.2 DIPOLAR RELAXATION TIME (TID)
The dipolar relaxation times of samples (a), (b) and (c)
were measured with the Jeener and Brockaert pulse sequence (see
Section 5.8) in identical conditions to those existing for the TlZ
measurements. The results are included in Table 7.2 together with
1
- 104 -
the corresponding values of d (T1Z/T1D). The errors quoted again
refer to the distribution of values obtained in each case.
Using the same technique Tunstall and Brown (72)
measured T1D
and 6 in samples of pure filed annealed powder over the temperature
range 1.3-295 K. Although their measured 6 value at room temper-
ature was 2.25 they interpreted the recorded temperature dependence
as indicating a contribution due to a quadrupolar thermal reservoir
and concluded that the value of 6 relating the true dipolar relaxat-
ion time to Tlz was in fact 2.15 ± 0.07. From room temperature
measurements of the spin-lattice relaxation in the rotating frame
113 (Tlp) Fradin and Rowland(d
) measured 6 as 2.65. Pifer
(114) used
a CW slow passage saturation method and obtained a value of
2.07 ±'0.02 at 273 K. At liquid helium temperatures experimental
values of 6 have been consistently greater than 2.5(18'72,115)
The measurements reported here indicate that the method of sample
preparation contributes to the measured values of T1D and hence Ö.
The recorded 6 value for the filed powder (c) is somewhat lower than
Tunstall and Brown's uncorrected value from a similar sample at 295 K.
On the other hand the value for powder (a) agrees with their corrected
value to within experimental error and is in excellent agreement with
that reported by Pifer. Such an occurrence may well be fortuitous,
however, because no details of Pifer's samples are included. With
the simplifying assumption of a spherical Fermi surface the theoret-
ical value for 6 is 2.06(72). The experimental value for the pure
sprayed powder therefore fits present theory very well. It remains
to be seen whether this value is independent of temperature as theory
predicts.
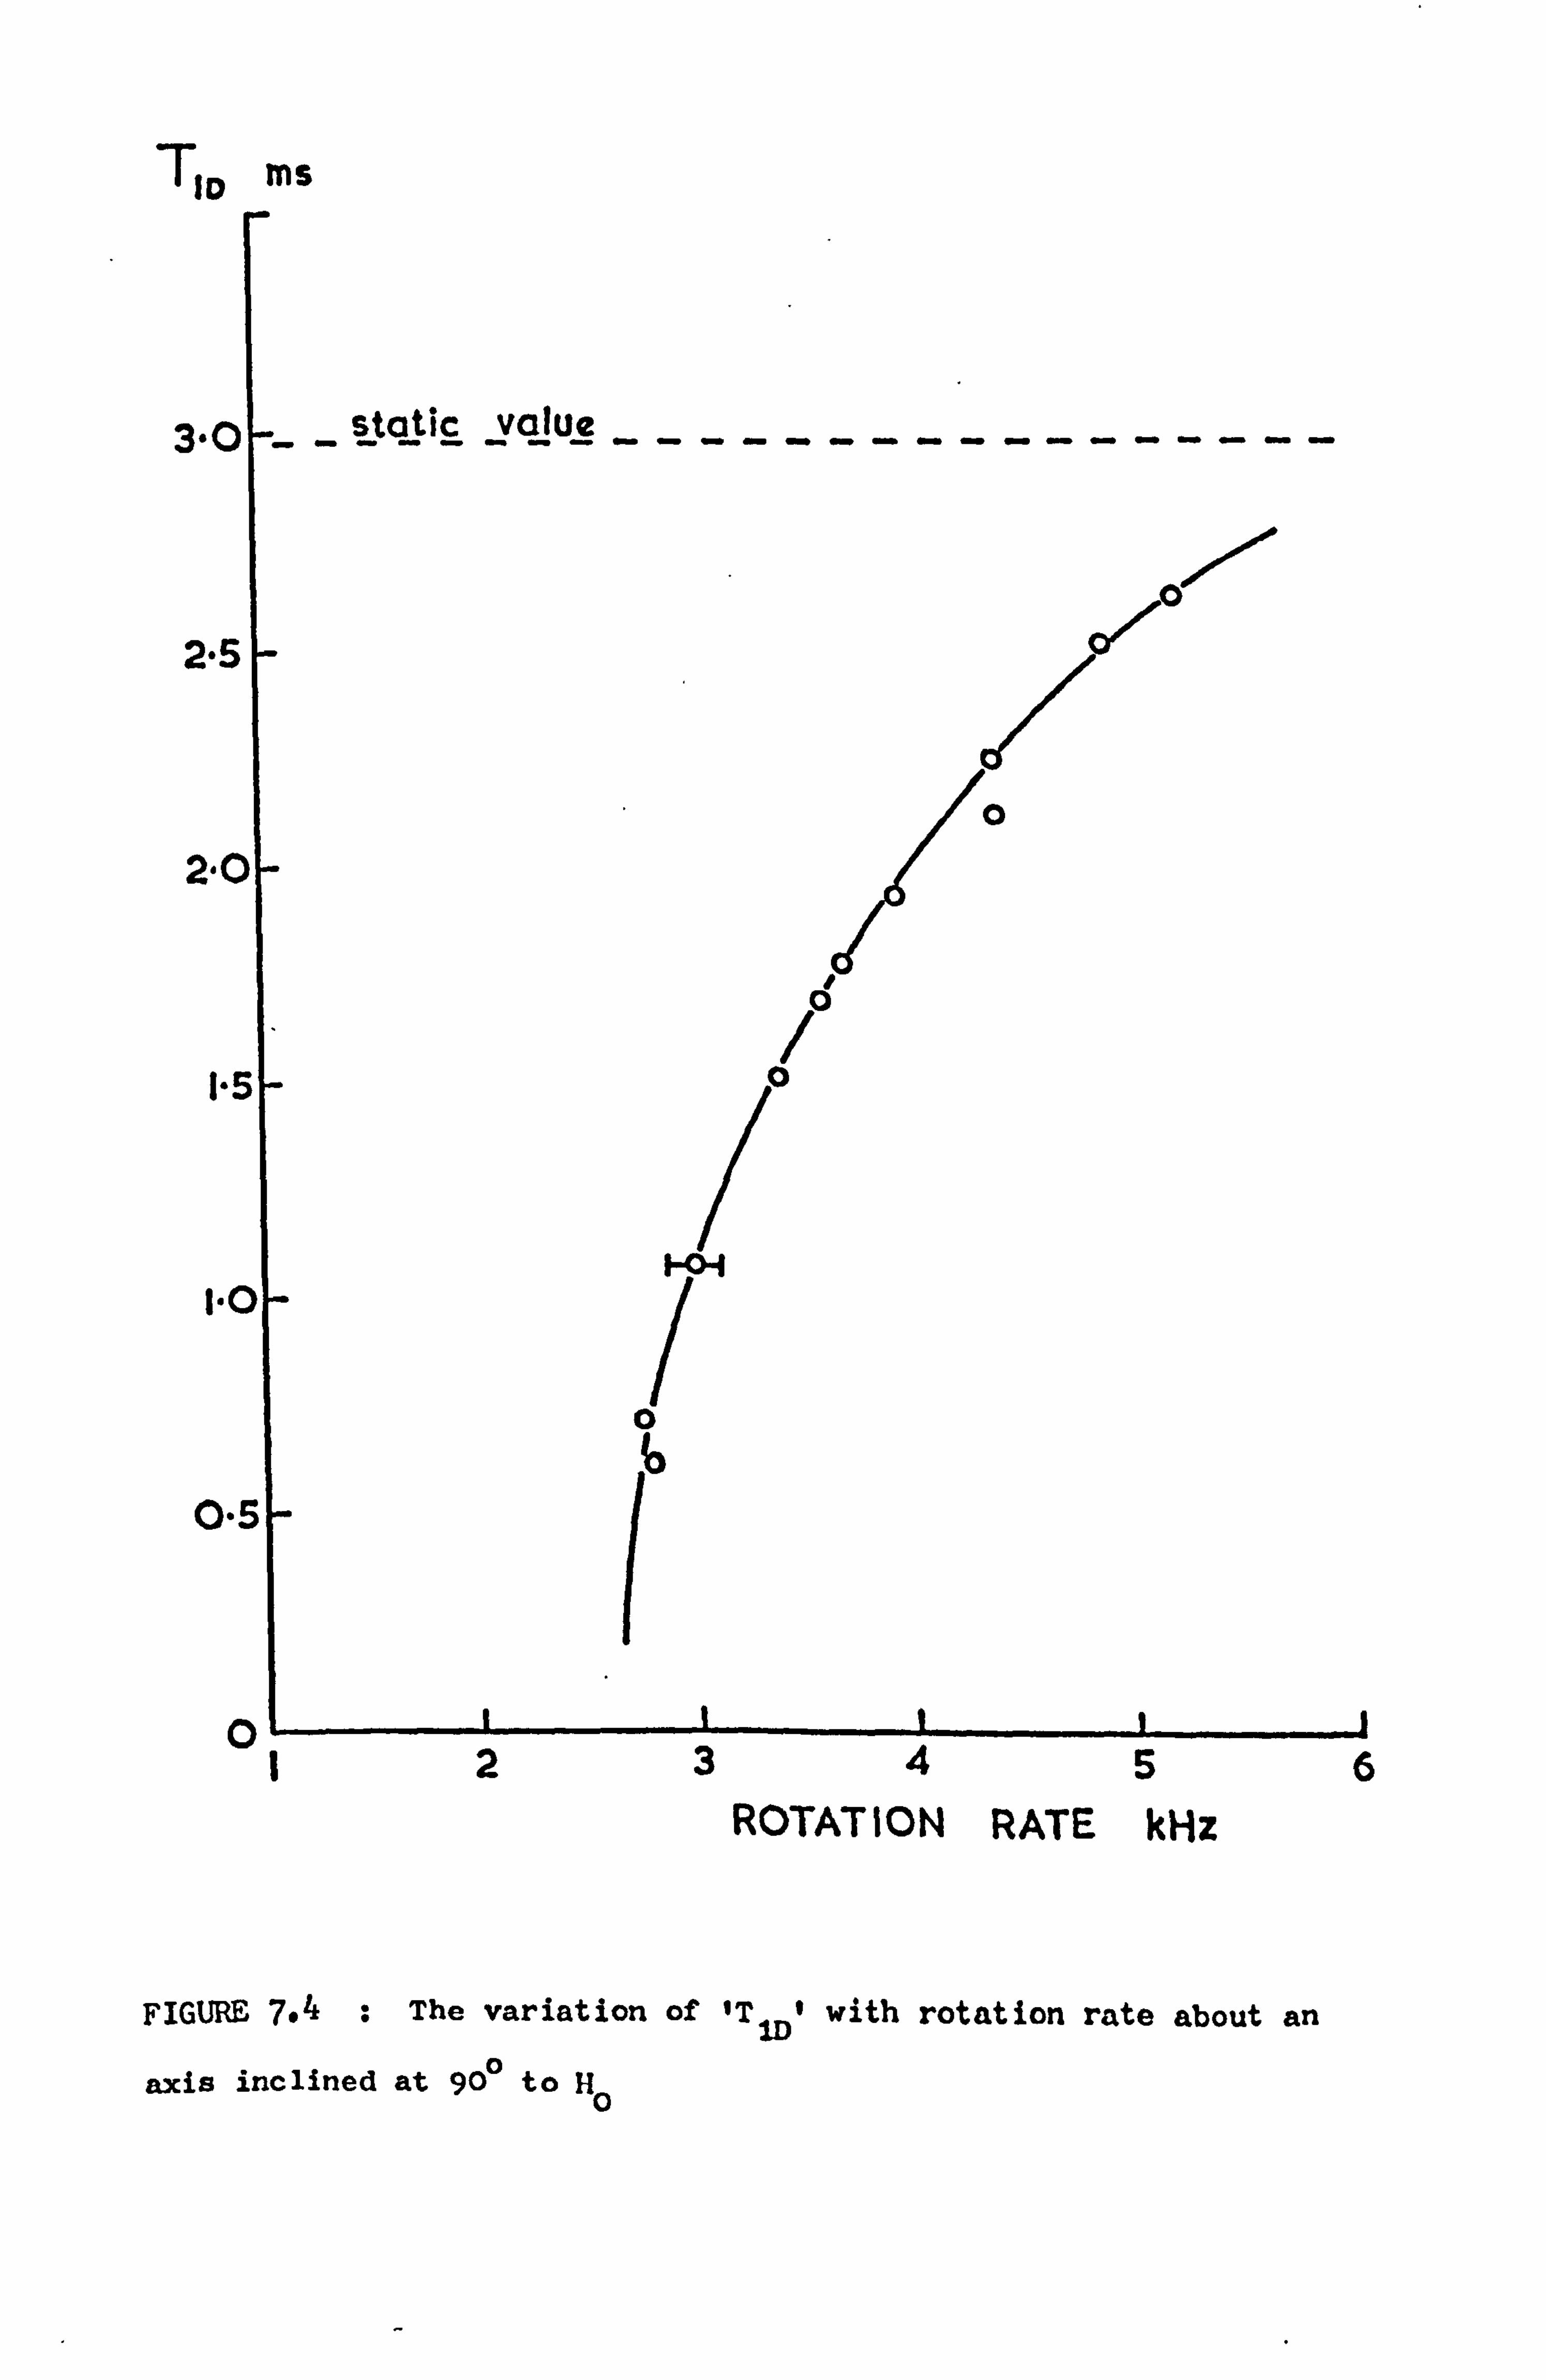
T10 ms
3. O
2.5
2'C
H
1"C
o..
v
ROTATION RATE kHz
FIGURE 7.4 : The variation of IT WI with rotation rate about an
axis inclined at 900 to H0
23456
- 105 -
7.5.3 VARIATION IN 'TAD' WITH ROTATION SPEED
As an interesting exercise the dipolar relaxation time
of the sprayed pure powder (a) was measured as a function of rotat-
ion speed. It was found that with the rotors spinning about the
magic axis, the modulation beats generated on the decay shapes dist-
orted the signal amplitude detected after the third pulse of the
Jeener and Brockaert sequence. However, by using the foil bearing
rotor system it proved possible to spin the samples about an axis
perpendicular to the external magnetic field. With this alignment
of the rotors the detected decay signals remained relatively undist-
orted and results could then be obtained from the Jeener and Brockaert
pulse sequence. As has been stated previously, use of the foil
bearing system meant that the aluminium sample was at a somewhat
higher temperature than the room, probably in the range 315-330 K.
The recorded variation in T1D against spinning rate is shown in
Figure 7.4. 'Rotation rates below 1.5 kHz could not be achieved with
the foil bearing rotor system. However, it was found that in the
range 1.5-2.7 kHz the relaxation times were too short to measure
with the techniques employed anyway. Because of the need to keep
the rotors spinning for quite a long period of time during each deter-
mination of T1D, measurements were limited to a maximum spinning
frequency of about 5 kHz. Compressed air could then be used as the
driving gas. No detailed theoretical consideration of the form of
the results has yet been undertaken.
- 106 -
CHAPTER 8
MEASUREMENTS ON VANADIUM, NIOBIUM AND CADMIUM METALS
8.1 INTRODUCTION
In practice the number of metals which can usefully be investi-
gated using the magic angle rotation technique is limited. Although
the more common metals all possess at least one isotope with a
nuclear magnetic moment, the natural abundance of many of these is
extremely low. This fact combined with low values of magnetic
moment- means that the resonances of a number of isotopes are extrem-
ely weak. Such isotopes are unsuited to the macroscopic rotat-
ion technique using existing equipment: indeed for many isotopes
the resonance condition lay outside the range of the spectrometer.
For those nuclear isotopes with spin greater than } existing in non-
cubic lattices, quadrupole interactions lead to very broad character-
istic spectra. Of those metals with cubic or near cubic lattice
symmetry scandium, ß-manganese, tantalum and thallium still have
too large a -static linewidth to be narrowed completely by the rotat-
ion rates which can be achieved at present. In the other extreme,
at room temperature the secular line broadening interactions in the
alkali metals are already reduced by diffusional motion. The room
temperature linewidths of lead and platinum arise in large part from
T1 broadening, which is unaffected by macroscopic specimen rotation.
Consequently these two metals were also excluded from the list of
possible samples.
0
- 107 -
Although most metals of the lanthanide series possess at least
one isotope with a magnetic moment, relatively little work has been
done on the NMR spectra of the rare earth metals. This is presum-
ably due in part to the difficulty in obtaining specimens of a
sufficiently high purity. Nevertheless it is worth noting that
considerations such as those described above rule out all but
europium, ytterbium and perhaps lanthanum as specimens which might
profitably be subjected to the magic angle rotation technique.
With these metals, however, there is also the additional complicat-
ion that they are readily oxidized and hence have to be kept from
contact with the air.
With the experimental system available the list of metals,
apart from the rare earths, which could usefully be investigated
by rotation at the magic angle was found to be reduced to six:
copper, tin, aluminium, cadmium, vanadium and niobium. Investi-
gations have already been carried out on the effect of specimen
rotation on the NMR spectra of copper(59) and ß-tin(116). Hence,
since the work on aluminium has been described in the preceding
chapter, detailed in this chapter are a series of measurements on
powdered specimens of vanadium, niobium and cadmium. Although
samples of all three metals were spun at speeds up to 5 kHz, the
static linewidths of vanadium and niobium were found to be too
large to be affected by spinning rates of this magnitude.
8.2 VANADIUM
Vanadium powder with a stated purity of 99.5% and a particle
size of less than 75 um was obtained commerically from Koch-Light
Laboratories. Because of the difficult nature of the annealing
- 108 -
process for vanadium the measurements were all undertaken on un-
annealed specimens. The loose powder samples used in some measure-
ments were suspended in a light oil. This served to damp out
mechanical vibrations induced in the individual crystallites by
the rf pulse which otherwise distorted the detected decay signals.
Other measurements were performed on solid slugs consisting of the
metal powder suspended in a resin matrix, the manufacture of which
was described in Section 5.9.
The spin-lattice relaxation time of 51V
was measured in these
samples. The value of T1 obtained at a room temperature of 295 K
and a resonance frequency of 15 MHz was 2.7 ± 0.1 ms. This value
is in good agreement with that computed from the expression TT1 a 0.788
as determined by Butterworth (117).
A typical FID recorded with the signal averager from a powder
sample is shown in Figure 8.1, together with the corresponding
computed spectrum in the frequency domain. (The time resolution
of the measured decay envelope was set by the maximum sweep speed
of the signal averager. ) The two lineshapes drawn relate to two
different assumptions about the form of the FID during the 12 ps
dead time. An exponential fit to the first few detected data points
is shown by the full line and the dashed line represents a Gaussian
approximation. It is suspected that the exponential fit is closer
to the true situation. Quadrupole echoes (118,119)
were observed
following pairs of closely spaced pulses, indicating that the absorpt-
ion lineshapes were broadened by first order quadrupole interactions.
This finding is consistent with the Lorentzian type wings of the
frequency spectrum defined by the solid line in Figure 8.1.
The large linewidth of the resonance spectrum prevented the
macroscopic rotation technique used for aluminium from being applied
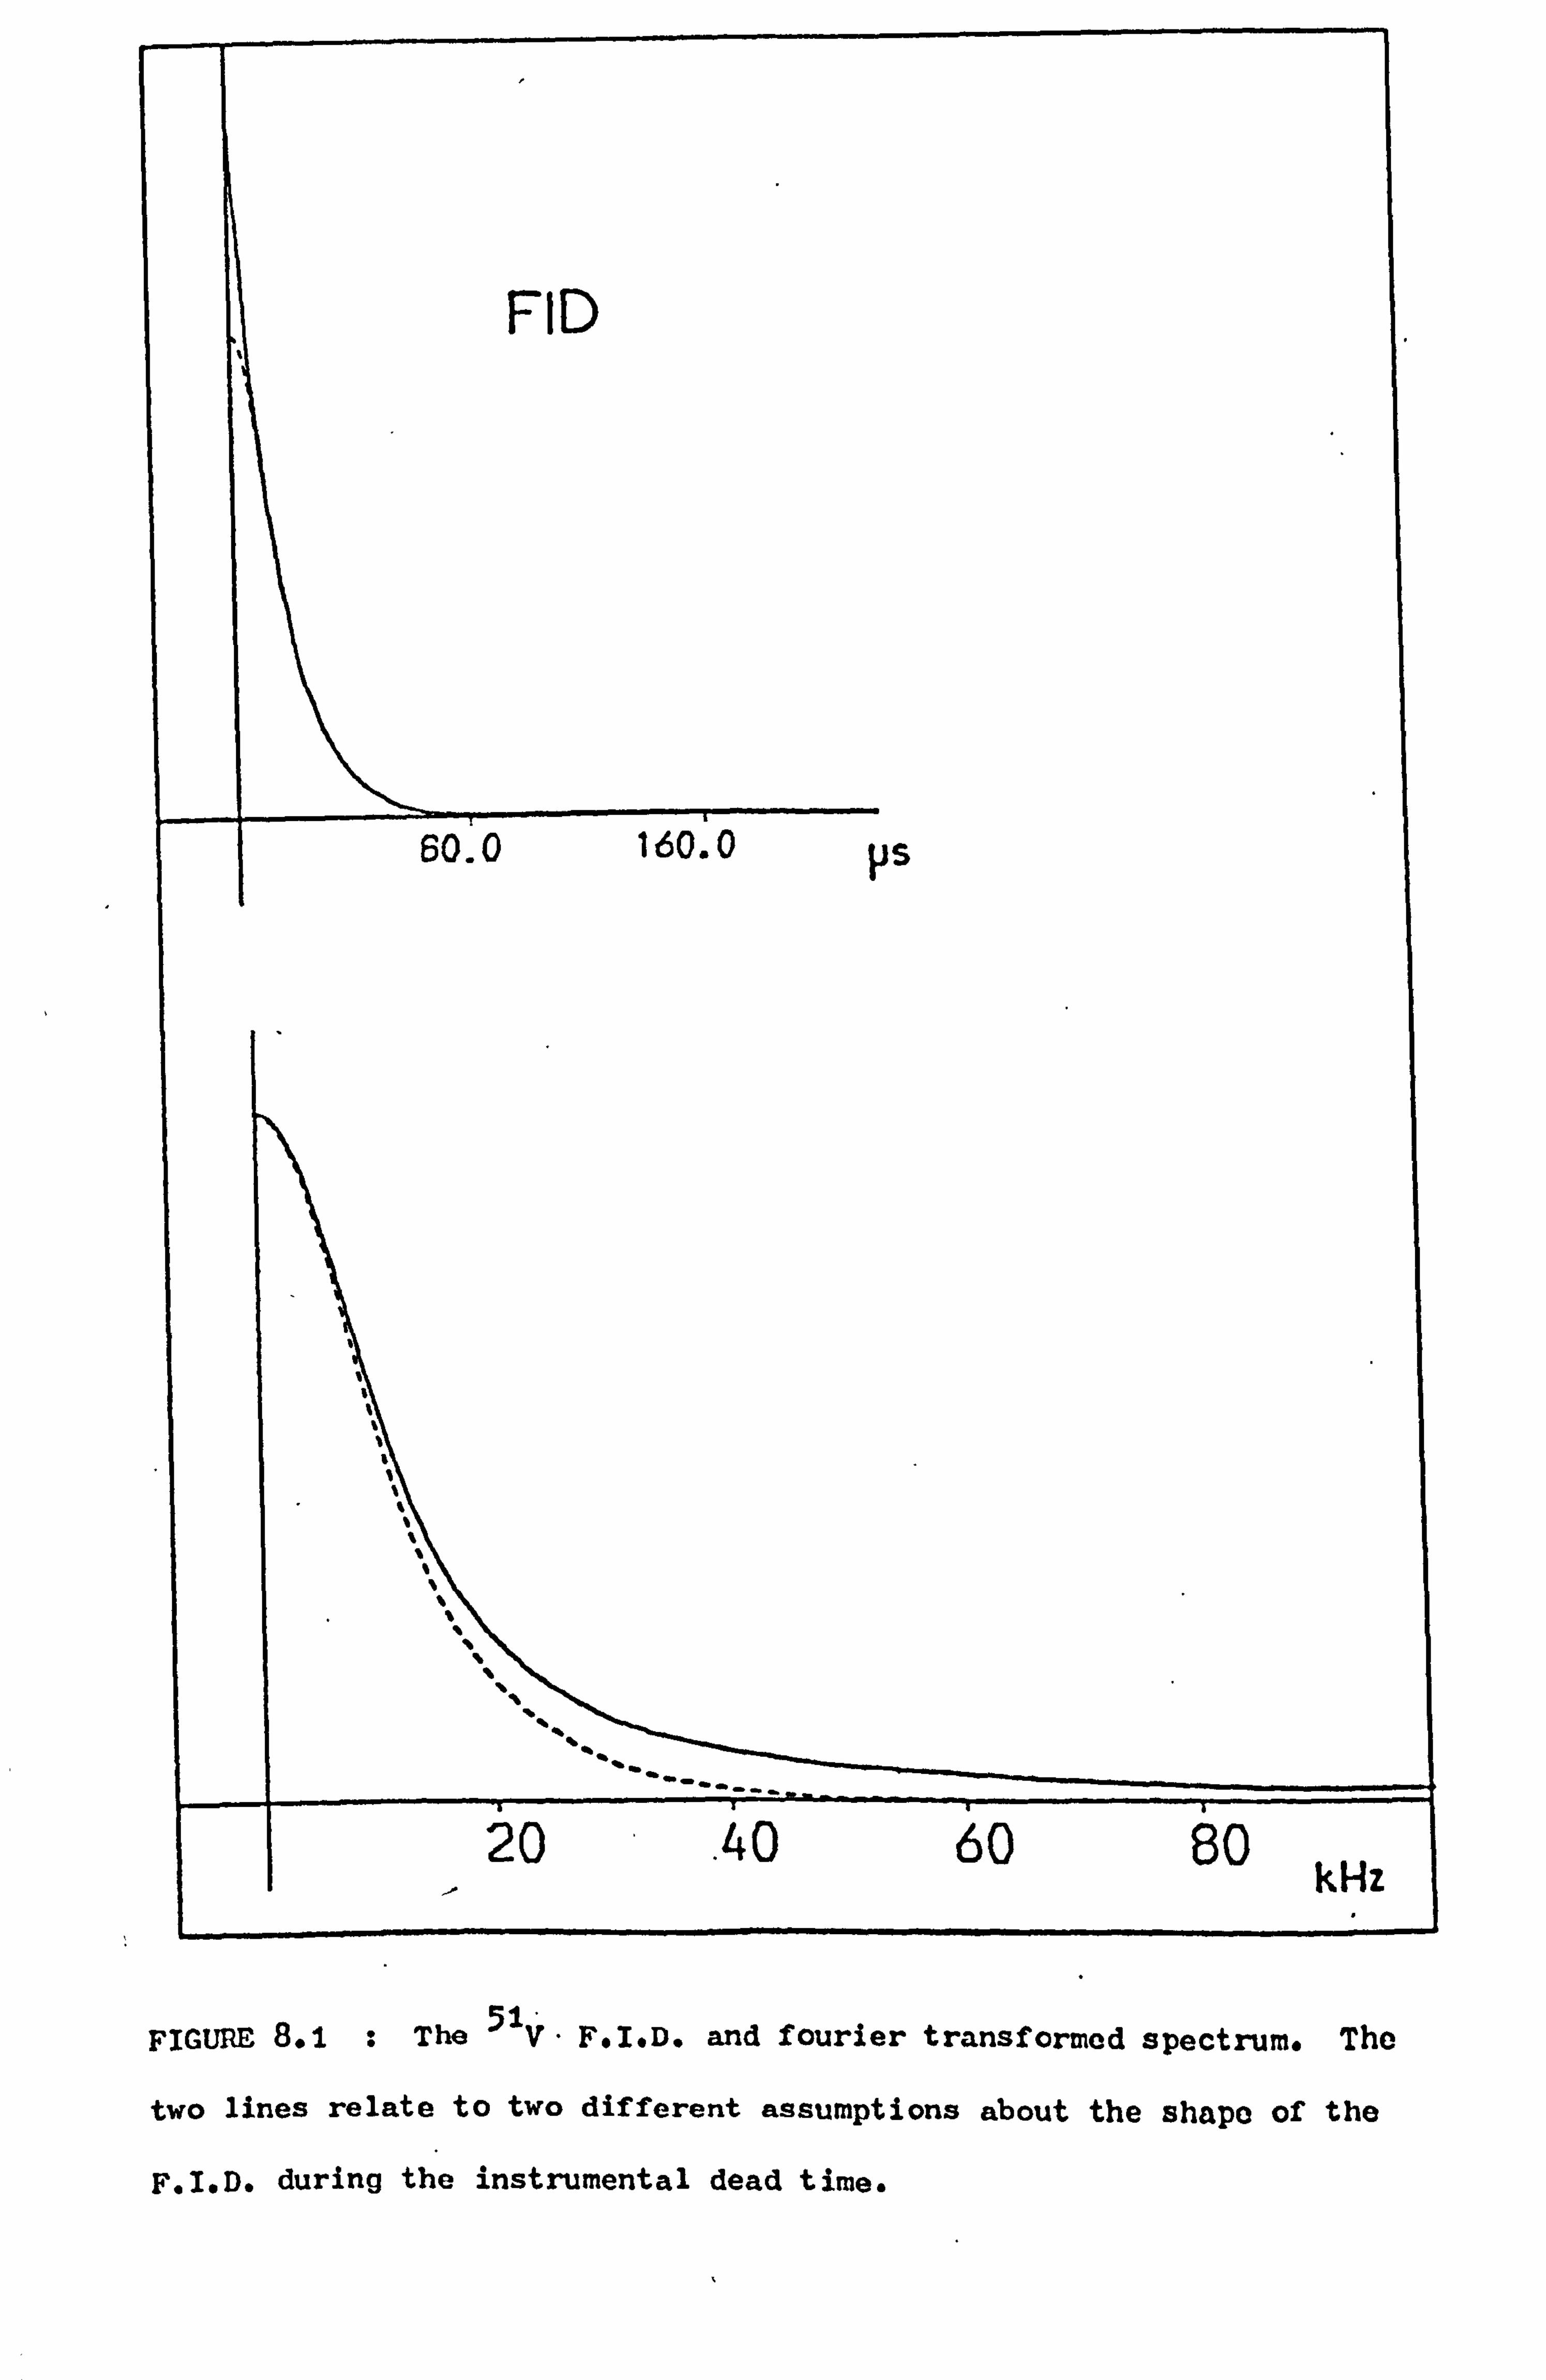
FIGURE 8.1 : The 51V-
F. I. D. and fourier transformed spectrum. The
two lines relate to two different assumptions about the shape of the
F. I. D. during the instrumental dead time.
- 109 -
in the same way to the precise determination of the 51V
Knight
shift. The detected FIDs (and hence the absorption spectra)
of the vanadium sample slugs were found to be largely unaffected
by magic angle rotation at speeds up to 4.5 kHz. However an
estimate of the Knight shift was made by exchanging the metal and
reference sample in the regular Bruker probe. In the frequency
domain the resonance frequency is defined quite accurately by the
Lorentzian type centre of the absorption lineshape. This accur-
acy was similarly apparent in the time domain where the large
signal intensity and short T1 enabled the null position to be set
to ±60 Hz. 0
There is no obvious reference compound that should be used in
the measurement of the 51V
Knight shift. In the past, values have
been quoted with respect to Nb(VO 3)2 (120),
KVO 3 (121),
VOC1 3 (122)
and NaVO3 (123)
and vanadium dissolved in nitric acid ý124).
VOC13
was ruled out as a possible reference compound, because chemical
shift measurements have shown that the 51V
resonance in VOC13 is
shifted paramagnetically compared to most other observable vanadium (125)
compounds. For this work sodium metavanadate was chosen in
preference to potassium metavanadate and lead metavanadate because
of its greater solubility in water. Thus the Knight shift of the
powdered metal was measured against a saturated solution of NaVO3
in distilled water. The value obtained at a room temperature of
298 K was 5755 ±5 ppm, where the error refers to the uncertainty
in setting the null position of the metal and reference solution.
This result is to be compared with the value of 5805 ± 10 ppm
recorded by Drain (123)
at a similar temperature. Vanadium has a
large magnetic susceptibility so the discrepancy between these two
- 110 -
figures may arise partly from a bulk susceptibility correction due
to the geometry of the samples used in each case. However a calc-
ulation similar to that performed for aluminium in Section 7.2.3(c)
puts the possible contribution to the experimental Knight shift
measured here of no more than 5 ppm. Certainly there was no measur-
able difference in the resonance frequencies of 51V in the loose
powder specimens and the solid araldite slugs.
8.3 NIOBIUM
99.9% pure niobium powder with a particle size of less than
40 dun was obtained from Metals Research Limited. The static measure-
ments were recorded on specimens of the loosely packed unannealed
powder at room temperature using a resonant frequency of 15 MHz.
The spin-lattice relaxation time was measured using a 90-T-90
pulse sequence, but the recovery envelope was not found to obey a
simple exponential relationship. A large proportion of the magnet-
ization recovered in a few microseconds, but a slow component had a
time constant of about 1.1 ms. This form of recovery indicates
that there was a significant second-order quadrupole broadening
present in the powder specimens, a result which is in agreement with
that recorded by Butterworth in similar y powdered metal samples.
The FIDs recorded from these samples were found to be almost
exponential with a time constant of 11.5 ± 1.5 is. This value is
considerably shorter than that found by Butterworth from a pure foil
sample, but is consistent with his measured T2 values from powdered (127)
specimens and the large variation in linewidths reported elsewhere.
The width of the Lorentzian lineshape defined by the exponential decay
of the transverse magnetization is given by
-111-
Qv == 28 kHz , 2
which is slightly larger than the width of the vanadium resonance
line. That the origin of this large linewidth was mainly quadrup-
olar in origin was made evident by the large quadrupolar echoes
observed following for example a 90-T-35 pulse sequence (118,119)ý
As expected, rapid sample rotation about the magic angle at speeds
of around 5 kHz failed to have any effect upon the nuclear lineshape.
There are very few compounds of niobium which can be observed
by NMR. The niobium Knight shift has been measured previously
with respect to Nb205 dissolved in hydrofluoric acid. However in
our work the Knight shift was determined against a solution of
NbC15 in pure acetone. The solution is light yellow upon the
NbC15 first being introduced, but later turns brown and produces
a brown precipitate. Although the 93Nb
resonance observed during
this time varies considerably both in frequency and in T2, after
several hours it becomes constant. The Knight shift value obtained
by direct substitution of the reference and metal samples into
the Bruker coil was 0.768 ± 0.0087. Values quoted in the literat-
ure with respect to Nb205 in HF are 0.85(120) and 0.875%(127) . In
view of the unknown nature of the reference compounds, the discrep-
ancy is not meaningful.
The large experimental Knight shifts measured for both vanadium
and niobium have been explained'in terms of a large orbital contrib-
ution to the hyperfine coupling in these two metals(123).
- 112 -
8.4 CADMIUM
8.4.1 INTRODUCTION TO THE MEASUREMENTS
Cadmium has two magnetic isotopes 111 Cd and
113 Cd which
have natural abundances of 12.86% and 12.34% respectively. Both
isotopes have spin I so, although cadmium metal has a hexagonal
ctystal structure, the nuclear resonance spectra are unaffected by
electric field gradients caused by the deviation from cubic symmetry.
At high magnetic fields the main source of broadening in powdered
specimens arises from the anisotropic Knight shift interaction due
to the non-s-character of the conduction electrons. Because of
the asymmetry of the nuclear lineshapes, there exists some uncert-
ainty in defining the exact centre frequency and hence the isotropic
Knight shift. Rapid sample rotation about the magic axis removes
this anisotropy and narrows the lineshape, thus enabling the centre
frequency to be determined accurately. Under the condition of a
sufficiently rapid rotation rate the residual central spectrum is
determined by the isotropic part of the indirect exchange interact-
ion between nuclear spins and by lifetime broadening. Typical
spectra of static and rotated cadmium powder are shown in Figure 8.2.
The NMR sensitivity of both the 111Cd
and 113Cd
resonances in
cadmium metal is less than a thousandth of that of aluminium. Although
the anisotropic broadening of the nuclear lineshapes is greater at
higher magnetic fields, the signal to noise ratio of the detected
signals is significantly improved by the use of higher rf frequencies.
Consequently measurements were undertaken employing as high an applied
magnetic field as could reasonably be achieved with the M12 electro-
magnet. The powdered metal samples used in this work were obtained
- 113 -
from Cerac Inc. (USA). The stated purity was 99.999% and the
particle size was less than 40 um, as compared to the value of
the skin depth at 13MHz of 30 Um.
8.4.2 KNIGHT SHIFT DETERMINATIONS
Previous room temperature estimates of the isotropic
Knight shift of cadmium metal as performed against aqueous solut-
ions of cadmium chloride and cadmium nitrate have yielded values
in the range 0.39-0.43%(120,129-134). Recently however it has been
shown (135)
that there exists a considerable range of chemical shifts
between the cadmium resonances from different aqueous solutions of
cadmium salts. These chemical shifts vary not only between the
different salts but also between different concentrations of the
same salt. The measured Knight shift depends therefore upon the
particular reference sample chosen.
The Knight shift of both isotopes was measured here using the
double rotor box described in Section 5.4. Rotors containing the
solid powder slugs were spun at speeds up to 4.5 kHz in a magnetic
field of 1.45 T. By employing the DL 102 signal averager the ref-
erence frequency and phase of the PSD could be adjusted so as to
measure the resonance frequency of the metal to an accuracy of ±20 Hz.
Preliminary measurements were performed against saturated solutions
of CdC12. The signal strengths were extremely poor so in order to
shorten the spin-lattice relaxation time the salt was dissolved in
a 1% molar aqueous solution of MnCI2. Against this reference and
at a temperature of 300 K the Knight shifts for 111Cd and
113Cd were
measured as 4155 ±4 ppm and 4154 ±4 ppm. The errors quoted arise
largely from the uncertainty in defining the centre frequency of the
- 114 -
very weak signals from the reference solution. The resonance freq-
uencies of the CdC12 solutions were found to vary considerably with
the amount of paramagnetic doping. For example, compared to a
saturated solution of CdC12 in 0.2% molar MnC12 the chemical shift
of the reference solution used in the above measurements was about
+15 ppm. Nevertheless the values quoted above illustrate that any
isotopic dependence of the Knight shift is less than 2x 10 3.
A second set of measurements were made against diluted undoped
solutions of Cd(N03)2. The signal intensity was again poor, but,
by pulsing rapidly and transforming the transient signal to the
frequency domain, the resonance frequency could be assessed quite
accurately. Choosing a solution concentration for which the chem-
ical shift is known should in principle enable the measured Knight
shift to be related to the cadmium ion in a vanishingly small dilut-
ion of the salt, i. e. to a single ion in water. Against a concentrat-
ion of solution corresponding to 0.06 moles of Cd in 1 mole of
water the measured Knight shifts at a temperature of 285 ±2K were
4321 ±6 ppm and 4324 ±8 ppm for 111Cd
and 113Cd
respectively.
By employing the experimentally determined value for the fractional
change in Knight shift with pressure(135), acalculation of the rotat-
ionally induced stresses in the metal gives a maximum possible contrib-
ution to the Knight shift of 2 ppm, well within the experimental
error. The effect of the sample bulk susceptibility is negligible
in comparison. The results of . Kruger et a1.
(135) indicate that a
correction factor of -46 ppm could normally be applied to relate the
Knight shift values recorded above to the free ion in solution. How-
ever, this value of the chemical shift was measured at a temperature
of 306 K, so the magnitude of this correction may well be inaccurate
at the somewhat lower temperature of our measurements.
- 115 -
8.4.3 SPIN-LATTICE RELAXATION TIMES
The spin-lattice relaxation times of 111 Cd and
113 Cd were
measured in the spinning and static samples. The results of
1.65 ± 0.15 ms for 111Cd and 1.40 ± 0.10 ms for 113Cd
at a room temp-
erature of 298 K were independent of rotation rate as expected.
The measured T1 for 113Cd is considerably higher than Masuda's rep-
orted room temperature value of 0.5 ms(137), but it is in better
agreement with the figure of approximately 1.2 ms recorded by Dickson(138)
No measurements of the 111Cd
T1 have apparently been reported in the
literature. However the relaxation time measured here is consist-
ent with the lower gyromagnetic ratio of this isotope.
It is of interest to compare the product T1K2T found by experi-
ment with the theoretical value derived from the Korringa relation
given by equation (2.23). In cadmium the direct contact mechanism
arising from the s-type conduction electrons is assumed to dominate
the Knight shift and the spin-lattice interactions. In this event
the scalar R defined thus
RT1KZT = 4'rk (Y 2
Bn
is a measure of electron enhancement of both K and l/T1. At room
temperature the results of Seymour and Styles(133) indicate that the
experimental Knight shift increases by about 4 ppm/°K. The temper-
ature correction acts in the opposite direction to the chemical shift
coxrection, so it is not unreasonable to take the Knight shift of
cadmium at 298 K as 0.43% to a first approximation. Substituting
our experimental values for the illCd
and 113Cd
relaxation times at
- 116 -
this temperature we obtain a mean value for R of 0.65. This fig-
ure is somewhat lower than the value of 0.85 recorded for the solid
state by Dickson. The discrepancy arises out of the higher values
of T1 and K used in our calculation.
We note that Kruger et al. demonstrated that there is quite
considerable shielding of the cadmium ions in aqueous solutions.
Therefore any determination of the absolute value of R is depend-
ent upon the experimental Knight shift being corrected for such
shielding effects in both the metal and the salt.
8.4.4 VARIATION OF LINESHAPE WITH ROTATION SPEED
- Careful lineshapes of the resonances of 111Cd
and 113Cd
nuclei were measured from static samples using the same resonant
frequency of 13.7 MHz. for both isotopes. The anisotropic Knight
shift can be estimated by comparing the experimental lineshape to
the theoretical frequency distribution
8(v) = K[2(v, - vo) + a]-l
given by equation (2.11). Figure 8.3 shows the 113Cd
absorption
curve together with the theoretical powder lineshape predicted by
g(v) setting a equal to 4.4 kHz. The 111 Cd absorption spectrum
was the same as the 113Cd
spectrum to within experimental error and
hence gave an identical value for a. It is usual to define the
anisotropic Knight shift, Kan as
3a Kan ° 2y (a measured in frequency units)
o.
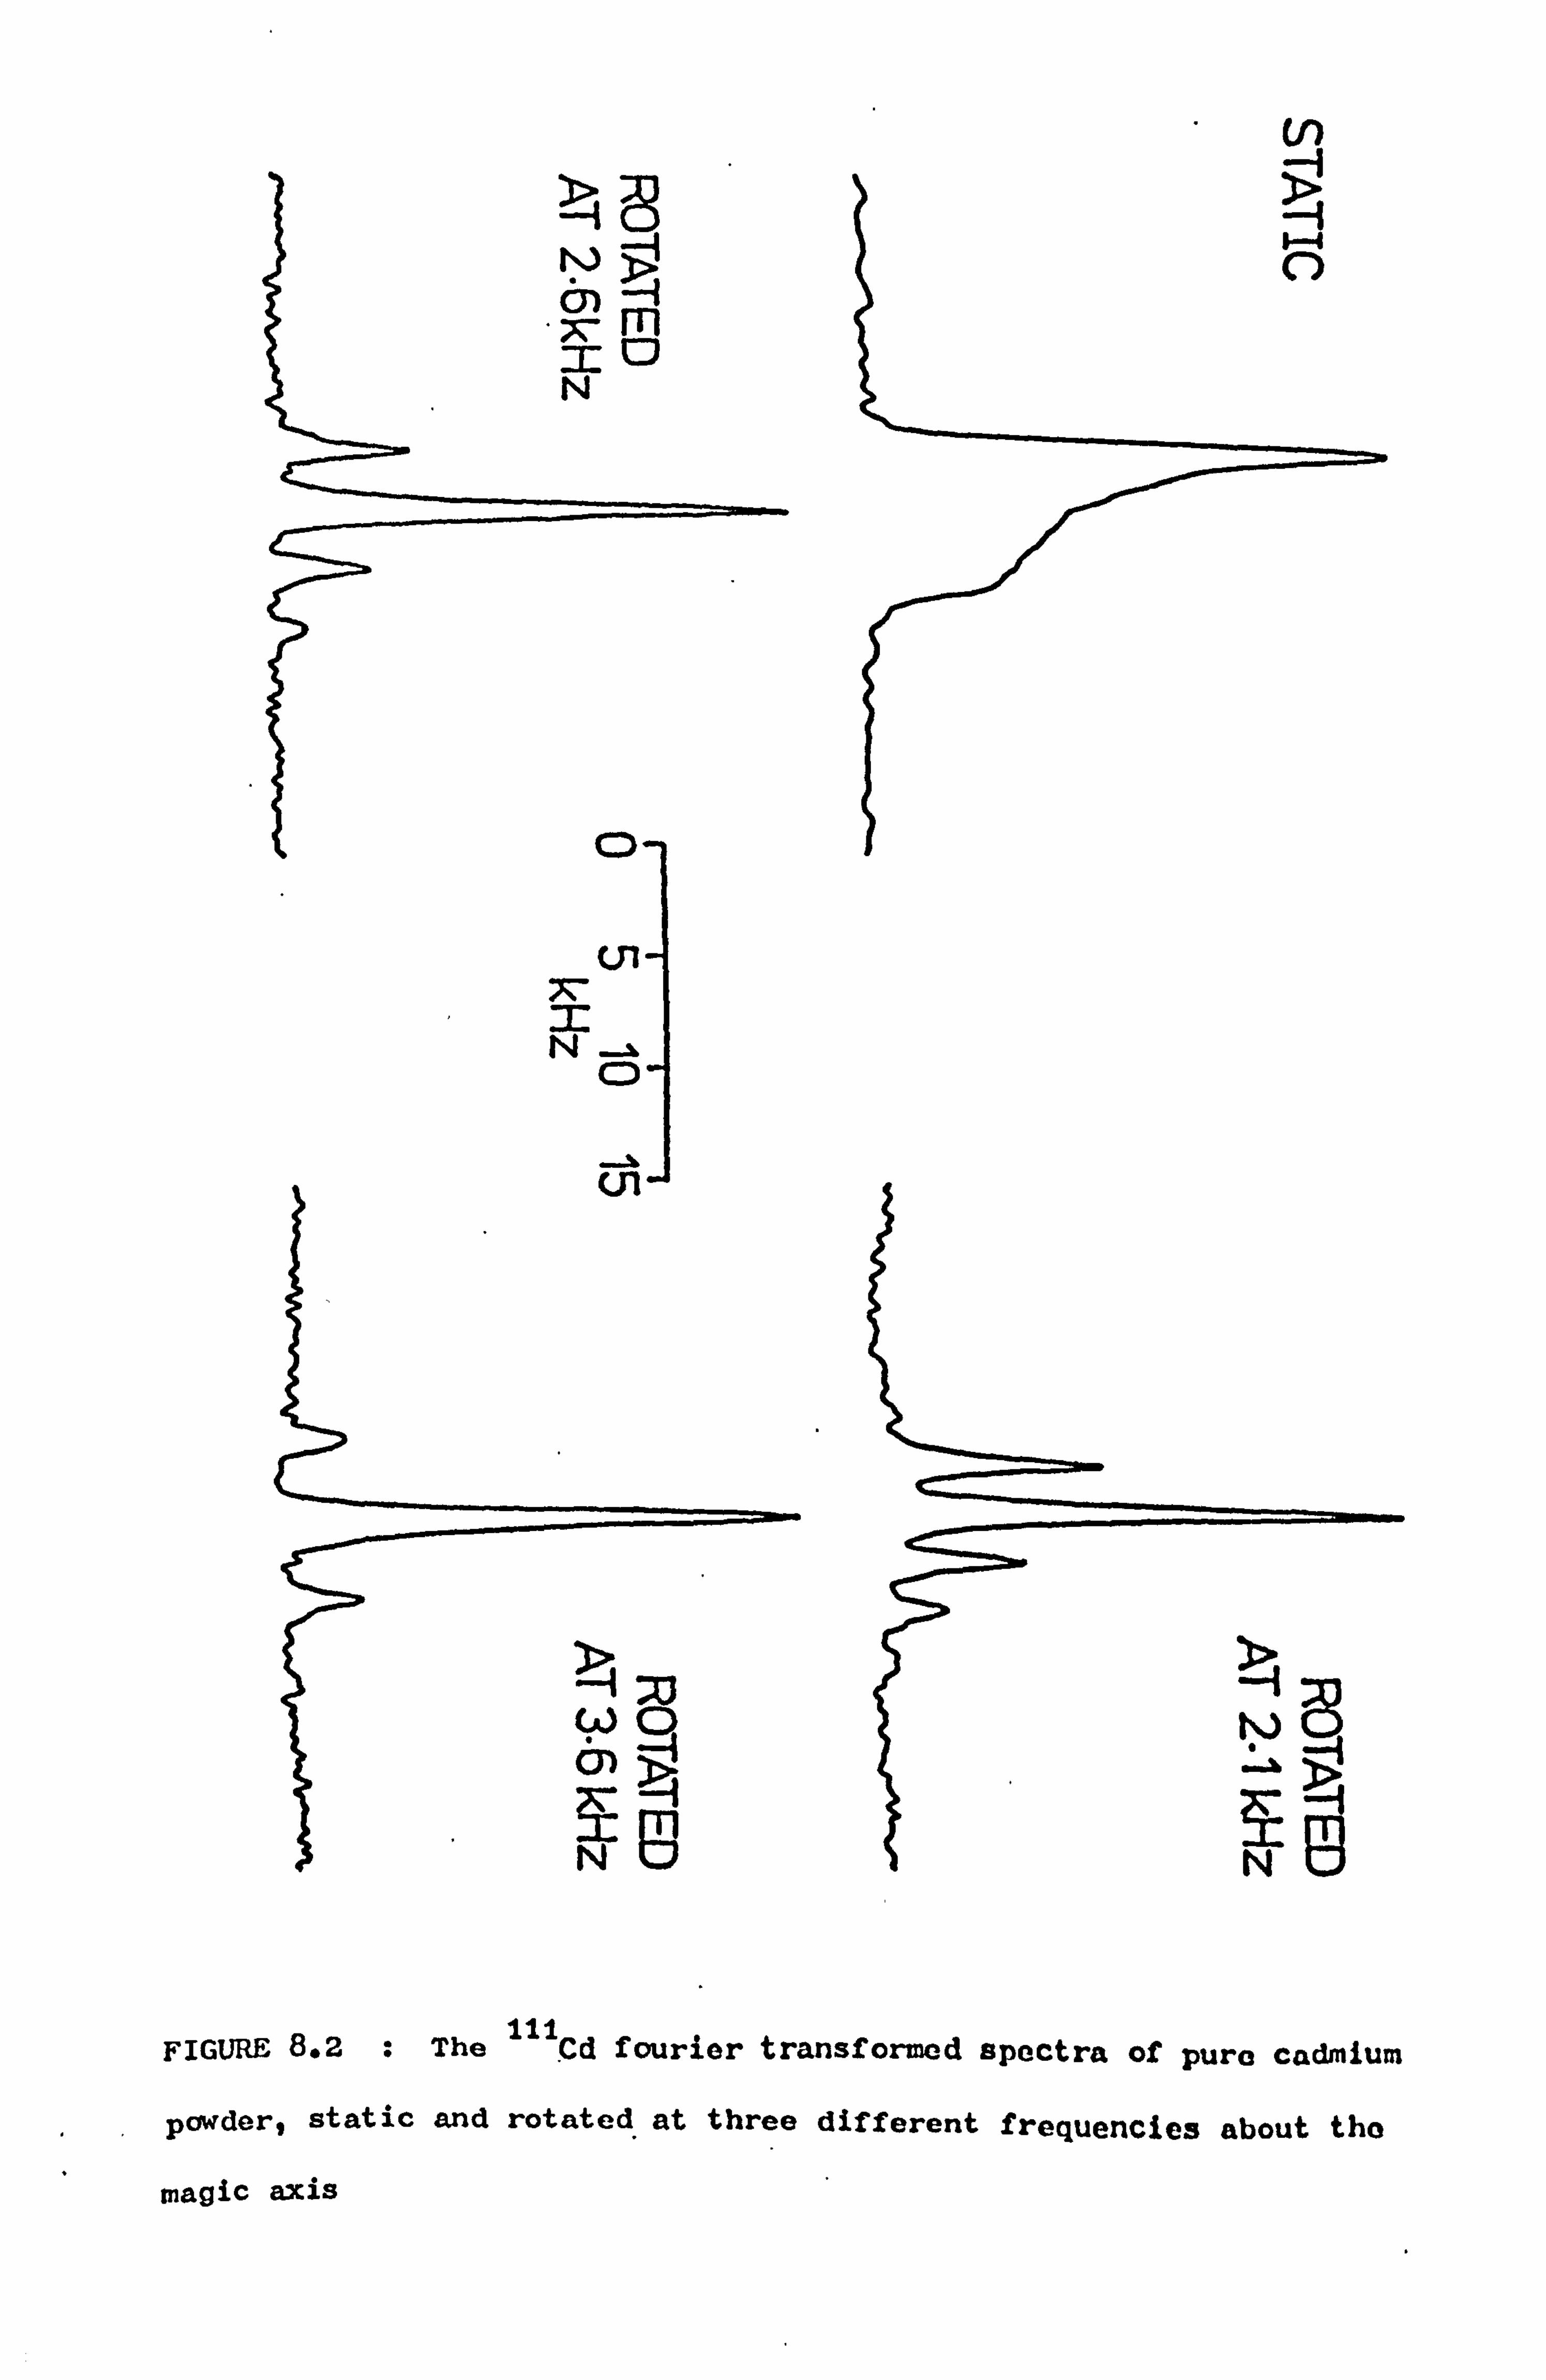
f-fl
tv D Xm =o N
O
Ul- X- z N
O
CJl
w D
ý8
NO =' D
FIGURE 8.2 : The 111Cd fourier transformed spectra of pure cadmium
powder, static and rotated at three different frequencies about the
magic axis
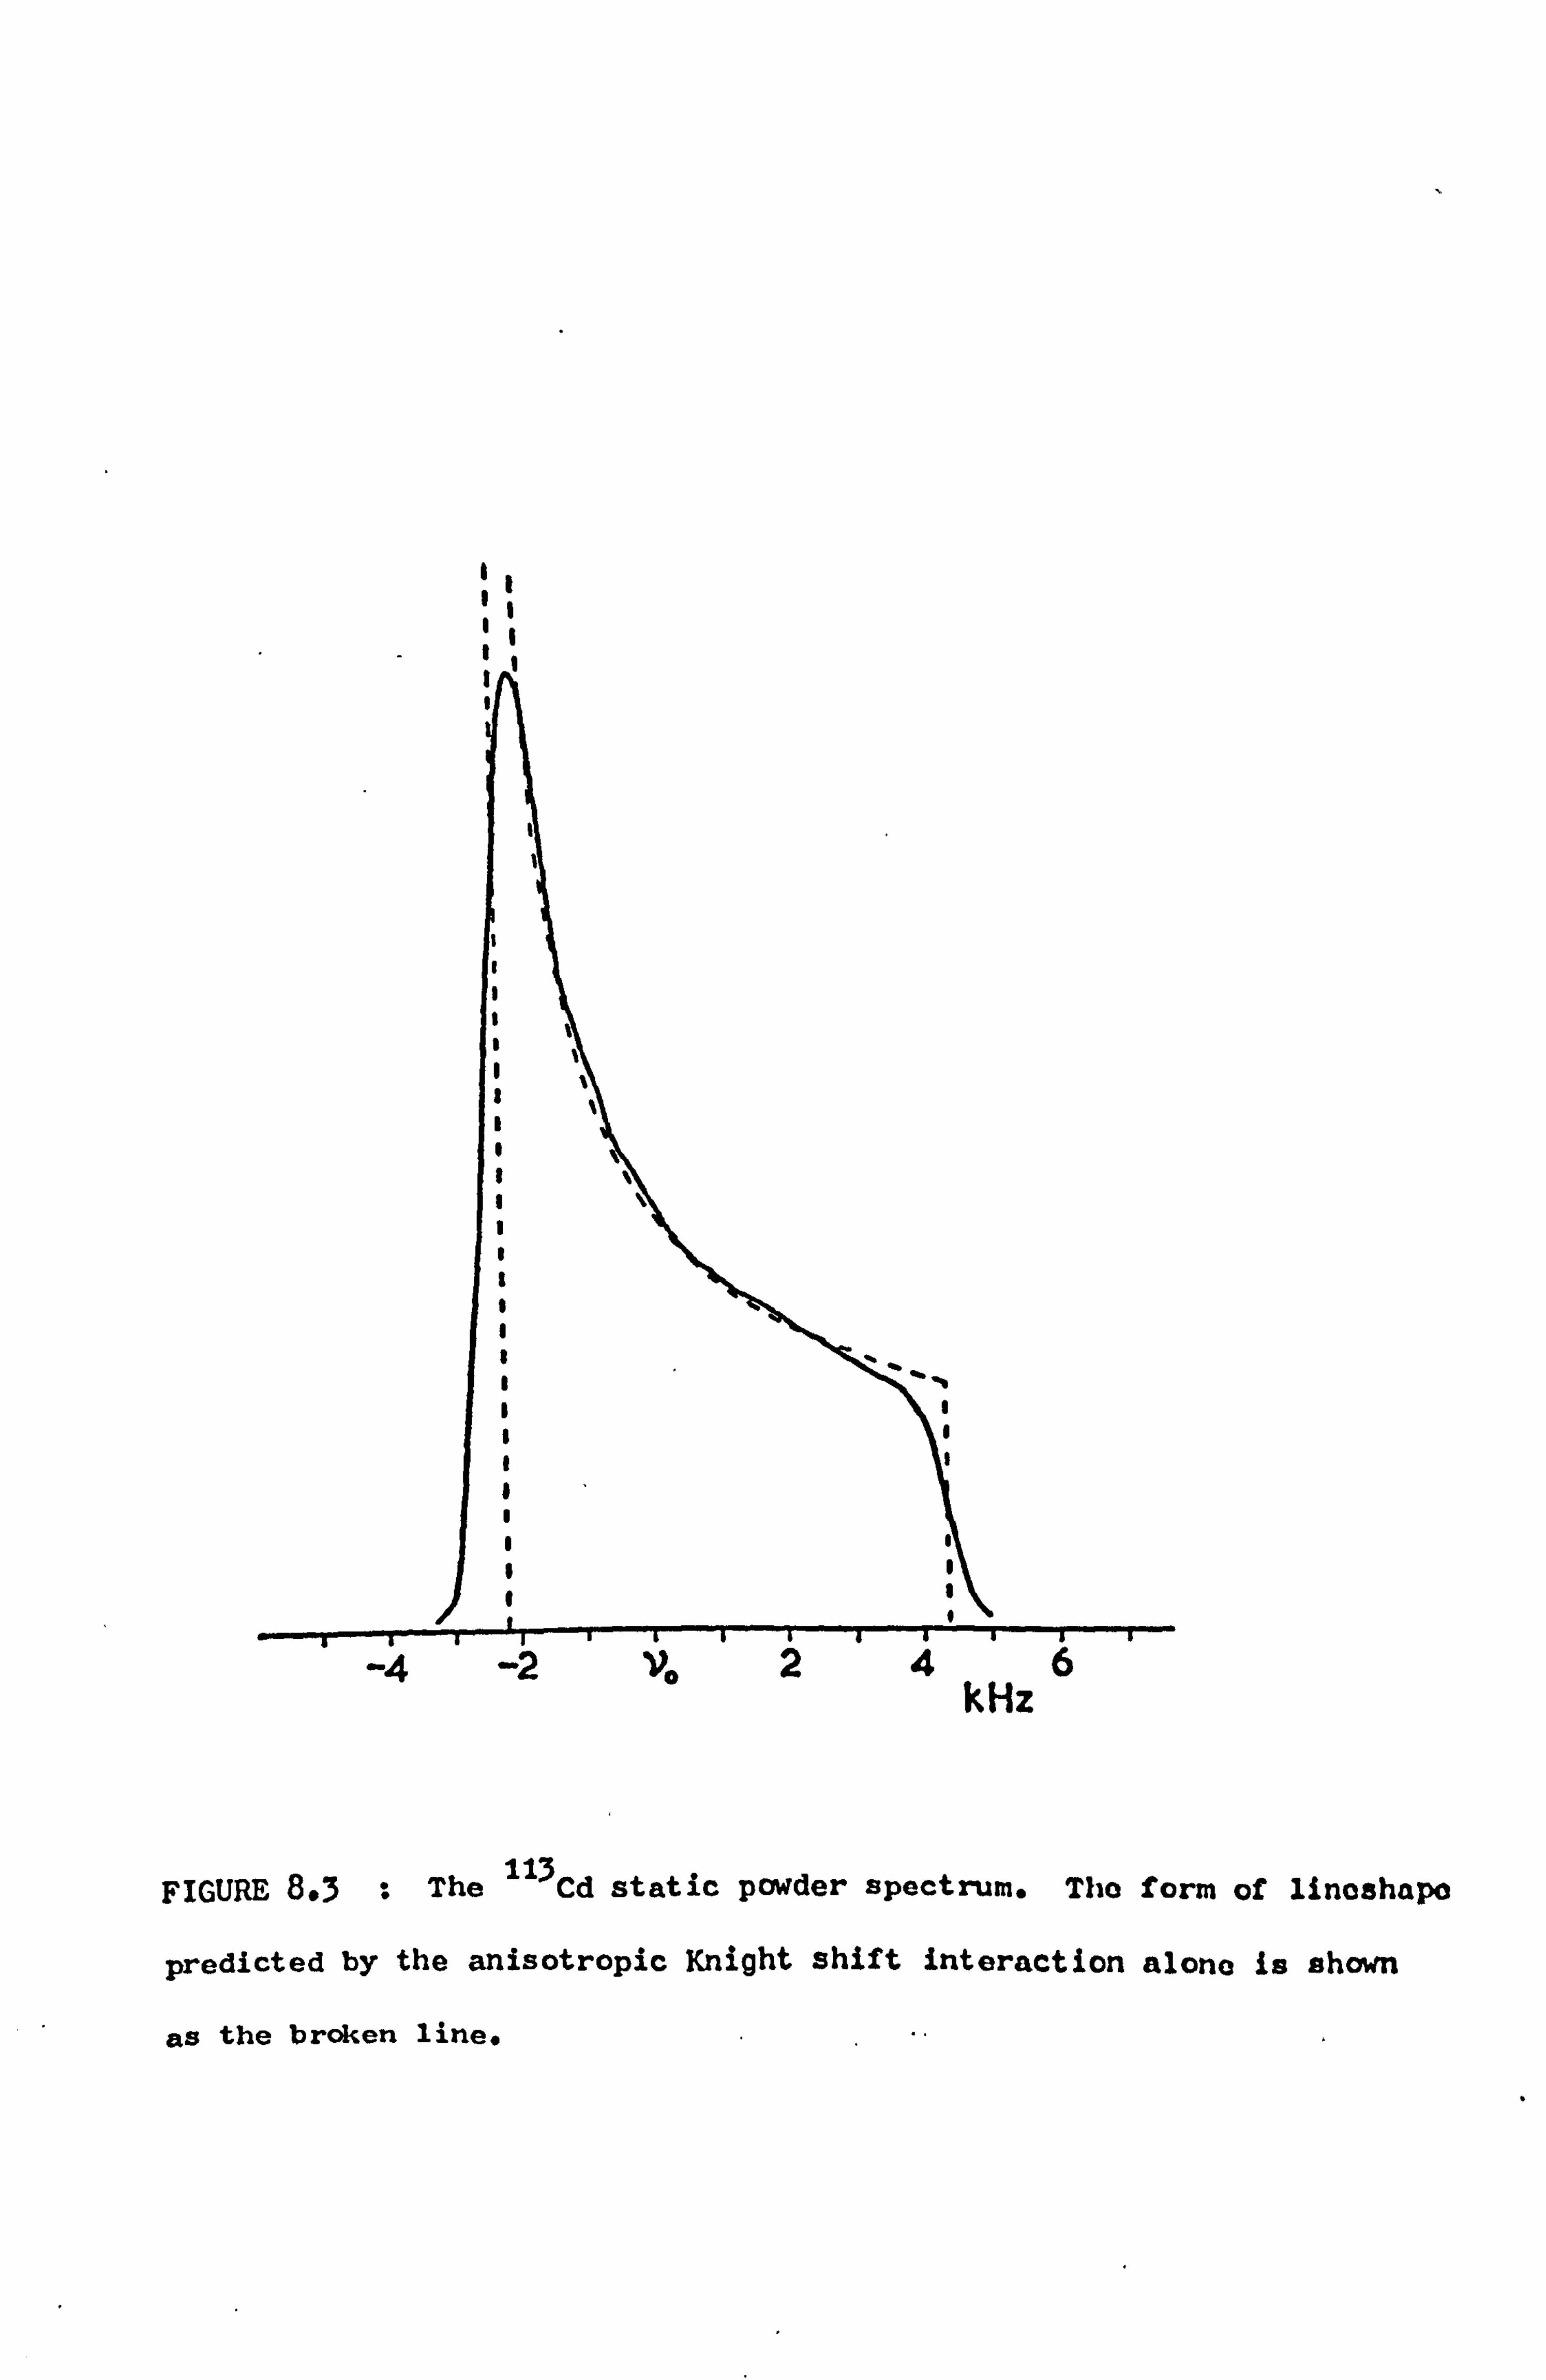
It 11 11
-4 2 Vo 24 kHz
FIGURE 8.3 : The 113Cd
static powder spectrum. The form of linoshapo
predicted by the anisotropic Knight shift interaction alone is shown
as the broken line.
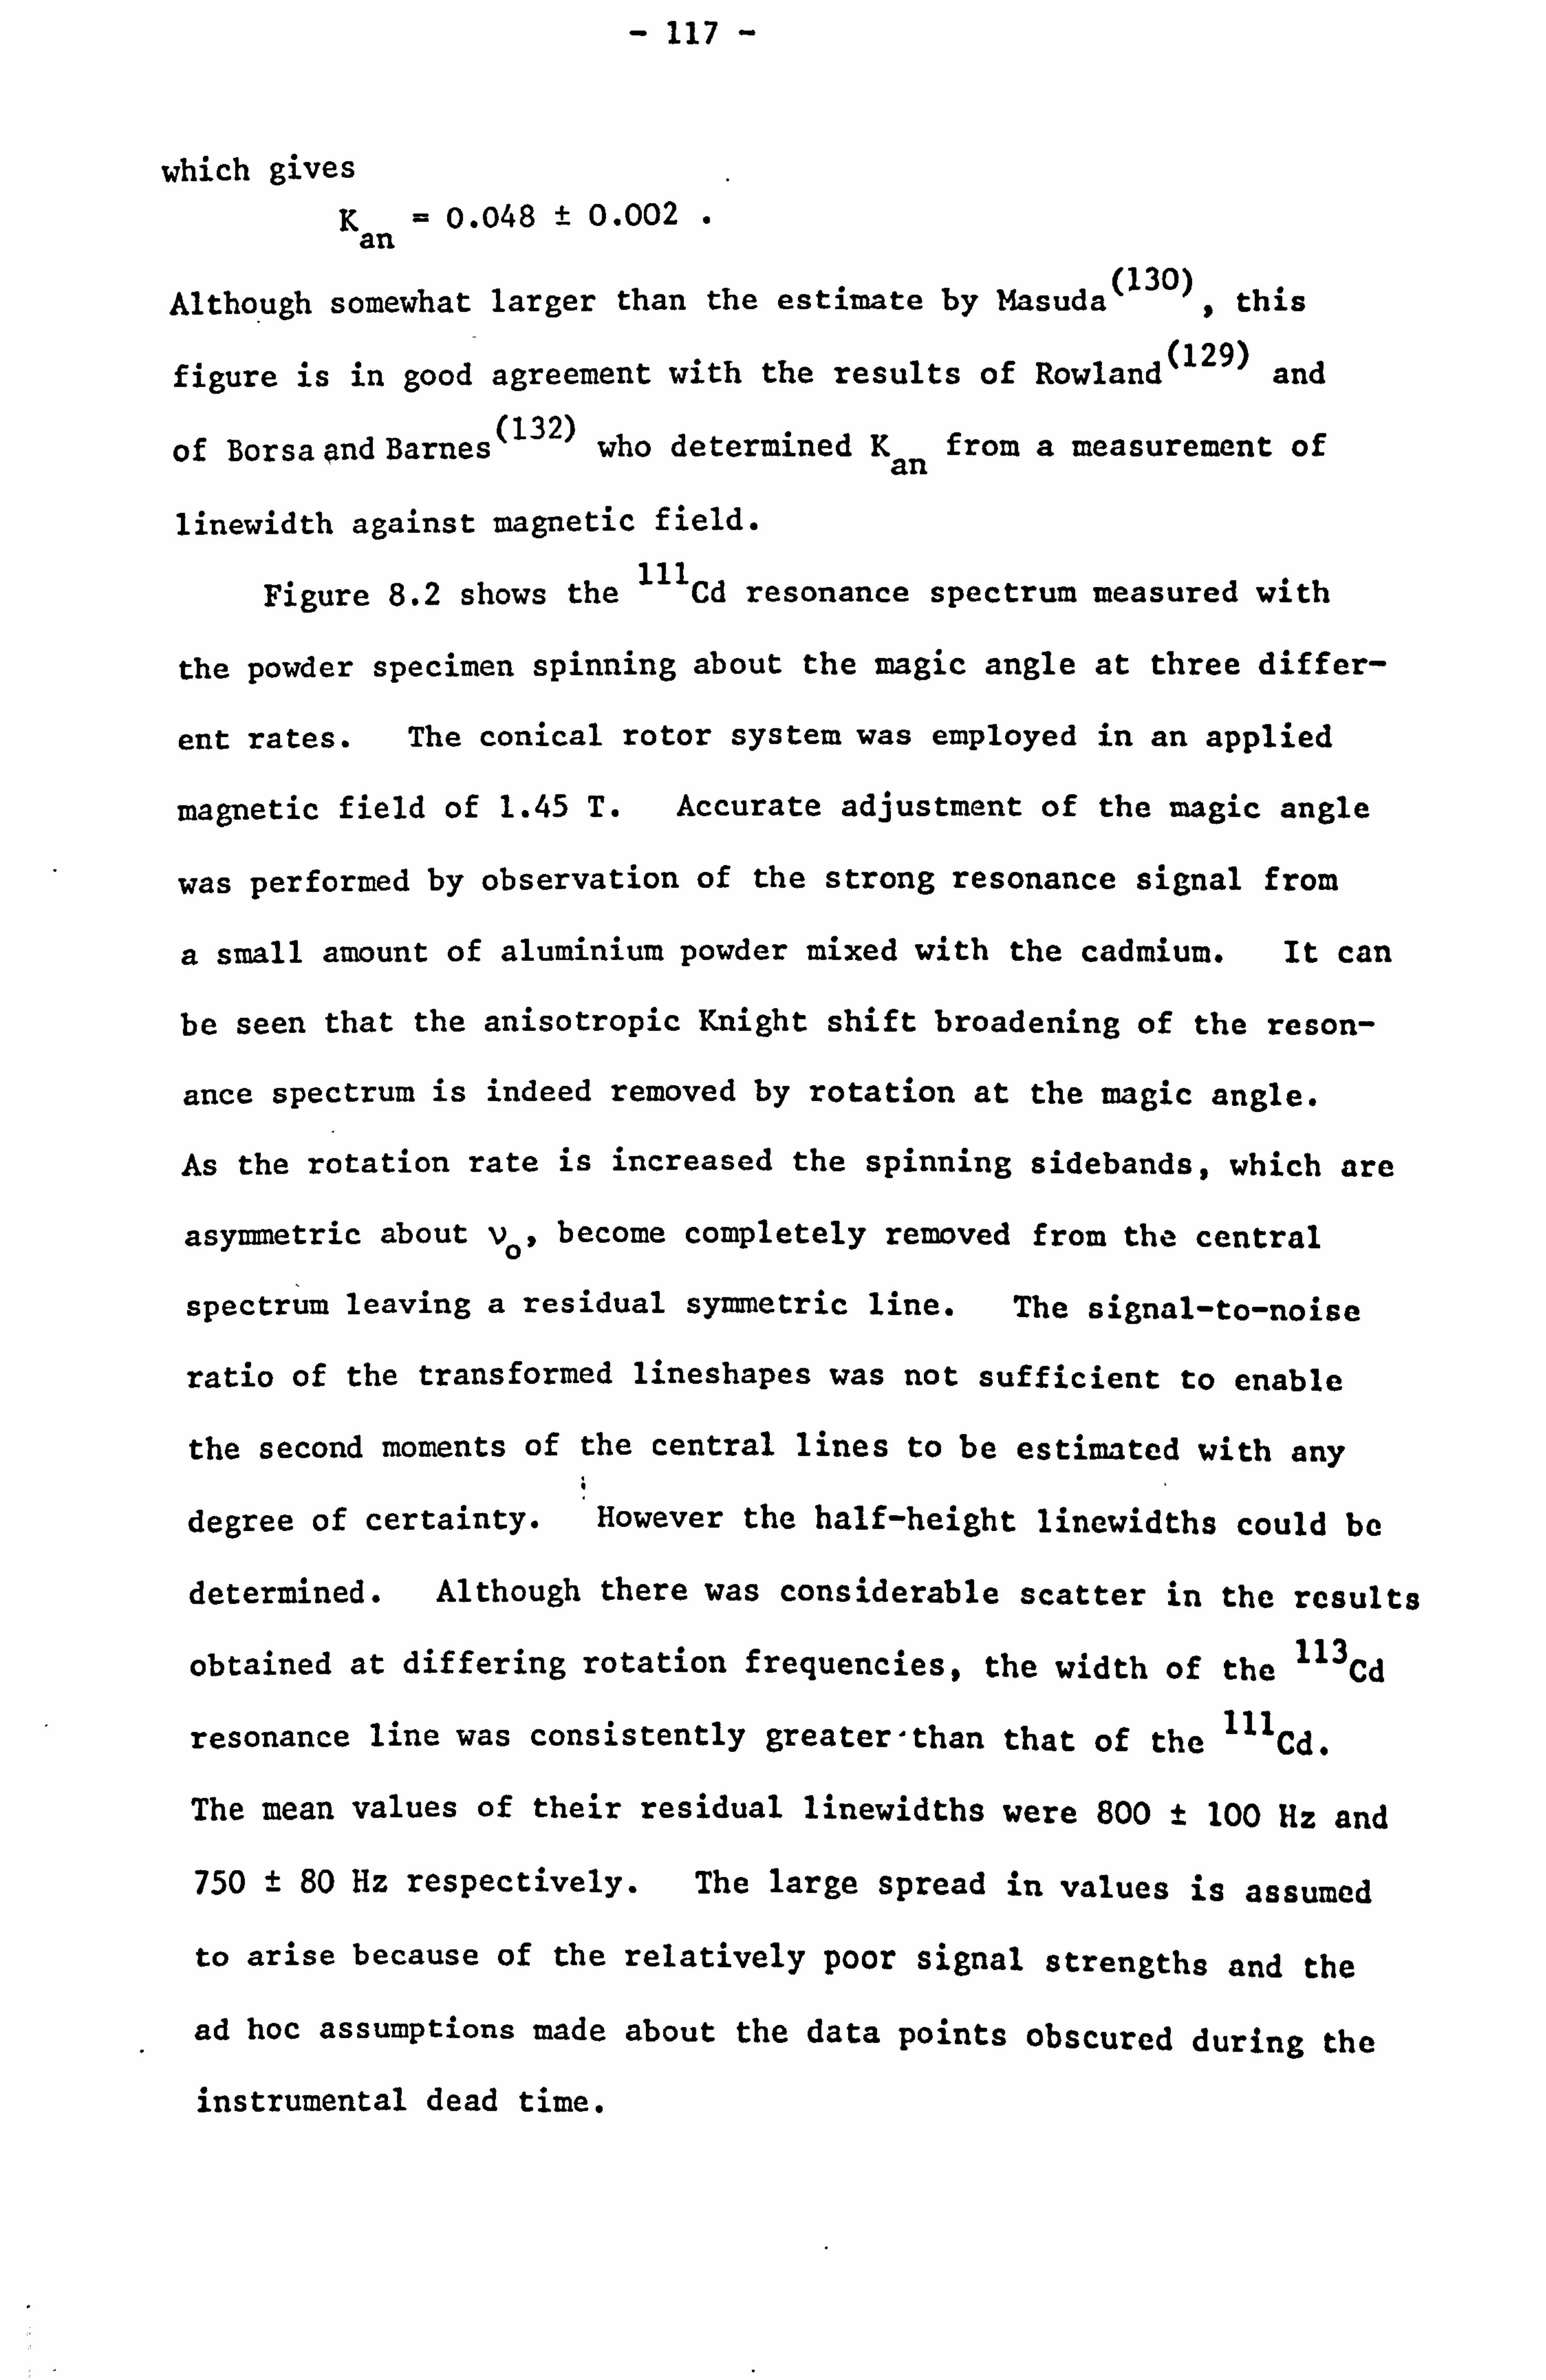
- 117 -
which gives K=0.048 ± 0.002
an
Although somewhat larger than the estimate by Masuda(130), this
figure is in good agreement with the results of Rowland (129)
and
of Borsaand Barnes (132)
who determined Kan from a measurement of
linewidth against magnetic field.
Figure 8.2 shows the 111Cd
resonance spectrum measured with
the powder specimen spinning about the magic angle at three differ-
ent rates. The conical rotor system was employed in an applied
magnetic field of 1.45 T. Accurate adjustment of the magic angle
was performed by observation of the strong resonance signal from
a small amount of aluminium powder mixed with the cadmium. It can
be seen that the anisotropic Knight shift broadening of the reson-
ance spectrum is indeed removed by rotation at the magic angle.
As the rotation rate is increased the spinning sidebands, which are
asymmetric about v0, become completely removed from the central
spectrum leaving a residual symmetric line. The signal-to-noise
ratio of the transformed lineshapes was not sufficient to enable
the second moments of the central lines to be estimated with any
degree of certainty. However the half-height linewidths could be
determined. Although there was considerable scatter in the results
obtained at differing rotation frequencies, the width of the 113Cd
resonance line was consistently greater than that of the 111Cd.
The mean values of their residual linewidths were 800 t 100 Hz and
750 ± 80 Hz respectively. The large spread in values is assumed
to arise because of the relatively poor signal strengths and the
ad hoc assumptions made about the data points obscured during the
instrumental dead time.
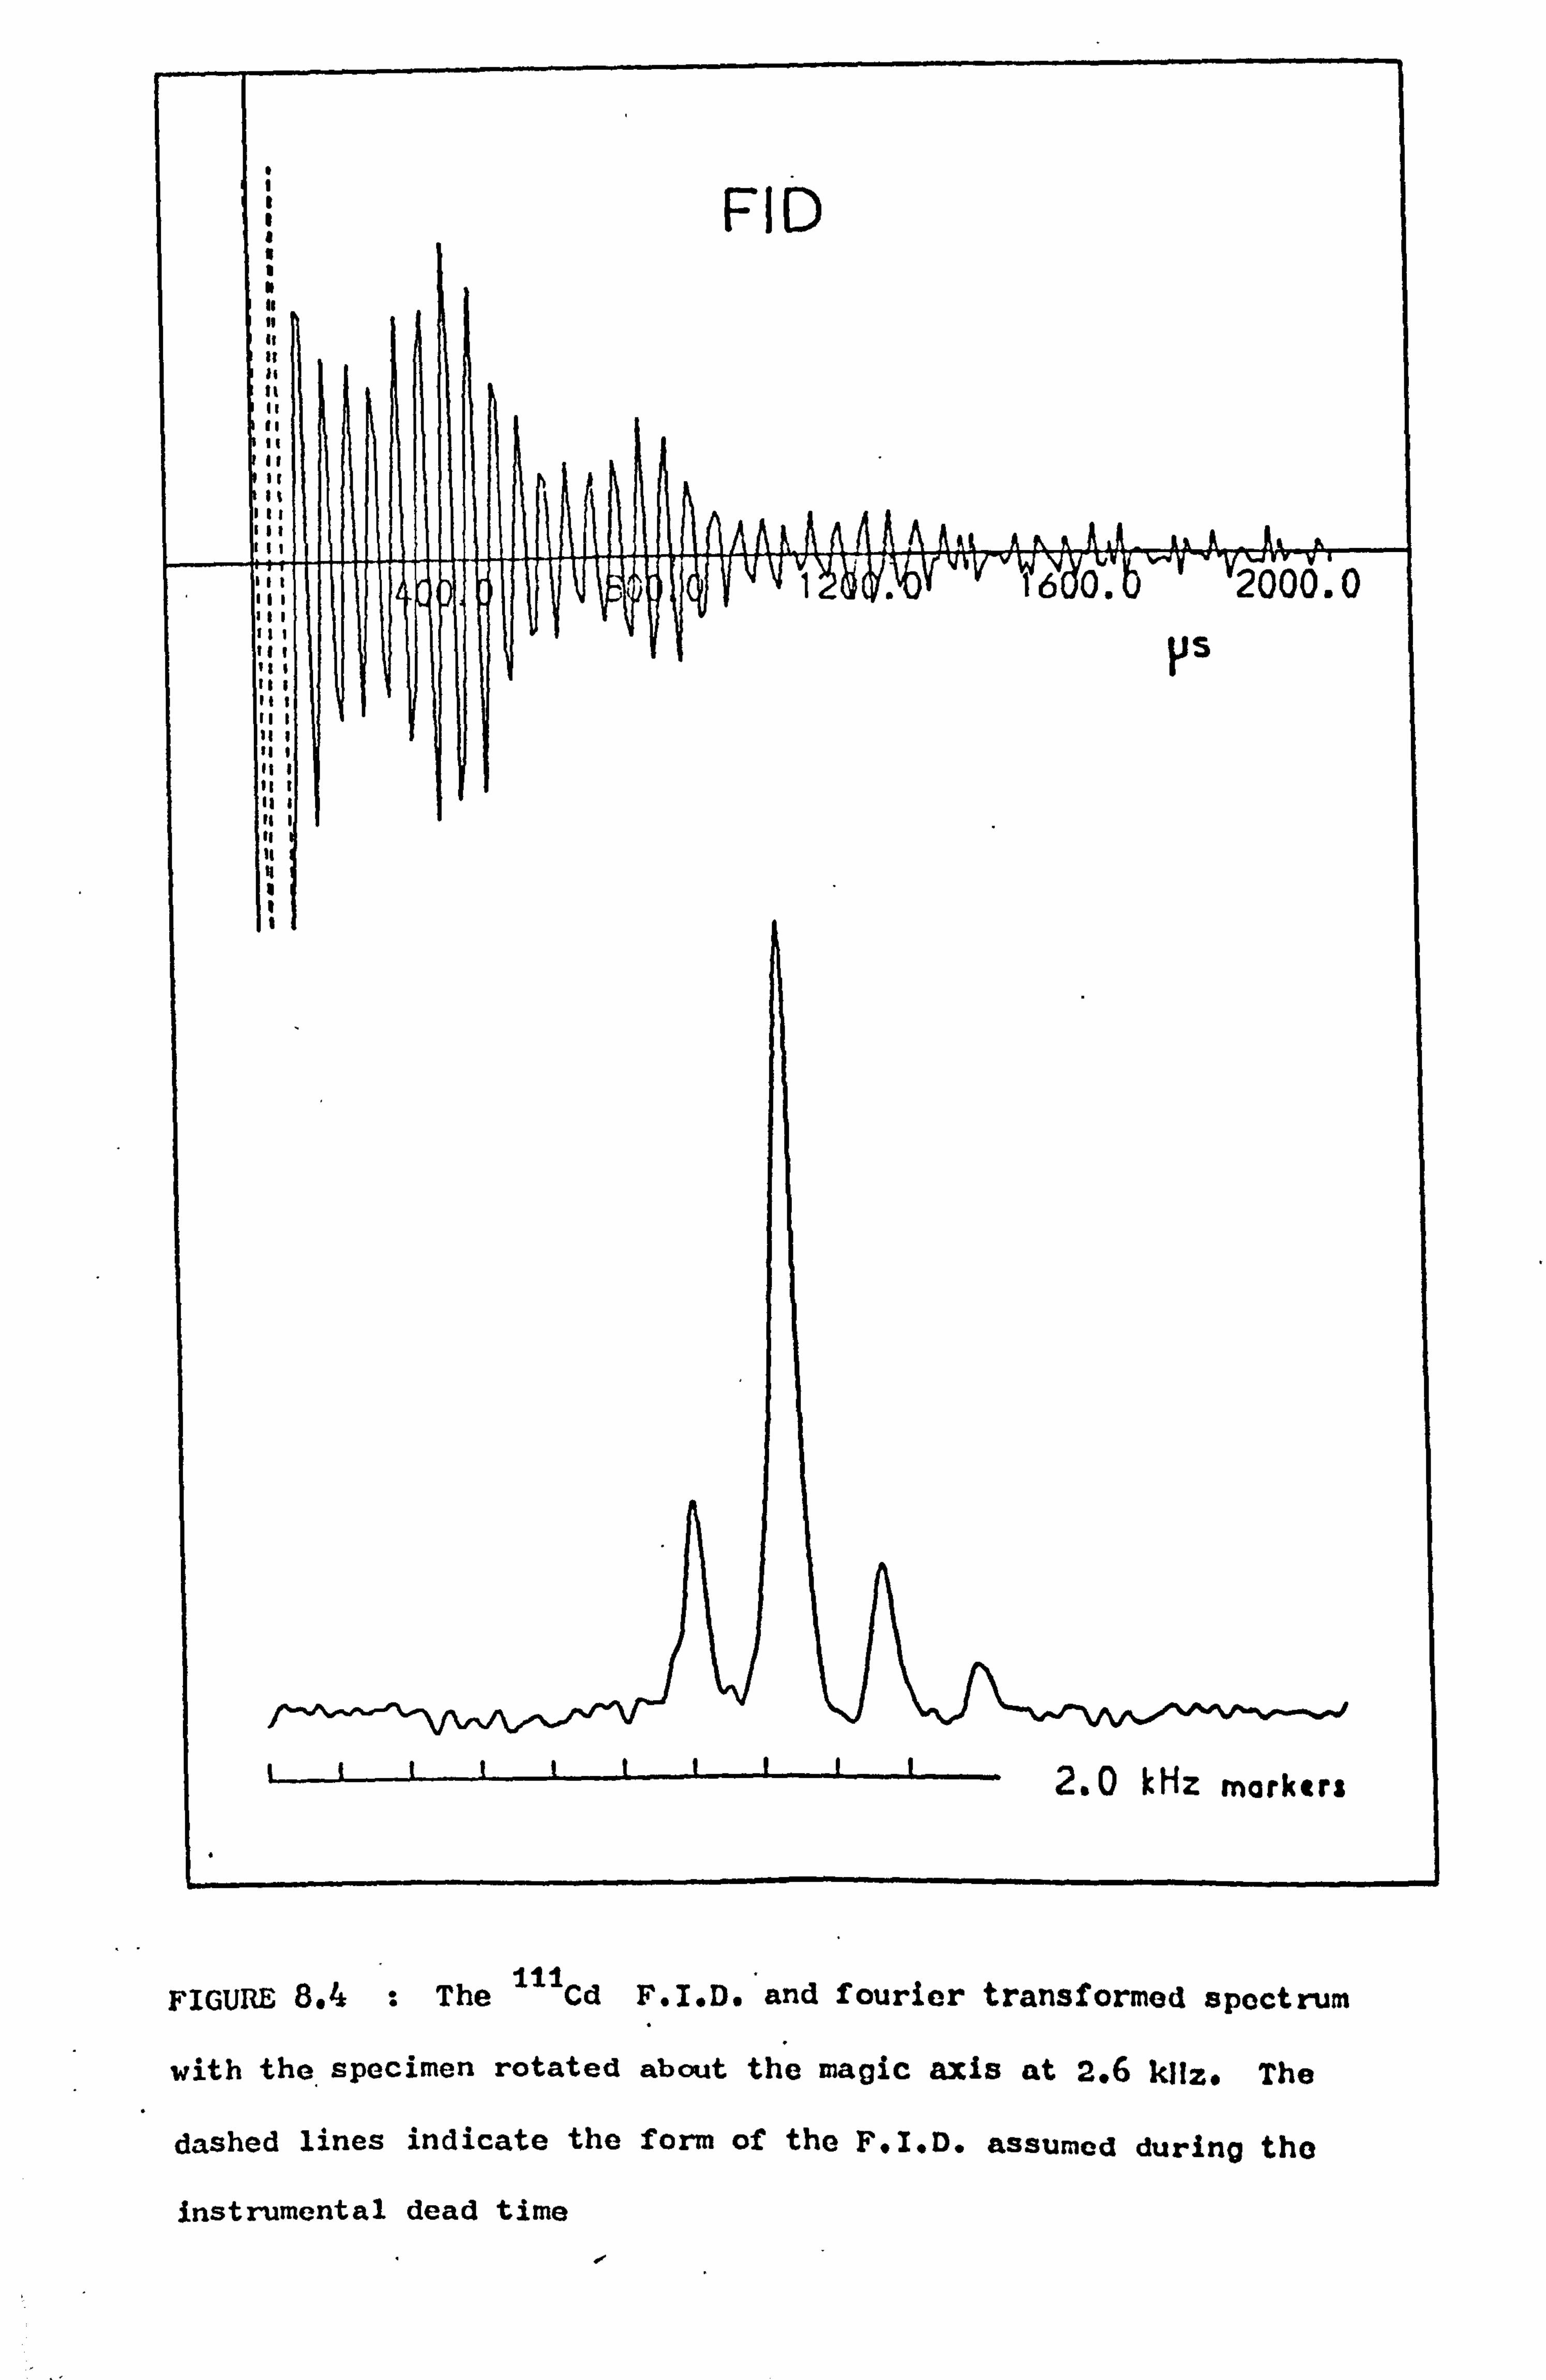
FIGURE 8.4 : The IIICd F. I. D. and fourier transformed spectrum
with the specimen rotated about the magic axis at 2.6 k11z. The
dashed lines indicate the form of the F. I. D. assumed during the
instrumental dead time
.1
- 118 -
Lifetime broadening alone gives rise to a Lorentzian line-
shape in the frequency domain with a width at half-height of 1/'nT1.
Assuming that the lifetime contribution to the total width of the
residual spectrum can be separated by a simple subtraction, then
upon substituting the values for T1 recorded previously the secular
broadening of the central line becomes about 560 Hz for both iso-
topes. The above value includes a contribution from the inhomo-
geneity of the magnetic field but this was estimated to be negigible
(< 20 Hz) in comparison. Consequently the figure quoted represents
a measure of the electron coupled scalar interaction between the
cadmium nuclei. The equivalence of the linewidth for the two iso-
topes simply reflects their almost equal natural abundancies.
At room temperature the relaxation times of both isotopes are of
approximately the same magnitude as the inverse of the first and
second nearest neighbour exchange coupled constants as determined
(139) by Alloul and Deltour. This leads to the possibility that
the isotropic magnetic exchange interaction may be time averaged by
lifetime fluctuations in the nuclear spin states. Any detailed
calculation of the Rudermann-Kittel(14) indirect exchange interact-
ion is precluded by an incomplete knowledge of the effect of these
fluctuations as well as by the preliminary nature of the results.
Consequently we content ourselves with making a simple comparison
of our results to those obtained by Alloul and Deltour from observat-
ion of the modulated structure of the spin echoes of the 113Cd
reson-
ance in cadmium based alloys. Their experiment was undertaken at
liquid helium temperatures, in which region T1 contributions to the
lineshapes are negligible. The exchange coupling constants, J1
and J2, between the first and second nearest neighbours in the hexagonal
- 119 -
close packed crystal lattice were calculated using the expression
for the second moment
M2 = 0.95B2 + 0.218J2 + 0.192J2
where B1 represents the total dipolar coupling between first near-
est neighbours (including pseudo-dipolar coupling). Rotation at
the magic angle removes the dipolar and pseudo-dipolar contribut-
ions to the central spectrum. The second moment of the residual
line is then given by
M2 = 0.218J2 + 0.192J2
The width of a Gaussian lineshape is often approximated to 2,412.
Applying a similar approximation here and substituting Alloul and
Deltour's values for J1 and J2 of -510 Hz and -380 Hz respectively
into the above expression, we obtain a theoretical linewidth of
580 Hz. The agrement with the T1 corrected value for the experi-
mental linewidth quoted previously is very satisfactory. In view
of the assumptions made in the calculation, the precise agreement
may be fortuitous. Nevertheless, it does serve to demonstrate
that any lifetime averaging effect on the scalar interaction at
room temperature is probably small.
In conclusion we emphasize the preliminary nature of our
measurements. The experimental accuracy could be improved by
averaging the detected decay signals over a longer period of time
and by employing a more reliable procedure for fitting the dead
time data points. However, as the rotors at present available
- 120 -
cannot be spun at low temperatures, any determination of the scalar
coupling constants in cadmium is dependent upon a detailed consid-
eration of the effect of the short spin-lattice relaxation time on
this interaction.
- 121 -
REFERENCES
General References for Chapters 1 and 2.
C. P. Slichter, Principles of Magnetic Resonance (1963) Harper and Row, New York.
A. Abragam, The Principles of Nuclear Magnetism (1961), Clarendon Press, Oxford.
J. Winter, Magnetic Resonance in Metals (1971) Clarendon Press, Oxford.
Review Articles on NMR in Metals
T. J. Rowland, Progress in Materials Science (1961) 9 1.
L. E. Drain, Metallurgical Reviews (1967) 12 195.
1. F. Bloch, Phys. Rev. (1946) 70 460.
2. See for example, P. Mansfield, M. J. Orchard, D. C. Stalker, K. H. B. Richards, Phys. Rev. B (1972) 7 90.
3. M. H. Cohen, F. Reif, in Solid State Physics, Vol. 5, p. 321-428, Academic Press, New York (1957).
4. G. D. Watkins, R. V. Pound, Phys. Rev. (1953) 89 658.
5. A. J. Freeman, R. E. Watson, 'Hyperfine interactions in magnetic materials' in Magnetism, Vol. IIA, Ed. G. T. Rado and 11. Suhl, Academic Press, New York (1965).
6. M. H. Cohen, D. A. Coodings, V. Heine, Proc. Phys. Soc., A73 811 (1959).
7. R. V. Heine, Phys. Rev. (1957) 107 1002.
8. A. M. Clogston, V. Jaccarino, Y. Yafet, Phys. Rev. (1964) 134 A650.
9. J. A. Seitchik, A. C. Cossard, V. Jaccarino, Phys. Rev. (1964) 136A 1119.
10. R. Kubo, Y. Obata, J. Phys. Soc. Japan (1956) 11 153.
- 122 -
11. L. E. Orgel, J. Phys. Chem. Solids (1961) 21 123.
12. N. F. Ramsey, E. M. Purcell, Phys. Rev. (1952) 85 143.
13. N. Bloembergen, T. J. Rowland, Phys. Rev. (1955) 97 1679.
14. M. A. Ruderman, C. Kittel, Phys. Rev. (1954) 96 99.
15. S. Gade, Phys. Rev. (1969) 187 419.
16. J. H. Van Vleck, Phys. Rev. (1948) 74 1168.
17. J. Korringa, Physica (1950) 16 601.
18. A. G. Anderson, A. G. Redfield, Phys. Rev. (1959) 116 583.
19. P. A. Wolff, Phys. Rev. (1963) 129 84.
20. G. R. Khutsishvili, Soviet Phys. JETP (1957) 4 382.
21. J. Van Kranendonk, M. B. Walker, Phys. Rev. Letters (1967) 18 701. änd Can. J. Phys. (1968) 46 2441.
22. J. Van Kranendonk, Physica (1954) 20 781.
23. R. L. Mieher, Phys. Rev. (1962) 125 1537..
24. R. M. Sternheimer, Phys. Rev. (1954) 95 736. H. M. Foley, R. M. Sternheimer, D. Tycko* , Phys. Rev. (1954) 93 734.
25. E. G. Wikner, T. P. Das , Phys. Rev. (1958) 109 360.
26. K. Yosida, T. Moriya, J. Phys. Soc. Japan (1956) 11 33.
27. J. Kondo, J. Yamashita, J. Phys. Chem. Solids (1959) 10 245.
28. E. G. Wikner, W. E. Blumberg, E. L. Hahn, Phys. Rev. (1960) 118 631.
29. M. J. Weber, Phys. Rev. (1963) 130 1.
30.. S. K. Joshi, R. Gupta, T. P. Das , Phys. Rev. A (1964) 134 693.
31. F. Bridges, W. Gilbert Clark, Phys. Rev. (1967) 164 288.
32. C. E. Torr, L. M. Stacey, C. V. Briscoe, Phys. Rev. (1967) 155 272.
33. S. Clough, K. W. Cray, Proc. Phys. Soc. (1962) 79 457,80 1382.
34. H. Kessemeier, R. E. Norberg, Phys. Rev. (1967) 155 321.
35. E. R. Andrew, A. Bradbury, R. G. Eades, V. T. Wynn, Phys. Letters (1963) 4 99.
- 123 -
36. E. R. Andrew, L.. F. Farnell, Mol. Phys. (1968) 15 157.
37. E. R. Andrew in 'Progress in Nuclear Magnetic Resonance Spectrosdopy', Vol. 8, Part 1, Pergamon Press (1971).
38. E. R. Andrew, A. Jasinski, J. Phys. C: Solid State Phys. (1971) 4 391.
39. A. C. Cunningham, S. M. Day, Phys. Rev. (1966) 152 287.
40. G. E. Pake in 'Solid State Physics', Vol. 2,1 (1956).
41. E. R. Andrew, R. A. Newing, Proc. Phys. Soc. (1958) 72 959.
42. E. R. Andrew, G. J. Jenks, Proc. Phys. Soc. (1962) 80 663.
43. E. R. Andrew, A. Bradbury, R. G. Eades, Nature (1958) 182 1659, and 183 1802 (1959).
44. I. J. Lowe, Phys. Rev. Letters (1959) 2 285.
45. S. Clough, I. R. MacDonald, Proc. Phys. Soc. (1965) 86 833.
46. U. Haeberlen, J. S. Waugh, Phys. Rev. (1969) 185 420.
47. A review of such work is given in Reference 37.
48. Guinness Book of Records, Ed. R. and N. McWhirter (1973).
49. E. R. Andrew, L. F. Farnell, M. Firth, T. Gledhill, I. Roberts, J. Mag. Res. (1969) 1 27.
50. J. Babka, D. Doskocilova, H. Purcova, Z. Ruzicka, B. Schneider, Proc. XVI Ampere Congress (1970), Ed. I. Ursu, p. 785, Romanian Publishing House, 1971.
51. S. Timoskenko, 'Strength of Materials', Part 2,216, Van Nostrand, New York (1956).
52. A detailed description of this effect is given in 'Gas Lubricated Bearings, Editors N. S. Grassan and J. W. Powell, Chapters 3 and 5, Butterworths, London (1964).
53. See for example H. W. Liepmann and A. Roshko, 'Elements of Gas Dynamics', Wiley and Son, New York (1967).
54. E. Heriot, E. Huguenard, Comptes Rendus (1925) 180 1389, and J. de Phys. et Rad. (1927) 8 443.
55. J. W. Beams, Rev. Sci. Instrum. (1930) 1 667.
56. J. W. Beams, E. G. Pickels, Rev. Sci. Instrum. (1935) 6 299.
57. T. D. Gledhill, Ph. D. Thesis, University of Nottingham (1967).
58. M. Firth, Ph. D. Thesis, University of Nottingham (1970).
- 124 -
59. P. J. Randall, Ph. D. Thesis, University of Nottingham (1972).
60. A more detailed description of the characteristics of a foil bearing rotor support is given by:
M. Wildmann, Paper 1, Gas Bearing Symposium, University of Southampton (1969).
61. R. W. Woolley, Paper 25, Gas Bearing Symposium, University
of Southampton (1971).
And Private Report to-the Department of Physics, University
of Nottingham, unpublished.
62. Degussit, Technical Information.
63. S. Timoshenko, J. N. Goodier, 'Theory of Elasticity', p. 410, McGraw-Hill, New York (1951).
64. Advanced Materials Limited, Technical Information.
65. D. Doskocilova, B. Schneider, Chem. Phys. Letters (1970) 6 381.
66. B. Bleaney and B. I. Bleaney, 'Electricity and Magnetism', p-. 171, Oxford University Press (1965).
67. E. R. Andrew, J. L. Carolan, P. J. Randall, Phys. Letters (1971) 35A, 435.
68. D. S. Banaal, I. J. Lowe, Phys. Rev. Letters (1963) 11 258.
69. J. Jeener, P. Brockaert, Phys. Rev. (1967) 157 232.
70. J. G. Powles, J. H. Strange, Proc; Phys. Soc. (1963) 82 6.
71. P. Mansfield, Phys. Rev. A (1965) 137 961.
72. D. P. Tunstall, D. Brown, Phys. Rev. B (1970) 1 2881.
73. A. F. Wells, 'Structural Inorganic Chemistry', Oxford University Press, London (1962).
74. A. C. Chapman, P. Rhodes, E. F. W. Seymour, Proc. Phys. Soc. B (1957) 70 345.
75. D. Kotzur, 0. Kanert, M. Mehring, Proc. XVII Ampere Congress, Ed. V. Hovi, p. 322, North-Holland, Amsterdam (1973).
76. P. L. Sagalyn, J. A. Hofmann, Phys. Rev. (1962) 127 68.
77. E. R. Andrew, J. L. Carolan, P. J. Randall, Chem. Phys. Letters (1971) 11 298.
- 125 -
78. B. D. Guenther, R. Hultsch, J. Mag. Res. (1969) 1609.
79. K. D. Becker, G. W. Herzog, D. Kanne, H. Richtenig, E. Stadler, Z. Elecktrochem. (1970) 74 527.
80. S. Domngang, J. Wucher, C. R. Acad. Sci. Paris (1969) 268 1608.
81. S. Domngang, J. Wucher, J. F. Caillard, Proc. XV Ampere Congress, Ed. P. Averbuch, p. 399, North-Holland, Amsterdam (1969).
82. H. Kruger, U. Meyer-Berkhout, Z. Phys. (1952) 132 171.
83. J. G. King, V. Jaccarino, Phys. Rev. (1954) 94 1610.
84. B. Bleaney, K. D. Bowers, M. H. Pryce, Proc. Roy. Soc. (1955) A228 166.
85. R. M. Sternheimer, Phys. Rev. (1966) 146 140.
86. G. Burns, E. G. Wikner, Phys. Rev. (1961) 121 155.
87. Values taken from Chemical Rubber Handbook, 54th Edition, C. R. C. Press, Cleveland.
88. R. W. G. Wyckoff, 'Crystal Structures', 1 110, Wiley, New York (1963).
89. W. Hinshaw, J. T. Lewis, C. V. Briscoe, Phys. Rev. (1967) 163 878.
90. See values quoted by J. Van Kranendonk, M. B. Walker, Phys. Rev. Letters (1967) 18 701 (Reference 22).
91. W. D. Knight, Phys. Rev. (1949) 76 1259.
92. H. S. Gutowsky, B. R. McCarvey, J. Chem. Phys. (1952) 20 1472.
93. F. Borsa, R. G. Barnes, J. Phys. Chem. Solids (1966) 27 567.
94. A. Narath, A. T. Weaver, Phys. Rev. (1968) 175 373.
95. U. El Hanany, D. Zamir, Solid State Comm. (1972) 10 1223.
96. T. Kushida, J. C. Murphy, Phys. Rev. B (1971) 3 1474.
97. J. A. Pople, W. G. Schneider, H. J. Bernstein, 'High Resolution Nuclear Magnetic Resonance Spectroscopy', p. 81, McGraw-Hill, New York (1959).
98. Value taken from J. A. Osborne, Phys. Rev. (1945) 67 351.
99. D. G. Hughes, Private Communication.
100. S. Kobayashi, T. Takahashi, W. Sasaki, Phys. Letters (1970) 33A 429.
- 126 -
101. H. R. Khan, J. M. Reynolds, R. G. Goodrich, Phys. Rev. B (1970) 2 4796.
102. W. M. Shyu, T. P. Das, G. D. Gaspari, Phys. Rev. (1966) 152 270.
103. E. F. W. Seymour, Proc. Phys. Soc. A (1953) 66 85.
104. J. J. Spokas, C. P. Slichter, Phys. Rev. (1959) 113 1462.
105. E. A. Faulkner, R. K. Ham, Phil. Mag. (1962) 87 279.
106. C. P. Flynn, E. F. W. Seymour, Proc. Phys. Soc. (1961) 77 922.
107. A. G. Anderson, Phys. Rev. (1959) 115 863.
108. N. Fernelius, Proc. XVI Ampere Congress, Ed. R. Blinc, p. 497, North-Holland, Amsterdam (1967).
109. T. J. Rowland, F. Y. Fradin, Phys. Rev. (1969) 182 760.
110. E. Van Meerwall, T. J. Rowland, Phys. Rev. B (1971) 3 1781.
111. W. Warren, R. E. Norberg, Phys. Rev. (1967) 154 277.
112. F. Y. Fradin, T. J. Rowland, Appl. Phys. Letters (1967) 11 207.
113. F. Y. Fradin, T. J. Rowland, Phys. Rev. B (1971) 3 1781.
114. J. H. Pifer, Phys. Rev. (1968) 166 540.
115. L. C. Hebel, C. P. Slichter, Phys. Rev. (1959) 113 1504.
116. M. R. Smith, Ph. D. Thesis, University of Alberta (Canada) (1972), communicated by D. G. Hughes.
117. J. Butterworth, Phys. Rev. Letters (1960) 5 305.
118. I. Solomon, Phys. Rev. (1958) 110 61.
119. J. Butterworth, Proc. Phys. Soc. (1965) 86 297.
120. W. D. Knight in 'Solid State Physics', Vol. 2, p. 93, Academic Press, New York (1956).
121. W. E. Blumberg, J. Eisenger, V. Jaccarino, R. T. Matthias, Phys. Rev. Letters (1960) 5 149.
122. See T. J. Rowland, Progress in Materials Science (1961) 9 1.
123. L. E. Drain, Proc. Phys. Soc. (1964) 83 755.
124. D. J. Lam, J. J. Spokas, D. 0. Van Ostenburg, Phys. Rev (1967) 156 735.
- 127 -
125. H. E. Walchi, H. W. Morgan, Phys. Rev. (1952) 87 541.
126. J. Butterworth, Proc. Phys. Soc. (1965) 85 735.
127. See L. E. Drain, Metallurgical Reviews (1967) 12 195.
128. A. M. Clogston, A. C. Gossard, V. Jaccarino, Y. Yafet, Rev. Mod. Physics (1964) 36 170.
129. T. J. Rowland, Phys. Rev. (1956) 103 1670.
130. Y. Masuda, J. Phys. Soc. Japan (1957) 12 523.
131. L. E. Drain, Phil. Mag. (1959) 4 484.
132. F. Borsa, R. G. Barnes, J. Phys. Chem. Solids (1964) 25 1305.
133. E. F. W. Seymour, G. A. Styles, Phys. Letters (1964) 10 269.
134. R. G. Goodrich, S. A. Khan, J. M. Reynolds, Phys. Rev. B (1971) 3 2379.
135. H. Kruger, 0. Lutz, A. Schwenk, G. Stricker, Z. Physik (1974) 266 233.
136. T. K. Kushida, L. Rimai, Phys. Rev. (1966) 143 157.
137. Y. Masuda, J. Phys. Soc. Japan (1958) 13 597.
138. E. M. Dickson, Phys. Rev. (1969) 184 294.
139. H. Alloul, R. Deltour, Phys. Rev. (1969) 183 414.