nitritation performance and biofilm development of co- and counter-diffusion biofilm reactors:...
TRANSCRIPT

w a t e r r e s e a r c h 4 3 ( 2 0 0 9 ) 2 6 9 9 – 2 7 0 9
Avai lab le a t www.sc iencedi rec t .com
journa l homepage : www.e lsev ie r . com/ loca te /wat res
Nitritation performance and biofilm developmentof co- and counter-diffusion biofilm reactors:Modeling and experimental comparison
Rongchang Wanga,b, Akihiko Teradaa, Susanne Lacknera,Barth F. Smetsa,*, Mogens Henzea, Siqing Xiab, Jianfu Zhaob
aDepartment of Environmental Engineering, Technical University of Denmark, Miljoevej, Building 113, DK-2800 Kgs. Lyngby, DenmarkbState Key Laboratory of Pollution Control and Resource Reuse, Key Laboratory of Yangtze Aquatic Environment, Ministry of Education
of China, College of Environmental Science and Engineering, Tongji University, Shanghai 200092, PR China
a r t i c l e i n f o
Article history:
Received 24 September 2008
Received in revised form
6 January 2009
Accepted 4 March 2009
Published online 21 March 2009
Keywords:
Nitritation
Co-diffusion
Counter-diffusion
Biofilm development
Fluorescence in situ hybridization
Membrane-aerated biofilm reactor
* Corresponding author. Tel.: þ45 4525 2230;E-mail address: [email protected] (B.F. Sme
0043-1354/$ – see front matter ª 2009 Elsevidoi:10.1016/j.watres.2009.03.017
a b s t r a c t
A comparative study was conducted on the start-up performance and biofilm development
in two different biofilm reactors with aim of obtaining partial nitritation. The reactors were
both operated under oxygen limited conditions, but differed in geometry. While substrates
(O2, NH3) co-diffused in one geometry, they counter-diffused in the other. Mathematical
simulations of these two geometries were implemented in two 1-D multispecies biofilm
models using the AQUASIM software. Sensitivity analysis results showed that the oxygen
mass transfer coefficient (Ki) and maximum specific growth rate of ammonia-oxidizing
(AOB) and nitrite-oxidizing bacteria (NOB) were the determinant parameters in nitrogen
conversion simulations. The modeling simulations demonstrated that Ki had stronger
effects on nitrogen conversion at lower (0–10 m d�1) than at the higher values (>10 m d�1).
The experimental results showed that the counter-diffusion biofilms developed faster and
attained a larger maximum biofilm thickness than the co-diffusion biofilms. Under oxygen
limited condition (DO < 0.1 mg L�1) and high pH (8.0–8.3), nitrite accumulation was trig-
gered more significantly in co-diffusion than counter-diffusion biofilms by increasing the
applied ammonia loading from 0.21 to 0.78 g NH4þ-N L�1 d�1. The co- and counter-diffusion
biofilms displayed very different spatial structures and population distributions after
120 days of operation. AOB were dominant throughout the biofilm depth in co-diffusion
biofilms, while the counter-diffusion biofilms presented a stratified structure with an
abundance of AOB and NOB at the base and putative heterotrophs at the surface of the
biofilm, respectively.
ª 2009 Elsevier Ltd. All rights reserved.
1. Introduction suppressed. Advantages such as lower oxygen demands for
Partial nitrification has gained significant recent attention in
wastewater treatment. In partial nitrification, also known as
nitritation, oxidation of nitrite (NO2�) to nitrate (NO3
�) is
fax: þ45 4593 2850.ts).er Ltd. All rights reserved
nitrification and lower organic carbon demands for subse-
quent denitrification are the reason. There are different
approaches to achieve nitritation applicable to suspended
growth or biofilm systems (Pedersen et al., 2003). High
.

w a t e r r e s e a r c h 4 3 ( 2 0 0 9 ) 2 6 9 9 – 2 7 0 92700
temperatures and low residence times without biomass
retention favor the growth of aerobic ammonia-oxidizing
bacteria (AOB) over nitrite-oxidizing bacteria (NOB). NOB can
be washed out due to their lower specific growth rate under
these conditions. An example of such a process is the Single
reactor system for High activity Ammonium Removal Over
Nitrite (SHARON) described by Hellinga et al. (2003). Inhibition
of nitrite oxidation can also be controlled by other factors,
such as concentration ratios of NH4þ/NH3, NO2
�/HNO2, in
combination with pH, dissolved oxygen (DO) (Jenicek et al.,
2004), organic carbon concentration (Yun et al., 2004) and
other inhibitors (Peng and Zhu, 2006). Yoo et al. (2006) have
shown that DO control can be more critical than pH control to
attain nitrite build-up in a nitrifying submerged membrane
bioreactor. At DO concentrations of 0.2–0.4 mg L�1, about 70%
ammonium conversion to nitrite was obtained with total
ammonium removal higher than 93% (Yoo et al., 2006).
However, several questions still remain. In particular it has
been shown that NOB can adapt to initially inhibiting condi-
tions, which compromises continued nitrite production
(Antonisen et al., 1976; Abeling and Seyfried, 1992).
Membrane aerated biofilm reactors (MABR) have been
introduced to remove nutrients (nitrogen or phosphorus or
both) (Semmens et al., 2003; Terada et al., 2003, 2006; Downing
and Nerenberg, 2008) or other pollutants (Ohandja and
Stuckey, 2007) from wastewaters. In MABR systems, the
oxygen is supplied to the base of the biofilm through a gas-
permeable membrane and the substrate is supplied to the
surface of the biofilm from the bulk liquid; we have termed the
resulting system a counter-diffusion biofilm. One advantage of
MABRs is the possibility for 100% oxygen transfer efficiency
(Brindle et al., 1998), which is not achievable with conventional
biofilm systems, which we have termed co-diffusion biofilms.
Further advantages of membrane-aerated systems are
minimal stripping of volatile organic compounds, controlled
delivery of potentially explosive gases, and a well-defined
surface area for mass transfer (Shanahan and Semmens,
2006). The independent control of oxygen surface loading (LO2)
and ammonia nitrogen surface loading (LNH4) makes the MABR
theoretically more amenable for successful nitritation.
Implementation of nitrogen removal via the nitrite pathway
has been obtained in sequencing batch processes (e.g., Pam-
brun et al., 2006), but few have been achieved with continuous
flow processes (Fux et al., 2004; Peng and Zhu, 2006). However,
effective control and manipulation of co- and counter-diffu-
sion biofilm geometries may provide some new clues to ach-
ieve nitritation in continuous-flow biofilm reactors.
Understanding the reaction and diffusion processes in
membrane aerated biofilms is necessary for optimizing the
operation conditions of a MABR. The mass transfer coefficient
for oxygen (Ki) seems to be a crucial parameter in these reac-
tors. Also the maximum biofilm thickness (Lf,max) has
a significant influence on the performance of membrane-
aerated biofilms.
The purpose of this study was therefore to (1) examine the
effects of Ki and Lf,max on the nitrogen conversion perfor-
mance of co- and counter-diffusion biofilm reactors; (2) vali-
date the feasibility of implementing and controlling partial
nitrification in continuous-flow co- and counter-diffusion
biofilm reactors; and (3) compare nitritation performance of
co- and counter-diffusion biofilms during their development
through modeling and experimental investigation.
2. Materials and methods
2.1. Reactor configuration
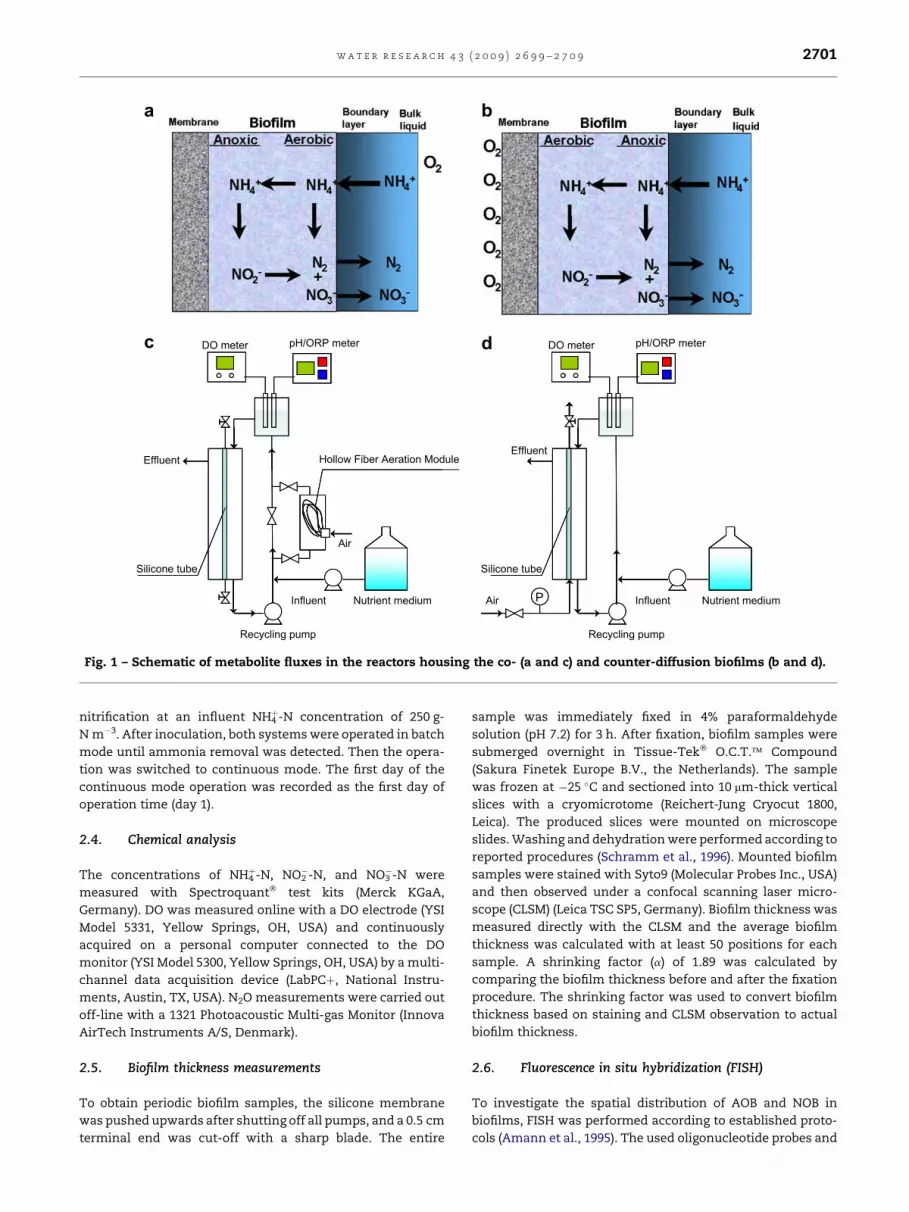
Two structurally identical reactors (R1 and R2) were con-
structed to support co- and counter-diffusion biofilms,
respectively. Fig. 1 shows the configuration of both systems
schematically. Briefly, each reactor had a working volume of
0.59 L and was completely mixed via liquid recirculation (the
average recirculation flow rate was approx 42.9 L h�1, upflow
velocity approx. 8.5 m h�1). Residence time distribution (RTD)
tests revealed dimensionless dispersion numbers of 0.37 and
0.38 for both reactors, respectively, indicating completely
mixed conditions. Gas-permeable silicone (J. Lindemann
GmbH, Helmstedt, Germany; 250 mm thickness, 12 mm diam-
eter, 300 mm length) was used as gas delivery membrane and
support for biofilm growth. The co-diffusion system (R1) had
a hydrophobic, microporous polyethylene hollow-fiber bundle
(128 fibers) in the recirculation line (MHF3504; Mitsubishi
Rayon Co. Ltd., Tokyo, Japan) to deliver oxygen to the bulk
liquid. DO concentration in the bulk was kept below
0.5 mg L�1. Therefore, both oxygen and ammonium were
supplied to the biofilm in the main reactor compartment from
the liquid phase in the co-diffusion geometry system (R1). In
R1, the gas lumen of the silicone membrane was filled with
nitrogen gas and sealed, preventing oxygen flux from the
lumen side. In the counter-diffusion system (R2), oxygen was
supplied directly from the silicone membrane to the biofilm
whereas ammonium was provided from the liquid phase.
Pressurized filtered air was used as oxygen source. The air
pressure before entering the hollow fibers or silicone
membrane was controlled at 1.8 � 0.2 kPa above atmospheric
pressure. To minimize biofilm growth on surfaces other than
the silicone membrane, the reactor walls and the hollow fiber
membrane module in the co-diffusion system (R1) were
scoured and cleaned twice a week with ultrasonic and
mechanical methods.
2.2. Medium
Both biofilm reactors were fed with the same synthetic
medium using peristaltic pumps (Ismatech MV-MS/CA8C,
Glattburg, Zurich, Switzerland). The feed was prepared with
tap water and contained NH4HCO3 (N source), NaHCO3 (C
source, pH buffer), 0.03 g phosphorus (as K2HPO4) L�1 and
1 ml L�1of a trace element solution (after Pynaert et al., 2004).
The pH was adjusted to 8.0–8.3. The influent ammonium
concentration and flow rate were adjusted during the exper-
iment to obtain the desired N load; the influent NaHCO3
concentration varied depending on the required buffer
capacity and pH.
2.3. Inoculation and start-up
Both systems were inoculated with activated sludge from
a lab-scale nitrifying reactor which displayed full and stable
c d
Silicone tube
Air
Influent Nutrient medium
Recycling pump
Hollow Fiber Aeration ModuleEffluent
pH/ORP meterDO meter
PAir
Silicone tube
Influent Nutrient medium
Recycling pump
Effluent
pH/ORP meterDO meter
a b
Fig. 1 – Schematic of metabolite fluxes in the reactors housing the co- (a and c) and counter-diffusion biofilms (b and d).
w a t e r r e s e a r c h 4 3 ( 2 0 0 9 ) 2 6 9 9 – 2 7 0 9 2701
nitrification at an influent NH4þ-N concentration of 250 g-
N m�3. After inoculation, both systems were operated in batch
mode until ammonia removal was detected. Then the opera-
tion was switched to continuous mode. The first day of the
continuous mode operation was recorded as the first day of
operation time (day 1).
2.4. Chemical analysis
The concentrations of NH4þ-N, NO2
�-N, and NO3�-N were
measured with Spectroquant� test kits (Merck KGaA,
Germany). DO was measured online with a DO electrode (YSI
Model 5331, Yellow Springs, OH, USA) and continuously
acquired on a personal computer connected to the DO
monitor (YSI Model 5300, Yellow Springs, OH, USA) by a multi-
channel data acquisition device (LabPCþ, National Instru-
ments, Austin, TX, USA). N2O measurements were carried out
off-line with a 1321 Photoacoustic Multi-gas Monitor (Innova
AirTech Instruments A/S, Denmark).
2.5. Biofilm thickness measurements
To obtain periodic biofilm samples, the silicone membrane
was pushed upwards after shutting off all pumps, and a 0.5 cm
terminal end was cut-off with a sharp blade. The entire
sample was immediately fixed in 4% paraformaldehyde
solution (pH 7.2) for 3 h. After fixation, biofilm samples were
submerged overnight in Tissue-Tek� O.C.T.� Compound
(Sakura Finetek Europe B.V., the Netherlands). The sample
was frozen at �25 �C and sectioned into 10 mm-thick vertical
slices with a cryomicrotome (Reichert-Jung Cryocut 1800,
Leica). The produced slices were mounted on microscope
slides. Washing and dehydration were performed according to
reported procedures (Schramm et al., 1996). Mounted biofilm
samples were stained with Syto9 (Molecular Probes Inc., USA)
and then observed under a confocal scanning laser micro-
scope (CLSM) (Leica TSC SP5, Germany). Biofilm thickness was
measured directly with the CLSM and the average biofilm
thickness was calculated with at least 50 positions for each
sample. A shrinking factor (a) of 1.89 was calculated by
comparing the biofilm thickness before and after the fixation
procedure. The shrinking factor was used to convert biofilm
thickness based on staining and CLSM observation to actual
biofilm thickness.
2.6. Fluorescence in situ hybridization (FISH)
To investigate the spatial distribution of AOB and NOB in
biofilms, FISH was performed according to established proto-
cols (Amann et al., 1995). The used oligonucleotide probes and

w a t e r r e s e a r c h 4 3 ( 2 0 0 9 ) 2 6 9 9 – 2 7 0 92702
their fluorochromes are shown in Table 2. The final probe
concentration was approximately 5 ng mL�1. The formamide
concentration (FA) in the hybridization buffer was 35%.
Hybridization was carried out at 46 �C for 3 h. Subsequently,
a stringent washing step of the samples was performed at
48 �C for 15 min in 50 ml of prewarmed washing solution
containing sodium chloride, Tris–HCl and EDTA. Micrographs
of the hybridized slices were obtained with a CLSM observa-
tion with argon (488 nm) and HeNe lasers (543 and 633 nm)
illumination.
2.7. Model development and simulation
2.7.1. Model developmentA one-dimensional multi-population biofilm model was con-
structed in AQUASIM 2.1 (Reichert, 1998). Both co- and
counter-diffusion biofilm geometries were modeled to simu-
late performance and microbial community structure under
various operational conditions. The models have the same
structural dimensions and membrane surface areas as in the
experimental biofilm reactors. Both modeled biofilm reactors
have two linked compartments: a completely-mixed gas
compartment and a biofilm compartment, the latter of which
is further composed of a biofilm matrix and bulk liquid. The
gas compartment, with oxygen partial pressure of 21 kPa, is
connected to the base of the biofilm for the counter-diffusion
system and to the bulk liquid for the co-diffusion system,
respectively. The oxygen flux (JO2) from the gas compartment
(the silicone tube for the counter-diffusion geometry or the
hollow fiber membrane module for the co-diffusion geometry)
to the biofilm base or the bulk liquid is given by equation (1):
JO2 ¼ Ki
�SO2;g
H� SO2;bb
�or JO2 ¼ Ki
�SO2;g
H� SO2;BL
�(1)
where SO2,g, SO2,bb and SO2,BL are the oxygen concentrations in
the gas compartment and at the biofilm base or in the bulk
liquid, respectively (g-O2 m�3), Ki is the oxygen mass transfer
coefficient (m d�1), H is the non-dimensional Henry’s law
coefficient. Gas transfer of nitrogen gas and carbon dioxide
were not considered in this model.
For all simulations, the initial biofilm thickness was set as
10 mm and the initial biomass was assumed to contain 50%
AOB, 25% NOB and 25% heterotrophic bacteria (HB). Biofilm
detachment was modeled by employing a pseudo steady-state
approach using the following expression: udet ¼ uF $
(Lf /Lf,max)2 when uF > 0 (otherwise udet ¼ 0), with udet: biofilm
detachment rate, Lf,max: the maximum biofilm thickness and
uF: the biofilm growth velocity (Lackner et al., 2008).
2.7.2. Sensitivity analysisA normalized absolute–relative sensitivity function was used
to investigate the identifiability and relative significance of
each parameter on reactor performance. It is defined as
(Reichert, 1998):
dCi ;p ¼ pvCiðpÞ
vp
�g�N m�3
�(2)
where dCi ;p, Ci, and p are the absolute–relative sensitivity
function, the effluent concentration of the considered species
(NH4þ-N, NO2
�-N, or NO3�-N), and the considered model
parameter, respectively. The dCi ;p measures the relative
change in Ci for a 100% change in p and all these changes are
calculated in linear approximation. The analysis was per-
formed over the same time interval as the typical simulation.
2.7.3. Model simulation and calibrationActivated Sludge Model No. 1 was extended by implementing
a two-step nitrification process (Henze et al., 2000) (Table I in
Appendix A). Bacterial growth and decay processes were
considered for HB (XH), AOB (XAOB) and NOB (XNOB) (Table II in
Appendix A). Oxygen (SO) was used as an electron acceptor for
both autotrophic and heterotrophic growth, while denitrifying
HB also use nitrite (SNO2) and nitrate (SNO3) as electron
acceptors when oxygen becomes limiting. Kinetic and stoi-
chiometric parameters for HB were derived from literature
(Table III in Appendix A). A wide range of maximum specific
growth rates for AOB (mmax,AOB) and NOB (mmax,NOB) has
reported in the literature. To increase the accuracy of the
simulation, the values of mmax,AOB and mmax,NOB were
confirmed by parameter estimation based on in situ respiro-
metric experiments (results not shown) in co- and counter-
diffusion biofilms, respectively (Table III in Appendix A).
3. Results and discussion
3.1. Sensitivity analysis
A summary of the sensitivity analysis of key parameters on
the NH4þ-N, NO2
�-N, and NO3�-N concentrations in the effluent
of co- and counter-diffusion biofilm systems is provided in
(Table V Appendix A). The most crucial parameter for
controlling nitritation performance in counter-diffusion bio-
film reactors was Ki, while mmax,AOB was the most determinant
parameter in the co-diffusion biofilm reactors. Ki had a less
significant effect on the nitritation performance in the co-
diffusion biofilm system. As expected, mmax,AOB and mmax,NOB
had strong effects on the nitrite accumulation in both co- and
counter-diffusion biofilm systems, especially in the co-diffu-
sion biofilm system. The biokinetic and stoichiometric
parameters related to HB were of minor significance. These
results indicate that it is important to control the oxygen flux
and keep AOB as the key player in biofilm systems in order to
maintain a high nitritation performance, irrespective of bio-
film geometry.
3.2. Effects of Ki and Lf,max on nitritation performance
The effects of Ki and Lf,max on the nitrogen conversion
performance in co- and counter-diffusion biofilms are shown
in Fig 2. In both co- and counter-diffusion biofilm reactors, the
effluent NH4þ-N concentration decreases with Ki increases,
which indicates that a higher oxygen mass transfer coefficient
enhances the oxidation of ammonia as more oxygen is
available to AOB in both systems (Fig. 2a and b). The effluent
NH4þ-N concentration increases with Lf,max in both co- and
counter-diffusion biofilm systems. The reason for the small
peak at Lf,max 100 mm in the co-diffusion scenario at high Ki
values is not clear. Fig. 2a and b indicate that satisfactory

a b
c d
ef
145150155160165170175180185
0200
400600
800
05
1015
20
Efflu
en
t N
H4
+-N
co
nc. [g
N/m
3]
Ki [m
/d]
145150155160165170175180185
05
1015
20
25
30
0200
400600
800
05
1015
20
Efflu
en
t N
O3
--N
co
nc. [g
N/m
3]
L_f_max [ m]
Ki [m
/d]
051015202530
130140150160170180190
200
0500100015002000
2500
010
2030
40L_f_max [ m]
L_f_max [ m]
L_f_max [ m]
L_f_max [ m
]
130140150160170180190200
0102030405060
70
5001000
15002000
25003000 0
1020
3040
Efflu
en
t N
O3
--N
co
nc. [g
N/m
3]
Ki [m
/d]
010203040506070
2
3
4
5
6
7
0500100015002000
2500
010
2030
40Efflu
en
t N
O2
--N
co
nc. [g
N/m
3]
Efflu
en
t N
H4
+-N
co
nc. [g
N/m
3]
Ki [m
/d]
Ki [m
/d]
234567
101520253035404550
0200
400600
800
05
1015
20
Efflu
en
t N
O2
--N
co
nc. [g
N/m
3]
Ki [m
/d]
101520253035404550
L_f_max [ m]
Fig. 2 – Predicted steady-state effluent nitrogen concentrations in co- (a, c, e) and counter- (b, d, f) diffusion biofilm reactors at
different values of Ki and Lf,max after 120 days. (a, b) NH4D-N; (c, d) NO2
L-N; (e, f) NO3L-N.
w a t e r r e s e a r c h 4 3 ( 2 0 0 9 ) 2 6 9 9 – 2 7 0 9 2703
ammonia removal efficiency is obtained if biofilm thickness
remain below 500 mm. In addition, ammonia removal effi-
ciency increases dramatically when Ki increases from 0.5 to
10 m d�1, but additional Ki increases give marginal improve-
ments, especially at biofilm thickness larger than 800 mm.
An increase in Ki has a completely different effect on nitrite
production in co- versus counter-diffusion biofilm systems
(Fig. 2c and d). In counter-diffusion systems, the nitrite
concentration in the bulk liquid decreases as the Ki increases,
especially from 0.5 to 10 m d�1. On the contrary, the bulk
liquid nitrite concentration in the co-diffusion biofilm system
increases when Ki increases. Clearly, an increase of Ki
compromises the nitrite accumulation in the counter-diffu-
sion biofilm system but enhances the nitrite accumulation in
the co-diffusion biofilm system investigated in this study.
There is a small valley in nitrite concentrations at Lf,max values
near 200 mm in counter-diffusion biofilms and at about 100 mm
in the co-diffusion biofilms. When Lf,max increases even
further (larger than 800 mm in counter-diffusion biofilms and
larger than 400 mm in co-diffusion biofilms), Lf,max appears to
have no significant effect on the nitrite production (Fig. 2c
and d).
Nitrate production is improved dramatically when Ki
increases from 0.5 to 20 m d�1 and then levels off for both co-

Table 1 – Target operational conditions for the co- and counter-diffusion biofilm reactors.
Strategy Time (days) pH DO (mg L�1) NH4þ-N loading (g-N L�1 d�1)
Onset 0–14 6.5–7.5 1.0–5.0 0.21–0.26
Low DO 15–40 7.2–7.8 0.1–0.5 0.21–0.26
Low DO þ High pH 40–52 7.5–8.0 0.05–0.1 0.21–0.26
Low DO þ High pH þ High NH4þ-N load 53–140 8.0–8.3 0.04–0.05 0.63–0.78
w a t e r r e s e a r c h 4 3 ( 2 0 0 9 ) 2 6 9 9 – 2 7 0 92704
and counter-diffusion biofilms. The effects of Lf,max on the
nitrate production are opposite to those of nitrite production,
i.e., a small peak is observed at Lf,max values of 200 and 100 mm
in counter- and co- diffusion biofilms; and the effect of Lf,max
becomes marginal above biofilm thicknesses of 800 mm and
400 mm in counter- and co- diffusion biofilms, respectively.
From Fig. 2c–f, it can be concluded that at biofilm thickness
exceeding 800 and 400 mm in counter- and co-diffusion bio-
films, further increases have no significant effects on either
nitrite or nitrate production, suggesting an optimum range of
Lf,max for nitritation performance in both co- and counter-
diffusion biofilm systems.
3.3. Comparison of nitritation performance in co- andcounter-diffusion systems
The DO concentration in the bulk liquid (SO2,BL) of the reactors
was controlled by adjusting the air pressure in the membrane
lumen (Fig. I in Appendix A). The variations of SO2,BL are
summarized in Table 1. During the first 5 days, SO2,BL was
about 2.0–5.0 mg L�1 at a relatively low air pressure (approx.
2.0 kPa). Oxygen consumption in both co- and counter-diffu-
sion systems was relatively low because of the low biomass
concentration in the reactors. When biofilms developed on the
membrane surface, SO2,BL decreased dramatically to below
1.0 mg L�1 at the same applied pressure. Then the air pressure
was increased up to 6 kPa to supply enough oxygen for biofilm
formation for several days. Formation of bacterial colonies
and thin biofilms (about 10 mm) on the membrane surface was
confirmed with microscopic observation. From day 15 onward
the air pressure was maintained at approx. 1.8 kPa for both
reactors.
Table 2 – Oligonucleotide probes used for fluorescence in situ
Probe Names in oligonucleotideprobe database (OPD)
Sequenc
EUB338 S-D-Bact-0338-a-A-18 GCT GCC TCC CG
EUB338II S-*-BactP-0338-a-A-18 GCA GCC ACC CG
EUB338III S-*-BactV-0338-a-A-18 GCT GCC ACC CG
non EUB S-*-Bact-338-a-B-18 ACT CCT ACG GG
Nso190 S-F-bAOB-0189-a-A-19 CGA TCC CCT GC
Nso1225 S-F-bAOB-1224-a-A-20 CGC CAT TGT AT
Nmo218 – CGG CCG CTC CA
Nsm156 S-G-Nsm-0155-a-A-19 TAT TAG CAC AT
Cluster6a192 – CTT TCG ATC CC
Cluster6a192 comp – CTT TCG ATC CC
NIT3 S-G-Nbac-1035-a-A-18 CCT GTG CTC CA
CNIT3 – CCT GTG CTC CA
Ntspa662 S-G-Ntspa-662-a-A-18 GGA ATT CCG CG
cNtspa662 – GGA ATT CCG CT
Nitrogen conversion in both systems is shown in Fig. 3.
During the first 10 days, the ammonia removal of R1 and R2
increased steadily from 8.5% to 80.1% and from 15.5% to 82.4%,
respectively. SO2,BL was reduced from above 4.0 mg L�1 to below
1.0 mg L�1. The ammonia removal decreased from 91.0% (day
11) to 45.7% (day 15) for the co-diffusion and from 82.4% (day 10)
to 48.2% (day 13) for the counter-diffusion system. However,
the ammonia removal performance of both systems recovered
(Fig. 3a,b), reaching 99.7% on day 31 for the co-diffusion system
and 99.1% on day 21 for the counter-diffusion system.
In order to stimulate and maintain partial nitrification in
both systems, the influent ammonium-nitrogen concentration
was increased from 67 mg L�1 to 262 mg L�1 from day 53 to day
60 (corresponding to an increase in NH4þ-N loading from 0.21 g-
NH4þ-N L�1d�1 to 0.78 g-NH4
þ-N L�1d�1). Nitrite accumulation
was observed in both systems, but the trends were very
different. In the counter-diffusion system, the nitrite concen-
tration increased slowly from about 3.2 mg-NO2�-N L�1 (day 60)
to 20.5 mg-NO2�-N L�1 (day 100), then it stayed at about 20 mg-
NO2�-N L�1 until the biofilm sloughing event on day 140, the last
day of the reactor operation, when almost all biofilm detached
from the membrane. The NO3� concentration in this system
was relatively constant and fluctuated around 45 mg-NO3�-
N L�1. The NO2� concentration in the co-diffusion system
increased gradually from 4.6 mg-NO2�-N L�1 (day 60) to about
70 mg-NO2�-N L�1 (day 100) where it was maintained
throughout the operational period. The NO3� concentration in
the co-diffusion system continually decreased from 56.2 mg-
NO3�-N L�1 to 26.4 mg-NO3
�-N L�1. In both systems, the effluent
NH4þ-N concentration increased after the load increase from
about 11 mg-NH4þ-N L�1 (before day 60) to about 140 mg-NH4
þ-
N L�1 (from day 60 to day 80); it decreased gradually to about
hybridization (FISH).
e (50–30) Target organism(s) Dye
T AGG AGT Domain Bacteria FLUO
T AGG TGT Planctomycetales FLUO
T AGG TGT Verrucomicrobia FLUO
A GGC AGC None FLUO
T TTT CTC C b-Subgroup ammonia-oxidizing bacteria Cy3
T ACG TGT GA b-Subgroup ammonia-oxidizing bacteria Cy3
A AAG CAT Nitrosomonas oligotropha Cy3
C TTT CGA T Nitrosomonas spp., Nitrosococcus mobilis Cy3
C TAC TTT CC N. oligotropha lineage (cluster 6a) Cy3
C TGC TTC C Competitor for cluster 6a192 Cy3
T GCT CCG Nitrobacter Cy5
G GCT CCG Competitor for NIT3 Cy5
C TCC TCT Nitrospira Cy5
C TCC TCT Competitor for Ntspa662 Cy5

NO2--N,
127.4 mgN/d,30.0%
NH4+-N,
177.0 mgN/d,41.7%
NO3--N,
46.0 mgN/d,10.8%
N2O,3.7 mgN/d,
0.9%
Unidentified,70.6 mgN/d,
16.6%a
NO2--N,
37.2 mgN/d,8.8%
NH4+-N,
122.1 mgN/d,28.8%Unidentified,
160.0 mgN/d,37.7%
N2O,1.9 mgN/d,
0.5%NO3
--N,103.5 mgN/d,
24.4%
b
Fig. 4 – Nitrogen mass balance (mg-N dL1) in the co- (a) and
counter- (b) diffusion biofilm reactors at 120 days with
influent total N of 424.8 mg-N dL1.
a
Time (d)
0 20 40 60 80 100 120 140
0 20 40 60 80 100 120 140
N co
ncen
tratio
n (m
g/L
)
0
50
100
150
200
250
300
NH4_inf.NO3_effNO2_effNH4_effNO3_simulatedNO2_simulatedNH4_simulated
b
Time (d)
N co
ncen
tratio
n (m
g/L
)
0
50
100
150
200
250
300
NH4_inf.NO3_effNO2_effNH4_effNO3_simulatedNO2_simulatedNH4_simulated
Fig. 3 – Comparison of simulated and actual performance
in co- (a) and counter- (b) diffusion biofilm reactors.
w a t e r r e s e a r c h 4 3 ( 2 0 0 9 ) 2 6 9 9 – 2 7 0 9 2705
90–100 mg-NH4þ-N L�1 (from day 80 to day 140) indicating a slow
increase in ammonia removal capacity in both systems.
Comparisons of the experimental and the model simulated
effluent concentrations in both systems are also shown in
Fig. 3. The simulated nitrite effluent profiles of both systems
roughly match the trend in the experimental profiles. There is,
however, a significant deviation between the predicted and
observed NH4þ effluent concentration, especially after day 80.
These differences may be due to an underestimation of either
the heterotrophic denitrification or anaerobic ammonium
oxidation activity in the simulation, but it is also possible that
differences in the oxygen flux caused this deviation. In addi-
tion, in the co-diffusion system, the nitrate production was
underestimated after the increase of NH4þ loading rate on day
53. The model predicts a rapid decrease in nitrate and increase
in nitrite after increasing the NH4þ loading, unlike the experi-
mental trends. The AOB and NOB biokinetic parameters in the
model, obviously, overpredict the NOB disappearance more
than the experiment. NOB may be more persistent than
previously assumed: the persistence of Nitrobacter NOBs in
bioreactor even under oxygen limited conditions has recently
been shown by others (Ahn et al., 2008).
The percentage of each nitrogenous component in the
effluent on day 120 is shown in Fig. 4. The ammonia loading
rate at 120 days was 424.8 mg-N d�1 for both systems. The
removed ammonia was 247.8 mg-N d�1 (58.3%) and 302.7 mg-
N d�1 (71.3%) in co- and counter-diffusion system, respec-
tively. Although the ammonia removal rate is lower in the co-
diffusion system, a higher nitrite production rate was ach-
ieved (127.4 mg-N d�1) compared to the counter-diffusion
system (37.2 mg-N d�1). The poorer nitrite build-up in the
counter-diffusion system is probably caused by its inherent
biofilm geometry: oxygen and produced nitrite are the highest
at the same location, allowing NOB to grow at the biofilm base.
A recent numerical study, using a two-dimensional cellular
automaton (CA)-hybrid model, confirmed that NOB can
compete more effectively for oxygen and substrate in counter-
versus co-diffusion biofilm system (Bell et al., 2005).
The N2O concentration varied from 50.2 to 135.8 ppm in the
co-diffusion system (air flow rate in membrane lumen
Qair ¼ 22.6 L d�1) and from 3.1 to 7.5 ppm in the counter-diffu-
sion system (Qair ¼ 210.4 L d�1). The N2O concentrations at
120 day were 129.7 � 7.1 ppm and 7.2 � 0.2 ppm translating in

140
w a t e r r e s e a r c h 4 3 ( 2 0 0 9 ) 2 6 9 9 – 2 7 0 92706
N2O production rates of 3.7 � 0.2 mg-N d�1 and 1.9 � 0.1 mg-
N d�1, for the co- and counter-diffusion systems respectively.
Thus, only a very small part of removed N (less than 1%) was
due to N2O production in both systems. The rest of the
unidentified N was about 16.6% and 37.7% in the co- and
counter-diffusion systems, respectively. The nitrogen fluxes
due to free ammonia stripping from the bulk liquid to the
membrane lumen in both systems were calculated to be less
than 0.1% of the total nitrogen loading. Based on these mass
balances, it can be speculated that either denitrification
(heterotrophic or autotrophic) or anaerobic ammonium
oxidation occurred in both systems and most of the unidenti-
fied N loss could be in the form of N2 gas. An insignificant
degree of heterotrophic denitrification was predicted
(<1 mg L�1, results not shown) because of small organic carbon
fluxes driven by nitrifying bacterial decay or their extracellular
polymeric substances. Nitrogen losses from autotrophic bio-
films have previously been reported as caused by anaerobic
ammonia oxidation (Kuai and Verstraete, 1998; Helmer et al.,
2001). Another possible sink could be autotrophic denitrifica-
tion by AOB as previously reported (Kampschreur et al., 2006).
However, more work is needed to identify the responsible
mechanisms to close the nitrogen balance in these systems.
3.4. Biofilm development
Comparison of the experimentally measured and the model
predicted values biofilm thickness are shown in Fig. 5. The
biofilm thickness measured on day 140 was 107 � 31 mm for
the co-diffusion system and 887 � 161 mm for the counter-
diffusion system. Based on these results, the Lf,max values
used in this study for the co- and counter-diffusion biofilm
systems are set to 150 mm and 1000 mm, respectively.
The counter-diffusion system had a higher biofilm growth
rate and a higher Lf,max than the co-diffusion biofilm. The
increase in NH4þ concentration (from day 53 to day 60) had
a small effect on the biofilm thickness in the co-diffusion
system versus the counter-diffusion system.
Time (d)
0 20 40 60 80 100 120 140 160
Bio
film
th
ic
kn
es
s ( m
)
0
200
400
600
800
1000
1200
Co-diffCounter-diff Co-diff simulatedCounter-diff simulated
Fig. 5 – Biofilm thickness profiles vs. time in co- and
counter-diffusion biofilms.
Biofilm thickness affects the substrate mass transfer
processes in the biofilm and through the membrane, which are
both vital to the reactor performance in the membrane-assis-
ted biofilm systems (Celmer et al., 2008). In addition, bacterial
growth and respiration near the membrane surface potentially
enhances oxygen transfer across the membrane wall as shown
before (Freitas dos Santos and Livingston, 1995; Semmens and
Essila, 2001). When biofilm thickness on the membrane
substratum increases, redox-stratification may result, which
makes a biofilm feasible for complete nitrogen removal via
either heterotrophic (e.g., Semmens et al., 2003) or autotrophic
pathways (e.g., Terada et al., 2007; Lackner et al., 2008). In this
study, the DO concentration in the bulk liquid was almost
undetectable, normally lower than 0.05 mg-O2 L�1 after day 60
at which point the biofilm thickness was higher than 200 mm in
counter-diffusion biofilm system. As the biofilm thickness on
day 140 was 887 � 161 mm in the counter-diffusion system,
redox-stratification was likely established in these biofilms.
On the contrary, the biofilm thickness reached only 150 mm in
the co-diffusion system. This might contribute to the differ-
ence in terms of nitrogen loss as shown in Fig. 4 (37.7% in
counter-diffusion biofilm vs. 16.6% in co-diffusion biofilm).
The relationships between biofilm thickness and nitrite
production rate in co- and counter-diffusion systems are
shown in Fig. 6. The solid dots represent the situation in the co-
diffusion system. Although the maximum biofilm thickness
was less than 150 mm, the nitrite production rate increases
dramatically from 46.0� 0.4 mg-N d�1 to 125.7 � 1.8 mg-N d�1
when the biofilm thickness develops from 66.5� 21.8 mm to
107.7 � 30.6 mm. However, in counter-diffusion biofilms, even
at biofilm thickness as large as 887 � 161 mm, the nitrite
production rate is still below 40 mg-N d�1. Effective control of
biofilm thickness is critical for optimizing the nitritation
performance of biofilm reactors, especially for counter-diffu-
sion biofilm geometries. The significance of biofilm thickness
control has been explored numerically (Terada et al., 2007) or
experimentally (Semmens et al., 2003; Celmer et al., 2008) for
0 200 400 600 800 1000
Nitrite p
ro
du
ctio
n rate (m
gN
/d
)
0
20
40
60
80
100
120
Co-diffusionCounter-diffusion
Biofilm thickness ( m)
Fig. 6 – Relations between biofilm thickness and nitrite
production rate in co- and counter-diffusion systems (C,
co-diffusion system; B, counter-diffusion system).

w a t e r r e s e a r c h 4 3 ( 2 0 0 9 ) 2 6 9 9 – 2 7 0 9 2707
membrane-aerated and supported biofilms. Optimal biofilm
thickness control strategies need to be further investigated so
as to maintain stable and high nitrite accumulation.
3.5. Comparison of microbial community structure andspatial distribution
The spatial distribution of AOB and NOB in both co- and
counter-diffusion biofilms was investigated by FISH. Repre-
sentative FISH images for co- and counter-diffusion biofilms
are shown in Fig. 7. AOB in the biofilm sections hybridize with
both EUB mix (green) and Nso series (red), so they are yellow in
the two-channel overlapped confocal images. Analogously,
NOB hybridize with both EUB mix (green) and NIT3 or
Ntspa662 (blue), and they are blue to cyan in Fig. 7.
The biofilm samples were harvested on days 40 and 120 of
operation. The bold white lines show the bases of biofilms (i.e.,
the positions of silicone membrane) on the sections. On day 40
Fig. 7 – Confocal laser scanning micrographs of biofilm sections
EUB338mix-FLUO (green) targeting most Bacteria; (Nso190-Cy3 D
and NIT3-Cy5 (blue) specific for Nitrobacter spp. Sections were tak
(b, d) diffusion biofilm reactors.
the co-diffusion biofilm is looser and more protuberant, while
the counter-diffusion biofilm is more compact and tight
(Fig. 7a and b). The b-subgroup AOB were dominant in all the
observed biofilm samples and NOB belonging to the genus
Nitrobacter were located in the regions adjacent to the silicone
membrane surface or biofilm surface. The probe Ntspa662 was
used to check the presence of Nitrospira signals in the biofilm;
however, Nitrospira spp. were not detected in both systems.
A different spatial distribution was observed on day 120
(Fig. 7c and d). First, the thickness of the counter-diffusion
biofilm was much higher than that of the co-diffusion biofilm.
Second, the counter-diffusion biofilm had a clear stratified
structure: most of AOB and NOB were located near the base of
the biofilm, i.e., close to the surface of the membrane as the
supply source of oxygen, and nonAOB nonNOB (presumable
HB) were located at the surface of the biofilm close to the bulk
liquid (Fig. 7d). A similarly layered biofilm structure has been
reported before (Hibiya et al., 2003; Lapara et al., 2006).
. All sections were simultaneously hybridized with
Nso1225-Cy3 D Nmo218-Cy3) (red) targeting most AOB,
en at 40 (a, b) and 120 (c, d) days from co- (a, c) and counter-

w a t e r r e s e a r c h 4 3 ( 2 0 0 9 ) 2 6 9 9 – 2 7 0 92708
On the contrary, such stratified structure was not observed
in the co-diffusion biofilm (Fig. 7c), where AOB were dominant
and the few NOB were located at the biofilm base. Compared
to the counter-diffusion biofilm, the co-diffusion biofilm was
thinner, which probably resulted in deeper penetration of
ammonia which, in turn, may have inhibited NOB, allowing
a much higher nitrite accumulation and lower nitrate
production in the co-diffusion biofilm systems. Lydmark et al.
(2006) have similarly observed more NOB at the base than the
top of nitrifying biofilms in a trickling filter.
4. Conclusions
Co- and counter-diffusion biofilm reactors were operated
under oxygen limited conditions in order to initiate and
maintain stable nitritation processes. The experimental
results show that a combination of high pH (8.0–8.3) and high
ammonia loading rates (about 0.78 g-NH4þ-N L�1 d�1) were
necessary to trigger NOB inhibition and obtain nitrite accu-
mulation. Significant nitritation was achieved with co-diffu-
sion biofilms but very poor nitritation was obtained with
counter- diffusion biofilm systems. Sensitivity analysis
revealed that the oxygen mass transfer coefficient (Ki) and
maximum biofilm thickness (Lf,max) were most determinant in
the nitrogen conversion performance for both biofilm
systems. The biofilms obtained in the counter-diffusion
systems were much thicker than those obtained in the co-
diffusion systems. In addition, NOB survived to a much
greater extent in the counter- versus the co-diffusion biofilm
after several months of operation. Our study reveals the
difficulty in obtaining partial nitrification in biofilm-based
nitrifying reactors, which is exacerbated in membrane-
aerated and membrane supported biofilms, where the
inherent system geometry may complicate inhibition and
washout of NOB, a condition necessary to ensure sufficient
and stable nitritation.
Acknowledgments
This research was supported by the Sino-Danish Scientific
Cooperation Program (S14NNP28) and the DANIDA fellowship,
the Danish Agency for Science Technology and Innovation
(FTP-ReSCoBiR), Program for Young Excellent Talents in
Tongji University (2007KJ015). We are also grateful to Dr.
Laurent Lardon, Ms. Lene K. Jensen, Dr. Najoi El Azhari, Mr.
Sanin Musovic, Mr. Anders Fredenslund and Mr. Xiangwen
Kong for assistance in various aspects of the work.
Appendix A.Supplemental material
Supplementary information for this manuscript can be
downloaded at doi: 10.1016/j.watres.2009.03.017.
r e f e r e n c e s
Abeling, U., Seyfried, C.F., 1992. Anaerobic-aerobic treatment ofhigh-strength ammonium wastewater - nitrogen removal vianitrite. Water Sci. Technol 26 (5–6), 1007–1015.
Ahn, J.H., Yu, R., Chandran, K., 2008. Distinctive microbial ecologyand biokinetics of autotrophic ammonia and nitrite oxidationin a partial nitrification bioreactor. Biotechnol. Bioeng 100 (6),1078–1087.
Amann, R.I., Ludwig, W., Schleifer, K.H., 1995. Phylogeneticidentification and in-situ detection of individual microbial-cells without cultivation. Microbiol. Rev. 59 (1), 143–169.
Antonisen, A., Loehr, R., Prakasam, T., Srinath, E., 1976. Inhibitionof nitrification by ammonia and nitrous acid. J. Water Pollut.Cont. Fed 48, 835–852.
Bell, A., Aoi, Y., Terada, A., Tsuneda, S., Hirata, A., 2005.Comparison of spatial organization in top-down- andmembrane-aerated biofilms: a numerical study. Water Sci.Technol 52 (7), 173–180.
Brindle, K., Stephenson, T., Semmens, M.J., 1998. Nitrification andoxygen utilization in a membrane aeration bioreactor. J.Membr. Sci. 144 (1–2), 197–209.
Celmer, D., Oleszkiewicz, J.A., Cicek, N., 2008. Impact of shearforce on the biofilm structure and performance ofa membrane biofilm reactor for tertiary hydrogen-drivendenitrification of municipal wastewater. Water Res. 42 (12),3057–3065.
Downing, L., Nerenberg, R., 2008. Total nitrogen removal ina hybrid, membrane-aerated activated sludge process. WaterRes. 42 (14), 3697–3708.
Freitas dos Santos, L.M., Livingston, A.G., 1995. Membrane-attached biofilms for VOC wastewater treatment. II: Effect ofbiofilm thickness on performance. Biotechnol. Bioeng 47 (1),90–95.
Fux, C., Huang, D., Monti, A., Siegrist, H., 2004. Difficulties inmaintaining long-term partial nitritation of ammonium-richsludge digester liquids in a moving-bed biofilm reactor (MBBR).Water Sci. Technol 49 (11–12), 53–60.
Hellinga, C., Schellen, A.A.J.C., Mulder, J.W., van Loosdrecht, M.C.M., Heijnen, J.J., 2003. The SHARON process: an innovativemethod for nitrogen removal from ammonium-rich wastewater. Water Sci. Technol 37 (9), 135–142.
Helmer, C., Tromm, C., Hippen, A., Rosenwinkel, K.H., Seyfried, C.F.,Kunst, S., 2001. Single stage biological nitrogen removal bynitritation and anaerobic ammonium oxidation in biofilmsystems. Water Sci. Technol 43 (1), 311–320.
Henze, M., Gujer, W., Mino, T., Loosdrecht, M.C.M. (Eds.), 2000.Activated Sludge Models ASM1, ASM2, ASM2d and ASM3,Scientific and Technical Reports. IWA Publishing, London.
Hibiya, K., Terada, A., Tsuneda, S., Hirata, A., 2003. Simultaneousnitrification and denitrification by controlling vertical andhorizontal microenvironment in a membrane-aerated biofilmreactor. J Biotechnol 100 (1), 23–32.
Jenicek, P., Svehla, P., Zabranska, J., Dohanyos, M., 2004. Factorsaffecting nitrogen removal by nitritation/denitritation. WaterSci. Technol 49 (5–6), 73–79.
Kampschreur, M.J., Tan, N.C.G., Picioreanu, C., Jetten, M.S.M.,Schmidt, I., van Loodsdrecht, M.C.M., 2006. Role of nitrogenoxides in the metabolism of ammonia-oxidizing bacteria.Biochem. Soc. Trans, 179–181.
Kuai, L., Verstraete, W., 1998. Ammonium removal by the oxygen-limited autotrophic nitrification-denitrification system. Appl.Environ. Microbiol. 64 (11), 4500–4506.
Lackner, S., Terada, A., Smets, B.F., 2008. Heterotrophic activitycompromises autotrophic nitrogen removal in membrane-aerated biofilms: Results of a modeling study. Water Res. 42(4–5), 1102–1112.

w a t e r r e s e a r c h 4 3 ( 2 0 0 9 ) 2 6 9 9 – 2 7 0 9 2709
Lapara, T.M., Cole, A.C., Shanahan, J.W., Semmens, M.J., 2006. Theeffects of organic carbon, ammoniacal-nitrogen, and oxygenpartial pressure on the stratification of membrane-aeratedbiofilms. J. Ind. Microbiol. Biotechnol 33 (4), 315–323.
Lydmark, P., Lind, M., Sorensson, F., Hermansson, M., 2006.Vertical distribution of nitrifying populations in bacterialbiofilms from a full-scale nitrifying trickling filter. Environ.Microbiol. 8 (11), 2036–2049.
Ohandja, D.G., Stuckey, D.C., 2007. Biodegradation of PCE ina hybrid membrane aerated biofilm reactor. J. Environ. Eng.ASCE 133 (1), 20–27.
Pambrun, V., Paul, E., Sprandio, M., 2006. Modeling the partialnitrification in sequencing batch reactor for biomass adaptedto high ammonia concentrations. Biotechnol. Bioeng 95 (1),120–131.
Pedersen, P.D., Jensen, K., Lyngsie, P., Johansen, N.H., 2003.Nitrogen removal in industrial wastewater by nitration anddenitrationd3 years of experience. Water Sci. Technol 47 (11),181–188.
Peng, Y.Z., Zhu, G.B., 2006. Biological nitrogen removal withnitrification and denitrification via nitrite pathway. Appl.Microbiol. Biotechnol 73 (1), 15–26.
Pynaert, K., Smets, B.F., Beheydt, D., Verstraete, W., 2004. Start-upof autotrophic nitrogen removal reactors via sequentialbiocatalyst addition. Environ. Sci. Technol 38 (4), 1228–1235.
Reichert, P., 1998. AQUASIM 2.0dUser Manual, ComputerProgram for the Identification and Simulation of AquaticSystems. Swiss Federal Institute for Environmental Scienceand Technology (EAWAG), Dubendorf, Switerland.
Schramm, A., Larsen, L.H., Revsbech, N.P., Ramsing, N.B.,Amann, R., Schleifer, K.H., 1996. Structure and function ofa nitrifying biofilm as determined by in situ hybridization and
the use of microelectrodes. Appl. Environ. Microbiol. 62 (12),4641–4647.
Semmens, M.J., Essila, N.J., 2001. Modeling biofilms on gas-permeable supports: Flux limitations. J. Environ. Eng.-ASCE127 (2), 126–133.
Semmens, M.J., Dahm, K., Shanahan, J., Christianson, A., 2003.COD and nitrogen removal by biofilms growing on gaspermeable membranes. Water Res. 37 (18), 4343–4350.
Shanahan, J.W., Semmens, M.J., 2006. Influence of a nitrifyingbiofilm on local oxygen fluxes across a micro-porous flat sheetmembrane. J. Membr. Sci. 277 (1–2), 65–74.
Terada, A., Hibiya, K., Nagai, J., Tsuneda, S., Hirata, A., 2003.Nitrogen removal characteristics and biofilm analysis ofa membrane-aerated biofilm reactor applicable to high-strength nitrogenous wastewater treatment. J. Biosci. Bioeng95 (2), 170–178.
Terada, A., Yamamoto, T., Tsuneda, S., Hirata, A., 2006.Sequencing batch membrane biofilm reactor for simultaneousnitrogen and phosphorus removal: novel application ofmembrane-aerated biofilm. Biotechnol. Bioeng 94 (4), 730–739.
Terada, A., Lackner, S., Tsuneda, S., Smets, B.F., 2007. Redox-stratification controlled biofilm (ReSCoBi) for completelyautotrophic nitrogen removal: The effect of co- versuscounter-diffusion on reactor performance. Biotechnol. Bioeng97 (1), 40–51.
Yoo, I.K., Lim, K.J., Lee, W.S., Kim, D.J., Cha, G.C., 2006. Study onoperational factors in a nitrite-accumulating submergedmembrane bioreactor. J. Microbiol. Biotechnol 16 (3), 469–474.
Yun, Z., Jung, Y.-H., Lim, B.-R., Choi, E., Min, K.S., 2004. Thestability of nitrite nitrification with strong nitrogenouswastewater: effects of organic concentration and microbialdiversity. Water Sci. Technol 49 (5–6), 89–96.