nifty highlights - icicidirect
TRANSCRIPT
February 20, 2018
ICICI Securities Ltd | Retail Equity Research
Result Update
Muted performance, strong outlook…
Timken India (TIL) reported weak Q3FY18 numbers. This was on
account of a dismal EBITDA and PAT performance despite strong
growth in topline numbers
Revenues came in at | 278.6 crore, up 20.6% YoY. We estimated
revenues of | 263.8 crore for the quarter
EBITDA declined 12.9% YoY to | 20.7 crore as the company reported
weak EBITDA margins of 7.4% in Q3FY18. Lower EBITDA margins
were on account of a sharp spike of 37.6% and 34.1% in employee
and other expenses, respectively. Gross margins remained stable for
the quarter. We estimated margins of 13.5% for the quarter
PAT operating performance coupled with higher non-operating
expenses led to PAT decline of 30.9% YoY. Absolute PAT came in at
| 9.2 crore. We estimated PAT of | 16.7 crore for the quarter
Muted operating performance, new opportunity to open up in railways
TIL reported a weak operating performance in Q3FY18 (EBITDA declined
12.9% YoY) mostly due to an increase in input prices for the quarter.
Additionally, the management also highlighted that Q3FY18 witnessed
sales booking from lower margin bearings, impacting the business
performance. The management has also guided that the product mix is
likely to improve from Q4FY18. Also, the company was able to sign
contracts with some of its customers for pass-through of higher input
prices. Going ahead, in the railway segment, TIL expects new opportunity
to open up in the ‘passenger coach’ segment. Replacement of bearings -
cartridge tapered roller bearings (CTRB) in-place of existing spherical
roller bearings for the existing coaches plus demand for CTRB bearings
for new coaches is likely to augur well for the company, going forward. In
addition to this opportunity, Indian Railways is also planning to outsource
‘maintenance of bearings’ for the existing wagons/locomotives to large
OEMs. TIL being a frontrunner in this space, intends to capture significant
pie of this upcoming opportunity.
Improved outlook, capex, synergies from acquisition to drive growth
In domestic markets, TIL is witnessing a pick-up in segments like CVs &
off-highway, railways and after-market segment. The management
continues to remain optimistic on these segments, going forward. In the
railways segment, TIL is eyeing significant business from the higher
demand of new wagons and new upcoming opportunities from this
segment. Accordingly, we expect domestic segment to grow healthy at
13.3% CAGR over FY17-20E respectively. We also expect exports to
perform better, going forward, due to strong demand for TIL’s bearings
from the heavy truck segment in international markets. TIL is also
expected to be a key hub for export to various customers of Timken
entities. Accordingly, we expect exports revenue to grow at 14.7% CAGR
in FY17-20E. The company has executed two capital expansion
programmes, for the railway bearings segment (| 124.7 crore) and for the
tapered roller bearing segment (| 64.3 crore). Both expansion
programmes are over and revenue generating from FY18. This coupled
with synergies from acquisition of ABC Bearings is likely to accelerate
topline and bottomline growth, going forward. We expect revenue,
EBITDA and PAT to grow at 14.5%, 17.8% and 14.8%, respectively, for
the consolidated entity in FY17-20E. We value the company at 40x FY20E
EPS of 21.9 to arrive at target price of | 880. We have a HOLD rating on
the company.
Timken India (TIMIND) | 815
Rating matrix
Rating : Hold
Target : | 880
Target Period : 12 months
Potential Upside : 8%
What’s changed?
s
Target Changed from | 867 to | 880
EPS FY18E (Before merger) Changed from | 15.9 to | 13.2
EPS FY19E (After merger)* Changed from | 22.1 to | 18.3
EPS FY20E (After merger)* Introduced at | 21.9
Rating Changed from Buy to Hold
*Estimates for merged entity
Quarterly performance
Q3FY18 Q3FY17 YoY (%) Q2FY18 QoQ (%)
Revenue 278.6 231.0 20.6 310.2 -10.2
EBITDA 20.7 23.8 -12.9 53.8 -61.5
EBITDA (%) 7.4 10.3 -286 bps 17.3 -990 bps
PAT 9.2 13.3 -30.9 37.3 -75.4
Key financials
| Crore FY17 FY18E FY19E* FY20E*
Net Sales 1,056 1,188 1,652 1,870
EBITDA 158 156 264 310
Net Profit 97 90 138 165
EPS (|) 14.3 13.2 18.3 21.9
*Esimates for the merged entity
Valuation summary
FY17 FY18E FY19E* FY20E*
P/E 57.0 61.9 44.5 37.2
Target P/E 61.6 66.8 48.0 40.1
EV / EBITDA 35.0 35.5 23.3 19.8
P/BV 9.1 8.2 6.6 5.8
RoNW (%) 15.9 13.3 14.8 15.6
RoCE (%) 22.6 19.7 20.8 21.7
*Esimates for the merged entity
Stock data
Particular Amount
Market Capitalization (| crore) 5,541
Total Debt (FY18E) (| crore) 18
Cash and Investments (FY18E) (| crore) 40
EV (FY18E) (| crore) 5,519
52 week H/L (|) 1008 / 601
Equity capital (| crore) 68.0
Face value (|) 10.0
Price performance
Return % 1M 3M 6M 12M
Timken India (10.4) 5.6 16.0 35.1
FAG Bearings (5.0) 2.6 22.5 32.1
NRB Bearings (2.8) 11.1 28.8 39.9
SKF India 1.5 9.1 20.5 26.5
Research Analyst
Chirag J Shah
Sagar K Gandhi
ICICI Securities Ltd | Retail Equity Research Page 2
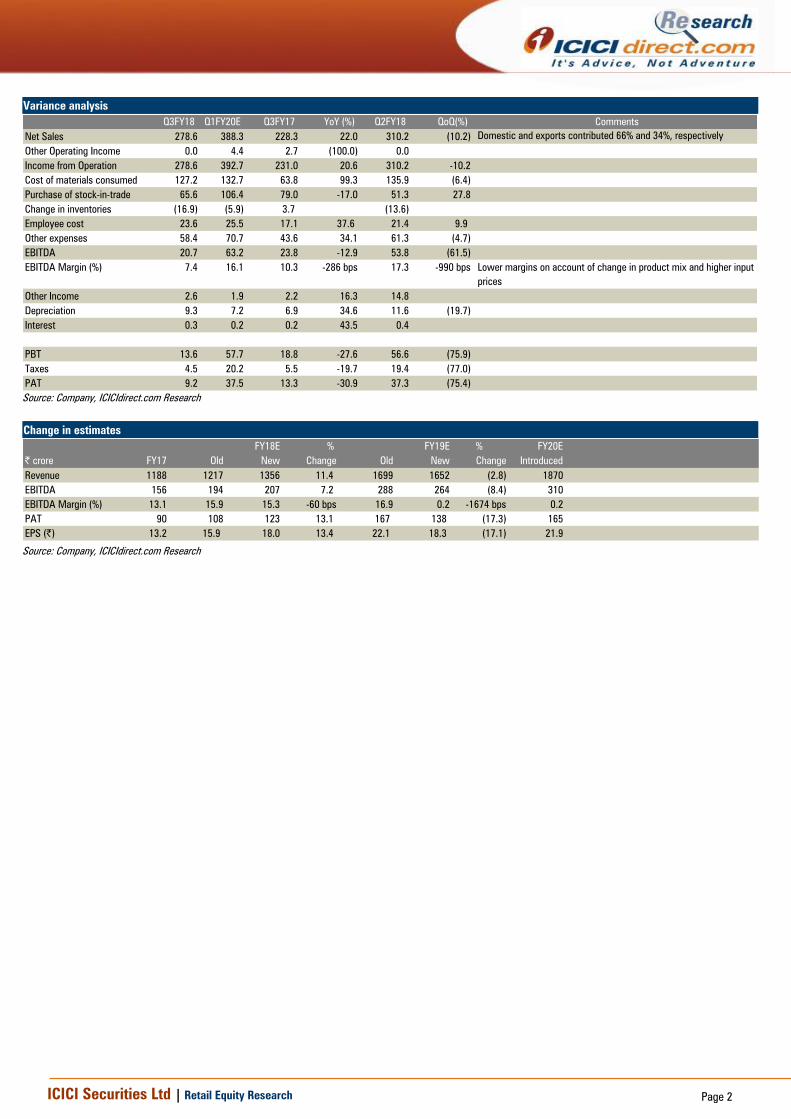
Variance analysis
Year Q3FY18 Q1FY20E Q3FY17 YoY (%) Q2FY18 QoQ(%) Comments
Net Sales 278.6 388.3 228.3 22.0 310.2 (10.2) Domestic and exports contributed 66% and 34%, respectively
Other Operating Income 0.0 4.4 2.7 (100.0) 0.0
Income from Operation 278.6 392.7 231.0 20.6 310.2 -10.2
Cost of materials consumed 127.2 132.7 63.8 99.3 135.9 (6.4)
Purchase of stock-in-trade 65.6 106.4 79.0 -17.0 51.3 27.8
Change in inventories (16.9) (5.9) 3.7 (13.6)
Employee cost 23.6 25.5 17.1 37.6 21.4 9.9
Other expenses 58.4 70.7 43.6 34.1 61.3 (4.7)
EBITDA 20.7 63.2 23.8 -12.9 53.8 (61.5)
EBITDA Margin (%) 7.4 16.1 10.3 -286 bps 17.3 -990 bps Lower margins on account of change in product mix and higher input
prices
Other Income 2.6 1.9 2.2 16.3 14.8
Depreciation 9.3 7.2 6.9 34.6 11.6 (19.7)
Interest 0.3 0.2 0.2 43.5 0.4
PBT 13.6 57.7 18.8 -27.6 56.6 (75.9)
Taxes 4.5 20.2 5.5 -19.7 19.4 (77.0)
PAT 9.2 37.5 13.3 -30.9 37.3 (75.4)
Source: Company, ICICIdirect.com Research
Change in estimates
FY18E % FY19E % FY20E
| crore FY17 Old New Change Old New Change Introduced
Revenue 1188 1217 1356 11.4 1699 1652 (2.8) 1870
EBITDA 156 194 207 7.2 288 264 (8.4) 310
EBITDA Margin (%) 13.1 15.9 15.3 -60 bps 16.9 0.2 -1674 bps 0.2
PAT 90 108 123 13.1 167 138 (17.3) 165
EPS (|) 13.2 15.9 18.0 13.4 22.1 18.3 (17.1) 21.9
Source: Company, ICICIdirect.com Research
ICICI Securities Ltd | Retail Equity Research Page 3
Acquisition of ABC: Merger of asset & capabilities
Timken India (TIL), a leader in the niche segments of engineered
bearings and mechanical power transmission products, has entered
into a definitive agreement to acquire ABC Bearings through a court-
approved amalgamation process
ABC Bearings (ABC) is a manufacturer of tapered, cylindrical and
spherical roller bearings and slewing rings. ABC operates primarily
out of manufacturing facilities in Bharuch, Gujarat and Dehradun,
Uttarakhand
The TIL-ABC deal is likely to conclude by March 2018, when the
latter’s shares will be dissolved and merged into TIL’s equity. The
shareholders of ABC will receive five shares of TIL for every eight
shares they hold in the company
ABC reported topline, EBITDA, PAT of | 190.4 crore, | 32 crore, | 12
crore in FY17, whereas TIL reported topline, EBITDA and PAT of |
1056.2 crore, | 158 crore and | 97.2 crore, respectively, in FY17
Entry into new segment: Wheel-end bearings
Bearings can broadly be categorised into three segments, viz. differential,
pinion and wheel-end segment. In the first two categories, Timken has a
high market share of 60-100%. However, in the last category, the
company does not have any presence. The market size of this segment is
~| 400 crore. The company did not make inroads into this segment, as it
was flooded by Chinese players. However, post H1FY17, the company
witnessed a significant improvement in this segment. This was primarily
due to an increase in ‘performance guarantee’ requirement by the major
consumer from this segment. ABC has a significant presence in this
segment, which will now allow TIL foray in this segment.
Huge underutilised capacity; access to domestic, export markets
Apart from a presence in the wheel-end segment, ABC also has
significant unused capacity in the tapered roller segment. TIL’s
management intends to utilise this used capacity (that is currently at 40%)
by catering to the lucrative export market, an area where TIL has a strong
presence. Superior technological capabilities of TIL coupled with the
labour cost advantage of ABC is also likely to bring in operational
efficiencies for the merged entity. Overall, acquisition of ABC Bearings is
likely to expand its capacity, customer base and locally produced product
breadth. The same is also likely to improve the company’s ability to
increase participation in local and export markets.
Deal value accretive…
The implied valuation of ABC Bearings at MCap/sales ratio of 2.6x and
trailing EV/EBITDA of 15.2x (FY17) seems expensive optically. However,
the underutilised capacity and cost efficiencies that will accrue to TIL may
result into strong revenue and PAT gains. For instance, even if TIL is able
to ramp up utilisation to 70% by FY19E, it will result into revenues of
| 296 crore (for ABC). This will lead to 1.8x rise in EBITDA by FY19E. This
would imply valuations of 1.6x MCap/sales and 8x EV/EBITDA making the
deal EPS accretive for TIL. Given the strong parentage and operating
history of TIL, we believe the deal will also be value accretive for TIL’s
shareholders.
ICICI Securities Ltd | Retail Equity Research Page 4
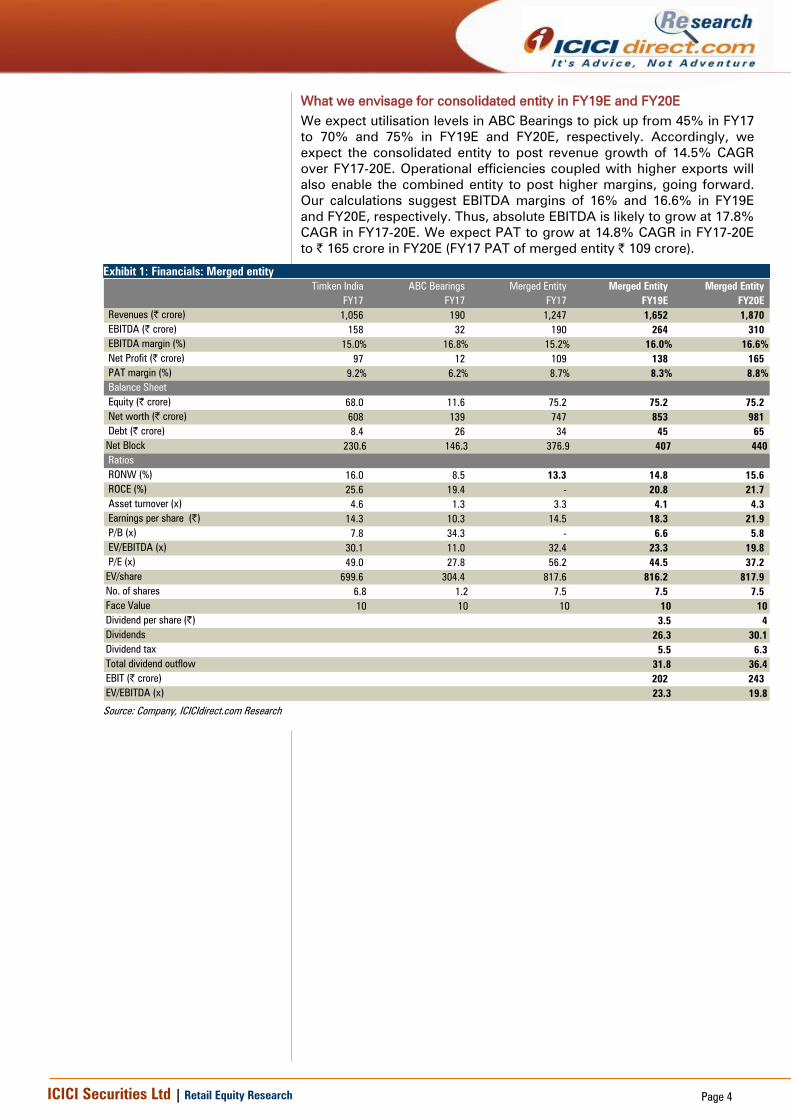
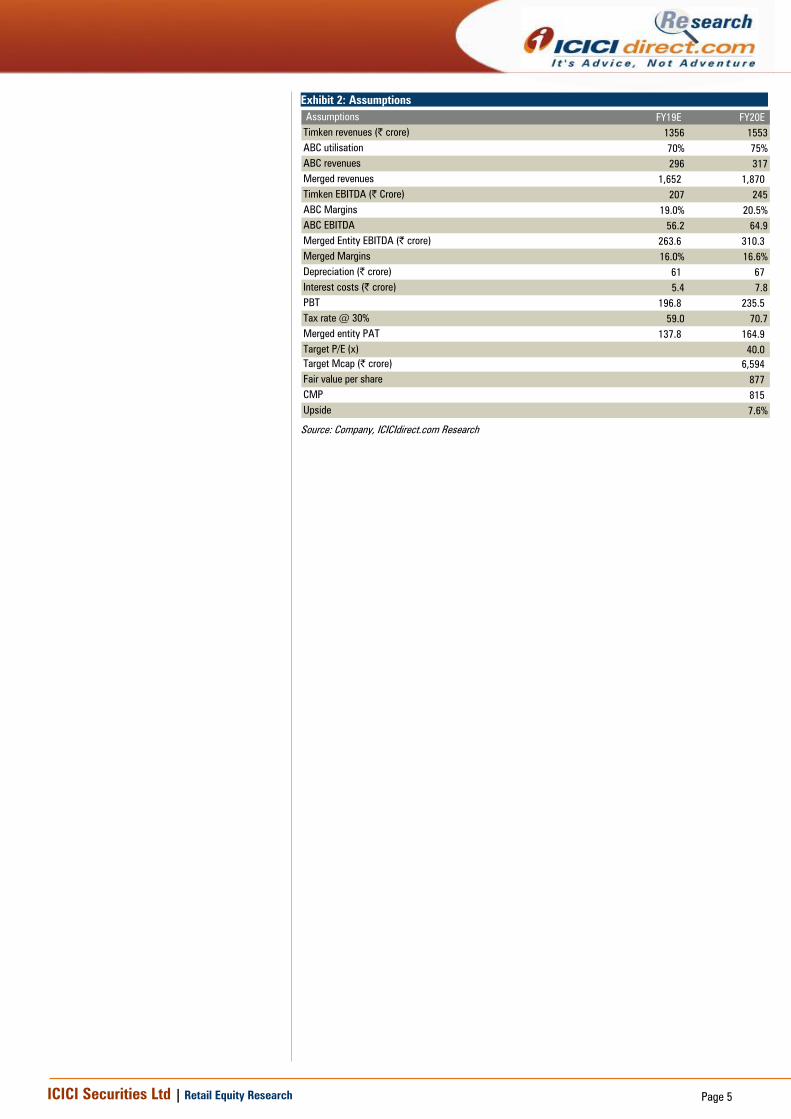
What we envisage for consolidated entity in FY19E and FY20E
We expect utilisation levels in ABC Bearings to pick up from 45% in FY17
to 70% and 75% in FY19E and FY20E, respectively. Accordingly, we
expect the consolidated entity to post revenue growth of 14.5% CAGR
over FY17-20E. Operational efficiencies coupled with higher exports will
also enable the combined entity to post higher margins, going forward.
Our calculations suggest EBITDA margins of 16% and 16.6% in FY19E
and FY20E, respectively. Thus, absolute EBITDA is likely to grow at 17.8%
CAGR in FY17-20E. We expect PAT to grow at 14.8% CAGR in FY17-20E
to | 165 crore in FY20E (FY17 PAT of merged entity | 109 crore).
Exhibit 1: Financials: Merged entity
Timken India ABC Bearings Merged Entity Merged Entity Merged Entity
FY17 FY17 FY17 FY19E FY20E
Revenues (| crore) 1,056 190 1,247 1,652 1,870
EBITDA (| crore) 158 32 190 264 310
EBITDA margin (%) 15.0% 16.8% 15.2% 16.0% 16.6%
Net Profit (| crore) 97 12 109 138 165
PAT margin (%) 9.2% 6.2% 8.7% 8.3% 8.8%
Balance Sheet
Equity (| crore) 68.0 11.6 75.2 75.2 75.2
Net worth (| crore) 608 139 747 853 981
Debt (| crore) 8.4 26 34 45 65
Net Block 230.6 146.3 376.9 407 440
Ratios
RONW (%) 16.0 8.5 13.3 14.8 15.6
ROCE (%) 25.6 19.4 - 20.8 21.7
Asset turnover (x) 4.6 1.3 3.3 4.1 4.3
Earnings per share (|) 14.3 10.3 14.5 18.3 21.9
P/B (x) 7.8 34.3 - 6.6 5.8
EV/EBITDA (x) 30.1 11.0 32.4 23.3 19.8
P/E (x) 49.0 27.8 56.2 44.5 37.2
EV/share 699.6 304.4 817.6 816.2 817.9
No. of shares 6.8 1.2 7.5 7.5 7.5
Face Value 10 10 10 10 10
Dividend per share (|) 3.5 4
Dividends 26.3 30.1
Dividend tax 5.5 6.3
Total dividend outflow 31.8 36.4
EBIT (| crore) 202 243
EV/EBITDA (x) 23.3 19.8
Source: Company, ICICIdirect.com Research
ICICI Securities Ltd | Retail Equity Research Page 5
Exhibit 2: Assumptions
Assumptions FY19E FY20E
Timken revenues (| crore) 1356 1553
ABC utilisation 70% 75%
ABC revenues 296 317
Merged revenues 1,652 1,870
Timken EBITDA (| Crore) 207 245
ABC Margins 19.0% 20.5%
ABC EBITDA 56.2 64.9
Merged Entity EBITDA (| crore) 263.6 310.3
Merged Margins 16.0% 16.6%
Depreciation (| crore) 61 67
Interest costs (| crore) 5.4 7.8
PBT 196.8 235.5
Tax rate @ 30% 59.0 70.7
Merged entity PAT 137.8 164.9
Target P/E (x) 40.0
Target Mcap (| crore) 6,594
Fair value per share 877
CMP 815
Upside 7.6%
Source: Company, ICICIdirect.com Research

ICICI Securities Ltd | Retail Equity Research Page 6
Company Analysis (pre-merger)
Revenues to grow at 13.7% CAGR during FY17-20E
Timken’s revenues grew at 11.3% CAGR in FY13-17 led by strong
exports, which grew at over 17% CAGR during the same period. While
export revenues are expected to remain strong in FY17-20E, growth rates
are likely to moderate from here. We expect export revenues to grow at
14.7% in FY17-20E. Domestic revenues are also likely to show higher
growth rates on the back of the ensuing economic recovery. The recovery
pace across industrial demand has already seen some green shoots from
FY17 onwards. We expect domestic revenues to grow at 13.3% (including
revenues from services) vs. earlier growth of 9% in FY13-17. Accordingly,
we expect total revenues to grow at 13.7% in FY17-20E to | 1553.2 crore
in FY20E.
Exhibit 3: Revenue growth trend
1,050.8 1,056.2
1,187.9
1,356.1
1,553.2
-
200.0
400.0
600.0
800.0
1,000.0
1,200.0
1,400.0
1,600.0
1,800.0
FY16 FY17 FY18E FY19E FY20E
| c
rore
Net Sales
Source: Company, ICICIdirect.com Research
Exhibit 4: Break-up of revenues into various segment
640 666 746843
961
361 338382
443
510
50 52
60
70
82
0
200
400
600
800
1000
1200
1400
1600
1800
FY16 FY17 FY18E FY19E FY20E
| c
rore
Domestic Sales of Goods Exports Domestic Services & others
Source: Company, ICICIdirect.com Research
ICICI Securities Ltd | Retail Equity Research Page 7
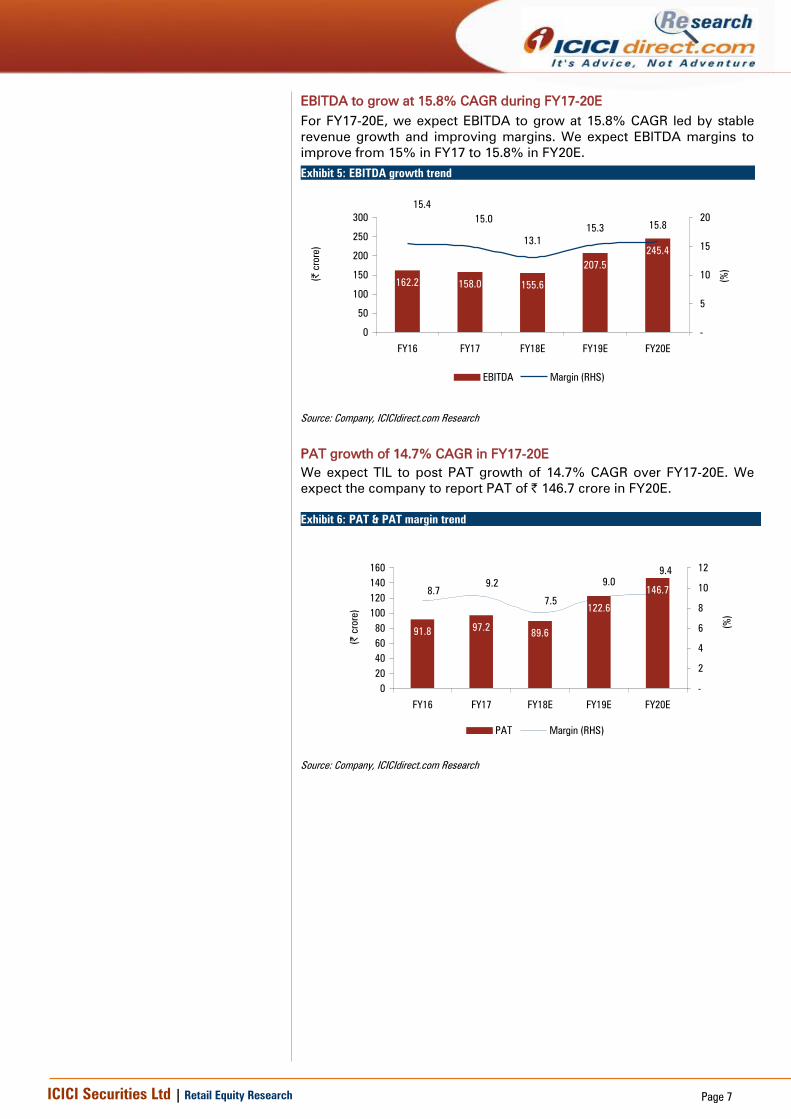
EBITDA to grow at 15.8% CAGR during FY17-20E
For FY17-20E, we expect EBITDA to grow at 15.8% CAGR led by stable
revenue growth and improving margins. We expect EBITDA margins to
improve from 15% in FY17 to 15.8% in FY20E.
Exhibit 5: EBITDA growth trend
162.2 158.0 155.6
207.5
245.4
13.1
15.315.8
15.4
15.0
0
50
100
150
200
250
300
FY16 FY17 FY18E FY19E FY20E
(|
crore)
-
5
10
15
20
(%
)
EBITDA Margin (RHS)
Source: Company, ICICIdirect.com Research
PAT growth of 14.7% CAGR in FY17-20E
We expect TIL to post PAT growth of 14.7% CAGR over FY17-20E. We
expect the company to report PAT of | 146.7 crore in FY20E.
Exhibit 6: PAT & PAT margin trend
91.897.2
89.6
122.6
146.78.7
9.2
7.5
9.0
9.4
0
20
40
60
80
100
120
140
160
FY16 FY17 FY18E FY19E FY20E
(|
crore)
-
2
4
6
8
10
12
(%
)PAT Margin (RHS)
Source: Company, ICICIdirect.com Research
ICICI Securities Ltd | Retail Equity Research Page 8
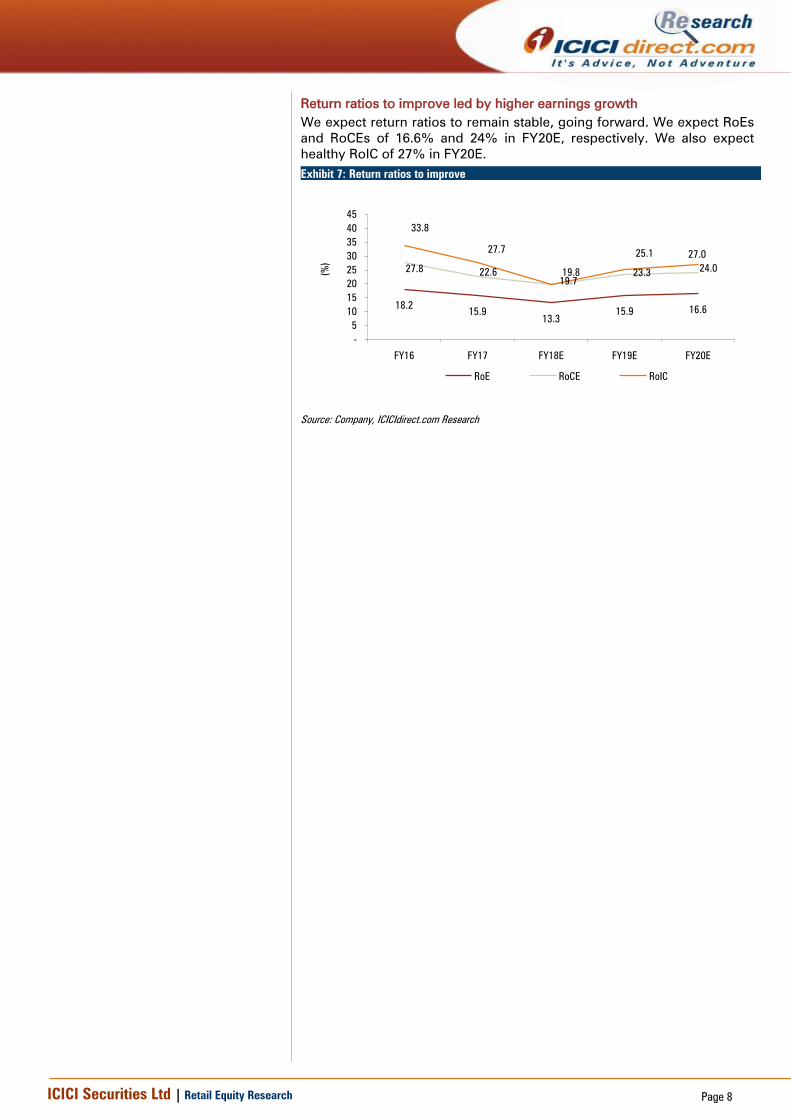
Return ratios to improve led by higher earnings growth
We expect return ratios to remain stable, going forward. We expect RoEs
and RoCEs of 16.6% and 24% in FY20E, respectively. We also expect
healthy RoIC of 27% in FY20E.
Exhibit 7: Return ratios to improve
18.215.9
13.3
15.9 16.6
27.822.6
19.7
23.324.0
33.8
27.7
19.8
25.1 27.0
-
5
10
15
20
25
30
35
40
45
FY16 FY17 FY18E FY19E FY20E
(%
)
RoE RoCE RoIC
Source: Company, ICICIdirect.com Research
ICICI Securities Ltd | Retail Equity Research Page 9
Outlook and Valuation
Timken India is one of the leading manufacturers of tapered roller
bearings and components in India with a manufacturing facility at
Jamshedpur and Raipur, which largely cater to medium and heavy trucks,
off-highway equipments, railways markets and exports. The company
meets the demand for other types of bearings viz. large size tapered roller
bearings, spherical roller bearings, cylindrical roller bearings and
speciality ball bearings by sourcing these from other Timken company
plants globally. To augment growth, the company has also executed
substantial capex as follows;
1. Capacity expansion of railway bearings (| 125 crore):
In order to meet rising global and domestic demand, the company
has planned a capacity expansion programme for railway bearings at
its Jamshedpur plant. The estimated investment for the project will be
| 124.7 crore, of which investment in plant and equipment will be
| 89.6 crore.
2. Tapered segment capacity expansion (| 64 crore):
This project involves expansion of tapered roller bearings 0-8 inches
finishing capacity at Jamshedpur through expansion of new cup,
cone and roller capacity involving an investment of | 64.3 crore. This
investment will primarily be made in plants and equipment.
In domestic markets, TIL is witnessing a pick-up in segments like CVs &
off-highway, railways and after-market segment. The management
continues to remain optimistic on these segments, going forward. In the
railways segment, TIL is eyeing significant business from the higher
demand for new wagons and new upcoming opportunities from this
segment. Accordingly, we expect the domestic segment to grow at a
healthy 13.3% CAGR in FY17-20E. We also expect exports to perform
better, going forward, due to strong demand for TIL’s bearings from the
heavy truck segment in international markets. TIL is also expected to be a
key hub for export to various customers of Timken entities. Accordingly,
we expect exports revenue to grow at 14.7% CAGR in FY17-20E. This
coupled with synergies from acquisition of ABC Bearings are likely to
accelerate topline and bottomline growth, going forward. We expect
revenue, EBITDA and PAT to grow at 14.5%, 17.8% and 14.8%,
respectively, for the consolidated entity in FY17-20E. We value the
company at 40x FY20E EPS of 21.9 to arrive at a target price of | 880. We
have a HOLD recommendation on the company.
ICICI Securities Ltd | Retail Equity Research Page 10
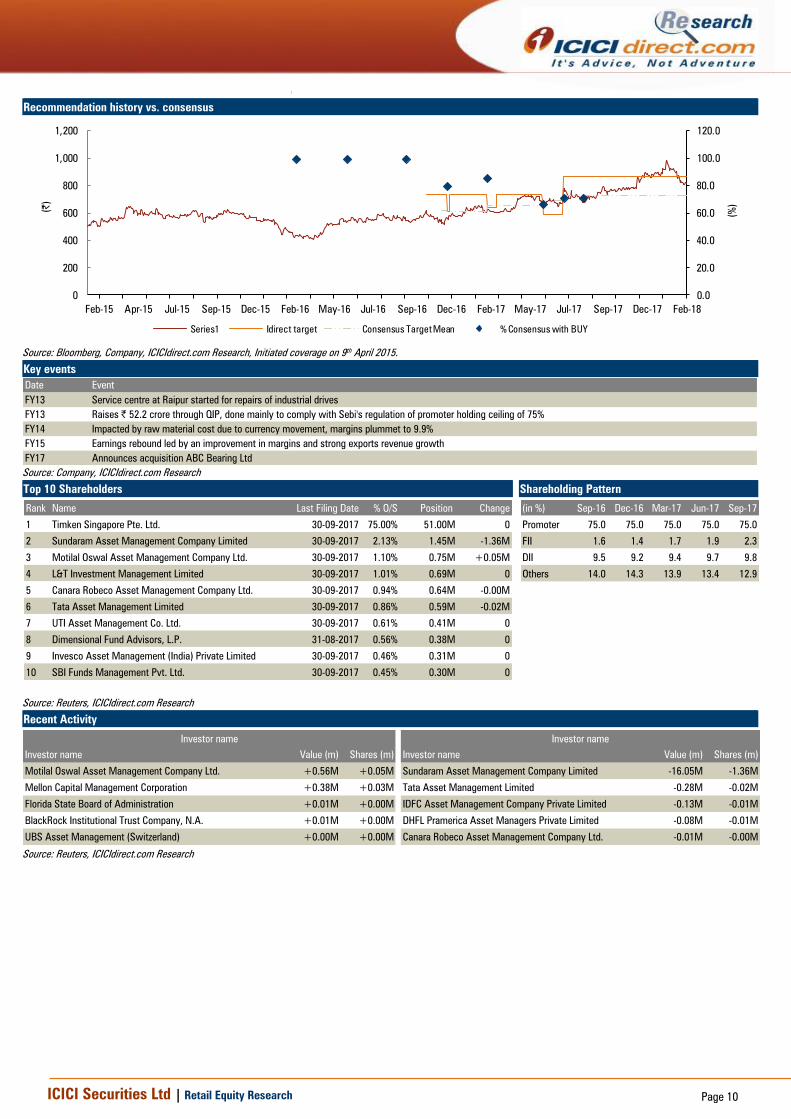
Recommendation history vs. consensus
0.0
20.0
40.0
60.0
80.0
100.0
120.0
0
200
400
600
800
1,000
1,200
Feb-18Dec-17Sep-17Jul-17May-17Feb-17Dec-16Sep-16Jul-16May-16Feb-16Dec-15Sep-15Jul-15Apr-15Feb-15
(%
)
(|)
Series1 Idirect target Consensus Target Mean % Consensus with BUY
Source: Bloomberg, Company, ICICIdirect.com Research, Initiated coverage on 9th April 2015.
Key events
Date Event
FY13 Service centre at Raipur started for repairs of industrial drives
FY13 Raises | 52.2 crore through QIP, done mainly to comply with Sebi's regulation of promoter holding ceiling of 75%
FY14 Impacted by raw material cost due to currency movement, margins plummet to 9.9%
FY15 Earnings rebound led by an improvement in margins and strong exports revenue growth
FY17 Announces acquisition ABC Bearing Ltd
Source: Company, ICICIdirect.com Research
Top 10 Shareholders Shareholding Pattern
Rank Name Last Filing Date % O/S Position Change
1 Timken Singapore Pte. Ltd. 30-09-2017 75.00% 51.00M 0
2 Sundaram Asset Management Company Limited 30-09-2017 2.13% 1.45M -1.36M
3 Motilal Oswal Asset Management Company Ltd. 30-09-2017 1.10% 0.75M +0.05M
4 L&T Investment Management Limited 30-09-2017 1.01% 0.69M 0
5 Canara Robeco Asset Management Company Ltd. 30-09-2017 0.94% 0.64M -0.00M
6 Tata Asset Management Limited 30-09-2017 0.86% 0.59M -0.02M
7 UTI Asset Management Co. Ltd. 30-09-2017 0.61% 0.41M 0
8 Dimensional Fund Advisors, L.P. 31-08-2017 0.56% 0.38M 0
9 Invesco Asset Management (India) Private Limited 30-09-2017 0.46% 0.31M 0
10 SBI Funds Management Pvt. Ltd. 30-09-2017 0.45% 0.30M 0
(in %) Sep-16 Dec-16 Mar-17 Jun-17 Sep-17
Promoter 75.0 75.0 75.0 75.0 75.0
FII 1.6 1.4 1.7 1.9 2.3
DII 9.5 9.2 9.4 9.7 9.8
Others 14.0 14.3 13.9 13.4 12.9
Source: Reuters, ICICIdirect.com Research
Recent Activity
Investor name Value (m) Shares (m) Investor name Value (m) Shares (m)
Motilal Oswal Asset Management Company Ltd. +0.56M +0.05M Sundaram Asset Management Company Limited -16.05M -1.36M
Mellon Capital Management Corporation +0.38M +0.03M Tata Asset Management Limited -0.28M -0.02M
Florida State Board of Administration +0.01M +0.00M IDFC Asset Management Company Private Limited -0.13M -0.01M
BlackRock Institutional Trust Company, N.A. +0.01M +0.00M DHFL Pramerica Asset Managers Private Limited -0.08M -0.01M
UBS Asset Management (Switzerland) +0.00M +0.00M Canara Robeco Asset Management Company Ltd. -0.01M -0.00M
Investor name Investor name
Source: Reuters, ICICIdirect.com Research

ICICI Securities Ltd | Retail Equity Research Page 11
Financial summary (pre-merger)
Profit and loss statement | Crore
(| Crore) FY17 FY18E FY19E FY20E
Net Sales 1,056.2 1,187.9 1,356.1 1,553.2
Other Operating Income - - - -
Total Operating Income 1,056.2 1,187.9 1,356.1 1,553.2
% Growth (Operating Income) 0.5 12.5 14.2 14.5
Other Income 9.9 24.0 28.0 34.0
Total Revenue 1,066.1 1,211.9 1,384.1 1,587.2
Cost of materials consumed 334.8 510.8 556.0 636.8
Purchase of stock-in-trade 282.4 231.6 264.4 298.2
Change in inventories 6.9 (35.6) (27.1) (31.1)
Employee cost 73.7 87.9 97.6 111.8
Other Expenses 200.5 237.6 257.7 292.0
Total expenditure 898.2 1,032.3 1,148.7 1,307.8
EBITDA 158.0 155.6 207.5 245.4
% Growth (EBITDA) (2.6) (1.5) 33.3 18.3
Interest 0.8 2.0 5.4 7.8
PBDT 167.1 177.6 230.1 271.6
Depreciation 28.9 43.8 46.8 52.4
PBT 138.2 133.9 183.3 219.2
Tax 41.0 44.3 60.7 72.6
PAT 97.2 89.6 122.6 146.7
% Growth (PAT) 5.9 (7.9) 36.9 19.6
EPS 14.3 13.2 18.0 21.6
Source: Company, ICICIdirect.com Research
Cash flow statement | Crore
(| Crore) FY17 FY18E FY19E FY20E
Profit after Tax 97.2 89.6 122.6 146.7
Depreciation 28.9 43.8 46.8 52.4
Interest 0.8 2.0 5.4 7.8
Other income (9.9) (24.0) (28.0) (34.0)
Prov for Taxation 41.0 44.3 60.7 72.6
Cash Flow before WC changes - - - -
Change in Working Capital (10.6) (37.3) (49.9) (58.7)
Taxes Paid (41.0) (44.3) (60.7) (72.6)
Cashflow from Operating Activities 106.4 74.0 96.9 114.1
(Purchase)/Sale of Fixed Assets (159.1) (50.0) (70.0) (70.0)
(Purchase)/Sale of Investments 28.4 (5.0) (10.0) -
Other Income 9.9 24.0 28.0 34.0
Cashflow from Investing Activities (120.8) (31.0) (52.0) (36.0)
Issue/(Repayment of Debt) 4.1 9.6 27.0 20.0
Interest (0.8) (2.0) (5.4) (7.8)
Others - - - -
Cashflow from Financing Activities 3.3 7.6 21.6 12.2
Changes in Cash (19.4) 25.9 37.7 57.5
Opening Cash/Cash Equivalent 33.2 13.8 39.7 77.4
Closing Cash/ Cash Equivalent 13.8 39.7 77.4 134.9
Source: Company, ICICIdirect.com Research
Balance sheet | Crore
(| Crore) FY17 FY18E FY19E FY20E
Share Capital 68 68 68 68
Reserves & Surplus 543 608 702 816
Total Shareholders fund 611 676 770 883
Minority Interest - - - -
Total debt 8.4 18.0 45.0 65.0
Other liabilities/Deferred tax liability (3.3) (3.3) (3.3) (3.3)
Total Liabilities 616 691 811 945
Gross Block 445 515 585 655
Acc: Depreciation 248 292 339 391
Net Block 197 223 246 264
Capital WIP 90 70 70 70
Investments 10 15 25 25
Inventory 188 212 242 277
Sundry debtors 190 212 242 277
Cash 14 40 77 135
Loans & Advances 63 71 81 93
Other current assets 13 14 16 18
CL& Prov. 148 166 188 214
Net Current Assets 319 383 470 587
Total Assets 616 691 811 945
Source: Company, ICICIdirect.com Research
Key ratios
(Year-end March) FY17 FY18E FY19E FY20E
Per share data (|)
EPS 14.3 13.2 18.0 21.6
Cash EPS 18.5 19.6 24.9 29.3
BV 89.9 99.4 113.2 129.9
DPS 1.2 3.6 4.2 4.8
Cash Per Share 36.5 42.9 49.8 57.5
Operating Ratios (%)
EBITDA Margin 15.0 13.1 15.3 15.8
PBT / Net Sales 12.2 9.4 11.8 12.4
PAT Margin 9.2 7.5 9.0 9.4
Inventory days 65.0 65.0 65.0 65.0
Debtor days 65.6 65.2 65.2 65.2
Creditor days 51.2 51.0 50.6 50.2
Return Ratios (%)
RoE 15.9 13.3 15.9 16.6
RoCE 22.6 19.7 23.3 24.0
RoIC 27.7 19.8 25.1 27.0
Valuation Ratios (x)
P/E 57.0 61.9 45.2 37.8
EV / EBITDA 35.0 35.5 26.5 22.3
EV / Net Sales 5.2 4.6 4.1 3.5
Market Cap / Sales 5.2 4.7 4.1 3.6
Price to Book Value 9.1 8.2 7.2 6.3
Solvency Ratios
Net Debt / Equity - - - -
Current Ratio 3.1 3.1 3.1 3.1
Quick Ratio 1.8 1.8 1.8 1.8
Source: Company, ICICIdirect.com Research
ICICI Securities Ltd | Retail Equity Research Page 12
RATING RATIONALE
ICICIdirect.com endeavours to provide objective opinions and recommendations. ICICIdirect.com assigns
ratings to its stocks according to their notional target price vs. current market price and then categorises them
as Strong Buy, Buy, Hold and Sell. The performance horizon is two years unless specified and the notional
target price is defined as the analysts' valuation for a stock.
Strong Buy: >15%/20% for large caps/midcaps, respectively, with high conviction;
Buy: >10%/15% for large caps/midcaps, respectively;
Hold: Up to +/-10%;
Sell: -10% or more;
Pankaj Pandey Head – Research [email protected]
ICICIdirect.com Research Desk,
ICICI Securities Limited,
1st Floor, Akruti Trade Centre,
Road No 7, MIDC,
Andheri (East)
Mumbai – 400 093
ICICI Securities Ltd | Retail Equity Research Page 13
Disclaimer
ANALYST CERTIFICATION
We /I, Chirag Shah PGDBM; Sagar Gandhi MBA (Finance), Research Analysts, authors and the names subscribed to this report, hereby certify that all of the views expressed in this research report accurately reflect our views about the subject
issuer(s) or securities. We also certify that no part of our compensation was, is, or will be directly or indirectly related to the specific recommendation(s) or view(s) in this report.
Terms & conditions and other disclosures:
ICICI Securities Limited (ICICI Securities) is a full-service, integrated investment banking and is, inter alia, engaged in the business of stock brokering and distribution of financial products. ICICI Securities Limited is a Sebi registered Research Analyst with Sebi Registration Number – INH000000990. ICICI Securities is a wholly-owned subsidiary of ICICI Bank which is India’s largest private sector bank and has its various subsidiaries engaged in businesses of housing finance, asset management, life insurance, general insurance, venture capital fund management, etc. (“associates”), the details in respect of which are available on www.icicibank.com.
ICICI Securities is one of the leading merchant bankers/ underwriters of securities and participate in virtually all securities trading markets in India. We and our associates might have investment banking and other business relationship with a significant percentage of companies covered by our Investment Research Department. ICICI Securities generally prohibits its analysts, persons reporting to analysts and their relatives from maintaining a financial interest in the securities or derivatives of any companies that the analysts cover.
The information and opinions in this report have been prepared by ICICI Securities and are subject to change without any notice. The report and information contained herein is strictly confidential and meant solely for the selected recipient and may not be altered in any way, transmitted to, copied or distributed, in part or in whole, to any other person or to the media or reproduced in any form, without prior written consent of ICICI Securities. While we would endeavour to update the information herein on a reasonable basis, ICICI Securities is under no obligation to update or keep the information current. Also, there may be regulatory, compliance or other reasons that may prevent ICICI Securities from doing so. Non-rated securities indicate that rating on a particular security has been suspended temporarily and such suspension is in compliance with applicable regulations and/or ICICI Securities policies, in circumstances where ICICI Securities might be acting in an advisory capacity to this company, or in certain other circumstances.
This report is based on information obtained from public sources and sources believed to be reliable, but no independent verification has been made nor is its accuracy or completeness guaranteed. This report and information herein is solely for informational purpose and shall not be used or considered as an offer document or solicitation of offer to buy or sell or subscribe for securities or other financial instruments. Though disseminated to all the customers simultaneously, not all customers may receive this report at the same time. ICICI Securities will not treat recipients as customers by virtue of their receiving this report. Nothing in this report constitutes investment, legal, accounting and tax advice or a representation that any investment or strategy is suitable or appropriate to your specific circumstances. The securities discussed and opinions expressed in this report may not be suitable for all investors, who must make their own investment decisions, based on their own investment objectives, financial positions and needs of specific recipient. This may not be taken in substitution for the exercise of independent judgment by any recipient. The recipient should independently evaluate the investment risks. The value and return on investment may vary because of changes in interest rates, foreign exchange rates or any other reason. ICICI Securities accepts no liabilities whatsoever for any loss or damage of any kind arising out of the use of this report. Past performance is not necessarily a guide to future performance. Investors are advised to see Risk Disclosure Document to understand the risks associated before investing in the securities markets. Actual results may differ materially from those set forth in projections. Forward-looking statements are not predictions and may be subject to change without notice.
ICICI Securities or its associates might have managed or co-managed public offering of securities for the subject company or might have been mandated by the subject company for any other assignment in the past twelve months.
ICICI Securities or its associates might have received any compensation from the companies mentioned in the report during the period preceding twelve months from the date of this report for services in respect of managing or co-managing public offerings, corporate finance, investment banking or merchant banking, brokerage services or other advisory service in a merger or specific transaction.
ICICI Securities or its associates might have received any compensation for products or services other than investment banking or merchant banking or brokerage services from the companies mentioned in the report in the past twelve months.
ICICI Securities encourages independence in research report preparation and strives to minimize conflict in preparation of research report. ICICI Securities or its associates or its analysts did not receive any compensation or other benefits from the companies mentioned in the report or third party in connection with preparation of the research report. Accordingly, neither ICICI Securities nor Research Analysts and their relatives have any material conflict of interest at the time of publication of this report.
It is confirmed that Chirag Shah PGDBM; Sagar Gandhi MBA (Finance), Research Analysts of this report have not received any compensation from the companies mentioned in the report in the preceding twelve months.
Compensation of our Research Analysts is not based on any specific merchant banking, investment banking or brokerage service transactions.
ICICI Securities or its subsidiaries collectively or Research Analysts or their relatives do not own 1% or more of the equity securities of the Company mentioned in the report as of the last day of the month preceding the publication of the research report.
Since associates of ICICI Securities are engaged in various financial service businesses, they might have financial interests or beneficial ownership in various companies including the subject company/companies mentioned in this report.
It is confirmed that Chirag Shah PGDBM; Sagar Gandhi MBA (Finance), Research Analysts do not serve as an officer, director or employee of the companies mentioned in the report.
ICICI Securities may have issued other reports that are inconsistent with and reach different conclusion from the information presented in this report.
Neither the Research Analysts nor ICICI Securities have been engaged in market making activity for the companies mentioned in the report.
We submit that no material disciplinary action has been taken on ICICI Securities by any Regulatory Authority impacting Equity Research Analysis activities.
This report is not directed or intended for distribution to, or use by, any person or entity who is a citizen or resident of or located in any locality, state, country or other jurisdiction, where such distribution, publication, availability or use would be contrary to law, regulation or which would subject ICICI Securities and affiliates to any registration or licensing requirement within such jurisdiction. The securities described herein may or may not be eligible for sale in all jurisdictions or to certain category of investors. Persons in whose possession this document may come are required to inform themselves of and to observe such restriction.