nifty highlights - icici direct
TRANSCRIPT
ICICI Securities Ltd. | Retail Equity Research
October 6, 2017
Q2FY18 Result Preview
Robust topline growth shaking off GST jitters…
The last three quarters were interspersed with one-time structural
events of demonetisation and GST implementation, which led to
subdued topline growth for sectors characterised by long supply
chains. However, contrary to the expectation of GST putting brakes on
the structural story of strong domestic consumption led growth, post
implementation, Q2FY18E is expected to witness strong topline growth
of 8.8% YoY (ex BFSI and oil & gas) with most sectors warding off the
GST jitters. Re-stocking post GST is expected to accentuate the growth
in this festivity laden quarter
Consumer driven sectors like FMCG & consumer discretionary that
witnessed muted business activity in Q1FY8 amid de-stocking of
channel inventory are expected to exhibit a growth revival in Q2FY18
on account of re-stocking and price revision in items like cigarette, fans,
cables, etc, due to change in tax slab post GST implementation.
Another beneficiary of re-stocking was auto and ancillary that witnessed
strong double digit volume growth of ~12% (vs. 7% in Q1FY18) across
sub-segments (except 3-W). Major sectors like oil & gas and metal &
mining will benefit from higher commodity prices. They may prove to
be key contributors in the topline growth of our coverage universe
However, certain export driven sectors, viz. pharma & IT have been
witnessing a slowdown in business in recent quarters. The same trend
is expected in Q2FY18E. While the IT sector is facing an uncertain
demand environment due to emerging technologies & protectionist
measures across regions, the pharma space is experiencing acute
pricing pressure in US, albeit domestic pharma has experienced
recovery post GST. The telecom sector also continues to witness steep
pricing led competition, leading to sharp decline in financials
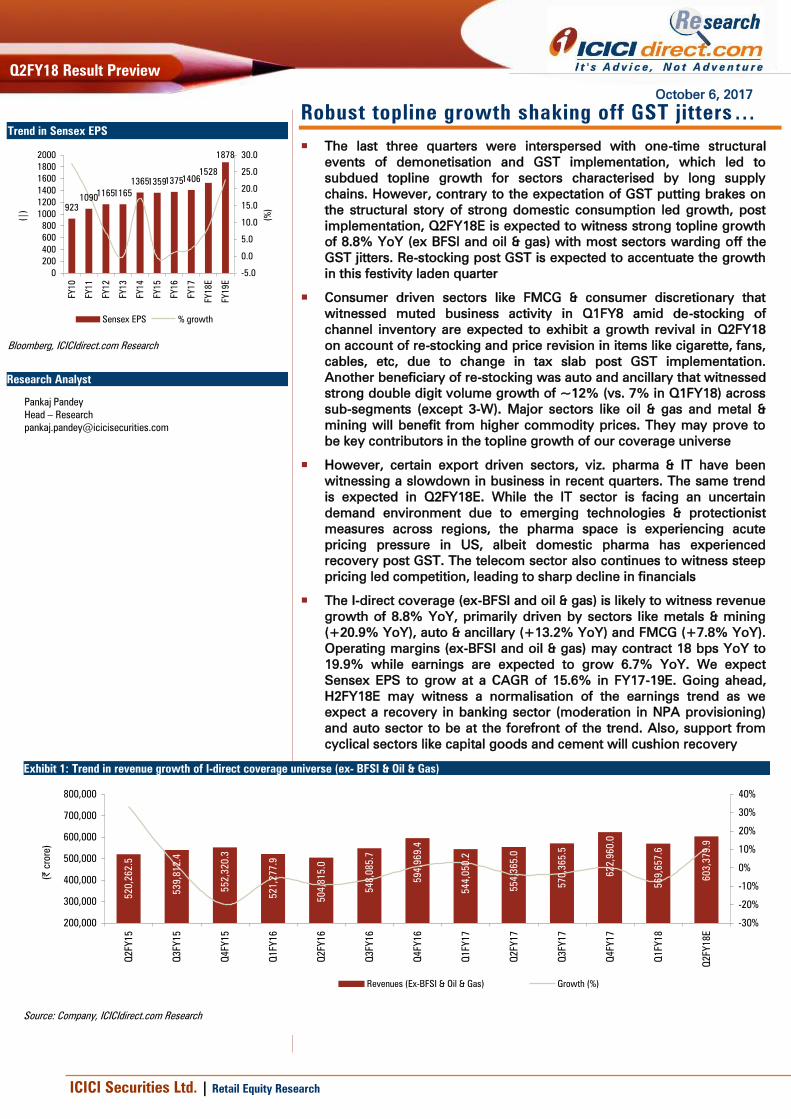
The I-direct coverage (ex-BFSI and oil & gas) is likely to witness revenue
growth of 8.8% YoY, primarily driven by sectors like metals & mining
(+20.9% YoY), auto & ancillary (+13.2% YoY) and FMCG (+7.8% YoY).
Operating margins (ex-BFSI and oil & gas) may contract 18 bps YoY to
19.9% while earnings are expected to grow 6.7% YoY. We expect
Sensex EPS to grow at a CAGR of 15.6% in FY17-19E. Going ahead,
H2FY18E may witness a normalisation of the earnings trend as we
expect a recovery in banking sector (moderation in NPA provisioning)
and auto sector to be at the forefront of the trend. Also, support from
cyclical sectors like capital goods and cement will cushion recovery
Exhibit 1: Trend in revenue growth of I-direct coverage universe (ex- BFSI & Oil & Gas)
520,2
62.5
539,8
12.4
552,3
20.3
521,2
77.9
504,8
15.0
548,0
85.7
594,9
69.4
544,0
50.2
554,3
65.0
570,3
65.5
622,9
60.0
569,6
57.6
603,3
79.9
200,000
300,000
400,000
500,000
600,000
700,000
800,000
Q2FY15
Q3FY15
Q4FY15
Q1FY16
Q2FY16
Q3FY16
Q4FY16
Q1FY17
Q2FY17
Q3FY17
Q4FY17
Q1FY18
Q2FY18E
(|
crore)
-30%
-20%
-10%
0%
10%
20%
30%
40%
Revenues (Ex-BFSI & Oil & Gas) Growth (%)
Source: Company, ICICIdirect.com Research
Trend in Sensex EPS
923
109011651165
1365135913751406
1528
1878
0
200
400
600
800
1000
1200
1400
1600
1800
2000
FY10
FY11
FY12
FY13
FY14
FY15
FY16
FY17
FY18E
FY19E
(|
)
-5.0
0.0
5.0
10.0
15.0
20.0
25.0
30.0
(%
)
Sensex EPS % growth
Source:
Bloomberg, ICICIdirect.com Research
Research Analyst
Pankaj Pandey
Head – Research
ICICI Securities Ltd. | Retail Equity Research
Page 2
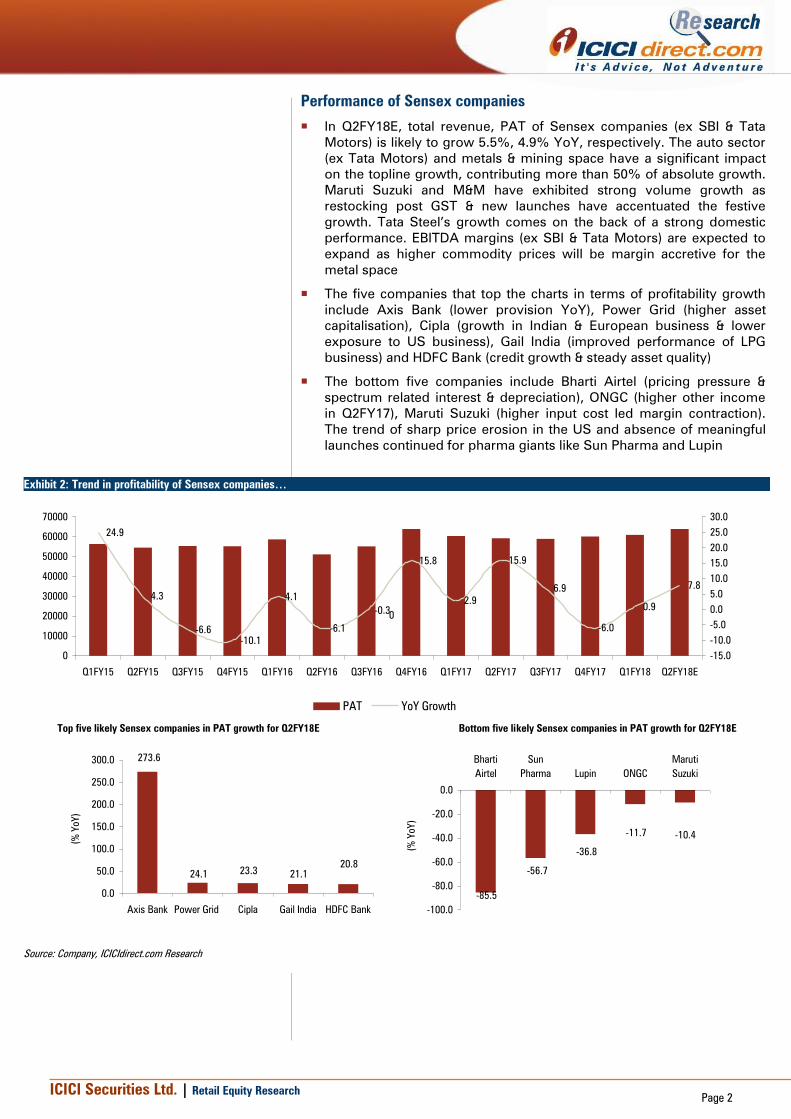
Performance of Sensex companies
In Q2FY18E, total revenue, PAT of Sensex companies (ex SBI & Tata
Motors) is likely to grow 5.5%, 4.9% YoY, respectively. The auto sector
(ex Tata Motors) and metals & mining space have a significant impact
on the topline growth, contributing more than 50% of absolute growth.
Maruti Suzuki and M&M have exhibited strong volume growth as
restocking post GST & new launches have accentuated the festive
growth. Tata Steel’s growth comes on the back of a strong domestic
performance. EBITDA margins (ex SBI & Tata Motors) are expected to
expand as higher commodity prices will be margin accretive for the
metal space
The five companies that top the charts in terms of profitability growth
include Axis Bank (lower provision YoY), Power Grid (higher asset
capitalisation), Cipla (growth in Indian & European business & lower
exposure to US business), Gail India (improved performance of LPG
business) and HDFC Bank (credit growth & steady asset quality)
The bottom five companies include Bharti Airtel (pricing pressure &
spectrum related interest & depreciation), ONGC (higher other income
in Q2FY17), Maruti Suzuki (higher input cost led margin contraction).
The trend of sharp price erosion in the US and absence of meaningful
launches continued for pharma giants like Sun Pharma and Lupin
Exhibit 2: Trend in profitability of Sensex companies…
24.9
4.3
-6.6
-10.1
4.1
-6.1
-0.3
15.8
2.9
15.9
6.9
-6.0
0.9
7.8
0
10000
20000
30000
40000
50000
60000
70000
Q1FY15 Q2FY15 Q3FY15 Q4FY15 Q1FY16 Q2FY16 Q3FY16 Q4FY16 Q1FY17 Q2FY17 Q3FY17 Q4FY17 Q1FY18 Q2FY18E
-15.0
-10.0
-5.0
0.0
5.0
10.0
15.0
20.0
25.0
30.0
PAT YoY Growth
0
Top five likely Sensex companies in PAT growth for Q2FY18E Bottom five likely Sensex companies in PAT growth for Q2FY18E
273.6
24.123.3
21.1
20.8
0.0
50.0
100.0
150.0
200.0
250.0
300.0
Axis Bank Power Grid Cipla Gail India HDFC Bank
(%
YoY)
-85.5
-56.7
-36.8
-11.7 -10.4
-100.0
-80.0
-60.0
-40.0
-20.0
0.0
Bharti
Airtel
Sun
Pharma Lupin ONGC
Maruti
Suzuki
(%
YoY)
Source: Company, ICICIdirect.com Research

ICICI Securities Ltd. | Retail Equity Research
Page 3
What we expect our coverage universe to report; emerging trends
From a sectoral perspective, sectors like auto (ex-Tata Motors 22%
YoY), metals & mining (20.9% YoY), oil & gas (17.1% YoY) and cement
(11.7% YoY) are expected to report strong revenue growth backed by
both volume & realisation growth and also led by inorganic growth in
certain auto ancillary & cement companies . However, the telecom
sector is expected to witness a sales decline of 9.9% YoY as post GST
jitters added to the competitive pressure
In the banking space, credit growth remains muted at 6.8% YoY. PSU
banks are expected to continue to see single digit growth of ~5.5% YoY
while private banks continue to clock strong 17.9% YoY growth.
Positive developments in the steel sector and large players evincing
buying interest in companies referred to NCLT under IBC (viz. Essar
Steel, Bhushan Steel & Monnet Ispat) may lead to provisions write-back
in coming quarters. Savings interest rate cut of 50 bps by the largest
bank remained the highlight of the quarter, with other banks following
suit. Accordingly, a decline in interest expense would support NII. A
higher cut in deposit rates, compared to a decline in MCLR, is expected
to result in NII growth of 13.1% YoY and 3.1% QoQ for our coverage
universe. We expect our banking coverage universe PPP to grow 14.9%
YoY and 2.9% QoQ while PAT is seen growing 39% YoY and 8.7% QoQ
For Q2FY18E, overall auto volumes registered strong ~12% YoY
growth mainly due to 1) re-stocking of vehicles by dealers post
implementation of GST and 2) higher inventory build-up across the
dealer network ahead of the festive season. The quarter was among the
best, as all segments reported healthy volume growth. The standout
from the space was the 2-W & tractor segment, which reported robust
growth of ~12% YoY & ~30% YoY, respectively. The PV space
maintained its growth momentum with volumes up ~10% YoY. Further,
a demand revival was seen in 3-W (volumes up ~8% YoY backed by
both domestic & export demand) and CV (volumes up ~15% YoY,
mainly due to a recovery in the M&HCV segment). The quarter was
among the best for most OEMs, which reported healthy YoY and QoQ
volume growth. Thus, we estimate our universe [ex-Tata Motors (TML)]
to report topline growth of ~22% YoY. Further, higher raw material cost
(prices of key commodities viz. steel & aluminium were up 19% YoY
each) is likely to impact EBITDA margins of our universe (ex-TML),
which is expected to decline 170 bps YoY to 14.1%
In the capital goods space in Q2FY18E, EPC companies are expected to
face interim headwinds in execution and elongation of working capital
cycle due to transition of the sub contractor/vendor value chain in the
GST process. This may lead EPC companies to lend support to their
vendor base and, hence, will impact working capital in Q2FY18E. In
turn, the move may lead to some rise in interest cost. However, the
same may be contained till Q2FY18E. We expect EPC companies to
post muted revenue growth of 3.9%YoY (lower execution from sub
contractor will slow execution in Q2FY18E). However, PAT is expected
to grow 9.6% YoY on the back of a margins expansion. For Q2FY18E,
product based companies are expected to report 9.1% YoY revenue
growth. However, pressure on EBITDA margins is likely to continue.
The same is expected to contract 50 bps to 16.1% for the quarter.
Consequently, absolute EBITDA is expected to grow by only 0.8% in
Q2FY18E.
Cement demand is expected to remain muted mainly due to the impact
of monsoon and sand mining issue in many parts of India. Hence, on an
organic basis, we expect companies under our coverage to report flat
to negative volume growth. However, considering the acquisition of
ICICI Securities Ltd. | Retail Equity Research
Page 4
Jaypee by UltraTech, merger of Trinetra Cement by India Cement and
capacity expansion by various companies under our coverage universe,
we expect companies to report optically higher volume growth.
Consequently, we expect companies in our coverage universe to
register volume growth of 10.5% YoY in Q2FY18E. In addition, we
expect realisation to increase 1.4% YoY leading to revenue growth of
11.7% YoY in Q2FY18E. However, higher other expenses (due to
increase in maintenance cost), rise in power (led by higher pet coke
prices) and freight cost may dent EBITDA/t (down 9.7% YoY to | 799/t)
in Q2FY18E
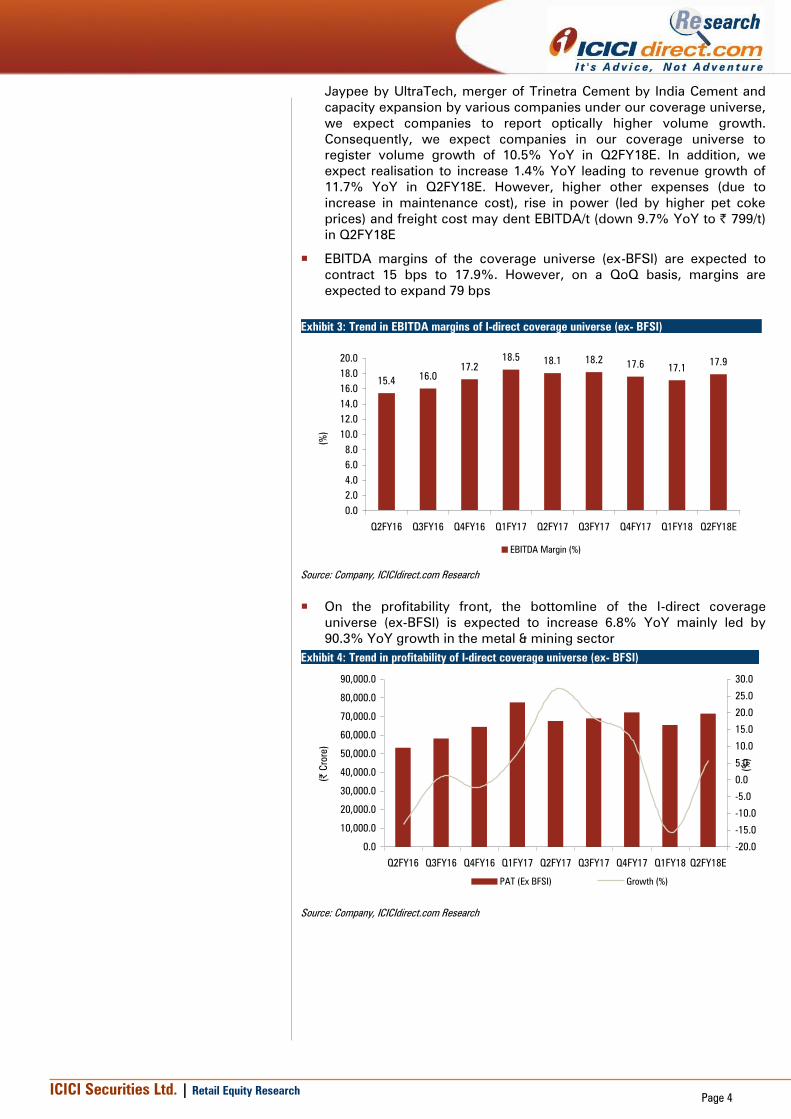
EBITDA margins of the coverage universe (ex-BFSI) are expected to
contract 15 bps to 17.9%. However, on a QoQ basis, margins are
expected to expand 79 bps
On the profitability front, the bottomline of the I-direct coverage
universe (ex-BFSI) is expected to increase 6.8% YoY mainly led by
90.3% YoY growth in the metal & mining sector
Exhibit 4: Trend in profitability of I-direct coverage universe (ex- BFSI)
0.0
10,000.0
20,000.0
30,000.0
40,000.0
50,000.0
60,000.0
70,000.0
80,000.0
90,000.0
Q2FY16 Q3FY16 Q4FY16 Q1FY17 Q2FY17 Q3FY17 Q4FY17 Q1FY18 Q2FY18E
(|
Crore)
-20.0
-15.0
-10.0
-5.0
0.0
5.0
10.0
15.0
20.0
25.0
30.0
(%
)
PAT (Ex BFSI) Growth (%)
Source: Company, ICICIdirect.com Research
Exhibit 3: Trend in EBITDA margins of I-direct coverage universe (ex- BFSI)
15.416.0
17.2
18.518.1 18.2
17.617.1
17.9
0.0
2.0
4.0
6.0
8.0
10.0
12.0
14.0
16.0
18.0
20.0
Q2FY16 Q3FY16 Q4FY16 Q1FY17 Q2FY17 Q3FY17 Q4FY17 Q1FY18 Q2FY18E
(%
)
EBITDA Margin (%)
Source: Company, ICICIdirect.com Research
ICICI Securities Ltd. | Retail Equity Research
Page 5
Defensives: Consumption sectors impacted by GST…
(Sector composition: consumer discretionary, IT, FMCG, healthcare)
Key highlights:
In the past seven years, the defensive sector has never reported
revenue de-growth in any quarter. However, events like demonetisation
& GST rollout have slowed down the topline growth from Q3FY17
onwards. Defensives are expected to post revenue growth of 4.8% YoY
compared to average revenue growth of 10.7% in the previous 12
quarters. Although the FMCG sector continues to witness some
pressure on account of GST in the form of disruption in wholesale
channel & slower rural recovery, the topline growth can be attributed to
price hikes like in cigarette post GST rate revision. In the healthcare
space, a slowdown in the US is likely to overshadow domestic growth,
which is expected to see revival post-GST implementation. The EBITDA
margin of the defensive universe is expected to contract 131 bps YoY
mainly due to margin contraction of 388 bps in the pharma space on
account of sharp price erosion in the US. The ensuing EBITDA, PAT of
the defensive universe is expected to decline 1.2% YoY & 2.6% YoY,
respectively
Tier-1 IT companies are expected to report constant currency (CC)
growth of 0.5-2.8% with HCL Tech leading the pack. Cross currency
could provide strength by ~100-130 bps to reported dollar growth.
Inter-quarter average US$ has depreciated vs. major currencies acting
as a tailwind. US$ has depreciated ~0.3%, 6.7%, 2.2% and 5.2%
against rupee, Euro, GBP and AU$, respectively. Tier-I IT companies are
likely to report average 3.1% growth in $ terms in Q2FY18E. Within tier-
I, HCLT (4.0%) may lead again supported by inorganic contribution
(0.8%) followed by Infosys (3.5%), TCS (3.2%) and Wipro (1.5%). Within
midcaps, we expect sequential dollar revenue growth to be broad
based across companies led by Cyient (5.3%), Persistent (3.9%), TechM
(2.5%) followed by NIIT Tech (2.9%), MindTree (2.5%) and KPIT (2.5%).
Persistent, TechM and NIIT Tech would benefit from the contribution of
acquisitions. On the operating margins front, absence of higher visa
cost and wage hikes for a few companies would provide a cushion to
margins in a seasonally strong Q2
In the first quarter, after implementation of GST, our FMCG universe is
expected to witness some pressure in its performance. This is largely
on account of a) slower rural recovery, b) disruption in the wholesale
channel and c) some chaos related to GST rates and accounting. We
estimate our universe will report revenue growth of 7.8% YoY
supported by FMCG behemoths ITC and HUL, expected to post growth
of 11.6% and 5.5% YoY, respectively. The only company that may
report a sales decline in our universe is Colgate, where we are
expecting a decline of 6.5% YoY, on account of price cuts on account of
lower tax incidence under GST regime. On account of some relief on
the commodity front, rationalisation of ad-ex (for major players) and
price hikes in cigarettes, we expect the EBITDA of our coverage
universe to grow 11.8% YoY. Further, we estimate 8.0% YoY growth in
profit for our coverage
I-direct healthcare universe is expected to register mere ~3% YoY
growth to | 39389 crore undermined by continuous price erosion in the
US base business. We expect US business (selected pack) to decline
11% YoY to | 10452 crore. Almost all players from the universe are
facing intense competition in existing products in the US due to client
consolidation and acceleration in product approvals momentum by the
USFDA. The intensity of price erosion is anywhere between high single
digit to low double digit. On the domestic front, we expect ~10% YoY
growth to | 9334 crore (select pack) as most companies are expecting
ICICI Securities Ltd. | Retail Equity Research
Page 6
normalcy to return in distribution channels. However, due to GST
related changes in accounting and reporting, domestic growth numbers
may witness a marginal negative impact
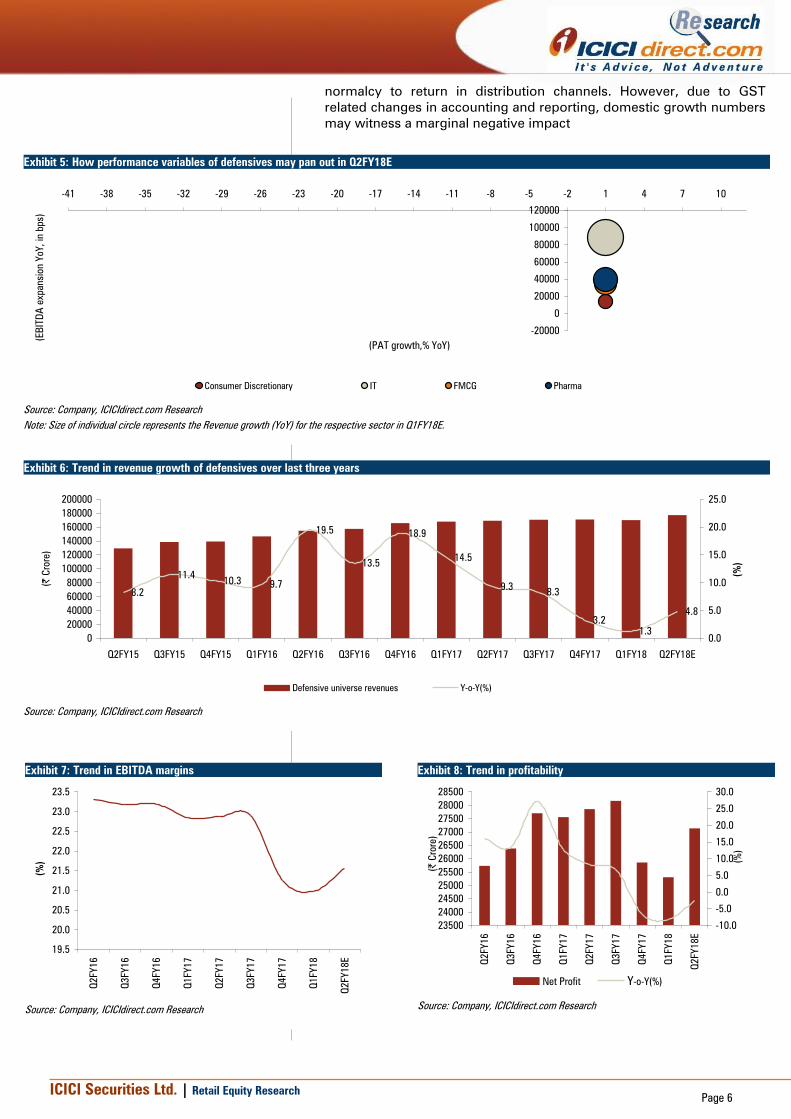
Exhibit 5: How performance variables of defensives may pan out in Q2FY18E
-20000
0
20000
40000
60000
80000
100000
120000
-41 -38 -35 -32 -29 -26 -23 -20 -17 -14 -11 -8 -5 -2 1 4 7 10
(PAT growth,% YoY)
(EB
ITD
A e
xpansio
n Y
oY,
in b
ps)
Consumer Discretionary IT FMCG Pharma
Source: Company, ICICIdirect.com Research
Note: Size of individual circle represents the Revenue growth (YoY) for the respective sector in Q1FY18E.
Exhibit 6: Trend in revenue growth of defensives over last three years
8.2
11.410.3
9.7
19.5
13.5
18.9
14.5
9.38.3
3.2
1.3
4.8
0
20000
40000
60000
80000
100000
120000
140000
160000
180000
200000
Q2FY15 Q3FY15 Q4FY15 Q1FY16 Q2FY16 Q3FY16 Q4FY16 Q1FY17 Q2FY17 Q3FY17 Q4FY17 Q1FY18 Q2FY18E
(|
Crore)
0.0
5.0
10.0
15.0
20.0
25.0
(%
)
Defensive universe revenues Y-o-Y(%)
Source: Company, ICICIdirect.com Research
Exhibit 7: Trend in EBITDA margins
19.5
20.0
20.5
21.0
21.5
22.0
22.5
23.0
23.5
Q2FY16
Q3FY16
Q4FY16
Q1FY17
Q2FY17
Q3FY17
Q4FY17
Q1FY18
Q2FY18E
(%
)
Source: Company, ICICIdirect.com Research
Exhibit 8: Trend in profitability
23500
24000
24500
25000
25500
26000
26500
27000
27500
28000
28500
Q2FY16
Q3FY16
Q4FY16
Q1FY17
Q2FY17
Q3FY17
Q4FY17
Q1FY18
Q2FY18E
(|
Crore)
-10.0
-5.0
0.0
5.0
10.0
15.0
20.0
25.0
30.0
(%
)
Net Profit Y-o-Y(%)
Source: Company, ICICIdirect.com Research
ICICI Securities Ltd. | Retail Equity Research
Page 7
Cyclicals: Visible signs of pick-up in capex cycle
(Sector composition: auto, cement, capital goods, power, infrastructure,
real estate, oil & gas and telecom)
Key Highlights
Cyclicals are expected to witness strong growth of 13% YoY after 11
quarters of de-growth. This high growth is expected to be mainly driven
by 17% YoY growth in the oil & gas sector led by higher gross refining
margins reported by oil marketing companies. The power sector is
likely to continue its growth momentum (~7.2% YoY growth) on the
back of generation & capacity addition
We expect the oil & gas sector to report a decent set of numbers in
Q2FY18E. Realisations of upstream oil & gas companies are expected to
grow QoQ on account of 3.3% QoQ growth in average Brent crude oil
prices to US$ 51.7/bbl. Also, increase in oil & gas production is
expected to augur well for upstream companies. On the OMCs front, we
expect strong GRMs supported by high product spreads and inventory
gains with benchmark Singapore GRMs rising from US$6.4/bbl in
Q1FY18 to US$8.3/bbl in Q2FY18. However, marketing volumes are
expected to remain muted. On the gas utility front, we expect stable
growth in volumes due to increase in domestic gas production and
imported LNG. Continued demand from city gas distribution, lower
domestic gas prices and relatively stable spot LNG prices are expected
to bode well for gas utility companies
In the metal space, on a sequential basis, we expect the EBITDA/tonne
of steel players to increase while non-ferrous players are also likely to
report healthy revenues and profitability. On account of an increase in
domestic steel prices and moderation in the prices of coking coal (key
raw material), we expect steel players to report healthy EBITDA/tonne
sequentially. During Q2FY18, majority of base metal prices witnessed
an increase on a YoY and QoQ basis. Average zinc prices during the
quarter were at US$2962/tonne (up 32% YoY, 14% QoQ). Average lead
prices were at US$2331/tonne (up 24% YoY, 8% QoQ). The average
price of aluminium was at US$2010/tonne (up 24% YoY, 6% QoQ) while
average copper prices were at US$6351/tonne (up 33% YoY, 12%
QoQ). We expect higher prices to augment the topline and profitability
of non-ferrous players
Overall, the power generation during April-August 2017 is up 4.6% YoY
while in August 2017 the same was up 7.9% YoY. In terms of segmental
(YTD) basis, thermal generation is up 5% YoY while hydro has seen
moderate growth of 5.8% YoY albeit peak season. On the other hand,
renewable segment witnessed 30.2% YoY growth in generation during
April-July 2017, mainly on the back of strong capacity addition in FY17.
On a segmental basis, central level utilities saw higher than average
PLFs at 70% while that of state and private IPPs meaningfully improved
to 64% and 55%, respectively. On the conventional side, no capacity
addition was reported in Q2FY18E
ICICI Securities Ltd. | Retail Equity Research
Page 8
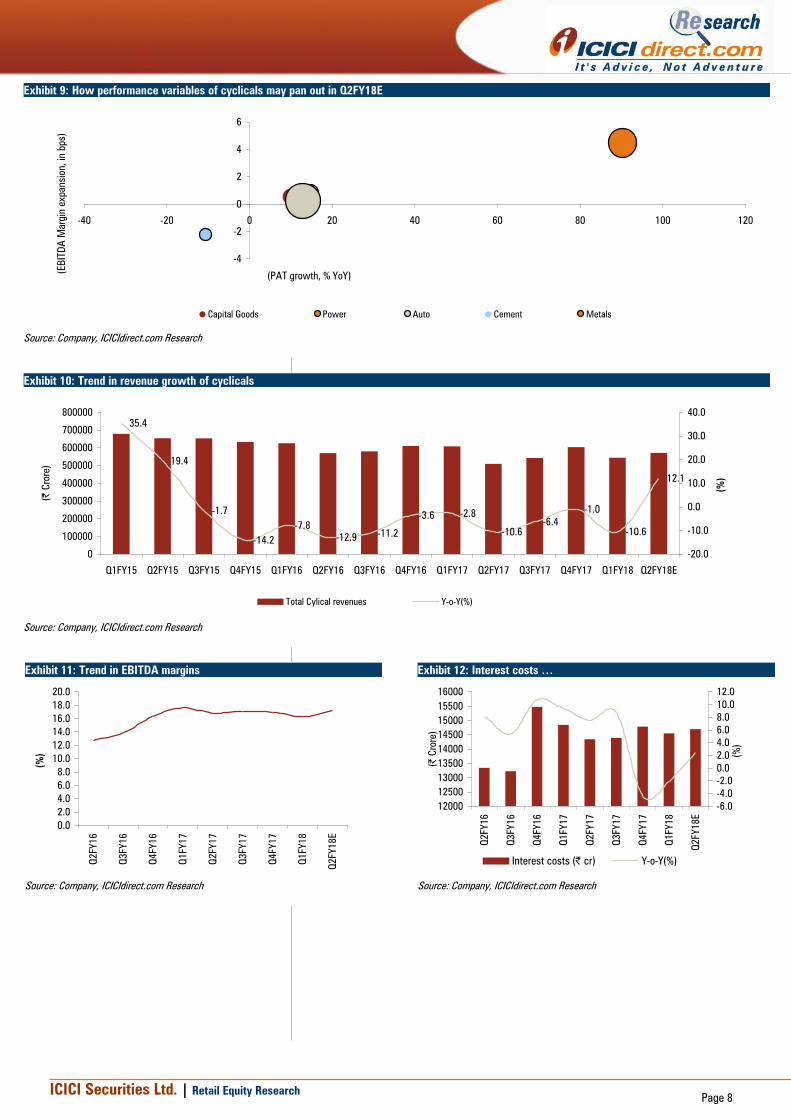
Exhibit 9: How performance variables of cyclicals may pan out in Q2FY18E
-4
-2
0
2
4
6
-40 -20 0 20 40 60 80 100 120
(PAT growth, % YoY)
(EB
ITD
A M
argin
expansio
n, in
bps)
Capital Goods Power Auto Cement Metals
Source: Company, ICICIdirect.com Research
Exhibit 10: Trend in revenue growth of cyclicals
35.4
19.4
-1.7
-14.2
-7.8
-12.9-11.2
-3.6 -2.8
-10.6
-6.4
-1.0
-10.6
12.1
0
100000
200000
300000
400000
500000
600000
700000
800000
Q1FY15 Q2FY15 Q3FY15 Q4FY15 Q1FY16 Q2FY16 Q3FY16 Q4FY16 Q1FY17 Q2FY17 Q3FY17 Q4FY17 Q1FY18 Q2FY18E
(|
Crore)
-20.0
-10.0
0.0
10.0
20.0
30.0
40.0
(%
)
Total Cylical revenues Y-o-Y(%)
Source: Company, ICICIdirect.com Research
Exhibit 11: Trend in EBITDA margins
0.0
2.0
4.0
6.0
8.0
10.0
12.0
14.0
16.0
18.0
20.0
Q2FY16
Q3FY16
Q4FY16
Q1FY17
Q2FY17
Q3FY17
Q4FY17
Q1FY18
Q2FY18E
(%
)
Source: Company, ICICIdirect.com Research
Exhibit 12: Interest costs …
12000
12500
13000
13500
14000
14500
15000
15500
16000
Q2FY16
Q3FY16
Q4FY16
Q1FY17
Q2FY17
Q3FY17
Q4FY17
Q1FY18
Q2FY18E
(|
Crore)
-6.0
-4.0
-2.0
0.0
2.0
4.0
6.0
8.0
10.0
12.0
(%
)
Interest costs (| cr) Y-o-Y(%)
Source: Company, ICICIdirect.com Research
ICICI Securities Ltd. | Retail Equity Research
Page 9
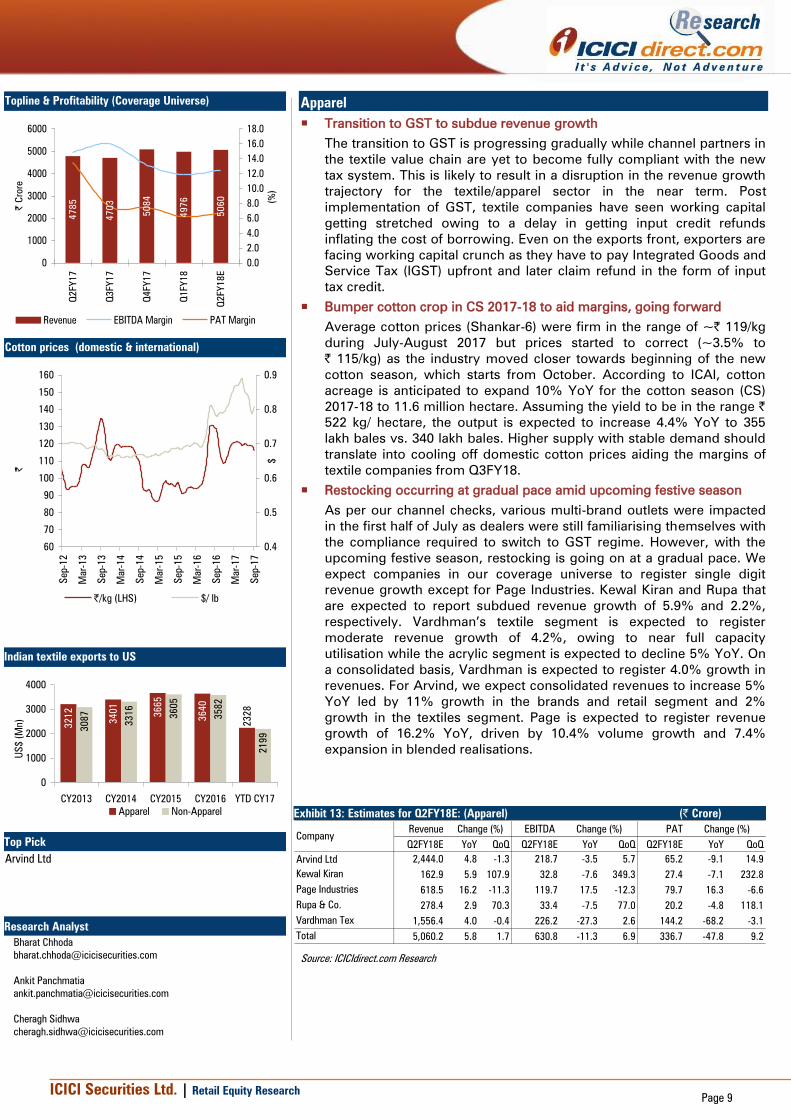
Apparel
Transition to GST to subdue revenue growth
The transition to GST is progressing gradually while channel partners in
the textile value chain are yet to become fully compliant with the new
tax system. This is likely to result in a disruption in the revenue growth
trajectory for the textile/apparel sector in the near term. Post
implementation of GST, textile companies have seen working capital
getting stretched owing to a delay in getting input credit refunds
inflating the cost of borrowing. Even on the exports front, exporters are
facing working capital crunch as they have to pay Integrated Goods and
Service Tax (IGST) upfront and later claim refund in the form of input
tax credit.
Bumper cotton crop in CS 2017-18 to aid margins, going forward
Average cotton prices (Shankar-6) were firm in the range of ~| 119/kg
during July-August 2017 but prices started to correct (~3.5% to
| 115/kg) as the industry moved closer towards beginning of the new
cotton season, which starts from October. According to ICAI, cotton
acreage is anticipated to expand 10% YoY for the cotton season (CS)
2017-18 to 11.6 million hectare. Assuming the yield to be in the range |
522 kg/ hectare, the output is expected to increase 4.4% YoY to 355
lakh bales vs. 340 lakh bales. Higher supply with stable demand should
translate into cooling off domestic cotton prices aiding the margins of
textile companies from Q3FY18.
Restocking occurring at gradual pace amid upcoming festive season
As per our channel checks, various multi-brand outlets were impacted
in the first half of July as dealers were still familiarising themselves with
the compliance required to switch to GST regime. However, with the
upcoming festive season, restocking is going on at a gradual pace. We
expect companies in our coverage universe to register single digit
revenue growth except for Page Industries. Kewal Kiran and Rupa that
are expected to report subdued revenue growth of 5.9% and 2.2%,
respectively. Vardhman’s textile segment is expected to register
moderate revenue growth of 4.2%, owing to near full capacity
utilisation while the acrylic segment is expected to decline 5% YoY. On
a consolidated basis, Vardhman is expected to register 4.0% growth in
revenues. For Arvind, we expect consolidated revenues to increase 5%
YoY led by 11% growth in the brands and retail segment and 2%
growth in the textiles segment. Page is expected to register revenue
growth of 16.2% YoY, driven by 10.4% volume growth and 7.4%
expansion in blended realisations.
Exhibit 13: Estimates for Q2FY18E: (Apparel) (| Crore)
Revenue EBITDA PAT
Q2FY18E YoY QoQ Q2FY18E YoY QoQ Q2FY18E YoY QoQ
Arvind Ltd 2,444.0 4.8 -1.3 218.7 -3.5 5.7 65.2 -9.1 14.9
Kewal Kiran 162.9 5.9 107.9 32.8 -7.6 349.3 27.4 -7.1 232.8
Page Industries 618.5 16.2 -11.3 119.7 17.5 -12.3 79.7 16.3 -6.6
Rupa & Co. 278.4 2.9 70.3 33.4 -7.5 77.0 20.2 -4.8 118.1
Vardhman Tex 1,556.4 4.0 -0.4 226.2 -27.3 2.6 144.2 -68.2 -3.1
Total 5,060.2 5.8 1.7 630.8 -11.3 6.9 336.7 -47.8 9.2
Change (%) Change (%) Change (%)
Company
Source: ICICIdirect.com Research
Topline & Profitability (Coverage Universe)
4785
4703
5084
4976
5060
0
1000
2000
3000
4000
5000
6000
Q2FY17
Q3FY17
Q4FY17
Q1FY18
Q2FY18E
| C
rore
0.0
2.0
4.0
6.0
8.0
10.0
12.0
14.0
16.0
18.0
(%
)
Revenue EBITDA Margin PAT Margin
Cotton prices (domestic & international)
60
70
80
90
100
110
120
130
140
150
160
Sep-12
Mar-13
Sep-13
Mar-14
Sep-14
Mar-15
Sep-15
Mar-16
Sep-16
Mar-17
Sep-17
|
0.4
0.5
0.6
0.7
0.8
0.9
$
|/kg (LHS) $/ lb
Indian textile exports to US
3212
3401
3665
2199
3640
2328
3087
3316
3605
3582
0
1000
2000
3000
4000
CY2013 CY2014 CY2015 CY2016 YTD CY17
US
$ (
Mn)
Apparel Non-Apparel
Top Pick
Arvind Ltd
Research Analyst
Bharat Chhoda
Ankit Panchmatia
Cheragh Sidhwa
ICICI Securities Ltd. | Retail Equity Research
Page 10
Decline in duty drawback to impact garment exports
According to the data provided by Office of Textile and Apparel
(OTEXA), India’s apparel exports to the US for YTD CY17 declined 0.2%
to US$2328 million while non-apparel exports continued to register
growth of 6.1% to US$2199 million. Recently, The Government of India
has announced new duty drawback rates for garments effective from
October 1, 2017. The duty drawback rate for cotton garments has been
fixed at 2% vs. existing 7.7%. Duty drawback rates on garments of
blended and manmade fibres have been fixed at 2.5% vs. existing 9.5%
and 9.8%, respectively. The new lower rates are expected to negatively
impact the global competitiveness of Indian garment exporters as the
industry is already facing pressure due to rupee appreciation.
Exhibit 14: Company specific view (Apparel)
Company Remarks
Kewal Kiran Traditionally, Q2 is a strong quarter for KKCL as various dealers replenish their
inventory a month prior to the start of the new festive season. However, we expect
revenues to be impacted due to GST compliance related issues at the dealer’s level.
We expect revenues to increase 5.9% YoY to | 162.9 crore led by 2.8% increase in
volumes to 15.2 lakh pieces and 3% increase in realisation to | 1072/piece. Operating
margins are likely to dip 290 bps YoY to 20.1. Subsequently, we expect PAT to decline
7.1% YoY to | 27.4 crore
Page
Industries
We expect Page to continue on its strong revenue growth trajectory and register a
healthy topline growth of 16.2% YoY to | 618.5 crore led by 10.4% volume growth to
42 million pieces and 7.4% realisation growth to | 147/piece. We expect leisure
segment to be the key growth driver by registering YoY volume growth of 24%.
Operating margins are likely to expand 30 bps YoY to 19.4% owing to improved
realisations and positive operating leverage. We expect PAT to increase 16.3% YoY to
| 79.7 crore
Rupa &
Company
We expect Rupa to register subdued revenue growth of 2.9% YoY to | 278.4 crore.
EBITDA margins are likely to contract 130 bps YoY to 12.0% on account of negative
operating leverage while absolute EBITDA is expected to decline 7.5% YoY to | 33.4
crore. On account of a decline in interest expense, we expect PAT de-growth to be
curtailed at 4.8% YoY to | 20.2 crore
Vardhman
Textiles
Consolidated revenues are likely to report moderate growth of 4.0% YoY to | 1556.4
crore. On the segmental front, we expect textiles segment to register subdued growth
rate of 4.2% while the acrylic business is expected to decline 5% YoY. In Q2FY17,
operating margins were abnormally high owing to low cost cotton inventory gains.
However we expect operating margins to be severely impacted in the quarter on
account of high cost cotton inventory. EBITDA margins are expected to contract 630
bps YoY to 14.5%. On account of a 40% stake sale in Vardhman yarn and threads in
Q2FY17 (exceptional income: | 251 crore), PAT was significantly higher at | 454
crore. In the absence of extraordinary income, PAT for Q2FY18 is expected to decline
68% to | 144.2 crore
Arvind Ltd The negative impact of GST, which dented revenues for July, was to an extent
moderated by the revival in August and September. In addition to the same, optimum
utilisation of capacity at the garment facility and lower demand for textiles could result
in a flattish performance for the textile business. We expect textile revenues to grow
2% YoY (vs. an average of 12% over past four quarter). Likewise, on the back of large
base impact of Q2FY17 (growth of 33%), retail revenues are expected to grow 11%
YoY to | 834 crore. The resultant consolidated revenues are expected to grow 5% YoY
to | 2444 crore. The impact of GST on operating expenses is expected to dent EBITDA
margins by 70 bps to 9% with an absolute EBITDA de-growth of 4% YoY to | 219
crore. Increase in interest expenses due to increased working capital requirement may
lead PAT de-growth of 11% YoY to | 65.2 crore
Source: Company, ICICIdirect.com Research
China’s cotton yarn import
80
110
140
170
200
230
260
Dec-14
Mar-15
Jun-15
Sep-15
Dec-15
Mar-16
Jun-16
Sep-16
Dec-16
Mar-17
Jun-17
Million k
gs
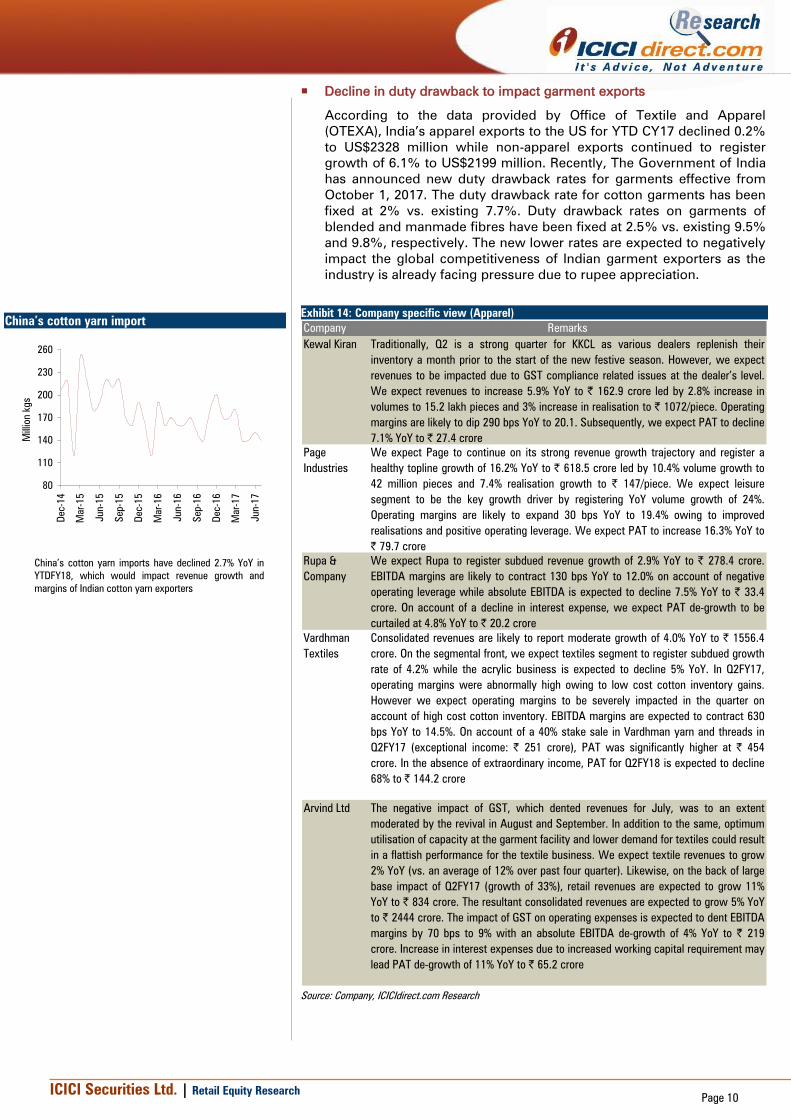
China’s cotton yarn imports have declined 2.7% YoY in
YTDFY18, which would impact revenue growth and
margins of Indian cotton yarn exporters
ICICI Securities Ltd. | Retail Equity Research
Page 11
Auto and auto ancillary
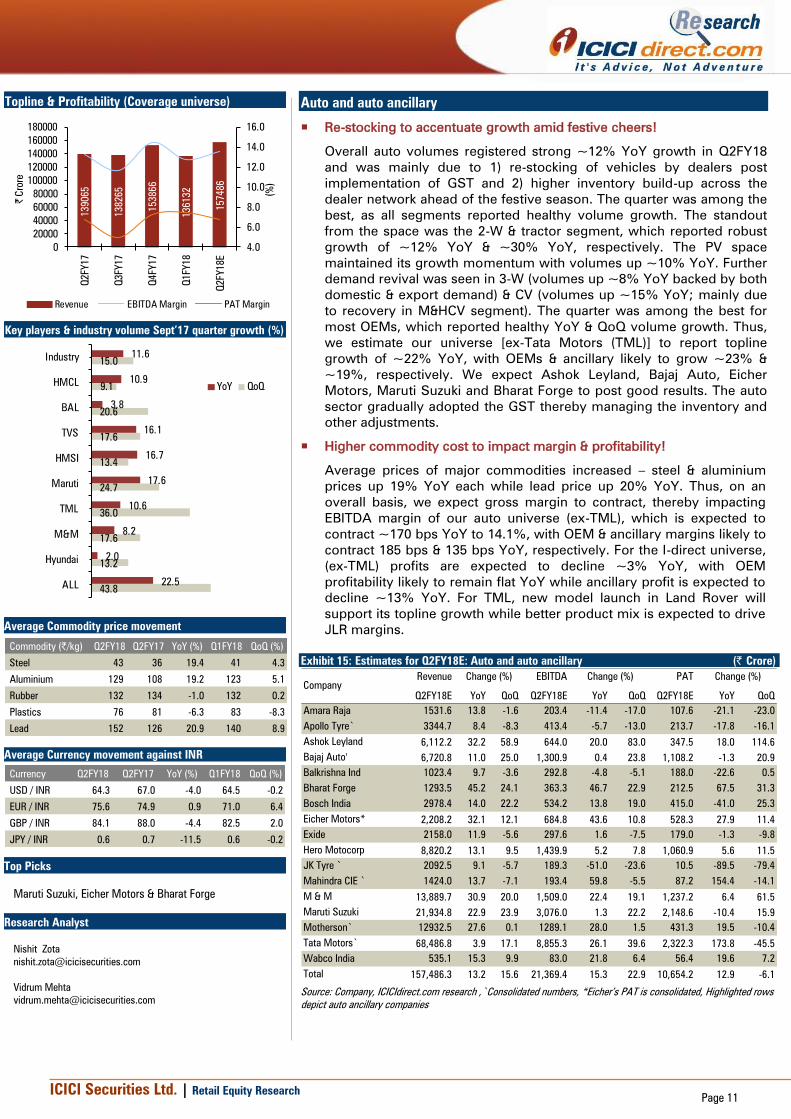
Re-stocking to accentuate growth amid festive cheers!
Overall auto volumes registered strong ~12% YoY growth in Q2FY18
and was mainly due to 1) re-stocking of vehicles by dealers post
implementation of GST and 2) higher inventory build-up across the
dealer network ahead of the festive season. The quarter was among the
best, as all segments reported healthy volume growth. The standout
from the space was the 2-W & tractor segment, which reported robust
growth of ~12% YoY & ~30% YoY, respectively. The PV space
maintained its growth momentum with volumes up ~10% YoY. Further
demand revival was seen in 3-W (volumes up ~8% YoY backed by both
domestic & export demand) & CV (volumes up ~15% YoY; mainly due
to recovery in M&HCV segment). The quarter was among the best for
most OEMs, which reported healthy YoY & QoQ volume growth. Thus,
we estimate our universe [ex-Tata Motors (TML)] to report topline
growth of ~22% YoY, with OEMs & ancillary likely to grow ~23% &
~19%, respectively. We expect Ashok Leyland, Bajaj Auto, Eicher
Motors, Maruti Suzuki and Bharat Forge to post good results. The auto
sector gradually adopted the GST thereby managing the inventory and
other adjustments.
Higher commodity cost to impact margin & profitability!
Average prices of major commodities increased – steel & aluminium
prices up 19% YoY each while lead price up 20% YoY. Thus, on an
overall basis, we expect gross margin to contract, thereby impacting
EBITDA margin of our auto universe (ex-TML), which is expected to
contract ~170 bps YoY to 14.1%, with OEM & ancillary margins likely to
contract 185 bps & 135 bps YoY, respectively. For the I-direct universe,
(ex-TML) profits are expected to decline ~3% YoY, with OEM
profitability likely to remain flat YoY while ancillary profit is expected to
decline ~13% YoY. For TML, new model launch in Land Rover will
support its topline growth while better product mix is expected to drive
JLR margins.
Exhibit 15: Estimates for Q2FY18E: Auto and auto ancillary (| Crore)
Revenue EBITDA PAT
Q2FY18E YoY QoQ Q2FY18E YoY QoQ Q2FY18E YoY QoQ
Amara Raja 1531.6 13.8 -1.6 203.4 -11.4 -17.0 107.6 -21.1 -23.0
Apollo Tyre` 3344.7 8.4 -8.3 413.4 -5.7 -13.0 213.7 -17.8 -16.1
Ashok Leyland 6,112.2 32.2 58.9 644.0 20.0 83.0 347.5 18.0 114.6
Bajaj Auto' 6,720.8 11.0 25.0 1,300.9 0.4 23.8 1,108.2 -1.3 20.9
Balkrishna Ind 1023.4 9.7 -3.6 292.8 -4.8 -5.1 188.0 -22.6 0.5
Bharat Forge 1293.5 45.2 24.1 363.3 46.7 22.9 212.5 67.5 31.3
Bosch India 2978.4 14.0 22.2 534.2 13.8 19.0 415.0 -41.0 25.3
Eicher Motors* 2,208.2 32.1 12.1 684.8 43.6 10.8 528.3 27.9 11.4
Exide 2158.0 11.9 -5.6 297.6 1.6 -7.5 179.0 -1.3 -9.8
Hero Motocorp 8,820.2 13.1 9.5 1,439.9 5.2 7.8 1,060.9 5.6 11.5
JK Tyre ` 2092.5 9.1 -5.7 189.3 -51.0 -23.6 10.5 -89.5 -79.4
Mahindra CIE ` 1424.0 13.7 -7.1 193.4 59.8 -5.5 87.2 154.4 -14.1
M & M 13,889.7 30.9 20.0 1,509.0 22.4 19.1 1,237.2 6.4 61.5
Maruti Suzuki 21,934.8 22.9 23.9 3,076.0 1.3 22.2 2,148.6 -10.4 15.9
Motherson` 12932.5 27.6 0.1 1289.1 28.0 1.5 431.3 19.5 -10.4
Tata Motors` 68,486.8 3.9 17.1 8,855.3 26.1 39.6 2,322.3 173.8 -45.5
Wabco India 535.1 15.3 9.9 83.0 21.8 6.4 56.4 19.6 7.2
Total 157,486.3 13.2 15.6 21,369.4 15.3 22.9 10,654.2 12.9 -6.1
Change (%)
Company
Change (%) Change (%)
Source: Company, ICICIdirect.com research ,`Consolidated numbers, *Eicher’s PAT is consolidated, Highlighted rows
depict auto ancillary companies
Topline & Profitability (Coverage universe)
139065
138265
153866
136132
157486
4.0
6.0
8.0
10.0
12.0
14.0
16.0
0
20000
40000
60000
80000
100000
120000
140000
160000
180000
Q2FY17
Q3FY17
Q4FY17
Q1FY18
Q2FY18E
(%
)
| C
rore
Revenue EBITDA Margin PAT Margin
Key players & industry volume Sept’17 quarter growth (%)
11.6
10.9
3.8
16.1
16.7
17.6
10.6
8.2
2.0
22.5
15.0
9.1
20.6
17.6
13.4
24.7
36.0
17.6
13.2
43.8
Industry
HMCL
BAL
TVS
HMSI
Maruti
TML
M&M
Hyundai
ALL
YoY QoQ
Average Commodity price movement
Commodity (|/kg) Q2FY18 Q2FY17 YoY (%) Q1FY18 QoQ (%)
Steel 43 36 19.4 41 4.3
Aluminium 129 108 19.2 123 5.1
Rubber 132 134 -1.0 132 0.2
Plastics 76 81 -6.3 83 -8.3
Lead 152 126 20.9 140 8.9
Average Currency movement against INR
Currency Q2FY18 Q2FY17 YoY (%) Q1FY18 QoQ (%)
USD / INR 64.3 67.0 -4.0 64.5 -0.2
EUR / INR 75.6 74.9 0.9 71.0 6.4
GBP / INR 84.1 88.0 -4.4 82.5 2.0
JPY / INR 0.6 0.7 -11.5 0.6 -0.2
Top Picks
Maruti Suzuki, Eicher Motors & Bharat Forge
Research Analyst
Nishit Zota
Vidrum Mehta
ICICI Securities Ltd. | Retail Equity Research
Page 12
Company Remarks
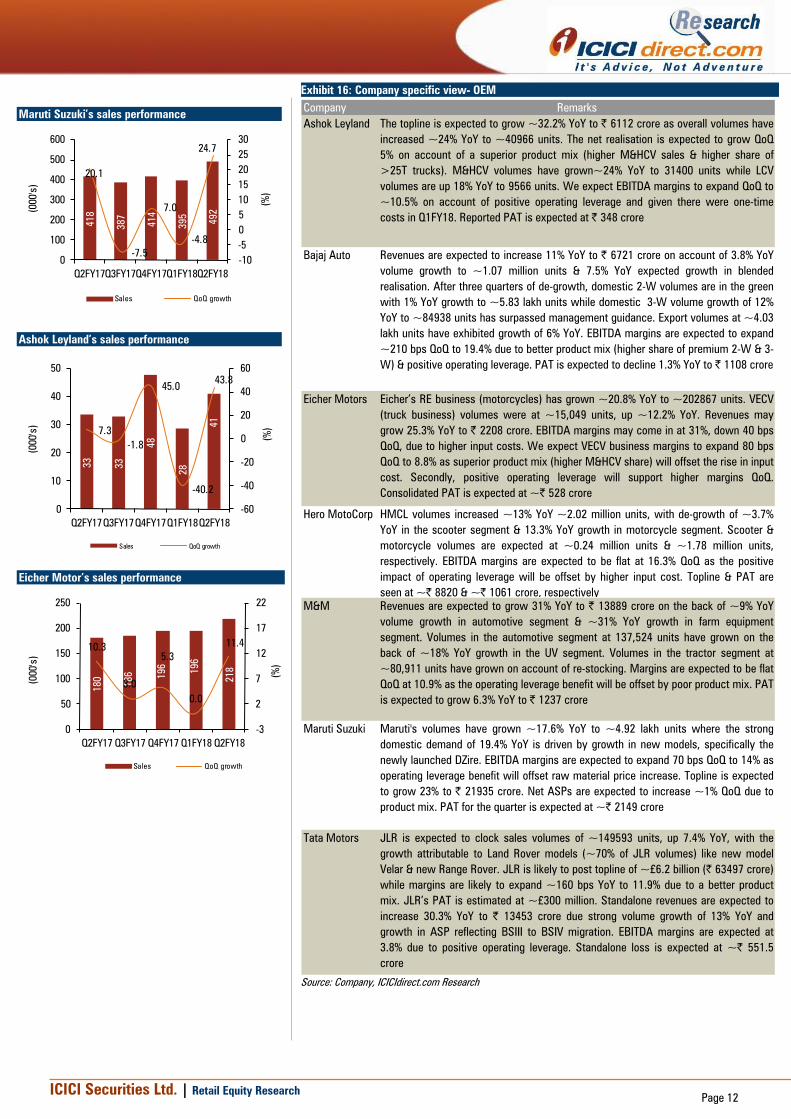
Ashok Leyland The topline is expected to grow ~32.2% YoY to | 6112 crore as overall volumes have
increased ~24% YoY to ~40966 units. The net realisation is expected to grow QoQ
5% on account of a superior product mix (higher M&HCV sales & higher share of
>25T trucks). M&HCV volumes have grown~24% YoY to 31400 units while LCV
volumes are up 18% YoY to 9566 units. We expect EBITDA margins to expand QoQ to
~10.5% on account of positive operating leverage and given there were one-time
costs in Q1FY18. Reported PAT is expected at | 348 crore
Bajaj Auto Revenues are expected to increase 11% YoY to | 6721 crore on account of 3.8% YoY
volume growth to ~1.07 million units & 7.5% YoY expected growth in blended
realisation. After three quarters of de-growth, domestic 2-W volumes are in the green
with 1% YoY growth to ~5.83 lakh units while domestic 3-W volume growth of 12%
YoY to ~84938 units has surpassed management guidance. Export volumes at ~4.03
lakh units have exhibited growth of 6% YoY. EBITDA margins are expected to expand
~210 bps QoQ to 19.4% due to better product mix (higher share of premium 2-W & 3-
W) & positive operating leverage. PAT is expected to decline 1.3% YoY to | 1108 crore
Eicher Motors Eicher’s RE business (motorcycles) has grown ~20.8% YoY to ~202867 units. VECV
(truck business) volumes were at ~15,049 units, up ~12.2% YoY. Revenues may
grow 25.3% YoY to | 2208 crore. EBITDA margins may come in at 31%, down 40 bps
QoQ, due to higher input costs. We expect VECV business margins to expand 80 bps
QoQ to 8.8% as superior product mix (higher M&HCV share) will offset the rise in input
cost. Secondly, positive operating leverage will support higher margins QoQ.
Consolidated PAT is expected at ~| 528 crore
Hero MotoCorp HMCL volumes increased ~13% YoY ~2.02 million units, with de-growth of ~3.7%
YoY in the scooter segment & 13.3% YoY growth in motorcycle segment. Scooter &
motorcycle volumes are expected at ~0.24 million units & ~1.78 million units,
respectively. EBITDA margins are expected to be flat at 16.3% QoQ as the positive
impact of operating leverage will be offset by higher input cost. Topline & PAT are
seen at ~| 8820 & ~| 1061 crore, respectively
M&M Revenues are expected to grow 31% YoY to | 13889 crore on the back of ~9% YoY
volume growth in automotive segment & ~31% YoY growth in farm equipment
segment. Volumes in the automotive segment at 137,524 units have grown on the
back of ~18% YoY growth in the UV segment. Volumes in the tractor segment at
~80,911 units have grown on account of re-stocking. Margins are expected to be flat
QoQ at 10.9% as the operating leverage benefit will be offset by poor product mix. PAT
is expected to grow 6.3% YoY to | 1237 crore
Maruti Suzuki Maruti's volumes have grown ~17.6% YoY to ~4.92 lakh units where the strong
domestic demand of 19.4% YoY is driven by growth in new models, specifically the
newly launched DZire. EBITDA margins are expected to expand 70 bps QoQ to 14% as
operating leverage benefit will offset raw material price increase. Topline is expected
to grow 23% to | 21935 crore. Net ASPs are expected to increase ~1% QoQ due to
product mix. PAT for the quarter is expected at ~| 2149 crore
Tata Motors JLR is expected to clock sales volumes of ~149593 units, up 7.4% YoY, with the
growth attributable to Land Rover models (~70% of JLR volumes) like new model
Velar & new Range Rover. JLR is likely to post topline of ~£6.2 billion (| 63497 crore)
while margins are likely to expand ~160 bps YoY to 11.9% due to a better product
mix. JLR’s PAT is estimated at ~£300 million. Standalone revenues are expected to
increase 30.3% YoY to | 13453 crore due strong volume growth of 13% YoY and
growth in ASP reflecting BSIII to BSIV migration. EBITDA margins are expected at
3.8% due to positive operating leverage. Standalone loss is expected at ~| 551.5
crore
Source: Company, ICICIdirect.com Research
Exhibit 16: Company specific view- OEM
Maruti Suzuki’s sales performance
418
387
414
395
492
20.1
-7.5
7.0
-4.8
24.7
-10
-5
0
5
10
15
20
25
30
0
100
200
300
400
500
600
Q2FY17Q3FY17Q4FY17Q1FY18Q2FY18
(%
)
(000's
)
Sales QoQ growth
Ashok Leyland’s sales performance
33
33
48
28
41
7.3
-1.8
45.0
-40.2
43.8
-60
-40
-20
0
20
40
60
0
10
20
30
40
50
Q2FY17Q3FY17Q4FY17Q1FY18Q2FY18
(%
)
(000's
)
Sales QoQ growth
Eicher Motor’s sales performance
180
186 196
196
218
10.3
3.0
5.3
0.0
11.4
-3
2
7
12
17
22
0
50
100
150
200
250
Q2FY17 Q3FY17 Q4FY17 Q1FY18 Q2FY18
(%
)
(000's
)
Sales QoQ growth

ICICI Securities Ltd. | Retail Equity Research
Page 13
Exhibit 17: Company specific view- Ancillaries
Company Remarks
Amara Raja
Batteries
(ARBL)
Good growth in the automotive segment (OEM + replacement) is likely to drive
ARBL's revenue, which is expected to grow 14% YoY to | 1,532 crore. EBITDA
margins are expected to decline 379 bps YoY to 13.3% as average lead prices (key
raw material) increased 20% YoY & 8% QoQ to |151/kg. PAT is expected to decline
21% YoY to | 108 crore
Apollo Tyres
(APL)
Consolidated revenue is likely to grow 8.4% YoY to | 3,345 crore mainly supported by
its Indian operations. The re-stocking of tyres (post GST) is expected to drive its
replacement segment. Average natural rubber price remained flat (down 1% YoY & up
0.2% QoQ to |132/kg). However, we believe APL will enjoy the benefit of low cost raw
material inventory in Q2FY18. EBITDA margins are likely to expand 403 bps QoQ to
12.4%. PAT is expected to decline 18.4% YoY to | 212 crore
Balkrishna
Industries (BIL)
BIL's revenues are expected to grow 9.7% YoY to | 1,023 crore, with volume likely to
increase 11% YoY to 47,231 MT. The management expects the margin to sharply
recover from Q2FY18 onwards (to its traditional level of 28-30%). Thus, we expect
EBITDA margins to expand 726 bps QoQ (down 436 bps YoY) to 28.6%. PAT is
expected to decline 6.1% YoY to | 188 crore
Bharat Forge Revenues are likely to increase 45% YoY to | 1292 crore. Net domestic revenues are
expected to grow 9.9% QoQ to | 554 crore, mainly driven by M&HCV volume growth.
Export revenues are expected to increase 58% YoY to | 712 crore as class 8 truck
volumes have grown YoY while oil & gas revenues are expected to grow significantly.
EBITDA margins are expected to be almost unchanged QoQ at 28.1%. PAT is likely to
increase 67% YoY to | 163 crore
Bosch Its revenue is expected to increase 14% YoY to | 2,978 crore mainly due to strong
recovery in domestic CV & tractor volumes. Its EBITDA margins are expected at 17.9%
flat YoY and up 140 bps QoQ due to a better product mix (lower share of traded of
goods) & cost efficiencies. Bosch had an exceptional gain from sale of its starter
motor & generator division worth | 281 crore in Q2FY17. Thus, a decline of 41% YoY
to |415 crore in PAT is not comparable YoY
Exide Industries
(EIL)
EIL is expected to post highest ever quarterly revenue (up 12% YoY to | 2,158 crore)
supported by good growth in its automotive segment. Further, despite a price hike in
the past (yet to be fully passed on), higher raw material cost will impact its margin,
which is expected to decline 139 bps YoY & 163 bps QoQ to 13.8%. PAT is expected
to decline marginally by 1% YoY to | 179 crore
JK Tyre (JKTIL) Consolidated revenues are expected to grow 9% YoY to | 2,093 crore primarily driven
by Indian operation. The acquired Cavendish Industries (CIL) has witnessed a
turnaround thereby driving its overall performance. EBITDA margins are expected to
improve 910 bps QoQ to 9% as JKTIL will benefit from lower cost inventory in Q2FY18
(unlike in Q1FY18). Higher interest & depreciation (>8% of sales) is likely to impact
PAT that is expected at | 11 crore
MCIE
Automotive
Its standalone business will largely be driven by production volumes of its top two
clients M&M & TML, which account for ~45% of its revenue. Standalone revenue,
EBITDA & PAT are estimated at ~| 479 crore, ~| 47 crore and ~| 21 crore,
respectively. On a consolidated basis, we expect revenue, EBITDA & PAT of | 1424
crore, | 193 crore and | 87 crore, respectively
Motherson
Sumi
MSSL's consolidated revenues are expected to grow 27.6% YoY to | 12,933 crore. The
result would not be comparable on like-to-like basis, as it would include the
performance of newly acquired PKC group (revenue of ~|1900 crore). Its European
operations (SMR & SMP) are expected to continue with its decent performance.
Consolidated EBITDA margin is likely to expand 100 bps QoQ & 10 bps YoY to 10%.
PAT is expected at | 431 crore
Wabco India
(WIL)
WIL’s revenue is expected to grow 15.3% YoY to | 535 crore mainly due to 1)
recovery in domestic M&HCV production volume up >13% YoY, 2) continued growth
momentum in exports and 3) partly driven by new product launches. EBITDA margins
are likely to improve 83 bps YoY & 50 bps QoQ to 15.5%. Subsequently, PAT is
expected to increase 19.6% YoY to | 56 crore
Source: Company, ICICIdirect.com Research
Hero MotoCorp’s sales performance
1823
1474
1622
1854
2023
4.5
-19.2
10.0
14.3
9.1
-25
-15
-5
5
15
1000
1200
1400
1600
1800
2000
2200
Q2FY17 Q3FY17 Q4FY17 Q1FY18 Q2FY18
(%
)
(000's
)
Sales QoQ growth

ICICI Securities Ltd. | Retail Equity Research
Page 14
Banking and Financial Institutions
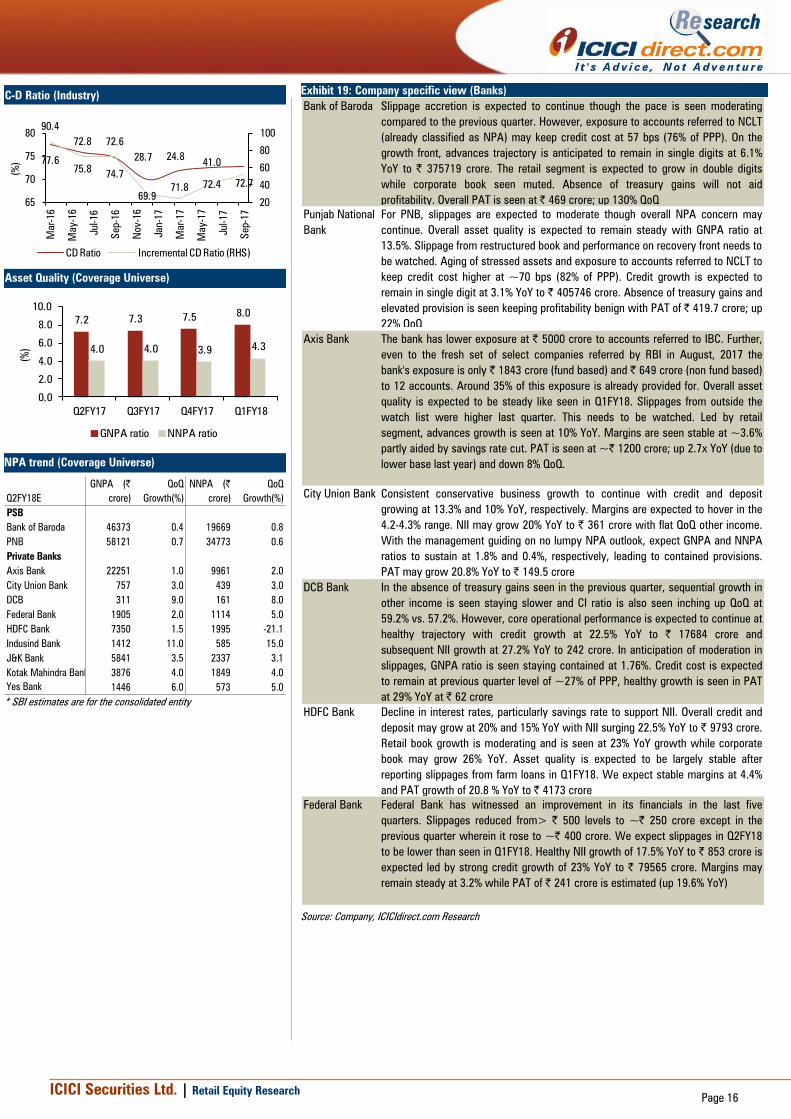
Improvement in credit not yet visible, marginally better CD ratio
Credit growth remained flat at 6.8% YoY as on September 15, 2017.
Deposit growth is seen moderating around 10% YoY as interest rates
decline and demonetisation money flushes out from banks.
Accordingly, the incremental CD ratio has gone up to 51.5% in
September 2017 from lows of 30-40% in the past. For our coverage
universe, credit growth is estimated at 10% YoY. PSU banks are
expected to continue to see single digit growth of ~5.5% YoY while
private banks continue to clock strong 17.9% YoY growth to | 1569368
crore. Retail focused private banks like IndusInd Bank, HDFC Bank, DCB
Bank and even Federal Bank are expected to maintain their strong
growth trajectory of >20% YoY.
Positive trends in steel sector to prevent liquidation risk provisions
Banks have been making additional provisions required to reach 50% in
case of initial 12 accounts referred to NCLT from Q1FY18. In addition,
new list of stressed borrowers would also entail further provisions.
Large banks like PNB & BoB (| 7200 crore exposure in 10 accounts) and
Axis Bank (| 5283 crore in eight accounts) had indicated their exposure
to the 12 accounts is provided for by ~40-50% of the portfolio.
Provisions on a QoQ basis may be largely stable as provision impact
from agri loan slippages in Q1 seems over.
Positive developments in steel sector resulted in large domestic and
international players evincing buying interest in companies referred to
NCLT under IBC (namely Essar Steel, Bhushan Steel & Monnet Ispat).
Any buyout can result in upgradation of status to standard and lower
haircuts may lead to provisions write-back in coming quarters.
Rise in yields, slower quarter to dent other income
Volatility in rupee led by sharp depreciation may impact forex fee
income positively. However, treasury gains were seen muted due to 15
bps rise in 10 year G-Sec to 6.66%. Accordingly, we factor in lower non-
interest income growth for banks in our coverage.
Improving NII to support ageing led higher provisions
Savings interest rate cut of 50 bps by the largest bank remained the
highlight of the quarter, with other banks following suit. Accordingly, a
decline in interest expense would support NII. A higher cut in deposit
rates compared to a decline in MCLR is expected to result in NII growth
of 13.1% YoY and 3.1% QoQ for our coverage universe. We expect our
banking coverage universe PPP to grow at 14.9% YoY and 2.9% QoQ
while PAT is seen growing 39% YoY and 8.7% on a QoQ basis.
We expect fresh NPA accretion to moderate in Q2FY18E. Slippages
from watchlist would be key monitorable. Restructured assets and SDR
is gradually flowing to NPA category. For our coverage universe, we
expect net addition in GNPA at | 7830 crore (| 15154 crore was added
in Q1FY18). Despite moderation in slippages, GNPA ratio is apparently
expected to inch up owing to muted growth in advances.
Within our coverage, mid size banks like Federal Bank, DCB Bank and
City Union Bank are expected to deliver a healthy set of numbers.
Earnings of large private banks like HDFC Bank, IndusInd Bank, Yes
Bank and Kotak Mahindra Bank are expected to continue to remain
strong both on business and earnings growth. Axis Bank’s earnings are
expected to remain stable QoQ but surge 275% YoY, mainly due to
lower provisions (| 2369 crore) in Q2FY18E vs. steep provisions in Q2
last year (| 3622 crore). Large PSBs including PNB and BoB are
expected to report strong PAT growth QoQ with largely stable GNPA.
NBFCs like Bajaj Finance are expected to report stellar PAT growth of
33.3% and expect consistent earnings for HDFC Ltd.
Net interest income (Coverage Universe)
7306
6865
7265
7260
7467
19268
19670
21280
21904
22594
15103
15260
17407
16722
18233
0
10000
20000
30000
40000
50000
Q2FY17
Q3FY17
Q4FY17
Q1FY18
Q2FY18E
(| C
rore)
PSB Private NBFC
PPP (Coverage Universe)
6002
5750
9252
5865
6233
15421
16745
17808
18059
18383
5869
6209 6
605
6308
6804
0
10000
20000
30000
40000
Q2FY17
Q3FY17
Q4FY17
Q1FY18
Q2FY18E
(|
Crore)
NBFC Private PSB
Net Profit (Coverage Universe)
417
547
888
5865
6843
7741
8360
8797
3558
3579
3975
3523
3885
0
2000
4000
6000
8000
10000
12000
Q2FY17
Q3FY17
Q4FY17
Q1FY18
Q2FY18E
(| C
rore)
NBFC Private PSB
Top Picks
Axis Bank
Bank of Baroda
Research Analyst
Kajal Gandhi
Vishal Narnolia
Vasant Lohiya
ICICI Securities Ltd. | Retail Equity Research
Page 15
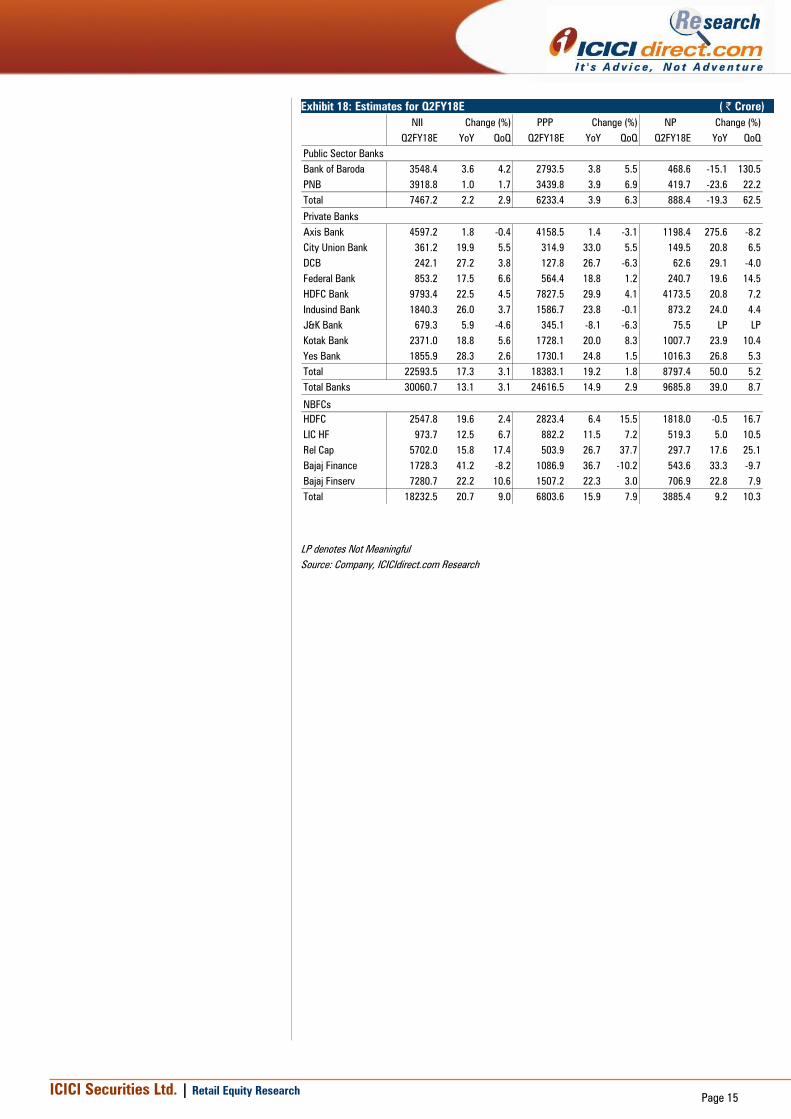
Exhibit 18: Estimates for Q2FY18E ( | Crore)
NII PPP NP
Q2FY18E YoY QoQ Q2FY18E YoY QoQ Q2FY18E YoY QoQ
Bank of Baroda 3548.4 3.6 4.2 2793.5 3.8 5.5 468.6 -15.1 130.5
PNB 3918.8 1.0 1.7 3439.8 3.9 6.9 419.7 -23.6 22.2
Total 7467.2 2.2 2.9 6233.4 3.9 6.3 888.4 -19.3 62.5
Axis Bank 4597.2 1.8 -0.4 4158.5 1.4 -3.1 1198.4 275.6 -8.2
City Union Bank 361.2 19.9 5.5 314.9 33.0 5.5 149.5 20.8 6.5
DCB 242.1 27.2 3.8 127.8 26.7 -6.3 62.6 29.1 -4.0
Federal Bank 853.2 17.5 6.6 564.4 18.8 1.2 240.7 19.6 14.5
HDFC Bank 9793.4 22.5 4.5 7827.5 29.9 4.1 4173.5 20.8 7.2
Indusind Bank 1840.3 26.0 3.7 1586.7 23.8 -0.1 873.2 24.0 4.4
J&K Bank 679.3 5.9 -4.6 345.1 -8.1 -6.3 75.5 LP LP
Kotak Bank 2371.0 18.8 5.6 1728.1 20.0 8.3 1007.7 23.9 10.4
Yes Bank 1855.9 28.3 2.6 1730.1 24.8 1.5 1016.3 26.8 5.3
Total 22593.5 17.3 3.1 18383.1 19.2 1.8 8797.4 50.0 5.2
Total Banks 30060.7 13.1 3.1 24616.5 14.9 2.9 9685.8 39.0 8.7
HDFC 2547.8 19.6 2.4 2823.4 6.4 15.5 1818.0 -0.5 16.7
LIC HF 973.7 12.5 6.7 882.2 11.5 7.2 519.3 5.0 10.5
Rel Cap 5702.0 15.8 17.4 503.9 26.7 37.7 297.7 17.6 25.1
Bajaj Finance 1728.3 41.2 -8.2 1086.9 36.7 -10.2 543.6 33.3 -9.7
Bajaj Finserv 7280.7 22.2 10.6 1507.2 22.3 3.0 706.9 22.8 7.9
Total 18232.5 20.7 9.0 6803.6 15.9 7.9 3885.4 9.2 10.3
Change (%) Change (%) Change (%)
Public Sector Banks
Private Banks
NBFCs
LP denotes Not Meaningful
Source: Company, ICICIdirect.com Research
ICICI Securities Ltd. | Retail Equity Research
Page 16
Exhibit 19: Company specific view (Banks)
Bank of Baroda Slippage accretion is expected to continue though the pace is seen moderating
compared to the previous quarter. However, exposure to accounts referred to NCLT
(already classified as NPA) may keep credit cost at 57 bps (76% of PPP). On the
growth front, advances trajectory is anticipated to remain in single digits at 6.1%
YoY to | 375719 crore. The retail segment is expected to grow in double digits
while corporate book seen muted. Absence of treasury gains will not aid
profitability. Overall PAT is seen at | 469 crore; up 130% QoQ
Punjab National
Bank
For PNB, slippages are expected to moderate though overall NPA concern may
continue. Overall asset quality is expected to remain steady with GNPA ratio at
13.5%. Slippage from restructured book and performance on recovery front needs to
be watched. Aging of stressed assets and exposure to accounts referred to NCLT to
keep credit cost higher at ~70 bps (82% of PPP). Credit growth is expected to
remain in single digit at 3.1% YoY to | 405746 crore. Absence of treasury gains and
elevated provision is seen keeping profitability benign with PAT of | 419.7 crore; up
22% QoQ
State Bank of Axis Bank The bank has lower exposure at | 5000 crore to accounts referred to IBC. Further,
even to the fresh set of select companies referred by RBI in August, 2017 the
bank's exposure is only | 1843 crore (fund based) and | 649 crore (non fund based)
to 12 accounts. Around 35% of this exposure is already provided for. Overall asset
quality is expected to be steady like seen in Q1FY18. Slippages from outside the
watch list were higher last quarter. This needs to be watched. Led by retail
segment, advances growth is seen at 10% YoY. Margins are seen stable at ~3.6%
partly aided by savings rate cut. PAT is seen at ~| 1200 crore; up 2.7x YoY (due to
lower base last year) and down 8% QoQ.
City Union Bank Consistent conservative business growth to continue with credit and deposit
growing at 13.3% and 10% YoY, respectively. Margins are expected to hover in the
4.2-4.3% range. NII may grow 20% YoY to | 361 crore with flat QoQ other income.
With the management guiding on no lumpy NPA outlook, expect GNPA and NNPA
ratios to sustain at 1.8% and 0.4%, respectively, leading to contained provisions.
PAT may grow 20.8% YoY to | 149.5 crore
DCB Bank In the absence of treasury gains seen in the previous quarter, sequential growth in
other income is seen staying slower and CI ratio is also seen inching up QoQ at
59.2% vs. 57.2%. However, core operational performance is expected to continue at
healthy trajectory with credit growth at 22.5% YoY to | 17684 crore and
subsequent NII growth at 27.2% YoY to 242 crore. In anticipation of moderation in
slippages, GNPA ratio is seen staying contained at 1.76%. Credit cost is expected
to remain at previous quarter level of ~27% of PPP, healthy growth is seen in PAT
at 29% YoY at | 62 crore
HDFC Bank Decline in interest rates, particularly savings rate to support NII. Overall credit and
deposit may grow at 20% and 15% YoY with NII surging 22.5% YoY to | 9793 crore.
Retail book growth is moderating and is seen at 23% YoY growth while corporate
book may grow 26% YoY. Asset quality is expected to be largely stable after
reporting slippages from farm loans in Q1FY18. We expect stable margins at 4.4%
and PAT growth of 20.8 % YoY to | 4173 crore
Federal Bank Federal Bank has witnessed an improvement in its financials in the last five
quarters. Slippages reduced from> | 500 levels to ~| 250 crore except in the
previous quarter wherein it rose to ~| 400 crore. We expect slippages in Q2FY18
to be lower than seen in Q1FY18. Healthy NII growth of 17.5% YoY to | 853 crore is
expected led by strong credit growth of 23% YoY to | 79565 crore. Margins may
remain steady at 3.2% while PAT of | 241 crore is estimated (up 19.6% YoY)
Source: Company, ICICIdirect.com Research
C-D Ratio (Industry)
77.6
75.874.7
69.9
71.872.4 72.7
90.4
72.8 72.6
28.7 24.841.0
20
40
60
80
100
65
70
75
80
Mar-16
May-16
Jul-16
Sep-16
Nov-16
Jan-17
Mar-17
May-17
Jul-17
Sep-17
(%
)
CD Ratio Incremental CD Ratio (RHS)
Asset Quality (Coverage Universe)
7.2 7.3 7.58.0
4.0 4.0 3.94.3
0.0
2.0
4.0
6.0
8.0
10.0
Q2FY17 Q3FY17 Q4FY17 Q1FY18
(%)
GNPA ratio NNPA ratio
NPA trend (Coverage Universe)
PSB
Bank of Baroda 46373 0.4 19669 0.8
PNB 58121 0.7 34773 0.6
Private Banks
Axis Bank 22251 1.0 9961 2.0
City Union Bank 757 3.0 439 3.0
DCB 311 9.0 161 8.0
Federal Bank 1905 2.0 1114 5.0
HDFC Bank 7350 1.5 1995 -21.1
Indusind Bank 1412 11.0 585 15.0
J&K Bank 5841 3.5 2337 3.1
Kotak Mahindra Bank 3876 4.0 1849 4.0
Yes Bank 1446 6.0 573 5.0
Q2FY18E
GNPA (|
crore)
QoQ
Growth(%)
NNPA (|
crore)
QoQ
Growth(%)
* SBI estimates are for the consolidated entity
ICICI Securities Ltd. | Retail Equity Research
Page 17
Exhibit 20: Company specific view contd. (Banks)
Jammu &
Kashmir Bank
For J&K Bank, moderation is expected in slippages. However, a robust recovery in
Q1FY18 remains unlikely. Therefore, GNPA ratio is expected to inch up to 11.5%.
High proportion of stressed assets and provision on NCLT exposure to keep credit
cost higher at 53 bps (72% of PPP), though lower compared to previous quarters.
Floating provision of | 349 crore and increased PCR at 70.3% provides comfort.
Credit growth is expected to remain flattish at | 47759 crore. With credit cost,
lower than previous quarter and steady operational performance, PAT is seen at |
75 crore
Kotak Mahindra
Bank
Expect continuance of steady performance on both asset quality as well as
earnings. Advances trajectory is expected to remain healthy at 18.5% YoY to |
149328 crore, led by retail segment. With margins seen stable at ~4.5%, NII
growth is expected at 18.8% YoY to | 2371 crore. Stable credit cost at ~15 bps,
with no major impact from exposure to NCLT referred accounts, is seen aiding
profitability. Asset quality is expected to remain steady with GNPA ratio at 2.6%.
The management's commentary on strategy on insurance business needs to
watched
Yes Bank Earnings growth is expected to continue at healthy pace at 26.8% YoY to | 1016
crore, led by 28.3% and 27.2% YoY growth in NII and other income respectively. On
the growth front, the advances trajectory is seen remaining robust at 30.2% YoY to
| 143471 crore. A recent cut in saving interest rates would aid stability in margins
at ~3.6-3.7%, though the impact will be fully visible from Q3FY18 onwards. Asset
quality is seen remaining steady with GNPA ratio at 1.01%, with bias towards
improvement on reversal of ~| 365.9 crore exposure to JP Associate out of total
exposure of | 911 crore
IndusInd Bank We expect IndusInd Bank's overall consistent performance to continue in Q2FY18E.
We expect growth of 25% YoY to | 123836 crore led by corporate finance segment.
In consumer finance, non vehicle segment like LAP and credit cards would continue
to drive growth. Margins are expected to be strong at ~3.8-3.9% range with partial
positive impact of savings rate cut. This would lead to NII growth of 26% YoY to |
1840 crore. PAT of | 873 crore is expected, up 24% YoY while asset quality should
remain largely steady
Source: Company, ICICIdirect.com Research
ICICI Securities Ltd. | Retail Equity Research
Page 18
Exhibit 21: Company specific view (NBFCs)
LIC Housing
Finance
We expect advances growth of ~15.0% YoY (| 150760 crore) to be maintained.
Individual home loans (~96% of the portfolio) are also expected to increase 13.7%
YoY while developer loans traction is expected to be at higher rate YoY. Margins,
which had risen to ~3%, have fallen back to 2.5% levels in Q1FY18 owing to a rise
in NPAs. We expect NPAs to be lower than in Q1FY18. This, in turn, would support
NIMs at ~2.55%. PAT growth of 5% YoY to | 519 crore is estimated
Reliance Capital Demerger and listing of housing finance is over. It still continues to stay in
consolidated financials. NII may grow 26% YoY with strong loan book growth of
>50% in home and ~12% growth in commercial finance. Life insurance and
general insurance are expected to report an improvement in premium growth. AMC
is expected to report PBT of | 150 crore, AUMs are seen flat QoQ led by equity
market corrections and debt yields rising in September. Revenues are seen rising
16% YoY to | 5702 crore led by premium growth. PAT growth is estimated to be |
298 crore rising 18% YoY
HDFC Ltd In case of HDFC Ltd, credit growth is estimated to be steady at 15% YoY to |
316717 crore led by higher traction in corporate loans and ~13% YoY growth in
individual segment (~70% of portfolio). GNPA ratio is expected to be lower than
1.12% in Q1FY18. This would support reported margins at ~3.9-4%. NII growth of
19.6% YoY to | 2548 crore is estimated. Gains on sale of investments would be
muted in Q2FY18 while dividend income of >| 300 crore is expected. PAT is seen
at | 1818 crore, flat YoY and up 17% QoQ
Bajaj Finance For Bajaj Finance Q2 is seasonally a weak quarter compared to Q1 and Q3.
However, led by consumer finance segment, we estimate AUM will increase 34%
YoY to | 70000 crore. Healthy sales by e-commerce companies would support
AUM traction, which along with healthy calculated margins of ~9.5% could lead to
NII growth of 41% YoY | 1728 crore. Asset quality may stay healthy while
provisions are seen lower QoQ. PAT of | 544 crore is expected, up 33% YoY (down
10% QoQ)
Bajaj Finserv Bajaj Finserv’s consolidated revenue is expected to grow at a healthy pace of
22.2% YoY to | 7281 crore, while PBT is seen at | 1507 crore, up 22.3% YoY.
Among segments, AUM of lending business is expected to continue to grow at a
healthy pace of more than 30% YoY. Subsequently, topline and PBT of finance
segment is expected to grow 31.1% and 31.6% YoY, respectively. Seasonality and
higher retention in crop insurance is seen keeping healthy traction in general
insurance premium at 22% YoY. Pick up in rated individual new business premium
seen in Q1FY18, is expected to continue ahead. Total premium (new as well as
renewal) growth in life insurance is expected at 7% YoY. On profitability, PBT is
expected at | 232 crore. Overall PAT is expected at | 707 crore; up 22.8% YoY
Source: Company, ICICIdirect.com Research

ICICI Securities Ltd. | Retail Equity Research
Page 19
Building materials
Re-stocking begins at dealer’s level…
The GST impact continued to weigh on the building materials
segment as significant de-stocking took place at the dealer’s level
during June-July 2017. However, recent media interaction of
various company managements indicates that things have
improved August 2017 onwards & a recovery has been seen.
Further, companies are expected to witness strong growth in
H2FY18E led by improvement in demand, re-stocking at dealer’s
level and implementation of e-way bill from October 1, 2017.
Overall, in Q2FY18E, our building material universe is expected to
post topline growth of 4.0% YoY to | 2674.3 crore.
We believe that in the long term, GST would be positive for
organised players as it would establish a level playing field & help
them gain market share from unorganised players who would now
come under the tax ambit. Currently, the organised segment
accounts for only ~50% in tiles industry and ~25% in plywood
industry, which could significantly rise over the next few years
given the GST implementation.
Tiles universe revenues expected to grow 3.5% YoY...
Our tiles universe is expected to post subdued sales volume
growth of 3.0% YoY to 29.4 MSM as sales would be impacted by
dealer de-stocking in the first half of Q2FY18. Hence, we expect
topline to grow moderately by 3.5% YoY to | 1114.0 crore.
However, we expect EBITDA margins to contract 120 bps YoY to
14.1% due to 200 bps YoY contraction in Kajaria’s EBITDA margins
to 18.0%. Hence, we expect the bottomline to de-grow 1.2% YoY to
| 86.6 crore.
Plywood universe revenues expected to grow 3.0% YoY...
With Century’s revenues expected to grow 5.1% YoY, we expect
the plywood universe’s topline to grow 3.0% YoY to | 921.7 crore.
EBITDA margins are expected to contract 70 bps YoY to 15.0% due
to higher input costs. Consequently, we expect the bottomline of
our plywood universe to de-grow 4.3% YoY to | 80.7 crore.
Exhibit 22: Estimates for Q2FY18E (Tiles) (| crore)
Revenue EBITDA PAT
Q2FY18E YoY QoQ Q2FY18E YoY QoQ Q2FY18E YoY QoQ
Kajaria Ceramics 652.8 3.8 4.0 117.5 -6.4 13.3 61.9 -2.7 21.5
Somany Ceramics 461.2 3.1 38.4 39.2 0.3 198.3 24.6 2.7 309.9
Total 1,114.0 3.5 15.9 156.7 -4.8 34.1 86.6 -1.2 51.9
Company
Change (%) Change (%) Change (%)
Source: Company, ICICIdirect.com Research
Exhibit 23: Estimates for Q2FY18E (Plywood) (| crore)
Revenue EBITDA PAT
Q2FY18E YoY QoQ Q2FY18E YoY QoQ Q2FY18E YoY QoQ
Century Plyboards 482.8 5.1 10.1 72.8 -3.9 19.1 43.6 -11.5 27.8
Greenply Industries 438.9 0.9 12.4 65.8 2.3 35.1 37.1 5.8 21.2
Total 921.7 3.0 11.2 138.5 -1.0 26.2 80.7 -4.3 24.7
Change (%)
Company
Change (%) Change (%)
Source: Company, ICICIdirect.com Research
Exhibit 24: Estimates for Q2FY18E (Home Improvement) (| crore)
Revenue EBITDA PAT
Q2FY18E YoY QoQ Q2FY18E YoY QoQ Q2FY18E YoY QoQ
Shankara Building 638.6 6.1 7.9 41.9 8.3 7.1 19.0 33.9 10.4
Total 638.6 6.1 7.9 41.9 8.3 7.1 19.0 33.9 10.4
Company
Change (%) Change (%) Change (%)
Source: Company, ICICIdirect.com Research
Topline & Profitability (Tiles universe)
1076
1025
1279
961
1114
0
300
600
900
1200
1500
Q2FY17
Q3FY17
Q4FY17
Q1FY18
Q2FY18E
| C
rore
3.0
6.0
9.0
12.0
15.0
18.0
(%
)
Revenue EBITDA Margin PAT Margin
Topline & Profitability (Plywood universe)
894
783 934
829
922
0
250
500
750
1000
Q2FY17
Q3FY17
Q4FY17
Q1FY18
Q2FY18E
| C
rore
0.0
4.0
8.0
12.0
16.0
20.0
(%
)
Revenue EBITDA Margin PAT Margin
Sales Volume Trend (Tiles Universe)
16.6
15.9
19.3
16.4
17.2
11.9
11.2
15.6
9.3
12.3
4
8
12
16
20
Q2FY17
Q3FY17
Q4FY17
Q1FY18
Q2FY18E
(M
SM
)
Kajaria Ceramics Somany Ceramics
Top pick of the sector
Shankara Building Products
Century Plyboards
Research Analyst
Deepak Purswani, CFA
Vaibhav Shah
ICICI Securities Ltd. | Retail Equity Research
Page 20
Exhibit 25: Company specific view (Tiles coverage universe)
Company Remarks
Kajaria Ceramics Though sales in July 2017 were impacted by dealer de-stocking amid GST roll-out,
a recovery at the dealer’s level has started from August onwards. Consequently, we
expect sales volumes to grow moderately at 3.1% YoY to 17.2 million square metre
(MSM). Hence, the topline is expected to grow 3.8% YoY to | 652.8 crore. Further,
we expect EBITDA margins to decline 200 bps YoY to 18.0% due to the high base
effect (the company recorded EBITDA margins of 20% due to lower gas prices in
the base quarter). Consequently, we expect the bottomline to de-grow 2.7% YoY to
| 61.9 crore mainly due to EBITDA margin contraction
Somany
Ceramics
With sales impacted in July 2017 post GST implementation, the management has
mentioned that re-stocking has begun from mid-August onwards. Hence, we expect
Somany to post subdued volume growth of 2.9% YoY to 12.3 MSM. Consequently,
we expect the topline to grow 3.1% YoY to | 461.2 crore. Further, we expect
EBITDA margins to contract 30 bps YoY to 8.5% led by higher raw material costs
(60.9% in Q2FY18E vs. 60.7% in Q2FY17). Consequently, we expect the bottomline
to grow moderately at 2.7% YoY to | 24.6 crore
Source: Company, ICICIdirect.com Research
Exhibit 26: Company specific view (Plywood coverage universe)
Company Remarks
Century Plyboard With a steady improvement in the demand environment, we expect Century to post
a moderate topline growth of 5.1% YoY to | 482.8 crore. Its plywood and allied
division revenues are expected to grow 3.6% YoY to | 336.8 crore while laminates
and allied division segment is expected to post a topline growth of 5.7% YoY to |
103.5 crore. Further, we expect EBITDA margins to contract 140 bps YoY to 15.1%
mainly on account of a 310 bps YoY contraction in plywood & allied division EBIT
margin to 12% due to a hike in raw material costs. Hence, the bottomline is
expected to decline 11.5% YoY to | 43.6 crore led by EBITDA margin contraction
and higher effective tax rate (19% in Q2FY18E vs. 15.6% in Q2FY17)
Greenply
Industries
Greenply is expected to post flattish topline growth of 0.9% YoY at | 438.9 crore as
its plywood division revenues are expected to post 2.3% YoY de-growth to | 303.8
crore due to the impact of de-stocking in July, 2017. However, MDF revenues are
expected to grow strongly at 10.1% YoY to | 136.1 crore as it is not much impacted
due to destocking. Furthermore, we expect EBITDA margins to expand 20 bps YoY
to 15.0% led by 60 bps YoY improvement in plywood division margins to 11%.
Consequently, we expect the bottomline to grow 5.8% YoY to | 37.1 crore
Source: Company, ICICIdirect.com Research
Exhibit 27: Company specific view (Home Improvement coverage universe)
Company Remarks
Shankara Building
Products
We expect Shankara's topline to grow 6.1% YoY to | 638.6 crore led by robust
growth of 20% YoY to | 319.6 crore in its retail division. On the other hand, we
expect channel and enterprise division revenues to decline 5% YoY to | 319.0 crore
in line with the management's plan to reduce channel division revenues. With a
higher share of high margin retail division (50% share in Q2FY18E revenues vs.
44.2% in Q2FY17), we expect EBITDA margins to expand 20 bps YoY to 6.6%.
Overall, we expect its bottomline to grow robustly at 33.9% YoY to | 19.0 crore led
by the strong performance of retail division and lower interest expenses
Source: Company, ICICIdirect.com Research
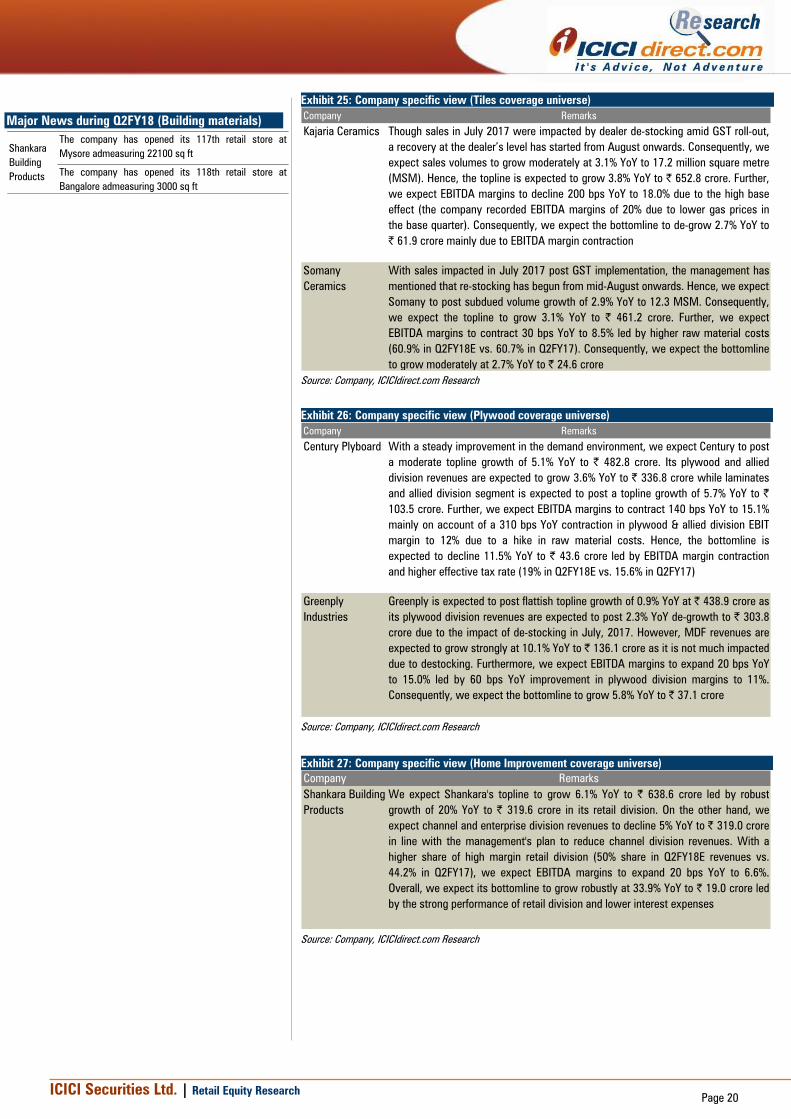
Major News during Q2FY18 (Building materials)
The company has opened its 117th retail store at
Mysore admeasuring 22100 sq ft
The company has opened its 118th retail store at
Bangalore admeasuring 3000 sq ft
Shankara
Building
Products
ICICI Securities Ltd. | Retail Equity Research
Page 21
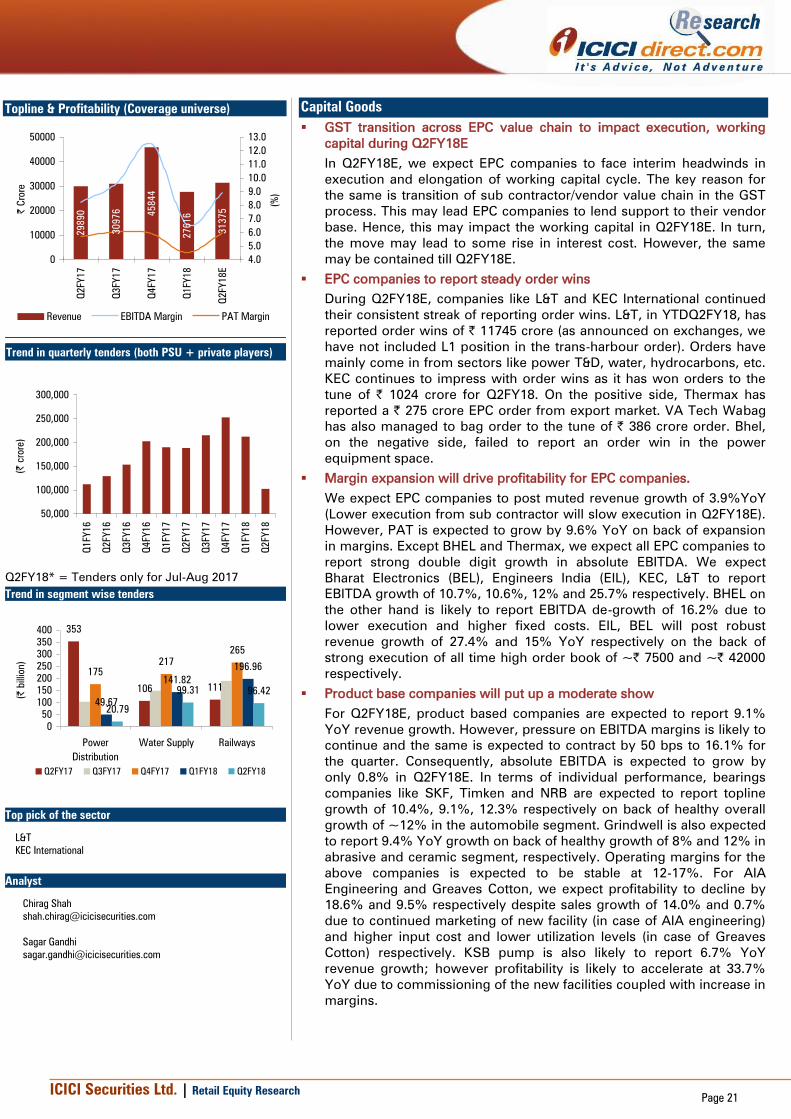
Capital Goods
GST transition across EPC value chain to impact execution, working
capital during Q2FY18E
In Q2FY18E, we expect EPC companies to face interim headwinds in
execution and elongation of working capital cycle. The key reason for
the same is transition of sub contractor/vendor value chain in the GST
process. This may lead EPC companies to lend support to their vendor
base. Hence, this may impact the working capital in Q2FY18E. In turn,
the move may lead to some rise in interest cost. However, the same
may be contained till Q2FY18E.
EPC companies to report steady order wins
During Q2FY18E, companies like L&T and KEC International continued
their consistent streak of reporting order wins. L&T, in YTDQ2FY18, has
reported order wins of | 11745 crore (as announced on exchanges, we
have not included L1 position in the trans-harbour order). Orders have
mainly come in from sectors like power T&D, water, hydrocarbons, etc.
KEC continues to impress with order wins as it has won orders to the
tune of | 1024 crore for Q2FY18. On the positive side, Thermax has
reported a | 275 crore EPC order from export market. VA Tech Wabag
has also managed to bag order to the tune of | 386 crore order. Bhel,
on the negative side, failed to report an order win in the power
equipment space.
Margin expansion will drive profitability for EPC companies.
We expect EPC companies to post muted revenue growth of 3.9%YoY
(Lower execution from sub contractor will slow execution in Q2FY18E).
However, PAT is expected to grow by 9.6% YoY on back of expansion
in margins. Except BHEL and Thermax, we expect all EPC companies to
report strong double digit growth in absolute EBITDA. We expect
Bharat Electronics (BEL), Engineers India (EIL), KEC, L&T to report
EBITDA growth of 10.7%, 10.6%, 12% and 25.7% respectively. BHEL on
the other hand is likely to report EBITDA de-growth of 16.2% due to
lower execution and higher fixed costs. EIL, BEL will post robust
revenue growth of 27.4% and 15% YoY respectively on the back of
strong execution of all time high order book of ~| 7500 and ~| 42000
respectively.
Product base companies will put up a moderate show
For Q2FY18E, product based companies are expected to report 9.1%
YoY revenue growth. However, pressure on EBITDA margins is likely to
continue and the same is expected to contract by 50 bps to 16.1% for
the quarter. Consequently, absolute EBITDA is expected to grow by
only 0.8% in Q2FY18E. In terms of individual performance, bearings
companies like SKF, Timken and NRB are expected to report topline
growth of 10.4%, 9.1%, 12.3% respectively on back of healthy overall
growth of ~12% in the automobile segment. Grindwell is also expected
to report 9.4% YoY growth on back of healthy growth of 8% and 12% in
abrasive and ceramic segment, respectively. Operating margins for the
above companies is expected to be stable at 12-17%. For AIA
Engineering and Greaves Cotton, we expect profitability to decline by
18.6% and 9.5% respectively despite sales growth of 14.0% and 0.7%
due to continued marketing of new facility (in case of AIA engineering)
and higher input cost and lower utilization levels (in case of Greaves
Cotton) respectively. KSB pump is also likely to report 6.7% YoY
revenue growth; however profitability is likely to accelerate at 33.7%
YoY due to commissioning of the new facilities coupled with increase in
margins.
Topline & Profitability (Coverage universe)
29890
30976 45844
27616
31375
0
10000
20000
30000
40000
50000
Q2FY17
Q3FY17
Q4FY17
Q1FY18
Q2FY18E
| C
rore
4.0
5.0
6.0
7.0
8.0
9.0
10.0
11.0
12.0
13.0
(%
)
Revenue EBITDA Margin PAT Margin
Trend in quarterly tenders (both PSU + private players)
50,000
100,000
150,000
200,000
250,000
300,000
Q1FY16
Q2FY16
Q3FY16
Q4FY16
Q1FY17
Q2FY17
Q3FY17
Q4FY17
Q1FY18
Q2FY18
(|
crore)
Q2FY18* = Tenders only for Jul-Aug 2017
Trend in segment wise tenders
353
106 111
175
217
265
49.67
141.82
196.96
20.79
99.31 96.42
0
50
100
150
200
250
300
350
400
Power
Distribution
Water Supply Railways
(|
billion)
Q2FY17 Q3FY17 Q4FY17 Q1FY18 Q2FY18
Top pick of the sector
L&T
KEC International
Analyst
Chirag Shah
Sagar Gandhi

ICICI Securities Ltd. | Retail Equity Research
Page 22
Exhibit 28: Estimates for Q2FY18E (Capital Goods) (| Crore)
Revenue EBITDA PAT
Q2FY18E YoY QoQ Q2FY18E YoY QoQ Q2FY18E YoY QoQ
AIA Engineering 603.5 14.0 5.9 132.8 -16.4 2.7 90.9 -18.6 3.4
Bharat Electronics 2,064.4 15.0 19.7 374.5 10.7 129.3 377.3 9.0 201.1
BHEL 6,335.3 -4.9 15.1 130.0 -16.2 LP 125.9 15.5 55.7
Engineers India Ltd 431.8 27.4 15.0 103.6 10.6 26.8 103.1 10.0 26.7
Greaves Cotton 442.4 0.7 8.9 61.6 -11.8 11.3 46.5 -9.5 12.9
Grindwell Norton 340.5 9.4 0.8 52.1 14.0 0.4 32.9 13.5 9.6
KEC Internnational 2,229.1 7.5 20.1 207.6 12.0 17.7 82.0 26.1 30.2
KSB Pumps 172.4 6.7 -18.0 17.2 35.8 -27.6 9.9 33.7 -35.9
L&T 15,497.6 5.4 11.2 1,367.2 25.7 41.6 878.8 8.0 8.0
NRB Bearings 201.8 12.3 12.6 32.1 13.3 17.1 18.4 12.5 45.0
Reliance Defence &
Engineering
180.0 83.3 9.2 16.2 41.0 30.0 -92.9 NA NA
SKF India 731.1 10.4 9.7 93.5 11.3 -0.1 66.3 10.0 3.2
Thermax Ltd 912.9 4.8 28.0 79.4 2.7 85.0 62.6 5.0 93.1
Timken India 308.2 9.1 2.8 52.1 9.6 22.9 32.6 9.3 48.9
Va Tech Wabag 924.2 18.9 38.2 72.1 23.3 72.4 31.4 22.3 275.3
Total 31,375.2 5.0 13.6 2,792.0 13.7 53.4 1,865.8 9.6 49.5
Change (%)
Company
Change (%) Change (%)
Source: Company, ICICIdirect.com Research
Interest costs for EPC companies to rise higher than the revenue
growth,
We expect the interest costs for our coverage universe to increase by
6.5% YoY, which is higher than revenue growth of 3.9% for the
coverage. This is mainly on account of vendor/sub contactor support
given the value chain is still transiting through the implementation
process of GST. From a individual basis, we believe L&T will see a 6%
YoY growth in interest cost while KEC will witness a 5% rise in the
same in Q2FY18E (KEC over the last few quarters was witnessing
declining in interest costs). But going ahead, H2FY18, we expect the
trend in working capital and interest costs to normalise.
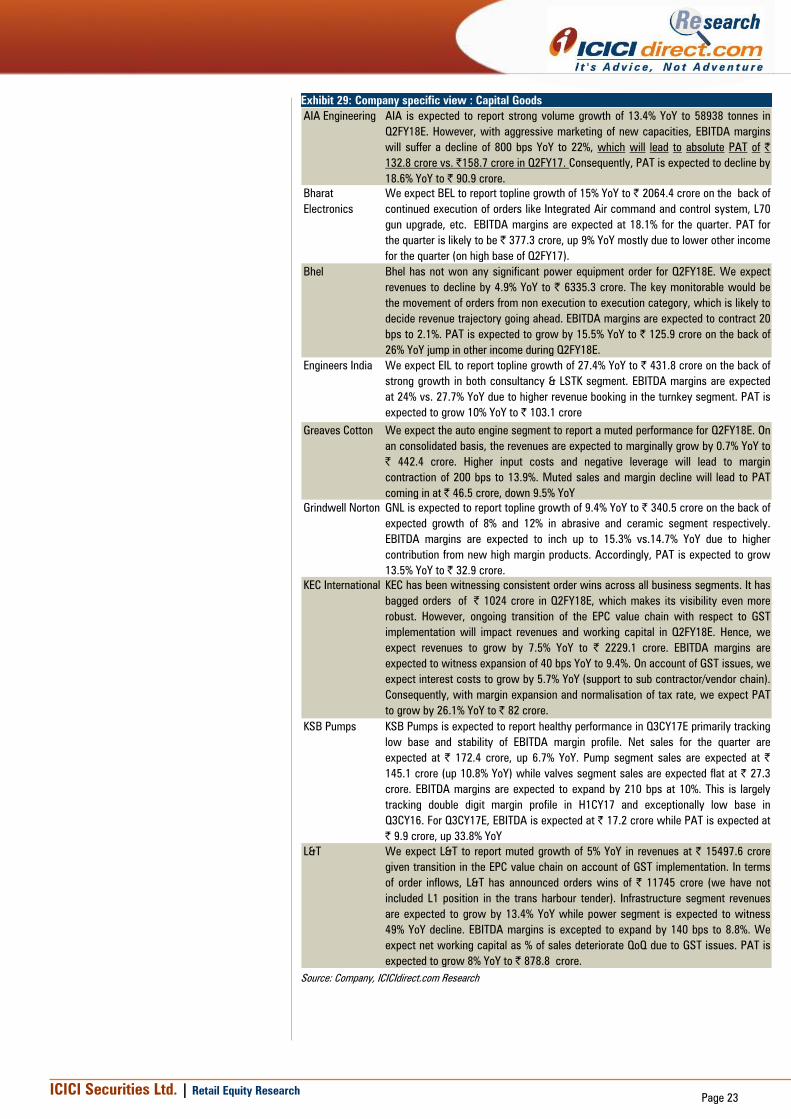
ICICI Securities Ltd. | Retail Equity Research
Page 23
Exhibit 29: Company specific view : Capital Goods
AIA Engineering AIA is expected to report strong volume growth of 13.4% YoY to 58938 tonnes in
Q2FY18E. However, with aggressive marketing of new capacities, EBITDA margins
will suffer a decline of 800 bps YoY to 22%, which will lead to absolute PAT of |
132.8 crore vs. |158.7 crore in Q2FY17. Consequently, PAT is expected to decline by
18.6% YoY to | 90.9 crore.
Bharat
Electronics
We expect BEL to report topline growth of 15% YoY to | 2064.4 crore on the back of
continued execution of orders like Integrated Air command and control system, L70
gun upgrade, etc. EBITDA margins are expected at 18.1% for the quarter. PAT for
the quarter is likely to be | 377.3 crore, up 9% YoY mostly due to lower other income
for the quarter (on high base of Q2FY17).
Bhel Bhel has not won any significant power equipment order for Q2FY18E. We expect
revenues to decline by 4.9% YoY to | 6335.3 crore. The key monitorable would be
the movement of orders from non execution to execution category, which is likely to
decide revenue trajectory going ahead. EBITDA margins are expected to contract 20
bps to 2.1%. PAT is expected to grow by 15.5% YoY to | 125.9 crore on the back of
26% YoY jump in other income during Q2FY18E.
Engineers India We expect EIL to report topline growth of 27.4% YoY to | 431.8 crore on the back of
strong growth in both consultancy & LSTK segment. EBITDA margins are expected
at 24% vs. 27.7% YoY due to higher revenue booking in the turnkey segment. PAT is
expected to grow 10% YoY to | 103.1 crore
Greaves Cotton We expect the auto engine segment to report a muted performance for Q2FY18E. On
an consolidated basis, the revenues are expected to marginally grow by 0.7% YoY to
| 442.4 crore. Higher input costs and negative leverage will lead to margin
contraction of 200 bps to 13.9%. Muted sales and margin decline will lead to PAT
coming in at | 46.5 crore, down 9.5% YoY
Grindwell Norton GNL is expected to report topline growth of 9.4% YoY to | 340.5 crore on the back of
expected growth of 8% and 12% in abrasive and ceramic segment respectively.
EBITDA margins are expected to inch up to 15.3% vs.14.7% YoY due to higher
contribution from new high margin products. Accordingly, PAT is expected to grow
13.5% YoY to | 32.9 crore.
KEC International KEC has been witnessing consistent order wins across all business segments. It has
bagged orders of | 1024 crore in Q2FY18E, which makes its visibility even more
robust. However, ongoing transition of the EPC value chain with respect to GST
implementation will impact revenues and working capital in Q2FY18E. Hence, we
expect revenues to grow by 7.5% YoY to | 2229.1 crore. EBITDA margins are
expected to witness expansion of 40 bps YoY to 9.4%. On account of GST issues, we
expect interest costs to grow by 5.7% YoY (support to sub contractor/vendor chain).
Consequently, with margin expansion and normalisation of tax rate, we expect PAT
to grow by 26.1% YoY to | 82 crore.
KSB Pumps KSB Pumps is expected to report healthy performance in Q3CY17E primarily tracking
low base and stability of EBITDA margin profile. Net sales for the quarter are
expected at | 172.4 crore, up 6.7% YoY. Pump segment sales are expected at |
145.1 crore (up 10.8% YoY) while valves segment sales are expected flat at | 27.3
crore. EBITDA margins are expected to expand by 210 bps at 10%. This is largely
tracking double digit margin profile in H1CY17 and exceptionally low base in
Q3CY16. For Q3CY17E, EBITDA is expected at | 17.2 crore while PAT is expected at
| 9.9 crore, up 33.8% YoY
L&T We expect L&T to report muted growth of 5% YoY in revenues at | 15497.6 crore
given transition in the EPC value chain on account of GST implementation. In terms
of order inflows, L&T has announced orders wins of | 11745 crore (we have not
included L1 position in the trans harbour tender). Infrastructure segment revenues
are expected to grow by 13.4% YoY while power segment is expected to witness
49% YoY decline. EBITDA margins is excepted to expand by 140 bps to 8.8%. We
expect net working capital as % of sales deteriorate QoQ due to GST issues. PAT is
expected to grow 8% YoY to | 878.8 crore.
Source: Company, ICICIdirect.com Research

ICICI Securities Ltd. | Retail Equity Research
Page 24
Exhibit 30: Company specific view : Capital Goods (Continued) eses
NRB Bearings NRB is expected to report double digit topline growth of 12.3% YoY to | 201.8 crore,
on the back of strong volume growth of 15% and 10% in two-wheeler and
commercial segment respectively. EBITDA margins are expected at 15.9% for
Q2FY18E vs. 15.8% in Q2FY17. PAT is expected to grow 12.5% YoY to | 18.4 crore.
Reliance Defence Reliance defence is expected to post higher revenues of | 180 crore for Q2FY18E on
the back of revenue booking of patrol boats delivered to Indian Navy in the quarter.
Better execution would lead to EBITDA margin improvement resulting in operating
profit of | 16.2 crore. Accordingly, we expect loss at PAT level to decrease to | 92.9
crore in Q2FY18E.
SKF India SKF is expected to deliver revenue growth of 10.4% YoY to | 731.1 crore. This is due
to mixed volume growth of 15%, 10% and 3.3% in the two-wheeler, commercial
vehicle and passenger segment, respectively. The industrial segment is likely to
witness 7% YoY growth on account of slow offtake of new product offerings in this
segment. We expect SKF to post stable EBITDA margins of 12.8% in Q2FY18E. PAT
is likely to grow 10% YoY to | 66.3 crore
Thermax The company has won a significant export order of $43 million or | 275 crore. This
coupled with decent order wins in Q1FY18 will now add to order backlog accretion
and revenue visibility. For Q2FY18E, we expect revenues to grow by 4.8% YoY to |
912.9 crore. EBITDA margins are expected to remain muted at 8.7% YoY. PAT is
expected to grow by 5% YoY at | 62.6 crore. Key monitorable would be performance
of TBW JV and Chinese subsidiary.
Timken India Timken is expected to report topline growth of 9.1% to | 308.2 crore. Higher single
digit topline growth is expected on the back of continued momentum in exports
growth of 12% YoY. Domestic performance is also likely to witness stable growth of
8% on the back of 10% growth in M&HCV segment in Q2FY18. EBITDA margins are
expected at remain stable at 16.9%. PAT is expected to increase 9.3% YoY to | 32.6
crore
VA Tech Wabag Wabag is expected to report strong topline growth of 18.9% YoY to | 924.2 crore on
the back of healthy execution in both domestic and overseas orders. The EBITDA
margin is expected 7.8% vs. 7.5% YoY. Absolute EBITDA is likely to grow 23.3% YoY
to | 72.1 crore. We expect PAT of | 31.4 crore for the quarter. We expect order
inflows of ~| 500 crore for the quarter.
Source: Company, ICICIdirect.com Research

ICICI Securities Ltd. | Retail Equity Research
Page 25
Cement
Acquisitions, capacity expansion to drive volume growth
We expect cement demand to remain subdued in Q2FY18E mainly due
to the impact of monsoon and sand mining issue in many parts of India.
On the infrastructure side, tendering activities have also remained
lacklustre (down 10.5% YoY in Q1FY18, 7.1% YoY in July-August 2018).
On an organic basis, we expect companies under our coverage to
report flat to negative volume growth. However, considering the
acquisition of Jaypee by UltraTech, merger of Trinetra Cement by India
Cement and capacity expansion by various companies under our
coverage universe, we expect companies to report optically higher
volume growth. Considering this, companies in our coverage universe
are expected to register volume growth of 10.5% YoY in Q2FY18E.
Despite lean demand, prices remain firm YoY
As per our channel checks, prices in the west have improved 8.9% YoY
to | 305/bag mainly due to a healthy price rise in the Gujarat region.
Further, prices in the east have improved 5.4% YoY to | 269 per bag led
by higher infra spend. Prices in central and south are expected to
register growth of 1.4% YoY and 0.3% YoY, respectively, while North is
expected to report a price decline of 1.1% YoY. Overall, realisation at
the pan-India level has increased 3.3% YoY to | 316/bag. We expect
companies in our coverage universe to report 1.4% YoY increase in
realisation to | 4,774.
I-direct universe to report 11.7% YoY topline growth in Q2FY18E
Our coverage universe is expected to report 11.7% YoY increase in
cement revenues led by 10.5% YoY increase in volumes. Company
wise, we expect UltraTech and India Cement to report volume growth
of 21.6% YoY and 11.0% YoY mainly due to inorganic expansion.
However, Star Cement and Heidelberg Cement are expected to report
volume de-growth of 10.0% and 1.0% YoY primarily due to monsoon
and increased competitive intensity. The bottomline of our universe is
expected to decline 10.6% YoY to | 1,437.6 crore led by lower
operating margins and higher tax expenses.
Increased pet coke prices, diesel prices to dent EBITDA/tonne
Q2 being a lean season, cement companies undertake maintenance
work in this quarter, which results in higher other cost. This coupled
with higher pet coke prices (impact of | 80-90/t) and increase in freight
cost is expected to keep EBITDA/t under pressure. Consequently, we
expect companies under our coverage universe to report 9.7% YoY
decrease in EBITDA/tonne to | 799/t.
Exhibit 1: Estimates for Q2FY18E (| Crore)
Revenue EBITDA PAT
Q2FY18E YoY QoQ Q2FY18E YoY QoQ Q2FY18E YoY QoQ
ACC^ 2,616.3 5.8 -17.5 234.2 4.0 -48.8 144.6 76.4 -42.4
Ambuja^ 2,087.7 4.2 -24.5 289.0 4.7 -53.5 253.9 -8.4 -39.3
Heidelberg 384.4 0.0 -24.0 49.5 -17.2 -44.7 12.4 -25.1 -65.0
India Cement * 1,407.9 7.7 -2.2 179.8 -19.9 -17.3 25.1 -59.8 -56.3
JK Cement 1,009.2 10.8 2.7 157.1 7.4 -15.8 48.1 16 -37
JK Laxmi Cement 719.4 9.7 -17.2 96.0 2.5 -26.1 19.2 -22.9 -43.3
Mangalam Cement 198.2 4.6 -25.7 22.9 2.4 -49.0 4.6 45.7 -75.9
Ramco Cements 1,033.7 1.7 0.5 286.6 -18.8 -1.3 144.1 -30.4 -7.5
Shree Cement * 2,452.4 8.8 -12.2 596.1 -9.2 -21.4 334.6 14.8 -18.4
Star Cement 332.4 -8.8 -28.6 61.5 4.4 -41.3 13.5 1,889.4 -67.0
UltraTech Cem 6,691.9 24.0 -2.4 1,188.4 8.6 -22.1 437.5 -27.2 -46.7
Total 18,933.5 11.7 -10.4 3,161.1 -1.5 -28.6 1,437.6 -10.6 -38.0
Company
Change (%) Change (%) Change (%)
Source: Company, ICICIdirect.com research ^Q3CY17 result
Topline & Profitability (Coverage universe)
16956
17477
20526
21196
18934
0
4000
8000
12000
16000
20000
Q2FY17
Q3FY17
Q4FY17
Q1FY18
Q2FY18E
| C
rore
4.0
6.0
8.0
10.0
12.0
14.0
16.0
18.0
20.0
22.0
(%
)
Revenue EBITDA Margin PAT Margin
All-India quarterly cement dispatches
20
30
40
50
60
70
80
Q2FY16
Q3FY16
Q4FY16
Q1FY17
Q2FY17
Q3FY17
Q4FY17
Q1FY18
Q2FY18E
million t
onnes
-15.0
-10.0
-5.0
0.0
5.0
10.0
15.0
%
Cement dispatches (LHS) YoY growth (RHS)
Monthly production growth YoY (%) – Till Aug 2017
-15.8
-5.2
-0.4
-6.3
-2.0
-1.3
9.2
13.5
2.7
10.5
0.7 3
.1
6.2
-13.3
-6.0
11.9
4.3 6.6
0.5
-20.0
-10.0
0.0
10.0
20.0
Jan
Feb
Mar
Apr
May
Jun
Jul
Aug
Sep
Oct
Nov
Dec
2017 2016
2015
Top pick of the sector
Ambuja
Research Analyst
Rashesh Shah
Devang Bhatt
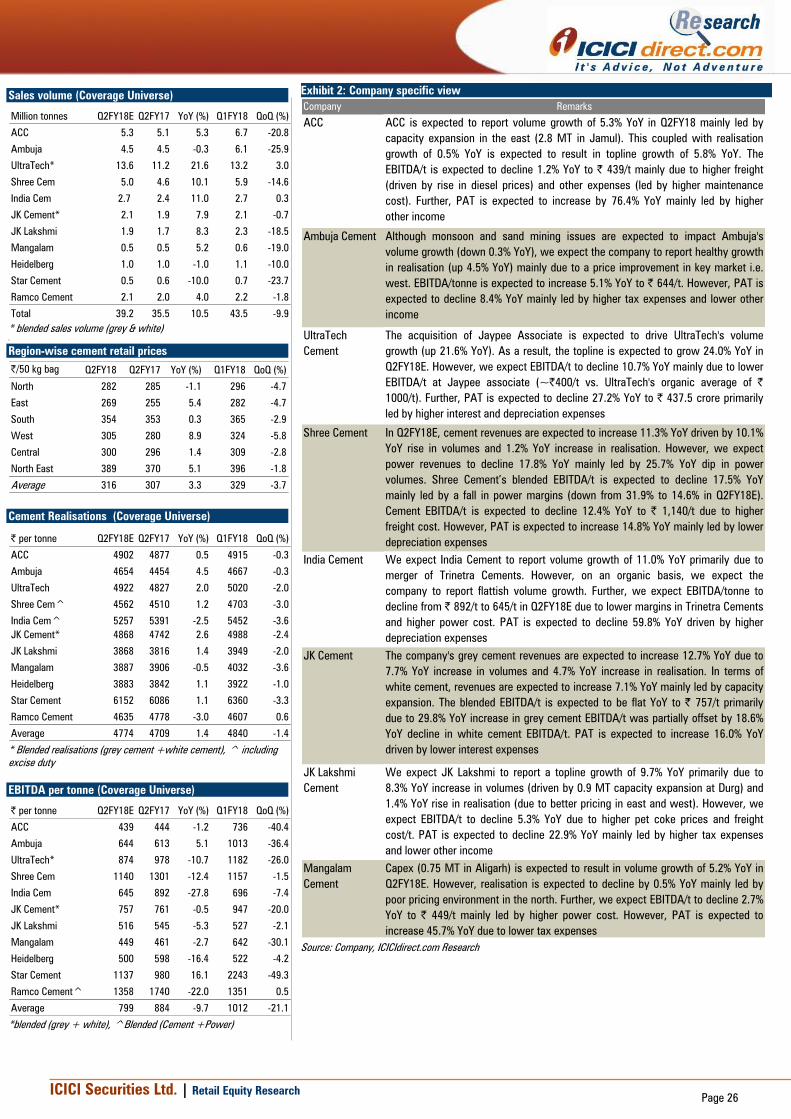
ICICI Securities Ltd. | Retail Equity Research
Page 26
Exhibit 2: Company specific view
Company Remarks
ACC ACC is expected to report volume growth of 5.3% YoY in Q2FY18 mainly led by
capacity expansion in the east (2.8 MT in Jamul). This coupled with realisation
growth of 0.5% YoY is expected to result in topline growth of 5.8% YoY. The
EBITDA/t is expected to decline 1.2% YoY to | 439/t mainly due to higher freight
(driven by rise in diesel prices) and other expenses (led by higher maintenance
cost). Further, PAT is expected to increase by 76.4% YoY mainly led by higher
other income
Ambuja Cement Although monsoon and sand mining issues are expected to impact Ambuja's
volume growth (down 0.3% YoY), we expect the company to report healthy growth
in realisation (up 4.5% YoY) mainly due to a price improvement in key market i.e.
west. EBITDA/tonne is expected to increase 5.1% YoY to | 644/t. However, PAT is
expected to decline 8.4% YoY mainly led by higher tax expenses and lower other
income
UltraTech
Cement
The acquisition of Jaypee Associate is expected to drive UltraTech's volume
growth (up 21.6% YoY). As a result, the topline is expected to grow 24.0% YoY in
Q2FY18E. However, we expect EBITDA/t to decline 10.7% YoY mainly due to lower
EBITDA/t at Jaypee associate (~|400/t vs. UltraTech's organic average of |
1000/t). Further, PAT is expected to decline 27.2% YoY to | 437.5 crore primarily
led by higher interest and depreciation expenses
Shree Cement In Q2FY18E, cement revenues are expected to increase 11.3% YoY driven by 10.1%
YoY rise in volumes and 1.2% YoY increase in realisation. However, we expect
power revenues to decline 17.8% YoY mainly led by 25.7% YoY dip in power
volumes. Shree Cement’s blended EBITDA/t is expected to decline 17.5% YoY
mainly led by a fall in power margins (down from 31.9% to 14.6% in Q2FY18E).
Cement EBITDA/t is expected to decline 12.4% YoY to | 1,140/t due to higher
freight cost. However, PAT is expected to increase 14.8% YoY mainly led by lower
depreciation expenses
India Cement We expect India Cement to report volume growth of 11.0% YoY primarily due to
merger of Trinetra Cements. However, on an organic basis, we expect the
company to report flattish volume growth. Further, we expect EBITDA/tonne to
decline from | 892/t to 645/t in Q2FY18E due to lower margins in Trinetra Cements
and higher power cost. PAT is expected to decline 59.8% YoY driven by higher
depreciation expenses
JK Cement The company's grey cement revenues are expected to increase 12.7% YoY due to
7.7% YoY increase in volumes and 4.7% YoY increase in realisation. In terms of
white cement, revenues are expected to increase 7.1% YoY mainly led by capacity
expansion. The blended EBITDA/t is expected to be flat YoY to | 757/t primarily
due to 29.8% YoY increase in grey cement EBITDA/t was partially offset by 18.6%
YoY decline in white cement EBITDA/t. PAT is expected to increase 16.0% YoY
driven by lower interest expenses
JK Lakshmi
Cement
We expect JK Lakshmi to report a topline growth of 9.7% YoY primarily due to
8.3% YoY increase in volumes (driven by 0.9 MT capacity expansion at Durg) and
1.4% YoY rise in realisation (due to better pricing in east and west). However, we
expect EBITDA/t to decline 5.3% YoY due to higher pet coke prices and freight
cost/t. PAT is expected to decline 22.9% YoY mainly led by higher tax expenses
and lower other income
Mangalam
Cement
Capex (0.75 MT in Aligarh) is expected to result in volume growth of 5.2% YoY in
Q2FY18E. However, realisation is expected to decline by 0.5% YoY mainly led by
poor pricing environment in the north. Further, we expect EBITDA/t to decline 2.7%
YoY to | 449/t mainly led by higher power cost. However, PAT is expected to
increase 45.7% YoY due to lower tax expenses
Source: Company, ICICIdirect.com Research
Sales volume (Coverage Universe)
Million tonnes Q2FY18E Q2FY17 YoY (%) Q1FY18 QoQ (%)
ACC 5.3 5.1 5.3 6.7 -20.8
Ambuja 4.5 4.5 -0.3 6.1 -25.9
UltraTech* 13.6 11.2 21.6 13.2 3.0
Shree Cem 5.0 4.6 10.1 5.9 -14.6
India Cem 2.7 2.4 11.0 2.7 0.3
JK Cement* 2.1 1.9 7.9 2.1 -0.7
JK Lakshmi 1.9 1.7 8.3 2.3 -18.5
Mangalam 0.5 0.5 5.2 0.6 -19.0
Heidelberg 1.0 1.0 -1.0 1.1 -10.0
Star Cement 0.5 0.6 -10.0 0.7 -23.7
Ramco Cement 2.1 2.0 4.0 2.2 -1.8
Total 39.2 35.5 10.5 43.5 -9.9
* blended sales volume (grey & white)
RE
Region-wise cement retail prices
|/50 kg bag Q2FY18 Q2FY17 YoY (%) Q1FY18 QoQ (%)
North 282 285 -1.1 296 -4.7
East 269 255 5.4 282 -4.7
South 354 353 0.3 365 -2.9
West 305 280 8.9 324 -5.8
Central 300 296 1.4 309 -2.8
North East 389 370 5.1 396 -1.8
Average 316 307 3.3 329 -3.7
Cement Realisations (Coverage Universe)
| per tonne Q2FY18E Q2FY17 YoY (%) Q1FY18 QoQ (%)
ACC 4902 4877 0.5 4915 -0.3
Ambuja 4654 4454 4.5 4667 -0.3
UltraTech 4922 4827 2.0 5020 -2.0
Shree Cem^ 4562 4510 1.2 4703 -3.0
India Cem^ 5257 5391 -2.5 5452 -3.6
JK Cement* 4868 4742 2.6 4988 -2.4
JK Lakshmi 3868 3816 1.4 3949 -2.0
Mangalam 3887 3906 -0.5 4032 -3.6
Heidelberg 3883 3842 1.1 3922 -1.0
Star Cement 6152 6086 1.1 6360 -3.3
Ramco Cement 4635 4778 -3.0 4607 0.6
Average 4774 4709 1.4 4840 -1.4
* Blended realisations (grey cement +white cement), ^ including
excise duty
EBITDA per tonne (Coverage Universe)
| per tonne Q2FY18E Q2FY17 YoY (%) Q1FY18 QoQ (%)
ACC 439 444 -1.2 736 -40.4
Ambuja 644 613 5.1 1013 -36.4
UltraTech* 874 978 -10.7 1182 -26.0
Shree Cem 1140 1301 -12.4 1157 -1.5
India Cem 645 892 -27.8 696 -7.4
JK Cement* 757 761 -0.5 947 -20.0
JK Lakshmi 516 545 -5.3 527 -2.1
Mangalam 449 461 -2.7 642 -30.1
Heidelberg 500 598 -16.4 522 -4.2
Star Cement 1137 980 16.1 2243 -49.3
Ramco Cement^ 1358 1740 -22.0 1351 0.5
Average 799 884 -9.7 1012 -21.1
*blended (grey + white), ^Blended (Cement +Power)
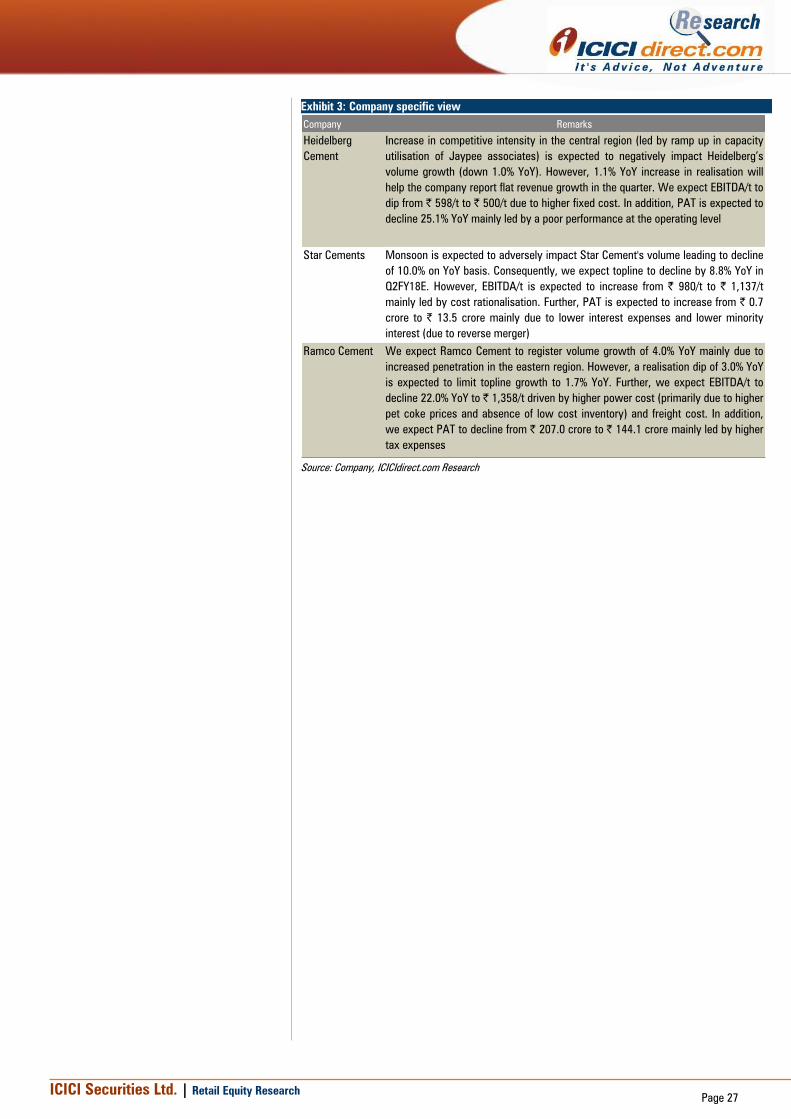
ICICI Securities Ltd. | Retail Equity Research
Page 27
Exhibit 3: Company specific view
Company Remarks
Heidelberg
Cement
Increase in competitive intensity in the central region (led by ramp up in capacity
utilisation of Jaypee associates) is expected to negatively impact Heidelberg’s
volume growth (down 1.0% YoY). However, 1.1% YoY increase in realisation will
help the company report flat revenue growth in the quarter. We expect EBITDA/t to
dip from | 598/t to | 500/t due to higher fixed cost. In addition, PAT is expected to
decline 25.1% YoY mainly led by a poor performance at the operating level
Star Cements Monsoon is expected to adversely impact Star Cement's volume leading to decline
of 10.0% on YoY basis. Consequently, we expect topline to decline by 8.8% YoY in
Q2FY18E. However, EBITDA/t is expected to increase from | 980/t to | 1,137/t
mainly led by cost rationalisation. Further, PAT is expected to increase from | 0.7
crore to | 13.5 crore mainly due to lower interest expenses and lower minority
interest (due to reverse merger)
Ramco Cement We expect Ramco Cement to register volume growth of 4.0% YoY mainly due to
increased penetration in the eastern region. However, a realisation dip of 3.0% YoY
is expected to limit topline growth to 1.7% YoY. Further, we expect EBITDA/t to
decline 22.0% YoY to | 1,358/t driven by higher power cost (primarily due to higher
pet coke prices and absence of low cost inventory) and freight cost. In addition,
we expect PAT to decline from | 207.0 crore to | 144.1 crore mainly led by higher
tax expenses
Source: Company, ICICIdirect.com Research

ICICI Securities Ltd. | Retail Equity Research
Page 28
Construction & Roads
NHAI confident of achieving yearly target despite slow start…
Owing to land acquisition issues, NHAI has awarded/constructed only
165 km/670 km in Q1FY18. However, NHAI is confident of exceeding its
FY18 awarding/construction target of 6500 km/3500 km. On fund raising
front, NHAI has already raised | 19880 crore including | 8500 crore
from LIC & | 5000 crore from EPFO till August, 2017. NHAI’s board has
approved monetisation of operational highway projects under which, 9
highway projects will be auctioned by October, 2017 end, which would
generate | 6700 crore. NHAI’s fund raising coupled with recent pick-up
in tendering activity should result in strong awarding activity ahead
which bodes well for EPC players.
Tendering activity in road sector improves in July-August 2017…
On the tendering side, there has been a slowdown in Q1FY18 as overall
tenders fell 10.5% YoY to | 1.7 lakh crore while road tenders fell 14.8%
YoY to ~| 62277 crore. On the other hand, during July-August 2017,
the tendering activity in the road division has picked up significantly
with road tenders growing robustly at 46.2% YoY to ~| 40909 crore.
However, overall tenders declined trend with 7.1% YoY decline in July-
August 2018 to ~| 1 lakh crore largely on account of a decline in power
distribution tenders. We believe this could be a temporary blip & should
revive H2FY18E onwards on the back of government’s renewed focus
on infrastructure development.
Road universe revenues to grow 14.2% YoY…
We expect revenues of our road universe to grow 14.2% YoY to
| 3093.1 crore led by 62.6% YoY growth in Ashoka’s revenues to
| 719.7 crore in Q2FY18E. Further, our construction universe is
expected to report moderate growth of 6.7% YoY in revenues to
| 4752.8 crore led by 13.2% YoY growth in NBCC’s topline.
PAT of our road universe to grow robustly by 24.6% YoY…
Our road universe is expected to post PAT growth of 24.6% YoY to
| 300.7 crore led by 37.7% YoY growth in IRB’s bottomline due to lower
depreciation and interest expenses. Our construction universe
bottomline is expected to remain flattish at | 135.5 crore, given the
seasonally weak quarter impacted by heavy monsoon.
Exhibit 4: Estimates for Q2FY18E (Road) (| Crore)
Revenue EBITDA PAT
Q2FY18E YoY QoQ Q2FY18E YoY QoQ Q2FY18E YoY QoQ
Ashoka Buildcon 719.7 62.6 -0.4 93.6 34.1 -4.1 59.0 30.1 -4.8
IRB Infra 1,336.7 3.6 -26.4 628.1 -11.4 -23.2 195.8 37.7 -17.7
PNC Infratech 351.7 -2.3 -1.4 45.7 -1.4 -12.2 23.1 -34.4 -22.7
Sadbhav Eng. 685.0 11.3 -27.5 75.4 15.3 -29.4 22.7 22.8 -59.0
Total 3,093.1 14.2 -19.5 842.7 -5.4 -21.5 300.7 24.6 -21.9
Change (%)Change (%) Change (%)
Company
Source: Company, ICICIdirect.com Research
Exhibit 5: Estimates for Q2FY18E (Construction) (| Crore)
Revenue EBITDA PAT
Q2FY18E YoY QoQ Q2FY18E YoY QoQ Q2FY18E YoY QoQ
NBCC 1,413.8 13.2 11.6 84.2 16.8 29.8 69.2 2.9 23.7
NCC 2,019.8 3.7 0.3 171.5 0.3 0.3 55.1 7.8 -13.1
Simplex Infra 1,319.2 5.0 -12.7 152.1 -4.8 -12.0 11.2 -37.3 -61.1
Total 4,752.8 6.7 -0.8 407.8 1.2 -0.2 135.5 -0.5 -8.5
Company
Change (%)Change (%) Change (%)
Source: Company, ICICIdirect.com Research
Topline & profitability (Road Coverage)
2709 3
263
3621
3841
3093
2000
2500
3000
3500
4000
Q2FY17
Q3FY17
Q4FY17
Q1FY18
Q2FY18E
| C
rore
5.0
10.0
15.0
20.0
25.0
30.0
35.0
40.0
(%
)
Revenue EBITDA Margin PAT Margin
Topline & profitability (Construction Coverage)
4453
4711 6035
4792
4753
0
1300
2600
3900
5200
6500
Q2FY17
Q3FY17
Q4FY17
Q1FY18
Q2FY18E
| C
rore
0.0
2.0
4.0
6.0
8.0
10.0
12.0
(%
)
Revenue EBITDA Margin PAT Margin
Strong pickup in tendering activity…
27,983
52,459
118,209
129417
62,277
40909
110,018
167,958
215,019
252,700
169,831
102222
0
100,000
200,000
300,000
July-Aug'
16
Q2FY17 Q3FY17 Q4FY17 Q1FY18 July-Aug'
17
(|
crore)
Road Tenders Total Tenders
Top pick of the sector
NCC
Sadbhav Engineering
Research Analyst
Deepak Purswani, CFA
Vaibhav Shah

ICICI Securities Ltd. | Retail Equity Research
Page 29
Exhibit 6: Company specific view (Road coverage universe)
Company Remarks
Ashoka Buildcon We expect Ashoka Buildcon to report stellar revenue growth of 62.6% YoY to |
719.7 crore on account of a lower base and strong execution. On a QoQ basis,
revenues are expected to decline 4.1%. Furthermore, we expect EBITDA margin to
contract 280 bps YoY to 13.0% due to high base impact. On the profitability front,
we expect PAT to grow robustly at 30.1% YoY to | 59.0 crore.
Key monitorable: Management guidance on execution and status of real estate
project
IRB Infrastructure We expect topline to grow moderately by 3.6% YoY to | 1336.7 crore as toll
revenues are expected to decline 26.5% YoY to | 412.9 crore following the transfer
of six projects to IRB InVIT. Also, we have not factored in transfer of Amritsar-
Pathankot to IRB InVIT. We expect construction revenues to grow robustly at 26.7%
YoY to | 923.8 crore. Further, we expect EBITDA margins to contract significantly
by 790 bps YoY to 47.0% as the share of comparatively lower margin construction
division has increased from 56.5% in Q2FY17 to 69.1% in Q2FY18E. However, the
bottomline is expected to grow robustly at 37.7% YoY to | 195.8 crore led by lower
depreciation and interest expenses as six projects have moved out from IRB's
balance sheet.
Key monitorable: Management guidance on order inflow
PNC Infratech With strong order inflow during the quarter, PNC's orderbook is at record high of
~| 11000 crore (including L1 orders). However, due to a delay in land acquisition,
the company has been unable to get appointed dates, which are expected to come
through in H2FY18. Consequently, we expect PNC's topline to de-grow 2.3% YoY to
| 351.7 crore. EBITDA margins are expected to expand 10 bps YoY to 13.0%.
However, we expect the bottomline to de-grow 34.4% to | 23.1 crore due to higher
effective tax rate (10% in Q2FY18E vs. 5.2% in Q2FY17).
Key monitorable: Management commentary on execution pick-up
Sadbhav
Engineering
With strong orderbook position at ~| 8600 crore (2.4x its TTM revenues), we
expect Sadbhav Engineering's execution to further improve. Consequently, we
expect Sadbhav's topline to grow robustly by 11.3% YoY to | 685.0 crore in
Q2FY18E. Furthermore, EBITDA margins are expected to expand 40 bps YoY at
11.0%. Consequently, we expect bottomline to grow at 22.8% YoY to | 22.7 crore
led by topline growth and margin expansion.
Key monitorable: Improvement in execution.
Source: Company, ICICIdirect.com Research
Road Coverage Universe
Interest expense* trend
13.9
11.5
10.7
8.8
9.7
6.0
9.0
12.0
15.0
Q2FY17
Q3FY17
Q4FY17
Q1FY18
Q2FY18E
(%)
*Interest Expenses as %age of Sales
Major news during Q2FY18
Ashoka
Buildcon
Ashoka has received extension in concession
period by a year i.e. up to September 9, 2018 for
its Ahmednagar-Aurangabad project from Public
Works Department of Maharashtra.
IRB
Infrastructure
IRB has achieved financial closure of its Udaipur-
Gujarat border six laning BOT project. The total
project cost is | 2088 crore of which equity
contribution in | 627 crore & it has tied up for
debt worth | 1461 crore with average cost of
10.65%
Udaipur Tollway, a wholly-owned subsidiary of
IRB has received the appointed date. Accordingly,
the SPV has started toll collection and also
construction on the Project from September 3,
2017
Sadbhav
Engineering
Sadbhav has won two EPC orders which include
upgradation to 6 lane with paved shoulders of
Sayla - Bamanbore section of NH 8A (38.1 km)
worth | 396 crore and upgradation to 6 lane with
paved shoulders of Bagodara - Limbdi section of
NH 8A (43 km) worth | 504 crore
MMRDA opened bids for four packages to be
awarded under Line 2B, which connects DN
Nagar to Mandale, and another five packages
under Line 4 for the Wadala to Kasarvadavli
stretch. The total project cost of these two lines
is estimated to be over | 25000 crore of which
L&T and Reliance Infrastructure are set to bag
orders worth | 1300 crore each
Road Sector
Media reports indicated that MoRTH (Ministry of
road, transport and highways) is looking to raise
| 15,000 crore by issuing National Highways
Authority of India (NHAI) bonds to the EPFO in
three tranches at an interest rate of 8.3% per
annum. The amount raised will be used for
highway expansion and bypass construction
projects
In an attempt to raise ~| 10 trillion for large
infrastructure projects, the government is looking
at measures including a public listing for state run
National Highways Authority of India (NHAI).
NHAI chairman mentioned that they are waiting
for ratings and once they are declared, they
would be ready to launch IPO and is confident of
launching it this year itself
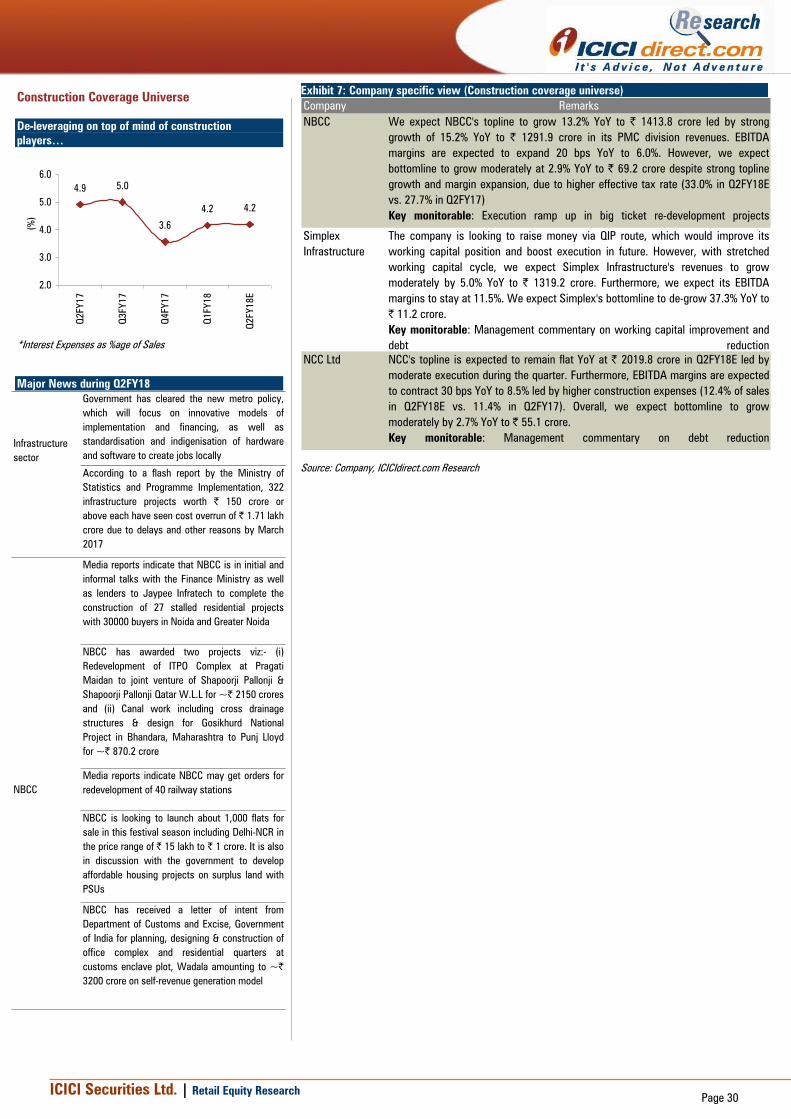
ICICI Securities Ltd. | Retail Equity Research
Page 30
Exhibit 7: Company specific view (Construction coverage universe)
Company Remarks
NBCC We expect NBCC's topline to grow 13.2% YoY to | 1413.8 crore led by strong
growth of 15.2% YoY to | 1291.9 crore in its PMC division revenues. EBITDA
margins are expected to expand 20 bps YoY to 6.0%. However, we expect
bottomline to grow moderately at 2.9% YoY to | 69.2 crore despite strong topline
growth and margin expansion, due to higher effective tax rate (33.0% in Q2FY18E
vs. 27.7% in Q2FY17)
Key monitorable: Execution ramp up in big ticket re-development projects
Simplex
Infrastructure
The company is looking to raise money via QIP route, which would improve its
working capital position and boost execution in future. However, with stretched
working capital cycle, we expect Simplex Infrastructure's revenues to grow
moderately by 5.0% YoY to | 1319.2 crore. Furthermore, we expect its EBITDA
margins to stay at 11.5%. We expect Simplex's bottomline to de-grow 37.3% YoY to
| 11.2 crore.
Key monitorable: Management commentary on working capital improvement and
debt reduction
NCC Ltd NCC's topline is expected to remain flat YoY at | 2019.8 crore in Q2FY18E led by
moderate execution during the quarter. Furthermore, EBITDA margins are expected
to contract 30 bps YoY to 8.5% led by higher construction expenses (12.4% of sales
in Q2FY18E vs. 11.4% in Q2FY17). Overall, we expect bottomline to grow
moderately by 2.7% YoY to | 55.1 crore.
Key monitorable: Management commentary on debt reduction
Source: Company, ICICIdirect.com Research
Construction Coverage Universe
De-leveraging on top of mind of construction
players…
4.9 5.0
3.6
4.2 4.2
2.0
3.0
4.0
5.0
6.0
Q2FY17
Q3FY17
Q4FY17
Q1FY18
Q2FY18E
(%
)
*Interest Expenses as %age of Sales
Major News during Q2FY18
Infrastructure
sector
Government has cleared the new metro policy,
which will focus on innovative models of
implementation and financing, as well as
standardisation and indigenisation of hardware
and software to create jobs locally
According to a flash report by the Ministry of
Statistics and Programme Implementation, 322
infrastructure projects worth | 150 crore or
above each have seen cost overrun of | 1.71 lakh
crore due to delays and other reasons by March
2017
Media reports indicate that NBCC is in initial and
informal talks with the Finance Ministry as well
as lenders to Jaypee Infratech to complete the
construction of 27 stalled residential projects
with 30000 buyers in Noida and Greater Noida
NBCC has awarded two projects viz:- (i)
Redevelopment of ITPO Complex at Pragati
Maidan to joint venture of Shapoorji Pallonji &
Shapoorji Pallonji Qatar W.L.L for ~| 2150 crores
and (ii) Canal work including cross drainage
structures & design for Gosikhurd National
Project in Bhandara, Maharashtra to Punj Lloyd
for ~| 870.2 crore
NBCC
Media reports indicate NBCC may get orders for
redevelopment of 40 railway stations
NBCC is looking to launch about 1,000 flats for
sale in this festival season including Delhi-NCR in
the price range of | 15 lakh to | 1 crore. It is also
in discussion with the government to develop
affordable housing projects on surplus land with
PSUs
NBCC has received a letter of intent from
Department of Customs and Excise, Government
of India for planning, designing & construction of
office complex and residential quarters at
customs enclave plot, Wadala amounting to ~|
3200 crore on self-revenue generation model
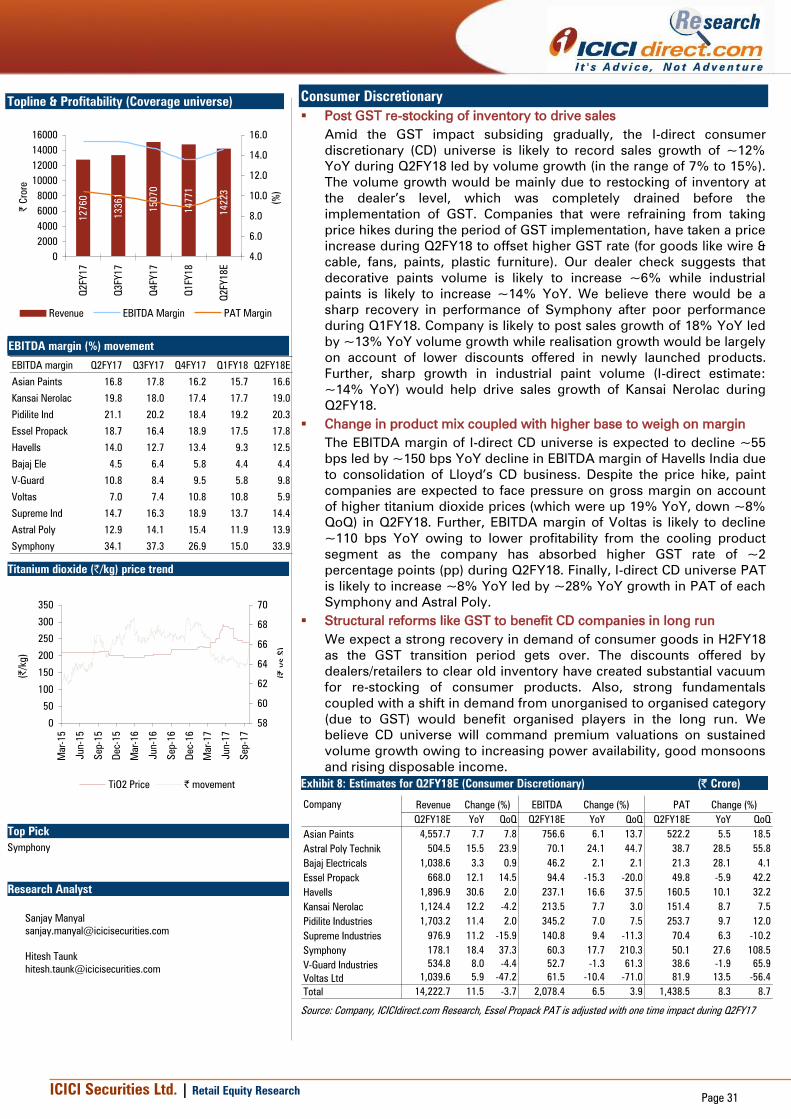
ICICI Securities Ltd. | Retail Equity Research
Page 31
Consumer Discretionary
Post GST re-stocking of inventory to drive sales
Amid the GST impact subsiding gradually, the I-direct consumer
discretionary (CD) universe is likely to record sales growth of ~12%
YoY during Q2FY18 led by volume growth (in the range of 7% to 15%).
The volume growth would be mainly due to restocking of inventory at
the dealer’s level, which was completely drained before the
implementation of GST. Companies that were refraining from taking
price hikes during the period of GST implementation, have taken a price
increase during Q2FY18 to offset higher GST rate (for goods like wire &
cable, fans, paints, plastic furniture). Our dealer check suggests that
decorative paints volume is likely to increase ~6% while industrial
paints is likely to increase ~14% YoY. We believe there would be a
sharp recovery in performance of Symphony after poor performance
during Q1FY18. Company is likely to post sales growth of 18% YoY led
by ~13% YoY volume growth while realisation growth would be largely
on account of lower discounts offered in newly launched products.
Further, sharp growth in industrial paint volume (I-direct estimate:
~14% YoY) would help drive sales growth of Kansai Nerolac during
Q2FY18.
Change in product mix coupled with higher base to weigh on margin
The EBITDA margin of I-direct CD universe is expected to decline ~55
bps led by ~150 bps YoY decline in EBITDA margin of Havells India due
to consolidation of Lloyd’s CD business. Despite the price hike, paint
companies are expected to face pressure on gross margin on account
of higher titanium dioxide prices (which were up 19% YoY, down ~8%
QoQ) in Q2FY18. Further, EBITDA margin of Voltas is likely to decline
~110 bps YoY owing to lower profitability from the cooling product
segment as the company has absorbed higher GST rate of ~2
percentage points (pp) during Q2FY18. Finally, I-direct CD universe PAT
is likely to increase ~8% YoY led by ~28% YoY growth in PAT of each
Symphony and Astral Poly.
Structural reforms like GST to benefit CD companies in long run
We expect a strong recovery in demand of consumer goods in H2FY18
as the GST transition period gets over. The discounts offered by
dealers/retailers to clear old inventory have created substantial vacuum
for re-stocking of consumer products. Also, strong fundamentals
coupled with a shift in demand from unorganised to organised category
(due to GST) would benefit organised players in the long run. We
believe CD universe will command premium valuations on sustained
volume growth owing to increasing power availability, good monsoons
and rising disposable income.
Exhibit 8: Estimates for Q2FY18E (Consumer Discretionary) (| Crore)
Company Revenue EBITDA PAT
Q2FY18E YoY QoQ Q2FY18E YoY QoQ Q2FY18E YoY QoQ
Asian Paints 4,557.7 7.7 7.8 756.6 6.1 13.7 522.2 5.5 18.5
Astral Poly Technik 504.5 15.5 23.9 70.1 24.1 44.7 38.7 28.5 55.8
Bajaj Electricals 1,038.6 3.3 0.9 46.2 2.1 2.1 21.3 28.1 4.1
Essel Propack 668.0 12.1 14.5 94.4 -15.3 -20.0 49.8 -5.9 42.2
Havells 1,896.9 30.6 2.0 237.1 16.6 37.5 160.5 10.1 32.2
Kansai Nerolac 1,124.4 12.2 -4.2 213.5 7.7 3.0 151.4 8.7 7.5
Pidilite Industries 1,703.2 11.4 2.0 345.2 7.0 7.5 253.7 9.7 12.0
Supreme Industries 976.9 11.2 -15.9 140.8 9.4 -11.3 70.4 6.3 -10.2
Symphony 178.1 18.4 37.3 60.3 17.7 210.3 50.1 27.6 108.5
V-Guard Industries 534.8 8.0 -4.4 52.7 -1.3 61.3 38.6 -1.9 65.9
Voltas Ltd 1,039.6 5.9 -47.2 61.5 -10.4 -71.0 81.9 13.5 -56.4
Total 14,222.7 11.5 -3.7 2,078.4 6.5 3.9 1,438.5 8.3 8.7
Change (%)Change (%) Change (%)
Source: Company, ICICIdirect.com Research, Essel Propack PAT is adjusted with one time impact during Q2FY17
Topline & Profitability (Coverage universe)
12760
13361
15070
14771
14223
0
2000
4000
6000
8000
10000
12000
14000
16000
Q2FY17
Q3FY17
Q4FY17
Q1FY18
Q2FY18E
| C
rore
4.0
6.0
8.0
10.0
12.0
14.0
16.0
(%
)
Revenue EBITDA Margin PAT Margin
EBITDA margin (%) movement
EBITDA margin Q2FY17 Q3FY17 Q4FY17 Q1FY18 Q2FY18E
Asian Paints 16.8 17.8 16.2 15.7 16.6
Kansai Nerolac 19.8 18.0 17.4 17.7 19.0
Pidilite Ind 21.1 20.2 18.4 19.2 20.3
Essel Propack 18.7 16.4 18.9 17.5 17.8
Havells 14.0 12.7 13.4 9.3 12.5
Bajaj Ele 4.5 6.4 5.8 4.4 4.4
V-Guard 10.8 8.4 9.5 5.8 9.8
Voltas 7.0 7.4 10.8 10.8 5.9
Supreme Ind 14.7 16.3 18.9 13.7 14.4
Astral Poly 12.9 14.1 15.4 11.9 13.9
Symphony 34.1 37.3 26.9 15.0 33.9
Titanium dioxide (|/kg) price trend
0
50
100
150
200
250
300
350
Mar-15
Jun-15
Sep-15
Dec-15
Mar-16
Jun-16
Sep-16
Dec-16
Mar-17
Jun-17
Sep-17
(|
/kg)
58
60
62
64
66
68
70
(|
vs $
)
TiO2 Price | movement
Top Pick
Symphony
Research Analyst
Sanjay Manyal
Hitesh Taunk
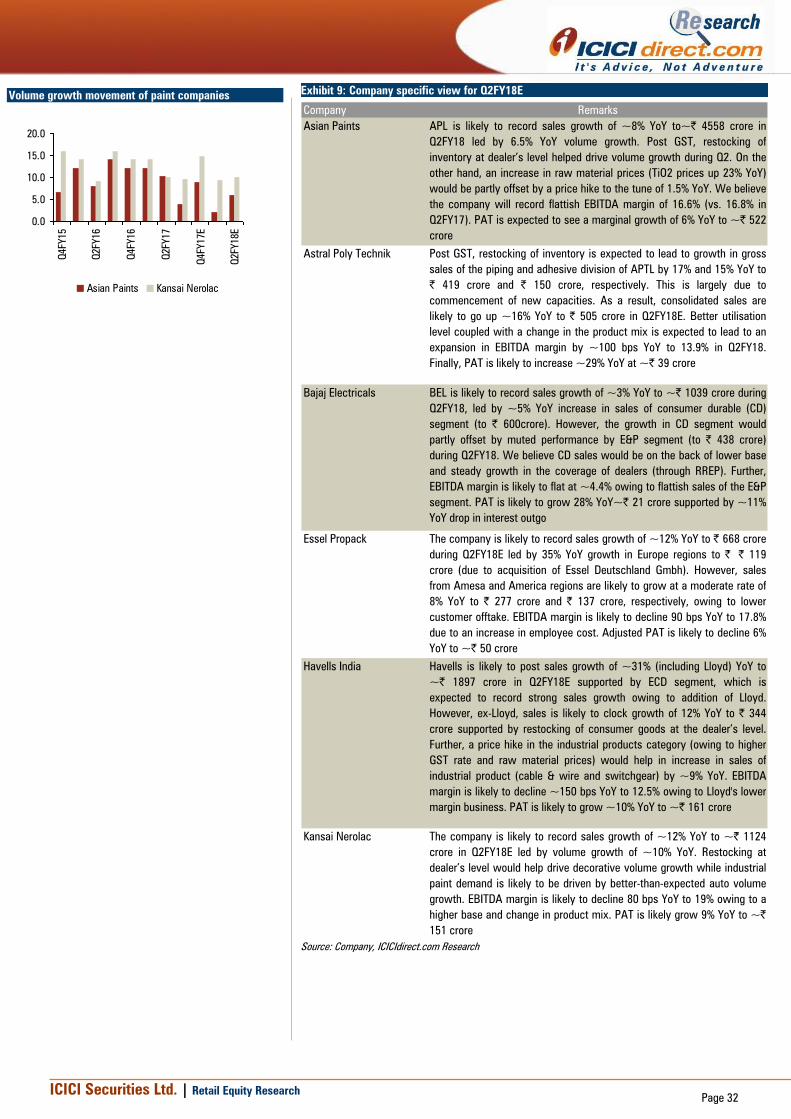
ICICI Securities Ltd. | Retail Equity Research
Page 32
Exhibit 9: Company specific view for Q2FY18E
Company Remarks
Asian Paints APL is likely to record sales growth of ~8% YoY to~| 4558 crore in
Q2FY18 led by 6.5% YoY volume growth. Post GST, restocking of
inventory at dealer’s level helped drive volume growth during Q2. On the
other hand, an increase in raw material prices (TiO2 prices up 23% YoY)
would be partly offset by a price hike to the tune of 1.5% YoY. We believe
the company will record flattish EBITDA margin of 16.6% (vs. 16.8% in
Q2FY17). PAT is expected to see a marginal growth of 6% YoY to ~| 522
crore
Astral Poly Technik Post GST, restocking of inventory is expected to lead to growth in gross
sales of the piping and adhesive division of APTL by 17% and 15% YoY to
| 419 crore and | 150 crore, respectively. This is largely due to
commencement of new capacities. As a result, consolidated sales are
likely to go up ~16% YoY to | 505 crore in Q2FY18E. Better utilisation
level coupled with a change in the product mix is expected to lead to an
expansion in EBITDA margin by ~100 bps YoY to 13.9% in Q2FY18.
Finally, PAT is likely to increase ~29% YoY at ~| 39 crore
Bajaj Electricals BEL is likely to record sales growth of ~3% YoY to ~| 1039 crore during
Q2FY18, led by ~5% YoY increase in sales of consumer durable (CD)
segment (to | 600crore). However, the growth in CD segment would
partly offset by muted performance by E&P segment (to | 438 crore)
during Q2FY18. We believe CD sales would be on the back of lower base
and steady growth in the coverage of dealers (through RREP). Further,
EBITDA margin is likely to flat at ~4.4% owing to flattish sales of the E&P
segment. PAT is likely to grow 28% YoY~| 21 crore supported by ~11%
YoY drop in interest outgo
Essel Propack The company is likely to record sales growth of ~12% YoY to | 668 crore
during Q2FY18E led by 35% YoY growth in Europe regions to | | 119
crore (due to acquisition of Essel Deutschland Gmbh). However, sales
from Amesa and America regions are likely to grow at a moderate rate of
8% YoY to | 277 crore and | 137 crore, respectively, owing to lower
customer offtake. EBITDA margin is likely to decline 90 bps YoY to 17.8%
due to an increase in employee cost. Adjusted PAT is likely to decline 6%
YoY to ~| 50 crore
Havells India Havells is likely to post sales growth of ~31% (including Lloyd) YoY to
~| 1897 crore in Q2FY18E supported by ECD segment, which is
expected to record strong sales growth owing to addition of Lloyd.
However, ex-Lloyd, sales is likely to clock growth of 12% YoY to | 344
crore supported by restocking of consumer goods at the dealer’s level.
Further, a price hike in the industrial products category (owing to higher
GST rate and raw material prices) would help in increase in sales of
industrial product (cable & wire and switchgear) by ~9% YoY. EBITDA
margin is likely to decline ~150 bps YoY to 12.5% owing to Lloyd's lower
margin business. PAT is likely to grow ~10% YoY to ~| 161 crore
Kansai Nerolac The company is likely to record sales growth of ~12% YoY to ~| 1124
crore in Q2FY18E led by volume growth of ~10% YoY. Restocking at
dealer’s level would help drive decorative volume growth while industrial
paint demand is likely to be driven by better-than-expected auto volume
growth. EBITDA margin is likely to decline 80 bps YoY to 19% owing to a
higher base and change in product mix. PAT is likely grow 9% YoY to ~|
151 crore
Source: Company, ICICIdirect.com Research
Volume growth movement of paint companies
0.0
5.0
10.0
15.0
20.0
Q4FY15
Q2FY16
Q4FY16
Q2FY17
Q4FY17E
Q2FY18E
Asian Paints Kansai Nerolac

ICICI Securities Ltd. | Retail Equity Research
Page 33
Exhibit 10: Company specific view for Q2FY18E
Pidilite Industries Pidilite is likely to record consolidated sales growth of ~11% YoY to |
1703 crore in Q2FY18E led by 14% YoY revenue growth in consumer &
bazaar segment to | 1470 crore. We believe a slight pick-up in demand
post GST implementation would help drive the sales growth of consumer
facing products. In the absence of any price hike, the gross margin is
expected to remain flat YoY owing to flattish VAM prices. EBITDA margin
is likely to decline ~80 bps YoY to 20.3% mainly due to higher employee
cost (up 17% YoY). Finally, PAT is likely to increase ~10% YoY to ~| 254
crore supported by higher other income
Supreme Industries Supreme is expected to record sales growth of ~11% YoY to ~| 977
crore in Q2FY18E led by similar volume growth. We believe restocking of
inventory at dealer level would drive the growth of volume of consumer
products. Piping and consumer products segment sales are also likely to
grow 14% and 10% YoY, respectively. Lower operating leverage from
industrial product category may lead to decline in EBITDA margin by 30
bps YoY to 14.4%. Finally, PAT is likely to increase 6% YoY to | 70 crore
Symphony After a below expected Q1 performance owing to higher discounts,
Symphony is likely to post sales growth of 18% YoY to | 178 crore during
Q2FY18E supported by volume growth of 13% YoY. The EBITDA margin is
likely to remain flat at 34% as higher gross margin would partly be offset
by higher other cost. PAT is likely to record growth of 28% YoY to | 50
crore supported by higher sales growth
V-Guard We expect topline growth of ~8% YoY to ~| 535 crore in Q2FY18E led
by ~10% YoY increase in sales of electronics and electricals product to |
150 crore and | 236 crore, respectively. This would be largely led by
stabilisers and pump segments, which are likely to record sales growth of
~15% and ~10% YoY, respectively. However, higher raw material prices
coupled with lower operating leverage of new plants may lead to a
decline in EBITDA margin by ~100 bps YoY at 9.8%. PAT is likely to
remain flat at ~| 39 crore
Voltas We believe Voltas would record sales growth of ~6% YoY to ~| 1040
crore during Q2FY18E supported by increase in sales of UCP and EMPS
segment by ~7% and ~5% YoY to | 380 crore and | 572 crore,
respectively. Being a lean season for air conditioners, Q2 was also
impacted by ~2% higher tax under GST, which Voltas has refrained from
passing on to customers. As a result, despite better EMPS segment
margin overall EBITDA margin is likely to fall ~110 bps YoY to 6% during
Q2FY18E. However, due to lower tax outgo PAT is likely to grow ~14%
YoY to ~| 82 crore
Source: Company, ICICIdirect.com Research
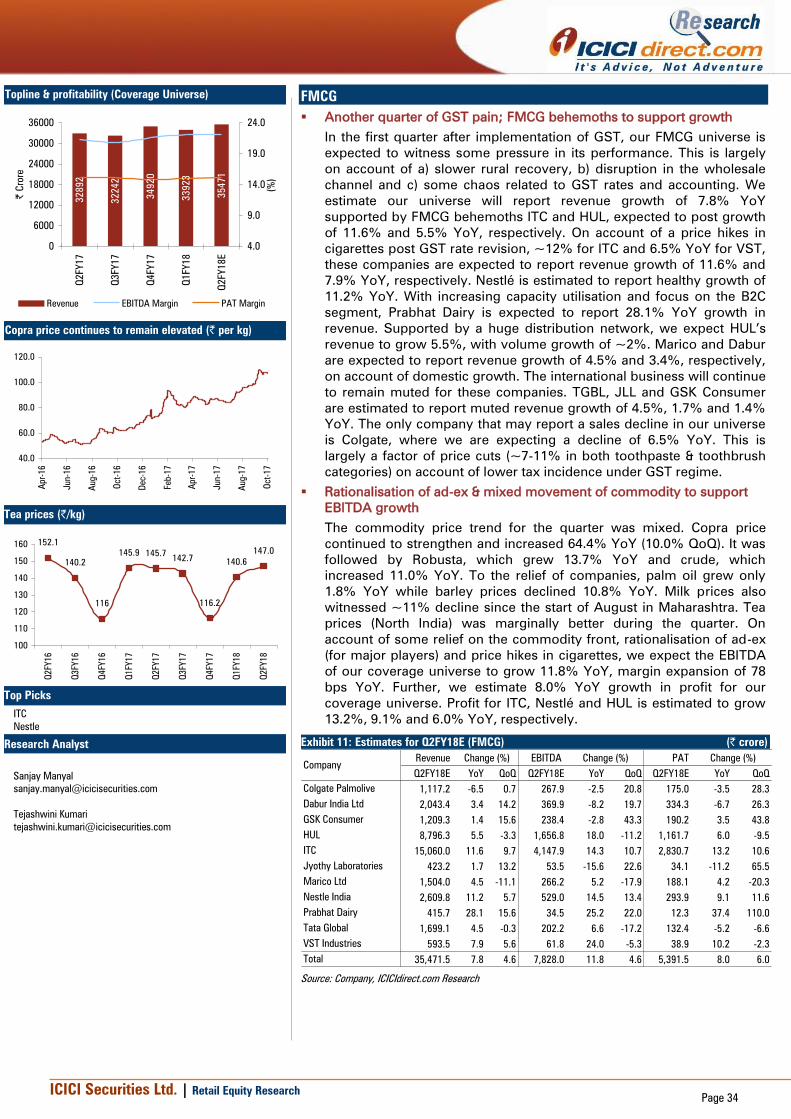
ICICI Securities Ltd. | Retail Equity Research
Page 34
FMCG
Another quarter of GST pain; FMCG behemoths to support growth
In the first quarter after implementation of GST, our FMCG universe is
expected to witness some pressure in its performance. This is largely
on account of a) slower rural recovery, b) disruption in the wholesale
channel and c) some chaos related to GST rates and accounting. We
estimate our universe will report revenue growth of 7.8% YoY
supported by FMCG behemoths ITC and HUL, expected to post growth
of 11.6% and 5.5% YoY, respectively. On account of a price hikes in
cigarettes post GST rate revision, ~12% for ITC and 6.5% YoY for VST,
these companies are expected to report revenue growth of 11.6% and
7.9% YoY, respectively. Nestlé is estimated to report healthy growth of
11.2% YoY. With increasing capacity utilisation and focus on the B2C
segment, Prabhat Dairy is expected to report 28.1% YoY growth in
revenue. Supported by a huge distribution network, we expect HUL’s
revenue to grow 5.5%, with volume growth of ~2%. Marico and Dabur
are expected to report revenue growth of 4.5% and 3.4%, respectively,
on account of domestic growth. The international business will continue
to remain muted for these companies. TGBL, JLL and GSK Consumer
are estimated to report muted revenue growth of 4.5%, 1.7% and 1.4%
YoY. The only company that may report a sales decline in our universe
is Colgate, where we are expecting a decline of 6.5% YoY. This is
largely a factor of price cuts (~7-11% in both toothpaste & toothbrush
categories) on account of lower tax incidence under GST regime.
Rationalisation of ad-ex & mixed movement of commodity to support
EBITDA growth
The commodity price trend for the quarter was mixed. Copra price
continued to strengthen and increased 64.4% YoY (10.0% QoQ). It was
followed by Robusta, which grew 13.7% YoY and crude, which
increased 11.0% YoY. To the relief of companies, palm oil grew only
1.8% YoY while barley prices declined 10.8% YoY. Milk prices also
witnessed ~11% decline since the start of August in Maharashtra. Tea
prices (North India) was marginally better during the quarter. On
account of some relief on the commodity front, rationalisation of ad-ex
(for major players) and price hikes in cigarettes, we expect the EBITDA
of our coverage universe to grow 11.8% YoY, margin expansion of 78
bps YoY. Further, we estimate 8.0% YoY growth in profit for our
coverage universe. Profit for ITC, Nestlé and HUL is estimated to grow
13.2%, 9.1% and 6.0% YoY, respectively.
Exhibit 11: Estimates for Q2FY18E (FMCG) (| crore)
Revenue EBITDA PAT
Q2FY18E YoY QoQ Q2FY18E YoY QoQ Q2FY18E YoY QoQ
Colgate Palmolive 1,117.2 -6.5 0.7 267.9 -2.5 20.8 175.0 -3.5 28.3
Dabur India Ltd 2,043.4 3.4 14.2 369.9 -8.2 19.7 334.3 -6.7 26.3
GSK Consumer 1,209.3 1.4 15.6 238.4 -2.8 43.3 190.2 3.5 43.8
HUL 8,796.3 5.5 -3.3 1,656.8 18.0 -11.2 1,161.7 6.0 -9.5
ITC 15,060.0 11.6 9.7 4,147.9 14.3 10.7 2,830.7 13.2 10.6
Jyothy Laboratories 423.2 1.7 13.2 53.5 -15.6 22.6 34.1 -11.2 65.5
Marico Ltd 1,504.0 4.5 -11.1 266.2 5.2 -17.9 188.1 4.2 -20.3
Nestle India 2,609.8 11.2 5.7 529.0 14.5 13.4 293.9 9.1 11.6
Prabhat Dairy 415.7 28.1 15.6 34.5 25.2 22.0 12.3 37.4 110.0
Tata Global 1,699.1 4.5 -0.3 202.2 6.6 -17.2 132.4 -5.2 -6.6
VST Industries 593.5 7.9 5.6 61.8 24.0 -5.3 38.9 10.2 -2.3
Total 35,471.5 7.8 4.6 7,828.0 11.8 4.6 5,391.5 8.0 6.0
Change (%) Change (%)
Company
Change (%)
Source: Company, ICICIdirect.com Research
Topline & profitability (Coverage Universe)
32892
32242
34920
33923
35471
0
6000
12000
18000
24000
30000
36000
Q2FY17
Q3FY17
Q4FY17
Q1FY18
Q2FY18E
| C
rore
4.0
9.0
14.0
19.0
24.0
(%
)
Revenue EBITDA Margin PAT Margin
Copra price continues to remain elevated (| per kg)
40.0
60.0
80.0
100.0
120.0
Apr-16
Jun-16
Aug-16
Oct-16
Dec-16
Feb-17
Apr-17
Jun-17
Aug-17
Oct-17
Tea prices (|/kg)
152.1
140.2
116
145.9 145.7142.7
116.2
140.6
147.0
100
110
120
130
140
150
160
Q2FY
16
Q3FY
16
Q4FY
16
Q1FY
17
Q2FY
17
Q3FY
17
Q4FY
17
Q1FY
18
Q2FY
18
Top Picks
ITC
Nestle
Research Analyst
Sanjay Manyal
Tejashwini Kumari

ICICI Securities Ltd. | Retail Equity Research
Page 35
Exhibit 12: Company specific view (FMCG)
Company
Colgate With the reduction of indirect tax incidence from ~24% to 18%, Colgate has taken a
price cut across its oral care portfolio. The price cut has been in the range of 7-11%.
Considering this price cut and slower volume growth due to disruption of the wholesale
channel, we expect the company to post 6.5% YoY de-growth in sales. We expect the
company to maintain its advertisement spend at 13% to sales mainly to protect
volumes. We expect net profit to decline 3.5% to | 175 crore due to the strong earning
growth reported in the base quarter
Dabur We expect Dabur to report 3.4% YoY growth in net sales on account of volume growth
in the domestic market. Domestic revenues are estimated to grow 6.1% YoY led by
volume growth on account of price cuts post GST and some demand recovery.
However, the international business would continue to remain under pressure and
decline ~2% YoY. We expect the company to increase selling expenses to 9.0% vs.
7.6% in same quarter last year. EBITDA margin is expected to contract 230 bps YoY to
18.1% on account of higher raw material and advertisement cost. PAT is estimated to
decline 6.4% YoY to | 334.3 crore
GSK
Consumer
Healthcare
On account of a slower than expected recovery in rural demand and continued impact
on the wholesale channel, we expect revenue (including auxiliary income) to clock
marginal growth of 1.4% YoY. Raw material cost is estimated to be lower for the
quarter at 29.0% of net sales vs. 30.8% in the same quarter last year on account of
lower barley cost and stable sugar prices. We expect the benefit in raw material cost
to be offset by higher spending on advertisement to drive demand at 12.0% for Q2FY18
vs. 10.7% in Q2FY17. Thus, we expect the operating margin to decline 84 bps YoY to
19.7%. PAT for the quarter is expected to grow marginally by 3.4% YoY on account of
lower tax outgo
HUL HUL is expected to witness 5.5% YoY increase in sales, primarily on account of 8% &
6% growth in refreshment & foods segment. Home care & personal care segment is
likely to grow 5% & 3% respectively. With the disruption of the trade channel due to the
transition of GST, we expect volume growth to remain muted during the quarter at
~2% YoY. Operating margins are likely to expand 200 bps to 18.6% mainly due to
lower advertisement spend during the quarter. Further, on account of higher
depreciation (commissioning of manufacturing unit at Assam), PAT for the quarter is
estimated to grow 6.0% YoY
ITC We expect ITC to report 11.6% YoY growth in sales mainly on the back of 9% YoY
growth in cigarette business on account of 12% realisation growth as the company has
taken a price increase after a steep hike in indirect tax incidence. Cigarette volumes
are expected to decline 4% YoY. Further, we estimate 12%, 11% & 16% growth in
FMCG, paperboard and hotels segments. We estimate a 64 bps YoY expansion in
EBITDA margin to 27.5%, primarily on account of ad-ex saving. Thus, net profit is
expected to grow 13.2% YoY to | 2830.7 crore
Jyothy Labs JLL was the worst hit in the previous quarter due to GST transition. We expect the
company to remain under pressure for this quarter as well on account of higher
exposure to the wholesale channel, which is yet to witness a recovery. Thus, we
expect revenues to grow marginally at 1.6% to | 423.2 crore. Further, raw materials
continue to witness uptrend. We believe the company would continue the marketing
spend to support demand. Hence, we estimate EBITDA margin at 12.6% vis-à-vis
15.2% in Q2FY17. PAT is estimated to decline 11.2% YoY to | 34.1 crore against | 38.4
crore in Q2FY17
Marico We expect Marico's performance to be impacted by the slower recovery in rural
demand as well as wholesale channel disruption. We expect the domestic revenue to
grow 5.3% YoY, largely on account of the price hike taken (5-10% in Parachute portfolio
and ~2% hike in Saffola portfolio). The international business is also expected to
remain muted and grow marginally by 1.3% YoY on account of unfavourable currency
movement and political turmoil in concerned countries. On account of rising copra
prices (up 64.4% YoY), lower marketing expense (YoY), we expect flat operating
margins at 17.7%. We estimate PAT will grow marginally by 4.2% YoY to | 188.1 crore
Source: Company, ICICIdirect.com Research
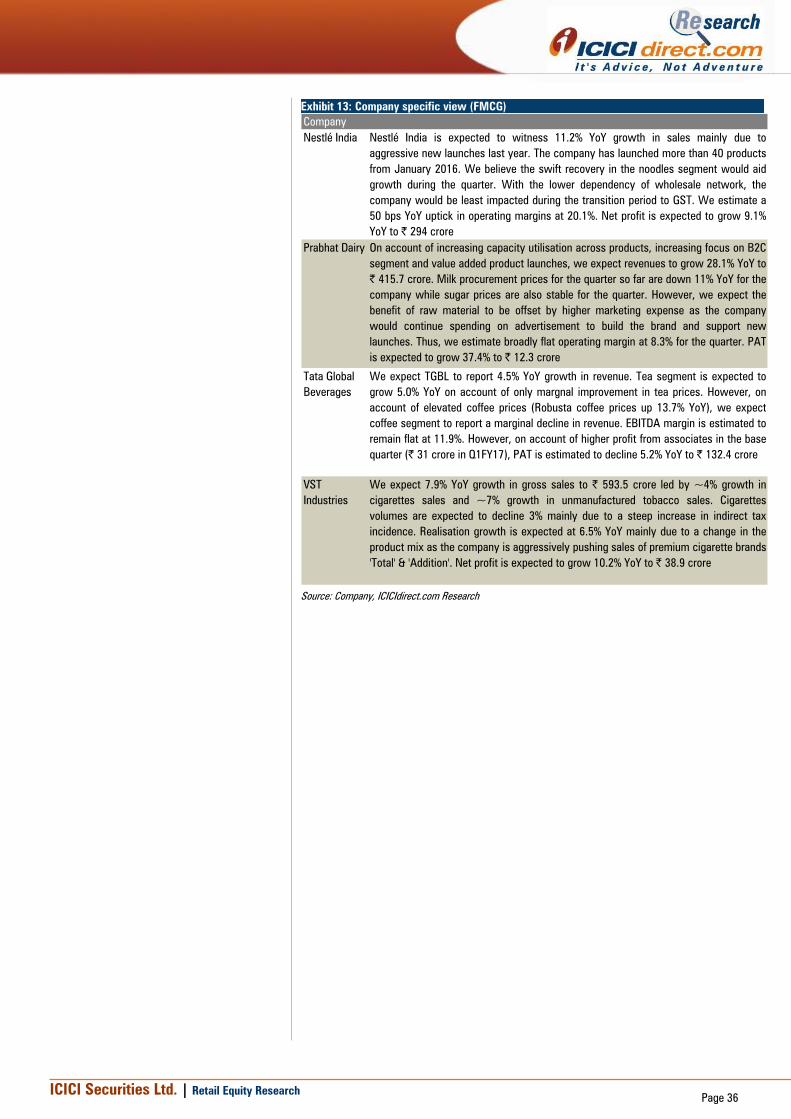
ICICI Securities Ltd. | Retail Equity Research
Page 36
Exhibit 13: Company specific view (FMCG)
Company
Nestlé India Nestlé India is expected to witness 11.2% YoY growth in sales mainly due to
aggressive new launches last year. The company has launched more than 40 products
from January 2016. We believe the swift recovery in the noodles segment would aid
growth during the quarter. With the lower dependency of wholesale network, the
company would be least impacted during the transition period to GST. We estimate a
50 bps YoY uptick in operating margins at 20.1%. Net profit is expected to grow 9.1%
YoY to | 294 crore
Prabhat Dairy On account of increasing capacity utilisation across products, increasing focus on B2C
segment and value added product launches, we expect revenues to grow 28.1% YoY to
| 415.7 crore. Milk procurement prices for the quarter so far are down 11% YoY for the
company while sugar prices are also stable for the quarter. However, we expect the
benefit of raw material to be offset by higher marketing expense as the company
would continue spending on advertisement to build the brand and support new
launches. Thus, we estimate broadly flat operating margin at 8.3% for the quarter. PAT
is expected to grow 37.4% to | 12.3 crore
Tata Global
Beverages
We expect TGBL to report 4.5% YoY growth in revenue. Tea segment is expected to
grow 5.0% YoY on account of only margnal improvement in tea prices. However, on
account of elevated coffee prices (Robusta coffee prices up 13.7% YoY), we expect
coffee segment to report a marginal decline in revenue. EBITDA margin is estimated to
remain flat at 11.9%. However, on account of higher profit from associates in the base
quarter (| 31 crore in Q1FY17), PAT is estimated to decline 5.2% YoY to | 132.4 crore
VST
Industries
We expect 7.9% YoY growth in gross sales to | 593.5 crore led by ~4% growth in
cigarettes sales and ~7% growth in unmanufactured tobacco sales. Cigarettes
volumes are expected to decline 3% mainly due to a steep increase in indirect tax
incidence. Realisation growth is expected at 6.5% YoY mainly due to a change in the
product mix as the company is aggressively pushing sales of premium cigarette brands
'Total' & 'Addition'. Net profit is expected to grow 10.2% YoY to | 38.9 crore
Source: Company, ICICIdirect.com Research
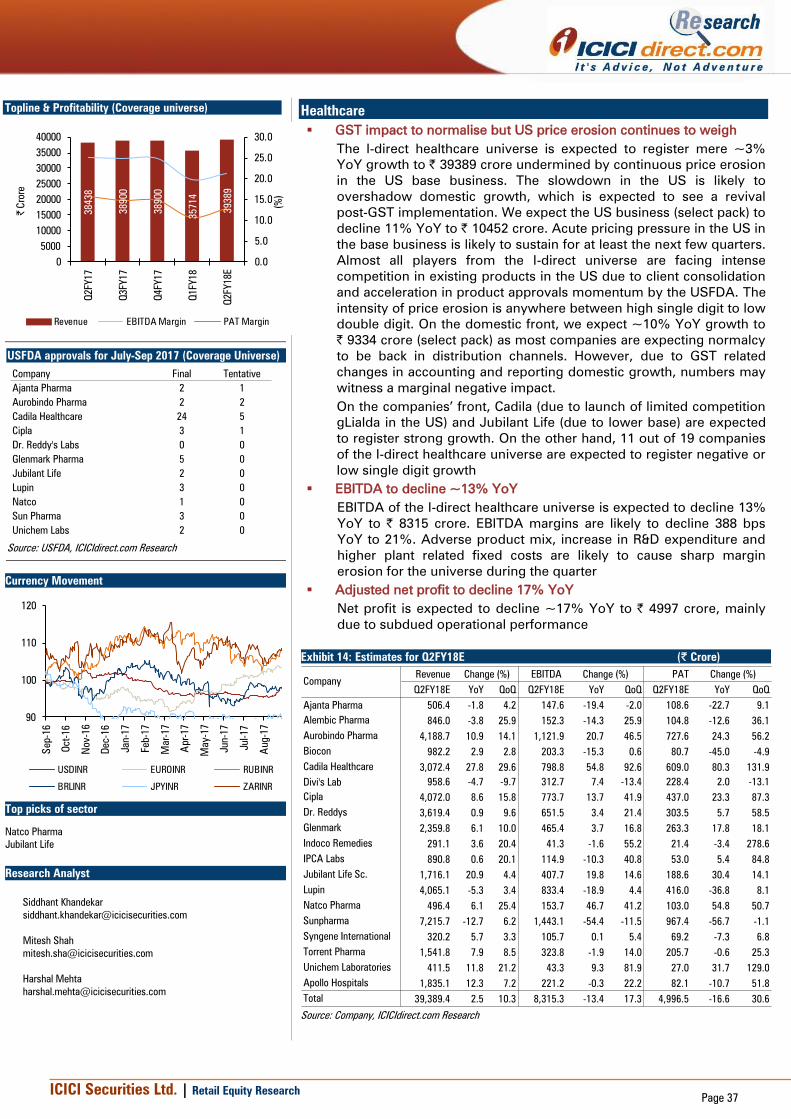
ICICI Securities Ltd. | Retail Equity Research
Page 37
Healthcare
GST impact to normalise but US price erosion continues to weigh
The I-direct healthcare universe is expected to register mere ~3%
YoY growth to | 39389 crore undermined by continuous price erosion
in the US base business. The slowdown in the US is likely to
overshadow domestic growth, which is expected to see a revival
post-GST implementation. We expect the US business (select pack) to
decline 11% YoY to | 10452 crore. Acute pricing pressure in the US in
the base business is likely to sustain for at least the next few quarters.
Almost all players from the I-direct universe are facing intense
competition in existing products in the US due to client consolidation
and acceleration in product approvals momentum by the USFDA. The
intensity of price erosion is anywhere between high single digit to low
double digit. On the domestic front, we expect ~10% YoY growth to
| 9334 crore (select pack) as most companies are expecting normalcy
to be back in distribution channels. However, due to GST related
changes in accounting and reporting domestic growth, numbers may
witness a marginal negative impact.
On the companies’ front, Cadila (due to launch of limited competition
gLialda in the US) and Jubilant Life (due to lower base) are expected
to register strong growth. On the other hand, 11 out of 19 companies
of the I-direct healthcare universe are expected to register negative or
low single digit growth
EBITDA to decline ~13% YoY
EBITDA of the I-direct healthcare universe is expected to decline 13%
YoY to | 8315 crore. EBITDA margins are likely to decline 388 bps
YoY to 21%. Adverse product mix, increase in R&D expenditure and
higher plant related fixed costs are likely to cause sharp margin
erosion for the universe during the quarter
Adjusted net profit to decline 17% YoY
Net profit is expected to decline ~17% YoY to | 4997 crore, mainly
due to subdued operational performance
Exhibit 14: Estimates for Q2FY18E (| Crore)
Revenue EBITDA PAT
Q2FY18E YoY QoQ Q2FY18E YoY QoQ Q2FY18E YoY QoQ
Ajanta Pharma 506.4 -1.8 4.2 147.6 -19.4 -2.0 108.6 -22.7 9.1
Alembic Pharma 846.0 -3.8 25.9 152.3 -14.3 25.9 104.8 -12.6 36.1
Aurobindo Pharma 4,188.7 10.9 14.1 1,121.9 20.7 46.5 727.6 24.3 56.2
Biocon 982.2 2.9 2.8 203.3 -15.3 0.6 80.7 -45.0 -4.9
Cadila Healthcare 3,072.4 27.8 29.6 798.8 54.8 92.6 609.0 80.3 131.9
Divi's Lab 958.6 -4.7 -9.7 312.7 7.4 -13.4 228.4 2.0 -13.1
Cipla 4,072.0 8.6 15.8 773.7 13.7 41.9 437.0 23.3 87.3
Dr. Reddys 3,619.4 0.9 9.6 651.5 3.4 21.4 303.5 5.7 58.5
Glenmark 2,359.8 6.1 10.0 465.4 3.7 16.8 263.3 17.8 18.1
Indoco Remedies 291.1 3.6 20.4 41.3 -1.6 55.2 21.4 -3.4 278.6
IPCA Labs 890.8 0.6 20.1 114.9 -10.3 40.8 53.0 5.4 84.8
Jubilant Life Sc. 1,716.1 20.9 4.4 407.7 19.8 14.6 188.6 30.4 14.1
Lupin 4,065.1 -5.3 3.4 833.4 -18.9 4.4 416.0 -36.8 8.1
Natco Pharma 496.4 6.1 25.4 153.7 46.7 41.2 103.0 54.8 50.7
Sunpharma 7,215.7 -12.7 6.2 1,443.1 -54.4 -11.5 967.4 -56.7 -1.1
Syngene International 320.2 5.7 3.3 105.7 0.1 5.4 69.2 -7.3 6.8
Torrent Pharma 1,541.8 7.9 8.5 323.8 -1.9 14.0 205.7 -0.6 25.3
Unichem Laboratories 411.5 11.8 21.2 43.3 9.3 81.9 27.0 31.7 129.0
Apollo Hospitals 1,835.1 12.3 7.2 221.2 -0.3 22.2 82.1 -10.7 51.8
Total 39,389.4 2.5 10.3 8,315.3 -13.4 17.3 4,996.5 -16.6 30.6
Change (%) Change (%)
Company
Change (%)
Source: Company, ICICIdirect.com Research
Topline & Profitability (Coverage universe)
38438
38900
38900
35714
39389
0.0
5.0
10.0
15.0
20.0
25.0
30.0
0
5000
10000
15000
20000
25000
30000
35000
40000
Q2FY17
Q3FY17
Q4FY17
Q1FY18
Q2FY18E
(%
)
| C
rore
Revenue EBITDA Margin PAT Margin
USFDA approvals for July-Sep 2017 (Coverage Universe)
Company Final Tentative
Ajanta Pharma 2 1
Aurobindo Pharma 2 2
Cadila Healthcare 24 5
Cipla 3 1
Dr. Reddy's Labs 0 0
Glenmark Pharma 5 0
Jubilant Life 2 0
Lupin 3 0
Natco 1 0
Sun Pharma 3 0
Unichem Labs 2 0
Source: USFDA, ICICIdirect.com Research
Currency Movement
90
100
110
120
Sep-16
Oct-16
Nov-16
Dec-16
Jan-17
Feb-17
Mar-17
Apr-17
May-17
Jun-17
Jul-17
Aug-17
USDINR EUROINR RUBINR
BRLINR JPYINR ZARINR
Top picks of sector
Natco Pharma
Jubilant Life
Research Analyst
Siddhant Khandekar
Mitesh Shah
Harshal Mehta
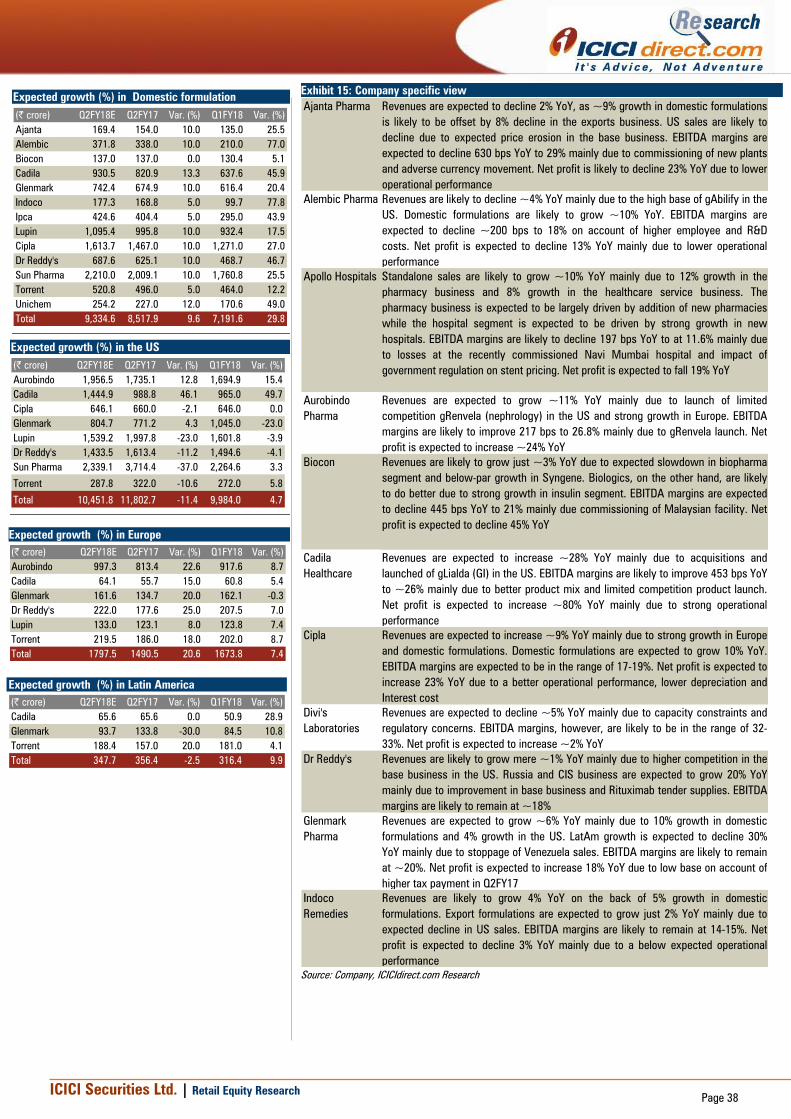
ICICI Securities Ltd. | Retail Equity Research
Page 38
Source: Company, ICICIdirect.com Research
Exhibit 15: Company specific view
Ajanta Pharma Revenues are expected to decline 2% YoY, as ~9% growth in domestic formulations
is likely to be offset by 8% decline in the exports business. US sales are likely to
decline due to expected price erosion in the base business. EBITDA margins are
expected to decline 630 bps YoY to 29% mainly due to commissioning of new plants
and adverse currency movement. Net profit is likely to decline 23% YoY due to lower
operational performance
Alembic Pharma Revenues are likely to decline ~4% YoY mainly due to the high base of gAbilify in the
US. Domestic formulations are likely to grow ~10% YoY. EBITDA margins are
expected to decline ~200 bps to 18% on account of higher employee and R&D
costs. Net profit is expected to decline 13% YoY mainly due to lower operational
performance
Apollo Hospitals Standalone sales are likely to grow ~10% YoY mainly due to 12% growth in the
pharmacy business and 8% growth in the healthcare service business. The
pharmacy business is expected to be largely driven by addition of new pharmacies
while the hospital segment is expected to be driven by strong growth in new
hospitals. EBITDA margins are likely to decline 197 bps YoY to at 11.6% mainly due
to losses at the recently commissioned Navi Mumbai hospital and impact of
government regulation on stent pricing. Net profit is expected to fall 19% YoY
Aurobindo
Pharma
Revenues are expected to grow ~11% YoY mainly due to launch of limited
competition gRenvela (nephrology) in the US and strong growth in Europe. EBITDA
margins are likely to improve 217 bps to 26.8% mainly due to gRenvela launch. Net
profit is expected to increase ~24% YoY
Biocon Revenues are likely to grow just ~3% YoY due to expected slowdown in biopharma
segment and below-par growth in Syngene. Biologics, on the other hand, are likely
to do better due to strong growth in insulin segment. EBITDA margins are expected
to decline 445 bps YoY to 21% mainly due commissioning of Malaysian facility. Net
profit is expected to decline 45% YoY
Cadila
Healthcare
Revenues are expected to increase ~28% YoY mainly due to acquisitions and
launched of gLialda (GI) in the US. EBITDA margins are likely to improve 453 bps YoY
to ~26% mainly due to better product mix and limited competition product launch.
Net profit is expected to increase ~80% YoY mainly due to strong operational
performance
Cipla Revenues are expected to increase ~9% YoY mainly due to strong growth in Europe
and domestic formulations. Domestic formulations are expected to grow 10% YoY.
EBITDA margins are expected to be in the range of 17-19%. Net profit is expected to
increase 23% YoY due to a better operational performance, lower depreciation and
Interest cost
Divi's
Laboratories
Revenues are expected to decline ~5% YoY mainly due to capacity constraints and
regulatory concerns. EBITDA margins, however, are likely to be in the range of 32-
33%. Net profit is expected to increase ~2% YoY
Dr Reddy's Revenues are likely to grow mere ~1% YoY mainly due to higher competition in the
base business in the US. Russia and CIS business are expected to grow 20% YoY
mainly due to improvement in base business and Rituximab tender supplies. EBITDA
margins are likely to remain at ~18%
Glenmark
Pharma
Revenues are expected to grow ~6% YoY mainly due to 10% growth in domestic
formulations and 4% growth in the US. LatAm growth is expected to decline 30%
YoY mainly due to stoppage of Venezuela sales. EBITDA margins are likely to remain
at ~20%. Net profit is expected to increase 18% YoY due to low base on account of
higher tax payment in Q2FY17
Indoco
Remedies
Revenues are likely to grow 4% YoY on the back of 5% growth in domestic
formulations. Export formulations are expected to grow just 2% YoY mainly due to
expected decline in US sales. EBITDA margins are likely to remain at 14-15%. Net
profit is expected to decline 3% YoY mainly due to a below expected operational
performance
Expected growth (%) in Domestic formulation
(| crore) Q2FY18E Q2FY17 Var. (%) Q1FY18 Var. (%)
Ajanta 169.4 154.0 10.0 135.0 25.5
Alembic 371.8 338.0 10.0 210.0 77.0
Biocon 137.0 137.0 0.0 130.4 5.1
Cadila 930.5 820.9 13.3 637.6 45.9
Glenmark 742.4 674.9 10.0 616.4 20.4
Indoco 177.3 168.8 5.0 99.7 77.8
Ipca 424.6 404.4 5.0 295.0 43.9
Lupin 1,095.4 995.8 10.0 932.4 17.5
Cipla 1,613.7 1,467.0 10.0 1,271.0 27.0
Dr Reddy's 687.6 625.1 10.0 468.7 46.7
Sun Pharma 2,210.0 2,009.1 10.0 1,760.8 25.5
Torrent 520.8 496.0 5.0 464.0 12.2
Unichem 254.2 227.0 12.0 170.6 49.0
Total 9,334.6 8,517.9 9.6 7,191.6 29.8
Expected growth (%) in the US
(| crore) Q2FY18E Q2FY17 Var. (%) Q1FY18 Var. (%)
Aurobindo 1,956.5 1,735.1 12.8 1,694.9 15.4
Cadila 1,444.9 988.8 46.1 965.0 49.7
Cipla 646.1 660.0 -2.1 646.0 0.0
Glenmark 804.7 771.2 4.3 1,045.0 -23.0
Lupin 1,539.2 1,997.8 -23.0 1,601.8 -3.9
Dr Reddy's 1,433.5 1,613.4 -11.2 1,494.6 -4.1
Sun Pharma 2,339.1 3,714.4 -37.0 2,264.6 3.3
Torrent 287.8 322.0 -10.6 272.0 5.8
Total 10,451.8 11,802.7 -11.4 9,984.0 4.7
Expected growth (%) in Europe
(| crore) Q2FY18E Q2FY17 Var. (%) Q1FY18 Var. (%)
Aurobindo 997.3 813.4 22.6 917.6 8.7
Cadila 64.1 55.7 15.0 60.8 5.4
Glenmark 161.6 134.7 20.0 162.1 -0.3
Dr Reddy's 222.0 177.6 25.0 207.5 7.0
Lupin 133.0 123.1 8.0 123.8 7.4
Torrent 219.5 186.0 18.0 202.0 8.7
Total 1797.5 1490.5 20.6 1673.8 7.4
Expected growth (%) in Latin America
(| crore) Q2FY18E Q2FY17 Var. (%) Q1FY18 Var. (%)
Cadila 65.6 65.6 0.0 50.9 28.9
Glenmark 93.7 133.8 -30.0 84.5 10.8
Torrent 188.4 157.0 20.0 181.0 4.1
Total 347.7 356.4 -2.5 316.4 9.9

ICICI Securities Ltd. | Retail Equity Research
Page 39
Exhibit 16: Company specific view
Ipca
Laboratories
Revenue growth is expected to remain muted as 5% YoY growth in domestic
formulations is likely to get offset by ~6% decline in export formulations. EBITDA
margins are likely to decline ~156 bps YoY to ~13% mainly due to an adverse
product mix. Net profit is expected to increase ~5% YoY mainly due to higher tax
paid in Q2FY17
Jubilant Life
Science
Revenues are expected grow ~21% YoY mainly due to strong growth in both
Pharma and LSI segments. LSI segment growth is likely to be driven by better
growth in vitamins and advanced intermediates whereas pharma growth is likely to
be driven by the specialty sub-segment. Margins are expected to remain at 24% YoY.
Net profit is expected to grow ~30% on the back of a strong operational
performance and lower interest cost
Lupin Revenues are expected to decline ~6% YoY on the back of 23% YoY decline in the
US mainly due to price erosion in Metformin group (diabetic). Japan sales are
expected to increase 13% YoY mainly due to consolidation of Shionogi portfolio.
EBITDA margins are likely to decline 346 bps to 20.5% YoY mainly due to an adverse
product mix. Net profit is expected to decline ~37% YoY owing to a below expected
operational performance
Natco Pharma Despite higher base of gTamiflu exclusivity, revenues are likely to increase ~6% YoY
mainly due to continuing traction from limited competition products (gTamiflu and
gDoxil) in the US. EBITDA margins are likely to improve to 856 bps YoY to 31%
mainly due to a better product mix. Net profit is expected to grow ~55% YoY
Sun Pharma Revenues are likely to decline 12% YoY mainly due to 37% expected decline in the
US owing to large base and price erosion in the base business. Taro's sales are
expected to decline ~32% YoY. EBITDA margins are expected to decline to 20%
from 38.3% in Q2FY17. Net profit is expected to decline 57% due to a sharp decline
in operational performance
Syngene Revenues are likely to grow just ~6% YoY mainly due to the spillover impact of the
fire incident of Q3FY17 and adverse currency movement. EBITDA margins are
expected to be in the range of 32-34%. Net profit is expected to decline ~7% on the
back of a lower operational performance
Torrent Pharma Revenues are expected to increase ~8% YoY mainly due to 10% growth in the
domestic formulations and 20% growth in Brazil. US sales are expected to decline
13% YoY mainly due to price erosion across portfolio. EBITDA margins are expected
to decline 209 bps YoY to 21% mainly due to an adverse product mix
Unichem Labs Revenues are expected to grow ~12% YoY on the back of 12% growth in developed
market formulation sales owing to strong US sales and 10% growth in domestic
formulations. EBITDA margins are likely to remain at ~11%. Net profit is expected to
grow ~32% mainly due lower taxation
Source: Company, ICICIdirect.com Research
Expected growth (%) in API
e
(| crore) Q2FY18E Q2FY17 Var. (%) Q1FY18 Var. (%)
Aurobindo 784.2 768.8 2.0 625.0 25.5
Alembic 172.2 164.0 5.0 130.0 32.5
Cadila 87.4 83.2 5.0 68.9 26.8
Glenmark 232.4 221.3 5.0 204.8 13.5
Divi's Lab 465.2 489.7 -5.0 402.9 15.5
Indoco 14.3 13.6 5.0 14.9 -4.2
Ipca Labs 203.0 184.5 10.0 171.5 18.4
Lupin 297.7 291.9 2.0 279.3 6.6
Cipla 115.5 110.0 5.0 130.0 -11.2
Dr Reddy's 590.0 578.4 2.0 465.1 26.8
API 52.4 47.6 10.0 86.3 -39.3
Sun Pharma 378.8 371.3 2.0 318.4 18.9
Unichem 25.8 24.5 5.0 21.9 17.4
Total 3418.7 3348.9 2.1 2919.0 17.1
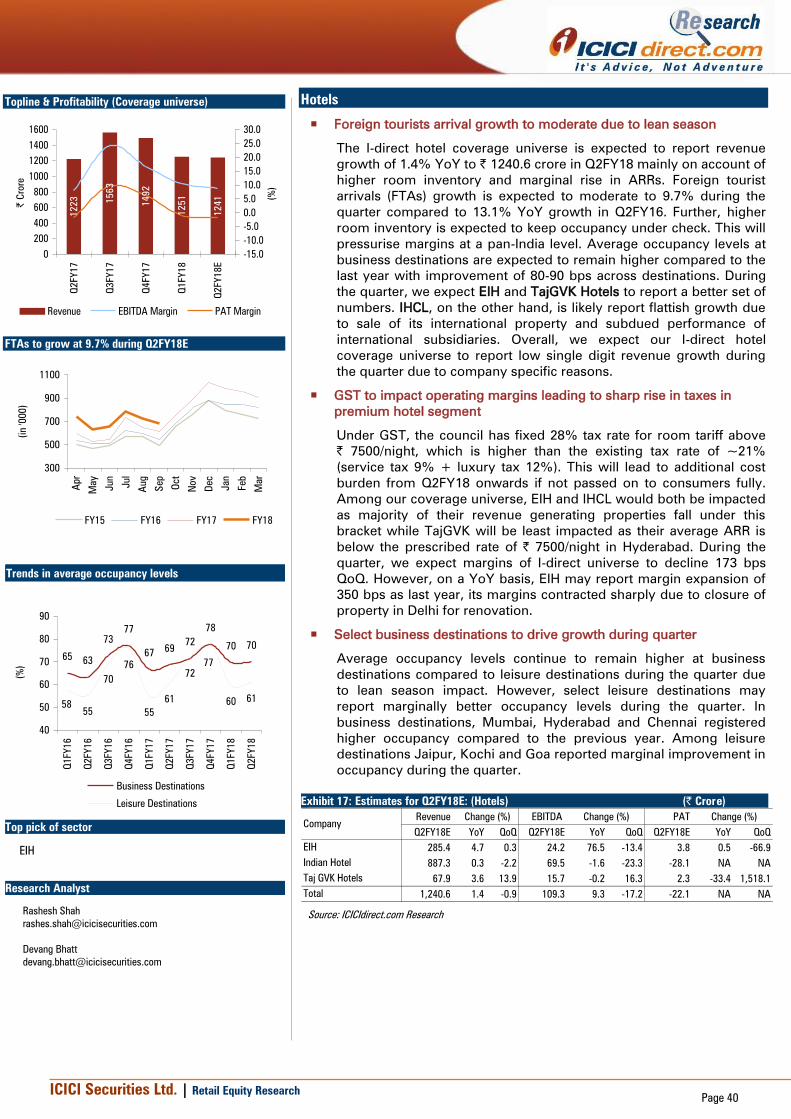
ICICI Securities Ltd. | Retail Equity Research
Page 40
Hotels
Foreign tourists arrival growth to moderate due to lean season
The I-direct hotel coverage universe is expected to report revenue
growth of 1.4% YoY to | 1240.6 crore in Q2FY18 mainly on account of
higher room inventory and marginal rise in ARRs. Foreign tourist
arrivals (FTAs) growth is expected to moderate to 9.7% during the
quarter compared to 13.1% YoY growth in Q2FY16. Further, higher
room inventory is expected to keep occupancy under check. This will
pressurise margins at a pan-India level. Average occupancy levels at
business destinations are expected to remain higher compared to the
last year with improvement of 80-90 bps across destinations. During
the quarter, we expect EIH and TajGVK Hotels to report a better set of
numbers. IHCL, on the other hand, is likely report flattish growth due
to sale of its international property and subdued performance of
international subsidiaries. Overall, we expect our I-direct hotel
coverage universe to report low single digit revenue growth during
the quarter due to company specific reasons.
GST to impact operating margins leading to sharp rise in taxes in
premium hotel segment
Under GST, the council has fixed 28% tax rate for room tariff above
| 7500/night, which is higher than the existing tax rate of ~21%
(service tax 9% + luxury tax 12%). This will lead to additional cost
burden from Q2FY18 onwards if not passed on to consumers fully.
Among our coverage universe, EIH and IHCL would both be impacted
as majority of their revenue generating properties fall under this
bracket while TajGVK will be least impacted as their average ARR is
below the prescribed rate of | 7500/night in Hyderabad. During the
quarter, we expect margins of I-direct universe to decline 173 bps
QoQ. However, on a YoY basis, EIH may report margin expansion of
350 bps as last year, its margins contracted sharply due to closure of
property in Delhi for renovation.
Select business destinations to drive growth during quarter
Average occupancy levels continue to remain higher at business
destinations compared to leisure destinations during the quarter due
to lean season impact. However, select leisure destinations may
report marginally better occupancy levels during the quarter. In
business destinations, Mumbai, Hyderabad and Chennai registered
higher occupancy compared to the previous year. Among leisure
destinations Jaipur, Kochi and Goa reported marginal improvement in
occupancy during the quarter.
Exhibit 17:�Estimates for Q2FY18E: (Hotels) (| Crore)
Revenue EBITDA PAT
Q2FY18E YoY QoQ Q2FY18E YoY QoQ Q2FY18E YoY QoQ
EIH 285.4 4.7 0.3 24.2 76.5 -13.4 3.8 0.5 -66.9
Indian Hotel 887.3 0.3 -2.2 69.5 -1.6 -23.3 -28.1 NA NA
Taj GVK Hotels 67.9 3.6 13.9 15.7 -0.2 16.3 2.3 -33.4 1,518.1
Total 1,240.6 1.4 -0.9 109.3 9.3 -17.2 -22.1 NA NA
Company
Change (%) Change (%)Change (%)
Source: ICICIdirect.com Research
Topline & Profitability (Coverage universe)
1223 1563
1492
1251
1241
0
200
400
600
800
1000
1200
1400
1600
Q2FY17
Q3FY17
Q4FY17
Q1FY18
Q2FY18E
| C
rore
-15.0
-10.0
-5.0
0.0
5.0
10.0
15.0
20.0
25.0
30.0
(%
)
Revenue EBITDA Margin PAT Margin
FTAs to grow at 9.7% during Q2FY18E
300
500
700
900
1100
Apr
May
Jun
Jul
Aug
Sep
Oct
Nov
Dec
Jan
Feb
Mar
(in
'000)
FY15 FY16 FY17 FY18
Trends in average occupancy levels
63
73
77
67
7270 70
55
76
61 6061
65
69
78
58
70
55
72
77
40
50
60
70
80
90
Q1FY16
Q2FY16
Q3FY16
Q4FY16
Q1FY17
Q2FY17
Q3FY17
Q4FY17
Q1FY18
Q2FY18
(%
)
Business Destinations
Leisure Destinations
Top pick of sector
EIH
Research Analyst
Rashesh Shah
Devang Bhatt
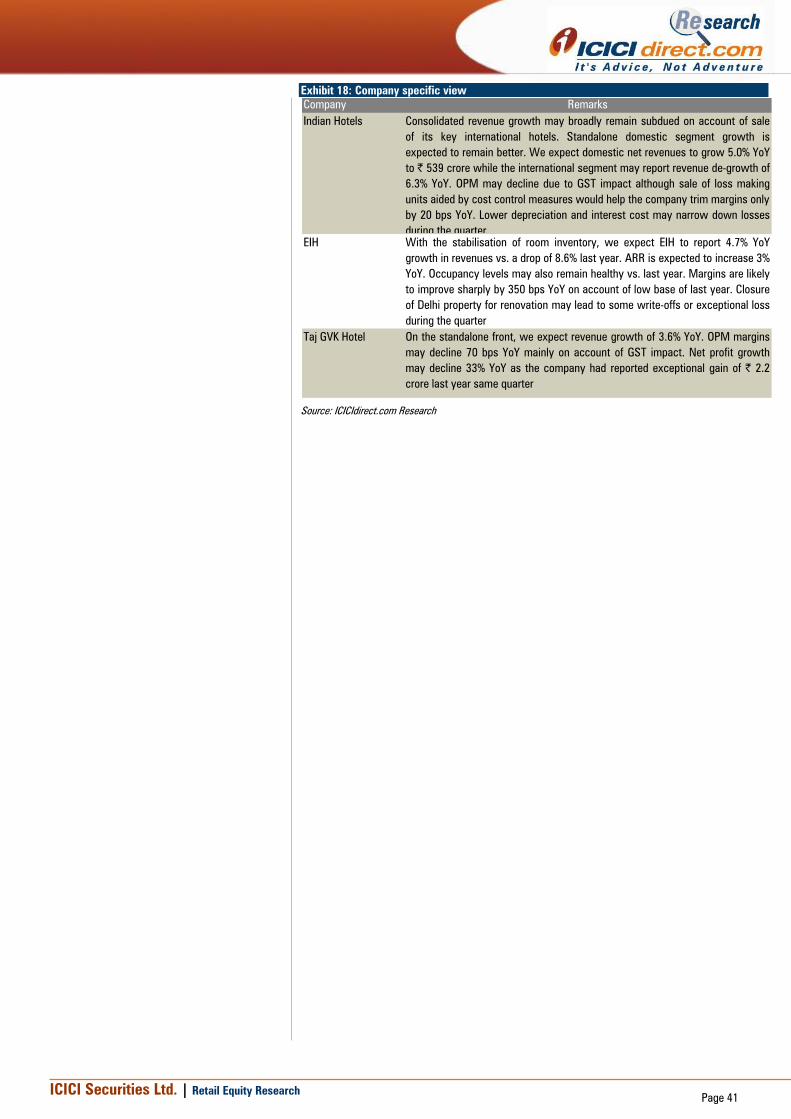
ICICI Securities Ltd. | Retail Equity Research
Page 41
Exhibit 18: Company specific view
Company Remarks
Indian Hotels Consolidated revenue growth may broadly remain subdued on account of sale
of its key international hotels. Standalone domestic segment growth is
expected to remain better. We expect domestic net revenues to grow 5.0% YoY
to | 539 crore while the international segment may report revenue de-growth of
6.3% YoY. OPM may decline due to GST impact although sale of loss making
units aided by cost control measures would help the company trim margins only
by 20 bps YoY. Lower depreciation and interest cost may narrow down losses
during the quarter
EIH With the stabilisation of room inventory, we expect EIH to report 4.7% YoY
growth in revenues vs. a drop of 8.6% last year. ARR is expected to increase 3%
YoY. Occupancy levels may also remain healthy vs. last year. Margins are likely
to improve sharply by 350 bps YoY on account of low base of last year. Closure
of Delhi property for renovation may lead to some write-offs or exceptional loss
during the quarter
Taj GVK Hotel On the standalone front, we expect revenue growth of 3.6% YoY. OPM margins
may decline 70 bps YoY mainly on account of GST impact. Net profit growth
may decline 33% YoY as the company had reported exceptional gain of | 2.2
crore last year same quarter
Source: ICICIdirect.com Research
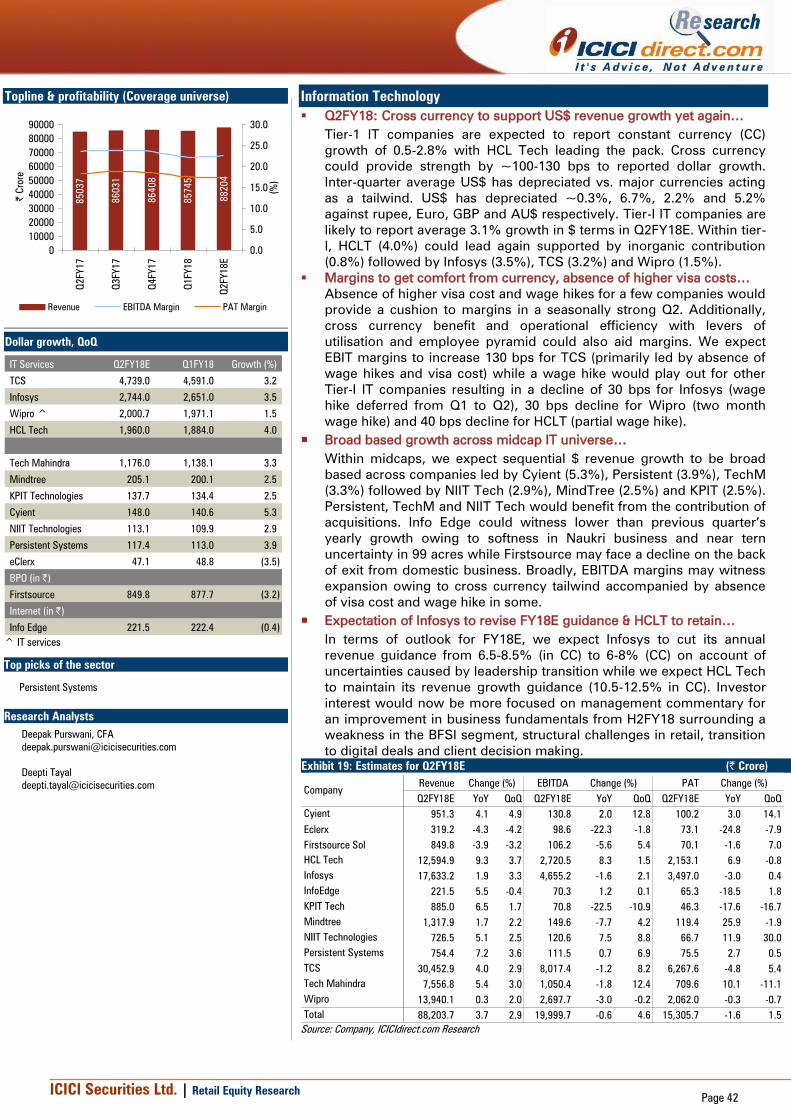
ICICI Securities Ltd. | Retail Equity Research
Page 42
Information Technology
Q2FY18: Cross currency to support US$ revenue growth yet again…
Tier-1 IT companies are expected to report constant currency (CC)
growth of 0.5-2.8% with HCL Tech leading the pack. Cross currency
could provide strength by ~100-130 bps to reported dollar growth.
Inter-quarter average US$ has depreciated vs. major currencies acting
as a tailwind. US$ has depreciated ~0.3%, 6.7%, 2.2% and 5.2%
against rupee, Euro, GBP and AU$ respectively. Tier-I IT companies are
likely to report average 3.1% growth in $ terms in Q2FY18E. Within tier-
I, HCLT (4.0%) could lead again supported by inorganic contribution
(0.8%) followed by Infosys (3.5%), TCS (3.2%) and Wipro (1.5%).
Margins to get comfort from currency, absence of higher visa costs…
Absence of higher visa cost and wage hikes for a few companies would
provide a cushion to margins in a seasonally strong Q2. Additionally,
cross currency benefit and operational efficiency with levers of
utilisation and employee pyramid could also aid margins. We expect
EBIT margins to increase 130 bps for TCS (primarily led by absence of
wage hikes and visa cost) while a wage hike would play out for other
Tier-I IT companies resulting in a decline of 30 bps for Infosys (wage
hike deferred from Q1 to Q2), 30 bps decline for Wipro (two month
wage hike) and 40 bps decline for HCLT (partial wage hike).
Broad based growth across midcap IT universe…
Within midcaps, we expect sequential $ revenue growth to be broad
based across companies led by Cyient (5.3%), Persistent (3.9%), TechM
(3.3%) followed by NIIT Tech (2.9%), MindTree (2.5%) and KPIT (2.5%).
Persistent, TechM and NIIT Tech would benefit from the contribution of
acquisitions. Info Edge could witness lower than previous quarter’s
yearly growth owing to softness in Naukri business and near tern
uncertainty in 99 acres while Firstsource may face a decline on the back
of exit from domestic business. Broadly, EBITDA margins may witness
expansion owing to cross currency tailwind accompanied by absence
of visa cost and wage hike in some.
Expectation of Infosys to revise FY18E guidance & HCLT to retain…
In terms of outlook for FY18E, we expect Infosys to cut its annual
revenue guidance from 6.5-8.5% (in CC) to 6-8% (CC) on account of
uncertainties caused by leadership transition while we expect HCL Tech
to maintain its revenue growth guidance (10.5-12.5% in CC). Investor
interest would now be more focused on management commentary for
an improvement in business fundamentals from H2FY18 surrounding a
weakness in the BFSI segment, structural challenges in retail, transition
to digital deals and client decision making.
Exhibit 19: Estimates for Q2FY18E (| Crore)
Revenue EBITDA PAT
Q2FY18E YoY QoQ Q2FY18E YoY QoQ Q2FY18E YoY QoQ
Cyient 951.3 4.1 4.9 130.8 2.0 12.8 100.2 3.0 14.1
Eclerx 319.2 -4.3 -4.2 98.6 -22.3 -1.8 73.1 -24.8 -7.9
Firstsource Sol 849.8 -3.9 -3.2 106.2 -5.6 5.4 70.1 -1.6 7.0
HCL Tech 12,594.9 9.3 3.7 2,720.5 8.3 1.5 2,153.1 6.9 -0.8
Infosys 17,633.2 1.9 3.3 4,655.2 -1.6 2.1 3,497.0 -3.0 0.4
InfoEdge 221.5 5.5 -0.4 70.3 1.2 0.1 65.3 -18.5 1.8
KPIT Tech 885.0 6.5 1.7 70.8 -22.5 -10.9 46.3 -17.6 -16.7
Mindtree 1,317.9 1.7 2.2 149.6 -7.7 4.2 119.4 25.9 -1.9
NIIT Technologies 726.5 5.1 2.5 120.6 7.5 8.8 66.7 11.9 30.0
Persistent Systems 754.4 7.2 3.6 111.5 0.7 6.9 75.5 2.7 0.5
TCS 30,452.9 4.0 2.9 8,017.4 -1.2 8.2 6,267.6 -4.8 5.4
Tech Mahindra 7,556.8 5.4 3.0 1,050.4 -1.8 12.4 709.6 10.1 -11.1
Wipro 13,940.1 0.3 2.0 2,697.7 -3.0 -0.2 2,062.0 -0.3 -0.7
Total 88,203.7 3.7 2.9 19,999.7 -0.6 4.6 15,305.7 -1.6 1.5
Change (%)Change (%)
Company
Change (%)
Source: Company, ICICIdirect.com Research
Topline & profitability (Coverage universe)
85037
86031
86408
85745
88204
0
10000
20000
30000
40000
50000
60000
70000
80000
90000
Q2FY17
Q3FY17
Q4FY17
Q1FY18
Q2FY18E
| C
rore
0.0
5.0
10.0
15.0
20.0
25.0
30.0
(%
)
Revenue EBITDA Margin PAT Margin
Dollar growth, QoQ
IT Services Q2FY18E Q1FY18 Growth (%)
TCS 4,739.0 4,591.0 3.2
Infosys 2,744.0 2,651.0 3.5
Wipro ^ 2,000.7 1,971.1 1.5
HCL Tech 1,960.0 1,884.0 4.0
Tech Mahindra 1,176.0 1,138.1 3.3
Mindtree 205.1 200.1 2.5
KPIT Technologies 137.7 134.4 2.5
Cyient 148.0 140.6 5.3
NIIT Technologies 113.1 109.9 2.9
Persistent Systems 117.4 113.0 3.9
eClerx 47.1 48.8 (3.5)
BPO (in |)
Firstsource 849.8 877.7 (3.2)
Internet (in |)
Info Edge 221.5 222.4 (0.4)
^ IT services
Top picks of the sector
Persistent Systems
Research Analysts
Deepak Purswani, CFA
Deepti Tayal
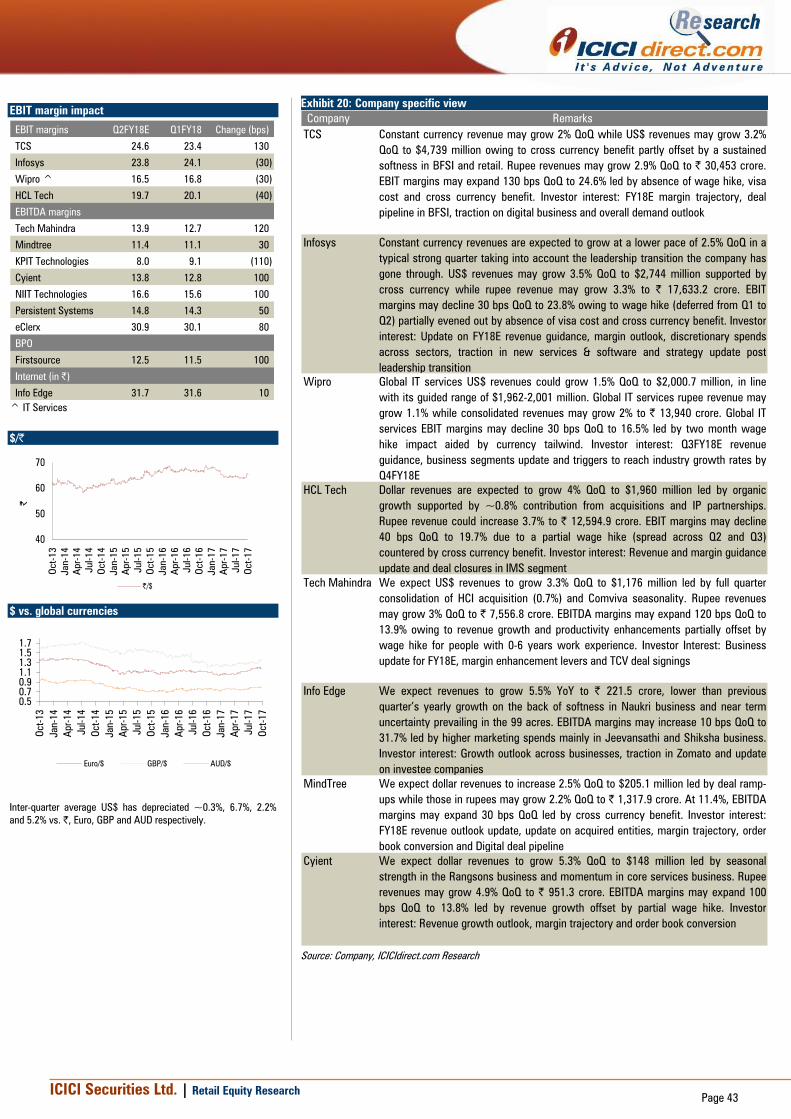
ICICI Securities Ltd. | Retail Equity Research
Page 43
Exhibit 20: Company specific view
Company Remarks
TCS Constant currency revenue may grow 2% QoQ while US$ revenues may grow 3.2%
QoQ to $4,739 million owing to cross currency benefit partly offset by a sustained
softness in BFSI and retail. Rupee revenues may grow 2.9% QoQ to | 30,453 crore.
EBIT margins may expand 130 bps QoQ to 24.6% led by absence of wage hike, visa
cost and cross currency benefit. Investor interest: FY18E margin trajectory, deal
pipeline in BFSI, traction on digital business and overall demand outlook
Infosys Constant currency revenues are expected to grow at a lower pace of 2.5% QoQ in a
typical strong quarter taking into account the leadership transition the company has
gone through. US$ revenues may grow 3.5% QoQ to $2,744 million supported by
cross currency while rupee revenue may grow 3.3% to | 17,633.2 crore. EBIT
margins may decline 30 bps QoQ to 23.8% owing to wage hike (deferred from Q1 to
Q2) partially evened out by absence of visa cost and cross currency benefit. Investor
interest: Update on FY18E revenue guidance, margin outlook, discretionary spends
across sectors, traction in new services & software and strategy update post
leadership transition
Wipro Global IT services US$ revenues could grow 1.5% QoQ to $2,000.7 million, in line
with its guided range of $1,962-2,001 million. Global IT services rupee revenue may
grow 1.1% while consolidated revenues may grow 2% to | 13,940 crore. Global IT
services EBIT margins may decline 30 bps QoQ to 16.5% led by two month wage
hike impact aided by currency tailwind. Investor interest: Q3FY18E revenue
guidance, business segments update and triggers to reach industry growth rates by
Q4FY18E
HCL Tech Dollar revenues are expected to grow 4% QoQ to $1,960 million led by organic
growth supported by ~0.8% contribution from acquisitions and IP partnerships.
Rupee revenue could increase 3.7% to | 12,594.9 crore. EBIT margins may decline
40 bps QoQ to 19.7% due to a partial wage hike (spread across Q2 and Q3)
countered by cross currency benefit. Investor interest: Revenue and margin guidance
update and deal closures in IMS segment
Tech Mahindra We expect US$ revenues to grow 3.3% QoQ to $1,176 million led by full quarter
consolidation of HCI acquisition (0.7%) and Comviva seasonality. Rupee revenues
may grow 3% QoQ to | 7,556.8 crore. EBITDA margins may expand 120 bps QoQ to
13.9% owing to revenue growth and productivity enhancements partially offset by
wage hike for people with 0-6 years work experience. Investor Interest: Business
update for FY18E, margin enhancement levers and TCV deal signings
Info Edge We expect revenues to grow 5.5% YoY to | 221.5 crore, lower than previous
quarter’s yearly growth on the back of softness in Naukri business and near term
uncertainty prevailing in the 99 acres. EBITDA margins may increase 10 bps QoQ to
31.7% led by higher marketing spends mainly in Jeevansathi and Shiksha business.
Investor interest: Growth outlook across businesses, traction in Zomato and update
on investee companies
MindTree We expect dollar revenues to increase 2.5% QoQ to $205.1 million led by deal ramp-
ups while those in rupees may grow 2.2% QoQ to | 1,317.9 crore. At 11.4%, EBITDA
margins may expand 30 bps QoQ led by cross currency benefit. Investor interest:
FY18E revenue outlook update, update on acquired entities, margin trajectory, order
book conversion and Digital deal pipeline
Cyient We expect dollar revenues to grow 5.3% QoQ to $148 million led by seasonal
strength in the Rangsons business and momentum in core services business. Rupee
revenues may grow 4.9% QoQ to | 951.3 crore. EBITDA margins may expand 100
bps QoQ to 13.8% led by revenue growth offset by partial wage hike. Investor
interest: Revenue growth outlook, margin trajectory and order book conversion
Source: Company, ICICIdirect.com Research
EBIT margin impact
EBIT margins Q2FY18E Q1FY18 Change (bps)
TCS 24.6 23.4 130
Infosys 23.8 24.1 (30)
Wipro ^ 16.5 16.8 (30)
HCL Tech 19.7 20.1 (40)
EBITDA margins
Tech Mahindra 13.9 12.7 120
Mindtree 11.4 11.1 30
KPIT Technologies 8.0 9.1 (110)
Cyient 13.8 12.8 100
NIIT Technologies 16.6 15.6 100
Persistent Systems 14.8 14.3 50
eClerx 30.9 30.1 80
BPO
Firstsource 12.5 11.5 100
Internet (in |)
Info Edge 31.7 31.6 10
^ IT Services
$/|
40
50
60
70
Oct-13
Jan-14
Apr-14
Jul-14
Oct-14
Jan-15
Apr-15
Jul-15
Oct-15
Jan-16
Apr-16
Jul-16
Oct-16
Jan-17
Apr-17
Jul-17
Oct-17
|
|/$
$ vs. global currencies
0.5
0.7
0.9
1.1
1.3
1.5
1.7
Oct-13
Jan-14
Apr-14
Jul-14
Oct-14
Jan-15
Apr-15
Jul-15
Oct-15
Jan-16
Apr-16
Jul-16
Oct-16
Jan-17
Apr-17
Jul-17
Oct-17
Euro/$ GBP/$ AUD/$
Inter-quarter average US$ has depreciated ~0.3%, 6.7%, 2.2%
and 5.2% vs. |, Euro, GBP and AUD respectively.
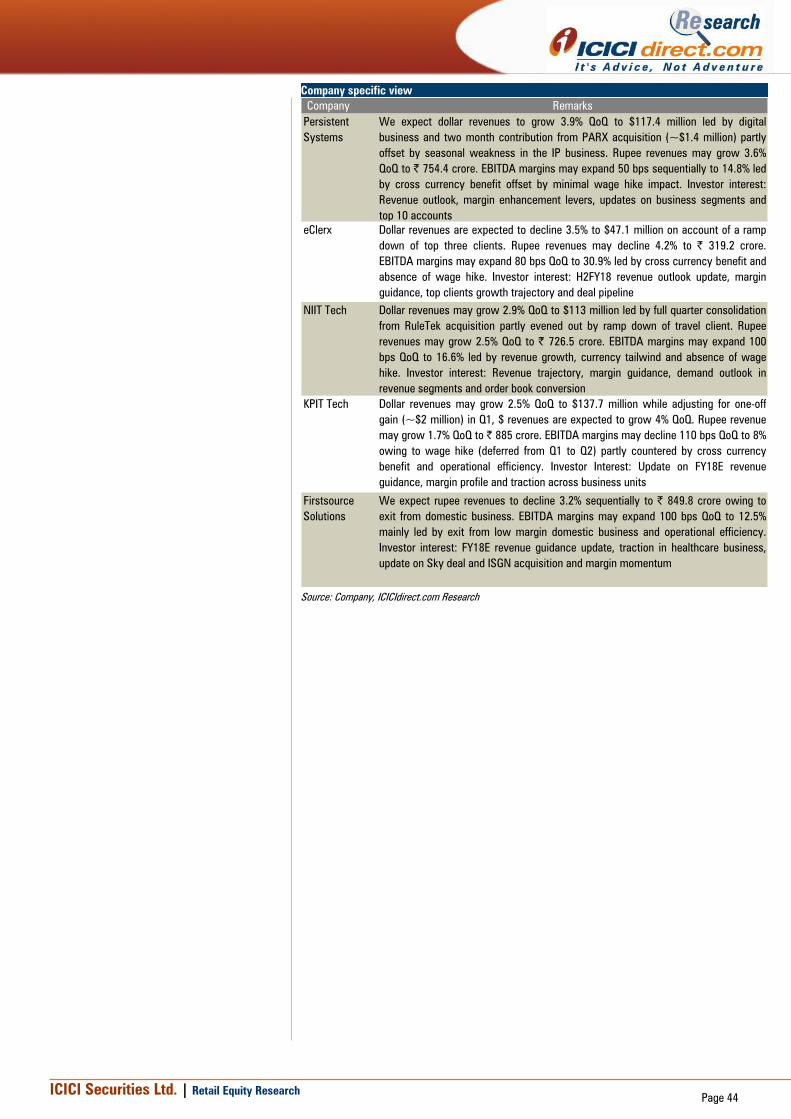
ICICI Securities Ltd. | Retail Equity Research
Page 44
Company specific view
Company Remarks
Persistent
Systems
We expect dollar revenues to grow 3.9% QoQ to $117.4 million led by digital
business and two month contribution from PARX acquisition (~$1.4 million) partly
offset by seasonal weakness in the IP business. Rupee revenues may grow 3.6%
QoQ to | 754.4 crore. EBITDA margins may expand 50 bps sequentially to 14.8% led
by cross currency benefit offset by minimal wage hike impact. Investor interest:
Revenue outlook, margin enhancement levers, updates on business segments and
top 10 accounts
eClerx Dollar revenues are expected to decline 3.5% to $47.1 million on account of a ramp
down of top three clients. Rupee revenues may decline 4.2% to | 319.2 crore.
EBITDA margins may expand 80 bps QoQ to 30.9% led by cross currency benefit and
absence of wage hike. Investor interest: H2FY18 revenue outlook update, margin
guidance, top clients growth trajectory and deal pipeline
NIIT Tech Dollar revenues may grow 2.9% QoQ to $113 million led by full quarter consolidation
from RuleTek acquisition partly evened out by ramp down of travel client. Rupee
revenues may grow 2.5% QoQ to | 726.5 crore. EBITDA margins may expand 100
bps QoQ to 16.6% led by revenue growth, currency tailwind and absence of wage
hike. Investor interest: Revenue trajectory, margin guidance, demand outlook in
revenue segments and order book conversion
KPIT Tech Dollar revenues may grow 2.5% QoQ to $137.7 million while adjusting for one-off
gain (~$2 million) in Q1, $ revenues are expected to grow 4% QoQ. Rupee revenue
may grow 1.7% QoQ to | 885 crore. EBITDA margins may decline 110 bps QoQ to 8%
owing to wage hike (deferred from Q1 to Q2) partly countered by cross currency
benefit and operational efficiency. Investor Interest: Update on FY18E revenue
guidance, margin profile and traction across business units
Firstsource
Solutions
We expect rupee revenues to decline 3.2% sequentially to | 849.8 crore owing to
exit from domestic business. EBITDA margins may expand 100 bps QoQ to 12.5%
mainly led by exit from low margin domestic business and operational efficiency.
Investor interest: FY18E revenue guidance update, traction in healthcare business,
update on Sky deal and ISGN acquisition and margin momentum
Source: Company, ICICIdirect.com Research

ICICI Securities Ltd. | Retail Equity Research
Page 45
Logistics
Dual (domestic & Exim) buoyancy in rail container volumes…
The Q2FY18 (July-August) tonnage for Indian Railways grew 7% YoY
to 186.5 MT vs. 174.9 MT in the same period (July-August) in the
previous year. Although low contributor, total container traffic, Exim
and domestic, grew 13% YoY each for the first two months of Q2FY18
to 9 MT vs. 7.2 MT in the same period in Q2FY17. The YTD tonnage
(April-August) growth remained robust at 5% YoY to 467.7 MT vs. 446
MT in the same period (April-August) in 2017. Container volumes for
the same period (April-August) grew 12% YoY (9% Exim and 28%
domestic) to 22 MT vs. 19.2 MT in (April-August) in 2017. With a
market leadership of ~73% we believe Concor will be the biggest
beneficiary of robust rail tonnage growth. Also, with initial disruption
(e-way bill, overcapacity, etc) due to GST on road transportation, we
expect Concor to gain market share. We expect Concor volumes to
9% YoY to 853420 TEUs. Domestic volumes are expected to grow
10% YoY to 114400 TEUs while Exim volumes are expected to grow
9%. EBITDA margins of Concor would be optically higher as Q2FY17
included retrospective impact of land prices revision undertaken by
Indian Railways. Subsequently, EBITDA, PAT is expected to grow
35%, 37% YoY to | 308 crore, | 218 crore, respectively.
Continued growth in external trade; upbeat volumes at major ports…
Indian foreign trade continues to exhibit improved growth. Indian
exports for the second quarter (July and August) grew 7% YoY to
$46.3 billion vs. $43.3 in the same period (July and August) in 2017.
However, imports for the same period grew at a faster pace of 18%
YoY to $69.5 billion compared to $58.8 billion in 2017. Although
imbalance was higher (imports exceed exports), volumes handled at
major ports continue to exhibit resilience to domestic weakness.
Container volumes at major ports for the current quarter (July-August)
grew 7% YoY to 1.5 million TEUs compared to 1.4 million TEUs in the
same period in 2017. YTD Q2FY18 volumes at JNPT (the largest port)
grew 8% YoY 818000 TEUs vs. 757000 TEUs in 2017. This was
supported by 5% growth each in Chennai, Tuticorin and Kolkata.
Improved efficiencies in terms of radio-frequency identification (RFID)
of containers, direct port delivery (DPD) facility, etc, led to this growth,
which would, in turn, impact volumes of private ports. In addition to
the aggressive stance of ports in the vicinity, GPPL has also lost a
client in Q1FY18, which would impact the current quarter volumes.
We expect volumes of Gujarat Pipavav port to de-grow 4% YoY to
160000 TEUs.
E-com euphoria returns; festive sale to keep express players busy…
In addition to the discounting strategy adopted by e-commerce
players during Independence Day and Onam, the big festival sale by
e-tail biggies in the last week of September is expected to bring some
cheer to express logistics players. In addition to the same, we would
see manufacturing/industries re-align their logistics contracts to
comply/benefit from GST, which was implemented from July 1. We
believe subdued first half of July (initial implementation hiccups)
would be completely offset by higher movement of goods triggered
before implementation of e-way bill. Gati would continue to lag (2%
de-growth in revenues) in our coverage universe due to softness in its
KWE division. We expect revenue for BlueDart, TCI post 5%, 4%
growth, respectively. However, margins are expected to remain
subdued for these players as they re-align their distribution setup to
embrace GST.
Exhibit 21: Estimates for Q2FY18E: (Logistics) (| crore)
Topline & Profitability (Coverage universe)
3090
3091
3305
3216
3215
0
400
800
1200
1600
2000
2400
2800
3200
3600
Q2FY17
Q3FY17
Q4FY17
Q1FY18
Q2FY18E
| C
rore
0.0
5.0
10.0
15.0
20.0
25.0
(%
)
Revenue EBITDA Margin PAT Margin
Container Volumes in an uptrend…
715679 693 705 690
707
630
791
752 755 744 758775
0
100
200
300
400
500
600
700
800
900
Aug'1
6
Sep'1
6
Oct'1
6
Nov'1
6
Dec'1
6
Jan'1
7
Feb'1
7
Mar'1
7
Apr'1
7
May'1
7
June'1
7
July
'17
Aug'1
7
('0
00 T
EU
s)
Top Pick
Container Corporation of India
Research Analyst
Bharat Chhoda
Ankit Panchmatia
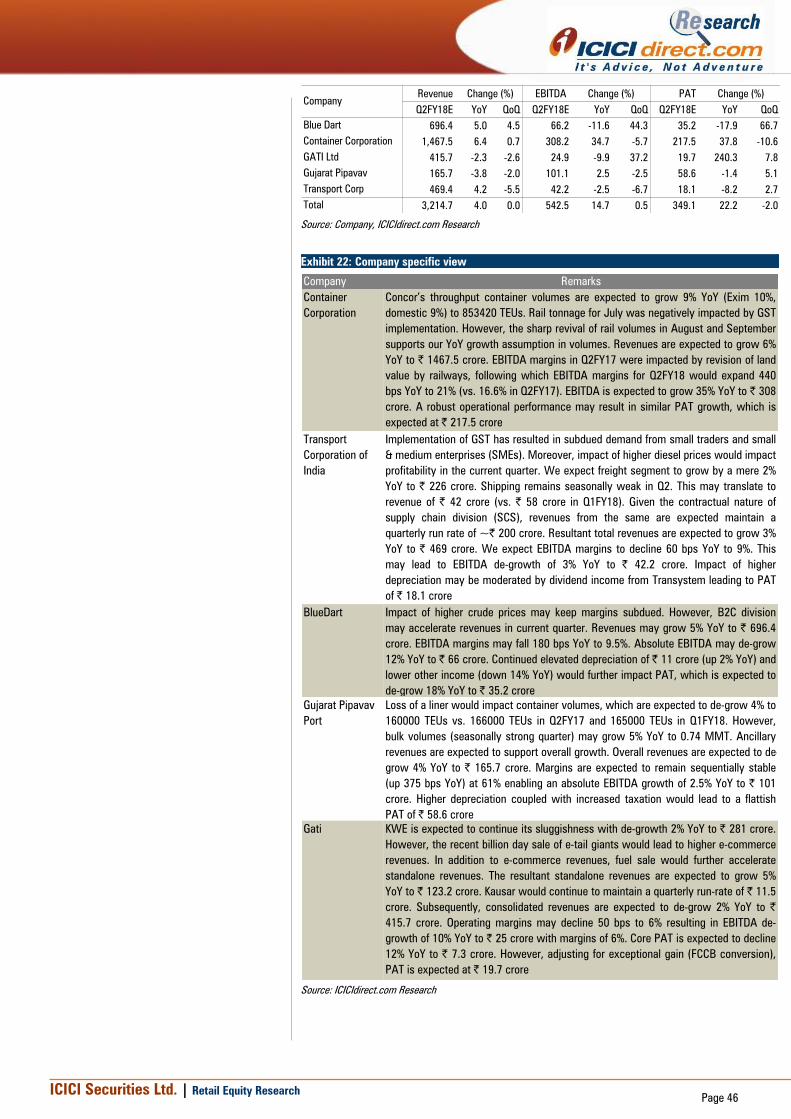
ICICI Securities Ltd. | Retail Equity Research
Page 46
Revenue EBITDA PAT
Q2FY18E YoY QoQ Q2FY18E YoY QoQ Q2FY18E YoY QoQ
Blue Dart 696.4 5.0 4.5 66.2 -11.6 44.3 35.2 -17.9 66.7
Container Corporation 1,467.5 6.4 0.7 308.2 34.7 -5.7 217.5 37.8 -10.6
GATI Ltd 415.7 -2.3 -2.6 24.9 -9.9 37.2 19.7 240.3 7.8
Gujarat Pipavav 165.7 -3.8 -2.0 101.1 2.5 -2.5 58.6 -1.4 5.1
Transport Corp 469.4 4.2 -5.5 42.2 -2.5 -6.7 18.1 -8.2 2.7
Total 3,214.7 4.0 0.0 542.5 14.7 0.5 349.1 22.2 -2.0
Change (%) Change (%)
Company
Change (%)
Source: Company, ICICIdirect.com Research
Exhibit 22: Company specific view
Company Remarks
Container
Corporation
Concor’s throughput container volumes are expected to grow 9% YoY (Exim 10%,
domestic 9%) to 853420 TEUs. Rail tonnage for July was negatively impacted by GST
implementation. However, the sharp revival of rail volumes in August and September
supports our YoY growth assumption in volumes. Revenues are expected to grow 6%
YoY to | 1467.5 crore. EBITDA margins in Q2FY17 were impacted by revision of land
value by railways, following which EBITDA margins for Q2FY18 would expand 440
bps YoY to 21% (vs. 16.6% in Q2FY17). EBITDA is expected to grow 35% YoY to | 308
crore. A robust operational performance may result in similar PAT growth, which is
expected at | 217.5 crore
Transport
Corporation of
India
Implementation of GST has resulted in subdued demand from small traders and small
& medium enterprises (SMEs). Moreover, impact of higher diesel prices would impact
profitability in the current quarter. We expect freight segment to grow by a mere 2%
YoY to | 226 crore. Shipping remains seasonally weak in Q2. This may translate to
revenue of | 42 crore (vs. | 58 crore in Q1FY18). Given the contractual nature of
supply chain division (SCS), revenues from the same are expected maintain a
quarterly run rate of ~| 200 crore. Resultant total revenues are expected to grow 3%
YoY to | 469 crore. We expect EBITDA margins to decline 60 bps YoY to 9%. This
may lead to EBITDA de-growth of 3% YoY to | 42.2 crore. Impact of higher
depreciation may be moderated by dividend income from Transystem leading to PAT
of | 18.1 crore
BlueDart Impact of higher crude prices may keep margins subdued. However, B2C division
may accelerate revenues in current quarter. Revenues may grow 5% YoY to | 696.4
crore. EBITDA margins may fall 180 bps YoY to 9.5%. Absolute EBITDA may de-grow
12% YoY to | 66 crore. Continued elevated depreciation of | 11 crore (up 2% YoY) and
lower other income (down 14% YoY) would further impact PAT, which is expected to
de-grow 18% YoY to | 35.2 crore
Gujarat Pipavav
Port
Loss of a liner would impact container volumes, which are expected to de-grow 4% to
160000 TEUs vs. 166000 TEUs in Q2FY17 and 165000 TEUs in Q1FY18. However,
bulk volumes (seasonally strong quarter) may grow 5% YoY to 0.74 MMT. Ancillary
revenues are expected to support overall growth. Overall revenues are expected to de-
grow 4% YoY to | 165.7 crore. Margins are expected to remain sequentially stable
(up 375 bps YoY) at 61% enabling an absolute EBITDA growth of 2.5% YoY to | 101
crore. Higher depreciation coupled with increased taxation would lead to a flattish
PAT of | 58.6 crore
Gati KWE is expected to continue its sluggishness with de-growth 2% YoY to | 281 crore.
However, the recent billion day sale of e-tail giants would lead to higher e-commerce
revenues. In addition to e-commerce revenues, fuel sale would further accelerate
standalone revenues. The resultant standalone revenues are expected to grow 5%
YoY to | 123.2 crore. Kausar would continue to maintain a quarterly run-rate of | 11.5
crore. Subsequently, consolidated revenues are expected to de-grow 2% YoY to |
415.7 crore. Operating margins may decline 50 bps to 6% resulting in EBITDA de-
growth of 10% YoY to | 25 crore with margins of 6%. Core PAT is expected to decline
12% YoY to | 7.3 crore. However, adjusting for exceptional gain (FCCB conversion),
PAT is expected at | 19.7 crore
Source: ICICIdirect.com Research

ICICI Securities Ltd. | Retail Equity Research
Page 47
Media
GST hangover dilutes festive benefits for print sector
The ad revenue growth for print players is expected to be subdued for
the quarter, largely on the back of a GST led ad pullback in July, which
has erased the festive benefits seen in September. DB Corp and Jagran
Prakashan are likely to witness print ad growth of ~5.0% YoY each. In
case of HT Media, the Hindi segment is expected to post ad revenue
growth of 4% YoY while English ad revenues are expected to decline
5% YoY. Circulation revenues for DB Corp are expected to grow 6%
YoY while that of Jagran are expected to grow 1.5% YoY. We expect a
decline of 4% YoY in circulation revenue for HT Media. We note that
Jagran and HT Media have taken cover price cuts in the key markets of
Uttar Pradesh and Bihar to counter competition.
Broadcasters to witness muted ad growth in quarter
The quarter is expected to be muted for broadcasters as GST impact
would weigh on the ad growth environment. Zee is expected to report
ad growth of 2% YoY (underlying growth of ~5%, adjusting for sports
business) while Sun TV is expected to report 3.9% YoY ad growth. TV
Today, on the other hand, is likely to report healthy ad growth of 9.3%
YoY. On the subscription front, Zee is expected to report 13% YoY
decline, largely due to exclusion of sports business and weak
international subscription growth. Sun TV is expected to report healthy
subscription growth of 14.4% YoY, benefiting from traction in cable
subscription revenues.
Relatively weak content to impact multiplexes
Movies such as Toilet EK Prem Katha, Shubh Mangal Saavdhaan,
Judwaa 2, etc, had a good run up in the box office. However, a weaker
than anticipated run of Jab Harry met Sejal, Jagga Jasoos, etc, coupled
with a heavy base quarter (Bajrangi Bhaijaan) led to softer footfalls. We
estimate marginal ATP growth (4% for PVR and 1% Inox on YoY). The
ad revenue growth for both players is expected to be divergent as Inox
is likely to witness ad yield catch-up on a low base. PVR’s ad revenue
growth is expected at 5% YoY while that for Inox is expected at 23.5%
YoY. EBITDA margins for PVR is expected to decline 130 bps YoY, while
for Inox the margin is expected to improve 220 bps YoY, largely driven
by strong growth in ad revenues.
Exhibit 23: Estimates for Q2FY18E- Media (| crore)
Revenue EBITDA PAT
Q2FY18E YoY QoQ Q2FY18E YoY QoQ Q2FY18E YoY QoQ
DB Corp 554.5 4.9 -6.7 155.3 3.2 -16.7 91.8 3.7 -16.6
Dish TV 753.9 -3.3 2.0 218.9 -17.2 8.8 -7.3 PL NA
ENIL 127.6 -1.6 22.3 25.9 12.0 55.2 6.8 -15.8 48.4
HT Media 599.1 -0.5 0.0 80.3 59.1 0.5 39.4 27.3 -5.3
Inox Leisure 307.6 3.4 -20.6 34.8 28.0 -53.7 6.0 282.9 NM
PVR 561.3 1.3 -11.8 87.0 -6.5 -22.4 22.4 -23.0 -49.6
Sun TV 663.8 6.1 -15.6 488.6 4.8 9.0 288.6 6.8 14.7
TV Today 147.1 11.2 -2.6 44.1 19.6 -3.8 27.3 20.6 40.6
Zee Ent. 1,585.9 -6.5 3.0 493.2 0.8 1.8 327.2 37.2 30.0
Total 5,892.1 -0.2 -3.9 1,789.4 1.9 -1.2 890.8 5.8 7.3
Change (%)
Company
Change (%) Change (%)
Source: Company, ICICIdirect.com Research
Topline & Profitability (Coverage universe)
5906
5978
5585
6130
5892
0
1000
2000
3000
4000
5000
6000
7000
Q2FY17
Q3FY17
Q4FY17
Q1FY18
Q2FY18E
| C
rore
0.0
5.0
10.0
15.0
20.0
25.0
30.0
35.0
(%
)
Revenue EBITDA Margin PAT Margin
PVR & Inox – Footfalls
20.7
18.517.9 18.2
21.0
18.3
15.5
12.7 12.5 13.0
15.8
12.7
0.0
5.0
10.0
15.0
20.0
25.0
Q1FY17
Q2FY17
Q3FY17
Q4FY17
Q1FY18
Q2FY18E
(m
illion)
PVR Inox
Top pick of sector
Inox Leisure
Research Analysts
Bhupendra.Tiwary
Sameer.Pardikar

ICICI Securities Ltd. | Retail Equity Research
Page 48
Exhibit 24: Company specific view
Company Remarks
DB Corp DB Corp is expected to post 5% YoY growth in its ad revenues to | 346.8 crore as a
GST led ad pullback in July seemed to have diluted the festive benefits during the
quarter. Subscription revenues at | 125 crore are expected to grow 6% YoY. Radio
revenues at | 32.6 crore are a tad softer owing to GST led ad pullback during the
quarter. We expect margins of 28%, down 50 bps YoY impacted by muted topline
growth
Dish TV Net subscriber addition is expected at ~0.18 million during the quarter. ARPU is
expected to be flattish QoQ at | 148.2 as the competitive intensity has restricted the
company's price hike taking ability. Consequently, we expect a topline of | 753.9
crore, down 3.3% YoY. Content costs are expected to stay under control. We expect
margins at 29%, higher 180 bps sequentially. We expect the company to post losses
of | 7.3 crore
ENIL We expect another weak quarter for ENIL as a GST led ad pullback seemed to have
played spoilsport in a festive quarter. Hence, ENIL is expected to post revenue de-
growth of 1.6% YoY during the quarter to | 127.6 crore. EBITDA margins are expected
to expand to 20.3% in Q2FY18 vs. 17.8% in the base quarter, which was heavy with
marketing expenditure for new stations launch
HT Media The Hindi segment ad revenue is expected to remain subdued at 4.0% YoY growth to
| 176.9 crore despite a strong festive September owing to impact of GST in July.
English ad, on the other hand, is expected to remain a laggard and decline 5.0% YoY
to | 246.8 crore. Circulation revenues are expected at | 72.6 crore, a decline of 4%
YoY owing to competitive pricing in the key states of UP and Bihar. The radio
segment is expected to remain robust with revenues of | 45.8 crore, up 27% YoY
aided by new frequencies in the key cities of Mumbai and New Delhi. The company
has been undertaking several cost rationalisation measures in terms of better
pagination and restructuring of several overheads, which will lead to margins of
13.4%, up 500 bps on a YoY basis
Jagran
Prakashan
In line with its peers, Jagran is expected to post subdued ad growth of ~5% YoY,
clocking print ad revenues of | 354.9 crore, impacted by GST, which has spoiled the
festival led benefits during the quarter. Circulation revenues would remain muted at
1.6% YoY to | 108.8 crore, impacted by cover price cuts in key markets of UP & Bihar
to counter competition. Radio business, however, is expected to witness healthy ad
revenue growth of 12% YoY at | 77.5 crore and radio margins of 33%. Overall,
margins are expected at 26.5%, down 100 bps on a YoY basis, mainly due to a muted
print ad show
Inox Leisure Coming off a heavy base quarter of Q2FY17, which witnessed a blockbuster in the
form of Bajrangi Bhaijaan , Q2FY18 was rather disappointing with big budget movies
such as Jab Harry Met Sejal and Jagga Jasoos witnessing sub-par box office
collections. Consequently, Inox is expected to witness flattish footfall and subdued
1% ATP growth, leading to net box office collections growth of ~3.1% YoY to | 185
crore. Advertisement revenues are expected to witness ~24.3% YoY growth to |
29.6 crore led by yield improvement as well as start studded content slate. We
expect EBITDA margins of 11.3% (up 220 bps YoY), largely aided by healthy ad
revenues
Source: Company, ICICIdirect.com Research
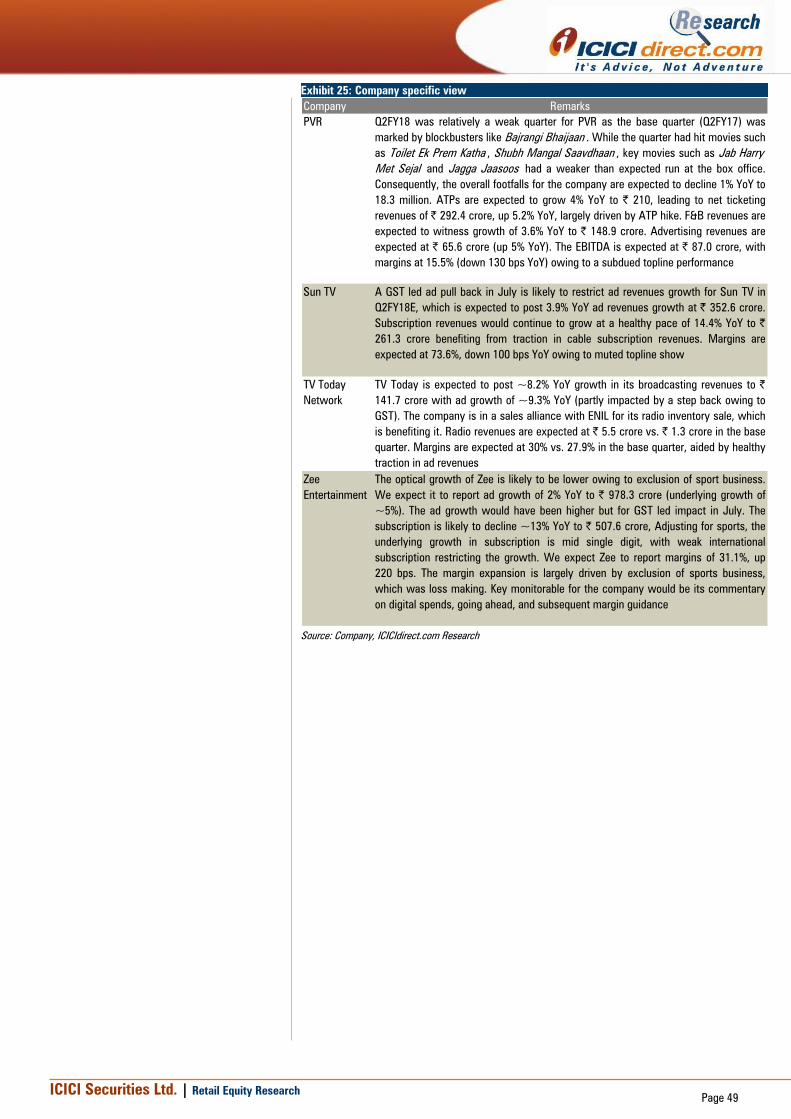
ICICI Securities Ltd. | Retail Equity Research
Page 49
Exhibit 25: Company specific view
Company Remarks
PVR Q2FY18 was relatively a weak quarter for PVR as the base quarter (Q2FY17) was
marked by blockbusters like Bajrangi Bhaijaan . While the quarter had hit movies such
as Toilet Ek Prem Katha , Shubh Mangal Saavdhaan , key movies such as Jab Harry
Met Sejal and Jagga Jaasoos had a weaker than expected run at the box office.
Consequently, the overall footfalls for the company are expected to decline 1% YoY to
18.3 million. ATPs are expected to grow 4% YoY to | 210, leading to net ticketing
revenues of | 292.4 crore, up 5.2% YoY, largely driven by ATP hike. F&B revenues are
expected to witness growth of 3.6% YoY to | 148.9 crore. Advertising revenues are
expected at | 65.6 crore (up 5% YoY). The EBITDA is expected at | 87.0 crore, with
margins at 15.5% (down 130 bps YoY) owing to a subdued topline performance
Sun TV A GST led ad pull back in July is likely to restrict ad revenues growth for Sun TV in
Q2FY18E, which is expected to post 3.9% YoY ad revenues growth at | 352.6 crore.
Subscription revenues would continue to grow at a healthy pace of 14.4% YoY to |
261.3 crore benefiting from traction in cable subscription revenues. Margins are
expected at 73.6%, down 100 bps YoY owing to muted topline show
TV Today
Network
TV Today is expected to post ~8.2% YoY growth in its broadcasting revenues to |
141.7 crore with ad growth of ~9.3% YoY (partly impacted by a step back owing to
GST). The company is in a sales alliance with ENIL for its radio inventory sale, which
is benefiting it. Radio revenues are expected at | 5.5 crore vs. | 1.3 crore in the base
quarter. Margins are expected at 30% vs. 27.9% in the base quarter, aided by healthy
traction in ad revenues
Zee
Entertainment
The optical growth of Zee is likely to be lower owing to exclusion of sport business.
We expect it to report ad growth of 2% YoY to | 978.3 crore (underlying growth of
~5%). The ad growth would have been higher but for GST led impact in July. The
subscription is likely to decline ~13% YoY to | 507.6 crore, Adjusting for sports, the
underlying growth in subscription is mid single digit, with weak international
subscription restricting the growth. We expect Zee to report margins of 31.1%, up
220 bps. The margin expansion is largely driven by exclusion of sports business,
which was loss making. Key monitorable for the company would be its commentary
on digital spends, going ahead, and subsequent margin guidance
Source: Company, ICICIdirect.com Research

ICICI Securities Ltd. | Retail Equity Research Page 50
Metals & Mining
� Healthy increase in domestic steel prices augHealthy increase in domestic steel prices augHealthy increase in domestic steel prices augHealthy increase in domestic steel prices augurs well....urs well....urs well....urs well....
For the first five months of FY18 (April-August), Indian finished steel production was at 43.2 million tonne (MT), up 5.9% YoY. Imports during the period were up 15.9% YoY to 3.5 MT while exports were up 57.1% YoY to 3.7 MT. Finished steel consumption witnessed growth of 4.4% YoY to 35.3 MT. Domestic steel prices have gathered strength on account of a cost push as well as increase in international steel prices during the last couple of months. Domestic HRC prices have increased 5-6% on a QoQ basis. The price increase is likely to flow positively toEBITDA, auguring well for domestic steel players. On the cost front,coking coal prices (a key input for steel making) have witnessedmoderation. Coking coal prices, which peaked at US$314/tonne in April2017, have declined to US$191/tonne in September 2017. Themoderation in prices of coking coal augurs well as it is likely to easecost pressure and enable margin expansion.
� NonNonNonNon----ferrous pack shines…ferrous pack shines…ferrous pack shines…ferrous pack shines…
During Q2FY18, the entire non-ferrous pack saw a notable upside. The global refined zinc market reported a deficit of ~203 kilotonne (KT) during the first six months of CY17 (January-June). Demand for refined zinc metal is expected to comfortably exceed supply in 2017. In the past, zinc deficit has augured well for global zinc prices. During the quarter, average zinc prices were up 31.5% YoY and 14.3% QoQ to US$2962/tonne. Average lead prices registered an increase of 24.4% YoY and 8.1% QoQ to US$2331/tonne. During the quarter, aluminium prices increased 24.1% YoY and 5.5% QoQ to US$2010/tonne while copper prices increased 32.9% YoY and 12.1% QoQ to US$6351/tonne.
� Aggregate EBITDA margins to increase QoQ, YoY…Aggregate EBITDA margins to increase QoQ, YoY…Aggregate EBITDA margins to increase QoQ, YoY…Aggregate EBITDA margins to increase QoQ, YoY…
We expect the aggregate topline of the coverage companies to increase 20.9% YoY while the aggregate EBITDA margin is likely to increase 449 bps YoY to 22.3% (vs. 17.8% in Q2FY17 and 21.2% in Q1FY18). We expect the EBITDA/tonne of JSW Steel (standalone operations) to come in at | 9000/tonne and Tata Steel (Indian operations) at | 13500/tonne. Tata Steel Europe is expected to report EBITDA/tonne of US$85/tonne. We expect Novelis to clock an EBITDA/tonne of US$375/tonne.
Exhibit 26:����Estimates for Q2FY18E: (Metals & Mining) (| Crore)
Revenue EBITDA PAT
Q2FY18E YoY QoQ Q2FY18E YoY QoQ Q2FY18E YoY QoQ
Coal India 18,340.6 13.1 -4.3 3,028.7 307.8 -14.0 2,310.3 285.0 -1.8
Graphite India 421.8 32.0 20.2 77.9 452.4 119.4 54.4 242.4 84.5
HEG 303.6 59.7 47.9 54.7 192.3 133.7 17.1 LP LP
Hindalco 10,399.6 15.4 6.4 1,295.5 12.0 12.9 447.7 2.0 54.6
Hindustan Zinc 5,442.5 54.4 18.9 2,967.4 42.9 24.5 2,423.0 27.4 29.2
JSW Steel 14,912.4 12.7 1.5 3,467.5 17.2 32.5 1,235.7 87.6 98.0
NMDC 2,488.0 43.1 -12.4 1,219.8 47.7 -18.4 864.5 12.2 -10.8
Vedanta Ltd 19,760.0 24.6 8.1 5,464.6 17.1 12.1 2,110.5 36.5 104.0
Tata Steel 32,468.6 23.1 9.9 5,772.6 94.4 16.1 2,099.4 LP 37.0
Total 104,537.1 20.9 5.1 23,348.6 51.3 10.8 12,562.6 90.3 36.7
Company Change (%) Change (%) Change (%)
Source: Company, ICICIdirect.com Research, Hindalco numbers are of Standalone entity
Topline & profitability (Coverage universe) 86
458
9916
6
1170
24
9944
6
104
537
0.0
5.0
10.0
15.0
20.0
25.0
0
25000
50000
75000
100000
125000
Q2F
Y17
Q3F
Y17
Q4F
Y17
Q1F
Y18
Q2F
Y18E
(%)
| C
rore
Revenue EBITDA Margin PAT Margin
Movement of base metal prices on LME (US$ per tonne)
Q2FY18 Q2FY17 YoY Q1FY18 QoQ
Zinc 2,961.9 2,252.6 31.5 2,591.4 14.3
Lead 2,331.2 1,873.2 24.4 2,156.1 8.1
Aluminium 2,010.1 1,620.1 24.1 1,905.4 5.5
Copper 6,351.4 4,778.3 32.9 5,667.8 12.1
Spot coking coal prices ($/tonne)
0
50
100
150
200
250
300
350
400
May
-15
Sep
-15
Jan-
16
May
-16
Sep
-16
Jan-
17
May
-17
Sep
-17
$ / t
onne
Source: Bloomberg, ICICIdirect.com Research
International iron ore prices ($/tonne)
0102030405060708090
100
Apr
-16
May
-16
Jun-
16
Jul-1
6
Aug
-16
Sep
-16
Oct
-16
Nov
-16
Dec
-16
Jan-
17
Feb-
17
Mar
-17
Apr
-17
May
-17
Jun-
17
Jul-1
7
Aug
-17
Sep
-17
$ / t
onne
Source: Bloomberg, ICICIdirect.com Research
Research Analyst
Dewang Sanghavi [email protected]
Akshay Kadam [email protected]

ICICI Securities Ltd. | Retail Equity Research
Page 51
Exhibit 27: Company specific view
Company Remarks
Coal India
Although a seasonally weak quarter, for Q2FY18, Coal India reported double
digit sales volume growth of 14% YoY. Coal offtake for the quarter was at 132
million tonne (MT) (vs. 115.9 MT in Q2FY17). For the quarter we expect e-
auction volumes to come in at 26.3 MT while e-auction realisations are
expected to increase 20.6% YoY and 2.5% QoQ to |1626/tonne. Coal India's
topline is likely to increase 13.1% YoY. We expect EBITDA margins to come
in at 16.5% (vs. 4.58% in Q2FY17 and 18.4% in Q1FY18). CIL is expected to
clock an EBITDA/tonne of | 230/tonne
Graphite India
Supply side restructuring led by China in the global graphite electrode market
has opened up substantial demand for domestic graphite electrode
manufacturers. The significant change in outlook is likely to have a positive
rub-off on the performance of the domestic graphite electrode players. We
expect GIL's domestic operations to report healthy capacity utilisation of 95%
for Q2FY18E (vs. 75% in Q2FY17 and 95% in Q1FY18). Subsequently, the
topline is likely to increase 32% YoY and 20% QoQ. For the quarter, the
company is expected to report an EBITDA margin of 18.5% (vs. 4.4% in
Q2FY17 and 10.1% in Q1FY18)
HEG
The global graphite electrode market has witnessed notable supply side
restructuring and concurrent improvement on the demand side. The
significant change in outlook is likely to have a positive rub-off on the
performance of domestic graphite electrode players. For Q2FY18E, we expect
HEG to report healthy capacity utilisation of 85% (vs. 65% in Q2FY17 and 70%
in Q1FY18). Subsequently, we expect the topline to increase 60% YoY and
48% QoQ. We expect EBITDA margins to improve 818 bps YoY and 662 bps
QoQ to 18%
Hindustan Zinc
For Q2FY18E, we expect HZL to report EBITDA margins of 54.5% primarily on
the back of strong volume growth and higher zinc prices YoY. The zinc sales
volume is likely to come in at 190000 tonne (up 28.4% YoY). We expect lead
volumes to come in at 40000 tonne (up 25% YoY) while silver volumes are
expected to come in higher at 130000 kg (up 20% YoY). We expect the
increased cost of production to impact profitability. Subsequently, the topline,
EBITDA and PAT is likely to increase 54%, 43% and 27% on a YoY basis,
respectively
JSW Steel
For Q2FY18E, we expect JSW Steel to report healthy EBITDA/tonne of |
9000/tonne for Q2FY18 on the back of increased steel prices domestically as
well as moderation in prices of key raw material i.e. coking coal. The sales
volume is to expected to come in at 3.8 million tonne (MT). We expect the
topline to increase 13% YoY while EBITDA margins are likely to increase 89
bps YoY and 545 bps QoQ to 23.3%
Hindalco
For Q2FY18E, we expect Hindalco's EBITDA margin to remain flattish YoY at
12.5% (Q2FY17: 12.8%). Hindalco's domestic operations are expected to
report aluminium sales of ~330000 tonne and copper sales of ~100000
tonne. On the back of higher metals prices YoY, we expect the topline to
increase 15% YoY. We expect Novelis to report shipments of ~803 kilo tonne
(KT) and an EBITDA/tonne of US$375/tonne
Source: ICICIdirect.com Research
Hindustan Zinc : Sales Volume Trend
Sales Unit Q2 Q3 Q4 Q1 Q2E
Zinc Tonne 148000 211000 217000 190000 190000
Lead Tonne 32000 36000 47000 34000 40000
Silver Kg 108000 117000 135000 110000 130000
FY17 FY18
Tata Steel :: EBITDTA/tonne & Sales
Sales Q2 Q3 Q4 Q1 Q2E
Tata Steel India 2.6 3.0 3.2 2.8 3.1
Tata Steel Europe 2.3 2.4 2.9 2.4 2.6
Tata Steel Group 5.7 6.1 6.8 5.8 6.4
EBITDA/tonne
Tata Steel India 7,297 11,285 13,470 10,786 13,500
Tata Steel Europe 67 38 104 80 85
FY18FY17
Sales volume in Million tonne, Indian EBITDA/tonne in |/tonne, while
European operations EBITDA/tonne in US$/tonne.
JSW Steel :: EBITDA/tonne & Sales
Q2 Q3 Q4 Q1 Q2E
Sales Volume 3.8 3.6 4.0 3.5 3.8
EBITDA/tonne 7,077 7,717 7,586 6,262 9,000
FY17 FY18
Sales volume in Million tonnes and EBITDA/tonne in |/tonne
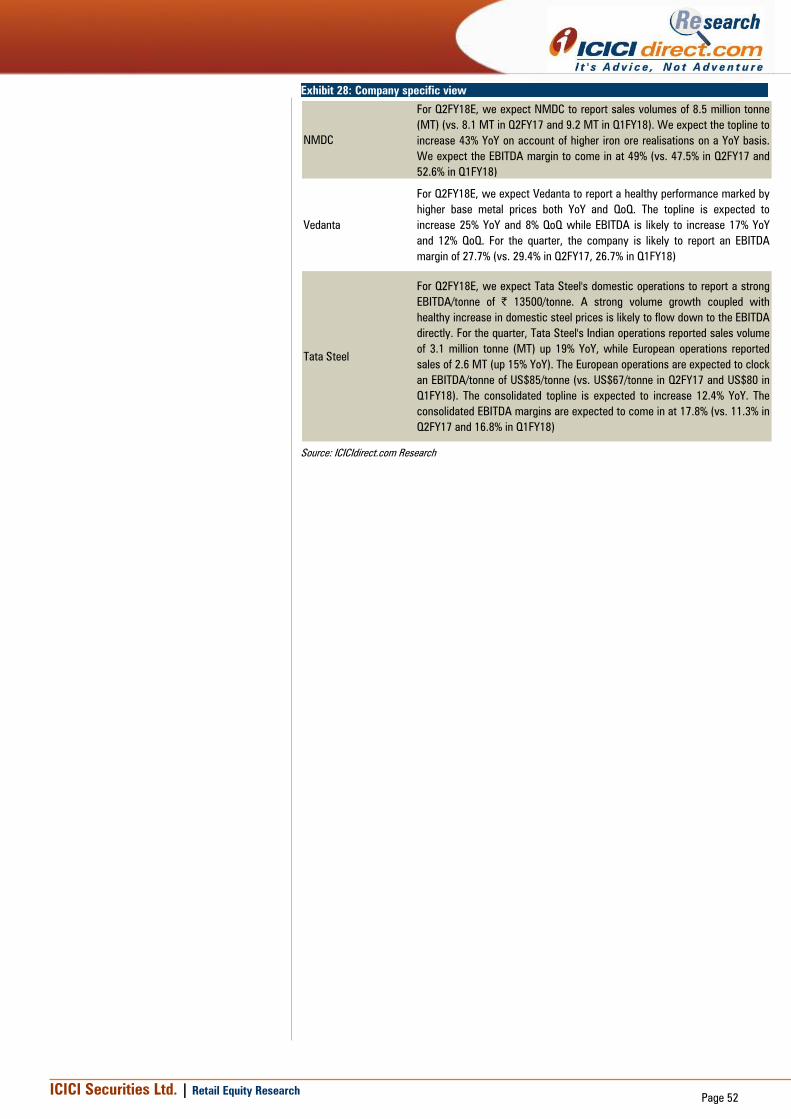
ICICI Securities Ltd. | Retail Equity Research
Page 52
Exhibit 28: Company specific view
NMDC
For Q2FY18E, we expect NMDC to report sales volumes of 8.5 million tonne
(MT) (vs. 8.1 MT in Q2FY17 and 9.2 MT in Q1FY18). We expect the topline to
increase 43% YoY on account of higher iron ore realisations on a YoY basis.
We expect the EBITDA margin to come in at 49% (vs. 47.5% in Q2FY17 and
52.6% in Q1FY18)
Vedanta
For Q2FY18E, we expect Vedanta to report a healthy performance marked by
higher base metal prices both YoY and QoQ. The topline is expected to
increase 25% YoY and 8% QoQ while EBITDA is likely to increase 17% YoY
and 12% QoQ. For the quarter, the company is likely to report an EBITDA
margin of 27.7% (vs. 29.4% in Q2FY17, 26.7% in Q1FY18)
Tata Steel
For Q2FY18E, we expect Tata Steel's domestic operations to report a strong
EBITDA/tonne of | 13500/tonne. A strong volume growth coupled with
healthy increase in domestic steel prices is likely to flow down to the EBITDA
directly. For the quarter, Tata Steel's Indian operations reported sales volume
of 3.1 million tonne (MT) up 19% YoY, while European operations reported
sales of 2.6 MT (up 15% YoY). The European operations are expected to clock
an EBITDA/tonne of US$85/tonne (vs. US$67/tonne in Q2FY17 and US$80 in
Q1FY18). The consolidated topline is expected to increase 12.4% YoY. The
consolidated EBITDA margins are expected to come in at 17.8% (vs. 11.3% in
Q2FY17 and 16.8% in Q1FY18)
Source: ICICIdirect.com Research

ICICI Securities Ltd. | Retail Equity Research
Page 53
Oil and gas
No clarity on GST implications for sector
Under GST, oil upstream companies, OMCs and gas utility companies
cannot claim input GST credit on procurement of machinery and
services as majority of the products are excluded from GST regime.
Hence, profitability of companies will have a notable negative impact,
going ahead. The Petroleum Ministry has made several propositions to
the Finance Ministry to bring petroleum products and natural gas under
GST regime. However, clarity on the same is still impending.
Strong product spreads, inventory gains to increase GRMs of OMCs
Singapore GRMs increased QoQ to US$8.3/bbl in Q2FY18 from
US$6.4/bbl in Q1FY18 supported by US refinery shutdowns and higher
product spreads. Crack spreads for gasoline (petrol) increased by
US$2/bbl QoQ to US$17.5/bbl while that of gas oil (diesel) also
increased by US$1.5/bbl QoQ to US$12/bbl. Hence, we expect GRMs of
oil marketing companies (OMCs) to increase QoQ with inventory gains
adding to it. We expect marketing volumes of industry to stay flattish
due to slower growth in products like (kerosene, naphtha, fuel oil).
US Hurricane Harvey pushes Brent crude prices up QoQ
The crude oil market during the quarter witnessed an easing out of the
supply glut in previous quarters on account of less production from US.
Hurricane Harvey in the last week of August weighed on US crude oil
production. Also, Opec countries that decided to extend the production
cut agreement till March 2018, reported better-than-expected
compliance to the agreement. The political instability in Kurdistan also
added to the possibility of supply and export disruptions. In effect,
average Brent oil prices increased 3.3% QoQ from US$50.1/bbl in
Q1FY18 to US$51.7/bbl in Q2FY18 with closing prices at the end of the
quarter at US$56.5/bbl. On account of the same, realisations of
upstream oil companies are expected to increase QoQ.
Gas utility companies to report stable performance QoQ
The quarter continued to see an increase in natural gas production and
imported LNG QoQ that will maintain volume growth for major gas
utility companies in Q2FY18E. City gas distribution companies may
continue to report steady volume growth due to sustainable conversion
to CNG vehicles and relatively stable spot LNG prices.
Exhibit 29: Estimates for Q2FY18E: (Oil and Gas) (| Crore)
Revenue EBITDA PAT
Q2FY18E YoY QoQ Q2FY18E YoY QoQ Q2FY18E YoY QoQ
Bharat Petroleum 67,215.3 22.4 0.7 3,231.7 134.0 163.8 1,985.4 52.1 166.7
Castrol India Ltd 829.3 8.9 -4.7 207.5 -2.5 -0.9 140.9 0.8 2.2
Gail India 12,541.9 4.0 8.4 1,798.2 17.2 -5.3 1,119.6 21.1 9.2
Gujarat Gas 1,498.7 21.2 1.4 261.7 23.0 -3.0 111.7 55.6 7.0
GSPL 316.5 22.7 6.8 286.0 26.5 3.6 156.9 20.9 2.9
Gulf Oil 300.3 9.5 7.2 49.6 13.2 0.6 32.7 8.4 -4.6
HPCL 62,314.4 30.3 3.9 2,934.7 132.7 80.3 1,601.9 128.4 73.2
Indraprastha Gas Ltd 1,107.8 14.6 5.6 270.5 10.4 -2.5 161.6 12.1 0.2
Mahanagar Gas Ltd 634.7 10.5 8.9 210.1 30.1 3.4 128.7 25.9 3.5
MRPL 14,913.4 6.6 2.9 1,164.5 48.3 99.8 638.2 53.5 172.7
ONGC 19,047.8 3.5 -0.1 9,903.3 2.7 0.2 4,391.4 -11.7 13.0
Petronet LNG 6,568.8 -0.7 2.1 763.5 5.1 2.6 447.8 -2.6 2.3
Total 187,288.9 17.1 2.4 21,081.3 20.6 22.2 10,916.7 7.3 37.0
Change (%)
Company
Change (%) Change (%)
Source: Company, ICICIdirect.com Research
Topline & Profitability (Coverage universe)
159904
180213
189069
182872
187289
0
40000
80000
120000
160000
200000
240000
280000
320000
Q2FY17
Q3FY17
Q4FY17
Q1FY18
Q2FY18E
| C
rore
0.0
2.0
4.0
6.0
8.0
10.0
12.0
14.0
(%
)
Revenue EBITDA Margin PAT Margin
Singapore gross refining margins (GRMs)
8.3
5.1
6.7 6.4 6.4
2
4
6
8
10
Q2FY17 Q3FY17 Q4FY17 Q1FY18 Q2FY18
Refinin
g m
argin
s (
US
$ p
er b
bl)
Average Brent crude oil prices
45.8
50.1
54.6
50.151.7
20
30
40
50
60
Q2FY17 Q3FY17 Q4FY17 Q1FY18 Q2FY18
US
$ p
er b
bl
Top pick of sector
Mahanagar Gas Ltd
MRPL
Research Analyst
Mayur Matani
Akshay Gavankar

ICICI Securities Ltd. | Retail Equity Research
Page 54
Exhibit 30: Company specific view
Company Remarks
BPCL Revenues are expected to increase marginally QoQ to | 67215.3 crore on account of
slower growth on the marketing front. We expect GRMs to increase QoQ to $9.2/bbl in
Q2FY18E from $4.9/bbl in Q1FY18 mainly due to inventory gains and strong spreads of
products like petrol and diesel. Subsequently, PAT is expected to increase 2.6x QoQ to
| 1985.4 crore
Castrol India Revenues are expected to increase 8.9% YoY mainly led by 5.5% YoY increase in net
realisation. Given the GST transition phase, we expect volumes to grow 3.6% YoY.
Gross margins are expected to increase marginally YoY to | 88.6/litre. However,
EBITDA per litre is expected to decline 5.9% YoY to | 43.7 /litre due to higher other
expenses resulting in marginal increase in PAT at | 140.5 crore
Gail We expect a stable performance in terms of profitability with growth of 9.2% QoQ in
Q2FY18E. In terms of gas transmission business, volumes are expected to increase
1.1% QoQ to 101 mmscmd with its EBIT increasing 1.6% QoQ to | 647.1 crore.
Although we expect petchem volumes to grow 45% QoQ, its EBIT may remain subdued
at | 27.3 crore given lower realisations. In LPG liquid hydrocarbon segment, we expect
EBIT to remain flat at QoQ at | 529 crore. However, higher other income QoQ will have
a positive impact on the overall profitability at | 1119.6 crore against | 1025.6 crore in
Q1FY18
GSPL We expect GSPL's gas transmission volumes at 28.5 mmscmd with growth of 6% QoQ
(15.8% YoY) due to better offtake from large industrial customer. Revenues are
expected to increase 6.8% QoQ (22.7% YoY) to | 316.5 crore with transmission tariffs
same as in Q1FY18 at | 1.2 per scm. Subsequently, PAT is expected to increase 2.9%
QoQ and 20.9% YoY to | 156.9 crore
Gujarat Gas Revenues are expected to increase 21.2% YoY on account of strong volume growth of
18.8% YoY at 6.1 mmscmd. However, on a QoQ basis, we expect volume demand to
remain flat in a GST transition phase. Gross margins are expected at | 7.3/scm (|
6.9/scm in Q2FY17) benefiting from regular price hike benefits. Lower tax rates may
lead to PAT growth of 55.6% YoY and 7% QoQ to | 111.7 crore
Gulf Oil
Lubricants
We expect revenues to increase 9.5% YoY mainly on account of higher realisations
YoY. Considering a gradual recovery from GST de-stocking during the quarter, core
volumes are expected to grow 8% YoY (core volume growth was at 7.5% YoY in
Q1FY18). EBITDA per litre is expected to increase by | 1/litre YoY to | 22.6/litre due to
lower other expenses. Subsequently, PAT is expected to increase 8% YoY to | 33 crore
Hindustan
Petroleum
Revenues are expected to increase 3.9% QoQ to | 62314.4 crore mainly due to slower
growth in marketing volumes. We expect refining margins to increase QoQ to $9.1/bbl
in Q2FY18E from $5.9/bbl in Q1FY18, mainly on account of inventory gains and strong
cracks of products like petrol and diesel. Subsequently, PAT is expected to 73.2% QoQ
to | 1601.9 crore
Indraprastha
Gas
We expect IGL's volumes to continue its growth momentum at 11.5% YoY due to
robust CNG vehicles conversions and efforts of the Delhi government for cleaner
environment. Total volumes are expected at ~5.1 mmscmd (CNG: 3.9 mmscmd, PNG:
1.2 mmscmd). We expect gross margins to remain strong YoY at | 10.8 per scm, up |
0.5 per scm led by pricing power and lower domestic gas prices. EBITDA per scm is
expected to remain flat YoY at | 5.8 per scm. On a QoQ basis, higher other expenses
may pull down EBITDA per scm by | 0.5 per scm from | 6.2/scm in Q1FY18. PAT is
expected to grow 12.1% YoY at | 161.6 crore
Source: ICICIdirect.com Research
Gross under-recoveries of petroleum products (QoQ)
37314297
7604
6319
5593
0
2000
4000
6000
8000
10000
Q2FY17 Q3FY17 Q4FY17 Q1FY18 Q2FY18
| C
rore
* Under-recoveries includes Cash Subsidy under DBTL
Gross under-recoveries of petroleum products (YoY)
763
276197 225
1399
0
400
800
1200
1600
2000
FY14
FY15
FY16
FY17
FY18E
| b
n
Gross under-recoveries
Singapore benchmark product spreads (US$/bbl)
Product Spreads Q2FY17 Q1FY18 Q2FY18 Chg YoY Chg QoQ
Gasoline 13 15.6 17.5 4.7 2.0
Naphtha -2 -1.4 -0.4 1.9 1.0
Jet Kerosene 11 10.8 12.9 2.2 2.1
Gas Oil 10 10.6 12.0 1.9 1.5
LSWR 4 4.3 -0.8 -5.2 -5.2
Fuel Oil -7 -4.1 -3.3 3.2 0.8
LPG -15 -13.4 -7.8 7.6 5.7
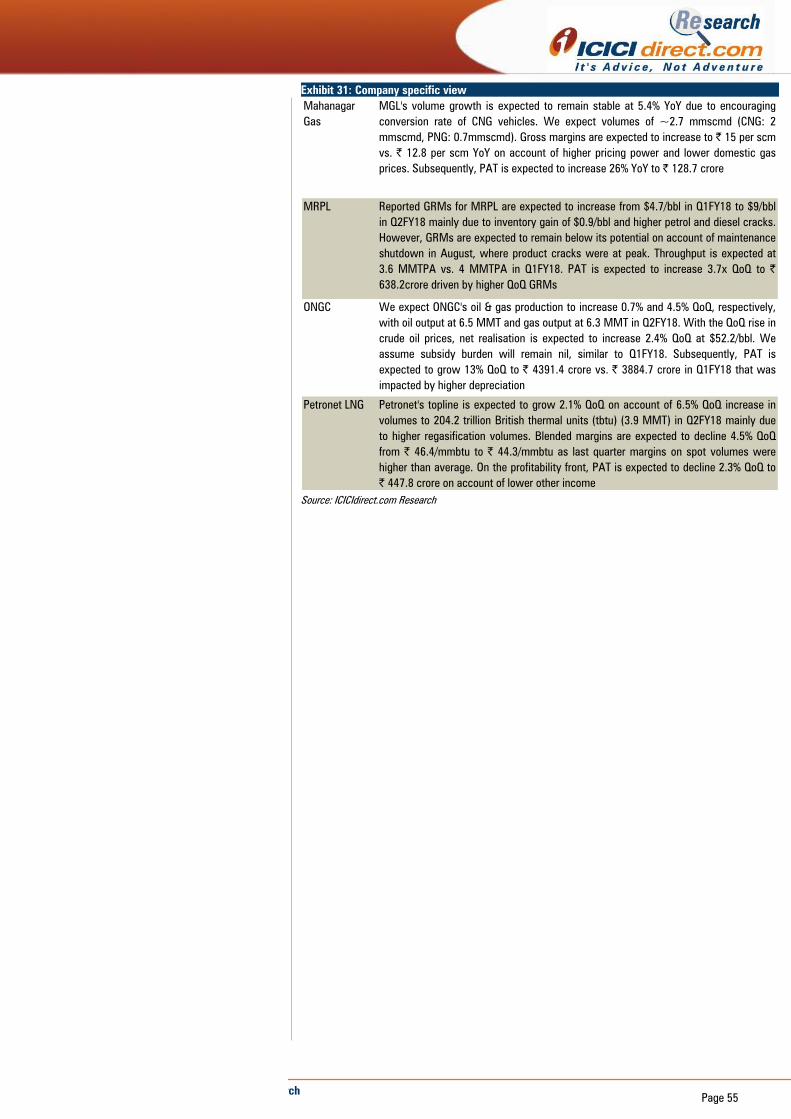
ICICI Securities Ltd. | Retail Equity Research
Page 55
Exhibit 31: Company specific view
Mahanagar
Gas
MGL's volume growth is expected to remain stable at 5.4% YoY due to encouraging
conversion rate of CNG vehicles. We expect volumes of ~2.7 mmscmd (CNG: 2
mmscmd, PNG: 0.7mmscmd). Gross margins are expected to increase to | 15 per scm
vs. | 12.8 per scm YoY on account of higher pricing power and lower domestic gas
prices. Subsequently, PAT is expected to increase 26% YoY to | 128.7 crore
MRPL Reported GRMs for MRPL are expected to increase from $4.7/bbl in Q1FY18 to $9/bbl
in Q2FY18 mainly due to inventory gain of $0.9/bbl and higher petrol and diesel cracks.
However, GRMs are expected to remain below its potential on account of maintenance
shutdown in August, where product cracks were at peak. Throughput is expected at
3.6 MMTPA vs. 4 MMTPA in Q1FY18. PAT is expected to increase 3.7x QoQ to |
638.2crore driven by higher QoQ GRMs
ONGC We expect ONGC's oil & gas production to increase 0.7% and 4.5% QoQ, respectively,
with oil output at 6.5 MMT and gas output at 6.3 MMT in Q2FY18. With the QoQ rise in
crude oil prices, net realisation is expected to increase 2.4% QoQ at $52.2/bbl. We
assume subsidy burden will remain nil, similar to Q1FY18. Subsequently, PAT is
expected to grow 13% QoQ to | 4391.4 crore vs. | 3884.7 crore in Q1FY18 that was
impacted by higher depreciation
Petronet LNG Petronet's topline is expected to grow 2.1% QoQ on account of 6.5% QoQ increase in
volumes to 204.2 trillion British thermal units (tbtu) (3.9 MMT) in Q2FY18 mainly due
to higher regasification volumes. Blended margins are expected to decline 4.5% QoQ
from | 46.4/mmbtu to | 44.3/mmbtu as last quarter margins on spot volumes were
higher than average. On the profitability front, PAT is expected to decline 2.3% QoQ to
| 447.8 crore on account of lower other income
Source: ICICIdirect.com Research

ICICI Securities Ltd. | Retail Equity Research
Page 56
Power
Share of renewable at 18% as of August 2017
The total installed capacity as of August 2017 was at 329226 MW. The
share of renewable has inched up to 18% of overall capacity. The
renewable capacity installed was at 58303 MW, which is clearly ahead of
the installed hydro capacity at 44653 MW. In the interim, on account of
revision of solar PPAs by various SEBs, solar capacity addition has
moderated. However, with developers settling with demands of SEBs,
we expect a gradual pick-up by H2FY18. On the whole, we expect 8000-
10000 MW of solar capacity to be added in FY18E. As of August 2017,
cumulative solar and wind capacity was at 13184 MW and 32634 MW,
respectively. On the conventional side, no capacity addition has been
reported in Q2FY18E so far.
Power generation up 4.6% in YTDFY18
Overall, power generation during April-August 2017 is up 4.6% YoY
while in August 2017, the same was up 7.9% YoY. In terms of segment
(YTD) basis, thermal generation is up 5% YoY while hydro has seen
moderate growth of 5.8% YoY albeit peak season. On the other hand,
renewable segment witnessed 30.2% YoY growth in generation during
April-July 2017, mainly on the back of strong capacity addition in FY17.
Base and peak deficit was at 0.6% and 1.5% in August 2017,
respectively. On an all-India level, PLFs for August 2017 were up 100 bps
at 55%. On a segmental basis, central level utilities saw higher than
average PLFs at 70% while that of state, private IPPs meaningfully
improved to 64%, 55%, respectively.
Merchant prices shoots up in September 2017
Power prices in the spot market recently witnessed a sharp rise, jumping
from | 3.12/kwhr in August 2017 and | 4.11/kwh in early September 2017
to | 9.91/kwh during the last two weeks of September. States started to
rely more on the spot market for short-term power supply instead of
signing PPAs to bring down their costs. The sudden surge in demand
coupled with wind power shortage, maintenance of nuclear plants, fall in
hydro electricity generation, scanty rain and soaring temperature led to a
spike in price.
Performance to come across coverage universe
On the whole, we expect the power coverage universe to report a strong
set of Q2FY18E results as revenues and PAT is expected to grow 7.2%
and 14.8% YoY, respectively, on the back of strong generation and asset
capitalisation trends. In terms of individual performance, Power Grid is
expected to continue to witness a robust operational performance as it is
likely to capitalise assets to the tune of | 7000-8000 crore in Q2FY18E
coupled with 21.6% and 24.1% YoY growth in revenues and PAT,
respectively. During Q2FY18E, NTPC has commercialised assets to the
tune of 2600 MW, which coupled with improvement in PLFs will lead to
generation growth of 7.2% YoY. PAT is also expected to grow 6.3%.
CESC is also expected to witness 10% YoY growth in energy sold. We
have built in revenue and PAT growth of 9.2% and 19.8% YoY,
respectively.
Topline & Profitability (Coverage universe)
27367
27646
28701
29363
29342
0
5000
10000
15000
20000
25000
30000
Q2FY17
Q3FY17
Q4FY17
Q1FY18
Q2FY18E
| C
rore
0.0
5.0
10.0
15.0
20.0
25.0
30.0
35.0
40.0
45.0
50.0
(%
)
Revenue EBITDA Margin PAT Margin
Trend in all India sectoral PLF
66
41
49
54
70
55 5564
0
10
20
30
40
50
60
70
80
Central State Private All India
Aug-16 Aug-17
Segment wise break up of total installed capacity
RES
18%
Hydro
14%
Nuclear
2%
Thermal
66%
Data as on August 2017
Top pick of sector
Power Grid
Research Analyst
Chirag Shah
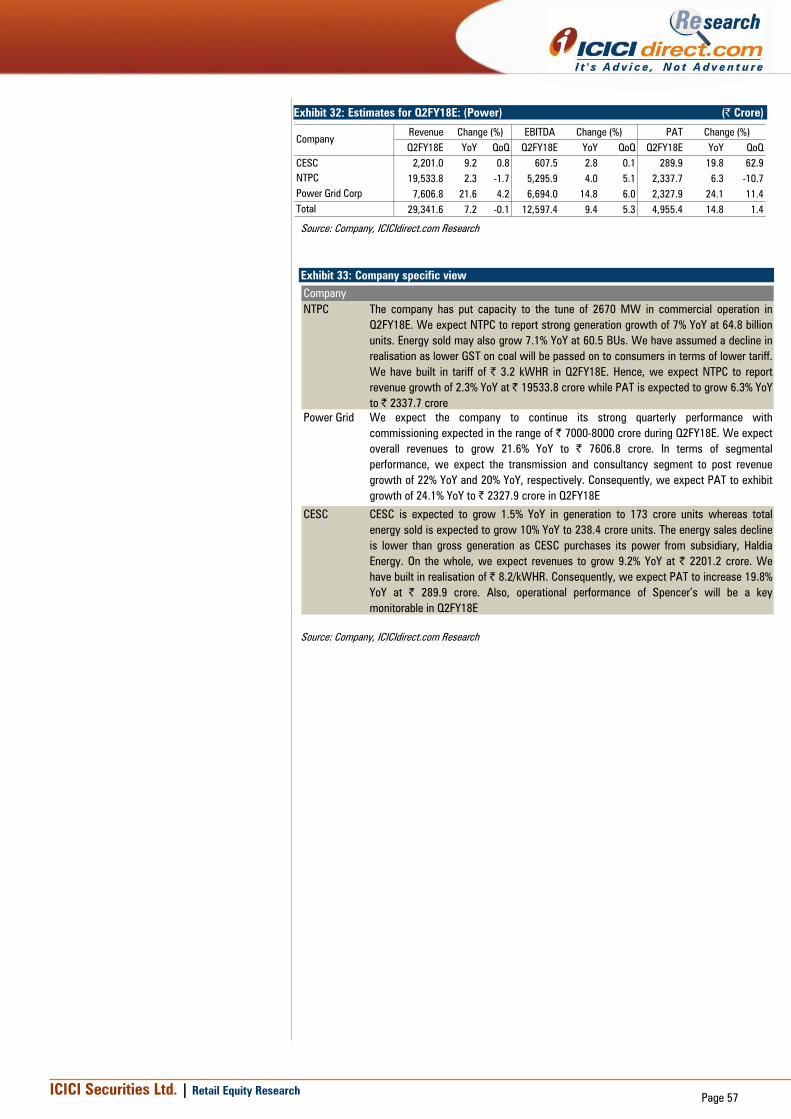
ICICI Securities Ltd. | Retail Equity Research
Page 57
Exhibit 33: Company specific view
Company
NTPC The company has put capacity to the tune of 2670 MW in commercial operation in
Q2FY18E. We expect NTPC to report strong generation growth of 7% YoY at 64.8 billion
units. Energy sold may also grow 7.1% YoY at 60.5 BUs. We have assumed a decline in
realisation as lower GST on coal will be passed on to consumers in terms of lower tariff.
We have built in tariff of | 3.2 kWHR in Q2FY18E. Hence, we expect NTPC to report
revenue growth of 2.3% YoY at | 19533.8 crore while PAT is expected to grow 6.3% YoY
to | 2337.7 crore
Power Grid We expect the company to continue its strong quarterly performance with
commissioning expected in the range of | 7000-8000 crore during Q2FY18E. We expect
overall revenues to grow 21.6% YoY to | 7606.8 crore. In terms of segmental
performance, we expect the transmission and consultancy segment to post revenue
growth of 22% YoY and 20% YoY, respectively. Consequently, we expect PAT to exhibit
growth of 24.1% YoY to | 2327.9 crore in Q2FY18E
CESC CESC is expected to grow 1.5% YoY in generation to 173 crore units whereas total
energy sold is expected to grow 10% YoY to 238.4 crore units. The energy sales decline
is lower than gross generation as CESC purchases its power from subsidiary, Haldia
Energy. On the whole, we expect revenues to grow 9.2% YoY at | 2201.2 crore. We
have built in realisation of | 8.2/kWHR. Consequently, we expect PAT to increase 19.8%
YoY at | 289.9 crore. Also, operational performance of Spencer’s will be a key
monitorable in Q2FY18E
Source: Company, ICICIdirect.com Research
Exhibit 32: Estimates for Q2FY18E: (Power) (| Crore) es
Revenue EBITDA PAT
Q2FY18E YoY QoQ Q2FY18E YoY QoQ Q2FY18E YoY QoQ
CESC 2,201.0 9.2 0.8 607.5 2.8 0.1 289.9 19.8 62.9
NTPC 19,533.8 2.3 -1.7 5,295.9 4.0 5.1 2,337.7 6.3 -10.7
Power Grid Corp 7,606.8 21.6 4.2 6,694.0 14.8 6.0 2,327.9 24.1 11.4
Total 29,341.6 7.2 -0.1 12,597.4 9.4 5.3 4,955.4 14.8 1.4
Company
Change (%) Change (%)Change (%)
Source: Company, ICICIdirect.com Research

ICICI Securities Ltd. | Retail Equity Research
Page 58
Real Estate
RERA, GST keeps sales and new launches under pressure…
The demand scenario continues to remain weak in the real estate
sector as a Prop Equity report suggested that housing sales across
top 8 markets have slipped 35% sequentially to 22,699 units in
Q3CY17. Also, new launches have slumped 83% sequentially to
4,313 units amid RERA and GST implementation. Consequently, the
unsold inventory dipped 4% QoQ to 4,46,730 units. However, we
believe, over the long term, RERA would bring back consumer
confidence and also lead to a consolidation in the sector which is
beneficial for organised players.
Office space absorption set to be stable in 2017…
A Cushman & Wakefield report indicates that office space absorption
is set to be stable on the back of corporate commitments. Net
absorption until September, 2017 has been recorded at ~18 msf led
by Bangalore, which registered highest volume of 4.8 msf. Office
space absorption is not only strong but pre-leasing is also at all-time
high, which is indication of sustained demand and occupiers' interest
in commercial spaces. Even, commercial office space vacancy has
almost halved in last 6 years. This gives us sense that commercial
space is recovering & lease rates can firm up in coming years.
Private players to boost affordable housing via new PPP models…
The central government has paved the way for private developers to
provide low cost housing. Ministry of Housing and Urban Poverty
Alleviation has framed a public private partnership policy for
affordable housing to give a much-needed fillip to the Prime Minister
Awas Yojana. Six PPP models have been identified in policy, which
differ on aspects like land ownership, private developer’s risk and
maintenance of houses. We believe this could hasten the
construction of affordable homes in urban areas as well.
Sales volumes of real estate universe to remain subdued…
We expect sales volumes of our universe to remain under pressure
amid RERA transition & GST implementation. Hence, we expect it to
post sales volume of 4.2 lakh sq ft in Q2FY18E. However, given low
interest rate regime & improved consumer sentiment amid festive
season, we expect a recovery in sales volumes H2FY18E onwards.
Topline of real estate coverage universe to grow 52.9% YoY...
Real estate universe revenues are expected to grow significantly by
52.9% YoY to | 747.9 crore on account of robust topline growth of
Sunteck Realty of 167.7% YoY to | 380.4 crore as its Avenue project
is expected to hit revenue recognition threshold. The universe is
expected to post EBITDA margins of 40.3%. However, we expect
our universe’s PAT to decline 1.8% YoY to | 190.2 crore due to 3.9%
de-growth in Sunteck’s PAT to | 93.4 crore.
Exhibit 34: Estimates for Q2FY18E (Real Estate) (| crore)
Revenue EBITDA PAT
Q2FY18E YoY QoQ Q2FY18E YoY QoQ Q2FY18E YoY QoQ
Oberoi Realty 260.8 3.5 0.0 130.4 3.6 -3.8 87.8 4.9 -3.9
Mahindra Lifespace 106.7 12.3 -2.3 12.0 106.9 3.2 8.9 -30.0 -16.3
Sunteck Realty 380.4 167.7 185.2 70.7 -44.0 0.0 93.4 -3.9 135.6
Total 747.9 52.9 48.6 213.1 -17.4 -2.2 190.2 -1.8 34.2
Company
Change (%) Change (%) Change (%)
Source: Company, ICICIdirect.com Research
Topline & Profitability (Coverage universe)
311
949
336
409
390
0
250
500
750
1000
Q2FY16
Q3FY16
Q4FY16
Q1FY17
Q2FY17E
| C
rore
20.0
25.0
30.0
35.0
40.0
45.0
(%
)
Revenue EBITDA Margin PAT Margin
311
949
336
409
390
0
100
200
300
400
500
600
700
800
900
1000
Q2FY16 Q3FY16 Q4FY16 Q1FY17 Q2FY17E
(| crore)
Sales Volume Trend (Coverage Universe)
5.1
2.1
2.1
2.7
2.5
3.2
1.1 1
.4
1.0
1.1
1.7
0.2
0.9
0.4 0.6
0.0
1.0
2.0
3.0
4.0
5.0
6.0
H1FY17 Q3FY17 Q4FY17 Q1FY18 Q2FY18E
(la
kh s
q f
t)
Mahindra Lifespace
Oberoi Realty
Sunteck Realty
Research Analyst
Deepak Purswani, CFA
Vaibhav Shah
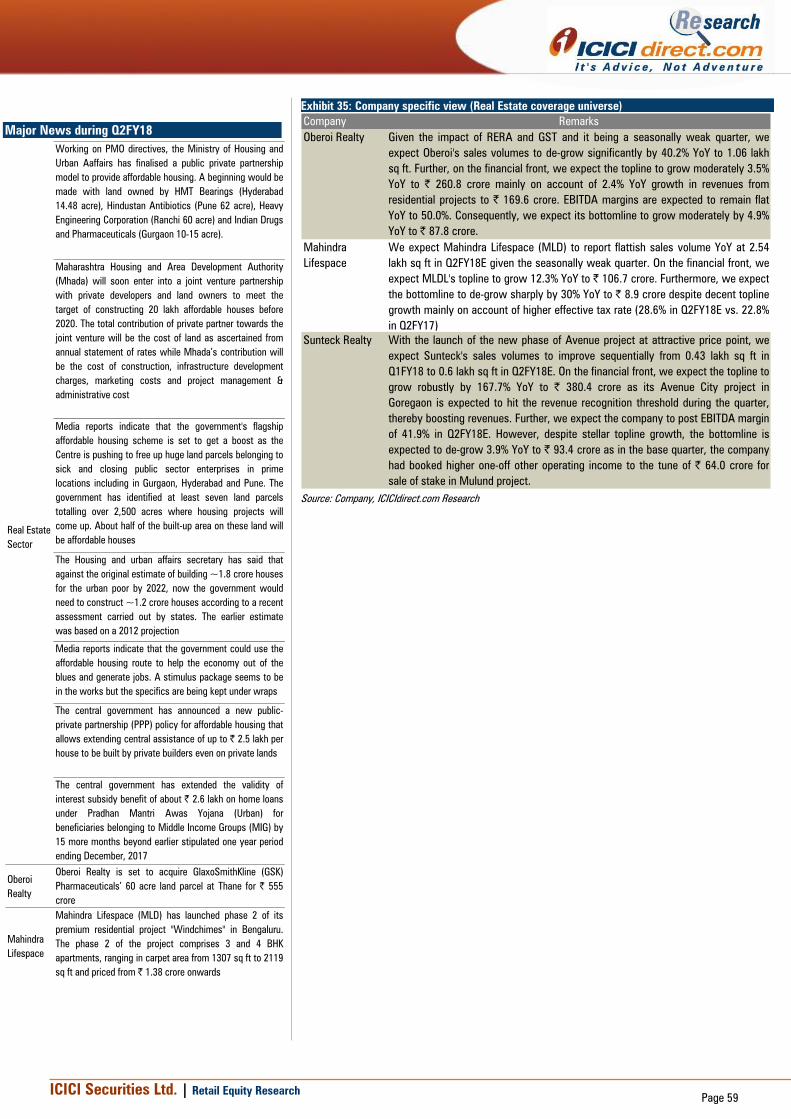
ICICI Securities Ltd. | Retail Equity Research
Page 59
Exhibit 35: Company specific view (Real Estate coverage universe)
Company Remarks
Oberoi Realty Given the impact of RERA and GST and it being a seasonally weak quarter, we
expect Oberoi's sales volumes to de-grow significantly by 40.2% YoY to 1.06 lakh
sq ft. Further, on the financial front, we expect the topline to grow moderately 3.5%
YoY to | 260.8 crore mainly on account of 2.4% YoY growth in revenues from
residential projects to | 169.6 crore. EBITDA margins are expected to remain flat
YoY to 50.0%. Consequently, we expect its bottomline to grow moderately by 4.9%
YoY to | 87.8 crore.
Mahindra
Lifespace
We expect Mahindra Lifespace (MLD) to report flattish sales volume YoY at 2.54
lakh sq ft in Q2FY18E given the seasonally weak quarter. On the financial front, we
expect MLDL's topline to grow 12.3% YoY to | 106.7 crore. Furthermore, we expect
the bottomline to de-grow sharply by 30% YoY to | 8.9 crore despite decent topline
growth mainly on account of higher effective tax rate (28.6% in Q2FY18E vs. 22.8%
in Q2FY17)
Sunteck Realty With the launch of the new phase of Avenue project at attractive price point, we
expect Sunteck's sales volumes to improve sequentially from 0.43 lakh sq ft in
Q1FY18 to 0.6 lakh sq ft in Q2FY18E. On the financial front, we expect the topline to
grow robustly by 167.7% YoY to | 380.4 crore as its Avenue City project in
Goregaon is expected to hit the revenue recognition threshold during the quarter,
thereby boosting revenues. Further, we expect the company to post EBITDA margin
of 41.9% in Q2FY18E. However, despite stellar topline growth, the bottomline is
expected to de-grow 3.9% YoY to | 93.4 crore as in the base quarter, the company
had booked higher one-off other operating income to the tune of | 64.0 crore for
sale of stake in Mulund project.
Source: Company, ICICIdirect.com Research
Major News during Q2FY18
Working on PMO directives, the Ministry of Housing and
Urban Aaffairs has finalised a public private partnership
model to provide affordable housing. A beginning would be
made with land owned by HMT Bearings (Hyderabad
14.48 acre), Hindustan Antibiotics (Pune 62 acre), Heavy
Engineering Corporation (Ranchi 60 acre) and Indian Drugs
and Pharmaceuticals (Gurgaon 10-15 acre).
Maharashtra Housing and Area Development Authority
(Mhada) will soon enter into a joint venture partnership
with private developers and land owners to meet the
target of constructing 20 lakh affordable houses before
2020. The total contribution of private partner towards the
joint venture will be the cost of land as ascertained from
annual statement of rates while Mhada’s contribution will
be the cost of construction, infrastructure development
charges, marketing costs and project management &
administrative cost
Real Estate
Sector
Media reports indicate that the government's flagship
affordable housing scheme is set to get a boost as the
Centre is pushing to free up huge land parcels belonging to
sick and closing public sector enterprises in prime
locations including in Gurgaon, Hyderabad and Pune. The
government has identified at least seven land parcels
totalling over 2,500 acres where housing projects will
come up. About half of the built-up area on these land will
be affordable houses
The Housing and urban affairs secretary has said that
against the original estimate of building ~1.8 crore houses
for the urban poor by 2022, now the government would
need to construct ~1.2 crore houses according to a recent
assessment carried out by states. The earlier estimate
was based on a 2012 projection
Media reports indicate that the government could use the
affordable housing route to help the economy out of the
blues and generate jobs. A stimulus package seems to be
in the works but the specifics are being kept under wraps
The central government has announced a new public-
private partnership (PPP) policy for affordable housing that
allows extending central assistance of up to | 2.5 lakh per
house to be built by private builders even on private lands
The central government has extended the validity of
interest subsidy benefit of about | 2.6 lakh on home loans
under Pradhan Mantri Awas Yojana (Urban) for
beneficiaries belonging to Middle Income Groups (MIG) by
15 more months beyond earlier stipulated one year period
ending December, 2017
Oberoi
Realty
Oberoi Realty is set to acquire GlaxoSmithKline (GSK)
Pharmaceuticals’ 60 acre land parcel at Thane for | 555
crore
Mahindra
Lifespace
Mahindra Lifespace (MLD) has launched phase 2 of its
premium residential project "Windchimes" in Bengaluru.
The phase 2 of the project comprises 3 and 4 BHK
apartments, ranging in carpet area from 1307 sq ft to 2119
sq ft and priced from | 1.38 crore onwards
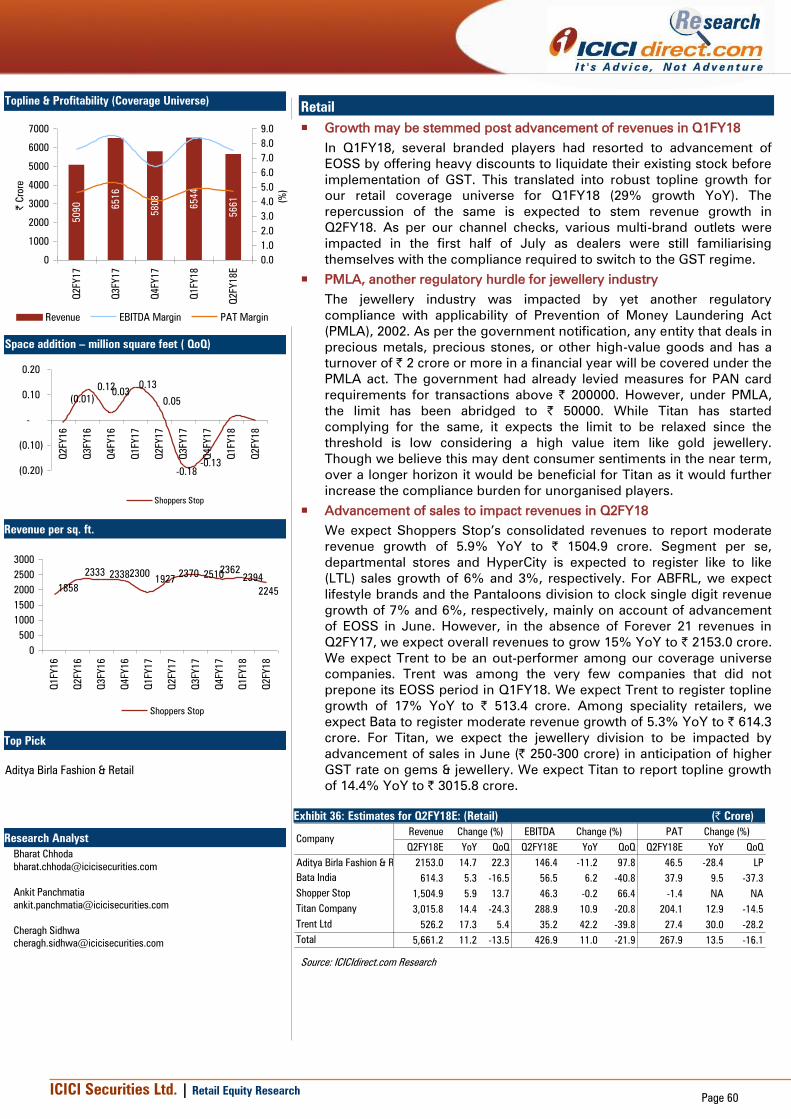
ICICI Securities Ltd. | Retail Equity Research
Page 60
Retail
Growth may be stemmed post advancement of revenues in Q1FY18
In Q1FY18, several branded players had resorted to advancement of
EOSS by offering heavy discounts to liquidate their existing stock before
implementation of GST. This translated into robust topline growth for
our retail coverage universe for Q1FY18 (29% growth YoY). The
repercussion of the same is expected to stem revenue growth in
Q2FY18. As per our channel checks, various multi-brand outlets were
impacted in the first half of July as dealers were still familiarising
themselves with the compliance required to switch to the GST regime.
PMLA, another regulatory hurdle for jewellery industry
The jewellery industry was impacted by yet another regulatory
compliance with applicability of Prevention of Money Laundering Act
(PMLA), 2002. As per the government notification, any entity that deals in
precious metals, precious stones, or other high-value goods and has a
turnover of | 2 crore or more in a financial year will be covered under the
PMLA act. The government had already levied measures for PAN card
requirements for transactions above | 200000. However, under PMLA,
the limit has been abridged to | 50000. While Titan has started
complying for the same, it expects the limit to be relaxed since the
threshold is low considering a high value item like gold jewellery.
Though we believe this may dent consumer sentiments in the near term,
over a longer horizon it would be beneficial for Titan as it would further
increase the compliance burden for unorganised players.
Advancement of sales to impact revenues in Q2FY18
We expect Shoppers Stop’s consolidated revenues to report moderate
revenue growth of 5.9% YoY to | 1504.9 crore. Segment per se,
departmental stores and HyperCity is expected to register like to like
(LTL) sales growth of 6% and 3%, respectively. For ABFRL, we expect
lifestyle brands and the Pantaloons division to clock single digit revenue
growth of 7% and 6%, respectively, mainly on account of advancement
of EOSS in June. However, in the absence of Forever 21 revenues in
Q2FY17, we expect overall revenues to grow 15% YoY to | 2153.0 crore.
We expect Trent to be an out-performer among our coverage universe
companies. Trent was among the very few companies that did not
prepone its EOSS period in Q1FY18. We expect Trent to register topline
growth of 17% YoY to | 513.4 crore. Among speciality retailers, we
expect Bata to register moderate revenue growth of 5.3% YoY to | 614.3
crore. For Titan, we expect the jewellery division to be impacted by
advancement of sales in June (| 250-300 crore) in anticipation of higher
GST rate on gems & jewellery. We expect Titan to report topline growth
of 14.4% YoY to | 3015.8 crore.
Exhibit 36: Estimates for Q2FY18E: (Retail) (| Crore)
Revenue EBITDA PAT
Q2FY18E YoY QoQ Q2FY18E YoY QoQ Q2FY18E YoY QoQ
Aditya Birla Fashion & Retail 2153.0 14.7 22.3 146.4 -11.2 97.8 46.5 -28.4 LP
Bata India 614.3 5.3 -16.5 56.5 6.2 -40.8 37.9 9.5 -37.3
Shopper Stop 1,504.9 5.9 13.7 46.3 -0.2 66.4 -1.4 NA NA
Titan Company 3,015.8 14.4 -24.3 288.9 10.9 -20.8 204.1 12.9 -14.5
Trent Ltd 526.2 17.3 5.4 35.2 42.2 -39.8 27.4 30.0 -28.2
Total 5,661.2 11.2 -13.5 426.9 11.0 -21.9 267.9 13.5 -16.1
Change (%)
Company
Change (%) Change (%)
Source: ICICIdirect.com Research
Topline & Profitability (Coverage Universe)
5090 6516
5808
6544
5661
0
1000
2000
3000
4000
5000
6000
7000
Q2FY17
Q3FY17
Q4FY17
Q1FY18
Q2FY18E
| C
rore
0.0
1.0
2.0
3.0
4.0
5.0
6.0
7.0
8.0
9.0
(%
)
Revenue EBITDA Margin PAT Margin
Space addition – million square feet ( QoQ)
(0.01)
0.120.03
0.13
0.05
-0.18
-0.13
(0.20)
(0.10)
-
0.10
0.20
Q2FY16
Q3FY16
Q4FY16
Q1FY17
Q2FY17
Q3FY17
Q4FY17
Q1FY18
Q2FY18
Shoppers Stop
Revenue per sq. ft.
2510
1858
2333 233823001927
23702362
2394
2245
0
500
1000
1500
2000
2500
3000
Q1FY16
Q2FY16
Q3FY16
Q4FY16
Q1FY17
Q2FY17
Q3FY17
Q4FY17
Q1FY18
Q2FY18
Shoppers Stop
Top Pick
Aditya Birla Fashion & Retail
Research Analyst
Bharat Chhoda
Ankit Panchmatia
Cheragh Sidhwa
ICICI Securities Ltd. | Retail Equity Research
Page 61
Negative operating leverage to impact EBITDA margins
With muted overall revenue growth anticipated this quarter, we expect
margins to remain suppressed owing to negative operating leverage
(higher employee and rental expense). The EBITDA margins for
Shoppers Stop, ABFRL and Titan are expected to contract 20 bps, 200
bps and 32 bps, respectively. In case of Trent, Q2 generally witnesses
lower EBITDA margins mainly on account of high discount offering
impacting gross margins negatively. On a YoY basis, we expect Trent’s
EBITDA margins to improve 120 bps YoY to 6.7% but decline 500 bps on
a sequential basis.
Space addition expected to pick up from H2FY18
In Q2FY18, Titan’s jewellery division added four Tanishq stores (7500 sq
ft), while the watches segment opened three World of Titan stores, five
Fastrack and eight Helios stores (8500 sq ft). The eyewear division added
10 Titan Eye plus stores (5000 sq ft) in Q2FY18. With the upcoming
buoyant festive season, the management intends to open stores more
aggressively in H2FY18. For Shoppers Stop, the number of departmental
store was at 80 with no addition on a net basis this quarter. However,
with Amazon’s equity infusion (| 179.3 crore), the company expects to
add five departmental stores in FY18.
ICICI Securities Ltd. | Retail Equity Research
Page 62
Exhibit 37: Company specific view (Retail)
Company Remarks
Bata India We expect Bata to register decent revenue growth of 5.3% YoY to | 614.3 crore.
Disruptions at the dealer level for the first half of July are expected to impact the
performance this quarter. We expect gross margins to improve 50 bps on the back of an
improved product mix. However, higher operating expense and subdued topline growth
will result in negative operating leveraging leading to flattish EBITDA margins at 9.2%. We
expect bottomline to grow 9.5% YoY to | 37.9 crore
Shoppers
Stop
We expect Shoppers Stop to report moderate consolidated revenue growth of 5.9% YoY to
| 1504.9 crore. In the segment per se, departmental stores and HyperCity are expected to
register like-to-like (LTL) sales growth of 6% and 3%, respectively. Advancement of EOSS
in Q1FY18 and supply side challenges post GST are key factors to have stemmed revenue
growth this quarter. We expect consolidated EBITDA margins to decline 20 bps YoY to
3.1%, with EBITDA remaining flattish at | 46.3 crore. Subsequently, consolidated net loss
is expected to widen to | 1.4 crore vs. | 0.3 crore in Q2FY17
Titan
Company
Traditionally, the July-September quarter is considered to be weak due to lack of festive
season and certain inauspicious period. Despite activation of studded jewellery, the
company received a tepid response mainly on account of advancement of sales in June (|
250-300 crore) in anticipation of a higher GST rate. We expect Titan to register revenue
growth of 14.4% YoY to | 3015.8 crore with jewellery division reporting topline growth of
14% YoY. We expect EBITDA margins to decline 32 bps YoY to 9.6% due to lower share of
studded jewellery. On account of absence of exceptional expense (VRS scheme to the
tune of | 3 crore), we expect PAT to register growth of 12.9% YoY to | 204.1 crore
Trent Ltd Trent was one of the very few companies, which did not prepone its EOSS period in June.
We expect Trent to report healthy topline growth of 17% YoY to | 513.4 crore. Q2
generally witnesses lower EBITDA margins mainly on account of high discount offering
impacting the gross margins negatively. On a YoY basis, we expect EBITDA margins to
improve 120 bps YoY to 6.7%. However, it is down 500 bps on a sequential basis. PAT is
expected to increase 30% YoY to | 27.4 crore
ABFRL In the segment per se, we expect lifestyle brands and Pantaloons to clock single digit
revenue growth of 7% and 6%, respectively, mainly on account of advancement of EOSS in
June. However, in the absence of Fast fashion revenues (Forever 21) in Q2FY17, we
expect overall revenues to grow 15% YoY to | 2153.0 crore. EBITDA margins are expected
to decline 200 bps YoY to 6.8%. PAT is expected to decline 28% YoY to | 46.5 crore
Source: Company, ICICIdirect.com Research
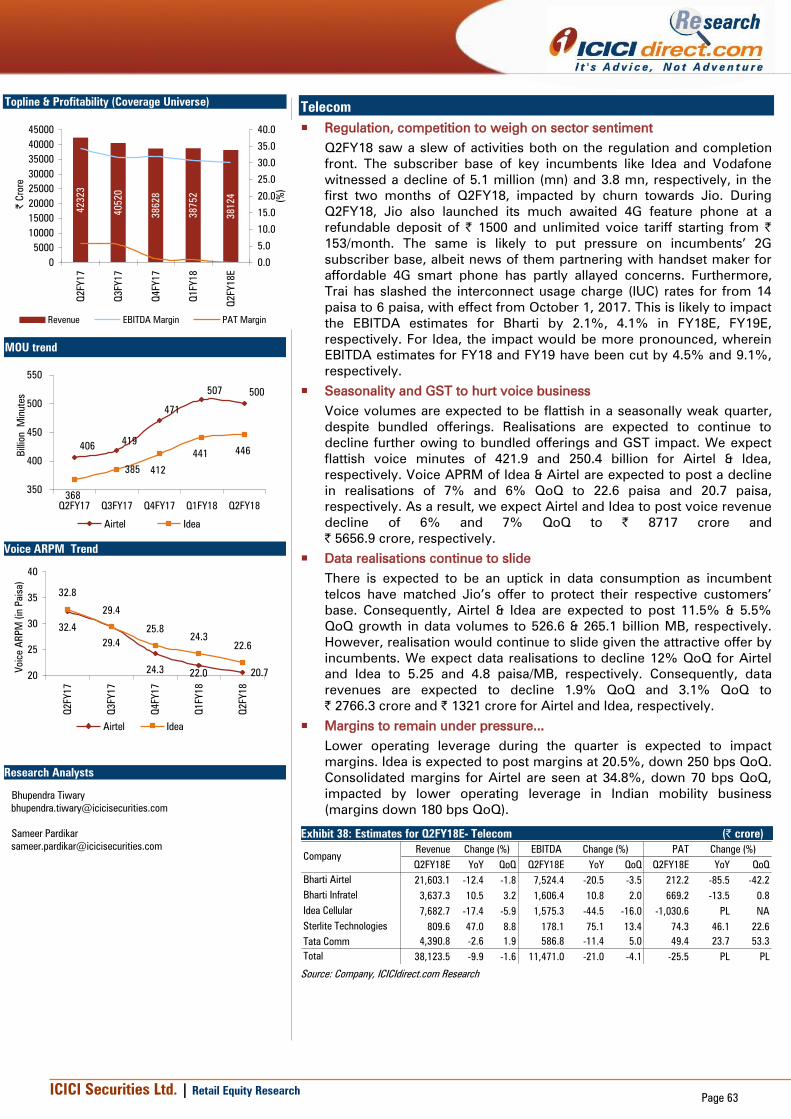
ICICI Securities Ltd. | Retail Equity Research
Page 63
Telecom
Regulation, competition to weigh on sector sentiment
Q2FY18 saw a slew of activities both on the regulation and completion
front. The subscriber base of key incumbents like Idea and Vodafone
witnessed a decline of 5.1 million (mn) and 3.8 mn, respectively, in the
first two months of Q2FY18, impacted by churn towards Jio. During
Q2FY18, Jio also launched its much awaited 4G feature phone at a
refundable deposit of | 1500 and unlimited voice tariff starting from |
153/month. The same is likely to put pressure on incumbents’ 2G
subscriber base, albeit news of them partnering with handset maker for
affordable 4G smart phone has partly allayed concerns. Furthermore,
Trai has slashed the interconnect usage charge (IUC) rates for from 14
paisa to 6 paisa, with effect from October 1, 2017. This is likely to impact
the EBITDA estimates for Bharti by 2.1%, 4.1% in FY18E, FY19E,
respectively. For Idea, the impact would be more pronounced, wherein
EBITDA estimates for FY18 and FY19 have been cut by 4.5% and 9.1%,
respectively.
Seasonality and GST to hurt voice business
Voice volumes are expected to be flattish in a seasonally weak quarter,
despite bundled offerings. Realisations are expected to continue to
decline further owing to bundled offerings and GST impact. We expect
flattish voice minutes of 421.9 and 250.4 billion for Airtel & Idea,
respectively. Voice APRM of Idea & Airtel are expected to post a decline
in realisations of 7% and 6% QoQ to 22.6 paisa and 20.7 paisa,
respectively. As a result, we expect Airtel and Idea to post voice revenue
decline of 6% and 7% QoQ to | 8717 crore and
| 5656.9 crore, respectively.
Data realisations continue to slide
There is expected to be an uptick in data consumption as incumbent
telcos have matched Jio’s offer to protect their respective customers’
base. Consequently, Airtel & Idea are expected to post 11.5% & 5.5%
QoQ growth in data volumes to 526.6 & 265.1 billion MB, respectively.
However, realisation would continue to slide given the attractive offer by
incumbents. We expect data realisations to decline 12% QoQ for Airtel
and Idea to 5.25 and 4.8 paisa/MB, respectively. Consequently, data
revenues are expected to decline 1.9% QoQ and 3.1% QoQ to
| 2766.3 crore and | 1321 crore for Airtel and Idea, respectively.
Margins to remain under pressure...
Lower operating leverage during the quarter is expected to impact
margins. Idea is expected to post margins at 20.5%, down 250 bps QoQ.
Consolidated margins for Airtel are seen at 34.8%, down 70 bps QoQ,
impacted by lower operating leverage in Indian mobility business
(margins down 180 bps QoQ).
Exhibit 38: Estimates for Q2FY18E- Telecom (| crore)
Revenue EBITDA PAT
Q2FY18E YoY QoQ Q2FY18E YoY QoQ Q2FY18E YoY QoQ
Bharti Airtel 21,603.1 -12.4 -1.8 7,524.4 -20.5 -3.5 212.2 -85.5 -42.2
Bharti Infratel 3,637.3 10.5 3.2 1,606.4 10.8 2.0 669.2 -13.5 0.8
Idea Cellular 7,682.7 -17.4 -5.9 1,575.3 -44.5 -16.0 -1,030.6 PL NA
Sterlite Technologies 809.6 47.0 8.8 178.1 75.1 13.4 74.3 46.1 22.6
Tata Comm 4,390.8 -2.6 1.9 586.8 -11.4 5.0 49.4 23.7 53.3
Total 38,123.5 -9.9 -1.6 11,471.0 -21.0 -4.1 -25.5 PL PL
Change (%) Change (%) Change (%)
Company
Source: Company, ICICIdirect.com Research
Topline & Profitability (Coverage Universe)
42323
40520
38628
38752
38124
0
5000
10000
15000
20000
25000
30000
35000
40000
45000
Q2FY17
Q3FY17
Q4FY17
Q1FY18
Q2FY18E
| C
rore
0.0
5.0
10.0
15.0
20.0
25.0
30.0
35.0
40.0
(%
)
Revenue EBITDA Margin PAT Margin
MOU trend
368
412
441446
406419
471
507 500
385
350
400
450
500
550
Q2FY17 Q3FY17 Q4FY17 Q1FY18 Q2FY18
Billion M
inutes
Airtel Idea
Voice ARPM Trend
32.4
29.4
24.3
32.8
29.4
25.8
24.3
22.0 20.7
22.6
20
25
30
35
40
Q2FY17
Q3FY17
Q4FY17
Q1FY18
Q2FY18
Voic
e A
RP
M (
in P
ais
a)
Airtel Idea
Research Analysts
Bhupendra Tiwary
Sameer Pardikar

ICICI Securities Ltd. | Retail Equity Research
Page 64
Exhibit 39: Company specific view (Telecom)
Company Remarks
Bharti Airtel Q2, being seasonally weak for telcos, is likely to result in muted voice volumes for
Airtel. Furthermore, wider adoption of bundled packages and GST impact will weigh
on realisations. We expect overall voice volumes at 421.9 billion minutes, flattish
QoQ. Voice realisations, however, are likely to slide to 20.7 paisa (down 6% QoQ),
largely impacted by bundled offerings and GST. Consequently, voice revenues are
expected to decline 6% QoQ to | 8717.2 crore, Data volumes at attractive prices
would continue to find favours, growing 11.5% QoQ to 526.6 billion MB. Realisations,
on the other hand, may decline 12% QoQ to 5.25 paisa/MB, thereby leading to 1.9%
QoQ decline in data revenues to | 2766.3 crore. Given the muted topline, the India
business margins are expected at 34.6%, down 180 bps QoQ. Africa topline and
margins are expected at | 4297.1 crore (up 1.5% QoQ) and 28%, respectively. Overall
margins are expected at 34.8%, down 70 bps QoQ, largely dragged by weak India
business margins
Bharti Infratel We expect net tenancy addition of 4558 in Q2FY18, aided largely by incremental
tenancy demand from Jio as it expands its services. The net add run rate, however,
is lower as key incumbents such as Idea and Vodafone are going slow on their capex
plans. Average tenancy ratio (at the consolidated level) is expected at 2.42x (up 2.6%
QoQ) with total co-locations reaching 222959. Rental realisation growth, however,
would be restricted by rental freeze for existing clients as per the new master service
agreement (MSA). Rental revenues are expected at | 2303.9 crore (up 2.0% QoQ).
We expect energy revenue growth of 5.5% QoQ to | 1333.4 crore, given the higher
usage of diesel on account of power outages as well higher realisations QoQ. Energy
margins are expected at 6.5% during the quarter. EBITDA margins are seen at 44.2%,
decline of 50 bps QoQ. PAT is seen at | 669.2 crore for the quarter. Our estimates are
based on proportionate consolidation of Indus (earlier method)
Idea Cellular Idea's subscriber base continues to face pressure from Jio as it lost 5.1 million
subscribers in the first two months of Q2FY18E. Furthermore, the impact of GST and
seasonality is likely to weigh on Idea's performance in Q2FY18. Overall voice volumes
at 250.4 billion minutes are expected to be flattish while voice realisations would
decline 7% QoQ to 22.6 paisa. Voice revenues, therefore, are expected to decline
7.1% QoQ to | 5656.9 crore. Data realisations would also slip to 4.8 paisa/MB (down
12% QoQ) given the wider adoption of bundled freebies. Data volumes, at 265.1
billion MB, are likely to grow 5% QoQ, thereby restricting data revenue decline to
3.1% QoQ at | 1321 crore. Margins are expected at 20.5%, down 250 bps QoQ, given
the negative operating leverage
Sterlite
Technologies
Sterlite is expected to report 47% YoY growth in topline at | 809.6 crore, on a lower
base as Q2FY17 had witnessed a weak services and projects revenues recognition.
The healthy revenue growth is expected to provide a positive operating leverage.
Consequently, we expect operating margins at 22% (350 bps improvement YoY).
Consequent PAT at | 74.3 crore is expected to grow 46.1% YoY. The bottomline
growth is lower than topline despite superior margins, owing to tax credit, which the
company had availed in Q2FY17
Tata Comm Data segment revenues continue to be driven by growth services. We expect overall
data revenues to grow 2.5% QoQ to | 2846.9 crore. Data margins are expected at
17.5% vs. 17% in Q1FY18. The weakness in the voice business is expected to
continue with voice volumes expected to decline 9.5% YoY to 10.2 billion minutes
while realisations are expected to decline 3.8% YoY leading to voice revenue decline
of 12.9% YoY to | 1543.9 crore. Voice margins are expected at 5.7%, flattish
sequentially. Overall margins are, hence, expected at 13.4%, up 40 bps QoQ. We
expect the company to report PAT of | 49.4 crore
Source: Company, ICICIdirect.com Research
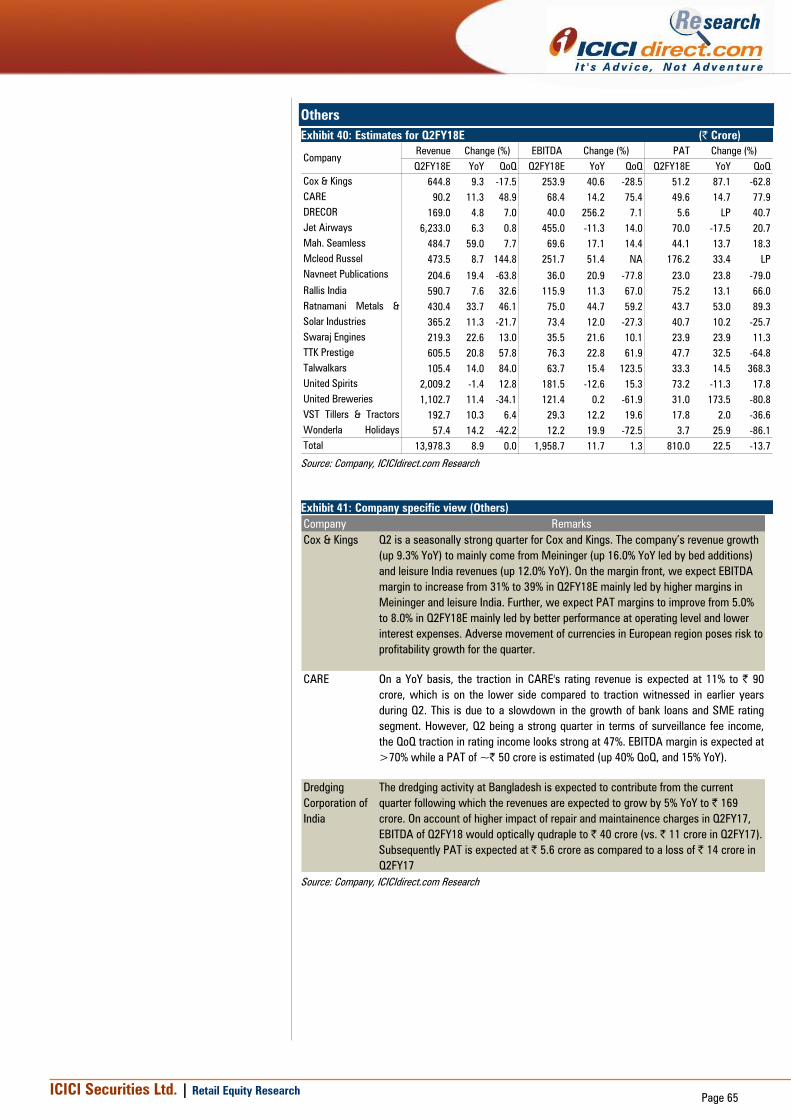
ICICI Securities Ltd. | Retail Equity Research
Page 65
Others
Exhibit 40: Estimates for Q2FY18E (| Crore)
Revenue EBITDA PAT
Q2FY18E YoY QoQ Q2FY18E YoY QoQ Q2FY18E YoY QoQ
Cox & Kings 644.8 9.3 -17.5 253.9 40.6 -28.5 51.2 87.1 -62.8
CARE 90.2 11.3 48.9 68.4 14.2 75.4 49.6 14.7 77.9
DRECOR 169.0 4.8 7.0 40.0 256.2 7.1 5.6 LP 40.7
Jet Airways 6,233.0 6.3 0.8 455.0 -11.3 14.0 70.0 -17.5 20.7
Mah. Seamless 484.7 59.0 7.7 69.6 17.1 14.4 44.1 13.7 18.3
Mcleod Russel 473.5 8.7 144.8 251.7 51.4 NA 176.2 33.4 LP
Navneet Publications 204.6 19.4 -63.8 36.0 20.9 -77.8 23.0 23.8 -79.0
Rallis India 590.7 7.6 32.6 115.9 11.3 67.0 75.2 13.1 66.0
Ratnamani Metals &
Tubes
430.4 33.7 46.1 75.0 44.7 59.2 43.7 53.0 89.3
Solar Industries 365.2 11.3 -21.7 73.4 12.0 -27.3 40.7 10.2 -25.7
Swaraj Engines 219.3 22.6 13.0 35.5 21.6 10.1 23.9 23.9 11.3
TTK Prestige 605.5 20.8 57.8 76.3 22.8 61.9 47.7 32.5 -64.8
Talwalkars 105.4 14.0 84.0 63.7 15.4 123.5 33.3 14.5 368.3
United Spirits 2,009.2 -1.4 12.8 181.5 -12.6 15.3 73.2 -11.3 17.8
United Breweries 1,102.7 11.4 -34.1 121.4 0.2 -61.9 31.0 173.5 -80.8
VST Tillers & Tractors
(VSTTIL)
192.7 10.3 6.4 29.3 12.2 19.6 17.8 2.0 -36.6
Wonderla Holidays
(WONHOL)
57.4 14.2 -42.2 12.2 19.9 -72.5 3.7 25.9 -86.1
Total 13,978.3 8.9 0.0 1,958.7 11.7 1.3 810.0 22.5 -13.7
Company
Change (%) Change (%)Change (%)
Source: Company, ICICIdirect.com Research
Exhibit 41: Company specific view (Others)
Company Remarks
Cox & Kings Q2 is a seasonally strong quarter for Cox and Kings. The company’s revenue growth
(up 9.3% YoY) to mainly come from Meininger (up 16.0% YoY led by bed additions)
and leisure India revenues (up 12.0% YoY). On the margin front, we expect EBITDA
margin to increase from 31% to 39% in Q2FY18E mainly led by higher margins in
Meininger and leisure India. Further, we expect PAT margins to improve from 5.0%
to 8.0% in Q2FY18E mainly led by better performance at operating level and lower
interest expenses. Adverse movement of currencies in European region poses risk to
profitability growth for the quarter.
CARE On a YoY basis, the traction in CARE's rating revenue is expected at 11% to | 90
crore, which is on the lower side compared to traction witnessed in earlier years
during Q2. This is due to a slowdown in the growth of bank loans and SME rating
segment. However, Q2 being a strong quarter in terms of surveillance fee income,
the QoQ traction in rating income looks strong at 47%. EBITDA margin is expected at
>70% while a PAT of ~| 50 crore is estimated (up 40% QoQ, and 15% YoY).
Dredging
Corporation of
India
The dredging activity at Bangladesh is expected to contribute from the current
quarter following which the revenues are expected to grow by 5% YoY to | 169
crore. On account of higher impact of repair and maintainence charges in Q2FY17,
EBITDA of Q2FY18 would optically qudraple to | 40 crore (vs. | 11 crore in Q2FY17).
Subsequently PAT is expected at | 5.6 crore as compared to a loss of | 14 crore in
Q2FY17
Source: Company, ICICIdirect.com Research

ICICI Securities Ltd. | Retail Equity Research
Page 66
Exhibit 42: Company specific view (Others)
Jet Airways Jet's domestic passenger traffic growth (up 11% YoY) is expected to remain better
than the past five quarters average passenger growth of 4.5% YoY. Domestic traffic
to grow by 11% YoY to 52.9 lacs (v/s Industry growth of 16.1% YoY). Whereas,
international traffic is expected to grow by 6.5% YoY to 21.3 lacs leading to total
passenger growth of 9.7% YoY. Moderation in ATF prices (down 5.1% QoQ, up 2%
YoY) will help to improve margins QoQ by 80bps to 7.3%. However, margins to
remain lower on YoY basis.
Maharashtra
Seamless
For Q2FY18, Maharashtra Seamless is expected to report pipes sales volume of
85375 tonne (up 2% QoQ). The sale of seamless pipes is likely to come in at 72875
tonne (up 1.5% QoQ) while the ERW pipes sales is expected to come in at 12500
tonne (up 4.5% QoQ). We expect the topline to increase 7.7% QoQ while the EBITDA
margins are expected to come in at 14.4% (vs. 19.5% in Q2FY17 and 13.5% in
Q1FY18)
McLeod Russel Mcleod russel is expected to witness a sales growth of 8.7% YoY to | 473.5 crore
mainly due to increase in tea prices in Assam. We estimate flat volume growth of 25
million kg with the average realisation of | 189 per kg. We estimate 10% YoY
increase in domestic tea prices to | 166.5 per kg and 17 million kg sales volumes.
Exports realisation are expected to grow by 5% YoY to | 240 per kg. With the
increase in tea prices operating profit is expected to grow by 51% to | 251.7 crore
and net profit is expected to grow by 33.1% to | 175.8 crore
Navneet
Education
The spillover of revenues of the supplementary books from Q1FY18 to Q2FY18 is
expected to improve the revenues for the current quarter. We expect Navneet to
register a revenue growth of 19.4% YoY to | 204.6 crore, driven by robust growth in
publication segment to the tune of 26% and 6.0% revenue growth in the stationery
segment. EBITDA margins are expected to expand marginally by 22 bps YoY to
17.6% on account of positive operating leverage. Consequently we expect PAT to
grow 23.8% YoY to | 23 crore.
Rallis India Rallis India is expected to report steady performance in a seasonally important
quarter for its base agro-chemical business amidst near normal monsoon 2017 (-5%
of LPA). In Q2FY18E, in the agro-chemical segment we expect sales to grow by
modest 7.8% YoY to | 542.7 crore. While on the Metahelix front, we expect a
modest 6% YoY growth in sales to | 48.0 crore. On the consolidated level, we
expect sales to grow 7.6% YoY to | 590.7 crore while EBITDA margins are expected
at 19.6% up 60 bps YoY. Consequent EBITDA & PAT in Q2FY18E is expected at |
115.9 crore & | 75.2 crore respectively.
Swaraj Engines Swaraj Engines is expected to report strong performance in Q2FY18E primarily
tracking robust tractor sales at parent group i.e. M&M, amidst near normal monsoon
2017 (-5% of LPA). Sales volume is expected to grow by 20% YoY to 26874 units in
Q2FY18E with consequent sales at | 219.3 crore, up 22.6% YoY. EBITDA margins
are expected to be flat at 16.2%. Consequent, PAT in Q2FY18E is expected at | 23.9
crore (up 23.8% YoY)
Solar Industries Solar Industries is expected to post revenue growth of 11.3% YoY to | 365.2 crore.
This is mostly due to weak volume growth of 10.9% in bulk segment, coupled with
15% decline in realizations. Cartridge segment is likely to witness strong volume
growth of 29% amid flat realizations for the quarter. Revenues from overseas
markets are likely to grow 22% YoY due to stable Lira (turkey) and Rand (South
Africa). Naira (Nigeria) and Kwacha (Zambia) have witnessed depreciation of 13%
and 5.5% for the quarter. EBITDA margins are likely to remain stable at 20.1%. PAT
is likely to increase by 10.2% YoY to | 40.7 crore.
Source: Company, ICICIdirect.com Research
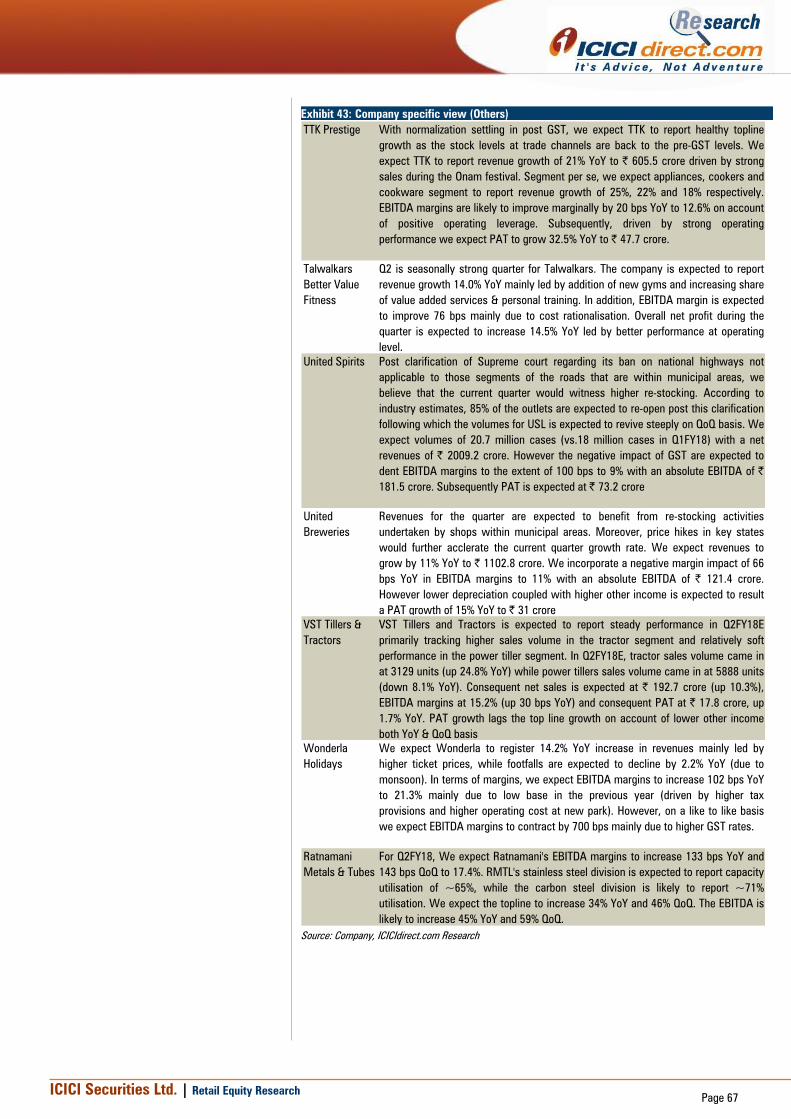
ICICI Securities Ltd. | Retail Equity Research
Page 67
Exhibit 43: Company specific view (Others)
TTK Prestige With normalization settling in post GST, we expect TTK to report healthy topline
growth as the stock levels at trade channels are back to the pre-GST levels. We
expect TTK to report revenue growth of 21% YoY to | 605.5 crore driven by strong
sales during the Onam festival. Segment per se, we expect appliances, cookers and
cookware segment to report revenue growth of 25%, 22% and 18% respectively.
EBITDA margins are likely to improve marginally by 20 bps YoY to 12.6% on account
of positive operating leverage. Subsequently, driven by strong operating
performance we expect PAT to grow 32.5% YoY to | 47.7 crore.
Talwalkars
Better Value
Fitness
Q2 is seasonally strong quarter for Talwalkars. The company is expected to report
revenue growth 14.0% YoY mainly led by addition of new gyms and increasing share
of value added services & personal training. In addition, EBITDA margin is expected
to improve 76 bps mainly due to cost rationalisation. Overall net profit during the
quarter is expected to increase 14.5% YoY led by better performance at operating
level.
United Spirits Post clarification of Supreme court regarding its ban on national highways not
applicable to those segments of the roads that are within municipal areas, we
believe that the current quarter would witness higher re-stocking. According to
industry estimates, 85% of the outlets are expected to re-open post this clarification
following which the volumes for USL is expected to revive steeply on QoQ basis. We
expect volumes of 20.7 million cases (vs.18 million cases in Q1FY18) with a net
revenues of | 2009.2 crore. However the negative impact of GST are expected to
dent EBITDA margins to the extent of 100 bps to 9% with an absolute EBITDA of |
181.5 crore. Subsequently PAT is expected at | 73.2 crore
United
Breweries
Revenues for the quarter are expected to benefit from re-stocking activities
undertaken by shops within municipal areas. Moreover, price hikes in key states
would further acclerate the current quarter growth rate. We expect revenues to
grow by 11% YoY to | 1102.8 crore. We incorporate a negative margin impact of 66
bps YoY in EBITDA margins to 11% with an absolute EBITDA of | 121.4 crore.
However lower depreciation coupled with higher other income is expected to result
a PAT growth of 15% YoY to | 31 crore
VST Tillers &
Tractors
VST Tillers and Tractors is expected to report steady performance in Q2FY18E
primarily tracking higher sales volume in the tractor segment and relatively soft
performance in the power tiller segment. In Q2FY18E, tractor sales volume came in
at 3129 units (up 24.8% YoY) while power tillers sales volume came in at 5888 units
(down 8.1% YoY). Consequent net sales is expected at | 192.7 crore (up 10.3%),
EBITDA margins at 15.2% (up 30 bps YoY) and consequent PAT at | 17.8 crore, up
1.7% YoY. PAT growth lags the top line growth on account of lower other income
both YoY & QoQ basis
Wonderla
Holidays
We expect Wonderla to register 14.2% YoY increase in revenues mainly led by
higher ticket prices, while footfalls are expected to decline by 2.2% YoY (due to
monsoon). In terms of margins, we expect EBITDA margins to increase 102 bps YoY
to 21.3% mainly due to low base in the previous year (driven by higher tax
provisions and higher operating cost at new park). However, on a like to like basis
we expect EBITDA margins to contract by 700 bps mainly due to higher GST rates.
Ratnamani
Metals & Tubes
For Q2FY18, We expect Ratnamani's EBITDA margins to increase 133 bps YoY and
143 bps QoQ to 17.4%. RMTL's stainless steel division is expected to report capacity
utilisation of ~65%, while the carbon steel division is likely to report ~71%
utilisation. We expect the topline to increase 34% YoY and 46% QoQ. The EBITDA is
likely to increase 45% YoY and 59% QoQ.
Source: Company, ICICIdirect.com Research
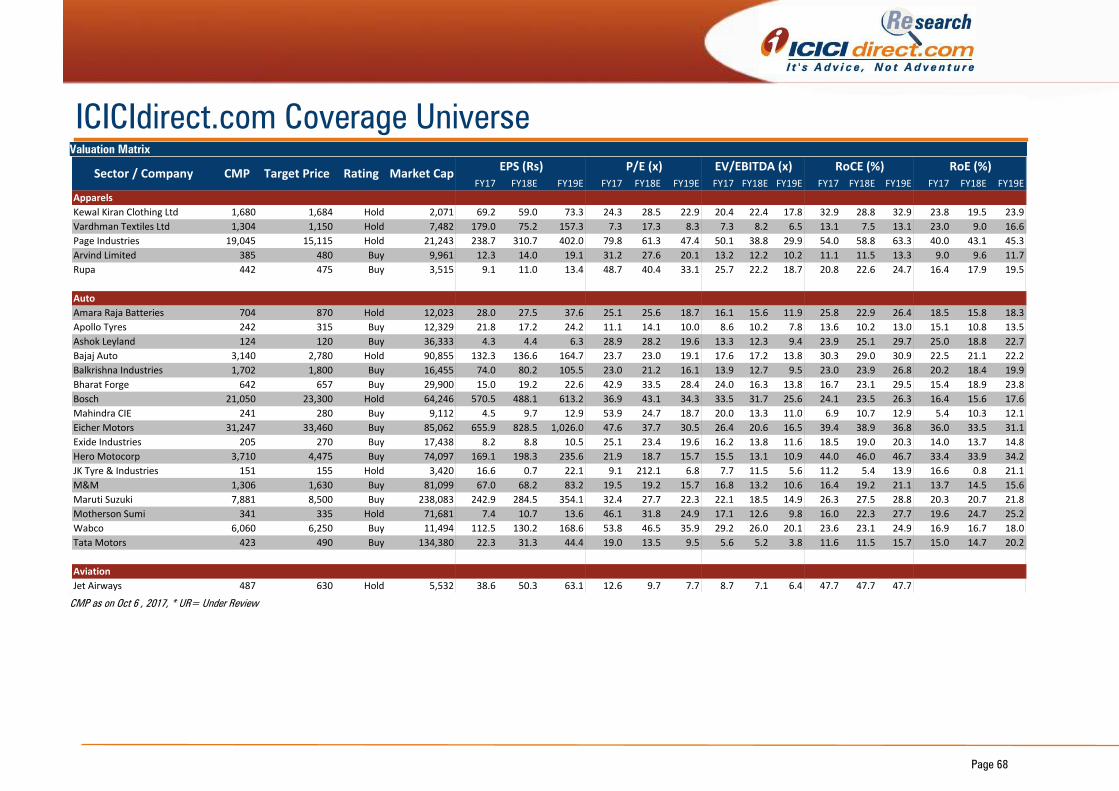
Page 68
ICICIdirect.com Coverage Universe
Valuation Matrix
x
FY17 FY18E FY19E FY17 FY18E FY19E FY17 FY18E FY19E FY17 FY18E FY19E FY17 FY18E FY19E
Apparels
Kewal Kiran Clothing Ltd 1,680 1,684 Hold 2,071 69.2 59.0 73.3 24.3 28.5 22.9 20.4 22.4 17.8 32.9 28.8 32.9 23.8 19.5 23.9
Vardhman Textiles Ltd 1,304 1,150 Hold 7,482 179.0 75.2 157.3 7.3 17.3 8.3 7.3 8.2 6.5 13.1 7.5 13.1 23.0 9.0 16.6
Page Industries 19,045 15,115 Hold 21,243 238.7 310.7 402.0 79.8 61.3 47.4 50.1 38.8 29.9 54.0 58.8 63.3 40.0 43.1 45.3
Arvind Limited 385 480 Buy 9,961 12.3 14.0 19.1 31.2 27.6 20.1 13.2 12.2 10.2 11.1 11.5 13.3 9.0 9.6 11.7
Rupa 442 475 Buy 3,515 9.1 11.0 13.4 48.7 40.4 33.1 25.7 22.2 18.7 20.8 22.6 24.7 16.4 17.9 19.5
RoA (%)
Auto
Amara Raja Batteries 704 870 Hold 12,023 28.0 27.5 37.6 25.1 25.6 18.7 16.1 15.6 11.9 25.8 22.9 26.4 18.5 15.8 18.3
Apollo Tyres 242 315 Buy 12,329 21.8 17.2 24.2 11.1 14.1 10.0 8.6 10.2 7.8 13.6 10.2 13.0 15.1 10.8 13.5
Ashok Leyland 124 120 Buy 36,333 4.3 4.4 6.3 28.9 28.2 19.6 13.3 12.3 9.4 23.9 25.1 29.7 25.0 18.8 22.7
Bajaj Auto 3,140 2,780 Hold 90,855 132.3 136.6 164.7 23.7 23.0 19.1 17.6 17.2 13.8 30.3 29.0 30.9 22.5 21.1 22.2
Balkrishna Industries 1,702 1,800 Buy 16,455 74.0 80.2 105.5 23.0 21.2 16.1 13.9 12.7 9.5 23.0 23.9 26.8 20.2 18.4 19.9
Bharat Forge 642 657 Buy 29,900 15.0 19.2 22.6 42.9 33.5 28.4 24.0 16.3 13.8 16.7 23.1 29.5 15.4 18.9 23.8
Bosch 21,050 23,300 Hold 64,246 570.5 488.1 613.2 36.9 43.1 34.3 33.5 31.7 25.6 24.1 23.5 26.3 16.4 15.6 17.6
Mahindra CIE 241 280 Buy 9,112 4.5 9.7 12.9 53.9 24.7 18.7 20.0 13.3 11.0 6.9 10.7 12.9 5.4 10.3 12.1
Eicher Motors 31,247 33,460 Buy 85,062 655.9 828.5 1,026.0 47.6 37.7 30.5 26.4 20.6 16.5 39.4 38.9 36.8 36.0 33.5 31.1
Exide Industries 205 270 Buy 17,438 8.2 8.8 10.5 25.1 23.4 19.6 16.2 13.8 11.6 18.5 19.0 20.3 14.0 13.7 14.8
Hero Motocorp 3,710 4,475 Buy 74,097 169.1 198.3 235.6 21.9 18.7 15.7 15.5 13.1 10.9 44.0 46.0 46.7 33.4 33.9 34.2
JK Tyre & Industries 151 155 Hold 3,420 16.6 0.7 22.1 9.1 212.1 6.8 7.7 11.5 5.6 11.2 5.4 13.9 16.6 0.8 21.1
M&M 1,306 1,630 Buy 81,099 67.0 68.2 83.2 19.5 19.2 15.7 16.8 13.2 10.6 16.4 19.2 21.1 13.7 14.5 15.6
Maruti Suzuki 7,881 8,500 Buy 238,083 242.9 284.5 354.1 32.4 27.7 22.3 22.1 18.5 14.9 26.3 27.5 28.8 20.3 20.7 21.8
Motherson Sumi 341 335 Hold 71,681 7.4 10.7 13.6 46.1 31.8 24.9 17.1 12.6 9.8 16.0 22.3 27.7 19.6 24.7 25.2
Wabco 6,060 6,250 Buy 11,494 112.5 130.2 168.6 53.8 46.5 35.9 29.2 26.0 20.1 23.6 23.1 24.9 16.9 16.7 18.0
Tata Motors 423 490 Buy 134,380 22.3 31.3 44.4 19.0 13.5 9.5 5.6 5.2 3.8 11.6 11.5 15.7 15.0 14.7 20.2
RoA (%)
Aviation
Jet Airways 487 630 Hold 5,532 38.6 50.3 63.1 12.6 9.7 7.7 8.7 7.1 6.4 47.7 47.7 47.7
EV/EBITDA (x)P/E (x) RoCE (%) RoE (%)EPS (Rs)Market CapSector / Company CMP Target Price Rating
CMP as on Oct 6 , 2017, * UR= Under Review

Page 69
Valuation Matrix
x
FY17 FY18E FY19E FY17 FY18E FY19E FY17 FY18E FY19E FY17 FY18E FY19E FY17 FY18E FY19E
Building Materials
Century Plyboard 258 310 Buy 5,734 8.4 8.6 12.2 30.9 29.8 21.2 8.3 6.9 5.5 21.3 18.9 23.3 27.0 23.1 26.1
Kajaria Ceramics 739 755 Hold 11,753 15.9 16.5 22.4 46.5 44.9 33.0 10.0 8.5 7.1 27.1 24.0 27.6 21.5 19.0 21.6
Somany Ceramics 844 815 Hold 3,577 21.7 24.8 32.5 38.9 34.1 26.0 17.9 16.5 13.3 20.3 20.0 22.6 17.7 17.6 19.8
Greenply Industries 271 310 Buy 3,328 11.2 12.4 14.1 24.3 21.9 19.3 14.3 14.3 12.2 17.3 14.6 13.7 17.3 16.2 15.8
Shankara Building Products 1,523 1,725 Buy 3,480 26.4 33.3 46.5 57.7 45.7 32.7 22.1 20.0 16.0 22.9 23.0 26.6 15.3 16.6 19.4
RoA (%)
Capital Goods
VA Tech Wabag 590 765 Buy 3,221 31.1 37.9 46.4 19.0 15.6 12.7 10.6 8.3 6.9 25.4 27.5 28.6 10.2 17.9 18.9
SKF Bearing 1,538 1,800 Buy 8,108 46.3 53.0 61.7 33.2 29.0 24.9 22.7 20.9 17.4 20.7 23.1 23.8 13.5 15.1 15.6
Timken India 765 867 Buy 5,202 14.3 15.9 19.3 53.5 48.0 39.7 29.7 24.0 20.1 22.7 24.2 25.5 16.0 15.7 16.6
NRB Bearing 121 130 Hold 1,173 5.6 6.1 6.8 21.7 19.8 17.7 11.7 10.5 9.5 16.1 17.8 18.1 17.0 16.8 16.7
Grindwell Norton 420 500 Buy 4,652 10.8 12.5 14.4 39.0 33.7 29.2 23.2 18.9 16.2 19.5 21.3 22.4 13.4 14.2 15.0
Thermax 937 990 Buy 11,164 12.2 25.5 31.6 77.0 36.7 29.7 27.8 25.1 20.2 15.4 15.4 17.3 8.4 10.8 12.1
KEC International 308 345 Buy 7,907 12.8 14.9 19.2 24.0 20.7 16.1 9.6 8.4 7.1 17.0 18.1 19.9 17.4 17.2 18.6
Greaves Cotton 134 176 Hold 3,281 7.3 8.4 9.8 18.3 16.1 13.7 14.5 12.9 10.6 28.7 31.6 34.6 21.2 22.5 24.7
AIA Engineering 1,384 1,421 Hold 13,054 43.9 40.9 54.7 31.5 33.8 25.3 22.4 22.7 16.6 28.3 23.8 27.5 22.1 18.2 20.8
Larsen & Toubro 1,142 1,430 Buy 159,956 33.9 42.0 48.6 33.7 27.2 23.5 26.0 21.9 0.9 13.9 16.2 18.2 11.4 13.3 14.4
Bharat Electronics Ltd 166 194 Hold 40,811 6.8 7.3 7.9 24.4 22.7 21.2 20.1 17.4 15.9 26.0 25.1 23.5 19.5 18.4 17.4
Engineers India Ltd 148 182 Buy 9,967 4.9 6.8 8.3 30.2 21.8 17.8 22.5 16.5 12.1 15.7 18.9 20.6 11.7 15.0 16.6
RoA (%)
cement
India cements 183 232 Buy 5,636 5.4 7.8 10.1 33.6 23.5 18.1 9.7 8.5 8.0 7.1 7.9 8.2 3.3 4.5 5.6
Ambuja 280 305 Buy 55,529 4.9 5.2 6.9 57.4 54.1 40.8 33.4 33.7 23.0 7.4 7.7 10.5 5.1 5.3 6.8
Ultratech 3,924 4,750 Buy 107,730 95.8 88.1 125.8 41.0 44.5 31.2 21.8 21.9 15.6 13.0 9.6 12.9 11.0 9.5 12.3
Heidelberg cement 120 140 Hold 2,723 3.4 3.8 6.0 35.7 31.9 19.9 14.1 13.2 10.1 10.8 11.7 15.9 7.9 8.5 13.2
JK Lakshmi 394 495 Hold 4,630 7.0 9.6 20.0 56.5 40.8 19.7 17.7 13.8 9.7 7.5 9.5 14.1 5.9 7.7 13.8
Jk cement 978 1,265 Buy 6,836 37.1 44.7 53.3 26.3 21.9 18.3 14.7 12.5 10.8 12.6 13.9 15.7 14.5 14.4 15.1
Mangalam cement 368 425 Buy 982 12.9 11.7 38.2 28.6 31.5 9.6 11.7 10.7 5.6 10.2 10.3 20.0 6.8 5.9 16.3
Shree cement 18,738 19,700 Hold 65,278 384.8 442.6 576.3 48.7 42.3 32.5 25.1 22.0 16.4 17.7 19.0 21.2 17.4 16.9 18.4
ACC 1,737 2,050 Buy 32,620 37.0 44.8 60.8 47.0 38.7 28.6 23.2 22.2 16.4 11.1 12.8 15.4 8.5 9.3 11.6
Star Cement 104 135 Hold 4,379 4.1 4.8 3.9 25.5 21.5 26.6 13.1 12.0 12.1 13.8 14.7 13.0 14.0 14.7 11.0
The Ramco Cement 707 822 Buy 16,837 27.3 25.9 30.1 25.9 27.3 23.5 15.3 15.5 13.4 12.7 11.2 12.0 17.4 15.2 15.6
RoA (%)
Construction
NBCC 216 220 Hold 19,418 3.9 4.6 6.9 55.3 46.9 31.3 42.5 35.9 23.0 31.4 32.9 42.0 21.0 21.9 27.9
NCC Limited 86 110 Buy 4,764 4.1 4.7 5.9 21.1 18.2 14.4 9.5 8.8 7.7 14.6 13.6 14.7 6.6 6.9 8.1
Simplex Infrastructure 479 550 Buy 2,369 24.3 27.7 44.2 19.7 17.3 10.8 8.2 7.4 6.2 11.8 12.7 14.7 7.9 8.2 11.6
RoE (%)Market Cap
EPS (Rs) P/E (x) EV/EBITDA (x) RoCE (%)Sector / Company CMP Target Price Rating
CMP as on Oct 6 , 2017 * UR= Under Review
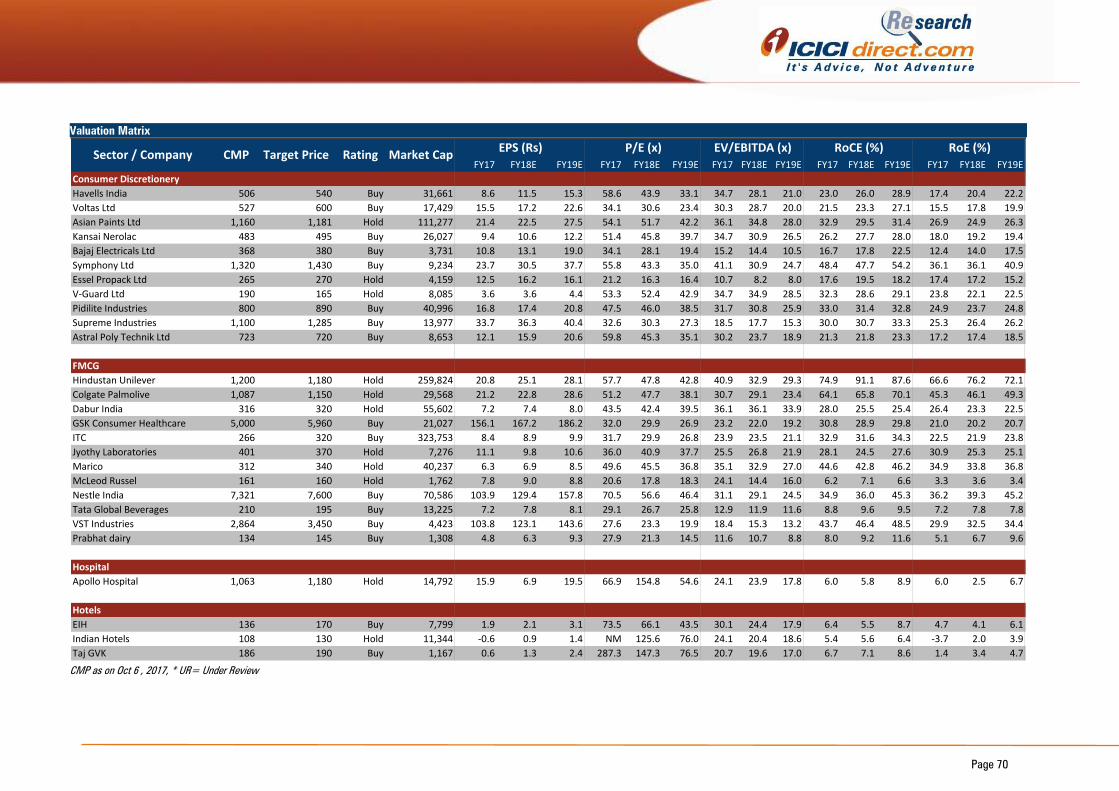
Page 70
Valuation Matrix
FY17 FY18E FY19E FY17 FY18E FY19E FY17 FY18E FY19E FY17 FY18E FY19E FY17 FY18E FY19E
Consumer Discretionery
Havells India 506 540 Buy 31,661 8.6 11.5 15.3 58.6 43.9 33.1 34.7 28.1 21.0 23.0 26.0 28.9 17.4 20.4 22.2
Voltas Ltd 527 600 Buy 17,429 15.5 17.2 22.6 34.1 30.6 23.4 30.3 28.7 20.0 21.5 23.3 27.1 15.5 17.8 19.9
Asian Paints Ltd 1,160 1,181 Hold 111,277 21.4 22.5 27.5 54.1 51.7 42.2 36.1 34.8 28.0 32.9 29.5 31.4 26.9 24.9 26.3
Kansai Nerolac 483 495 Buy 26,027 9.4 10.6 12.2 51.4 45.8 39.7 34.7 30.9 26.5 26.2 27.7 28.0 18.0 19.2 19.4
Bajaj Electricals Ltd 368 380 Buy 3,731 10.8 13.1 19.0 34.1 28.1 19.4 15.2 14.4 10.5 16.7 17.8 22.5 12.4 14.0 17.5
Symphony Ltd 1,320 1,430 Buy 9,234 23.7 30.5 37.7 55.8 43.3 35.0 41.1 30.9 24.7 48.4 47.7 54.2 36.1 36.1 40.9
Essel Propack Ltd 265 270 Hold 4,159 12.5 16.2 16.1 21.2 16.3 16.4 10.7 8.2 8.0 17.6 19.5 18.2 17.4 17.2 15.2
V-Guard Ltd 190 165 Hold 8,085 3.6 3.6 4.4 53.3 52.4 42.9 34.7 34.9 28.5 32.3 28.6 29.1 23.8 22.1 22.5
Pidilite Industries 800 890 Buy 40,996 16.8 17.4 20.8 47.5 46.0 38.5 31.7 30.8 25.9 33.0 31.4 32.8 24.9 23.7 24.8
Supreme Industries 1,100 1,285 Buy 13,977 33.7 36.3 40.4 32.6 30.3 27.3 18.5 17.7 15.3 30.0 30.7 33.3 25.3 26.4 26.2
Astral Poly Technik Ltd 723 720 Buy 8,653 12.1 15.9 20.6 59.8 45.3 35.1 30.2 23.7 18.9 21.3 21.8 23.3 17.2 17.4 18.5
RoA (%)
FMCG
Hindustan Unilever 1,200 1,180 Hold 259,824 20.8 25.1 28.1 57.7 47.8 42.8 40.9 32.9 29.3 74.9 91.1 87.6 66.6 76.2 72.1
Colgate Palmolive 1,087 1,150 Hold 29,568 21.2 22.8 28.6 51.2 47.7 38.1 30.7 29.1 23.4 64.1 65.8 70.1 45.3 46.1 49.3
Dabur India 316 320 Hold 55,602 7.2 7.4 8.0 43.5 42.4 39.5 36.1 36.1 33.9 28.0 25.5 25.4 26.4 23.3 22.5
GSK Consumer Healthcare 5,000 5,960 Buy 21,027 156.1 167.2 186.2 32.0 29.9 26.9 23.2 22.0 19.2 30.8 28.9 29.8 21.0 20.2 20.7
ITC 266 320 Buy 323,753 8.4 8.9 9.9 31.7 29.9 26.8 23.9 23.5 21.1 32.9 31.6 34.3 22.5 21.9 23.8
Jyothy Laboratories 401 370 Hold 7,276 11.1 9.8 10.6 36.0 40.9 37.7 25.5 26.8 21.9 28.1 24.5 27.6 30.9 25.3 25.1
Marico 312 340 Hold 40,237 6.3 6.9 8.5 49.6 45.5 36.8 35.1 32.9 27.0 44.6 42.8 46.2 34.9 33.8 36.8
McLeod Russel 161 160 Hold 1,762 7.8 9.0 8.8 20.6 17.8 18.3 24.1 14.4 16.0 6.2 7.1 6.6 3.3 3.6 3.4
Nestle India 7,321 7,600 Buy 70,586 103.9 129.4 157.8 70.5 56.6 46.4 31.1 29.1 24.5 34.9 36.0 45.3 36.2 39.3 45.2
Tata Global Beverages 210 195 Buy 13,225 7.2 7.8 8.1 29.1 26.7 25.8 12.9 11.9 11.6 8.8 9.6 9.5 7.2 7.8 7.8
VST Industries 2,864 3,450 Buy 4,423 103.8 123.1 143.6 27.6 23.3 19.9 18.4 15.3 13.2 43.7 46.4 48.5 29.9 32.5 34.4
Prabhat dairy 134 145 Buy 1,308 4.8 6.3 9.3 27.9 21.3 14.5 11.6 10.7 8.8 8.0 9.2 11.6 5.1 6.7 9.6
RoA (%)
Hospital
Apollo Hospital 1,063 1,180 Hold 14,792 15.9 6.9 19.5 66.9 154.8 54.6 24.1 23.9 17.8 6.0 5.8 8.9 6.0 2.5 6.7
RoA (%)
Hotels
EIH 136 170 Buy 7,799 1.9 2.1 3.1 73.5 66.1 43.5 30.1 24.4 17.9 6.4 5.5 8.7 4.7 4.1 6.1
Indian Hotels 108 130 Hold 11,344 -0.6 0.9 1.4 NM 125.6 76.0 24.1 20.4 18.6 5.4 5.6 6.4 -3.7 2.0 3.9
Taj GVK 186 190 Buy 1,167 0.6 1.3 2.4 287.3 147.3 76.5 20.7 19.6 17.0 6.7 7.1 8.6 1.4 3.4 4.7
Sector / Company CMP Target Price Rating Market CapEPS (Rs) P/E (x) EV/EBITDA (x) RoCE (%) RoE (%)
CMP as on Oct 6 , 2017, * UR= Under Review
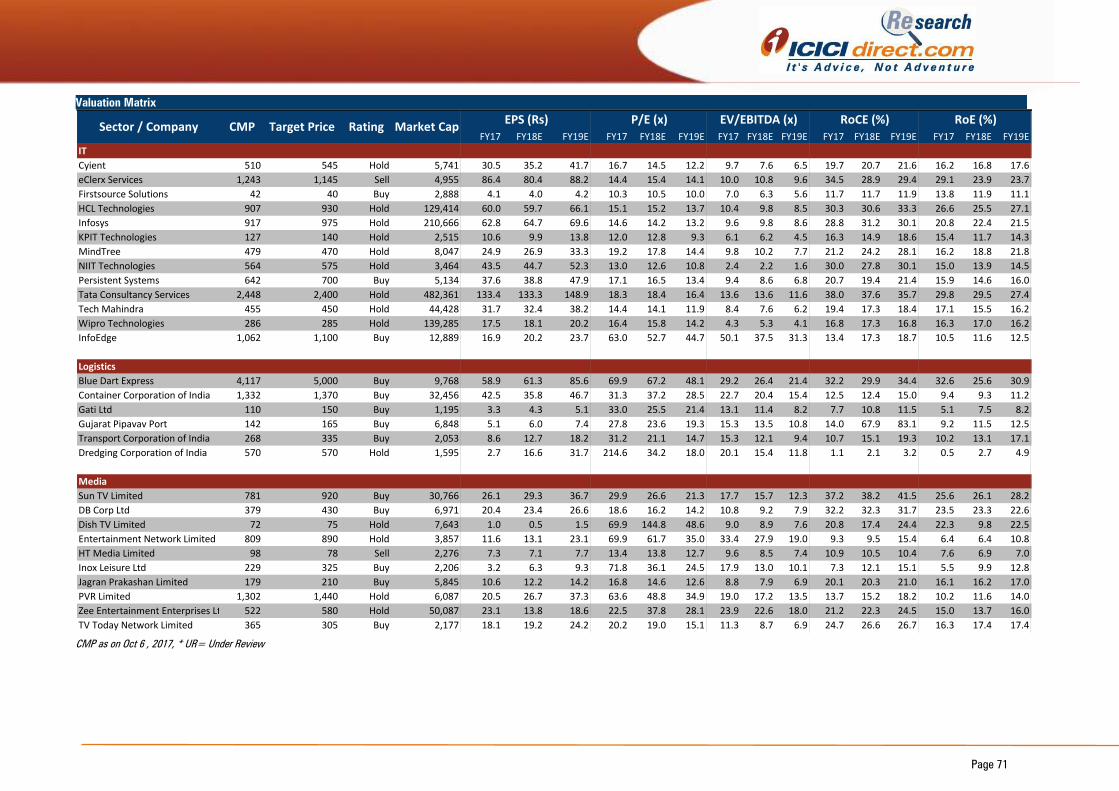
Page 71
Valuation Matrix
FY17 FY18E FY19E FY17 FY18E FY19E FY17 FY18E FY19E FY17 FY18E FY19E FY17 FY18E FY19E
IT
Cyient 510 545 Hold 5,741 30.5 35.2 41.7 16.7 14.5 12.2 9.7 7.6 6.5 19.7 20.7 21.6 16.2 16.8 17.6
eClerx Services 1,243 1,145 Sell 4,955 86.4 80.4 88.2 14.4 15.4 14.1 10.0 10.8 9.6 34.5 28.9 29.4 29.1 23.9 23.7
Firstsource Solutions 42 40 Buy 2,888 4.1 4.0 4.2 10.3 10.5 10.0 7.0 6.3 5.6 11.7 11.7 11.9 13.8 11.9 11.1
HCL Technologies 907 930 Hold 129,414 60.0 59.7 66.1 15.1 15.2 13.7 10.4 9.8 8.5 30.3 30.6 33.3 26.6 25.5 27.1
Infosys 917 975 Hold 210,666 62.8 64.7 69.6 14.6 14.2 13.2 9.6 9.8 8.6 28.8 31.2 30.1 20.8 22.4 21.5
KPIT Technologies 127 140 Hold 2,515 10.6 9.9 13.8 12.0 12.8 9.3 6.1 6.2 4.5 16.3 14.9 18.6 15.4 11.7 14.3
MindTree 479 470 Hold 8,047 24.9 26.9 33.3 19.2 17.8 14.4 9.8 10.2 7.7 21.2 24.2 28.1 16.2 18.8 21.8
NIIT Technologies 564 575 Hold 3,464 43.5 44.7 52.3 13.0 12.6 10.8 2.4 2.2 1.6 30.0 27.8 30.1 15.0 13.9 14.5
Persistent Systems 642 700 Buy 5,134 37.6 38.8 47.9 17.1 16.5 13.4 9.4 8.6 6.8 20.7 19.4 21.4 15.9 14.6 16.0
Tata Consultancy Services 2,448 2,400 Hold 482,361 133.4 133.3 148.9 18.3 18.4 16.4 13.6 13.6 11.6 38.0 37.6 35.7 29.8 29.5 27.4
Tech Mahindra 455 450 Hold 44,428 31.7 32.4 38.2 14.4 14.1 11.9 8.4 7.6 6.2 19.4 17.3 18.4 17.1 15.5 16.2
Wipro Technologies 286 285 Hold 139,285 17.5 18.1 20.2 16.4 15.8 14.2 4.3 5.3 4.1 16.8 17.3 16.8 16.3 17.0 16.2
InfoEdge 1,062 1,100 Buy 12,889 16.9 20.2 23.7 63.0 52.7 44.7 50.1 37.5 31.3 13.4 17.3 18.7 10.5 11.6 12.5
RoA (%)
Logistics
Blue Dart Express 4,117 5,000 Buy 9,768 58.9 61.3 85.6 69.9 67.2 48.1 29.2 26.4 21.4 32.2 29.9 34.4 32.6 25.6 30.9
Container Corporation of India 1,332 1,370 Buy 32,456 42.5 35.8 46.7 31.3 37.2 28.5 22.7 20.4 15.4 12.5 12.4 15.0 9.4 9.3 11.2
Gati Ltd 110 150 Buy 1,195 3.3 4.3 5.1 33.0 25.5 21.4 13.1 11.4 8.2 7.7 10.8 11.5 5.1 7.5 8.2
Gujarat Pipavav Port 142 165 Buy 6,848 5.1 6.0 7.4 27.8 23.6 19.3 15.3 13.5 10.8 14.0 67.9 83.1 9.2 11.5 12.5
Transport Corporation of India 268 335 Buy 2,053 8.6 12.7 18.2 31.2 21.1 14.7 15.3 12.1 9.4 10.7 15.1 19.3 10.2 13.1 17.1
Dredging Corporation of India 570 570 Hold 1,595 2.7 16.6 31.7 214.6 34.2 18.0 20.1 15.4 11.8 1.1 2.1 3.2 0.5 2.7 4.9
RoA (%)
Media
Sun TV Limited 781 920 Buy 30,766 26.1 29.3 36.7 29.9 26.6 21.3 17.7 15.7 12.3 37.2 38.2 41.5 25.6 26.1 28.2
DB Corp Ltd 379 430 Buy 6,971 20.4 23.4 26.6 18.6 16.2 14.2 10.8 9.2 7.9 32.2 32.3 31.7 23.5 23.3 22.6
Dish TV Limited 72 75 Hold 7,643 1.0 0.5 1.5 69.9 144.8 48.6 9.0 8.9 7.6 20.8 17.4 24.4 22.3 9.8 22.5
Entertainment Network Limited 809 890 Hold 3,857 11.6 13.1 23.1 69.9 61.7 35.0 33.4 27.9 19.0 9.3 9.5 15.4 6.4 6.4 10.8
HT Media Limited 98 78 Sell 2,276 7.3 7.1 7.7 13.4 13.8 12.7 9.6 8.5 7.4 10.9 10.5 10.4 7.6 6.9 7.0
Inox Leisure Ltd 229 325 Buy 2,206 3.2 6.3 9.3 71.8 36.1 24.5 17.9 13.0 10.1 7.3 12.1 15.1 5.5 9.9 12.8
Jagran Prakashan Limited 179 210 Buy 5,845 10.6 12.2 14.2 16.8 14.6 12.6 8.8 7.9 6.9 20.1 20.3 21.0 16.1 16.2 17.0
PVR Limited 1,302 1,440 Hold 6,087 20.5 26.7 37.3 63.6 48.8 34.9 19.0 17.2 13.5 13.7 15.2 18.2 10.2 11.6 14.0
Zee Entertainment Enterprises Ltd 522 580 Hold 50,087 23.1 13.8 18.6 22.5 37.8 28.1 23.9 22.6 18.0 21.2 22.3 24.5 15.0 13.7 16.0
TV Today Network Limited 365 305 Buy 2,177 18.1 19.2 24.2 20.2 19.0 15.1 11.3 8.7 6.9 24.7 26.6 26.7 16.3 17.4 17.4
RoE (%)Market Cap
EPS (Rs) P/E (x) EV/EBITDA (x) RoCE (%)Sector / Company CMP Target Price Rating
CMP as on Oct 6 , 2017, * UR= Under Review
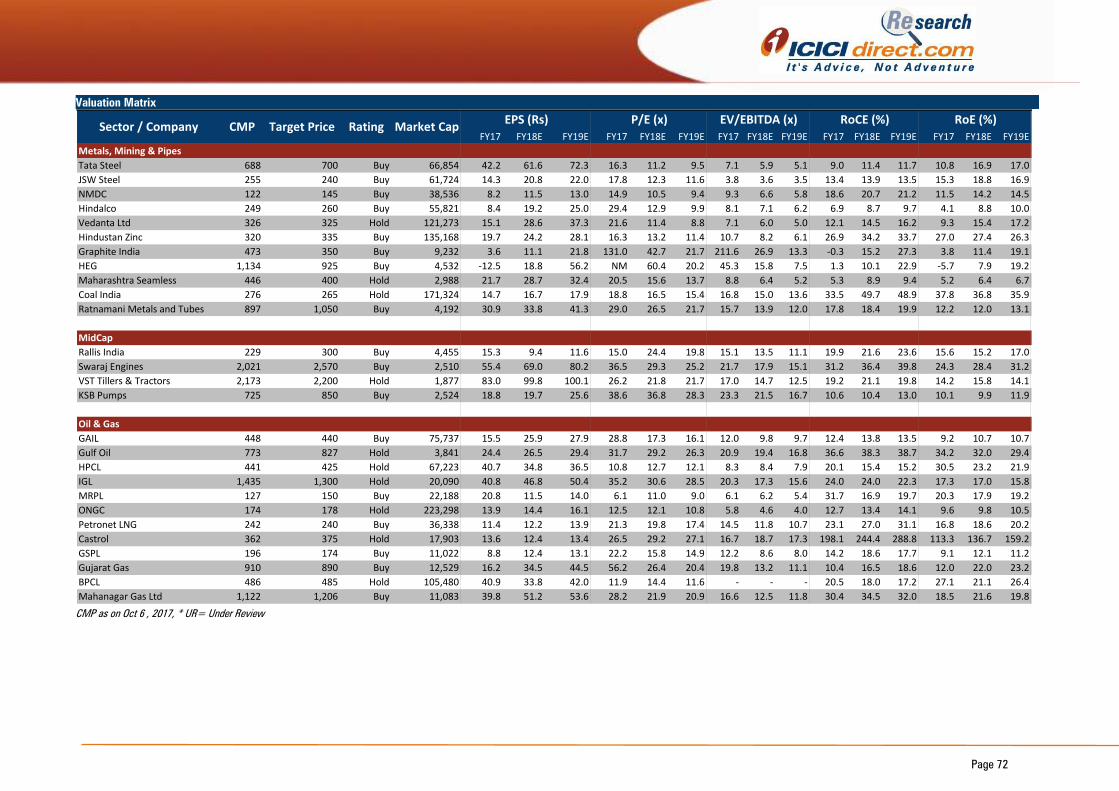
Page 72
Valuation Matrix
FY17 FY18E FY19E FY17 FY18E FY19E FY17 FY18E FY19E FY17 FY18E FY19E FY17 FY18E FY19E
Metals, Mining & Pipes
Tata Steel 688 700 Buy 66,854 42.2 61.6 72.3 16.3 11.2 9.5 7.1 5.9 5.1 9.0 11.4 11.7 10.8 16.9 17.0
JSW Steel 255 240 Buy 61,724 14.3 20.8 22.0 17.8 12.3 11.6 3.8 3.6 3.5 13.4 13.9 13.5 15.3 18.8 16.9
NMDC 122 145 Buy 38,536 8.2 11.5 13.0 14.9 10.5 9.4 9.3 6.6 5.8 18.6 20.7 21.2 11.5 14.2 14.5
Hindalco 249 260 Buy 55,821 8.4 19.2 25.0 29.4 12.9 9.9 8.1 7.1 6.2 6.9 8.7 9.7 4.1 8.8 10.0
Vedanta Ltd 326 325 Hold 121,273 15.1 28.6 37.3 21.6 11.4 8.8 7.1 6.0 5.0 12.1 14.5 16.2 9.3 15.4 17.2
Hindustan Zinc 320 335 Buy 135,168 19.7 24.2 28.1 16.3 13.2 11.4 10.7 8.2 6.1 26.9 34.2 33.7 27.0 27.4 26.3
Graphite India 473 350 Buy 9,232 3.6 11.1 21.8 131.0 42.7 21.7 211.6 26.9 13.3 -0.3 15.2 27.3 3.8 11.4 19.1
HEG 1,134 925 Buy 4,532 -12.5 18.8 56.2 NM 60.4 20.2 45.3 15.8 7.5 1.3 10.1 22.9 -5.7 7.9 19.2
Maharashtra Seamless 446 400 Hold 2,988 21.7 28.7 32.4 20.5 15.6 13.7 8.8 6.4 5.2 5.3 8.9 9.4 5.2 6.4 6.7
Coal India 276 265 Hold 171,324 14.7 16.7 17.9 18.8 16.5 15.4 16.8 15.0 13.6 33.5 49.7 48.9 37.8 36.8 35.9
Ratnamani Metals and Tubes 897 1,050 Buy 4,192 30.9 33.8 41.3 29.0 26.5 21.7 15.7 13.9 12.0 17.8 18.4 19.9 12.2 12.0 13.1
RoA (%)
MidCap
Rallis India 229 300 Buy 4,455 15.3 9.4 11.6 15.0 24.4 19.8 15.1 13.5 11.1 19.9 21.6 23.6 15.6 15.2 17.0
Swaraj Engines 2,021 2,570 Buy 2,510 55.4 69.0 80.2 36.5 29.3 25.2 21.7 17.9 15.1 31.2 36.4 39.8 24.3 28.4 31.2
VST Tillers & Tractors 2,173 2,200 Hold 1,877 83.0 99.8 100.1 26.2 21.8 21.7 17.0 14.7 12.5 19.2 21.1 19.8 14.2 15.8 14.1
KSB Pumps 725 850 Buy 2,524 18.8 19.7 25.6 38.6 36.8 28.3 23.3 21.5 16.7 10.6 10.4 13.0 10.1 9.9 11.9
RoA (%)
Oil & Gas
GAIL 448 440 Buy 75,737 15.5 25.9 27.9 28.8 17.3 16.1 12.0 9.8 9.7 12.4 13.8 13.5 9.2 10.7 10.7
Gulf Oil 773 827 Hold 3,841 24.4 26.5 29.4 31.7 29.2 26.3 20.9 19.4 16.8 36.6 38.3 38.7 34.2 32.0 29.4
HPCL 441 425 Hold 67,223 40.7 34.8 36.5 10.8 12.7 12.1 8.3 8.4 7.9 20.1 15.4 15.2 30.5 23.2 21.9
IGL 1,435 1,300 Hold 20,090 40.8 46.8 50.4 35.2 30.6 28.5 20.3 17.3 15.6 24.0 24.0 22.3 17.3 17.0 15.8
MRPL 127 150 Buy 22,188 20.8 11.5 14.0 6.1 11.0 9.0 6.1 6.2 5.4 31.7 16.9 19.7 20.3 17.9 19.2
ONGC 174 178 Hold 223,298 13.9 14.4 16.1 12.5 12.1 10.8 5.8 4.6 4.0 12.7 13.4 14.1 9.6 9.8 10.5
Petronet LNG 242 240 Buy 36,338 11.4 12.2 13.9 21.3 19.8 17.4 14.5 11.8 10.7 23.1 27.0 31.1 16.8 18.6 20.2
Castrol 362 375 Hold 17,903 13.6 12.4 13.4 26.5 29.2 27.1 16.7 18.7 17.3 198.1 244.4 288.8 113.3 136.7 159.2
GSPL 196 174 Buy 11,022 8.8 12.4 13.1 22.2 15.8 14.9 12.2 8.6 8.0 14.2 18.6 17.7 9.1 12.1 11.2
Gujarat Gas 910 890 Buy 12,529 16.2 34.5 44.5 56.2 26.4 20.4 19.8 13.2 11.1 10.4 16.5 18.6 12.0 22.0 23.2
BPCL 486 485 Hold 105,480 40.9 33.8 42.0 11.9 14.4 11.6 - - - 20.5 18.0 17.2 27.1 21.1 26.4
Mahanagar Gas Ltd 1,122 1,206 Buy 11,083 39.8 51.2 53.6 28.2 21.9 20.9 16.6 12.5 11.8 30.4 34.5 32.0 18.5 21.6 19.8
Sector / Company CMP Target Price Rating Market CapEPS (Rs) P/E (x) EV/EBITDA (x) RoCE (%) RoE (%)
CMP as on Oct 6 , 2017, * UR= Under Review
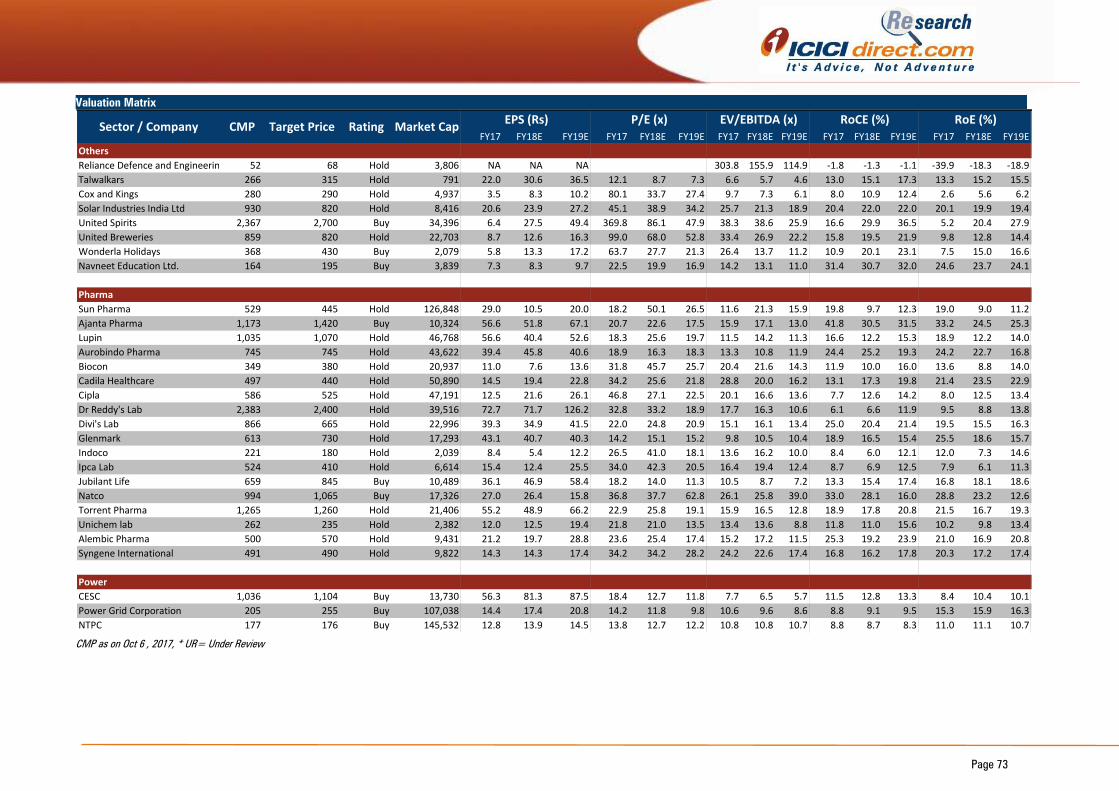
Page 73
Valuation Matrix
FY17 FY18E FY19E FY17 FY18E FY19E FY17 FY18E FY19E FY17 FY18E FY19E FY17 FY18E FY19E
Others
Reliance Defence and Engineering 52 68 Hold 3,806 NA NA NA 303.8 155.9 114.9 -1.8 -1.3 -1.1 -39.9 -18.3 -18.9
Talwalkars 266 315 Hold 791 22.0 30.6 36.5 12.1 8.7 7.3 6.6 5.7 4.6 13.0 15.1 17.3 13.3 15.2 15.5
Cox and Kings 280 290 Hold 4,937 3.5 8.3 10.2 80.1 33.7 27.4 9.7 7.3 6.1 8.0 10.9 12.4 2.6 5.6 6.2
Solar Industries India Ltd 930 820 Hold 8,416 20.6 23.9 27.2 45.1 38.9 34.2 25.7 21.3 18.9 20.4 22.0 22.0 20.1 19.9 19.4
United Spirits 2,367 2,700 Buy 34,396 6.4 27.5 49.4 369.8 86.1 47.9 38.3 38.6 25.9 16.6 29.9 36.5 5.2 20.4 27.9
United Breweries 859 820 Hold 22,703 8.7 12.6 16.3 99.0 68.0 52.8 33.4 26.9 22.2 15.8 19.5 21.9 9.8 12.8 14.4
Wonderla Holidays 368 430 Buy 2,079 5.8 13.3 17.2 63.7 27.7 21.3 26.4 13.7 11.2 10.9 20.1 23.1 7.5 15.0 16.6
Navneet Education Ltd. 164 195 Buy 3,839 7.3 8.3 9.7 22.5 19.9 16.9 14.2 13.1 11.0 31.4 30.7 32.0 24.6 23.7 24.1
RoA (%)
Pharma
Sun Pharma 529 445 Hold 126,848 29.0 10.5 20.0 18.2 50.1 26.5 11.6 21.3 15.9 19.8 9.7 12.3 19.0 9.0 11.2
Ajanta Pharma 1,173 1,420 Buy 10,324 56.6 51.8 67.1 20.7 22.6 17.5 15.9 17.1 13.0 41.8 30.5 31.5 33.2 24.5 25.3
Lupin 1,035 1,070 Hold 46,768 56.6 40.4 52.6 18.3 25.6 19.7 11.5 14.2 11.3 16.6 12.2 15.3 18.9 12.2 14.0
Aurobindo Pharma 745 745 Hold 43,622 39.4 45.8 40.6 18.9 16.3 18.3 13.3 10.8 11.9 24.4 25.2 19.3 24.2 22.7 16.8
Biocon 349 380 Hold 20,937 11.0 7.6 13.6 31.8 45.7 25.7 20.4 21.6 14.3 11.9 10.0 16.0 13.6 8.8 14.0
Cadila Healthcare 497 440 Hold 50,890 14.5 19.4 22.8 34.2 25.6 21.8 28.8 20.0 16.2 13.1 17.3 19.8 21.4 23.5 22.9
Cipla 586 525 Hold 47,191 12.5 21.6 26.1 46.8 27.1 22.5 20.1 16.6 13.6 7.7 12.6 14.2 8.0 12.5 13.4
Dr Reddy's Lab 2,383 2,400 Hold 39,516 72.7 71.7 126.2 32.8 33.2 18.9 17.7 16.3 10.6 6.1 6.6 11.9 9.5 8.8 13.8
Divi's Lab 866 665 Hold 22,996 39.3 34.9 41.5 22.0 24.8 20.9 15.1 16.1 13.4 25.0 20.4 21.4 19.5 15.5 16.3
Glenmark 613 730 Hold 17,293 43.1 40.7 40.3 14.2 15.1 15.2 9.8 10.5 10.4 18.9 16.5 15.4 25.5 18.6 15.7
Indoco 221 180 Hold 2,039 8.4 5.4 12.2 26.5 41.0 18.1 13.6 16.2 10.0 8.4 6.0 12.1 12.0 7.3 14.6
Ipca Lab 524 410 Hold 6,614 15.4 12.4 25.5 34.0 42.3 20.5 16.4 19.4 12.4 8.7 6.9 12.5 7.9 6.1 11.3
Jubilant Life 659 845 Buy 10,489 36.1 46.9 58.4 18.2 14.0 11.3 10.5 8.7 7.2 13.3 15.4 17.4 16.8 18.1 18.6
Natco 994 1,065 Buy 17,326 27.0 26.4 15.8 36.8 37.7 62.8 26.1 25.8 39.0 33.0 28.1 16.0 28.8 23.2 12.6
Torrent Pharma 1,265 1,260 Hold 21,406 55.2 48.9 66.2 22.9 25.8 19.1 15.9 16.5 12.8 18.9 17.8 20.8 21.5 16.7 19.3
Unichem lab 262 235 Hold 2,382 12.0 12.5 19.4 21.8 21.0 13.5 13.4 13.6 8.8 11.8 11.0 15.6 10.2 9.8 13.4
Alembic Pharma 500 570 Hold 9,431 21.2 19.7 28.8 23.6 25.4 17.4 15.2 17.2 11.5 25.3 19.2 23.9 21.0 16.9 20.8
Syngene International 491 490 Hold 9,822 14.3 14.3 17.4 34.2 34.2 28.2 24.2 22.6 17.4 16.8 16.2 17.8 20.3 17.2 17.4
RoA (%)
Power
CESC 1,036 1,104 Buy 13,730 56.3 81.3 87.5 18.4 12.7 11.8 7.7 6.5 5.7 11.5 12.8 13.3 8.4 10.4 10.1
Power Grid Corporation 205 255 Buy 107,038 14.4 17.4 20.8 14.2 11.8 9.8 10.6 9.6 8.6 8.8 9.1 9.5 15.3 15.9 16.3
NTPC 177 176 Buy 145,532 12.8 13.9 14.5 13.8 12.7 12.2 10.8 10.8 10.7 8.8 8.7 8.3 11.0 11.1 10.7
RoE (%)Market Cap
EPS (Rs) P/E (x) EV/EBITDA (x) RoCE (%)Sector / Company CMP Target Price Rating
CMP as on Oct 6 , 2017, * UR= Under Review

Page 74
Valuation Matrix
FY17 FY18E FY19E FY17 FY18E FY19E FY17 FY18E FY19E FY17 FY18E FY19E FY17 FY18E FY19E
Real Estate
Oberoi Realty 423 435 Hold 14,365 11.2 20.1 25.3 37.9 21.1 16.7 25.0 12.7 10.3 8.6 15.0 17.0 6.7 11.0 12.4
Mahindra Lifespace 467 605 Buy 2,578 24.9 21.5 30.1 18.8 21.7 15.5 50.7 34.1 21.0 4.7 5.0 6.3 6.0 5.4 7.1
Sunteck Realty Ltd 330 285 Buy 4,152 17.3 21.1 26.9 19.0 15.7 12.3 10.8 8.8 6.4 12.9 15.2 18.5 11.6 12.6 14.2
RoA (%)
Retail
TTK Prestige 6,100 5,300 Sell 7,101 129.3 219.1 171.0 47.2 27.8 35.7 33.3 27.6 23.2 18.5 20.2 22.6 17.6 25.1 17.4
Shopper Stop 510 650 Buy 4,255 -2.4 5.3 9.7 NM 96.4 52.7 25.5 19.5 15.9 5.6 9.3 11.4 -2.6 4.8 8.1
Titan Industries 598 630 Hold 53,107 8.6 11.8 15.0 69.7 50.6 39.9 43.9 36.0 28.9 33.0 33.5 34.7 17.7 20.6 21.7
Bata India 740 880 Buy 9,505 12.4 17.9 22.0 59.9 41.4 33.5 31.7 24.9 20.2 29.5 37.6 39.6 12.0 15.3 16.5
Trent Ltd. 318 310 Buy 10,576 2.0 3.1 4.1 156.4 101.3 76.8 80.9 57.4 47.3 7.4 9.4 11.0 3.8 8.2 11.0
Aditya Birla Fashion & Retail 161 210 Buy 12,454 0.7 1.4 2.6 232.5 114.1 62.0 33.0 27.2 21.6 7.5 9.7 12.8 5.6 10.2 15.8
RoA (%)
Road
IRB Infrastructure 209 240 Hold 7,335 21.5 25.5 26.1 9.7 8.2 8.0 7.4 6.0 4.2 6.2 6.4 7.4 13.6 14.2 13.0
Ashoka Buildcon 195 210 Buy 3,656 -0.5 -3.4 0.8 NM NM 237.5 9.2 8.4 7.4 5.2 5.2 6.2 -0.5 -3.5 0.9
PNC Infratech 149 155 Buy 3,822 8.2 6.9 10.3 18.2 21.5 14.4 15.4 12.7 8.6 14.2 12.8 17.4 9.8 10.4 13.6
Sadbhav Engineering 287 350 Buy 4,923 11.0 13.6 12.4 26.2 21.1 23.2 18.0 14.4 12.1 10.5 11.2 12.7 11.5 12.7 10.5
RoA (%)
Telecom
Bharti Airtel 1,000 450 Buy 202,521 9.5 3.1 7.1 105.2 322.7 140.3 7.2 8.4 7.8 8.4 5.9 7.0 7.6 1.9 4.2
Bharti Infratel 400 410 Hold 73,910 14.9 15.7 17.7 26.9 25.5 22.6 12.4 11.2 10.3 20.1 23.2 24.8 17.7 19.1 21.4
Idea Cellular 74 85 Hold 26,528 -1.1 -11.1 -10.6 NM NM NM 7.6 12.2 11.5 3.3 -1.8 -1.4 -1.6 -19.3 -22.5
Tata Communications 706 670 Hold 20,124 43.3 12.5 21.1 16.3 56.4 33.5 11.2 10.3 8.5 6.1 7.4 10.3 17.2 20.8 28.9
Sterlite Technologies Ltd. 223 230 Buy 8,913 5.1 6.8 8.8 44.0 32.7 25.2 18.8 14.4 11.6 16.1 19.9 21.8 22.9 25.2 26.3
Sector / Company CMP Target Price Rating Market CapEPS (Rs) P/E (x) EV/EBITDA (x) RoCE (%) RoE (%)
CMP as on Oct 6 , 2017, * UR= Under Review
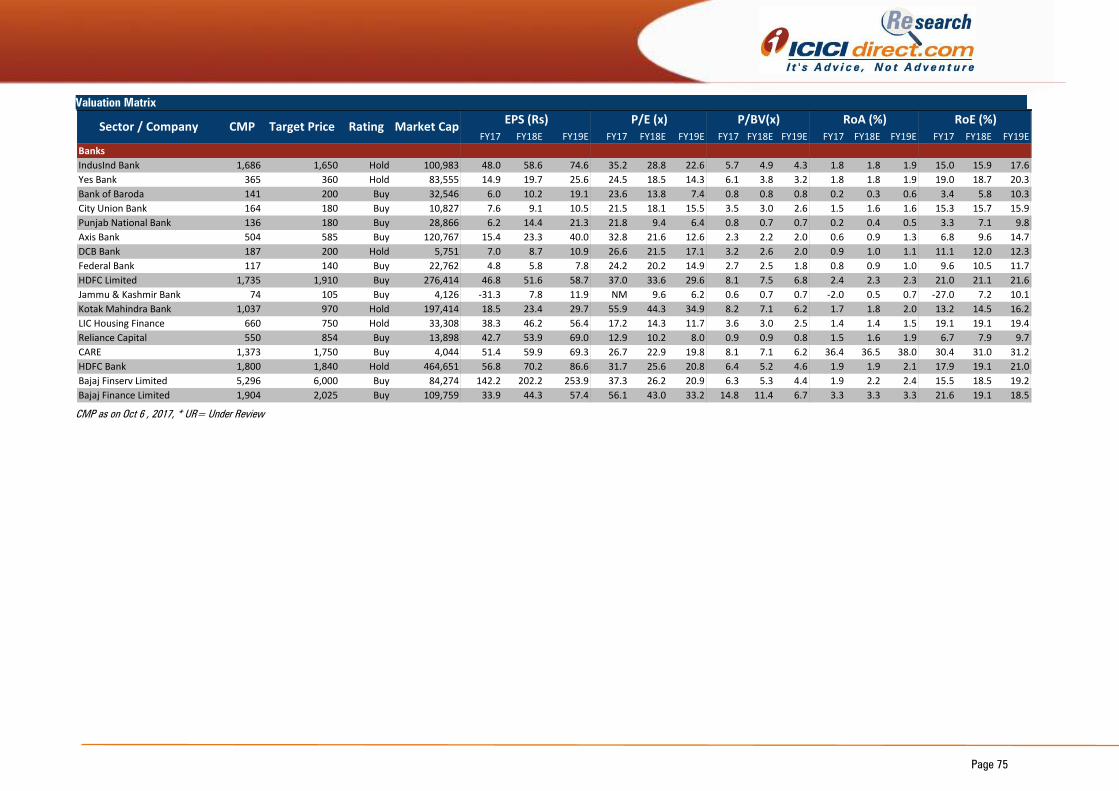
Page 75
Valuation Matrix
FY17 FY18E FY19E FY17 FY18E FY19E FY17 FY18E FY19E FY17 FY18E FY19E FY17 FY18E FY19E
Banks
IndusInd Bank 1,686 1,650 Hold 100,983 48.0 58.6 74.6 35.2 28.8 22.6 5.7 4.9 4.3 1.8 1.8 1.9 15.0 15.9 17.6
Yes Bank 365 360 Hold 83,555 14.9 19.7 25.6 24.5 18.5 14.3 6.1 3.8 3.2 1.8 1.8 1.9 19.0 18.7 20.3
Bank of Baroda 141 200 Buy 32,546 6.0 10.2 19.1 23.6 13.8 7.4 0.8 0.8 0.8 0.2 0.3 0.6 3.4 5.8 10.3
City Union Bank 164 180 Buy 10,827 7.6 9.1 10.5 21.5 18.1 15.5 3.5 3.0 2.6 1.5 1.6 1.6 15.3 15.7 15.9
Punjab National Bank 136 180 Buy 28,866 6.2 14.4 21.3 21.8 9.4 6.4 0.8 0.7 0.7 0.2 0.4 0.5 3.3 7.1 9.8
Axis Bank 504 585 Buy 120,767 15.4 23.3 40.0 32.8 21.6 12.6 2.3 2.2 2.0 0.6 0.9 1.3 6.8 9.6 14.7
DCB Bank 187 200 Hold 5,751 7.0 8.7 10.9 26.6 21.5 17.1 3.2 2.6 2.0 0.9 1.0 1.1 11.1 12.0 12.3
Federal Bank 117 140 Buy 22,762 4.8 5.8 7.8 24.2 20.2 14.9 2.7 2.5 1.8 0.8 0.9 1.0 9.6 10.5 11.7
HDFC Limited 1,735 1,910 Buy 276,414 46.8 51.6 58.7 37.0 33.6 29.6 8.1 7.5 6.8 2.4 2.3 2.3 21.0 21.1 21.6
Jammu & Kashmir Bank 74 105 Buy 4,126 -31.3 7.8 11.9 NM 9.6 6.2 0.6 0.7 0.7 -2.0 0.5 0.7 -27.0 7.2 10.1
Kotak Mahindra Bank 1,037 970 Hold 197,414 18.5 23.4 29.7 55.9 44.3 34.9 8.2 7.1 6.2 1.7 1.8 2.0 13.2 14.5 16.2
LIC Housing Finance 660 750 Hold 33,308 38.3 46.2 56.4 17.2 14.3 11.7 3.6 3.0 2.5 1.4 1.4 1.5 19.1 19.1 19.4
Reliance Capital 550 854 Buy 13,898 42.7 53.9 69.0 12.9 10.2 8.0 0.9 0.9 0.8 1.5 1.6 1.9 6.7 7.9 9.7
CARE 1,373 1,750 Buy 4,044 51.4 59.9 69.3 26.7 22.9 19.8 8.1 7.1 6.2 36.4 36.5 38.0 30.4 31.0 31.2
HDFC Bank 1,800 1,840 Hold 464,651 56.8 70.2 86.6 31.7 25.6 20.8 6.4 5.2 4.6 1.9 1.9 2.1 17.9 19.1 21.0
Bajaj Finserv Limited 5,296 6,000 Buy 84,274 142.2 202.2 253.9 37.3 26.2 20.9 6.3 5.3 4.4 1.9 2.2 2.4 15.5 18.5 19.2
Bajaj Finance Limited 1,904 2,025 Buy 109,759 33.9 44.3 57.4 56.1 43.0 33.2 14.8 11.4 6.7 3.3 3.3 3.3 21.6 19.1 18.5
Sector / Company CMP Target Price Rating Market CapEPS (Rs) P/E (x) P/BV(x) RoA (%) RoE (%)
CMP as on Oct 6 , 2017, * UR= Under Review

Pankaj Pandey Head – Research [email protected]
ICICIdirect.com Research Desk,
ICICI Securities Limited,
1st Floor, Akruti Trade Centre,
Road No 7, MIDC,
Andheri (East)
Mumbai – 400 093
Disclaimer
ANALYST CERTIFICATION
We /I, Pankaj Pandey, Research Analysts, authors and the names subscribed to this report, hereby certify that all of the views expressed in this research report accurately reflect our views about the
subject issuer(s) or securities. We also certify that no part of our compensation was, is, or will be directly or indirectly related to the specific recommendation(s) or view(s) in this report.
Terms & conditions and other disclosures:
ICICI Securities Limited (ICICI Securities) is a full-service, integrated investment banking and is, inter alia, engaged in the business of stock brokering and distribution of financial products. ICICI Securities
Limited is a Sebi registered Research Analyst with Sebi Registration Number – INH000000990. ICICI Securities is a wholly-owned subsidiary of ICICI Bank which is India’s largest private sector bank and
has its various subsidiaries engaged in businesses of housing finance, asset management, life insurance, general insurance, venture capital fund management, etc. (“associates”), the details in respect of
which are available on www.icicibank.com.
ICICI Securities is one of the leading merchant bankers/ underwriters of securities and participate in virtually all securities trading markets in India. We and our associates might have investment banking
and other business relationship with a significant percentage of companies covered by our Investment Research Department. ICICI Securities generally prohibits its analysts, persons reporting to analysts
and their relatives from maintaining a financial interest in the securities or derivatives of any companies that the analysts cover.
The information and opinions in this report have been prepared by ICICI Securities and are subject to change without any notice. The report and information contained herein is strictly confidential and
meant solely for the selected recipient and may not be altered in any way, transmitted to, copied or distributed, in part or in whole, to any other person or to the media or reproduced in any form,
without prior written consent of ICICI Securities. While we would endeavour to update the information herein on a reasonable basis, ICICI Securities is under no obligation to update or keep the
information current. Also, there may be regulatory, compliance or other reasons that may prevent ICICI Securities from doing so. Non-rated securities indicate that rating on a particular security has been
suspended temporarily and such suspension is in compliance with applicable regulations and/or ICICI Securities policies, in circumstances where ICICI Securities might be acting in an advisory capacity
to this company, or in certain other circumstances.
This report is based on information obtained from public sources and sources believed to be reliable, but no independent verification has been made nor is its accuracy or completeness guaranteed.
This report and information herein is solely for informational purpose and shall not be used or considered as an offer document or solicitation of offer to buy or sell or subscribe for securities or other
financial
instruments. Though disseminated to all the customers simultaneously, not all customers may receive this report at the same time. ICICI Securities will not treat recipients as customers by virtue of their
receiving this report. Nothing in this report constitutes investment, legal, accounting and tax advice or a representation that any investment or strategy is suitable or appropriate to your specific
circumstances. The securities discussed and opinions expressed in this report may not be suitable for all investors, who must make their own investment decisions, based on their own investment
objectives, financial positions and needs of specific recipient. This may not be taken in substitution for the exercise of independent judgment by any recipient. The recipient should independently
evaluate the investment risks. The value and return on investment may vary because of changes in interest rates, foreign exchange rates or any other reason. ICICI Securities accepts no liabilities
whatsoever for any loss or damage of any kind arising out of the use of this report. Past performance is not necessarily a guide to future performance. Investors are advised to see Risk Disclosure
Document to understand the risks associated before investing in the securities markets. Actual results may differ materially from those set forth in projections. Forward-looking statements are not
predictions and may be subject to change without notice.
ICICI Securities or its associates might have managed or co-managed public offering of securities for the subject company or might have been mandated by the subject company for any other
assignment in the past twelve months.
ICICI Securities or its associates might have received any compensation from the companies mentioned in the report during the period preceding twelve months from the date of this report for services
in respect of managing or co-managing public offerings, corporate finance, investment banking or merchant banking, brokerage services or other advisory service in a merger or specific transaction.
ICICI Securities or its associates might have received any compensation for products or services other than investment banking or merchant banking or brokerage services from the companies
mentioned in the report in the past twelve months.
ICICI Securities encourages independence in research report preparation and strives to minimize conflict in preparation of research report. ICICI Securities or its associates or its analysts did not receive
any compensation or other benefits from the companies mentioned in the report or third party in connection with preparation of the research report. Accordingly, neither ICICI Securities nor Research
Analysts and their relatives have any material conflict of interest at the time of publication of this report.
It is confirmed that Pankaj Pandey Research Analysts of this report have not received any compensation from the companies mentioned in the report in the preceding twelve months.
Compensation of our Research Analysts is not based on any specific merchant banking, investment banking or brokerage service transactions.
ICICI Securities or its subsidiaries collectively or Research Analysts or their relatives do not own 1% or more of the equity securities of the Company mentioned in the report as of the last day of the
month preceding the publication of the research report.
Since associates of ICICI Securities are engaged in various financial service businesses, they might have financial interests or beneficial ownership in various companies including the subject
company/companies mentioned in this report.
It is confirmed that Pankaj Pandey Research Analysts do not serve as an officer, director or employee of the companies mentioned in the report.
ICICI Securities may have issued other reports that are inconsistent with and reach different conclusion from the information presented in this report.
Neither the Research Analysts nor ICICI Securities have been engaged in market making activity for the companies mentioned in the report.
We submit that no material disciplinary action has been taken on ICICI Securities by any Regulatory Authority impacting Equity Research Analysis activities.
This report is not directed or intended for distribution to, or use by, any person or entity who is a citizen or resident of or located in any locality, state, country or other jurisdiction, where such
distribution, publication, availability or use would be contrary to law, regulation or which would subject ICICI Securities and affiliates to any registration or licensing requirement within such jurisdiction.
The securities
described herein may or may not be eligible for sale in all jurisdictions or to certain category of investors. Persons in whose possession this document may come are required to inform themselves of
and to observe such restriction.
ICICI Securities has received an investment banking mandate from Government of India for disinvestment in ONGC. This report is prepared based on publicly available information.
ICICI Securities has received an investment banking mandate from Government of India for disinvestment in Bharat Heavy Electricals Limited. This report is prepared based on publicly available
information.
ICICI Securities has received an investment banking mandate for disinvestment in NMDC Ltd. The report is prepared on the basis of publicly available information.