net worth predicts symptom burden at the end of life
TRANSCRIPT
JOURNAL OF PALLIATIVE MEDICINEVolume 8, Number 4, 2005© Mary Ann Liebert, Inc.
Net Worth Predicts Symptom Burden at the End of Life
MARIA J. SILVEIRA, M.D., M.A., M.P.H.,1,2 MOHAMMED U. KABETO, M.D.,2 andKENNETH M. LANGA, M.D., Ph.D.1–5
ABSTRACT
Objectives: To explore the predictors of symptom burden at the end of life.Design: Observational, secondary analysis of Health and Retirement Study (HRS) data.Setting: USA.Participants: Two thousand six hundred four deceased, older adults.Methods: Multivariate Poisson and logistic regression to explore the relationship between
sociodemographic and clinical factors with symptoms. Results: Fatigue, pain, dyspnea, depression, and anorexia were common and severe; 58% of
participants experienced more than 3 of these during their last year of life. Sociodemographicand clinical factors were associated with the number of symptoms as well as the presence ofpain, depression, and dyspnea alone. Decedents in the highest quartile of net worth had fewersymptoms (incident rate ratio [IRR] 0.90, confidence interval [CI] 0.85–0.96) and less pain (oddsratio [OR] 0.66, CI 0.51–0.85) than comparisons did. Patients with cancer experienced morepain (OR 2.02, CI 1.62–2.53) and depression (OR 1.31, CI 1.07–1.61). Patients experienced moredepression (OR 2.37, CI 1.85–3.03) and dyspnea (OR 1.40, CI 1.09–1.78).
Limitation: Use of proxy reports for primary data.Conclusion: Older Americans experience a large symptom burden in the last year of life,
largely with treatable symptoms such as pain, dyspnea, and depression. The adequacy ofsymptom control relates to clinical factors as well as net worth. This association betweensymptoms and wealth suggests that access to health care and other social services beyondthose covered by Medicare may be important in decreasing symptom burden at the end oflife.
827
INTRODUCTION
IT IS A SAD REALITY that for most Americans ac-cess to good palliative and hospice care is lim-
ited. A recent national survey on the status ofend-of-life care reported that among all U.S. hos-
pitals only 14% offer palliative care, 23% offerhospice care, and 42% have comprehensive painservices.1 While these numbers motivate im-proving end-of-life care for all, there is good rea-son to focus special attention upon the plight ofolder adults.
1VA Health Services Research & Development Center of Excellence, VA Ann Arbor Healthcare System, Ann Ar-bor, Michigan.
2Division of General Medicine, University of Michigan Medical School, Ann Arbor, Michigan.3Survey Research Center, Institute for Social Research, Ann Arbor, Michigan.4Patient Safety Enhancement Program, University of Michigan Health System, Ann Arbor, Michigan.5SGIM Collaborative Center for Research and Education in the Care of Older Adults, Ann Arbor, Michigan.

Not only do older adults represent the fastestgrowing segment of the U.S. population,2 butthey carry an especially high symptom burden.Desbiens et al.3 showed that among seriously ill,hospitalized elders, 50% experience pain in theyear after their hospitalization. Among elders innursing homes, the estimates are even higher.4–9
Lynn et al.10 showed that in the last 3 days of life,40% of elders experience severe pain, 80% severefatigue, and 25% moderate dysphoria—higherlevels than those reported among equally sick,younger patients.11
To date, no study has thoroughly explored thedeterminants of symptom burden among olderadults. Studies of predictors of symptom burdenamong seriously ill, younger patients have shownthat clinical (e.g., comorbidities, age, cognitivestatus, and depression), sociodemographic (e.g.,caregiver support, gender, and ethnicity), andsystemic factors (e.g., hospital and region) are im-portant3,12,13 patients’ wishes for comfort careand their wealth appear not to matter.14 It is un-clear if these factors would be the same for olderadults. Some factors, such as wealth and care-giver status, may be more salient to older adultsthan to younger ones. To improve the end-of-lifecare of the older adults, we need to understandwhich mutable factors are associated with the ex-tent of symptom burden. Thus, we decided to ex-plore the determinants of symptom burdenamong older adults using a large, national data-base of deceased individuals which included clin-ical, sociodemographic, and geographic informa-tion.
MATERIALS AND METHODS
Study population
We used data from the Health and RetirementStudy (HRS), a biennial longitudinal survey of anationally representative cohort of U.S. adultsaged 50 or older.15 The HRS interviewed a cohortof individuals aged 70 or older in 1993, 1995, and1998. For those respondents who died after theseinterviews, data were collected from a proxywhen possible during the HRS 1995, 1998, or 2000exit interview. A total of 2832 HRS respondentsdied between 1993 and 1998. After excludingdecedents who were younger than 70 at the timeof death (29; 1%), lacked age data (35; 1%), orlacked a proxy interview (164; 6%), we were left
with a study population of 2604 (92%) represent-ing 7.9 million elderly U.S. residents.
The Health and Retirement Study
The HRS, funded by the National Institute onAging and performed by the Institute for SocialResearch at the University of Michigan, is de-signed to provide representative data on the ag-ing of the U.S. population. HRS questionnairetopics include: health, cognitive status, retirementplanning, subjective probabilities, family struc-ture, caregiving, employment status, job de-mands, disability, and demographics, housing,income, net worth, health insurance and pensionplans. For more details about HRS sampling andresponse rates, data collection procedures, andmeasures, see Juster and Suzman,15 and the HRSweb site at �www.hrsonline.isr.umich.edu/�.
Dependent variables
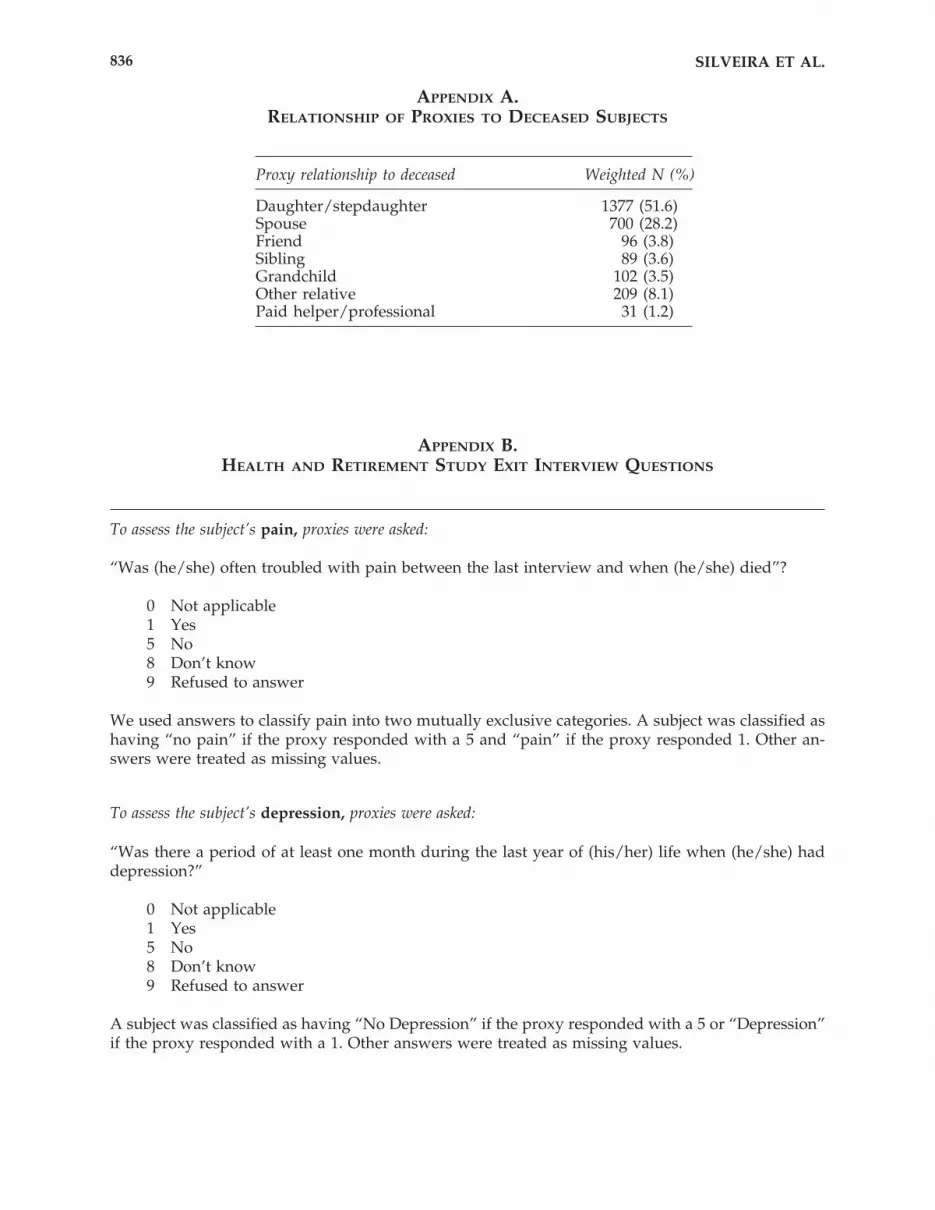
The HRS asked proxies to report on the dece-dent’s pain, depression, delirium, dyspnea, fa-tigue, and anorexia. For pain, proxies were askedif the decedent, “was often troubled with pain be-tween the last interview and when he died.” Forall other symptoms, proxies were asked, “Wasthere a period of at least 1 month during the lastyear of life when he had (this symptom)?” An-swers to these questions were dichotomized andused as our outcomes of interest. We took par-ticular interest in pain, depression, and dyspnea,because in comparison to other symptoms expe-rienced at the end of life, they are treatable andnot an inevitable part of the dying process (as fa-tigue, anorexia, or delirium might be).
In addition, we explored overall symptom bur-den, defined as the total number of symptoms.Symptom burden was determined by summingthe number of affirmative answers to the 6 symp-tom questions. Hence, symptom burden couldrange from 0 to 6.
Independent variables
We explored clinical, sociodemographic, andeconomic factors. Clinical factors that we consid-ered included: age (categorized as 70–79, 80–89,and 90 or older), gender (categorized as male orfemale), smoking status (categorized as yes orno), history of alcohol abuse (categorized as yesor no), history of cognitive impairment (definedby “fair” or “poor” memory 1 month prior to
SILVEIRA ET AL.828

death as assessed by the proxy respondent), andchronic conditions (presence of cancer, lung,heart, or cerebrovascular disease). Sociodemo-graphic factors that we explored included: ethnicity (categorized as white, black, or other),living arrangement (categorized as married, unmarried cohabitating, and unmarried livingalone), and educational attainment (categorizedas no education, less than high school, and highschool and above). Economic variables includedhousehold net worth16 (categorized into quar-tiles: less than $10,400, $10,400–$70,000, $70,000–$182,000, and more than $182,000) and Medicarecoverage (categorized as yes or no). Other vari-ables we considered were geographic region (cat-egorized as Northeast, Midwest, Southeast, andWest), year of death, and any visit for health care(defined as any overnight stay at a hospital, nurs-ing home, or hospice) during the last year of life(categorized as yes or no).
Analyses
We used Poisson regression to explore the as-sociation between these factors and total symp-tom burden (categorized into four mutually ex-clusive categories: 0, 1–2, 3–4, and 5–6). We usedlogistic regression to explore the association be-tween the independent variables (i.e. clinical, so-ciodemographic, and economic factors) and thepresence of pain, depression and dyspnea. We ac-counted for the complex sampling design of theHRS in our analyses.15,16 All statistical analyseswere performed using STATA 7.0 software (StataCorporation, College Station, TX).
Ethical considerations
This study was approved by the Health Sci-ences Institutional Review Board at the Univer-sity of Michigan. At the time this study was done,Drs. Silveira and Langa had no conflicts of inter-est that may have influenced this work; neithercurrently receives industry funding.
RESULTS
Study population
Our final study population consisted of 2604older adults in the HRS who died between 1993and 2000 and whose proxies had responded toexit surveys administered in 1995, 1998, or 2000
(2604 represents 94% of the HRS subjects whodied during our study period). The characteris-tics of our study population are summarized inTable 1. Subjects’ ages at the time of death rangedfrom 70 to 108, with a median age of 84. The pop-ulation was mostly female (56%), white (89%),and married (40%). Subjects came from through-out the United States: 38% from the Southeast,25% from the Midwest, 20% from the Northeast,and 17% from the West. Most, 85%, suffered fromat least one chronic condition including: heartdisease (55%), cognitive impairment (42%), can-cer (34%), stroke (32%), and lung disease (22%).
Proxies reported that the majority of subjectshad died expectedly (59%) and in hospital (39%)as opposed to home (29%), nursing home (25%),or hospice (3%). Most subjects (66%) had visiteda hospital, hospice, or nursing facility sometimein the last year. Proxy data was obtained an av-erage of 27 months (standard deviation [SD]3) af-ter the subject’s death.
Proxy population
Descriptive data on proxies was available onlyfor 700 proxies who themselves were enrolled inthe study (as spouses). Similar to our subjects,most proxies were white (89%) and married.Proxies’ ages ranged from 49 to 94 (with a me-dian of 70) prior to the death of the subject. Mostwere male (73%) and high school educated (67%).Proxies were interviewed a median of 13 monthsafter the decedent’s death (SD 8; range, 1–39).
Symptom prevalence and burden
Symptoms were widely prevalent within thestudy population (Table 1). Approximately halfof the study population was often troubled bypain (52%), depression (45%), or dyspnea (47%)from the time of their last interview and whenhe/she died. Among those with pain, proxies re-ported that most (59%) experienced pain at se-vere levels. Most subjects experienced one ormore symptoms (90%) with 58% experiencing atleast 3.
Pain was most common among individualswith cancer (63%), lung disease (58%), and car-diovascular disease (56%). Depression was mostcommon among individuals with cognitive im-pairment (57%). Dyspnea was most commonamong those with pulmonary disease (83%).
In a Poisson regression adjusting for the so-ciodemographic, clinical, and economic variables
SYMPTOM BURDEN 829
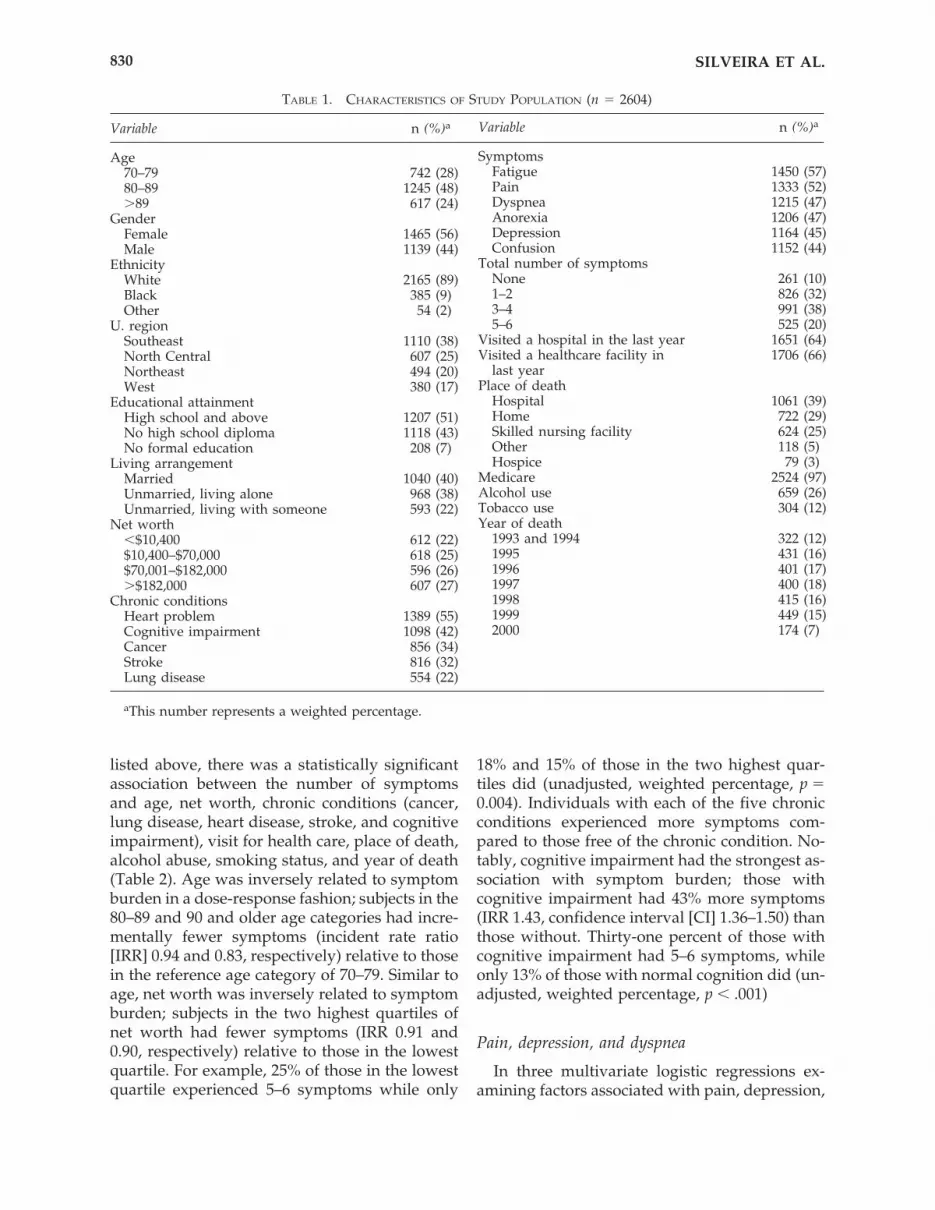
listed above, there was a statistically significantassociation between the number of symptomsand age, net worth, chronic conditions (cancer,lung disease, heart disease, stroke, and cognitiveimpairment), visit for health care, place of death,alcohol abuse, smoking status, and year of death(Table 2). Age was inversely related to symptomburden in a dose-response fashion; subjects in the80–89 and 90 and older age categories had incre-mentally fewer symptoms (incident rate ratio[IRR] 0.94 and 0.83, respectively) relative to thosein the reference age category of 70–79. Similar toage, net worth was inversely related to symptomburden; subjects in the two highest quartiles ofnet worth had fewer symptoms (IRR 0.91 and0.90, respectively) relative to those in the lowestquartile. For example, 25% of those in the lowestquartile experienced 5–6 symptoms while only
18% and 15% of those in the two highest quar-tiles did (unadjusted, weighted percentage, p �0.004). Individuals with each of the five chronicconditions experienced more symptoms com-pared to those free of the chronic condition. No-tably, cognitive impairment had the strongest as-sociation with symptom burden; those withcognitive impairment had 43% more symptoms(IRR 1.43, confidence interval [CI] 1.36–1.50) thanthose without. Thirty-one percent of those withcognitive impairment had 5–6 symptoms, whileonly 13% of those with normal cognition did (un-adjusted, weighted percentage, p � .001)
Pain, depression, and dyspnea
In three multivariate logistic regressions ex-amining factors associated with pain, depression,
SILVEIRA ET AL.830
TABLE 1. CHARACTERISTICS OF STUDY POPULATION (n � 2604)
Variable n (%)a
Age70–79 742 (28)80–89 1245 (48)�89 617 (24)
GenderFemale 1465 (56)Male 1139 (44)
EthnicityWhite 2165 (89)Black 385 (9)Other 54 (2)
U. regionSoutheast 1110 (38)North Central 607 (25)Northeast 494 (20)West 380 (17)
Educational attainmentHigh school and above 1207 (51)No high school diploma 1118 (43)No formal education 208 (7)
Living arrangementMarried 1040 (40)Unmarried, living alone 968 (38)Unmarried, living with someone 593 (22)
Net worth�$10,400 612 (22)$10,400–$70,000 618 (25)$70,001–$182,000 596 (26)�$182,000 607 (27)
Chronic conditionsHeart problem 1389 (55)Cognitive impairment 1098 (42)Cancer 856 (34)Stroke 816 (32)Lung disease 554 (22)
SymptomsFatigue 1450 (57)Pain 1333 (52)Dyspnea 1215 (47)Anorexia 1206 (47)Depression 1164 (45)Confusion 1152 (44)
Total number of symptomsNone 261 (10)1–2 826 (32)3–4 991 (38)5–6 525 (20)
Visited a hospital in the last year 1651 (64)Visited a healthcare facility in 1706 (66)
last yearPlace of death
Hospital 1061 (39)Home 722 (29)Skilled nursing facility 624 (25)Other 118 (5)Hospice 79 (3)
Medicare 2524 (97)Alcohol use 659 (26)Tobacco use 304 (12)Year of death
1993 and 1994 322 (12)1995 431 (16)1996 401 (17)1997 400 (18)1998 415 (16)1999 449 (15)2000 174 (7)
aThis number represents a weighted percentage.
Variable n (%)a

or dyspnea, there was an inverse and dose-re-lated relationship between age and presence ofthese symptoms (Table 3). For example, the old-est–old (90 or older) had lower risk for pain (OR0.69, CI 0.51–0.93), depression (OR 0.48, CI0.35–0.65), and dyspnea (OR 0.50, CI 0.35–0.70)compared to younger subjects.
Net worth was associated with pain but not de-pression or dyspnea. This relationship was in-verse and dose related as well; decedents in thehighest quartile of net worth had lower risk ofpain (OR 0.66, CI 0.51–0.85) compared to those inthe lowest quartile. The relationship between networth and depression and dyspnea followed the
same pattern (inverse and dose related), but wasnot statistically significant.
Chronic conditions were associated with allthree symptoms after adjusting for other factors.Pain was most likely among those with cancer(OR 2.02, CI 1.62–2.53) and heart disease (OR 1.50,CI 1.18–1.91). Depression was ubiquitously asso-ciated with all five chronic conditions; however,those with cognitive impairment seemed to carrythe greatest risk (OR 2.37, CI 1.85–3.03). Dyspneawas most likely among subjects with lung disease(OR 7.66, CI 5.93–9.90), heart disease (OR 2.28, CI1.86–2.79), and cognitive impairment (OR 1.40, CI1.09–1.78).
SYMPTOM BURDEN 831
TABLE 2. FACTORS RELATING TO TOTAL SYMPTOM BURDEN AMONG THE
OLDER ADULTS: RESULTS OF A MULTIVARIATE POISSON REGRESSION
Incidentrate ratio
Factor (IRR) 95% CI
Age 70–79 — —80–89 0.94 0.89–1.00�90 0.83 0.76–0.90
Gender Female 1.02 0.94–1.01Ethnicity White — —
Black 0.92 0.84–1.00Other 1.01 0.84–1.20
Region Northeast — —Southeast 1.03 0.94–1.16West 1.04 0.94–1.13Midwest 1.05 0.95–1.21
Education No formal education — —Less than high school 1.02 0.90–1.16High school and above 1.01 0.88–1.16
Living arrangement Living alone — —Unmarried, cohabitating 1.02 0.95–1.09Married 0.94 0.89–0.96
Net worth �$10,400 — —$10,400–$70,000 0.98 0.92–1.06$70,001–$182,000 0.91 0.85–0.98�$182,000 0.90 0.85–0.96
Chronic conditions Cancer 1.21 1.16–1.26Lung disease 1.23 1.16–1.30Stroke 1.04 1.00–1.09Heart disease 1.17 1.11–1.24Cognitive impairment 1.43 1.36–1.50
Healthcare visit 1.29 1.23–1.35Alcohol use 1.02 1.00–1.04Tobacco use 0.97 0.95–0.99Medicare 0.97 0.87–1.09Year of death 1993/1994 — —
1995 1.00 0.91–1.111996 1.18 1.10–1.281997 1.15 1.04–1.261998 1.16 1.05–1.291999 1.13 1.03–1.242000 1.10 0.98–1.23
CI, confidence interval.

DISCUSSION
In this nationally representative sample of morethan 2000 older individuals, we found that olderadults carry a great symptom burden in their lastyear of life, largely with symptoms that areamenable to treatment. Fatigue was the mostprevalent symptom, followed by pain, dyspnea,anorexia, depression and delirium—at frequenciesgreater than those observed among hospice pa-tients.17 Most older adults experienced multiplesymptoms, with over half experiencing at least 3—at levels similar to those reported for seriously, illhospitalized patients.3,10,11,14 Our findings suggestthat a general population of older adults in theirlast year of life suffer as much as do patients whomwe traditionally consider for palliative care, thatis, patients with life-limiting conditions and pa-tients who are severely ill and hospitalized. Be-cause our current health system provides pallia-
tive care mostly through hospice and inpatient pal-liative care services, our health care providers’radar may be set to miss older adults unless theycarry a life-limiting condition or become hospital-ized with organ failure. This is concerning becauseolder adults do not die in patterns that would iden-tify them for palliative care. Indeed, Lunney et al.18
showed that 47% of older adults Medicare dece-dents die of frailty (defined as a slow decline thatallows the patient to return home between staysin the hospital), rather than cancer (22%) or organsystem failure (16%). This may explain why stud-ies have consistently shown undertreatment ofpain among the older adults.4,13 To provide suchpatients with palliative care, we would need toeither consider advanced age a life-limiting con-dition or trigger palliative care not by condition orprognosis, but by the presence of symptoms.
It appears that clinical, sociodemographic, andlocal health system factors all may play a role in
SILVEIRA ET AL.832
TABLE 3. FACTORS RELATING TO PAIN, DEPRESSION, AND DYSPNEA AMONG THE
OLDER ADULTS: RESULTS OF MULTIVARIATE POISSON REGRESSION
OR (95% CI)
Factor Pain Depression Dyspnea
Age 70–79 — — —80–89 0.94 (0.72–1.21) 0.81 (0.61–1.04) 0.86 (0.69–1.06)�90 0.69 (0.51–0.93) 0.48 (0.35–0.65) 0.50 (0.35–0.70)
Gender Female 1.29 (0.98–1.71) 0.88 (0.67–1.16) 0.99 (0.83–1.18)Ethnicity White — — —
Black 0.85 (0.60–1.21) 0.86 (0.62–1.19) 0.85 (0.62–1.17)Other 1.20 (0.61–2.38) 0.89 (0.41–1.92) 0.83 (0.40–1.73)
Region Northeast — — —Southeast 1.05 (0.81–1.36) 1.02 (0.75–1.38) 1.10 (0.81–1.51)West 1.08 (0.80–1.46) 1.12 (0.79–1.59) 0.96 (0.56–1.64)Midwest 1.12 (0.80–1.55) 0.97 (0.69–1.35) 1.02 (0.70–1.48)
Education No formal education — — —Less than high school 1.00 (0.61–1.63) 1.03 (0.64–1.65) 0.86 (0.55–1.32)High school and above 0.76 (0.46–1.23) 1.07 (0.68–1.66) 1.02 (0.67–1.76)
Living arrangement Living alone — — —Unmarried, co-habitating 1.16 (0.90–1.48) 0.92 (0.72–1.18) 1.06 (0.78–1.45)Married 1.10 (0.61–1.63) 0.76 (0.59–0.97) 0.78 (0.58–1.03)
Net worth �$10,400 — — —$10,400–$70,000 0.99 (0.73–1.34) 0.87 (0.66–1.16) 0.85 (0.63–1.14)$70,000–$182,000 0.70 (0.53–0.93) 0.75 (0.56–1.00) 0.74 (0.50–1.08)�$182,000 0.66 (0.51–0.85) 0.84 (0.63–1.12) 0.76 (0.55–1.05)
Chronic conditions Cancer 2.02 (1.62–2.53) 1.31 (1.07–1.61) 1.08 (0.89–1.32)Lung disease 1.12 (0.87–1.45) 1.33 (1.04–1.69) 7.66 (5.93–9.90)Stroke 1.05 (0.85–1.30) 1.42 (1.13–1.77) 0.94 (0.77–1.15)Heart disease 1.50 (1.18–1.91) 1.52 (1.21–1.93) 2.28 (1.86–2.79)Cognitive impairment 0.97 (0.79–1.17) 2.37 (1.85–3.03) 1.40 (1.09–1.78)
Healthcare visit 1.79 (1.47–2.18) 1.47 (1.21–1.79) 1.64 (1.35–2.00)Alcohol use 1.04 (0.98–1.09) 1.02 (0.96–1.09) 1.01 (0.95–1.08)Tobacco use 0.88 (0.81–0.95) 0.94 (0.86–1.02) 0.85 (0.79–0.92)
aYear of death and Medicare status were adjusted for and are not shown (neither had a statistically significant relationship to the outcome of interest).
OR, odds ratio; CI, confidence interval.

symptom burden. In our study, age, comorbidi-ties (cancer, pulmonary disease, cardiovasculardisease, and cognitive impairment), visits to ahealth care provider, alcohol use, tobacco use,and net worth were all associated with symptomburden. Of these relationships, three are uniqueto the older adults and worthy of discussion.
We found that the oldest–old had the lowestrisk for overall symptom burden as well as pain,depression, and dyspnea individually. Otherstudies have reported that very advanced age isassociated with less pain19–22; we are the first toshow that this is true for other symptoms as well.Why is this so? It may be that those who surviveinto their 90s are a healthier group overall, onewith a lower disease burden and better functionalstatus than those who are chronically ill and diebefore reaching 90. This phenomenon is unlikelyto be due to a birth cohort effect because it hasbeen observed across birth cohorts since the1970s.22 There is the possibility that this findingis the result of an ascertainment bias, in that prox-ies may not interpret problems such as depres-sion and dyspnea in the oldest–old as “symp-toms” because they assume that these problemsare “part of old age.” Further research is neces-sary to determine if there are systematic differ-ences in how proxies interpret and report symp-toms for the oldest-old, as compared to youngerindividuals. Regardless of the explanation, find-ing that the oldest–old have fewer symptomsmeans that using age as a criterion for palliativecare would require that the cut-off be set low, atage 70 for example, where the specificity mightbe poor.
Seniors with cognitive impairment had thegreatest symptom burden, more than seniorswith cancer, pulmonary disease or cardiovascu-lar disease. This finding is not surprising giventhe lower rates of enrollment in hospice for pa-tients with dementia.23 Another possible expla-nation is that proxies may over-report symptomsexperienced by cognitively impaired patients;however, studies show that proxies can accu-rately report the symptoms of patients with mildto moderate cognitive impairment—this is not sowhen patients have advanced dementia.24
Individuals with cognitive impairment hadgreater relative risks for depression and dyspnea,but not pain. The relationship between depres-sion and cognitive impairment is well known;25
early stages of Alzheimer’s disease and other de-mentias frequently involve depressive symp-
toms. Why elders with cognitive impairmentmight experience more dyspnea, however, is un-clear; perhaps the functional decline, decondi-tioning, and aspiration associated with cognitivedecline increase the risk of dyspnea. That cogni-tive impairment was not associated with painmay be due to our method of pain assessment(i.e., by proxy); however, it is known that cogni-tively impaired older adults do experience amoderate decrease in pain in comparison to olderadults who are cognitively intact, even after ac-counting for the method of assessment.26
Our most unique and sobering finding is thatwealth was a strong predictor of symptom bur-den in older adults during the last year of life,even after adjusting for other sociodemographicvariables. Older adults belonging to the two high-est quartiles of net worth ($70,000–182,000 andmore than $182,000) had 9% and 10% lower risk(respectively) of high symptom burden (i.e., ahigher number of total symptoms) than did olderadults in the lowest quartile of wealth. When weexamined the relationship between wealth andpain, older adults belonging to the two highestquartiles of net worth had 30% and 36% lowerodds of experiencing pain. While the relation-ships between net worth and depression and dys-pnea were in the same direction (i.e., wealthierelders experienced less depression and dyspnea)these relationships were not statistically signifi-cant.
How might wealth affect the level symptomburden among older Americans? Most of ourstudy population was insured (97% hadMedicare) and most, 66%, saw a healthcare pro-vider at some point during their last year of life.What is it about their care that may explain whysymptoms persisted among the less privileged?We offer some potential explanations: elders ofhigher socioeconomic status may (1) express theirsymptoms more assertively and demand bettercare, (2) have more ready access to goods and ser-vices above and beyond what insurance provides,(3) have greater access to social capital (e.g., so-cial support from family and friends), or (4) re-side in settings with better quality of care.
Medicare-dependent older adults bear much fi-nancial responsibility for their care. Many outpa-tient services, supplies, and medications are notcovered by Medicare and must be paid for out ofpocket, leaving some older adults to prioritizeand limit treatments. Indeed, Steinman et al.27
showed that many older adults, especially those
SYMPTOM BURDEN 833

with low income, self-limit their medications be-cause of the high cost of medication. When giventhe choice between medications that may prolonglife, devices or services that may prolong inde-pendence, and those that might make the qualityof life better, some older adults may choose tosacrifice their comfort. Alternatively, physiciansmight make the choice for them when writingprescriptions. Patients’ general reluctance to takecertain medications with negative stigma, such asopiates or antidepressants, may make the deci-sion even clearer.
To break the connection between wealth andsymptom burden we might consider expandingMedicare’s services to include medications or ex-panding the criteria for hospice to include olderadults with significant symptom burden, regard-less of their prognosis. This would enable olderadults to access medications regardless of abilityto pay and would be consistent with CMS’s mis-sion to “improve access to services for under-served and vulnerable beneficiary populations,including eliminating health disparities.”
This study has a number of potential limita-tions relating to data collection. We relied on ret-rospective proxy reports for our outcomes of in-terest, and this raises several concerns: It isunclear how accurately proxy reports reflect sub-jects’ actual experiences. Proxy–subject concor-dance is known to depend on demographics, re-lationship, caregiver burden, expectations, hopes,emotions, and coping skills.24 Moreover, prospec-tive proxy reports are generally more reliablethan retrospective ones, as memories change withtime, and reports of objective symptoms (e.g.,vomiting and cough) are more reliable than thoseof subjective ones (e.g. pain and depression).24
However, our findings are consistent with thoseof others who have explored similar questionsbut collected data differently.10,13,17,19,20 In addi-tion, our findings have face validity, that is, pa-tients with cardiovascular disease experiencedpain and dyspnea, and those with pulmonary dis-ease experienced dyspnea. Proxy reports ofchronic conditions may not reflect true diagnoses.When proxies were asked if patients were de-pressed, it is unclear if an affirmative answermeans the subject felt blue or carried a DSM IVdiagnosis of depression. Except for pain, symp-toms were measured in only one realm—theirpresence, not their severity or their timing. More-over, we could not ascertain whether and howsymptoms were treated.
These findings demonstrate the need for wide-spread institution of symptom assessment andmanagement for older adults throughout all thehealth care settings they frequent—hospitals,clinics, and nursing homes. However, the ulti-mate success of such programs may be limited byelders’ ability to pay for goods and services thatare not covered by Medicare. Further researchinto the relationship between wealth and symp-tom burden is necessary to better identify possi-ble causal mechanisms leading from poverty topoor symptom control, and appropriate clinicaland public policy interventions to decrease symp-tom burden at the end of life.
ACKNOWLEDGMENTS
Dr. Silveira was supported by the VA HealthServices Research & Development Center of Ex-cellence in Ann Arbor, the Division of GeneralMedicine at the University of Michigan, as wellas a Robert Wood Johnson Generalist ScholarAward. Dr. Langa was supported by a Career De-velopment Award from the National Institute onAging (K08 AG19180), a New Investigator Re-search Grant from the Alzheimer’s Association,and a Paul Beeson Physician Faulty ScholarAward. The National Institute on Aging providedfunding for the Health and Retirement Study(U01 AG09740).
This paper was presented as a poster at theSGIM national meeting in May 2003.
Drs. Silveira and Langa had no conflicts of in-terest that may have influenced this work; nei-ther currently receives industry funding.
REFERENCES
1. National Hospice and Palliative Care Organization:Means to a Better End: A Report on Dying in America To-day. Washington, D.C.: Last Acts; November 2002.
2. Public Information Office: Census Analysis Tracks100 Years of Change. United States Department ofCommerce News 2002:CB02-CN.173.
3. Desbiens NA, Wu AW, Alzola C, Mueller-Rizner N,Wenger NS, Connors AF Jr, Lynn J, Phillips RS: Painduring hospitalization is associated with continuedpain six months later in survivors of serious illness.The SUPPORT Investigators. Study to UnderstandPrognoses and Preferences for Outcomes and Risks ofTreatments. Am J Med 1997;102:269–276.
4. Teno JMMD, Mor VP, Weitzen SMS, Wetle TP: Per-sistent pain in nursing home residents. JAMA2001;286:788.
SILVEIRA ET AL.834

5. Baer W, Hanson L: Families’ perception of the addedvalue of hospice in the nursing home. J Am GeriatrSoc 2000;48:879–882.
6. Ferrell B, Ferrell B, Rivaera L: Pain in cognitively im-paired nursing home patients. J Pain Symptom Man-age 1995;10:591–598.
7. Ferrell B: Pain management in elderly people. J AmGeriatr Soc 1991;39:64–73.
8. Stein W, Ferrell B: Pain in the nursing home. ClinGeriatr Med 1996;12:601–613.
9. Sengstaken E, King S: The problems of pain and itsdetection among geriatric nursing home residents. JAm Geriatr Soc 1993;41:541–543.
10. Lynn J, Teno JM, Phillips RS, Wu AW, Desbiens N,Harrold J, Claessens MT, Wenger N, Kreling B, Con-nors AF Jr: Perceptions by family members of the dy-ing experience of older and seriously ill patients. SUP-PORT Investigators. Study to Understand Prognosesand Preferences for Outcomes and Risks of Treat-ments [see comments]. Ann Intern Med 1997;126:97–106.
11. Desbiens NA, Wu AW, Broste SK, Wenger NS, Con-nors AF Jr, Lynn J, Yasui Y, Phillips RS, Fulkerson W:Pain and satisfaction with pain control in seriously illhospitalized adults: findings from the SUPPORT re-search investigations. For the SUPPORT investiga-tors. Study to Understand Prognoses and Preferencesfor Outcomes and Risks of Treatment. Crit Care Med1996;24:1953–1961.
12. Edmonds P, Karlsen S, Khan S, Addington-Hall J: Acomparison of the palliative care needs of the patientsdying from chronic respiratory diseases and lung can-cer. J Palliat Med 2001;15:287–295.
13. Bernabei R, Gambassi G, Lapane K, Landi F, Gatso-nis C, Dunlop R, Lipsitz L, Steel K, Mor V: Manage-ment of pain in elderly patients with cancer. JAMA1998;279:1877–1882.
14. Desbiens NA, Mueller-Rizner N, Hamel MB, ConnorsAF Jr: Preference for comfort care does not affect thepain experience of seriously ill patients. The SUP-PORT Investigators. Study to Understand Prognosesand Preferences for Outcomes and Risks of Treat-ment. J Pain Symptom Manage 1998;16:281–289.
15. Juster F, Suzman R: An overview of the health andretirement study. J Hum Resour 1995;30(suppl):S7–S56.
16. Soldo B, Hurd M, Rodgers W, Wallace R: Asset andhealth dynamics among the oldest–old: An overviewof the AHEAD study. J Gerontol: Series B: Psychol SciSoc Sci. 1997;52B:1–20.
17. Kutner JS, Kassner CT, Nowels DE: Symptom burdenat the end of life: Hospice providers’ perceptions. JPain Symptom Manage 2001;21:473–480.
18. Lunney J, Lynn J, Foley DJ, Lipson S, Guralnik JM:Patterns of functional decline at the end of life. JAMA2003;289:2387–2392.
19. Desbiens NA, Mueller-Rizner N, Connors AF, Jr.,Hamel MB, Wenger NS: Pain in the oldest-old duringhospitalization and up to one year later. HELP In-vestigators. Hospitalized Elderly Longitudinal Proj-ect. J Am Gerriatr Soc 1997;45:1167–1172.
20. Desbiens NA, Wu AW, Broste SK, Wenger NS, Con-nors AF Jr, Lynn J, Yasui Y, Phillips RS, Fulkerson W:Pain and satisfaction with pain control in seriously illhospitalized adults: Findings from the SUPPORT re-search investigations. For the SUPPORT investiga-tors. Study to Understand Prognoses and Preferencesfor Outcomes and Risks of Treatment.[comment]. CritCare Med 1996;24:1953–1961.
21. Harkins SW, Price DD, Martelli M: Effects of age onpain perception: Thermonociception. J Gerontol 1986;41:58–63.
22. Bellville JW, Forrest WH, Jr., Miller E, Brown BW Jr:Influence of age on pain relief from analgesics. Astudy of postoperative patients. JAMA 1971;217:1835–1841.
23. Hanrahan P, Luchins D: Access to hospice care for de-mentia patients: A national survey of hospice pro-grams. J Am Geriatr Soc 1993;41:25–30.
24. McPherson C, Addington-Hall J: Judging the qualityof care at the end of life: can proxies provide reliableinformation? Soc Sci Med. 2002;56:95–109.
25. Tasman A, Kay J, Lieberman J: Psychiatry. Philadel-phia: Saunders, 1997.
26. Huffman JC, Kunik ME: Assessment and under-standing of pain in patients with dementia. Geron-tologist 2000;40:574–581.
27. Steinman M, Sands L, Covinsky K: Self-restriction ofmedications due to cost in seniors without prescrip-tion coverage. J Gen Intern Med 2001;16:793–799.
Address reprint requests:Maria J. Silveira, M.D., M.A., M.P.H.
300 North Ingalls Building, Room 7C27Ann Arbor, MI 48109-0429
E-mail: [email protected]
SYMPTOM BURDEN 835
SILVEIRA ET AL.836
APPENDIX A.RELATIONSHIP OF PROXIES TO DECEASED SUBJECTS
Proxy relationship to deceased Weighted N (%)
Daughter/stepdaughter 1377 (51.6)Spouse 700 (28.2)Friend 96 (3.8)Sibling 89 (3.6)Grandchild 102 (3.5)Other relative 209 (8.1)Paid helper/professional 31 (1.2)
APPENDIX B.HEALTH AND RETIREMENT STUDY EXIT INTERVIEW QUESTIONS
To assess the subject’s pain, proxies were asked:
“Was (he/she) often troubled with pain between the last interview and when (he/she) died”?
0 Not applicable1 Yes5 No8 Don’t know9 Refused to answer
We used answers to classify pain into two mutually exclusive categories. A subject was classified ashaving “no pain” if the proxy responded with a 5 and “pain” if the proxy responded 1. Other an-swers were treated as missing values.
To assess the subject’s depression, proxies were asked:
“Was there a period of at least one month during the last year of (his/her) life when (he/she) haddepression?”
0 Not applicable1 Yes5 No8 Don’t know9 Refused to answer
A subject was classified as having “No Depression” if the proxy responded with a 5 or “Depression”if the proxy responded with a 1. Other answers were treated as missing values.
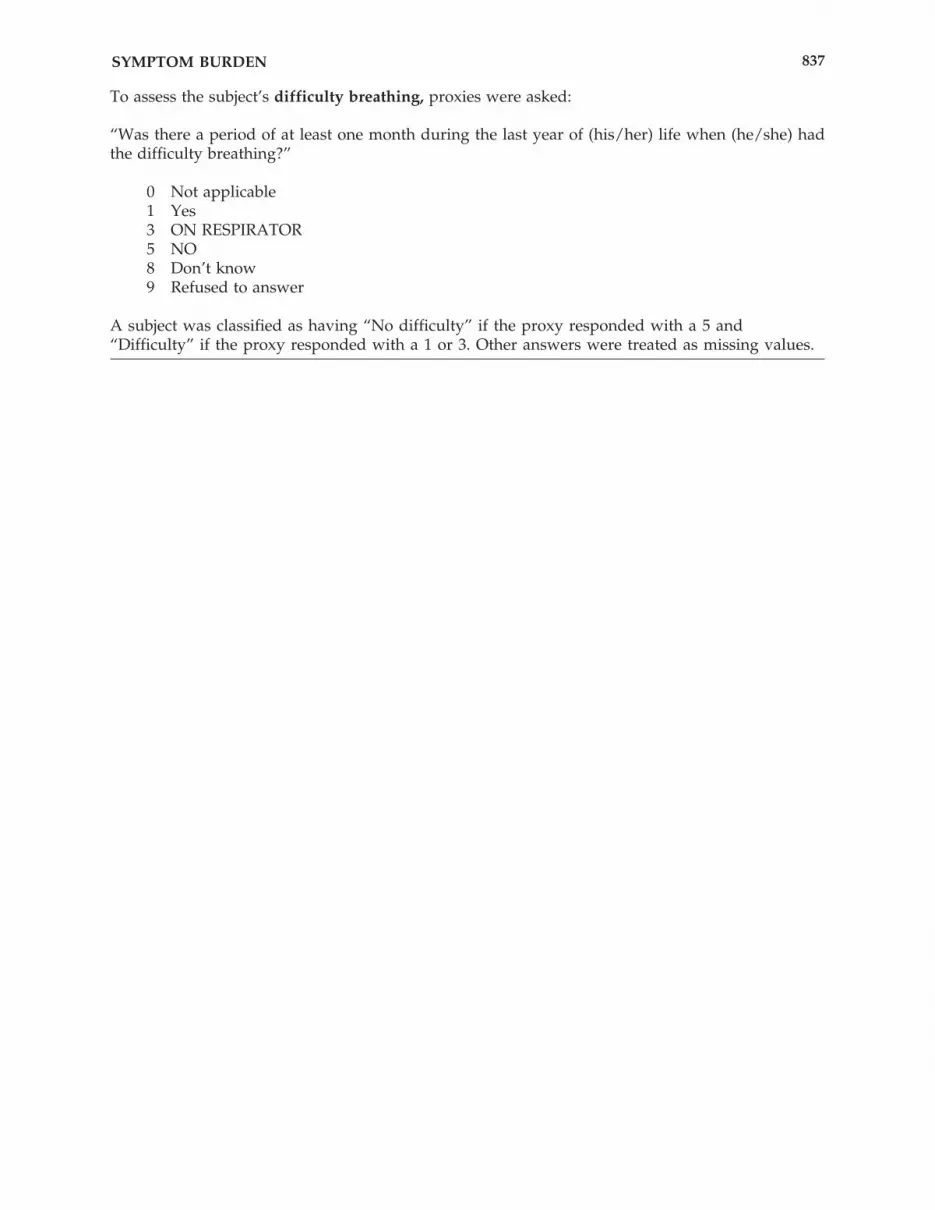
To assess the subject’s difficulty breathing, proxies were asked:
“Was there a period of at least one month during the last year of (his/her) life when (he/she) hadthe difficulty breathing?”
0 Not applicable1 Yes3 ON RESPIRATOR5 NO8 Don’t know9 Refused to answer
A subject was classified as having “No difficulty” if the proxy responded with a 5 and“Difficulty” if the proxy responded with a 1 or 3. Other answers were treated as missing values.
SYMPTOM BURDEN 837

This article has been cited by:
1. Margaret Quinn Rosenzweig, Theresa Wiehagen, Adam Brufsky, Anne Sillaman, Robert Arnold. 2009. The Unique Perspectiveof Illness Among Women With Metastatic Breast Cancer According to Race and Income. Journal of Hospice & Palliative Nursing11:1, 27-38. [CrossRef]
2. V. Shannon Burkett, Charles S. Cleeland. 2007. Symptom burden in cancer survivorship. Journal of Cancer Survivorship 1:2,167-175. [CrossRef]
3. Siew Tzuh Tang, Ruth McCorkle. 2006. Reply to Commentary by Dr Peterson and Dr Groenvold. Quality of Life Research 15:3,407-409. [CrossRef]
4. Robert M. Arnold . 2006. Lessons LearnedLessons Learned. Journal of Palliative Medicine 9:1, 4-6. [Citation] [PDF] [PDF Plus]